Optimization and evaluation of gastroretentive ranitidine HCl microspheres by using design expert...
10
International Journal of Biological Macromolecules 51 (2012) 691–700 Contents lists available at SciVerse ScienceDirect International Journal of Biological Macromolecules jo u r n al hom epa ge: ww w.elsevier.com/locate/ijbiomac Optimization and evaluation of gastroretentive ranitidine HCl microspheres by using design expert software Aashima Hooda a,∗ , Arun Nanda b , Manish Jain a , Vikash Kumar a , Permender Rathee a a PDM College of Pharmacy, Bahadurgarh 124507, India b Department of Pharmaceutical Sciences, MDU, Rohtak 124001, India a r t i c l e i n f o Article history: Received 7 May 2012 Received in revised form 18 July 2012 Accepted 29 July 2012 Available online 3 August 2012 Keywords: Optimization Bioadhesive Floating Microspheres Gastro retentive Chitosan a b s t r a c t The current study involves the development and optimization of their drug entrapment and ex vivo bioadhesion of multiunit chitosan based floating system containing Ranitidine HCl by ionotropic gelation method for gastroretentive delivery. Chitosan being cationic, non-toxic, biocompatible, biodegradable and bioadhesive is frequently used as a material for drug delivery systems and used to transport a drug to an acidic environment where it enhances the transport of polar drugs across epithelial surfaces. The effect of various process variables like drug polymer ratio, concentration of sodium tripolyphosphate and stirring speed on various physiochemical properties like drug entrapment efficiency, particle size and bioadhesion was optimized using central composite design and analyzed using response surface methodology. The observed responses were coincided well with the predicted values given by the opti- mization technique. The optimized microspheres showed drug entrapment efficiency of 74.73%, particle size 707.26 m and bioadhesion 71.68% in simulated gastric fluid (pH 1.2) after 8 h with floating lag time 40 s. The average size of all the dried microspheres ranged from 608.24 to 720.80 m. The drug entrapment efficiency of microspheres ranged from 41.67% to 87.58% and bioadhesion ranged from 62% to 86%. Accelerated stability study was performed on optimized formulation as per ICH guidelines and no significant change was found in drug content on storage. © 2012 Elsevier B.V. All rights reserved. 1. Introduction The oral route is the most common and preferable route for the delivery of drugs. This may be due to ease of administra- tion, patient compliance and flexibility in formulation [1]. During past few decades, numerous oral controlled drug delivery systems have been investigated and developed to act as drug reservoirs for release of drugs over a defined period of time at a controlled rate. The real challenge in the development of an oral controlled-release drug delivery system is not just to sustain the drug release but also to prolong the presence of the dosage form within the gas- trointestinal tract (GIT) until all the drug is completely released at the desired period of time [2]. To overcome these limitations, various gastroretentive systems have been designed to be retained in the gastric region for prolonged time. Garg and Gupta [3] have classified the gastroretentive dosage forms into four main classes: (i) floating systems [4], (ii) expandable systems [5], (iii) bioadhe- sive systems [6] and (iv) high density systems [7]. Both single-unit systems [8] and multiple-unit systems [9] have been reported in the literature. Multiple-unit floating drug delivery systems show ∗ Corresponding author. Tel.: +91 9212237791. E-mail address: [email protected] (A. Hooda). several advantages over single-unit ones, among which are: avoid- ing all-or-nothing emptying, absence of impairing of performance due to failure of a few units, more predictable drug release kinetics [10]. Ranitidine hydrochloride (RHCl) is a histamine H 2 receptor antagonist. It has been recently approved for esophagitis. Since the drug is freely soluble in water (1 g in 25 mL) and has a short elim- ination half-life of about 4 h due to which a regimen of 150 mg four times a day is required leads to poor patient compliance [11]. Moreover, ranitidine HCl has a narrow absorption window and is mainly absorbed in the proximal areas of GIT [12]. Hence, when a conventional sustained-release dosage form reaches the colon, where it gets metabolized [12], resulting in low absorption and poor bioavailability (52%). These factors favor the development of a gastroretentive type of drug delivery system. Response surface methodology (RSM) as a tool of designing of experiments is widely practiced approach in the development and optimization of drug delivery devices [13–18]. The technique requires minimum experimentation and time, thus proving to be far more effective and cost effective than the conventional methods of formulating dosage forms. In the present study, a new multiparticulate gastroretentive system based on combination of floating as well as bioadhesive mechanism was designed and developed using ionotropic gelation 0141-8130/$ – see front matter © 2012 Elsevier B.V. All rights reserved. http://dx.doi.org/10.1016/j.ijbiomac.2012.07.030
-
Upload
independent -
Category
Documents
-
view
2 -
download
0
Transcript of Optimization and evaluation of gastroretentive ranitidine HCl microspheres by using design expert...
Ou
Aa
b
a
ARRAA
KOBFMGC
1
ttphrTdatavic(sst
0h
International Journal of Biological Macromolecules 51 (2012) 691– 700
Contents lists available at SciVerse ScienceDirect
International Journal of Biological Macromolecules
jo u r n al hom epa ge: ww w.elsev ier .com/ locate / i jb iomac
ptimization and evaluation of gastroretentive ranitidine HCl microspheres bysing design expert software
ashima Hoodaa,∗, Arun Nandab, Manish Jaina, Vikash Kumara, Permender Ratheea
PDM College of Pharmacy, Bahadurgarh 124507, IndiaDepartment of Pharmaceutical Sciences, MDU, Rohtak 124001, India
r t i c l e i n f o
rticle history:eceived 7 May 2012eceived in revised form 18 July 2012ccepted 29 July 2012vailable online 3 August 2012
eywords:ptimizationioadhesiveloating
a b s t r a c t
The current study involves the development and optimization of their drug entrapment and ex vivobioadhesion of multiunit chitosan based floating system containing Ranitidine HCl by ionotropic gelationmethod for gastroretentive delivery. Chitosan being cationic, non-toxic, biocompatible, biodegradableand bioadhesive is frequently used as a material for drug delivery systems and used to transport a drugto an acidic environment where it enhances the transport of polar drugs across epithelial surfaces. Theeffect of various process variables like drug polymer ratio, concentration of sodium tripolyphosphateand stirring speed on various physiochemical properties like drug entrapment efficiency, particle sizeand bioadhesion was optimized using central composite design and analyzed using response surfacemethodology. The observed responses were coincided well with the predicted values given by the opti-
icrospheresastro retentivehitosan
mization technique. The optimized microspheres showed drug entrapment efficiency of 74.73%, particlesize 707.26 �m and bioadhesion 71.68% in simulated gastric fluid (pH 1.2) after 8 h with floating lagtime 40 s. The average size of all the dried microspheres ranged from 608.24 to 720.80 �m. The drugentrapment efficiency of microspheres ranged from 41.67% to 87.58% and bioadhesion ranged from 62%to 86%. Accelerated stability study was performed on optimized formulation as per ICH guidelines andno significant change was found in drug content on storage.
. Introduction
The oral route is the most common and preferable route forhe delivery of drugs. This may be due to ease of administra-ion, patient compliance and flexibility in formulation [1]. Duringast few decades, numerous oral controlled drug delivery systemsave been investigated and developed to act as drug reservoirs forelease of drugs over a defined period of time at a controlled rate.he real challenge in the development of an oral controlled-releaserug delivery system is not just to sustain the drug release butlso to prolong the presence of the dosage form within the gas-rointestinal tract (GIT) until all the drug is completely releasedt the desired period of time [2]. To overcome these limitations,arious gastroretentive systems have been designed to be retainedn the gastric region for prolonged time. Garg and Gupta [3] havelassified the gastroretentive dosage forms into four main classes:i) floating systems [4], (ii) expandable systems [5], (iii) bioadhe-
ive systems [6] and (iv) high density systems [7]. Both single-unitystems [8] and multiple-unit systems [9] have been reported inhe literature. Multiple-unit floating drug delivery systems show∗ Corresponding author. Tel.: +91 9212237791.E-mail address: [email protected] (A. Hooda).
141-8130/$ – see front matter © 2012 Elsevier B.V. All rights reserved.ttp://dx.doi.org/10.1016/j.ijbiomac.2012.07.030
© 2012 Elsevier B.V. All rights reserved.
several advantages over single-unit ones, among which are: avoid-ing all-or-nothing emptying, absence of impairing of performancedue to failure of a few units, more predictable drug release kinetics[10].
Ranitidine hydrochloride (RHCl) is a histamine H2 receptorantagonist. It has been recently approved for esophagitis. Since thedrug is freely soluble in water (1 g in 25 mL) and has a short elim-ination half-life of about 4 h due to which a regimen of 150 mgfour times a day is required leads to poor patient compliance [11].Moreover, ranitidine HCl has a narrow absorption window and ismainly absorbed in the proximal areas of GIT [12]. Hence, whena conventional sustained-release dosage form reaches the colon,where it gets metabolized [12], resulting in low absorption andpoor bioavailability (52%). These factors favor the development ofa gastroretentive type of drug delivery system.
Response surface methodology (RSM) as a tool of designingof experiments is widely practiced approach in the developmentand optimization of drug delivery devices [13–18]. The techniquerequires minimum experimentation and time, thus proving to befar more effective and cost effective than the conventional methods
of formulating dosage forms.In the present study, a new multiparticulate gastroretentivesystem based on combination of floating as well as bioadhesivemechanism was designed and developed using ionotropic gelation
692 A. Hooda et al. / International Journal of Biological Macromolecules 51 (2012) 691– 700
Table 1Formulation design for preliminary studies.
Form. code Drug:polymer
Chitosan (%w/v)
Conc. of sodiumTPP (% w/v)
Stirring speed(rpm)
Cross-linkingtime (min)
Appearance Percentage yield
F1 1:1 1 3 250 30 Flakes type –F2 1:1 1.5 3 250 30 Gel type –F3 1:1 2 3 250 30 Spherical 73.3F4 1:1 2 2 250 30 Irregular shaped 49.0F5 1:1 2 4 250 30 Spherical 81.3F6 1:1 2 6 250 30 Brittle, soft & gel type –
00
00
00
mtai
2
cSIJ
2
2
gtcb(pof1(tat
2
ivTiTfo
TL
F7 1:1 2 3 5F8 1:1 2 3 10F9 1:1 2 3 5
ethod. These forms are expected to remain lastingly buoyant onhe gastric contents independent of gastric volume of fluid, withoutffecting the intrinsic rate of gastric emptying, as their bulk densitys lower than that of the gastric fluids.
. Materials and methods
Ranitidine HCl was purchased from Radicura pharmaceuti-als, Delhi. Chitosan was obtained from Thahira chemicals, Kerela,odium tripolyphosphate from Thomas Baker Chemicals Pvt. Ltd.,ndia. All the chemicals and reagent used were of Analytical grade.MP statistical software was used for the optimization studies.
.1. Preliminary studies
.1.1. Preparation of microspheresFloating microspheres were prepared according to an ionotropic
elation method and physically cross-linking with sodiumripolyphosphate (sodium TPP). Sodium TPP is a polyanion, whichan interact with the positively charged amino group of chitosany electrostatic forces [19,20]. Briefly, Ranitidine hydrochloride (1%w/v)) was dissolved in a stirred solution of chitosan (Table 1)repared in 2% (v/v) acetic acid until a uniform dispersion wasbtained. The microparticles were formed by dropping the bubble-ree dispersion (30 ml) through a 21G disposable syringe into00 ml of a gently agitated solution of the cross-linking agentsodium TPP). The dropping rate was 30 drops/min. The falling dis-ance was 5 cm. The microparticles formed were separated after
specified cross-linking time, washed with deionized water andhen subsequently dried at room temperature for 3 h.
.2. Experimental design
Response surface methodology (RSM) was used to systemicallynvestigate the effect of a wide range of independent and dependentariables. The formulation variables and their levels as shown inable 2 were chosen from the knowledge obtained from the prelim-
nary studies. The drug polymer ratio (X1), concentration of sodiumPP (X2), stirring speed (X3) and cross-linking time (X4) wereour independent variables (factors) considered in the preparationf chitosan microspheres, while the drug entrapment efficiency,able 2evels of process parameters used in experiment.
Code Process parameters Levels
−1 0 +1
X1 Drug polymer ratio 1:1 2:1 3:1X2 Concentration of sodium
TPP (% w/v)3 4 5
X3 Stirring speed (rpm) 250 500 750X4 Cross-linking time (min) 30 75 120
60 Spherical 78.060 Disintegrated –
120 Spherical 80.43
particle size and percentage bioadhesion after 2 h were dependentvariables (response).
The matrix of the design including investigated responses i.e.,drug entrapment efficiency (%), particle size (�m), and bioadhe-sion after 2 h (%) are shown in Table 3. For optimization, the effectsof independent variables upon the responses were modeled usingfollowing second order polynomial equation involving indepen-dent factors and interaction factors was selected based on modelanalysis, lack of fit and R2 analysis for various measured responses,studied in this investigation. The effects of independent variablesupon the drug entrapment efficiency (%), particle size (�m), andbioadhesion after 2 h (%) were modeled using following quadraticmathematical model generated by central composite design isfollowing:
Y = b0 + b1X1 + b2X2 + b3X3 + b4X4 + b5X1X2 + b6X1X3 + b7X2X3
+ b8X1X4 + b9X2X4 + b10X3X4 + b11X21
+ b12X22 + b13X2
3 + b14X24
where Y is the response; b0 is the intercept, and b1, b2, b3, b4, b5,b6, b7, b8, b9, b10, b11, b12, b13, b14 are regression coefficients. X1,X2, X3, X4 are individual effects; X2
1 , X22 , X2
3 and X24 are quadratic
effects; X1X2, X1X3, X2X3, X1X4, X2X4 and X3X4 are the interactioneffect. One-way ANOVA was applied to estimate the significance ofthe model (p < 0.05). Individual response parameters were evalu-ated using the F-test. The surface response plots, and contour plotswere analyzed to reveal the effect of independent factors (here drugto polymer ratio, concentration of sodium TPP, stirring speed andcross-linking time) on the measured responses (here drug entrap-ment efficiency, particle size and percentage bioadhesion after 2 h)were analyzed.
2.3. Determination of percentage yield
The percentage of production yield can be calculated from theweight of dried microspheres recovered from each of the formu-lations and the sum of initial dry weight of starting materials asmentioned in equation.
Yield (%) = Wt. of microparticles × 100Total wt. of drug and polymer
2.4. Surface morphology analysis
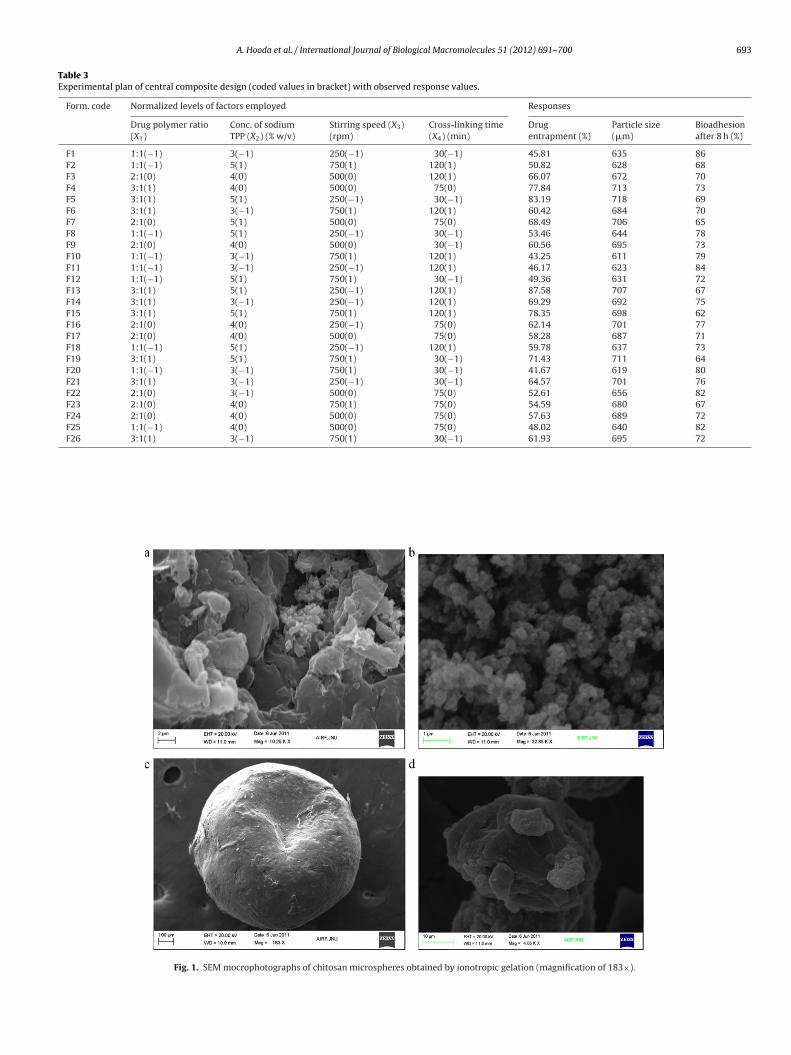
Surface morphologies of the microspheres were investigatedwith a Scanning Electron Microscope (SEM) (Carl Zeiss EVO 40,Germany) Fig. 1.
2.5. Determination of particle size
The size of prepared microparticles was determined by sievingmethod in triplicates [21]. Pre-weighed microparticles were placed
A. Hooda et al. / International Journal of Biological Macromolecules 51 (2012) 691– 700 693
Table 3Experimental plan of central composite design (coded values in bracket) with observed response values.
Form. code Normalized levels of factors employed Responses
Drug polymer ratio(X1)
Conc. of sodiumTPP (X2) (% w/v)
Stirring speed (X3)(rpm)
Cross-linking time(X4) (min)
Drugentrapment (%)
Particle size(�m)
Bioadhesionafter 8 h (%)
F1 1:1(−1) 3(−1) 250(−1) 30(−1) 45.81 635 86F2 1:1(−1) 5(1) 750(1) 120(1) 50.82 628 68F3 2:1(0) 4(0) 500(0) 120(1) 66.07 672 70F4 3:1(1) 4(0) 500(0) 75(0) 77.84 713 73F5 3:1(1) 5(1) 250(−1) 30(−1) 83.19 718 69F6 3:1(1) 3(−1) 750(1) 120(1) 60.42 684 70F7 2:1(0) 5(1) 500(0) 75(0) 68.49 706 65F8 1:1(−1) 5(1) 250(−1) 30(−1) 53.46 644 78F9 2:1(0) 4(0) 500(0) 30(−1) 60.56 695 73F10 1:1(−1) 3(−1) 750(1) 120(1) 43.25 611 79F11 1:1(−1) 3(−1) 250(−1) 120(1) 46.17 623 84F12 1:1(−1) 5(1) 750(1) 30(−1) 49.36 631 72F13 3:1(1) 5(1) 250(−1) 120(1) 87.58 707 67F14 3:1(1) 3(−1) 250(−1) 120(1) 69.29 692 75F15 3:1(1) 5(1) 750(1) 120(1) 78.35 698 62F16 2:1(0) 4(0) 250(−1) 75(0) 62.14 701 77F17 2:1(0) 4(0) 500(0) 75(0) 58.28 687 71F18 1:1(−1) 5(1) 250(−1) 120(1) 59.78 637 73F19 3:1(1) 5(1) 750(1) 30(−1) 71.43 711 64F20 1:1(−1) 3(−1) 750(1) 30(−1) 41.67 619 80F21 3:1(1) 3(−1) 250(−1) 30(−1) 64.57 701 76F22 2:1(0) 3(−1) 500(0) 75(0) 52.61 656 82F23 2:1(0) 4(0) 750(1) 75(0) 54.59 680 67F24 2:1(0) 4(0) 500(0) 75(0) 57.63 689 72F25 1:1(−1) 4(0) 500(0) 75(0) 48.02 640 82F26 3:1(1) 3(−1) 750(1) 30(−1) 61.93 695 72
Fig. 1. SEM mocrophotographs of chitosan microspheres obtained by ionotropic gelation (magnification of 183×).
6 Biolog
oasm
d
wia
2
i5tw3s3t
D
wcdn
2
lamtm
2
epwimg0wf
B
2
ta3tcdta
94 A. Hooda et al. / International Journal of
n the top of a set of six standard sieves of size range 315–1250 �mnd shaken for 30 min. The resulting fractions remaining on eachieve were weighed to determine the particle size distribution. Theean particle size was calculated after sieving as follows:
ave =∑
nd∑
n
here dave is the arithmetic mean diameter of microparticles, ns percent weight fraction retained on smaller sieve, and d is therithmetic mean size of sieve opening.
.6. Determination of drug entrapment efficiency
The drug entrapment was determined in triplicates accord-ng to a reported method [22]. An accurately weighed amount of0 mg microspheres were crushed in a glass mortar-pestle andhe powdered microparticles were placed into 100 ml of 0.1 N HClith constant stirring for 6 h at 1000 rpm by magnetic stirrer at
7 ± 0.5 ◦C. After 6 h, the drug content in the filtrate was analyzedpectrophotometrically using a UV–Vis spectrophotometer at �max
14 nm. The drug entrapment efficiency (%) was calculated as perhe formula mentioned below.
EE (%) = Actual drug content × 100Theoretical drug content
here DEE is the drug entrapment efficiency. The theoretical drugontent was determined by calculation; assuming that the entirerug present in the polymer gets entrapped in microspheres ando loss occurs at any stage of preparation of microspheres.
.7. In vitro buoyancy study
The buoyancy of microspheres was studied in triplicate fol-owing a reported method [23]. 50 microspheres were placed in
100 ml of 0.1 N HCl at 37 ± 0.5 ◦C. Both the number of floatingicrospheres (observed visually) and the floating duration (the
ime during which microspheres remain buoyant) were then deter-ined at a fixed time interval during 12-h period.
.8. In vitro bioadhesion study
The bioadhesive property of the optimized microsperes wasvaluated by in vitro bioadheison testing method known as agarlate method as reported previously [24]. An agar plate (2% (w/w))as prepared using microscopic slide in 0.1 N HCl (pH 1.2). Approx-
mately 50 microspheres were spread on to the agar plate. Fiveinutes later, the prepared agar plate was hung onto one of the
rooves of a USP tablet disintegration apparatus, which containing.1 N HCl (pH 1.2). After 8 h, the microspheres adhering to the plateas counted. Percent bioadhesion was calculated using the given
ormula mentioned in equation.
ioadhesion (%) = No. of adhered microparticles × 100No. of applied microparticles
.9. In vitro drug release studies
The in vitro release of the drug from prepared microspheres wasested using a dissolution apparatus USP basket-type dissolutionpparatus [25]. A weighed amount of microspheres equivalent to36 mg drug was placed into 900 ml of 0.1 N HCl (pH 1.2) main-ained at 37 ± 0.5 ◦C and stirring at 100 rpm. 5 ml sample was
ollected at regular time intervals, and the same amount of freshissolution medium was replaced into dissolution vessel to main-ain the sink condition throughout the experiment. The collectedliquots were filtered, and further diluted suitably to analyze forical Macromolecules 51 (2012) 691– 700
the spectrophotometrically using UV–Vis spectrophotometer at314 nm.
2.10. Analysis of in vitro drug release kinetics and mechanism
The in vitro drug release data from various formulations ofmicrospheres containing ranitidine HCl were evaluated kineticallyvarious mathematical models like zero order, first order, Higuchi,and Korsmeyer–Peppas model [26–29].
Zero-order model: F = K0t; where F represents the fraction of drugreleased in time t, and K0 is the apparent release rate constant orzero-order release constant.First-order model: ln (1 − F) = −K1st t; where F represents the frac-tion of drug released in time t, and K1 is the first-order releaseconstant.Higuchi model: F = KHt1/2; where F represents the fraction of drugreleased in time t, and KH is the Higuchi dissolution constant.Korsmeyer–Peppas model: F = KPtn; where F represents the frac-tion of drug released in time t, KP is the rate constant and n isthe release exponent, indicative of the drug release mechanism.Again, the Korsmeyer–Peppas model was employed in the in vitrodrug release behavior analysis of these formulations to distinguishbetween competing release mechanisms. For spheres, a value ofn ≤ 0.43 indicates the Fickian release. The n value between 0.43and 0.85 is an indication of non-Fickian release (both diffusioncontrolled and swelling controlled drug release). When, n ≥ 0.85,it is case-II transport and this involves polymer dissolution andpolymeric chain enlargement or relaxation.
2.11. Fourier transform infra red (FT-IR) spectroscopy analysis
Samples were reduced to powder and analyzed as KBr pelletsby using a Fourier transform infrared (FT-IR) spectroscope (PerkinElmer Spectrum RX I, USA). The pellet was placed in the sampleholder and spectral scanning was taken in the wavelength regionbetween 4000 and 400 cm−1.
2.12. Stability studies of optimized formulation
The optimized formulation was kept for accelerated stabilitystudy according to the International Conference on Harmonization(ICH) guidelines for 3 months [30]. Microspheres were packed in alaminated aluminum foil and kept in the stability chamber main-tained at temperature of 40 ± 2 ◦C and 75 ± 5% RH. At the end of0, 30, 60, 90 days, samples were withdrawn and examined for anystatistical difference in their adhesion retention periods, floatingcharacteristics and drug content using a paired Student’s t-test.Differences were considered to be significant at p < 0.05.
3. Results and discussion
3.1. Preliminary studies
Formulation design for preliminary studies was shown inTable 1. Microspheres were not obtained when chitosan was usedin 1% concentration (F1). Formulation F1 showed flakes type parti-cles not microspheres. Microspheres prepared with 1.5% chitosanconcentration (F2) were non-discrete and gel type due to poormolecular packing and cross-linking resulting in large clumping.Well discrete microspheres with little clumping were obtained
as chitosan concentration increased to 2% (F3). At a concentra-tion of above 2%, it was difficult to prepare the microspheres, dueto enhanced viscosity of the polymer solution. The concentrationof the sodium TPP was varied and irregular shaped particles was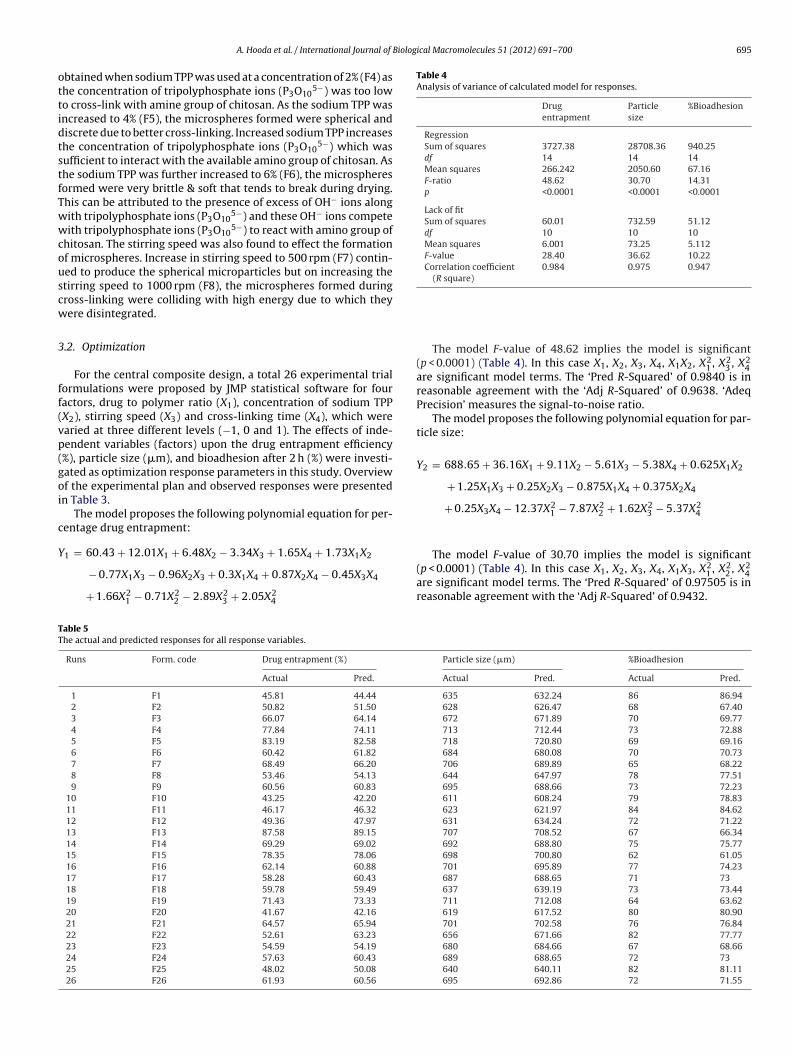
Biological Macromolecules 51 (2012) 691– 700 695
ottidtstfTwwcouscw
3
ff(vp(goi
c
Y
Table 4Analysis of variance of calculated model for responses.
Drugentrapment
Particlesize
%Bioadhesion
RegressionSum of squares 3727.38 28708.36 940.25df 14 14 14Mean squares 266.242 2050.60 67.16F-ratio 48.62 30.70 14.31p <0.0001 <0.0001 <0.0001
Lack of fitSum of squares 60.01 732.59 51.12df 10 10 10Mean squares 6.001 73.25 5.112F-value 28.40 36.62 10.22Correlation coefficient 0.984 0.975 0.947
TT
A. Hooda et al. / International Journal of
btained when sodium TPP was used at a concentration of 2% (F4) ashe concentration of tripolyphosphate ions (P3O10
5−) was too lowo cross-link with amine group of chitosan. As the sodium TPP wasncreased to 4% (F5), the microspheres formed were spherical andiscrete due to better cross-linking. Increased sodium TPP increaseshe concentration of tripolyphosphate ions (P3O10
5−) which wasufficient to interact with the available amino group of chitosan. Ashe sodium TPP was further increased to 6% (F6), the microspheresormed were very brittle & soft that tends to break during drying.his can be attributed to the presence of excess of OH− ions alongith tripolyphosphate ions (P3O10
5−) and these OH− ions competeith tripolyphosphate ions (P3O10
5−) to react with amino group ofhitosan. The stirring speed was also found to effect the formationf microspheres. Increase in stirring speed to 500 rpm (F7) contin-ed to produce the spherical microparticles but on increasing thetirring speed to 1000 rpm (F8), the microspheres formed duringross-linking were colliding with high energy due to which theyere disintegrated.
.2. Optimization
For the central composite design, a total 26 experimental trialormulations were proposed by JMP statistical software for fouractors, drug to polymer ratio (X1), concentration of sodium TPPX2), stirring speed (X3) and cross-linking time (X4), which werearied at three different levels (−1, 0 and 1). The effects of inde-endent variables (factors) upon the drug entrapment efficiency%), particle size (�m), and bioadhesion after 2 h (%) were investi-ated as optimization response parameters in this study. Overviewf the experimental plan and observed responses were presentedn Table 3.
The model proposes the following polynomial equation for per-entage drug entrapment:
1 = 60.43 + 12.01X1 + 6.48X2 − 3.34X3 + 1.65X4 + 1.73X1X2
− 0.77X1X3 − 0.96X2X3 + 0.3X1X4 + 0.87X2X4 − 0.45X3X4
+ 1.66X21 − 0.71X2
2 − 2.89X23 + 2.05X2
4
able 5he actual and predicted responses for all response variables.
Runs Form. code Drug entrapment (%)
Actual Pred.
1 F1 45.81 44.44
2 F2 50.82 51.50
3 F3 66.07 64.14
4 F4 77.84 74.11
5 F5 83.19 82.58
6 F6 60.42 61.82
7 F7 68.49 66.20
8 F8 53.46 54.13
9 F9 60.56 60.83
10 F10 43.25 42.20
11 F11 46.17 46.32
12 F12 49.36 47.97
13 F13 87.58 89.15
14 F14 69.29 69.02
15 F15 78.35 78.06
16 F16 62.14 60.88
17 F17 58.28 60.43
18 F18 59.78 59.49
19 F19 71.43 73.33
20 F20 41.67 42.16
21 F21 64.57 65.94
22 F22 52.61 63.23
23 F23 54.59 54.19
24 F24 57.63 60.43
25 F25 48.02 50.08
26 F26 61.93 60.56
(R square)
The model F-value of 48.62 implies the model is significant(p < 0.0001) (Table 4). In this case X1, X2, X3, X4, X1X2, X2
1 , X23 , X2
4are significant model terms. The ‘Pred R-Squared’ of 0.9840 is inreasonable agreement with the ‘Adj R-Squared’ of 0.9638. ‘AdeqPrecision’ measures the signal-to-noise ratio.
The model proposes the following polynomial equation for par-ticle size:
Y2 = 688.65 + 36.16X1 + 9.11X2 − 5.61X3 − 5.38X4 + 0.625X1X2
+ 1.25X1X3 + 0.25X2X3 − 0.875X1X4 + 0.375X2X4
+ 0.25X3X4 − 12.37X21 − 7.87X2
2 + 1.62X23 − 5.37X2
4
The model F-value of 30.70 implies the model is significant2 2 2
(p < 0.0001) (Table 4). In this case X1, X2, X3, X4, X1X3, X1 , X2 , X4are significant model terms. The ‘Pred R-Squared’ of 0.97505 is inreasonable agreement with the ‘Adj R-Squared’ of 0.9432.
Particle size (�m) %Bioadhesion
Actual Pred. Actual Pred.
635 632.24 86 86.94628 626.47 68 67.40672 671.89 70 69.77713 712.44 73 72.88718 720.80 69 69.16684 680.08 70 70.73706 689.89 65 68.22644 647.97 78 77.51695 688.66 73 72.23611 608.24 79 78.83623 621.97 84 84.62631 634.24 72 71.22707 708.52 67 66.34692 688.80 75 75.77698 700.80 62 61.05701 695.89 77 74.23687 688.65 71 73637 639.19 73 73.44711 712.08 64 63.62619 617.52 80 80.90701 702.58 76 76.84656 671.66 82 77.77680 684.66 67 68.66689 688.65 72 73640 640.11 82 81.11695 692.86 72 71.55
6 Biolog
b
Y
(ca
Fv
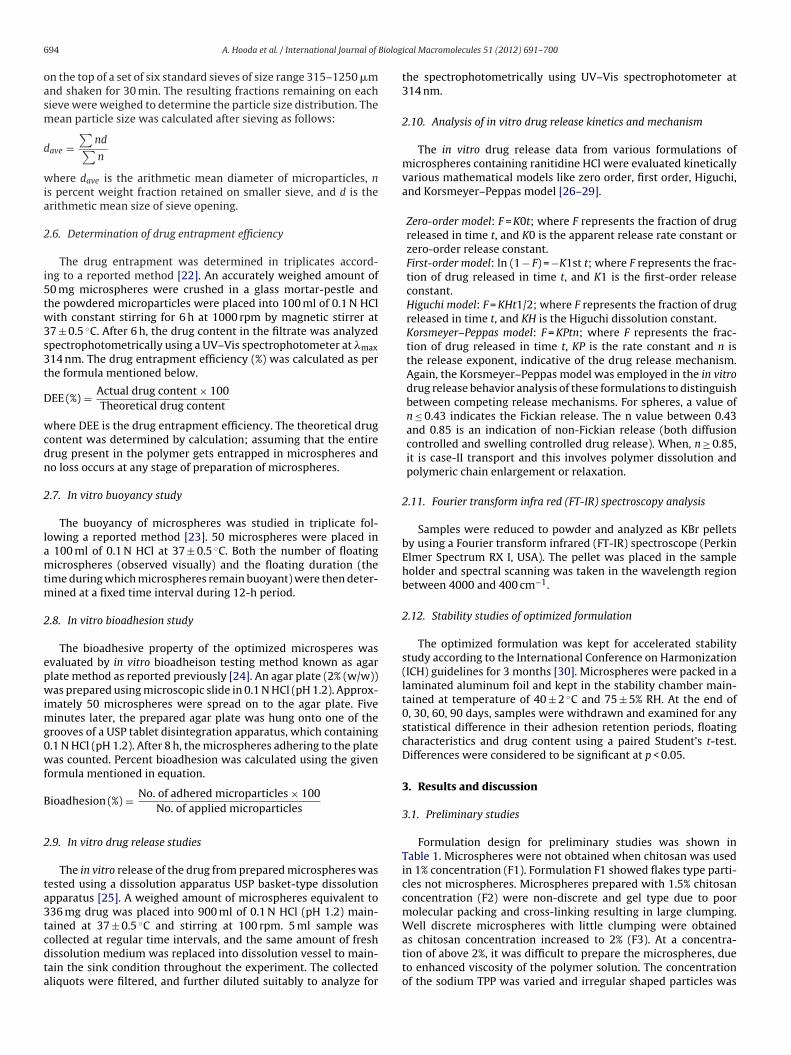
Linear correlation plots between the actual, the predictedresponse variables are presented in Fig. 2, and their correspondingresidual plots showing the scatter of the residuals versus predicted
96 A. Hooda et al. / International Journal of
The model proposes the following polynomial equation for %ioadhesion:
3 = 73 − 4.11X1 − 4.77X2 − 2.83X3 − 1.22X4 + 0.437X1X2
+ 0.187X1X3 − 0.062X2X3 + 0.31X1X4 − 0.437X2X4
+ 0.062X3X4 + 4X21 − 1.5X2
3 − 2X24
The model F-value of 14.31 implies the model is significant
p < 0.0001) (Table 4). In this case X1, X2, X3, X4, X21, X24 are signifi-
ant model terms. The ‘Pred R-Squared’ of 0.9479 is in reasonablegreement with the ‘Adj R-Squared’ of 0.8817.
ig. 2. (a–c) Linear correlation plots between the actual, the predicted responseariables.
ical Macromolecules 51 (2012) 691– 700
For all these formulations proposed by the central compos-ite design, the results of investigated responses (drug entrapmentefficiency, particle size, and bioadhesion after 2 h (%) were foundwithin limits. Table 5 lists the actual and predicted responses forall response variables investigated in this study with parentage oferrors in prognosis.
values are presented in Fig. 3.
Fig. 3. (a–c) Residual plots showing the scatter of the residuals versus predictedvalues.
Biolog
ldgtpopwt(trf
oao(a
Fcd
A. Hooda et al. / International Journal of
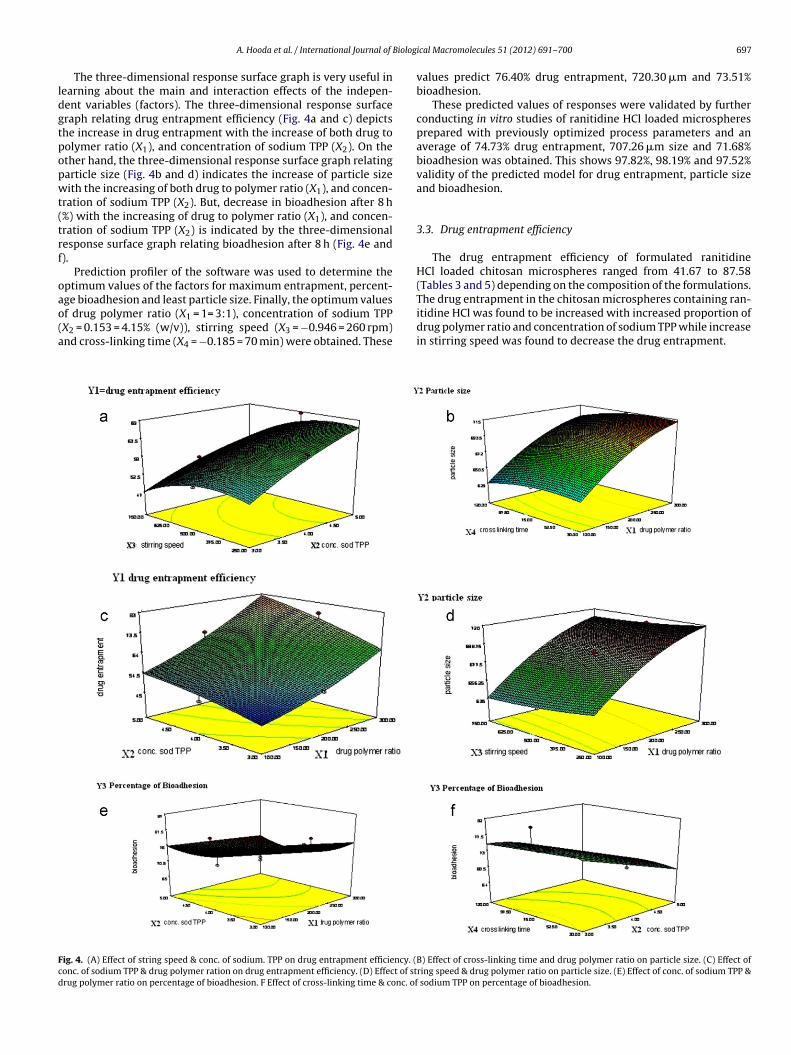
The three-dimensional response surface graph is very useful inearning about the main and interaction effects of the indepen-ent variables (factors). The three-dimensional response surfaceraph relating drug entrapment efficiency (Fig. 4a and c) depictshe increase in drug entrapment with the increase of both drug toolymer ratio (X1), and concentration of sodium TPP (X2). On thether hand, the three-dimensional response surface graph relatingarticle size (Fig. 4b and d) indicates the increase of particle sizeith the increasing of both drug to polymer ratio (X1), and concen-
ration of sodium TPP (X2). But, decrease in bioadhesion after 8 h%) with the increasing of drug to polymer ratio (X1), and concen-ration of sodium TPP (X2) is indicated by the three-dimensionalesponse surface graph relating bioadhesion after 8 h (Fig. 4e and).
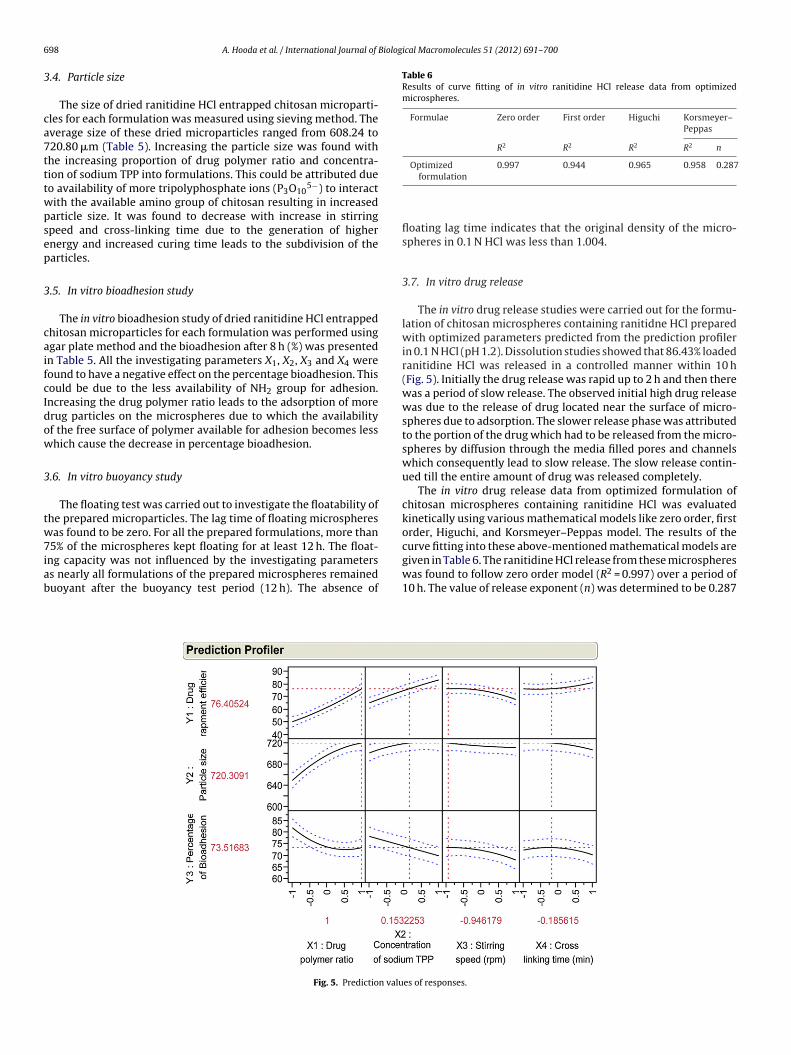
Prediction profiler of the software was used to determine theptimum values of the factors for maximum entrapment, percent-
ge bioadhesion and least particle size. Finally, the optimum valuesf drug polymer ratio (X1 = 1= 3:1), concentration of sodium TPPX2 = 0.153 = 4.15% (w/v)), stirring speed (X3 = −0.946 = 260 rpm)nd cross-linking time (X4 = −0.185 = 70 min) were obtained. Theseig. 4. (A) Effect of string speed & conc. of sodium. TPP on drug entrapment efficiency. (onc. of sodium TPP & drug polymer ration on drug entrapment efficiency. (D) Effect of strug polymer ratio on percentage of bioadhesion. F Effect of cross-linking time & conc. of
ical Macromolecules 51 (2012) 691– 700 697
values predict 76.40% drug entrapment, 720.30 �m and 73.51%bioadhesion.
These predicted values of responses were validated by furtherconducting in vitro studies of ranitidine HCl loaded microspheresprepared with previously optimized process parameters and anaverage of 74.73% drug entrapment, 707.26 �m size and 71.68%bioadhesion was obtained. This shows 97.82%, 98.19% and 97.52%validity of the predicted model for drug entrapment, particle sizeand bioadhesion.
3.3. Drug entrapment efficiency
The drug entrapment efficiency of formulated ranitidineHCl loaded chitosan microspheres ranged from 41.67 to 87.58(Tables 3 and 5) depending on the composition of the formulations.
The drug entrapment in the chitosan microspheres containing ran-itidine HCl was found to be increased with increased proportion ofdrug polymer ratio and concentration of sodium TPP while increasein stirring speed was found to decrease the drug entrapment.B) Effect of cross-linking time and drug polymer ratio on particle size. (C) Effect ofring speed & drug polymer ratio on particle size. (E) Effect of conc. of sodium TPP &
sodium TPP on percentage of bioadhesion.
6 Biological Macromolecules 51 (2012) 691– 700
3
ca7tttwpsep
3
caifcIdow
3
tw7iab
Table 6Results of curve fitting of in vitro ranitidine HCl release data from optimizedmicrospheres.
Formulae Zero order First order Higuchi Korsmeyer–Peppas
R2 R2 R2 R2 n
Optimized 0.997 0.944 0.965 0.958 0.287
98 A. Hooda et al. / International Journal of
.4. Particle size
The size of dried ranitidine HCl entrapped chitosan microparti-les for each formulation was measured using sieving method. Theverage size of these dried microparticles ranged from 608.24 to20.80 �m (Table 5). Increasing the particle size was found withhe increasing proportion of drug polymer ratio and concentra-ion of sodium TPP into formulations. This could be attributed dueo availability of more tripolyphosphate ions (P3O10
5−) to interactith the available amino group of chitosan resulting in increasedarticle size. It was found to decrease with increase in stirringpeed and cross-linking time due to the generation of highernergy and increased curing time leads to the subdivision of thearticles.
.5. In vitro bioadhesion study
The in vitro bioadhesion study of dried ranitidine HCl entrappedhitosan microparticles for each formulation was performed usinggar plate method and the bioadhesion after 8 h (%) was presentedn Table 5. All the investigating parameters X1, X2, X3 and X4 wereound to have a negative effect on the percentage bioadhesion. Thisould be due to the less availability of NH2 group for adhesion.ncreasing the drug polymer ratio leads to the adsorption of morerug particles on the microspheres due to which the availabilityf the free surface of polymer available for adhesion becomes lesshich cause the decrease in percentage bioadhesion.
.6. In vitro buoyancy study
The floating test was carried out to investigate the floatability ofhe prepared microparticles. The lag time of floating microspheresas found to be zero. For all the prepared formulations, more than
5% of the microspheres kept floating for at least 12 h. The float-ng capacity was not influenced by the investigating parameterss nearly all formulations of the prepared microspheres remaineduoyant after the buoyancy test period (12 h). The absence of
Fig. 5. Prediction valu
formulation
floating lag time indicates that the original density of the micro-spheres in 0.1 N HCl was less than 1.004.
3.7. In vitro drug release
The in vitro drug release studies were carried out for the formu-lation of chitosan microspheres containing ranitidne HCl preparedwith optimized parameters predicted from the prediction profilerin 0.1 N HCl (pH 1.2). Dissolution studies showed that 86.43% loadedranitidine HCl was released in a controlled manner within 10 h(Fig. 5). Initially the drug release was rapid up to 2 h and then therewas a period of slow release. The observed initial high drug releasewas due to the release of drug located near the surface of micro-spheres due to adsorption. The slower release phase was attributedto the portion of the drug which had to be released from the micro-spheres by diffusion through the media filled pores and channelswhich consequently lead to slow release. The slow release contin-ued till the entire amount of drug was released completely.
The in vitro drug release data from optimized formulation ofchitosan microspheres containing ranitidine HCl was evaluatedkinetically using various mathematical models like zero order, firstorder, Higuchi, and Korsmeyer–Peppas model. The results of thecurve fitting into these above-mentioned mathematical models are
given in Table 6. The ranitidine HCl release from these microsphereswas found to follow zero order model (R2 = 0.997) over a period of10 h. The value of release exponent (n) was determined to be 0.287es of responses.
A. Hooda et al. / International Journal of Biological Macromolecules 51 (2012) 691– 700 699
Fig. 6. (a) FT-IR spectra of placebo microspheres. (b) FT-IR spectra of optimized formulation of drug loaded microspheres.
Shelf Life Analysis
Time (days)
4003002001000
Perc
ent o
f Lab
el C
laim
85
90
95
100
105
Fig. 7. Plot of % drug remaining versus time of optimized formulation for determination of shelf life.
7 Biolog
it
3
lt3ts
3
ld
ltPgd
4
oHcfertvmsbtsbrtdbd
[
[
[
[
[[[
[
[
[[
[
[
[[
[
[[
[
00 A. Hooda et al. / International Journal of
ndicating that the transport of the drug across polymeric matrixakes place by a Fickian diffusion process.
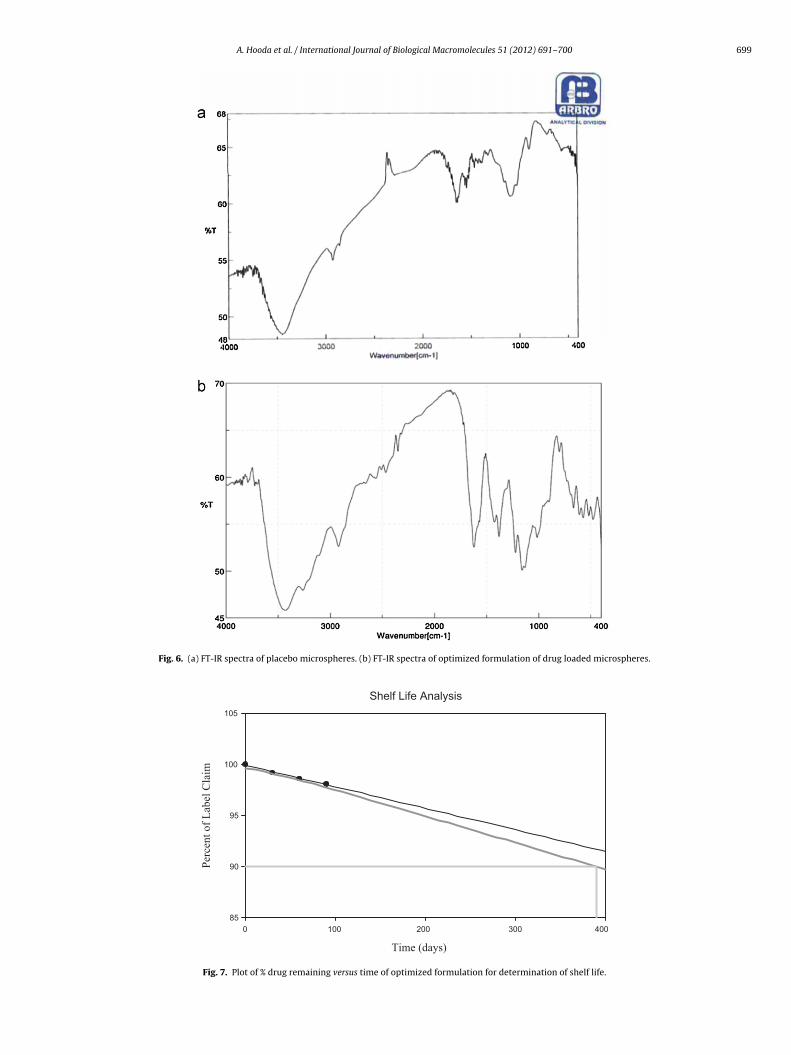
.8. FT-IR spectral analysis
FT-IR spectra of placebo microspheres and optimized drugoaded formulation are represented in Fig. 6a and b. The FT-IR spec-ra of drug loaded formulation shows typical absorption bands at426 cm−1, 1618 cm−1, 1380 cm−1, and 1159 cm−1. This shows thathe peak of the drug were the same for the drug and the formulationhowing no interaction between the excipients.
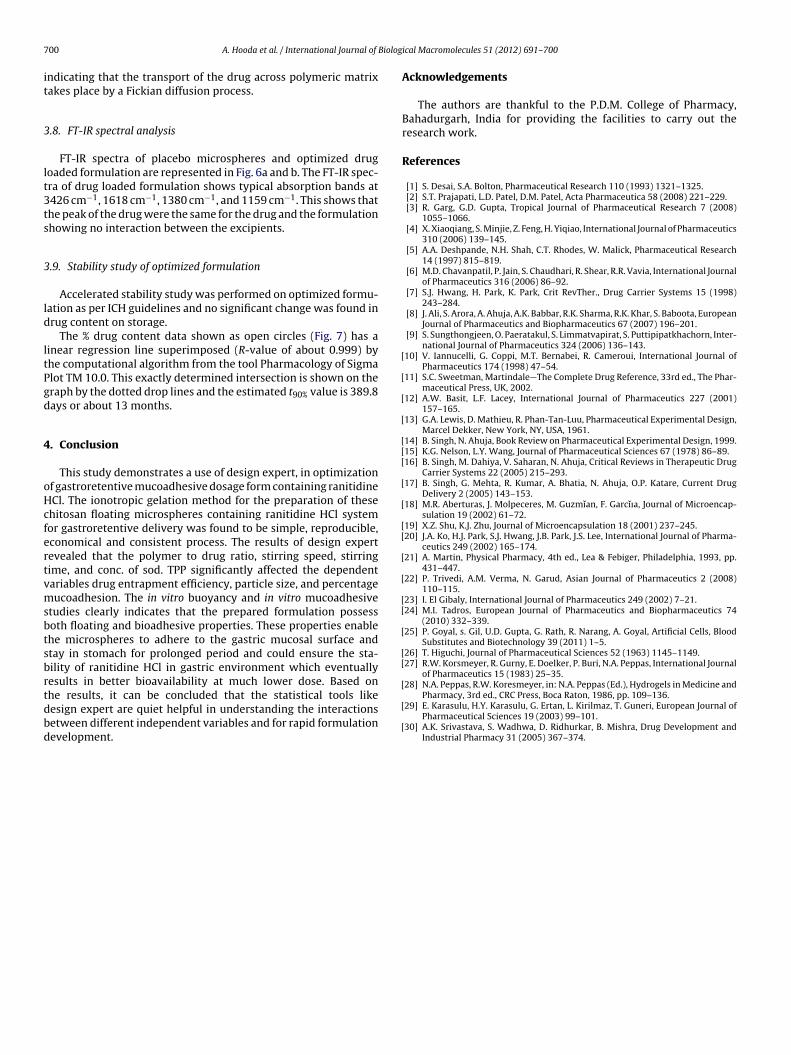
.9. Stability study of optimized formulation
Accelerated stability study was performed on optimized formu-ation as per ICH guidelines and no significant change was found inrug content on storage.
The % drug content data shown as open circles (Fig. 7) has ainear regression line superimposed (R-value of about 0.999) byhe computational algorithm from the tool Pharmacology of Sigmalot TM 10.0. This exactly determined intersection is shown on theraph by the dotted drop lines and the estimated t90% value is 389.8ays or about 13 months.
. Conclusion
This study demonstrates a use of design expert, in optimizationf gastroretentive mucoadhesive dosage form containing ranitidineCl. The ionotropic gelation method for the preparation of thesehitosan floating microspheres containing ranitidine HCl systemor gastroretentive delivery was found to be simple, reproducible,conomical and consistent process. The results of design expertevealed that the polymer to drug ratio, stirring speed, stirringime, and conc. of sod. TPP significantly affected the dependentariables drug entrapment efficiency, particle size, and percentageucoadhesion. The in vitro buoyancy and in vitro mucoadhesive
tudies clearly indicates that the prepared formulation possessoth floating and bioadhesive properties. These properties enablehe microspheres to adhere to the gastric mucosal surface andtay in stomach for prolonged period and could ensure the sta-ility of ranitidine HCl in gastric environment which eventuallyesults in better bioavailability at much lower dose. Based on
he results, it can be concluded that the statistical tools likeesign expert are quiet helpful in understanding the interactionsetween different independent variables and for rapid formulationevelopment.[
[
ical Macromolecules 51 (2012) 691– 700
Acknowledgements
The authors are thankful to the P.D.M. College of Pharmacy,Bahadurgarh, India for providing the facilities to carry out theresearch work.
References
[1] S. Desai, S.A. Bolton, Pharmaceutical Research 110 (1993) 1321–1325.[2] S.T. Prajapati, L.D. Patel, D.M. Patel, Acta Pharmaceutica 58 (2008) 221–229.[3] R. Garg, G.D. Gupta, Tropical Journal of Pharmaceutical Research 7 (2008)
1055–1066.[4] X. Xiaoqiang, S. Minjie, Z. Feng, H. Yiqiao, International Journal of Pharmaceutics
310 (2006) 139–145.[5] A.A. Deshpande, N.H. Shah, C.T. Rhodes, W. Malick, Pharmaceutical Research
14 (1997) 815–819.[6] M.D. Chavanpatil, P. Jain, S. Chaudhari, R. Shear, R.R. Vavia, International Journal
of Pharmaceutics 316 (2006) 86–92.[7] S.J. Hwang, H. Park, K. Park, Crit RevTher., Drug Carrier Systems 15 (1998)
243–284.[8] J. Ali, S. Arora, A. Ahuja, A.K. Babbar, R.K. Sharma, R.K. Khar, S. Baboota, European
Journal of Pharmaceutics and Biopharmaceutics 67 (2007) 196–201.[9] S. Sungthongjeen, O. Paeratakul, S. Limmatvapirat, S. Puttipipatkhachorn, Inter-
national Journal of Pharmaceutics 324 (2006) 136–143.10] V. Iannucelli, G. Coppi, M.T. Bernabei, R. Cameroui, International Journal of
Pharmaceutics 174 (1998) 47–54.11] S.C. Sweetman, Martindale—The Complete Drug Reference, 33rd ed., The Phar-
maceutical Press, UK, 2002.12] A.W. Basit, L.F. Lacey, International Journal of Pharmaceutics 227 (2001)
157–165.13] G.A. Lewis, D. Mathieu, R. Phan-Tan-Luu, Pharmaceutical Experimental Design,
Marcel Dekker, New York, NY, USA, 1961.14] B. Singh, N. Ahuja, Book Review on Pharmaceutical Experimental Design, 1999.15] K.G. Nelson, L.Y. Wang, Journal of Pharmaceutical Sciences 67 (1978) 86–89.16] B. Singh, M. Dahiya, V. Saharan, N. Ahuja, Critical Reviews in Therapeutic Drug
Carrier Systems 22 (2005) 215–293.17] B. Singh, G. Mehta, R. Kumar, A. Bhatia, N. Ahuja, O.P. Katare, Current Drug
Delivery 2 (2005) 143–153.18] M.R. Aberturas, J. Molpeceres, M. Guzmı̌an, F. Garcı̌ıa, Journal of Microencap-
sulation 19 (2002) 61–72.19] X.Z. Shu, K.J. Zhu, Journal of Microencapsulation 18 (2001) 237–245.20] J.A. Ko, H.J. Park, S.J. Hwang, J.B. Park, J.S. Lee, International Journal of Pharma-
ceutics 249 (2002) 165–174.21] A. Martin, Physical Pharmacy, 4th ed., Lea & Febiger, Philadelphia, 1993, pp.
431–447.22] P. Trivedi, A.M. Verma, N. Garud, Asian Journal of Pharmaceutics 2 (2008)
110–115.23] I. El Gibaly, International Journal of Pharmaceutics 249 (2002) 7–21.24] M.I. Tadros, European Journal of Pharmaceutics and Biopharmaceutics 74
(2010) 332–339.25] P. Goyal, s. Gil, U.D. Gupta, G. Rath, R. Narang, A. Goyal, Artificial Cells, Blood
Substitutes and Biotechnology 39 (2011) 1–5.26] T. Higuchi, Journal of Pharmaceutical Sciences 52 (1963) 1145–1149.27] R.W. Korsmeyer, R. Gurny, E. Doelker, P. Buri, N.A. Peppas, International Journal
of Pharmaceutics 15 (1983) 25–35.28] N.A. Peppas, R.W. Koresmeyer, in: N.A. Peppas (Ed.), Hydrogels in Medicine and
Pharmacy, 3rd ed., CRC Press, Boca Raton, 1986, pp. 109–136.29] E. Karasulu, H.Y. Karasulu, G. Ertan, L. Kirilmaz, T. Guneri, European Journal of
Pharmaceutical Sciences 19 (2003) 99–101.30] A.K. Srivastava, S. Wadhwa, D. Ridhurkar, B. Mishra, Drug Development and
Industrial Pharmacy 31 (2005) 367–374.