
Effect of ranitidine on acetaminophen-induced hepatotoxicity in dogs
Upload
independentCategory
view
0download
0
Journal of Pharmaceutical and Biomedical Analysis15 (1997) 1667–1678
Protolytic constants of nizatidine, ranitidine andN,N %-dimethyl-2-nitro-1,1-ethenediamine; spectrophotometric
and theoretical investigation
D. Dumanovic a, I. Juranic b,*, D. Dz' eletovic a, V.M. Vasic c, J. Jovanovic a
a ICN Galenika Institute, 29. No6embra 111, 11 000 Belgrade, Yugosla6iab Faculty of Chemistry, Uni6ersity of Belgrade, P.O. Box 158, 11 001 Belgrade, Yugosla6ia
c Institute of Nuclear Sciences ‘Vinc' a’, Department of Chemistry, P.O. Box 522, 11 001 Belgrade, Yugosla6ia
Received 18 June 1996; accepted 30 October 1996
Abstract
The prototropic exchange equilibria of two drugs, nizatidine (I) and ranitidine (II), and also of structurally relatedthe N,N %-dimethyl-2-nitro-1,1-ethenediamine molecule (III) were investigated. From the changes in electronic spectrain media of various acidity several protonation constants were determined. For nizatidine pK values were −0.82,1.95, and 6.67; for ranitidine pK values were 1.95 and 8.13; and for III was 2.60. The hydroxylation equilibriumconstant in strongly alkaline media was determined too. Corresponding pKa values were 13.23 for I, 13.26 for II and13.76 for III. Molecular orbital calculations of electronic spectra confirmed that pK 1.95 for I and II, and pK 2.60for III, are associated with C-protonation of nitroethenediamine fragment, while all pKa values correspond to theaddition of HO− anion at the same double bond. © 1997 Elsevier Science B.V.
Keywords: Nizatidine; Ranitidine; N,N %-dimethyl-2-nitro-1,1-ethenediamine; Protolytic constants; UV spectra;MNDO-PM3 and ZINDO/S calculations
1. Introduction
Nizatidine, N-[2-[[[2-[(dimethylamino)methyl]-4-thiazolyl]methyl]thio]ethyl]-N %-methyl-2-nitro-1,1-ethenediamine (I) and ranitidine, N-[2-[[[5-[(dimethylamino) methyl]-2-furanyl] methyl]thio]ethyl]-N %-methyl-2-nitro-1,1-ethenediamine (II) are
selective H2-receptor antagonists and powerful in-hibitors of gastric acid secretion introduced for thetreatment of peptic ulcers and related disorders[1–4]. The first synthesis of ranitidine was reportedin 1978 [5] and nizatidine in 1983 [6]. These twodrugs are structurally related and differ in the typeof heterocyclic ring. A key feature of both structuresis N,N %-dialkyl-2-nitro-1,1-ethenediamine moiety[7], since nizatidine (I) contains the thiazolyl, while* Corresponding author.
0731-7085/97/$17.00 © 1997 Elsevier Science B.V. All rights reserved.
PII S0731 -7085 (96 )01977 -2

D. Dumano6ic et al. / J. Pharm. Biomed. Anal. 15 (1997) 1667–16781668
ranitidine (II) contains the furan ring (Scheme 1).To make the clear distinction between the effectsof two moieties, the N,N %-dimethyl-2-nitro-1,1-ethenediamine molecule (III) was investigated too.
Besides the medical importance of nizatidineand ranitidine, these compounds offer a challeng-ing structural problem of the determination of thereactivity of various sites suitable for prototropicexchange.
The pK values for the protonation process ofnizatidine [8] and ranitidine [9], which occur inneutral media (pH 6–8) have been determinedpotentiometrically [8,9]. The protonation constanton a 2-nitroethenediamine moiety of nizatidine [8]as well as of ranitidine [9–11] was determinedspectrophotometrically [8–11]. In this paper, thestudy of protolytic equilibria was extended toinclude the spectrophotometric and theoretical in-vestigations of the protolytic processes inaqueous, in sulphuric acid aqueous solutions andin alkaline media.
For the molecular orbital calculations of theground-state geometries the PM3-MNDO methodwas used [12], as most accurate, particularly forthe nitro compounds. All the calculations weredone on the compound III. Due to the complexstructure of this compound there are certain am-biguities in the assignment of the measured spec-tra to the particular ionic form. Using ZINDO/SMO method, spectra of III and of various ionicspecies derived from it were calculated. The calcu-lated approximate spectra are used to make defin-ite assignments of measured spectra.
Fig. 1. (a)Absorption spectra of III (4×10⁻⁵ M) in solutionsof different pH: 1, 6.59 (B); 2, 3.29; 3, 2.87; 4, 2.56; 5, 2.36; 6,1.98; 7, 1.42; 8, 0.23 (BH+).(b) Absorbance of III (4×10⁻⁵
M) at 209, 309 and 282 nm as a function of H0, pH and J−.(c)Absorption spectra of III (4×10⁻⁵ M) in solutions of differ-ent pH and J−: 1, 12.00 (B); 2, 12.80; 3, 13.30; 4, 13.60; 5,13.85; 6, 14.40; 7, 15.20 (BOH−).
Scheme 1.
The knowledge and use of prototropic ex-change equilibria and stereoelectronic propertiesof pharmacologically important subunits of drugsis profoundly important for successful analytical

D. Dumano6ic et al. / J. Pharm. Biomed. Anal. 15 (1997) 1667–1678 1669
Fig. 2. (a) Absorption spectra of ranitidine, II, (4×10⁻⁵ M)in solutions of different pH and H0: 1, 5.02 (BH+); 2, 2.87; 3,2.56; 4, 2.36; 5, 1.98 6, 1.81; 7, 1,40; 8, 1.20; 9, 0.70; 10, −0.91(BH2
2+).(b) Absorbance of II, (4×10⁻⁵ M) at 223, 313 and282 nm, and of 8×10⁻⁵ M at 227 nm, as a function of H0,pH and J−.(c) Absorption spectra of II (4×10⁻⁵ M) insolutions of different pH and J−: 1, 12.00 (B); 2, 12.70; 3,13.00; 4, 13.20; 5, 13.35; 6, 13.70; 7, 13.95; 8, 15.20 (BOH−).
Fig. 3. (a) Absorption spectra of nizatidine, I, (4×10⁻⁵ M) insolutions of different pH: 1, 5.02 (BH+); 2, 2.87; 3, 2.36; 4,1.98; 5, 1.70; 6, 1.40; 7, 1.00; 8, 0.0 (BH2
2+).(b) Absorbance ofI, (4×10⁻⁵ M) at 259, 313 and 282 nm of 2×10⁻⁴ M at 259nm and of 1.6×10⁻⁴ M at 257 nm, as a function of H0, pHand J−.(c) Absorption spectra of I (4×10⁻⁵ M) in solutionsof different pH and J−: 1, 12.00 (B); 2, 12.70; 3, 13.00; 4,13.20; 5, 13.35; 6, 13.70; 7, 13.95; 8, 15.20 (BOH−).

D. Dumano6ic et al. / J. Pharm. Biomed. Anal. 15 (1997) 1667–16781670
Fig. 4. Absorption spectra of nizatidine, I, (2×10⁻⁴ M) insolutions of different pH: 1, 5.02 (BH+); 2, 5.72; 3, 6.09; 4,6.59; 5, 6.80; 6, 7.00; 7, 7.24 8, 7.54; 9, 8.36–10.38(B).
2. Experimental
2.1. Materials
Nizatidine (CAS No. 76 963-41-2) (I), suppliedfrom ICN Galenika (Belgrade, Yugoslavia), rani-tidine (II) hydrochloride (CAS No. 66 357-59-3),obtained from Zdravlje (Leskovac, Yugoslavia)and N,N %-dimethyl-2-nitro-1,1-ethenediamine(CAS No. 54 252-45-8) (III), product of Uquifa(Barcelona, Spain), were used without furtherpurification. Substrate stock solutions of 1×10⁻³
M were prepared in water. The concentrations ofsubstrates for the determination of pK values were4×10−5–2×10⁻⁴ M. The other chemicals(H2SO4, NaOH) were of reagent grade quality.The acidity of the solutions in the pH range 2–12was adjusted by addition of Britton–Robinsonbuffer. The acidity of concentrated H2SO4 solu-tions was characterized by Hammett acidity func-tion, Ho [13]. The basicity of concentrated NaOHsolutions was described using J− function [14].
2.2. Spectroscopic and pH measurements
UV spectra were recorded, immediately afterpreparing the solutions, on a spectrophotometerShimadzu UV Model 260. The concentration ofsulfuric acid was determined from the densitymeasured at 25°C, using the precise density meter.Acid solutions of various acid concentration weremade by diluting H2SO4 to obtain desired acidity.To check the possible existence of the non-pro-tolytic processes, the absorption spectra wererecorded again after 1 h standing and no changeswere found. On the subsequent dilution of solu-tions in 8 M H2SO4 and in 5 M NaOH, thespectra were identical to those of the controlsolutions in dilute acids or in neutral media.
2.3. Method of computation
Ground state structures of III and ions derivedfrom it were calculated by MNDO-PM3 semiem-pirical molecular orbital method [12], included inMOPAC program package, Version 7.01. Thesimulation of polar medium was performed usingCOSMO facility. The calculation of electronic
procedures, for the selection of optimal conditionsfor synthesis, isolation, and purification. It is es-sential in the realm of pharmaceutical technology,pharmacokinetics, clinical medicine, etc.
Fig. 5. Absorption spectra of nizatidine, I, (1.6×10⁻⁴ M) insolutions of different H0: 1, −2.50 (BH3
3+); 2, −2.23; 3,−1.78; 4, −1.50; 5, −1.10; 6, −0.83; 7, −0.62; 8, −0.30;9, −0.20 (BH2
2+).
D. Dumano6ic et al. / J. Pharm. Biomed. Anal. 15 (1997) 1667–1678 1671
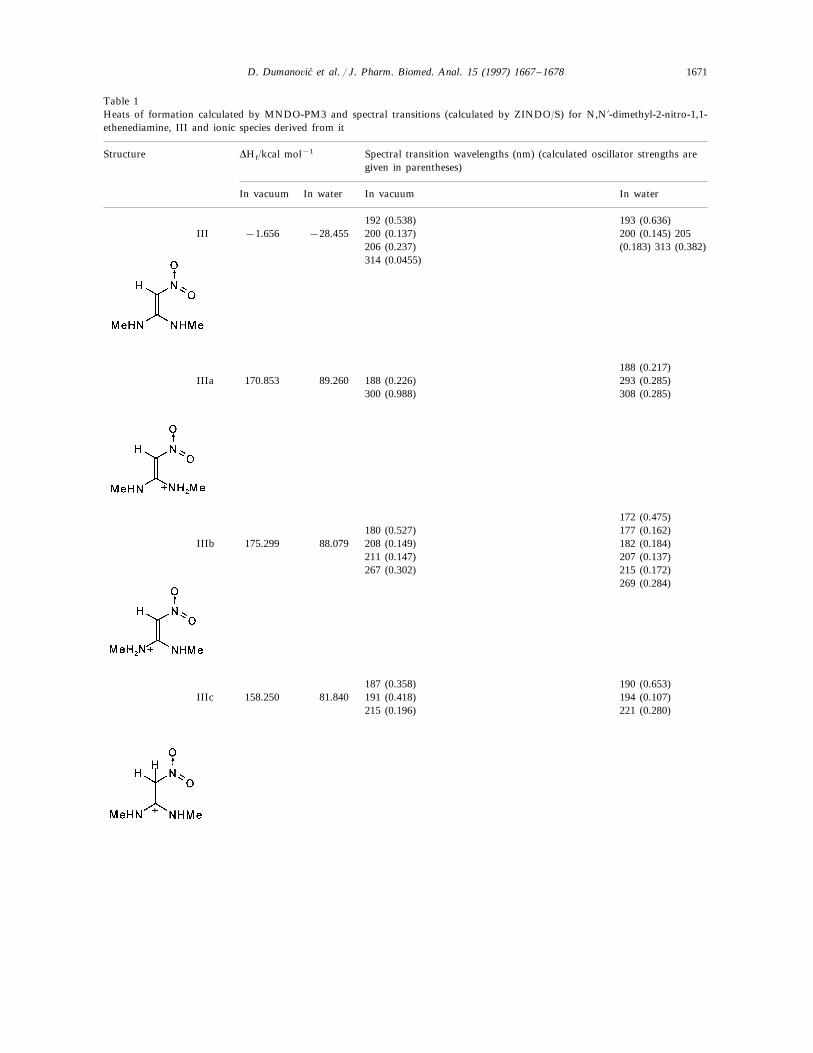
Table 1Heats of formation calculated by MNDO-PM3 and spectral transitions (calculated by ZINDO/S) for N,N%-dimethyl-2-nitro-1,1-ethenediamine, III and ionic species derived from it
DHf/kcal mol−1 Spectral transition wavelengths (nm) (calculated oscillator strengths areStructuregiven in parentheses)
In waterIn vacuumIn vacuum In water
193 (0.636)192 (0.538)III 200 (0.145) 205−1.656 −28.455 200 (0.137)
(0.183) 313 (0.382)206 (0.237)314 (0.0455)
188 (0.217)IIIa 170.853 293 (0.285)89.260 188 (0.226)
300 (0.988) 308 (0.285)
172 (0.475)180 (0.527) 177 (0.162)
IIIb 175.299 88.079 208 (0.149) 182 (0.184)211 (0.147) 207 (0.137)267 (0.302) 215 (0.172)
269 (0.284)
187 (0.358) 190 (0.653)191 (0.418)81.840IIIc 158.250 194 (0.107)
221 (0.280)215 (0.196)

D. Dumano6ic et al. / J. Pharm. Biomed. Anal. 15 (1997) 1667–16781672
Table 1 (continued)
DHf/kcal mol−1Structure Spectral transition wavelengths (nm) (calculated oscillator strengths aregiven in parentheses)
In waterIn vacuumIn vacuum In water
167.527247.106 Partial geometry optimization was done (C–H bond angle was not opti-IIIdmized). See discussion.
173 (0.220) 202 (0.159)90.233 205 (0.426)237 (0.273)IIIe 156.521
320 (0.713)294 (0.923)
202 (0.428)204 (0.130)201 (0.472)
IIIf −72.293 −141.745 205 (0.120) 254 (0.239)247 (0.241) 448 (0.113)673 (0.198) 661 (0.222)
207 (0.303)208 (0.277)−153.042IIIg −97.912 259 (0.281)
269 (0.137)247 (0.562)

D. Dumano6ic et al. / J. Pharm. Biomed. Anal. 15 (1997) 1667–1678 1673
Table 1 (continued)
DHf/kcal mol−1 Spectral transition wavelengths (nm) (calculated oscillator strengths areStructuregiven in parentheses)
In waterIn vacuum In water In vacuum
170 (0.172) 220 (0.159)207 (0.331) 205 (0.426)IIIh −49.443 −127.493307 (0.779) 320 (0.713)
302.31 (0.290)344.96 (0.154)−107.351 265.13 (0.259)IIIi −20.446 264.19 (0.345)
221.67 (0.216) 208.98 (0.184)195.07 (0.216)204.23 (0.339)
transitions was done with ZINDO/S program.Configurational space for the excited state calcu-lations was formed of all monoexcitations up to20 eV cutoff energy.
3. Results and discussion
3.1. Absorption spectra
The absorption spectra of the compounds I–III were recorded in water solutions of the vari-ous acidity, from 8 M H2SO4 to 5 M NaOH.
The absorption spectra of the model sub-stance III in neutral media show the absorptionbands with the maxima at 223 and 309 nm (Fig.1). In acidic solutions (pH 5–0) the protonationof 2-nitroethenediamine moiety caused the hyp-sochromic shift of the absorption maximumfrom 223 to 209 nm while the absorption maxi-mum at 309 nm disappeared (Fig. 1(a,b)). Withthe increasing NaOH concentration up to 5 M,
the longer wavelength maximum was shiftedhypsochromically from 309 to 282 nm (Fig.1(b,c)).
The absorption spectra of ranitidine (Fig. 2)and nizatidine (Fig. 3) in aqueous solutions (pH4–11) show two main absorption bands. Theshort wavelength maximum at 227–259 nmstems mainly from the heterocyclic ring chro-mophore, with the contribution from the 2-ni-troethenediamine chromophore. The other onehas main absorption at 313 nm. The absorptionspectra of both drugs in acidic media (pH 4–0)show the changes similar to the change exertedby III. Disappearance of the absorption band at313 nm, assignable to the substituted conjugated2-nitroethenediamine chromopohore, is followedby the increase in intensity and by the hyp-sochromic shift of the short wavelength maxi-mum, at 223 nm for ranitidine (Fig. 2(a,b)), and207 nm for nizatidine (Fig. 3a). The increase ofpH from 11 to 15.5, leads to the hypsochromicshift of the other absorption maximum from 313

D. Dumano6ic et al. / J. Pharm. Biomed. Anal. 15 (1997) 1667–16781674
Table 2Spectral characteristics of nizatidine (I), ranitidine (II) and N,N %-dimethyl-2-nitro-1,1-ethenediamine (III) molecular species
Ionic formCompound Optimal acidity lmax (nm) 10−4×o (mol−1 dm3 cm−1)
BH33+Nizatidine H0=−2.5–−3.0 207 1.70
0.67257BH2
2+ pH=0.0–0.5 207 1.84257 0.50
BH+ pH=4.0–5.1 259 0.87313 1.59
B pH=9.5–11.5 255 0.771.59313
BOH− J−=15.2–15.4 262 1.10282 1.23
2.15223H0=−1.0–pH=0.0Ranitidine BH22+
pH=4.0–6.0 227 1.73BH+
313 1.65B pH=10.3–11.5 227 1.63
1.663131.55227J−=15.2–15.4BOH−
282 1.26BH+ pH=0.0–0.3III 209 1.20
pH=5.0–11.5B 0.45223309 1.59
J−=15.2–15.4BOH− 282 1.20
to 282 nm (Fig. 2(b,c) and 3(b,c)); again thebehavior similar to that of III.
For the three compounds studied the spectralchanges exert clear isosbestic points, in acidicsolutions at 242 nm(I), 243 nm (II), 235 nm (III)and in alkaline solutions at 238 and 292 nm (I),240 and 292 nm (II), 238 and 288 nm (III).Corollarly, these protolytic processes involve thesame reaction sites on 2-nitroethenediamine moi-ety.
By increasing pH from 4 to 10 the compoundsI and II show the spectral changes that are minutebut visible. The decrease of the intensity of theabsorption at 259 nm of I (Fig. 3b/upper curveand Fig. 4) and at 227 nm of II (Fig. 2b/uppercurve) was accompanied by the appearance of theclear isosbestic points and hypsochromic shift ofthe absorption maximum.
The increase of acidity from pH 0 to H0−3,decreases the absorption of component I at 257nm (Fig. 3b, Fig. 5).
3.2. Molecular orbital calculations
The results of the molecular orbital calculationsare summarized in Table 1. Details on variousconformers of III, are not given, because of theirclose resemblance to the results previously obtainedby MNDO-AM1 method [15]. The structures IIIa–IIIe represent all the possible protonated forms ofIII. (The full geometry optimization was not per-formed for structure IIId. If bond angle of newC–H is not constrained it ends as structure IIIc).In the reference [9] very convincing evidences infavor of C-protonation were given. The calcula-tions confirm it. The calculations both on isolatedand on solvated ions reveal rather low heats offormation for two C-protonated species, IIIc andIIId and O-protonated species IIIe. The semiempir-ical MNDO-PM3 calculation shows that IIId cannot exist. Distinction between IIIc and IIIe isclearly detectable in UV spectra. Only the elec-tronic transitions calculated for IIIc conform to theexperimental spectrum, because IIIe should have

D. Dumano6ic et al. / J. Pharm. Biomed. Anal. 15 (1997) 1667–1678 1675
Table 3The pK values of nizatidine (I), ranitidine (II) and N,N %-dimethyl-2-nitro-1,1-ethenediamine (III), determined spectrophotometrically
pKReaction site pKnIonic form
Ranitidine IIINizatidine
Heterocyclic ring pK3BH33+ −0.8290.07
1.9590.012-nitroethene diamine pK2BH2
2+(a) 1.9590.02 2.6090.022.3 [9]2.1990.04 [10,11]2.1 [8]
Dimethyl amino group pK1BH+ 6.6790.01 8.1390.056.80b 8.20c
2-nitroethene diamine pKaBOH− 13.2390.02 13.2690.04 13.7690.02
a For compound III this is actually BH+ due to lack of dimethyl amino group.b Value 6.80 was found by potentiometric titration [8].c Value 8.20 was found by potentiometric titration [9].
considerable absorption at longer wavelengths.Anionic species can be produced either by the
proton abstraction (IIIh and IIIi) [9], or by thehydroxyl anion addition (IIIf and IIIg). The cal-culations show that IIIf has the lowest heat offormation. The key feature of the UV spectralchanges in alkaline solutions of III is hyp-sochromic and hypochromic shifts of the longwavelength peak. Again, the calculated electronictransitions for IIIg most closely fit the observedeffect. This structure is already suggested in theliterature [16], and we hope that our calculationsbear the conclusive evidence for it.
3.3. The ionic forms and calculation of protolyticconstants
The changes in the absorption spectra due tothe variable media acidity, are the consequences ofthe changed ionic form of the compound. Theabsorbance versus acidity curves were producedfor the investigated acidity range. Table 2 summa-rizes the pH and intervals of the acid concentra-tions where no change of the absorbance takesplace (optimal acidity for particular molecularspecies), together with the wavelength and molarabsorptivity of the peak absorption of the corre-sponding molecular species.
Taking into accounts that there are differentbasic sites, the multiple protonation equilibria inthe acidity range from pH 10 to 8 M H2SO4 occur:
BH(n−1)+n−1 +nH+ = BHn+
n (1)
Kn=[BHn+
n ][BH(n−1)+
n−1 ] [H+]nn=1, 2, 3 (2)
The protonation constant, K1, of the dimethylamino group for compounds I and II was well
established and determined by potentiometric ti-tration [8,9]. Although the spectral changes in theacidity range from pH 5 to 10 were small, the pK1
values of monoprotonated molecules I and II havebeen calculated from the dependence of the ab-sorbance versus pH curves at several wavelengthsaccording to the known spectrophotometricmethod [17].
pK=pH+ log I (3)
I=[BHn+
n ][BH(n−1)+
n−1 ]=
A−A1
A0−A(4)
where A0 and A1 are the absorbancies of the pureforms of the compounds. The spectrophotometri-cally obtained results agree very well with thepotentiometric data [8,9] (Table 3).
The pK2 values of I–III were determined fromthe absorbance versus pH curves in the acidityrange from pH 0 to 5 according to the Eq. (3), andtheir values are mutually related in the mannerexpected from structural differences. This agree-ment suggests that the second protonation processon I and II must be assigned to the 2-nitroethene-diamine moiety.

D. Dumano6ic et al. / J. Pharm. Biomed. Anal. 15 (1997) 1667–16781676
The variation of nizatidine absorbance in ahighly acidic media is shown on Fig. 5. The valueof the protonation constant of the nitrogen atomin a thiazole ring of I (pK3) was calculated usingthe excess acidity method based on the followingequation [18]:
log I− log cH+ =m·X+pK3 (5)
The values for log CH+ and X are independentof the base present and are taken from the litera-ture data for each H2SO4 concentration [18].
The spectroscopic studies of ranitidine in alka-line solutions show that ranitidine, as a weak acid,is completely dissociated in 5 M sodium hydrox-ide [9]. This protolytic constant has not beenaccurately measured but suggested that it is of themagnitude 10−14. Presumably, proton loss is fromnitrogen, although why it leads to a hypsochromic
Fig. 6. Absorption spectra of nizatidine, I, (4×10⁻⁵ M)species: BH3
3+ (——) (H0 −3.0); BH22+ (- - - -) (pH 0.0);
BH+ (- � - � -) (pH 5.3); B (– – – –) (pH 10.4); and BOH−
(——) (J− 15.2).
shift was not clear [9]. However, the report on theinvestigation of hydrolytic cleavage of ranitidineunder strongly basic conditions at reflux tempera-ture [16] was suggested that hydrolytic cleavageoccurs via hydroxy ion attack on the b-carbonatom of the 2-nitroethenediamine moiety.
The equilibrium Eq. (6) represents the additionof a hydroxyl ion that can occur at pH\12:
B+OH− = BOH− (6)
KOH− =[BOH−]
[B][OH−](7)
Scheme 2.
Fig. 7. Absorption spectra of ranitidine, II, (4×10⁻⁵ M)species: BH2
2+ (- - - -) (pH 0.0); BH+ (- � - � -) (pH 5.3); B(– – – –) (pH 10.4); and BOH− (——) (J− 15.2).

D. Dumano6ic et al. / J. Pharm. Biomed. Anal. 15 (1997) 1667–1678 1677
Fig. 8. Absorption spectra of III (4×10⁻⁵ M) species: BH+
(- - - -) (pH 0.0); B (- � - � -) (pH 5.3), (– – – –) (pH 10.4); andBOH− (——) (J− 15.2).
IIIi. The computed properties of various molecu-lar species, given in Table 1, are clearly againstsuch proton exchange. In common terms, theC–H dissociation in highly acidic medium is notprobable. It is well known fact that anionic spe-cies have much higher reduction potential thancorresponding cation and experimental facts showclear decrease of reduction potential at lower pH.All the effects described in the literature [19,20]are easy to explain by involvement of intermediateIIIc. This is also consistent with the finding thatnitrosation of a nitroethenediamine moiety occurspreferentially at a carbon atom [21].
The prototropic exchange b�a may involveprotonation on several places: oxygen in a nitrogroup, amine nitrogen in ethenediamine moiety,and nitrogen in a thiazole ring. The lack ofanalogous protonation in ranitidine suggests thatthis metathesis is related to the presence of athiazole ring.
Once the pK value is determined, the H0, pH,or J− of the medium could be chosen to obtainthe maximal concentration of the correspondingmolecular species. For nizatidine, ranitidine andcompound III, spectra of pure molecular speciestaken at appropriate acidity values are given inFigs. 6–8.
The knowledge of correct pK values of pharma-ceuticals has a profound pharmacological rele-vance, enabling the preparation of most stableand most efficient formulations. The results pre-sented in this work show that spectrophotometrictitration coupled with MO calculations offer accu-rate method for the identification of ionic speciesderived from complex organic molecules.
References
[1] R.N. Brogden, A.A. Carmine, R.C. Heel, T.M. Speightand G.S. Avery, Drugs, 24 (1982) 267–303.
[2] J. Dawson, R. Cockel, G.T. Dixon, D.A. Richards andR. Stables, J. Clin. Hosp. Pharm., 8 (1983) 1–13.
[3] M.J. Daly and B.J. Price, Prog. Med. Chem., 20 (1983)337–368.
[4] A.H. Price and R.N. Brogden, Drugs, 36 (1988) 521–539.[5] B.J. Price, J.W. Clitherow and J. Bradshaw (Allen and
Hanburys Ltd.), Ger. Offen. 2.734.070, 09. Feb. 1978;Brit Appl. 76/32.465, 04 August 1976, pp. 83, Chem.Abstr. 88 (1978) 190.580b.
The symbol B represents a very weakly acidicmolecule having no net charge.
For addition of hydroxyl ions (Eq. (6)) theacidity function J− has been defined [13,14] as:
J− =pKa+ log[BOH−]
[B](8)
where pKa=pKOH− +pKw ; pKw denotes a nega-tive logarithm of the dissociation constant of wa-ter. To calculate values of pKa by means ofequilibrium 8, the value of log I was determinedfrom spectrophotometric measurements at vary-ing sodium hydroxide concentrations.
The pK values for the two drugs, nizatidine andranitidine, and for the model substance III aresummarized in Table 3. The differences foundbetween the successive pKn values are largeenough to justify the assumption in the treating ofexperimental data that protonation steps takeplace one at a time.
Scheme 2 shows three steps of protonationequilibria and the process of the addition of ahydroxyl ion on nizatidine.
The structures d and c in Scheme 2 are easilycharacterized by UV absorption maximum at �310 nm that is found in uncharged forms of IIand III too. The transition c�b is characterizedby the disappearance of this absorption maximumat approximately 310 nm, implying a major struc-tural change. Some authors [19,20] have proposeda proton exchange resembling the transition III�

D. Dumano6ic et al. / J. Pharm. Biomed. Anal. 15 (1997) 1667–16781678
[6] R.P. Pioch (Lilly, Eli and Co.) U.S. 4.382.090, 03 May1983, U.S. Appl. 193.192, 02 Oct. 1980, 23 pp. Cont.- inpart of U.S. 4.375.547; Chem. Abstr. 99 (1983) 43548w.
[7] S. Rajappa, Tetrahedron, 37 (1981) 1453–1480.[8] T.J. Wozniak, Anal. Profiles Drug Subst., 19 (1990) 397–
427.[9] T.J. Cholerton, J.H. Hunt, G. Klinkert and M. Martin-
Smith, J. Chem. Soc., Perkin Trans., 2 (1984) 1761–1776.[10] M. Hohnjec, S. Rendic, T. Alebic-Kolbah, F. Kajfes' , N.
Blaz' evic and J. Kuftinec, Acta Pharm. Jugosl., 31 (1981)131–142.
[11] M. Hohnjec, J. Kuftinec, M. Malnar, M. S& kreblin, F.Kajfes' , A. Nagl and N. Blaz' evic, Anal. Profiles DrugSubst., 15 (1986) 534–561.
[12] J.J.P. Stewart, J. Comp.-Aided Molec. Des., 4 (1990)1–105.
[13] C.H. Rochester, in Acidity Functions, Academic Press,London, New York, 1970, pp. 22–36.
[14] W.J. Bover and P. Zuman, J. Am. Chem. Soc., 95 (1973)2531–2536.
[15] R.D. Enriz and E.A. Jauregui, J. Mol. Struct. (Teochem),207 (1990) 269–283; R.D. Enriz and E.A. Jauregui, ActaCient. Venez., 42 (1991) 70–76; R.D. Enriz, G.M. Cinffo,M.R. Estrada and E.A. Jauregui, Acta Cient. Venez., 39(1988) 214–223.
[16] P.A. Haywood, M. Martin-Smith, T.J. Cholerton andM.B. Evans, J. Chem. Soc., Perkin Trans., 1 (1987)951–954.
[17] A.G. Asuero, M.J. Navas and J.L. Jimenez-Trillo, Ta-lanta, 33 (1986) 195–198.
[18] R.A. Cox and K. Yates, J. Am. Chem. Soc., 100 (1978)3861–3867.
[19] P. Richter, M.I. Toral and F. Munoz-Vargas, Analyst,119 (1994) 1371–1374.
[20] A. Sega, R. Toso, V. S& unjic, L. Klasinc, A. Sabljic and D.Srzic, Gazz. Chim. Ital., 111 (1981) 217–222.
[21] T.J. Cholerton, J. Clitherow, J.H. Hunt, J.W.M. Mackin-non, M. Martin-Smith, B.J. Price, J. Murray-Rust and P.Murray-Rust, J. Chem. Res. (S) (1985) 250–251; J. Chem.Res. (M) (1985) 2818–2846.
.
Copyright © 2022 FDOKUMEN


![(+)-Chlorido[(1,2,3,4-η;κ P 2′ )-2′-diphenylphosphanyl-2-diphenylphosphoryl-1,1′-binaphthyl]rhodium(I) methanol monosolvate](https://static.fdokumen.com/doc/165x107/6336927a242ed15b940dc815/-chlorido1234-ik-p-2-2-diphenylphosphanyl-2-diphenylphosphoryl-11-binaphthylrhodiumi.jpg)
![Lippke (2014.2), Verbindungslinien [RVO 2|CO 1,1]](https://static.fdokumen.com/doc/165x107/6320792ea3cd9cf896067893/lippke-20142-verbindungslinien-rvo-2co-11.jpg)


![The photophysics of singlet, triplet, and degradation trap states in 4,4-N,N[sup ʹ]-dicarbazolyl-1,1[sup ʹ]-biphenyl](https://static.fdokumen.com/doc/165x107/634397aac405478ed30633d9/the-photophysics-of-singlet-triplet-and-degradation-trap-states-in-44-nnsup.jpg)