
Future Supply Chain Solutions Limited Investor Presentation
30
Future Supply Chain Solutions Limited Investor Presentation November 19, 2018
-
Upload
khangminh22 -
Category
Documents
-
view
4 -
download
0
Transcript of Future Supply Chain Solutions Limited Investor Presentation
Future Supply Chain Solutions Limited
Investor Presentation
November 19, 2018
Future Supply Chain Solutions Limited Investor Presentation
Disclaimer
2
This report contains forward-looking statements, which may be identified by their use of words like ‘plans’, ‘expects’, ‘will’, ‘anticipates’, ‘believes’, ‘intends’, ‘projects’, ‘estimates’, orother words of similar meaning. All statements that address expectations or projections about the future, including but not limited to statements about the Company’s strategy forgrowth, market position, expenditures, and financial results are forward-looking statements. Forward-looking statements are based on certain assumptions and expectations of futureevents. Actual future performance, outcomes and results may differ materially from those expressed in forward-looking statements as a result of a number of risks, uncertainties andassumptions. Although the Company believes that such forward-looking statements are based on reasonable assumptions, it can give no assurance that such expectations will be met.You are cautioned not to place undue reliance on these forward-looking statements, which are based on current views of the Company’s management on future events. Norepresentation or warranty (whether express or implied) is given in respect of any information in this presentation.All figures herein have been rounded off to the nearest integer.
References to the A&M Industry Report are to the report of Alvarez & Marsal India Private Limited (“A&M India”) entitled “Future of Organized Logistics in India - Contract, Express andCold Chain” (the “Report”), which is subject to the following disclaimer:The information in the Report includes extracts from publicly available information, data and statistics and has been derived from various government publications, data provided byinternational agencies, industry estimates and industry reports. A&M India has not performed anything in the nature of an audit and nor has it independently verified or checked thisinformation. The data may have been re-classified by A&M India for the purposes of this presentation. Industry sources and publications generally state that the information containedtherein has been obtained from sources generally believed to be reliable, but that their accuracy, completeness and underlying assumptions are not guaranteed and their reliabilitycannot be assured. Industry sources and publications are also prepared based on information as of specific dates and may no longer be current or reflect current trends. All informationcontained in the Report is updated as on the date of the Report (“Report Date”). A&M India is under no obligation to update the information contained in the Report past the ReportDate. Industry sources and publications may also base their information on estimates, projections, forecasts and assumptions that may prove to be incorrect. No part of the Reportshould be construed as expert advice or investment advice within the meaning of any law or regulation. Accordingly, investors should not place reliance on, or base an investmentdecision on the Report and must undertake their own due diligence and consult their own advisors for making any investment decisions. Neither A&M India nor any of its affiliates northeir respective directors, officers and employees (together, the “Affiliates”) are soliciting any action based on the Report, and nothing contained herein constitutes an offer or aninvitation to subscribe for or purchase any securities and should not be construed as such. There is no assurance that all matters of significance will be disclosed by A&M India’s Report.A&M India does not make any warranties or guarantees of any nature with respect to the economic, financial or other results which the Company may experience. A&M India’s summarydoes not include an analysis of the potential impact of any unexpected sharp rise or decline in local or general financial markets or economic conditions or technological changes.The contents of the Report are for general information purposes only. Neither A&M India nor its Affiliates will be responsible for any loss or damage that could result from reliance onany information being made available to you in the Report. A&M India does not make representations about or bears responsibility for, the results obtained from the use of theinformation in the Report. Except as specifically authorized by A&M India in its consent letter issued to Future Supply Chain Solutions Limited, no person is authorized to, and may not,copy or duplicate all or any part of the Report in any form by any means, or redistribute it to any other person. The Report is not a recommendation to invest / disinvest in, or take anydecisions in respect of, any company covered in the Report. Neither A&M India nor its Affiliates have any liability whatsoever to the subscribers / users / transmitters / distributors of theReport or of the information in it, except the Company. Neither A&M India nor any of its Affiliates accept any liability or responsibility whatsoever in respect of unauthorized alterationsor changes which may have been done, undertaken or occurred during the course of transmission of the Report through electronic means.

Future Supply Chain Solutions Limited Investor Presentation
Company Overview

Future Supply Chain Solutions Limited Investor Presentation
Service Offerings to customers in four key areas Amongst India’s largest organized third-party logistics operators
Company Overview
4
At forefront in introducing new standards
of technology & automation in
the Indian logistics industry
Pan-India Supply Chain
Network
Well positioned to cater to the
shift to pan-India distribution
pursuant to GST implementation
Comprehensive solutions for supply chain requirement
Diverse customer base across many
sectors; Longstanding relationship with
Future entities
Asset Light Business Model
Standalone Financial PerformanceRevenue
In ₹ mn
FY18
FY16-18 CAGR (%)
7,750 6731,212
22.1% 31.6% 51.3%
EBITDAIn ₹ mn
PATIn ₹ mn
28.0%
ROCE%
H1 FY19 5,041 392709 26.9%*
* ROCE: Return on Average Capital Employed calculated by dividing Last Twelve Months Operating Profit by Average of Capital Employed (Excluding Cash & Bank Balance)
^ Growth Percentage is calculated based on H1FY18 pre-exceptional net profit, adjusting for impact of one-time other income of ₹ 70.6 million
Contract Logistics
Express Logistics
Temperature-Controlled Logistics
Vulcan Express (Last Mile Delivery)
41.0% 26.2% 49.3%^% Growth
(Y-o-Y)

Future Supply Chain Solutions Limited Investor Presentation5
41.0%
Significant Revenue Growth; H1FY19
Revenue at ₹ 5,041 mn
₹ 709 mnEBITDA
49.3%
Strong Net Profit Growth *
14.1%
Cash Profit
₹ 546 mn
Healthy EBITDA Margin
Reducing Trade Receivable Days Strong Balance Sheet
Net Cash Position#
₹ 42 mn
₹₹
Standalone H1 FY19 Snapshot: Strong Fundamentals
High ROCE^; Driven by Asset Light Business
Model
26.9%
141
10894 90
FY1
7
FY1
8
Q1
FY1
9
Q2
FY1
9
Growth numbers on Y-o-Y basis; # Calculated as Total Cash & Bank Balance less Total Debt * Growth Percentage is calculated based on H1FY18 pre-exceptional net profit, as it included one-time other income of ₹ 70.6 mn^ ROCE: Return on Average Capital Employed calculated by dividing Last Twelve Months Operating Profit by Average of Net Capital Employed of Q2FY18 and Q2FY19
Two-notch Rating Upgrade to AA-by CARE Ratings
Limited

Future Supply Chain Solutions Limited Investor Presentation6
Warehouse Space1 4.58mn sq. ft.
5.612
mn sq. ft.6.402
mn sq. ft.
Distribution Centres / Temperature-controlled
Distribution Centres55 / 4 66 / 4 80 /4
Hubs / Branches (Including Franchisees)
14 / 129 14 / 129 14 / 129
Containerized Vehicles3
(Dedicated)622 771 832
Owned Reefer Trucks4 144 116 116
Pan-India Supply Chain Infrastructure
Note: 1. Includes one distribution center of customer operated by FSC with area of 0.29 mn. sq. feet of warehouse space2. Includes 0.22mn warehouse space of Vulcan that has been integrated with FSC during H1 FY193. For contract and express logistics for the month of March 2018, June 2018 and September 2018 respectively4. As of March 31, 2018, June 30, 2018 and September 30, 2018 respectively
Mar-18 Jun-18 Sep-18

Future Supply Chain Solutions Limited Investor Presentation
211,816 230,680259,812
313,350374,680
FY16 FY17 FY18 FY19E* FY20E*
Future Retail Future Lifestyle Future Consumer
Fashion & Apparel, 21%
Food & FMCG, 17%
E-Commerce, 18% CDEIT, 17%
Automotive & Engineering , 10%
Home & Furniture, 13%
Others, 4%
FSC's revenue mix from different sectors * - H1 FY19
Strong Presence in Fast Growing Consumption Sectors
7
Strong Anchor Customers
* Based on consolidated revenues other than anchor customers
Diverse Non-Anchor Customer Portfolio
FSC Works With Reputed Companies
₹ m
illio
n
Key Future Entities & Brands
* Based on Bloomberg Consensus Estimates
Reported Revenue of Key Anchor Customers: Expect Strong Growth
Anchor customers’ large scale, consumer focus & growth visibility: A key strength for FSC
Non-Anchor revenues have more than doubled in the past 5 years

Future Supply Chain Solutions Limited Investor Presentation8
Warehouse Management System (“WMS”)
Inventory management tool integrated directly with customer’s enterprise resource planning system to provide visibility of inventory
Transport Management System (“TMS”)
Provides 24x7 direct visibility into distribution chain through online portal
Vehicle Tracking System (“VTS”)
GPS-enabled vehicles allow for real-time tracking of customer goods
Mobility Platform
Portal for customers to access TMS. The platform connects features of VTS with TMS to provide customers real-time tracking
Ensuring Efficiency While Maintaining Accuracy
At the Forefront of Process Automation & Technology Enhancements
Future Supply Chain Solutions Limited Investor Presentation
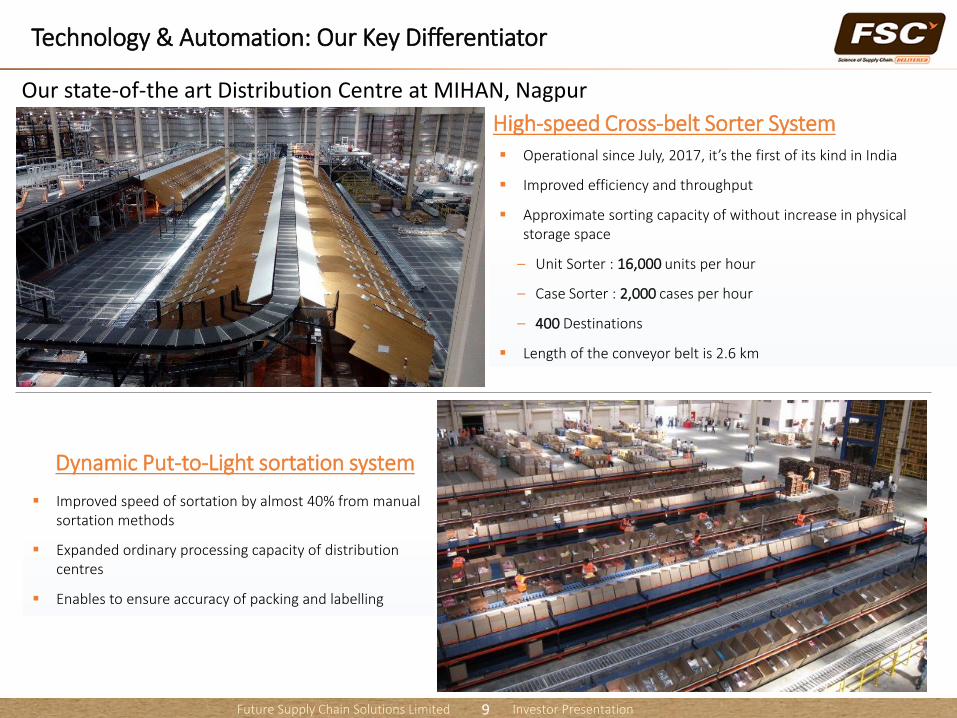
Technology & Automation: Our Key Differentiator
High-speed Cross-belt Sorter System
Dynamic Put-to-Light sortation system
Our state-of-the art Distribution Centre at MIHAN, Nagpur
Improved speed of sortation by almost 40% from manual sortation methods
Expanded ordinary processing capacity of distribution centres
Enables to ensure accuracy of packing and labelling
Operational since July, 2017, it’s the first of its kind in India
Improved efficiency and throughput
Approximate sorting capacity of without increase in physical storage space
– Unit Sorter : 16,000 units per hour
– Case Sorter : 2,000 cases per hour
– 400 Destinations
Length of the conveyor belt is 2.6 km
9

Future Supply Chain Solutions Limited Investor Presentation
Industry Overview
Future Supply Chain Solutions Limited Investor Presentation
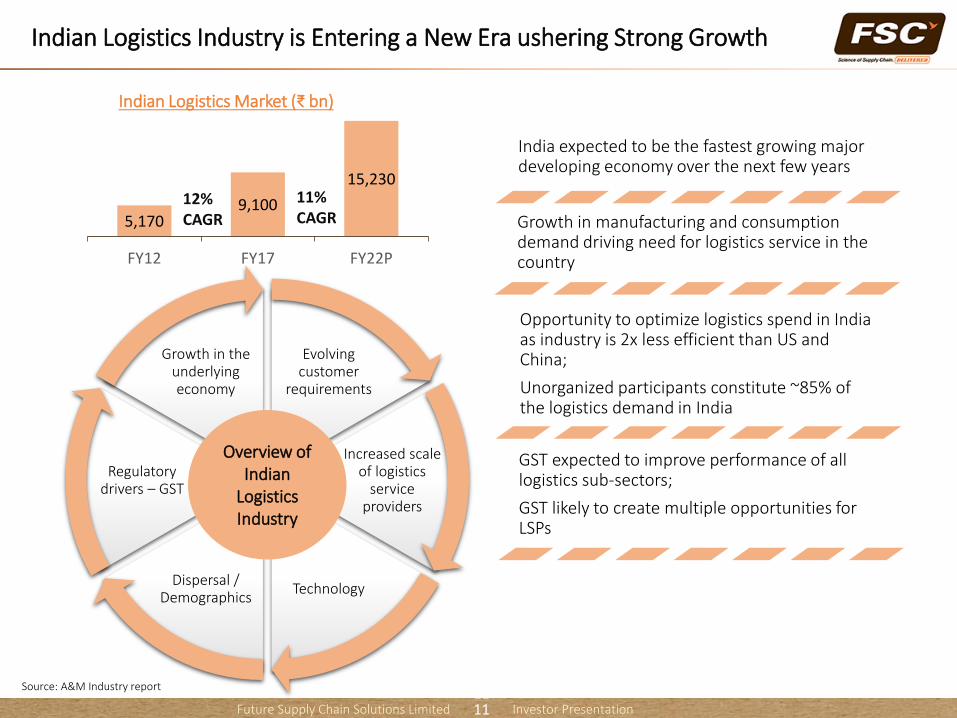
Evolving customer
requirements
Increased scale of logistics
service providers
TechnologyDispersal /
Demographics
Regulatory drivers – GST
Growth in the underlying economy
Indian Logistics Industry is Entering a New Era ushering Strong Growth
11
Overview of Indian
Logistics Industry
Source: A&M Industry report
5,1709,100
15,230
FY12 FY17 FY22P
Indian Logistics Market (₹ bn)
11
12% CAGR
11% CAGR
India expected to be the fastest growing major developing economy over the next few years
Growth in manufacturing and consumption demand driving need for logistics service in the country
GST expected to improve performance of all logistics sub-sectors;
GST likely to create multiple opportunities for LSPs
Opportunity to optimize logistics spend in India as industry is 2x less efficient than US and China;
Unorganized participants constitute ~85% of the logistics demand in India

Future Supply Chain Solutions Limited Investor Presentation
FF/ NVOCC
5,900
2,065
340
245
235
200
110
100#
Road Transport
Others
Container…
Freight Fwding. /…
Agri Warehousing
Cold Chain
Contract Logistics
Express Services
Market Size (₹ bn)
Strong Growth Outlook for Logistics Sector in India; FSC services are attractively placed
12
Key segments – Indian Logistics Industry
# Part of overall road transport industry
Source: A&M Industry report
50110
244
FY12 FY17 FY22
0
50
100
150
200
250
300
52100
200
FY12 FY17 FY22
0
50
100
150
200
250
414
36
FY12 FY17 FY22
0
5
10
15
20
25
30
35
40
Contract Logistics Market in ₹ bn
FY12-17 CAGR
14%
17%
15%
13%
07%
15%
-
14%
Express Logistics Market in ₹ bn
Cold Chain Logistics Market* in ₹ bn
*Note: Industry size for the Organized players
Road Transport
Port Services
Agri.Warehouse
Articulated Project
Custom BondedWarehouse
Tank Farms
Coastal ShippingCold Chain
Air (Domestic)
Express Services
Container LogisticsContract Logistics
RO
CE
High
Low HighBarriers to entry
Last 5 years growth 15-20% 10-15% 5-10% 0-5%
Note: Size of bubble represents relative size of opportunity for organized private participants
12
Future Supply Chain Solutions Limited Investor Presentation
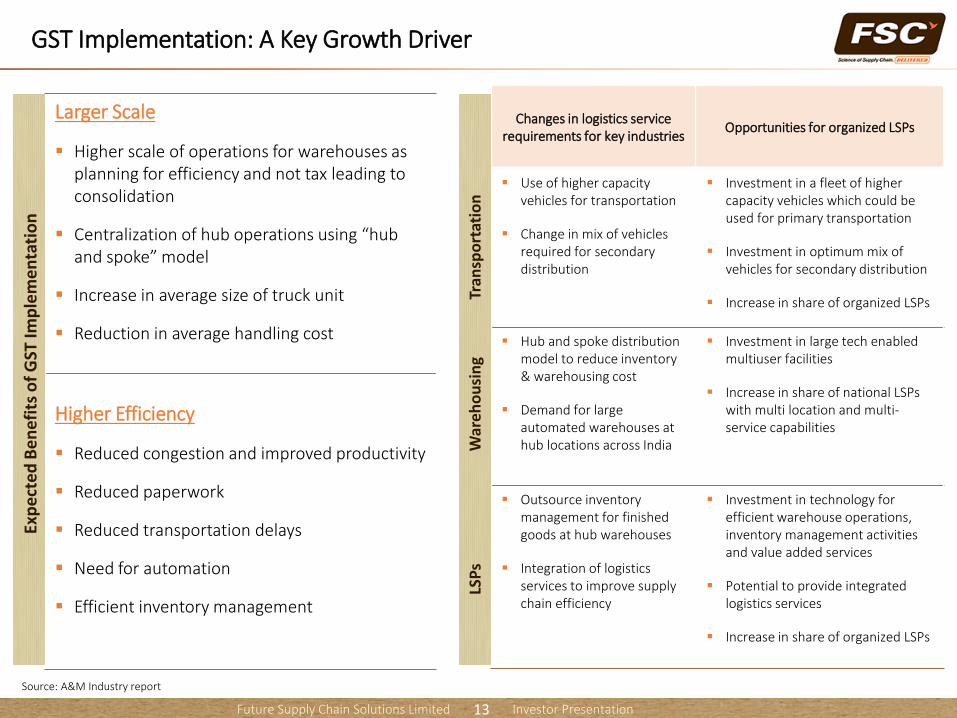
Larger Scale
Higher scale of operations for warehouses as planning for efficiency and not tax leading to consolidation
Centralization of hub operations using “hub and spoke” model
Increase in average size of truck unit
Reduction in average handling cost
Higher Efficiency
Reduced congestion and improved productivity
Reduced paperwork
Reduced transportation delays
Need for automation
Efficient inventory management
13
Exp
ect
ed
Be
nef
its
of
GST
Imp
lem
en
tati
on
Changes in logistics service requirements for key industries
Opportunities for organized LSPs
Use of higher capacity vehicles for transportation
Change in mix of vehicles required for secondary distribution
Investment in a fleet of higher capacity vehicles which could be used for primary transportation
Investment in optimum mix of vehicles for secondary distribution
Increase in share of organized LSPs
Hub and spoke distribution model to reduce inventory & warehousing cost
Demand for large automated warehouses at hub locations across India
Investment in large tech enabled multiuser facilities
Increase in share of national LSPs with multi location and multi-service capabilities
Outsource inventory management for finished goods at hub warehouses
Integration of logistics services to improve supply chain efficiency
Investment in technology forefficient warehouse operations, inventory management activities and value added services
Potential to provide integrated logistics services
Increase in share of organized LSPs
Tran
spo
rtat
ion
War
eho
usi
ng
LSP
s
Source: A&M Industry report
GST Implementation: A Key Growth Driver
Future Supply Chain Solutions Limited Investor Presentation14
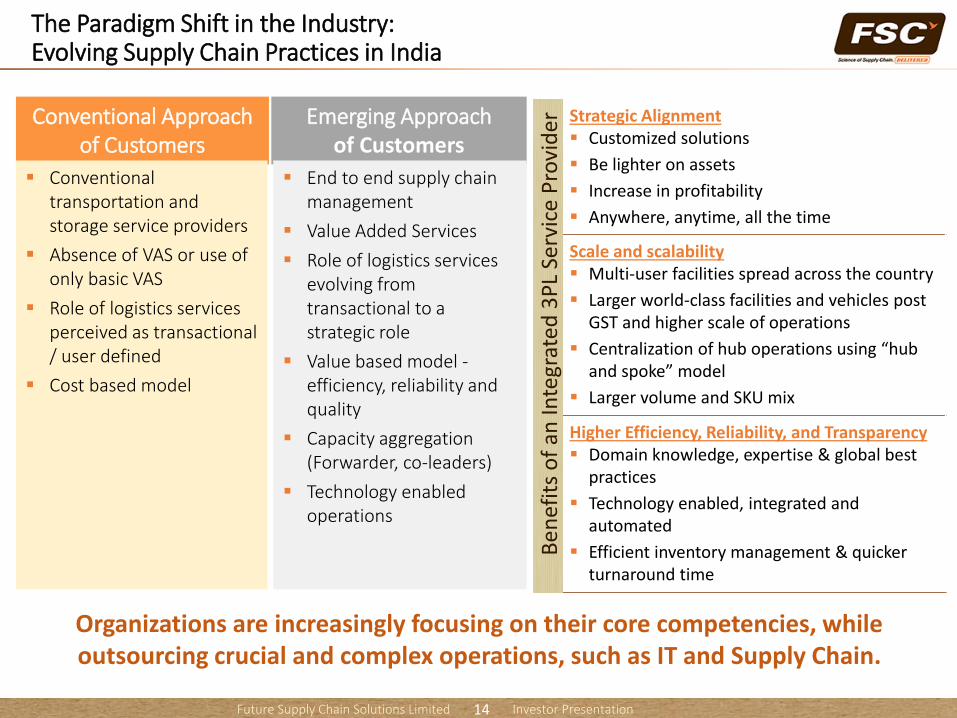
The Paradigm Shift in the Industry:Evolving Supply Chain Practices in India
Conventional Approach of Customers
Emerging Approach of Customers
Conventional transportation and storage service providers
Absence of VAS or use of only basic VAS
Role of logistics services perceived as transactional / user defined
Cost based model
End to end supply chain management
Value Added Services
Role of logistics services evolving from transactional to a strategic role
Value based model -efficiency, reliability and quality
Capacity aggregation (Forwarder, co-leaders)
Technology enabled operations
Strategic Alignment Customized solutions
Be lighter on assets
Increase in profitability
Anywhere, anytime, all the time
Scale and scalability Multi-user facilities spread across the country
Larger world-class facilities and vehicles post GST and higher scale of operations
Centralization of hub operations using “hub and spoke” model
Larger volume and SKU mix
Higher Efficiency, Reliability, and Transparency Domain knowledge, expertise & global best
practices
Technology enabled, integrated and automated
Efficient inventory management & quicker turnaround time
Be
nef
its
of
an In
tegr
ated
3P
L Se
rvic
e P
rovi
der
Organizations are increasingly focusing on their core competencies, while outsourcing crucial and complex operations, such as IT and Supply Chain.

Future Supply Chain Solutions Limited Investor Presentation
Business Overview

Future Supply Chain Solutions Limited Investor Presentation
Key Business Highlights; Robust Outlook
16
Strong 12-month sales funnel of
₹ 4,000 -5,000 mn: Potential customers at
various stages of discussion
On-boarded several reputed customers,
including Voltbek Home Appliances Private
Limited (a Voltas JV), JK Helene Curtis Limited
(part of Raymond Group), Tilda Limited and
many more during Q2FY19
Signed 3.2 mn sq. ft. space in FY19 till date for Built To Suit Distribution
Centers: Possession expected during FY19
and FY20
Added 1.8 mn sq. ft. of warehousing space in H1
FY19 as compared to 0.60 mn sq. ft. in FY18,
supported by strong visibility on revenue
Future Supply Chain Solutions Limited Investor Presentation
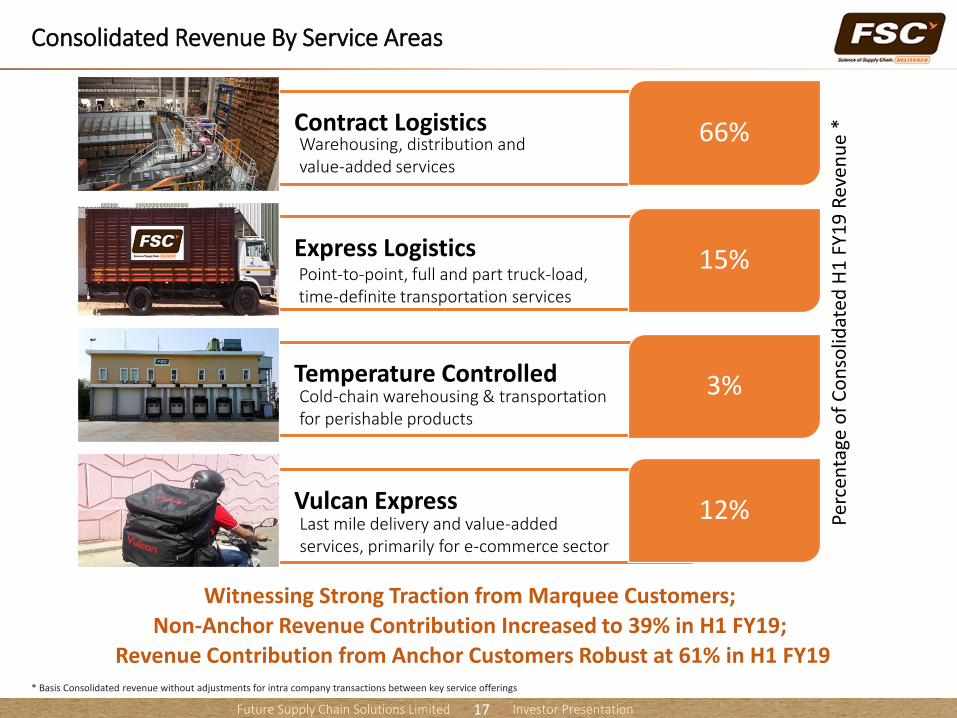
Consolidated Revenue By Service Areas
17
Contract Logistics
Express Logistics
Temperature Controlled
Vulcan Express
66%
15%
3%
12% Perc
enta
ge o
f C
on
solid
ated
H1
FY1
9 R
even
ue
*
Warehousing, distribution and value-added services
Point-to-point, full and part truck-load, time-definite transportation services
Cold-chain warehousing & transportation for perishable products
Last mile delivery and value-added services, primarily for e-commerce sector
Witnessing Strong Traction from Marquee Customers; Non-Anchor Revenue Contribution Increased to 39% in H1 FY19;
Revenue Contribution from Anchor Customers Robust at 61% in H1 FY19* Basis Consolidated revenue without adjustments for intra company transactions between key service offerings
Future Supply Chain Solutions Limited Investor Presentation18
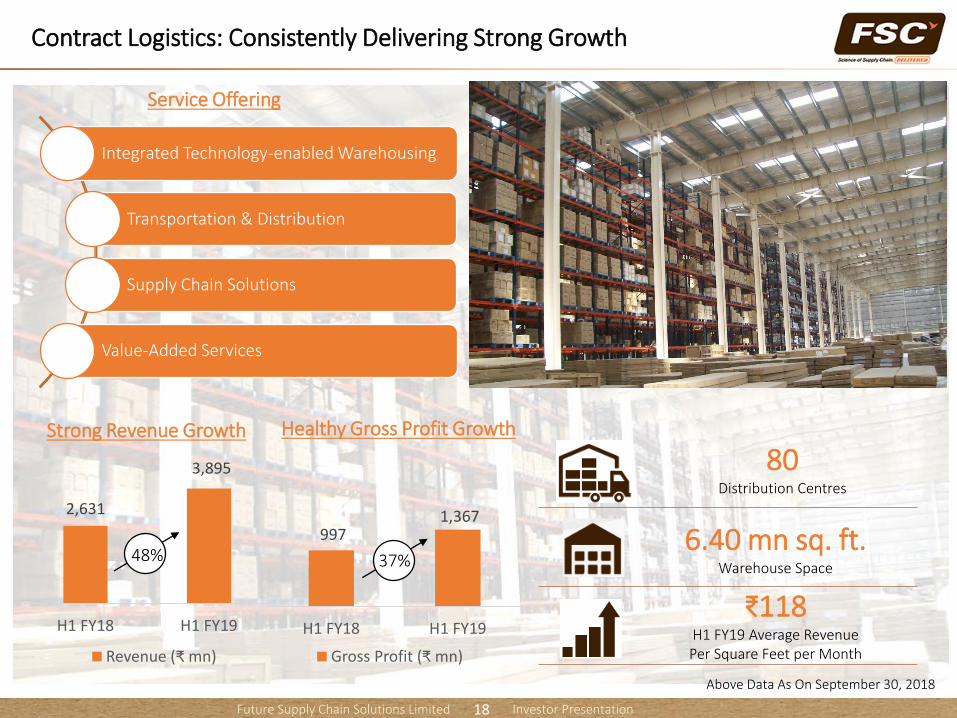
Contract Logistics: Consistently Delivering Strong Growth
2,631
3,895
H1 FY18 H1 FY19
Revenue (₹ mn)
997 1,367
H1 FY18 H1 FY19
Gross Profit (₹ mn)
Integrated Technology-enabled Warehousing
Transportation & Distribution
Supply Chain Solutions
Value-Added Services
Service Offering
6.40 mn sq. ft.Warehouse Space
₹118H1 FY19 Average Revenue Per Square Feet per Month
Strong Revenue Growth Healthy Gross Profit Growth
48% 37%
80Distribution Centres
Above Data As On September 30, 2018
Future Supply Chain Solutions Limited Investor Presentation
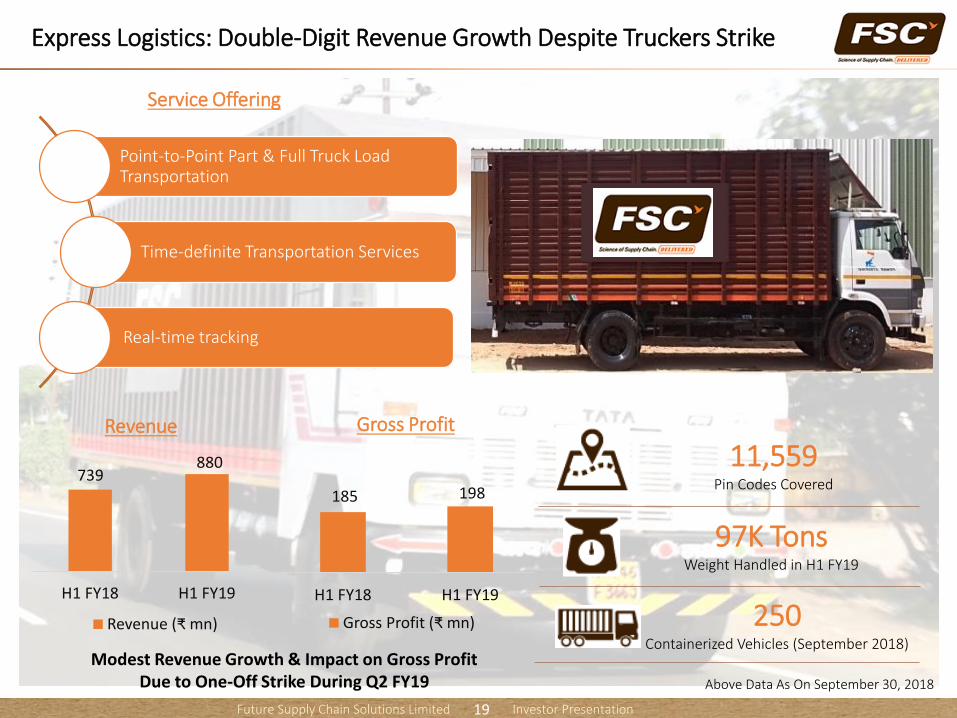
739 880
H1 FY18 H1 FY19
Revenue (₹ mn)
185 198
H1 FY18 H1 FY19
Gross Profit (₹ mn)
Modest Revenue Growth & Impact on Gross Profit Due to One-Off Strike During Q2 FY19
19
Express Logistics: Double-Digit Revenue Growth Despite Truckers Strike
Revenue Gross Profit
97K TonsWeight Handled in H1 FY19
11,559Pin Codes Covered
250Containerized Vehicles (September 2018)
Point-to-Point Part & Full Truck Load Transportation
Time-definite Transportation Services
Real-time tracking
Service Offering
Above Data As On September 30, 2018
Future Supply Chain Solutions Limited Investor Presentation
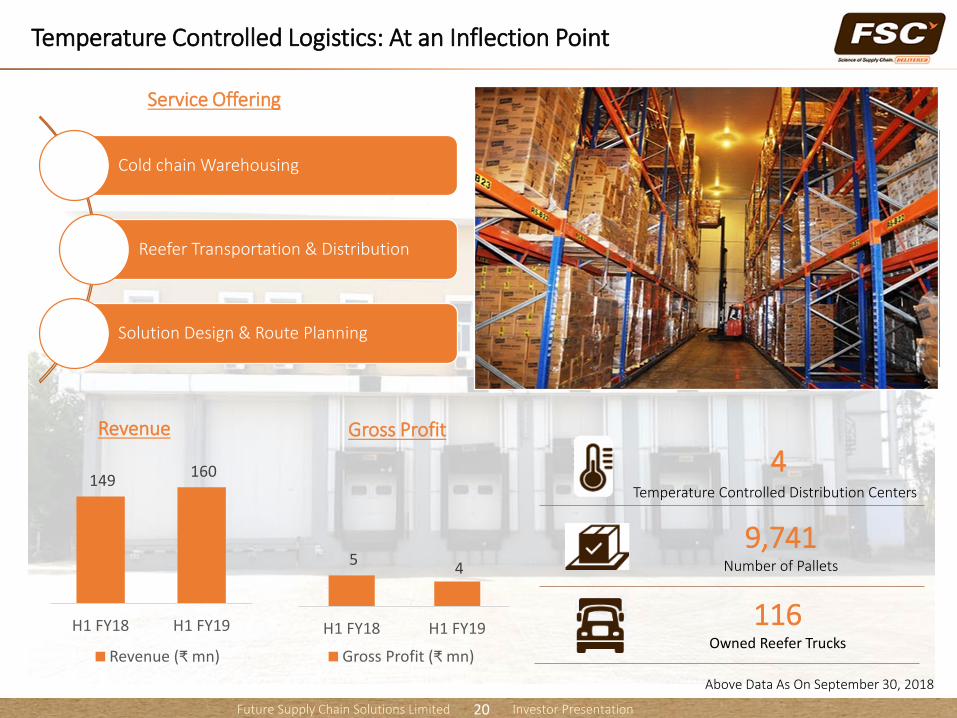
5 4
H1 FY18 H1 FY19
Gross Profit (₹ mn)
149 160
H1 FY18 H1 FY19
Revenue (₹ mn)
20
Temperature Controlled Logistics: At an Inflection Point
Cold chain Warehousing
Reefer Transportation & Distribution
Solution Design & Route Planning
Service Offering
Revenue Gross Profit
116Owned Reefer Trucks
9,741Number of Pallets
4Temperature Controlled Distribution Centers
Above Data As On September 30, 2018
Future Supply Chain Solutions Limited Investor Presentation
Gross Profit in H1 FY19
21
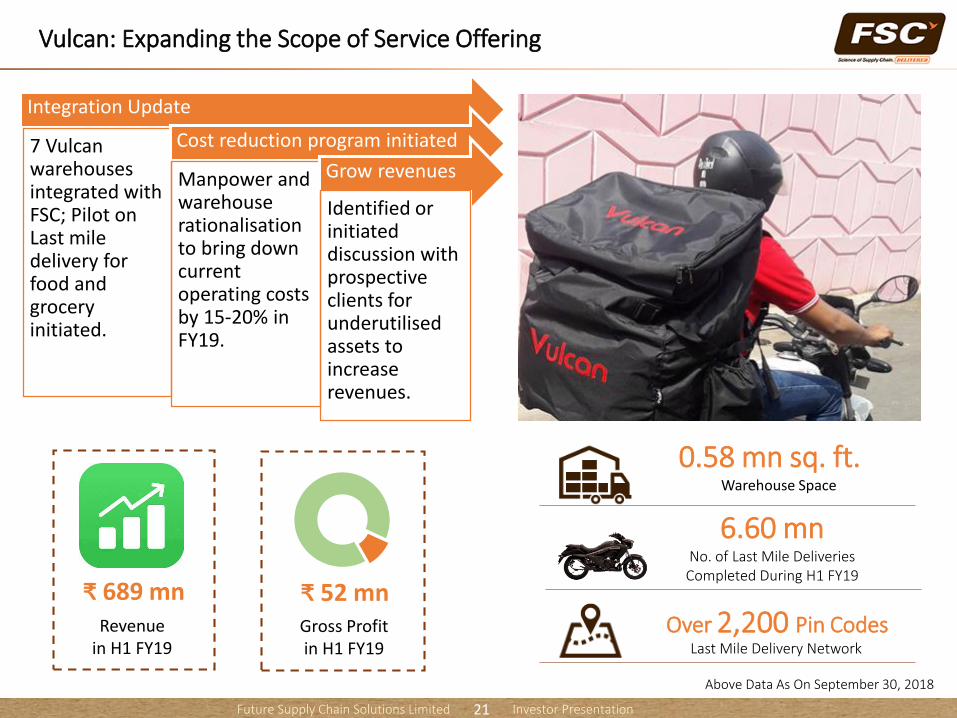
Vulcan: Expanding the Scope of Service Offering
Last Mile Delivery Network
Over 2,200 Pin Codes
0.58 mn sq. ft.Warehouse Space
6.60 mnNo. of Last Mile Deliveries Completed During H1 FY19
Integration Update
7 Vulcan warehouses integrated with FSC; Pilot on Last mile delivery for food and grocery initiated.
Cost reduction program initiated
Manpower and warehouse rationalisation to bring down current operating costs by 15-20% in FY19.
Grow revenues
Identified or initiated discussion with prospective clients for underutilised assets to increase revenues.
Revenue in H1 FY19
₹ 52 mn₹ 689 mn
Above Data As On September 30, 2018
Future Supply Chain Solutions Limited Investor Presentation
Financial Update: Standalone
Future Supply Chain Solutions Limited Investor Presentation
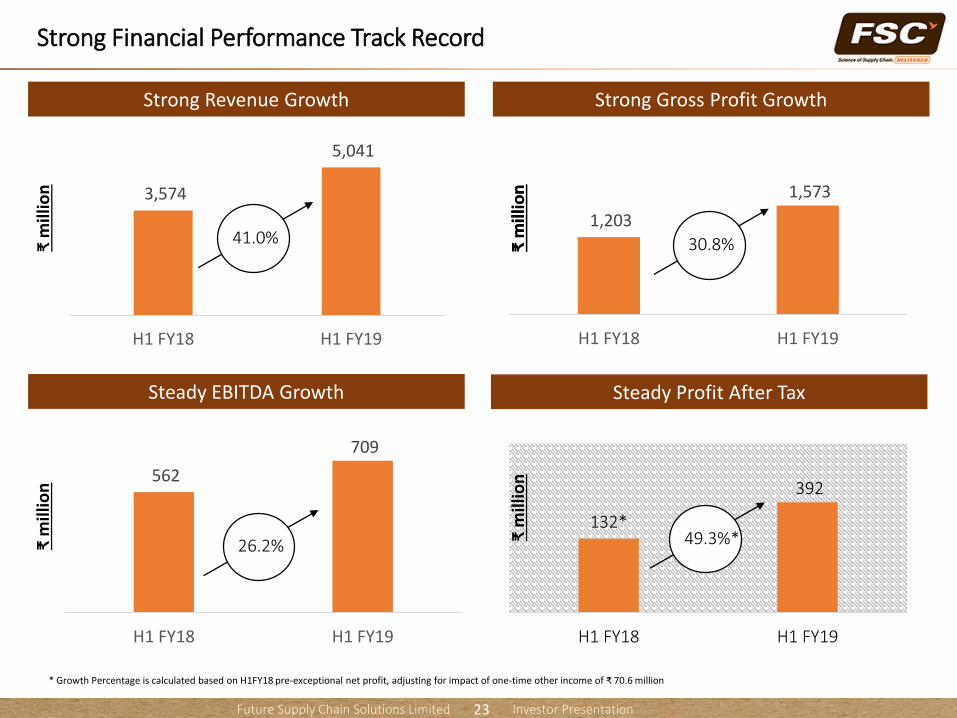
3,574
5,041
H1 FY18 H1 FY19
Strong Financial Performance Track Record
23
132*
392
H1 FY18 H1 FY19
Strong Gross Profit GrowthStrong Revenue Growth
Steady Profit After TaxSteady EBITDA Growth
₹ m
illio
n
1,203
1,573
H1 FY18 H1 FY19
₹ m
illio
n₹
mill
ion
41.0%
49.3%*
30.8%₹ m
illio
n
562
709
H1 FY18 H1 FY19
₹ m
illio
n
26.2%
* Growth Percentage is calculated based on H1FY18 pre-exceptional net profit, adjusting for impact of one-time other income of ₹ 70.6 million
Future Supply Chain Solutions Limited Investor Presentation24
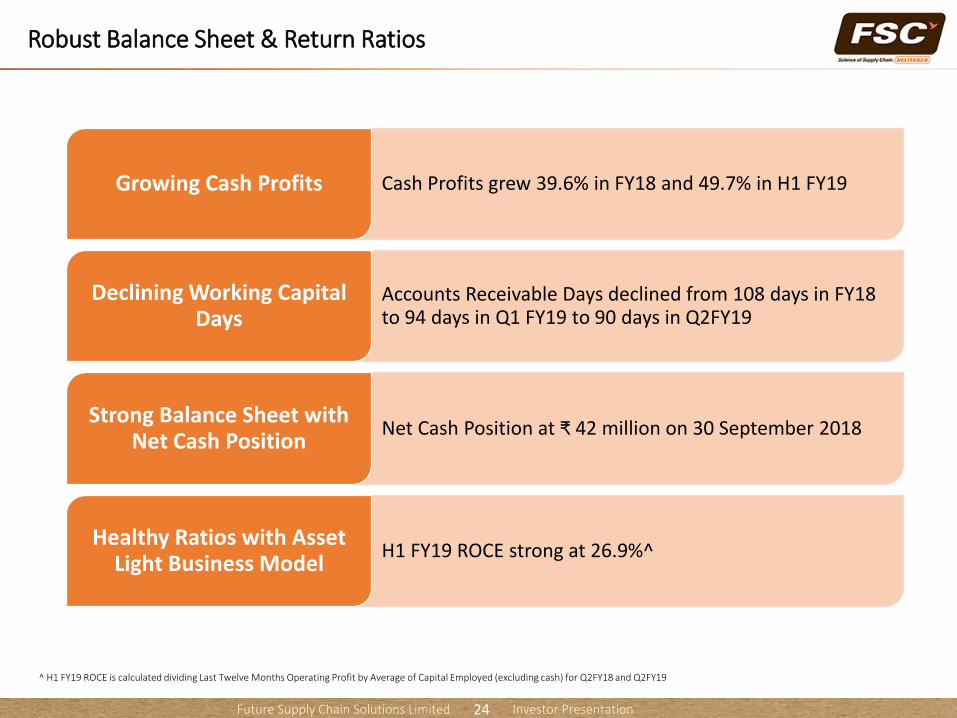
• Cash Profits grew 39.6% in FY18 and 49.7% in H1 FY19Growing Cash Profits
• Accounts Receivable Days declined from 108 days in FY18 to 94 days in Q1 FY19 to 90 days in Q2FY19
Declining Working Capital Days
• Net Cash Position at ₹ 42 million on 30 September 2018Strong Balance Sheet with
Net Cash Position
• H1 FY19 ROCE strong at 26.9%^ Healthy Ratios with Asset
Light Business Model
Robust Balance Sheet & Return Ratios
^ H1 FY19 ROCE is calculated dividing Last Twelve Months Operating Profit by Average of Capital Employed (excluding cash) for Q2FY18 and Q2FY19
Future Supply Chain Solutions Limited Investor Presentation
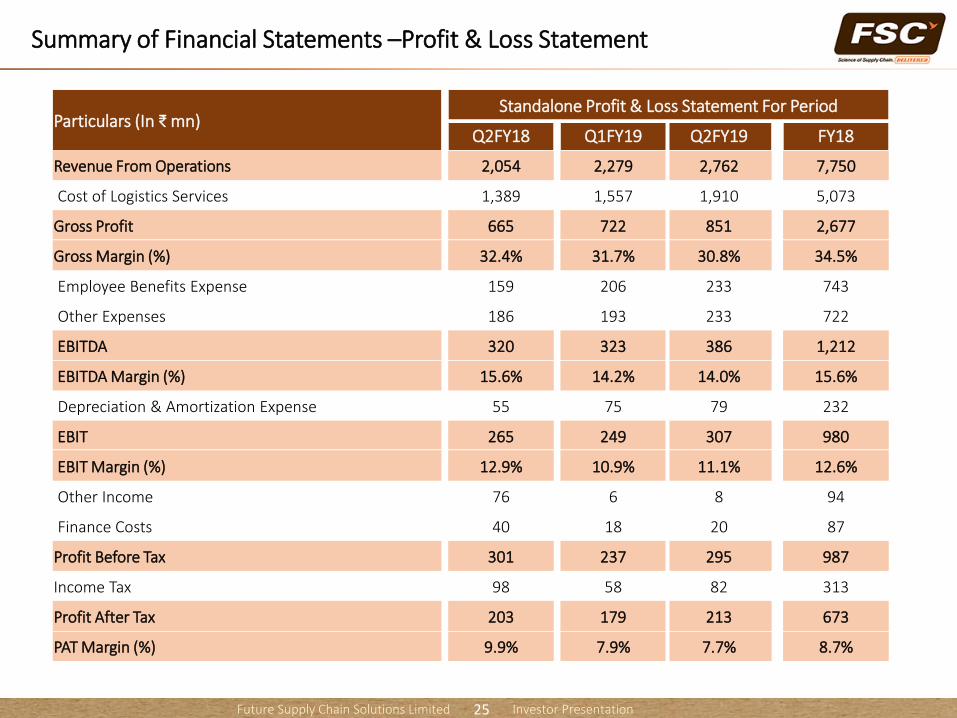
Summary of Financial Statements –Profit & Loss Statement
25
Particulars (In ₹ mn)Standalone Profit & Loss Statement For Period
Q2FY18 Q1FY19 Q2FY19 FY18
Revenue From Operations 2,054 2,279 2,762 7,750
Cost of Logistics Services 1,389 1,557 1,910 5,073
Gross Profit 665 722 851 2,677
Gross Margin (%) 32.4% 31.7% 30.8% 34.5%
Employee Benefits Expense 159 206 233 743
Other Expenses 186 193 233 722
EBITDA 320 323 386 1,212
EBITDA Margin (%) 15.6% 14.2% 14.0% 15.6%
Depreciation & Amortization Expense 55 75 79 232
EBIT 265 249 307 980
EBIT Margin (%) 12.9% 10.9% 11.1% 12.6%
Other Income 76 6 8 94
Finance Costs 40 18 20 87
Profit Before Tax 301 237 295 987
Income Tax 98 58 82 313
Profit After Tax 203 179 213 673
PAT Margin (%) 9.9% 7.9% 7.7% 8.7%

Future Supply Chain Solutions Limited Investor Presentation
Summary of Financial Statements – Balance Sheet
26
Particulars (In ₹ mn)Standalone
31-Mar-18 30-Sep-18
Equity 4,170 4,535
Gross Debt 330 2,259
Cash & Bank Balance 757 2,302
Net Debt (427) (42)
Capital Employed 3,743 4,492
Fixed Assets 2,646 2,998
Investments 631 909
Other Non Current Assets (Net) 115 193
Current Assets - A
Trade Receivables 2,289 2,693
Other Current Assets 156 273
Total Current Assets 2,445 2,966
Less: Current Liabilities - B
Trade Payables 1,384 1,810
Other Current Liabilities and Provisions 711 763
Total Current Liabilities 2,095 2,573
Net Current Asset (A-B) 351 392
Total Net Assets 3,743 4,492

Future Supply Chain Solutions Limited Investor Presentation
Governance
Future Supply Chain Solutions Limited Investor Presentation28
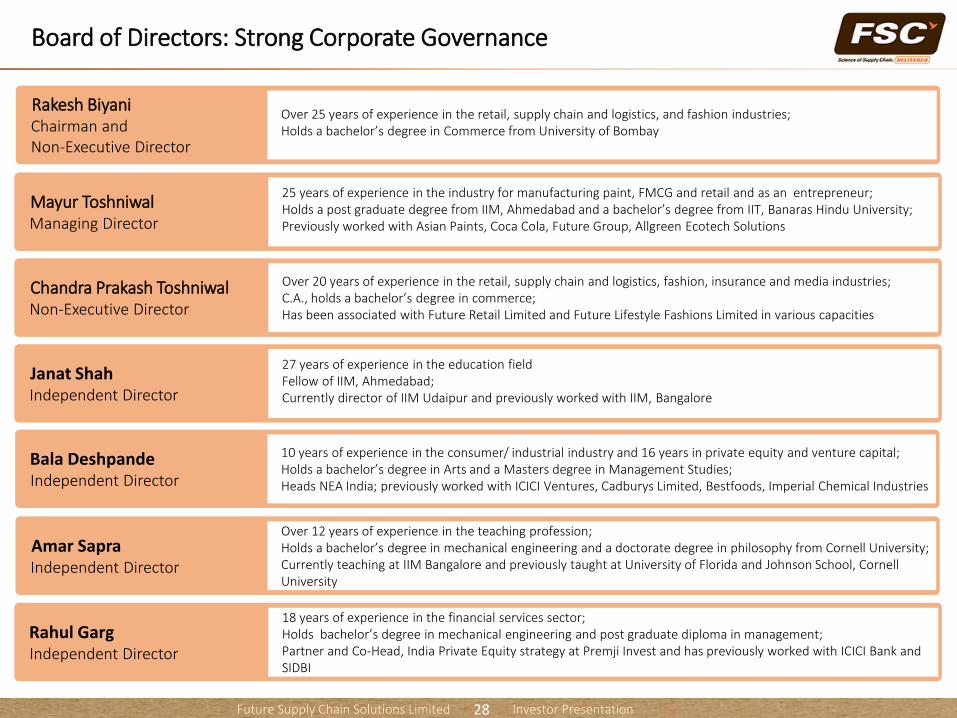
Rakesh BiyaniChairman and Non-Executive Director
Over 25 years of experience in the retail, supply chain and logistics, and fashion industries;Holds a bachelor’s degree in Commerce from University of Bombay
Mayur ToshniwalManaging Director
25 years of experience in the industry for manufacturing paint, FMCG and retail and as an entrepreneur;Holds a post graduate degree from IIM, Ahmedabad and a bachelor’s degree from IIT, Banaras Hindu University;Previously worked with Asian Paints, Coca Cola, Future Group, Allgreen Ecotech Solutions
Chandra Prakash ToshniwalNon-Executive Director
Over 20 years of experience in the retail, supply chain and logistics, fashion, insurance and media industries;C.A., holds a bachelor’s degree in commerce;Has been associated with Future Retail Limited and Future Lifestyle Fashions Limited in various capacities
Janat ShahIndependent Director
27 years of experience in the education fieldFellow of IIM, Ahmedabad;Currently director of IIM Udaipur and previously worked with IIM, Bangalore
Rahul GargIndependent Director
18 years of experience in the financial services sector;Holds bachelor’s degree in mechanical engineering and post graduate diploma in management;Partner and Co-Head, India Private Equity strategy at Premji Invest and has previously worked with ICICI Bank and SIDBI
Amar SapraIndependent Director
Over 12 years of experience in the teaching profession;Holds a bachelor’s degree in mechanical engineering and a doctorate degree in philosophy from Cornell University; Currently teaching at IIM Bangalore and previously taught at University of Florida and Johnson School, Cornell University
Bala DeshpandeIndependent Director
10 years of experience in the consumer/ industrial industry and 16 years in private equity and venture capital;Holds a bachelor’s degree in Arts and a Masters degree in Management Studies;Heads NEA India; previously worked with ICICI Ventures, Cadburys Limited, Bestfoods, Imperial Chemical Industries
Board of Directors: Strong Corporate Governance

Future Supply Chain Solutions Limited Investor Presentation
Experienced Management
29
Mayur Toshniwal, Managing Director• 25 years of experience in the industry for manufacturing paint, FMCG and retail and also as an
entrepreneur; • Holds a post graduate degree from IIM, Ahmedabad and a bachelor’s degree from IIT, Banaras Hindu
University; • Previously worked with Asian Paints, Coca Cola, Future Group and Allgreen Ecotech Solutions
P V Sheshadri, Chief Executive Officer• 26 years of extensive experience in the Supply Chain function in fields of warehousing,
transportation, project procurement and vendor development / management;• Holds a bachelor’s degree in Science from Bangalore University• Previously worked with Lloyds Steel, Grasim Industries, Bombay Dyeing, Pantaloon Retail and
Welspun Retail
Samir Kedia, Chief Financial Officer• Over 16 years of experience primarily in commercial, financial, accounting affairs besides hands on
corporate secretarial and compliance function;
• A qualified Chartered Accountant;
• Has been part of Future Group for more than 12 years, most recently associated with Future Consumer Limited as Financial Controller; Previously worked with H&R Johnson (India) Limited
• Received CFO of the Year Awards 2018 – an initiative of Financial Express