Functional Genomic Study of Exogenous n-Butanol Stress in Escherichia coli
11
APPLIED AND ENVIRONMENTAL MICROBIOLOGY, Mar. 2010, p. 1935–1945 Vol. 76, No. 6 0099-2240/10/$12.00 doi:10.1128/AEM.02323-09 Copyright © 2010, American Society for Microbiology. All Rights Reserved. Functional Genomic Study of Exogenous n-Butanol Stress in Escherichia coli †‡ Becky J. Rutherford, 1,2 Robert H. Dahl, 1,2 Richard E. Price, 4 Heather L. Szmidt, 2,5 Peter I. Benke, 2,5 Aindrila Mukhopadhyay, 2,5 * and Jay D. Keasling 1,2,3,5 Department of Chemical Engineering, University of California, Berkeley, California 94720 1 ; Joint BioEnergy Institute, Emeryville, California 94608 2 ; Department of Bioengineering, University of California, Berkeley, California 94720 3 ; Department of Molecular and Cellular Biology, University of California, Berkeley, California 94720 4 ; and Physical Biosciences Division, Lawrence Berkeley National Laboratory, Berkeley, California 94720 5 Received 25 September 2009/Accepted 16 January 2010 n-Butanol has been proposed as an alternative biofuel to ethanol, and several industrially used microbes, including Escherichia coli, have been engineered to produce it. Unfortunately, n-butanol is more toxic than ethanol to these organisms. To understand the basis for its toxicity, cell-wide studies were conducted at the transcript, protein, and metabolite levels to obtain a global view of the n-butanol stress response. Analysis of the data indicates that n-butanol stress has components common to other stress responses, including pertur- bation of respiratory functions (nuo and cyo operons), oxidative stress (sodA, sodC, and yqhD), heat shock and cell envelope stress (rpoE, clpB, htpG, cpxR, and cpxP), and metabolite transport and biosynthesis (malE and opp operon). Assays using fluorescent dyes indicated a large increase in reactive oxygen species during n-butanol stress, confirming observations from the microarray and proteomics measurements. Mutant strains with mutations in several genes whose products changed most dramatically during n-butanol stress were examined for increased sensitivity to n-butanol. Results from these analyses allowed identification of key genes that were recruited to alleviate oxidative stress, protein misfolding, and other causes of growth defects. Cellular engineering based on these cues may assist in developing a high-titer, n-butanol-producing host. Short-chain alcohols such as propanol, butanol, and penta- nol have recently been highlighted as potential transportation fuels with many advantages over ethanol, and several new studies have focused on the microbial production of these alcohols (24). Among these, n-butanol has gained popularity as an alternative fuel since it can be blended with gasoline, is compatible with existing supply infrastructure, and has higher energy content than ethanol (14). However, n-butanol accu- mulation is also known to be highly toxic to native producers (e.g., Clostridium) and engineered hosts (e.g., Escherichia coli) (6, 27). As such, it is difficult to produce n-butanol at the titers needed for economic efficiency. Understanding the stress response of potential n-butanol- producing microorganisms could facilitate engineering them for improved tolerance. In the absence of a high-titer, n-buta- nol-producing host, n-butanol can be added exogenously to cultures in order to elucidate the stress response. In this study, we used functional genomics (microarrays, proteomics, and targeted metabolite analysis) to characterize the physiological response to n-butanol exposure in E. coli with the idea that the results would be useful for improving the tolerance of n-buta- nol producers. Cell-wide studies of microbial production hosts have been used in the past to optimize synthesis of a variety of products, ranging from primary metabolites to pharmaceutical compounds, and this is a well-reviewed topic (28, 31). Solvent stress from aliphatic alcohols and alkanes has been studied in a variety of bacteria. While the trend is an increase in toxicity with an increase in solvent hydrophobicity, the mechanism of toxicity varies with the length of the carbon backbone (2). In general, the toxicity of the alcohol correlates well with the octanol-water partition coefficient, P ow (2); at saturating concentrations, solvents with a log P ow greater than 3.8 are not toxic to E. coli. The degree of toxicity of an alcohol also varies across bacteria, with some bacteria being more affected by the length of the alkyl chain while others are more affected by saturation (fewer double bonds) (22). Most toxicity studies have proposed the cell membrane as the most affected target of organic solvents and a significant factor in adapting to the stress. Both long- and short-chain alcohols are known to cause stress by either desiccation (short) or by intercalating in the hydrophobic cell wall fatty acids (long) (19, 20, 22) and may be critical factors in the robustness of a host microbe during fuel production. n-Butanol stress has been studied in solven- togenic Clostridia, where toxicity was primarily ascribed to the chaotropic effects of the solvent (5), and it was hypothesized that expression of chaperones would alleviate stress caused by solvent exposure. In Clostridium acetobutylicum, transcript analysis after exposure to 0.75% n-butanol indicated that the primary response was accumulation of transcripts encoding chaperones, proteases, and other heat shock-related proteins (45), and overexpression of the GroELS chaperones produced strains with greater n-butanol tolerance (46). In E. coli, stress from ethanol exposure is the most widely studied alcohol stress * Corresponding author. Mailing address: Physical Biosciences Di- vision, Lawrence Berkeley National Laboratory, 1 Cyclotron Rd., MS 978-4121, Berkeley, CA 94720. Phone: (510) 495-2628. Fax: (510) 486-4252. E-mail: [email protected]. † Supplemental material for this article may be found at http://aem .asm.org/. Published ahead of print on 29 January 2010. ‡ The authors have paid a fee to allow immediate free access to this article. 1935
-
Upload
independent -
Category
Documents
-
view
0 -
download
0
Transcript of Functional Genomic Study of Exogenous n-Butanol Stress in Escherichia coli

APPLIED AND ENVIRONMENTAL MICROBIOLOGY, Mar. 2010, p. 1935–1945 Vol. 76, No. 60099-2240/10/$12.00 doi:10.1128/AEM.02323-09Copyright © 2010, American Society for Microbiology. All Rights Reserved.
Functional Genomic Study of Exogenous n-ButanolStress in Escherichia coli�†‡
Becky J. Rutherford,1,2 Robert H. Dahl,1,2 Richard E. Price,4 Heather L. Szmidt,2,5 Peter I. Benke,2,5
Aindrila Mukhopadhyay,2,5* and Jay D. Keasling1,2,3,5
Department of Chemical Engineering, University of California, Berkeley, California 947201; Joint BioEnergy Institute, Emeryville,California 946082; Department of Bioengineering, University of California, Berkeley, California 947203; Department of
Molecular and Cellular Biology, University of California, Berkeley, California 947204; and Physical Biosciences Division,Lawrence Berkeley National Laboratory, Berkeley, California 947205
Received 25 September 2009/Accepted 16 January 2010
n-Butanol has been proposed as an alternative biofuel to ethanol, and several industrially used microbes,including Escherichia coli, have been engineered to produce it. Unfortunately, n-butanol is more toxic thanethanol to these organisms. To understand the basis for its toxicity, cell-wide studies were conducted at thetranscript, protein, and metabolite levels to obtain a global view of the n-butanol stress response. Analysis ofthe data indicates that n-butanol stress has components common to other stress responses, including pertur-bation of respiratory functions (nuo and cyo operons), oxidative stress (sodA, sodC, and yqhD), heat shock andcell envelope stress (rpoE, clpB, htpG, cpxR, and cpxP), and metabolite transport and biosynthesis (malE andopp operon). Assays using fluorescent dyes indicated a large increase in reactive oxygen species duringn-butanol stress, confirming observations from the microarray and proteomics measurements. Mutant strainswith mutations in several genes whose products changed most dramatically during n-butanol stress wereexamined for increased sensitivity to n-butanol. Results from these analyses allowed identification of key genesthat were recruited to alleviate oxidative stress, protein misfolding, and other causes of growth defects. Cellularengineering based on these cues may assist in developing a high-titer, n-butanol-producing host.
Short-chain alcohols such as propanol, butanol, and penta-nol have recently been highlighted as potential transportationfuels with many advantages over ethanol, and several newstudies have focused on the microbial production of thesealcohols (24). Among these, n-butanol has gained popularity asan alternative fuel since it can be blended with gasoline, iscompatible with existing supply infrastructure, and has higherenergy content than ethanol (14). However, n-butanol accu-mulation is also known to be highly toxic to native producers(e.g., Clostridium) and engineered hosts (e.g., Escherichia coli)(6, 27). As such, it is difficult to produce n-butanol at the titersneeded for economic efficiency.
Understanding the stress response of potential n-butanol-producing microorganisms could facilitate engineering themfor improved tolerance. In the absence of a high-titer, n-buta-nol-producing host, n-butanol can be added exogenously tocultures in order to elucidate the stress response. In this study,we used functional genomics (microarrays, proteomics, andtargeted metabolite analysis) to characterize the physiologicalresponse to n-butanol exposure in E. coli with the idea that theresults would be useful for improving the tolerance of n-buta-nol producers. Cell-wide studies of microbial production hosts
have been used in the past to optimize synthesis of a variety ofproducts, ranging from primary metabolites to pharmaceuticalcompounds, and this is a well-reviewed topic (28, 31).
Solvent stress from aliphatic alcohols and alkanes has beenstudied in a variety of bacteria. While the trend is an increasein toxicity with an increase in solvent hydrophobicity, themechanism of toxicity varies with the length of the carbonbackbone (2). In general, the toxicity of the alcohol correlateswell with the octanol-water partition coefficient, Pow (2); atsaturating concentrations, solvents with a log Pow greater than3.8 are not toxic to E. coli. The degree of toxicity of an alcoholalso varies across bacteria, with some bacteria being moreaffected by the length of the alkyl chain while others are moreaffected by saturation (fewer double bonds) (22). Most toxicitystudies have proposed the cell membrane as the most affectedtarget of organic solvents and a significant factor in adapting tothe stress. Both long- and short-chain alcohols are known tocause stress by either desiccation (short) or by intercalating inthe hydrophobic cell wall fatty acids (long) (19, 20, 22) and maybe critical factors in the robustness of a host microbe duringfuel production. n-Butanol stress has been studied in solven-togenic Clostridia, where toxicity was primarily ascribed to thechaotropic effects of the solvent (5), and it was hypothesizedthat expression of chaperones would alleviate stress caused bysolvent exposure. In Clostridium acetobutylicum, transcriptanalysis after exposure to 0.75% n-butanol indicated that theprimary response was accumulation of transcripts encodingchaperones, proteases, and other heat shock-related proteins(45), and overexpression of the GroELS chaperones producedstrains with greater n-butanol tolerance (46). In E. coli, stressfrom ethanol exposure is the most widely studied alcohol stress
* Corresponding author. Mailing address: Physical Biosciences Di-vision, Lawrence Berkeley National Laboratory, 1 Cyclotron Rd., MS978-4121, Berkeley, CA 94720. Phone: (510) 495-2628. Fax: (510)486-4252. E-mail: [email protected].
† Supplemental material for this article may be found at http://aem.asm.org/.
� Published ahead of print on 29 January 2010.‡ The authors have paid a fee to allow immediate free access to
this article.
1935

(18), and knowledge from cell-wide stress response studies hasbeen applied to create better ethanologenic hosts (3). Recentstudies have examined the effect of isobutanol in E. coli, wheretranscript analysis revealed several key mechanisms includingthe disruption of quinone function and the involvement ofglobal regulators such as ArcA (7).
In this study, we characterized the response of E. coli toexogenous n-butanol stress using transcript and protein anal-yses. Several important candidates were further examined us-ing the corresponding Keio collection mutants (4) to examinetheir involvement in n-butanol tolerance. Additional experi-ments such as quantitative PCR measurements and metaboliteand reactive oxygen species (ROS) assays were used to fol-low-up on key results. Results from these experiments providethe criteria to select mechanisms that are the ideal targets forhost engineering efforts.
MATERIALS AND METHODS
Culture conditions. For toxicity assays, Escherichia coli DH1 (ATCC 33849)was grown from freezer stocks in LB or M9 minimal medium with additionaltrace elements (32). To determine the effect of n-butanol on E. coli DH1 growth,a wide range of concentrations were tested first (data not shown) and thennarrowed to a range that caused stress but not significant cell death. Growthassays to test the effect of different concentrations of n-butanol on E. coli DH1were performed in 250-ml baffled shake flasks with 30 ml of M9 medium and a2% inoculation from an overnight culture shaken at 200 rpm at 37°C. Unlessnoted otherwise, all subsequent n-butanol stress assays were conducted at 0.8%(vol/vol) n-butanol. pH was also measured for 0.8% n-butanol-exposed andcontrol cultures.
For microarrays and proteomics experiments, cultures were grown in 1-litershake flasks containing 300 ml of M9 medium shaking at 200 rpm. n-Butanol wasadded to a final concentration of 0.8% at mid-log phase (optical density at 600nm [OD600], 0.35 to 0.4/ml), and biomass was collected at the time pointsindicated in Tables 1 and 2. The cultures were centrifuged (10,000 � g, 4°C, 5min), and cell pellets were immediately frozen in liquid nitrogen and stored at�80°C.
Gene deletion mutants were obtained from the Keio collection (4). The wild-type strain for the Keio deletion strains, BW2550, was obtained from the CGSCcollection (http://cgsc.biology.yale.edu). Strains were adapted and tested in M9medium using 24-well microtiter plates at 37°C using a plate reader (Safire;Tecan). Gas-permeable plate covers (PlateMax Ultraclear sealing film; AxygenScientific, CA) were applied after addition of n-butanol.
Microarray sample preparation. For microarray samples, total RNA wasisolated using the RNeasy Midi kit (Qiagen). RNA quality and quantity weremeasured with a Bioanalyzer (Agilent Technologies, Santa Clara, CA) andNanoDrop ND-1000 spectrophotometer (NanoDrop Technologies, Wilmington,DE), respectively. Reverse transcription reactions were performed as describedpreviously (25). RNA in the reactions was hydrolyzed with 100 mM NaOH–10mM EDTA at 65°C for 10 min and neutralized in 500 mM HEPES, pH 7.0. Theremaining Tris in the cDNA suspension was removed by washing with waterthree times in a Microcon-YM30 (Millipore, Billerica, MA). The solutions wereconcentrated with a SPD2010 SpeedVac system (Thermo Scientific, Waltham,MA) prior to labeling with Alexa fluorophores (555 and 647) (Invitrogen, Co.,Carlsbad, CA). Labeled cDNA was purified using Qiaquick PCR columns (Qia-gen, Germantown, MD) and dried again in a SPD2010 SpeedVac system. Thesamples were rehydrated in Slide Hyb 3 (Invitrogen Co., Carlsbad, CA), andsamples from each time point (stressed and control) were pooled together priorto hybridization.
E. coli microarrays were prepared by spotting 70-mer oligonucleotides (Euro-fins MWG Operon, Huntsville, AL) onto Superamine 2 substrates (Arrayit Co.,Sunnyvale, CA) using a robotic spotter (Digilab, Inc., Holliston, MA) (38). Oneoligomer representing each open reading frame (ORF) was spotted in triplicateon the slide. A prehybridization was performed with 5� saline-sodium citrate(SSC)–0.2% sodium dodecyl sulfate (SDS)–1% bovine serum albumin (BSA) for60 min at 42°C. Hybridization was carried out at 42°C for 17 h, and the hybridswere washed subsequently with 1� SSC–0.2% SDS at 42°C, 0.1� SSC–0.2% SDSat 25°C, and 0.1� SSC at 25°C, all for 2 min at medium agitation in a hybrid-
ization station (Tecan). Three replicate hybridizations were performed for eachtime point from the three biological replicate pools of RNA.
Microarray data analysis. Hybridized slides were scanned at a 10-�m resolu-tion with a GenePix 4200A microarray scanner (MDS Analytical Technologies,Sunnyvale, CA) at 70% laser power. Images were analyzed using GenePix Pro(MDS Analytical Technologies, Sunnyvale, CA) to globally normalize fluores-cence intensity for each spot in both channels. Relative expression levels for eachspot were calculated by dividing the intensity of the stressed sample by theintensity of the control sample. Local hybridization and intensity-dependentartifacts across the arrays were removed by Loess normalization using the Stan-dardization and Normalization of Microarray Data (SNOMAD) program (8).The final log ratio for each gene was calculated by averaging the three replicatespots on each slide and the average ratio from the three biological replicateslides. z-scores for each gene were calculated using the formula
z �log2 �stress/control�
�0.25 � � variance
where 0.25 is a pseudovariance (30). Ratios with log2 � �2� and z-score � �1.96�were considered significant. Complete data are available at http://www.microbesonline.org/cgi-bin/microarray/viewExp.cgi?expId1319 (1) and via theNCBI’s Gene Expression Omnibus (11) (GEO series accession no. GSE16973).MicrobesOnline was also used to examine the raw data in terms of genes withsimilar functions and metabolic pathways.
Proteomics sample preparation. The volume of cells collected was based onthe in-solution digestion protocol described previously to ensure isolation ofapproximately 1 mg of total protein for analysis (37). Cell pellets were washed in1 M phosphate-buffered saline (pH 7) and flash frozen in liquid nitrogen. Thecells were then lysed in a buffer containing 6 M urea and 500 mM triethyl-ammonium bicarbonate, which provides denaturing conditions and is compatiblewith iTRAQ tag labeling. Protein concentration was determined using the Bio-Rad protein assay kit (Bio-Rad, Hercules, CA), and samples were prepared foriTRAQ labeling as described previously (37). Briefly, protein samples werereduced using Tris-2-carboxyethylphosphine, blocked using iodoacetic acid, andproteolysed using trypsin. Samples were then labeled with isobaric iTRAQ tagsas per the manufacturer’s protocol (Applied Biosystems, Foster City, CA).iTRAQ tags were used as follows: 114:T1, stress; 115:T2, control; 116:T1, con-trol; and 117:T2, stress.
Two-dimensional liquid chromatography-tandem mass spectrometry. Strongcation exchange fractionation was completed using high-performance liquidchromatography as described previously (37). Electrospray ionization quadru-pole time-of-flight mass analyzers (QSTAR Hybrid Quadrupole TOF andQSTAR Elite; Applied Biosystems, Foster City, CA) were used for sampleanalysis. Generally, 40 �l of each sample was injected using an Ultimate high-performance liquid chromatograph with Famos autosampler and Switchos microcolumn switching module onto a PepMap100 trapping column (0.3 by 5 mm)(Dionex, Inc., Sunnyvale, CA). Reverse-phase separation was completed on aC18 column (75-�m inside diameter) at a flow rate of 200 nl/min using anacetonitrile (ACN)-formic acid (FA) gradient buffer system: A, 2% ACN–0.1%FA; and B, 98% ACN–0.1% FA. Ions in the range of 350 to 1,600 m/z with acharge state of 2 to 4 were scanned for and selected. Ions were required toexceed a threshold of 50 counts to be selected as parent ions for fragmentation.Parent ions and their isotopes were excluded from further selection for 60 s. Theinstrument was manually calibrated and tuned following each batch of 2 to 4samples. A digest of BSA was used as a standard to evaluate system performance.
Proteomics data analysis. Collected mass spectra were analyzed using Pro-teinPilot (Applied Biosystems, Foster City, CA). A FASTA file containing all theopen reading frame (ORF) protein sequences of E. coli, obtained from NCBI,was used to generate the theoretical search database. Data analysis was con-ducted as described previously (37). Only proteins identified by at least twounique peptides at greater than 95% confidence were considered confidentlyidentified and used for further analysis. To determine if a ratio was statisticallysignificant, a standard score (z) was used, z (x � �)/�, where x is the value ofthe individual protein ratio, � is the population mean, and � is the populationstandard deviation. For protein ratios exposed to 1 h of n-butanol stress, � was�0.037 and � was 0.65. For protein ratios exposed to 2 h of n-butanol stress, �was �0.0042 and � was 0.34. In general, ratios with z-scores � �1.5� wereconsidered as significantly changed. Complete proteomics data are provided inTable S1 in the supplemental material.
qPCR. Total RNA for quantitative reverse transcriptase PCR (qPCR) wasextracted as described for microarray analysis. An additional DNase treatmentwas performed on 10 �g of total RNA with Turbo DNase (Ambion). A total of3.2 �g treated total RNA was reverse transcribed with 2 �g random hexamers
1936 RUTHERFORD ET AL. APPL. ENVIRON. MICROBIOL.

and SuperScript III (Invitrogen) for 3 h at 50°C. The cDNA product was treatedwith RNase H (Invitrogen) and diluted 25-fold for quantitative PCR. The prim-ers used for qPCR are listed in the supplemental material (see Table S1). qPCRwas performed on the StepOnePlus instrument (Applied Biosystems) using 1 �lof diluted cDNA as template in 25-�l reactions with the DyNamo HS SYBRgreen Supermix (Finnzymes) and 0.2 �M each of the primers. Fold change inexpression of target genes was calculated relative to the control samples. Theprimers used are provided in Table S2 in the supplemental material.
Reactive oxygen species assay. Control and n-butanol-stressed E. coli cultureswere grown in M9 medium as described with various concentrations of n-butanol.To 5 ml of fresh M9 medium, 100 �l of each overnight culture was added, andthen 140 �l of this diluted culture was transferred into a 96-well plate andincubated at 37°C for 45 min. As per the manufacturer’s instruction, positivecontrols for oxidative stressed cells were prepared by adding 10 �l of 7.78 Mtert-butyl hydroperoxide (TBHP) (Invitrogen, Co., Carlsbad, CA) to one set ofcontrol cells before incubation. Ten microliters of 25 mM 5 (and 6-)-carboxy-
TABLE 2. qPCR stress/control ratios for selected genes
GeneLog2 stress/control ratio for gene ata:
0 min 5 min 30 min 80 min 185 min 260 min
cyoA �0.33 �5.25 �1.41 �0.83 2.60 3.82cpxP �0.82 5.04 3.44 3.29 3.08 2.49rpoH �0.24 1.02 1.03 0.65 �2.63 �1.50ompF �0.15 �4.71 �6.29 �6.69 �1.99 �1.98evgS �0.66 0.31 0.17 1.53 3.86 1.55marA �0.05 2.76 2.75 1.90 1.15 1.80arcA �0.16 �1.86 �0.27 �0.94 �1.82 �1.12
a Genes with a log2 stress/control ratio of �2 are in bold.
TABLE 1. Selected microarray data
COG category andgene namea
Log2 stress/control ratio at: AdditionalCOG
category
COG category andgene namea
Log2 stress/control ratio at: AdditionalCOG
categoryPrestress 30 min 80 min 195 min Prestress 30 min 80 min 195 min
COG C COG JcyoA 0.76 �0.24 2.66 2.14 C raiA 1.06 2.05 �0.62 2.57 JcyoB 1.10 �0.92 2.69 1.44 C rmf �1.19 3.22 2.84 1.96 JcyoC 0.51 �0.53 2.26 1.70 C rplB 1.00 �2.07 �1.11 �0.94 JcyoD 0.93 �0.31 1.94 1.13 C rplD 1.19 �2.19 �0.89 �0.64 JcyoE 0.56 �0.49 1.47 0.65 O rplS 0.50 �1.88 �2.02 �1.94 JnfsA 0.33 2.10 1.17 1.21 C rplW 1.03 �2.11 �0.90 �0.73 JnuoA 0.61 1.29 0.57 1.82 C yhbH �0.12 0.97 0.05 �0.17 JnuoB 0.68 1.29 0.98 1.61 CnuoC 0.37 0.59 1.79 1.63 C COG MnuoE 0.53 0.67 1.29 1.40 C acrA 0.05 1.23 1.41 0.11 MnuoF 0.77 0.47 1.59 1.98 C acrB 0.37 1.73 2.33 0.75 VnuoG 0.82 0.65 1.87 2.23 C ompF 1.76 �5.18 �4.07 �1.95 MnuoH 0.14 0.56 1.80 1.86 C tolC 0.13 0.04 �0.15 0.31 MUnuoI 0.34 0.49 2.02 2.02 CnuoJ 0.07 0.42 1.65 1.35 C COGs O and PnuoK 0.13 0.47 1.75 1.89 C clpB �1.05 1.04 0.40 0.82 OnuoL 0.06 0.20 0.97 1.04 CP cpxP 0.33 2.70 4.47 2.76 UNTPnuoM 0.10 0.25 1.59 1.03 C cyoE 0.56 �0.49 1.47 0.65 OnuoN 0.10 0.38 1.83 0.79 C dnaJ �0.32 0.71 0.16 �0.23 OsdhC 0.45 �0.63 2.04 1.90 C groELS 0.09 1.04 0.41 �0.53 OsdhD 0.19 �1.14 0.69 0.19 C groS 0.10 0.78 0.28 0.34 OsdhA 0.63 �1.76 1.35 0.84 C htpG �0.13 0.72 0.28 �0.50 OsdhB 0.92 �1.43 1.10 0.56 C htrA 0.13 1.71 1.10 0.45 OyqhD �0.29 2.63 0.99 0.65 C ibpA �0.56 0.26 �0.64 �0.04 O
ibpB �0.56 0.76 �0.52 �0.16 OCOG E katG 0.09 0.00 �0.57 �1.01 P
cysD �0.15 �2.07 �0.41 �0.32 E sodA 0.34 �0.61 1.98 0.64 Pdcp 0.21 �0.31 0.26 �0.09 E sodC �0.67 �0.08 0.46 �0.20 PgadA �1.62 �0.64 �0.11 0.30 E spy �0.28 2.63 2.67 1.84 UNTPglnH �0.20 0.17 �0.90 �1.55 ET yegD 0.75 �0.89 2.01 �1.92 OhisI �0.22 �0.08 �1.27 �1.04 EleuD 1.22 �2.35 �3.17 �0.76 E COG TmetE �0.30 �3.83 �4.16 �3.90 E arcA �0.25 �0.22 �1.14 �0.01 TKoppA 0.40 2.45 0.60 1.45 E cpxA �0.16 �0.08 �0.31 �0.86 ToppB 0.35 2.45 1.40 1.70 EP cpxR �0.17 �0.77 �0.64 �0.88 TKoppC 0.14 2.16 1.85 1.47 EP evgA 0.26 1.22 0.59 0.84 TKoppD �0.12 2.36 2.00 1.22 EP evgS 0.11 2.14 2.83 1.73 ToppF �0.05 2.32 1.78 1.16 E phoB 0.14 1.19 0.88 0.49 TKpotF �0.50 �0.62 �0.61 �0.88 E phoR �0.73 0.38 0.39 0.06 T
COG G Additional uncategorizedmalE 1.14 4.02 �1.34 �1.01 G genesmanX 0.76 2.67 0.55 2.26 G asr �1.15 5.31 3.41 2.47manY 0.66 2.72 0.63 1.76 G crl 0.24 �0.20 �0.26 0.00mgsA �0.06 0.22 �0.91 �0.53 G marA �0.13 2.92 1.14 0.43
a COG C, energy production and conversion; COG E, amino acid transport and metabolism; COG G, carbohydrate transport and metabolism; COG J, translation,ribosomal structure, and biogenesis; COG M, cell wall, membrane, and envelope biogenesis; COG O, posttranslational modification, protein turnover, and chaperones;COG P, inorganic ion transport and metabolism; COG T, signal transduction mechanisms.
VOL. 76, 2010 CANDIDATE GENES IN n-BUTANOL TOLERANCE 1937

2�,7�-dichlorodihydro-fluorescein diacetate (carboxy-H2DCFDA) was added toall cells. Florescence at 535 nm and optical density at 600 nm were measured for45 min at 5-min intervals after adding dye using a plate reader (Safire, TecanInfinite 200). Specific fluorescence is [A535/A600].
RESULTS AND DISCUSSION
Toxicity tests. The range of n-butanol concentrations foundto be inhibitory to E. coli DH1 in this study (Fig. 1) is consis-tent with trends noted in the literature for alcohol toxicity in E.coli (20). The concentration of n-butanol that caused a 50%growth decrease in M9 medium was found to be 0.8% (vol/vol)and was selected for the other growth assays and functionalgenomic analyses in this study. The pH of control culturesdecreased from 7.0 at the start of the assay to 6.1 in stationaryphase. However, in cultures exposed to 0.8% n-butanol, the pHdecreased to 5.3 in stationary phase. The significance of thispH change will be discussed later.
Functional-genomics analysis. The temporal response at thetranscript level showed 82 genes to be significantly changed at30 min, 63 genes at 80 min, and 32 genes at 195 min. To obtaina broad overview of changes, the significantly changing tran-scripts were viewed in terms of the cluster of orthologous genes(COG) to which they belong. A COG consists of individualorthologous genes or orthologous sets of paralogs. Since or-thologs often have the same function, it allows transfer offunctional information from one member to an entire COGand provides the framework for functional genome analysis(44). In E. coli, 3,862 of 4,502 genes have COG descriptions.Distributing the significantly changing transcripts into theirrespective COG categories revealed the most perturbed cate-gories to be energy production and conversion (C), amino acidtransport and metabolism (E), and signal transduction (T) (seeFig. S1 and S2 in the supplemental material).
Corresponding experiments using similar conditions wereconducted for analysis of the proteome. A total of 1,336 pro-teins were identified at a 95% confidence interval from 55,900
distinct peptides from 103,904 spectra. Of these 997 were iden-tified using 2 or more unique high-confidence peptides. TheiTRAQ ratios were generated as described in Materials andMethods (see Table S1 in the supplemental material) andcorrelated well across the two time points (see Fig. S3 in thesupplemental material). Comparison of changes at the tran-script and proteomic levels showed good agreement for mostsignificantly changing candidates (Fig. 2). To analyze the data,the identified proteins were also categorized into their respec-tive COG categories; a selected list is shown in Table 2. Thefollowing sections present and discuss the results for key stressresponse groups observed using these functional-genomicsanalyses.
Responses in energy metabolism and oxidative stress mech-anisms. Candidates categorized in COG C (energy conserva-
FIG. 1. Growth of E. coli DH1 in M9 minimal medium in the presence of various concentrations (vol/vol) of n-butanol. n-Butanol was addedin mid-log phase (OD600 of 0.35/ml, 4 h after subculture).
FIG. 2. Scatter plot of log2 ratios of transcript-level changes at 80min versus the protein level at 60 min. The sets of most up- anddownregulated candidates from both data sets are indicated.
1938 RUTHERFORD ET AL. APPL. ENVIRON. MICROBIOL.

tion and production) represented one of the main groups ofsignificantly differentially expressed genes. Among these, twomain sets of genes with changes in expression were observed:the 13-member nuo operon and the 5-member cyo operon(Table 1). The nuo operon encodes the NADH ubiquinoneoxidoreductase (complex I), a multisubunit enzyme that cou-ples electron transfer from NADH to ubiquinone with thetranslocation of protons across the cytoplasmic membraneand forms an integral part of oxidative phosphorylation (17)(Fig. 3). The concerted increase in the transcript levels of allmembers of this complex across all time points after exposureto n-butanol suggests an increased requirement for energy or adisruption in the respiratory efficiency of the organism. Thelatter has been proposed to occur in the eukaryote Saccharo-myces cerevisiae during alcohol stress due to increased mem-brane fluidity causing dissipation of H potential (41). Impactof n-butanol exposure on membrane-related function, includ-ing the inability to maintain an optimal pH gradient, has alsobeen reported in Clostridium acetobutylicum (6). Increases inthe transcripts in the cyo operon, which encodes a terminaloxidase (the cytochrome b562-o complex), and sdh genes, whichencode the succinate dehydrogenase complex, both involved inoxidative phosphorylation (17) (Table 1 and Fig. 3), also indi-cate a perturbation in respiratory balance. This cytochromecomplex is known to be responsive to redox changes caused byincreased permeability of the cell wall (9). Interestingly, thecyo and nuo operons were reported to be downregulated dur-ing isobutanol stress after 10 min of exposure (7). qPCR anal-ysis of the cyoA indicated a decrease in transcript levels at earlytime points and an increase at later time points (Table 2)consistent with both results. Protein changes reflected many ofthe changes also seen in the microarrays for COG C, including
significant upregulation in CyoB. All members of the nuooperon were identified via proteomics, and the NuoB subunitprotein levels increased significantly during n-butanol expo-sure. The remaining proteins encoded by the nuo operon(NuoCEFG, NuoI, and NuoK) increased or showed no changeacross both time points. Other significantly increased proteinsin this category were an NADPH-dependent, flavin mononu-cleotide (FMN)-dependent nitroreductase, NfsA (Table 3).
The upregulation in the cyo, nuo, and sdh operons over timewere accompanied by several other significant changes, such asthe upregulation of sodA, encoding a superoxide dismutase,and yqhD, encoding an alcohol dehydrogenase, suggesting anoxidative stress response. The proteomics data identified sev-eral candidates known to be part of bacterial antioxidant stressresponses (42). The levels of many of these proteins, such asYqhD, also showed significant increases (Table 3).
The results at the transcript and protein level suggested adisruption of respiratory mechanisms and oxidative stress, of-ten caused by an increase in intracellular reactive oxygen spe-cies (ROS). To compare the intracellular ROS levels of controland n-butanol-exposed cultures, cells were labeled with car-boxy-H2DCFDA, a known fluorogenic marker for ROS in vivo.Cells exposed to increasing levels of n-butanol showed increas-ingly elevated levels of fluorescence (Fig. 4). This result agreeswith the measurements at the transcript and protein levels, andtaken together, these findings indicate an oxidative stress in E.coli in response to n-butanol exposure (Fig. 5).
Responses in amino acid metabolism and metabolite trans-port. COG E (amino acid transport and metabolism) con-tained the most downregulated genes (see Fig. S1 and S2 in thesupplemental material). Downregulation in several genes re-lated to histidine, leucine, arginine, tryptophan, and methio-
FIG. 3. Schematic model of microarray data for genes categorized with function in respiratory complexes and energy conservation are shownat 80 min after n-butanol exposure. The candidates depicted are energy metabolism complexes involved in oxidative phosphorylation in the KEGGpathway map (http://www.genome.jp/kegg/) and other ArcA-regulated genes.
VOL. 76, 2010 CANDIDATE GENES IN n-BUTANOL TOLERANCE 1939

nine biosynthesis and transport was observed (Table 1). Con-sistent with the transcript data, significant decreases in proteinlevels were also seen, including histidine (HisJ), cysteine (CysD),leucine (LeuD), glutamine (GlnH), glutamate (GadA), and pu-trescine (PotF) metabolism or transport (Table 3). The onlyprominently upregulated genes in this category were members ofthe opp operon (oppABCDF) that encodes a polyamine-inducedoligopeptide ABC transport system. OppAFD proteins were alsohighly upregulated (Table 3). This Opp oligopeptide transportsystem was also reported to be upregulated in response to isobu-tanol exposure (7). The upregulation in the Opp system suggestsa role of polyamines in n-butanol stress. Polyamines (e.g., pu-trescine and spermidine) are known to play an important roleduring acid stress (50), and the pH lowering in the butanol-stressed cultures is within the range known to elicit an acid stressresponse (10, 43). However, several polyamine production andtransport systems are known in E. coli and form part of thiscategory, and no other polyamine-related candidate showed sig-nificant change (for complete data see the microarray URL).
Based on the transcript and protein data, the levels of sev-eral metabolites known to be involved in both osmotic and acidstress were measured using capillary electrophoresis-massspectrometry (CE-MS) (see Fig. S5 in the supplemental mate-rial). These included several amino acids, osmoprotectants,and amino acid-derived compounds. Consistent with the down-regulation in both biosynthetic and utilization pathways, thelevels of most metabolites measured were found to be lower orremained unchanged in n-butanol exposed cells (Fig. S5). Glu-tamate, alanine, and glycine were the most abundant aminoacids in both control and stressed samples, but their levels weresignificantly reduced in the stressed samples relative to those incontrol samples. n-Butanol has been reported to cause a chao-tropic effect in Clostridium strains (6), and amino acids such asglutamate are known osmoprotectants and also known to playa role in acid stress (10). To examine if supplementation ofmedium with the most highly accumulated amino acids (glu-tamate and alanine) could mitigate the growth effect of n-butanol exposure, E. coli DH1 cultures were grown in a definedmedium containing n-butanol and amino acids at levels re-ported in osmoprotection assays in the literature (30). How-ever, the addition of no single amino acid or combination ofamino acids alleviated the growth impact imposed by n-butanolexposure substantially (see Fig. S6 in the supplemental mate-rial). Hence, while it is possible that n-butanol exposure cre-ated a stress similar to the chaotropic effect described forClostridium, there does not appear to be any impact of osmo-protecting amino acids on growth during n-butanol exposure.
Extracytoplasmic stress and heat shock responses. The cpxgenes cpxR and cpxP were the two most upregulated genesduring n-butanol stress in E. coli (COG T) (Table 1). TheCpxR/A two-component system responds to protein degrada-tion and cell envelope stresses (21). Correspondingly, othermembers of this regulon, cpxP and degP, were among the mosthighly upregulated genes in this stress (Table 1). The upregu-lation of the cpxP transcript was confirmed using qPCR (Table2). Also upregulated was the transcript encoding the envelopestress protein spy. CpxP and Spy were also among the mostsignificantly increased proteins during n-butanol stress (Table3). In addition to the envelope stress response, upregulationwas also observed in genes encoding chaperones (e.g., dnaJ
TABLE 3. iTRAQ proteomics log2 ratios forselect protein candidates
COG category andprotein namea
Log2 stress/controlratio atb:
AdditionalCOG
category60 min 120 min
COG CCyoB 1.68 0.26 CCydA 0.34 0.92 CNfsA 0.91 0.91 CNuoB 1.01 0.07 CNuoE 0.23 0.06 CNuoF 0.20 0.12 CNuoG �0.05 0.06 CNuoI 0.31 �0.02 CNuoK 0.14 0.92 CYqhD 0.73 0.81 C
COG ECysD �1.22 �0.73 EGadA �1.92 �1.28 EGlnH �1.68 0.25 ETHisJ �0.62 �0.47 ELeuD �0.45 �0.84 EOppA 0.54 0.81 EOppD 0.42 0.45 EPOppF 0.15 0.63 EPotF �1.58 �0.12 E
COG GMalE �0.04 0.75 GManX 0.63 0.86 GManY 2.61 0.88 GMgsA 0.48 0.86 G
COG JRaiA 1.56 1.18 JRplB �0.34 �0.41 JRplD �0.94 �0.59 JRplS �0.51 �0.42 JRplW 1.56 �0.59 JYhbH 1.82 0.89 J
COG MAcrA 0.06 0.26 MAcrB 0.51 0.19 MVOmpF �3.91 �1.79 MTolC �0.23 0.33 MU
COGs O and PClpB 0.58 0.44 OCpxP 0.97 0.68 UNTPGroEL 0.58 0.20 OGroS 0.48 0.22 OIbpB 0.79 �0.03 OKatG 0.12 0.30 PSodA �0.47 �0.01 PSodB 0.25 0.09 PSodC �0.14 0.43 PSpy �0.19 0.96 O
Additional uncategorizedprotein
Crl �1.22 �0.73
a COG C, energy production and conversion; COG E, amino acid transportand metabolism; COG G, carbohydrate transport and metabolism; COG J,translation, ribosomal structure, and biogenesis; COG M, cell wall, membrane,and envelope biogenesis; COG O, posttranslational modification, protein turn-over, and chaperones; and COG P, inorganic ion transport and metabolism.
b For the corresponding standard z-scores, see Table S1 in the supplementalmaterial.
1940 RUTHERFORD ET AL. APPL. ENVIRON. MICROBIOL.

and htpG) and proteases (e.g., clpB) at both the transcript andprotein levels (Tables 1 and 3). The proteomics data set in-cluded other proteins associated with heat shock (IbpAB) andenvelope stress (Table 3). These changes suggest the involve-ment of heat shock and protein-misfolding responses modu-lated as part of the �H and �E regulons during n-butanolexposure. �H (encoded by rpoH) is the well-studied heat shockregulator known to primarily regulate the cytoplasmic heatstress response (13). �E (encoded by rpoE) is typically found tobe involved in response to extracytoplasmic (or cell envelope)and extreme heat stress, but it has also been shown to controla large number of cytoplasmic genes, including rpoH (15).
Though several members of the �H regulon were upregu-lated after exposure to n-butanol, rpoH itself showed only asmall upregulation (Tables 1 and 2). �H has been establishedto be a major response factor during exposure to 10% ethanol(49), and the involvement of �H-regulated genes in n-butanolstress is not surprising. Furthermore, heat shock responseshave been documented not only in general stress but alsospecifically during n-butanol stress in other organisms (45). Incontrast to rpoH, rpoE showed a strong upregulation at 30 minafter n-butanol exposure (Table 1). Upregulation in the cpxgenes and the increase in �E strongly suggest cell envelopestress (Fig. 5). Consistent with the involvement of �E, severaltranscripts encoding outer membrane proteins—for example,the outer membrane protein porin F (ompF)—were signifi-cantly downregulated (Tables 1 and 2). Interestingly, the tran-script encoding RseA, the primary negative regulator of �E,was also significantly upregulated (Table 1).
Carbohydrate transport and metabolism. Several proteinsin COG G (carbohydrate transport and metabolism), particu-larly those associated with the membrane or located in theperiplasm, showed increased levels in response to n-butanolstress (Tables 1 and 3). manX and manY, encoding the man-nose phosphotransferase system, were highly upregulated atboth the transcript and protein levels. This system transports
and phosphorylates exogenous hexoses (mannose, glucose,fructose, etc.) and releases the phosphate esters into the cyto-plasm (36). The manXYZ system has also been implicated insolvent tolerance in E. coli (33). Interestingly, another upregu-lated protein, MgsA (methylglyoxal synthase), limits the accu-mulation of phosphorylated sugars and has been postulated toprovide a bypass mechanism for triose phosphate metabolismduring growth in inadequate inorganic phosphate levels (47).The transcript levels of the maltose ABC transporter, specifi-cally the periplasmic maltose-binding protein MalE, increasednoticeably at early time points. MalE is documented to havechaperone-like properties such as interacting with unfolded ordenatured proteins and preventing aggregation under heatshock conditions (38). However, while many of these systemshave been functionally characterized in E. coli, the significanceof their change during n-butanol exposure requires furtherinvestigation.
Additional stress responses. Changes in candidates in theCOG T category (signal transduction systems) suggested theinvolvement of other stress response mechanisms during n-butanol exposure (Table 1 and Fig. 5). Specifically, evgS, whichencodes the sensor protein of the EvgS/EvgA two-componentsystem, was highly upregulated. The upregulation of the evgStranscript was confirmed using qPCR (Table 2). The EvgS/EvgA system is known to control a broad set of genes and playsa central role during acid resistance, osmotic adaptation, anddrug resistance. This two-component system is known to effectthe regulation of a variety of efflux pumps (12). Consistent withthe upregulation in evgS, the genes acrB, which encodes partof the AcrA/B-TolC multidrug efflux system, and marA, whichalso encodes part of an efflux pump system, which are widelydocumented to be involved in solvent resistance (3, 34), wereamong the most upregulated genes (Tables 1 and 2). Thoughnot greater than a log2 of �2�, the phoB/R transcripts were alsofound to be upregulated. PhoB/R is documented to regulatethe small RNA-encoding asr as part of the acid stress response
FIG. 4. Measurement of intracellular reactive oxygen species using carboxy-H2DCFDA. The n-butanol concentrations used (vol/vol) are asindicated. “TBHP” represents control cells treated with tert-butyl hydroperoxide, which is known to produce intracellular H2O2 and which servedas a positive control. The data shown are fluorescence measured after 15 min of treatment with carboxy-H2DCFDA. Measurements wereconducted in triplicate. For complete data, see Fig. S4 in the supplemental material.
VOL. 76, 2010 CANDIDATE GENES IN n-BUTANOL TOLERANCE 1941
1942
(40). The asr transcript is known be upregulated in E. coli inpH ranges from 4.0 to 5.0 (43) and was highly upregulatedacross all time points sampled after n-butanol exposure (Table1 and Fig. 5).
Changes were also observed in several ribosomal protein-encoding genes (Table 1). RaiA (29), a translation inhibitorduring cold shock, showed upregulation at both the transcriptand protein levels. Also highly upregulated was YhbH, whichhas high sequence similarity to RaiA (29). Although not as-signed to a COG category, Crl has been shown to regulate theactivity and abundance of the RNA polymerase component �S
(48) and was downregulated during n-butanol stress.Examination of knockout mutants. The functional-genomics
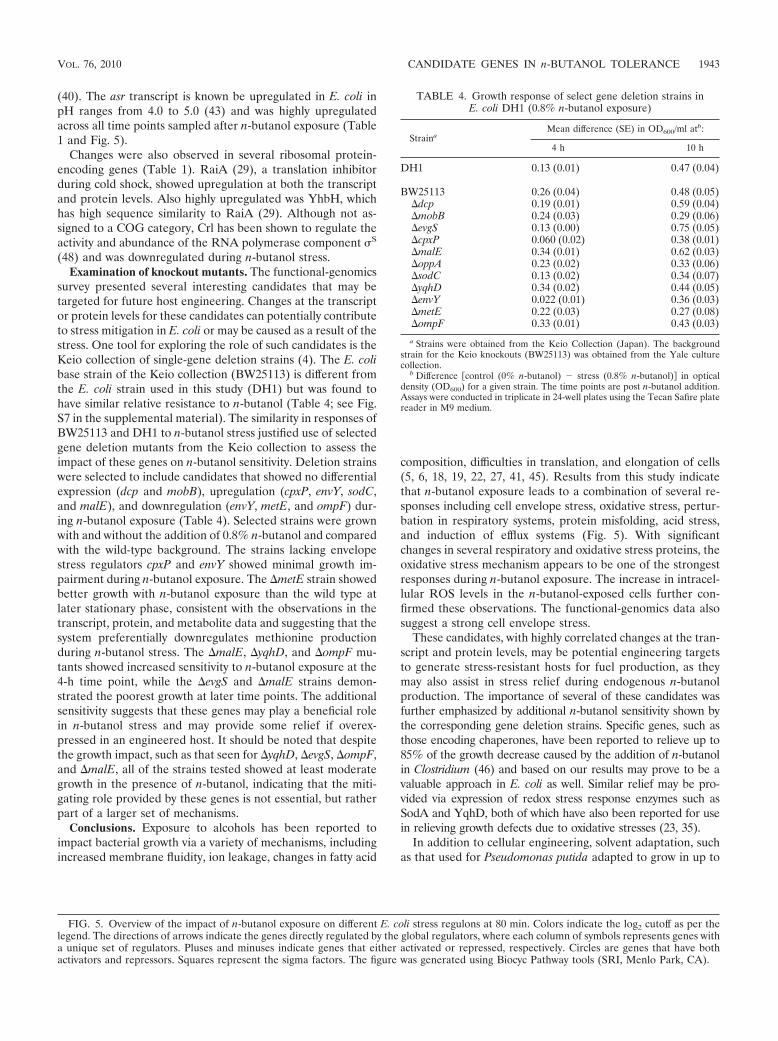
survey presented several interesting candidates that may betargeted for future host engineering. Changes at the transcriptor protein levels for these candidates can potentially contributeto stress mitigation in E. coli or may be caused as a result of thestress. One tool for exploring the role of such candidates is theKeio collection of single-gene deletion strains (4). The E. colibase strain of the Keio collection (BW25113) is different fromthe E. coli strain used in this study (DH1) but was found tohave similar relative resistance to n-butanol (Table 4; see Fig.S7 in the supplemental material). The similarity in responses ofBW25113 and DH1 to n-butanol stress justified use of selectedgene deletion mutants from the Keio collection to assess theimpact of these genes on n-butanol sensitivity. Deletion strainswere selected to include candidates that showed no differentialexpression (dcp and mobB), upregulation (cpxP, envY, sodC,and malE), and downregulation (envY, metE, and ompF) dur-ing n-butanol exposure (Table 4). Selected strains were grownwith and without the addition of 0.8% n-butanol and comparedwith the wild-type background. The strains lacking envelopestress regulators cpxP and envY showed minimal growth im-pairment during n-butanol exposure. The �metE strain showedbetter growth with n-butanol exposure than the wild type atlater stationary phase, consistent with the observations in thetranscript, protein, and metabolite data and suggesting that thesystem preferentially downregulates methionine productionduring n-butanol stress. The �malE, �yqhD, and �ompF mu-tants showed increased sensitivity to n-butanol exposure at the4-h time point, while the �evgS and �malE strains demon-strated the poorest growth at later time points. The additionalsensitivity suggests that these genes may play a beneficial rolein n-butanol stress and may provide some relief if overex-pressed in an engineered host. It should be noted that despitethe growth impact, such as that seen for �yqhD, �evgS, �ompF,and �malE, all of the strains tested showed at least moderategrowth in the presence of n-butanol, indicating that the miti-gating role provided by these genes is not essential, but ratherpart of a larger set of mechanisms.
Conclusions. Exposure to alcohols has been reported toimpact bacterial growth via a variety of mechanisms, includingincreased membrane fluidity, ion leakage, changes in fatty acid
composition, difficulties in translation, and elongation of cells(5, 6, 18, 19, 22, 27, 41, 45). Results from this study indicatethat n-butanol exposure leads to a combination of several re-sponses including cell envelope stress, oxidative stress, pertur-bation in respiratory systems, protein misfolding, acid stress,and induction of efflux systems (Fig. 5). With significantchanges in several respiratory and oxidative stress proteins, theoxidative stress mechanism appears to be one of the strongestresponses during n-butanol exposure. The increase in intracel-lular ROS levels in the n-butanol-exposed cells further con-firmed these observations. The functional-genomics data alsosuggest a strong cell envelope stress.
These candidates, with highly correlated changes at the tran-script and protein levels, may be potential engineering targetsto generate stress-resistant hosts for fuel production, as theymay also assist in stress relief during endogenous n-butanolproduction. The importance of several of these candidates wasfurther emphasized by additional n-butanol sensitivity shown bythe corresponding gene deletion strains. Specific genes, such asthose encoding chaperones, have been reported to relieve up to85% of the growth decrease caused by the addition of n-butanolin Clostridium (46) and based on our results may prove to be avaluable approach in E. coli as well. Similar relief may be pro-vided via expression of redox stress response enzymes such asSodA and YqhD, both of which have also been reported for usein relieving growth defects due to oxidative stresses (23, 35).
In addition to cellular engineering, solvent adaptation, suchas that used for Pseudomonas putida adapted to grow in up to
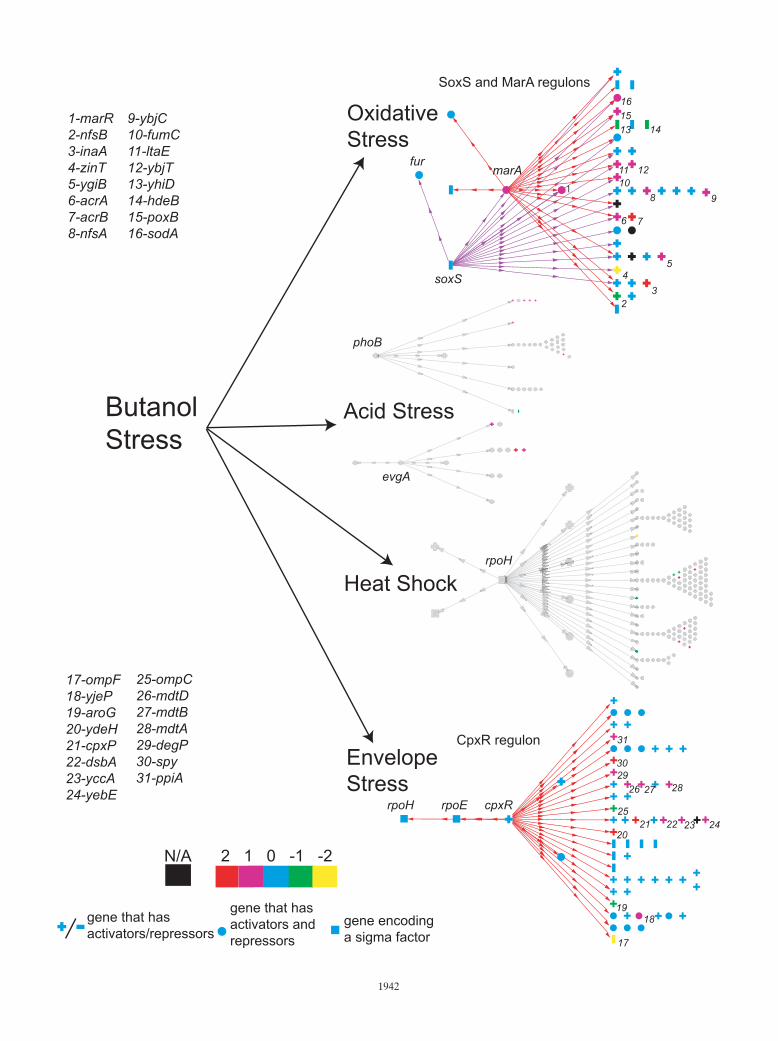
FIG. 5. Overview of the impact of n-butanol exposure on different E. coli stress regulons at 80 min. Colors indicate the log2 cutoff as per thelegend. The directions of arrows indicate the genes directly regulated by the global regulators, where each column of symbols represents genes witha unique set of regulators. Pluses and minuses indicate genes that either activated or repressed, respectively. Circles are genes that have bothactivators and repressors. Squares represent the sigma factors. The figure was generated using Biocyc Pathway tools (SRI, Menlo Park, CA).
TABLE 4. Growth response of select gene deletion strains inE. coli DH1 (0.8% n-butanol exposure)
StrainaMean difference (SE) in OD600/ml atb:
4 h 10 h
DH1 0.13 (0.01) 0.47 (0.04)
BW25113 0.26 (0.04) 0.48 (0.05)�dcp 0.19 (0.01) 0.59 (0.04)�mobB 0.24 (0.03) 0.29 (0.06)�evgS 0.13 (0.00) 0.75 (0.05)�cpxP 0.060 (0.02) 0.38 (0.01)�malE 0.34 (0.01) 0.62 (0.03)�oppA 0.23 (0.02) 0.33 (0.06)�sodC 0.13 (0.02) 0.34 (0.07)�yqhD 0.34 (0.02) 0.44 (0.05)�envY 0.022 (0.01) 0.36 (0.03)�metE 0.22 (0.03) 0.27 (0.08)�ompF 0.33 (0.01) 0.43 (0.03)
a Strains were obtained from the Keio Collection (Japan). The backgroundstrain for the Keio knockouts (BW25113) was obtained from the Yale culturecollection.
b Difference �control (0% n-butanol) � stress (0.8% n-butanol)� in opticaldensity (OD600) for a given strain. The time points are post n-butanol addition.Assays were conducted in triplicate in 24-well plates using the Tecan Safire platereader in M9 medium.
VOL. 76, 2010 CANDIDATE GENES IN n-BUTANOL TOLERANCE 1943

6% (vol/vol) n-butanol (39), may improve solvent resistance inhost strains. Solvent adaptation often involves complex re-sponses involving short- and long-term mechanisms. The adap-tive responses of bacteria to different solvents are very similarand include a variety of mechanisms (16). The complexity ofstress response is also evident in our results (Fig. 5), andengineering single genes may not sufficiently increase n-buta-nol tolerance. The use of global regulatory proteins, specifi-cally RpoH, RpoE, and ArcA, may allow the modulation ofentire stress regulons and more complex systems such as theNADH-ubiquinone oxidoreductase complex or the cyto-chrome complex. Such global approaches for trait selectionhave been conducted, including mutations in the E. coli rpoAgene for improved resistance to commercially important prod-ucts including n-butanol (26). Recent studies also suggest apotential use of RNA chaperones such as Hfq to modulate therole of protein complexes such as the Opp system (15). Inconclusion, while numerous candidates showed significantchanges at the transcript level, additional systems level analysisand follow-up studies should allow a more rational approachfor cellular engineering of E. coli for an improved host plat-form for n-butanol production.
ACKNOWLEDGMENTS
We thank Vivek Mutalik and Mario Ouellet for helpful discussions,Edward Baidoo for advice on CE-MS protocols, Jason Baumohl andMarcin Joachimiak for help with uploading data to MicrobesOnline,and Pramila Tamrakar for help with growth assays.
This work was part of the Joint BioEnergy Institute supported by theU.S. Department of Energy, Office of Science, Office of Biological andEnvironmental Research, through contract DE-AC02-05CH11231 be-tween Lawrence Berkeley National Laboratory and the U.S. Depart-ment of Energy.
REFERENCES
1. Alm, E. J., K. H. Huang, M. N. Price, R. P. Koche, K. Keller, I. L. Dubchak,and A. P. Arkin. 2005. The MicrobesOnline web site for comparative genom-ics. Genome Res. 15:1015–1022.
2. Aono, R., and H. Nakajima. 1997. Organic solvent tolerance in Escherichiacoli. Tanpakushitsu Kakusan Koso 42:2532–2541.
3. Asako, H., H. Nakajima, K. Kobayashi, M. Kobayashi, and R. Aono. 1997.Organic solvent tolerance and antibiotic resistance increased by overexpres-sion of marA in Escherichia coli. Appl. Environ. Microbiol. 63:1428–1433.
4. Baba, T., T. Ara, M. Hasegawa, Y. Takai, Y. Okumura, M. Baba, K. A.Datsenko, M. Tomita, B. L. Wanner, and H. Mori. 2006. Construction ofEscherichia coli K-12 in-frame, single-gene knockout mutants: the Keio col-lection. Mol. Syst. Biol. 2:2006.0008.
5. Baer, S. H., H. P. Blaschek, and T. L. Smith. 1987. Effect of butanolchallenge and temperature on lipid composition and membrane fluidity ofbutanol-tolerant Clostridium acetobutylicum. Appl. Environ. Microbiol.53:2854–2861.
6. Bowles, L. K., and W. L. Ellefson. 1985. Effects of butanol on Clostridiumacetobutylicum. Appl. Environ. Microbiol. 50:1165–1170.
7. Brynildsen, M. P., and J. C. Liao. 2009. An integrated network approachidentifies the isobutanol response network of Escherichia coli. Mol. Syst. Biol.5:277.
8. Colantuoni, C., G. Henry, S. Zeger, and J. Pevsner. 2002. SNOMAD (Stan-dardization and NOrmalization of MicroArray Data): web-accessible geneexpression data analysis. Bioinformatics 18:1540–1541.
9. Cotter, P. A., V. Chepuri, R. B. Gennis, and R. P. Gunsalus. 1990. Cyto-chrome o (cyoABCDE) and d (cydAB) oxidase gene expression in Escherichiacoli is regulated by oxygen, pH, and the fnr gene product. J. Bacteriol.172:6333–6338.
10. Diez-Gonzalez, F., and Y. Karaibrahimoglu. 2004. Comparison of the glu-tamate-, arginine- and lysine-dependent acid resistance systems in Esche-richia coli O157:H7. J. Appl. Microbiol. 96:1237–1244.
11. Edgar, R., M. Domrachev, and A. E. Lash. 2002. Gene Expression Omnibus:NCBI gene expression and hybridization array data repository. Nucleic AcidsRes. 30:207–210.
12. Eguchi, Y., T. Oshima, H. Mori, R. Aono, K. Yamamoto, A. Ishihama, andR. Utsumi. 2003. Transcriptional regulation of drug efflux genes by EvgAS,a two-component system in Escherichia coli. Microbiology 149:2819–2828.
13. Erickson, J. W., V. Vaughn, W. A. Walter, F. C. Neidhardt, and C. A. Gross.1987. Regulation of the promoters and transcripts of rpoH, the Escherichiacoli heat shock regulatory gene. Genes Dev. 1:419–432.
14. Ezeji, T. C., N. Qureshi, and H. P. Blaschek. 2007. Bioproduction of butanolfrom biomass: from genes to bioreactors. Energy Biotechnol. Environ. Bio-technol. 18:220–227.
15. Guisbert, E., V. A. Rhodius, N. Ahuja, E. Witkin, and C. A. Gross. 2007. Hfqmodulates the sigmaE-mediated envelope stress response and the sigma32-mediated cytoplasmic stress response in Escherichia coli. J. Bacteriol. 189:1963–1973.
16. Heipieper, H. J., G. Neumann, S. Cornelissen, and F. Meinhardt. 2007.Solvent-tolerant bacteria for biotransformations in two-phase fermentationsystems. Appl. Microbiol. Biotechnol. 74:961–973.
17. Ingledew, W. J., and R. K. Poole. 1984. The respiratory chains of Escherichiacoli. Microbiol. Rev. 48:222–271.
18. Ingram, L. O. 1990. Ethanol tolerance in bacteria. Crit. Rev. Biotechnol.9:305–319.
19. Ingram, L. O. 1986. Microbial tolerance to alcohols—role of the cell mem-brane. Trends Biotechnol. 4:40–44.
20. Ingram, L. O., and T. M. Buttke. 1984. Effects of alcohols on microorgan-isms. Adv. Microb. Physiol. 25:253–300.
21. Isaac, D. D., J. S. Pinkner, S. J. Hultgren, and T. J. Silhavy. 2005. Theextracytoplasmic adaptor protein CpxP is degraded with substrate by DegP.Proc. Natl. Acad. Sci. U. S. A. 102:17775–17779.
22. Kabelitz, N., P. M. Santos, and H. J. Heipieper. 2003. Effect of aliphaticalcohols on growth and degree of saturation of membrane lipids in Acineto-bacter calcoaceticus. FEMS Microbiol. Lett. 220:223–227.
23. Kang, Y. S., Y. Lee, H. Jung, C. O. Jeon, E. L. Madsen, and W. Park. 2007.Overexpressing antioxidant enzymes enhances naphthalene biodegradationin Pseudomonas sp. strain As1. Microbiology 153:3246–3254.
24. Keasling, J. D., and H. Chou. 2008. Metabolic engineering delivers next-generation biofuels. Nat. Biotechnol. 26:298–299.
25. Kizer, L., D. J. Pitera, B. F. Pfleger, and J. D. Keasling. 2008. Application offunctional genomics to pathway optimization for increased isoprenoid pro-duction. Appl. Environ. Microbiol. 74:3229–3241.
26. Klein-Marcuschamer, D., C. N. Santos, H. Yu, and G. Stephanopoulos. 2009.Mutagenesis of the bacterial RNA polymerase alpha subunit for improve-ment of complex phenotypes. Appl. Environ. Microbiol. 75:2705–2711.
27. Knoshaug, E. P., and M. Zhang. 2009. Butanol tolerance in a selection ofmicroorganisms. Appl. Biochem. Biotechnol. 153:13–20.
28. Lee, S. Y., D. Y. Lee, and T. Y. Kim. 2005. Systems biotechnology for strainimprovement. Trends Biotechnol. 23:349–358.
29. Maki, Y., H. Yoshida, and A. Wada. 2000. Two proteins, YfiA and YhbH,associated with resting ribosomes in stationary phase Escherichia coli. GenesCells 5:965–974.
30. Mukhopadhyay, A., Z. He, E. J. Alm, A. P. Arkin, E. E. Baidoo, S. C. Borglin,W. Q. Chen, T. C. Hazen, Q. He, H. Y. Holman, K. Huang, R. Huang, D. C.Joyner, N. Katz, M. Keller, P. Oeller, A. Redding, J. Sun, J. Wall, J. Wei,Z. M. Yang, H. C. Yen, J. Z. Zhou, and J. D. Keasling. 2006. Salt stress inDesulfovibrio vulgaris Hildenborough: an integrated genomics approach. J.Bacteriol. 188:4068–4078.
31. Mukhopadhyay, A., A. M. Redding, B. J. Rutherford, and J. D. Keasling.2008. Importance of systems biology in engineering microbes for biofuelproduction. Curr. Opin. Biotechnol. 19:228–234.
32. Neidhardt, F., P. Bloch, and D. Smith. 1974. Culture medium for enterobac-teria. J. Bacteriol. 119:736–747.
33. Okochi, M., M. Kurimoto, K. Shimizu, and H. Honda. 2007. Increase oforganic solvent tolerance by overexpression of manXYZ in Escherichia coli.Appl. Microbiol. Biotechnol. 73:1394–1399.
34. Okusu, H., D. Ma, and H. Nikaido. 1996. AcrAB efflux pump plays a majorrole in the antibiotic resistance phenotype of Escherichia coli multiple-anti-biotic-resistance (Mar) mutants. J. Bacteriol. 178:306–308.
35. Perez, J. M., F. A. Arenas, G. A. Pradenas, J. M. Sandoval, and C. C.Vasquez. 2008. Escherichia coli YqhD exhibits aldehyde reductase activityand protects from the harmful effect of lipid peroxidation-derived aldehydes.J. Biol. Chem. 283:7346–7353.
36. Postma, P. W., J. W. Lengeler, and G. R. Jacobson. 1993. Phosphoenolpyru-vate:carbohydrate phosphotransferase systems of bacteria. Microbiol. Mol.Biol. Rev. 57:543–594.
37. Redding, A., A. Mukhopadhyay, D. C. Joyner, T. C. Hazen, and J. D. Keas-ling. 2003. Study of nitrate stress in Desulfovibrio vulgaris Hildenboroughusing iTRAQ proteomics. Brief. Funct. Genomic Proteomics 5:133–143.
38. Richarme, G., and T. D. Caldas. 1997. Chaperone properties of the bacterialperiplasmic substrate-binding proteins. J. Biol. Chem. 272:15607–15612.
39. Ruhl, J., A. Schmid, and L. M. Blank. 2009. Selected Pseudomonas putidastrains able to grow in the presence of high butanol concentrations. Appl.Environ. Microbiol. 75:4653–4656.
40. Seputiene, V., D. Motiejunas, K. Suziedelis, H. Tomenius, S. Normark, O.Melefors, and E. Suziedeliene. 2003. Molecular characterization of the acid-inducible asr gene of Escherichia coli and its role in acid stress response. J.Bacteriol. 185:2475–2484.
1944 RUTHERFORD ET AL. APPL. ENVIRON. MICROBIOL.

41. Sikkema, J., J. A. M. Debont, and B. Poolman. 1995. Mechanisms of mem-brane toxicity of hydrocarbons. Microbiol. Rev. 59:201–222.
42. Storz, G., and M. Zheng. 2000. Oxidative stress, p. 47–59. In G. Storz and R.Hengge-Aronis (ed.), Bacterial stress responses. ASM Press, Washington, DC.
43. Suziedeliene, E., K. Suziedelis, V. Garbenciute, and S. Normark. 1999. Theacid-inducible asr gene in Escherichia coli: transcriptional control by thephoBR operon. J. Bacteriol. 181:2084–2093.
44. Tatusov, R., N. Fedorova, J. Jackson, A. Jacobs, B. Kiryutin, E. Koonin, D.Krylov, R. Mazumder, S. Mekhedov, A. Nikolskaya, B. S. Rao, S. Smirnov,A. Sverdlov, S. Vasudevan, Y. Wolf, J. Yin, and D. Natale. 2003. The COGdatabase: an updated version includes eukaryotes. BMC Bioinformatics 4:41.
45. Tomas, C. A., J. Beamish, and E. T. Papoutsakis. 2004. Transcriptionalanalysis of butanol stress and tolerance in Clostridium acetobutylicum. J.Bacteriol. 186:2006–2018.
46. Tomas, C. A., N. E. Welker, and E. T. Papoutsakis. 2003. Overexpression of
groESL in Clostridium acetobutylicum results in increased solvent productionand tolerance, prolonged metabolism, and changes in the cell’s transcrip-tional program. Appl. Environ. Microbiol. 69:4951–4965.
47. Totemeyer, S., N. A. Booth, W. W. Nichols, B. Dunbar, and I. R. Booth. 1998.From famine to feast: the role of methylglyoxal production in Escherichiacoli. Mol. Microbiol. 27:553–562.
48. Typas, A., C. Barembruch, A. Possling, and R. Hengge. 2007. Stationaryphase reorganisation of the Escherichia coli transcription machinery by Crlprotein, a fine-tuner of sigma(s) activity and levels. EMBO J. 26:1569–1578.
49. VanBogelen, R., M. Acton, and F. Neidhardt. 1987. Induction of the heat-shock regulon does not produce thermotolerance in Escherichia coli. GenesDev. 1:525–531.
50. Yohannes, E., A. E. Thurber, J. C. Wilks, D. P. Tate, and J. L. Slonczewski. 2005.Polyamine stress at high pH in Escherichia coli K-12. BMC Microbiol. 5:59.
VOL. 76, 2010 CANDIDATE GENES IN n-BUTANOL TOLERANCE 1945