Density and speed of sound measurements of 1- and 2-butanol
10
Density and speed of sound measurements of 1- and 2-butanol ☆ Stephanie L. Outcalt ⁎, Arno Laesecke, Tara J. Fortin Thermophysical Properties Division, Chemical Science and Technology Laboratory, National Institute of Standards and Technology, 325 Broadway, Boulder, CO 80305-3337, USA abstract article info Article history: Received 9 September 2009 Received in revised form 4 November 2009 Accepted 7 November 2009 Available online 12 November 2009 Keywords: Adiabatic compressibility Biofuels 1-butanol 2-butanol Compressed liquid Density Speed of sound The density and speed of sound of 1- and 2-butanol have been measured with two instruments; both instruments used vibrating-tube sensors for measuring density. At ambient pressure (83 kPa), density and speed of sound were measured from 278.15 K to 343.15 K. Adiabatic compressibilities were derived from these density and speed of sound data. Compressed liquid density measurements were carried out in a second instrument over a range from 270 K to 470 K with pressures from 0.5 MPa to 50 MPa. The measured density data were correlated with a modified Tait equation within their experimental uncertainty, and this correlation provides a baseline for extensive comparisons with literature data. Differences between the measured macroscopic properties of the two butanol isomers are related to differences on the molecular level. These were characterized by quantum mechanical calculations using the second-order Møller–Plesset model with the polarization basis set 6-311+G⁎⁎. Published by Elsevier B.V. 1. Introduction This contribution is part of a series of measurements, the goal of which is to systematically characterize the thermophysical properties of fuels and their constituents over wide ranges of temperature and pressure. While previous reports have communicated measurement results for jet fuels [1], rocket fuels [2], and their constituents methyl- and propylcyclohexane [3] and hexadecane [4], two butanol isomers (1- and 2-butanol) have been characterized in this work. There are four isomers of the aliphatic alcohol with the molecular formula C 4 H 9 OH. One of the two isomers with a primary hydroxyl group is 1-butanol or n-butanol (CAS no. 71-36-3). The only isomer with a secondary alcohol group at an internal carbon atom is 2- butanol (CAS no. 78-92-2), also known as sec-butanol, 2-butyl alcohol, or 1-methyl-1-propanol. The other isomer with a primary hydroxyl group is 2-methyl-1-propanol, and the isomer with a tertiary hydroxyl group is 1,1-dimethyl-ethanol or 2-methyl-2- propanol. Interest in butanols as a second-generation biofuel has increased in recent years because they have many advantages over other po- tential alternative fuel candidates such as ethanol. At 85% by volume with gasoline, butanols can be used in cars designed for gasoline without requiring any retrofit to the engine (unlike 85% ethanol, E85) [5]. They have a higher energy content for a given volume than ethanol, and almost as much as gasoline. Butanols can also be used as a blended additive to gasoline to reduce carbon monoxide emissions [6], and are less susceptible to separation in the presence of water than ethanol/gasoline blends, therefore allowing use of the in- dustry's existing distribution infrastructure without requiring mod- ifications to blending facilities, storage tanks or retail station pumps [5]. Despite the advantages butanols may provide as an alternative fuel, there are still significant gaps in the thermophysical properties data, particularly for 2-butanol. Also, there is a fair amount of scatter in the data for both 1- and 2-butanol. The measurements reported here were undertaken to provide data where none exist, and to help resolve some of the differences between published data sets. Results of density and speed of sound measurements for 1- and 2- butanol are reported in this work. Adiabatic compressibilities have been derived from the ambient pressure density and speed of sound data and are also included. Compressed liquid density data have been extrapolated to saturation pressure and combined with ambient pressure density data for correlation with a Rackett equation. Additionally, the compressed liquid density data have been corre- lated with a modified Tait equation and compared to existing literature data. 2. Molecular characterization A major goal of our research is to provide accurate macroscopic thermophysical properties data and to relate them to the molecular Journal of Molecular Liquids 151 (2010) 50–59 ☆ Contribution of the National Institute of Standards and Technology. Not subject to Copyright © in the USA. ⁎ Corresponding author. Tel.: + 1 303 497 5786; fax: + 1 303 497 5224. E-mail address: [email protected] (S.L. Outcalt). 0167-7322/$ – see front matter. Published by Elsevier B.V. doi:10.1016/j.molliq.2009.11.002 Contents lists available at ScienceDirect Journal of Molecular Liquids journal homepage: www.elsevier.com/locate/molliq
Transcript of Density and speed of sound measurements of 1- and 2-butanol
Journal of Molecular Liquids 151 (2010) 50–59
Contents lists available at ScienceDirect
Journal of Molecular Liquids
j ourna l homepage: www.e lsev ie r.com/ locate /mol l iq
Density and speed of sound measurements of 1- and 2-butanol☆
Stephanie L. Outcalt ⁎, Arno Laesecke, Tara J. FortinThermophysical Properties Division, Chemical Science and Technology Laboratory, National Institute of Standards and Technology, 325 Broadway, Boulder, CO 80305-3337, USA
☆ Contribution of the National Institute of Standards aCopyright© in the USA.⁎ Corresponding author. Tel.: +1 303 497 5786; fax:
E-mail address: [email protected] (S.L. Outc
0167-7322/$ – see front matter. Published by Elsevierdoi:10.1016/j.molliq.2009.11.002
a b s t r a c t
a r t i c l e i n f oArticle history:Received 9 September 2009Received in revised form 4 November 2009Accepted 7 November 2009Available online 12 November 2009
Keywords:Adiabatic compressibilityBiofuels1-butanol2-butanolCompressed liquidDensitySpeed of sound
The density and speed of sound of 1- and 2-butanol have been measured with two instruments; bothinstruments used vibrating-tube sensors for measuring density. At ambient pressure (83 kPa), density andspeed of sound were measured from 278.15 K to 343.15 K. Adiabatic compressibilities were derived fromthese density and speed of sound data. Compressed liquid density measurements were carried out in asecond instrument over a range from 270 K to 470 K with pressures from 0.5 MPa to 50 MPa. The measureddensity data were correlated with a modified Tait equation within their experimental uncertainty, and thiscorrelation provides a baseline for extensive comparisons with literature data. Differences between themeasured macroscopic properties of the two butanol isomers are related to differences on the molecularlevel. These were characterized by quantum mechanical calculations using the second-order Møller–Plessetmodel with the polarization basis set 6-311+G⁎⁎.
nd Technology. Not subject to
+1 303 497 5224.alt).
B.V.
Published by Elsevier B.V.
1. Introduction
This contribution is part of a series of measurements, the goal ofwhich is to systematically characterize the thermophysical propertiesof fuels and their constituents over wide ranges of temperature andpressure. While previous reports have communicated measurementresults for jet fuels [1], rocket fuels [2], and their constituents methyl-and propylcyclohexane [3] and hexadecane [4], two butanol isomers(1- and 2-butanol) have been characterized in this work.
There are four isomers of the aliphatic alcohol with the molecularformula C4H9OH. One of the two isomers with a primary hydroxylgroup is 1-butanol or n-butanol (CAS no. 71-36-3). The only isomerwith a secondary alcohol group at an internal carbon atom is 2-butanol (CAS no. 78-92-2), also known as sec-butanol, 2-butylalcohol, or 1-methyl-1-propanol. The other isomer with a primaryhydroxyl group is 2-methyl-1-propanol, and the isomer with atertiary hydroxyl group is 1,1-dimethyl-ethanol or 2-methyl-2-propanol.
Interest in butanols as a second-generation biofuel has increasedin recent years because they have many advantages over other po-tential alternative fuel candidates such as ethanol. At 85% by volumewith gasoline, butanols can be used in cars designed for gasolinewithout requiring any retrofit to the engine (unlike 85% ethanol, E85)[5]. They have a higher energy content for a given volume than
ethanol, and almost as much as gasoline. Butanols can also be used asa blended additive to gasoline to reduce carbon monoxide emissions[6], and are less susceptible to separation in the presence of waterthan ethanol/gasoline blends, therefore allowing use of the in-dustry's existing distribution infrastructure without requiring mod-ifications to blending facilities, storage tanks or retail station pumps[5].
Despite the advantages butanols may provide as an alternativefuel, there are still significant gaps in the thermophysical propertiesdata, particularly for 2-butanol. Also, there is a fair amount ofscatter in the data for both 1- and 2-butanol. The measurementsreported here were undertaken to provide data where none exist,and to help resolve some of the differences between published datasets.
Results of density and speed of soundmeasurements for 1- and 2-butanol are reported in this work. Adiabatic compressibilities havebeen derived from the ambient pressure density and speed of sounddata and are also included. Compressed liquid density data have beenextrapolated to saturation pressure and combined with ambientpressure density data for correlation with a Rackett equation.Additionally, the compressed liquid density data have been corre-lated with a modified Tait equation and compared to existingliterature data.
2. Molecular characterization
A major goal of our research is to provide accurate macroscopicthermophysical properties data and to relate them to the molecular

51S.L. Outcalt et al. / Journal of Molecular Liquids 151 (2010) 50–59
size, shape, and charge distribution of the measured compounds. Theisomers 1- and 2-butanol were chosen for themeasurements reportedin this work to elucidate how the change of the hydroxyl group from aprimary to a secondary position on the molecular level is reflected inthe densities and speeds of sound of the two compounds over a widerange of temperature and pressure. Measurements over widetemperature ranges provide particularly detailed insight into theeffects of electrostatic attractions between polar molecules such asalcohols that associate with each other and form hydrogen bonds. Onthe molecular level, our approach includes the computationalcharacterization of the test compounds by ab initio calculations oftheir equilibrium geometries and charge distributions in the Møller–Plesset theory level MP2 with 6-311+G⁎⁎ basis sets [7]. The twomolecules are compared in Fig. 1 in three views of their electrondensity isosurface at 0.002 electrons a.u.−3 (where 1 a.u.=5.292 nm,the Bohr radius of hydrogen). The electrostatic potential is color-mapped onto the electron density isosurface indicating the chargedistribution in the molecules [8]. The three views of the molecules,two frontal and one along the longitudinal axes, reveal differences inshape and polarity between the two isomers. They give anappreciation of the possible ordering of the molecules in condensedphases and the associated void volumes. While the calculatedmolecular volumes agree very well, the molecular surface area of 2-butanol is 2.4% smaller than that of 1-butanol. Visualizations of themolecular charge distributions as in Fig. 1 facilitate the understandingof structural effects due to electrostatic attractions and repulsions,which are prominent in polar molecules such as 1- and 2-butanol. At1.7 debye, the calculated dipole moment of 2-butanol agrees with thesame value reported in the compilation of Poling, Prausnitz, and
Fig. 1. Comparison of molecular size, shape, and charge distribution of 1- and 2-butanol.The electrostatic potential is color-mapped onto an electron density isosurface at thelevel of 0.002 electrons a.u.−3 (with 1 a.u.=5.292 nm being the Bohr radius ofhydrogen). This surface represents approximately 99% of a molecule. The color scaleranges from red (negative charge) to blue (positive charge). Each molecule is shown intwo frontal views (top row and center row) and along the longitudinal axis (bottomrow) to illustrate size and shape differences. Molecular data in the table are based onequilibrium geometry calculations at the MP2 theory level with 6-311+G⁎⁎ basis sets.(For interpretation of the references to color in this figure legend, the reader is referredto the web version of this article.)
O'Connell [9]. In contrast, at 1.74 debye, the calculated dipole momentof 1-butanol is 2.4% lower than the reported value of 1.8 debye [9]. Thework reported here illustrates how these characteristics on themolecular level are reflected in the measured macroscopic propertiesdensity and speed of sound.
3. Experimental
The 1- and 2-butanol samples measured in this work wereobtained from Sigma-Aldrich Chemicals1 both with a statedminimumpurity of 99.5%. Because of their hygroscopicity, activated molecularsieves type 5A, grade 521, with an effective pore size of 5 Å wereadded to each of the sample bottles to keep the butanols dry ofcontamination from ambient humidity. Karl Fischer analysis per-formed on each of the samples prior to measurements determined thewater content to be just at the detection limit of approximately20 ppm. Measurements at ambient pressure were conducted on thesamples with no additional analysis or purification.
Prior to measurements of compressed liquid density, sampleswere transferred to stainless steel cylinders and degassed as describedin Outcalt and McLinden [10]. The sample of 2-butanol used to chargethe system for the compressed liquid density measurements wasanalyzed in our laboratory with a gas chromatographic method andfound to be within manufacturer specifications. An analysis was alsoperformed on the 2-butanol collected at the outlet of the instrumentto determine whether thermal breakdown or any type of contami-nation took place during themeasurements. No significant differencesbetween fresh and used samples were detected.
A DSA 5000 analyzer from Anton Paar Company was used tomeasure density and speed of sound at ambient pressure. Details ofthe instrument and experimental procedures have been reported inLaesecke et al. [3]; thus, only a brief description is given here. Theinstrument contains a sound speed cell and a vibrating quartz tubedensimeter in series. Temperature is measured with an integrated Pt-100 thermometer with an estimated uncertainty of 0.01 K. Theinstrument was adjusted with air and deionized water at 293.15,313.15, and 333.15 K. In addition, the instrument performance ischecked before and after measurements to ensure that the densityand speed of sound of water at 293.15 K are reproduced within100 ppm. For the 1- and 2-butanol measurements, temperature scanswere programmed from 343.15 K to 278.15 K in 5 K increments. Freshsamples of test liquid were injected for each temperature scan insteadof performing repetitive measurements on the same sample. At leastfour temperature scans were performed for both fluids. The relativestandard deviation (reproducibility) of these repeated sound speedmeasurements was no greater than 0.07% and no more than 0.001%for density. Based on repeated measurements of the speed of sound ofwater, we conservatively estimate the uncertainty of our sound speedmeasurements to be 0.3% (k=2.3). To more accurately estimate theuncertainty of the ambient pressure density measurements, densitiesof NIST SRM 211d (toluene) were measured over the temperaturerange of the instrument and compared to the correlation of McLindenand Splett [11]. Based on these comparisons, we conservativelyestimate the uncertainty of our ambient pressure density measure-ments to be 0.04% (k=2.3).
Densities of the compressed liquids were measured with theautomated densimeter of Outcalt andMcLinden, details of which havebeen described in a previous publication [10]. The core of theapparatus is a commercial vibrating-tube densimeter (DMA-HPMfrom Anton Paar Company) which is housed in a custom designed
1 In order to describe materials and experimental procedures adequately, it isoccasionally necessary to identify commercial products by manufacturers' names orlabels. In no instance does such identification imply endorsement by the NationalInstitute of Standards and Technology, nor does it imply that the particular product orequipment is necessarily the best available for the purpose.

Fig. 2. Measured speed of sound of 1- and 2- butanol at ambient pressure as a function
52 S.L. Outcalt et al. / Journal of Molecular Liquids 151 (2010) 50–59
thermostat to maximize temperature stability and control. Theapparatus includes several other physical improvements, and proce-dures such as regular calibration of temperature and pressuremeasurement devices are implemented to minimize the uncertaintyin the measurements beyond that of the commercial instrumentoperated in a stand-alone mode. The temperature range of theinstrument is 270 K to 470 K with pressures up to 50 MPa. In thiswork, both of the samples were measured along eleven isotherms atpressures from 0.5 MPa to 50 MPa. The instrument was calibratedwith propane and toluene over the entire temperature and pressurerange. The overall uncertainty (k=2) in density is 0.64 kg m−3 to0.81 kg m−3, corresponding to a relative uncertainty in density of0.09% to 0.14%.
4. Results
Table 1 lists values of density, speed of sound, and derivedadiabatic compressibilities for 1-and 2-butanol from 278.15 K to343.15 K at a pressure of 83 kPa. Speed of sound and adiabaticcompressibility results are also illustrated in Figs. 2 and 3, respec-tively. Adiabatic compressibilities were calculated from the measureddensities and speeds of sound via the thermodynamic relation
κs = −ð∂V =∂pÞs = V = 1= ðρw2Þ; ð1Þ
where V denotes volume, p is pressure, ρ is the density, and w thespeed of sound. The subscript s indicates that the derivative is taken“at constant entropy.” Figs. 2 and 3 illustrate that even over a fairlysmall temperature range and at ambient pressure, the differences inthe molecular characteristics of the butanol isomers studied in this
of temperature.
Fig. 3.Derived adiabatic compressibilities of 1- and2-butanol as a function of temperature.
Table 1Density, speed of sound, and adiabatic compressibility of 1- and 2-butanol measured inthe density and sound speed analyzer. The ambient pressure during the measurementswas approximately 0.083 MPa.
TemperatureTK
Densityρkg m−3
Speed of soundwm s−1
Adiab.compressibility κsTPa−1
1-butanol278.15 820.9 1308.8 711.2283.15 817.1 1291.3 733.9288.15 813.3 1274.0 757.5293.15 809.5 1256.8 782.0298.15 805.7 1239.8 807.5303.15 801.9 1222.9 833.9308.15 798.0 1206.2 861.3313.15 794.1 1189.6 890.0318.15 790.1 1173.0 919.8323.15 786.1 1156.5 951.1328.15 782.1 1140.0 983.9333.15 778.0 1123.5 1018.3338.15 773.8 1107.0 1054.5343.15 769.6 1090.6 1092.4
2-butanol278.15 818.3 1284.0 741.3283.15 814.4 1266.0 766.1288.15 810.4 1248.0 792.2293.15 806.3 1230.1 819.6298.15 802.2 1212.1 848.5303.15 798.0 1194.0 879.0308.15 793.7 1175.8 911.3313.15 789.3 1157.6 945.5318.15 784.8 1139.2 981.9323.15 780.2 1120.6 1020.6328.15 775.5 1102.0 1061.8333.15 770.7 1083.2 1105.9338.15 765.8 1064.2 1153.1343.15 760.7 1044.8 1204.2
53S.L. Outcalt et al. / Journal of Molecular Liquids 151 (2010) 50–59
work are manifested in significant differences in speed of sound andadiabatic compressibility.
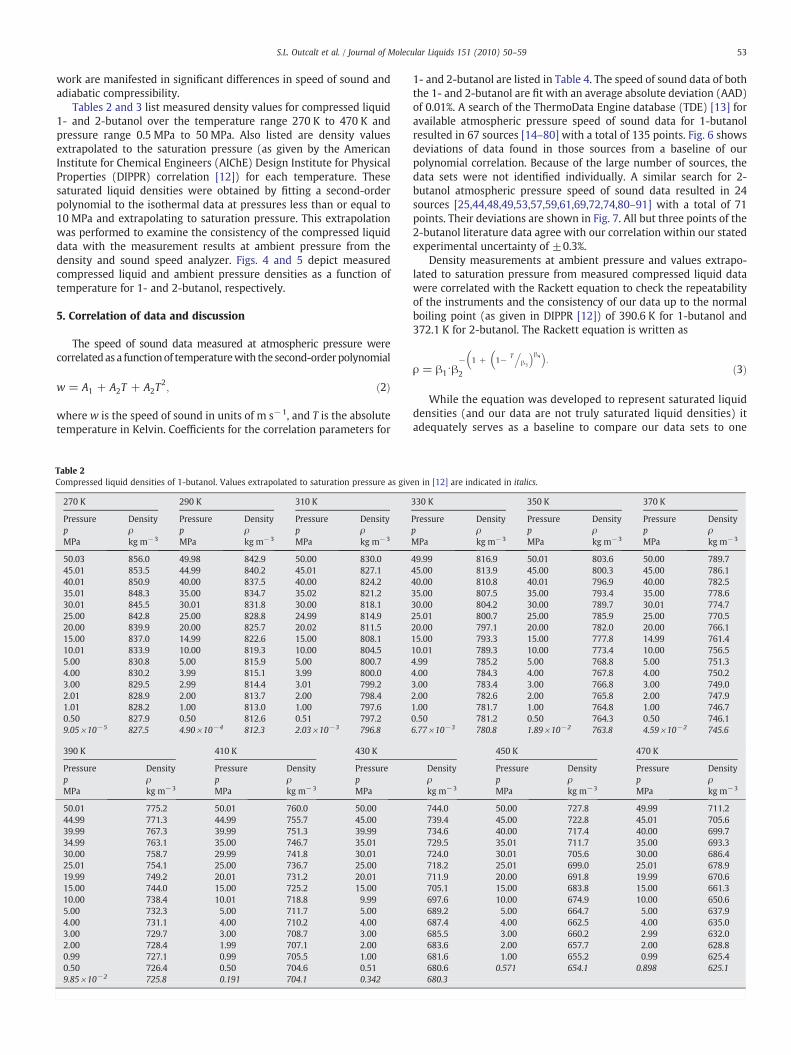
Tables 2 and 3 list measured density values for compressed liquid1- and 2-butanol over the temperature range 270 K to 470 K andpressure range 0.5 MPa to 50 MPa. Also listed are density valuesextrapolated to the saturation pressure (as given by the AmericanInstitute for Chemical Engineers (AIChE) Design Institute for PhysicalProperties (DIPPR) correlation [12]) for each temperature. Thesesaturated liquid densities were obtained by fitting a second-orderpolynomial to the isothermal data at pressures less than or equal to10 MPa and extrapolating to saturation pressure. This extrapolationwas performed to examine the consistency of the compressed liquiddata with the measurement results at ambient pressure from thedensity and sound speed analyzer. Figs. 4 and 5 depict measuredcompressed liquid and ambient pressure densities as a function oftemperature for 1- and 2-butanol, respectively.
5. Correlation of data and discussion
The speed of sound data measured at atmospheric pressure werecorrelatedas a functionof temperaturewith the second-orderpolynomial
w = A1 + A2T + A2T2; ð2Þ
where w is the speed of sound in units of m s−1, and T is the absolutetemperature in Kelvin. Coefficients for the correlation parameters for
Table 2Compressed liquid densities of 1-butanol. Values extrapolated to saturation pressure as giv
270 K 290 K 310 K
PressurepMPa
Densityρkg m−3
PressurepMPa
Densityρkg m−3
PressurepMPa
Densityρkg m−3
50.03 856.0 49.98 842.9 50.00 830.045.01 853.5 44.99 840.2 45.01 827.140.01 850.9 40.00 837.5 40.00 824.235.01 848.3 35.00 834.7 35.02 821.230.01 845.5 30.01 831.8 30.00 818.125.00 842.8 25.00 828.8 24.99 814.920.00 839.9 20.00 825.7 20.02 811.515.00 837.0 14.99 822.6 15.00 808.110.01 833.9 10.00 819.3 10.00 804.55.00 830.8 5.00 815.9 5.00 800.74.00 830.2 3.99 815.1 3.99 800.03.00 829.5 2.99 814.4 3.01 799.22.01 828.9 2.00 813.7 2.00 798.41.01 828.2 1.00 813.0 1.00 797.60.50 827.9 0.50 812.6 0.51 797.29.05×10−5 827.5 4.90×10⁻⁴ 812.3 2.03×10⁻³ 796.8
390 K 410 K 430 K
PressurepMPa
Densityρkg m−3
PressurepMPa
Densityρkg m−3
PressurepMPa
50.01 775.2 50.01 760.0 50.0044.99 771.3 44.99 755.7 45.0039.99 767.3 39.99 751.3 39.9934.99 763.1 35.00 746.7 35.0130.00 758.7 29.99 741.8 30.0125.01 754.1 25.00 736.7 25.0019.99 749.2 20.01 731.2 20.0115.00 744.0 15.00 725.2 15.0010.00 738.4 10.01 718.8 9.995.00 732.3 5.00 711.7 5.004.00 731.1 4.00 710.2 4.003.00 729.7 3.00 708.7 3.002.00 728.4 1.99 707.1 2.000.99 727.1 0.99 705.5 1.000.50 726.4 0.50 704.6 0.519.85×10−2 725.8 0.191 704.1 0.342
1- and 2-butanol are listed in Table 4. The speed of sound data of boththe 1- and 2-butanol are fit with an average absolute deviation (AAD)of 0.01%. A search of the ThermoData Engine database (TDE) [13] foravailable atmospheric pressure speed of sound data for 1-butanolresulted in 67 sources [14–80] with a total of 135 points. Fig. 6 showsdeviations of data found in those sources from a baseline of ourpolynomial correlation. Because of the large number of sources, thedata sets were not identified individually. A similar search for 2-butanol atmospheric pressure speed of sound data resulted in 24sources [25,44,48,49,53,57,59,61,69,72,74,80–91] with a total of 71points. Their deviations are shown in Fig. 7. All but three points of the2-butanol literature data agree with our correlation within our statedexperimental uncertainty of ±0.3%.
Density measurements at ambient pressure and values extrapo-lated to saturation pressure from measured compressed liquid datawere correlated with the Rackett equation to check the repeatabilityof the instruments and the consistency of our data up to the normalboiling point (as given in DIPPR [12]) of 390.6 K for 1-butanol and372.1 K for 2-butanol. The Rackett equation is written as
ρ = β1⋅β− 1 + 1− T
β3
. �β4�:
��
2 ð3Þ
While the equation was developed to represent saturated liquiddensities (and our data are not truly saturated liquid densities) itadequately serves as a baseline to compare our data sets to one
en in [12] are indicated in italics.
330 K 350 K 370 K
PressurepMPa
Densityρkg m−3
PressurepMPa
Densityρkg m−3
PressurepMPa
Densityρkg m−3
49.99 816.9 50.01 803.6 50.00 789.745.00 813.9 45.00 800.3 45.00 786.140.00 810.8 40.01 796.9 40.00 782.535.00 807.5 35.00 793.4 35.00 778.630.00 804.2 30.00 789.7 30.01 774.725.01 800.7 25.00 785.9 25.00 770.520.00 797.1 20.00 782.0 20.00 766.115.00 793.3 15.00 777.8 14.99 761.410.01 789.3 10.00 773.4 10.00 756.54.99 785.2 5.00 768.8 5.00 751.34.00 784.3 4.00 767.8 4.00 750.23.00 783.4 3.00 766.8 3.00 749.02.00 782.6 2.00 765.8 2.00 747.91.00 781.7 1.00 764.8 1.00 746.70.50 781.2 0.50 764.3 0.50 746.16.77×10−3 780.8 1.89×10⁻² 763.8 4.59×10⁻² 745.6
450 K 470 K
Densityρkg m−3
PressurepMPa
Densityρkg m−3
PressurepMPa
Densityρkg m−3
744.0 50.00 727.8 49.99 711.2739.4 45.00 722.8 45.01 705.6734.6 40.00 717.4 40.00 699.7729.5 35.01 711.7 35.00 693.3724.0 30.01 705.6 30.00 686.4718.2 25.01 699.0 25.01 678.9711.9 20.00 691.8 19.99 670.6705.1 15.00 683.8 15.00 661.3697.6 10.00 674.9 10.00 650.6689.2 5.00 664.7 5.00 637.9687.4 4.00 662.5 4.00 635.0685.5 3.00 660.2 2.99 632.0683.6 2.00 657.7 2.00 628.8681.6 1.00 655.2 0.99 625.4680.6 0.571 654.1 0.898 625.1680.3

Table 3Compressed liquid densities of 2-butanol. Values extrapolated to saturation pressure as given in [12] are indicated in italics.
270 K 290 K 310 K 330 K 350 K 370 K
PressurepMPa
Densityρkg m−3
PressurepMPa
Densityρkg m−3
PressurepMPa
Densityρkg m−3
PressurepMPa
Densityρkg m−3
PressurepMPa
Densityρkg m−3
PressurepMPa
Densityρkg m−3
50.00 853.0 49.97 840.4 50.04 827.6 50.01 813.0 50.02 797.5 50.01 781.145.01 850.5 45.00 837.7 45.01 824.6 45.01 809.8 45.01 794.0 45.01 777.340.01 848.0 40.01 834.9 40.01 821.6 40.00 806.5 40.01 790.4 40.01 773.335.01 845.3 35.01 832.1 35.01 818.6 35.01 803.1 35.02 786.7 35.01 769.130.02 842.6 30.00 829.1 30.01 815.4 30.01 799.6 30.00 782.8 30.01 764.725.01 839.8 25.00 826.1 25.00 812.0 25.01 795.9 25.01 778.6 24.99 760.120.01 836.9 20.01 822.9 20.01 808.6 20.00 792.1 20.01 774.3 20.01 755.215.01 833.9 15.01 819.7 15.02 804.9 15.00 788.0 15.01 769.7 15.01 749.910.01 830.8 10.00 816.3 10.00 801.1 10.01 783.7 10.00 764.8 10.01 744.35.01 827.6 5.00 812.7 5.00 797.1 5.00 779.2 5.01 759.6 5.01 738.24.00 826.9 4.01 812.0 4.00 796.3 4.00 778.3 4.00 758.5 4.01 736.93.00 826.3 3.00 811.2 3.01 795.5 3.01 777.3 3.01 757.4 3.01 735.62.01 825.6 2.01 810.5 2.01 794.6 2.01 776.3 2.01 756.3 2.01 734.21.01 824.9 1.00 809.7 1.00 793.8 1.01 775.3 1.00 755.1 1.00 732.90.51 824.6 0.50 809.3 0.50 793.3 0.51 774.8 0.50 754.5 0.50 732.22.63×10−4 824.2 1.32×10⁻³ 808.9 5.03×10⁻³ 792.9 1.55×10⁻² 774.4 4.04×10⁻² 754.0 9.10×10⁻² 731.6
390 K 410 K 430 K 450 K 470 K
PressurepMPa
Densityρkg m−3
PressurepMPa
Densityρkg m−3
PressurepMPa
Densityρkg m−3
PressurepMPa
Densityρkg m−3
PressurepMPa
Densityρkg m−3
50.00 764.1 50.02 746.6 50.00 728.7 50.02 710.5 50.03 692.745.01 759.8 45.01 741.9 45.01 723.6 45.00 704.8 45.01 686.340.01 755.4 40.01 737.0 40.01 718.1 40.02 698.7 40.02 679.635.01 750.8 35.02 731.8 35.01 712.3 35.00 692.1 35.00 672.130.02 745.9 30.02 726.3 30.01 706.0 30.02 685.0 30.01 664.125.02 740.6 25.02 720.3 25.00 699.2 25.01 677.2 25.01 655.120.01 735.0 20.02 713.9 20.00 691.7 20.01 668.6 20.02 645.115.01 729.0 15.01 706.9 15.01 683.5 15.00 658.8 15.01 633.410.01 722.4 10.00 699.1 10.01 674.2 10.01 647.5 10.01 619.45.00 715.2 5.01 690.4 5.01 663.5 5.00 634.0 5.01 601.74.00 713.7 4.01 688.5 4.01 661.1 4.02 630.9 4.01 597.43.01 712.1 3.01 686.6 3.01 658.6 3.50 629.3 3.52 595.12.00 710.5 2.01 684.6 2.00 656.0 3.00 627.6 3.00 592.71.01 708.9 1.00 682.5 1.00 653.4 2.51 625.9 2.51 590.20.51 708.0 0.51 681.4 0.50 652.0 2.00 624.1 2.00 587.60.183 707.5 0.334 681.1 0.565 652.2 1.51 622.3 1.51 584.9
1.008 620.4 1.36 584.20.898 620.1
Fig. 4. Measured compressed liquid and ambient pressure densities of 1-butanol as afunction of temperature.
54 S.L. Outcalt et al. / Journal of Molecular Liquids 151 (2010) 50–59
another as well as to literature data, particularly at low reducedtemperatures. It is common practice when the Rackett equation isused, to constrain β3 to the critical temperature of the fluid for whichthe correlation is being performed. We constrained the β3 values tothe critical temperatures in the DIPPR database [12], namely, for 1-butanol and 2-butanol, 563.1 K and 535.9 K, respectively. Thecorrelation parameters for the Rackett equations are listed inTable 5. In Figs. 8 and 9 our Rackett correlations for 1-and 2-butanol,respectively, serve as the baseline to compare our ambient pressureand extrapolated density values, as well as the DIPPR correlation ofdensities, and the TDE [13] correlation of saturated liquid densities.The DIPPR correlation includes densities measured at one atmo-sphere for temperatures below the normal boiling point, anddensities at saturation pressure for temperatures above the normalboiling point.
There is an abundance of ambient pressure and saturated liquiddensity data in the literature for both 1-and 2-butanol, and the scatter inthe data is substantial. For the purpose of comparison, the DIPPR andTDE database correlations are considered to represent the majority ofthe available literature data. It can be seen in both Figs. 8 and 9 that theTDE correlation agreeswellwith our data, but that theDIPPR correlation(alsoaRackett equation)doesnot. In fact, it canbeargued that theDIPPRcorrelation does not agree well with the data used in its veryformulation. Although not shown here, the deviations of that data

Fig. 5. Measured compressed liquid and ambient pressure densities of 2-butanol as afunction of temperature.
Table 4Parameters of the sound speed correlation (Eq. (2)), for 1- and 2-butanol at an ambientpressure of 83 kPa.
Parameter Value Std. dev.
1-butanolΑ1 2408.8 12.5Α2/K −4.447 0.080Α3/K2 0.00177 0.00013
2-butanolΑ1 2099.8 13.3Α2/K −2.337 0.086Α3/K2 −0.00215 0.00014
Fig. 6. Comparison of the speed of sound data of 1-butanol reported in this work and inthe literature at ambient pressure relative to the correlation, Eq. (2).
Fig. 7. Comparison of the speed of sound data of 2-butanol reported in this work and inthe literature at ambient pressure relative to the correlation, Eq. (2).
Table 5Parameters of the Racket correlations (Eq. (3)) for 1- and 2-butanol.
Parameter Value
1-butanolβ1/kg m−3 9.92×10⁻²
β2 1.01×10⁻²
β3/K 563.1 (constrained)β4 5.66×10⁻²
2-butanolβ1/kg m−3 1.08×10⁻³
β2 1.05×10⁻³
β3/K 535.9 (constrained)β4 3.80×10⁻²
55S.L. Outcalt et al. / Journal of Molecular Liquids 151 (2010) 50–59
from the DIPPR correlation are similar in sign and magnitude to thedeviations observed with our data. Thus, our data generally agree withthe literature data referenced in the DIPPR database but not with itsrepresentative Rackett correlation. This is an indication that the Rackett
Fig. 8. Comparison of ambient pressure and extrapolated 1-butanol density datareported in this work with saturated liquid density correlations in the literature relativeto the correlation, Eq. (3).

Fig. 9. Comparison of ambient pressure and extrapolated 2-butanol density datareported in this work with saturated liquid density correlations in the literature relativeto the correlation, Eq. (3).
Fig. 10. Deviations of measured compressed liquid densities of 1-butanol from the Taitcorrelation (Eqs. (4)–(6)) as a function of pressure.
56 S.L. Outcalt et al. / Journal of Molecular Liquids 151 (2010) 50–59
equation may not be the best choice for correlating alcohol densities,particularly at high reduced temperatures. This later point is corrobo-rated in the recent work of Lai et al. [92].
The reported compressed liquid density results were correlatedwith a Tait equation similar to that of Dymond and Malhotra [93]. Theequation used to fit the compressed liquid density data is
ρðT;pÞ = ρref ðT ;pref Þ1−C ln p + BðTÞ
pref + BðTÞ� � ; ð4Þ
Table 6Parameters of the polynomial correlation (Eq. (5)), for the saturated liquid densitiesthat have been derived from extrapolating the isothermal compressed liquid densitiesof 1- and 2-butanol to saturation pressure from 270 K to 470 K.
Parameter Value
1-butanolD1 448.77183D2 1298.77857D3 −1511.08340D4 583.77972D5 406.58208
2-butanolD1 431.90443D2 1508.90032D3 −2575.93025D4 3361.54274D5 −2193.28711
Table 7Parameters of the Tait correlation (Eqs. (4) and (6)) for the density of 1- and 2- butanol.
Parameter Value Std. dev.
1-butanolC 8.4917×10⁻² 0.0096×10⁻²
E1 305.38 0.49E2 −250.50 0.53E3 47.38 0.16
2-butanolC 8.3979×10⁻² 0.0039×10⁻²
E1 382.27 0.25E2 −367.87 0.27E3 87.243 0.080
where pref is the vapor pressure according to the DIPPR correlation,and ρref(T) is derived from a fourth order polynomial fit of theisothermal compressed liquid density data that were extrapolated tothe vapor pressure as given in Tables 2 and 3. The correlation equationfor the extrapolated saturated liquid densities is
ρsat = D1 + D2τ + D3τ2 + D4τ
3 + D5τ4; ð5Þ
where τ=1−T/Tc and the parameters are listed in Table 6. Thetemperature dependence of the Tait parameters B(T) was expressedby the quadratic polynomial,
BðTÞ = E1 + E2Tr + E3T2r ð6Þ
where Tr is the absolute temperature T divided by 273.15 K.Parameters for the Tait correlations are given in Table 7. Thecorrelations represent our 1- and 2-butanol data with AADs of0.029% and 0.019%, respectively. Deviations of our measuredcompressed liquid densities from our Tait correlations for 1- and 2-butanol are shown in Figs. 10 and 11. These figures illustrate that theTait equations for 1- and 2-butanol fit our data within the overall
Fig. 11. Deviations of measured compressed liquid densities of 2-butanol from the Taitcorrelation (Eqs. (4)–(6)) as a function of pressure.

57S.L. Outcalt et al. / Journal of Molecular Liquids 151 (2010) 50–59
combined uncertainty of 0.12%. and 0.14%, respectively. A search ofthe literature for compressed liquid density data resulted in 11sources for 1-butanol [94–104] and three for 2-butanol [99,104,105].Figs. 12a,b, 13a, and b show deviations of literature values ofcompressed liquid density data from our Tait equations as a functionof pressure and temperature for 1- and 2-butanol, respectively. Again,
Fig. 12. a. Deviations of literature data for the density of compressed liquid 1-butanol from thfor the density of compressed liquid 1-butanol from the Tait correlation (Eqs. (4)–(6)) as a
there is a fair amount of scatter in the literature data and in general,our data lie in the middle of that scatter. No 2-butanol compressedliquid density data were found in the literature at temperatures above362 K.
Data reported here show significant differences between thedensities and speeds of sound between 1- and 2-butanol. These
e Tait correlation (Eqs. (4)–(6)) as a function of pressure. b. Deviations of literature datafunction of temperature.

Fig. 13. a. Deviations of literature data for the density of compressed liquid 2-butanol from the Tait correlation (Eqs. (4)–(6)) as a function of pressure. b. Deviations of literature datafor the density of compressed liquid 2-butanol from the Tait correlation (Eqs. (4)–(6)) as a function of temperature.
58 S.L. Outcalt et al. / Journal of Molecular Liquids 151 (2010) 50–59
differences are indicative of the differences in the molecular shapeand charge distribution of the isomers. At the lowest measuredtemperature of 270 K the higher density of 1-butanol is consistentwith the difference in shape from 2-butanol. Fig. 1 shows that 1-butanol molecules can be packed with less void volume than 2-butanol molecules. The temperature dependence of the densitydifference between the two isomers indicates differences in polarattractions. The density of 2-butanol decreases faster with tempera-ture than that of 1-butanol as a result of lower attractive forces in the
secondary alcohol due to the different shape and charge distributioncompared to the primary alcohol.
Literature surveys of the speed of sound and density data of 1- and2-butanol showed significant scatter as well as gaps, particularly for 2-butanol. The speed of sound data reported here extend the range ofavailable data from 318 K to 343 K for both 1- and 2-butanol.Compressed liquid density data for 2-butanol reported here extendthe range of available data from 363 K to 470 K. Differences in samplepurity likely contribute to the scatter seen in the literature data;

59S.L. Outcalt et al. / Journal of Molecular Liquids 151 (2010) 50–59
butanols are hygroscopic and it is therefore difficult to keep samplesfree of water, and very pure (better than 99.5%) samples of 1-and 2-butanol are not readily commercially available or are prohibitivelyexpensive. Our measurements are consistent with previously pub-lished data, generally falling in the middle of the scatter, and thusidentifying data that are clear outliers.
Acknowledgements
We acknowledge our NIST colleagues Dr. Thomas Bruno for theanalyses of the 2-butanol samples used in the compressed liquiddensitymeasurements and Dr. Jason Widegren for Karl Fischer analyses of allthe samples.
References
[1] S. Outcalt, A. Laesecke, M.B. Freund, Energy Fuels 23 (2009) 1626.[2] S.L. Outcalt, A. Laesecke, K. Brumbeck, J. Propuls. Power 25 (2009) 1032.[3] A. Laesecke, S.L. Outcalt, K. Brumbeck, Energy Fuels 22 (2008) 2629.[4] S. Outcalt, A. Laesecke, T.J. Fortin, J. Chem. Thermodyn. (submitted for publication).[5] D.E. Ramey, “Butanol: the other alternative fuel”, presented at NABC 19: Agricultural
Biofuels: Technology, Sustainability andProfitability, S. Dakota StateUniversity, 2007.[6] J.L. Smith, J.P. Workman, “Alcohol for Motor Fuels,”, Colorado State University
Extension, Farm & Ranch Series: Equipment, 2004.[7] W.J. Hehre, A Guide to Molecular Mechanics and Quantum Chemical Calculations,
Wavefunction, Inc., Irvine, CA, 2003.[8] R.J. Gillespie, P.L.A. Popelier, Chemical Bonding and Molecular Geometry: From
Lewis to Electron Densities, Oxford University Press, New York, 2001.[9] B.E. Poling, J.M. Prausnitz, J.P. O'Connell, The Properties of Gases and Liquids. 5 ed,
McGraw-Hill, New York, 2001.[10] S.L. Outcalt, M.O. McLinden, Ind. Eng. Chem. Res. 46 (2007) 8264.[11] M.O. McLinden, J.D. Splett, J. Res. Natl. Inst. Stand. Technol. 113 (2008) 29.[12] R.L. Rowley, W.V. Wilding, J.L. Oscarson, “DIPPR Project 801 Data Compilation of
Pure Compound Properties,”, AIChE Design Institute for Physical Properties,New York, March 2007, 2007, http://DIPPR.BYU.Edu.
[13] M. Frenkel, R.D. Chirico, V. Diky, C. Muzny, E.W. Lemmon, X. Yan, Q. Dong, “NISTStandard Reference Database 103 — ThermoData Engine Databases”, NationalInstitute of Standards and Technology, Standard Reference Data Program, Gaithers-burg,Maryland20899,USA,2.0, 2007, http://www.nist.gov/srd/WebGuide/nist103/103v2.htm.
[14] W. Schaffs, Z. Phys. Chem. (Leipzig) 194 (1944) 28.[15] N.I. Larionov, Russ. J. Phys. Chem. A 27 (1953) 1002.[16] S. Parthasarathy, N.N. Bakhshi, Indian J. Phys. 27 (1953) 73.[17] S. Prakash, S.B. Srivastav, J. Chem. Thermodyn. 7 (1975) 997.[18] K. Subramanyam Reddy, P.R. Naidu, J. Chem. Thermodyn. 8 (1976) 1208.[19] O. Kiyohara, G.C. Benson, J. Chem. Thermodyn. 11 (1979) 861.[20] G.R. Naidu, P.R. Naidu, Indian J. Pure Appl. Phys. 20 (1982) 313.[21] M.R. Islam, S.K. Quadri, Acoust. Lett. 8 (1985) 166.[22] S.N. Gour, J.S. Tomar, R.P. Varma, Indian J. Pure Appl. Phys. 24 (1986) 602.[23] T.M. Aminabhavi, M.I. Aralaguppi, S.B. Harogoppad, R.H. Balundgi, J. Chem. Eng.
Data 38 (1993) 31.[24] T.M. Aminabhavi, S.K. Raikar, J. Chem. Eng. Data 38 (1993) 310.[25] C. Lafuente, J. Pardo, J. Santafe, F.M. Royo, J.S. Urieta, J. Chem. Thermodyn. 27 (1995)
541.[26] V.K. Reddy, K. Rambabu, T. Devarajulu, A. Krishnaiah, J. Chem. Eng. Data 40 (1995)
124.[27] J. Rajasekar, P.R. Naidu, J. Chem. Eng. Data 41 (1996) 373.[28] N.V. Sastry, M.K. Valand, J. Chem. Eng. Data 41 (1996) 1421.[29] J.R. Sekar, P.R. Naidu, J. Chem. Eng. Data 41 (1996) 170.[30] M. Dominguez, M.C. Lopez, J. Santafe, F.M. Royo, J.S. Urieta, J. Chem. Thermodyn.
29 (1997) 99.[31] J. Nath, J. Chem. Thermodyn. 29 (1997) 853.[32] T.M. Aminabhavi, V.B. Patil, J. Chem. Eng. Data 43 (1998) 504.[33] B.E. de Cominges, M.M. Pineiro, T.P. Iglesias, J.L. Legido, M.I. Paz Andrade, J. Chem.
Thermodyn. 30 (1998) 1147.[34] J. Nath, J. Chem. Thermodyn. 30 (1998) 885.[35] S.L. Oswal, K.D. Prajapati, J. Chem. Eng. Data 43 (1998) 367.[36] T.M. Aminabhavi, V.B. Patil, K. Banerjee, J. Chem. Eng. Data 44 (1999) 1291.[37] M.I. Aralaguppi, C.V. Jadar, T.M. Aminabhavi, J. Chem. Eng. Data 44 (1999) 216.[38] A. Arce, E. Rodil, A. Soto, J. Chem. Eng. Data 44 (1999) 1028.[39] A. Ali, K. Tewari, A.K. Nain, V. Chakravortty, Phys. Chem. Liq. 38 (2000) 459.[40] J. Canosa, A. Rodriguez, J. Tojo, J. Chem. Eng. Data 45 (2000) 471.[41] M. Dominguez, C. Lafuente, M.C. Lopez, F.M. Royo, J.S. Urieta, J. Chem. Thermodyn.
32 (2000) 155.[42] G.Ritzoulis, D.Missopolinou, S.Doulami, C. Panayioton, J. Chem. Eng.Data45 (2000)
636.
[43] N.V. Sastry, S.R. Patel, Int. J. Thermophys. 21 (2000) 1153.[44] J. Troncoso, E. Carballo, C.A. Cerdeirina, D. Gonzalez, L. Romani, J. Chem. Eng. Data
45 (2000) 594.[45] A. Acre, E. Rodil, A. Soto, J. Chem. Eng. Data 46 (2001) 962.[46] E. Mascato, L. Mosteiro, M.M. Pineiro, J. Garcia, T.P. Iglesias, J.L. Legido, J. Chem.
Thermodyn. 33 (2001) 269.[47] A. Rodriguez, J. Canosa, J. Tojo, J. Chem. Eng. Data 46 (2001) 1476.[48] A. Rodriguez, J. Canosa, J. Tojo, J. Chem. Eng. Data 46 (2001) 1506.[49] J. Troncoso, C.A. Tovar, C.A. Cerdeirina, E. Carballo, L. Romani, J. Chem. Eng. Data
46 (2001).[50] I. Gascon, H. Artigas, C. Lafuente, M.C. Lopez, F.M. Royo, Fluid Phase Equilib.
202 (2002) 385.[51] J. George, N.V. Sastry, S.R. Patel, M.K. Valand, J. Chem. Eng. Data 47 (2002) 262.[52] J. Nath, J. Chem. Thermodyn. 34 (2002) 1857.[53] A. Valen, I. Gascon, C. Lafuente, J.S. Urieta, F.M. Royo, M. Postigo, Int. J. Thermophys.
23 (2002) 1587.[54] A. Valen, M.C. Lopez, J.S. Urieta, F.M. Royo, C. Lafuente, J. Mol. Liq. 95 (2002) 157.[55] P. Bahadur, N.V. Sastry, Int. J. Thermophys. 24 (2003) 447.[56] I. Gascon, B. Giner, S. Martin, P. Cea, H. Artigas, Fluid Phase Equilib. 211 (2003) 61.[57] B. Giner, H. Artigas, A. Carrion, C. Lafuente, F.M. Royo, J. Mol. Liq. 108 (2003) 303.[58] M.M. Pineiro, E. Mascato, L. Mosteiro, J.L. Legido, J. Chem. Eng. Data 48 (2003) 758.[59] S.L.Oswal, K.D. Prajapati,N.Y.Ghael, S.P. Ijardar, Fluid Phase Equilib. 218 (2004)131.[60] V.K. Rattan, S. Singh, B.P.S. Sethi, J. Chem. Eng. Data 49 (2004) 1074.[61] J. Troncoso, J.L. Valencia, M. Souto-Caride, D. Gonzalez-Salgado, J. Peleteiro,
J. Chem. Eng. Data 49 (2004) 1789.[62] C. Valles, E. Perez, M. Cardoso, M. Dominguez, A.M. Mainar, J. Chem. Eng. Data 49
(2004) 1460.[63] A. Ali, S. Hyder, M. Tariq, Int. J. Thermophys. 26 (2005) 1537.[64] J.G. Baragi, M.I. Aralaguppi, T.M. Aminabhavi, M.Y. Kariduraganavar, S.S. Kulkarni,
J. Chem. Eng. Data 50 (2005) 917.[65] M. Haro, I. Gascon, P. Cea, C. Lafuente, F.M. Royo, J. Therm. Anal. Calorim. 79 (2005)
51.[66] G. Savaroglu, E. Aral, Int. J. Thermophys. 26 (2005) 1525.[67] N.G. Tsierkezos, I.E. Molinou, A.C. Filippou, J. Solution Chem. 34 (2005) 1371.[68] M.I. Aralaguppi, J.G. Baragi, J. Chem. Thermodyn. 38 (2006) 434.[69] B. Gonzalez, A. Dominguez, J. Tojo, J. Chem. Thermodyn. 38 (2006) 1172.[70] U.B. Kadam, A.P. Hiray, A.B. Sawant,M. Hasan, J. Chem. Thermodyn. 38 (2006) 1675.[71] U.B. Kadam, A.P. Hiray, A.B. Sawant, M. Hasan, J. Chem. Eng. Data 50 (2006) 60.[72] E. Langa, A.M. Mainar, J.I. Pardo, J.S. Urieta, J. Chem. Eng. Data 51 (2006) 392.[73] V. Mutalik, L.S. Manjeshwar, M. Sairam, T.M. Aminabhavi, J. Chem. Thermodyn.
38 (2006) 1620.[74] M.N. Roy, A. Sinha, Fluid Phase Equilib. 243 (2006) 133.[75] C. Valles, E. Perez, A.M. Mainar, J. Santafe, M. Dominguez, J. Chem. Eng. Data
51 (2006) 1105.[76] P. Venkatesu, G.C. Sekhar, M.V.P. Rao, Phys. Chem. Liq. 44 (2006) 287.[77] B. Gonzalez, N. Calvar, A. Dominguez, J. Tojo, J. Chem. Thermodyn. 39 (2007) 322.[78] E. Mascato, A. Mariano, M.M. Pineiro, J.L. Legido, A.M.I. Paz, J. Chem. Thermodyn.
39 (2007) 1247.[79] I.Mozo, I.G. de la Fuente, J.A. Gonzalez, J.C. Cobos, J. Chem. Eng. Data 52 (2007) 2086.[80] A.K. Nain, T. Srivastava, J.D. Pandey, S. Gopal, J. Mol. Liq. 149 (2009) 9.[81] T.O.H. Okano, S. Murakami, Can. J. Chem. 66 (1988) 713.[82] K.Mohan Krishnan, K. Ramababu, D. Ramachandran, P. Venkateswarlu, G.K. Raman,
Fluid Phase Equilib. 105 (1995) 109.[83] D. Venkatesulu, P. Venkatesu,M.V. Prabhakara Rao, Phys. Chem. Liq. 32 (1996) 127.[84] M. Dominguez, H. Artigas, P. Cea, M.C. Lopez, J.S. Urieta, J. Mol. Liq. 88 (2000) 243.[85] A. Rodriguez, J. Canosa, J. Tojo, J. Chem. Eng. Data 46 (2001) 1476.[86] M. Dominguez, S. Martin, J. Santafe, H. Artigas, F.M. Royo, Thermochim. Acta
381 (2002) 181.[87] N.V. Sastry, J. George, Int. J. Thermophys. 24 (2003) 1089.[88] A.Valen, I.Gascon,C. Lafuente,M.C. Lopez, F.M. Royo, Phys. Chem. Liq. 41 (2003) 239.[89] I.Gascon,M.C. Lopez, C. Lafuente, F.M.Royo, P. Cea, Thermochim.Acta 423 (2004)49.[90] B. Gonzalez, A. Dominguez, J. Tojo, J. Chem. Thermodyn. 36 (2004) 267.[91] P.G.Kumari, G.C. Sekhar, K. Ramamohan,M.V.P. Rao, Phys. Chem. Liq. 44 (2006)701.[92] N.A. Lai, M. Wendland, J. Fischer, Fluid Phase Equilib. 280 (2009) 30.[93] J.H. Dymond, R. Malhotra, Int. J. Thermophys. 9 (1988) 941.[94] I.F. Golubev, E.N. Bagina, Tr. GIAP (1963) 39.[95] T.N. Vasilkovskaya, I.F. Golubev, V.S. Zolin, Tr. GIAP 54 (1979) 15.[96] I.F. Golubev, T.N. Vasilkovskaya, V.S. Zolin, Inzh.-Fiz. Zh. 38 (1980) 668.[97] H.J. Albert, J.A. Gates, R.H. Wood, J.-P.E. Grolier, Fluid Phase Equilib. 20 (1985) 321.[98] J.A. Gates, R.H. Wood, J.C. Cobos, C. Casanova, A.H. Roux, G. Roux-Desgranges, J.-P.E.
Grolier, Fluid Phase Equilib. 27 (1986) 137.[99] H. Kubota, Y. Tanaka, T. Makita, Int. J. Thermophys. 8 (1987) 47.[100] D.P.C. Papaioannou, J. Chem. Eng. Data 40 (1995) 202.[101] P.B.M. Ulbig, S. Schulz, J. Chem. Eng. Data 42 (1997) 449.[102] B.M. Westwood, V.N. Kabadi, J. Chem. Thermodyn. 35 (2003) 1965.[103] A. Zuniga-Moreno, L.A. Galicia-Luna, L.E. Camacho-Camacho, J. Chem. Thermodyn.
39 (2007) 254.[104] A. Zuniga-Moreno, L.A.Galicia-Luna, S.I. Sandler, J. Chem. Eng.Data552(2007)1960.[105] B.P.G.H. Sahli, A.J. Richard, J. Chem. Thermodyn. 8 (1976) 179.