Nag Hammadi Codex II,2-7, together with XIII, 2 Brit. Lib. Or ...
Upload
independentCategory
view
2download
0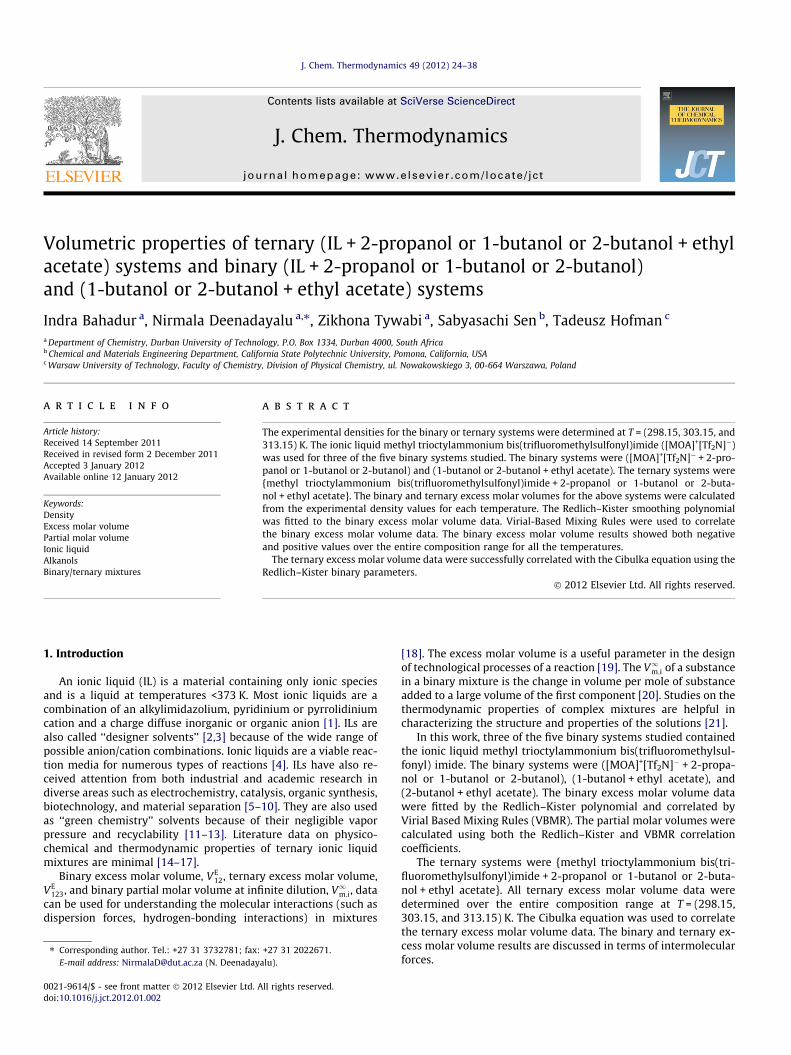
J. Chem. Thermodynamics 49 (2012) 24–38
Contents lists available at SciVerse ScienceDirect
J. Chem. Thermodynamics
journal homepage: www.elsevier .com/locate / jc t
Volumetric properties of ternary (IL + 2-propanol or 1-butanol or 2-butanol + ethylacetate) systems and binary (IL + 2-propanol or 1-butanol or 2-butanol)and (1-butanol or 2-butanol + ethyl acetate) systems
Indra Bahadur a, Nirmala Deenadayalu a,⇑, Zikhona Tywabi a, Sabyasachi Sen b, Tadeusz Hofman c
a Department of Chemistry, Durban University of Technology, P.O. Box 1334, Durban 4000, South Africab Chemical and Materials Engineering Department, California State Polytechnic University, Pomona, California, USAc Warsaw University of Technology, Faculty of Chemistry, Division of Physical Chemistry, ul. Nowakowskiego 3, 00-664 Warszawa, Poland
a r t i c l e i n f o
Article history:Received 14 September 2011Received in revised form 2 December 2011Accepted 3 January 2012Available online 12 January 2012
Keywords:DensityExcess molar volumePartial molar volumeIonic liquidAlkanolsBinary/ternary mixtures
0021-9614/$ - see front matter � 2012 Elsevier Ltd. Adoi:10.1016/j.jct.2012.01.002
⇑ Corresponding author. Tel.: +27 31 3732781; fax:E-mail address: [email protected] (N. Deenaday
a b s t r a c t
The experimental densities for the binary or ternary systems were determined at T = (298.15, 303.15, and313.15) K. The ionic liquid methyl trioctylammonium bis(trifluoromethylsulfonyl)imide ([MOA]+[Tf2N]�)was used for three of the five binary systems studied. The binary systems were ([MOA]+[Tf2N]� + 2-pro-panol or 1-butanol or 2-butanol) and (1-butanol or 2-butanol + ethyl acetate). The ternary systems were{methyl trioctylammonium bis(trifluoromethylsulfonyl)imide + 2-propanol or 1-butanol or 2-buta-nol + ethyl acetate}. The binary and ternary excess molar volumes for the above systems were calculatedfrom the experimental density values for each temperature. The Redlich–Kister smoothing polynomialwas fitted to the binary excess molar volume data. Virial-Based Mixing Rules were used to correlatethe binary excess molar volume data. The binary excess molar volume results showed both negativeand positive values over the entire composition range for all the temperatures.
The ternary excess molar volume data were successfully correlated with the Cibulka equation using theRedlich–Kister binary parameters.
� 2012 Elsevier Ltd. All rights reserved.
1. Introduction
An ionic liquid (IL) is a material containing only ionic speciesand is a liquid at temperatures <373 K. Most ionic liquids are acombination of an alkylimidazolium, pyridinium or pyrrolidiniumcation and a charge diffuse inorganic or organic anion [1]. ILs arealso called ‘‘designer solvents’’ [2,3] because of the wide range ofpossible anion/cation combinations. Ionic liquids are a viable reac-tion media for numerous types of reactions [4]. ILs have also re-ceived attention from both industrial and academic research indiverse areas such as electrochemistry, catalysis, organic synthesis,biotechnology, and material separation [5–10]. They are also usedas ‘‘green chemistry’’ solvents because of their negligible vaporpressure and recyclability [11–13]. Literature data on physico-chemical and thermodynamic properties of ternary ionic liquidmixtures are minimal [14–17].
Binary excess molar volume, VE12, ternary excess molar volume,
VE123, and binary partial molar volume at infinite dilution, V1m;i, data
can be used for understanding the molecular interactions (such asdispersion forces, hydrogen-bonding interactions) in mixtures
ll rights reserved.
+27 31 2022671.alu).
[18]. The excess molar volume is a useful parameter in the designof technological processes of a reaction [19]. The V1m;i of a substancein a binary mixture is the change in volume per mole of substanceadded to a large volume of the first component [20]. Studies on thethermodynamic properties of complex mixtures are helpful incharacterizing the structure and properties of the solutions [21].
In this work, three of the five binary systems studied containedthe ionic liquid methyl trioctylammonium bis(trifluoromethylsul-fonyl) imide. The binary systems were ([MOA]+[Tf2N]� + 2-propa-nol or 1-butanol or 2-butanol), (1-butanol + ethyl acetate), and(2-butanol + ethyl acetate). The binary excess molar volume datawere fitted by the Redlich–Kister polynomial and correlated byVirial Based Mixing Rules (VBMR). The partial molar volumes werecalculated using both the Redlich–Kister and VBMR correlationcoefficients.
The ternary systems were {methyl trioctylammonium bis(tri-fluoromethylsulfonyl)imide + 2-propanol or 1-butanol or 2-buta-nol + ethyl acetate}. All ternary excess molar volume data weredetermined over the entire composition range at T = (298.15,303.15, and 313.15) K. The Cibulka equation was used to correlatethe ternary excess molar volume data. The binary and ternary ex-cess molar volume results are discussed in terms of intermolecularforces.
N+
CH3
(CH2)7CH3
(CH2)7CH3
H3C(H2C)7 N
S
O
O
S
O
CF3O
CF3
FIGURE 1. Structure of the IL, {methyl trioctylammonium bis(trifluoromethyl-sulfonyl)imide}.
I. Bahadur et al. / J. Chem. Thermodynamics 49 (2012) 24–38 25
This work is a continuation of our research group’s work onthermodynamic properties of ILs [22–26]. The structure of the io-nic liquid used in this work is presented in figure 1.
2. Experimental
2.1. Materials
The chemicals, suppliers, purity, literature and experimentaldensities (q) are given in table 1. The density of the pure liquids
TABLE 1Pure compound specifications for supplier, purity, literature, and experimental densities a
Compound Supplier Mole fraction purity
2-Propanol BDH 0.9971-Butanol BDH 0.9982-Butanol Fulka 0.995[MOA]+[Tf2N]� Solvent innovation 0.980Ethyl acetate Fluka 0.997
a Reference [30].b Reference [29].c Reference [26].d Reference [38].
TABLE 2Binary densities and excess molar volumes for the {ionic liquid (x1) + 2-propanol (x2)} at T
x1 q/(g � cm�3) VE12/(cm3 �mol�1)
{[MOA]+[Tf2N]� (x1) +
T = 298.10.0530 0.8769 0.1910.1000 0.9326 �0.2790.2045 1.0049 �1.4560.2841 1.0338 �1.6810.3934 1.0562 �1.079
T = 303.10.0530 0.8730 0.1770.1000 0.9289 �0.3240.2045 1.0015 �1.5640.2841 1.0303 �1.7760.3934 1.0526 �1.148
T = 313.10.0530 0.86510.1000 0.9213 �0.3760.2045 0.9947 �1.7780.2841 1.0233 �1.9710.3934 1.0451 �1.218
were determined at T = (298.15, 303.15, and 313.15) K and atatmospheric pressure. The molar mass of the IL is 648.85 g �mol�1.The ionic liquid {methyl trioctylammonium bis (trifluoromethyl-sulfonyl)imide [MOA] + [Tf2N]�}, 2-propanol, 1-butanol, 2-butanoland ethyl acetate were used without any further purification. Thewater content in the IL was obtained with a Karl–Fischer Coulome-ter [Metrohm 831] and the mass per cent water content was foundto be 0.04.
2.2. Experimental procedure and apparatus
The densities were measured using an Anton Paar DMA 38vibrating U-tube densimeter. The densimeter consists of a built-in thermostat controller capable of maintaining temperature pre-cisely to ±0.01 K and measuring density to ±0.0001 g � cm�3. Themixtures were prepared by transferring via syringe the pure liq-uids into stoppered bottles to prevent evaporation, using anOHAUS mass balance for the exact masses of each component.The mass balance has a precision of 0.0001 g. The uncertaintyin the mole fraction is 0.0006. The mixtures were shaken in orderto ensure complete homogeneity of the compounds, since the io-nic liquid is slightly viscous. To avoid formation of bubbles insidethe vibrating tube of the densimeter, injections were done slowly.For a different temperature, the instrument had to be switchedoff and reset to the required temperature with the solution in
t T = (298.15, 303.15, and 313.15) K.
q/(g � cm�3)
Temperature/K
Literature Experimental
298.15 298.15 303.15 313.15
0.78087a 0.7812 0.7772 0.76940.80575b 0.8070 0.8037 0.79670.8024a 0.8028 0.7988 0.79111.1093c 1.1069 1.1032 1.095770.8948d 0.8948 0.8886 0.8752
= (298.15, 303.15, and 313.15) K.
x1 q/(g � cm�3) VE12/(cm3 �mol�1)
2-propanol (x2)}
5 K0.4824 1.0676 �0.2710.5896 1.0789 0.2570.7066 1.0890 0.4290.7967 1.0952 0.5050.8960 1.1005 0.734
5 K0.4824 1.0639 �0.3040.5896 1.0752 0.2340.7066 1.0854 0.3740.7967 1.0916 0.4520.8960 1.0969 0.683
5 K0.4824 1.0566 �0.4170.5896 1.0681 0.0560.7066 1.0783 0.1880.7967 1.0844 0.3040.8960 1.0895 0.633
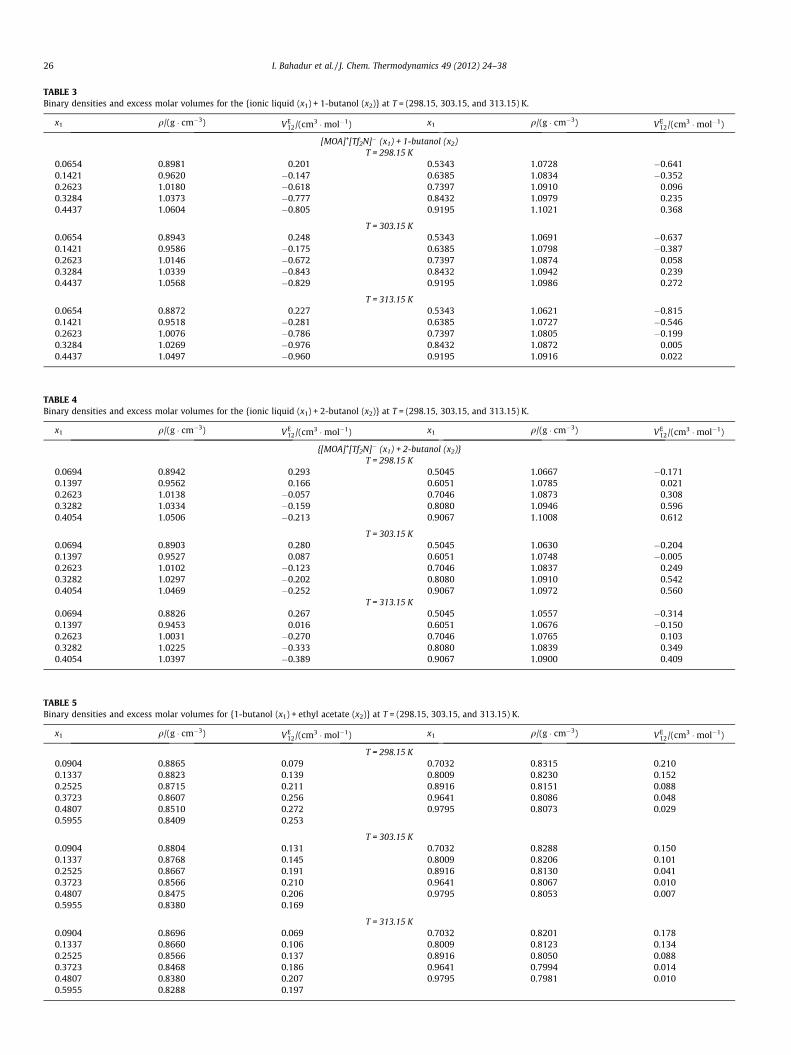
TABLE 3Binary densities and excess molar volumes for the {ionic liquid (x1) + 1-butanol (x2)} at T = (298.15, 303.15, and 313.15) K.
x1 q/(g � cm�3) VE12/(cm3 �mol�1) x1 q/(g � cm�3) VE
12/(cm3 �mol�1)
[MOA]+[Tf2N]� (x1) + 1-butanol (x2)T = 298.15 K
0.0654 0.8981 0.201 0.5343 1.0728 �0.6410.1421 0.9620 �0.147 0.6385 1.0834 �0.3520.2623 1.0180 �0.618 0.7397 1.0910 0.0960.3284 1.0373 �0.777 0.8432 1.0979 0.2350.4437 1.0604 �0.805 0.9195 1.1021 0.368
T = 303.15 K0.0654 0.8943 0.248 0.5343 1.0691 �0.6370.1421 0.9586 �0.175 0.6385 1.0798 �0.3870.2623 1.0146 �0.672 0.7397 1.0874 0.0580.3284 1.0339 �0.843 0.8432 1.0942 0.2390.4437 1.0568 �0.829 0.9195 1.0986 0.272
T = 313.15 K0.0654 0.8872 0.227 0.5343 1.0621 �0.8150.1421 0.9518 �0.281 0.6385 1.0727 �0.5460.2623 1.0076 �0.786 0.7397 1.0805 �0.1990.3284 1.0269 �0.976 0.8432 1.0872 0.0050.4437 1.0497 �0.960 0.9195 1.0916 0.022
TABLE 4Binary densities and excess molar volumes for the {ionic liquid (x1) + 2-butanol (x2)} at T = (298.15, 303.15, and 313.15) K.
x1 q/(g � cm�3) VE12/(cm3 �mol�1) x1 q/(g � cm�3) VE
12/(cm3 �mol�1)
{[MOA]+[Tf2N]� (x1) + 2-butanol (x2)}T = 298.15 K
0.0694 0.8942 0.293 0.5045 1.0667 �0.1710.1397 0.9562 0.166 0.6051 1.0785 0.0210.2623 1.0138 �0.057 0.7046 1.0873 0.3080.3282 1.0334 �0.159 0.8080 1.0946 0.5960.4054 1.0506 �0.213 0.9067 1.1008 0.612
T = 303.15 K0.0694 0.8903 0.280 0.5045 1.0630 �0.2040.1397 0.9527 0.087 0.6051 1.0748 �0.0050.2623 1.0102 �0.123 0.7046 1.0837 0.2490.3282 1.0297 �0.202 0.8080 1.0910 0.5420.4054 1.0469 �0.252 0.9067 1.0972 0.560
T = 313.15 K0.0694 0.8826 0.267 0.5045 1.0557 �0.3140.1397 0.9453 0.016 0.6051 1.0676 �0.1500.2623 1.0031 �0.270 0.7046 1.0765 0.1030.3282 1.0225 �0.333 0.8080 1.0839 0.3490.4054 1.0397 �0.389 0.9067 1.0900 0.409
TABLE 5Binary densities and excess molar volumes for {1-butanol (x1) + ethyl acetate (x2)} at T = (298.15, 303.15, and 313.15) K.
x1 q/(g � cm�3) VE12/(cm3 �mol�1) x1 q/(g � cm�3) VE
12/(cm3 �mol�1)
T = 298.15 K0.0904 0.8865 0.079 0.7032 0.8315 0.2100.1337 0.8823 0.139 0.8009 0.8230 0.1520.2525 0.8715 0.211 0.8916 0.8151 0.0880.3723 0.8607 0.256 0.9641 0.8086 0.0480.4807 0.8510 0.272 0.9795 0.8073 0.0290.5955 0.8409 0.253
T = 303.15 K0.0904 0.8804 0.131 0.7032 0.8288 0.1500.1337 0.8768 0.145 0.8009 0.8206 0.1010.2525 0.8667 0.191 0.8916 0.8130 0.0410.3723 0.8566 0.210 0.9641 0.8067 0.0100.4807 0.8475 0.206 0.9795 0.8053 0.0070.5955 0.8380 0.169
T = 313.15 K0.0904 0.8696 0.069 0.7032 0.8201 0.1780.1337 0.8660 0.106 0.8009 0.8123 0.1340.2525 0.8566 0.137 0.8916 0.8050 0.0880.3723 0.8468 0.186 0.9641 0.7994 0.0140.4807 0.8380 0.207 0.9795 0.7981 0.0100.5955 0.8288 0.197
26 I. Bahadur et al. / J. Chem. Thermodynamics 49 (2012) 24–38
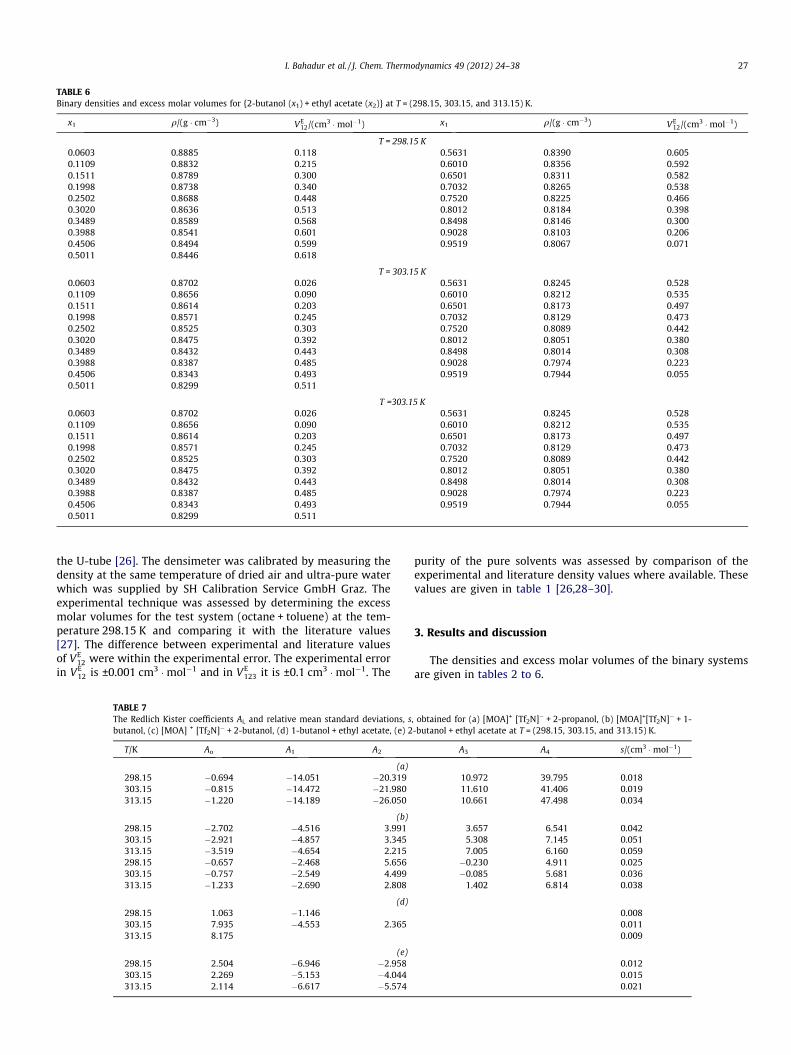
TABLE 6Binary densities and excess molar volumes for {2-butanol (x1) + ethyl acetate (x2)} at T = (298.15, 303.15, and 313.15) K.
x1 q/(g � cm�3) VE12/(cm3 �mol�1) x1 q/(g � cm�3) VE
12/(cm3 �mol�1)
T = 298.15 K0.0603 0.8885 0.118 0.5631 0.8390 0.6050.1109 0.8832 0.215 0.6010 0.8356 0.5920.1511 0.8789 0.300 0.6501 0.8311 0.5820.1998 0.8738 0.340 0.7032 0.8265 0.5380.2502 0.8688 0.448 0.7520 0.8225 0.4660.3020 0.8636 0.513 0.8012 0.8184 0.3980.3489 0.8589 0.568 0.8498 0.8146 0.3000.3988 0.8541 0.601 0.9028 0.8103 0.2060.4506 0.8494 0.599 0.9519 0.8067 0.0710.5011 0.8446 0.618
T = 303.15 K0.0603 0.8702 0.026 0.5631 0.8245 0.5280.1109 0.8656 0.090 0.6010 0.8212 0.5350.1511 0.8614 0.203 0.6501 0.8173 0.4970.1998 0.8571 0.245 0.7032 0.8129 0.4730.2502 0.8525 0.303 0.7520 0.8089 0.4420.3020 0.8475 0.392 0.8012 0.8051 0.3800.3489 0.8432 0.443 0.8498 0.8014 0.3080.3988 0.8387 0.485 0.9028 0.7974 0.2230.4506 0.8343 0.493 0.9519 0.7944 0.0550.5011 0.8299 0.511
T =303.15 K0.0603 0.8702 0.026 0.5631 0.8245 0.5280.1109 0.8656 0.090 0.6010 0.8212 0.5350.1511 0.8614 0.203 0.6501 0.8173 0.4970.1998 0.8571 0.245 0.7032 0.8129 0.4730.2502 0.8525 0.303 0.7520 0.8089 0.4420.3020 0.8475 0.392 0.8012 0.8051 0.3800.3489 0.8432 0.443 0.8498 0.8014 0.3080.3988 0.8387 0.485 0.9028 0.7974 0.2230.4506 0.8343 0.493 0.9519 0.7944 0.0550.5011 0.8299 0.511
I. Bahadur et al. / J. Chem. Thermodynamics 49 (2012) 24–38 27
the U-tube [26]. The densimeter was calibrated by measuring thedensity at the same temperature of dried air and ultra-pure waterwhich was supplied by SH Calibration Service GmbH Graz. Theexperimental technique was assessed by determining the excessmolar volumes for the test system (octane + toluene) at the tem-perature 298.15 K and comparing it with the literature values[27]. The difference between experimental and literature valuesof VE
12 were within the experimental error. The experimental errorin VE
12 is ±0.001 cm3 �mol�1 and in VE123 it is ±0.1 cm3 �mol�1. The
TABLE 7The Redlich Kister coefficients Ai, and relative mean standard deviations, sbutanol, (c) [MOA] + [Tf2N]� + 2-butanol, (d) 1-butanol + ethyl acetate, (e) 2
T/K Ao A1 A2
(a)298.15 �0.694 �14.051 �20.319303.15 �0.815 �14.472 �21.980313.15 �1.220 �14.189 �26.050
(b)298.15 �2.702 �4.516 3.991303.15 �2.921 �4.857 3.345313.15 �3.519 �4.654 2.215298.15 �0.657 �2.468 5.656303.15 �0.757 �2.549 4.499313.15 �1.233 �2.690 2.808
(d)298.15 1.063 �1.146303.15 7.935 �4.553 2.365313.15 8.175
(e)298.15 2.504 �6.946 �2.958303.15 2.269 �5.153 �4.044313.15 2.114 �6.617 �5.574
purity of the pure solvents was assessed by comparison of theexperimental and literature density values where available. Thesevalues are given in table 1 [26,28–30].
3. Results and discussion
The densities and excess molar volumes of the binary systemsare given in tables 2 to 6.
, obtained for (a) [MOA]+ [Tf2N]� + 2-propanol, (b) [MOA]+[Tf2N]� + 1--butanol + ethyl acetate at T = (298.15, 303.15, and 313.15) K.
A3 A4 s/(cm3 �mol�1)
10.972 39.795 0.01811.610 41.406 0.01910.661 47.498 0.034
3.657 6.541 0.0425.308 7.145 0.0517.005 6.160 0.059�0.230 4.911 0.025�0.085 5.681 0.036
1.402 6.814 0.038
0.0080.0110.009
0.0120.0150.021

TABLE 8Binary interaction parameters obtained from the Virial Based Mixing Rule correlation and relative mean standard deviation, s, obtained for{[OMA]+[Tf2N]� + (a) 2-propanol, (b) 1-butanol, (c) 2-butanol} (d) 1-butanol + ethyl acetate (e) 2-butanol + ethyl acetate at T = (298.15, 303.15, and313.15) K.
T/K k12 k112 g1122 n11222 s
{[OMA]+[Tf2N]� + 2-propanol}298.15 0.002145 0.3008 �0.7299 0.7765 �0.3124303.15 0.002665 0.3091 �0.7558 0.8070 �0.3246313.15 0.003563 0.3394 �0.8444 0.9139 �0.3701
{[OMA]+[Tf2N]� + 1-butanol}298.15 0.00104 0.09466 �0.1586 0.1305 �0.05067303.15 0.001142 0.1046 �0.1805 0.1514 �0.05785313.15 0.002411 0.09560 �0.1649 0.1356 �0.04967
{[OMA]+[Tf2N]� + 2-butanol}298.15 �0.002338 0.07539 �0.1180 0.09578 �0.04013303.15 �0.001846 0.07689 �0.1287 0.1107 �0.04623313.15 �0.0009147 0.08417 �0.1505 0.1351 �0.05495
{1-Butanol + ethyl acetate}298.15 �0.005523 0.02319 �0.01523 �0.001753 0.007994303.15 �0.004503 �0.07875 0.05493 0.005045 0.007429313.15 �0.004237 �0.005517 0.001255 �0.1042 0.008239
{2-Butanol + ethyl acetate}298.15 �0.01261 0.1262 �0.09483 0.01325303.15 �0.01112 0.1714 �0.1287 0.01563313.15 �0.009964 0.2110 �0.1600 0.02182
TABLE 9The partial molar volumes at infinite dilution obtained from the Redlich–Kister (RK) parameters and those obtained from the VBMR parameters for(a) {[MOA]+[Tf2N]� + 2-propanol}, (b) {[MOA]+[Tf2N]� + 1-butanol}, (c) {[MOA]+[Tf2N]� + 2-butanol}, (d) {1-butanol + ethyl acetate}, (e) {2-butanol + ethyl acetate} at T = (298.15, 303.15, and 313.15) K.
T/K V1m;1 (RK)/(cm3 �mol�1) V1m;2 (RK)/(cm3 �mol�1) V1m;1 VBMR/(cm3 �mol�1) V1m;2 VBMR/(cm3 �mol�1)
(a)298.15 15.703 21.861 15.559 21.693303.15 15.749 21.473 15.653 21.364313.15 16.700 23.756 16.584 23.626
(b)298.15 6.971 8.689 7.244 8.331303.15 8.020 7.118 8.272 7.346313.15 7.207 2.505 7.393 2.743
(c)298.15 7.212 12.608 7.492 12.777303.15 6.789 12.057 7.067 12.243313.15 7.101 9.677 7.354 9.881
(d)298.15 0.997 1.025 1.001 1.029303.15 1.855 0.186 1.847 0.173313.15 1.042 0.706 1.043 0.706
(e)298.15 2.145 2.282 2.145 2.282303.15 1.813 1.916 1.813 1.916313.15 0.900 2.222 0.900 2.222
28 I. Bahadur et al. / J. Chem. Thermodynamics 49 (2012) 24–38
The binary excess molar volumes were calculated from theexperimental density values, using the following equation:’
VE12 ¼
x1M1 þ x2M2
q� x1M1
q1� x2M2
q2; ð1Þ
and the ternary excess molar volumes were calculated from theexperimental density values, using equation (2):
VE123 ¼
x1M1 þ x2M2 þ x3M3
q� x1M1
q1� x2M2
q2� x3M3
q3; ð2Þ
where x1, x2 and x3 are mole fractions, M1, M2 and M3 are molarmasses, q1, q2 and q3 are densities of the pure components 1, 2and 3, where ‘‘1’’ refers to the IL, ‘‘2’’ refers to 2-propanol or 1-buta-nol or 2-butanol and ‘‘3’’ refers to ethyl acetate, and q is density ofthe mixtures.
The Redlich–Kister smoothing polynomial equation [31]
VE12 ¼ x1x2
XN
i¼0
Aiðx1 � x2Þi; ð3Þ
was used to fit the binary excess molar volume data and the coeffi-cient Ai are the parameters obtained by a least-squares fitting meth-od using a commercial software (MathCAD).The relative meanstandard deviations, s, is defined as:
sðVE12Þ ¼
XN
i¼1
ðVE12exp� VE
12calÞ2
n� k
" #1=2
; ð4Þ
where n is the number of experimental points and k is the numberof coefficients used in the Redlich–Kister correlation.
The densities of the pure ionic liquid and their binary systemsdecrease with an increase in the temperature. The for the three

TABLE 10Ternary density, q, and excess molar volume, VE
123 for the (ionic liquid + 2-propanol + ethyl acetate) at T = (298.15, 303.15, and 313.15) K.
x1 x2 x3 q/(g � cm�3) VE123/(cm�3 �mol�1)
T = 298.15 Kz = 7.57
0.0600 0.4856 0.4543 0.9234 �0.10.0281 0.7591 0.2127 0.9685 �0.40.0225 0.8077 0.1698 0.9838 �0.40.0946 0.2117 0.6938 0.9899 �0.30.1091 0.0653 0.8256 0.8619 �0.00.1167 0.0000 0.8833 0.8481 �0.1
z = 3.360.0939 0.5904 0.3156 0.9469 �0.30.1429 0.3764 0.4807 0.9896 �0.70.1847 0.1949 0.6204 1.0145 �0.80.2017 0.1193 0.6790 1.0230 �0.80.2291 0.0000 0.7709 1.0345 �0.80.0939 0.5904 0.3156 0.9469 �0.3
z = 1.260.2304 0.4790 0.2906 1.0212 �0.80.3156 0.2854 0.3990 1.0488 �1.10.3523 0.2034 0.4443 1.0579 �1.20.3954 0.1064 0.4982 1.0670 �1.40.4417 0.0000 0.5583 1.0747 �1.4
z = 0.840.1100 0.7974 0.0926 0.9479 �0.50.1911 0.6482 0.1607 1.0018 �0.90.3356 0.3825 0.2819 1.0515 �1.30.4338 0.2018 0.3644 1.0712 �1.60.5433 0.0000 0.4567 1.0854 �1.6
z = 0.420.3759 0.4664 0.1578 1.0562 �1.10.5101 0.2753 0.2146 1.0780 �1.40.6157 0.1256 0.2587 1.0896 �1.50.6625 0.0596 0.2779 1.0938 �1.60.7037 0.0000 0.2963 1.0967 �1.5
z = 0.250.2927 0.6337 0.0736 1.0322 �0.40.4909 0.3849 0.1242 1.0727 �0.90.6302 0.2105 0.1593 1.0888 �1.20.7088 0.1119 0.1794 1.0952 �1.20.7993 0.0000 0.2007 1.1013 �1.3
z = 0.080.7867 0.1483 0.0650 1.0978 �0.60.8568 0.0733 0.0698 1.1020 �0.70.6371 0.3113 0.0516 1.0864 �0.50.4409 0.5232 0.0359 1.0623 �0.3
T = 303.15 Kz = 7.57
0.0600 0.4856 0.4543 0.9184 �0.20.0281 0.7591 0.2127 0.8560 �0.20.0225 0.8077 0.1698 0.8424 �0.20.0946 0.2117 0.6938 0.9636 �0.50.1091 0.0653 0.8256 0.9788 �0.50.1167 0.0000 0.8833 0.9849 �0.4
z = 1.260.2304 0.4790 0.2906 1.0183 �1.30.3156 0.2854 0.3990 1.0450 �1.40.3523 0.2034 0.4443 1.0535 �1.40.3954 0.1064 0.4982 1.0622 �1.50.4417 0.0000 0.5583 1.0696 �1.4
z = 0.840.1100 0.7974 0.0926 0.9457 �0.80.1911 0.6482 0.1607 0.9995 �1.40.3356 0.3825 0.2819 1.0478 �1.60.4338 0.2018 0.3644 1.0668 �1.80.5433 0.0000 0.4567 1.0803 �1.6
z = 0.420.3759 0.4664 0.1578 1.0514 �1.10.5101 0.2753 0.2146 1.0728 �1.30.6157 0.1256 0.2587 1.0843 �1.40.6625 0.0596 0.2779 1.0882 �1.4
(continued on next page)
I. Bahadur et al. / J. Chem. Thermodynamics 49 (2012) 24–38 29
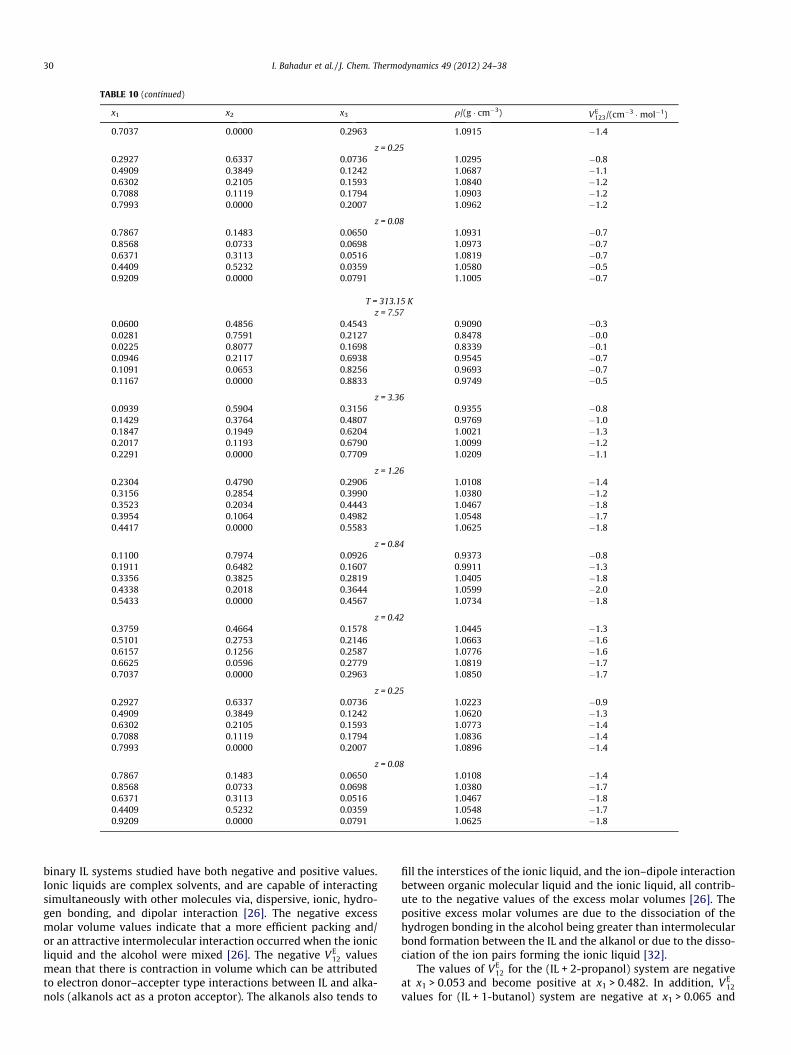
TABLE 10 (continued)
x1 x2 x3 q/(g � cm�3) VE123/(cm�3 �mol�1)
0.7037 0.0000 0.2963 1.0915 �1.4
z = 0.250.2927 0.6337 0.0736 1.0295 �0.80.4909 0.3849 0.1242 1.0687 �1.10.6302 0.2105 0.1593 1.0840 �1.20.7088 0.1119 0.1794 1.0903 �1.20.7993 0.0000 0.2007 1.0962 �1.2
z = 0.080.7867 0.1483 0.0650 1.0931 �0.70.8568 0.0733 0.0698 1.0973 �0.70.6371 0.3113 0.0516 1.0819 �0.70.4409 0.5232 0.0359 1.0580 �0.50.9209 0.0000 0.0791 1.1005 �0.7
T = 313.15 Kz = 7.57
0.0600 0.4856 0.4543 0.9090 �0.30.0281 0.7591 0.2127 0.8478 �0.00.0225 0.8077 0.1698 0.8339 �0.10.0946 0.2117 0.6938 0.9545 �0.70.1091 0.0653 0.8256 0.9693 �0.70.1167 0.0000 0.8833 0.9749 �0.5
z = 3.360.0939 0.5904 0.3156 0.9355 �0.80.1429 0.3764 0.4807 0.9769 �1.00.1847 0.1949 0.6204 1.0021 �1.30.2017 0.1193 0.6790 1.0099 �1.20.2291 0.0000 0.7709 1.0209 �1.1
z = 1.260.2304 0.4790 0.2906 1.0108 �1.40.3156 0.2854 0.3990 1.0380 �1.20.3523 0.2034 0.4443 1.0467 �1.80.3954 0.1064 0.4982 1.0548 �1.70.4417 0.0000 0.5583 1.0625 �1.8
z = 0.840.1100 0.7974 0.0926 0.9373 �0.80.1911 0.6482 0.1607 0.9911 �1.30.3356 0.3825 0.2819 1.0405 �1.80.4338 0.2018 0.3644 1.0599 �2.00.5433 0.0000 0.4567 1.0734 �1.8
z = 0.420.3759 0.4664 0.1578 1.0445 �1.30.5101 0.2753 0.2146 1.0663 �1.60.6157 0.1256 0.2587 1.0776 �1.60.6625 0.0596 0.2779 1.0819 �1.70.7037 0.0000 0.2963 1.0850 �1.7
z = 0.250.2927 0.6337 0.0736 1.0223 �0.90.4909 0.3849 0.1242 1.0620 �1.30.6302 0.2105 0.1593 1.0773 �1.40.7088 0.1119 0.1794 1.0836 �1.40.7993 0.0000 0.2007 1.0896 �1.4
z = 0.080.7867 0.1483 0.0650 1.0108 �1.40.8568 0.0733 0.0698 1.0380 �1.70.6371 0.3113 0.0516 1.0467 �1.80.4409 0.5232 0.0359 1.0548 �1.70.9209 0.0000 0.0791 1.0625 �1.8
30 I. Bahadur et al. / J. Chem. Thermodynamics 49 (2012) 24–38
binary IL systems studied have both negative and positive values.Ionic liquids are complex solvents, and are capable of interactingsimultaneously with other molecules via, dispersive, ionic, hydro-gen bonding, and dipolar interaction [26]. The negative excessmolar volume values indicate that a more efficient packing and/or an attractive intermolecular interaction occurred when the ionicliquid and the alcohol were mixed [26]. The negative VE
12 valuesmean that there is contraction in volume which can be attributedto electron donor–accepter type interactions between IL and alka-nols (alkanols act as a proton acceptor). The alkanols also tends to
fill the interstices of the ionic liquid, and the ion–dipole interactionbetween organic molecular liquid and the ionic liquid, all contrib-ute to the negative values of the excess molar volumes [26]. Thepositive excess molar volumes are due to the dissociation of thehydrogen bonding in the alcohol being greater than intermolecularbond formation between the IL and the alkanol or due to the disso-ciation of the ion pairs forming the ionic liquid [32].
The values of VE12 for the (IL + 2-propanol) system are negative
at x1 > 0.053 and become positive at x1 > 0.482. In addition, VE12
values for (IL + 1-butanol) system are negative at x1 > 0.065 and

TABLE 11Ternary density, q, and excess molar volume, VE
123 for the (ionic liquid + 1-butanol + ethyl acetate) at T = (298.15, 303.15, and 313.15) K.
x1 x2 x3 q/(g � cm�3) VE123/(cm�3 �mol�1)
T = 298.15 Kz = 7.57
0.0660 0.4347 0.4992 0.9372 �0.80.0328 0.7188 0.2484 0.8800 �0.20.0263 0.7746 0.1990 0.8669 �0.10.0957 0.1808 0.7235 0.9731 �0.90.1102 0.0560 0.8338 0.9857 �0.50.1167 0.0000 0.8833 0.9899 �0.3
z = 3.360.1058 0.5394 0.3548 0.9593 �0.80.1538 0.3299 0.5164 0.9968 �1.00.1912 0.1637 0.6452 1.0186 �1.10.2024 0.1182 0.6794 1.0254 �1.10.2291 0.0000 0.7709 1.0345 �0.8
z = 1.260.2512 0.4243 0.3245 1.0280 �1.20.3331 0.2457 0.4212 1.0520 �1.30.3657 0.1728 0.4615 1.0600 �1.40.4022 0.0901 0.5077 1.0677 �1.40.4417 0.0000 0.5583 1.0747 �1.4
z = 0.840.1295 0.7617 0.1087 0.9630 �0.90.2176 0.5993 0.1830 1.0117 �1.30.3614 0.3350 0.3036 1.0558 �1.60.4494 0.1701 0.3805 1.0725 �1.60.5433 0.0000 0.4567 1.0854 �1.6
z = 0.420.4124 0.4141 0.1735 1.0608 �1.30.5373 0.2396 0.2231 1.0800 �1.40.6280 0.1057 0.2664 1.0904 �1.50.6664 0.0527 0.2809 1.0941 �1.60.7037 0.0000 0.2963 1.0967 �1.5
z = 0.250.3320 0.5814 0.0866 1.0399 �0.70.5288 0.3389 0.1323 1.0762 �1.10.6561 0.1775 0.1664 1.0900 �1.20.7246 0.0925 0.1829 1.0959 �1.30.7993 0.0000 0.2007 1.1013 �1.3
z = 0.080.8087 0.1246 0.0667 1.0985 �0.90.8495 0.0617 0.0888 1.1025 �0.90.6693 0.2642 0.0664 1.0898 �1.00.4910 0.4715 0.0375 1.0681 �0.80.9209 0.0000 0.0791 1.1054 �0.7
T = 303.15 Kz = 7.57
0.0660 0.4347 0.4992 0.9327 �0.80.0328 0.7188 0.2484 0.8770 �0.30.0263 0.7746 0.1990 0.8634 �0.00.0957 0.1808 0.7235 0.9672 �0.80.1102 0.0560 0.8338 0.9805 �0.60.1167 0.0000 0.8833 0.9849 �0.4
z = 3.360.1058 0.5394 0.3548 0.9554 �0.80.1538 0.3299 0.5164 0.9918 �1.00.1912 0.1637 0.6452 1.0135 �1.10.2024 0.1182 0.6794 1.0205 �1.10.2291 0.0000 0.7709 1.0295 �0.9
z = 1.260.2512 0.4243 0.3245 1.0234 �1.10.3331 0.2457 0.4212 1.0477 �1.40.3657 0.1728 0.4615 1.0552 �1.40.4022 0.0901 0.5077 1.0625 �1.40.4417 0.0000 0.5583 1.0696 �1.4
z = 0.840.1295 0.7617 0.1087 0.9598 �0.90.2176 0.5993 0.1830 1.0080 �1.40.3614 0.3350 0.3036 1.0513 �1.60.4494 0.1701 0.3805 1.0679 �1.70.5433 0.0000 0.4567 1.0803 �1.6
(continued on next page)
I. Bahadur et al. / J. Chem. Thermodynamics 49 (2012) 24–38 31
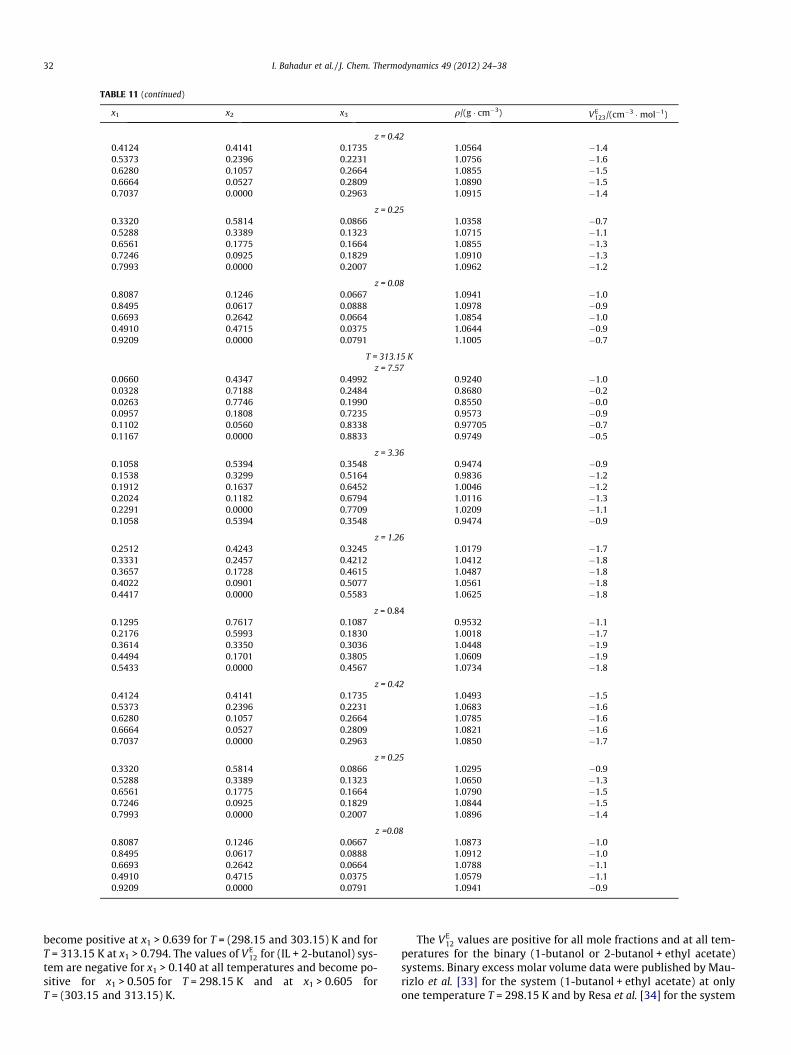
TABLE 11 (continued)
x1 x2 x3 q/(g � cm�3) VE123/(cm�3 �mol�1)
z = 0.420.4124 0.4141 0.1735 1.0564 �1.40.5373 0.2396 0.2231 1.0756 �1.60.6280 0.1057 0.2664 1.0855 �1.50.6664 0.0527 0.2809 1.0890 �1.50.7037 0.0000 0.2963 1.0915 �1.4
z = 0.250.3320 0.5814 0.0866 1.0358 �0.70.5288 0.3389 0.1323 1.0715 �1.10.6561 0.1775 0.1664 1.0855 �1.30.7246 0.0925 0.1829 1.0910 �1.30.7993 0.0000 0.2007 1.0962 �1.2
z = 0.080.8087 0.1246 0.0667 1.0941 �1.00.8495 0.0617 0.0888 1.0978 �0.90.6693 0.2642 0.0664 1.0854 �1.00.4910 0.4715 0.0375 1.0644 �0.90.9209 0.0000 0.0791 1.1005 �0.7
T = 313.15 Kz = 7.57
0.0660 0.4347 0.4992 0.9240 �1.00.0328 0.7188 0.2484 0.8680 �0.20.0263 0.7746 0.1990 0.8550 �0.00.0957 0.1808 0.7235 0.9573 �0.90.1102 0.0560 0.8338 0.97705 �0.70.1167 0.0000 0.8833 0.9749 �0.5
z = 3.360.1058 0.5394 0.3548 0.9474 �0.90.1538 0.3299 0.5164 0.9836 �1.20.1912 0.1637 0.6452 1.0046 �1.20.2024 0.1182 0.6794 1.0116 �1.30.2291 0.0000 0.7709 1.0209 �1.10.1058 0.5394 0.3548 0.9474 �0.9
z = 1.260.2512 0.4243 0.3245 1.0179 �1.70.3331 0.2457 0.4212 1.0412 �1.80.3657 0.1728 0.4615 1.0487 �1.80.4022 0.0901 0.5077 1.0561 �1.80.4417 0.0000 0.5583 1.0625 �1.8
z = 0.840.1295 0.7617 0.1087 0.9532 �1.10.2176 0.5993 0.1830 1.0018 �1.70.3614 0.3350 0.3036 1.0448 �1.90.4494 0.1701 0.3805 1.0609 �1.90.5433 0.0000 0.4567 1.0734 �1.8
z = 0.420.4124 0.4141 0.1735 1.0493 �1.50.5373 0.2396 0.2231 1.0683 �1.60.6280 0.1057 0.2664 1.0785 �1.60.6664 0.0527 0.2809 1.0821 �1.60.7037 0.0000 0.2963 1.0850 �1.7
z = 0.250.3320 0.5814 0.0866 1.0295 �0.90.5288 0.3389 0.1323 1.0650 �1.30.6561 0.1775 0.1664 1.0790 �1.50.7246 0.0925 0.1829 1.0844 �1.50.7993 0.0000 0.2007 1.0896 �1.4
z =0.080.8087 0.1246 0.0667 1.0873 �1.00.8495 0.0617 0.0888 1.0912 �1.00.6693 0.2642 0.0664 1.0788 �1.10.4910 0.4715 0.0375 1.0579 �1.10.9209 0.0000 0.0791 1.0941 �0.9
32 I. Bahadur et al. / J. Chem. Thermodynamics 49 (2012) 24–38
become positive at x1 > 0.639 for T = (298.15 and 303.15) K and forT = 313.15 K at x1 > 0.794. The values of VE
12 for (IL + 2-butanol) sys-tem are negative for x1 > 0.140 at all temperatures and become po-sitive for x1 > 0.505 for T = 298.15 K and at x1 > 0.605 forT = (303.15 and 313.15) K.
The VE12 values are positive for all mole fractions and at all tem-
peratures for the binary (1-butanol or 2-butanol + ethyl acetate)systems. Binary excess molar volume data were published by Mau-rizlo et al. [33] for the system (1-butanol + ethyl acetate) at onlyone temperature T = 298.15 K and by Resa et al. [34] for the system
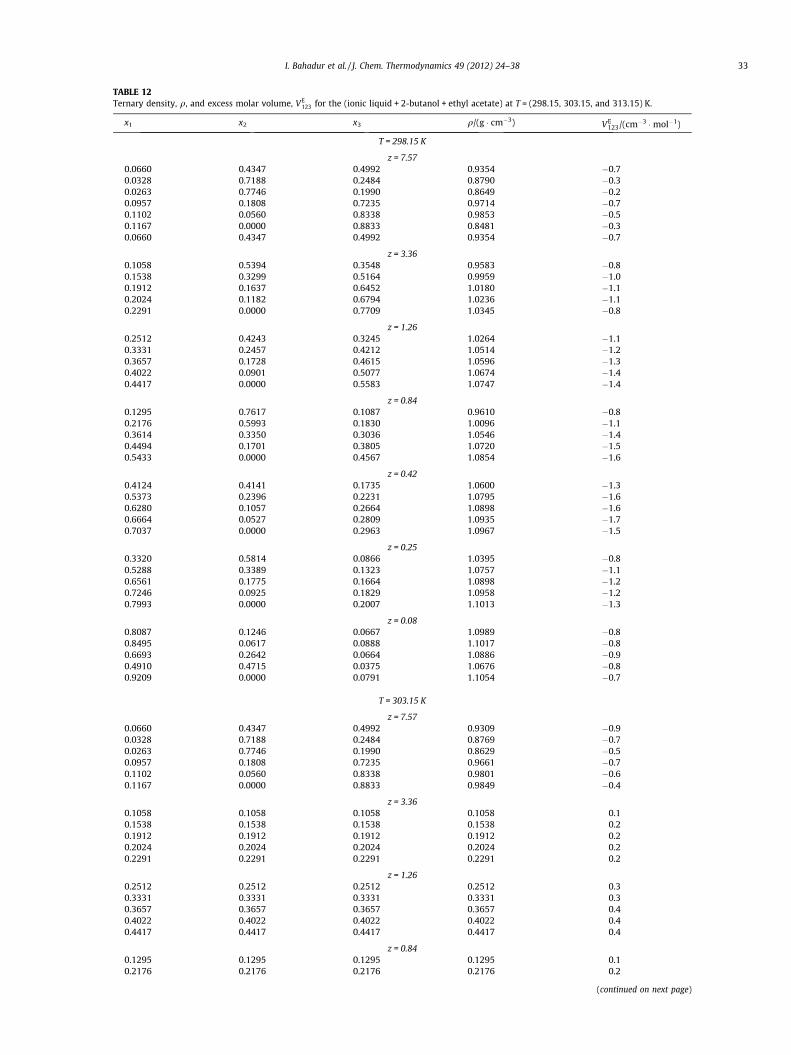
TABLE 12Ternary density, q, and excess molar volume, VE
123 for the (ionic liquid + 2-butanol + ethyl acetate) at T = (298.15, 303.15, and 313.15) K.
x1 x2 x3 q/(g � cm�3) VE123/(cm�3 �mol�1)
T = 298.15 K
z = 7.570.0660 0.4347 0.4992 0.9354 �0.70.0328 0.7188 0.2484 0.8790 �0.30.0263 0.7746 0.1990 0.8649 �0.20.0957 0.1808 0.7235 0.9714 �0.70.1102 0.0560 0.8338 0.9853 �0.50.1167 0.0000 0.8833 0.8481 �0.30.0660 0.4347 0.4992 0.9354 �0.7
z = 3.360.1058 0.5394 0.3548 0.9583 �0.80.1538 0.3299 0.5164 0.9959 �1.00.1912 0.1637 0.6452 1.0180 �1.10.2024 0.1182 0.6794 1.0236 �1.10.2291 0.0000 0.7709 1.0345 �0.8
z = 1.260.2512 0.4243 0.3245 1.0264 �1.10.3331 0.2457 0.4212 1.0514 �1.20.3657 0.1728 0.4615 1.0596 �1.30.4022 0.0901 0.5077 1.0674 �1.40.4417 0.0000 0.5583 1.0747 �1.4
z = 0.840.1295 0.7617 0.1087 0.9610 �0.80.2176 0.5993 0.1830 1.0096 �1.10.3614 0.3350 0.3036 1.0546 �1.40.4494 0.1701 0.3805 1.0720 �1.50.5433 0.0000 0.4567 1.0854 �1.6
z = 0.420.4124 0.4141 0.1735 1.0600 �1.30.5373 0.2396 0.2231 1.0795 �1.60.6280 0.1057 0.2664 1.0898 �1.60.6664 0.0527 0.2809 1.0935 �1.70.7037 0.0000 0.2963 1.0967 �1.5
z = 0.250.3320 0.5814 0.0866 1.0395 �0.80.5288 0.3389 0.1323 1.0757 �1.10.6561 0.1775 0.1664 1.0898 �1.20.7246 0.0925 0.1829 1.0958 �1.20.7993 0.0000 0.2007 1.1013 �1.3
z = 0.080.8087 0.1246 0.0667 1.0989 �0.80.8495 0.0617 0.0888 1.1017 �0.80.6693 0.2642 0.0664 1.0886 �0.90.4910 0.4715 0.0375 1.0676 �0.80.9209 0.0000 0.0791 1.1054 �0.7
T = 303.15 K
z = 7.570.0660 0.4347 0.4992 0.9309 �0.90.0328 0.7188 0.2484 0.8769 �0.70.0263 0.7746 0.1990 0.8629 �0.50.0957 0.1808 0.7235 0.9661 �0.70.1102 0.0560 0.8338 0.9801 �0.60.1167 0.0000 0.8833 0.9849 �0.4
z = 3.360.1058 0.1058 0.1058 0.1058 0.10.1538 0.1538 0.1538 0.1538 0.20.1912 0.1912 0.1912 0.1912 0.20.2024 0.2024 0.2024 0.2024 0.20.2291 0.2291 0.2291 0.2291 0.2
z = 1.260.2512 0.2512 0.2512 0.2512 0.30.3331 0.3331 0.3331 0.3331 0.30.3657 0.3657 0.3657 0.3657 0.40.4022 0.4022 0.4022 0.4022 0.40.4417 0.4417 0.4417 0.4417 0.4
z = 0.840.1295 0.1295 0.1295 0.1295 0.10.2176 0.2176 0.2176 0.2176 0.2
(continued on next page)
I. Bahadur et al. / J. Chem. Thermodynamics 49 (2012) 24–38 33
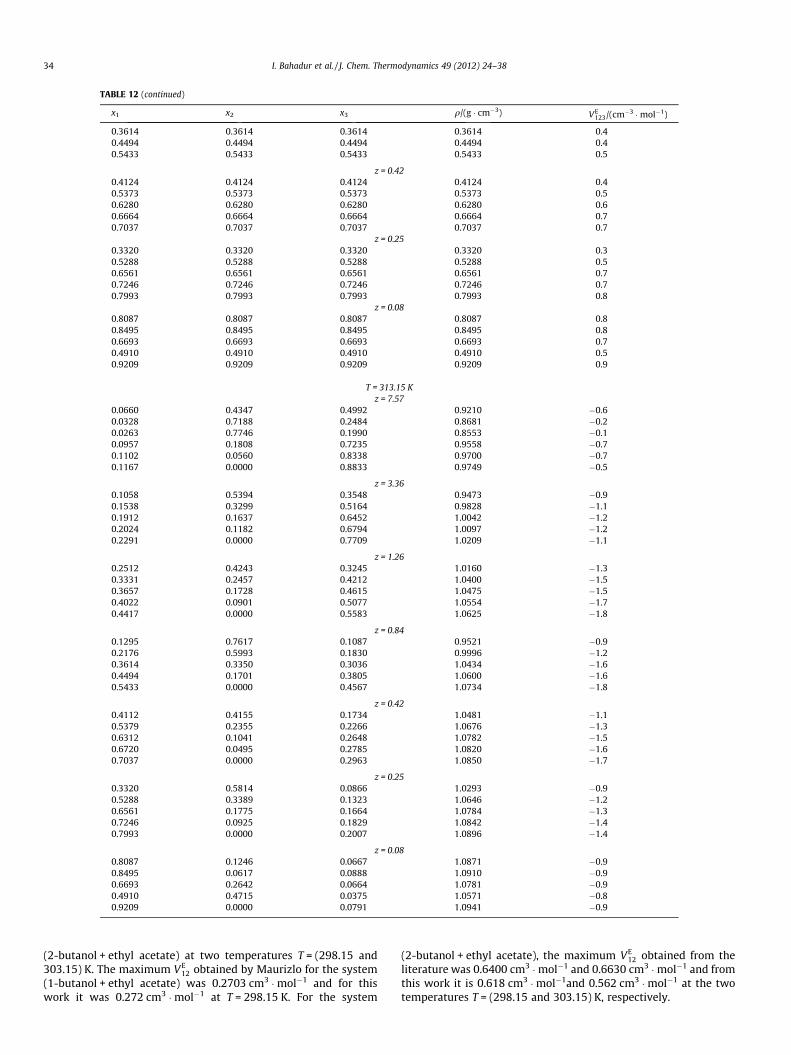
TABLE 12 (continued)
x1 x2 x3 q/(g � cm�3) VE123/(cm�3 �mol�1)
0.3614 0.3614 0.3614 0.3614 0.40.4494 0.4494 0.4494 0.4494 0.40.5433 0.5433 0.5433 0.5433 0.5
z = 0.420.4124 0.4124 0.4124 0.4124 0.40.5373 0.5373 0.5373 0.5373 0.50.6280 0.6280 0.6280 0.6280 0.60.6664 0.6664 0.6664 0.6664 0.70.7037 0.7037 0.7037 0.7037 0.7
z = 0.250.3320 0.3320 0.3320 0.3320 0.30.5288 0.5288 0.5288 0.5288 0.50.6561 0.6561 0.6561 0.6561 0.70.7246 0.7246 0.7246 0.7246 0.70.7993 0.7993 0.7993 0.7993 0.8
z = 0.080.8087 0.8087 0.8087 0.8087 0.80.8495 0.8495 0.8495 0.8495 0.80.6693 0.6693 0.6693 0.6693 0.70.4910 0.4910 0.4910 0.4910 0.50.9209 0.9209 0.9209 0.9209 0.9
T = 313.15 Kz = 7.57
0.0660 0.4347 0.4992 0.9210 �0.60.0328 0.7188 0.2484 0.8681 �0.20.0263 0.7746 0.1990 0.8553 �0.10.0957 0.1808 0.7235 0.9558 �0.70.1102 0.0560 0.8338 0.9700 �0.70.1167 0.0000 0.8833 0.9749 �0.5
z = 3.360.1058 0.5394 0.3548 0.9473 �0.90.1538 0.3299 0.5164 0.9828 �1.10.1912 0.1637 0.6452 1.0042 �1.20.2024 0.1182 0.6794 1.0097 �1.20.2291 0.0000 0.7709 1.0209 �1.1
z = 1.260.2512 0.4243 0.3245 1.0160 �1.30.3331 0.2457 0.4212 1.0400 �1.50.3657 0.1728 0.4615 1.0475 �1.50.4022 0.0901 0.5077 1.0554 �1.70.4417 0.0000 0.5583 1.0625 �1.8
z = 0.840.1295 0.7617 0.1087 0.9521 �0.90.2176 0.5993 0.1830 0.9996 �1.20.3614 0.3350 0.3036 1.0434 �1.60.4494 0.1701 0.3805 1.0600 �1.60.5433 0.0000 0.4567 1.0734 �1.8
z = 0.420.4112 0.4155 0.1734 1.0481 �1.10.5379 0.2355 0.2266 1.0676 �1.30.6312 0.1041 0.2648 1.0782 �1.50.6720 0.0495 0.2785 1.0820 �1.60.7037 0.0000 0.2963 1.0850 �1.7
z = 0.250.3320 0.5814 0.0866 1.0293 �0.90.5288 0.3389 0.1323 1.0646 �1.20.6561 0.1775 0.1664 1.0784 �1.30.7246 0.0925 0.1829 1.0842 �1.40.7993 0.0000 0.2007 1.0896 �1.4
z = 0.080.8087 0.1246 0.0667 1.0871 �0.90.8495 0.0617 0.0888 1.0910 �0.90.6693 0.2642 0.0664 1.0781 �0.90.4910 0.4715 0.0375 1.0571 �0.80.9209 0.0000 0.0791 1.0941 �0.9
34 I. Bahadur et al. / J. Chem. Thermodynamics 49 (2012) 24–38
(2-butanol + ethyl acetate) at two temperatures T = (298.15 and303.15) K. The maximum VE
12 obtained by Maurizlo for the system(1-butanol + ethyl acetate) was 0.2703 cm3 �mol�1 and for thiswork it was 0.272 cm3 �mol�1 at T = 298.15 K. For the system
(2-butanol + ethyl acetate), the maximum VE12 obtained from the
literature was 0.6400 cm3 �mol�1 and 0.6630 cm3 �mol�1 and fromthis work it is 0.618 cm3 �mol�1and 0.562 cm3 �mol�1 at the twotemperatures T = (298.15 and 303.15) K, respectively.

TABLE 13Correlation coefficients and relative mean standard deviation, s, for the Cibulka equation at T = (298.15, 303.15, and 313.15) K.
T/K b0 b1 b2 s
{[MOA]+[Tf2N]� (x1) + 2-propanol (x2) + ethyl acetate (x3)}298.15 �8.85669 �53.75698 26.14328 0.17303.15 �16.21188 �40.20545 12.56015 0.17313.15 �37.82652 �2.462188 31.02055 0.13
{[MOA]+[Tf2N]� (x1) + 1-butanol (x2) + ethyl acetate (x3)}298.15 �20.11710 3.96595 �1.1856 0.20303.15 �16.46755 �9.57106 �0.07346 0.20313.15 �23.39665 11.69914 �6.99739 0.15
{[MOA]+[Tf2N]� (x1) + 2-butanol (x2) + ethyl acetate (x3)}298.15 �26.93157 13.31379 �20.96522 0.21303.15 �22.78219 9.60763 �42.86072 0.24313.15 �28.0324 22.73148 �32.80080 0.20
(a) (b)
(c)
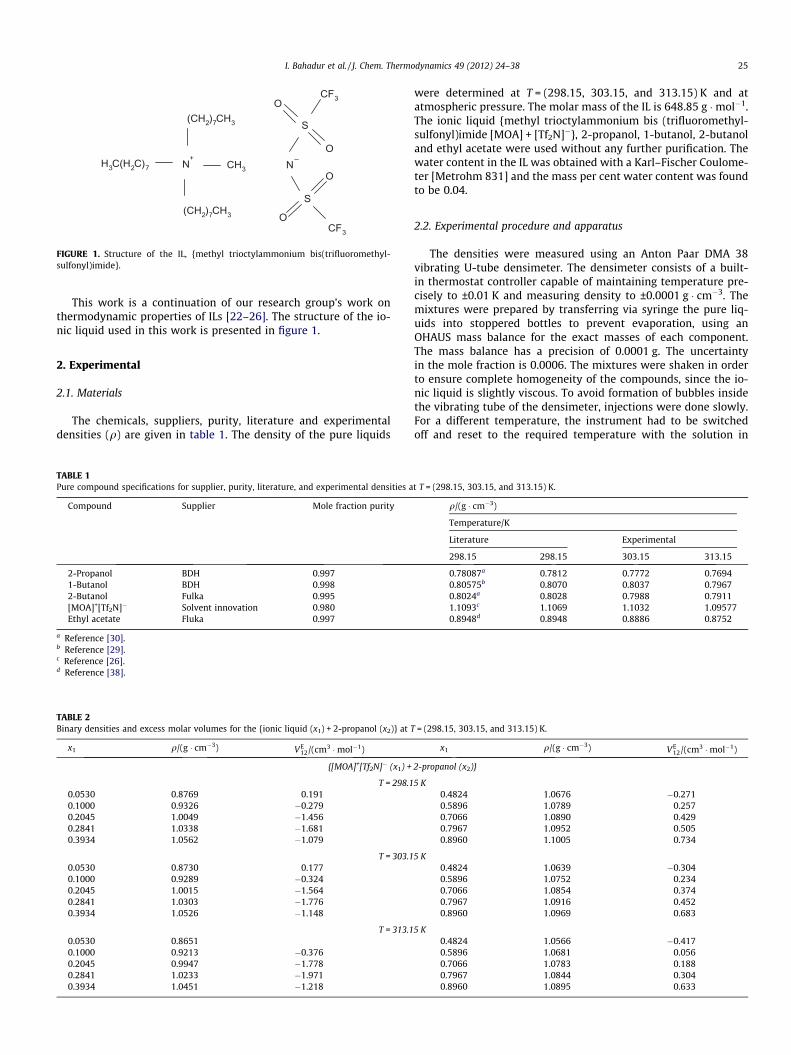
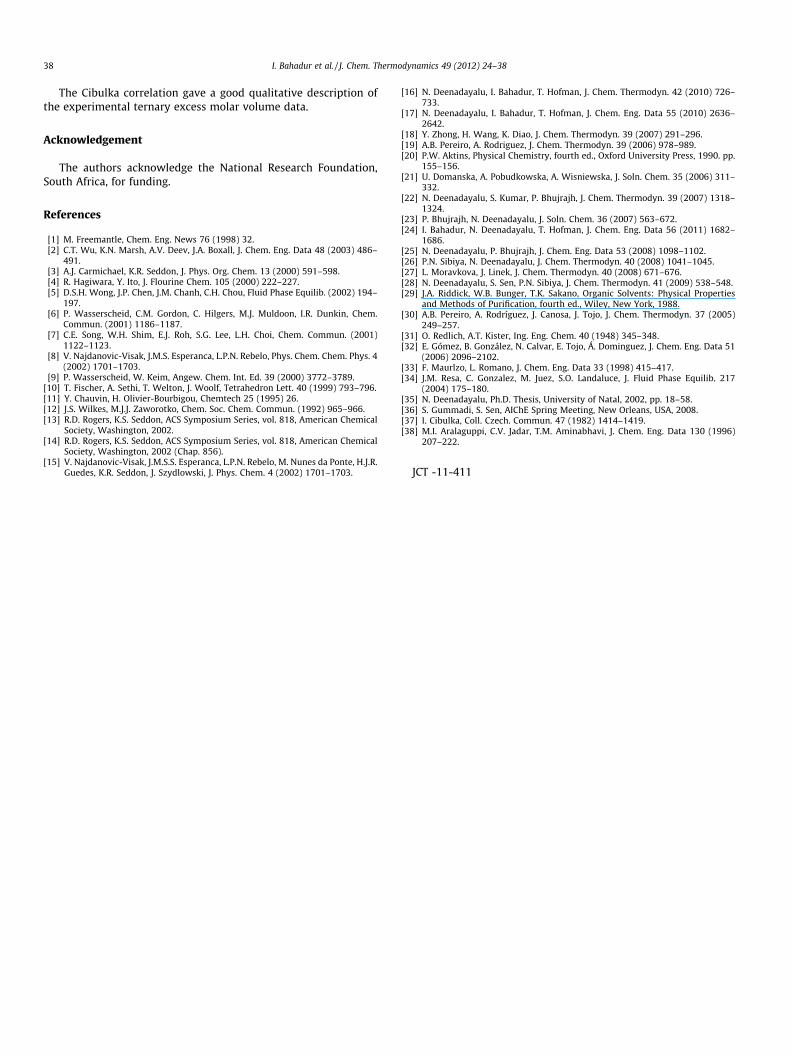
FIGURE 2. Graph of excess molar volumes, VE123, of the ternary mixture for {[MOA]+[Tf2N]� (x1) + 2-propanol (x2) + ethyl acetate (x3)} at: (a) T = 298.15 K, (b) T = 303.15 K, (c)
T = 313.15 K. Solid lines calculated by the Cibulka equation using the values of the parameters fitted to the binary and ternary data.
I. Bahadur et al. / J. Chem. Thermodynamics 49 (2012) 24–38 35
The partial molar volumes at infinite dilution V1m;i were calculatedfrom the Redlich–Kister polynomial coefficients as follows [35].
V1m;1 ¼ ½Ao þ A1 þ A2 þ A3 þ � � �� ð5Þ
and
V1m;2 ¼ ½Ao � A1 þ A2 � A3 þ � � ��; ð6Þ
where Ai are the coefficients of expansion of the Redlich–Kisterequation and are given in table 7 together with the relative meanstandard deviation, s.
3.1. Binary data correlation
Gummadi and Sen [36] demonstrated a methodology to corre-late the composition dependence of excess volumes by using viri-al-based mixing rules.
The ideal (linear) mixing rule for any non-entropic thermophys-ical property Q (Qi being the pure component value) in a homoge-neous phase at a fixed T and P is given by:
Q IDEAL ¼X
i
xiQ i: ð7Þ
(a) (b)
(c)
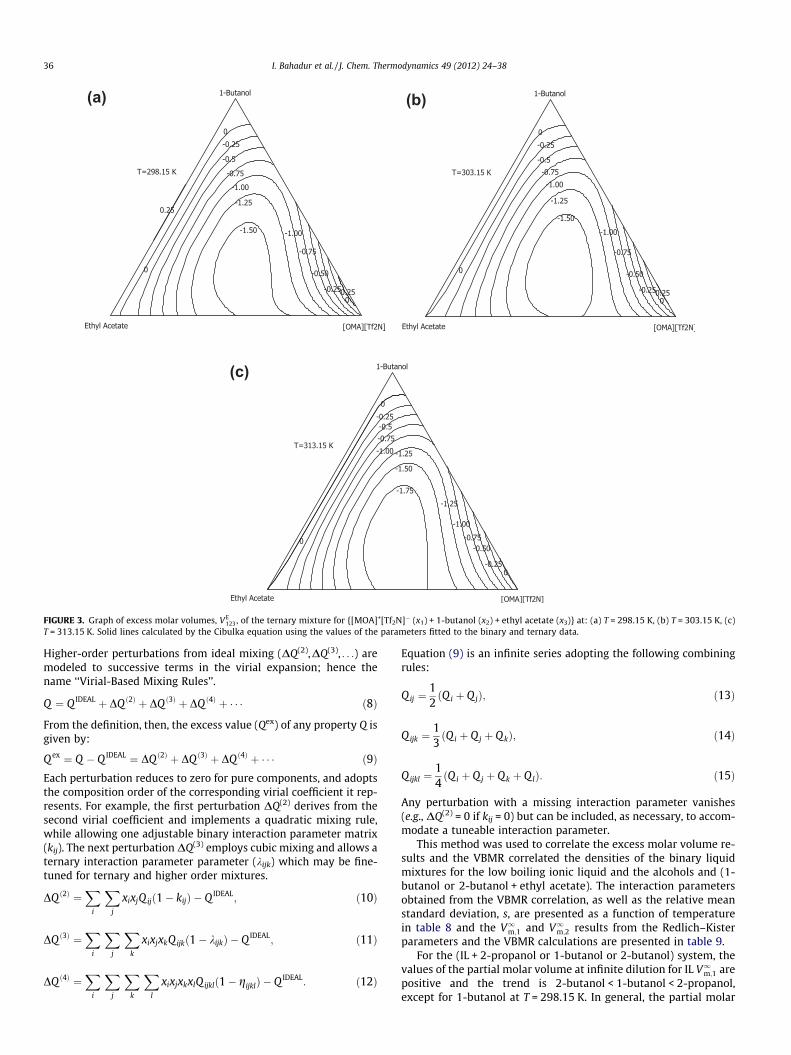
FIGURE 3. Graph of excess molar volumes, VE123, of the ternary mixture for {[MOA]+[Tf2N]� (x1) + 1-butanol (x2) + ethyl acetate (x3)} at: (a) T = 298.15 K, (b) T = 303.15 K, (c)
T = 313.15 K. Solid lines calculated by the Cibulka equation using the values of the parameters fitted to the binary and ternary data.
36 I. Bahadur et al. / J. Chem. Thermodynamics 49 (2012) 24–38
Higher-order perturbations from ideal mixing (DQ(2),DQ(3), . . .) aremodeled to successive terms in the virial expansion; hence thename ‘‘Virial-Based Mixing Rules’’.
Q ¼ Q IDEAL þ DQ ð2Þ þ DQ ð3Þ þ DQ ð4Þ þ � � � ð8Þ
From the definition, then, the excess value (Qex) of any property Q isgiven by:
Q ex ¼ Q � Q IDEAL ¼ DQ ð2Þ þ DQ ð3Þ þ DQ ð4Þ þ � � � ð9ÞEach perturbation reduces to zero for pure components, and adoptsthe composition order of the corresponding virial coefficient it rep-resents. For example, the first perturbation DQ(2) derives from thesecond virial coefficient and implements a quadratic mixing rule,while allowing one adjustable binary interaction parameter matrix(kij). The next perturbation DQ(3) employs cubic mixing and allows aternary interaction parameter parameter (kijk) which may be fine-tuned for ternary and higher order mixtures.
DQ ð2Þ ¼X
i
Xj
xixjQ ijð1� kijÞ � Q IDEAL; ð10Þ
DQ ð3Þ ¼X
i
Xj
Xk
xixjxkQijkð1� kijkÞ � Q IDEAL; ð11Þ
DQ ð4Þ ¼X
i
Xj
Xk
Xl
xixjxkxlQ ijklð1� gijklÞ � Q IDEAL: ð12Þ
Equation (9) is an infinite series adopting the following combiningrules:
Qij ¼12ðQ i þ Q jÞ; ð13Þ
Qijk ¼13ðQi þ Qj þ Q kÞ; ð14Þ
Qijkl ¼14ðQ i þ Qj þ Qk þ QlÞ: ð15Þ
Any perturbation with a missing interaction parameter vanishes(e.g., DQ(2) = 0 if kij = 0) but can be included, as necessary, to accom-modate a tuneable interaction parameter.
This method was used to correlate the excess molar volume re-sults and the VBMR correlated the densities of the binary liquidmixtures for the low boiling ionic liquid and the alcohols and (1-butanol or 2-butanol + ethyl acetate). The interaction parametersobtained from the VBMR correlation, as well as the relative meanstandard deviation, s, are presented as a function of temperaturein table 8 and the V1m;1 and V1m;2 results from the Redlich–Kisterparameters and the VBMR calculations are presented in table 9.
For the (IL + 2-propanol or 1-butanol or 2-butanol) system, thevalues of the partial molar volume at infinite dilution for IL V1m;1 arepositive and the trend is 2-butanol < 1-butanol < 2-propanol,except for 1-butanol at T = 298.15 K. In general, the partial molar
(a) (b)
(c)
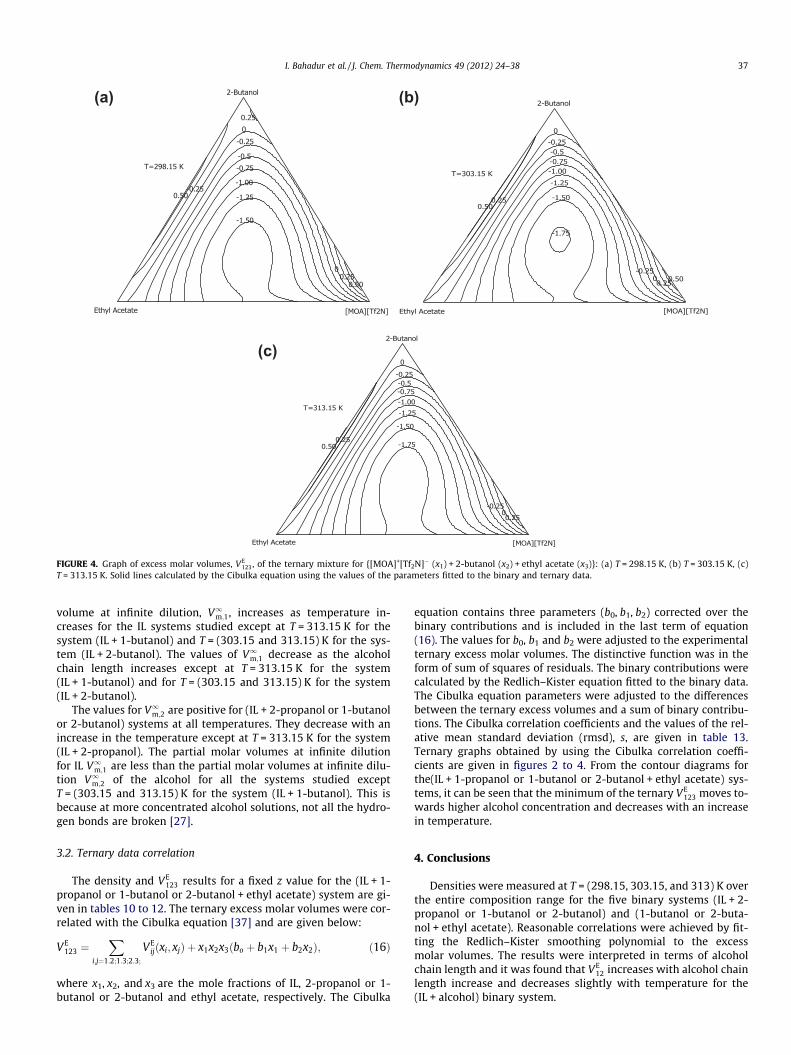
FIGURE 4. Graph of excess molar volumes, VE123, of the ternary mixture for {[MOA]+[Tf2N]� (x1) + 2-butanol (x2) + ethyl acetate (x3)}: (a) T = 298.15 K, (b) T = 303.15 K, (c)
T = 313.15 K. Solid lines calculated by the Cibulka equation using the values of the parameters fitted to the binary and ternary data.
I. Bahadur et al. / J. Chem. Thermodynamics 49 (2012) 24–38 37
volume at infinite dilution, V1m;1, increases as temperature in-creases for the IL systems studied except at T = 313.15 K for thesystem (IL + 1-butanol) and T = (303.15 and 313.15) K for the sys-tem (IL + 2-butanol). The values of V1m;1 decrease as the alcoholchain length increases except at T = 313.15 K for the system(IL + 1-butanol) and for T = (303.15 and 313.15) K for the system(IL + 2-butanol).
The values for V1m;2 are positive for (IL + 2-propanol or 1-butanolor 2-butanol) systems at all temperatures. They decrease with anincrease in the temperature except at T = 313.15 K for the system(IL + 2-propanol). The partial molar volumes at infinite dilutionfor IL V1m;1 are less than the partial molar volumes at infinite dilu-tion V1m;2 of the alcohol for all the systems studied exceptT = (303.15 and 313.15) K for the system (IL + 1-butanol). This isbecause at more concentrated alcohol solutions, not all the hydro-gen bonds are broken [27].
3.2. Ternary data correlation
The density and VE123 results for a fixed z value for the (IL + 1-
propanol or 1-butanol or 2-butanol + ethyl acetate) system are gi-ven in tables 10 to 12. The ternary excess molar volumes were cor-related with the Cibulka equation [37] and are given below:
VE123 ¼
Xi;j¼1:2;1:3;2:3;
VEijðxi; xjÞ þ x1x2x3ðbo þ b1x1 þ b2x2Þ; ð16Þ
where x1, x2, and x3 are the mole fractions of IL, 2-propanol or 1-butanol or 2-butanol and ethyl acetate, respectively. The Cibulka
equation contains three parameters (b0, b1, b2) corrected over thebinary contributions and is included in the last term of equation(16). The values for b0, b1 and b2 were adjusted to the experimentalternary excess molar volumes. The distinctive function was in theform of sum of squares of residuals. The binary contributions werecalculated by the Redlich–Kister equation fitted to the binary data.The Cibulka equation parameters were adjusted to the differencesbetween the ternary excess volumes and a sum of binary contribu-tions. The Cibulka correlation coefficients and the values of the rel-ative mean standard deviation (rmsd), s, are given in table 13.Ternary graphs obtained by using the Cibulka correlation coeffi-cients are given in figures 2 to 4. From the contour diagrams forthe(IL + 1-propanol or 1-butanol or 2-butanol + ethyl acetate) sys-tems, it can be seen that the minimum of the ternary VE
123 moves to-wards higher alcohol concentration and decreases with an increasein temperature.
4. Conclusions
Densities were measured at T = (298.15, 303.15, and 313) K overthe entire composition range for the five binary systems (IL + 2-propanol or 1-butanol or 2-butanol) and (1-butanol or 2-buta-nol + ethyl acetate). Reasonable correlations were achieved by fit-ting the Redlich–Kister smoothing polynomial to the excessmolar volumes. The results were interpreted in terms of alcoholchain length and it was found that VE
12 increases with alcohol chainlength increase and decreases slightly with temperature for the(IL + alcohol) binary system.
38 I. Bahadur et al. / J. Chem. Thermodynamics 49 (2012) 24–38
The Cibulka correlation gave a good qualitative description ofthe experimental ternary excess molar volume data.
Acknowledgement
The authors acknowledge the National Research Foundation,South Africa, for funding.
References
[1] M. Freemantle, Chem. Eng. News 76 (1998) 32.[2] C.T. Wu, K.N. Marsh, A.V. Deev, J.A. Boxall, J. Chem. Eng. Data 48 (2003) 486–
491.[3] A.J. Carmichael, K.R. Seddon, J. Phys. Org. Chem. 13 (2000) 591–598.[4] R. Hagiwara, Y. Ito, J. Flourine Chem. 105 (2000) 222–227.[5] D.S.H. Wong, J.P. Chen, J.M. Chanh, C.H. Chou, Fluid Phase Equilib. (2002) 194–
197.[6] P. Wasserscheid, C.M. Gordon, C. Hilgers, M.J. Muldoon, I.R. Dunkin, Chem.
Commun. (2001) 1186–1187.[7] C.E. Song, W.H. Shim, E.J. Roh, S.G. Lee, L.H. Choi, Chem. Commun. (2001)
1122–1123.[8] V. Najdanovic-Visak, J.M.S. Esperanca, L.P.N. Rebelo, Phys. Chem. Chem. Phys. 4
(2002) 1701–1703.[9] P. Wasserscheid, W. Keim, Angew. Chem. Int. Ed. 39 (2000) 3772–3789.
[10] T. Fischer, A. Sethi, T. Welton, J. Woolf, Tetrahedron Lett. 40 (1999) 793–796.[11] Y. Chauvin, H. Olivier-Bourbigou, Chemtech 25 (1995) 26.[12] J.S. Wilkes, M.J.J. Zaworotko, Chem. Soc. Chem. Commun. (1992) 965–966.[13] R.D. Rogers, K.S. Seddon, ACS Symposium Series, vol. 818, American Chemical
Society, Washington, 2002.[14] R.D. Rogers, K.S. Seddon, ACS Symposium Series, vol. 818, American Chemical
Society, Washington, 2002 (Chap. 856).[15] V. Najdanovic-Visak, J.M.S.S. Esperanca, L.P.N. Rebelo, M. Nunes da Ponte, H.J.R.
Guedes, K.R. Seddon, J. Szydlowski, J. Phys. Chem. 4 (2002) 1701–1703.
[16] N. Deenadayalu, I. Bahadur, T. Hofman, J. Chem. Thermodyn. 42 (2010) 726–733.
[17] N. Deenadayalu, I. Bahadur, T. Hofman, J. Chem. Eng. Data 55 (2010) 2636–2642.
[18] Y. Zhong, H. Wang, K. Diao, J. Chem. Thermodyn. 39 (2007) 291–296.[19] A.B. Pereiro, A. Rodriguez, J. Chem. Thermodyn. 39 (2006) 978–989.[20] P.W. Aktins, Physical Chemistry, fourth ed., Oxford University Press, 1990. pp.
155–156.[21] U. Domanska, A. Pobudkowska, A. Wisniewska, J. Soln. Chem. 35 (2006) 311–
332.[22] N. Deenadayalu, S. Kumar, P. Bhujrajh, J. Chem. Thermodyn. 39 (2007) 1318–
1324.[23] P. Bhujrajh, N. Deenadayalu, J. Soln. Chem. 36 (2007) 563–672.[24] I. Bahadur, N. Deenadayalu, T. Hofman, J. Chem. Eng. Data 56 (2011) 1682–
1686.[25] N. Deenadayalu, P. Bhujrajh, J. Chem. Eng. Data 53 (2008) 1098–1102.[26] P.N. Sibiya, N. Deenadayalu, J. Chem. Thermodyn. 40 (2008) 1041–1045.[27] L. Moravkova, J. Linek, J. Chem. Thermodyn. 40 (2008) 671–676.[28] N. Deenadayalu, S. Sen, P.N. Sibiya, J. Chem. Thermodyn. 41 (2009) 538–548.[29] J.A. Riddick, W.B. Bunger, T.K. Sakano, Organic Solvents: Physical Properties
and Methods of Purification, fourth ed., Wiley, New York, 1988.[30] A.B. Pereiro, A. Rodríguez, J. Canosa, J. Tojo, J. Chem. Thermodyn. 37 (2005)
249–257.[31] O. Redlich, A.T. Kister, Ing. Eng. Chem. 40 (1948) 345–348.[32] E. Gómez, B. González, N. Calvar, E. Tojo, Á. Dominguez, J. Chem. Eng. Data 51
(2006) 2096–2102.[33] F. Maurlzo, L. Romano, J. Chem. Eng. Data 33 (1998) 415–417.[34] J.M. Resa, C. Gonzalez, M. Juez, S.O. Landaluce, J. Fluid Phase Equilib. 217
(2004) 175–180.[35] N. Deenadayalu, Ph.D. Thesis, University of Natal, 2002, pp. 18–58.[36] S. Gummadi, S. Sen, AIChE Spring Meeting, New Orleans, USA, 2008.[37] I. Cibulka, Coll. Czech. Commun. 47 (1982) 1414–1419.[38] M.I. Aralaguppi, C.V. Jadar, T.M. Aminabhavi, J. Chem. Eng. Data 130 (1996)
207–222.
JCT -11-411
Copyright © 2022 FDOKUMEN