Role of Doa1 in the Saccharomyces cerevisiae DNA Damage Response
Upload
independentCategory
view
0download
0
Appl Microbiol Biotechnol (2006) 70: 237–246DOI 10.1007/s00253-005-0070-2
APPLIED MICROBIAL AND CELL PHYSIOLOGY
Sung A. Schoondermark-Stolk . Michael Jansen .Janine H. Veurink . Arie J. Verkleij . C. Theo Verrips .Gert-Jan W. Euverink . Johannes Boonstra .Lubbert Dijkhuizen
Rapid identification of target genes for 3-methyl-1-butanolproduction in Saccharomyces cerevisiae
Received: 17 April 2005 / Revised: 16 June 2005 / Accepted: 16 June 2005 / Published online: 23 July 2005# Springer-Verlag 2005
Abstract Extracellular conditions determine the taste offermented foods by affecting metabolite formation by themicro-organisms involved. To identify targets for improve-ment of metabolite formation in food fermentation pro-cesses, automated high-throughput screening and cDNAmicroarray approaches were applied. Saccharomyces cer-evisiae was cultivated in 96-well microtiter plates, and theeffects of salt concentration and pH on the growth andsynthesis of the fusel alcohol-flavoured substance, 3-meth-yl-1-butanol, was evaluated. Optimal fermentation con-ditions for 3-methyl-1-butanol concentration were found atpH 3.0 and 0% NaCl. To identify genes encoding enzymeswith major influence on product formation, a genome-widegene expression analysis was carried out with S. cerevisiaecells grown at pH 3.0 (optimal for 3-methyl-1-butanol for-mation) and pH 5.0 (yeast cultivated under standard condi-tions). A subset of 747 genes was significantly inducedor repressed when the pH was changed from pH 5.0 to3.0. Expression of seven genes related to the 3-methyl-1-butanol pathway, i.e. LAT1, PDX1, THI3, ALD4, ILV3,ILV5 and LEU4, strongly changed in response to thisswitch in pH of the growth medium. In addition, genesinvolved in NAD metabolism, i.e. BNA2, BNA3, BNA4 andBNA6, or those involved in the TCA cycle and glutamatemetabolism, i.e. MEU1, CIT1, CIT2, KDG1 and KDG2,displayed significant changes in expression. The resultsindicate that this is a rapid and valuable approach for iden-tification of interesting target genes for improvement ofyeast strains used in industrial processes.
Introduction
Food fermentation covers a wide range of microbial pro-cessing. Changes in extracellular conditions during thefood fermentation have great impact on the final productquality. They influence the microbial metabolic fluxes,growth and the production of flavour compounds (Bisson1999; Ribéreau-Gayon et al. 2000). Important issues inindustrial food fermentation, i.e. quality, taste and processtime, concern the efficiency of the process. Improvementsin efficiency are usually obtained via strain selection orstrain improvement (Volschenk et al. 2001). Consequently,up-to-date knowledge is required of the physiology, me-tabolism and genetic properties of the fermenting micro-organisms.
High-throughput techniques for metabolite screeningand gene expression analysis provide suitable tools for de-tailed analysis of microbial physiology. We applied a pow-erful combination of a microtiter plate (MTP) metabolitescreening assay with high-density cDNA filters (micro-array gene expression analysis) to investigate the produc-tion of fusel alcohols. These alcohols are important flavoursubstances in fermented foods. Since a pH- and salt-step isincluded in many food fermentations such as soy sauce, weinvestigate the effects of changes in important extracellularparameters such as pH and salt concentration on the for-mation of fusel alcohols in Saccharomyces cerevisiae.
TheMTPmetabolite screening assay allows rapid screen-ing of metabolite formation under different fermentationconditions. Cells are cultivated in 96 deep-well MTPs, eachwell representing an individual extracellular condition withminor variations in pH and salt concentration. Using a ded-icated facility with several MTP handling and pipettingrobots (http://www.bioexplore.com), large numbers of con-ditions can be screened in a relatively short time. The com-pounds of interest produced, e.g. amino acids and alcohols,can be analysed using GC or HPLC-MS methods (Jansenet al. 2003). cDNAmicroarrays visualize the genome-wideexpression profile of an organism. New sets of induced andrepressed genes have been identified by the use of micro-arrays, in response to gene deletions or to various extra-
S. A. Schoondermark-Stolk (*) . M. Jansen . J. H. Veurink .A. J. Verkleij . C. T. Verrips . G.-J. W. Euverink . J. Boonstra .L. DijkhuizenDepartment of Molecular Cell Biologyand the Institute of Biomembranes (IB),Utrecht University,Padualaan 8,3584 CH Utrecht, The Netherlandse-mail: [email protected]

cellular changes (Gasch and Werner-Washburne 2002).Using optimal growth conditions for metabolite formationestablished by the high-throughput metabolite screening,cDNA microarray analysis was applied to identify meta-bolic processes and pathways involved in fusel alcoholproduction in S. cerevisiae. The latter are potential targetsfor subsequent strain improvement studies.
Fusel alcohols 3-methyl-1-butanol (isoamyl alcohol),2-methyl-1-butanol (active amyl alcohol) and 2-methyl-1-propanol (isobutyl alcohol) are produced during the ca-tabolism of branched chain amino acids (BCAA) leucine,isoleucine and valine (Ehrlich 1904), or they are synthe-sized de novo during the biosynthesis of the BCAA(Hammond 1993). However, the precise pathways forfusel alcohol production by yeast are poorly understoodat present. The effects of important food fermentation pa-rameters such as pH and salt-concentration on underlyingmolecular mechanisms remain unknown.
The aim of this study is to identify genes in S. cerevisiaeleading to the secondary metabolite 3-methyl-1-butanol inconditions relevant to food fermentation. The metabolitescreening exposed the effects of pH and NaCl on thefermentative pattern of S. cerevisiae: optimal growth con-ditions for fusel alcohol synthesis were pH 3.0 and 0%NaCl. The gene expression profiles showed an up-regula-tion of specific genes encoding for enzymes involved infusel alcohol production at low pH. In addition, genesinvolved in leucine metabolism and NADmetabolism werestrongly expressed under these conditions.
Materials and methods
Strain, growth media and cultivation procedures
Saccharomyces cerevisiae wild-type strain CEN.PK113-7D was used. Cultures were maintained on skimmed milkand glycerol at −800°C. Preculturing of S. cerevisiae wasdone at 30°C and 150 rpm on a rotary shaker (UnitronAJ200 shaker, Infors AG, Bottmingen, Switzerland) in500-ml Erlenmeyer flasks containing 100 ml medium. Themedium used was yeast nitrogen base (YNB) without am-monium sulphate and amino acids (Difco Laboratories,MI, USA), supplemented with 2% glucose (autoclaved),(NH4)2SO4 (5 mM) and citrate buffer (0.2 M; also con-taining 0.1 M KH2PO4) at pH 5.0. The complete mediumwas filter-sterilized (Millex 0.22 μm, Millipore, Billerica,MA, USA). Cultures were grown until exhausted of thenitrogen source, and cells were stored at 40°C and used asinoculum for further experiments. Experiments in batchcultures (0.5% inoculum) were done in duplicate as de-scribed above, with L-leucine (10 mM) as nitrogen sourceat 30°C and 150 rpm. At different time points, opticaldensity at 600 nm and 3-methyl-1-butanol concentrationswere measured.
Adaptation to high NaCl concentrations was achievedby transferring cultures (1% v/v) to fresh medium con-taining 2% NaCl and growing until exhausted of nitrogensource. This procedure was repeated three times, increas-
ing NaCl concentration by 2% per step until it reached8% NaCl. Experiments in deep-well (96-well) microtiterplates with a pH gradient (in one direction at eight differentvalues of pH 3.0, 3.5, 4.0, 4.5, 5.0, 5.5, 6.0 and 7.0) and anNaCl gradient (in the other direction with six differentconcentrations of 0 to 10% NaCl with a step-size of 2%NaCl) were inoculated to an OD600 of 1.0 and incubated at30°C. This high initial OD600 value was chosen in order toreduce differences in lag-phase between different wells.The inocula for wells with medium containing 0, 2, 4, 6, 8and 10% NaCl were precultured on medium containing 0,2, 4, 6 and 8% NaCl, respectively. Erlenmeyer flasks(500 ml, containing 100 ml medium) were incubated at150 rpm on a rotary shaker and (deep-well) microtiterplates. The microtiter plates were capped to prevent evap-oration. MTPs were shaken at 900 rpm (total orbit of1.5 mm) on a Titramax 1000 rotary shaker (Heidolph In-struments, Schwabach, Germany). After rapid cooling ofmicrotiter plates, or samples, at 40°C for at least 30 min,metabolites were measured in supernatants obtained aftercentrifugation using a centrifuge with a rotor for (deep-well) microtiter plates (Sigma, Sigma laboratory centri-fuges GmbH, Osterode, Germany).
Analytical methods
3-Methyl-1-butanol concentrations were determined bygas chromatography with flame ionization detector (GC8000 Top equipped with two autosamplers in order todouble the number of samples that can be handled at thesame time; CE Instruments, Thermoquest, Milan, Italy),using on-column injection and helium as carrier gas. Col-umns used were Zebron ZB-1 (30 m, ID 0.32 mm, 0.50 μmfilm; Phenomenex, Torrance, CA, USA) and DB-WAX(30 m, ID 0.53 mm, 1.00 μm film; J and W Scientific,Folsom, CA, USA). Samples were extracted with methylformate (1:3) containing 1-hexanol or 1-pentanol as inter-nal standards.
Methods were optimized for fast separation by usingshort temperature gradients to increase the throughput ofsamples (retention times of 5 min or less). L-Leucine wasmeasured using HPLC after derivatization with 30 μlophthalaldehyde/3-mercaptopropionate mixture (25 mMo-phthalaldehyde and 25 mM 3-mercaptopropionate in50% methanol) and 200 μl 0.3 M borate buffer (pH 9.3).The system was equipped with a Luna 5 μC18 column(30×4.60 mm, Phenomenex) and a UV6000LP diodearray detector (Thermo Separation Products, San Jose, CA,USA); the eluate was monitored at 335 nm. Growth wasmeasured in a polycarbonate microtiter plate at 600 nm afterappropriate dilution in water using a spectrophotometer(SPECTRAmax PLUS384 Microplate Spectrophotometer;Molecular Devices, Sunnyvale, CA, USA). Above-men-tioned assays were routinely done using automated robot-ized equipment for pipetting and plate handling: the Plato-7pipetting robot (Rosys-Anthos, Hombrechtikon, Switzer-land), the Zymate robot for plate handling and the Ra-pidPlate-96 pipetting robot (Zymark, MA, USA). Contour
238
plots were made using MATLAB Version 6.1.0.450 Re-lease 12.1 (MathWorks, Natick, MA, USA).
Cell extract preparation, synthesis of cDNA probe,GeneFilter hybridization, data analysis and spotvalidation
Samples for cell extracts were taken from the Erlenmey-er cultures at t=24 h. Cell extracts and [33P]CTP-labelledcDNAwere prepared as previously described (Schoondermark-Stolk et al. 2002). The procedure for hybridization of theGeneFilter membranes (Life Technologies, Breda, TheNetherlands), data analysis (using ImaGene 4.0 microarrayanalysis software; BioDiscovery, Marina del Rey, CA,USA) and spot validation was performed as described(Schoondermark-Stolk et al. 2002). The expression profileof S. cerevisiae cells cultivated at pH 3.0 and 5.0 wereinvestigated with two independent duplo microarray hy-bridizations. After scanning and image processing, the fil-ters were stripped and hybridized a second time with probesfrom the same batch. In this way, four genome-wide datasets were obtained for pH 3.0 as well as for pH 5.0.
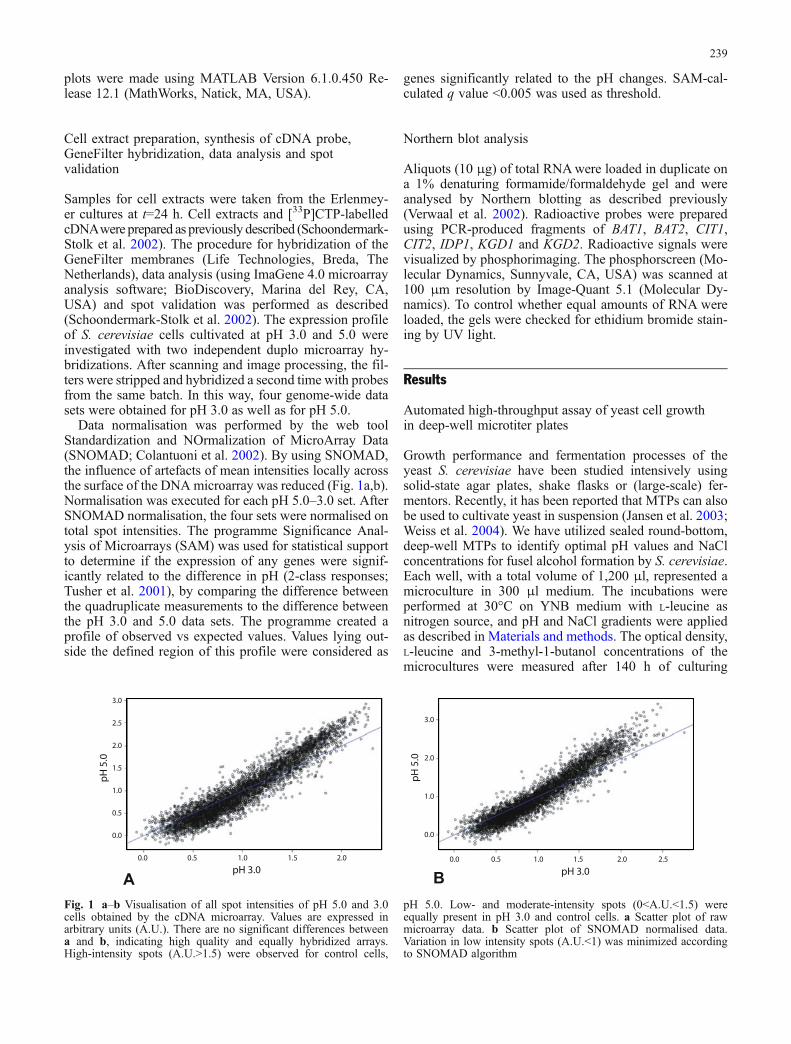
Data normalisation was performed by the web toolStandardization and NOrmalization of MicroArray Data(SNOMAD; Colantuoni et al. 2002). By using SNOMAD,the influence of artefacts of mean intensities locally acrossthe surface of the DNAmicroarray was reduced (Fig. 1a,b).Normalisation was executed for each pH 5.0–3.0 set. AfterSNOMAD normalisation, the four sets were normalised ontotal spot intensities. The programme Significance Anal-ysis of Microarrays (SAM) was used for statistical supportto determine if the expression of any genes were signif-icantly related to the difference in pH (2-class responses;Tusher et al. 2001), by comparing the difference betweenthe quadruplicate measurements to the difference betweenthe pH 3.0 and 5.0 data sets. The programme created aprofile of observed vs expected values. Values lying out-side the defined region of this profile were considered as
genes significantly related to the pH changes. SAM-cal-culated q value <0.005 was used as threshold.
Northern blot analysis
Aliquots (10 μg) of total RNAwere loaded in duplicate ona 1% denaturing formamide/formaldehyde gel and wereanalysed by Northern blotting as described previously(Verwaal et al. 2002). Radioactive probes were preparedusing PCR-produced fragments of BAT1, BAT2, CIT1,CIT2, IDP1, KGD1 and KGD2. Radioactive signals werevisualized by phosphorimaging. The phosphorscreen (Mo-lecular Dynamics, Sunnyvale, CA, USA) was scanned at100 μm resolution by Image-Quant 5.1 (Molecular Dy-namics). To control whether equal amounts of RNA wereloaded, the gels were checked for ethidium bromide stain-ing by UV light.
Results
Automated high-throughput assay of yeast cell growthin deep-well microtiter plates
Growth performance and fermentation processes of theyeast S. cerevisiae have been studied intensively usingsolid-state agar plates, shake flasks or (large-scale) fer-mentors. Recently, it has been reported that MTPs can alsobe used to cultivate yeast in suspension (Jansen et al. 2003;Weiss et al. 2004). We have utilized sealed round-bottom,deep-well MTPs to identify optimal pH values and NaClconcentrations for fusel alcohol formation by S. cerevisiae.Each well, with a total volume of 1,200 μl, represented amicroculture in 300 μl medium. The incubations wereperformed at 30°C on YNB medium with L-leucine asnitrogen source, and pH and NaCl gradients were appliedas described in Materials and methods. The optical density,L-leucine and 3-methyl-1-butanol concentrations of themicrocultures were measured after 140 h of culturing
A BpH 3.0 pH 3.0
pH
5.0
pH
5.0
0.0 0.5 2.01.5
0.0
1.0
1.0
2.0
3.0
2.50.0 0.5
0.5
2.01.5
0.0
1.0
1.5
1.0
2.0
3.0
2.5
Fig. 1 a–b Visualisation of all spot intensities of pH 5.0 and 3.0cells obtained by the cDNA microarray. Values are expressed inarbitrary units (A.U.). There are no significant differences betweena and b, indicating high quality and equally hybridized arrays.High-intensity spots (A.U.>1.5) were observed for control cells,
pH 5.0. Low- and moderate-intensity spots (0<A.U.<1.5) wereequally present in pH 3.0 and control cells. a Scatter plot of rawmicroarray data. b Scatter plot of SNOMAD normalised data.Variation in low intensity spots (A.U.<1) was minimized accordingto SNOMAD algorithm
239

(Fig. 2a–c). A change in pH over the range 3.0–7.0 had nomajor influence on the final OD600 of the yeast after 140 hof culturing, when no NaCl was present in the medium.Changes in pH in combination with NaCl, on the otherhand, caused significantly reduced growth at pH<4.0 withNaCl concentrations of 2.5% w/v and higher (Fig. 2a). Inaddition, in an acidic environment at pH below 4.0, ele-vated 3-methyl-1-butanol concentrations were measured(Fig. 2c). A maximal formation of 3.4 mM 3-methyl-1-butanol was established at pH 3.0. A clear correlation wasobserved between growth (Fig. 2a) and the external L-leucine concentration (Fig. 2b). When the cells reached amaximum OD600 of 15, no residual L-leucine was mea-sured in the medium, indicating that all L-leucine had beenconsumed. No residual L-leucine was detected when theextracellular NaCl-concentration remained under 6% w/v.NaCl had an inhibitory effect on the 3-methyl-1-butanolformation (Fig. 2c). Thus, MTP screening revealed thatS. cerevisiae formed the highest 3-methyl-1-butanol con-centration (3.4 mM) at low pH (pH 3.0) in the absence ofNaCl (Fig. 2c).
Gene expression analysis
To identify candidate genes involved in fusel alcoholformation whose expression is affected by a lowering ofextracellular pH, we compared the genome-wide gene ex-pression profiles of S. cerevisiae grown at pH 3.0 with pH5.0, the standard cultivation pH, without any NaCl present.Yeast growth and product formation in the MTP culturescan be extrapolated to Erlenmeyer flask batch cultures
(Jansen et al. 2003). In 500-ml Erlenmeyer flasks undersimilar conditions as MTP cultures, the 3-methyl-1-butanolconcentration reached a maximum of 5.4 mM, with a yieldof 0.74 mmol 3-methyl-1-butanol per OD600 at pH 5.0(Fig. 3a,b). At pH 3.0, the 3-methyl-1-butanol yield in-creased by 13% compared to the control and reached0.85 mmol per OD600. Although the difference in 3-meth-yl-1-butanol yield was less obvious as observed in theMTP, cells cultivated at pH 3.0 showed the highestflavour production.
Total cellular RNAs were isolated from the cells andused as templates for 33P-labelled cDNAs. 33P-LabelledcDNAs were then hybridized with the DNA filters con-taining 6,144 ORFs, covering >95% of the total ORFsof the S. cerevisiae genome database. Using the softwareprogramme SAM (Tusher et al. 2001) and a fold-changethreshold >2, 747 genes were identified with an alteredexpression level in pH 3.0 cells as compared to the control.A total of 388 genes showed a down-regulation at pH 3.0,and 359 genes were up-regulated at pH 3.0.
Characterization of expression of genes involved infusel alcohol production
Cellular fusel alcohol production is the net result of ac-tivities of both the BCAA degradation and biosynthesispathways. Expression ratios of 13 genes were established,encoding enzymes involved in these pathways according tothe Kyoto encyclopedia of genes and genomes (KEGG)Pathway Database (Kanehisa 1997; Kanehisa and Goto2000) (Table 1). Three genes involved in the L-leucinedegradation, BAT1, BAT2 and ERG13, encoding a mito-chondrial branched chain amino acid transferase, cytosolicbranched chain amino acid transferase and 3-hydroxy-3-methylglutaryl-CoA synthase, respectively, were clearlyexpressed (Fig. 4). The genes LEU1 and LEU2, involvedin the leucine biosynthesis, encoding 3-isopropylmalatedehydratase and 3-isopropylmalate dehydrogenase, respec-tively, were also clearly expressed (Fig. 4). ALD6 (cyto-solic aldehyde dehydrogenase), ILS1 (isoleucine-tRNAligase), ILV2 (acetolactate synthase) and VAS1 (valyl-tRNAsynthase), involved in the isoleucine and valine pathways,showed high transcriptional activities. Expression of thesegenes was observed at both pH 5.0 and 3.0. The genesALD4 (mitochondrial aldehyde dehydrogenase), ILV3(mitochondrial dihydroxy-acid dehydratase), ILV5 (mito-chondrial ketol-acid reductoisomerase) and LEU4 (mito-chondrial 2-isopropylmalate synthase) were only expressedin cells cultivated at pH 5.0. No expression of HAT2 (sub-unit of the major yeast histone acetyltransferase), HPA3(histone and other protein acetyltransferase), CDC60 (Leu-cine-tRNA ligase), ILV6 (regulatory subunit of acetolac-tate synthase), ISM1 (isoleucine-tRNA ligase), NAM2(leucyl-tRNA synthase),MAK3 (N-acetyltransferase),POT1(peroxisomal acetyl-CoAC-acyltransferase) and ALD5 [mi-tochondrial aldehyde dehydrogenase (NAD+)], was de-tected either in pH 3.0 or in pH 5.0 grown cells.
Fig. 2 a–c Contour plots of S. cerevisiae grown in deep-wellmicrotiter plates in medium with 6% glucose and 10 mM L-leucineat 30°C with final values of a OD600, bL-leucine (mM), c 3-methyl-1-butanol (mM). Vertical bars indicate OD600 values or metaboliteconcentrations
240

In addition to the genes mentioned above, the ratios foranother 11 genes linked to fusel alcohol production as de-scribed in the literature were established (Table 2). Thesegenes encoded permeases, decarboxylases and dehydro-genases. Transcripts of BAP2 and BAP3, encoding for ahigh-affinity leucine permease and valine transporter, wereonly detected at pH 3.0 (Table 2). The genesGAP1 (generalamino acid permease), ADH1 (cytosolic alcohol dehydro-genase), PDC1 (pyruvate decarboxylase isozyme 1), PDC5(pyruvate decarboxylase isozyme 2), PDC6 (pyruvate de-carboxylase isozyme 3) and YAL061W (member of alcoholdehydrogenase family) were expressed at both pH valueswithout significant differences. Another three genes, LAT1(part of pyruvate dehydrogenase complex), PDX1 (pyru-vate dehydrogenase complex proteinX) andTHI3 (4-methyl-2-oxopentanoic acid decarboxylase), were down-regulatedat pH 3.0. Transcripts of regulators like LEU3 and SSY1,encoding for a transcriptional regulator of several transport-er genes including BAP2 (Forsberg et al. 2001), were notdetected. Transcripts of GCN4, general regulator of geneexpression during amino acid starvation (Natarajan et al.2001), were detected at both pH 3.0 and 5.0.
Of the gene groups involved in fusel alcohol production,a total of 17 genes were strongly expressed at pH 3.0. Nineof them, BAP2, BAP3, LAT1, PDX1, THI3, ALD4, ILV3,ILV5 and LEU4 displayed an altered gene expression. Thesegenes may play critical roles in the enhanced fusel alcoholproduction at pH 3.0.
Using over-represented gene ontology (GO) groups ofup-regulated genes, alternative potential target genes for
strain improvement were found. From the genome wideprofile, we identified 28 different GO groups, significantlyup-regulated at pH 3.0 (Table 3) (Ashburner et al. 2000).From the 359 up-regulated genes at pH 3.0, 358 wereannotated to a given GO group (directly or indirectly).Since a gene may appear in several GO groups, the prob-ability of having x out of n annotations assigned to the sameGO group by chance was defined as the product of thenumber of permutations by which the annotations couldoccur. We applied a cut-off of p<0.01.
Significant functional categories of the 359 genes spe-cifically enhanced during growth at pH 3.0 were linked toNAD pathways [NAD biosynthesis (p=0.00024), pyridinenucleotide biosynthesis (p=0.00044), nicotinamide metab-olism (p=0.00068), and NAD metabolism (p=0.00112)]and transport (p=0.00075). NAD is a coenzyme involvedin oxidoreductase reactions, amongst them the conversionof branched chain aldehydes to fusel alcohols. BNA6,BNA2, BNA4 and BNA3, encoding enzymes required forbiosynthesis of nicotinic acid from tryptophan via thekynurenine pathway, were significantly up-regulated atpH 3.0. YOR356W, RPE1 and MDH3, three other predictedgenes in the nicotinamide pathway, including NAD andNADP, were also up-regulated at pH 3.0. In addition to thegroups associated with NAD, the group of vitamin bio-synthesis was also extracted as significantly enhanced atpH 3.0. The following GO identified groups concernedcoenzyme and prosthetic group metabolism (p=0.00190),vitamin biosynthesis (p=0.00231), water-soluble vitamin
Table 1 Hybridization signalsreferring to enzymes involvedin the metabolic pathway forvaline, leucine and isoleucineaccording to the KEGG Path-way Database (Kanehisa andGoto 2000)
Normalised spot intensity valuesin columns pH 5.0 and pH 3.0are given in arbitrary units(A.U.). Twofold up- or down-regulation is calculated in thecolumn 2log (pH 3.0·/ pH 5.0)
Gene ID pH 5.0 pH 3.0 2log (pH 3 / pH 5) Biological process
ALD4 24.6 – −14.59 Ethanol metabolismALD6 23.8 14.4 −0.73 Carbohydrate metabolismbat1 13.6 18.1 0.41 Branched chain family amino acid metabolismbat2 4.09 3.57 −0.20 Branched chain family amino acid metabolismerg13 26.6 20.3 −0.39 Ergosterol biosynthesisils1 6.06 4.62 −0.39 Isoleucyl-tRNA aminoacylationilv2 6.60 5.34 −0.30 Branched chain family amino acid biosynthesisilv3 9.61 – −13.23 Valine isoleucine biosynthesisilv5 6.61 – −12.69 Not yet annotatedleu1 17.1 17.8 0.05 Leucine biosynthesisleu2 27.1 17.2 −0.66 Leucine biosynthesisleu4 4.38 – −12.10 Leucine biosynthesisvas1 4.01 1.63 −1.30 Valyl-tRNA aminoacylation
Fig. 3 a–b Growth curves of S.cerevisiae in Erlenmeyer flasksin medium with 6% glucose and10 mM L-leucine at 30°C.Growth conditions are a pH 5.0and b pH 3.0. Triangles OD600(left axis), squaresL-leucineconcentration (mM), circles 3-methyl-1-butanol concentration(mM)
241
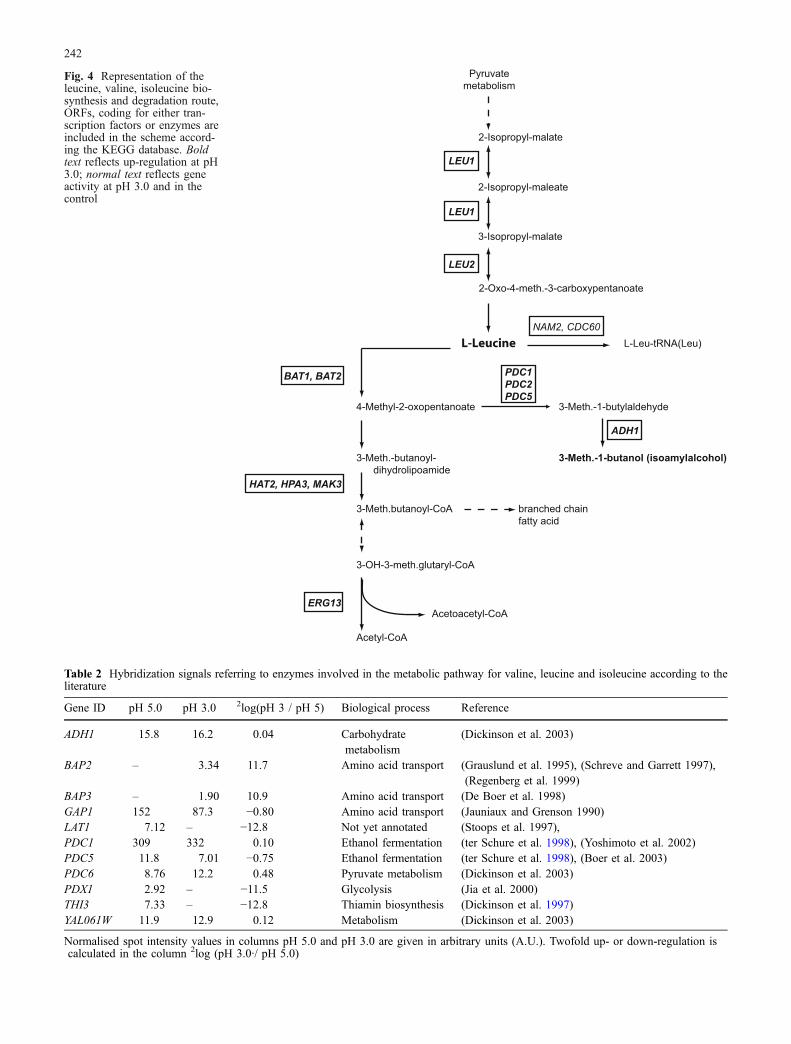
Table 2 Hybridization signals referring to enzymes involved in the metabolic pathway for valine, leucine and isoleucine according to theliterature
Gene ID pH 5.0 pH 3.0 2log(pH 3 / pH 5) Biological process Reference
ADH1 15.8 16.2 0.04 Carbohydratemetabolism
(Dickinson et al. 2003)
BAP2 – 3.34 11.7 Amino acid transport (Grauslund et al. 1995), (Schreve and Garrett 1997),(Regenberg et al. 1999)
BAP3 – 1.90 10.9 Amino acid transport (De Boer et al. 1998)GAP1 152 87.3 −0.80 Amino acid transport (Jauniaux and Grenson 1990)LAT1 7.12 – −12.8 Not yet annotated (Stoops et al. 1997),PDC1 309 332 0.10 Ethanol fermentation (ter Schure et al. 1998), (Yoshimoto et al. 2002)PDC5 11.8 7.01 −0.75 Ethanol fermentation (ter Schure et al. 1998), (Boer et al. 2003)PDC6 8.76 12.2 0.48 Pyruvate metabolism (Dickinson et al. 2003)PDX1 2.92 – −11.5 Glycolysis (Jia et al. 2000)THI3 7.33 – −12.8 Thiamin biosynthesis (Dickinson et al. 1997)YAL061W 11.9 12.9 0.12 Metabolism (Dickinson et al. 2003)
Normalised spot intensity values in columns pH 5.0 and pH 3.0 are given in arbitrary units (A.U.). Twofold up- or down-regulation iscalculated in the column 2log (pH 3.0·/ pH 5.0)
Pyruvate
metabolism
2-Isopropyl-malate
2-Isopropyl-maleate
3-Isopropyl-malate
2-Oxo-4-meth.-3-carboxypentanoate
L-Leu-tRNA(Leu)
NAM2, CDC60
LEU2
LEU1
LEU1
L-Leucine
4-Methyl-2-oxopentanoate
3-Meth.-butanoyl-
dihydrolipoamide
3-Meth.butanoyl-CoA
Acetoacetyl-CoA
Acetyl-CoA
BAT1, BAT2
HAT2, HPA3, MAK3
ERG13
branched chain
fatty acid
3-Meth.-1-butylaldehyde
3-Meth.-1-butanol (isoamylalcohol)
PDC1
PDC2
PDC5
ADH1
3-OH-3-meth.glutaryl-CoA
Fig. 4 Representation of theleucine, valine, isoleucine bio-synthesis and degradation route,ORFs, coding for either tran-scription factors or enzymes areincluded in the scheme accord-ing the KEGG database. Boldtext reflects up-regulation at pH3.0; normal text reflects geneactivity at pH 3.0 and in thecontrol
242
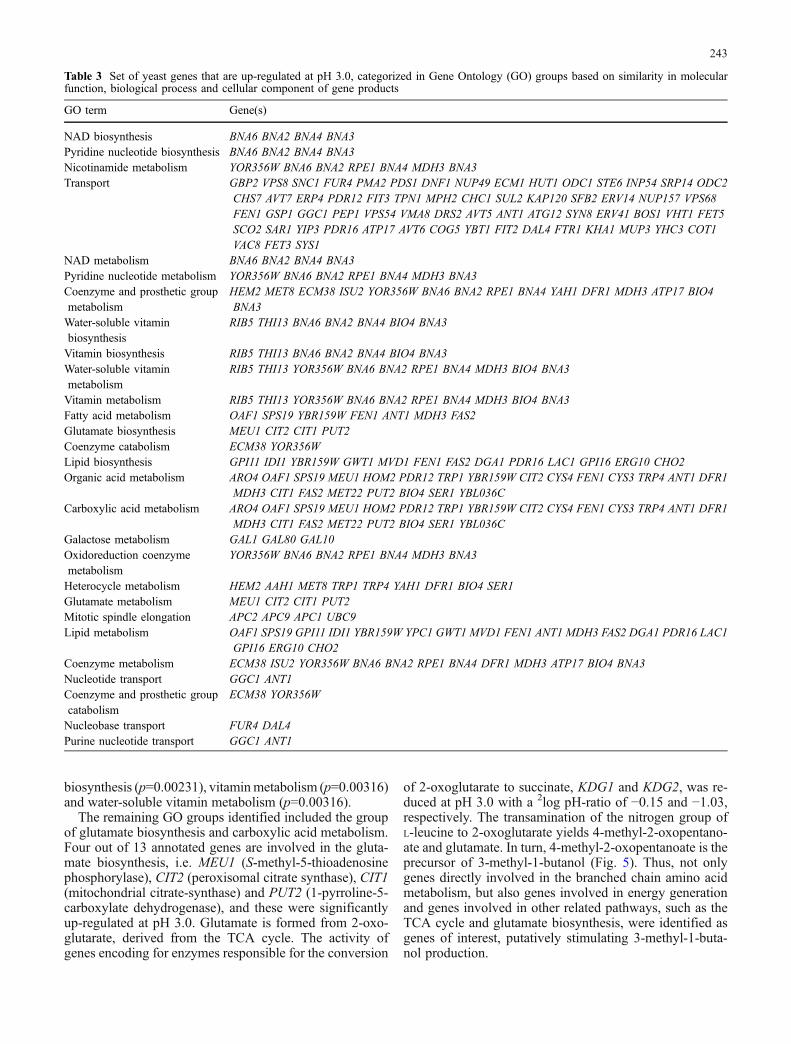
biosynthesis (p=0.00231), vitaminmetabolism (p=0.00316)and water-soluble vitamin metabolism (p=0.00316).
The remaining GO groups identified included the groupof glutamate biosynthesis and carboxylic acid metabolism.Four out of 13 annotated genes are involved in the gluta-mate biosynthesis, i.e. MEU1 (S-methyl-5-thioadenosinephosphorylase), CIT2 (peroxisomal citrate synthase), CIT1(mitochondrial citrate-synthase) and PUT2 (1-pyrroline-5-carboxylate dehydrogenase), and these were significantlyup-regulated at pH 3.0. Glutamate is formed from 2-oxo-glutarate, derived from the TCA cycle. The activity ofgenes encoding for enzymes responsible for the conversion
of 2-oxoglutarate to succinate, KDG1 and KDG2, was re-duced at pH 3.0 with a 2log pH-ratio of −0.15 and −1.03,respectively. The transamination of the nitrogen group ofL-leucine to 2-oxoglutarate yields 4-methyl-2-oxopentano-ate and glutamate. In turn, 4-methyl-2-oxopentanoate is theprecursor of 3-methyl-1-butanol (Fig. 5). Thus, not onlygenes directly involved in the branched chain amino acidmetabolism, but also genes involved in energy generationand genes involved in other related pathways, such as theTCA cycle and glutamate biosynthesis, were identified asgenes of interest, putatively stimulating 3-methyl-1-buta-nol production.
Table 3 Set of yeast genes that are up-regulated at pH 3.0, categorized in Gene Ontology (GO) groups based on similarity in molecularfunction, biological process and cellular component of gene products
GO term Gene(s)
NAD biosynthesis BNA6 BNA2 BNA4 BNA3Pyridine nucleotide biosynthesis BNA6 BNA2 BNA4 BNA3Nicotinamide metabolism YOR356W BNA6 BNA2 RPE1 BNA4 MDH3 BNA3Transport GBP2 VPS8 SNC1 FUR4 PMA2 PDS1 DNF1 NUP49 ECM1 HUT1 ODC1 STE6 INP54 SRP14 ODC2
CHS7 AVT7 ERP4 PDR12 FIT3 TPN1 MPH2 CHC1 SUL2 KAP120 SFB2 ERV14 NUP157 VPS68FEN1 GSP1 GGC1 PEP1 VPS54 VMA8 DRS2 AVT5 ANT1 ATG12 SYN8 ERV41 BOS1 VHT1 FET5SCO2 SAR1 YIP3 PDR16 ATP17 AVT6 COG5 YBT1 FIT2 DAL4 FTR1 KHA1 MUP3 YHC3 COT1VAC8 FET3 SYS1
NAD metabolism BNA6 BNA2 BNA4 BNA3Pyridine nucleotide metabolism YOR356W BNA6 BNA2 RPE1 BNA4 MDH3 BNA3Coenzyme and prosthetic groupmetabolism
HEM2 MET8 ECM38 ISU2 YOR356W BNA6 BNA2 RPE1 BNA4 YAH1 DFR1 MDH3 ATP17 BIO4BNA3
Water-soluble vitaminbiosynthesis
RIB5 THI13 BNA6 BNA2 BNA4 BIO4 BNA3
Vitamin biosynthesis RIB5 THI13 BNA6 BNA2 BNA4 BIO4 BNA3Water-soluble vitaminmetabolism
RIB5 THI13 YOR356W BNA6 BNA2 RPE1 BNA4 MDH3 BIO4 BNA3
Vitamin metabolism RIB5 THI13 YOR356W BNA6 BNA2 RPE1 BNA4 MDH3 BIO4 BNA3Fatty acid metabolism OAF1 SPS19 YBR159W FEN1 ANT1 MDH3 FAS2Glutamate biosynthesis MEU1 CIT2 CIT1 PUT2Coenzyme catabolism ECM38 YOR356WLipid biosynthesis GPI11 IDI1 YBR159W GWT1 MVD1 FEN1 FAS2 DGA1 PDR16 LAC1 GPI16 ERG10 CHO2Organic acid metabolism ARO4 OAF1 SPS19 MEU1 HOM2 PDR12 TRP1 YBR159W CIT2 CYS4 FEN1 CYS3 TRP4 ANT1 DFR1
MDH3 CIT1 FAS2 MET22 PUT2 BIO4 SER1 YBL036CCarboxylic acid metabolism ARO4 OAF1 SPS19 MEU1 HOM2 PDR12 TRP1 YBR159W CIT2 CYS4 FEN1 CYS3 TRP4 ANT1 DFR1
MDH3 CIT1 FAS2 MET22 PUT2 BIO4 SER1 YBL036CGalactose metabolism GAL1 GAL80 GAL10Oxidoreduction coenzymemetabolism
YOR356W BNA6 BNA2 RPE1 BNA4 MDH3 BNA3
Heterocycle metabolism HEM2 AAH1 MET8 TRP1 TRP4 YAH1 DFR1 BIO4 SER1Glutamate metabolism MEU1 CIT2 CIT1 PUT2Mitotic spindle elongation APC2 APC9 APC1 UBC9Lipid metabolism OAF1 SPS19 GPI11 IDI1 YBR159W YPC1 GWT1 MVD1 FEN1 ANT1 MDH3 FAS2 DGA1 PDR16 LAC1
GPI16 ERG10 CHO2Coenzyme metabolism ECM38 ISU2 YOR356W BNA6 BNA2 RPE1 BNA4 DFR1 MDH3 ATP17 BIO4 BNA3Nucleotide transport GGC1 ANT1Coenzyme and prosthetic groupcatabolism
ECM38 YOR356W
Nucleobase transport FUR4 DAL4Purine nucleotide transport GGC1 ANT1
243

To confirm the expression pattern of the genes identi-fied by SGD Gene Term Finder and thereby also justifythat the microarrays correctly reflect gene activities, the`xpressions of BAT1, BAT2, CIT1, CIT2, IDP1, KGD1and KGD2 were determined by Northern blot analysis(Fig. 6a,b). The data show that the levels of CIT1 and CIT2mRNA increased greatly in S. cerevisiae cultivated at pH
3.0 (Fig. 6a). Increase in IDP1 and decreases in KGD1 andKGD2 transcript levels were also observed; however, thepH-influence was not as significant as detected by themicroarray (Fig. 6a,b). The levels of BAT1 and BAT2 tran-scripts did not increase under the changes (Fig. 6a,b).Based on these results, we conclude that the microarrayaccurately reflected the expression patterns of the S. cere-visiae genes.
Discussion
We have designed a two-factor combinatorial assay for arapid and reliable identification of optimal fermentationconditions and elucidation of genes encoding enzymeswith major influence on product formation. The effects oftwo important food fermentation process parameters, pHand NaCl, were tested. The fusel alcohol, 3-methyl-1-butanol, was used as indicator substance relevant for thetaste of fermented foods. As shown in Fig. 2a–c, changes incell growth, L-leucine consumption and 3-methyl-1-bu-tanol production are visualized by the automated high-throughput MTP screening. The data show that thepresence of NaCl had an inhibitory effect on the fuselalcohol formation in S. cerevisiae. An acidic environmentbelow pH 5.0, amplified the inhibitory effect of NaCl onfusel alcohol production by the yeast. Furthermore, thecells did not exhibit growth- or L-leucine-consumption-dependent responses for fusel alcohol formation. Thus, no
2-oxoglutaratesuccinate
Leucine
BAT1
BAT2
3-Methyl-1-butanol
Acetyl-CoA
CIT1
KGD1
CIT2
IDP2
isocitrate
KGD2
glutamate
TCA-Cycle
Fig. 5 Schematic representation of pathways related to 3-methyl-1-butanol production. 2-Oxoglutarate is converted to succinate theTCA cycle via KDG1 and KDG2. The activity of genes encoding theenzymes was reduced at pH 3.0. Genes encoding for CIT1, CIT2 andIDP2 were up-regulated at pH 3.0
rRNA
KGD2
KGD1
IDP1
CIT2
CIT1
BAT2
BAT1
pH 5.0
pH 3
.0
A
20
10
0BAT1 KGD2KGD1CIT2CIT1BAT2 IDP1
Norm
aliz
ed e
xpre
ssio
n v
alu
es
A.U
.
B
Fig. 6 a–b Expression of genes during growth at pH 5.0 and 3.0 asdetermined by Northern blot and DNA microarray analysis. S.cerevisiae was cultivated at pH 5.0 or 3.0. Cells were harvestedat the exponential phase. a RNA was loaded on a formamide/form-
aldehyde gel and subjected to Northern blot analysis. The sampleswere loaded in duplicate. b Expression pattern of the genes in theDNA microarray experiment
244

direct relation between the uptake of branched chain aminoacids (L-leucine) and the formation of branched chain al-cohols (3-methyl-1-butanol) was observed. The highestfusel alcohol formation was measured at pH 3.0–4.0 with-out NaCl, associated with moderate L-leucine consumptionand moderate growth. This screening assay already hasallowed identification of similar extracellular parameterscrucial for fusel alcohol formation in soy sauce by the yeastZygosaccharomyces rouxii: highest fusel alcohol concen-trations were obtained at low pH (3.0–4.0) and low NaClconcentration (0–4%) (Jansen et al. 2003).
Fusel alcohol production is a major topic in food andbeverage fermentations; several studies have been per-formed to elucidate bottlenecks in the fusel alcohol for-mation pathway. Disruption or over-expression of obvioustarget genes in S. cerevisiae, such as the BCAA trans-porters BAP2 and BAP3, the BCAA transferases BAT1 andBAT2 and four pyruvate decarboxylases, i.e. PDC1, PDC5,PDC6 and YDL080c, showed that neither the uptake northe transamination or the decarboxylation of the BCAA isessential for the formation of fusel alcohols (De Boer 2000;Dickinson et al. 1997; Eden et al. 2001; Schoondermark-Stolk et al. 2005; Kispal et al. 1996; Kodama et al. 2001; terSchure et al. 1998). These observations emphasized thenecessity of further research on fusel alcohol production.Microarray technology offers the possibility of identifyinggenes that play an important role in the formation of fuselalcohols, allowing directed strain improvement in furtherwork.
The optimal fermentation condition for fusel alcoholproduction was used for cDNA microarray studies. ThecDNA microarray studies pointed to 747 genes with a sig-nificantly altered transcription activity. The different meta-bolic pathways and processes responsible for fusel alcoholproduction thus may be identified from these changed geneexpression levels. The cDNA microarray analysis demon-strated that 17 genes encoding steps in BCAA metabolismwere strongly expressed in the yeast cells. A subset of ninegenes, i.e. BAP2, BAP3, LAT1, PDX1, THI3, ALD4, ILV3,ILV5 and LEU4, showed a significantly changed geneexpression level at pH 3.0 compared to the standard pH 5.0.It has been reported that the uptake of BCAAs is not thebottleneck in fusel alcohol production (De Boer 2000;Kodama et al. 2001), which leaves the last seven genes astargets for strain improvement.
In addition to these target genes that may contribute tofusel alcohol production, we observed that numerous nic-otinamide and vitamin biosynthetic genes were inducedduring growth at pH 3.0. This was revealed by SGD GeneOntology (GO) Term Finder. Identified groups included themetabolism of nicotinamides, vitamins, fatty acids, gluta-mate and carboxylic acids (Table 3). Vitamins function, forinstance, as cofactors for various enzymes involved in me-tabolic pathways. Up-regulation of genes involved in nico-tinamide biosynthesis may be explained by an enhanceddemand for NAD at low pH in order to remove the
increased levels of reducing equivalents. However, bio-synthesis of 3-methyl-1-butanol also involves oxidoreduc-tase steps (Dickinson et al. 1997). The increased expressionof genes involved in vitamin biosynthesis and other co-enzyme biosynthesis (nicotinamides) at low pH stronglysuggests that these metabolic functions contribute to theBCAA metabolism, stimulating production of 3-methyl-1-butanol. Elevated expression of genes involved in nicotin-amide pathways may also be linked to the redox stepinvolved in the conversion of the branched chain aldehyde,e.g. 3-methyl-1-butanol to the fusel alcohol, 3-methyl-1-butanol. Since it is known already that the uptake ofBCAAs, the transaminase or the decarboxylase steps arenot the rate-limiting steps in fusel alcohol formation, thereduction step (essential for the formation of 3-methyl-1-butanol from L-leucine) thus is an important target forconstruction of improved strains.
The other GO groups identified are involved in theglutamate metabolism and tricarboxylic acid (TCA) cycle.The amino-acceptor 2-oxoglutarate is required for synthe-sis of glutamate. Glutamate is the amino-donor in theBCAA biosynthesis, and both are thus essential for fuselalcohol synthesis. Citrate is converted to 2-oxo-glutarateby the TCA cycle enzymes involving the NAD-dependentisocitrate dehydrogenase step. Our results show that thegenes CIT1 and CIT2 have an elevated expression at pH3.0, possibly reflecting that availability of 2-oxoglutarateprecursor plays a crucial role in the fusel alcohol pro-duction (Fig. 5). The activity of the KGD1 and KGD2genes was reduced at pH 3.0. Therefore, BNA6, BNA2,BNA4, BNA3, YOR356W, RPE1, MDH3, CIT1, CIT2,KGD1 and KGD2 are additional target genes for futurestudies.
In conclusion, the high-throughput microtiter screeningwas successfully applied in combination with cDNA mi-croarrays to gain insights into molecular processes duringspecific process conditions. Investigation of environment–gene interactions for identification of key enzyme steps orregulatory pathways is paramount for functional genomics,revealing targets for directed mutagenesis. The selectedgenes are promising targets for the development of im-proved production strains. This specific example illustratesthat the MTP screening assays (a) allowed a qualitativeprofiling of the effects of changes in extracellular con-ditions on fusel alcohol formation, (b) allowed rapid iden-tification of optimal process condition for fusel alcoholformation in yeast and (c) provided a firm base for sub-sequent cDNA microarray gene expression analysis. Both,the high-throughput MTP approach and the genomics canbe used to analyse any fermentation process, even withother micro-organisms.
Acknowledgements We thank Dr. Victor Winter (Utrecht Schoolof Applied Science, Universiteit Utrecht, The Netherlands) for hisassistance in the preparation of this manuscript. This research wassupported by Senter Research Grant 99028 and sponsored byUnilever Research Vlaardingen.
245

References
Ashburner M, Ball CA, Blake JA, Botstein D, Butler H, Cherry JM,Davis AP, Dolinski K, Dwight SS, Eppig JT, Harris MA, HillDP, Issel-Tarver L, Kasarskis A, Lewis S, Matese JC,Richardson JE, Ringwald M, Rubin GM, Sherlock G (2000)Gene ontology: tool for the unification of biology. The GeneOntology Consortium. Nat Genet 25:25–29
Bisson L (1999) Stuck and sluggish fermentations. Am J Enol Vitic50:107–119
Colantuoni C, Henry G, Zeger S, Pevsner J (2002) SNOMAD(Standardization and NOrmalization of MicroArray Data): web-accessible gene expression data analysis. Bioinformatics 18:1540–1541
De Boer M (2000) Fermentative production of flavours in yeast.Thesis, Mol Biol Vrije Universiteit Amsterdam
Dickinson JR, Lanterman MM, Danner DJ, Pearson BM, Sanz P,Harrison SJ, Hewlins MJ (1997) A 13C nuclear magneticresonance investigation of the metabolism of leucine to isoamylalcohol in Saccharomyces cerevisiae. J Biol Chem 272:26871–26878
Eden A, Van Nedervelde L, Drukker M, Benvenisty N, Debourg A(2001) Involvement of branched-chain amino acid aminotrans-ferases in the production of fusel alcohols during fermentationin yeast. Appl Microbiol Biotechnol 55:296–300
Ehrlich F (1904) Uber das natürliche isomere des leucins. DtschChem Ges 37:1809–1840
Forsberg H, Gilstring CF, Zargari A, Martinez P, Ljungdahl PO(2001) The role of the yeast plasma membrane SPS nutrientsensor in the metabolic response to extracellular amino acids.Mol Microbiol 42:215–228
Gasch AP, Werner-Washburne M (2002) The genomics of yeastresponses to environmental stress and starvation. Funct IntegrGenomics 2:181–192
Hammond JRM (1993) The yeasts, vol 5: yeast technology. Aca-demic, London, pp 8–67
Jansen M, Veurink JH, Euverink GJ, Dijkhuizen L (2003) Growth ofthe salt-tolerant yeast Zygosaccharomyces rouxii in microtiterplates: effects of NaCl, pH and temperature on growth and fuselalcohol production from branched-chain amino acids. FEMSYeast Res 3:313–318
Kanehisa M (1997) A database for post-genome analysis. TrendsGenet 13:375–376
Kanehisa M, Goto S (2000) KEGG: Kyoto encyclopedia of genesand genomes. Nucleic Acids Res 28:27–30
Kispal G, Steiner H, Court DA, Rolinski B, Lill R (1996) Mito-chondrial and cytosolic branched-chain amino acid transami-nases from yeast, homologs of the myc oncogene-regulatedEca39 protein. J Biol Chem 271:24458–24464
Kodama Y, Omura F, Ashikari T (2001) Isolation and characteriza-tion of a gene specific to lager brewing yeast that encodes abranched-chain amino acid permease. Appl Environ Microbiol67:3455–3462
Natarajan K, Meyer MR, Jackson BM, Slade D, Roberts C,Hinnebusch AG, Marton MJ (2001) Transcriptional profilingshows that Gcn4p is a master regulator of gene expressionduring amino acid starvation in yeast. Mol Cell Biol 21:4347–4368
Ribéreau-Gayon P, Dubourdieu D, Donèche B, Lonvaud A (2000)Handbook of enology, vol 1. Wiley, New York
Schoondermark-Stolk SA, ter Schure EG, Verrips CT, Verkleij AJ,Boonstra J (2002) Identification of salt-induced genes of Zy-gosaccharomyces rouxii by using Saccharomyces cerevisiaeGeneFilters. FEMS Yeast Res 2:525–532
Schoondermark-Stolk S, Tabernero M, Chapman J, Verrips T,Verkleij A, Boonstra J (2005) Bat2p is essential in Saccharo-myces cerevisiae for fusel alcohol production on the non-fermentable carbon source ethanol. FEMS Yeast Res 5:757–766
ter Schure EG, Flikweert MT, van Dijken JP, Pronk JT, Verrips CT(1998) Pyruvate decarboxylase catalyzes decarboxylation ofbranched-chain 2-oxo acids but is not essential for fusel alcoholproduction by Saccharomyces cerevisiae. Appl Environ Mi-crobiol 64:1303–1307
Tusher VG, Tibshirani R, Chu G (2001) Significance analysis ofmicroarrays applied to the ionizing radiation response. ProcNatl Acad Sci U S A 98:5116–5121
Verwaal R, Paalman JW, Hogenkamp A, Verkleij AJ, Verrips CT,Boonstra J (2002) HXT5 expression is determined by growthrates in Saccharomyces cerevisiae. Yeast 19:1029–1038
Volschenk H, Viljoen-Bloom M, Subden RE, van Vuuren HJ (2001)Malo-ethanolic fermentation in grape must by recombinantstrains of Saccharomyces cerevisiae. Yeast 18:963–970
Weiss A, Delproposto J, Giroux CN (2004) High-throughput phe-notypic profiling of gene–environment interactions by quanti-tative growth curve analysis in Saccharomyces cerevisiae. AnalBiochem 327:23–34
246
Copyright © 2022 FDOKUMEN


![[123doc vn] - tim-hieu-nam-men-saccharomyces-cerevisiae](https://static.fdokumen.com/doc/165x107/6345cd51f474639c9b0502af/123doc-vn-tim-hieu-nam-men-saccharomyces-cerevisiae.jpg)