Fundamentals intact, - but Hold on short-term exogenous factors
67
Fundamentals intact, but Hold on short-term exogenous factors Saudi Arabian Food and Dairy | December 2020
-
Upload
khangminh22 -
Category
Documents
-
view
0 -
download
0
Transcript of Fundamentals intact, - but Hold on short-term exogenous factors

Fundamentals intact,but Hold on short-term exogenous factors
Saudi Arabian Food and Dairy | December 2020

2
Initiate coverage on 4 Saudi food producers; favor Almarai on growth sustainability and Savola on recovering retail growth path Though remaining resilient throughout most of 2020, food consumption in Saudi Arabia, which has for long been supported by strong demographics, is likely to bear the brunt of the implemented austerity measures in the short term. In this regard, food producers under our coverage have absorbed some of the impact of a higher value-added tax (VAT) as well as cost inflation, leading to overall pressured margins. However, we believe these companies will weather the short-term hurdles and resume their growth paths as the impact of the COVID-19 pandemic subsides, supported by intact fundamentals and the region’s solid demand base. We initiate coverage on 4 Saudi food producers with Hold ratings given their limited upside, but we believe in the sustainable growth story of Almarai Company (Almarai) with its EBITDA and core earnings to grow at 6-year CAGRs of 5.1% and 9.9%, respectively, justifying the demanding P/E multiples, in our view. We also have a positive view on the Savola Group (Savola), owing to its strong 6-year EPS CAGR of 28%, capitalizing on growing investment income in Almarai (Savola owns a 34.5% stake in Almarai), its continuous deleveraging, and 5.3% EBITDA growth of core operations as its transformation plan has started to bear fruit. Despite Saudia Dairy and Foodstuff Company’s (SADAFCO) expected short-term earnings decline, the stock trades broadly in line with its peers’ average (2021 P/E multiple of 21x) on a high dividend yield and strong returns. Meanwhile, with low returns recorded, the National Agricultural Development Company (NADEC) new management is considering strategic growth and cost-saving initiatives, which we expect will drive core earnings to grow at a 6-year CAGR of 7%.
Dairy margins under pressure in 2020a and 2021e on lifting subsidies on imported feed amid milk oversupplySaudi dairy producers have been exposed to a higher cost of imported forage following the government’s decision to remove direct subsidies on imported forage effective December 2019 (except alfalfa, which is one third of animal feed). This has pressured NADEC’s profitability margin in 9M20 and will pressure Almarai’s margins in 2021, in our view, given the companies inability to fully pass on the higher cost amid the current weak purchasing power. Moreover, the current fresh milk oversupply on the expat exodus and interrupted tourism is likely to lead to increasing conversion of excess fresh milk to skim milk powder (SMP), resuming the long-life milk price discount wave. This, together with projected 11% higher SMP prices in 2021 based on future contracts, will likely pressure long-shelf-life milk producer SADAFCO’s operating margins, in our view, given its 3–6 months average stocking period of SMP. Going forward, we estimate the prices of fresh milk and long-life milk will grow at 2019–25e CAGRs of 3% and 2%, respectively.
Savola’s retail recovery to enhance EBITDA growth; stake in Almarai overshadows core operations While 77% of Savola’s value is generated from the stake owned in Almarai, we believe core operations will grow at 6-year EBITDA CAGR of 5.3%, generated mostly from the transformational plan of its retail business, which included the closure of inefficient stores, in addition to increased production of higher margin products, namely edible oils. Starting 2020, the company managed to recover its retail business through increased current store yields as well as increasing its fresh food offerings, and lately introducing its e-commerce platform. Meanwhile, its edible oil and sugar segments were hit on declining global prices and volumes due to increased competition and macro distress.
All 4 companies exploring new growth opportunities to create more value While demand for dairy products has been relatively stable, dairy producers are currently exploring further growth opportunities. Almarai, according to its 2025 strategy, is seeking to enter new segments or explore new markets (further details are undisclosed) with CAPEX requirements to be centered on maintenance of its existing facilities. Also, NADEC’s new management turnaround strategy focuses on reactivation of unutilized land plots as well as implementing cost-saving initiatives. Recently, shareholders at SADAFCO’s EGM approved an up to 9% share buyback, utilizing 79% of its strong cash balance on hand, given the highest returns provided (ROAE of 19% and ROIC of 23%). Meanwhile, Savola is capitalizing on consumer preference towards small-scale grocery stores, while a recovery in global prices should lift performance of the struggling edible oil segment.
Saudi Arabian Food and DairyFundamentals intact, but Hold on short-term exogenous factorsFood and Dairy | Saudi Arabia
Initiation of Coverage 1 December 2020
Rating: Hold
Fair value: SAR61.00
Market price: SAR54.20
Upside: 13%
Rating: Hold
Fair value: SAR33.90
Market price: SAR30.00
Upside: 13%
NADEC
Almarai Company
Please see the investment ratings and important disclosures contained on the last page of this report
*Closing as of 29 November 2020**Rebased at 100
SADAFCO
Rating: Hold
Fair value: SAR194.40
Market price: SAR175.2
Upside: 11%
Savola Group
Rating: Hold
Fair value: SAR49.3
Market price: SAR45.8
Upside: 8%
Ingy El Diwany, CFA [email protected] | +20224616352
Mohamed [email protected] | + 20224616382
4,0005,0006,0007,0008,0009,000
10,00011,00012,000
Dec-
19
Jan-
20
Feb-
20
Mar
-20
Apr-2
0
May
-20
Jun-
20
Jul-2
0
Aug-
20
Sep-
20
Oct-2
0
Nov-
20
Tadawul Food & Staples Retailing IndexTadawul (rebased)
3
1 December 2020Table of Content
I. Investment thesis 4
II. Comparative analysis 5
III. Market overview 7
IV. Operational analysis 12
Saudi dairy industry overview 14
Almarai Company 17
National Agricultural Development Company (NADEC) 28
Saudia Dairy & Foodstuff Company (SADAFCO) 34
Food Producer | Savola Group 40
APPENDIX 59

4
Saudi Arabia Consumer 1 December 2020
I. Investment thesis
We initiate coverage on 3 Saudi dairy producers, Almarai, NADEC, and SADAFCO, as well as Saudi food producer Savola. We have Hold ratings on all 4 stocks given their limited upside potential following a share price rally as well as short-term hurdles.
With limited inflation in food prices in Saudi Arabia over the last decade, we believe dairy companies under our coverage will continue to absorb some of the cost inflation arising from the higher VAT and the feed subsidy removal in the short term given weak consumer spending and changes in consumption patterns. Going forward, as domestic consumption returns to normal (expected post 2021e), we believe the companies could freely pass on expected increases in imported feed prices, which move in tandem with global oil prices. It is worth mentioning that the US Joe Biden presidency could transform the oil price movement, leading to higher positively correlated global food commodity prices on sugar, corn, and soybean, which are the main ingredients for biofuel.
Out of the dairy producers under our coverage, we favor the industry flagship Almarai, despite the company trading at a 2021e P/E multiple of 24.9x, a 36% premium compared to its peers, which is justified in our view. Capitalizing on diversified segment exposure, we expect Almarai to maintain its sustainable growth, with its EPS to grow at a 6-year CAGR of 9.9%, retaining its strong EBITDA margins. SADAFCO provides a high dividend yield, despite short-term pressure in profitability margins on higher forward SMP prices and increasing price discounts.
We anticipate Savola Group will capitalize on the retail transformational plan, which has started to reflect on enhancing its stores’ efficiency, driving consolidated EBITDA to grow at a 2020–25e CAGR of 5.3%, on our numbers. This in addition to its continuous deleveraging, and growing income from investments in Almarai, should lead to double-digit CAGR growth in EPS over 2019–25e. This is besides the projected partial improvement global edible oil prices within 2–3 years while second-tier competitors continuing to pressure market share, therefore maintaining a policy of increased production of high-margin products. We expect Savola to generate a high FCFF yield over our forecast period, attributed mainly to the lack of significant CAPEX as management awaits an improvement in its oil and sugar segments. That said, we believe management will maintain its FY19 dividend payout of 24% going forward on continuous debt settlement. We believe this all has already been priced in Savola’s share price, which currently trades at a 2021e P/E multiple of 20x, at par with the global composite peer median of 20.0x.
Figure 1: Companies’ main highlights
Company Almarai NADEC SADAFCO* Savola
Main products
Dairy products
Juice
Poultry
Bakery
Dairy products
Juice
Olive oil
Dairy products
Juice
Ice cream
Food retail
Oil
Sugar
Pasta
Frozen foods
Fast food
2019–25e revenue CAGR 5.2% 5.2% 6.8% 2%
FY21e EBITDA margin 26.9% 17.6% 17.0% 10.1%
2019–25e EBTIDA CAGR 5.1% 3.4% 4.3% 5.3%
2019–25e core earnings CAGR 9.9% 7.0% 3.0% 27.8%
*FY ends on 31 March
Figure 2: Y-T-D performance versus Tadawul Index
70
110
150
Dec-19 Jan-20 Feb-20 Mar-20 Apr-20 May-20 Jun-20 Jul-20 Aug-20 Sep-20 Oct-20 Nov-20
Savola NADEC SADAFCO Almarai TASI
Source: Bloomberg*Rebased at 100
Y-T-D share performance
Savola 34%
NADEC 30%
SADAFCO 30%
Almarai 7%
Tadawul 4%

5
Saudi Arabia Consumer 1 December 2020
II. Comparative analysis
Dairy companies comparable valuation
Company Country
MC (USDmn)
P/E P/BV EV/EBITDA EBITDA marginEarnings
CAGRDividend yield
2019 2020e 2021e 2020e 2021e 2019 2020e 2021e 2019 2020e 2021e 19/22 2020e 2021e
1. Dairy peers
Inner Mongolia YILI China 35,285 33.6 32.5 27.9 7.9 8.2 7.4 21.2 18.2 10.7% 11.1% 11.4% 11.7% 2.0% 2.3%
Vietnam Dairy
Products Vietnam 9,688 23.0 21.9 20.2 8.0 7.7 7.1 13.9 13.0 25.2% 25.4% 25.2% 5.9% 3.8% 3.9%
Bright Dairy & Food China 2,877 40.6 36.9 30.8 3.4 3.2 2.9 10.6 9.3 8.9% 8.3% 8.6% 17.6% 0.8% 1.0%
Grupo Lala Sab
De CV Mexico 1,680 15.5 20.3 16.3 1.4 1.6 1.6 7.7 7.1 11.3% 10.2% 10.5% 10.4% 4.2% 4.4%
Dutch Lady Milk
Inds Malaysia 565 22.8 23.1 20.6 21.4 13.0 10.4 14.9 13.5 N/M 14.4% 15.3% 7.2% 2.3% 2.6%
Juhayna Egypt 429 16.9 14.7 12.5 2.3 2.2 2.1 6.2 5.7 15.3% 16.4% 16.5% 17.0% 3.9% 5.1%
Nestle Lanka Plc Sri Lanka 320 18.6 21.0 19.5 10.3 N/A N/A 10.7 10.4 N/M 14.9% 14.7% 1.6% 3.8% 4.2%
Median 0 20.7 21.5 19.9 3.2 2.9 9.1 10.7 9.8 13.3% 14.7% 15.0% 8.3% 3.8% 4.1%
SADAFCO Saudi Arabia 1,506 20.0 19.8 21.0 3.5 3.4 13.7 13.1 13.5 18.8% 18.4% 17.0% -0.3% 3.0% 3.0%
NADEC Saudi Arabia 816 29.3 82.9 44.7 2.1 2.0 10.0 12.0 10.9 21.0% 17.4% 17.4% -10% 0.0% 0.0%
Weight of dairy in Almarai's earnings 74% 74% 73% 74% 73% 74% 74% 73% 74% 74% 73% 74% 74% 73%
2. Bakery peers Weights
EDITA Egypt 433 16.1 26.4 18.1 3.9 3.2 10.1 12.5 9.4 17.7% 15.1% 17.2% 2.9% 2.0% 270.6%
Mondelez Int'l United States 83,035 23.4 22.3 20.6 3.1 3.0 19.1 18.4 17.4 20.3% 20.6% 21.1% 7.2% 2.1% 2.2%
Hershey United States 32,054 26.8 24.9 23.5 17.6 15.6 18.0 17.1 16.5 24.9% 25.9% 26.2% 6.4% 2.1% 2.1%
Nestle SA-REG Switzerland 334,529 24.1 25.1 23.6 6.2 6.4 17.0 18.2 17.7 21.5% 22.0% 22.2% 3.1% 2.6% 2.7%
Tiger Brands LTD South Africa 2,561 14.3 21.1 15.9 2.2 2.1 11.0 14.4 11.5 12.1% 9.1% 11.1% 0.5% 2.5% 3.7%
Cadbury Nigeria Nigeria 50 21.6 22.9 11.8 N/A N/A 4.1 4.8 2.9 7.0% 6.6% 10.0% 27.6% NA NA
Grupo Bimbo SAB- Mexico 9,891 31.7 21.0 20.0 2.0 1.8 9.7 7.4 7.3 11.2% 13.1% 13.0% 19.3% 1.3% 1.5%
Median 23.4 22.9 20.0 3.5 3.1 11.0 14.4 11.5 17.7% 15.1% 17.2% 7.2% 2.1% 2.4%
Weight of bakery in Almarai's earnings 13% 12% 11% 12% 11% 13% 12% 11% 13% 12% 11% 13% 12% 11%
3. Poultry
Tyson Foods United States 22,712 11.3 12.4 10.7 1.5 1.4 8.2 8.3 7.7 9.6% 9.4% 9.8% 6.5% 2.7% 2.9%
MHP SE Ukraine 642 3.4 N/A 11.4 N/A N/A 4.7 5.1 4.7 22.0% 21.2% 22.2% -18.5% 4.7% 4.7%
Astral Foods South Africa 359 8.4 8.5 6.6 N/A N/A 6.1 4.5 4.0 7.1% 9.3% 9.9% 13.1% 4.4% 8.6%
Cairo Poultry Egypt 99 8.3 N/A N/A N/A N/A 3.4 N/A N/A 13.8% N/M N/M NA NA NA
Median 8.3 10.5 10.7 1.5 1.4 5.4 5.1 4.7 11.7% 9.4% 9.9% 22.3% 4.4% 4.7%
Weight of poultry in Almarai’s earnings 14% 14% 15% 14% 15% 14% 14% 15% 14% 14% 15% 14% 14% 15%
Almarai composite peer average 19.3 20.0 18.4 3.0 2.7 8.8 10.3 9.2 13.6% 14.0% 14.5% 10.1% 3.7% 4.0%
Almarai Company 28.3 25.9 24.9 3.7 3.5 16.2 15.5 14.7 29% 28% 28% 9.0% 1.7% 1.8%
Source: Bloomberg* Based on Beltone estimates ** SADAFCO FY ends on 31 March***Composite peer average is derived from the weighted average of the comparative multiples of the 3 main segments of Almarai, weighted by their annual contribution to total earnings

6
Saudi Arabia Consumer 1 December 2020
Savola comparable valuation
Company Country Mrkt cap (USDmn)
P/E (x) P/BV EV/EBITDA (x) EBITDA margin Earnings CAGR
Dividend yield (%)
2019a 2020e 2021e 2020e 2021e 2019a 2020e 2021e 2019a 2020e 2021e 19/22 2019a 2020e 2021e
Food peers
Archer Daniels Midland US 27,046 18.8 14.3 13.5 1.4 1.3 11.6 10.7 9.4 5% 5% 6% 14% 2.9 3.0 3.1
Bunge US 8,204 20.4 8.9 10.8 1.4 1.3 10.6 8.2 8.9 3% 5% 4% 26% 3.4 3.3 3.5
Cosumar Morocco 2,177 20.2 22.0 20.4 N/A N/A N/A 11.7 11.0 N/A 22% 23% 4% N/A 3.3 4.8
Kernel Holding Ukraine 978 10.4 6.8 4.7 0.6 0.5 4.9 4.5 3.8 10% 9% 10% N/A 2.4 2.4 5.2
Graincorp Ltd Australia 749 N/A N/A 17.8 0.9 0.9 19.2 11.4 6.8 2% 4% 5% -190% 0.4 0.0 3.1
Median 19.5 11.6 13.5 1.1 1.1 11.1 10.7 8.9 4% 5% 6% 9% 2.6 3.0 3.5
Weight of food in Savola earnings 51% 51% 43% 51% 43% 51% 51% 43% 51% 51% 43% 45% 51% 51% 43%
Composite multiple 9.9 5.9 5.8 0.6 0.5 5.6 5.4 3.8 2% 3% 2% 4% 1.3 1.5 1.5
Food services peers
McDonald's US 159,521 27.3 34.5 25.6 N/A N/A 18.1 21.6 17.3 51% 47% 51% 5% 2.2 2.4 2.5
Yum Brands US 31,672 28.3 30.8 26.4 N/A N/A 20.2 22.7 19.6 37% 33% 34% 6% 1.6 1.8 2.0
Restaurant Brands Canada 27,678 21.9 27.2 21.3 10.0 9.8 16.8 20.3 16.9 41% 38% 41% 4% 3.4 3.5 3.6
Yum China Holdings China 25,207 33.9 41.0 29.7 4.9 4.5 15.9 17.0 13.3 15% 15% 16% 9% 0.8 0.5 0.9
Dunkin' Brands Group US 8,749 33.9 38.1 33.3 N/A N/A 22.8 24.3 22.4 36% 35% 36% 3% 1.4 0.8 1.6
Texas Roadhouse US 5,135 31.2 101.2 28.2 5.3 4.6 16.0 29.9 14.6 12% 7% 12% 11% 1.6 0.6 1.8
Wendy's Co US 5,045 37.9 39.3 31.7 8.9 9.4 18.1 17.9 16.6 24% 24% 25% 12% 1.8 1.3 1.6
Jollibee Foods Philippines 4,478 35.4 N/A 53.6 3.7 3.5 21.8 92.6 14.6 7% 2% 10% 1% 1.1 0.4 0.7
Cracker Barrel Old US 3,297 15.3 53.2 28.3 N/A N/A 9.8 20.3 11.9 13% 7% 11% -4% 4.7 3.0 3.8
Median 31.2 38.7 28.3 5.3 4.6 18.1 21.6 16.6 24% 24% 25% 5% 1.6 1.3 1.8
Weight of food services in Savola earnings 20% 20% 32% 20% 32% 20% 20% 32% 20% 20% 32% 25% 20% 20% 32%
Composite multiple 6.1 7.6 8.9 1.1 1.5 3.6 4.3 5.3 5% 5% 8% 1% 0.3 0.2 0.6
Retail peers
Tesco Britain 30,260 13.6 16.6 13.3 1.3 1.3 7.1 8.6 7.9 8% 7% 7% 4% 3.6 3.6 4.0
Yonghui Superstores China 11,411 34.5 31.0 24.4 3.5 3.3 21.4 18.5 15.4 4% 4% 4% 20% 1.8 2.2 2.7
Dino Polska Poland 7,088 65.6 45.1 35.3 12.2 9.2 38.6 28.2 22.1 9% 10% 10% 33% 0.0 0.0 0.0
Bim Birlesik
Magazalar Turkey 5,545 34.6 19.6 18.6 7.2 6.7 14.0 9.9 8.6 8% 8% 8% 32% 1.8 3.6 4.1
Axfood Sweden 4,915 25.3 22.8 22.4 9.7 9.2 10.7 10.2 10.0 9% 9% 9% 5% 3.5 3.6 3.6
Bindawood Holding Saudi Arabia 3,730 N/A 26.8 26.8 9.2 7.7 N/A 15.6 14.6 N/A 18% 19% N/A N/A 2.9 3.2
Casino Guichard France 3,069 10.1 14.2 10.7 0.5 0.4 9.7 7.5 7.3 5% 7% 7% 8% 13.1 2.0 8.2
Abdullah Al Othaim Saudi Arabia 2,990 33.9 24.0 24.9 6.6 6.0 20.5 15.2 15.3 7% 9% 9% 16% 2.2 3.3 2.9
Chongqing China 1,937 12.7 12.7 10.1 1.8 1.6 6.0 7.2 5.6 4% 4% 4% 16% 2.6 2.5 2.7
Smu Chile 900 15.5 15.1 11.8 0.9 0.9 8.9 8.1 7.6 8% 8% 8% 17% 1.4 3.8 3.3
Eurocash Poland 532 32.7 25.5 18.9 2.0 2.0 6.1 5.7 5.4 3% 3% 3% 25% 5.6 4.0 4.9
Saudi Marketing Saudi Arabia 345 75.7 29.3 26.6 2.1 2.0 13.6 9.3 9.2 12% 14% 14% 40% N/A 2.6 2.7
Median 32.7 23.4 20.7 2.8 2.6 10.7 9.6 8.9 8% 8% 8% 17% 2.4 3.1 3.2
Weight of retail in Savola earnings 30% 30% 26% 30% 26% 30% 30% 26% 30% 30% 26% 30% 30% 30% 26%
Composite Multiple 9.7 6.9 5.3 0.8 0.7 3.2 2.8 2.3 2% 2% 2% 5% 0.7 0.9 0.8
Total composite multiple 25.7 20.4 20.0 2.5 2.6 12.4 12.5 11.4 9.0% 9.7% 12% 10% 2.4 2.7 2.9
Savola Saudi Arabia 50.2 24.1 20.0 2.6 2.3 13.5 11.7 10.4 8.9% 9.7% 10.1% 45% 0.7 1.1 1.3
Source: Bloomberg* Based on Beltone estimates **Composite peer average is derived from the weighted average of the comparative multiples of the 3 main segments of Savola Group, weighted by their annual contribution to total earnings

7
Saudi Arabia Consumer 1 December 2020
III. Market overview
Moderate growth post 2021e as impact of the pandemic subsides
Our in-house macro team expects limited 1.3% y-o-y growth in Saudi private spending during 2021e, with private demand to return to pre-COVID levels by 2H22e. This supports our view of stalled growth in food consumption during late 2020e and 2021e, followed by moderate growth as the economy returns to normal in the year after. Consumption of food and beverages in Saudi Arabia (22% of monthly consumer expenditures) grew at a 4–year CAGR of 5% to SAR247mn in 2019. Going forward, we expect Saudi food to grow at a 4–year CAGR of 4.7%, supported by demand revival as the impact of the pandemic subsides.
Figure 5: Breakdown of average family food
consumption in Saudi Arabia
Figure 6: Expected limited growth in per capita
food consumption in 2021e; demand to pick up in
2022e
6,200 6,400 6,600 6,800 7,000 7,200 7,400 7,600 7,800 8,000 8,200
2016
2017
2018
2019
2020
e
2021
e
2022
e
SAR/
capi
ta
Food consumption per capita
Source: General Authority for Statistics, Beltone esti-mates
Source: General Authority for Statistics, Beltone esti-mates
Similarly, the economies of other Gulf Cooperation Council (GCC) states have encountered hard-hitting challenges due to the fallout of the pandemic, which was further exacerbated by plunging global oil prices.
Changes in consumption patterns and risk of second wave could derail pace of recovery
The resumption of the Hajj pilgrimage starting 1 November 2020, the upcoming reversal of a ban on international flights on 1 January 2021, and our expectations of 12% growth in oil prices (oil revenue represents 64% of annual receipt) are likely to drive a mild economic recovery in Saudi Arabia in 2021e. Moreover, the recently announced 33% increase in minimum salaries for Saudi citizens to SAR4k/Saudi employee under the Nitaqat program (slated for 2Q21), should provide support to income levels and cater for a recovery in private demand given Saudi nationals account for 24% of total employment in the kingdom. However, tighter restrictions and precautionary measures with a second wave could ultimately derail the pace of economic recovery, in our view.
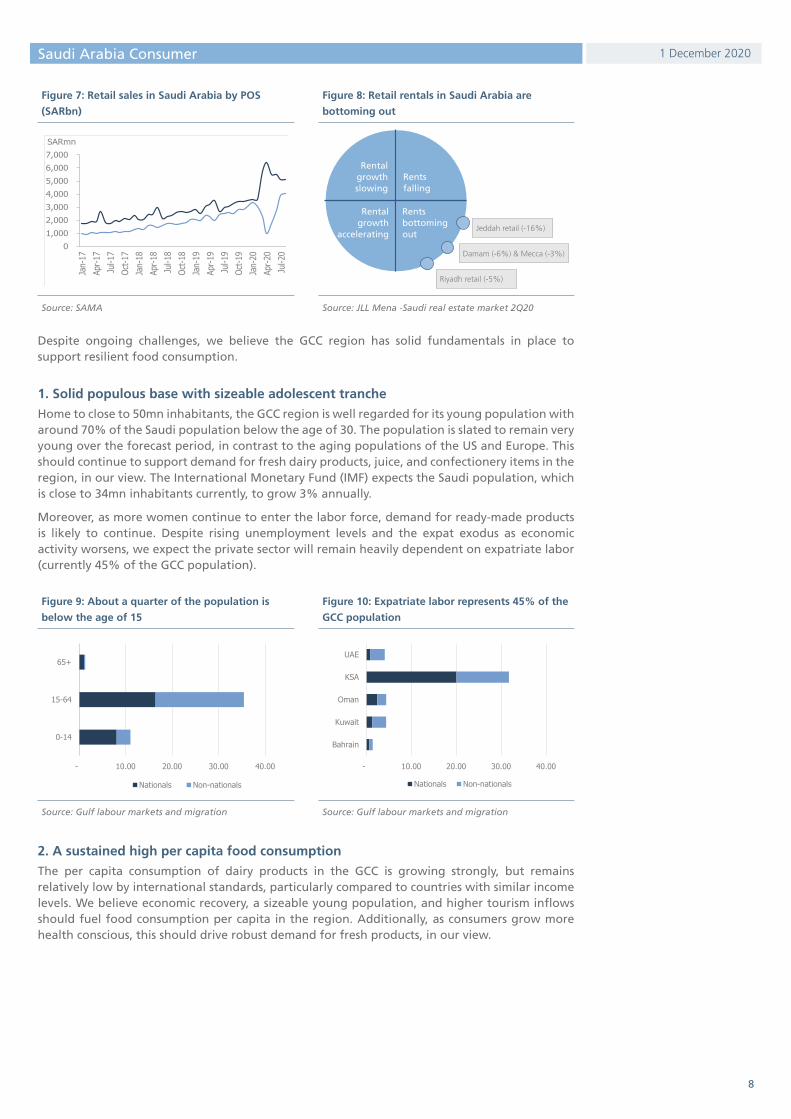
So far Consumer spending has been under pressure, particularly on dining out and entertainment, given a rise in unemployment, the expiry of stimulus programs, and the tripling of the VAT rate. We also believe consumption patterns have shifted from premium to inexpensive merchandise, which has obligated retailers to overhaul their offerings to accommodate market needs as consumers continue to focus their spending on essential goods rather than leisure items, in our view. As a result, smaller retailers who suffer from shortages in liquidity have been forced to downsize or terminate operations either temporarily or permanently. To sustain businesses, retailers are engaging with landlords in restructuring deals and demanding additional rent-free periods, with landlords adapting to the changing market on a survival basis.
8
Saudi Arabia Consumer 1 December 2020
Figure 7: Retail sales in Saudi Arabia by POS
(SARbn)
Figure 8: Retail rentals in Saudi Arabia are
bottoming out
01,0002,0003,0004,0005,0006,0007,000
Jan-
17Ap
r-17
Jul-1
7Oc
t-17
Jan-
18Ap
r-18
Jul-1
8Oc
t-18
Jan-
19Ap
r-19
Jul-1
9Oc
t-19
Jan-
20Ap
r-20
Jul-2
0
SARmn
Restaurants & Café Food & Beverages
Jeddah retail (-16%)
Damam (-6%) & Mecca (-3%)
Riyadh retail (-5%)
Rental growth slowing
Rental growth
accelerating
Rents falling
Rentsbottomingout
Source: SAMA Source: JLL Mena -Saudi real estate market 2Q20
Despite ongoing challenges, we believe the GCC region has solid fundamentals in place to support resilient food consumption.
1. Solid populous base with sizeable adolescent tranche
Home to close to 50mn inhabitants, the GCC region is well regarded for its young population with around 70% of the Saudi population below the age of 30. The population is slated to remain very young over the forecast period, in contrast to the aging populations of the US and Europe. This should continue to support demand for fresh dairy products, juice, and confectionery items in the region, in our view. The International Monetary Fund (IMF) expects the Saudi population, which is close to 34mn inhabitants currently, to grow 3% annually.
Moreover, as more women continue to enter the labor force, demand for ready-made products is likely to continue. Despite rising unemployment levels and the expat exodus as economic activity worsens, we expect the private sector will remain heavily dependent on expatriate labor (currently 45% of the GCC population).
Figure 9: About a quarter of the population is
below the age of 15
Figure 10: Expatriate labor represents 45% of the
GCC population
- 10.00 20.00 30.00 40.00
0-14
15-64
65+
Nationals Non-nationals
- 10.00 20.00 30.00 40.00
Bahrain
Kuwait
Oman
KSA
UAE
Nationals Non-nationals
Source: Gulf labour markets and migration Source: Gulf labour markets and migration
2. A sustained high per capita food consumption
The per capita consumption of dairy products in the GCC is growing strongly, but remains relatively low by international standards, particularly compared to countries with similar income levels. We believe economic recovery, a sizeable young population, and higher tourism inflows should fuel food consumption per capita in the region. Additionally, as consumers grow more health conscious, this should drive robust demand for fresh products, in our view.

9
Saudi Arabia Consumer 1 December 2020
Figure 11: Sustained growth potential in MENA per capita food consumption
0
500
1,000
1,500
2,000
2,500
3,000
0 10 20 30 40 50 60 70 80GDP/capita USD000
Food consumption/capita USD)
Kzhastan Italy
Turkey
MoroccoBahrain
Kuwait
UAENorway
Netherlands
Algeria
Egypt
Iran
KSAJordan
Source: NationMaster, IMF
3. Tourism activity
International tourism is one of the main economic pillars of most countries within the MENA region. International tourist arrivals to the top 5 destination markets in the region have grown at a 2016–20 CAGR of 5%, with the top 2 destinations in the region being the UAE followed by Saudi Arabia. We expect this trend to continue in the coming period as the pandemic subsides. While most inbound tourists in Saudi Arabia are mainly religious pilgrimages, the kingdom is currently developing its tourism infrastructure to expand its tourism base to include leisure tourists as well.
Figure 12: Growing tourism destinations Figure 13: Foreign pilgrims
14 15 16 17
18 16 15 16
10 11 12 12 5 8 11 10 4 4
4 4
- 10 20 30 40 50 60 70
2016 2017 2018 2019
Tourists mn
UAE KSA Morocco Egypt Jordan
6.1 6.5 6.8 7.5
2.4
1.3 1.
8 1.8 1.
9
0.0
0.0
2.0
4.0
6.0
8.0
10.0
2016a 2017a 2018a 2019a 2020e
Milli
ons
Umrah performers Hajj performers
Source: World Bank Source: General Authority for Statistics
4. Rising modern trade business and online retailing
The food market is diverging with a shift toward online retail and expanding hotels, restaurants, and cafés (HORECA) on growing business-to-business supply, ready-to-eat, and the health and wellness market segments. Dominated for long by traditional retail channels (baqalas), the retail market in Saudi Arabia witnessed growing modern retail channels (hypermarkets and supermarkets) over the last few years, driven by lack of amusement destinations and growing preferences for promotional items and value-for-money products. We expect baqalas’ market share to continue to be pressured after the Saudi government recently announced plans to accelerate the Saudization of expat-operated baqalas.
Figure 14: Global online retail penetration (2017) Figure 15: Saudi retail market format
1.4%
3.2%
4.9%
6.3%
9.1%
11.4%
15.7%
18.8%
20.4%
0% 5% 10% 15% 20% 25%
KSAUAE
IndiaBrazil
GermanyUSAUK
South KoreaChina
Source: Delta Perspective Source: Almarai investor presentation, June 2020

10
Saudi Arabia Consumer 1 December 2020
Online groceries, though still a new concept in the MENA region, has been the fastest-growing e-commerce category over the past 3 years, representing 3% of total e-commerce sales versus 20% for electronics in 2019. The imposed lockdown measures across the kingdom as a result of COVID-19 has given rise to online delivery applications, leading retailers to launch their e-commerce platform and delivery fleets, such as Pandaclick. As a result, online purchases surged 917% y-o-y during 1H20 in Saudi Arabia. This was supported by high levels of smartphone penetration at an average rate of 80% in Saudi Arabia and the UAE compared to 42% in Egypt and the global average of 41%.
Government initiatives to support sizeable e-commerce contribution
Market specialists estimate online groceries, 1.9% of grocery consumption, will grow almost 90% annually, reaching USD4.1bn in the GCC and Egypt by 2022. This figure is still below the developed market average given low credit card penetration, as over 67% of transactions completed have used cash-on-delivery as the preferred payment method. Given the logistical challenges in Saudi Arabia, there is a significant opportunity to integrate local baqalas through marketplaces.
The Saudi government targets 80% contribution of e-commerce by 2030 under Saudi Vision 2030, supported by the launch of a new e-commerce law introduced in late 2019, and the planned USD100bn in financing to expand the country’s logistics infrastructure, grants to stimulate more locals to operate in the e-commerce industry, as well as proposing interest-free financing to acquire and manage carriage trucks.
M&As in regional online groceries
There have been growing M&A transactions lately in the online grocery marketplace, with Germany’s Delivery Hero (DHER.DE) acquiring online grocery marketplace InstaShop for an initial USD270mn, as it branches out of online takeaway meals into new services. InstaShop, launched in 2015, operates in the UAE, Qatar, Bahrain, Egypt, and Lebanon and has an annualized gross merchandise volume of USD300mn. Meanwhile, Saudi Arabia-based Foodics entered the Egyptian retail market aiming to provide point of sale (POS) operating systems to enhance local businesses’ operations.
Biden presidency could transform oil price movement, impacting global food prices
Mixed effect on oil prices
Although US President-elect Joe Biden’s win could benefit short-term oil demand on passing an additional USD1tn economic relief package (expected to be in the range of 0.5mn bpd), his approach to foreign relations could bring more supply to the market as he could ease relations with Iran and Venezuela, which in turn could unleash over 2mn bpd of oil to the market. This would likely lead to an oil supply glut, in our view, driving the OPEC+ supply cut agreement to remain intact for a longer-than-anticipated period given that the group’s earlier plans discussed easing supply cuts by the beginning of 2021. This would keep the oil price elevated above USD50/bbl. We believe the Biden administration would look to re-enter the Paris Agreement to combat global climate change, and, in this regard, we believe there will be more restrictions on the issuance of new drilling permits on federal lands and waters. Accordingly, oil prices are likely to be high enough to make clean energy alternatives to fossil fuels competitive in support of the ambitious climate plan, in our view. Moreover, a return to globalized trade policies and reinstating trade relations with China could be positive for oil demand.
What does it mean for GCC economy?
As GCC economies move in correlation with oil prices given the heavy contribution of hydrocarbon revenue to the state budget, we expect a slow economic recovery in the GCC region in 2021e as we expect oil prices to remain below historical highs in the medium term. Our in-house macro team expects oil prices to reach USD55.0/bbl in 2021e, up from USD40.0/bbl in 2020e, due to a slow recovery in global energy demand. With a high break-even level for oil, we believe any positive oil price movement would positively impact the Saudi economy, with the ramping up of major projects positively reflecting on household consumption and business activity.

11
Saudi Arabia Consumer 1 December 2020
What’s in it for global commodities?
Given the high positive correlation between crude oil and food commodities, such as sugar, soybean, and corn, we believe any upward movement in oil prices will likely reflect on higher prices of sugar, corn, and other crops. Corn is the ingredient in biofuel in the US, sugar is the primary ingredient in the biofuel ethanol in Brazil, and palm oil is a feedstock for bio-diesel. This makes these commodities positively correlated with crude oil prices as they are used as a main ingredient for the production of biofuel.
Sugar is positively correlated with oil as high crude oil prices incentivize farmers in Brazil, a large exporter of sugar, to divert sugarcane for the production of ethanol, which is used as fuel. Conversely, a decline in oil prices reduces the appeal of ethanol, and farmers accordingly divert more sugarcane for sugar production, which in turn weighs on sugar prices in global markets.
Alfalfa has considerable potential as a feedstock for the production of ethanol and other industrial materials because of its high biomass production, and, importantly, alfalfa does not require nitrogen fertilizer, which is a major and increasing cost in corn production. However, refining of alfalfa remains underdeveloped, and it is primarily processed and used as livestock feed.
What’s in it for food companies and dairy producers?
The companies under our coverage in this note, namely Savola, Almarai, NADEC, and SADAFCO, are impacted by global changes in commodity prices. However, looking at the prices of edible oil, fresh milk, and sugar in Saudi Arabia, we have seen limited price inflation over the last 10 years in the Saudi market, despite global fluctuations in oil prices and positively correlated commodities. The kingdom banned forage cultivation in 2018, allocating direct subsidies to feed importers instead to overcome the high cost and preserve general price levels. However, with the latest phase out of feed subsidies and after tripling the VAT to 15%, we do not expect dairy producers to fully pass on the high cost of imported feed in 2021e, which will likely pressure margins during the year in light of weakening purchasing power. Going forward, we expect to see further price increases to accommodate for higher cost inflation as economic conditions return to normal.
On historical grounds, the VAT enactment typically results in temporary inflationary pressure, with adjustments in consumer’s expenditure behavior later steadying within a year.
Figure 16: Positive correlation of oil prices with
food commodities
Figure 17: Stable food prices in Saudi Arabia over
the last 10 years; latest food inflation reflects
higher VAT
050
100150200250300350400
Jan-
05Ja
n-06
Jan-
07Ja
n-08
Jan-
09Ja
n-10
Jan-
11Ja
n-12
Jan-
13Ja
n-14
Jan-
15Ja
n-16
Jan-
17Ja
n-18
Jan-
19Ja
n-20
Crude oil Soybeans Corn Sugar Alfalfa hay
60
80
100
120
140
160
2009
2010
2011
2012
2013
2014
2015
2016
2017
2018
2019
Aug-
20
Fresh milk Vegatible oil Corn oil Sugar
VAT impact
Intensifyingcompetition
Source: Delta Perspective Source: General Authority for Statistics

12
Saudi Arabia Consumer 1 December 2020
IV. Operational analysis
Figure 18: Product diversification supports
revenue growth at 6-year CAGR of 5%
Figure 19: Inflated costs to pressure dairy
producers’ gross margins during 2021e
22 22 22 23 24 24 25
14 15 16 17 18 19 19
2 2 2 2 3 3 3 2 2 2 3 3 3 3
0
5
10
15
20
25
30
2019
a
2020
e
2021
e
2022
e
2023
e
2024
e
2025
e
Reve
nue
(SAR
bn)
Savola Almarai SADAFCO* NADEC
20% 21% 22% 22% 22% 22% 23%
46% 45% 44% 44% 45% 45% 45%
38% 38% 36% 36% 36% 35% 36%
47%44% 44% 44% 44% 44% 44%
0%5%
10%15%20%25%30%35%40%45%50%
2019
a
2020
e
2021
e
2022
e
2023
e
2024
e
2025
e
GPM
(%)
Savola Almarai SADAFCO* NADEC
*SADAFCO FY ends 31 MarchSource: Company data, Beltone estimates
*SADAFCO FY ends 31 MarchSource: Company data, Beltone estimates
Figure 20: NADEC‘s efficient utilization of its
distribution centers to reduce high SG&A/sales
Figure 21: Almarai leads on EBITDA margin
*SADAFCO FY ends 31 MarchSource: Company data, Beltone estimates
*SADAFCO FY ends 31 MarchSource: Company data, Beltone estimates
Figure 22: Savola and Almarai continuing to
deleverage...
Figure 23: ...driving core earnings to grow at
5-year CAGRs of 26.1% and 9.9%, respectively
1.3 1.1
0.9 0.8
0.6 0.5 0.5
1.1 1.1 1.1 0.9 0.8 0.7 0.6
-1
-1
0
1
1
2
2019a 2020e 2021e 2022e 2023e 2024e 2025e
Net d
ebt/e
quity
Savola Almarai SADAFCO* NADEC
486
1,01
3
1,20
2
1,42
8
1,61
5
1,78
7
1,95
7
1,91
9
2,09
4
2,17
7 2,47
4 2,84
1
3,08
2 3,38
0
280 284
267
278
290
308
334
104
37
68
76
110
132
156
0500
1,0001,5002,0002,5003,0003,5004,000
2019
a
2020
e
2021
e
2022
e
2023
e
2024
e
2025
e
Core
ear
ning
s (S
ARm
n)
Savola Almarai SADAFCO* NADEC
*SADAFCO FY ends 31 MarchSource: Company data, Beltone estimates
*SADAFCO FY ends 31 MarchSource: Company data, Beltone estimates
Figure 24: SADAFCO provides highest dividend
yield; Savola to generate high FCFF yield
Figure 25: SADAFCO generates highest ROIC and
ROAE
0%
2%
4%
6%
8%
10%
12%
Div yield FCFF yield Div yield FCFF yield
2019a 2020e
Savola Almarai SADAFCO* NADEC
0%5%
10%15%20%25%30%
Savo
la
Alm
arai
SADA
FCO*
NADE
C
Savo
la
Alm
arai
SADA
FCO*
NADE
C
Savo
la
Alm
arai
SADA
FCO*
NADE
C
2019a 2020e 2021eROIC ROAE
*SADAFCO FY ends 31 MarchSource: Company data, Beltone estimates
*SADAFCO FY ends 31 MarchSource: Company data, Beltone estimates

13
Saudi dairyI. Saudi dairy industry overview
II. Companies
1. Almarai Company
2. The National Agricultural Development Company (NADEC)
3. Saudia Dairy and Foodstuff Company (SADAFCO)

14
Dairy industry overview 1 December 2020
Saudi dairy industry overview
Milk oversupply led to growing consolidation as margins tighten
Dairy consumption, which represents 9% of food consumption in Saudi Arabia, is among the highest in the region, second after the UAE. The dairy market in the kingdom in particular, and the GCC in general, is highly concentrated with the top large-scale Saudi dairy companies (Almarai, SADAFCO, and NADEC) having a 64% market share. Owing to sizeable investments in Saudi dairy capacity over the last 40 years in tandem with a reduction in certain consumption categories has led to a milk surplus, growing consolidation among small players in the industry, and evolving long-life milk (9-month shelf life) versus fresh milk (5–10 day shelf life) as a balancing element. Accordingly, this has put pressure on profitability margins due to supplier promotions and discounts granted in 2017 and 2018 to overcome sluggish demand. While the price gap between fresh milk and long life was wide enough at the beginning, currently the growing demand for long-life milk from regional markets for storage purposes has led to a narrowing pricing gap.
Figure 26: Breakdown of average family
food consumption in Saudi Arabia
Figure 27: Dairy volumes should maintain
tepid growth
Figure 28: Dairy market by brands1,
083
1,13
1
1,09
8
1,12
0
1,16
9
1,23
0
839
877
915
916
956
1,00
6
2,359 2,464 2,471 2,498 2,612 2,754
-
500
1,000
1,500
2,000
2,500
3,000
-
500
1,000
1,500
2,000
2,500
3,000
2018
a
2019
a
2020
e
2021
e
2022
e
2023
e
Mn Liters
Fresh milk & yogurt Long-life milk Cheese Total
Almarai46%
Saudia (SADAFCO)
9%
NADEC9%
Al Safi7%
Al Rawabei5%
Nada4%
Al-Ain4%
Others16%
Source: General Authority for Statistics Source: Almarai, Beltone estimates Source: Almarai investor presentation, June 2020
New entrants in GCC market could lead to continuous oversupply
To ensure food security and dairy self-sufficiency, 2 of the main dairy importing GCC countries have established vertically integrated dairy companies such as Mazoon in Oman and Baladna in Qatar (following the boycott). This, in addition to the expat exodus and the disrupted flow of tourism, has negatively impacted the overseas businesses of Saudi dairy producers, leading to a continuous milk oversupply, which could ultimately lead to cooling off prices or reducing milk supply as advocated by some dairy producers. Market sources estimate the following as a result: (i) price discount, especially for long-life milk, (ii) converting fresh milk to SMP for export as other major dairy producers do to balance such as Arla in Denmark and Fonterra in New Zealand, and (iii) developing new products and increasing cheese production. There has been an increasing tendency of dropping excess fresh milk in the food segment (cheese), resulting in the latest price decline.
Difficult geography in Saudi Arabia assures importance of integrated dairy processing companies
Locally produced raw milk is principally used for fresh products that require constant year-round supply. Given the lack of large-scale independent dairy farms in the GCC, this gave rise to integrated dairy processing companies maintaining their own dairy herds. Though this allows companies to have direct control over the production process, and timing of their milk supply, the cost of establishing and operating dairy herds as well as providing the necessary temperature controlled environments burdens companies’ cost structures. Additionally, relying on imported forage, given the ban imposed by the Saudi government by virtue of a decree on local production of forage starting late 2018 to preserve the limited water resources, has added to the cost burden as the farms consist of milking parlours and animal housing, with adjacent sand-yards, compared to pasture farming as practiced by traditional dairy farming countries.

15
Dairy industry overview 1 December 2020
Figure 29: Declining net margins of dairy
producers on growing price competition
Figure 30: Dairy herd milk production yield per
cow (tons/head)
21%
19%17%
14%
23%
19%
15% 15%
3.6%0.1%
4.2% 5.2%
0%
5%
10%
15%
20%
25%
2016 2017 2018 2019
Almarai SADAFCO* NADEC13.86
11.6
10.38
8.63
6.95
6.91
5.94
3.22
2.51
0.82
0.51
0 2 4 6 8 10 12 14 16
Almarai (KSA)
NADEC (KSA)
North America
Japan
EU
Safi-Danone (KSA)
Argentina
South Africa
China
Egypt
Saudi Arabia
Source: Dairy company data Source: Company data, FAO
Lifting subsidies on imported feed ingredients could push retail dairy prices higher or else lead to squeeze on profitability margins
Dairy product retail prices have been relatively stable over the last 10 years, growing at a CAGR of 1%–3%, owing to the government’s support and food price regulation. Starting December 2019, Saudi dairy manufacturers were exposed to higher costs of imported feed grains after the government decided to remove direct subsidies on some 23 imported grains, including yellow corn, soybean meal, and dried distillers grains with solubles (DDGS). These subsidies used to help dairy manufacturers mitigate the impact of the higher cost of imported animal feed. While the government excluded 7 green feed ingredients from the subsidy lift, including alfalfa (one third of animal feed), which is subject to a rebate of a SAR221/ton, we believe the subsidy lift on imported forage (except alfalfa) will pressure profitability margins unless companies can freely pass on the increased costs. These subsidies were calculated on a per ton basis and used to range SAR49.33–SAR202.13 per metric ton, based on the energy and protein content of each feed ingredient.
Figure 31: Subsidies received from the
government
Figure 32: Subsidies pre and post government
decree
281
57.6
439
58.3
428
85.6
-
100
200
300
400
500
Almarai NADEC Almarai NADEC Almarai NADEC
2017a 2018a 2019a
SARmn
202.13
120.53
221
0 0
221
0
50
100
150
200
250
Soybean meal Yellow corn Alfalfa hay
SAR/ton
Pre gov decree Post gov decree (2020)
* Almarai subsidies included SAR100-150mn for the poultry segmentSource: Companies’ financials
Source: USDA

16
Dairy industry overview 1 December 2020
Demand sensitivity post VAT amid growing price competition
Dairy market oversupply over the 2016–18 period has led to heavy discounting, especially on the long-life milk segment, owing to weak structural demand from expat departures, the Qatar embargo, and weaker spending. We believe that tripling the VAT to 15%, effective July 2020, could affect consumption and trigger several promotions from producers, impacting overall margins. We expect SADAFCO’s sales volumes to decrease in the coming period, already reflected in its latest quarterly numbers, with its milk segment growing only 2% compared to Almarai’s growth of 16%. We believe this resulted from SADAFCO’s forgone market share due to a 11% premium pricing scheme compared to NADEC and Almarai (NADEC and Almarai’s 1-liter long-life milk product is currently priced at SAR4.5 compared to SAR5.0 for SADAFCO’s Saudia brand). That said, we expect the prices of fresh milk to grow at a 2019–25e CAGR of 3% (to pass on higher feed costs) compared to an average 2% price increase for long-life milk. In this regard, NADEC and Almarai could potentially be the least impacted dairy producers among other market players due to their lower pricing scheme, which falls in favour compared to premium-priced brands such as SADAFCO.
Figure 33: Consumers tend to favor lower-priced
long-life brands (SAR/liter)
Figure 34: Minimal demand growth for fresh milk
on stocking up long-life brands (SAR/liter)
5.0
5.0
4.8
4.5
4.5
4.5
4.5
4.2 4.4 4.6 4.8 5
SADAFCO
Nada
Rainbow
Almarai
NADEC
Al Safi
Alrabie
5.0
5.0
4.0
4.0
4.0
0 1 2 3 4 5 6
Almarai
NADEC
Al Safi
Najdyah
Nada
Source: Al-Othaim, Carrefour KSA Source: Al-Othaim, Carrefour KSA

17
Rating: HOLD
Fair value: SAR61.00
Market price: SAR54.20
Upside: 13%
*Closing as of 29 November 2020
Initiate coverage with a FV of SAR61.00/share and a Hold rating
Almarai has grown over the last 44 years to become a leading conglomerate in the Middle East, serving mainly Saudi Arabia along with other neighboring GCC markets. Leveraging on its strong brand name and wider coverage, the company is the GCC’s largest producer of dairy and juice (segment generating 71% of net revenue), poultry (15% of net revenue), and bakery (12% of revenue). While Almarai spent nearly SAR15bn on CAPEX over the last 5 years on its core business, the company should efficiently utilize its free cash flow going forward to enter new segments or expend in new markets with CAPEX requirements to be centered mostly on maintenance and replacement in its existing facilities, according to its 2025 strategy. We value Almarai using a sum-of-the parts (SOTP) valuation method, reaching a FV of SAR61.00/share, with our discounted cash flow (DCF) valuation yielding 13% upside, warranting a Hold rating. We expect core earnings to grow at a 2019–25e CAGR of 10%, supported by moderate revenue growth, margin enhancement, and deleveraging.
Growing competition and milk oversupply likely to limit dairy price revision amid lower feed subsidies
Almarai expects to collect feed subsidies of SAR150mn in 2021, mainly on alfalfa imports down from SAR300mn collected on all feed imports in 2019 and 2020. The new government regulations lift subsidies on non-green imported forage, and should start to reflect on Almarai’s 2021 financials as its outstanding subsidized feed is depleted. Following the volume-led growth exhibited in 9M20, we believe volumes are likely to slow in the coming 2 quarters on dampened purchasing power. Over the 2019–25e period, we estimate dairy and juice segment revenue will grow at a CAGR of 5.1%, supported by limited price adjustments on passing on higher feed cost as well as a volume recovery post 2022e as the economic impact of COVID-19 subsides. We therefore expect margins for the segment to gradually decrease in 2020e and 2021e on higher cost of imported feed as well as additional costs for juice ingredients, driven by sugar-free recipes, the expat levy, and higher trade support due to growth in modern trade.
Poultry segment to maintain strong growth despite the pandemic
Almarai is expanding its poultry business by adding a new line to its 3 existing lines, which should add an additional 50mn birds to its capacity, bringing total capacity to around 240mn birds by 2Q21. The channel shift toward the high-margin fresh retail poultry line has temporarily positively impacted the margins of the segment on lower performance of the food service segment due to closure of all restaurants during the pandemic. We do not believe the change in the poultry subsidy regime (to production based) will impact the collected subsidy amount. Meanwhile, the closure of educational institutions and travel restrictions has impacted the performance of the bakery segment on lower demand for single serve and other bakery items.
Almarai CompanyIndustry flagship to remain resilient despite headwindsFood and Dairy | Saudi Arabia
Initiation of Coverage 1 December 2020
Main financial highlights (FY end Dec)
In SARmn, unless otherwise stated 2019e 2020e 2021e 2022e
Revenue 14,351 15,290 16,267 17,000
EBITDA 4,135 4,247 4,381 4,689
EBITDA margin 28.8% 27.8% 26.9% 27.6%
Recurring net income 1,919 2,094 2,177 2,474
P/E (x)* 28.3 25.9 24.9 21.9
EV/IFRS EBITDA (x) 16.2 15.5 14.7 13.3
ROAE 13.9% 14.7% 14.3% 15.4%
* based on core net income (excluding one-offs and volatile items)Source: Company, Beltone estimates
Stock dataReuters 2280.SE
Bloomberg ALMARAI AB
Shares (mn) 1,000
MKT capSAR54,200mn/
USD14,453mn
3M avg. daily liquiditySAR42.5mn/
USD11.3mn
52-week high/low SAR58.4/SAR36.5
Free float 25%
Please see the investment ratings and important disclosures contained on the last page of this report
Shareholders structure
15.020.025.030.035.040.045.050.055.060.065.0
Dec
-19
Jan
-20
Feb
-20
Mar
-20
Ap
r-20
May
-20
Jun
-20
Jul-
20
Au
g-2
0
Sep
-20
Oct
-20
No
v-20
SARAlmarai TASI (rebased)
Ingy El Diwany, CFA [email protected] | +20224616352
Mohamed [email protected] | + 20224616382

18
Almarai Company 1 December 2020
Investment summary
Established in 1977 by HH Sultan bin Mohammed bin Saud Al Kabeer, Almarai has grown over the last 43 years to become the largest food conglomerate and the flagship of the dairy industry in the Middle East. The IPO in 2005 was a turning point in the company’s history, which was followed by expanding its dairy processing line and launching the bakery and poultry lines of business. Almarai maintained its leading position across different food categories in the kingdom with a 64% share of the Saudi fresh dairy segment, 30% of packaged cheese, and 35% of the fresh poultry market. Almarai’s vertically-integrated dairy segment (71 % of revenue), with a capacity of 1.5bn liters of fresh milk serves Saudi and neighboring GCC markets. Almarai’s 6 farms encompass a milking herd of 107,840 Holstein cows. Growth in this phase is driven by its fresh poultry segment (15% of revenue), which captures 35% share of the Saudi fresh poultry segment. The company’s bakery segment (12% of revenue) produces approximately 1.3bn bakery products annually, marketed under the L’usine brand and the 7 Days brand. The company recently acquired 100% of Premier Foods, which provides value added products (meat and poultry) to the food services industry in the Middle East.
Valuation methodology and risks
We have a Hold rating on Almarai with a FV estimate of SAR61.00/share using a SOTP methodology with a 6-year DCF, discounted at a WACC of 7%, and a terminal growth rate of 2.5% for the dairy and juice, bakery, and poultry segments. Key downside risks to our forecasts include (i) spread of infectious disease (Mastitis) negatively affecting milk yield and milk quality, (ii) risk of availability of imported forage from the international markets, especially during drought, and (iii) competition risk together with risk of milk oversupply limiting the company’s ability to pass on inflated imported feed amid lower government feed subsidies.
18
Financial statement | FY end Dec (SARmn)
Income statement 2019a 2020e 2021e 2022e
Revenue 14,351 15,290 16,267 17,000
COGS (7,812) (8,481) (9,160) (9,462)
Gross profit 6,539 6,808 7,107 7,537
SG&A expenses (2,405) (2,562) (2,726) (2,848)
EBITDA 4,135 4,247 4,381 4,689
Depreciation and amortization (1,545) (1,592) (1,678) (1,762)
EBIT 2,590 2,655 2,703 2,927
Net financing costs (585) (533) (447) (363)
Other income/costs (83) - - -
EBT 1,922 2,122 2,256 2,564
Zakat & income taxes (121) (74) (79) (90)
NPAT 1,802 2,048 2,177 2,474
Non-controlling interest 10 46 - -
Attributable net income 1,812 2,094 2,177 2,474
Core attributable net income* 1,919 2,094 2,177 2,474
Balance sheet 2019a 2020e 2021e 2022e
Cash and equivalents 1,161 358 41 84
Accounts receivables 1,260 1,348 1,367 1,382
Inventory 4,198 4,591 4,977 5,149
Prepaid expenses and other
receivables 510 546 582 598
Total current assets 7,129 6,843 6,967 7,212
Total non current assets 26,019 25,292 24,482 23,592
Total assets 33,148 32,134 31,449 30,804
Short term borrowings 271 101 251 451
CPLTD 2,031 1,877 3,498 2,103
Accounts payable 1,404 1,524 1,530 1,533
Accrued expenses and other
balances 2,870 3,060 3,197 3,375
Total current liabilities 6,575 6,562 8,477 7,463
Long-Term Borrowing 11,233 9,356 5,858 5,255
Other LT liabilities 931 931 931 931
Non-controlling interest 606 560 560 560
Total non-current liabilities 12,770 10,847 7,349 6,746
Paid-in capital 10,000 10,000 10,000 10,000
Reserves 1,780 1,990 2,206 2,454
Treasury shares (771) (1,001) (1,300) (1,687)
Retained earnings 2,794 3,736 4,716 5,828
Total equity 13,804 14,725 15,623 16,595
Total liabilities and equity 33,148 32,134 31,449 30,804
Cash flow 2019a 2020e 2021e 2022e
Change in working capital (55) (299) (335) (155)
Cash flow from operations 4,732 4,504 4,598 5,075
CAPEX (1,517) (1,060) (1,063) (1,067)
Cash flow from investing (2,944) (1,496) (1,499) (1,503)
Free cash flow (FCF) 1,788 3,009 3,099 3,571
Cash flow from financing (2,460) (3,812) (3,416) (3,528)
Change in cash (672) (804) (317) 43
Main ratios 2019a 2020e 2021e 2022e Per-share data
EPS (SAR)* 1.9 2.1 2.2 2.5
BVPS (SAR) 13.8 14.7 15.6 16.6
DPS (SAR) 0.9 0.9 1.0 1.1
Valuation data
P/E (x)* 28.3 25.9 24.9 21.9
P/BV (x) 3.9 3.7 3.5 3.3
Dividend yield 1.6% 1.7% 1.8% 2.1%
FCF yield 3.3% 5.6% 5.7% 6.6%
EV/ IFRS EBITDA (x) 16.2 15.5 14.7 13.3
Growth (y-o-y)
Revenue 5.9% 6.5% 6.4% 4.5%
EBITDA -3.2% 2.7% 3.2% 7.0%
Attributable net income -10.3% 13.7% 6.3% 13.6%
Core attributable net income* -15.3% 9.1% 4.0% 13.6%
Profitability
Gross profit margin (GPM) 45.6% 44.5% 43.7% 44.3%
EBITDA margin 28.8% 27.8% 26.9% 27.6%
EBIT margin 18.0% 17.4% 16.6% 17.2%
Core net profit margin (NPM)* 13.4% 13.7% 13.4% 14.6%
ROAA* 5.8% 6.4% 6.8% 7.9%
ROAE* 13.9% 14.7% 14.3% 15.4%
ROAIC 7.0% 7.9% 8.4% 9.8%
Leverage
Net debt (cash)/equity (x) 0.9 0.8 0.6 0.5
Net debt (cash)/IFRS EBITDA (x) 3.1 2.7 2.3 1.8
* based on core net attributable income (excluding one-offs)Source: Company, Beltone estimates

19
Almarai Company 1 December 2020
I. Valuation
Hold recommendation with a FV of SAR61.00/share
We have a Hold recommendation on Almarai with a FV of SAR61.00/share, implying 13% upside potential. We reach this value using a SOTP valuation methodology, where each of the dairy and juice, bakery, and poultry segments are valued separately using a DCF model.
We utilize a WACC of 7% and a cost of equity of 7.3% derived from (i) a risk-free rate of 2.35% (using the average of a 4-year and 7-year sovereign sukuk yield after zakat), (ii) equity market risk premium (ERP) of 6.2% (US market risk premium plus an additional country risk premium), and (iii) a beta of 0.8. Our WACC calculations are based on a 90% weight of equity and 10% weight of debt and lease after accounting for IFRS 16 accounting standards. We also use a terminal growth rate of 2.5%.
Figure 1: Discounted cash flow (SARmn)
2020e 2021e 2022e 2023e 2024e 2025e
EBIT 2,655 2,703 2,927 3,216 3,376 3,610
Zakat paid (74) (79) (90) (103) (112) (123)
NOPAT 2,580 2,624 2,837 3,113 3,264 3,487
Depreciation and amortization 1,592 1,678 1,762 1,796 1,877 1,967
Adjusted COPAT 4,172 4,302 4,599 4,909 5,141 5,454
∆ in net working capital (299) (335) (155) (187) (103) (186)
CAPEX (1,060) (1,063) (1,067) (1,071) (1,074) (1,078)
Increase in biological assets (436) (436) (436) (436) (436) (436)
Free cash flow to firm (FCFF) 2,378 2,468 2,941 3,215 3,528 3,755
Terminal value - 82,729
PV of FCFF and terminal value 2,365 2,295 2,556 2,607 2,666 60,777
Enterprise value (EV) 73,265
Net cash (debt) (as of 30 Sep 2020) (11,950)
Investments (as of 30 Sep2020) 244
Minority Interest (as of 30 Sep 2020) (552)
Equity value 61,008
FV/share, SAR 61.0
Upside potential 13%
Figure 2: Sensitivity of our FV to changes in WACC and terminal growth rate
Term
inal
gro
wth
rat
e
WACC
4.8% 5.8% 6.8% 7.8% 8.8%
1% 42.7 42.7 42.7 42.7 42.7
1.5% 50.2 50.2 50.2 50.2 50.2
3% 61.0 61.0 61.0 61.0 61.0
4% 77.6 77.6 77.6 77.6 77.6
5% 106.8 106.8 106.8 106.8 106.8
Source: Beltone estimates
Figure 3: Summary of Almarai’s SOTP valuation Figure 4: Summary of DCF valuation by segment
39.48.8
9.63.2
010203040506070
Dairy &juice
segment
Bakerysegment
Poultrysegment
Otherservices
FV
SAR/
shar
e
SARmnDCF equity
valueFV/share % of
value
Dairy and juice segment
39,349 39.3 65%
Bakery segment 8,810 8.8 14%
Poultry segment 9,633 9.6 16%
Other services 3,199 3.2 5%
Total valuation 61.00
Source: Beltone estimates Source: Beltone estimates

20
Almarai Company 1 December 2020
II. Operations overview
1. Dairy and juice segment (65% of value)
Vertically integrated to secure high quality products, but comes at a cost
Having been in the business for over 40 years, the dairy business (79% of Almarai’s net income) is the largest not only in the kingdom, but also across other GCC countries. The company generates almost 30% of its revenue from neighboring markets, GCC countries, Egypt, and Jordan. The introduction of a new competitor sponsored by the Omani government has led to a loss of market share in Oman, but management believes it can recapture the lost share at a later stage.
The company’s success can be attributed to its ability to produce 1.5bn liters of high quality fresh milk (46% of GCC dairy consumption) out of its 6 Saudi-based farms. The fresh dairy industry is particularly concentrated in the central region of Saudi Arabia where humidity levels are low to preserve milk yield, which is negatively affected by high humidity levels.
These farms house a milking herd of 107,840 Holstein cows sourced from the US and Europe. Owing to breeding, nutrition, farm design, animal husbandry, and crop management, each of these cows yield an annual average of c14k liters, almost double the European figure and nearly 3.5k liters higher than the yield in North America.
Cows are housed and fed at a total mixed ration. To secure the supply of high quality fodder for its livestock, the company sources 40% of its alfalfa hay requirements (one third of total feed requirements) from its own farms in the US, Romania, and Argentina, with the remaining 60% of alfalfa hay besides other feed requirements (soybean, cotton seeds, etc) procured from international markets. This came following a Saudi government decree issued in 2014 that stipulated that by 2018 all local green fodder production for the purpose of herd consumption would be stopped in effort to preserve the kingdom’s precious water resources. The operational cost of overseas farms adds close to SAR90mn annually to the company’s total average operational costs, according to Almarai management.
SAR150mn in lost subsidies in 2021 on changes in subsidy regime
Almarai’s dairy business had been previously eligible for feed subsidies ranging SAR250mn–SAR300mn to offset the high cost of imported feed. However, on 24 December 2019, the Saudi government removed subsidies on all feed imports except for 7 green fodders, including alfalfa hay, with its imports to remain subsidized at SAR221/ton. Accordingly, Almarai expects to collect a total of SAR150mn in subsidies in 2021 on alfalfa hay imports, just half of what it collected in 2019 and 2020 as the new decree will start reflecting on its 2021 financials, with the company set to record accrued amounts of SAR300mn in FY20 related to the 12-month feedstock sourced before the issuance of the decree.
Pricing opportunity for juice without added sugar given 50% selective tax imposed on sugary drinks
Almarai’s juice segment margins have become squeezed as the company has not fully passed on the additional costs incurred on its sugar-free recipes to avoid the 50% selective tax imposed on sugary drinks in Saudi Arabia (consisting of water and sugar, sweeteners, concentrated liquids) effective 1 December 2019. During 9M20, juice revenue witnessed slow growth as consumers tended to focus on buying essentials. Though we believe the new tax imposed on sugary drinks should enhance demand for no-added-sugar juice (a can of a popular soda brand is 50% more expensive than 300ml carton of Almarai’s fresh orange juice), management sees a pricing opportunity as the company will be able to raise the price of juice with no added sugar to levels below the new retail price of sugar-added products.
The juice segment is highly concentrated with the top 3 players holding market shares of 47% and 39% in the kingdom and across the GCC market,respectively.
Streamlining manufacturing operations in Egypt and Jordan
In 9M20, Almarai’s Egyptian unit, IDJ a joint venture with Pepsi, managed to report strong 22% y-o-y growth in top line (partially supported by 5% EGP appreciation), outperforming domestic producers, with the growth stemming from strong market share positions in long-life milk, yoghurt, and juice (with introduction of new economic juice line) as well as successful distribution efforts by expanding over 30,000 coolers in clear store locations and strong brand positioning.

21
Almarai Company 1 December 2020
A new PET line also enabled the company to introduce attractive new packaging for its drinkable yoghurt products. Despite strong top line growth, however, International Dairy and Juice company (IDJ) continues to remain under stress on high labor (3,143 workers) and overhead costs in its Egyptian operations. Juhayna Food Industries’ annual turnover/worker stood at EGP1.9mn in 2019, for example, compared to Almarai’s EGP1.4mn. Accordingly, management is implementing a turnaround strategy with more focus on gross margin improvement and ROI for new CAPEX. Meanwhile, IDJ Jordan-based operations broke-even in 2020 due to its successful introduction of new products (Yoghurt Laban, Labaneh, and Almarai fresh juice), price recovery, and strict cost control measures and a focus on EBIT delivery. A farm renovation in Jordan also helped deliver high quality milk at below market prices. In 2019, IDJ recorded a total loss of SAR20mn out of its operations in Egypt and Jordan.
Figure 5: Almarai leads Egypt’s juice market Figure 6: Packaged milk consumption per capita
in 2019
55%28% 25%
19%
22% 28%
9%
22%
17% 28%40%
0%
20%
40%
60%
80%
100%
120%
Plain milk Spoonable yoghurt Juice
Juhayna Almarai Lamar Danone Others Rani
0
10
20
30
40
50
60
Tuni
sia
Kuw
ait
KSA
UAE
Leba
non
Jord
an
Alge
ria
Ghan
a
Yem
en
Mor
occo
Egyp
t
Syria
Liter
/cap
ita
Source: Juhayna Food Industries 1H20 IR presentation Source: Juhayna Food Industries 1H20 IR presentation
Distribution coverage presents competitive edge
Almarai benefits from an extensive distribution network, allowing fresh products to be distributed via over 9,092 trucks on the road on a daily basis, serving around 62,511 active customers within GCC countries and around 69,000 active customers within Jordan and Egypt.
Figure 7: Almarai’s vertically integrated operations
Poultry farming
Arable & horticulture farm
Manufacturing plant
Milking parlours
Fondomente USA193 shipments in 2019
Fondomente USATotal land = 11,680 hasOwn land = 3,063 has
Fondomente ArgentinaTotal land = 27,423 hasOwn land = 18,054 has
Fondomente Romania42 shipments in 2019
Fondomente Argentina43 shipments in 2019
Source: Almarai investor presentation, June 2020

22
Almarai Company 1 December 2020
2. Poultry division (16% of value)
Fastest growing segment
With a production capacity of 190mn birds, Almarai holds a 35% share of the Saudi fresh poultry segment and a 15% share of the total poultry market (fresh and frozen) in the kingdom. Almarai is currently adding a new production line to its 3 existing lines, which should add around 50mn birds, raising total capacity to around 240mn birds by 2Q21. Poultry revenue grew at a 3-year CAGR of 17% on the consolidation of its associate Pure Breed Company in 2018 following the acquisition of a controlling stake in 2018 as well as on diversifying beyond whole bird sales to selling boneless and mixed parts products. Operating under 2 brands, namely Alyoum and Al Bashayer, the poultry segment includes premium fresh products from whole chicken to portion packs and value-added options. Almarai also maintains its strong position in neighboring GCC markets such as the UAE and Bahrain, with a market share of 10% across the GCC poultry market, generating 12% of total poultry revenue. However, temporary bans on poultry imports in Kuwait from Saudi Arabia in February 2020 on the outbreak of the avian influenza (HPAI)A (H5N1) has affected Almarai’s performance early this year in this market.
Figure 8: Poultry revenue to grow at a 6-year
CAGR of 6% with margins to soften on projected
higher fodder prices
Figure 9: A fourth line should raise total capacity
to 240mn birds (mn birds)
12%14% 14%
13% 12% 12% 11%
0%2%4%6%8%10%12%14%16%
- 500
1,000 1,500 2,000 2,500 3,000 3,500
2019
a
2020
e
2021
e
2022
e
2023
e
2024
e
2025
e
SAR
mn
KSA Other GCC markets Net profit margin
155
190 190
240
2018
a
2019
a
2020
e
2021
e
Source: Company data, Beltone estimates Source: Company data
Sector profitability improved on higher contribution of fresh retail channel on COVID-19; expected to remain unscathed from changes in subsidy regime
Due to the COVID-19 outbreak, Almarai’s food service segment (relatively lower margins) was negatively impacted by the state-imposed curfews, leading to an increase in the contribution of the fresh retail channels to 70% of poultry revenue up from 51% on average. During 9M20, poultry segment revenue grew 12%, driven by volume growth as well as a higher average selling price on changes in channel mix during 2Q20. This filtered through to a higher net profit margin, rising to 15.4% from 12% in 9M19, as capacity was fully utilized. Additionally, the new 5% increase in import duties on frozen poultry to 25%, effective 20 June, supported Almarai’s poultry segment growth.
In 2019, the company collected SAR150mn on poultry feed imports, and, based on management guidance, we expect the company will collect the same under the new production-based subsidy system.
Change in subsidy regime from imported feed to production based
Chicken meat producers incur a high production cost in Saudi Arabia, including the cost of controlling temperatures in chicken houses under extremely hot weather conditions and a heavy reliance on imported feed, vaccines, and equipment. To offset this high cost of production, the Saudi government provides several types of production support, including monthly production based direct financial subsidies to poultry producers, interest-free loans, and rebates on the purchase of certain poultry equipment. While poultry producers currently rely on imported feed, which accounts for about an average 70% of chicken production costs in Saudi Arabia, animal feed subsidies have been critical to the development of Saudi Arabia’s poultry sector. In December 2020, Saudi Arabia eliminated most feed import subsidies and introduced production-based monthly financial payments to poultry producers. This was a move by the government to enhance the efficiency of local farms.

23
Almarai Company 1 December 2020
Figure 10: New poultry industry subsidy regime
Poultry type Subsidy in SAR per month Production unit
Broiler parent chicken 0.4 Per chick
Layer parent chicken 0.2 Per chick
Broiler chick 0.14 Per chick
Broiler meat 0.65 Per kg
Table eggs 15 Per carton of 360 eggs
Source: Barley Trade Quarterly, USDA, 6 Feb 2020
Importing high quality table eggs to cover market shortage
Almarai started importing table eggs from the Netherlands, Belgium, and Germany to cover market shortages during the pandemic, efficiently utilizing its wide distribution channel. Currently, the company is studying expansion into this side of the poultry segment. The outbreak of bird flu (H5N8) in layer farms in early February 2020 reduced the country’s table egg production by approximately 30%. This together with increased at-home consumption due to COVID-19 has driven the retail price of table eggs to increase by over 50%.
Poultry consumption steadily rising on affordability and health perception
Saudi Arabia’s annual poultry consumption, estimated at 1.4mn tons by the USDA, is considered the highest of all animal protein consumption, with per capita consumption in 2019 estimated at approximately 41kg, compared to 12kg for red meat, given its affordability and positive health perception over red meat. Chicken remains the most price competitive animal protein source in Saudi Arabia. Imported commercial beef is sold for up to USD12/kg, while lamb is sold for up to USD15.70.kg, and chicken at USD4.4/kg. After maintaining steady consumption growth for years, this segment’s total consumption dropped, mainly on the expat exodus in 2017, though consumption has ticked up since then. The Saudi poultry meat market is cyclical in nature, with demand rising dramatically during the Umrah and Hajj seasons (prior to Eid al-Adha), particularly in the cities of Mecca and Medina where visitors go to perform the Umrah and Hajj rituals. However, consumption typically declines significantly during the month of Ramadan and during the summer months when millions of Saudis and expatriate workers leave the kingdom for vacations. During 2020, demand was supported by at-home consumption on lockdowns and travel restrictions due to the COVID-19 pandemic. That said, we expect the resumption of international flights to still support demand in 2021e. However, should the government reinstate curfew measures in the event of a second wave, we believe demand for frozen poultry will decline on disrupted tourism, a continued expat exodus, as well as the impact of social distancing measures on food service companies.
Figure 11: Size of the poultry market Figure 12: Annual per capita poultry meat
consumption in Egypt and the GCC (kg/capita)
1.2
1.51.6 1.6
1.3 1.41.4
0.5 0.7 0.7 0.8 0.7 0.7 0.8
0.60.8
0.9 0.80.6 0.6 0.7
0.00.20.40.60.81.01.21.41.61.8
0.00.20.40.60.81.01.21.41.61.8
2013
a
2014
a
2015
a
2016
a
2017
a*
2018
a
2019
a
Thou
sand
s
Tons mn
Consumption Local production Imports
13 16
27
41 43 45 4552
61
Egyp
t
Aver
age
Jord
an KSA
Oman
Kuw
ait
Bahr
ain
Qata
r
UAE
*Imports dropped in 2017 on spread of the avian flu amid expat exodusSource: USDA Poultry and Products annual report, Sep 2020
Source: USDA Poultry and Products annual report, Arab organization for Agricultural Development datastat, 2017

24
Almarai Company 1 December 2020
New government measures to increase poultry self-sufficiency
Domestic chicken meat production in Saudi Arabia reached 730k tons (covering 53% of demand) in 2019, produced by 10 vertically integrated companies controlling over 80% of production. Meanwhile, imports mainly from Brazil and France cover 47% of unmet demand. The poultry market in Saudi Arabia is divided into 2 major segments, fresh (chilled) products produced locally, with a shelf life of approximately 6 days from the production date, and frozen products, produced both locally and imported. The government introduced several measures aiming to reduce reliance on imported chicken and increase the self-sufficiency level to 80% by 2025, including offering local farmers veterinary services that have helped lower the country’s average chicken mortality rate to 10% currently from 25% few years ago.
Figure 13: Saudi Arabia’s poultry market structure Figure 14: Retail fresh chicken market share (by
sales value)
Imported (frozen)
47%
Local (fresh)37%
Local (frozen) 16%
Almarai35%
Al-Watania13%
Tanmiah12%
Radwa12%
Entaj10%
Golden6%
Fakieh6%
Others6%
Source: Almarai investor presentation, June 2020 Source: Almarai investor presentation, June 2020
The Saudi government, as part of its measures to promote local manufacturers, raised import duties from 5% to 20% effective 2017, (or SAR1.00/kg, whichever is higher), which was then raised to 25% on 20 June 2020. This gave shield to local manufacturers to protect their market share as current retail prices of frozen poultry is only 8% lower on average compared to fresh (chilled) poultry following the VAT increase to 15% in July, making locally produced chicken meat more competitive.
Figure 15: Price of imported chicken mirrors corn
price movements
Figure 16: Fresh and frozen chicken retail selling
price (SAR/kg)
18.0 17.5 16.8 17.0 15.8 17.0 16.5 16.0 15.7 14.9 14.0
Enta
j
Alm
arai
Al-W
atan
ia
Fakie
h
Tanm
iah
Sadi
a
Dari
Radw
a
Doux
Enta
j
Sear
a
Fresh Frozen
Source: Indexmundi/commodities Source: Al-Othaim, Carrefour, 13 July 2020 online prices
Brazil’s BRF to set up a new processing plant with a CAPEX of USD120mn
Brazilian food processor BRF SA announced its intentions to invest around USD120mn to build its first chicken processing plant in Saudi Arabia in a bid to strengthen its position in a key growth market. The plant, with an estimated production capacity of 50k tons, is slated to start operating by the end of 2021, and will focus on producing value-added products such as breaded and marinated products and burgers. According to a USDA report, the Saudi government issued new operational licenses for 107 projects with a production capacity of 500mn chickens, in addition to 77 new poultry farms with a combined production capacity of 220mn birds. No information on was provided when construction of these new projects would be completed.
25
Almarai Company 1 December 2020
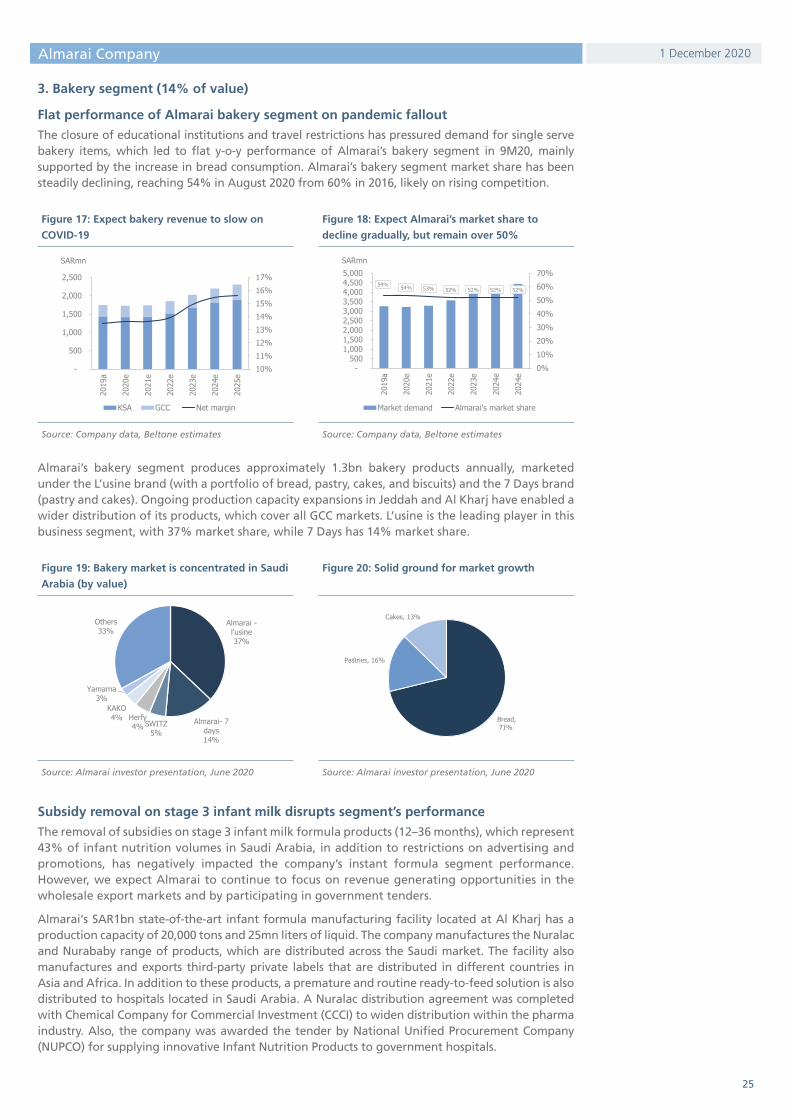
3. Bakery segment (14% of value)
Flat performance of Almarai bakery segment on pandemic fallout
The closure of educational institutions and travel restrictions has pressured demand for single serve bakery items, which led to flat y-o-y performance of Almarai’s bakery segment in 9M20, mainly supported by the increase in bread consumption. Almarai’s bakery segment market share has been steadily declining, reaching 54% in August 2020 from 60% in 2016, likely on rising competition.
Figure 17: Expect bakery revenue to slow on
COVID-19
Figure 18: Expect Almarai’s market share to
decline gradually, but remain over 50%
10%11%12%13%14%15%16%17%
-
500
1,000
1,500
2,000
2,500
2019
a
2020
e
2021
e
2022
e
2023
e
2024
e
2025
e
SARmn
KSA GCC Net margin
54% 54% 53% 52% 52% 52% 52%
0%10%20%30%40%50%60%70%
- 500
1,000 1,500 2,000 2,500 3,000 3,500 4,000 4,500 5,000
2019
a
2020
e
2021
e
2022
e
2023
e
2024
e
2024
e
SARmn
Market demand Almarai's market share
Source: Company data, Beltone estimates Source: Company data, Beltone estimates
Almarai’s bakery segment produces approximately 1.3bn bakery products annually, marketed under the L’usine brand (with a portfolio of bread, pastry, cakes, and biscuits) and the 7 Days brand (pastry and cakes). Ongoing production capacity expansions in Jeddah and Al Kharj have enabled a wider distribution of its products, which cover all GCC markets. L’usine is the leading player in this business segment, with 37% market share, while 7 Days has 14% market share.
Figure 19: Bakery market is concentrated in Saudi
Arabia (by value)
Figure 20: Solid ground for market growth
Almarai -l'usine37%
Almarai- 7 days14%
SWITZ5%
Herfy4%
KAKO4%
Yamama3%
Others33%
Source: Almarai investor presentation, June 2020 Source: Almarai investor presentation, June 2020
Subsidy removal on stage 3 infant milk disrupts segment’s performance
The removal of subsidies on stage 3 infant milk formula products (12–36 months), which represent 43% of infant nutrition volumes in Saudi Arabia, in addition to restrictions on advertising and promotions, has negatively impacted the company’s instant formula segment performance. However, we expect Almarai to continue to focus on revenue generating opportunities in the wholesale export markets and by participating in government tenders.
Almarai‘s SAR1bn state-of-the-art infant formula manufacturing facility located at Al Kharj has a production capacity of 20,000 tons and 25mn liters of liquid. The company manufactures the Nuralac and Nurababy range of products, which are distributed across the Saudi market. The facility also manufactures and exports third-party private labels that are distributed in different countries in Asia and Africa. In addition to these products, a premature and routine ready-to-feed solution is also distributed to hospitals located in Saudi Arabia. A Nuralac distribution agreement was completed with Chemical Company for Commercial Investment (CCCI) to widen distribution within the pharma industry. Also, the company was awarded the tender by National Unified Procurement Company (NUPCO) for supplying innovative Infant Nutrition Products to government hospitals.

26
Almarai Company 1 December 2020
Figure 21: Almarai holds 4% share of infant
formula in Saudi Arabia; remaining 96% is
imported
Figure 22: Infant milk and food services segment
to continue to record losses for 24 months due to
transfer pricing issues and required improvements
in food service channel post COVID-19
Almarai, 4%
Nestle, 20%
Ronesca, 14%
Abbott, 14%Wyeth, 10%
Others, 38%
Source: Almarai investor presentation, June 2020 *Others revenue include revenue of infant formula and the new food service channelSource: Company data, Beltone estimates
Entering the food service channel
Almarai acquired a 100% stake in Premier Foods, which is mainly engaged in providing value-added products (meat and poultry) to the food services industry in the Middle East. This acquisition should further enhance Almarai’s footprint for expansion in the food services channel. Management expects this segment to continue to record losses for at least 18–24 months due to transfer pricing issues and improvements required in the food services channel post COVID-19.

27
Almarai Company 1 December 2020
Figure 23: Revenue to grow at 2019–25 CAGR of 5%... Figure 24: ...supported by diversified market reach...
10 11 12 12 13 13 14
2 2 3 3 3 3 32 2 2 2 2 2 2
0.02.04.06.08.0
10.012.014.016.018.020.0
2019
a
2020
e
2021
e
2022
e
2023
e
2024
e
2025
e
SAR bn
Dairy & juice Poultry Bakery Others
KSA, 68%
UAE, 10%
Oman, 5%
Kuwait, 5%
Egypt, 6%Bahrain, 2%
Jordan, 2% Other exports, 2%
Source: Company data, Beltone estimates Source: Company data
Figure 25: ...and diversified product range Figure 26: Feed prices to grow at a 6-year CAGR
of 2% (USD/ton)
Dairy & juice, 71%
Poultry, 15%
Bakery, 12%Others, 2%
338 338 345 351 359 364 364
167 168 171 174 178 181 181
380 395 404 413 421 429 429
- 50
100 150 200 250 300 350 400 450
2019
a
2020
e
2021
e
2022
e
2023
e
2024
e
2025
e
Alfalfa hay Corn Soybean
Source: Company data Source: FAO, Beltone estimates
Figure 27: EBITDA to grow at a 6-year CAGR of
5%, despite subsidy removal and higher feed
prices
Figure 28: Interest coverage ratio to improve on
continuous deleveraging
29%
28%
27%
28% 28% 28%
29%
26%26%27%27%28%28%29%29%
01,0002,0003,0004,0005,0006,000
2019
a
2020
e
2021
e
2022
e
2023
e
2024
e
2025
e
SAR
mn
EBITDA EBITDA margin - 10.0 20.0 30.0
2019a
2020e
2021e
2022e
2023e
2024e
2025e
Interest coverage ratio (x)
Source: Company data, Beltone estimates Source: Company data, Beltone estimates
Figure 29: Core earnings to grow at 6-year CAGR
of 10%
Figure 30: Asset conversion cycle is balanced
(DOH)
13% 14% 13%15%
16% 17% 17%
0%
5%
10%
15%
20%
0500
1,0001,5002,0002,5003,0003,5004,000
2019
a
2020
e
2021
e
2022
e
2023
e
2024
e
2025
e
SAR
mn
Core earnings Net margin
31 31 31 31 31 31 31
191 191 191 191 191 191 187
19 19 19 19 19 19 19
(61) (61) (61) (61) (61) (61) (61)(53) (53) (53) (53) (53) (53) (53)
(150) (100) (50) - 50
100 150 200 250 300
2019
a
2020
e
2021
e
2022
e
2023
e
2024
e
2025
e
A/R DOH Inventory DOHAdv. payment DOH A/P DOH
Source: Company data Source: Company data, Beltone estimates

28
Rating: Hold
Fair value: SAR33.90
Market price: SAR30.00
Upside: 13%
*Closing as of 29 November 2020
Initiate coverage with a FV of SAR33.90/share and a Hold rating
One of the leading Saudi dairy and food companies, the National Agricultural Development Company (NADEC) has continued to capitalize on its brand power along with its competitive pricing strategy to capture higher market share in the kingdom, recording an annual uptick of 1.8ppt to 12.9% in the dairy segment and 1.0ppt in the food (cheese) segment to 5.9% as of March 2020. This is largely attributed to NADEC’s vertically integrated operations, in which it produces over 1.3mn liters of raw milk daily from its own farms housing 83,000 American Holstein cows. The company’s new management is exploring further growth opportunities, including expanding its organic olive oil segment to cater to growing market needs, with the company owning some 5mn organic olive trees cultivated to produce over 5mn liters of oil annually. We value NADEC using a DCF model, yielding a FV of SAR33.90/share, which wrrants a Hold rating on 13% upside potential from the current share price. We expect core earnings to grow at a 2019–25e CAGR of 7%, supported by revenue growth and margin enhancement.
Margins to soften in 2020e on high cost of feed imports and subsidy removal
While consolidated operating margins have improved over 2017–19 on better product mix, profitablility margins were pressured in 9M20 with EBITDA margin dropping 3.5ppt to 18% from 21% in 2019 on the high cost of imported feed as well as the elimination of feed subsidies on non-green fodder imports, reflecting in NADEC’s 2Q20 and 3Q20 numbers. In this regard, management is currently considering cost-saving initiatives that should gradually support margins in 2021 with the full impact to reflect in 2022. Going forward, we do not rule out gradual price adjustments for fresh milk to pass on higher feed cost starting 2021e and 2022e as purchasing power returns to pre-COVID levels.
Exploring new growth opportunities; turning focus on reactivation of unutilized land to grow fruits and vegetables
The company’s new management is working on several cost-saving initiatives as well as exploring further growth opportunities. NADEC started exporting to the Egyptian market (population of over 100mn). Management also highlighted that the offer to acquire 100% of Al Safi Danone Company, the fourth largest dairy producer in Saudi Arabia, could further be reinstated, despite initial negotiations falling through back in June 2019 as the deal was not value accretive for both parties. The deal was conditional on NADEC’s share market value among other criteria at the time of execution. While NADEC’s share price is up 46% since the deal was terminated, we believe diversifying its product range to other high-margin non-dairy segments such as the agribusiness will add more value than expanding in the dairy business given arising cost pressures, milk oversupply following the emabargo in Qatar, entrance of new regional competitors, and price competition.
National Agricultural Development Company (NADEC)New management seeks new growth opportunities along with cost rationalization initiativesFood and Dairy | Saudi Arabia
Initiation of Coverage 1 December 2020
Main financial highlights (FY end Dec)
In SARmn, unless otherwise stated 2019a 2020e 2021e 2022e
Revenue 2,225 2,288 2,430 2,558
EBITDA 468 394 427 449
EBITDA margin 21.0% 17.2% 17.6% 17.6%
Recurring net income* 104 37 68 76
P/E (x)* 29 83 45 40
EV/EBITDA (x) 10 12 11 10
ROAE* 7.2% 2.5% 4.5% 4.8%
* based on core net income (excluding one-offs and volatile items)Source: Company, Beltone estimates
Stock dataReuters 6040.SE
Bloomberg NADEC EY
Shares (mn) 102
MKT capSAR3,049mn/
USD813mn
3M avg. daily liquiditySAR30.7mn/
USD8.1mn
52-week high/low SAR34.45/SAR16.82
Free float 62.4%
Please see the investment ratings and important disclosures contained on the last page of this report
Shareholders structure
15.017.019.021.023.025.027.029.031.033.035.0
Dec
-19
Jan
-20
Feb
-20
Mar
-20
Ap
r-20
May
-20
Jun
-20
Jul-
20
Au
g-2
0
Sep
-20
Oct
-20
No
v-20
SARNADEC TASI (rebased)
Public Investment
Fund20.0%
A. M. Al-Othman7.3%
A.M. Al-Othman5.3%
A. Saleh El Raghi5.0%
Free Float62.4%
Ingy El Diwany, CFA [email protected] | +20224616352
Mohamed [email protected] | + 20224616382

29
NADEC 1 December 2020
Investment summary
Established in 1981, NADEC is the first agricultural shareholding company set up by a royal decree from the Saudi government to contribute to the food security and sustainability in the kingdom. Listed on the Saudi Tadawul in 1993, NADEC is currently one of the leading vertically integrated dairy producers with a 15% share in the Saudi dairy market. The company produces milk (fresh and long-life milk), laban, yoghurt, cheese and olive oil through its dairy and food arm (94% of revenue) in addition to fruits and vegetables through its agricultural arm (6% of revenue). With 4 cultivating projects in Saudi Arabia, NADEC cultivates 100,000 tons of fruits and vegetables, 3,000 tons of organic dates, and 5mn olive trees across a total land area of 25.4k hectares. NADEC’s cattle farms produce over 1.27 liters of raw milk daily, with the support of 83k American Holstein cows, with main feed ingredients sourced from its 60k feddans leased in Sudan (less than 10%), the US, and European countries following the ban on locally grown forage crops. NADEC has 34 wholly owned distribution facilities and sells over 180 SKUs across 48,000 retail stores in Saudi Arabia and the GCC.
Valuation methodology and risks
We have a Hold rating on NADEC with a FV estimate of SAR33.90/share using a 6-year DCF, discounted at a WACC of 6.6%, and a terminal growth rate of 2.5%.
Key downside risks to our forecasts include (i) spread of infectious disease (Mastitis) negatively affecting milk yield and milk quality, (ii) risk of availability of imported forage from international markets especially during drought, (iii) competition risk together with risk of milk oversupply limiting the company’s ability to pass on inflated imported feed.
29
Financial statement | FY end Dec (SARmn)
Income statement 2019a 2020e 2021e 2022e
Revenue 2,225 2,288 2,430 2,558
COGS (1,176) (1,282) (1,353) (1,437)
Gross profit 1,049 1,006 1,077 1,120
SG&A expenses (581) (612) (650) (671)
EBITDA 468 394 427 449
Depreciation and amortization 277 292 305 319
EBIT 191 102 123 130
Net financing costs (118) (52) (53) (52)
Other income/costs (76) 53 - -
Earnings before zakat (3) 104 70 78
Zakat (5) (3) (2) (2)
Net profit after zakat (8) 101 68 76
Core Earnings 104 37 68 76
Balance sheet 2019a 2020e 2021e 2022e
Cash and equivalents 63 21 27 29
Accounts receivables 341 341 365 387
Inventory 548 590 606 605
Prepaid expenses and other
receivables 156 164 170 176
Total current assets 1,107 1,116 1,168 1,197
Total non-current assets 2,837 2,909 2,901 2,886
Total assets 3,944 4,024 4,068 4,083
Banks short-term borrowings 316 620 870 1,050
CPLTD 308 308 281 274
Account payables 415 453 478 508
Creditors and other credit balances 204 210 214 219
Total current liabilities 1,243 1,591 1,843 2,050
Long-term debt 1,088 780 499 225
Provision for end-of-service benefits 166 170 175 179
Other liabilities 6 6 6 6
Total non-current liabilities 1,260 956 680 411
Paid-in capital 847 1,016 1,016 1,016
Reserves 201 211 218 226
Retained earnings 392 250 311 380
Total equity 1,440 1,477 1,546 1,622
Total liabilities and equity 3,944 4,024 4,068 4,083
Cash flow 2019a 2020e 2021e 2022e
Change in working capital 118 (18) (17) 8
Cash flow from operations 551 378 413 459
CAPEX (311) (335) (268) (275)
Cash flow from investing (236) (363) (297) (304)
Free cash flow (FCF) 316 15 117 155
Cash flow from financing (289) (56) (111) (153)
Change in cash 27 (41) 6 2
Main ratios 2019a 2020e 2021e 2022e Per-share data
EPS (SAR)* 1.0 0.4 0.7 0.7 BVPS (SAR) 14.2 14.5 15.2 16.0 DPS (SAR) - - - - Valuation data
P/E (x)* 29.3 82.9 44.7 40.1 P/BV (x) 2.1 2.1 2.0 1.9 Dividend yield 0.0% 0.0% 0.0% 0.0%FCF yield 10.4% 0.5% 3.8% 5.1%EV/ IFRS EBITDA (x) 10.0 12.0 10.9 10.2 Growth (y-o-y)
Revenue 6.2% 2.8% 6.2% 5.3%EBITDA 16.8% -15.9% 8.5% 5.0%EBIT 47.3% -46.5% 20.1% 5.8%Attributable net income NA NA -32.6% 11.4%Core attributable net income* 97.9% -64.6% 85.4% 11.4%Profitability
Gross profit margin (GPM) 47.2% 44.0% 44.3% 43.8%EBITDA margin 21.0% 17.2% 17.6% 17.6%EBIT margin 8.6% 4.5% 5.1% 5.1%Core net profit margin (NPM)* 4.7% 1.6% 2.8% 3.0%ROAA* 2.6% 0.9% 1.7% 1.9%ROAE* 7.2% 2.5% 4.5% 4.8%ROAIC 3.2% 1.1% 2.1% 2.3%Leverage
Net debt (cash)/equity (x) 1.1 1.1 1.1 0.9 Net debt (cash)/IFRS EBITDA (x) 8.6 16.5 13.2 11.7 * based on core net attributable income (excluding one-offs)Source: Company, Beltone estimates

30
NADEC 1 December 2020
I. Valuation
We have a Hold recommendation on NADEC with a FV of SAR33.90, implying a 13% upside potential. We reach this value using a FCFF valuation methodology. Our DCF model utilizes a WACC of 6.6% and a cost of equity of 7.4% derived from (i) a risk-free rate (using the average of a 4 year and 7-year sovereign sukuk yield after zakat) of 2.3%, (ii) equity market risk premium (ERP) of 6.2% (US market risk premium plus an additional country risk premium), and (iii) a beta of 0.8. Our WACC calculations are based on a 64% weight of equity. We also use a terminal growth rate of 2.5%.
Figure 1: Discounted cash flow (SARmn)
2020e 2021e 2022e 2023e 2024e 2025e
EBIT 102 123 130 162 183 199
Zakat (3) (2) (2) (3) (3) (4)
NOPLAT 100 121 128 160 180 195
Depreciation and amortization 292 305 319 335 354 375
Adjusted COPLAT 391 426 447 495 534 570
CAPEX (285) (268) (275) (287) (305) (313)
Change in working capital (18) (17) 8 (15) (25) (22)
FCFF 89 141 180 193 203 234
Terminal value 5,714
PV of FCFF 88 131 157 159 156 4,276
Enterprise value (EV) 4,967
Net debt (cash) (as of 30 Sep 2020) 1,518
Equity value 3,450
FV/share, SAR 33.9
Potential return 13%
Figure 2: Sensitivity of our FV to changes in WACC and terminal growth rate
Term
inal
gro
wth
rat
e
WACC
4.4% 5.4% 6.4% 7.4% 8.4%
0.5% 20.4 20.4 20.4 20.4 20.4
1.5% 25.9 25.9 25.9 25.9 25.9
2.5% 33.9 33.9 33.9 33.9 33.9
3.5% 47.1 47.1 47.1 47.1 47.1
4.5% 72.1 72.1 72.1 72.1 72.1
Source: Beltone estimates

31
NADEC 1 December 2020
II. Operations overview
1. Dairy and food segment (93% of FY19 revenue)
New management targets growth opportunities to boost top line performance
Steen Hadsberg, NADEC’s new CEO, along with the rest of the team target exploring new growth opportunities to stimulate top line growth, which grew at 2016–19 CAGR of 1%. We believe the company will continue to capitalize on sustainable market demand for dairy products, especially fresh milk (47% of sales), long-life milk (18% of sales), and cheese (11% of sales). NADEC started exporting long-life milk to the Egyptian market, and has regional presence in Jordan, Lebanon, the Sychelles, along with GCC neighboring markets. Meanwhile, we believe juice sales (13% of sales) will continue to slow on growing competition and price sensitivity, especially following the kingdom’s imposition of a 50% excise tax on sugar-sweetened beverages effective December 2019. NADEC’s olive oil segment grew at a 2016–19 CAGR of 60%. Given the strong demand for olive oil in the kingdom, NADEC decided in March 2019 to build the second phase of the existing olive-oil mill in Al-Jouf with an estimated CAPEX of EUR3mn. The company awarded Germany-based GEA for the project, which, once finalized, should be the largest in Asia. Going forward, we estimate top line will grow at a 2019–25e CAGR of 5%, driven by recovering economic performance post 2022e as well as expected selling price adjustments and expansions into new high-growth segments.
Figure 3: GCC dairy market by brand* Figure 4: GCC processed cheese market by
manufacturers
Figure 5: GCC juice market share data by
brand**
Almarai46%
Saudia (SADAFCO)
9%
NADEC9%
Al Safi7%
Al Rawabei5%
Nada4%
Al-Ain4%
Others16%
Almarai32%
Arla20%
Bel Group20%
Mondolez13%
NADEC6%
Others9%
Almarai17%
Al Rabie13%
Suntop11%
Rani9%Original
5%
NADEC4%
Others41%
*Dairy market includes fresh milk, long-life milk, laban and yoghurt ** Juice includes Fresh, long-life, cans and othersSource: Nielsen company, Jun 2019/ Almarai IR presentation, 30 June 2020
Margins to soften on high cost of feed imports and subsidy removal
The increased cost of imported forage following the elimination of their subsidies (except alfalfa) and the higher feed prices have pressured NADEC’s 9M20 operating margins. This, in addition to expected milk oversupply and weakening purchasing power, will also continue to pressure margins in the coming period. According to management, feed subsidies, recorded on an accrual basis, will likely drop to SAR50mn–SAR60mn in 2020 from SAR86mn in 2019 on consumed feed. NADEC operates one of the leading vertically integrated dairy operations, with over 7 cattle farms housing 83k Holeistein cows producing 1.27mn liters of fresh milk per day, and 2 processing facilities in the city of Haradh, which produces fresh milk, long-life milk, and their derivatives such as laban, yoghurt, butter, cream, and cheese. Given the ban imposed on growing forage in the kingdom to preserve water resources, the company started in 2018 to import its feed needs of yellow corn, alfalfa hay, soybean, and DDSG. Around 6% of its daily 1,500 ton needs are sourced from the company’s leased farm in Sudan (60k feddans) with the balance sourced from the US and Eastern Europe.
Management considering strategic cost-saving initiatives to protect margins
To support margins, management is currently considering the following initiatives: (i) restructuring methods for the land in Sudan given the current high cost of feed sourced from Sudan compared to other countries, (ii) working on different feed recipes to balance cost by utilizing lower cost feed instead of high cost ones, (iii) outsourcing the supply chain through a vendor-managed inventory model (VMI), where the manufacturer hands over the responsibility of replenishing stock to key suppliers to supply just in time feed based on production plans and forecasts.

32
NADEC 1 December 2020
This should eliminate the working capital burden and storage costs, as the company usually keeps 7–8 months of alfalfa hay stock in Haradh, (iv) managing the right balance between the retail and the food service channels to achieve higher profitability given the latter’s low cost of distribution, (v) efficient utilization of its distribution network, with distribution costs currently 45%–50% higher than peers, through distribution center optimization, and (vi) waste management and reducing sales return of 6% (20mn) to 5%. Management expects these initiatives to start reflecting in 2021, with the full impact to reflect on 2022 numbers.
Al Safi Danone deal negotiations terminated, but could be reinstated
Management highlighted that the offer to acquire 100% of Al Safi Danone, the fourth largest dairy producer in Saudi Arabia, could further be reinstated though negotiations were terminated in June 2019 as the deal was not value accretive for either party. Valued in 2018 at SAR1bn–SAR1.5bn, the transaction was planned to be financed by NADEC holding a SAR536mn capital increase with target shareholders owning 38.75% of NADEC and existing shareholders diluted to 61.25%. The deal was conditional on NADEC’s share market value among other criteria at the time of execution. While NADEC’s share price has risen 46% since the deal was terminated, we believe diversifying its product range to other high-margin non-dairy segments such as the agribusiness will add more value than expanding in the dairy business.
2. Agricultural products, feed, and others (7% of FY19 revenue)
Turning focus on reactivation of unutilized land to grow fruits and vegetables
With over 25k hectares of cultivated land across 4 major agriculture locations, we believe NADEC’s agriculture segment will continue to grow, as management turns its focus on reactivation of unutilized land plots following the ban of feed cultivation in Saudi Arabia to preserve water resources. The segment was mainly focused on growing forage, such as alfalfa hay, corn, and soybean, for internal consumption of the herd, with sales of excess feed representing 5% of revenue in 2018. Now, management is increasing focus on growing value-added fruits and vegetables, including potatoes, onions, and palm, given Saudi consumers have recently been shifting food consumption patterns toward fresh products in effort to maintain healthier lifestyles, in line with global trends.
NADEC’s Al-Jouf site is located 1,250km from Riyadh, with a cultivated area of 4,000 hectares and a suitable climate for the cultivation of fruit trees such as peach, apricot, and plum. With over 100,000 tons of fruits and vegetables and 280 tons of premium organic dates gathered throughout Saudi Arabia, NADEC’s agricultural segment (4% of total FY19 sales) recorded the utmost improvement across all other business segments with a 23% y-o-y enhancement in 2019.
On 4 November 2020, NADEC signed a memorandum of understanding (MOU) with Pure Harvest Smart Farms Company to build and operate approximately 6 hectare high-tech hydroponic climate-controlled greenhouses as a first phase within NADEC City in Haradh. This came in a bid to produce and supply high-quality fresh fruits and vegetables to the Saudi market. The MOU will mature after 150 days from the signing date. On a macro level, the government has been endorsing drip irrigation to cope with limited water supply, with the aim of sustaining local fruit and vegetable cultivation. These undertakings are projected to diminish local necessity on imports and consequently improve national cultivation, with the size of the kingdom’s fruit and vegetable capacity to grow at a 2020–25e CAGR of 5.2%, according to industry data.
Feed and others
According to the United Nations Development Programme (UNDP), some 81% of Saudi Arabia’s fresh water is utilized for cultivation. Accordingly, the government prohibited the harvesting of green fodder in November 2018 to preserve water levels. As a result, NADEC’s 2019 feed revenue plummeted to SAR1mn from SAR109mn in the previous year. We believe the segment will continue to demonstrate insignificant levels going forward as the government maintains its policy to preserve water reserves. NADEC’s other revenue category includes the sales of calves and bulls, which recorded a considerable increase of 14.7% y-o-y in FY19, possibly on the oversupply of milk production during the previous years.

33
NADEC 1 December 2020
Figure 6: Revenue to grow at 2019–25e
CAGR of 5% supported by dairy and
agriculture sector
Figure 7: Fresh milk to continue to lead
contribution to top line
Figure 8: Limited exports to the GCC,
Levant, Libya, Pakistan, Australia, and the
Seychelles
0%1%2%3%4%5%6%7%
- 500
1,000 1,500 2,000 2,500 3,000 3,500
2019
a
2020
e
2021
e
2022
e
2023
e
2024
e
2025
e
SARmn
Net sales y-o-y growth
Fresh milk47%
Juice13%
UHT milk19%
Cheese & butter11%
Olive oil3%
Agri. products
4%
Calves & others
3%
1,830 1,724 1,833 1,947
346 309 263 279 16%
15%
13% 13%
0%2%4%6%8%10%12%14%16%18%
-
500
1,000
1,500
2,000
2,500
2016
a
2017
a
2018
a
2019
a
SARmn
KSA Other countries % of export sales
Source: Company data, Beltone estimates Source: Company data Source: Company data
Figure 9: GPM to drop on feed subsidy
removal and higher feed cost, but remain
supported by cost saving measures
Figure 10: High SG&A/sales ratio to
gradually decline on cost saving initiatives
Figure 11: Overall EBITDA margins to drop,
but to gradually recover on cost-saving
initiatives
47%44% 44% 44% 44% 44% 44%
20%
25%
30%
35%
40%
45%
50%
0200400600800
1,0001,2001,400
2019
a
2020
e
2021
e
2022
e
2023
e
2024
e
2025
e
SAR
mn
Gross profit GPM
26%27% 27%
26%26%
25% 25%
20%21%22%23%24%25%26%27%28%
0200400600800
1,0001,2001,400
2019
a
2020
e
2021
e
2022
e
2023
e
2024
e
2025
e
SAR
mn
SG&A SG&A/sales
21%
17% 18% 18% 18% 19% 19%
3%
8%
13%
18%
23%
0
100
200
300
400
500
600
2019
a
2020
e
2021
e
2022
e
2023
e
2024
e
2025
e
SAR
mn
EBITDA EBITDA margin
Source: Company data, Beltone estimates Source: Company data, Beltone estimates Source: Company data, Beltone estimates
Figure 12: High feed stock on hand to
gradually reduce on efficient feed sourcing
Figure 13: Core earnings to grow at a
6-year CAGR of 7%
Figure 14: Steady recovery of FCFF; net
debt/equity to gradually decline
55 54 54 54 55 55 55
168 166 161 151 147 147 145
29 29 29 29 29 29 29
(127) (127) (127) (127) (127) (127) (127)
(21) (21) (21) (21) (21) (21) (21) (200)
(100)
-
100
200
300
2019a 2020e 2021e 2022e 2023e 2024e 2025e
A/R DOH Inventory DOH Adv. paymentA/P DOH A/E DOH
5%
2%
3% 3%
4%5%
5%
0%
1%
2%
3%
4%
5%
6%
0
50
100
150
200
2019
a
2020
e
2021
e
2022
e
2023
e
2024
e
2025
e
SAR
mn
Core income Net margin
316
15
117 155 167 174 202
1.1 1.1 1.1
0.9 0.8
0.7
0.6
0.0
0.2
0.4
0.6
0.8
1.0
1.2
0
100
200
300
400
500
600
2019
a
2020
e
2021
e
2022
e
2023
e
2024
e
2025
e
FCFF Net debt/equity
Source: Company data, Beltone estimates Source: Company data, Beltone estimates Source: Company data, Beltone estimates

34
Rating: HOLD
Fair value: SAR194.40
Market price: SAR175.20
Upside: 11%
*Closing as of 29 November 2020
Initiate coverage with a FV of SAR194.40/share and a Hold rating
We initiate coverage on Saudia Dairy and Foodstuff Company (SADAFCO) with a FV of SAR194.40/share, derived via a DCF valuation, and a Hold recommendation on 11% upside potential from the current market price. SADAFCO has maintained its steady growth performance since it was established in 1976 by offering a wide product range, including ice cream and tomato paste, in addition to long-life milk. Increasing piling-up activities during the pandemic gave a boost to the company’s long-life milk and tomato paste, though SADAFCO’s long-life milk is priced at a premium compared to key competitors on its strong brand equity. Current weak consumer spending is likely to slow revenue growth, and accordingly the projected higher SMP prices will likely pressure operating margins. In this regard, we expect earnings to decline 6% in FY22e (FY ending March), with earnings to then grow at a 4-year CAGR of 6%, supported by revenue growth as the impact of the pandemic subsides.
Fresh milk oversupply and higher SMP prices to impact margins in 2021e; potential selling price adjustments as purchasing power restores to pre-COVID levels
We believe discounts on long-life milk selling prices will likely resume in the coming period in light of an expected fresh milk market supply glut on the expat exodus as well as the entrance of a new competitor in Oman. Ultimately, the excess milk could be converted to milk powder, and hence pressure prices lower. This, coupled with the expected 11% higher SMP prices in 2021e, will lead to pressured profitability margins, in our view, given SADAFCO’s 3–6 month average SMP stocking period and as the company only secures 20% of its SMP needs from its Poland-based producer (Mlekoma). We rule out any high price adjustments in 2021e as the recent VAT increase was not fully passed on in certain product categories given weakening consumer spending. As demand returns to normal, we expect to see price adjustments starting in 2022e onward with long-life milk prices estimated to grow at a 3-year CAGR of 3% to support profitability margins.
Debt free with sizeable cash on hand for opportunistic expansions; shareholders approve up to 9% share buyback
In addition to adding distribution warehouses to minimize logistics costs and save on third-party storage facilities, the company is currently setting up a new Jeddah-based ice-cream factory at a CAPEX of SAR105mn, with operations slated for mid 2021, to cater to the growing high-margin ice cream market. The company previously expressed interest in diversifying into the meat segment by acquiring a controlling stake in livestock, and meat importer Horizon Food Factory Company, but the 3-month term of the MOU was terminated on 28 October 2020 without a final agreement reached. The company, instead, is planning to utilize the sufficient cash on hand (SAR610mn as of 30 September 2020, 30% of annual sales) to buy back up to 2.7mn of its shares, representing 9% of outstanding shares (valued at SAR482mn) within a year with a 5-year holding period, after receiving shareholder approval at its 18 November EGM.
Saudia Dairy & Foodstuff Company (SADAFCO)
Diversification is key for higher growth
Food and Dairy | Saudi Arabia
Initiation of Coverage 1 December 2020
Main financial highlights (FY end Mar)
In SARmn, unless otherwise stated 2020a 2021e 2022e 2023e
Revenue 2,056 2,177 2,288 2,459
EBITDA 388 401 389 411
EBITDA margin 19% 18% 17% 17%
Recurring net income* 280 284 267 278
P/E (x)* 20.0 19.8 21.0 20.2
EV/IFRS EBITDA (x) 13.7 13.1 13.5 12.8
ROAIC 25.0% 22.9% 20.3% 19.8%
* based on core net income (excluding one-offs and volatile items)Source: Company, Beltone estimates
Stock data
Reuters 2270.SE
Bloomberg SADAFCO AB
Shares (mn) 32
MKT capSAR5,603mn,
USD1,494mn
3M avg. daily liquiditySAR9.3mn,
USD2.5mn
52-week high/low SAR197/SAR114.4
Free float 48%
Please see the investment ratings and important disclosures contained on the last page of this report
Shareholders structure
Qurain Petrochemicals Industries
(QPIC) 40%
SAMH Trading
12%
Free Float48%
15.035.055.075.095.0
115.0135.0155.0175.0195.0215.0
Dec
-19
Jan
-20
Feb
-20
Mar
-20
Ap
r-20
May
-20
Jun
-20
Jul-
20
Au
g-2
0
Sep
-20
Oct
-20
No
v-20
SARSADAFCO TASI (rebased)
Ingy El Diwany, CFA [email protected] | +20224616352
Mohamed [email protected] | + 20224616382

35
SADAFCO 1 December 2020
Investment summary
Since its establishment in 1976, Saudia Dairy and Foodstuff Company (SADAFCO) has been a leader in the Saudi long-life milk market, with the Saudia brand capturing over 60% of the long-life milk market and almost a quarter of total drinking milk. SADAFCO was formed initially as a JV between Saudi and Kuwaiti investors together with Danish Turnkey Dairies before it was publicly listed on the Saudi Tadawul in 2005. From producing long-life milk initially, the company has diversified its product portfolio to include 130 stock keeping units (SKU), including ice cream, tomato paste (market leader), Feta cheese (through a JV with New Zealand Dairy Board), hommos, juice drinks, among others. SADAFCO sells products produced by third-party manufacturers, such as French fries, butter, and triangle cheese. SADAFCO’s products are marketed under the Saudia, Crispy, and Majestique brands across the region. Its manufacturing facilities are located in Jeddah (2 factories) and Dammam in addition to a plant in Poland. The company targets the Saudi and neighboring markets through wide regional distribution centers (RDCs) in Riyadh, Jeddah, and Dammam as well as 20 depots across Saudi Arabia and neighboring GCC markets. We expect top line and core earnings to grow at 6-year CAGRs of 7% and 3%, respectively.
Valuation methodology and risks
We have a Hold rating on SADAFCO with a FV estimate of SAR194.40/share using a 6-year DCF, discounted at a WACC of 6.4%, and a terminal growth rate of 2.5%. Key downside risks to our forecasts include (i) inflation of key raw material prices (SMP, AMF, tomato paste concentrate), which together with (ii) competition risk from fresh milk producers that utilize their oversupply of fresh milk in UHT manufacturing, could limit the company’s cost passing abilities, and (iii) changes in consumer preferences toward fresh healthy products over recombined products could adversely impact performance of long-life milk.
35
Financial statement | FY end Mar (SARmn)
Income statement 2020a 2021e 2022e 2023e
Revenue 2,056 2,177 2,288 2,459
COGS (1,267) (1,357) (1,464) (1,574)
Gross profit 789 820 824 885
SG&A expenses (401) (419) (435) (473)
EBITDA 388 401 389 411
Depreciation and amortization (100) (108) (114) (125)
EBIT 288 293 275 287
Net financing costs 8 9 9 10
Other income/costs (12) (6) (5) (5)
Earnings before zakat 284 296 280 292
Zakat (19) (21) (21) (22)
Net profit after zakat 265 275 258 269
Attributable net income 266 277 260 271
Non-contolling interest (1) (1) (1) (1)
Core attributable net income* 280 284 267 278
Balance sheet 2020a 2021e 2022e 2023e
Cash and equivalents 646 731 750 757
Accounts receivables 203 218 226 236
Inventory 358 358 387 414
Prepaid expenses and other
receivables 67 72 75 79
Total current assets 1,273 1,378 1,438 1,486
Total non-current assets 901 963 1,030 1,099
Total assets 2,174 2,342 2,468 2,585
CPLTD of lease liability 12 20 20 20
Trade & other payables 221 248 266 286
Accruals and other liabilities 249 277 299 321
Zakat payable 16 16 16 16
Total current liabilities 498 560 601 643
Non-controlling interest put option 29 29 29 29
Lease liability 57 57 57 57
Provision for end-of-service benefits 113 113 113 113
Total non-current liabilities 200 200 200 200
Paid-in capital 325 325 325 325
Treasury shares (52) (52) (52) (52)
Reserves 417 431 457 484
Retained earnings 767 859 920 969
Non-controlling Interest 20 18 17 16
Total equity 1,476 1,582 1,667 1,742
Total liabilities and equity 2,174 2,342 2,468 2,585
Cash flow 2020a 2021e 2022e 2023e
Change in working capital (68) 26 (6) (7)
Cash flow from operations 318 417 374 394
CAPEX (75) (150) (161) (173)
Cash flow from investing (91) (170) (181) (193)
Free cash flow (FCF) 227 247 193 201
Cash flow from financing (163) (162) (173) (194)
Change in cash 64 85 19 7
Main ratios 2020a 2021e 2022e 2023e Per-share data
EPS (SAR)* 8.8 8.9 8.3 8.7 BVPS (SAR) 46.2 49.5 52.1 54.5 DPS (SAR) 4.5 5.3 5.4 6.1 Valuation data
P/E (x)* 20.0 19.8 21.0 20.2 P/BV (x) 3.8 3.5 3.4 3.2 Dividend yield 2.6% 3.0% 3.1% 3.5%FCF yield 4.0% 4.4% 3.4% 3.6%EV/ IFRS EBITDA (x) 13.7 13.1 13.5 12.8 Growth (y-o-y)
Revenue 13.4% 5.9% 5.1% 7.5%EBITDA 33.5% 3.5% -3.1% 5.8%Earnings 23.8% 3.9% -6.1% 4.3%Core attributable net income* 27.6% 1.1% -6.0% 4.2%
Profitability
Gross profit margin (GPM) 38.4% 37.7% 36.0% 36.0%EBITDA margin 18.8% 18.4% 17.0% 16.7%EBIT margin 14.0% 13.5% 12.0% 11.7%Core net profit margin (NPM)* 13.6% 13.0% 11.7% 11.3%ROAA* 13.7% 12.6% 11.1% 11.0%ROAE* 19.8% 18.5% 16.4% 16.3%ROAIC 25.0% 22.9% 20.3% 19.8%Leverage
Net debt (cash)/equity (x) (0.2) (0.2) (0.2) (0.2)Net debt (cash)/IFRS EBITDA (x) (0.8) (0.9) (0.9) (0.8)* based on core net attributable income (excluding one-offs)Source: Company, Beltone estimates

36
SADAFCO 1 December 2020
I. Valuation
We have a Hold recommendation on Sadafco with a FV of SAR194.40/share, implying an 11% upside potential. We reach this value using a FCFF valuation methodology.
Our DCF model utilizes a WACC of 6.4% and a cost of equity of 6.4% derived from (i) a risk-free rate (using the average 4-year and 7-year sovereign sukuk yield after zakat) of 2.3%, (ii) equity market risk premium (ERP) of 6.2% (US market risk premium plus an additional country risk premium), and (iii) a beta of 0.7. Our WACC calculations are based on a 100% weight of equity. We also use a terminal growth rate of 2.5%
Figure 1: Discounted cash flow (SARmn)
2020e 2021e 2022e 2023e 2024e 2025e
EBIT 294 277 289 301 319 346
Zakat paid (21) (21) (22) (22) (23) (24)
NOPAT 273 256 267 279 296 323
Depreciation & amortization 108 114 125 135 144 156
Adjusted COPAT 381 370 391 414 440 479
∆ in net working capital 26 (6) (7) 2 (7) (25)
CAPEX (150) (161) (173) (187) (201) (216)
Exercise of put option of Melokoma - - - (29) - -
Free cash flow to firm (FCFF) 258 203 211 201 233 237
Terminal Value 6,310
PV of FCFF 253 187 183 163 178 4,711
Enterprise value (EV) 5,676
Net cash (debt) (as of 30 Sep 2020) 542
Equity value 6,217
FV/share*, SAR 194.40
Upside potential 11%
*Based on issued no. of shares
Figure 2: Sensitivity of our FV to changes in WACC and terminal growth rate
Term
inal
gro
wth
rat
e
Terminal WACC
6.5% 7.5% 8.5% 9.5% 10.5%
1% 144.1 144.1 144.1 144.1 144.0
1.5% 164.1 164.1 164.1 164.0 164.0
3% 194.5 194.4 194.4 194.4 194.4
4% 246.1 246.1 246.0 246.0 246.0
5% 353.4 353.4 353.4 353.4 353.3
Source: Beltone estimates

37
SADAFCO 1 December 2020
II. Operations overview
Fresh milk oversupply and higher SMP prices to impact margins in 2021e; potential selling price adjustments as purchasing power restores to pre-COVID levels
The current market imbalance due to a fresh milk oversupply on the expat exodus, interrupted tourism activities, and the entrance of a new competitor in Oman are all likely to lead to increasing conversion of excess fresh milk to SMP. This could ultimately resume the price discount wave of long-life milk, as was the case over the last few years. In light of the current weakening of consumer spending, we believe SADAFCO’s top line is likely to exhibit slow revenue growth as consumers have become more price sensitive, unless the company adopts price discounts. Accordingly, the projected 11% higher SMP prices in 2021e will likely pressure operating margins given SADAFCO’s 3–6 month average SMP stocking period. In this regard, we expect earnings to decline 6% in FY22e, with earnings growth to accelerate afterwards, growing at a 4-year CAGR of 6% supported by revenue growth as the impact of the pandemic subsides. We rule out higher price adjustments in 2021e as the recent VAT increase was not fully passed on by all producers, given weakening consumer spending. We expect to see price adjustments starting 2022e onward with long-life milk prices estimated to grow at a moderate 6-year CAGR of 3% given its strategic importance.
Securing 20% of SMP needs through acquisition of Polish Mlekoma
SADAFCO is exposed to fluctuations in the price of powdered milk (SMP and AMF), the primary ingredient in recombined milk production, which adversely affects the company’s margins amid a supply glut and competitive environment. The company keeps an average 3–6 months of SMP stock (based on price forecast), with SMP sourced at spot prices with the option of future delivery. Furthermore, the company currently secures 20% of its powdered milk requirements from its 76%-owned Polish-based subsidiary, Mlekoma, following the SAR84mn deal executed on 2 July 2018, leading to estimated savings of SAR10mn on the consolidated level in FY19/20, while losses of the subsidiary reached SAR1.6mn for securing Mlekoma’s 42k MT of SMP at better terms. Non-controlling equity holders have the option to put their remaining 24% stake in Mlekoma at the option expiry date in 2023 (fifth year of the completion date) at a higher purchase price or FY22/23 earnings multiplier based on Mlekoma’s EBITDA (after deducting net debt). SADAFCO has estimated a gross cash outflow of SAR27.3mn–SAR38.7mn if it were to exercise its option. The remaining SMP requirements are sourced from Australia, New Zealand, and the US. Moreover, Sadafco mixes fresh milk sourced from domestic peers with SMP
Figure 3: Ex-factory long-life milk prices will not
keep pace with higher forward SMP prices
Figure 4: EBITDA margins to soften in the coming
period in this regard
3.7 3.6
4.7 4.55.0 5.1 5.1 5.2 5.2
3.7
3.43.2 3.2 3.2 3.3 3.4 3.5 3.6
0.00
1.00
2.00
3.00
4.00
5.00
6.00
2017
a
2018
a
2019
a
2020
e
2021
e
2022
e
2023
e
2024
e
2025
e
SAR/
liter
SMP prices (rebased) Long-life milk
18.8%18.4%
17.0% 16.7%16.4% 16.1%
15%15%16%16%17%17%18%18%19%19%20%
2020
a
2021
e
2022
e
2023
e
2024
e
2025
e
*Estimates are based on future pricesSource: FAO prices, barchart - futures/quotes
Source: Company data, Beltone estimates

38
SADAFCO 1 December 2020
Product diversification key to sustainable growth
SADAFCO expanded its non-drink product portfolio (currently generating 35% of top line), which includes ice cream and foodstuffs (tomato paste, cheese, and snacks), through constant product differentiation over the last 30 years to meet ever-changing consumer demand and maintain its leading market positions amid growing competition and market fragmentation. However, long-life milk has remained SADAFCO’s primary product, comprising a range of SKUs that include whole milk, skimmed milk, enriched milk, and flavored milk, generating close to 65% of net sales over the last 3 years, down from 68% in March 2015. The COVID-19 outbreak coupled with Ramadan stocking has fueled the overstocking appetite for long-life milk for its long validity, driving contribution to revenue to reach 66.7% in the quarter ending in June. In a step to enter the meat market, the company was planning to purchase a controlling stake in livestock and meat importer Horizon Food Factory Company from Tabuk Agricultural Development Company by capitalizing on the company’s frozen storage space. However, the 3-month term of the non-binding MOU has terminated with no final agreement reached.
Expanding high-margin ice cream segment
SADAFCO leads the market in the ice cream business through its continuous efforts of adding new freezers in both existing and new outlets, supported by expansion at outdoor public events. The company is currently adding a new ice cream plant (at a CAPEX of SAR105mn) scheduled to commence operations in 2021 to cater to the growing Ice cream market and to expand SADAFCO’s market share. During the pandemic, ice cream products witnessed only 2% y-o-y revenue growth due to significant reduction in consumption and the closure of restaurants and juice shops (main customers). Ice cream revenue contribution grew to 19.9% in 2Q20 from 10% in March 2015.
Figure 5: SADAFCO’s leadership maintained
in long-life milk
Figure 6: Growing share of SADAFCO in the
tomato paste market
Figure 7: SADAFCO leads the Saudi ice
cream market
SADAFCO63%
Almarai15%
NADEC7%
Rainbow6%
Others9%
44% 46% 49%45% 48%
54%
0%
10%
20%
30%
40%
50%
60%
Mar
-15a
Mar
-16a
Mar
-17a
Mar
-18a
Mar
-19a
Mar
-20a
SADAFCO, 25.4%
Al Amal, 15.8%
Kwality, 10.8%Igloo, 9.0%
Baskin Robbins,
6.4%
London Dairy, 5.5%
Fadeco, 4.3%
Others, 22.8%
Source: SADAFCO investor presentation, June 2020
Source: SADAFCO investor presentation, June 2020
Source: SADAFCO investor presentation, June 2020

39
SADAFCO 1 December 2020
Figure 8: Revenue to grow at 2020–25e
CAGR of 7%
Figure 9: Long-life milk to remain main
revenue contributor; other business lines to
see moderate growth
Figure 10: Main reliance on Saudi market
1.4 1.4 1.5 1.6 1.8 1.90.2 0.2 0.3 0.3 0.3 0.30.3 0.3 0.3 0.4 0.4 0.4
2.18 2.29 2.46 2.65 2.86 3.05
0.00
1.00
2.00
3.00
4.00
-0.5
0.5
1.5
2.5
3.5
Mar
-20a
Mar
-21e
Mar
-22e
Mar
-23e
Mar
-24e
Mar
-25e
Thou
sand
s
SAR bn
Milk Tomato paste Ice creamPowdered milk Cheese OthersTotal
64% 63% 62% 62% 61% 61%
10% 10% 10% 10% 10% 10%13% 13% 13% 14% 14% 15%
0%
20%
40%
60%
80%
100%
Mar
-20a
Mar
-21e
Mar
-22e
Mar
-23e
Mar
-24e
Mar
-25e
Milk Tomato paste Ice creamPowdered milk Cheese Others
KSA, 94%Bahrain, 2%
Jordan, 1%
Kuwait, 1%Others, 1%
Source: Company data, Beltone estimates Source: Company data, Beltone estimates Source: Sadafco investor presentation
Figure 11: Dairy segment to maintain
growth despite short-term sluggish
performance on expected price discounts
Figure 12: Tomato paste to continue to
grow at high single digits
Figure 13: Ice cream to grow further on
new plant
1.3
1.4
1.4
1.5
1.6
1.8
13%
5%4%
6% 7% 7%
0%2%4%6%8%10%12%14%16%
0.00.20.40.60.81.01.21.41.61.8
Mar
-20a
Mar
-21e
Mar
-22e
Mar
-23e
Mar
-24e
Mar
-25e
SAR bn
Dairy milk y-o-y growth
184
212
235
256
277
299
6%
15%
11%9% 8% 8%
0%2%4%6%8%10%12%14%16%
0
100
200
300
400
500
Mar
-20a
Mar
-21e
Mar
-22e
Mar
-23e
Mar
-24e
Mar
-25e
SAR mn
Tomato paste y-o-y growth26
7
278
298
331
368
405
15%
4%
7%
11% 11%10%
0%2%4%6%8%10%12%14%16%
0
100
200
300
400
500
Mar
-20a
Mar
-21e
Mar
-22e
Mar
-23e
Mar
-24e
Mar
-25e
SAR mn
Ice cream y-o-y growth
Source: Company data, Beltone estimates Source: Company data, Beltone estimates Source: Company data, Beltone estimates
Figure 14: GPM to decline on higher SMP
prices amid fresh milk supply glut
Figure 15: EBITDA margin to also slightly
decline on nearly stable SG&A/sales
Figure 16: Stable asset conversion cycle
(Days)
38% 38%
36% 36%36% 35%
33%
34%
35%
36%
37%
38%
39%
0
200
400
600
800
1,000
1,200
Mar
-20a
Mar
-21e
Mar
-22e
Mar
-23e
Mar
-24e
Mar
-25e
SARmn
Gross profit GPM
388
401
389
411
435
461
18.9%18.4%
17.0% 16.7%16.4% 16.1%
15%15%16%16%17%17%18%18%19%19%20%
0100200300400500600700800
Mar
-20a
Mar
-21e
Mar
-22e
Mar
-23e
Mar
-24e
Mar
-25e
SAR mn
EBITDA EBITDA margin
45 45 45 45 45
107 111 111 110 109
10 10 10 10 9
(66) (66) (66) (66) (66)
(73) (73) (73) (73) (73)
(200) (150) (100) (50) - 50
100 150 200
Mar-20a Mar-21e Mar-22e Mar-23e Mar-24e
A/R DOH Inventory DOH Adv. paymentA/P DOH A/E DOH
Source: Company data, Beltone estimates Source: Company data, Beltone estimates Source: Company data, Beltone estimates

Food Producer | Savola Group
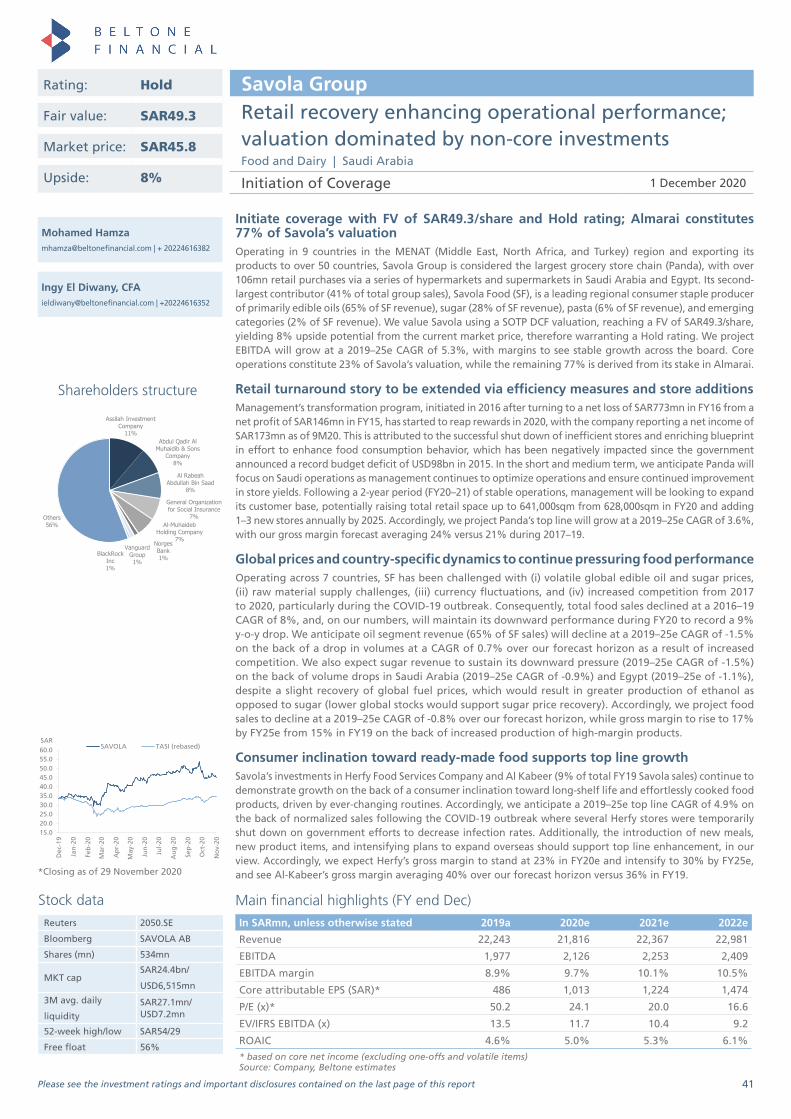
41
Rating: Hold
Fair value: SAR49.3
Market price: SAR45.8
Upside: 8%
*Closing as of 29 November 2020
Initiate coverage with FV of SAR49.3/share and Hold rating; Almarai constitutes 77% of Savola’s valuation Operating in 9 countries in the MENAT (Middle East, North Africa, and Turkey) region and exporting its products to over 50 countries, Savola Group is considered the largest grocery store chain (Panda), with over 106mn retail purchases via a series of hypermarkets and supermarkets in Saudi Arabia and Egypt. Its second-largest contributor (41% of total group sales), Savola Food (SF), is a leading regional consumer staple producer of primarily edible oils (65% of SF revenue), sugar (28% of SF revenue), pasta (6% of SF revenue), and emerging categories (2% of SF revenue). We value Savola using a SOTP DCF valuation, reaching a FV of SAR49.3/share, yielding 8% upside potential from the current market price, therefore warranting a Hold rating. We project EBITDA will grow at a 2019–25e CAGR of 5.3%, with margins to see stable growth across the board. Core operations constitute 23% of Savola’s valuation, while the remaining 77% is derived from its stake in Almarai.
Retail turnaround story to be extended via efficiency measures and store additionsManagement’s transformation program, initiated in 2016 after turning to a net loss of SAR773mn in FY16 from a net profit of SAR146mn in FY15, has started to reap rewards in 2020, with the company reporting a net income of SAR173mn as of 9M20. This is attributed to the successful shut down of inefficient stores and enriching blueprint in effort to enhance food consumption behavior, which has been negatively impacted since the government announced a record budget deficit of USD98bn in 2015. In the short and medium term, we anticipate Panda will focus on Saudi operations as management continues to optimize operations and ensure continued improvement in store yields. Following a 2-year period (FY20–21) of stable operations, management will be looking to expand its customer base, potentially raising total retail space up to 641,000sqm from 628,000sqm in FY20 and adding 1–3 new stores annually by 2025. Accordingly, we project Panda’s top line will grow at a 2019–25e CAGR of 3.6%, with our gross margin forecast averaging 24% versus 21% during 2017–19.
Global prices and country-specific dynamics to continue pressuring food performanceOperating across 7 countries, SF has been challenged with (i) volatile global edible oil and sugar prices, (ii) raw material supply challenges, (iii) currency fluctuations, and (iv) increased competition from 2017 to 2020, particularly during the COVID-19 outbreak. Consequently, total food sales declined at a 2016–19 CAGR of 8%, and, on our numbers, will maintain its downward performance during FY20 to record a 9% y-o-y drop. We anticipate oil segment revenue (65% of SF sales) will decline at a 2019–25e CAGR of -1.5% on the back of a drop in volumes at a CAGR of 0.7% over our forecast horizon as a result of increased competition. We also expect sugar revenue to sustain its downward pressure (2019–25e CAGR of -1.5%) on the back of volume drops in Saudi Arabia (2019–25e CAGR of -0.9%) and Egypt (2019–25e of -1.1%), despite a slight recovery of global fuel prices, which would result in greater production of ethanol as opposed to sugar (lower global stocks would support sugar price recovery). Accordingly, we project food sales to decline at a 2019–25e CAGR of -0.8% over our forecast horizon, while gross margin to rise to 17% by FY25e from 15% in FY19 on the back of increased production of high-margin products.
Consumer inclination toward ready-made food supports top line growth Savola’s investments in Herfy Food Services Company and Al Kabeer (9% of total FY19 Savola sales) continue to demonstrate growth on the back of a consumer inclination toward long-shelf life and effortlessly cooked food products, driven by ever-changing routines. Accordingly, we anticipate a 2019–25e top line CAGR of 4.9% on the back of normalized sales following the COVID-19 outbreak where several Herfy stores were temporarily shut down on government efforts to decrease infection rates. Additionally, the introduction of new meals, new product items, and intensifying plans to expand overseas should support top line enhancement, in our view. Accordingly, we expect Herfy’s gross margin to stand at 23% in FY20e and intensify to 30% by FY25e, and see Al-Kabeer’s gross margin averaging 40% over our forecast horizon versus 36% in FY19.
Savola GroupRetail recovery enhancing operational performance; valuation dominated by non-core investmentsFood and Dairy | Saudi Arabia
Initiation of Coverage 1 December 2020
Main financial highlights (FY end Dec)In SARmn, unless otherwise stated 2019a 2020e 2021e 2022e
Revenue 22,243 21,816 22,367 22,981
EBITDA 1,977 2,126 2,253 2,409
EBITDA margin 8.9% 9.7% 10.1% 10.5%
Core attributable EPS (SAR)* 486 1,013 1,224 1,474
P/E (x)* 50.2 24.1 20.0 16.6
EV/IFRS EBITDA (x) 13.5 11.7 10.4 9.2
ROAIC 4.6% 5.0% 5.3% 6.1%* based on core net income (excluding one-offs and volatile items)Source: Company, Beltone estimates
Stock dataReuters 2050.SE
Bloomberg SAVOLA AB
Shares (mn) 534mn
MKT capSAR24.4bn/
USD6,515mn
3M avg. daily
liquidity
SAR27.1mn/USD7.2mn
52-week high/low SAR54/29
Free float 56%
Please see the investment ratings and important disclosures contained on the last page of this report
Shareholders structure
Assilah Investment Company
11%Abdul Qadir Al
Muhaidib & Sons Company
8%
Al Rabeah Abdullah Bin Saad
8%
General Organization for Social Insurance
7%Al-Muhaideb
Holding Company7%
Vanguard Group1%
BlackRock Inc1%
Norges Bank1%
Others56%
15.020.025.030.035.040.045.050.055.060.0
Dec
-19
Jan
-20
Feb
-20
Mar
-20
Ap
r-20
May
-20
Jun
-20
Jul-
20
Au
g-2
0
Sep
-20
Oct
-20
No
v-20
SARSAVOLA TASI (rebased)
Ingy El Diwany, CFA [email protected] | +20224616352
Mohamed [email protected] | + 20224616382

42
Savola Group 1 December 2020
Investment summary
Established in 1979, Savola Group started its edible oil refinery operations (27% of total FY19 revenue) in Jeddah and later branched out into new business line segments to introduce Saudi Arabia’s first sugar refinery company operations (11% of total FY19 revenue) following its IPO in 1992, as well as operating 2 sugar refinery facilities in Egypt. Savola has continued to expand further via a chain of organic and inorganic developments to become a market leader in the food retail business (52% of total FY19 revenue) resulting from the merger with Azizia Panda in 1998. Currently, Panda operates over 201 stores in Saudi Arabia and holds a market share of 19.8% of total modern grocery retailing. Looking to further develop its operations base, Savola delved into the Egyptian retail market with over 4 stores. In addition to being a commercial corporation, Savola is an investment holding company that focuses on investing in regional F&B conglomerates such as the UAE’s Al Kabeer, a regional leader in frozen foods manufacturing and distribution, Saudi Arabia’s largest fast-food chain, Herfy Food Services Company, and Almarai Company, the leading dairy producer in the MENA region. We expect the company’s core earnings to grow at a 2019–25e CAGR of 28%, on account of growing net investment from its associate, Almarai (+10.5% CAGR), retail (+3.6% CAGR), and food services sales (+4.9% CAGR) over our forecast horizon. Conversely, we expect the food segment will be pressured (2019–25e CAGR of -0.8%). Over 77% of Savola’s valuation is derived from its 34.5% stake in Almarai, while the remaining 23% is extracted from its core operations.
Valuation methodology and risks
We have a Hold rating on Savola Group with a FV estimate of SAR49.3/share using a SOTP methodology with a 6-year DCF, discounted at a WACC of 8.3% (derived from a weighted average cost of equity of Saudi Arabia, Egypt, and Iran), and a terminal growth rate of 2% for each business segment. Key downside risks to our forecasts include (i) global oil and sugar prices maintaining their current low-levels, effectively increasing competition with Savola, (ii) currency devaluation and hyperinflation harmfully distressing purchasing power, and (iii) slow recovery in Saudi Arabia’s economy.
42
Financial statement | FY end Dec (SARmn)
Income statement 2019a 2020e 2021e 2022e
Revenue 22,243 21,816 22,367 22,981
COGS (17,706) (17,179) (17,506) (17,863)
Gross profit 4,538 4,637 4,861 5,117
SG&A expenses (3,762) (3,626) (3,700) (3,786)
EBIT 776 1,010 1,161 1,331
Depreciation and amortization 1,201 1,116 1,093 1,078
EBITDA 1,977 2,126 2,253 2,409
Net financing costs (687) (490) (421) (388)
Share in associates net income 639 723 752 854
Other income/costs 32 16 (28) (29)
EBT 761 1,260 1,463 1,769
Income taxes (104) (118) (137) (165)
NPAT 657 1,142 1,326 1,604
Appropriations 181 112 131 158
Attributable net income 476 1,030 1,196 1,446
Core attributable net income* 486 1,013 1,224 1,474
Balance sheet 2019a 2020e 2021e 2022e
Cash and equivalents 941 966 784 705
Inventory 2,752 2,378 2,898 2,486
Receivables 1,191 1,081 1,248 1,144
Prepayments and other receivables 1,060 1,327 1,125 1,394
Other assets 27 27 27 27
Total current assets 5,970 5,778 6,081 5,756
Total non current assets 20,688 20,379 20,134 20,042
Total assets 26,658 26,156 26,214 25,798
Bank short-term borrowings 2,899 2,844 2,916 2,996
CPLTD 740 600 500 600
CPLTD of lease liability 677 639 639 639
Account payables 2,305 2,308 2,393 2,110
Creditors and other credit balances 2,243 2,147 2,265 1,944
Total current liabilities 8,864 8,538 8,713 8,288
Long-term debt 3,905 3,505 3,005 2,405
Long-term lease liability 3,956 3,316 2,697 2,092
Other non-current liabilities 1,394 1,394 1,394 1,394
Total non-current liabilities 9,255 8,215 7,096 5,891
Paid-in capital 5,340 5,340 5,340 5,340
Share premium 343 343 343 343
Reserves (194) (194) (194) (194)
Effect of acquisition transactions
with non-controlling interest (188) (188) (188) (188)
Non-controlling interest 949 1,061 1,192 1,350
Retained Earnings 2,289 3,040 3,912 4,967
Total equity 8,539 9,403 10,406 11,618
Total liabilities and equity 26,658 26,156 26,214 25,798
Cash flow 2019a 2020e 2021e 2022e
Change in working capital (154) 125 (282) (358)
Cash flow from operations (CFO) 983 1,660 1,385 1,469
CAPEX (373) (377) (403) (437)
Cash flow from investing (CFI) (373) (84) (77) (98)
Cash flow from financing (CFF) (1,311) (1,551) (1,490) (1,449)
Change in cash (702) 25 (182) (78)
Main ratios 2019a 2020e 2021e 2022e Per-share data
EPS (SAR)* 0.9 1.9 2.2 2.7 BVPS (SAR) 16.0 17.6 19.5 21.8 DPS (SAR) 0.3 0.5 0.6 0.7 Valuation data
P/E (x)* 50.2 24.1 20.0 16.6 P/BV (x) 2.9 2.6 2.3 2.1 Dividend yield 0.7% 1.1% 1.3% 1.6%FCF yield 6.4% 7.3% 5.8% 5.9%EV/ IFRS EBITDA (x) 13.5 11.7 10.4 9.2 Growth (y-o-y)
Revenue 2.0% -1.9% 2.5% 2.7%EBITDA 197.6% 7.5% 6.0% 6.9%EBIT -892.6% 30.2% 14.9% 14.7%Attributable net income -191.4% 116.4% 16.1% 20.9%Core attributable net income* -491.9% 108.4% 20.8% 20.5%Profitability
Gross profit margin (GPM) 20.4% 21.3% 21.7% 22.3%EBITDA margin 8.9% 9.7% 10.1% 10.5%EBIT margin 3.5% 4.6% 5.2% 5.8%Core net profit margin (NPM)* 2.2% 4.6% 5.5% 6.4%ROAA* 2.0% 3.8% 4.7% 5.7%ROAE* 5.9% 11.3% 12.4% 13.4%ROAIC* 4.6% 5.0% 5.3% 6.1%Leverage
Net debt (cash)/equity (x) 1.3 1.1 0.9 0.7 Net debt (cash)/IFRS EBITDA (x) 5.7 4.7 4.0 3.3 * based on core net attributable income (excluding one-offs)Source: Company, Beltone estimates

43
Savola Group 1 December 2020
I. Valuation
We have a Hold recommendation on Savola with a FV of SAR49.30/share, implying 8% upside potential. We reach this value using a SOTP valuation methodology, where each of the retail, oil, sugar, pasta, and investment segments are valued separately using a DCF model. We utilize a WACC of 8.3% and a weighted average cost of equity of 13% derived from Saudi Arabia, Egypt, and Iran (representing the majority of Savola’s operations). For Saudi Arabia (weight of 76%), the cost of equity of 7.9% is derived from (i) a risk-free rate of 2.3%, (ii) equity market risk premium (ERP) of 6.2%, and (iii) a beta of 0.9. For Egypt (weight of 20%), our cost of equity of 17% is derived from (i) a risk-free rate of 11%, (ii) equity market risk premium (ERP) of 8%, and (iii) a beta of 0.8. For Iran (weight of 4%), our cost of equity of 35% is derived from (i) a risk-free rate of 13%, (ii) equity market risk premium (ERP) of 22%, and (iii) a beta of 1.0. Our WACC calculations are based on a 46% weight of equity and 54% weight of debt. We also use a terminal growth rate of 2%.
Figure 1: Summary of DCF valuation (SARmn)
2020e 2021e 2022e 2023e 2024e 2025e
EBIT 1,010 1,161 1,331 1,419 1,491 1,633
Zakat paid (118) (137) (165) (190) (213) (237)
NOPAT 893 1,024 1,166 1,229 1,278 1,396
Depreciation and amortization 1,116 1,093 1,078 1,068 1,064 1,064
Adjusted COPAT 2,008 2,117 2,244 2,297 2,342 2,460
∆ in net working capital 125 (282) (358) 204 (784) (568)
Operating cash flow (OpCF) 2,133 1,834 1,886 2,501 1,558 1,891
Capex (377) (403) (437) (473) (487) (501)
Increase in right-of-use assets - (19) (34) (30) (41) (37)
Free cash flow to firm (FCFF) 1,756 1,413 1,415 1,998 1,031 1,354
Terminal Value 16,007
PV of FCFF 1,743 1,290 1,178 1,503 694 810
Sum of PV of FCFF 7,218
PV of terminal value 9,572
Enterprise value (EV) 16,791
Net cash (debt) (as of 30 Sep 2020) (10,634)
Investment (as of 30 Sep 2020) 21,082
Minority interest (as of 30 Sep 2020) 939
Equity value 26,300
FV/share, SAR 49.30
Upside potential 8%
Source: Beltone estimates
Figure 2: Sensitivity to changes in terminal growth and WACC
Term
inal
gro
wth
rat
e
Terminal WACC
9.6% 10.1% 10.6% 11.1% 11.6%
1.0% 49.9 48.5 47.2 46.1 45.1
1.5% 51.2 49.6 48.2 46.9 45.8
2.0% 52.6 50.8 49.3 47.9 46.7
2.5% 54.2 52.2 50.4 48.9 47.6
3.0% 56.0 53.7 51.8 50.1 48.6
Source: Beltone estimates

44
Savola Group 1 December 2020
Figure 3: Summary of Savola Group’s SOTP
valuation
Figure 4: Summary of DCF valuation by segment
SARmnDCF equity
valueValue/share
% of value
Almarai stake 20,120 37.72 77%
Retail 1,924 3.55 7%
Herfy 3,391 6.33 13%
Oil 3,023 5.63 11%
Frozen food 1,952 3.65 7%
Sugar 976 1.82 4%
Pasta 193 0.36 1%
Emerging categories 44 0.08 0%
Holding co. debt + sukuk (5,284) -9.89 -20%
Total valuation 26,300 49.3
Source: Beltone estimates Source: Beltone estimates
Upside risks
• Placed as a market leader in several markets in which it operates, Savola has an opportunity to boost top line by extending its customer base to under served economies or growing its product variation. Additionally, Savola could delve into interrelated categories, including condiments and ready-to-eat segments.
• Potential acquisition of competitors in the retail business would further elevate margins on the back of higher market share.
• Further improvement in relation to retail streamlining would support the turnaround recorded y-t-d, allowing management to proceed with possible expansions in terms of number of stores.
• Removal of price controls in Egypt and Iran to alleviate pressure on sugar and oil margins, respectively.
• US President-elect Joe Biden could potentially lift sanctions on Iran, boosting the country’s economy.
Downside risks
• Sluggish sales improvement on the back of resilient competition from local and multinational companies, limiting Savola’s potential to increase its market share.
• Escalating global inflation rates harmfully distressing purchasing power, with some countries such as Egypt implementing price ceilings for sugar products to alleviate pressure off consumers.
• Operating in politically unstable countries such as Turkey, Iran, and Sudan could potentially put downward pressure on margins.

45
Savola Group 1 December 2020
Figure 5: Savola operates in over 7 countries in retailing, food production, and food services
Iran
Sudan
Morocco
Turkey
AlgeriaEgypt
KSA
Source: Company data
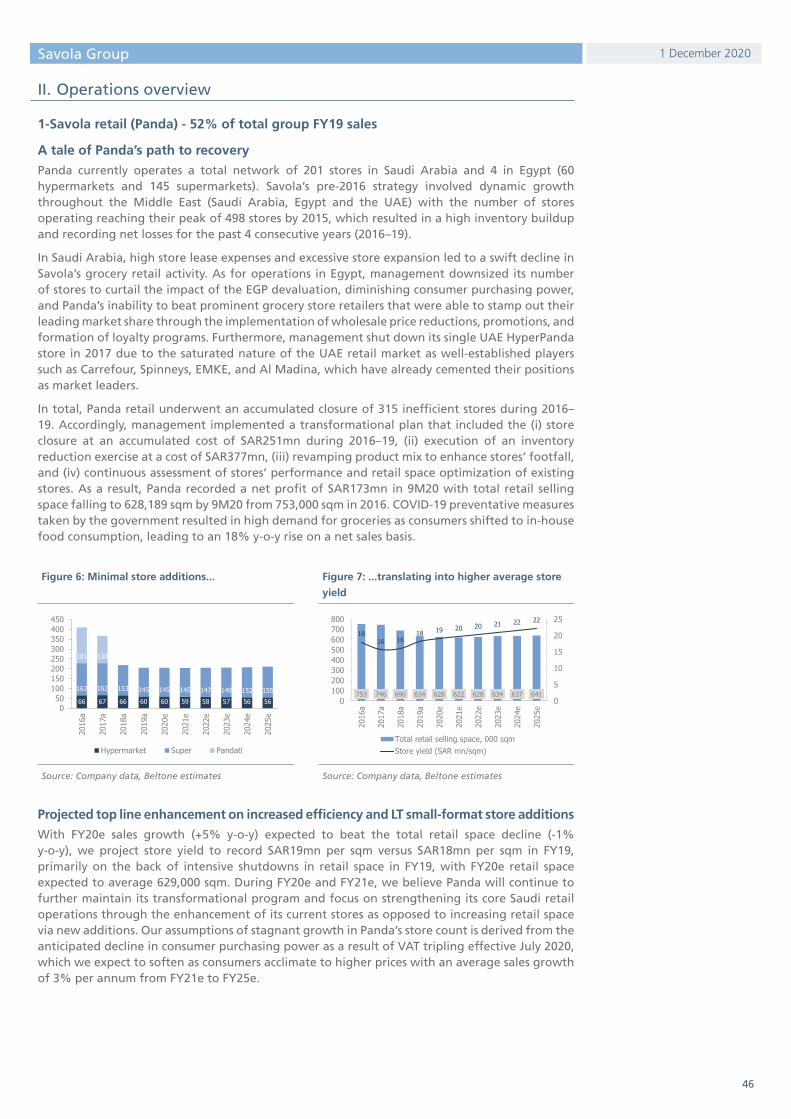
46
Savola Group 1 December 2020
II. Operations overview
1-Savola retail (Panda) - 52% of total group FY19 sales
A tale of Panda’s path to recovery
Panda currently operates a total network of 201 stores in Saudi Arabia and 4 in Egypt (60 hypermarkets and 145 supermarkets). Savola’s pre-2016 strategy involved dynamic growth throughout the Middle East (Saudi Arabia, Egypt and the UAE) with the number of stores operating reaching their peak of 498 stores by 2015, which resulted in a high inventory buildup and recording net losses for the past 4 consecutive years (2016–19).
In Saudi Arabia, high store lease expenses and excessive store expansion led to a swift decline in Savola’s grocery retail activity. As for operations in Egypt, management downsized its number of stores to curtail the impact of the EGP devaluation, diminishing consumer purchasing power, and Panda’s inability to beat prominent grocery store retailers that were able to stamp out their leading market share through the implementation of wholesale price reductions, promotions, and formation of loyalty programs. Furthermore, management shut down its single UAE HyperPanda store in 2017 due to the saturated nature of the UAE retail market as well-established players such as Carrefour, Spinneys, EMKE, and Al Madina, which have already cemented their positions as market leaders.
In total, Panda retail underwent an accumulated closure of 315 inefficient stores during 2016–19. Accordingly, management implemented a transformational plan that included the (i) store closure at an accumulated cost of SAR251mn during 2016–19, (ii) execution of an inventory reduction exercise at a cost of SAR377mn, (iii) revamping product mix to enhance stores’ footfall, and (iv) continuous assessment of stores’ performance and retail space optimization of existing stores. As a result, Panda recorded a net profit of SAR173mn in 9M20 with total retail selling space falling to 628,189 sqm by 9M20 from 753,000 sqm in 2016. COVID-19 preventative measures taken by the government resulted in high demand for groceries as consumers shifted to in-house food consumption, leading to an 18% y-o-y rise on a net sales basis.
Figure 6: Minimal store additions... Figure 7: ...translating into higher average store
yield
66 67 66 60 60 59 58 57 56 56
163 162 153 145 145 145 147 149 152 155
181 138 0
050
100150200250300350400450
2016
a
2017
a
2018
a
2019
a
2020
e
2021
e
2022
e
2023
e
2024
e
2025
e
Hypermarket Super Pandati
753 746 690 634 628 622 628 634 637 641
1816 16
18 19 20 20 21 22 22
0
5
10
15
20
25
0100200300400500600700800
2016
a
2017
a
2018
a
2019
a
2020
e
2021
e
2022
e
2023
e
2024
e
2025
e
Total retail selling space, 000 sqmStore yield (SAR mn/sqm)
Source: Company data, Beltone estimates Source: Company data, Beltone estimates
Projected top line enhancement on increased efficiency and LT small-format store additions
With FY20e sales growth (+5% y-o-y) expected to beat the total retail space decline (-1% y-o-y), we project store yield to record SAR19mn per sqm versus SAR18mn per sqm in FY19, primarily on the back of intensive shutdowns in retail space in FY19, with FY20e retail space expected to average 629,000 sqm. During FY20e and FY21e, we believe Panda will continue to further maintain its transformational program and focus on strengthening its core Saudi retail operations through the enhancement of its current stores as opposed to increasing retail space via new additions. Our assumptions of stagnant growth in Panda’s store count is derived from the anticipated decline in consumer purchasing power as a result of VAT tripling effective July 2020, which we expect to soften as consumers acclimate to higher prices with an average sales growth of 3% per annum from FY21e to FY25e.

47
Savola Group 1 December 2020
Going forward, with sustained levels of top line performance on the back of private consumption revival (+0.4% in 1Q21e and +0.8% in 2Q21e versus -2.4% in 4Q20e), we believe management could reconsider increasing its number of stores to 211 by FY25e and record a store yield of SAR22mn per sqm. However, we project Panda’s store yield to expand at a slower rate (+3% during FY22–24e versus +6% during FY20–21e) as management announces new store openings and increases total retail space to 641,000 sqm by FY25e. In view of that, we estimate Panda’s top line will grow at a 2019–25e CAGR of 3.6% versus -1.2% during 2014–19. Accordingly, we expect Panda’s sales CAGR growth to be in line with modern retailers’ sales 2019-25e CAGR of 5.5% on the back of Panda’s major turnaround since 2020 and coming off a low base in 2019.
Figure 8: Transformational plan in motion... Figure 9: ...focusing on the Saudi retail market
with 99% of retail sales
32
5156 59 60 62 64 66 67
-4%
60%
11%5% 2% 4% 4% 3% 2%
-10%0%10%20%30%40%50%60%70%
01020304050607080
2017
a
2018
a
2019
a
2020
e
2021
e
2022
e
2023
e
2024
e
2025
e
Sales per store (SAR mn) y-o-y Saudia Arabia99%
Egypt1%
Source: Company data, Beltone estimates Source: Company data
Figure 10: Improved retail revenue... Figure 11: ...on the back of increased stores
efficiencies
-14%
-5%
3% 5%2%
4% 4% 4% 4%
-20%
-15%
-10%
-5%
0%
5%
10%
02,0004,0006,0008,000
10,00012,00014,00016,000
2017
a
2018
a
2019
a
2020
e
2021
e
2022
e
2023
e
2024
e
2025
e
Total retail revenue (SAR,mn) y-o-y
20% 21% 22% 23% 23% 24% 24% 24% 24%
0%
5%
10%
15%
20%
25%
30%
0500
1,0001,5002,0002,5003,0003,5004,000
2017
a
2018
a
2019
a
2020
e
2021
e
2022
e
2023
e
2024
e
2025
e
Total retail GP (SAR mn) Total retail GPM (%)
Source: Company data, Beltone estimates Source: Company data, Beltone estimates
Historically, major Saudi retailers have focused on expanding their customer base through the inauguration of hypermarkets as opposed to smaller-sized supermarkets given that families in the kingdom spend the majority of their social activities in mall settings on the limited avenues available at the time. However, with a significant shift to open new entertainment avenues such as cinemas, concerts, sporting events, and other leisure activities, we believe retailers, including Panda, will also shift to open supermarkets as opposed to hypermarkets. For that reason, our estimated accumulated 6 net store additions by FY25e for Panda will likely come in the format of form of supermarkets over our forecast horizon.
Saudi retail industry and market structure
The Saudi economy encountered hard-hitting challenges succeeding the drop in global oil prices, which led to unemployment escalation, subsidy lifts, and the introduction of VAT. These conditions have gradually diminished expenditure appetite and triggered a successive deceleration in consumer outlay, with the grocery retailing market shrinking SAR9bn (USD2.4bn) to SAR137bn (USD36.6bn) in 2019. Consequently, there has been an adjustment in consumer inclinations from premium to inexpensive merchandise, which has obligated retailers to overhaul offerings to accommodate market needs. That said, we still anticipate food demand to maintain its robustness and grow in light of growing population, sizable per capita income, escalating tourism, ever-changing consumer taste, and an overall economic recovery. Market leaders were in a better position to endure market repercussions, whereas smaller stores were forced to reconsider whether to continue operating or shut down and limit their losses. According to Euromonitor, overall grocery retailing market to recuperate at a 2019–24e CAGR of 5.5%.

48
Savola Group 1 December 2020
Figure 12: KSA grocery retailers sales value
(SARmn)
Figure 13: KSA modern retailers sales value
(SARmn)
59,566 56,429 56,50172,564
86,569 83,020 80,60478,628
020,00040,00060,00080,000
100,000120,000140,000160,000
2017a 2018a 2019a 2024e
Modern Traditional
CAGR -0.2%
CAGR +5.5% 16,681 16,180 16,218 19,886
35,257 33,257 33,69543,960
7,628 6,992 6,588
8,718
010,00020,00030,00040,00050,00060,00070,00080,000
2017a 2018a 2019a 2024e
Hypermarkets Supermarkets Others
CAGR +4.5%
CAGR +5.8%
Source: Euromonitor Source: Euromonitor
For modern retailers (41% of total 2019 retailers), supermarkets and hypermarkets constitute 88% and 79% of sales and floor space, respectively. These figures are largely credited to customers’ preferences toward larger venues for major grocery procurements and compact stores for daily grocery needs. Hypermarkets (30% of 2019 modern sales) are mostly found in larger shopping outlets, which offer visitors access to procuring food supplies as well as entertainment outlets that include shopping stores, indoor amusement parks, restaurants, and movie theaters, enriching customers’ overall retail experience. As for supermarkets (60% of 2019 modern sales), modern retailers target highly condensed districts to attract substantial footfall by exhibiting distinctive offerings such as private labels, imported products, fresh food, as well as extensive product availability. In contrast, the remaining 59% represents over 40,000 baqalas, which continue to dominate the market due to their expansive presence in neighborhoods. Despite increased competition from modern retailers, baqalas continue to be a conventional food retail avenue on account of their capacity to deliver greater degrees of accessibility and affordability especially in low-income districts. We believe traditional retail will remain pressured as the kingdom witnesses increased interest in developing urban centers as well as government formalities to regulate baqalas as mentioned earlier.
We anticipate consumers will favor modern grocery retailing formats as opposed to traditional baqalas, with the former’s share of total grocery retail sales projected to increase 6.8ppt in 2019–24e, amassing a total 48% share by 2024e. This is in line with previous developments over 2015–19, where modern grocery stores’ share of floor space and number of outlets grew 3ppts and 0.9ppts, respectively, and are estimated to grow at a FY20–24e CAGRs of 5.6% and 5.5%, respectively. Additionally, large outlets boast an advantage over smaller players as they are able to flourish with the assistance of increased operational efficiency, product differentiation, and enhanced outlet blueprints to enrich the consumer experience.
A fragmented grocery market with top 4 players control less than 50% of market share
The Saudi food retail market is highly fragmented (HHI index of 914), with conglomerates such as Panda, Abdullah Al-Othaim Marketing Co (Al Othaim), BinDawood, Saudi Hypermarket LLC, and Saudi Marketing Company constituting 45% of total Saudi grocery retail sales, while small-scale retailers dominate the market with a 55% market share. As of 2019, Panda continues to be the dominant and leading market player with 19.8% market share. Despite the vast closure of stores in previous years, Panda’s market share continued to display strong resistance, while other major retailers continued to enhance their market shares as baqalas and small-scaler retailers lose out. We believe Panda will continue to hold a large share of the fragmented market on the back of its dominance across all regions except for the Northern area, which it holds the second largest market share of 17.7% while Al Othaim leads with a market share of 18.1%.

49
Savola Group 1 December 2020
Figure 14: Despite coming in second in terms of
number of grocery stores...
Figure 15: ...Savola maintains its share in a highly
fragmented market
Panda20%
Al Othaim11%
BinDawood9%
Lulu3%Farm
3%
Others55%
Source: BinDawood Source: Company data, BinDawood
Online platform, Pandaclick, to capitalize on growing e-commerce
Deeply ingrained in technological advancement, we believe the largely youthful Saudi population is on track to a promising future in online grocery retailing as it is anticipated to experience a 104% increase by 2024e, and is already somewhat prevalent in Saudi Arabia’s 3 largest cities. Despite comprising 3% of 2019 Saudi retail sales, major grocery outlets have begun competing to dominate this segment. As this newfound segment is projected to amass SAR623mn (USD166mn) in sales by 2024e, more local players will be looking to integrate it into their current business model in effort to strengthen market share and enrich customer experience. Launched in March 2020 following the COVID-19 outbreak, Panda launched Pandaclick, an e-commerce application that allows consumers to order their grocery necessities and have them delivered to their premises via an agreement with third-party delivery partners. We believe Pandaclick will capitalize on the growing online grocery activities in the market as over 65% of Saudi inhabitants reside in major urban cities such as Riyadh, Jeddah and Dammam, resulting in prolonged commutes to congested shopping centers. As of 1H20, Panda’s online sales constituted less than 3% of total sales, with management insisting that it could take up to 2–3 years to record significant contribution to total sales. This is likely on the back of continuous efforts to enhance the customer experience via increasing number of deliveries and reducing delay time, putting into consideration that the application was launched in direct response to COVID-19 and is anticipated to be enhanced further. Additionally, Panda is catching up with established food ordering companies such as Talabat and other retail outlets such as BinDawood, Carrefour, and Lulu.
In previous decades, baqalas have been the main hub for delivering groceries to family homes. However e-commerce has recently been overturning worldwide retail businesses as consumers shift to online purchasing, resulting in offline retail profitability taking a knock. Considering the regions’ low e-commerce penetration rate compared to other regions, the region’s 2018–23e food demand CAGR of 5.6% exceeding the 2.3% annual growth in GCC population illustrates the sector’s potential and expansion opportunities. Global economies have witnessed online retail penetration levels surge to encounter consumers’ ever-changing preferences and continue to be significant in dynamic markets such as Saudi Arabia.
2-Savola Foods - 41% of total FY19 group sales
With over 40 years as a major commodity player, Savola Foods (SF) is a market leader in the production of premium edible oils (65% of SF sales), sugar (28% of SF sales), pasta (6% of SF sales), and emerging categories (2% of SF sales) and exporting to over 50 countries. Lately, the company has been dealing with swift fluctuations in geopolitical dynamics, inflation, and consumer inclinations while engaging in price wars with second-tier products. As a result, FY19 total oil, sugar, and pasta volumes dropped 1.5% y-o-y to c3mn tons, mainly from lower oil volumes in Saudi Arabia, Iran, and Sudan as well as lower sugar volumes in Egypt. To offset lower volumes, SF has been fine-tuning its advertising and packaging in effort to accommodate altering appetite and maintain its strong market share, specifically in its oil segment. Additionally, management was able to introduce new varieties in its B2C and B2B streamline and add more value-added (higher margin) products. By 9M20, gross and net margin inched up 0.4ppts y-o-y driven by +1.3ppts y-o-y in oil gross margin, while pressured by -2.4ppt y-o-y in sugar gross margin.

50
Savola Group 1 December 2020
Going forward, we believe SF volumes will continue to be deterred (2019–25 CAGR of -0.8%), pressured by an oil volume CAGR of -0.7% and a sugar volume CAGR of -1.0%, despite both pasta and emerging categories recording a sales CAGR of 3.3% and 11.6%, respectively, from 2019–25e. Furthermore, we project oil will record a higher gross margin due to intense production of high-margin products offsetting a volume drop in mature markets (excluding Egypt), supported by volume increases in start-up markets. As for sugar, we expect gross margins will be pressured as we anticipate both the Saudi and Egyptian markets will decline in volumes. Accordingly, we project oil gross margin will stand at an average of 18% over our forecast horizon versus 15% in FY19, while sugar gross margin will average 12% versus 15% in FY19.
Figure 16: Food volumes to continue to be
pressured...
Figure 17: ...highly dependant on oil segment
revenue contribution
1.58 1.61 1.62 1.59 1.54 1.53 1.53 1.53 1.53 1.52
1.52 1.41 1.42 1.41 1.32 1.30 1.29 1.29 1.30 1.32
- 0.5 1.0 1.5 2.0 2.5 3.0 3.5
2016a 2017a 2018a 2019a 2020e 2021e 2022e 2023e 2024e 2025e
Oil volumes (tons mn) Sugar volumes (tons mn)
3.03 3.04 3.00 2.85 2.83 2.82 2.833.10
2.82 2.84
65%
28%
6% 2%
Oil Sugar Pasta Emerging categories
Source: Company data, Beltone estimates Source: Company data
Figure 18: Despite pressured food top line... Figure 19: ...high-margin edible oil prodcts to
support gross margin growth
-4%
-14%
-5%
-9%
1% 0% 1% 1% 1%
-16%-14%-12%-10%-8%-6%-4%-2%0%2%4%
02,0004,0006,0008,000
10,00012,000
2017
a
2018
a
2019
a
2020
e
2021
e
2022
e
2023
e
2024
e
2025
e
Food revenue (SAR mn) y-o-y
15%13% 15%
15% 15% 16% 16% 16% 17%
0%2%4%6%8%10%12%14%16%18%
0
500
1,000
1,500
2,000
2017
a
2018
a
2019
a
2020
e
2021
e
2022
e
2023
e
2024
e
2025
e
Gross profit (SAR mn) Food GPM (%)
Source: Company data, Beltone estimates Source: Company data, Beltone estimates
2.1- SF’s oil segment - (65% of total SF FY19 sales)
Operating across 7 countries with over 8 refining facilities, SF’s oil segment (SFO) operates a mixed-stream business where it does not own or cultivate crops but rather sources raw oil from several countries and transforms them to variant edible oils such as corn, sunflower, sesame, and olive. SFO operates in both mature markets (Saudi Arabia, Iran, Egypt, and Turkey) and start-up markets (Algeria, Morocco, and Sudan). Management’s target is to maintain strong market share in mature markets (standing at 79% as of total oil sales), while contending to gain higher market share in start-up markets, which constitutes 21% of total oil sales. Overall, with a capacity of 2mn tpa, the utilization rate reached 79%, with each facility established to cover local demand.

51
Savola Group 1 December 2020
Figure 20: Volume pressure across mature markets (excluding Egypt) on the back of increased competition
from second-tier producers, while start-up markets gain a lead in terms of market share
1.31 1.31 1.32 1.25 1.18 1.16 1.15 1.15 1.15 1.14
0.27 0.31 0.31 0.33 0.35 0.37 0.38 0.38 0.38 0.38
- 0.2 0.4 0.6 0.8 1.0 1.2 1.4 1.6 1.8
2016a 2017a 2018a 2019a 2020e 2021e 2022e 2023e 2024e 2025e
Oil mature markets volume sold (tons mn) Oil start-up markets volume sold (tons mn)
Source: Company data, Beltone estimates
Total volumes reached 1.59mn tons in FY19, down 2% y-o-y. However, management was successful in making up for lost volumes with increased production of high-margin products, which elevated annual gross, EBIT, and net margins by 2.4ppts, 1.6ppts, and 2.7ppts, respectively. 9M20 volumes continued to drop 0.4% y-o-y, driven by Turkey (-11% y-o-y), Iran (-8% y-o-y), Saudi Arabia (-8% y-o-y), and Algeria (-4% y-o-y). Additionally, Savola’s average oil price decreased in both mature and start-up markets, mainly driven by currency fluctuations and hyperinflation in Iran, Turkey, and Sudan. Management’s main challenge lies ahead in its mature market, specifically Saudi Arabia, Iran, and Turkey, which continue to confront price competition, supply shortages, and macro challenges, respectively. As for its start-up markets, we are optimistic on management’s strategy to continue to gain market share. Consequently, we estimate FY20e oil volumes will drop 3% y-o-y, recording a CAGR drop of 0.7% over our forecast horizon.
Figure 21: Mature markets continue to be
challenged...
Figure 22: ...while oil gross margin improves on
the back of increased high-margin production
18% 17%
13%
15%17% 17% 17% 18% 18% 19%
0%
5%
10%
15%
20%
0200400600800
1,0001,2001,4001,600
2016
a
2017
a
2018
a
2019
a
2020
e
2021
e
2022
e
2023
e
2024
e
2025
e
Oil gross profit (SAR mn) Oil GPM (%)
Source: Company data, Beltone estimates Source: Company data, Beltone estimates
Figure 23: FY19 volume and sales contribution by country
26% 26%
16%11% 11%
6% 4%
30%
19%16%
11% 13%6% 6%
0%
5%
10%
15%
20%
25%
30%
35%
Saudi Arabia Iran Egypt Algeria Turkey Morocco Sudan
Volume Sales
Source: Company data

52
Savola Group 1 December 2020
2.1.1-Mature markets (79% of total oil sales)
Mature markets continued to face downward pressure in 2019, with sales declining 13% y-o-y due to (i) lower global raw oil prices (-9% y-o-y) and (ii) a 5% y-o-y drop in volumes. Nevertheless, management maintained a leading market share in Saudi Arabia (30% of total FY19 oil sales), despite continued pressure from second-tier competitors (sales dropping 6% y-o-y), and Iran (19% of total FY19 oil sales) in the face of supply difficulties caused by geopolitical uncertainties (sales dropping 36% y-o-y). In Turkey (13% of total FY19 oil sales), higher volumes were attained, undeterred by unstable interest rates and currency variations (sales increasing 5% y-o-y), while Egypt (16% of total FY19 oil sales) demonstrated stagnant sales growth. 9M20 sales continued to be stressed, declining 12% y-o-y.
With the mature market projected to continue displaying market unpredictability in the coming years, we estimate sales to decline at a CAGR of 2.1% over our forecast horizon, curtailed by both volume and price pressures in Iran, Saudi Arabia, and Turkey whereas we expect Egypt to record the sole volume improvement. Conversely, we believe FY20–25e gross margins will average 20% versus 17% in FY19 on the back of resilient brand equity and portfolio expansion toward higher-margin B2B transactions.
• Saudi Arabia (38% of FY19 mature market sales)
Operations continued to witness increased competition from small-scale producers that mostly produce lower-branded products compared to Savola’s premium products. Consequently, management was unsuccessful in enhancing volumes during FY19 (-4% y-o-y), despite maintaining a leading market share of over 50% as opposed to over 60% in previous years. This was attributed to consumers shifting to lower-tier products instead of consuming premium products on the back diminishing purchasing power. In 9M20, volumes continued to record -8% y-o-y, attributed to lower B2B sales (represent 40% of total Saudi oil sales) following the COVID-19 outbreak and intensified competition. With curfews lifted, we believe B2B operations will normalize to pre-COVID levels.
Despite an anticipated improvement in global oil prices (2019–24e CAGR of 2.8%), we project Saudi Arabia revenue to decline at a CAGR of 1.6% over our forecast horizon as small-scale producers continue to erode Savola’s market share. For that reason, we anticipate intense promotions to continue to be in place, effectively putting downward pressure on margins. To ease off margin compression, management will continue producing higher-margin products to make up for the tripling of the VAT rate in July 2020 and lost volumes as expat numbers continue to dwindle in FY20e and FY21e.
Iran (24% of FY19 mature market sales)
FY19 volumes took a hit on the back of the Irani government’s tight control on raw oil imports, where it is currently the sole importer. Additionally, global palm oil prices witnessed intense downward pressure that resulted in global panic buying and local market shortages. In view of that, Savola’s supply is directly linked to Iran’s strategic reserves and its facilities are currently operating at 50%–60% utilization. Similar to Saudi Arabia, production of high margin products will continue to be a mainstay in Iranian operations to maintain profitability going forward, in our view. Management reported that it has also started to produce value-for-money priced products in 1H20, which has slightly lowered average selling prices.
We believe Iranian operations will continue to face volume (2019–25e CAGR of -3.3%) and price pressures as it enters a state of hyperinflation, despite an anticipated recovery in global palm oil prices. Accordingly, we expect volume levels to average 0.34mn tons over our forecast horizon (well off pre-2018 levels of 0.50mn tons).
Turkey and Egypt (38% of FY19 mature market sales)
In FY19, Turkish volumes shifted toward premium and perceived healthier products such as margarine, which is derived from vegetable oils as opposed to milk-based butter. The interest in this segment has been to shift to specialty goods for additional portfolio enhancement, supported by rising demand for healthier goods. That said, 9M20 oil sales declined sharply on the back of the TRY depreciating 20% y-t-d as well as lower B2B operations due to COVID-19. We anticipate FY20 volumes to continue to be pushed down, declining 11% y-o-y. We remain cautious on Turkish recovery as political unrest continues to flatten the economy, with an anticipated volume CAGR of -4.1% over our forecast horizon.

53
Savola Group 1 December 2020
Savola’s oil operations in Egypt recorded the highest annual improvement in 9M20, with sales surging 30% y-o-y. This was attributed to volume and average price enhancements of 17% y-o-y and 14% y-o-y, respectively. Accordingly, we anticipate sales to grow at a 2019–25e CAGR of 7.7%, mainly resulting from a volumes CAGR of 4.5%.
Figure 24: Low global prices impacting mature
market revenue growth during 2020–21...
Figure 25: ...while gross margin improves steadily
on global price recovery
-7%
-18% -13%-14%
1% 0% 0% 0%
-20%
-15%
-10%
-5%
0%
5%
01,0002,0003,0004,0005,0006,0007,000
2017
a
2018
a
2019
a
2020
e
2021
e
2022
e
2023
e
2025
e
Total oil mature revenue (SAR mn) y-o-y
18%
13% 17%
19% 19% 19% 20% 20%
0%
5%
10%
15%
20%
25%
0200400600800
1,0001,2001,400
2017
a
2018
a
2019
a
2020
e
2021
e
2022
e
2023
e
2025
e
Total oil mature GP (SAR mn) Total oil mature GPM (%)
Source: Company data, Beltone estimates Source: Company data, Beltone estimates
2.1.2- Start-up markets (21% of total oil sales)
Management was successful in enhancing start-up FY19 top line by 9% y-o-y on the back of a 7% y-o-y volume improvement, despite the Sudanese (18% of FY19 start-up market sales) markets facing macroeconomic distress, where volumes dropped 9% y-o-y. 9M20 volumes continued to demonstrate upward levels of +7% y-o-y, driven by +60% y-o-y in Sudan volumes (21% of 9M20 start-up volumes), +4% y-o-y in Morocco volumes (28% of 9M20 start-up volumes), while Algeria volumes (51% of 9M20 start-up volumes) recorded a 5% y-o-y decline.
We anticipate further growth in Sudan (2019–25e volumes CAGR of 6.5%), Morocco (2019–25e volumes CAGR of 2.9%), and Algeria (2019–25e volumes CAGR of 1%) as management continues to gain market share, leading to a 2019–25e total volumes CAGR of 2.6%. As a result, we project revenue will grow by a 6-year CAGR of 0.8% with gross margins averaging 11% versus 9% in FY19.
Figure 26: Modest market share gains in start-up
markets...
Figure 27: ...reinforces gross margin improvement
over our forecast horizon
16%
-8%
9%0%
3% 1% 0% 0%
-10%-5%0%5%10%15%20%
1,0501,1001,1501,2001,2501,3001,3501,400
2017
a
2018
a
2019
a
2020
e
2021
e
2022
e
2023
e
2025
e
Total oil start-up revenue (SAR mn) y-o-y
12%11%
9%10% 10% 10% 11% 11%
0%2%4%6%8%10%12%14%
020406080
100120140160180
2017
a
2018
a
2019
a
2020
e
2021
e
2022
e
2023
e
2025
e
Total oil start-up GP (SAR mn) Total oil start-up GPM (%)
Source: Company data, Beltone estimates Source: Company data, Beltone estimates
2.2- SF’s sugar segment - 28% of SF FY19 sales
Third in line in terms of top line contribution, SF’s sugar segment (SFS) constitutes 11% of consolidated revenue and operates in both Saudi Arabia (86% of SFS revenue) and Egypt (14% of SFS revenue). Savola inaugurated United Sugar Company (USC) in 1994 and recorded a production capacity of 2.2mn tons in FY19, making it one of the largest sugar refineries in the world with over 40 export markets. USC was the first sugar refining company to be established in Saudi Arabia, with 70% market share while the remaining market players import refined sugar. Some 2/3 of USC’s operations are attributed to consumers while the remainder is provided to conglomerate B2B partners such as PepsiCo, Al Rabie, Almarai (an associate company of Savola), Halwani Bros, and Ulker. Under USC’s portfolio, Al-Osra is a flagship premium product that is offered in different varieties, including white, brown, coarse, liquid, cube, and sachet sticks. With no cultivation of sugar cane, Saudi Arabia is entirely dependent on importing its raw sugar

54
Savola Group 1 December 2020
supplies, mainly from Brazil. Later in 2005, SFS extended its reach to the Egyptian market via its 33.8%-owned subsidiary, United Sugar Company of Egypt (USCE), begining commercial operation in 2008. Later in 2014, SFS announced a full-value chain sugar beet operation, Alexandria Sugar Company (ASC), with an agro-cultivation company associated as it cultivates its own sugar beets and operates its owned mills. According to management, all 3 facilities are running at almost full utilization with 1/3 of volumes directly sold to consumers, another to B2B, and the remainder earmarked for export markets.
Figure 28: With over 87% of sugar volumes
attributed to Saudi Arabia...
Figure 29: ...volumes are projected to maintain
their low levels on the back of increased
competition from second-tier producers
1.35
1.26
1.19 1.23
1.17
1.16
1.15
1.15 1.16 1.17
0.17
0.16 0.23
0.18
0.15
0.15
0.15
0.15
0.15 0.15
0.0
0.4
0.8
1.2
1.6
2016
a
2017
a
2018
a
2019
a
2020
e
2021
e
2022
e
2023
e
2024
e
2025
e
Sugar Egypt volume production (tons mn), 100% owned
Sugar KSA volume production (tons mn)
Source: Company data Source: Company data, Beltone estimates* United Sugar Company of Egypt (USCE) excluded
Sugar prices are considered highly volatile, and USC accordingly utilizes derivative financial instruments to hedge against major price fluctuations whether for raw sugar or white premium sugar for export markets. Sugar prices in Saudi Arabia are flexible, with no government intervention to regulate procurement prices. Meanwhile, Egypt’s regulated price scheme, which implements an import tax on imported sugar (international price + 25% tax + USD25/ton) in effort to protect local manufacturers. Due to the recent drop in global prices, sugar processors such as SFS have been effectively hit by higher competition from imported sugar and are therefore pressured into lowered margins. As seen in figure 37 below, imported retail prices dropped further in April 2020. Accordingly, the Egyptian government enforced an import ban on white and raw sugar in June 2020 to December 2020 in effort to protect local sugar prices from the major drop in global sugar prices since the COVID-19 outbreak. Global prices declined to SAR876/ton (USD234/ton) by 1H20 from SAR1,020/ton (USD272/ton) in FY19 due to lower demand levels and high sugar stocks from previous years.
Figure 30: Prices of Egyptian-produced sugar are higher than import prices, pressuring Savola’s market
share
Source: FAO
We attribute the loss in 9M20 volumes to lower B2B and exports in Saudi Arabia, as well as continued competition from lower imported prices (heavy competition from other crops) in Egypt. Accordingly, we anticipate FY20 SFS revenue will drop 9% y-o-y on the back of (i) a global sugar price decline and (ii) volume deterioration in both Saudi Arabia and Egypt. We project sugar volumes will decline further at a 2019–25e CAGR of -1.1%, attributed to a volume drop in Saudi Arabia (CAGR of -0.9%) and Egypt’s volume (CAGR of -1.1%). Despite the projected improvement in global sugar prices as a result of increased ethanol production following a recovery in global oil prices, we anticipate sugar prices will continue to demonstrate lower levels over our forecast
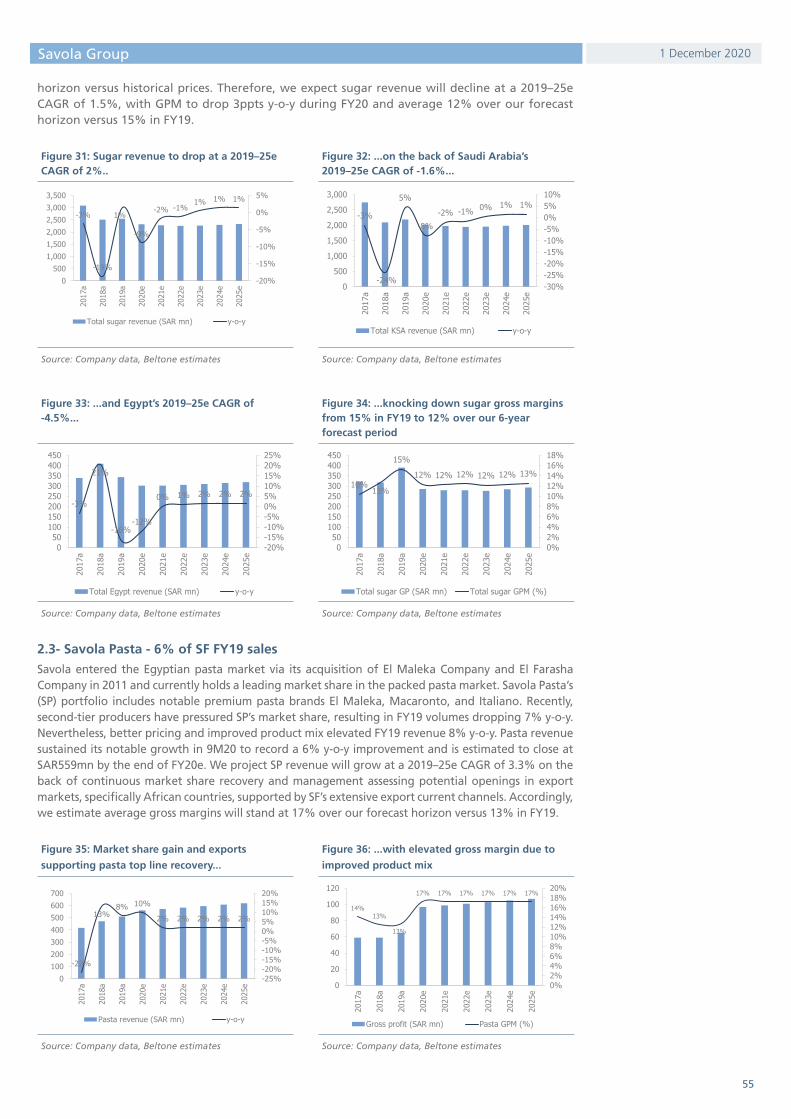
55
Savola Group 1 December 2020
horizon versus historical prices. Therefore, we expect sugar revenue will decline at a 2019–25e CAGR of 1.5%, with GPM to drop 3ppts y-o-y during FY20 and average 12% over our forecast horizon versus 15% in FY19.
Figure 31: Sugar revenue to drop at a 2019–25e CAGR of 2%..
Figure 32: ...on the back of Saudi Arabia’s 2019–25e CAGR of -1.6%...
-3%
-19%
1%
-9%
-2% -1%1% 1% 1%
-20%
-15%
-10%
-5%
0%
5%
0500
1,0001,5002,0002,5003,0003,500
2017
a
2018
a
2019
a
2020
e
2021
e
2022
e
2023
e
2024
e
2025
e
Total sugar revenue (SAR mn) y-o-y
-3%
-24%
5%
-8%-2% -1% 0% 1% 1%
-30%-25%-20%-15%-10%-5%0%5%10%
0
500
1,000
1,500
2,000
2,500
3,000
2017
a
2018
a
2019
a
2020
e
2021
e
2022
e
2023
e
2024
e
2025
e
Total KSA revenue (SAR mn) y-o-y
Source: Company data, Beltone estimates Source: Company data, Beltone estimates
Figure 33: ...and Egypt’s 2019–25e CAGR of -4.5%...
Figure 34: ...knocking down sugar gross margins from 15% in FY19 to 12% over our 6-year forecast period
-3%
21%
-16%-12%
0% 1% 2% 2% 2%
-20%-15%-10%-5%0%5%10%15%20%25%
050
100150200250300350400450
2017
a
2018
a
2019
a
2020
e
2021
e
2022
e
2023
e
2024
e
2025
e
Total Egypt revenue (SAR mn) y-o-y
10%13%
15%
12% 12% 12% 12% 12% 13%
0%2%4%6%8%10%12%14%16%18%
050
100150200250300350400450
2017
a
2018
a
2019
a
2020
e
2021
e
2022
e
2023
e
2024
e
2025
e
Total sugar GP (SAR mn) Total sugar GPM (%)
Source: Company data, Beltone estimates Source: Company data, Beltone estimates
2.3- Savola Pasta - 6% of SF FY19 sales
Savola entered the Egyptian pasta market via its acquisition of El Maleka Company and El Farasha Company in 2011 and currently holds a leading market share in the packed pasta market. Savola Pasta’s (SP) portfolio includes notable premium pasta brands El Maleka, Macaronto, and Italiano. Recently, second-tier producers have pressured SP’s market share, resulting in FY19 volumes dropping 7% y-o-y. Nevertheless, better pricing and improved product mix elevated FY19 revenue 8% y-o-y. Pasta revenue sustained its notable growth in 9M20 to record a 6% y-o-y improvement and is estimated to close at SAR559mn by the end of FY20e. We project SP revenue will grow at a 2019–25e CAGR of 3.3% on the back of continuous market share recovery and management assessing potential openings in export markets, specifically African countries, supported by SF’s extensive export current channels. Accordingly, we estimate average gross margins will stand at 17% over our forecast horizon versus 13% in FY19.
Figure 35: Market share gain and exports
supporting pasta top line recovery...
Figure 36: ...with elevated gross margin due to
improved product mix
-22%
13%8% 10%
2% 2% 2% 2% 2%
-25%-20%-15%-10%-5%0%5%10%15%20%
0100200300400500600700
2017
a
2018
a
2019
a
2020
e
2021
e
2022
e
2023
e
2024
e
2025
e
Pasta revenue (SAR mn) y-o-y
14%13%
13%
17% 17% 17% 17% 17% 17%
0%2%4%6%8%10%12%14%16%18%20%
0
20
40
60
80
100
120
2017
a
2018
a
2019
a
2020
e
2021
e
2022
e
2023
e
2024
e
2025
e
Gross profit (SAR mn) Pasta GPM (%)
Source: Company data, Beltone estimates Source: Company data, Beltone estimates

56
Savola Group 1 December 2020
2.4- Savola’s emerging categories - 2% of SF FY19 sales
Savola’s emerging categories (SEM) consist of the (i) sale of ready-to-eat baked products (Pech Pech) in Iran, (ii) JV with international canned-seafood producer, Thai Union, to promote the renowned John West trademark, and (iii) sales of specialty fats and margarine in Saudi Arabia and Turkey. SEM’s FY19 revenue improved 10% y-o-y to SAR184mn, with a gross profit of SAR8mn, reversing a gross loss of SAR6mn a year earlier, but still recording a FY19 net loss of SAR32mn. In 9M20, SEM sustained a gross profit of SAR8mn, which we will anticipate will reach SAR11mn by the end of FY20e. Considering its niche nature, we believe the segment’s gross margin will improve to 8% by FY25e from 4.3% in FY19 on the back of greater market penetration, supported by a 2019–25e sales CAGR of 12%.
Figure 37: Savola’s niche segment growing at a
CAGR of a mere 4%...
Figure 38: ...translating to stable gross margin
development
10%
10%
10% 10% 10%
15% 15%
0%
5%
10%
15%
20%
050
100150200250300350400
2019
a
2020
e
2021
e
2022
e
2023
e
2024
e
2025
e
EC revenue (SAR mn) y-o-y
Source: Company data, Beltone estimates Source: Company data, Beltone estimates
3- Food Services - 9% of total group FY19 sales
3.1- Herfy - 6% of total group FY19 sales
Established in 1981, Herfy is considered to be Saudi Arabia’s largest fast food chain with over 394 branches across 50 cities within Saudi Arabia, Kuwait, and Bangladesh. Herfy also produces a range of packaged and frozen foods such as bread, friable chicken nuggets, and frozen burger patties. Savola initially owned 70% of Herfy following its acquisition of Panda in 1998, which has later fallen to 49% following its IPO on the Saudi Tadawul in 2011. The company’s FY19 revenue improved 5% y-o-y, but 9M20 sales took a hit (-19% y-o-y) following the COVID-19 outbreak, which resulted in major store closures and limited working hours. 3Q20 sales figures witnessed a sequential turnaround (+83% q-o-q) as curfew restrictions were removed and as bakery and meat volumes improved. Accordingly, we anticipate FY20e sales to close at SAR1,030mn (-20% y-o-y), yielding a gross margin of 23%. Going forward, we project sales to grow at a 2019–25e CAGR of 2.6% on the back of normalized operations (with gross margin levels normalizing at 30% over our forecast horizon) and management’s efforts to launch new meals and possibly extend its overseas presence.
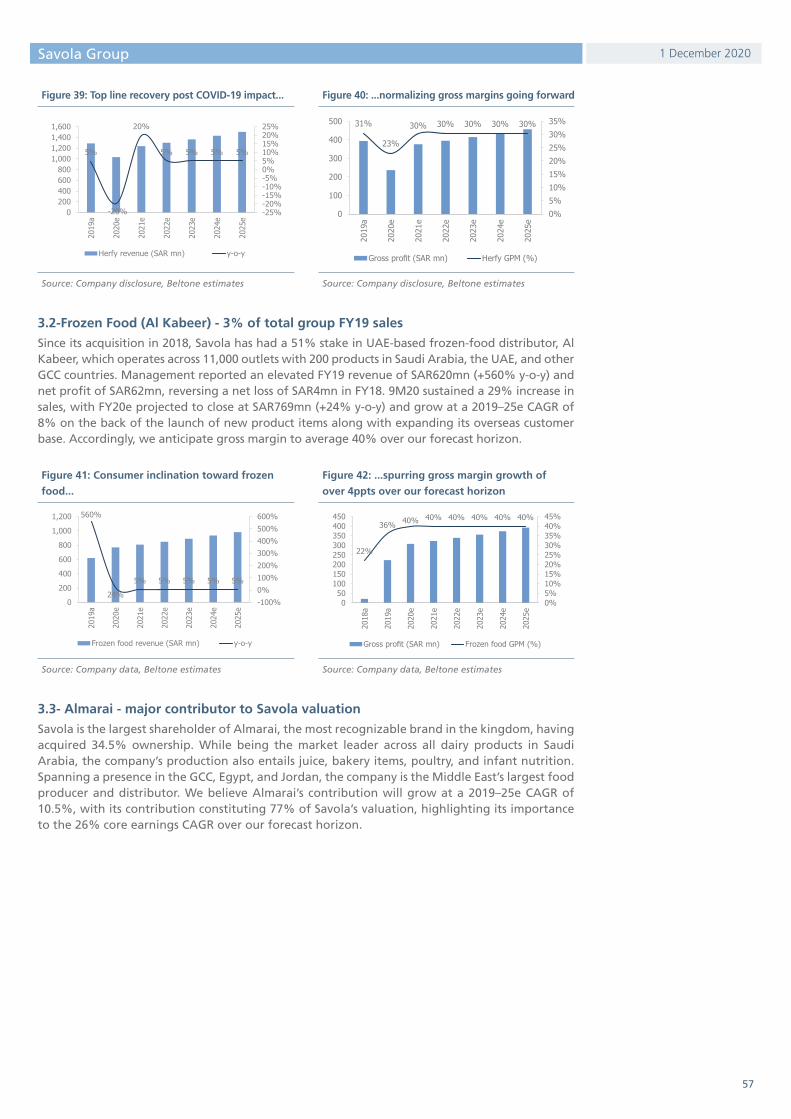
57
Savola Group 1 December 2020
Figure 39: Top line recovery post COVID-19 impact... Figure 40: ...normalizing gross margins going forward
5%
-20%
20%
5% 5% 5% 5%
-25%-20%-15%-10%-5%0%5%10%15%20%25%
0200400600800
1,0001,2001,4001,600
2019
a
2020
e
2021
e
2022
e
2023
e
2024
e
2025
eHerfy revenue (SAR mn) y-o-y
Source: Company disclosure, Beltone estimates Source: Company disclosure, Beltone estimates
3.2-Frozen Food (Al Kabeer) - 3% of total group FY19 sales
Since its acquisition in 2018, Savola has had a 51% stake in UAE-based frozen-food distributor, Al Kabeer, which operates across 11,000 outlets with 200 products in Saudi Arabia, the UAE, and other GCC countries. Management reported an elevated FY19 revenue of SAR620mn (+560% y-o-y) and net profit of SAR62mn, reversing a net loss of SAR4mn in FY18. 9M20 sustained a 29% increase in sales, with FY20e projected to close at SAR769mn (+24% y-o-y) and grow at a 2019–25e CAGR of 8% on the back of the launch of new product items along with expanding its overseas customer base. Accordingly, we anticipate gross margin to average 40% over our forecast horizon.
Figure 41: Consumer inclination toward frozen
food...
Figure 42: ...spurring gross margin growth of
over 4ppts over our forecast horizon
560%
24%5% 5% 5% 5% 5%
-100%0%100%200%300%400%500%600%
0
200
400
600
800
1,000
1,200
2019
a
2020
e
2021
e
2022
e
2023
e
2024
e
2025
e
Frozen food revenue (SAR mn) y-o-y
Source: Company data, Beltone estimates Source: Company data, Beltone estimates
3.3- Almarai - major contributor to Savola valuation
Savola is the largest shareholder of Almarai, the most recognizable brand in the kingdom, having acquired 34.5% ownership. While being the market leader across all dairy products in Saudi Arabia, the company’s production also entails juice, bakery items, poultry, and infant nutrition. Spanning a presence in the GCC, Egypt, and Jordan, the company is the Middle East’s largest food producer and distributor. We believe Almarai’s contribution will grow at a 2019–25e CAGR of 10.5%, with its contribution constituting 77% of Savola’s valuation, highlighting its importance to the 26% core earnings CAGR over our forecast horizon.

58
Savola Group 1 December 2020
Figure 43: Savola top line to record 6-year CAGR
of 2%...
Figure 44: ...driven mostly by retail and food
services revenue improvements...
5%
-9% -8%
2%
-2%
3% 3% 3% 3% 3%
-12%-10%-8%-6%-4%-2%0%2%4%6%
05,000
10,00015,00020,00025,00030,000
2016
a
2017
a
2018
a
2019
a
2020
e
2021
e
2022
e
2023
e
2024
e
2025
e
Sales (SAR mn) y-o-y
Source: Company data, Beltone estimates Source: Beltone estimates
Figure 45: EBITDA improvement attributed to
trickled-down impact of enhanced retail recovery
Figure 46: Attributable net income surging on the
back of Savola’s net income share of Almarai
4% 5%3%
9%10% 10% 10% 11% 11% 11%
0%
2%
4%
6%
8%
10%
12%
0
500
1,000
1,500
2,000
2,500
3,000
2016
a
2017
a
2018
a
2019
a
2020
e
2021
e
2022
e
2023
e
2024
e
2025
e
EBITDA (SAR mn) EBITDA margin (%)
-1%
4%
-2%
2%
5% 5% 6% 7% 7% 8%
-4%-2%0%2%4%6%8%10%
-1,000-500
0500
1,0001,5002,0002,500
2016
a
2017
a
2018
a
2019
a
2020
e
2021
e
2022
e
2023
e
2024
e
2025
eAttributable net income (SAR mn) Attributable NP (%)
Source: Company data, Beltone estimates Source: Company data, Beltone estimates
Figure 47: Stable working capital across our
projections...
Figure 48: ...and lack of major CAPEX translating
into high FCFF yield
2%2%
2%
2%
2% 2% 2%
2%
2%
2%
2%
2%
2%
2%
0
500
1,000
1,500
2,000
2,500
2019
a
2020
e
2021
e
2022
e
2023
e
2024
e
2025
e
FCFF, (SAR mn) CAPEX/sales, %
Source: Company data, Beltone estimates Source: Company data, Beltone estimates

APPENDIX

60
APPENDIX 1 December 2020
Global oil industry dynamics
Oilseeds
• Oilseeds, especially soybeans, are universally cultivated to extract (crush) oil and protein ingredients. These ingredients are then processed and utilized as human foods, livestock feeds, and manufacturing goods.
• Overall oilseed production recorded a 2013–19 CAGR of 2.4% with consumption growing at a higher CAGR of 3.0%, indicating increased appetite and demand.
• From 2017–19, Brazil has been the dominant producer of oilseeds at an average of 118.9mn tpa. This is highly attributed to the execution of a double-cropping scheme, where 2 different types of harvests are planted during an agricultural calendar. As a runner-up, the US produces over 117.0mn tpa.
Figure 1: Brazil and US lead global oilseed production (mn tons)
Figure 2: China being the largest importer of oilseeds directly impacts price fluctuations (mn tons)
020406080
100120140160
Braz
il
Unite
d St
ates
Arge
ntin
a
Chin
a
Indi
a
Para
guay
Cana
da
Average 2017-2019 2029
020406080
100120140160180
Chin
a
Unite
d St
ates
Braz
il
Arge
ntin
a EU
Indi
a
Mex
ico
Average 2017-2019 2029
Source: OECD/FAO Source: OECD/FAO
• Soybean is fundamentally branded as the major oilseed variety, increasing its contribution from 53% in the 90’s to 69% from 2017–19 of total oilseed produced globally.
• Soybean’s planted area increased from 74mn acres in 2000 to reach a high of 90mn acres in 2017. Other types of oilseeds such as cotton seed and sunflower seed have recorded lower planted areas over the past 20 years on the back of a lower average yield of 0.7 tons per acre versus 4.6 tons per acre for soybean. This is attributed to the (i) rise of hybrid planting where 2–3 beans are embedded in soybean plant pods at a time. Currently, farmers can embed up to 4 beans, potentially rising to 5 in some cases, (ii) escalation of global carbon dioxide (CO2) levels. Soybeans are categorized as C3 plants that react greater to CO2 levels than C4 plants such as corn, and (iii) enhancement in fertilizer and pesticide utilization.
• 2019/2020 soybean production deteriorated as a result of a 20% drop in the US. This was attributed to heavy rainfalls that spanned from January to June, leading farmers to delay harvesting in imperfect growing conditions. As a result, yield per acre dropped 15% y-o-y.
• Regardless of the deterioration in soybean production in FY19/20, prices did not surge as consumption recorded a noticeable reduction in China, the largest consumer and importer as well as third major producer of oilseeds globally. This was largely driven by the continuous damaging impact of the African swine fever on China’s livestock with over 100mn pig deaths since August 2018.

61
APPENDIX 1 December 2020
Figure 3: Majority of oilseed production is
attributed to soybean
Figure 4: Oilseed yields and acreage dropped during
past 3 years, while prices remained stagnant
53%69% 70%
47%31% 30%
0%10%20%30%40%50%60%70%80%90%
100%
1990-1999 2017-19 2029
Soybean Other oilseeds
0
1
2
3
4
5
6
0102030405060708090
100
2010
2011
2012
2013
2014
2015
2016
2017
2018
2019
Soybean harvested, mn acres Cottonseed harvested, mn acresSunflowerseed harvested, mn acres Canola harvested, mn acresSoybean yield ton/acre Cottonseed yield ton/acreSunflowerseed yield ton/acre Canola yield ton/acre
Source: OECD/FAO Source: USA Department of Agriculture
Vegetable oil
• Vegetable oils are oils distilled from a range of oilseeds and nuts. The majority of oils do not accommodate cold-pressing techniques since unsavory flavors would linger. Consequently, these oils undertake various processing phases beyond plain abstraction to yield a rich and edible oil.
Figure 5: Oil crushing process
Dried oilseed
Metalcontaminants
Water FilterDeodorizingRefined oilWater
refining
Magnetic separator
Bleaching
Dehulling or deshelling
Screw press
Additional filtering
Crush to pulp
Oil (virgin)Centrifuge
+
Source: Britannica
• Production is subject to oilseed crushing and the cultivation of long-standing tropical plants, particularly palm oil. In the past 10 years, palm oil harvest has eclipsed other vegetable oils.
• At the center of the COVID-19 pandemic, global vegetable oil prices witnessed demand deceleration in China and India, triggered by lockdown enforcements. For importing countries, crushing volumes were prolonged, therefore growing their seed imports to the detriment of oil and meal procurements. In view of that, key exporters of vegetable oil suffered from below customary export levels, resulting in a drop in global prices

62
APPENDIX 1 December 2020
Figure 6: Indonesia is the leading palm oil producer, one of the major vegetable oils produced...
Indonesia24%
China13%
Malaysia11%EU
7%
United States6%
Others39%
Source: OECD/FAO
Figure 7: ...while China is the leading vegetable
oil consumer
Figure 8: Projected major hike in vegetable oil
imports by 2029 (mn tons)
China18%
India12%
EU11%
Indonesia8%
United States8%
Others43%
75
80
85
90
95
100
Average 2017-2019 2029
Source: OECD/FAO Source: OECD/FAO
Slower projected production rates on the back of weaker consumption
• With Brazil being renowned for its fertile landscapes, its soybean projected production growth of 1.9% per annum will beat that of the US (0.7% per annum) to reach 141mn tons versus 125.2mn tons, respectively, by 2029. China is projected to revive production levels by 1.7% from 2020–29 as the lack of policy backing for the farming of wheat (+0.6% from 2020 to 2029), which acts as a substitute for oilseeds, supports interest in oilseeds harvesting going forward.
• With consumption levels expected to record a 2020–26 CAGR of 1.4% compared to a historical 2013–19 CAGR of 3.0%, projected soybean production will accordingly record a lower CAGR of 1.2% versus historical CAGR of 2.4%. In view of that, total oilseed crush is anticipated to increase by 64mn tons by 2029, considerably less than 103mn tons during the preceding 10-year span.
• Global vegetable oil production is anticipated to grow by 1.4% annually, attributed mostly to increased food demand in developing countries as population and income levels continue to outpace developed country growth rates. Nevertheless, harvest development is anticipated to deteriorate as a result of growing resolutions to diminish deforestation instigated by palm oil factories in Indonesia and Malaysia, which constitute 33% of global vegetable oil manufacturing. This indicates that manufacturing enhancement will rise gradually from efficiency increases, together with an intensification in cultivation practices.
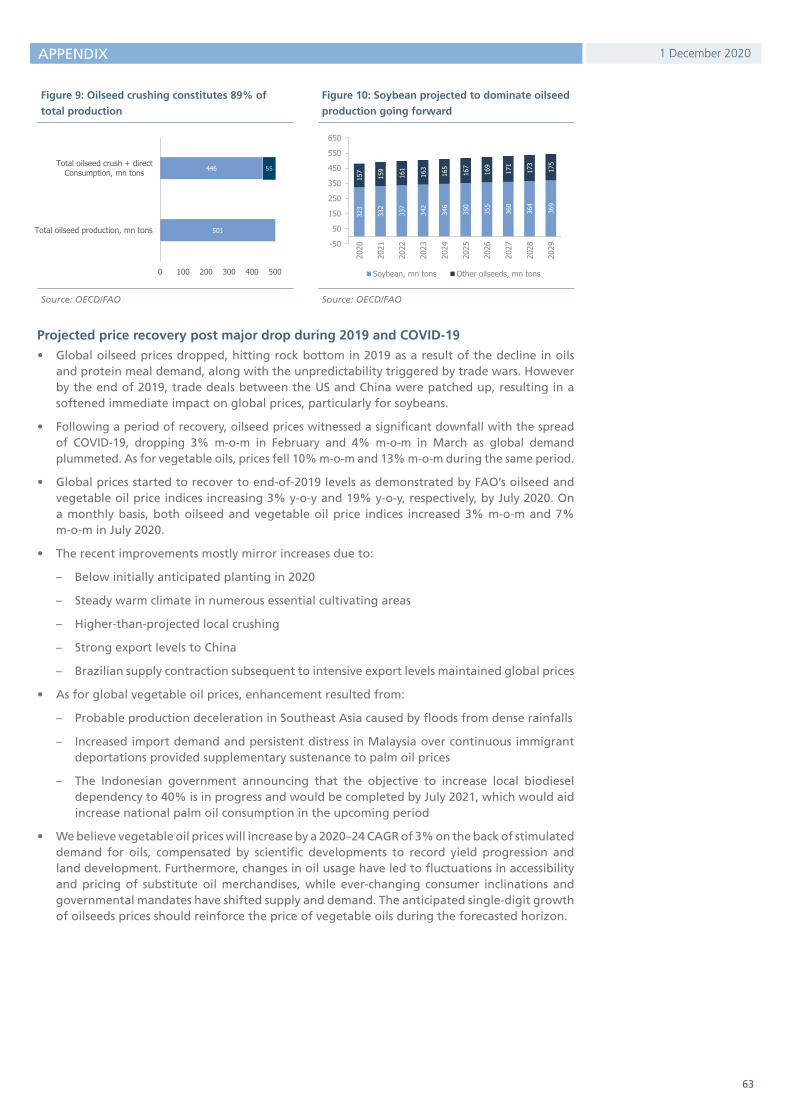
63
APPENDIX 1 December 2020
Figure 9: Oilseed crushing constitutes 89% of
total production
Figure 10: Soybean projected to dominate oilseed
production going forward
501
446
0 100 200 300 400 500
Total oilseed production, mn tons
Total oilseed crush + directConsumption, mn tons 55
323
332
337
342
346
350
355
360
364
369
157
159
161
163
165
167
169
171
173
175
-50
50
150
250
350
450
550
650
2020
2021
2022
2023
2024
2025
2026
2027
2028
2029
Soybean, mn tons Other oilseeds, mn tons
Source: OECD/FAO Source: OECD/FAO
Projected price recovery post major drop during 2019 and COVID-19
• Global oilseed prices dropped, hitting rock bottom in 2019 as a result of the decline in oils and protein meal demand, along with the unpredictability triggered by trade wars. However by the end of 2019, trade deals between the US and China were patched up, resulting in a softened immediate impact on global prices, particularly for soybeans.
• Following a period of recovery, oilseed prices witnessed a significant downfall with the spread of COVID-19, dropping 3% m-o-m in February and 4% m-o-m in March as global demand plummeted. As for vegetable oils, prices fell 10% m-o-m and 13% m-o-m during the same period.
• Global prices started to recover to end-of-2019 levels as demonstrated by FAO’s oilseed and vegetable oil price indices increasing 3% y-o-y and 19% y-o-y, respectively, by July 2020. On a monthly basis, both oilseed and vegetable oil price indices increased 3% m-o-m and 7% m-o-m in July 2020.
• The recent improvements mostly mirror increases due to:
– Below initially anticipated planting in 2020
– Steady warm climate in numerous essential cultivating areas
– Higher-than-projected local crushing
– Strong export levels to China
– Brazilian supply contraction subsequent to intensive export levels maintained global prices
• As for global vegetable oil prices, enhancement resulted from:
– Probable production deceleration in Southeast Asia caused by floods from dense rainfalls
– Increased import demand and persistent distress in Malaysia over continuous immigrant deportations provided supplementary sustenance to palm oil prices
– The Indonesian government announcing that the objective to increase local biodiesel dependency to 40% is in progress and would be completed by July 2021, which would aid increase national palm oil consumption in the upcoming period
• We believe vegetable oil prices will increase by a 2020–24 CAGR of 3% on the back of stimulated demand for oils, compensated by scientific developments to record yield progression and land development. Furthermore, changes in oil usage have led to fluctuations in accessibility and pricing of substitute oil merchandises, while ever-changing consumer inclinations and governmental mandates have shifted supply and demand. The anticipated single-digit growth of oilseeds prices should reinforce the price of vegetable oils during the forecasted horizon.

64
APPENDIX 1 December 2020
Figure 11: Both oilseed and vegetable oil prices (USD/ton) have taken a hit for the past 10 years...
Figure 12: ...however recent recovery on the back of increased demand and lower cultivation yields (2014-2016=100)
0
500
1,000
1,500
2,000
1999
2004
2009
2014
2019
Soybean Other oilseeds Protein meals Vegetable oils
Source: OECD/FAO Source: FAO
Mature markets’ vegetable oil consumption recorded 8.7mn tons on average during 2017–19 (4.0% of global vegetable oil consumption) and is anticipated to grow 15% by 2029. Turkey, being the largest user, consumes over 2.9mn tons (1.4% of global vegetable oil consumption and 34% of MENAT mature market consumption). Next in line, Egypt consumed an average of 2.6mn tons during the same period (1.2% of global vegetable oil consumption and 30% of MENA mature market consumption). As for Iran, which came in third, consumption averaged 2.0mn tons (1% of global vegetable oil consumption and 24% of MENAT mature market consumption). Lastly, Saudi Arabia coming from a low base of 0.9mn tons is expected to record the highest consumption growth rate of 36% by 2029 to reach 1.2mn tons. With consumption exceeding production levels, potential shortages are compensated via importation, which is estimated to surge from 5.5mn tons on average from 2017–19 to 6.1mn tons by 2029 (+10%). According to FAO estimates, mature markets’ production growth is anticipated to outpace that of consumption by 9ppts, indicating a higher dependency on local harvesting going forward.
Global sugar industry
• Sugar can be manufactured from sugarcane or beet, with 86% of total volumes contributed by sugarcane while beets contribute the residual 14%.
• Sugarcane is a seasonal harvest that is cultivated repeatedly mostly in humid and wet areas, in spite of diminishing yields with each passing season. Meanwhile, beet is harvested once every season in moderate regions.
• Both harvests undergo a number of processes to extract refined sugar as well as ethanol, an alternate biofuel. Accordingly, there is a positive correlation between sugar and ethanol prices versus global fuel prices. To illustrate more, when global oil prices increase, consumers tend to fend off fuel consumption and shift toward substitute products such as ethanol, leading to less sugar production and driving higher sugar prices. As for production choice, mills can alternate between sugar and ethanol production when either by-product price declines, hedging any investment uncertainty.
• According to FAO estimates, 78% of total sugar crops will be utilized to produce sugar, while the remaining 22% will be allocated to ethanol.
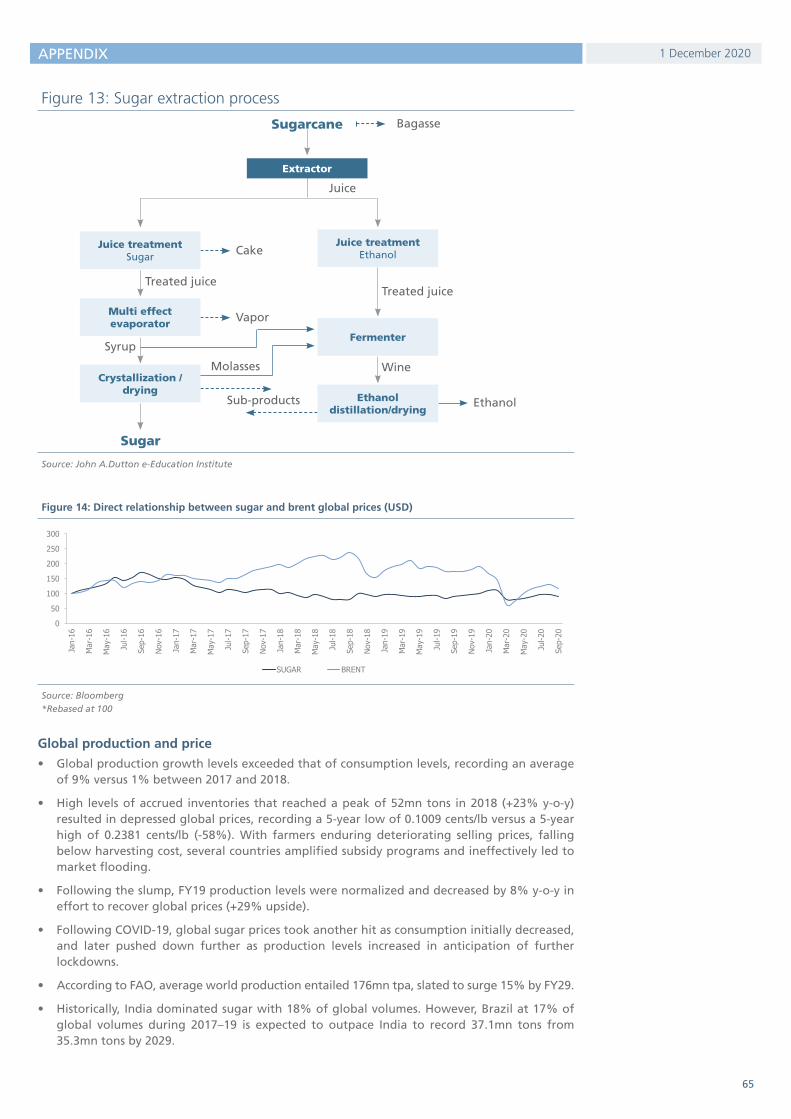
65
APPENDIX 1 December 2020
Figure 13: Sugar extraction process
Sugarcane Bagasse
Juice
Juice treatment Ethanol
Treated juice
Juice treatment Sugar Cake
Treated juice
VaporMulti effect evaporator
Syrup
Wine
Fermenter
Ethanoldistillation/drying
Sub-products Ethanol
Molasses
Extractor
Crystallization /drying
Sugar
Source: John A.Dutton e-Education Institute
Figure 14: Direct relationship between sugar and brent global prices (USD)
0
50
100
150
200
250
300
Jan-
16
Mar
-16
May
-16
Jul-1
6
Sep-
16
Nov-
16
Jan-
17
Mar
-17
May
-17
Jul-1
7
Sep-
17
Nov-
17
Jan-
18
Mar
-18
May
-18
Jul-1
8
Sep-
18
Nov-
18
Jan-
19
Mar
-19
May
-19
Jul-1
9
Sep-
19
Nov-
19
Jan-
20
Mar
-20
May
-20
Jul-2
0
Sep-
20
SUGAR BRENT
Source: Bloomberg*Rebased at 100
Global production and price
• Global production growth levels exceeded that of consumption levels, recording an average of 9% versus 1% between 2017 and 2018.
• High levels of accrued inventories that reached a peak of 52mn tons in 2018 (+23% y-o-y) resulted in depressed global prices, recording a 5-year low of 0.1009 cents/lb versus a 5-year high of 0.2381 cents/lb (-58%). With farmers enduring deteriorating selling prices, falling below harvesting cost, several countries amplified subsidy programs and ineffectively led to market flooding.
• Following the slump, FY19 production levels were normalized and decreased by 8% y-o-y in effort to recover global prices (+29% upside).
• Following COVID-19, global sugar prices took another hit as consumption initially decreased, and later pushed down further as production levels increased in anticipation of further lockdowns.
• According to FAO, average world production entailed 176mn tpa, slated to surge 15% by FY29.
• Historically, India dominated sugar with 18% of global volumes. However, Brazil at 17% of global volumes during 2017–19 is expected to outpace India to record 37.1mn tons from 35.3mn tons by 2029.

66
APPENDIX 1 December 2020
• Brazil’s sugar production growth will be driven by:
– Devaluation of its local currency, the BRL, in drawing new investments
– Increased efforts to limit carbon emission will escalate ethanol production and sugar trading
• India production is projected to improve from existing slumps and gradually develop to 35mn tons by 2029 (+14%), relatively supported by the government’s subsidy program to support crop farmers.
• EU (10% of global volumes) is anticipated to record a single-digit drop of 1% from 2017–19 average to 2029.
• The highest gainer during the coming period will be Thailand (7% of global volumes), which anticipates production to increase from 13.0mn tons to 15.8mn tons by 2029 (+21%).
• China (6% of global volumes) is estimated to expand 13% by 2029 to record 12.2mn tons on account of China’s continued efforts to fill in the consumption-production gap from similarly priced countries, allowing local farmers to compete.
• With a FY20–29 consumption CAGR of 1.42% beating historical FY10–19 CAGR of 1.26%.
Global corn industry
• The US is considered the largest corn producer with over 367mn tons produced during 2018–19. Next in line is China, which produced over 258mn tons, with the majority consumed locally. Brazil, ranked third in terms of corn production, cultivating 95mn tons of corn. Coming in forth in terms of corn production, Argentina produced over 46mn tons. Lastly, Ukraine produced over 36mn tons of corn.
• Global corn prices fell significantly during 2013–15 following a drought season in 2012, which resulted in significant price increases. In effort to offset price increase, major production volumes were yielded in subsequent years where prices dropped to USD157/ton by 2015 versus USD271/ton in 2012.
• Price recovery was instigated in 2018 and 2019 with average price reaching USD164/ton in 2018 and climbing further to USD170/ton in 2019. This was attributed to extended dry seasons in Argentina along with global demand continuing to be resilient.
• China, being the largest US corn importer, implemented a price-controlled scheme on corn from 2011–15 (standing at USD394 /ton), which accordingly stimulated intense corn harvesting. However in 2016, China ended its uneconomical corn subsidy program, which eventually led to state reserves being exhausted. Additionally, China’s 2020 corn yield was severely hit by (i) a dry season, (ii) a typhoon, and (iii) African swine fever. According to estimates, local production will be insufficient to cover escalating demand as pigs recover from African swine fever. This was demonstrated as Chinese corn imports climbed to 6.7mn tons y-t-d from global suppliers.
• The US’s FY20/21 corn production is estimated to drop to 368mn tons on the back of lower yields of 5.5 tons/acre. Meanwhile, US corn exports are projected to increase to 67mn tons as a result of increased demand from China as mentioned earlier. With supply deteriorating and demand growing, US corn closing stocks will drop to 43mn tons (registering a record drop since 2013/14).
• According to estimates, global maize production will grow at a 2019–29 CAGR of 1.6%, mainly driven by China’s continued dependency on diminishing its production-consumption gap and accordingly result in global prices increasing to USD198/ton versus USD168/ton in 2020.

67
DisclaimerImportant Notice and Disclosures
1. Author, Regulator and Responsibility This document has been issued by Beltone Securities Brokerage S.A.E (“Beltone”) which is incorporated in the Arab Republic of Egypt (“Egypt”) and authorized and regulated by the Financial Regulatory Authority (“FRA”) to carry on financial services in and from the Egyptian Exchange (“EGX”). Beltone Financial Holding, or any of its subsidiaries or officers (other than the authors of this report) may have a financial interest in one or any of the securities that are the subject of this report. Funds managed by Beltone Holding and its subsidiaries (together and separately, “Beltone”) for third parties may own the securities that are the subject of this report. Beltone may own shares in one or more of the aforementioned funds, or in funds managed by third parties. The author(s) of this report may own shares in funds open to the public that invest in the securities mentioned in this report as part of a diversified portfolio, over which the author(s) has/have no discretion. The Investment Banking division of Beltone may be in the process of soliciting or executing fee-earning mandates for companies (or affiliates of companies) that are either the subject of this report or are mentioned in this report. Research reports issued by Beltone are prepared and issued in accordance with the requirements of the local exchange conduct of business rules, where the stock is primarily listed.
2. Analyst Certification We,Ingy El Diwany and Mohamed Hamza, in our capacity as the authors, hereby certify that the views expressed in this document accurately reflect our personal views about the securities and companies that are the subject of this report. We also certify that neither we nor our spouse(s) or dependents (if relevant) hold a beneficial interest in the securities that are subject of this report. We also certify that no part of our respective compensations, was, is, or will be directly or indirectly related to the specific ratings or view expressed in this research report.
3. PurposeThis document is provided for informational purposes only and has been produced by marketing personnel for marketing purposes to professional investors. It does not constitute independent research and nothing should be construed as a solicitation or offer, or recommendation to acquire or dispose of any investment or to engage in any other transaction or, to provide any investment advice or service whether investment related, legal, tax or other guidance.
4. SuitabilityThe general capabilities of Beltone and investment related information may be disclosed in this document, but nothing should be construed as client specific advice and no account has been taken of the investment objectives, preferences, risk tolerances, finances or other needs of any particular person. In regulatory terms, client specific advice has therefore not been provided and no suitability obligations are owed to any person. Investors should, before relying and/or acting on this document, independently evaluate any investments and strategies referred to herein and make their own determination as to whether they are appropriate or suitable in light of their own financial circumstances, objectives and other matters important to them.
5. Accuracy of InformationThe information contained in this document is based on current trade, statistical and other public information we consider reliable. Any statements that are not historical facts are forward-looking statements. Forward-looking statements are based on current expectations, estimates and projections, and rely on beliefs and assumptions. They are not guarantees of future performance and involve certain risks, uncertainties and assumptions which are difficult to predict. Therefore, actual outcomes and returns may differ materially from what is expressed or forecasted in such forward-looking statements. Any pricing is indicative and does not, and is not intended to, constitute an offer to buy or sell or a representation that a purchase or sale can be executed at that price. Past performance is not indicative of future results. Any mention of market rumours has been derived from the markets and is not purported to be fact or reflect our opinions. Beltone has no obligation to update, modify or amend this document or to otherwise notify a recipient thereof in the event that any opinion, forecast or estimate set forth herein, changes or subsequently becomes inaccurate. Beltone does not represent or warrant that such information is accurate or complete and it should not be relied upon as such.
6. Recipients and Sales and Marketing RestrictionsThis document is addressed to and/or directed at Professional Clients and not Retail Clients as defined in Beltone rules. Any investments or financial products referred to herein will only be made available to clients, who qualifies as Professional Clients, as per Beltone’s discretion. Any other persons in receipt of this document must not rely upon or otherwise act upon it. This document is only being distributed to investors who meet certain qualifications and to whom an investment or service may be offered or promoted in accordance with relevant country restrictions. This excludes the US except for SEC registered broker-dealers (or banks in permissable”broker” or “dealer” capacity) acting on a principal or agency capacity, and major US institutional investors in accordance with SEC Rules 15a-6(a)(2). In reliance on the exemption from registration provided by Rule 15a-6 of the Exchange Act and interpretations thereof by the SEC in order to conduct certain business with Major Institutional Investors, Beltone has entered into an agreement with a U.S. registered broker-dealer, Auerbach Grayson and Company LLC (“Auerbach Grayson”). Transactions in securities discussed in this research report should be effected through Auerbach Grayson or another U.S. registered broker dealer. Particularly to EU investors, the content of this promotion has not been approved by an authorized person within the meaning of the Markets in Financial Instruments Directive 2004. In relation to UK investors in particular, the content of this promotion has not been approved by an authorized person within the meaning of the Financial Services and Markets Act 2000. Reliance on this promotion for the purpose of engaging in any investment activity may expose an individual to a significant risk of losing all of the property or other assets invested. Recipients of this document shall thoroughly review, study and apply such restrictions and should not rely upon or otherwise act upon this document where it is unlawful to make to such person such an offer or invitation or recommendation without compliance with any authorisation, registration or other legal requirements.
7. Foreign Collective Investment Funds (“FCIFs”)Any foreign collective investment funds (as stipulated in Beltone’s rules) mentioned herein is not subject to any form of regulation or approval by the FRA. The FRA has no responsibility for reviewing or verifying any document or other documents in connection with FCIFs. Accordingly, the FRA has not approved any information about FCIFs or any other associated documents nor taken any steps to verify the information set out in this document, and has no responsibility for it. Any FCIFs mentioned herein may be illiquid and/or subject to restrictions on their resale. Prospective purchasers of any FCIF units, mentioned in this document, should conduct their own due diligence on the FCIF.
8. Risk WarningsAny prices, valuations or forecasts are indicative and are not intended to predict actual results, which may differ substantially from those reflected. The value of an investment may go up as well as down. The value of and income from any investment may fluctuate from day to day as a result of changes in relevant economic markets (including, without limitation, foreseeable or unforeseeable changes in interest rates, foreign exchange rates, default rates, prepayment rates, political or financial conditions, etc.). Past performance is not indicative of future results. Any opinions, estimates, valuations or projections (target prices and ratings in particular) are inherently imprecise and a matter of judgement. They are statements of opinion and not of fact, based on current expectations, estimates and projections, and rely on beliefs and assumptions. Actual outcomes and returns may differ materially from what is expressed or forecasted. There are no guarantees of future performance. Certain transactions, including those involving futures, options, and other derivatives, give rise to substantial risk and are not suitable for all investors. This document does not propose to identify or to suggest all of the risks (direct or indirect) which may be associated with the investments and strategies referred to herein.
9. Conflicts InterestBeltone, or any of its subsidiaries, does and seeks to do business with companies mentioned in its research reports or any of their affiliates. As a result, investors should be aware that the firm, or any of its subsidiaries, may have a material conflict of interest that could affect the objectivity of this report.Beltone provides non-banking financial services and its directors, officers and employees, may take positions which conflict with the views expressed in this document. Our salespeople, traders, and other professionals may provide oral or written market commentary or trading strategies to our clients and our proprietary trading desks that reflect opinions that are contrary to the opinions expressed in this document.
10. No Warranty Beltone makes no representations or warranties and, to the fullest extent permitted by applicable law, we hereby expressly disclaim any and all express, implied and statutory representations and warranties of any kind, including, without limitation, any warranty as to accuracy, timeliness, completeness, merchantability, and fitness for a particular purpose and/or non-infringement.
11. No LiabilityBeltone shall not be liable in any event including (without limitation) negligence for any damages or loss of any kind, including (without limitation) direct, indirect, incidental, special or consequential damages, expenses or losses arising out of, or in connection with your use or inability to use this document, or in connection with any error, omission, defect, computer virus or system failure, or loss of any profit, goodwill or reputation, even if expressly advised of the possibility of such loss or damages, arising out of or in connection with your use of this document.
12. Copyright and ConfidentialityThe entire content of this document is subject to copyright with all rights reserved and the information is private and confidential for your own personal use only. This document and the information contained herein may not be reproduced, distributed or transmitted to any other person or incorporated in any way into another document or other material without our prior written consent.
13. Governing LawEgyptian law governs this document and these disclaimers and any dispute in relation thereto shall be exclusively referred to the Egyptian Courts.
14. ContactsBeltone, Head Quarter, Nile City Towers, North Tower, 33rd Floor, Corniche El-Nil 2005 A, Cairo, Egypt | 11221, [email protected]://www.beltonefinancial.comAuerbach Grayson and Company LLC, Head Quarter, 25 West 45th Street, New York, NY 10036, USA, [email protected]://www.agco.com
Sales and TradingInstitutional Sales TeamMohamed Waked
Institutional Trading TeamNadin Mustafa
Tamer Salama
Wagih Sharaf
Rating systemBeltone financial research is based on fundamental analyses of companies and their associated sectors, and the local/economic environment they are exposed to.
Our rating system is based on a 12-month expected return to our Fair Value (FV) estimate. Please find below our rating scale in percentage terms:
Rating Market price upside / (downside) potential to our FV (%)
Buy Above 20%
Hold Between (10%) and 20%
Sell Below (10%)
Beltone financial Research’s policy is to maintain up-to-date research reports based on fundamental changes. However, in special cases, the return on our FV may vary from the rating according to the above criteria, due to share price volatility. Despite this discrepancy, analysts may not necessarily update their rating until this movement is sustained over a period of at least 30 days. In such cases, analysts will disclose their outlook and explain their rationale to Beltone financial clients.
Beltone Financial2005C Nile City Towers
North Tower, 33rd floor
Cairo 11221, Egypt
Tel.: +202 24616300
Fax: +202 24619848