Functional Ecology of Tropical Forest Recovery - WUR eDepot
228
-
Upload
khangminh22 -
Category
Documents
-
view
1 -
download
0
Transcript of Functional Ecology of Tropical Forest Recovery - WUR eDepot

Functional ecology of tropical forest recovery
Madelon Lohbeck
Functional ecology of tropical forest recovery Madelon Lohbeck


Functional Ecology of Tropical Forest Recovery
Madelon Lohbeck
30544 Lohbeck-bk.indd 1 27-10-14 16:42

Thesis committee
PromotorsProf. Dr F.J.J.M. BongersPersonal chair at the Forest Ecology and Forest Management GroupWageningen University
Prof. Dr M. Martínez-RamosProfessor in population and community ecology, Centro de Investigaciones en EcosistemasUniversidad Nacional Autónoma de México
Co-promotorProf. Dr L. PoorterPersonal chair at the Forest Ecology and Forest Management GroupWageningen University
Other membersProf. Dr L. Brussaard, Wageningen UniversityProf. Dr R.L. Chazdon, University of Connecticut, Storrs, USAProf. Dr J.H.C. Cornelissen, VU University AmsterdamDr J. van Ruijven, Wageningen University
This research was conducted under the auspices of the C. T. de Wit Graduate School for Production Ecology and Resource Conservation (PE&RC)
30544 Lohbeck-bk.indd 2 28-10-14 08:54

Functional Ecology of Tropical Forest Recovery
Madelon Lohbeck
Thesis
submitted in fulfillment of the requirements for the degree of doctorat Wageningen University
by the authority of the Rector MagnificusProf. Dr M.J. Kropff,
in the presence of theThesis Committee appointed by the Academic Board
to be defended in publicon Tuesday 16 December 2014
at 11 a.m. in the Aula.
30544 Lohbeck-bk.indd 3 27-10-14 16:42

Madelon LohbeckFunctional ecology of tropical forest recovery,224 pages.
PhD thesis, Wageningen University, Wageningen, NL (2014)With references, with summaries in Dutch, English and Spanish
ISBN 978-94-6257-161-7
30544 Lohbeck-bk.indd 4 27-10-14 16:42

Table of contents
Chapter 1 General introduction 9
Chapter 2 Functional diversity changes during tropical forest successionPublished in Perspectives in Plant Ecology, Evolution and Systematics (2012) 14(2): 89-96
33
Chapter 3 Successional changes in functional composition contrast for dry and wet tropical forestPublished in Ecology (2013) 94(6): 1211-1216
53
Chapter 4 Functional trait strategies of trees in dry and wet tropical forests are similar but differ in their consequences for successionSubmitted for publication
69
Chapter 5 Changing drivers of species dominance during tropical forest successionPublished in Functional Ecology (2014) 28: 1052-1058
89
Chapter 6 Biomass is the main driver of changes in ecosystem process rates during tropical forest successionIn press, Ecology
107
Chapter 7 The importance of biodiversity for multiple ecosystem functions in a human-modified tropical landscape
135
Chapter 8 General discussion 157
30544 Lohbeck-bk.indd 5 27-10-14 16:42

Literature
Summary
Samenvatting
Resúmen
Acknowledgements
Short biography
List of publications
PE&RC Training and Education Statement
174
193
199
206
213
217
219
221
30544 Lohbeck-bk.indd 6 27-10-14 16:42

30544 Lohbeck-bk.indd 7 27-10-14 16:42

30544 Lohbeck-bk.indd 8 27-10-14 16:42

General introduction
Madelon Lohbeck
30544 Lohbeck-bk.indd 9 27-10-14 16:42

Chapter 1
10
Ecosystems under global change
The world’s natural ecosystems are under high pressure for land-conversion, which, in combination with other drivers of environmental change such as global warming and pollution, will have large consequences for life on earth. To face current environmental challenges, there is an urgent need for scientific knowledge on how ecosystems function, how they change, how they are related to human well-being, and how people can use and transform them in a sustainable way (Loreau 2010). One of the consequences of global change is species loss. Currently, biodiversity is being lost at dramatic rates, and there are clear indications that we are approaching the sixth mass extinction (Barnosky et al. 2011, Dirzo et al. 2014). Since biodiversity is generally accepted as one of the major drivers of ecosystem functioning (Balvanera et al. 2006, Midgley 2012), large consequences for ecosystem functioning and services can be expected (MA 2005). The science of biodiversity and ecosystem functioning has grown rapidly in importance especially after the publication of the Millennium Ecosystem Assessment where the effect of global change on human well-being was addressed by making the direct link between biodiversity and ecosystem functioning (MA 2005, see also Fig 1.1). Functional traits (see Box 1.1 for definition) are key variables to assess organisms’ responses to global change drivers, and are at the same time indicators of how organisms drive changes in ecosystem functioning (Fig 1.1; e.g. Díaz et al. 2006). Trait-based approaches can therefore provide a mechanistic way to scale up from organisms to ecosystems and thereby contribute to the development of a more predictive biodiversity and ecosystem functioning science (Sapijanskas and Loreau 2010).
From plant tissue to ecosystem fluxes
Plant functional traits are characteristics, usually measured at the tissue-level like at the leaves, that are indicators of the plants’ carbon, water, and nutrient balance (Box 1.1, Table 1.1). Such balances determine, on the one hand, species success in a given environment (Naeem and Wright 2003), and, on the other hand, the contribution of that species to ecosystem level fluxes of carbon, water and nutrients; ecosystem processes (Petchey and Gaston 2006). Considering that vegetation forms the basis of all other life on earth, I focus on plant functional
30544 Lohbeck-bk.indd 10 27-10-14 16:42

Introduction
11
1Global change drivers
e.g. land-use change
Biodiversity variety of life in the
ecosystem ‘functional traits’
Ecosystem processes & functioning
e.g. primary productivity, nutrient
cycling
Human well-being
Ecosystem services
e.g. fertile soils, wood provisioning, water
purification
1
2
this thesis
Figure 1.1: Conceptual framework of this study (modified from the Millennium Ecosystems Assessment; MA 2005). The framework represents how global change drivers affect ecosystems, their biodiversity and the processes that take place and how this in turn affects the ecosystem services on which society depends. In the current thesis I focus on the global change driver “land conversion for cultivating maize” and address the filled arrows: its effect on biodiversity (arrow 1) and how changes in biodiversity in turn affect ecosystem functioning (arrow 2).
traits and their role in linking effects of land-use change and ecosystem function. For animals, similar functional traits that relate to the organisms performance can be measured, including behavioural and feeding traits. These are similarly expected to respond strongly to changes in the environment and affect ecosystem processes, and are intrinsically linked to the plant community in the ecosystem through a network of biotic interactions (e.g. pollination, seed dispersal, seed predation, herbivory, diseases).
30544 Lohbeck-bk.indd 11 27-10-14 16:42

Chapter 1
12
Response traitsFunctional traits that determine species success given a certain set of abiotic
conditions and biotic pressures are called response traits. With changing conditions and pressures (e.g. due to global change), the functional trait properties of the ecosystem are likely to change (arrow 1 in Fig 1.1), response traits are central to understanding this change. Particular local biotic and abiotic conditions posing specific challenges to plant performance can be seen as habitat filters. These filters occur at different life stages. There is a filter to arrive and establish in a site, typically whether a species passes through this filter is influenced by dispersal traits like seed size and dispersal strategy. For example, small seeded wind dispersed seeds arrive first and quickly establish on recently abandoned fields (Hammond and Brown 1995). Other filters determine which species survive and pass on to subsequent life-stages. For example, after a major fire outbreak only thick barked species survive (Van Nieuwstadt and Sheil 2005), and after severe drought events only deciduous species survive (Poorter and Markesteijn 2008). Yet other filters determine whether species reach reproductive success (Keddy 1992). Here, changes in the plant-pollinators interactions and the lack of suitable pollinators are crucial filters that can cause reproductive failure and threatens species survival (Sargent and Ackerly 2008).
Besides differential success of different functional strategies given specific local growing conditions (habitat filtering, as described above), species interactions also play a pivotal role in the process of community assembly (see Box 1.1 for definition). As resources (light, water, nutrients) may become limiting, competitive pressure arises. Similarly, pressure may arise by presence of herbivores and pathogens. Under such pressures, successful species are no longer just the ones that most effectively capture the necessary resources (as predicted under the habitat filtering hypothesis), but increasingly also the ones that have a functional strategy that is complementary to the strategy exhibited by its neighbours. This ‘limiting trait similarity’ (Macarthur and Levins 1967) makes that being different than your neighbour in terms of resource capture strategy helps to capture resources yet untapped, and being different in terms of defence strategy helps to limit damage from pathogens and herbivores (Comita et al. 2014).
Habitat filtering and limiting trait similarity are community assembly mechanisms that have contrasting outcomes on how functional traits in a community are distributed. There is increasing evidence that both habitat
30544 Lohbeck-bk.indd 12 27-10-14 16:42

Introduction
13
1filtering and limiting similarity shape communities simultaneously, though their relative strength may change along environmental- and resource gradients (Mason et al. 2007, 2013) and are affected by global change drivers. If habitat filtering is the predominant factor driving species success, it is expected that few similar functional trait values will dominate and those are the ones that most successfully respond to the filter. If competitively driven limiting trait similarity is the predominant factor driving species success, it is expected that dominant species with complementary functional trait values would coexist under resource-limited environments. Given this, changing ‘community-weighted functional trait mean’ along environmental gradients is often used as an indicator of changing abiotic conditions and concurrent change in main habitat filters. In contrast, the degree of trait divergence within a community can be used to assess the strength of competitive interactions. The functional traits that matter here are those that best reflect the habitat filters and/ or main limiting resource(s) in the ecosystem. For example, along a gradient of increasing light scarcity, the community traits will probably diverge in traits that reflect light capture strategies, such as specific leaf area and leaf chlorophyll content. Along a gradient of increasing water scarcity, traits related to water loss from the leaves (e.g. leaf dry mater content, deciduousness) and traits related to water uptake from the roots (e.g. rooting depth) are likely to respond. See also table 1.1 for functional traits and their response to gradients in biophysical conditions.
Effect traitsFunctional traits that determine how species contribute to ecosystem processes
are called effect traits (arrow 2 in Fig 1.1) and are central to understand the effects of biodiversity changes on the functioning and services of ecosystems (e.g. Díaz et al. 2007b). Although there is increasing empirical evidence for the consequences of biodiversity loss on ecosystem functioning (e.g. Bunker et al. 2005, Cardinale et al. 2012, Maestre et al. 2012b), the mechanisms through which this unfolds is under ongoing debate. I distinguish two complementary ways to quantify the functional trait properties of biodiversity that imply different mechanisms by which biodiversity could influence ecosystem functioning: functional diversity and community-weighted functional trait mean. Functional diversity (FD) describes the distribution of species in functional trait space (Mason et al. 2005). FD may have a positive effect on ecosystem process rates because highly diverse communities are better able to make optimal use of the available resources,
30544 Lohbeck-bk.indd 13 27-10-14 16:42

Chapter 1
14
leading to increased ecosystem process rates, a mechanism which has been coined the niche complementarity effect (Tilman et al. 1997) and which has been supported empirically (e.g. Scherer-Lorenzen 2008). Community-weighted means (CWMs) describe the dominant functional trait value of the overall community, by weighting species trait values by the abundance of the species (Lavorel et al. 2007). An effect of CWMs on ecosystem process rates indicates that the functional traits of the most abundant species in the community are responsible for most fluxes in the ecosystem. This mechanism has been coined the mass ratio effect (Grime 1998) and has been supported by empirical evidence (e.g. Smith and Knapp 2003, Dangles and Malmqvist 2004). Whether the direction of the relationship between CWM and ecosystem function rates is positive or negative depends on the trait that is used for quantifying the functional trait mean; trait values that enhance resource acquisition (e.g. high CWM of specific leaf area, high CWM of leaf nutrients) increase ecosystem function rates whereas trait values that enhance resource conservation (e.g. high CWM of leaf dry matter contents, high CWM of wood density) decrease such rates (Garnier et al. 2004, Reich 2014). See also figure 1.4 for a schematic overview of drivers of successional changes in community functional properties and how these affect ecosystem functioning, and Table 1.1 for functional traits and their effect on ecosystem functioning. The difference between these two mechanisms that link biodiversity (sensu lato) to ecosystem function is whether the diversity (niche complementarity effect) plays a larger role than the dominance (mass ratio effect) for ecosystem function, or the other way around. This may differ along environmental gradients and depend on the ecosystem function of interest. Dominance is a typical phenomenon in natural ecosystems where, even in hyperdiverse tropical forest, only 1.4% of the species make up for most of the trees (ter Steege et al. 2013). Moreover, with increasing human pressure on ecosystems, dominance is likely to increase as a limited set of disturbance-related (pioneer) species thrive in human-dominated landscapes (Santos et al. 2008).
30544 Lohbeck-bk.indd 14 27-10-14 16:42

Introduction
15
1Box 1.1: Glossary
Biodiversity: The variety of all living things, including plants, animals and microorganisms, their interrelationships, the genes they contain, and the ecosystems they form (encyclopedia of life: www.eol.org).Community assembly: The ecological process of how a local (plant) community assembles, following certain mechanisms that select for or against species from the regional species pool (Keddy 1992). Community assembly is influenced by dispersal limitation, local habitat filters (biotic and abiotic conditions) and competitive interactions (limiting trait similarity).Ecosystems: A community of plants, animals and microorganisms that are linked by energy and nutrient flows and that interact with each other and with the physical environment (encyclopedia of life: www.eol.org).Ecosystem functions or ecosystem processes: The fluxes of matter and energy over time and space through biological activity (Reiss et al. 2009) .Ecosystem functioning: The joint effects of all functions that sustain an ecosystem (Reiss et al. 2009).Ecosystem services: The benefits that people obtain from ecosystems (MA 2005).Functional traits: Those components of an organism’s phenotype that determine an organisms response to environmental factors (response traits) (Naeem and Wright 2003) and/or an organisms effect on ecosystem processes/ ecosystem functioning (effect traits) (Petchey and Gaston 2006). Functional traits are considered to reflect adaptations to biotic and abiotic conditions and trade-offs (ecophysiological and/or evolutionary) among different functions within the organism. In plants, functional traits include morphological, ecophysiological, biochemical and regeneration traits. In animals, these traits are combined with behavioural and feeding habit traits (de Bello et al. 2010). Examples of plant functional traits, the focus of this study, are given in Table 1.1.
Tropical forest succession after shifting cultivation
Pressure for land conversion is high in most tropical forest ecosystems where also the highest levels of biodiversity are found. Despite conservation efforts, tropical biodiversity is rapidly declining and this decline does not seem to end any time soon (Laurance et al. 2012).
30544 Lohbeck-bk.indd 15 27-10-14 16:42

Chapter 1
16
Already more than half of all forested areas in the tropics consists of degraded or newly regenerated secondary forests (FAO 2010b), and their extent relative to undisturbed forests will continue to increase (Chazdon 2014a). Secondary forests are usually ephemeral in their characteristic (typically reaching up to 5 years of fallow age; landowners pers. comm.) and are an integral part of the human-modified landscape, especially in tropical areas where shifting cultivation is common. In this thesis I study secondary forests that regenerated after cultivation of maize in tropical Mexico (see also Fig 1.2). Agricultural expansion for shifting cultivation is one of the major drivers of tropical deforestation (Geist and Lambin 2002, Kissinger et al. 2012).
Figure 1.2: The shifting cultivation cycle. The secondary forests that are central to this thesis grow on abandoned maize fields. The length of the fallow cycle (the age that secondary forest reach before the land is cultivated again) is an important determinant of the sustainability of this land-use system.
Cultivation causes significant depletion of soil carbon and nutrient stocks (Guo and Gifford 2002, Don et al. 2011) and the effects of these depleted soils persist for many years (McGrath et al. 2001). During secondary succession the vegetation grows back through the process of natural regeneration allowing the recovery of biodiversity and ecosystem properties such as carbon and nutrient stocks, which were lost from the original system. The extent to which recovery (e.g. of the vegetation structure, diversity and of the soil properties) takes place
30544 Lohbeck-bk.indd 16 27-10-14 16:42

Introduction
17
1before the land is cultivated again is an important indicator of the resilience of the forests in the landscape and of the long-term sustainability of shifting cultivation as a land-use practice (Kleinman et al. 1995, Jakovac et al. in press). The speed of successional recovery is very variable, and strongly depends on climate, soil type, land-use history, landscape configuration and composition (Chazdon 2014a). Under low use-intensity and large fallow periods, shifting cultivation can be advantageous for biodiversity and considered sustainable. Understanding secondary forests’ potential for maintaining biodiversity, ecosystem functions and ecosystem services is vital given their increased importance in anthropogenic landscapes (Nadrowski et al. 2010, Melo et al. 2013).
Changing community properties during secondary successionSecondary succession is community assembly in action (Lebrija-Trejos et al.
2010b) and especially during early succession species turnover is high (Chazdon et al. 2007). Species replacement during secondary succession is often explained in terms of species’ adaptations to changing light environments (e.g. Bazzaz and Pickett 1980), although in dry forest water is instead the main factor limiting successional turnover (Lebrija-Trejos et al. 2011, Pineda-García et al. 2013). Species adaptation along a light gradient reflects a trade-off in plant design. In the one extreme of this gradient, fast-growing species with a rapid acquisition of resources thrive at the rich light environment of early-successional stages, while in the other extreme, slow-growing species that conserve resources dominate under the poor light environment of late-successional stages (Reich et al. 2003, Poorter et al. 2004). This ‘acquisitive-conservative trade-off’ is also called the growth-survival trade-off (Kobe and Coates 1997, Kitajima and Poorter 2008) as acquisitive species invest in growth whereas conservative species invest in survival. Functional traits are used to locate species’ strategies on this continuum. At the same time, changes in the community-weighted mean of certain traits can indicate shifts in habitat filters during succession. Also the type of traits that changes directionally reveals the filter that drives species turnover. For example, a successional decrease in community weighted ‘specific leaf area’ (where high values indicate a low-cost leaf area display for efficient light capture) indicates that reduced light availability operates as a major filter, whereas successional decrease in the proportion of species that is deciduous indicates early successional drought as a filter. For more functional traits and their relation to environmental gradients, see Table 1.1.
30544 Lohbeck-bk.indd 17 27-10-14 16:42

Chapter 1
18
Tab
le 1
.1: O
verv
iew
of t
he fu
nctio
nal t
raits
that
are
use
d in
this
thes
is, h
ow th
ese
trai
ts in
fluen
ce p
lant
per
form
ance
, the
ir ro
le a
s res
pons
e tr
aits
; i.e
. how
they
resp
ond
to d
iffer
ent e
nvir
onm
enta
l gra
dien
ts, a
nd th
eir
role
as
effe
ct tr
aits
; i.e
. how
they
influ
ence
eco
syst
em fu
nctio
ning
. The
‘+’ a
nd ‘-
’ ind
icat
e hy
poth
esiz
ed d
irec
tions
in
whi
ch tr
ait v
alue
s cha
nge
alon
g th
e en
viro
nmen
tal g
radi
ent a
nd th
e di
rect
ion
in w
hich
hig
her v
alue
s of t
hat t
rait
are
expe
cted
to a
ffec
t eco
syst
em fu
nctio
ns.
Role
as r
espo
nse
trai
tRo
le a
s eff
ect t
rait
Plan
t fu
nctio
nal t
rait
Perf
orm
ance
indi
cato
r
Light
Heat
Water
Nutrients
Physical damage
Landscape connectivity
Standing biomass
Primary productivity
Litter production
Decomposition
Nutrient cycling
Consumption by herbivores
Damage resistance
Heat exchange
Evapotranpiration
Food source for animals
Regeneration potential
Refe
renc
es
Leaf
are
a; L
A (c
m2 )
Ligh
t int
erce
ptin
g ar
ea, r
espi
ratio
n,
tran
spir
atio
n, le
af c
oolin
g, g
as e
xcha
nge
++
++
++
(Baz
zaz
and
Pick
ett
1980
, Pop
ma
et a
l. 19
92,
Yate
s et a
l. 20
10)
Spec
ific
Leaf
Are
a;
SLA
(m
2 K
g-1)
Ligh
t cap
ture
eco
nom
ics,
net
ass
imila
tion
rate
, rel
ativ
e gr
owth
rate
, lea
f life
span
, ph
otos
ynth
etic
cap
acity
++
+-
++
++
+-
++
(Cor
nelis
sen
et a
l. 19
99,
Poor
ter a
nd B
onge
rs
2006
, Poo
rter
et a
l. 20
09)
Leaf
Dry
Mat
ter
Con
tent
; LD
MC
(g
g-1)
Con
stru
ctio
n co
sts,
nutr
ient
rete
ntio
n,
agai
nst m
echa
nica
l and
her
bivo
re d
amag
e,
tole
ranc
e ag
ains
t wat
er li
mita
tions
--
-+
--
--
-+
(Poo
rter
and
Gar
nier
19
99, N
iinem
ets 2
001,
Gar
nier
et a
l. 20
04)
Leaf
Den
sity
; LD
(g
cm
-3)
Con
stru
ctio
n co
sts,
leaf
life
span
, ph
otos
ynth
etic
rate
s per
uni
t lea
f are
a,
agai
nst m
echa
nica
l and
her
bivo
re d
amag
e
--
-+
--
--
-+
(Niin
emet
s 199
9,
Lebr
ija-T
rejo
s et a
l. 20
10b)
Leaf
Thi
ckne
ss; L
T(m
m)
Con
stru
ctio
n co
sts,
leaf
life
span
, ph
otos
ynth
etic
rate
s per
uni
t lea
f are
a,
agai
nst m
echa
nica
l and
her
bivo
re d
amag
e,
gas e
xcha
nge
and
leaf
coo
ling
-+
-+
--
--
-+
(Rei
ch e
t al.
1991
, Po
pma
et a
l. 19
92,
Niin
emet
s 200
1, O
noda
et a
l. 20
11)
30544 Lohbeck-bk.indd 18 27-10-14 16:42

Introduction
19
1Sp
ecifi
c Fo
rce
to
Punc
h; sF
tP (M
N
m-2
)
Con
stru
ctio
n co
sts,
leaf
stre
ngth
, sur
viva
l to
herb
ivor
y an
d ph
ysic
al d
amag
e, p
ersi
sten
ce,
leaf
life
span
+-
--
--
+(C
orne
lisse
n et
al.
1999
, Po
orte
r et a
l. 20
09,
Kita
jima
and
Poor
ter
2010
, Ono
da e
t al.
2011
)
Petio
le le
ngth
;PL
(cm
)Li
ght c
aptu
re e
ffic
ienc
y, le
af su
ppor
t cos
ts+
++
(Bla
ck 19
60, T
aken
aka
1994
, Niin
emet
s et a
l. 20
07)
Inst
anta
neou
s ch
loro
phyl
l flu
ores
cenc
e;F 0 (n
o un
it)
Hea
t dis
sipa
tion,
resi
stan
ce a
gain
st
over
heat
ing,
pho
tosy
nthe
tic p
erfo
rman
ce-
--
-(M
axw
ell a
nd Jo
hnso
n 20
00, B
aker
and
Ro
senq
vist
200
4, W
oo
et a
l. 20
08)
Qua
ntum
Yie
ld; Q
Y (n
o un
it)Ef
fect
iven
ess o
f pho
tosy
stem
II,
CO
2 ass
imila
tion,
stre
ss to
lera
nce,
ph
otos
ynth
etic
per
form
ance
, lea
f nut
rien
t le
vels
++
++
++
+(M
axw
ell a
nd Jo
hnso
n 20
00, P
arkh
ill e
t al
. 200
1, Ba
ker a
nd
Rose
nqvi
st 2
004,
dos
Sa
ntos
Jr e
t al.
2006
)
Chl
orop
hyll
cont
ent;
Chl
(S
PAD
-uni
ts)
Ligh
t upt
ake
effic
ienc
y, p
hoto
synt
hetic
rate
s-
++
(Min
otta
and
Pin
zaut
i 19
96, P
oort
er a
nd
Bong
ers 2
006,
Ro
zend
aal e
t al.
2006
)
Leaf
nitr
ogen
co
nten
t; N
(m
g g-1
)
Phot
osyn
thet
ic ra
tes,
CO
2 ass
imila
tion,
leaf
nu
trie
nt le
vels
++
++
++
(Rei
ch e
t al.
1995
, Po
orte
r and
Bon
gers
20
06, B
akke
r et a
l. 20
11)
Leaf
pho
spho
rous
co
nten
t; P
(mg
g-1)
Phot
osyn
thet
ic ra
tes,
CO
2 ass
imila
tion,
leaf
nu
trie
nt le
vels
++
++
++
(Rei
ch e
t al.
1995
, Po
orte
r et a
l. 20
04,
Fort
unel
et a
l. 20
09)
Woo
d D
ensi
tyW
D; (
g cm
-3)
Con
stru
ctio
n co
sts,
gro
wth
rate
, ste
m
vuln
erab
ility
, mor
talit
y ra
te-
-+
+-
+(A
ugsp
urge
r and
Kel
ly
1984
, van
Gel
der e
t al.
2006
, Cha
ve e
t al.
2009
)
Leaf
com
poun
d-ne
ss; L
C(b
inar
y)
Leaf
coo
ling,
ligh
t cap
ture
eco
nom
ics,
dr
ough
t res
ista
nce
and
avoi
danc
e, su
rviv
al
duri
ng d
roug
ht
++
-+
(Niin
emet
s 199
8,
Mar
kest
eijn
and
Po
orte
r 200
9, L
ebri
ja-
Trej
os e
t al.
2010
b)
30544 Lohbeck-bk.indd 19 27-10-14 16:42

Chapter 1
20
Dec
iduo
us-n
ess;
De
(bin
ary)
Dro
ught
avo
idan
ce, s
urvi
val d
urin
g dr
ough
t-
++
+(P
oort
er a
nd
Mar
kest
eijn
200
8,
Bohl
man
201
0, L
ebri
ja-
Trej
os e
t al.
2010
b)
Seed
vol
ume;
SV
(mm
3 )In
vest
men
t in
repr
oduc
tion,
ger
min
atio
n su
cces
s, n
umbe
r of s
eeds
, pho
tosy
nthe
tic
rate
s of s
eedl
ings
, dis
tanc
e of
dis
pers
al,
colo
niza
tion
chan
ce, l
onge
vity
in se
ed b
ank
--
++
+(F
oste
r and
Jans
on
1985
, Kita
jima
1992
, W
esto
by e
t al.
1996
, W
eihe
r et a
l. 19
99,
Mol
es a
nd W
esto
by
2004
)
Biot
ic d
ispe
rsal
; BD
(b
inar
y)D
ista
nce
of d
ispe
rsal
, col
oniz
atio
n ch
ance
++
+(H
amm
ond
and
Brow
n 19
95, C
hazd
on
et a
l. 20
03, J
anse
n et
al
. 200
8)
30544 Lohbeck-bk.indd 20 27-10-14 16:42

Introduction
21
1It should be noted that how a trait influences species success as a response
to a certain gradient in reality can be quite complex. This depends on which part of the resource gradient the study focuses, as species are known to thrive under a certain optimal set of resource conditions. Also, gradients that are of interest in observational studies can often be decomposed into different variables that underlie this gradient. Wet forest succession, for example, does not only represent a gradient of decreasing light (Montgomery and Chazdon 2002), at the same time one may expect a peak in soil water availability and increase in soil nutrients. Dry forest succession is less characterized by decreasing light, and instead the increasing water availability and decreasing temperatures are thought to drive species turnover (Lebrija-Trejos et al. 2011). Ultimately, the combined effect of these environmental gradients and pressures determines differential species performance along the successional gradient. Given that throughout the tropics the importance of secondary and degraded forests is increasing (FAO 2010), it is important to understand the environmental factors that underlie the successional gradient and how these influence species performance, across larger climatic (e.g. annual precipitation) and geomorphological gradients.
The number of tree species in the forest accumulates during secondary succession, usually showing asymptotic increases in species richness (e.g. van Breugel et al. 2006, Norden et al. 2009, Lebrija-Trejos et al. 2010a). Concurrent increases in the range, relative abundance, and divergence of functional strategies can be expected. The synchronicity in which taxonomic diversity, on the one hand, and functional trait diversity, on the other hand, recover during succession can reveal further assembly mechanisms. When functional diversity increases beyond taxonomic diversity, species become increasingly complementary in their resource uptake, which may indicate increased competitive pressures. When taxonomic diversity increases beyond functional diversity, functional redundancy may increasingly prevail in secondary forest communities. Functional redundancy occurs when the species are similar in their functional strategies and may thereby fulfil similar ecological niches. It has been proposed that functional redundancy is crucial for forest resilience since functional redundancy rather than functional diversity is what maintains or restores ecosystem functioning under changing environmental conditions or disturbance events (Walker et al. 1999, Díaz and Cabido 2001, Micheli and Halpern 2005). The changes in functional composition and diversity along succession strongly imply concurrent changes in ecosystem functioning.
30544 Lohbeck-bk.indd 21 27-10-14 16:42

Chapter 1
22
Recovery of ecosystem functions during successionDuring tropical forest succession, nutrients accumulate in the topsoil through
litter decomposition and soil biotic activity (Aweto 1981, Wadsworth et al. 1990) and in the vegetation through regrowth (Hughes et al. 1999, Feldpausch et al. 2004, Batterman et al. 2013). Succession increases the soil water holding capacity (Aweto 1981, Giambelluca 2002), improves soil structure (Martins et al. 1991) and reduces agricultural pest-populations like weeds, herbivores and pathogens (Ewel 1986, de Rouw 1995). These processes are crucial for the recovery of soil fertility and preparing the land again for a new cycle of slash and burn agriculture (Szott et al. 1999). Also, secondary forests accumulate carbon stocks over time (e.g. Becknell et al. 2012, Martin et al. 2013), the rates of which are crucial for the global carbon cycle and for climate regulation. Forests increasingly intercept rainfall during succession (Giambelluca 2002, Zimmermann et al. 2013), they are important elements in the landscape for protecting water sources (Kosoy et al. 2007), provide hydrological services both in situ and downstream (Klemick 2011) and may protect against flooding and erosion (Bruijnzeel 2004). Furthermore, secondary forests are often the only significant source of forest resources available to the rural poor (Smith et al. 2001, 2003) and provide important direct use-benefits to land-owners. For example, they provide wood for construction, firewood, fodder and shade for animals, and access to useful species, like medicinal, fibre and food species (Chambers and Leach 1989, Voeks 1996, Chazdon and Coe 1999, Smith et al. 2003, Junqueira et al. 2010).
Secondary forests and biodiversity conservationThough old-growth forest is of foremost importance for biodiversity
conservation (Gibson et al. 2011), the conservation value of secondary forests is large due to the vast areas of land covered by these ecosystems (Wright and Muller-Landau 2006b). In landscapes where the ratio of secondary forest to old-growth forest is low, secondary forests are critical to enhance connectivity and contribute to maintaining high diversity values in human modified landscapes (Barlow et al. 2007, Chazdon et al. 2009, Dent and Wright 2009). However, due to their short existence (short fallow cycles), the realized conservation value of secondary forests is often limited (Brooks et al. 2002, Gibson et al. 2011, van Breugel et al. 2013). During secondary succession, the forest increases in height and structural complexity, creating an increased number of niches for diversification of plant and animal species. So, if secondary forests are conserved for restoration purposes, there is
30544 Lohbeck-bk.indd 22 27-10-14 16:42

Introduction
23
1ample opportunity for habitat specialisation and they can become important safe havens for conserving species diversity (Lamb 2005, Melo et al. 2013). The role of secondary forests for conservation is controversial because contrasting studies have reported opposing results and recommendations. This controversy can partly be attributed to the strong differences in context of different studies; including biogeography, landscape configuration, climate and disturbance history (Melo et al. 2013). The conservation potential of secondary forests may fail when distance to old-growth forest is large, when secondary forests have a history of intense land-use or when species have become locally extinct (Chazdon 2014a). This context-dependence illustrates a large need to understand the local scale processes that take place during secondary succession, what they mean for biodiversity conservation and for the recovery of ecosystem functioning and how they can contribute to ‘biodiversity friendly tropical landscapes’ (Melo et al. 2013).
Objectives of this study
The aim of this study is to mechanistically link tropical forest succession with the recovery of ecosystem functioning after agricultural field abandonment using a functional trait-based approach. Specific objectives were formulated:
1) To determine successional changes in functional diversity, and to what extent these reflect patterns derived from traditional (taxonomic) diversity metrics
2) To determine successional changes in functional composition, and to what extent these reveal underlying changes in environmental conditions (such as light and water availability) that act as filters on species performance
3) To reveal fundamental constraints underlying species to adopt certain functional strategies
4) To unravel the relative importance of community assembly mechanisms (habitat filtering and limiting trait similarity) in shaping successional changes in the distribution of functional traits in the community
5) To assess which community functional properties (community-weighted mean and functional diversity) drive the recovery of different ecosystem functions (such as net primary productivity and decomposition) during succession
6) To evaluate the importance of biodiversity for maintaining multiple ecosystem functions at the landscape level
30544 Lohbeck-bk.indd 23 27-10-14 16:42

Chapter 1
24
To achieve these objectives, I made use of secondary forest data in two locations in Mexico. The core location is a moist forest region in the state of Chiapas; data from this location are used in all chapters. For comparison, in part of this thesis (chapters 3 and 4) I made additional use of data from a dry forest region in the state of Oaxaca (see Fig 1.3, and below for a more detailed description of both study regions). Both are species-rich tropical forest regions with similar land-use histories, but they differ markedly in their annual precipitation (wet: 3000 mm/yr, dry: 900 mm/yr). In total, for this thesis I made use of 32 secondary forest plots (wet:17, dry: 15) that differ in their fallow ages (wet: <1- 29, dry: 5- 63 yrs), 133 species (wet: 82, dry: 51) on which 17 functional traits were measured (Table 1.1), and a set of 10 ecosystem function indicators (biomass, carbon stocks, biomass productivity, litter productivity, litter nitrogen, litter phosphorous, litter decomposition in situ, litter decomposition ex situ, leaf decomposition, wood decomposition). Overall, I empirically tested the relevance of plant functional traits for successional species turnover (Fig 1.1 arrow 1) and for ecosystem function recovery (Fig 1.1 arrow 2; see also Table 1.1 and Fig 1.4).
Using empirical data from tropical forest under anthropogenic pressure I contribute to increase the understanding of global change effects on tropical ecosystems and their functioning. Given that secondary forests are of increasing importance worldwide, it is crucial to assess to what extent these forests can maintain high levels of biodiversity and critical ecosystem functions. Moreover, understanding the drivers behind the recovery of specific functions is necessary to enable optimization according to interests of actors. An example is enrichment planting to fasten the recovery of soil fertility in agricultural fallows, which may be desired by local farmers. Such social actor strategies are an important component in the landscape approach, where forests are considered as key elements of the wider socio-ecological system (e.g. Díaz et al. 2011).
Study sites description
Wet forest in Chiapas: This thesis makes use of data on tropical wet secondary forests surrounding the village (or ‘ejido’, see also Box 1.2) of Loma Bonita in the state of Chiapas, south-eastern Mexico (16°01’N, 90°55’W) (Fig 1.3). Tropical wet forest originally covered about 9.1% of Mexico’s land cover, and is presently reduced to 4.8%, of which 2/3 is secondary forest (Challenger and Soberón 2008).
30544 Lohbeck-bk.indd 24 27-10-14 16:42

Introduction
25
1The main drivers of deforestation in Mexico are those related to the partitioning of land with the purpose of converting forested areas to agricultural land-uses (Box 1.2) (de Jong et al. 2000). A mosaic of cropland, grazing lands, and secondary forests characterize the study landscape, where forests are more degraded along the established roads, rivers and around human settlements. Few small patches of old-growth forest remain and only in the protected areas large, continuous stretches can be found (de Jong et al. 2000, Hernandez-Ruedas et al. 2014), like the protected area Montes Azules Biosphere Reserve adjacent to the study landscape (Fig 1.3). Mean annual temperature is 24°C and mean annual precipitation is 3000 mm, with a dry period (<100 mm month-1) from February through April (van Breugel et al. 2006, 2007, Martínez-Ramos et al. 2009). The research area is characterized by small hills and valleys with sandy and clay soils of low pH (<5.5). Permanent sampling plots were established in the year 2000 and are located on abandoned maize fields (van Breugel 2007). Currently there are 15 secondary forest plots (1000 m2 each) with different fallow ages (<1 - 30 yr). The number of plots has changed over the study period, as fire has destroyed some plots and new plots were established. Plots have been monitored annually during which the diameter at breast height (DBH), height and taxonomic identity of each stem is recorded. Each plot is divided into two 10 x 50 m subplots where in one subplot all individuals with DBH ≥ 1cm were identified and measured, and in the second all individuals DBH ≥5cm.
Dry forest in Oaxaca: In chapter 3 and 4, I made additional use of data from a tropical dry forest chronosequence. Tropical dry forest originally covered about 17.1% of Mexico’s landcover, and is presently reduced to 11.3%, of which roughly 2/3 is secondary forest (Challenger and Soberón 2008). Dry forest research plots were established close to the village of Nizanda on the Pacific slope of the Tehuantepec Isthmus in Oaxaca, southern Mexico (16°39’N, 95°00’W). Mean annual temperature is 26 °C and mean annual precipitation is 900 mm of which over a 90% is concentrated between late May and mid-October (Lebrija-Trejos et al. 2008). The vegetation is predominantly tropical dry deciduous forest, characterized by a low canopy stature (ca. 7 m tall) with a high biodiversity (Pérez-García et al. 2001, 2010). Permanent sampling plots were established in 2003 and are located on abandoned maize fields (Lebrija-Trejos 2009). In this study I made use of 15 of those plots (400 m2 each) that have different fallow ages (5-63 yrs). Within each plot four parallel 5 x 20 m transects were established, further divided
30544 Lohbeck-bk.indd 25 27-10-14 16:42

Chapter 1
26
into four 5 x 5 m sub-quadrats. In one sub-quadrat all individuals with DBH ≥ 1 cm were identified and measured, in a second all individuals with DBH ≥ 2.5 cm, and in the remaining two all individuals with DBH ≥ 5 cm.
Figure 1.3: Image of Mexico indicating the core study location in the state of Chiapas (the wet forest area) in the white circle, and the additional study location in the state of Oaxaca (the dry forest area) in the white broken circle. The satellite image shows the wet forest study region in Chiapas. Small white circles are the locations of the 15 secondary forest plots surrounding the village of Loma Bonita in Marques de Comillas. The continuous forest area north of the river Lacantún represents the Montes Azules Biosphere Reserve. The yellow line is the border with Guatemala.
Thesis outline
This thesis consists of 8 chapters: the introduction (chapter 1), six research chapters (chapter 2-7) and the synthesis (chapter 8). In chapters 2-5, I show how different functional aspects of the secondary forest communities change with succession, thus how tropical forest responds to agricultural expansion as a global change driver (arrow 1, Fig 1.1). In chapters 6 and 7, I evaluate what these changes mean for ecosystem functioning (arrow 2, Fig 1.1, see also Fig 1.4). In the last chapter I synthesize the results of this thesis, discuss how they complement existing knowledge on secondary succession, and place the secondary forests studied in the socio-economic reality of the study region.
30544 Lohbeck-bk.indd 26 27-10-14 16:42

Introduction
27
1Functional diversity is often proposed as one of the key functional properties
of biodiversity that gives insight into ecosystem responses to global change, and into community effects on ecosystem functioning (e.g. Tilman 2001b, Micheli and Halpern 2005). However, little is known on how functional diversity responds to environmental gradients such as succession in high diverse tropical forest. In Chapter 2, I tested how functional diversity changes with wet forest succession and assess how sensitive functional diversity is to changes in taxonomic diversity, while including differing (numbers of) functional traits. This is relevant as the simple taxonomic metric ‘species richness’ is most commonly used when linking biodiversity with ecosystem function but to what extent it reflects the (possibly) more useful functional diversity metrics is hardly known.
Functional composition, or community-weighted mean (CWM), describes the functional traits of the species that are most abundant and reflects the main habitat filter that shapes species dominance. It is thereby expected to change along environmental gradients (Grime 1998, Garnier et al. 2004). In Chapter 3, I tested how functional composition changes with succession for the wet forest chronosequence in Chiapas and the dry forest chronosequence in Oaxaca. It was expected that functional composition changes differently as wet forest succession is mainly driven by decreasing light whereas dry forest succession by increasing water availability.
Fundamental trade-offs in resource economics constrain a plant’s possibility to respond to different environmental gradients (e.g. Wright et al. 2007). In Chapter 4, I assessed the different functional strategies exhibited by wet and dry forest species and how similar these are. Subsequently, I tested how the main strategy-axes determine functional adaptation along the successional gradient. This reveals which is the predominant habitat filter that determines species turnover along the successional gradient in forest types of contrasting precipitation levels.
There is increasing evidence that the functional characteristics of the dominant species, rather than the diversity per se, determine the functioning of an ecosystem (Grime 1998, Smith and Knapp 2003, Dangles and Malmqvist 2004). In Chapter 5, I asked which are the dominant species along the wet forest chronosequence and what subset of the species that are present do they represent. Whether dominant species represent a functionally narrow or wide subset can reveal the mechanisms of specialisation that underlie dominance. Light is a
30544 Lohbeck-bk.indd 27 27-10-14 16:42

Chapter 1
28
major factor limiting growth in tropical wet forest and by using a trait-based approach I unravel how light limitation shaped patterns of species dominance during early wet forest succession.
Biodiversity is celebrated as a major driver of ecosystem functioning (MA 2005), but empirical evidence from observational studies in high-diverse forest ecosystems are scarce (but see Conti and Díaz 2013, Bu et al. 2014, Ruiz-Benito et al. 2014). In Chapter 6, I used structural equation modelling to evaluate the relative importance of different functional properties (including biodiversity) of the secondary forest communities as drivers of changes in ecosystem functions during succession. Using the ecosystem processes biomass productivity, litter productivity, actual decomposition and potential decomposition I quantified some of the most important fluxes of carbon and nutrients that take place in forest ecosystems. I assessed three alternative drivers of ecosystem functioning: biomass (vegetation quantity hypothesis), community-weighted trait mean (mass ratio hypothesis) and functional diversity (niche complementarity hypothesis). Doing so, I evaluated whether it is (functional) biodiversity that drives ecosystem function or instead the traits of the dominant species or perhaps the amount of vegetation regardless of diversity and functional traits.
Recent evidence indicates that biodiversity may not be very important for a single ecosystem function, but it becomes increasingly important when multiple ecosystem functions are considered due to the fact that different species are needed to maintain different functions (e.g. Hector and Bagchi 2007, Isbell et al. 2011, Gamfeldt et al. 2013). In chapter 7, I took a landscape perspective and tested whether indeed different species matter for different ecosystem functions (biomass, productivity, litter production, wood decomposition and litter decomposition). The alternative is that the same, dominant, species matter for different functions. Using simulations I was able to tease apart the relative importance of species richness, species dominance and species functional traits for multiple ecosystem functions.
Finally, in chapter 8, I discussed how the results of this thesis contribute to current knowledge on secondary succession and to the rapidly growing scientific discipline of biodiversity and ecosystem functioning. Also, I placed the findings of this study in the socio-economic reality that is found in the village of Loma Bonita, stressing the need for evaluating the role of forest using a landscape approach. I conclude with some general prospects on the role of forests in future human-modified landscapes in the study area in Chiapas, Mexico. For a schematic overview of the contents of the thesis how and the different chapters
30544 Lohbeck-bk.indd 28 27-10-14 16:42

Introduction
29
1come together see Fig 1.4.
Bio$c interac$ons
Ecosystem func$oning
Succession
Community func$onal trait proper$es
CWM FD
5 2
6 7
3 4
Landscape context & regional species pool
Habitat filters
Niche complemen-‐
tarity Mass ra$o
Figure 1.4: Conceptual framework representing the causes and consequences of changes in community functional properties during secondary succession. Blue boxes represent changing community properties whereas red circles represent the mechanisms by which change takes place. The green circle is the successional context that changes the community functional properties through affecting community assembly mechanisms (habitat filtering and competitively driven limiting similarity), and, with that, ecosystem functioning. The process of succession is embedded in the landscape context (including its biophysical and socio-economic aspects) and regional species pool. The square coloured frames represent the focus of the different chapters, indicated by the numbers given in the corner of each of the frames: chapter 2 focuses on changing functional diversity (FD) with succession, chapter 3 and 4 on changing community-weighted functional trait mean (CWM) with succession and how these reflect the habitat filters, chapter 5 focuses on the relative importance of habitat filtering versus competitively driven limiting trait similarity on species dominance, and chapter 6 and 7 focus on the relative importance of different community functional properties for multiple ecosystem functions.
30544 Lohbeck-bk.indd 29 27-10-14 16:42

Chapter 1
30
Box 1.2: History of human inhabitation of the Lacandon forest
The Lacandon forest (‘La Selva Lacandona’) is an area of more than 1 500 000 ha and encompasses the Zona Lacandona (since 1972), the Montes Azules Biosphere Reserve (since 1978) and Marqués de Comillas. Inhabitation of the Lacandon region by the original inhabitants, the Maya people, goes very far back in time; human remains have been found that date from 2500 years back. In de classic period (600 – 800 AD), the region was especially densely populated, numerous Maya temples and monumental altars from this period remain as proof. In the 9th century, the Maya population in this region experienced a collapse, causing them to dramatically decrease in number, similar to what happened in other regions inhabited by the Maya. Today, the original Lacandon Maya people no longer exist, though the exact cause of their extinction in the 18th century remains unclear. There are indications of a collective suicide to avoid falling into the hands of the Spanish conquistadores, combined with the effect of colonialist germs that spread through the area, and extirpation by colonialist (de Vos 1988). During the colonization by the Spanish conquistadores, the area was also inhabited by Mayan-Caribbean families that fled violent uprisals among Mayan groups in the Yucatan peninsula in the 18th century. These people are now known as the ‘Lacandon people’, although they are not the original inhabitants (de Vos 1988).
From the 1850s, the Lacandon forest became well known for the valuable wood it contained. Concessions were sold to companies from the neighbouring state of Tabasco as well as international companies (de Vos 1996). What followed was a period of extraction of mahogany (Swietenia macrophyla King) and ceder (Cedrela odorata L.), though the impacts on the forest were limited to the proximity of the rivers and virtually no permanent settlements developed. Colonization of the Lacandon forest by immigrants started in the 1950s under a government programme of agricultural reform. In response to revolts by landless farmers that demanded property, the government decided to open national properties that until then had no official destination. The immigration started in the north of the Lacandon forest and the first colonisers were indigenous groups that worked as labourers on coffee estates in the highlands of Chiapas. Especially the first waves of colonisation, where farmers, pastoralists and loggers united to colonize new areas of tropical forests, have been described as ‘spontaneous, unorganized and very destructive’ (O’Brien
30544 Lohbeck-bk.indd 30 27-10-14 16:42

Introduction
31
11995, de Vos 2003). From 1967, the government tried to control the colonization of the region by declaring the ‘Zona Lacandona’ a region under the sole custody of a group of Maya-Caribbean settlers that lived deep in the forest, by declaring the Montes Azules Biosphere reserve a few years later and declaring large tracts of land as national territory and creating ‘ejidos’ on it (ejido is a term used for the productive grouping of people with land in common usufruct; de Jong et al. 1995).
Marqués de Comillas was destined for immigrants organized in ejidos and was colonized from the 1970s onward. Immigration and associated deforestation in Marqués de Comillas was driven by oil exploration, pressure on land in other regions and a conscious program of settling Mexican farmers along sensitive border areas to guarantee national sovereignty (O’Brien 1998). Deforestation in the region also significantly increased by settlement of central American refugees in the 1980s, by the construction of the road in the year 1995, and government subsidies for agricultural production (de Jong et al. 2000, Klepeis and Vance 2003). Loma Bonita is one of those ejidos inside Marques de Comillas, consisting of mainly non-indigenous farmers, the ejido has currently about 230 inhabitants (G. Jamangape pers. comm). The main source of income is from dairy production. Also (shifting) cultivation for maize (as well as other crops) is practiced, but mainly for subsistence (Fig 1.2).
30544 Lohbeck-bk.indd 31 27-10-14 16:42

30544 Lohbeck-bk.indd 32 27-10-14 16:42

Functional diversity changes during tropical forest succession
Madelon Lohbeck, Lourens Poorter, Horacio Paz, Laura Pla Michiel van Breugel, Miguel Martínez-Ramos, Frans Bongers
Published in Perspectives in Plant Ecology, Evolution and Systematics (2012) 14(2): 89-96
30544 Lohbeck-bk.indd 33 27-10-14 16:42

Chapter 2
34
Abstract
Functional diversity (FD) ‘those components of biodiversity that influence how an ecosystem operates or functions’ is a promising tool to assess the effect of biodiversity loss on ecosystem functioning. FD has received ample theoretical attention, but empirical studies are limited. We evaluate changes in species richness and FD during tropical secondary forest succession after shifting cultivation in Mexico. We also test whether species richness is a good predictor of FD. FD was calculated based on a combination of nine functional traits, and based on two individual traits important for primary production (specific leaf area) and carbon sequestration (wood density). Stand basal area was a good predictor of successional changes in diversity and FD, in contrast to fallow age. Incidence-based FD indices increased logarithmically with stand basal area, but FD weighted by species’ importance values lacked pattern with succession. Species richness and diversity are strong predictors of FD when all traits were considered; linear relationships indicate that all species are equally functionally complementary, suggesting there is little functional redundancy. In contrast, when FD was calculated for individual traits and weighted for abundances, species richness may underestimate FD.
Selection of functional trait(s) critically determines FD, with large consequences for studies relating biodiversity to ecosystem functioning. Careful consideration of the traits required to capture the ecosystem process of interest is thus essential.
Keywords: Chiapas; Chronosequence; Mexico; Functional redundancy, Secondary forests; Species diversity, Specific leaf area, Wood density.
30544 Lohbeck-bk.indd 34 27-10-14 16:42

Functional diversity and succession
35
2
Introduction
Functional traits are important for the response of species to their environment, and for the effects that species have on ecosystem processes (e.g. Lavorel and Garnier 2002, McGill et al. 2006, Cornwell et al. 2008, Lavorel et al. 2010). Functional diversity has been defined as the value, range, and distribution of functional traits in a given ecosystem (Díaz et al. 2007a) or as those components of biodiversity that influence how an ecosystem operates or functions (Tilman 2001b). Many researchers recognize that functional diversity is more important to local scale ecosystem functioning than taxonomic diversity (Grime 1998, Tilman 2001b, Micheli and Halpern 2005), because functional diversity may be a good indicator of ecosystem resource dynamics, stability and productivity (Tilman 2000, Díaz and Cabido 2001, Cardinale et al. 2006, Díaz et al. 2007b).
Two main index types have been proposed for measuring functional diversity, those based on species incidence (presence/absence) and those based on species abundance. Incidence-based indices, which are comparable to functional richness measures (e.g. Walker et al. 1999, Petchey and Gaston 2002b), emphasize the full range of functional strategies present in the community, proposing that both dominant and rare species contribute equally to functional diversity. The rationale underlying this idea is that each species may strongly influence ecosystem functioning and that rare species are especially important contributors to long-term ecosystem resilience (Walker et al. 1999, Hooper et al. 2005). In contrast, indices based on species abundance emphasize the role of dominant species (e.g. Mason et al. 2003, Mouillot et al. 2005) in a similar way as the biomass-ratio hypothesis (Grime 1998), which also states that dominant species have a greater effect on ecosystem functioning than rare species. Processes that are mostly influenced by the trait values of dominant species are, for example, specific primary productivity and decomposition (Garnier et al. 2004, Cornwell et al. 2008). Thus, the type of index useful in a particular study depends on the ecosystem process of interest (Díaz et al. 2007b).
Functional diversity has received ample theoretical attention (e.g. Díaz and Cabido 2001, Tilman 2001b, Ackerly and Cornwell 2007, Díaz et al. 2007a, Díaz et al. 2007b, Hillebrand and Matthiessen 2009, Petchey et al. 2010), and has become the central paradigm of the Millennium Ecosystem Assessment (MA 2005). Still there is surprisingly little empirical data showing how functional diversity varies across environmental and successional gradients in forests, despite their
30544 Lohbeck-bk.indd 35 27-10-14 16:42

Chapter 2
36
importance for maintaining ecosystem functioning (Scherer-Lorenzen et al. 2005, but see; Scherer-Lorenzen et al. 2007b, Baraloto et al. 2010a, Paquette and Messier 2011). Here we apply the concept of functional diversity to secondary tropical forest succession.
The changes in forest structure and species composition along succession strongly imply concurrent changes in both functional diversity and ecosystem functioning. Tree communities of tropical agricultural lands are poorer than those of old-growth forests in both species and functional diversity (Mayfield et al. 2005), and species richness increases asymptotically during secondary succession (e.g. van Breugel et al. 2006, Norden et al. 2009, Lebrija-Trejos et al. 2010a), but how functional diversity changes with secondary succession is largely unknown. Understanding this phenomenon is of paramount importance for managing ecosystem processes in secondary forests, especially tropical landscapes subjected to shifting cultivation and abandoned land practices (MA 2005).
The relation between functional diversity and species diversity (FD-SD) can be used to explore to what extent functional trait values are complementary among species (Petchey and Gaston 2002b, Laliberté et al. 2010), i.e. to what extent does functional redundancy among species exist. Overall, functional diversity is expected to scale positively to species diversity because each new species added to the ecosystem will not only contribute to species diversity but will also contribute to functional diversity, assuming that the suite of functional trait values possessed by each new species is not present yet in the community. In case of a linear FD-SD relationship, species richness is a good proxy for functional diversity. Detailed and time consuming measurements of functional traits then are unnecessary. Such linear relations are not commonly found in nature (Díaz and Cabido 2001), however, rather partial complementarity (logarithmic) or non-complementarity (no relation) is predominant (Schmid et al. 2002). A logarithmic FD-SD relationship indicates functional redundancy since new species added to the community sometimes have functional attributes that are already represented by other species. Species diversity and functional diversity may also be uncoupled, as species diversity is hypothesized to be limited by the regional species pool whereas functional diversity is hypothesized to be limited by the local availability of niches (Schmid et al. 2002).
The FD-SD relationship is influenced by the ‘effective dimensionality of trait space’ (Petchey and Gaston 2002b). ´Effective’ dimensionality equals the number of functional traits that are orthogonal, or the number of ways in which
30544 Lohbeck-bk.indd 36 27-10-14 16:42

Functional diversity and succession
37
2
species can be complementary. A higher dimensionality allows more species to be functionally equally similar (or dissimilar) resulting in a linear FD-SD relationship. The addition of any one species thus increases functional diversity in the same way as adding any other species to the community. The effective dimensionality of trait space increases with the number of independent traits and decreases when species abundances are included because weighting species differently focuses on the dominant species (Petchey and Gaston 2002b).
This study provides the first assessment of the FD-SD relationship for tree communities in a tropical forest successional system (see Bihn et al. 2010 for similar work on ant communities). We use 11 forest plots that vary in fallow age from 3.3 to 24.6 years of regeneration after shifting cultivation in Southeast Mexico, this early successional stage is where most of the changes in diversity are expected to take place (van Breugel et al. 2006). For the most important species in each plot (making up 92% of the importance value on average) we have analysed nine functional traits that are important for plant performance and ecosystem processes (Appendix 2). Functional diversity is calculated for all nine traits combined as an indicator of the overall plant strategy, as well as for specific leaf area (SLA) and wood density (WD) separately. SLA and WD have been chosen because they are among the most important and commonly studied traits and are of paramount importance for different ecosystem processes (Lavorel and Garnier 2002, Chave et al. 2009). SLA affects primary production, carbon and nutrient cycling and litter decomposition (Poorter et al. 2009) whereas WD is a key trait for biogeochemical ecosystem processes such as carbon sequestration, forest stratification and turnover rates (Chave et al. 2009).
We address the questions (1) how do functional and species diversity change during secondary tropical forest succession? and (2) is species diversity a good proxy for functional diversity in successional tree communities? Because evidence exists that species diversity increases asymptotically during secondary succession, we hypothesized that functional diversity will show a similar trend. We further hypothesized that functional diversity based on individual traits (e.g. SLA or WD) will have a saturating relationship with species richness, as the trait values of additional species are likely to be present in the community. Functional diversity based on all nine traits combined, however, will be linearly related to species diversity because the effective dimensionality of trait space increases with the number of traits included (cf. Petchey and Gaston 2002b).
30544 Lohbeck-bk.indd 37 27-10-14 16:42

Chapter 2
38
Methods
Research site and species selectionResearch plots were located in the Marqués de Comillas region in southeast
Mexico (16°01’N, 90°55’W). The climate is warm-humid with an average annual temperature of 24°C and an annual rainfall of 3000 mm, with a dry period (less than 100 mm per month) from February through April (van Breugel et al. 2006). The 11 permanent study plots are located around the village of Loma Bonita, and upon site selection great care was taken to obtain as much environmental homogeneity as possible with regard to soil, topography and management history (van Breugel et al. 2006). Sites are established on abandoned cornfields, having experienced mostly one cycle of cultivation (Chazdon et al. 2007). They are located within the rather uniform low hill geomorphological unit, characterized by small hills and valleys with sandy or limestone soils of low pH (<5.5), which is one out of the four geo-morphological units identified in the area (Siebe et al. 1996). The landscape matrix is dynamic and under high anthropogenic pressure, currently 65% of the land area around Loma Bonita is used for agricultural practices (mostly livestock pasture), 14% is mature forest and 21% consist of secondary forests of different ages (I. Zermeño-Hernández unpublished results). The secondary forest plots (10 x 50 m) had fallow ages between 3.3 and 24.6 years, all trees with a diameter at breast height (DBH) ≥ 1cm were identified and their diameter was measured. For each plot those species were selected that made up at least 80% of the importance value (mean 92 ± 5.7% ) (see below for calculation of the importance value index) in that plot, as these determine most of the key ecosystem processes (Garnier et al. 2004, Pakeman and Quested 2007). On average 32 species per plot were selected (range 9 to 47), being 79 species in total.
Functional traitsFor each species, nine functional traits that are important for the carbon-,
water- and nutrient-balance of plants were measured (Appendix 2). Leaf traits were measured on two sun-lit leaves per individual, on small adult trees of ca. 5 meters high, having 10 replicate individuals per species. The specific force to punch and wood density were measured for 5 individuals per species. Traits were measured following standardized protocols given by Cornelissen et al. (2003). For analyses mean trait values were used per species, although we acknowledge that species per plot trait values could have improved the accuracy (Baraloto et al. 2010c).
30544 Lohbeck-bk.indd 38 27-10-14 16:42

Functional diversity and succession
39
2
Leaves were dark-adapted for 1 hour after which the Instantaneous Chlorophyll Fluorescence (F0) was measured with a fluorpen (Photon Systems Instruments, FP100) on exposure to 445 nm light at a saturating intensity of 3000uE. The quantum yield (Fv / Fm) was measured as the ratio between variable fluorescence and maximum fluorescence. This ratio reflects the proportion of light used in photochemistry or emitted as heat.
After collection the leaves were placed in water to rehydrate for at least five hours and fresh weight was determined. Leaf petiole length (cm) was measured with a digital caliper or a tape-measure and leaf thickness (mm) was determined with a digital caliper in the middle of the leaf avoiding the main and secondary veins (0.01 mm accurate). Leaves (excluding petiole) were photographed on a light box and leaf area (cm2) was calculated using pixel counting software ImageJ (Rasband 2008). Leaves were subsequently oven-dried for 48 h at 70°C and weighed. Specific Leaf Area (SLA, m2 kg-1) was calculated as the fresh leaf area divided by the oven-dried mass (excluding petiole). Leaf Dry Matter Content (g g-1) was calculated as the oven-dry weight divided by the fresh weight. In case of compound leaves the smallest photosynthetic unit was taken.
Fresh leaf laminas were punched with a penetrometer built with a flat-end nail attached to the inner part of a syringe and a waterbasin on top. Water was added to the basin until the leaf ruptured. The total weight added was converted into Mega Newton. The specific force to Punch (MN m-2) was calculated as the force divided over the breaking surface of the hole (circumference of the nail x
thickness of the leaf). This alternative punching method is comparable to cutting and tearing tests and is a good indicator of leaf mechanical resistance (Onoda et al. 2011).
Species specific wood density was based on wood cores or stem slices. With an increment borer (12” mm Suunto, Finland) a core of wood was extracted from the outer bark up to at least the heart of the tree (firmly attached bark or phloem tissue was considered part of the stem). For some species the stems did not reach sufficient size for this method and for these a slice of the stem was extracted. The wood cores were divided in three parts (across the pith, heartwood and sapwood) and the wood density was measured for these parts separately by dividing the dry weight (70°C, 48 h) over the fresh volume. The fresh volume was determined with the water displacement method. Wood densities of these three parts were averaged, to obtain the species’ specific wood density (WD, g cm-3). This measurement was taken for 32 of the 79 species studied: data on WD for
30544 Lohbeck-bk.indd 39 27-10-14 16:42

Chapter 2
40
remaining species were taken from comparable studies by the authors (unpub. data) in Mexican wet forests in the same location around Loma Bonita (Chiapas), Las Margaritas (Puebla) and Los Tuxlas (Veracruz).
Calculating species diversity and functional diversitySpecies diversity and functional diversity indices were calculated based on
incidence and weighted by species dominance (Table 2.1). An importance value index was used as an indicator of species dominance, and was calculated as: (BAi/BAtotal + Di/Dtotal)/ 2, where BAi is the basal area of the ith species and, Di is the stem density of the ith species and total reflects the total basal area or stem density in the plot. Weighting with the importance value was chosen because we assume that if ecosystem processes are mainly determined by dominant species, this may be expressed by species with large numbers of individuals, just as by species with few individuals but large biomasses.
All diversity indices were based on the cumulative number of species in a site that account for at least 80% (mean 92% ± 5.7) of the importance value in the plot (DBH > 1 cm). Species richness was used as incidence-based species diversity measure, whereas Shannon Wiener index includes species’ importance values (Table 2.1). Species richness and Shannon Wiener were based on the same selection as the functional diversity indices, rather than on the total number of species in a plot. This makes species and functional diversity best comparable, as these are limited to including those species for which functional trait data was available. This species richness however tightly correlates to the total plot species richness (Pearson correlation 0.98).
Two measures of functional diversity were calculated, one based on the functional traits of species present in the plots (incidence-based functional diversity) and the other based on the traits weighted by the importance value of the species (Table 2.1). Functional diversity was calculated using the fDiversity software program based on Euclidean distance and average linkage (Casanoves et al. 2008, Casanoves et al. 2011) after the traits have been standardized to ensure equal contribution of each trait. Standardization was calculated as: Zi = (xi – xmean)/sd, where Zi is the standardized trait value for a speciesi, xi is the trait value for speciesi, xmean is the mean value of a trait across all species and sd is the standard deviation of the variation in trait values across all 79 species studied.
We used the ‘multiplicative extended functional diversity’ (Casanoves et al. 2008, Casanoves et al. 2011) based on a dendrogram-based measure proposed
30544 Lohbeck-bk.indd 40 27-10-14 16:42

Functional diversity and succession
41
2
by Petchey and Gaston (2006) and modified by Pla and coworkers (2008) to be able to include species relative abundances. Weighting by abundances is done by loading the species dissimilarity matrix with the species importance values and subsequently the multiplicative extended weighted functional diversity is computed as the total branch length of the functional dendrogram of the community multiplied by the squared species number. This dendrogram based functional diversity calculation is suggested to have a great power to explain variation in ecosystem functioning (Petchey and Gaston 2007). We used weighted functional diversity (wFD), including species relative importance values in every site and incidence based functional diversity (FD) where the importance values in the input file are set to 1, ensuring equal contribution of every species. In the literature three primary functional diversity components have been proposed; functional richness, evenness and divergence (Mason et al. 2005). Incidence-based functional diversity (FD) is best comparable to functional richness (Mouchet et al. 2010, Schleuter et al. 2010). When weighted for the importance value, more emphasis is placed on dominant species and wFD becomes higher when abundant species are functionally far apart on the dendrogram, thereby we argue that wFD is best comparable to functional divergence (Villéger et al. 2008). Functional diversity (weighted and incidence-based) was calculated for all 9 traits together and for two key traits (SLA and WD) separately.
Table 2.1: The diversity indices used to describe the secondary forest communities
Diversity index; abbreviation Method of calculation References
Species number; SD Total number of species sampled in the site, making up at least 80% of the importance value
Shannon Wiener diversity, weighted by species importance values; wSD
pi = importance value of species iS= total number of species Calculated in fDiversity
(Shannon and Weaver 1949, Casanoves et al. 2008)
Functional diversity based on incidence (presence/ absence); FD
Distance matrix among species based on trait values. FD= total branch length of the functional dendrogram x S2
S= total number of species Calculated in fDiversity
(Petchey and Gaston 2006, Casanoves et al. 2008, Casanoves et al. 2011)
Functional diversity weighted by species importance values; wFD
Distance matrix among species based on trait values, matrix loaded by importance values. wFD= total branch length of the functional dendrogram x S2
S= total number of species Calculated in fDiversity
(Petchey and Gaston 2006, Casanoves et al. 2008, Casanoves et al. 2011)
30544 Lohbeck-bk.indd 41 27-10-14 16:42

Chapter 2
42
Statistical analysisRegression analysis and Pearson correlations were used to evaluate how
species diversity and functional diversity change during secondary succession. Diversity was not only related to time since abandonment, but also to stand basal area. Stand basal area increases asymptotically with fallow age in the chronosequence used and is a good structural variable of succession (van Breugel et al. 2006). To evaluate how species and functional diversity change during succession, linear and logarithmic models were used; to evaluate relationships between functional diversity and species diversity (FD-SD relationship), linear, logarithmic and exponential regression models were used.
The best fitting model was selected based on the highest R2. We considered 5% the minimum difference needed for being significant, and in case of insignificant difference we chose the linear (most parsimonious) model. All statistical analyses were carried out using IBM SPSS statistics 19.0 (SPSS Inc. Chicago).
Results
None of the taxonomic or functional diversity measures were significantly related to the fallow age (Table 2.2). In contrast, three of the incidence-based diversity measures increased logarithmically with stand basal area (Fig 2.1), species richness, incidence-based functional diversity of all traits, and incidence-based functional diversity of wood density. The weighted diversity measures (Shannon Wiener, weighted functional diversity of all traits, SLA and WD) did not vary significantly with stand basal area, although weighted functional diversity of all traits was close (p= 0.066) (Table 2.2).
We examined the ability to use species diversity as a proxy for functional diversity by analyzing the shape of the relation of functional diversity plotted against species diversity. Most combinations showed significant relations indicating that functional diversity indeed is predictable. Incidence-based functional diversity of all traits combined (FDALL) was linearly related to species richness (Fig 2.2a), as was incidence-based functional diversity in WD (FDWD) (Fig 2.2c), but FDSLA was unrelated to species richness (Fig 2.2b).
Weighted functional diversity of all traits combined (wFDALL) was linearly related to species richness (Fig 2.2d), while SLA (wFDSLA) and WD (wFDWD) were exponentially related to species richness (Fig 2.2e,f). Weighted functional
30544 Lohbeck-bk.indd 42 27-10-14 16:42

Functional diversity and succession
43
2
diversity was also well predicted by weighted species diversity (Shannon Wiener index): linear relationships are found for all traits combined (wFDALL), for SLA (wFDSLA) and for WD (wFDWD) (Fig 2.2g-i).
Table 2.2: Diversity changes along a successional gradient (time after abandonment and stand basal area). Diversity indices include: Incidence-based species diversity or species richness (SD), species diversity weighted by species importance (wSD), incidence-based functional diversity (FD), and functional diversity weighted by importance (wFD). Functional diversity is based on all nine traits (FDALL) or based on a single trait (FDSLA, FDWD). Pearson correlation (R) coefficient and the significance levels (p) are shown. Significant correlations in bold (N=11)
Diversity Time after abandonment Basal area
R p R p
SD 0.36 0.279 0.66 0.028
wSD -0.00 0.990 0.19 0.570
FDALL 0.40 0.219 0.68 0.022
FDSLA -0.12 0.720 -0.24 0.473
FDWD 0.34 0.302 0.67 0.023
wFDALL 0.10 0.770 0.57 0.066
wFDSLA 0.39 0.238 0.39 0.238
wFDWD 0.04 0.914 0.49 0.130
�
�
�
�
�
�
�
�
�
��
0 10 20 30 40 500
10
20
30
40
50
Stand basal area (m2 ha)
SD
a
r²= 0.55, p= 0.009
�
�
� �
�
�
�
�
�
�
�
0 10 20 30 40 500
20
40
60
80
100
120
Stand basal area (m2 ha)
FD(a
ll)
b
r²= 0.54, p= 0.010
�
�
��
�
�
�
�
� �
�
0 10 20 30 40 500
2
4
6
8
10
12
Stand basal area (m2 ha)
FD(W
D)
c
r²= 0.65, p= 0.003
Figure 2.1: Species and functional diversity changes during secondary forest succession at Marqués de Comillas, Southeastern Mexico. Stand basal area is used to reflect vegetation changes along a successional gradient. a. Species richness (SD) as a logarithmic function of stand basal area; b. Incidence-based functional diversity (FD) including all 9 traits as a logarithmic function of stand basal area; c. Incidence-based functional diversity in wood density (FDWD) as a logarithmic function of stand basal area.
30544 Lohbeck-bk.indd 43 27-10-14 16:42

Chapter 2
44
�
�
��
�
�
�
�
�
�
�
0 10 20 30 40 500
20
40
60
80
100
120
SD
FD(a
ll)a
r²= 0.99, p< 0.001
� ��
��
�
��
�
�
�
0 10 20 30 40 500
5
10
15
20
SD
FD(S
LA)
b�
�
��
�
�
�
�
��
�
0 10 20 30 40 500
2
4
6
8
10
12
SD
FD(W
D)
c
r²= 0.85, p< 0.001
�
�
�
��
�
��
�
�
�
0 10 20 30 40 500
20
40
60
80
100
120
SD
wFD
(all)
d
r²= 0.90, p< 0.001
� �
�
�
��
�
�
�
�
�
0 10 20 30 40 500
5
10
15
20
25
30
SD
wFD
(SLA
)e
r²= 0.72, p= 0.001
�
�
���
�
�
�
�
�
�
0 10 20 30 40 500
10
20
30
40
SD
wFD
(WD
)
f
r²= 0.72, p= 0.001
�
�
�
��
�
��
�
�
�
0 1 2 3 40
20
40
60
80
100
120
wSD
wFD
(all)
g
r²= 0.75, p= 0.001
� �
�
�
��
�
�
�
�
�
0 1 2 3 40
5
10
15
20
25
30
wSD
wFD
(SLA
)
h
r²= 0.48, p= 0.017
�
�
�� �
�
�
�
�
�
�
0 1 2 3 40
10
20
30
40
wSD
wFD
(WD
)i
r²= 0.47, p= 0.020
Figure 2.2: Functional diversity as a function of species diversity indices in secondary forests in Southeastern Mexico. Left, middle and right columns illustrate functional diversity measures based on all traits, SLA and wood density respectively. Upper row illustrates the relations between species richness (SD) and incidence-based functional diversity (FD), middle row shows the relations between species richness (SD) and weighted functional diversity (wFD) and the lower row illustrates weighted functional diversity (wFD) as a function of weighted species diversity (wSD). The best fitting curves (tested for linear, logarithmic and exponential) are depicted in the figures with the r2 and significance levels.
30544 Lohbeck-bk.indd 44 27-10-14 16:42

Functional diversity and succession
45
2
Discussion
In this study we asked how functional and species diversity change during secondary tropical forest succession, and if functional diversity was predictable by species diversity, basal area or forest age. We found incidence-based species and functional diversity to increase with stand basal area, but not with successional age. We showed that species richness and species diversity are good predictors of functional diversity (weighted by abundance or based on species incidence) when all traits are included. When only a single trait is considered in the measurement of functional diversity, however, species richness underestimated the weighted functional diversity in a site. Here we discuss these results in the light of functional diversity theory.
Do species and functional diversity increase predictably during succession?We predicted that functional and species diversity would increase during
early secondary succession. Despite the sharp successional gradient considered, we found no relation with time after abandonment, but basal area clearly predicted some diversity measures (Table 2.2). Basal area reflects not only time since abandonment, but also land use history and within-plot environmental heterogeneity and may therefore be a better descriptor of diversity changes during succession than fallow age per se (van Breugel et al. 2006, Chazdon et al. 2007). Stand basal area is considered to be an important indicator of succession because it modifies the local environment (Lebrija-Trejos et al. 2011) and acts as an important filter for functional traits well adapted to local conditions (Lebrija-Trejos et al. 2010b).
The incidence-based diversity measures increased logarithmically (Fig 2.1a- c) with basal area, but the pattern is largely determined by few sites only. Inclusion of more young sites is needed to solve this question. The asymptotic increase suggests that in early structural development of the forest recruiting individuals are species not yet present in the plot, with functional strategies complementary to the ones already present. With increasing basal area, the increases in species and functional richness slow down. This suggests that plot-level increases in basal area are either caused by growth of present individuals, or result from newly recruited individuals functionally similar to the ones already present in the community. The first alternative is supported by data from our sites showing that biomass accumulated in fewer, bigger individuals (van Breugel et al. 2006). The
30544 Lohbeck-bk.indd 45 27-10-14 16:42

Chapter 2
46
second alternative reflects the fact that with a higher number of species already present in the community the chance that ‘new’ species or functional types disperse to a site decreases (Schmid et al. 2002). Since functional redundancy is not found in our sites (see below) the first alternative is most plausible.
None of the importance-weighted diversity measures significantly changed with stand basal area, probably as a result of rapid, variable changes in some of the plots. For example, massive mortality of the pioneer Ochroma pyramidale (Bombacaceae), or a strong dominance of Vochysia guatemalensis (Vochysiaceae, 63% of total importance) in our older secondary forest have been reported (van Breugel et al. 2007). Such site-specific demography will swamp any subtle successional patterns in functional diversity when weighed by importance.
As most of the changes in diversity take place in early successional development (van Breugel et al. 2006, 2007), our 11 sites, covering the first 25 years of succession, provide us with a high resolution picture of early successional development. Moreover, this shifting cultivation land-use system is characterized by high pressure for land and older secondary forests are again brought into cultivation resulting in a high abundance of young secondary forests (van Breugel 2007; I. Zermeño-Hernández unpublished results). These are therefore specifically relevant to study for biodiversity-effects of land-use change and its consequences for ecosystem functioning. This puts changes in species and functional diversity during long term succession beyond the scope of this work. The asymptotic increase of species richness and functional richness with stand basal area suggests that diversity remains constant. An alternative possibility is a peak in functional diversity occurring at intermediate successional time, in line with the Intermediate Disturbance Hypothesis predicting a peak in species richness after disturbance (e.g. Sheil 1999, Sheil and Burslem 2003, Bongers et al. 2009). Whether species and functional diversity remain tightly correlated (see next section) is also important for discussing long term successional changes in diversity. Possibly functional redundancy starts to play an important role at later stages of succession (Laliberté et al. 2010, Paquette and Messier 2011), or, on the contrary, limiting similarity causes functional diversity to increase disproportionally to allow species to co-exist (Holdaway and Sparrow 2006, Cardinale et al. 2007). More research needs to be conducted to clarify such long term successional dynamics in species and functional diversity.
Our analysis testing for diversity as a response of stand basal area suggests that increased productivity during succession is a driver of increases in diversity.
30544 Lohbeck-bk.indd 46 27-10-14 16:42

Functional diversity and succession
47
2
The opposite causal direction, increased productivity as a response of increases in diversity, is also frequently studied (e.g. Tilman 2001a, van Ruijven and Berendse 2005). The use of one or the other, off course, depends on the research interests. The present study focuses on the effect of land-use change on (functional) diversity in tropical forests, making diversity as a response to changes in stand basal area (structural variable of succession) most appropriate. Such effect of succession on functional diversity is likely to have major implications for ecosystem functioning (e.g. Díaz and Cabido 2001, Nadrowski et al. 2010). It must be noted however that the present study does not explicitly link functional diversity to ecosystem functioning, and that changes in functional diversity may not proportionally translate into changes in particular ecosystem functions (c.f. Bihn et al. 2010).
Does species diversity predict functional diversity? We found that functional diversity generally increased with species diversity
(e.g. Biswas and Mallik 2011). The shape of this relationship, however, depends on the number and nature of functional traits included. Incidence-based and weighted functional diversity (9 traits) were strongly linearly related to species richness and to species diversity (Fig 2.2a,d,g). These linear relationships suggest that species are functionally complementary; each species added to the system represents therefore a functional profile that was not present before (cf. Díaz and Cabido 2001). Thus, our results suggest a lack of functional redundancy during early secondary forest succession, although we recognize that implying redundancy from the SD-FD relationship depends on the FD index as well as on the functional traits selected and methods of classification (continuous or in functional groups) (Rosenfeld 2002). Lack of functional redundancy may indicate that ecological resilience is lacking since functional redundancy rather than functional diversity is what maintains or restores ecosystem functioning under changing environmental conditions or disturbance events (Walker et al. 1999, Díaz and Cabido 2001, Micheli and Halpern 2005). However linking redundancy with resilience of ecosystem functioning requires knowledge on whether ‘redundant’ species also respond differently to disturbance (‘response diversity’), so that the functions can be maintained with species loss due to disturbance (Elmqvist et al. 2003, Laliberté et al. 2010). Considering this, we can only conclude that the linear relation between species and functional diversity offers no reason to believe that ecological functions are safeguarded against species loss through functional
30544 Lohbeck-bk.indd 47 27-10-14 16:42

Chapter 2
48
redundancy (c.f. Bihn et al. 2010). Further research should clarify how ‘response diversity’ develops with succession in the study sites.
Incidence-based functional diversity of single traits was either not related to species richness (FDSLA, Fig 2.2b) or linearly related to species richness (FDWD, Fig 2.2c). In single-trait functional diversity the effective dimensionality is reduced, and as such an increase in FD depends strongly on species identity and the particular trait values of the species added (Petchey and Gaston 2002b), which causes different traits to respond differently. We hypothesized a logarithmic relationship when functional richness of single traits is plotted against species richness, which would indicate partial complementarity. The linear pattern in the case of FDWD indicates that additional species are complementary in their wood density values to the ones already present. The logarithmic model showed a slightly higher fit (R2 of 0.88) but because of the minimal difference (< 0.05) we chose the most parsimonious model (linear: R2 of 0.85) to describe the data. This suggests that a saturating relationship may be underlying these data but a longer chronosequence is needed to detect it.
The biomass ratio hypothesis (Grime 1998) predicts that the functional traits of the most abundant species largely determine ecosystem processes and is supported by several studies (e.g. Garnier et al. 2004, Mokany et al. 2008). Abundance-weighted measures of functional diversity are thus needed when ecosystem processes are the point of concern. Since collection of functional trait data for a large suite of species is time, money and labour intensive (Baraloto et al. 2010c), the use of species number as an easy to obtain proxy for weighted functional diversity is much desired. Indeed, species richness strongly predicted weighted functional diversity for all traits, and could serve therefore as an adequate proxy. However, the usefulness of species richness as an indicator of wFD depends on the functional trait included, and hence, on the ecosystem process under concern. Indeed, we found that species richness underestimated weighted functional diversity in SLA (wFDSLA) as well as wFD in wood density (wFDWD). The reduction of effective dimensionality of trait space that results from weightings and from using single traits, increases the importance of community composition and highlights the functional identity of the dominant species. This allows functional diversity to further differentiate between communities beyond differentiation based on species richness only. The exponential increase in weighted functional diversity of single traits with species richness results from either more evenly distributed species importance values, or from co-occurring
30544 Lohbeck-bk.indd 48 27-10-14 16:42

Functional diversity and succession
49
2
species becoming more functionally distant due to niche differentiation. Since single trait functional diversity indices (wFDSLA and wFDWD) are linearly related to weighted species diversity (wSD) (next section), the exponential relation is mainly determined by more evenly distributed importance values.
Both functional diversity and species diversity indices have a reduced effective dimensionality when weighted for abundances because weighting species brings the focus towards fewer, dominant species (cf. Petchey and Gaston 2002b). Linear relationships are found when weighted functional diversity (wFDALL, wFDSLA and wFDWD) is plotted against weighted species diversity (wSD) (Fig 2.2 g-i). This indicates that species diversity is a better proxy for weighted functional diversity (wFD) than species richness (SD) in our early successional sites, specifically when a single trait is included. It also reflects that there is no indication of increased functional distance between species (niche differentiation) since differentiation of communities based on weighted species diversity is proportional to that of weighted functional diversity. Whether indeed this is a general pattern legitimating the use of species diversity as a proxy for weighted functional diversity should be confirmed by additional studies across different ecosystems.
Our results of functional diversity patterns with forest structural development and of functional diversity against species diversity demonstrate that trait choice is crucial when comparing functional diversity among sites, just as the choice of functional diversity index, which has been discussed previously (eg. Scherer-Lorenzen et al. 2007b, Bihn et al. 2010).
Our study has a limited sampling size and chronosequence length which reduces extrapolative power across regions. The significant trends are in line with our expectations based on theory, suggesting that our results are a conservative estimate of real patterns found in nature.
Conclusions
Species and functional richness increase logarithmically with structural development during forest succession (less than 25 years of abandonment). Stand basal area predicts functional richness well, but time after abandonment does not. Species richness and diversity are good predictors of functional diversity (based on incidence or weighted by species importance) when a range of traits is considered; the linear relationship between species and functional richness
30544 Lohbeck-bk.indd 49 27-10-14 16:42

Chapter 2
50
suggests that functional redundancy is limited in these secondary forest. When a single trait is included in the functional diversity measure, species richness may underestimate weighted functional diversity. Careful consideration of the traits required to capture the ecosystem process of interest is thus essential: number and nature of traits significantly determine the outcome.
Acknowledgements
We thank Gilberto Jamangape for fieldwork assistance and species identification. Jorge Rodriguez-Velázquez has been of great technical support. ML was supported by a research grant from Wageningen University and Research center. MvB and FB were supported by NWO-WOTRO (Netherlands Organisation for Scientific Research - Science for Global Development) grant W85-326. MMR was supported by MABOTRO projects SEMARNAT-CONACYT 2002-C01-0597 and SEP-CONACYT CB-2005-01-51043. Fieldwork was partly supported by US National Science Foundation grant DEB-0639393. LP and LP were partly funded by the DiverSus project through Inter-American Institute for Global Change Research (IAI) CRN 2015, which is supported by the US National Science Foundation (Grant GEO-0452325). B. Williamson, C. Baraloto and three anonymous reviewers constructively commented on an earlier version of this manuscript.
30544 Lohbeck-bk.indd 50 27-10-14 16:42

Functional diversity and succession
51
2
Appendix 2
Table A2.1: Selected functional traits important for plant performance and ecosystem processes. The nine traits used to calculate the functional diversity for each of the sites; trait abbreviations, a short description of their functional role, their effect on ecosystem processes and the references used
Fun
ctio
nal t
rait
Resp
onse
to a
biot
ic c
ondi
tions
Effe
ct o
n ec
osys
tem
pro
cess
esRe
fere
nces
Leaf
are
a; L
A (c
m2 )
Ligh
t int
erce
ptin
g ar
ea, d
ry m
atte
r pr
oduc
tion,
resp
irat
ion,
leaf
coo
ling,
ga
s exc
hang
e
Evap
otra
nspi
ratio
n, n
et p
rim
ary
prod
uctiv
ity(B
azza
z an
d Pi
cket
t 198
0, P
opm
a et
al
. 199
2)
Spec
ific
Leaf
Are
a; S
LA
(m2 K
g-1)
Ligh
t cap
ture
eco
nom
ics,
net
ass
imila
-tio
n ra
te, r
elat
ive
grow
th ra
te, l
eaf l
ife
span
, pho
tosy
nthe
tic c
apac
ity
Net
pri
mar
y pr
oduc
tivity
, rel
a-tiv
e pr
oduc
tivity
rate
, con
sum
p-tio
n by
her
bivo
res,
dec
ompo
si-
tion
and
net m
iner
alis
atio
n
(Rei
ch e
t al.
1997
, Cor
nelis
sen
et
al. 1
999,
Poo
rter
and
Gar
nier
1999
, Po
orte
r and
Bon
gers
200
6, S
terc
k et
al
. 200
6, P
oort
er e
t al.
2009
)
Leaf
Dry
Mat
ter C
onte
nt;
LDM
C (
g g-1
)Le
af ti
ssue
den
sity
, lev
el o
f ass
imila
tive
com
poun
ds a
nd tr
ansf
er c
ondu
ctan
ce
to C
O2, c
onst
ruct
ion
cost
s and
nutr
ient
re
tent
ion,
aga
inst
mec
hani
cal a
nd
herb
ivor
e da
mag
e, to
lera
nce
agai
nst
wat
er li
mita
tions
Dec
ompo
sitio
n, c
onsu
mpt
ion
by
herb
ivor
es,
(Poo
rter
and
Gar
nier
1999
, Ni-
inem
ets 2
001,
Gar
nier
et a
l. 20
04)
Leaf
Thi
ckne
ss; L
T (m
m)
Con
stru
ctio
n co
sts,
leaf
life
span
, ph
otos
ynth
etic
rate
s per
uni
t lea
f are
a,
agai
nst m
echa
nica
l and
her
bivo
re
dam
age,
gas
exc
hang
e an
d le
af c
oolin
g
Con
sum
ptio
n by
her
bivo
res,
net
pr
imar
y pr
oduc
tivity
(Rei
ch e
t al.
1991
, Pop
ma
et a
l. 19
92,
Niin
emet
s 200
1, D
íaz
et a
l. 20
04,
Ono
da e
t al.
2011
)
Spec
ific
Forc
e to
Pun
ch
(MN
m-2
)Le
af st
reng
th, s
urvi
val t
o he
rbiv
ory
and
phys
ical
dam
age,
per
sist
ence
, lea
f lif
espa
n
Net
pri
mar
y pr
oduc
tivity
, rel
a-tiv
e pr
oduc
tivity
rate
, con
sum
p-tio
n by
her
bivo
res,
dec
ompo
si-
tion
and
net m
iner
alis
atio
n
(Cor
nelis
sen
et a
l. 19
99, D
íaz
et a
l. 20
07b,
Poo
rter
et a
l. 20
09, K
itajim
a an
d Po
orte
r 201
0, O
noda
et a
l. 20
11)
Petio
le le
ngth
;PL
(cm
)Li
ght c
aptu
re e
ffic
ienc
yEv
apot
rans
pira
tion,
net
pri
mar
y pr
oduc
tivity
(Bla
ck 19
60, T
aken
aka
1994
)
Inst
anta
neou
s chl
orop
hyll
fluor
esce
nce;
F 0 (dim
ensi
onle
ss)
Abili
ty to
dis
sipa
te h
eat,
resi
stan
ce
agai
nst o
verh
eatin
g, p
hoto
synt
hetic
pe
rfor
man
ce
Hea
t exc
hang
e, n
et p
rim
ary
prod
uctiv
ity(M
axw
ell a
nd Jo
hnso
n 20
00, B
aker
an
d Ro
senq
vist
200
4)
Qua
ntum
Yie
ld;
QY
(dim
ensi
onle
ss)
Effe
ctiv
enes
s of p
hoto
syst
em II
, C
O2
assi
mila
tion,
stre
ss to
lera
nce,
pho
to-
synt
hetic
per
form
ance
, lea
f nut
rien
t le
vels
Hea
t exc
hang
e, n
et p
rim
ary
prod
uctiv
ity, c
onsu
mpt
ion
by
herb
ivor
es
(Max
wel
l and
John
son
2000
, Par
kh-
ill e
t al.
2001
, Bak
er a
nd R
osen
qvis
t 20
04, d
os S
anto
s Jr e
t al.
2006
)
Woo
d D
ensi
ty;
WD
(g c
m-3
)C
onst
ruct
ion
cost
s, g
row
th ra
te, s
tem
vu
lner
abili
ty, m
orta
lity
rate
Accu
mul
atio
n of
stan
ding
bio
-m
ass
(Aug
spur
ger a
nd K
elly
1984
, van
G
elde
r et a
l. 20
06, P
oort
er e
t al.
2008
, Cha
ve e
t al.
2009
)
30544 Lohbeck-bk.indd 51 27-10-14 16:42

30544 Lohbeck-bk.indd 52 27-10-14 16:42

Successional changes in functional composition contrast for dry and
wet tropical forest
Madelon Lohbeck, Lourens Poorter, Edwin Lebrija-Trejos, Miguel Martínez-Ramos, Jorge A. Meave, Horacio Paz, Eduardo A. Pérez-García, I. Eunice
Romero-Pérez, Alejandra Tauro, Frans Bongers
Published in Ecology (2013) 94(6): 1211-1216
30544 Lohbeck-bk.indd 53 27-10-14 16:42

Chapter 3
54
Abstract
We tested whether and how functional composition changes with succession in dry deciduous and wet evergreen forests of Mexico. We hypothesized that compositional changes during succession in dry forest were mainly determined by increasing water availability leading to community functional changes from conservative to acquisitive strategies, and in wet forest by decreasing light availability leading to changes from acquisitive to conservative strategies. Research was carried out in 15 dry secondary forest plots (5-63 years after abandonment) and 17 wet secondary forest plots (<1-25 years after abandonment). Community-level functional traits were represented by community-weighted means based on 11 functional traits measured on 132 species. Successional changes in functional composition are more marked in dry forest than in wet forest and largely characterized by different traits. During dry forest succession, conservative traits related to drought tolerance and drought avoidance decreased, as predicted. Unexpectedly acquisitive leaf traits also decreased, whereas seed size and dependence on biotic dispersal increased. In wet forest succession functional composition changed from acquisitive to conservative leaf traits, suggesting light availability as the main driver of changes. Distinct suites of traits shape functional composition changes in dry and wet forest succession, responding to different environmental filters.
Keywords: acquisitive traits, community-weighted mean, conservative traits, dry deciduous forest, Mexico, secondary succession, wet evergreen forest
30544 Lohbeck-bk.indd 54 27-10-14 16:42

Functional composition and succession
55
3
Introduction
Secondary succession is community assembly in action (Lebrija-Trejos et al. 2010b). Species replacement during secondary succession is often explained in terms of species’ adaptations to changing light environments (e.g. Bazzaz and Pickett 1980), reflecting a trade-off in plant design. Fast-growing species with a rapid acquisition of resources thrive at the rich light environment of early-successional stages, while slow-growing species that conserve resources dominate under the poor light environment of late-successional stages (Reich et al. 2003, Poorter et al. 2004). This trade-off in plant design is maintained across different geographic regions and is consistent across floras, life forms, and phylogenetic groups (Díaz et al. 2004, Wright et al. 2004).
In reality, the acquisitive-conservative trade-off points to the extremes of a continuum in plant strategies and a species’ position along this continuum can be quantified by its functional traits (Wright et al. 2004). In this study we focus on 11 leaf-, stem-, whole-plant-, and regenerative traits that are important for light acquisition, carbon gain, stress resistance (heat, drought, shade), resource conservation, dispersal and establishment (see Table A3.1 in Appendix 3).
Leaf traits run from cheap, short-lived leaves with high assimilation rates on the acquisitive end of the spectrum to tough, resistant leaves that have long leaf lifespans on the conservative end (Wright et al. 2004). Acquisitive leaf traits include long petioles (Takenaka 1994), large leaf laminas (Bazzaz and Pickett 1980), high specific leaf area (SLA)(Poorter et al. 2009) and compound leaves (Niinemets 1998). Conservative leaf traits include high leaf dry matter contents, leaf density and leaf thickness (Reich et al. 1991, Kitajima and Poorter 2010).
The acquisitive- conservative continuum for stem traits runs from cheap-to-construct, low-density wood, facilitating high volumetric stem growth rates, to high-density wood, facilitating stem protection, and hence, high survival rates (Chave et al. 2009). Deciduous species are conservative since they efficiently reabsorb nutrients before shedding the leaves (Aerts 1996, Givnish 2002), moreover deciduousness is a good predictor of drought survival (Poorter and Markesteijn 2008). Seed size and biotic dispersal are good indicators of per-capita reproductive effort (Dalling and Hubbell 2002). Early-successional species produce many small seeds and late-successional species few large seeds (e.g. Foster and Janson 1985) that are more often animal-dispersed, enhancing directed dispersal to safe sites (Jansen et al. 2008).
30544 Lohbeck-bk.indd 55 27-10-14 16:42

Chapter 3
56
Studies on successional change from acquisitive to conservative strategies have been mainly conducted in tropical wet forests, where species assemble along a gradient of decreasing light availability (e.g. Kobe 1999, Montgomery and Chazdon 2002). This classical idea may not hold for tropical dry forests where light is not a major limiting resource for plant performance since these forests are less stratified and species are short statured (Lebrija-Trejos et al. 2008). During tropical dry forest succession, conditions change from dry and hot to relatively moister and cooler environments (Lebrija-Trejos et al. 2011, Pineda-García et al. 2013). Early-successional species have better drought-coping strategies and enhanced water use efficiency compared to late-successional species (Lebrija-Trejos et al. 2010b, Alvarez-Añorve et al. 2012). Dry forest species may therefore experience highly stressful conditions during the dry and hot early stages of succession, and wet forest species during the shaded late stages of succession. Therefore, in dry forests we expect that species occurring at early stages of succession have conservative strategies whereas those occurring at late-successional stages have acquisitive strategies, based on increasing water availability. In contrast, we expect that in tropical wet forests early-successional species are acquisitive and late-successional species are conservative, based on decreasing light availability. These expectations hold for leaf-, stem- and whole-plant traits which reflect the use and conservation of internal resources and depend on the resources available (light, water). Traits related to the regenerative phase are largely decoupled from those related to the established phase (Grime et al. 1997). We expect both dry and wet forest successional changes to reflect increased importance of per-capita reproductive effort indicated by large seeds and animal dispersal, because small-seeded wind-dispersed species are favoured in open (recently abandoned) sites (Hammond and Brown 1995) and because of increased abundance of potential dispersers with succession. To test these predictions we analyse how 11 functional traits measured on 132 species in dry and wet tropical forest change with secondary succession.
Methods
Research locationsTropical dry forest originally covered about 17.1% of Mexico’s landcover, and
is presently reduced to 11.3%, of which roughly 2/3 is secondary forest (Challenger
30544 Lohbeck-bk.indd 56 27-10-14 16:42

Functional composition and succession
57
3
and Soberón 2008). Dry forest research plots were established close to the village of Nizanda on the Pacific slope of the Tehuantepec Isthmus in Oaxaca, southern Mexico (16°39’N, 95°00’W). Mean annual temperature is 26°C and mean annual precipitation is 900mm of which over a 90% is concentrated between late May and mid-October (Lebrija-Trejos et al. 2008). The vegetation is predominantly tropical dry deciduous forest, characterized by a low canopy stature (ca. 7 m tall) with a high biodiversity(Pérez-García et al. 2001, 2010). The 15 secondary forest plots (900m2 each) with different fallow ages (5-63 yrs) are established on abandoned maize fields. Within each plot four parallel 5 x 20 m transects were established, further divided into four 5 x 5 m sub-quadrats. In one sub-quadrat all individuals with DBH ≥1 cm were identified and measured, in a second all individuals with DBH ≥2.5 cm and in the remaining two all individuals with DBH ≥5 cm. Species-level variables were scaled up according to sampling effort per size-class (see also Lebrija-Trejos et al. 2008).
Tropical wet forest originally covered about 9.1% of Mexico’s landcover, and is presently reduced to 4.8%, of which 2/3 is secondary forest (Challenger and Soberón 2008). Wet forest research plots were established close to the village of Loma Bonita, in Marqués de Comillas, Chiapas, south-eastern Mexico (16°01’N, 90°55’W). Mean annual temperature is 24°C and mean annual precipitation is 3000 mm, with a dry period (<100 mm month-1) from February through April (van Breugel et al. 2006, 2007). The research area is characterized by small hills and valleys with sandy or limestone soils of low pH (<5.5). The 17 secondary forest plots (1000 m2 each) with different fallow ages (<1-25 yr)are established on abandoned maize fields. Each plot is divided into two 10 x 50 m subplots. In one subplot all individuals with DBH ≥1 cm were identified and measured, in the second all individuals DBH ≥5 cm. Again, species variables were scaled up according to sampling effort per size-class.
Functional traitsA total of 132 species were evaluated: 51 dry forest species and 81 wet forest
species. Those species that made up at least 80% of the basal area in the plots were selected (excluding cacti in dry forest, as functional traits are hard to compare) because they accurately describe the community-weighted mean (Garnier et al. 2004, Pakeman and Quested 2007). Seven leaf traits, 1 stem trait, 1 whole-plant trait and 2 regenerative traits were considered that are important for the carbon-, water- and nutrient-balance of plants. Traits were measured following
30544 Lohbeck-bk.indd 57 27-10-14 16:42

Chapter 3
58
standardized protocols (Cornelissen et al. 2003, for a detailed description of the methods for each trait see Appendix 3). Traits were measured in the study areas on 5 to 10 individuals per species, with the exceptions of wood density (where for wet forest 15 of the 81 species were taken from comparable Mexican ecosystems), and the binary traits leaf compoundness, deciduousness and dispersal syndrome (which were scored based on field observations, local informants, herbaria and literature). In wet forest, data for some species for seed volume (14 species) and dispersal type (13 species) were missing and average wet forest trait values were used in the analyses; these missing values made up for an average of 6% of the total basal area (range 0-8.7%) in the case of seed volume and 2% (range 0-29%) in the case of dispersal type.
Species’ average trait values were used although we recognize that intraspecific trait variation may play an important role in species adaptation along environmental gradients. Considering the extensive species-level trait dataset available (132 species) and the high species turnover during succession, for the purpose of this research we consider the use of species average trait values legitimized.
Statistical analysisEach functional trait is scaled up from species to community-level using the
community-weighted mean (CWM; Garnier et al. 2004, Lavorel et al. 2007), a parameter that can be seen as the functional value of an average plant from the community. It is calculated as:
where S is the total number of species, wi is the relative basal area of the ith species and xi is the trait value of the ith species. The relative basal area is used, rather than abundance, because it reflects the species’ biomass, an indicator of plant performance and adaptation to local conditions. This is a species’ relative contribution to the functional spectrum available in each plot (which is at least 80% of total basal area in a plot).
Regression analysis was used to relate CWM trait values with the successional age (years after abandonment of maize field) and the stand basal area (m2 ha-1, which is a structural variable of succession; including cacti in dry forest). Stand basal area is logarithmically related to age in both forest types (Fig A3.1 in Appendix). Statistical analyses were carried out using R v. 2.13.1 (R Development Core Team 2011).
30544 Lohbeck-bk.indd 58 27-10-14 16:42

Functional composition and succession
59
3
Results
The dry forest showed clear community-level functional trait changes with succession: many traits (8 out of 11) directionally changed, with similar patterns for stand basal area and age (Fig 3.1, Table A3.2 in Appendix). Traits related to large and efficient leaf display (leaf area, SLA), wood density, and the proportion of plants with compound and deciduous leaves decreased with succession. Leaf thickness, seed volume and proportion of biotic seed dispersal increased with succession.
In wet forest only four traits changed directionally (Fig 3.1, Table A3.2 in Appendix) of which one trait only responded to age (leaf thickness), and others only to stand basal area (LDMC, leaf density), with SLA responding to both. Only leaf traits changed with succession; SLA decreased whereas LDMC and leaf density increased with stand basal area. Leaf thickness increased with age (Table A3.2 in Appendix).
Discussion
In both forest types, the functional composition of the community changes with succession, though distinct suites of traits matter for dry and wet forest succession. More traits changed during dry forest succession compared to wet forest succession. This may partly be due to the length of the chronosequence which is notably longer in dry forest (5-63 yrs after abandonment) than in wet forest (<1-25 yrs). Despite the relatively short sequence for wet forest we do think that the most important changes are captured, as high rates of species turnover as well as rapid changes in species- and functional diversity have been shown to take place in early successional stages (i.e. the first two decades) (van Breugel et al. 2006, 2007, Lohbeck et al. 2012).
Dry forest succession - We predicted that during tropical dry forest succession there is a shift from early-successional species with conservative traits to cope with the harsh, dry and hot environment, towards late-successional species with acquisitive traits that benefit from the higher water availability and the cooler environment. We partially found decreases in the conservative strategy; wood density decreased with succession but LDMC and leaf density did not. Wood
30544 Lohbeck-bk.indd 59 27-10-14 16:42

Chapter 3
60
density limits volumetric growth and reflects resistance to drought (Poorter and Markesteijn 2008) and the need for being drought resistant is greater at early-successional stages where soil water potential is lower (Lebrija-Trejos et al. 2011, but see Pineda-García et al. 2013). Remarkably SLA and leaf area decreased with succession, against expectations as high values of these traits are generally associated with high resource conditions (Poorter et al. 2009). Including a gradient of deciduousness; number of months without leaves (Méndez-Alonzo et al. 2012), as well as rooting depths may reveal how species with large and cheap leaves are able to prosper in these dry early-successional sites (cf. Pineda-García et al. 2013).
The small increase in relative abundance of evergreen species with succession (note that deciduous species dominate throughout the successional gradient) was in line with expectations, as the forests become denser, close their canopy, hold more humidity and the soil water content increases (Lebrija-Trejos et al. 2011). This confirms previous studies showing that deciduousness is especially important during the extra dry environments in early-successional stages (Pineda-García et al. 2013). Also the importance of having compound leaves decreased with succession: additional to the ability of some species to avoid desiccation by folding leaflets, compound leaves are able to drop individual leaflets rather than the whole leaf thereby fine-tuning leaf area under drought stress (Poorter and Markesteijn 2008). Leaf thickness increased with dry forest succession, as in wet forest succession (only with time after abandonment; Table A3.2 in Appendix).Thick leaves mostly have higher stomatal density (but see Bongers and Popma 1990) and lower chlorophyll contents (Loranger and Shipley 2010), are expensive to construct and associated with longer leaf lifespans (Reich et al. 1991, but see Kitajima et al. 2012). Lastly the importance of species that depend on animals for seed dispersal increases with tropical dry forest succession, as does the volume of the seeds. This confirms that early-successional species invest in many small seeds that can travel large distances (e.g. by wind), whereas late-successional species invest in fruits that attract biotic dispersers to allow directional dispersal.
Wet forest succession - We predicted that during tropical wet forest succession there is a shift from early-successional species with acquisitive strategies towards late-successional species with conservative strategies to cope with the low light conditions. We indeed found the acquisitive trait SLA to decrease with succession and the conservative traits leaf density, LDMC and leaf thickness to increase with
30544 Lohbeck-bk.indd 60 27-10-14 16:42

Functional composition and succession
61
3
Figure 3.1: Changes in community-weighted mean trait values (weighted by relative basal area) against stand basal area (m2 ha-1; structural variable of succession) in successional dry (open symbols, N=15) and wet (filled symbols, N=17) forest plots in southern Mexico. Regression lines (broken in dry forest, continuous in wet forest) and coefficients of determination are given, in the case of significant relationships. In the case of the binary variables leaf compoundness, deciduousness and biotic dispersal the value 1 represents compound leaves, deciduous leaf habit and biotically-dispersed seeds respectively.
50
100
200
500
1000
Leaf
are
a (c
m3 ) a
r² = 0.32*12
13
14
15
16
SLA
( m2
kg)
b r² = 0.37*
r² = 0.38**
0.30
0.35
0.40
0.45
0.50
0.55
LDM
C (g
g)
c
r² = 0.23* 0.40
0.45
0.50
0.55
0.60
0.65
Leaf
den
sity
( gcm
3 ) d
r² = 0.51***
0.10
0.15
0.20
0.25
Leaf
thic
knes
s (m
m) e
r² = 0.43** 2
5
10
Pet
iole
leng
th ( c
m) f
Leaf
com
poun
dnes
s
0
0.5
0.8
1 g r² = 0.34*
0.3
0.4
0.50.60.70.80.9
WD
( gcm
3 )
h r² = 0.31*
0.0
0.2
0.4
0.6
0.8
1.0
Dec
iduo
usne
ss
ir² = 0.53**
0 5 10 15 20 25 30
10
20
50
100
200
SV
( mm
3 )
j
r² = 0.57***
0 5 10 15 20 25 30
0.0
0.2
0.4
0.6
0.8
Bio
tic d
ispe
rsal
kr² = 0.42**
Stand basal area (m2 ha)
dry forest plots
dry forest trend
wet forest plots
wet forest trend
Stand basal area (m2 ha)
30544 Lohbeck-bk.indd 61 27-10-14 16:42

Chapter 3
62
succession, confirming earlier results from other vegetation types (Garnier et al. 2004, Kahmen and Poschlod 2004, Dahlgren et al. 2006). Remarkably only leaf traits showed significant changes. These clear changes from an acquisitive to a conservative strategy show that the leaf economics spectrum plays an important role in species turnover during tropical wet forest succession, and suggests light availability to be one of the main drivers of species turnover. Community traits related to reproductive strategies, wood density and deciduousness showed no directional changes with succession. The lack of a role for wood density is surprising, given the fact that the biomass proportion of high wood density trees increases with succession (Brown and Lugo 1990) and that it is one of the best predictors for growth and survival of wet forest species (Poorter et al. 2008, Wright et al. 2010). The proportion of deciduous species does not change during wet forest succession, likely because deciduousness is a rare (<10% of the wet forest species is deciduous) and a maladaptive strategy in extremely wet conditions. Surprisingly, we found no increase in biotically-dispersed trees for wet forest. In our plots biotic dispersal is common throughout the successional gradient (Fig 3.1k), in line with previous studies (Young et al. 1987). We therefore hypothesize that instead of changes from abiotic to biotic dispersal, changes in animal dispersal-groups could play an important role during wet forest succession.
Of the 11 traits studied, only 1 trait was irrelevant to both successional gradients (petiole length). Two traits (SLA and leaf thickness) showed community-level changes during succession in both forest types, following the same direction. This indicates that SLA is a crucial trait for secondary succession and may be applicable across vegetation types (cf. Garnier et al. 2004, Poorter et al. 2009). A similar argument can be given for leaf thickness although due to the uncertainties in its functional role (mainly its relation to the leaf economics spectrum) we argue that this needs further study. Most traits are either related to dry forest succession (leaf area, leaf compoundness, wood density, deciduousness, biotic dispersal, seed volume) or to wet forest succession (LDMC, leaf density).
This study shows that secondary succession directionally changes functional composition in two contrasting tropical forest types that differ strikingly in their annual precipitation, but largely distinct suites of traits matter for dry and wet forest succession. Dry forest trait changes can be partially explained by water limitations in early succession. In wet forest succession community functional
30544 Lohbeck-bk.indd 62 27-10-14 16:42

Functional composition and succession
63
3
composition changed from acquisitive to conservative leaf traits, suggesting decreasing light availability to be the main driver.
Acknowledgements
We are indebted to the people of Nizanda, Oaxaca, and Loma Bonita, Chiapas, for their hospitality and assistance during field work. We thank Jorge Rodríguez-Velázquez and Marco Romero for database management, and Eva van den Elzen, Erik Peters, Paul van Esch, Michiel van Breugel, Elisabeth Schüller and Peter Hietz for contributing data. ML was supported by a research grant from Wageningen University and Research center. LP was partly funded by the DiverSus project through Inter-American Institute for Global Change Research (IAI) CRN 2015, supported by the US NSF (Grant GEO-0452325). ELT was supported by CONACYT-SEMARNAT (grant 2002-C01-0267) and PAPIIT (grantIN216007). MMR, HP and AT were supported by MABOTRO projects SEMARNAT-CONACYT 2002-C01-0597 and SEP-CONACYT CB-2005-01-51043. JAM, EAPG and IERP were supported by SEP CONACYT-2009-01-128136. FB was supported by NWO-WOTRO grant W85-326. Fieldwork was partly supported by US NSF grant DEB-0639393.
30544 Lohbeck-bk.indd 63 27-10-14 16:42

Chapter 3
64
Appendix 3
Table A3.1: Traits included in the study, the trait category (L = leaf trait, S= stem trait, W= whole-plant trait, R= regenerative trait), the functional strategy that high values of this trait refer to (A= acquisitive, C= conservative, R= reproductive effort), description of the functional role, and references used.
Trait Cat. Strategy Functional role References
Leaf area (cm2) L A Light intercepting area, dry matter production, respiration, leaf cooling, gas exchange
(Bazzaz and Pickett 1980, Popma et al. 1992)
Specific Leaf Area SLA (m2 kg-1)
L A Light capture economics, net assimilation rate, relative growth rate, leaf life span, photosynthetic capacity
(Reich et al. 1997, Poorter and Garnier 1999, Poorter and Bongers 2006, Sterck et al. 2006)
Leaf Dry Matter Content LDMC (g g-1)
L C Level of assimilative compounds and transfer conductance to CO2, construction costs, nutrient retention, tolerance against water limitations and mechanical and herbivore damage
(Poorter and Garnier 1999, Niinemets 2001, Garnier et al. 2004, Poorter and Markesteijn 2008)
Leaf density (g cm-3) L C Leaf tissue density, leaf structure, water balance
(Niinemets 1999, Lebrija-Trejos et al. 2010b)
Leaf thickness (mm)
L C Construction costs, leaf life span, photosynthetic rates per unit leaf area, against mechanical and herbivore damage, gas exchange and leaf cooling
(Popma and Bongers 1991, Reich et al. 1991, Díaz et al. 2004, Loranger and Shipley 2010)
Petiole length (cm) L A Light capture efficiency, leaf support costs
(Black 1960, Takenaka 1994, Niinemets et al. 2007)
Leaf compoundness (0=simple1=compound)
L A Leaf cooling, light capture economics
(Niinemets 1998, Markesteijn and Poorter 2009, Lebrija-Trejos et al. 2010b)
Wood density WD (g cm-3)
S C Construction costs, growth rate, stem vulnerability, mortality rate, resistance against cavitation, drought tolerance
(Augspurger and Kelly 1984, Hacke et al. 2001, Poorter et al. 2008, Chave et al. 2009, Poorter et al. 2010, Markesteijn et al. 2011)
Deciduousness (0= evergreen1= deciduous)
W C Drought avoidance, survival during drought
(Poorter and Markesteijn 2008, Bohlman 2010, Lebrija-Trejos et al. 2010b)
Seed volume (mm3) R R Investment in reproduction, germination success, number of seeds
(Foster and Janson 1985, Westoby et al. 1996, Moles and Westoby 2004)
Dispersal type (0=abiotic 1=biotic)
R R Distance of dispersal, colonization chance, food source for animals
(Hammond and Brown 1995)
30544 Lohbeck-bk.indd 64 27-10-14 16:42

Functional composition and succession
65
3
0 10 20 30 40 50 60
010
2030
Dry forest
Age (years)
Sta
nd b
asal
are
a (m
2ha
)a
r² = 0.92
0 5 10 15 20 25
Wet forest
Age (years)
b
r² = 0.70
Figure A3.1: Stand basal area increases logarithmically with fallow age during secondary succession in (a) dry forest deciduous forest and (b) wet evergreen forest. Coefficients of determination are given in the figures.
Table A3.2: Results of the linear regression analysis of the community-weighted mean trait values (weighted by relative basal area) against successional variables time since abandonment and stand basal area for secondary forests in Mexico. These secondary forests include a dry forest chronosequence in Nizanda, Oaxaca (N=15) and a wet forest chronosequence in Loma Bonita, Chiapas (N=17). The traits used for community-weighted mean values are leaf area (LA), specific leaf area (SLA), leaf dry matter content (LDMC), leaf density (LD), leaf thickness (LT), petiole length (PL), proportion of species with compound leaves (LC), wood density (WD), proportion of species that is deciduous (De), seed volume (SV), proportion of species that is biotically dispersed (Di). (For explanation of traits see also Table A3.1 in Appendix). For the significant relations a + or – is added to summarize a positive or negative trend with the successional variable. See also Figure 3.1 in the main article.
CWM traits
Dry forest Wet forest
Time since abandonment
Stand basal area Time since abandonment
Stand basal area
R2 p R2 p R2 p R2 p
LA* 0.31 0.031 - 0.32 0.027 - 0.002 0.874 0.18 0.087
SLA 0.47 0.005 - 0.37 0.016 - 0.78 <0.001 - 0.38 0.009 -
LDMC 0.19 0.109 0.18 0.115 0.061 0.338 0.23 0.049 +
LD 0.21 0.085 0.19 0.103 0.16 0.117 0.51 0.001 +
LT* 0.48 0.004 + 0.43 0.007 + 0.56 <0.001 + 0.07 0.318
PL* 0.18 0.113 0.18 0.113 0.06 0.355 0.08 0.270
LC§ 0.27 0.049 - 0.34 0.024 - 0.01 0.658 0.18 0.095
WD* 0.27 0.045 - 0.31 0.032 - 0.05 0.415 0.06 0.345
De 0.65 <0.001 - 0.53 0.002 - 0.00 0.977 0.06 0.356
SV* 0.60 <0.001 + 0.57 0.001 + 0.11 0.189 0.00 0.985
Di 0.52 0.002 + 0.42 0.009 + 0.04 0.427 0.01 0.648
* variable ln transformed, § variable exponentially transformed
30544 Lohbeck-bk.indd 65 27-10-14 16:42

Chapter 3
66
Detailed methods on trait measurements Leaf traits - In the wet forest sites, leaf traits were measured for two sun-lit
leaves for 10 adult trees per species (5 individuals for specific force to punch) of ca. 5m high, and in dry forest for 5 sun-lit leaves for 5 adult trees per species with a DBH of 10-30 cm. After collection the leaves were rehydrated for at least half an hour after which fresh weight was determined. Petiole length (cm) was measured and leaf thickness (mm) was determined with a calliper (0.01 mm accuracy) in the middle of the leaf avoiding the main and secondary veins. Leaves were photographed on a light box (wet forest) or scanned (dry forest) after which leaf area was calculated using pixel counting software ImageJ (Rasband 2008). For composite leaves the entire leaf was used in leaf trait analysis and the rachis was considered part of the leaf (Cornelissen et al. 2003). The petiole was excluded in leaf trait measurements for wet forest species, because here petioles can be very long (up to 90 cm), for dry forest leaf traits did include the petiole, and in general, they tend to be small compared to wet forest petioles. Leaves were dried to constant weight and weighed. Specific Leaf Area (SLA, m2 kg-1) was calculated as leaf area divided by oven-dried mass, Leaf Dry Matter Content (g g-1) as leaf oven-dry weight divided by fresh weight, Leaf Density (g cm-3) was calculated as leaf dry mass divided by leaf volume (leaf area multiplied by thickness). Leaf-compoundness was included as a dummy variable (0=simple, 1=compound).
Stem trait- Wood density was based on wood cores taken with an increment borer from the outer bark up to the heart of the tree, or alternatively based on stem slices in case stems did not reach sufficient size (< 5 cm DBH). The fresh volume was determined with the water replacement method and after dry weight measurement the wood density was obtained (WD, g cm-3). For wet forest, this measurement was taken in the study area for 66 of the 81 species studied, data on WD for remaining species were taken from comparable studies in Mexican wet forests by the authors (unpub. data) in Las Margaritas (8 species) and Los Tuxlas (7 species).
Whole plant trait - Species’ deciduousness was included as dummy variable based on field observations or accounts from local informants (0= evergreen, 1= deciduous).
Regenerative traits - Dispersal mode (0= abiotic, 1= biotic) was taken from literature, field observations, or inferred from fruit shapes as found in literature, field or herbaria. Seed volume was measured from seed collections (for wet forest species; Martínez-Ramos & Ibarra-Manríquez unpublished results), collections
30544 Lohbeck-bk.indd 66 27-10-14 16:42

Functional composition and succession
67
3
in the field, literature and from herbarium specimen (National Herbarium of Mexico (MEXU, UNAM), herbaria of the Instituto de Ecología A.C. in Pátzcuaro and in Xalapa). In wet forest, data for some species for seed volume (14 species) and dispersal mode (13 species) were missing and average wet forest trait values were used in the analyses. Relative to the total community functional spectrum in the plots these missing values made up for 6% (range 0-8.7%) in the case of seed volume and 2% (range 0- 29%) in the case of dispersal mechanism.
30544 Lohbeck-bk.indd 67 27-10-14 16:42

30544 Lohbeck-bk.indd 68 27-10-14 16:42

Functional trait strategies of trees in dry and wet tropical forests
are similar but differ in their consequences for succession
Madelon Lohbeck, Edwin Lebrija-Trejos, Miguel Martínez-Ramos, Jorge A. Meave, Lourens Poorter, Frans Bongers
Submitted for publication
30544 Lohbeck-bk.indd 69 27-10-14 16:42

Chapter 4
70
Abstract
Global plant trait studies have revealed fundamental trade-offs in plant resource economics. We evaluated such trait trade-offs during secondary succession in two species-rich tropical ecosystems that contrast in precipitation: dry deciduous and wet evergreen forests of Mexico. Species turnover with succession in dry forest is largely driven by increasing water availability and in wet forest by decreasing light availability. We hypothesized that while functional trait trade-offs are similar in the two forest systems, the successful plant strategies in these communities will be different, as contrasting filters affect species turnover.
Research was carried out in 15 dry secondary forest sites (5-63 years after abandonment) and in 17 wet secondary forest sites (<1-25 years after abandonment). We used 11 functional traits measured on 132 species to make species-trait PCA biplots for dry and wet forest and compare trait trade-offs. We evaluated whether multivariate plant strategies changed during succession, by calculating a ‘Community-Weighted Mean’ plant strategy, based on species scores on the first two PCA-axes.
Trait spectra reflected two main trade-off axes that were similar for dry and wet forest species: acquisitive versus conservative species, and drought avoiding species versus evergreen species with large animal-dispersed seeds. Successional changes in the most successful plant strategies reflected different functional trait spectra depending on the forest type. In dry forest the community changed from having drought avoiding strategies early in succession to increased abundance of evergreen strategies with larger seeds late in succession. In wet forest the community changed from species having mainly acquisitive strategies to those with more conservative strategies during succession. These strategy changes were explained by increasing water availability during dry forest succession and increasing light scarcity during wet forest succession.
Although similar trait spectra were observed among dry and wet secondary forest species, the consequences for succession were different resulting from contrasting environmental filters.
Keywords: dry deciduous forest, functional trait, functional trait trade-off, functional strategy, Mexico, secondary succession, PCA, wet evergreen forest
30544 Lohbeck-bk.indd 70 27-10-14 16:42

Functional trait strategies
71
4
Introduction
Trade-offs in plant design and resource economics are consistent at the global scale (Díaz et al. 2004, Wright et al. 2004, Reich 2014). These give insight into comprehensive dimensions of multivariate functional trait variation, or what we call ‘functional trait spectra’. As functional traits are indicators of ecological strategies, the study of trait spectra and trade-offs allows us to explore the complex interplay of different strategies (Wright et al. 2007). For example, the worldwide leaf economics spectrum runs from a plant strategy with cheap-to-construct acquisitive leaves with high photosynthetic rates that maximize resource capture to a strategy with expensive-to-construct conservative leaves that tolerate stress and physical damage and better conserve the acquired resources (Wright et al. 2004). Such an economic spectrum has not only been found for leaves, but also for other plant organs like roots and stems (Freschet et al. 2010, Reich 2014), and it has been found across different climatic regions (Wright et al. 2004). This economics spectrum at the tissue level underlies the trade-off between growth and survival at the whole-plant level (Sterck et al. 2006), as in resource rich environments acquisitive strategies thrive by fast growth (and high mortality) whilst in resource-poor environments conservative strategies thrive by persistence (and high survival). This fundamental trade-off describes variation among plants in the established phase. In contrast, different trade-offs are found in the regenerative phase, where plants have to arrive and establish successfully at a site. As a result, traits related to the regenerative phase are largely decoupled from those related to the established phase (Grime et al. 1997). The trade-off between seed size and seed number plays an important role in explaining the differential success of species in the regenerative phase (e.g. Foster and Janson 1985). Small seeds are produced in large numbers and are often wind-dispersed, which is advantageous when colonizing new sites (Hammond and Brown 1995), but their small seed size comes at the expense of a lower per capita establishment success (Dalling and Hubbell 2002). Large seeds produce robust seedlings (Westoby et al. 1996), which is advantageous when colonizing shaded sites (Leishman et al. 2000), and they are often animal-dispersed, enhancing directed dispersal to safe sites (Jansen et al. 2008).
These traits and trait trade-offs are used to explain species’ success along successional gradients. In tropical wet forest, succession is driven by a gradient of decreasing light availability over time (e.g. Nicotra et al. 1999) whereas in dry
30544 Lohbeck-bk.indd 71 27-10-14 16:42

Chapter 4
72
forest it is driven by a gradient of increasing water availability over time (Lebrija-Trejos et al. 2011, Pineda-García et al. 2013). Dry forest species experience, therefore, stressful conditions during the dry and hot early stages of succession, while wet forest species do so during the shaded late stages of succession. We showed previously that, at the community-level, the community-weighted mean (CWM) of individual functional traits changed with tropical forest succession in Mexico [17]. The type of traits that changed differed largely between dry and wet forests (Lohbeck et al. 2013). In dry forest, early-successional communities had trait values related to drought coping and optimal light acquisition, whereas late-successional communities had trait values related to large seeds and biotic dispersal. In wet forest, early-successional communities also had trait values related to optimal light acquisition, whereas late-successional communities had trait values related to increased leaf toughness. Here we expand on the previous analysis, and explore differences in species-level trait trade-offs between dry and wet forest species, and to what extent this can be translated into different multivariate plant strategies between dry and wet forest species.
The present study focuses on trait trade-offs at the species level, and how multivariate plant strategies change during succession. To this end we described plant strategies using 11 functional traits measured on 132 species found in 32 secondary forest sites belonging to dry and wet tropical forest in Mexico. We hypothesized the existence of two major trait- or strategy spectra, namely the spectrum of species with acquisitive versus those with conservative trait values, which is important in the established phase of plants, and the spectrum of small seeded wind-dispersed species versus large seeded animal-dispersed species, which is important in the regeneration phase. We expected that in dry forest, water is the main limiting factor, and that tree communities show a change from predominantly conservative to acquisitive strategies over time, whereas in wet forest, light is the main limiting factor, and the communities show a change from predominantly acquisitive to conservative strategies over time. We also expected that the seed size spectrum would play an important role in both forest types, reflecting an increase in the proportion of large seeded animal-dispersed species along succession.
30544 Lohbeck-bk.indd 72 27-10-14 16:42

Functional trait strategies
73
4
Methods
Ethics statementSince all secondary forest plots are located on privately owned land, permission
from landowners to enter the sites and collect plant material was provided before conducting this research.
Research locationsTropical dry forest. Research plots in tropical dry forest surround the village
of Nizanda on the Pacific watershed of the Isthmus of Tehuantepec in Oaxaca, southern Mexico (16°39’N, 95°00’W). Mean annual temperature is 26 °C and mean annual precipitation is 900 mm, of which > 90 % concentrates between late May and mid-October (Lebrija-Trejos et al. 2008). The vegetation is predominantly tropical dry deciduous forest, characterized by a low canopy stature (ca. 7 m tall) with a high biodiversity (Pérez-García et al. 2001, 2010). The 15 secondary forest plots (900 m2) with different fallow ages (6-64 years) were established on abandoned maize fields. Within each plot four parallel 5 × 20 m transects were set up, and further divided into four 5 × 5 m quadrats. In one quadrat all individuals with DBH ≥ 1cm were identified and measured, in a second all individuals with DBH ≥ 2.5 cm and in the remaining two all individuals with DBH ≥ 5 cm, with these sampling criteria being randomly assigned to each quadrat. Variables measured on each individual were scaled up to the plot level according to sampling effort per size-class (i.e., all stems 1 cm ≤ DBH ≤ 2.5 cm were multiplied by four, and 2.5 cm ≤ DBH ≤ 5 cm by two, to make sampling effort comparable across size-classes, after which all stems are added up). For further details see Lebrija-Trejos et al. (2008).
Tropical wet forest. Research plots in the tropical wet forest surround the village of Loma Bonita in the Marqués de Comillas region in Chiapas, southeastern Mexico (16°01’N, 90°55’W). Mean annual temperature is 24 °C and mean annual precipitation is 3000 mm, with a dry period (< 100 mm month-1) from February through April (van Breugel et al. 2006). The research area is characterized by small hills and valleys with sandy and clay soils of low pH (< 5.5). The 17 secondary forest plots (1000 m2) with different fallow ages (< 1-25 years) were established on abandoned maize fields. Each plot was divided into two 10 × 50 m subplots. In one subplot all individuals with DBH ≥ 1 cm were identified and measured, in
30544 Lohbeck-bk.indd 73 27-10-14 16:42

Chapter 4
74
the second all individuals DBH ≥ 5 cm. Again, measured variables were scaled to the plot level up according to sampling effort per size-class (i.e., stems 1 cm ≤ DBH ≤ 5 cm were multiplied by two to make sampling effort comparable to DBH ≥ 5 cm, after which all stems are added up).
Functional traitsThose species that made up at least 80 % of the basal area in the plots were
selected for functional trait measurements (excluding cacti in dry forest, as their functional traits are difficult to compare with trees), because they accurately describe the community-weighted mean (Garnier et al. 2004, Pakeman and Quested 2007). This resulted in a total of 132 species: 51 dry forest species and 81 wet forest species. We measured seven leaf traits: leaf area (m2), specific leaf area- SLA (m2/kg), leaf dry matter content- LDMC (g/g), leaf density (g/cm3), leaf thickness (mm), leaf compoundness (0=simple, 1=compound), petiole length (cm); one whole plant trait: deciduousness (0=evergreen, 1=deciduous); one stem trait: wood density- WD (g/cm3); and two regenerative traits: seed size (mm3) and dispersal syndrome (0=abiotic, 1=biotic). Traits were measured following standardized protocols (Cornelissen et al. 2003, Pérez-Harguindeguy et al. 2013). In the wet forest sites, leaf traits were measured for two sun-lit leaves for 10 adult trees per species (5 individuals for specific force to punch) of ca. 5 m high, and in dry forest for 5 sun-lit leaves for 5 adult trees per species with a DBH of 10-30 cm. Functional trait measurements took place within the study areas, but not inside the plots. For wood density measurements in the wet forest 15 of the 81 species were taken from comparable Mexican ecosystems. The binary traits leaf compoundness, deciduousness, and dispersal syndrome were scored based on field observations, local informants, herbaria, and literature; for detailed methods on functional trait measurements see supplementary material in Lohbeck et al. (2013). We used species’ average trait values although we recognize that intraspecific trait variation may play an important role in species adaptation along environmental gradients. However, given the extensive species-level trait data set (132 species) together with the high species turnover during succession, for the purpose of this study we consider the use of species average trait values legitimized.
Statistical analysisWe used principal component analysis to quantify spectra of trait-based
multivariate plant strategies for each forest type separately. The PCA biplots show
30544 Lohbeck-bk.indd 74 27-10-14 16:42

Functional trait strategies
75
4
the main trade-offs across (standardized) functional traits based on principal axes of variation, where binary variables are treated as dummy variables. Trait spectra for dry and wet forest species were compared by correlating the correlation coefficients of all pairwise trait combinations; in each site 11 traits were measured, resulting in 55 pairwise trait correlations per site. Subsequently the pairwise trait correlation coefficients derived from dry forest species were correlated with the pairwise trait correlation coefficients derived from wet forest species. Spearman correlation coefficients were used, since not all traits are normally distributed, except for relating the binary variables [deciduousness (De), leaf compoundness (LC) and biotic dispersal (Di)] when we used the Phi coefficient, a measure of association between binary variables whose interpretation is similar to correlation coefficients.
Species scores on the first two principal components of the PCA were scaled up to community level using the Community Weighted Mean (CWM) (Garnier et al. 2004, Lavorel et al. 2007), which is calculated as follows:
48
site 11 traits were measured, resulting in 55 pairwise trait correlations per site. Subsequently the pairwise trait correlation coefficients derived from dry forest species were correlated with the pairwise trait correlation coefficients derived from wet forest species. Spearman correlation coefficients were used, since not all traits are normally distributed, except for relating the binary variables [deciduousness (De), leaf compoundness (LC) and biotic dispersal (Di)] when we used the Phi coefficient, a measure of association between binary variables whose interpretation is similar to correlation coefficients.
Species scores on the first two principal components of the PCA were scaled up to community level using the Community Weighted Mean (CWM) (Garnier et al. 2004, Lavorel et al. 2007), which is calculated as follows:
CWM ∑
where S is the total number of species, wi is the relative basal area of the ith species and
xi is the score on the PCA axis of the ith species. Relative basal area is a measure of species’ relative contributions to the total basal area represented by functional trait measurements in each plot (which is in turn at least 80 % of total basal area in a plot). The relative basal area was used for weighting, rather than the abundance, because it reflects the species’ biomass, an indicator of plant performance and adaptation to local conditions. These community weighted mean scores on the PCA axes reflect the average multivariate plant strategy in the community, and were regressed against stand basal area (m2/ha) (including cacti in the case of dry forest). Stand basal area is a structural variable of succession and logarithmically relates to forest age in both forest types (see supplementary material in Lohbeck et al. 2013). Stand basal area was used, and not age, because it better reflects aboveground biomass, understory light interception and environmental conditions (Lebrija-Trejos et al. 2011) as well as competitive interactions (Paquette and Messier 2011). All statistical analyses were carried out using R v. 2.13.1 (R Development Core Team 2011); for multivariate analysis we used the package ‘Vegan’ (Oksanen et al. 2011).
Results
The first two component axes of the PCAs for dry and wet forest species captured more than half of the variation in species trait values (Fig. 1, Table 1). The ordination biplots indicated that the spectra of functional trait-based strategies of the dry forest species were similar to those of the wet forest species. This was confirmed when the pairwise correlation coefficients of the dry forest were plotted against those of the wet forest (Fig. 2, Table 2); the highly significant positive correlation indicated that the same trait associations were found for the species of the two forest types. The first PCA axes were largely related to phenology and reproductive strategies, with deciduous, small-seeded wind-dispersed species on the left side, and species with large seeds, biotic seed dispersal, and thick leaves on the right side (Fig. 1). We will therefore refer to this axis as the deciduousness/ reproductive effort strategy axis. The second PCA axes were related to the plant economics spectrum, with species having acquisitive trait values (e.g., high SLA) at the lower side, and those having conservative trait
where S is the total number of species, wi is the relative basal area of the ith species and xi is the score on the PCA axis of the ith species. Relative basal area is a measure of species’ relative contributions to the total basal area represented by functional trait measurements in each plot (which is in turn at least 80 % of total basal area in a plot). The relative basal area was used for weighting, rather than the abundance, because it reflects the species’ biomass, an indicator of plant performance and adaptation to local conditions. These community weighted mean scores on the PCA axes reflect the average multivariate plant strategy in the community, and were regressed against stand basal area (m2/ha) (including cacti in the case of dry forest). Stand basal area is a structural variable of succession and logarithmically relates to forest age in both forest types (see supplementary material in Lohbeck et al. 2013). Stand basal area was used, and not age, because it better reflects aboveground biomass, understory light interception and environmental conditions (Lebrija-Trejos et al. 2011) as well as competitive interactions (Paquette and Messier 2011). All statistical analyses were carried out using R v. 2.13.1 (R Development Core Team 2011); for multivariate analysis we used the package ‘Vegan’ (Oksanen et al. 2011).
30544 Lohbeck-bk.indd 75 27-10-14 16:42

Chapter 4
76
Results
The first two component axes of the PCAs for dry and wet forest species captured more than half of the variation in species trait values (Fig 4.1, Table 4.1). The ordination biplots indicated that the spectra of functional trait-based strategies of the dry forest species were similar to those of the wet forest species. This was confirmed when the pairwise correlation coefficients of the dry forest were plotted against those of the wet forest (Fig 4.2, Table 4.2); the highly significant positive correlation indicated that the same trait associations were found for the species of the two forest types. The first PCA axes were largely related to phenology and reproductive strategies, with deciduous, small-seeded wind-dispersed species on the left side, and species with large seeds, biotic seed dispersal, and thick leaves on the right side (Fig 4.1). We will therefore refer to this axis as the deciduousness/ reproductive effort strategy axis. The second PCA axes were related to the plant economics spectrum, with species having acquisitive trait values (e.g., high SLA) at the lower side, and those having conservative trait values (e.g., high leaf density, LDMC and WD) at the upper side (Fig 4.1). We refer to this axis as the acquisitive/conservative strategy axis.
There were also some differences between forest types. For example, plants with large leaf laminas and petioles (high LA and PL) had an acquisitive strategy in dry forest (as they were associated with high SLA), whereas such plants rather coincided with a drought avoiding strategy in wet forest (as they were associated with deciduousness, Fig 4.1). Moreover, in dry forest a conservative strategy tended to be associated with a drought avoiding strategy, as the suite of conservative traits (LD, LDMC, WD) tended towards the left side of the biplot where species that are deciduous are positioned. Instead, in wet forest a conservative strategy tended to be associated with species that also have large seeds and that are biotically dispersed, as the conservative traits tended towards the right side of the biplot where evergreen species that invest in large biotically dispersed seeds are positioned.
Directional changes in community-weighted PCA scores indicated successional turnover in multivariate plant strategies for both forest types (Fig 4.3). Interestingly, the main axis that mattered was different for dry and wet forest. Successional changes in dry forest were associated with increasing species scores along the first PCA axis (from high importance of deciduousness early in succession to increased reproductive effort later in succession; Fig 4.3a), whereas
30544 Lohbeck-bk.indd 76 27-10-14 16:42

Functional trait strategies
77
4
successional changes in wet forest were associated with increasing species scores along the second PCA axis (from acquisitive trait values early in succession to conservative trait values later in succession; Fig 4.3b). Results were similar when using age instead of basal area, though dry forest change in multivariate plant strategies proved somewhat stronger whereas wet forest change was weaker and no longer significant (see Fig A4.1 in Appendix).
−1.5 −0.5 0.5 1.5
−1.5
−1.0
−0.5
0.0
0.5
1.0
1.5
Dry forest
De
Di
LC
SLA
LDMCLD
LT
WD
SV
LA
PL
�
�
�
�
�
�
�
�
�
�
�
�
�
�
�
�
�
��
�
�
�
�
�
�
�
�
�
�
�
�
�
�
�
�
�
�
�
�
�
�
�
�
�
�
��
�
�
�
�
a
Axis 1: deciduous −> reproductive effort (34%)
Axi
s 2:
acq
uisi
tive
−> c
onse
rvat
ive
(26%
)
1.5 0.5 −0.5 −1.5
−1.5
−1.0
−0.5
0.0
0.5
1.0
1.5
Wet forest
De
Di
LC
SLA
LDMCLD
LT
WD
SVLAPL
�
�
�
�
�
�
�
�
�
�
�
�
�
�
�
�
�
��
�
�
�
�
�
�
�
�
�
�
�
�
�
�
�
�
�
�
�
�
�
�
�
�
�
�
� �
�
�
�
�
b
Axis 1: deciduous −> reproductive effort (27%)
Axi
s 2:
acq
uisi
tive
−> c
onse
rvat
ive
(25%
)
Figure 4.1: Results of the Principal Component Analyses applied to functional traits of tree species from Mexican tropical dry and wet forests. (a) PCA of dry forest species (n = 51), (b) PCA of wet forest species (n = 81). Species (grey symbols) were separated based on their functional traits shown as arrows; LA= leaf area, SLA = specific leaf area, LD= leaf density, LT= leaf thickness, LDMC= leaf dry matter content, PL= petiole length, WD= wood density, LC= leaf compoundness (0=simple, 1=compound), Di= dispersal syndrome (0=abiotic, 1=biotic), De= deciduousness (0=evergreen, 1=deciduous). LA and PL were ln-transformed.
30544 Lohbeck-bk.indd 77 27-10-14 16:42

Chapter 4
78
�
�
�
��
�
�
�
�
��
�
�
�
�
��
�
�
�
�
�
�
�
�
�
�
��
�
�
�
�
�
�
��
�
�
��
��
�
��
�
�
�
�
�
�
��
�
−1.0 −0.5 0.0 0.5 1.0
−1.0
−0.5
0.0
0.5
1.0
CC traits dry
CC
trai
ts w
et
R = 0.67***
Figure 4.2: Correlation coefficients (CC) of all pairwise trait combinations (11 traits, resulting in 55 pairwise trait combinations per forest type, see Table 4.2) of dry forest species plotted against those of wet forest species. Correlation coefficients represent Spearman coefficients except when relating binary variables, then the Phi coefficient was used. The pairwise correlation coefficients of dry forest proved to be significantly correlated with those of the wet forest (Pearson product moment correlation [R], P < 0.001), indicating that trait spectra are consistent across the two different forest types.
0 5 10 15 20 25 30
−2
−1
0
1
Stand basal area (m2 ha)
deci
duou
s −>
repr
oduc
tive
effo
rt
��
�
�
�
�
�
�
�
�
�
�
�
��
�
�
a
r2 = 0.56**
0 5 10 15 20 25 30
−1.0
−0.5
0.0
0.5
1.0
Stand basal area (m2 ha)
acqu
isiti
ve −
> co
nser
vativ
e
��
�
�
�
�
�
�
��
�
�
�
�
�
�
�
b
r2 = 0.32*
�
�
�
�
�
�
�
�
�
�
�Stand basal area (m2 ha)
dry forest plotsdry forest trend
� wet forest plotswet forest trend
�
�
�
�
�
�
�
�
�
�
�Stand basal area (m2 ha)
Figure 4.3: Changes in the dominant plant strategies with succession. Stand basal area was used to indicate succession; it increased asymptotically with successional age and reflects successional change in vegetation structure. Functional composition was calculated using the community-weighted mean of species scores on the principal component axes. (a) Dry forest succession (open symbols, broken regression line) was characterized by changes along the first PCA axis (Fig 4.1a) and reflected changes from deciduous species to evergreen species that invest in a secure reproductive strategy. (b) Wet forest succession (filled symbols, continuous regression line) was characterized by changes along the second PCA axis (Fig 4.1b) and reflected changes from an acquisitive strategy to a conservative strategy. Given is the r2, * P < 0.05; ** P < 0.01. See Fig A4.1 in Appendix for the trends with fallow age as an indicator of succession.
30544 Lohbeck-bk.indd 78 27-10-14 16:42

Functional trait strategies
79
4
Discussion
We found that tree species from communities growing under very contrasting conditions (dry and wet) face similar functional trait trade-offs, thus confirming the existence of universal trait spectra. The functional turnover with succession in the two forest types, however, reflected different trait spectra, and hence, the changing dominance of different plant strategies. During dry forest succession, species strategies shifted from high importance of deciduousness early in succession towards increased reproductive effort late in succession, whereas during wet forest succession species strategies changed from acquisitive towards conservative strategies. This indicated that dry and wet forest species face different filters during forest succession.
Dry and wet secondary forest species showed similar trait trade-offsWe hypothesized the existence of two major trade-off axes underlying trait
variation in dry and wet forest species, namely the acquisitive-conservative spectrum, and the seed size spectrum, with the spectra reflecting multivariate strategy axes. Our results largely confirmed this hypothesis. The first principal component reflected variation from a deciduous strategy with abiotically (mainly wind-) dispersed species towards evergreen species that invested in biotic seed dispersal, in the dry forest also coinciding with an increased seed size (Fig 4.1). Deciduous species shed their leaves to avoid desiccation and this is an important adaptation to survive severe droughts (Poorter and Markesteijn 2008, Méndez-Alonzo et al. 2013, Pineda-García et al. 2013), which are common in dry forest sites. In both dry and wet forests, deciduous species often also had compound leaves. Compound-leaved species often have photonastic leaves, which can avoid high insolation and therefore high temperature and excessive evaporation by folding their leaflets at noon or during the dry season (e.g., some Fabaceae species). Compoundness also increases leaf cooling and control of water loss (Yates et al. 2010) and is an efficient way of increasing leaf area for light capture (Niinemets 1998). In both dry and wet forest, deciduousness was independent of the acquisitive-conservative continuum, suggesting that deciduous and evergreen species can possess similar resource economics. This is contrary to previous research in temperate forests (Givnish 2002) and across forest types (Villar and Merino 2001). In line with our results, evidence from another Mexican dry forest shows that the deciduous-evergreen dichotomy does not adequately reflect the
30544 Lohbeck-bk.indd 79 27-10-14 16:42
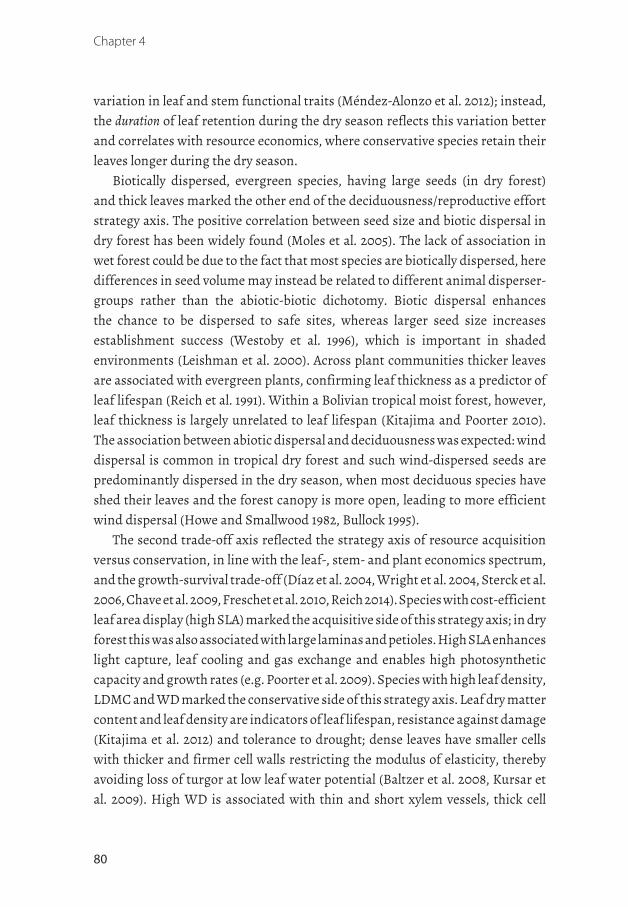
Chapter 4
80
variation in leaf and stem functional traits (Méndez-Alonzo et al. 2012); instead, the duration of leaf retention during the dry season reflects this variation better and correlates with resource economics, where conservative species retain their leaves longer during the dry season.
Biotically dispersed, evergreen species, having large seeds (in dry forest) and thick leaves marked the other end of the deciduousness/reproductive effort strategy axis. The positive correlation between seed size and biotic dispersal in dry forest has been widely found (Moles et al. 2005). The lack of association in wet forest could be due to the fact that most species are biotically dispersed, here differences in seed volume may instead be related to different animal disperser-groups rather than the abiotic-biotic dichotomy. Biotic dispersal enhances the chance to be dispersed to safe sites, whereas larger seed size increases establishment success (Westoby et al. 1996), which is important in shaded environments (Leishman et al. 2000). Across plant communities thicker leaves are associated with evergreen plants, confirming leaf thickness as a predictor of leaf lifespan (Reich et al. 1991). Within a Bolivian tropical moist forest, however, leaf thickness is largely unrelated to leaf lifespan (Kitajima and Poorter 2010). The association between abiotic dispersal and deciduousness was expected: wind dispersal is common in tropical dry forest and such wind-dispersed seeds are predominantly dispersed in the dry season, when most deciduous species have shed their leaves and the forest canopy is more open, leading to more efficient wind dispersal (Howe and Smallwood 1982, Bullock 1995).
The second trade-off axis reflected the strategy axis of resource acquisition versus conservation, in line with the leaf-, stem- and plant economics spectrum, and the growth-survival trade-off (Díaz et al. 2004, Wright et al. 2004, Sterck et al. 2006, Chave et al. 2009, Freschet et al. 2010, Reich 2014). Species with cost-efficient leaf area display (high SLA) marked the acquisitive side of this strategy axis; in dry forest this was also associated with large laminas and petioles. High SLA enhances light capture, leaf cooling and gas exchange and enables high photosynthetic capacity and growth rates (e.g. Poorter et al. 2009). Species with high leaf density, LDMC and WD marked the conservative side of this strategy axis. Leaf dry matter content and leaf density are indicators of leaf lifespan, resistance against damage (Kitajima et al. 2012) and tolerance to drought; dense leaves have smaller cells with thicker and firmer cell walls restricting the modulus of elasticity, thereby avoiding loss of turgor at low leaf water potential (Baltzer et al. 2008, Kursar et al. 2009). High WD is associated with thin and short xylem vessels, thick cell
30544 Lohbeck-bk.indd 80 27-10-14 16:42
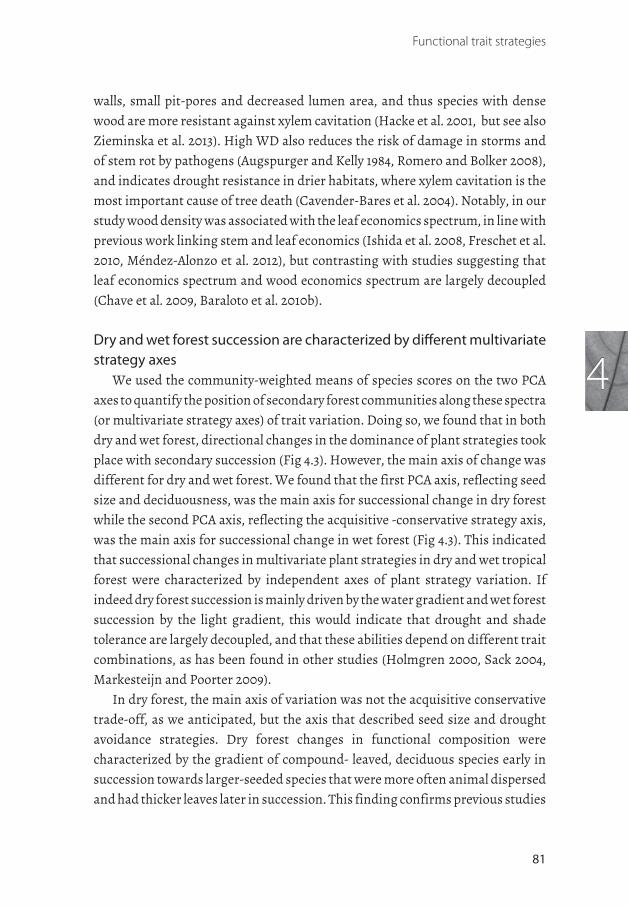
Functional trait strategies
81
4
walls, small pit-pores and decreased lumen area, and thus species with dense wood are more resistant against xylem cavitation (Hacke et al. 2001, but see also Zieminska et al. 2013). High WD also reduces the risk of damage in storms and of stem rot by pathogens (Augspurger and Kelly 1984, Romero and Bolker 2008), and indicates drought resistance in drier habitats, where xylem cavitation is the most important cause of tree death (Cavender-Bares et al. 2004). Notably, in our study wood density was associated with the leaf economics spectrum, in line with previous work linking stem and leaf economics (Ishida et al. 2008, Freschet et al. 2010, Méndez-Alonzo et al. 2012), but contrasting with studies suggesting that leaf economics spectrum and wood economics spectrum are largely decoupled (Chave et al. 2009, Baraloto et al. 2010b).
Dry and wet forest succession are characterized by different multivariate strategy axes
We used the community-weighted means of species scores on the two PCA axes to quantify the position of secondary forest communities along these spectra (or multivariate strategy axes) of trait variation. Doing so, we found that in both dry and wet forest, directional changes in the dominance of plant strategies took place with secondary succession (Fig 4.3). However, the main axis of change was different for dry and wet forest. We found that the first PCA axis, reflecting seed size and deciduousness, was the main axis for successional change in dry forest while the second PCA axis, reflecting the acquisitive -conservative strategy axis, was the main axis for successional change in wet forest (Fig 4.3). This indicated that successional changes in multivariate plant strategies in dry and wet tropical forest were characterized by independent axes of plant strategy variation. If indeed dry forest succession is mainly driven by the water gradient and wet forest succession by the light gradient, this would indicate that drought and shade tolerance are largely decoupled, and that these abilities depend on different trait combinations, as has been found in other studies (Holmgren 2000, Sack 2004, Markesteijn and Poorter 2009).
In dry forest, the main axis of variation was not the acquisitive conservative trade-off, as we anticipated, but the axis that described seed size and drought avoidance strategies. Dry forest changes in functional composition were characterized by the gradient of compound- leaved, deciduous species early in succession towards larger-seeded species that were more often animal dispersed and had thicker leaves later in succession. This finding confirms previous studies
30544 Lohbeck-bk.indd 81 27-10-14 16:42

Chapter 4
82
showing that deciduousness and leaf compoundness are particularly important during the extra dry environments in early-successional stages (cf. Ross et al. 2001, Poorter and Markesteijn 2008, Pineda-García et al. 2013). The proportion of species that depend on animals for seed dispersal increased during tropical dry forest succession (though it remained low compared to wet forest sites: Fig 4.3a), as did the seed size. This confirms that early-successional species invest in many small seeds that can travel large distances (e.g., by wind), whereas late-successional species are more likely to invest in fruits that attract biotic dispersers to enhance directional dispersal. Given that the second principal component (acquisitive/conservative strategy axis) was relatively unimportant, it is likely that in our dry forest sequence drought avoidance (characterized by deciduousness) was more important than drought resistance (characterized by conservative traits).
In wet forest, the main axis of variation was described by changes in functional composition from acquisitive to conservative trait values (Fig 4.3b), a result that complies with expectations based on decreasing light availability during succession (Garnier et al. 2004, Kahmen and Poschlod 2004, Dahlgren et al. 2006, Lohbeck et al. 2013, Poorter et al. in press). Regenerative traits did not play a role in species assembly along the gradient of wet forest succession as we found no increase in biotically-dispersed trees, nor an increase in seed size. Instead, biotic dispersal was common throughout the successional gradient, in line with previous studies (Young et al. 1987). Increasing seed size, an important trait for establishment success under shaded conditions (Leishman et al. 2000) was not found; possibly it could start playing a role at later successional stages or in forest positioned in a more intact landscape forest-matrix.
We investigated a dry (900 mm/yr) and a wet forest (3000 mm/yr) chronosequence and showed that tree species are constrained by similar trade-offs, though this had different consequences for the success of plant strategies during succession. This confirms that dry and wet forest species face different filters during succession. A challenging issue is how the relative strength of these different filters (light and water) changes along the large precipitation gradient found across tropical regions and the consequences thereof for functional composition of successional communities. This is relevant because throughout the tropics the importance of secondary and degraded forests is increasing (FAO 2010b) and there is great need to understand its effects on biodiversity and ecosystem functioning (MA 2005). Moreover, restoration plantings with local
30544 Lohbeck-bk.indd 82 27-10-14 16:42

Functional trait strategies
83
4
species that mimic natural regeneration may be needed to speed up forest recovery and improve biodiversity conservation and ecosystem services delivery (Chazdon 2008). A switch from water being replaced by light as the main filter somewhere along the precipitation gradient has direct consequences for forest restoration activities and the selection of to-be-planted species with characteristics that fit with the main filters (cf. Martínez-Garza et al. 2013).
This study showed that similar trait spectra were observed among dry and wet secondary forest species, but with different consequences for succession. In dry forest succession the dominant plant strategies changed from drought avoiding species towards species that invest in large biotically dispersed seeds, which can be explained by water limitations in early succession. In wet forest succession the dominant plant strategies changed from species having acquisitive towards species with conservative strategies, which can be explained by decreasing light availability as the main driver of wet forest succession.
Acknowledgements
We are indebted to the people of Nizanda, Oaxaca, and Loma Bonita, Chiapas, for their hospitality and assistance during field work. We appreciate landowners’ cooperation and permission to enter their fields and collect plant material for conducting this research. This work received invaluable input from many people: Gilberto Jamangapé, Jorge Rodríguez-Velázquez, Marco Romero, Eduardo A. Pérez-García, Eva van den Elzen, Erik Peters, Paul van Esch, Michiel van Breugel, Alejandra Tauro, Eunice Romero-Pérez and Horacio Paz.
30544 Lohbeck-bk.indd 83 27-10-14 16:42

Chapter 4
84
Table 4.1: Eigenvector scores of functional traits on the two main principal components for dry forest and for wet forest. Values in parentheses indicate variance accounted for by each axis. §Variable was ln-transformed.
Traits Dry forest Wet forest
PC1 (34%) PC2 (26%) PC1 (27%) PC2 (25%)
LA§ -0.141 -0.378 0.446 0.026
SLA -0.072 -0.327 0.163 -0.352
LDMC -0.327 0.343 -0.158 0.528
LD -0.328 0.290 0.032 0.574
LT 0.383 -0.014 -0.205 -0.231
PL§ -0.094 -0.482 0.513 0.031
LC -0.401 0.012 0.411 0.225
WD -0.205 0.458 -0.275 0.364
De -0.424 -0.230 0.340 0.150
Di 0.424 0.230 -0.279 -0.038
SV 0.206 -0.025 -0.079 0.079
30544 Lohbeck-bk.indd 84 27-10-14 16:42

Functional trait strategies
85
4
Table 4.2: Spearman regression coefficients of the pairwise relations between variables and the principal components (Fig 4.1). Relations between the binary variables (LC, De and Di) are phi coefficients. §Variable was ln-transformed. Lower-left half of the matrix corresponds to dry forest species (n=51), Upper-right half corresponds to wet forest species (N=81). * p<0.05, ** p<0.01, ***p< 0.001.
PCA1 PCA2 LA§ SLA LDMC LD LT PL§ LC WD De Di SV
PCA1 -0.08 0.75***
0.33**
-0.33**
-0.04 -0.36***
0.89***
0.68***
-0.48***
0.48***
-0.45***
-0.23*
PCA2 -0.01 0.08 -0.59***
0.86***
0.94***
-0.25*
0.04 0.38***
0.58***
0.22*
0.06 0.23*
LA§ -0.18 -0.71***
-0.07 -0.17 0.09 -0.12 0.79***
0.56***
-0.26*
0.26*
-0.10 -0.07
SLA -0.16 -0.51***
0.18 -0.50***
-0.57***
-0.50***
0.11 -0.03 -0.29**
0.05 -0.26*
-0.10
LDMC -0.70***
0.42**
-0.09 -0.24 0.80***
-0.21 -0.19 0.05 0.49***
-0.01 0.15 0.18
LD -0.72***
0.49***
-0.16 -0.29*
0.64***
-0.27*
0.07 0.34**
0.45***
0.17 0.08 0.16
LT 0.78***
-0.05 -0.01 -0.47***
-0.44**
-0.65***
-0.24*
-0.31**
-0.08 -0.15 0.23*
-0.09
PL§ -0.04 -0.77***
0.63***
0.09 -0.18 -0.27 0.15 0.57***
-0.35**
0.36***
-0.31**
-0.17
LC -0.77***
-0.10 0.28*
0.09 0.63***
0.40**
-0.41**
0.15 -0.07 0.47***
-0.18 0.09
WD -0.41**
0.59***
-0.29*
-0.26 0.54***
0.51***
-0.29*
-0.39**
0.28*
-0.11 0.11 0.29**
De -0.76***
-0.43**
0.28 0.28 0.28*
0.30*
-0.49***
0.36**
0.55***
0.13 -0.48***
-0.05
Di 0.76***
0.43**
-0.28 -0.28 -0.28*
-0.30*
0.49***
-0.36**
-0.55***
-0.13 -1.00***
0.21
SV 0.50***
-0.02 0.25 -0.31*
-0.30*
-0.30*
0.52***
0.18 -0.34*
-0.27 -0.50***
0.50***
30544 Lohbeck-bk.indd 85 27-10-14 16:42

Chapter 4
86
Appendix 4
0 5 10 15 20 25 30
−2
−1
0
1
Stand basal area (m2 ha)
deci
duou
s −>
repr
oduc
tive
effo
rt
��
�
�
�
�
�
�
�
�
�
�
�
��
�
�
a
r2 = 0.56** (d)
r2 = 0.10 (w)
0 5 10 15 20 25 30
−1.0
−0.5
0.0
0.5
1.0
Stand basal area (m2 ha)
acqu
isiti
ve −
> co
nser
vativ
e
��
�
�
�
�
�
�
��
�
�
�
�
�
�
�
b
r2 = 0.32* (w)
r2 = 0.09 (d)
0 10 20 30 40 50 60
−2
−1
0
1
age (years)
deci
duou
s −>
repr
oduc
tive
effo
rt
��
�
�
�
�
�
�
�
�
�
�
�
��
�
�
c
r2 = 0.58** (d)
r2 = 0.09 (w)
0 10 20 30 40 50 60
−1.0
−0.5
0.0
0.5
1.0
age (years)
acqu
isiti
ve −
> co
nser
vativ
e
���
�
�
�
�
�
��
�
�
�
�
�
�
�
d
r2 = 0.14 (w)
r2 = 0.05 (d)
�
�
�
�
�
�
�
�
�
�
�
dry forest plotsdry forest trend
� wet forest plotswet forest trend
Figure A4.1: Changes in the dominant plant strategies with succession, using two different indicators of succession: stand basal area (a, b) and fallow age (c, d). Functional composition was calculated using the community-weighted mean of species scores on the principal component axes (Fig 4.1). Dry forest succession (open symbols, [d], broken regression line) was characterized by changes along the first PCA axis and reflected changes from deciduous species to evergreen species that invest in a secure reproductive strategy. This was significant when using stand basal area as a successional indicator (a), and when using fallow age (c). Wet forest succession (solid symbols, [w], continuous regression line) was characterized by changes along the second PCA axis and reflected changes from an acquisitive strategy to a conservative strategy. This was significant when using stand basal area as successional indicator (b), but not when using fallow age (d). Given is the r2, * P < 0.05; ** P < 0.01.
30544 Lohbeck-bk.indd 86 27-10-14 16:42

30544 Lohbeck-bk.indd 87 27-10-14 16:42

30544 Lohbeck-bk.indd 88 27-10-14 16:42

Changing drivers of species dominance during tropical forest
succession
Madelon Lohbeck, Lourens Poorter, Miguel Martínez-Ramos, Jorge Rodriguez-Velázquez, Michiel van Breugel, Frans Bongers
Published in Functional Ecology (2014) 28: 1052-1058
30544 Lohbeck-bk.indd 89 27-10-14 16:42

Chapter 5
90
Abstract
Deterministic theories predict that local communities assemble from a regional species pool based on niche differences, thus by plant functional adaptations. We tested whether functional traits can also explain patterns in species dominance among the suite of co-occurring species.
We predicted that along a gradient of secondary succession the main driver of species dominance changes from environmental filtering in the relatively harsh (dry and hot) early successional conditions, towards increased competitive interactions and limiting similarity in later successional conditions (when light is limited). We used the Kurtosis (K) (a measure of peakedness) of the functional trait distribution of secondary forest communities in high-diversity tropical rainforest in Chiapas, Mexico. The forests ranged 1 to 25 years in age, and we used 8 functional leaf traits related to a plants’ carbon, water and heat balance. We calculated the functional trait distribution based on species dominance, where trait values were weighted by species’ relative basal area, as well as based on species presence, all species counting once. “K-ratio” was subsequently computed by dividing kurtosis based on species dominance by kurtosis based on species presence. If the K-ratio is high, the dominant species are functionally similar and we interpreted this as environmentally driven functional convergence allowing species to become dominant. If the K-ratio is small, dominant species are a functionally dissimilar subset of the species present and we interpreted this as competitively driven functional divergence allowing species to become dominant.
We found that in early succession dominant species represent a functionally narrow subset of species with similar traits and in late succession dominant species increasingly represent a wide subset of the species present. This trend was found for traits that reflect photosynthetic performance and light capture, and indicates increased competition for light with succession. No trend was found for traits that indicate defense against herbivory, suggesting no successional changes in herbivore pressure.
This is one of the first studies showing that drivers of species dominance change along a gradient of secondary succession. During the early successional time window we evaluated, the importance of environmental filtering as a driving force fades away rapidly, and the importance of niche partitioning for species dominance starts to emerge.
30544 Lohbeck-bk.indd 90 27-10-14 16:42

Species dominance and succession
91
5
Keywords: Chiapas, Functional convergence / divergence, Functional traits, Environmental filtering, Kurtosis, Light gradient partitioning, Mexico, Secondary succession
30544 Lohbeck-bk.indd 91 27-10-14 16:42

Chapter 5
92
Introduction
Community assembly processes are crucial for explaining species coexistence and maintenance of biodiversity (Hubbell 2001, Wright 2002). The mechanisms by which local communities assemble remain debated however, although many advances have been made in the last decade (e.g. Davis et al. 2005, Ackerly and Cornwell 2007, Chase 2010, Uriarte et al. 2010). Deterministic theories predict that niche differences create differential responses of species to environmental conditions and to different interspecific interactions. The environmental filtering hypothesis (Weiher and Keddy 1995, Díaz et al. 1999), for example, predicts that species are functionally adapted to survive and grow under specific environments and species with similar traits are therefore found in similar habitats, a phenomenon also known as trait-convergence (e.g. Pavoine et al. 2011). The limiting similarity hypothesis (Macarthur and Levins 1967) postulates that under resource-limiting conditions competition leads to niche differentiation of co-occurring species (Hardin 1960, Grime 1973). Competing species can therefore only coexist if they differ in their traits (limiting similarity), a phenomenon which is also known as trait-divergence. Alternatively biodiversity is the result of neutral drift, in which all species of the same trophic level have equal chances of becoming abundant and are functionally equivalent, despite having different functional traits (Hubbell 2001). Different assembly processes may simultaneously affect local community structure (Helmus et al. 2007, Cornwell and Ackerly 2009) and their relative importance may change along environmental gradients (Mason et al. 2007, 2013).
Secondary succession is community assembly in action (Lebrija-Trejos et al. 2010b) and therefore provides an ideal setting to test whether functional traits are indeed important for community assembly. In this study we analyze functional trait distributions as indicators of changing drivers of species dominance during secondary succession. Although we consider species dominance one aspect of community assembly, this contrasts with the commonly used concept of community assembly processes where the focus is on assembly of local communities from a regional species pool. To avoid confusion and to underline the difference we use the term drivers of species dominance, not community assembly processes. Previous studies have explored the relative importance of the process of environmental filtering and competition by comparing trait characteristics of species in the local community with that of the regional
30544 Lohbeck-bk.indd 92 27-10-14 16:42

Species dominance and succession
93
5
species pool, demonstrating a link between species presence (and sometimes also abundance) and their traits (e.g. de Bello et al. 2009, Marteinsdóttir and Eriksson 2013). This does not necessarily imply that functional traits can also explain patterns in species dominance among the suite of co-occurring species (Cingolani et al. 2007). Cornwell and Ackerly (2010) have shown that species’ abundances are correlated with functional traits and recent advances have modeled species abundances based on functional traits (using methods like maximum entropy and hierarchical Bayesian models) (Merow et al. 2011, Shipley et al. 2011, Laughlin and Laughlin 2013).
Recognizing two alternative drivers of species dominance; the environmentally driven process selecting individuals with similar traits versus the competitively driven process selecting individuals with dissimilar traits, we ask what drives species dominance, and whether the relative importance of these drivers changes along a successional gradient. We do so by using kurtosis to describe the “peakedness” of the trait distribution of the community (in line with Kraft et al. 2008) for the species present in a site and based on species dominance (weighted by relative basal area) in a site. Subsequently, the logarithm of the ratio (kurtosis based on species dominance)/(kurtosis based on species presence), hereafter referred as K-ratio, is tested for changes along the successional gradient. We thereby evaluate successional shifts in the relative contribution of environmentally driven and competitively driven processes that underlie species dominance: when K-ratio is positive, the main force driving species dominance is environmental filtering as filtering selects species with similar traits; in contrast, when K-ratio is negative, the main force is the competitively driven process leading to limiting similarity as competition selects species with dissimilar traits (Webb et al. 2002, Grime 2006, Kraft et al. 2008, Mouchet et al. 2010). Conceptually, Figure 5.1 shows how the predicted decrease of K-ratio during succession is translated into a shift in relative importance from environmentally driven to competitively driven processes.
30544 Lohbeck-bk.indd 93 27-10-14 16:42

Chapter 5
94
Kur
tosi
s-ra
tio
Succession
Environmentally driven
Competitively driven
low
hi
gh
early late
0
Figure 5.1: Conceptualized changes in K-ratio (kurtosis change, or trait distribution change, from species presence to species dominance) during secondary succession. The K-ratio is expected to shift from high values early in succession (Kdominance exceeds Kpresence) to lower values late in succession (Kpresence exceeds Kdominance), indicated by a negative relationship. This reflects a shift in the relative importance of environmental filtering in early stages of succession towards competitively driven processes leading to limiting similarity in later stages, recognizing that both drivers are influencing species dominance at all times.
Previous studies have shown that different trait values become important for species success at different points along habitat gradients (e.g. Lebrija-Trejos et al. 2010b, Violle et al. 2010, Lohbeck et al. 2013). Early in succession resources (e.g. light) are abundant and dominant species are likely the ones that successfully exploit these resources for growth and reproduction (few functional strategies dominate). It is expected that the importance of competition increases with succession because resources become limited as stand biomass increases (Grubb 1977). Such increased competitive pressure will lead to differentiated strategies to obtain the increasingly scarce resources, with concomitant different functional traits, a process leading to increasingly limited trait similarity.
In this paper we evaluate whether and how the relative contribution of environmentally and competitively driven processes to species dominance changes with succession and whether functional traits can be used as indicators of this change. We evaluated functional traits for 81 woody species occurring along a chronosequence of secondary forests in high-diversity tropical rainforest in southern Mexico. We selected 8 functional traits that are important for the carbon, water, and heat balance of plants and hence for species success. These 8 traits can be divided into two groups; traits reflecting photosynthetic performance
30544 Lohbeck-bk.indd 94 27-10-14 16:42

Species dominance and succession
95
5
and light capture and traits related to herbivore defense. We hypothesized that early successional forests are mostly shaped by environmentally driven processes (higher kurtosis when weighted by species dominance) and as forests get older and structurally more complex they are increasingly shaped by competitively driven processes leading to limiting similarity (lowered kurtosis when weighted by species dominance). As light is the major factor limiting growth in wet tropical forest we expect this to be true for leaf traits reflecting photosynthetic performance and light capture. We expect no pattern for defense traits as we predict no successional change in herbivore pressure. To assess these hypotheses, we compared the empirical (observed) successional trajectory of K-ratio with randomly generated trajectories.
Methods
Research site and species selectionResearch plots are located in the wet tropical forest surrounding the village
of Loma Bonita in the Marqués de Comillas region in Chiapas, southeast Mexico (16°01’N, 90°55’W). Mean annual temperature is 24°C and mean annual precipitation is 3000 mm, with a dry period (less than 100 mm per month) from February through April (van Breugel et al. 2006). The research area is characterized by small hills and valleys with sandy, limestone or clay soils of low pH (<5.5). Seventeen secondary forest plots (0.1 ha) with different fallow ages (<1-25 years) were established on abandoned maize fields. Each plot was divided into two 10 × 50 m subplots. In one subplot all individuals with DBH ≥ 1 cm were identified and measured, in the second all individuals DBH ≥ 5 cm. Species-level variables were scaled up according to sampling effort per size-class (i.e. sampling effort for 1 ≤ DBH ≤ 5 is half the sampling effort for DBH ≥ 5). For functional trait measurement those species were selected that made up at least 80% of the stand basal area (average 92%) in each plot, being 81 species in total.
Functional traitsFor each species, 8 leaf functional traits were considered; leaf area, specific
leaf area, leaf dry matter content, leaf density, leaf thickness, petiole length, chlorophyll content and specific force to punch. These were measured on two sun-lit leaves per individual, on 10 replicate small adult trees of ca. 5 meters high per
30544 Lohbeck-bk.indd 95 27-10-14 16:42

Chapter 5
96
species. The leaf mechanical resistance (specific force to punch) and chlorophyll content were measured for 5 individuals per species. Traits were measured following standardized protocols (Cornelissen et al. 2003). For analyses we used species’ mean functional trait values, although we acknowledge that intraspecific functional trait variation could have improved the accuracy (Baraloto et al. 2010c). However, given the extensive species-level trait dataset (81 species) and the high species turnover during succession, for the purpose of this research we consider the use of species mean trait values meaningful.
Chlorophyll content per unit area (Chl, in SPAD-units) was measured directly on the tree with a SPAD meter (Minolta SPAD-502, Spectrum Technologies, Plainfield, Illinois, USA). SPAD values correspond closely with independent measurements of chlorophyll contents (Coste et al. 2010). After collection the leaves were rehydrated after which fresh weight was determined. Petiole length (cm) and leaf thickness (mm) were measured with a tape measure or a digital calliper. Leaves were photographed on a light box after which leaf area was calculated using pixel counting software ImageJ (Rasband 2008). Leaves were dried until constant weight (at 70 °C) and weighed. Specific Leaf Area (SLA, m2 kg-1) was calculated as fresh leaf area divided by oven-dried mass, Leaf Dry Matter Content (g g-1) as leaf oven-dry weight divided by fresh weight, Leaf Density (g cm-3) was calculated as leaf dry mass divided by leaf volume (in which volume is calculated as leaf area multiplied by thickness).
Fresh leaf laminas were punched with a penetrometer built with a flat-end nail attached to the inner part of a syringe and a waterbasin on top. The total weight added to penetrate the leaf was converted to Mega Newton. The specific force to Punch (sFtP, MN m-2) was calculated as the force divided over the breaking surface of the hole (circumference of the nail x thickness of the leaf). This alternative punching method is comparable to cutting and tearing tests and is a good indicator of leaf mechanical resistance (Onoda et al. 2011).
Statistical analyses We use stand basal area, instead of fallow age, as the successional variable.
Stand basal area logarithmically increases with fallow age (R2 = 0.70, p < 0.001), it is a good descriptor of aboveground biomass, it correlates closely with light interception and changes in environmental conditions (Lebrija-Trejos et al. 2011) and may reflect competitive interactions (Paquette and Messier 2011). To quantify the distribution of trait values in the community the Pearson’s measure
30544 Lohbeck-bk.indd 96 28-10-14 08:54

Species dominance and succession
97
5
of Kurtosis (K) was calculated for each of the 8 traits in each community using the package ‘moments’ in R (Komsta and Novomestky 2012). Pearson’s Kurtosis implies that a mesokurtic distribution has a value of 0, platykurtic distributions are indicated by negative values (lower bound -2) suggesting limiting similarity and leptokurtic distributions by positive values suggesting environmental filtering. Kurtosis was calculated in two ways; for the species present in a site (all species counted once; Kpresence) and for species dominance (species weighted by relative basal area; Kdominance) (see also Figure A5.2 for rank-dominance curves). We chose to weight by the relative basal area, rather than abundance, because it better reflects the species’ biomass, an indicator of plant performance and adaptation to local conditions. To determine Kdominance species present were multiplied by their percentage of the stand basal area (species contributing <1% were excluded). Subsequently the relative change in kurtosis from species presence to dominance was calculated as:
61
mass divided by leaf volume (in which volume is calculated as leaf area multiplied by thickness).
Fresh leaf laminas were punched with a penetrometer built with a flat-end nail attached to the inner part of a syringe and a waterbasin on top. The total weight added to penetrate the leaf was converted to Mega Newton. The specific force to Punch (sFtP, MN m-2) was calculated as the force divided over the breaking surface of the hole (circumference of the nail * thickness of the leaf). This alternative punching method is comparable to cutting and tearing tests and is a good indicator of leaf mechanical resistance (Onoda et al. 2011).
Statistical analyses
We use stand basal area, instead of fallow age, as the successional variable. Stand basal area logarithmically increases with fallow age (R2 = 0.70, p < 0.001), it is a good descriptor of aboveground biomass, it correlates closely with light interception and changes in environmental conditions (Lebrija-Trejos et al. 2011) and may reflect competitive interactions (Paquette and Messier 2011). To quantify the distribution of trait values in the community the Pearson’s measure of Kurtosis (K) was calculated for each of the 8 traits in each community using the package ‘moments’ in R (Komsta and Novomestky 2012). Pearson’s Kurtosis implies that a mesokurtic distribution has a value of 0, platykurtic distributions are indicated by negative values (lower bound -2) suggesting limiting similarity and leptokurtic distributions by positive values suggesting environmental filtering. Kurtosis was calculated in two ways; for the species present in a site (all species counted once; Kpresence) and for species dominance (species weighted by relative basal area; Kdominance) (see also Figure A5.2 for rank-dominance curves). We chose to weight by the relative basal area, rather than abundance, because it better reflects the species’ biomass, an indicator of plant performance and adaptation to local conditions. To determine Kdominance species present were multiplied by their percentage of the stand basal area (species contributing <1% were excluded). Subsequently the relative change in kurtosis from species presence to dominance was calculated as:
When K-ratio is higher than zero, Kdominance exceeds Kpresence (Kdominance is more peaked
than Kpresence) and indicates that dominant species are convergent in functional characteristics, which we interpret as environmental filtering being the main driver of species dominance. When K-ratio is lower than zero, Kpresence exceeds Kdominance (Kdominance is more evenly spread than Kpresence) and the competitively driven process resulting in limiting similarity is the main driver of species dominance. Changes in K-ratio with stand basal area were tested using linear regression.
To test whether the observed changes of K-ratio are ecologically meaningful, we also generated random values for K-ratio. Doing so, a random Kdominance is computed by randomly attributing trait values from within the community to the communities’ dominance structure (see figure A5.2 for the rank dominance curve of some plots). This is done 999 times for each of the communities and for all traits, after which a random K-ratio was calculated by dividing the random Kdominance over Kpresence. The randomly generated K-ratio values were then
When K-ratio is higher than zero, Kdominance exceeds Kpresence (Kdominance is more peaked than Kpresence) and indicates that dominant species are convergent in functional characteristics, which we interpret as environmental filtering being the main driver of species dominance. When K-ratio is lower than zero, Kpresence exceeds Kdominance (Kdominance is more evenly spread than Kpresence) and the competitively driven process resulting in limiting similarity is the main driver of species dominance. Changes in K-ratio with stand basal area were tested using linear regression.
To test whether the observed changes of K-ratio are ecologically meaningful, we also generated random values for K-ratio. Doing so, a random Kdominance is computed by randomly attributing trait values from within the community to the communities’ dominance structure (see figure A5.2 for the rank dominance curve of some plots). This is done 999 times for each of the communities and for all traits, after which a random K-ratio was calculated by dividing the random Kdominance over Kpresence. The randomly generated K-ratio values were then regressed against stand basal area, resulting in an average randomized regression coefficient and corresponding confidence intervals (95%). These were compared with the regression coefficient of the observed K-ratio with stand basal area. All statistical analyses were carried out using R v. 3.0.0 (R Development Core Team 2011).
30544 Lohbeck-bk.indd 97 27-10-14 16:42

Chapter 5
98
Results
For 4 out of the 8 traits (SLA, leaf area, leaf thickness and chlorophyll content) the K-ratio decreased significantly as stand basal area increased (Fig 5.2). These patterns indicate that, during stand development, the functional distribution of dominant species is more leptokurtic (peaked) in early succession and becomes increasingly platykurtic (more evenly spread) compared to the functional distribution of the species present in the community. Randomly generated functional trait distributions (random K-ratio) for each of the existing communities showed no pattern with stand basal area (grey line in Fig 5.2). Indeed the slope of the observed trends differed significantly from the randomly generated functional trait distributions (Table A5.1 in Appendix).
�
�
�
�
�
�
��
�
�
�
��
��
�
�
0 5 10 15 20 25 30 35
−1.0
0.0
0.5
1.0
1.5
K−r
atio
SLA
a
R²= 0.34*
�
� �
�
�
��
�
�
�
�
�
�
��
�
�
0 5 10 15 20 25 30 35
−1.5
−0.5
0.5
1.5
K−r
atio
LA
b
R²= 0.27*
�
�
� �
�
�
���
�
�
�
�
�
�
�
�
0 5 10 15 20 25 30 35
−2−1
01
2
K−r
atio
LT
c
R²= 0.23*
�
�
�
�
�
�
�
�
�
�
�
�
�
�
�
�
�
0 5 10 15 20 25 30 35
−0.5
0.0
0.5
1.0
1.5
K−r
atio
Chl
d
R²= 0.51**
�
�
�
�
�
�
�
�
�
�
�Stand basal area (m2 ha)
�
�
�
�
�
�
�
�
�
�
�Stand basal area (m2 ha)
Figure 5.2: The relative change in kurtosis from species presence to species dominance (K-ratio = ln(Kdominance / Kpresence)) decreases with succession expressed as stand basal area (m2/ha), indicating a decreased effect of environmentally driven filtering and an increased effect of competitively driven processes shaping species dominance. a) Specific Leaf Area (SLA), b) Leaf Area (LA), c) Leaf Thickness (LT), d) Chlorophyll content (Chl). Given are the linear model R2, * p < 0.05, ** p < 0.01 of the observed trend (solid line), in grey the median regression through the randomized data is given (not significant), slopes of the observed trends are significantly different from the randomized trends (999 randomizations, see Table A5.1).
30544 Lohbeck-bk.indd 98 27-10-14 16:42

Species dominance and succession
99
5
Discussion
We used kurtosis to describe the distribution of functional traits in the community and showed that in early succession dominant species are a functionally narrow subset of the species present and that this subset widens with succession. We interpret this as a gradually shifting importance of different drivers of species dominance; environmentally-driven filtering decreases and competitively driven limiting similarity increases with succession.
Gradual change in drivers of species dominance during successionFor four functional traits, the trait distribution of the dominant species
became relatively more evenly spread during succession compared to the trait distribution of the species present in the community. This is in line with our hypothesis that the dominant species become functionally less similar and more divergent during secondary forest succession. This suggests that during succession, the competitively driven process leading to limiting similarity becomes gradually more important and the process of environmental filtering less important in shaping species dominance. Although at later successional stages the observed trend approaches the randomized trend, the observed K-ratio never drops below the random K-ratio, with the exception of SLA (Fig 5.2). Never do we find that observed communities are more platykurtic, dominants representing a wider subset of species present, than the randomly generated communities. Possibly our successional gradient is too short (up to 25 years after abandonment) or our plots are too large, as biotic interactions that result in limiting similarity predominantly take place at smaller spatial scales (Swenson et al. 2007).
The trends in drivers of species dominance are largely consistent with findings in the literature on community assembly processes. Letcher et al. (2012) found increasing phylogenetic evenness during succession in a study on secondary forests across the Neotropics (including our study region). Similarly, Holdaway & Sparrow (2006) found increasing evenness in functional group abundances with successional age on riverbeds, and explain this by increased importance of competition at later stages of succession. Also Cardinale et al. (2007) concluded in their review article that, as a result of niche partitioning, species become increasingly complementary in their resource uptake with time (in experiments). This suggests that the increasing functional trait complementarity among
30544 Lohbeck-bk.indd 99 27-10-14 16:42

Chapter 5
100
dominants during tropical forest succession may reflect general patterns of natural population dynamics that can be found across vegetation types.
Species presence and species dominance may be driven by different factors
The focus of this study is drivers of species dominance, emphasizing the functional traits of species that are dominant, compared to the traits of the species that are present in the community. As explained, this is distinct from those studies emphasizing community assembly processes selecting species present in a plot from the regional species pool. These distinct methods may reflect different processes, one shaping species presence and the other shaping species dominance, which may be driven by different mechanisms (Keddy 1992, Cingolani et al. 2007). Choice of the method thereby depends on the research interests. For example, species presence is determined by species’ establishment success and mechanisms thereby include natural regeneration, dispersal limitation, and connectivity to the species pool within the landscape matrix. This line of research is crucial for assessing the impact of habitat fragmentation on natural regeneration and maintenance of biodiversity in fragmented landscapes. Instead species dominance (the focus of the current study) is mainly influenced by species’ adaptations to local conditions and biotic interactions affecting plant growth and population dynamics. This line of research matters more for assessing land-use impacts on ecosystem properties and functions, which are largely driven by the characteristics of dominant species (Grime 1998, Smith and Knapp 2003).
The rationale behind this manuscript is that species dominance is influenced by local adaptation to environmental conditions and competitive interactions. Of course, the species present at the site have passed a dispersal filter already (Myers and Harms 2009) which may indirectly influence the patterns found in this study. For example, pioneers species with productive, high SLA leaves that reach high abundances in early successional stages may also have arrived in large numbers because of the correlated suite of regenerative traits (i.e., many small seeds), which allows them to become dominant. We recognize the important role of seed dispersal and dispersal limitation in community assembly during secondary forest succession (Guariguata and Ostertag 2001). However, we feel that this affects our results only to a limited extent, as we focus on the species that have already successfully dispersed to our sites, and we evaluate then what factors shape their subsequent dominance.
30544 Lohbeck-bk.indd 100 27-10-14 16:42

Species dominance and succession
101
5
Light capture traits, not defense traits, shape species dominance during early succession
Declining K-ratio during succession is an indicator that competitive interactions become more important over time. Traits central to the leaf economics spectrum are important indicators of changing drivers of species dominance, because aboveground competition for light is more important than belowground competition for water and nutrients at early stages of secondary tropical forest succession (van Breugel et al. 2012). In our study sites SLA, leaf area, leaf thickness, and chlorophyll content of the dominant species became more divergent with increasing stand development (Fig 5.2). These traits are central to species’ photosynthetic performance and growth potential and vary along light gradients. SLA is a strong driver of interspecific variation in growth responses to the light gradient (e.g. Poorter 1999). A large leaf lamina indicates an efficient light foraging strategy (Bazzaz and Pickett 1980, Takenaka 1994). Leaf thickness has been related to high photosynthetic capacities per unit leaf area (Niinemets 2001), thick leaves are expensive to construct and are associated with a longer leaf lifespan (Reich et al. 1991, but see Kitajima and Poorter 2010). Chlorophyll content reflects light capture efficiency per unit leaf area (Rozendaal et al. 2006) which is important for individuals growing in the shade (Poorter and Bongers 2006). During succession understory light availability decreases rapidly, inducing the creation of different light niches. Our results thereby suggest that increased light gradient partitioning drives species dominance as the forest becomes structurally more complex during succession.
K-ratio of the traits leaf dry matter content (LDMC), leaf density, specific force to punch and petiole length do not change with succession (see Figure A5.1). LDMC, leaf density and specific force to punch represent defense traits. Even though pioneers suffer more from herbivory than late successional species (Coley et al. 1985, Poorter et al. 2004), and community-weighted mean of defense traits increased with succession (Lohbeck et al. 2013, Poorter et al. in press), we hypothesized that herbivore pressure shows no clear successional pattern. Lack of changes in K-ratio with succession confirms that herbivore pressure may indeed remain constant. In fact, surprisingly little research has been carried out on presence and abundance of herbivores with succession. One may also expect increasing numbers of herbivores during succession due to improved habitat complexity and resource availability (Brown 1985). This would cause defense traits to be increasingly filtered for along the successional gradient, and would increase
30544 Lohbeck-bk.indd 101 27-10-14 16:42

Chapter 5
102
K-ratio with succession (showing the reverse pattern from what is expected for light capture traits). Further research needs to clarify how changes in herbivore pressure affect species performance and community structure, which may be related to defense traits.
In sum, we show that leaf trait values are more constrained among species dominating early successional forests than among species dominating late successional forests. This suggests an increased effect of light gradient partitioning to more optimally use the increasingly scarce irradiation during succession. The use of kurtosis for describing trait distributions is intuitive, straightforward and applicable to many datasets. We show that it can be applied successfully to environmental gradients and is able to detect shifts in the relative importance of different processes driving species dominance.
Acknowledgements
We are indebted to the people of Loma Bonita, Chiapas, for their hospitality and assistance during field work, especially G. Jamangape for species identification. We thank J. Westveer for help with data collection, G. Carreño-Rocabado, M. Jansen, H. Paz, L. Pla for valuable advice and the NeoSelvas network (coordinated by R. Chazdon) for fruitful discussions. We thank Natalia Norden and an anonymous referee for constructive comments that greatly improved the manuscript. Fieldwork was partly supported by NSF- LTREB. ML and FB were supported by a research grant from Wageningen University and Research centre. MvB and FB were supported by NWO-WOTRO (Netherlands Organisation for Scientific Research - Science for Global Development) grant W85-326. MMR was supported by MABOTRO projects SEMARNAT-CONACYT 2002-C01-0597 and SEP-CONACYT CB-2005-01-51043. LP was partly funded by the DiverSus project through Inter-American Institute for Global Change Research (IAI) CRN 2015, which is supported by the US National Science Foundation (Grant GEO-0452325).
30544 Lohbeck-bk.indd 102 27-10-14 16:42

Species dominance and succession
103
5
Appendix 5
Table A5.1: Regression coefficients of K-ratio against stand basal area (Fig 5.2). Given are the slope of the regression based on observed data, the mean slope of 999 randomly generated communities, the median slope (used to plot the random trend in Fig 5.2 and Fig A5.1, with corresponding intercepts), and the upper and lower confidence intervals for the slope of the randomly generated communities. Results are only given for the traits for which the trend of the observed K-ratio with succession appeared significant: SLA, LA, LT, Chl. In all cases the observed slope falls outside of the 95% confidence intervals of the random slopes.
Trait Slope observed Mean slope random Median slope random CI slope randomLower; upper
SLA -0.036 -0.014 -0.014 -0.018; -0.010
LA -0.053 -0.032 -0.033 -0.037; -0.028
LT -0.050 -0.020 -0.020 -0.025; -0.016
Chl -0.043 -0.011 -0.011 -0.015; -0.006
30544 Lohbeck-bk.indd 103 27-10-14 16:42

Chapter 5
104
�
�
�
��
�
�
�
�
�
�
�
�
��
�
�
0 5 10 15 20 25 30 35
−0.5
0.0
0.5
1.0
1.5
K−r
atio
LD
MC
a
NS
�
�
�
�
�
�
��
�
�
�
�
�
�
�
�
�
0 5 10 15 20 25 30 35
−0.5
0.0
0.5
1.0
1.5
K−r
atio
LD
b
NS
�
�
�
�
�
�
�
�
�
�
�
�
�
�
�
�
�
0 5 10 15 20 25 30 35
−0.5
0.0
0.5
1.0
1.5
K−r
atio
sFt
P
c
NS
�
�
�
�
�
��
�
�
�
�
�
�
�
�
�
�
0 5 10 15 20 25 30 35
−2−1
01
2
K−r
atio
PL
d
NS
�
�
�
�
�
�
�
�
�
�
�Stand basal area (m2 ha)
�
�
�
�
�
�
�
�
�
�
�Stand basal area (m2 ha)
Figure A5.1: The relative change in kurtosis from species presence to species dominance (K-ratio = ln(Kdominance / Kpresence)) decreases with succession expressed as stand basal area (m2/ha), for four of the traits tested for (Specific Leaf Area (SLA), Leaf Area (LA), Leaf Thickness (LT), Chlorophyll content (Chl) (see Fig 5.2). For four other traits no significant trend was found; a) Leaf Dry Matter Content (LDMC), b) Leaf Density (LD), c) specific Force to Punch (sFtP), d) Petiole Length. Given are the observed ΔK values, and in grey the median regression through the randomized data (not significant).
30544 Lohbeck-bk.indd 104 27-10-14 16:42

Species dominance and succession
105
5
�
�
�
�
�
�
�
�
�
�
�
Rel
bas
al a
rea
0 10 20 30 40 50
0.00
10.
005
0.05
00.
500
Rank
Abu
ndan
ce
BA= 0.1 (m2 ha)a
0 10 20 30 40 50
0.00
10.
005
0.05
00.
500
Rank
Abu
ndan
ce
BA= 1.5 (m2 ha)b
0 10 20 30 40 50
0.00
10.
005
0.05
00.
500
Rank
Abu
ndan
ce
BA= 2.2 (m2 ha)c
�
�
�
�
�
�
�
�
�
�
�
Rel
bas
al a
rea
0 10 20 30 40 50
0.00
10.
005
0.05
00.
500
Rank
Abu
ndan
ce
BA= 18.0 (m2 ha)d
0 10 20 30 40 50
0.00
10.
005
0.05
00.
500
Rank
Abu
ndan
ce
BA= 19.5 (m2 ha)e
0 10 20 30 40 50
0.00
10.
005
0.05
00.
500
Rank
Abu
ndan
ce
BA= 19.7 (m2 ha)f
�
�
�
�
�
�
�
�
�
�
�
Rel
bas
al a
rea
0 10 20 30 40 50
0.00
10.
005
0.05
00.
500
Rank
Abu
ndan
ce
BA= 26.0 (m2 ha)g
0 10 20 30 40 50
0.00
10.
005
0.05
00.
500
Rank
Abu
ndan
ce
BA= 31.5 (m2 ha)h
0 10 20 30 40 50
0.00
10.
005
0.05
00.
500
Rank
Abu
ndan
ce
BA= 33.3 (m2 ha)i
�
�
�
�
�
�
�
�
�
�
�
�
�
�
�
�
�
�
�
�
�
�Rank
�
�
�
�
�
�
�
�
�
�
�Rank
�
�
�
�
�
�
�
�
�
�
�Rank
Figure A5.2: Rank dominance curves for 3 sites with low basal area (< 2.5 m2/ha): Fig a, b, c, for 3 sites with intermediate basal area (18-20 m2/ha): Fig d, e, f, and for 3 sites with high basal area (> 26 m2/ha): Fig g, h, i. Dominance is expressed as the contribution of each species’ basal area relative to the total basal area of the site. Only species are included for which trait values were measured, i.e. those species that were used to calculate kurtosis in this study (which is at least 80% of the basal area). Note the log-scale on the y-axis.
30544 Lohbeck-bk.indd 105 27-10-14 16:42

30544 Lohbeck-bk.indd 106 27-10-14 16:42

Biomass is the main driver of changes in ecosystem process
rates during tropical forest succession
Madelon Lohbeck, Lourens Poorter, Miguel Martínez-Ramos, Frans Bongers
Accepted in Ecology
30544 Lohbeck-bk.indd 107 27-10-14 16:42

Chapter 6
108
Abstract
Over half of the world’s forests are disturbed and the rate at which ecosystem processes recover after disturbance is important for the services these forests can provide. We analyse the drivers underlying changes in rates of key ecosystem processes (biomass productivity, litter productivity, actual litter decomposition and potential litter decomposition) during secondary succession after shifting cultivation in wet tropical forest of Mexico.
We test the importance of three alternative drivers of ecosystem processes: vegetation biomass (vegetation quantity hypothesis), community-weighted trait mean (mass ratio hypothesis) and functional diversity (niche complementarity hypothesis) using structural equation modelling. This allows to infer the relative importance of different mechanisms underlying ecosystem functioning recovery.
Ecosystem process rates changed during succession, and the strongest driver was aboveground biomass for each of the processes. Productivity of aboveground stem biomass and leaf litter as well as actual litter decomposition increased with initial standing vegetation biomass, whereas potential litter decomposition decreased with standing biomass. Additionally, biomass productivity was positively affected by community-weighted mean of specific leaf area and potential decomposition was positively affected by functional divergence, and negatively by community-weighted mean of leaf dry matter content.
Our empirical results show that functional diversity and community-weighted means are of secondary importance for explaining changes in ecosystem process rates during tropical forest succession. Instead, simply the amount of vegetation in a site is the major driver of changes, perhaps because there is a steep biomass build-up during succession that overrides more subtle effects of community functional properties on ecosystem processes. We recommend future studies in the field of biodiversity and ecosystem functioning to separate the effects of vegetation quality (community-weighted mean trait values and functional diversity) from those of vegetation quantity (biomass) on ecosystem processes and services.
Keywords: biodiversity- ecosystem functioning, biomass, community-weighted mean, decomposition, ecosystem processes, ecosystem functioning, functional diversity, functional traits, Mexico, productivity, secondary succession, structural equation modelling
30544 Lohbeck-bk.indd 108 27-10-14 16:42

Drivers of ecosystem process rates
109
6
Introduction
Most of the worlds’ tropical forest is naturally regenerated secondary forest (FAO 2010b) and the extent and importance of secondary forests will only continue to increase in the future (Letcher and Chazdon 2009). It is thereby vital to understand which functions and services can be provided by secondary forests, and to what extent ecosystem functioning recovers during tropical forest succession. This contributes to understanding the sustainability and maintenance of functions and services in future tropical forest landscapes (Nadrowski et al. 2010, Melo et al. 2013). Ecosystem functioning refers to the joint effects of all processes that sustain an ecosystem, and ecosystem processes (EPs) can be defined as fluxes of matter and energy over time and space (Reiss et al. 2009). Biodiversity (broadly defined as ‘the variety of life’) is generally accepted to be one of the major drivers of ecosystem functioning (Balvanera et al. 2006) though underlying mechanisms are still highly debated. Functional traits are proposed to provide the most direct link between biodiversity and ecosystem processes (Díaz et al. 2006), the reason for which we consider functional traits to represent biodiversity in this study. Functional traits are defined as those components of an organism’s phenotype that determine its effect on ecosystem processes (Petchey and Gaston 2006) as well as its response to environmental factors (Naeem and Wright 2003). We distinguish two complementary ways to quantify the functional trait properties of biodiversity that imply different mechanisms by which biodiversity influences ecosystem processes: functional diversity and community-weighted functional trait mean. Functional diversity (FD) describes the distribution of species in functional trait space (Mason et al. 2005). FD may have a positive effect on EP rates because highly diverse communities are better able to make optimal use of the available resources leading to increased ecosystem process rates, a mechanism which has been coined the niche complementarity effect. Community-weighted means (CWMs) describe the dominant functional trait value of the overall community, by weighting species trait values by the abundance of the species (Lavorel et al. 2007). An effect of CWM on EP rates indicates that the functional traits of the most abundant species in the community are responsible for most fluxes in the ecosystem. This mechanism is described as the mass ratio effect (Grime 1998). Whether the direction of the relationship between CWM and EP rates is positive or negative depends on the trait that is used for quantifying functional trait mean; trait values that enhance resource acquisition (high CWM
30544 Lohbeck-bk.indd 109 27-10-14 16:42

Chapter 6
110
of specific leaf area, high CWM of leaf nutrients) increase EP rates whereas trait values that enhance resource conservation (high CWM of leaf dry matter contents, high CWM of wood density) decrease such rates (Garnier et al. 2004, Reich 2014).
Empirical progress in biodiversity-ecosystem functioning (BEF) research has mainly come from grassland experiments and showed that both functional diversity and CWM are important for ecosystem processes like primary productivity and decomposition (Tilman et al. 1997, Mouillot et al. 2011) and for ecosystem services like soil carbon sequestration and fodder production (Butterfield and Suding 2013). CWM has been found to be more important than taxonomic diversity in explaining ecosystem processes in temperate grasslands (Mokany et al. 2008), while single-trait functional indices (both in CWM and in FD) were found to be stronger indicators of EPs than multi-trait indices in Mediterranean grasslands (Butterfield and Suding 2013). Moreover, increasing evidence shows that different groups of species matter for different ecosystem processes and that biodiversity matters more when a variety of ecosystem processes is taken into account (Hector and Bagchi 2007, Gamfeldt et al. 2008, Zavaleta et al. 2010, Isbell et al. 2011, Gamfeldt et al. 2013). Few studies have evaluated the link between biodiversity and EPs in forest ecosystems. Forests may fundamentally differ from grasslands as they are structurally complex and slow growing, thereby provide ample opportunity for niche specialization with large potential effects on ecosystem processes. Earlier work demonstrated that functional diversity positively influenced productivity in temperate and boreal forest (Paquette and Messier 2011, Ruiz-Benito et al. 2014) and carbon stocks in tropical secondary forest (Bu et al. 2014) but negatively influenced carbon stocks in semi-arid forest ecosystems (Conti and Díaz 2013). Highly-diverse tropical rainforests are far underrepresented in BEF studies, despite the fact that these face high rates of biodiversity loss due to human activities and despite their importance for ecosystem functioning at the local, regional and global scales.
In the current study we focus on the drivers of changes in ecosystem process rates in highly-diverse tropical forests during secondary succession. We do not only test for effects of functional diversity and functional trait mean (which may be described as ‘vegetation quality’) on EPs but also for an effect of biomass, proposing that maybe not the quality of the vegetation matters but simply their quantity. We coin this the ‘vegetation quantity hypothesis’ (for a schematic overview of the hypotheses addressed in this study see Fig 6.1). For example, positive effects of functional diversity on productivity in boreal and temperate
30544 Lohbeck-bk.indd 110 27-10-14 16:42

Drivers of ecosystem process rates
111
6
forests were weak compared to the strong positive effect of basal area, which is an indicator of biomass (Paquette and Messier 2011), suggesting that quantity may be more important than quality. Similarly Vilà et al (2013) found that the effect of species richness on wood production was largely mediated by stand basal area. This ‘vegetation quantity effect’ may be especially relevant in early successional forests where increases in plant biomass are rapid and may override more subtle changes in biodiversity (Martin et al. 2013).
3 hypothetical pathways
1. Vegetation quantity hypothesis -> more biomass = faster functioning 2. Niche complementarity hypothesis -> Higher diversity = faster functioning 3. Mass ratio hypothesis -> more acquisitive traits faster functioning
age
Ecosystem function/ process
biomass
Functional mean
Functional diversity
1
2 3
Figure 6.1: The conceptual model used to test the link between succession, community functional properties and ecosystem process rates and the three alternative hypothetical pathways representing the three key hypotheses tested in this study. See also Fig A6.1 for a schematic representation the different facets of the vegetation (quality and quantity), the hypotheses and what indices are used.
Here we ask what drives the changes in rates of multiple ecosystem processes during tropical forest succession on abandoned agricultural fields. To this end we study the recovery of biomass, functional diversity, community-weighted mean and key ecosystem processes in tropical wet forest of Mexico. We use four ecosystem processes (biomass productivity, litter productivity, actual decomposition and potential decomposition) that determine some of the major fluxes of biomass and nutrients over time (Hooper et al. 2005). We focus on secondary forest sites that cover the crucial first three decades of tropical forest succession (e.g. Chazdon 2014b). We scale up from species-level functional traits to the community level using three indices (richness, evenness and divergence;
30544 Lohbeck-bk.indd 111 27-10-14 16:42

Chapter 6
112
Mason et al. 2005) and community-weighted means (Garnier et al. 2004, Lavorel et al. 2007). We address the following research question: How do successional changes in biomass, community-weighted mean and functional diversity affect the recovery of key ecosystem processes? We hypothesize that communities with higher biomass (vegetation quantity hypothesis), higher functional diversity (niche complementarity hypothesis) and community-weighted means towards more acquisitive trait values (mass ratio hypothesis) will have faster ecosystem productivity rates and decomposition rates. We expect that biomass and litter productivity will be mainly influenced by vegetation quantity (biomass) whereas litter decomposition will be mainly influenced by vegetation quality (community-weighted mean and functional diversity).
Methods
Study regionTropical forest research plots were established close to the village of Loma
Bonita, in Marqués de Comillas, Chiapas, South-eastern Mexico (16°01’N, 90°55’W). Mean annual temperature is 24 °C and mean annual precipitation is 3000 mm, with a dry period (< 100 mm month-1) from February through April (van Breugel et al. 2006, 2007). Small hills and valleys with sandy and clay silt soils of low pH (< 5.5) characterize the research area. Fifteen secondary forest plots (permanent sampling plots; 1000 m2 each) with different fallow ages (< 1-29 yr) were established on abandoned maize fields. The research plots are located in a landscape of approximately 1500 ha, within which the distance between plots ranges from 60 m to 11.5 km, where plots of similar age (< 2 years difference) were at least 800 m apart (see Fig A6.1 for a map). Each plot was divided into two 10 x 50 m subplots. In one subplot all individuals with DBH ≥ 1 cm were taxonomically identified and measured, in the other all individuals DBH ≥ 5 cm, this was repeated in annual censuses. Variables measured on each individual were scaled up to plot level according to sampling effort per size-class (i.e. sampling effort for 1≤DBH≤5 is half the sampling effort for DBH ≥ 5).
Functional traitsThe species that together represent at least 80% of the basal area of the plots
were selected for functional trait measurements as these should accurately
30544 Lohbeck-bk.indd 112 27-10-14 16:42

Drivers of ecosystem process rates
113
6
describe community functional properties (Garnier et al. 2004, Pakeman and Quested 2007, but also see Pakeman and Oksanen 2014). We measured therefore 80 species that covered on average 92% of the basal area in each plot (range 80-99%). We measured 5 functional traits per species that are important for the carbon- and nutrient-balance of plants and thereby for the effect of species on ecosystem-level fluxes of energy and matter. Functional traits were measured on 5 to 10 individuals per species in the study landscape, not inside the research plots. We followed standardized protocols (Cornelissen et al. 2003, Pérez-Harguindeguy et al. 2013). For leaf traits small adult trees (ca. 5 m high) were selected and sun leaves used for trait measurements. Leaves were photographed on a light box after which leaf area was calculated using pixel counting software ImageJ (Rasband 2008). Leaves were dried until constant weight and weighed. Specific Leaf Area (SLA, m2 kg-1) was calculated as fresh leaf area divided by oven-dried mass and Leaf Dry Matter Content (LDMC, g g-1) as leaf oven-dry weight divided by fresh weight (rehydrated after field collection). To determine leaf nitrogen and phosphorus content (mg/g), samples were ground to pass a 0.5 mm sieve prior analysis. Colorimetric determinations were carried out in a Bran-Luebbe AutoAnalyzer III (Norderstedt, Germany; Technicon Industrial Systems 1977) after acid digestion by the macro-Kjeldahl modified method in the case of nitrogen and after ascorbic acid reduction (Murphy and Riley 1962) in the case of phosphorus. Wood density was based on wood cores, using an increment borer (12” mm Suunto, Finland), or stem slices for species of which stems did not reach sufficient size (<5 cm DBH). The fresh volume was determined with the water displacement method. Wood density was calculated as oven-dried mass over fresh volume (WD, g cm-3). This measurement was taken in the study area for 66 of the 80 species studied, data on WD for remaining species were taken from comparable studies in Mexican wet forests by the authors in Las Margaritas, Puebla (7 species) and Los Tuxlas, Veracruz (7 species). Species’ average trait values were used although we recognize that intraspecific trait variation may play an important role in the acclimation of species adaptation along environmental gradients as well as in their effects on ecosystem processes (Baraloto et al. 2010c). However given the high number of species in tropical forest and the high species turnover during succession (Chazdon et al. 2007), we consider the use of species average trait values meaningful for the purpose of this study.
30544 Lohbeck-bk.indd 113 27-10-14 16:42

Chapter 6
114
Site propertiesFor each plot the time after abandonment was determined based on
interviews with landowners. Aboveground biomass (Mg/ha) was estimated with allometric formulas developed for secondary forest in Panama and based on DBH and wood density (van Breugel et al. 2011). Where species’ wood density values were missing (< 20% of total basal area), we used the average wood density value of the corresponding genus (calculated from our region’s data) and else average wood density values across all 80 species considered in this study. To calculate carbon stocks, we multiplied aboveground biomass with the carbon concentration of 0.45 found for a very similar Mexican tropical forest (Hughes et al. 2000). Biomass data used in the analyses came from the year 2010 for 9 of the permanent sampling plots and from the year 2012 for 6 later established plots. Only for the biomass productivity we used the 2009 biomass data for the 9 earlier established sites to ensure it corresponded to the initial biomass of the period over which productivity was calculated (2009-2010, see next paragraph). For each of the plots we measured plot-average litter nitrogen and phosphorus content measured for 5 samples of well-mixed litter from littertraps in each site (see section on ecosystem processes), using the colorimetric determinations described earlier (section on functional trait measurements).
Ecosystem processesThe rates of change in four key ecosystem processes were measured in each of
the successional sites, which quantified some of the major fluxes in energy and matter that take place in forests. They reflect the build-up of biomass, the litter that is produced, as well as the rates at which this litter decomposes. By including both actual and potential litter decomposition rates we were able to elucidate the effects of just the litter quality (potential) from what really happens in the sites (actual). These EPs are important for the provisioning of several ecosystem services (see Table A6.1 in the Appendix).
Biomass production rate. Biomass production is the difference in aboveground biomass over one year interval (Mg of Carbon/ ha/ yr) and was calculated based on the above mentioned allometric formulas. For nine of the permanent sampling plots it was calculated for the period 2009-2010 and for six later established plots for the period 2012-2013. Litter production rate. The litter production rate (g/ m2/ day) was estimated by establishing seven litter traps (70 x 100cm, at a height of 1.3m) at random locations in each site and collecting the litter for two consecutive
30544 Lohbeck-bk.indd 114 27-10-14 16:42

Drivers of ecosystem process rates
115
6
months (January - March 2012). Each month the litter was dried and weighed. Actual litter decomposition rate. Actual (in situ) leaf litter decomposition rates
(% weight loss/ day) were estimated using the litterbag method. Leaf litter was collected from the litter traps described above. Five litterbags (mesh size of 1 mm) containing an initial dry weight of 2-3 gram of well-mixed litter (leaves only) were incubated in each of the sites from February to April 2012. After two months the remaining litter was dried, carefully brushed clean and weighed. The litter before incubation was weighed after which the dry weight was estimated using the site-specific average water content of the litter material. Decomposition is the weight loss as a percentage of the estimated initial dry weight, expressed per day. Potential litter decomposition rate. Potential (ex situ) leaf litter decomposition rates (% weight loss/ day) were estimated using the litterbag method in a common garden experiment. Leaf litter was collected from the litter traps described above. Five litterbags with a mesh size of 1 mm were filled with well-mixed leaf litter of known dry weight (around 3 grams) and incubated in a common garden (March to April 2012). During incubation the decomposition bed was irrigated with the average yearly precipitation and after one month the remaining litter was dried, carefully brushed clean and weighed. The difference between actual and potential litter decomposition is the environment in which the litter mixtures decompose. Actual decomposition was determined by incubating the litter in its natural environment (in situ), thereby reflecting abiotic conditions, decomposer community and litter material, whereas potential decomposition takes the material into a common garden (ex situ) and variation in decomposition rates is therefore due to the litter characteristics only.
Statistical analysisFunctional traits were scaled from species level to the community level using
functional diversity indices and community-weighted means. For functional diversity we used three orthogonal indices: functional richness (convex hull volume encompassing all species in the community), functional evenness (evenness of abundances in trait space) and functional divergence (degree of divergence in abundances in trait space) (Mason et al. 2005). We decided not to include species richness because it tightly correlates to functional richness in our dataset (see also Table A6.4) and because functional diversity is suggested to be more important than taxonomic diversity (Tilman 2001b, Micheli and Halpern 2005). These multivariate indices were calculated using a selected set of 3 or 4
30544 Lohbeck-bk.indd 115 27-10-14 16:42

Chapter 6
116
traits that were relevant for a specific process. SLA, leaf N and WD were used for productivity processes as these indicate the investment per unit leaf area to capture light, photosynthetic capacity and volumetric growth capacity (Poorter and Bongers 2006, Poorter et al. 2008). SLA, LDMC, leaf N and leaf P were used as indicators of decomposition processes as these indicate leaf toughness, fibre density, nutrient contents and palatability (Cornelissen and Thompson 1997, Bakker et al. 2011). Community-weighted means are used to approximate plot-level functional trait averages (Garnier et al. 2004, Lavorel et al. 2007). Community-weighted means were based on SLA, leaf N and WD for productivity processes and on SLA and LDMC for decomposition processes. We chose to measure community-weighted nitrogen and phosphorus directly from the litter because this is a more accurate measure of the substrate’s chemical composition than the community-weighted mean of nutrients measured on green leaves (see also Fig A6.1 in the Appendix for a schematic representation of the traits used to calculate different indices for the ecosystem processes). Community functional properties were calculated using the R-package FD (Laliberté and Shipley 2012). We weighted functional diversity (evenness and divergence) and community-weighted means by a species’ relative basal area in the plot. The relative basal area represents the species’ relative biomass contribution, which reflects plant performance and adaptation to local conditions and may determine a plant’s contribution to ecosystem processes.
Structural equation modelling [SEM, as implemented in the R-package Lavaan (Rosseel 2012) ] was used to relate site properties, community functional properties and ecosystem processes. SEM is a statistical method that tests for causal relationships. Our conceptual a priori model (see Fig 6.1) is based on existing knowledge of this study system where biomass (van Breugel 2007), functional diversity and community-weighted means (Lohbeck et al. 2012, 2013) have been shown to change during secondary succession. We tested three alternative pathways that can explain changes in ecosystem processes during succession: the vegetation quantity hypothesis (positive relation between biomass and EP), the niche complementarity hypothesis (positive relation between FD and EP) and the mass ratio hypothesis (positive relation between acquisitive trait values and EP or negative relation between conservative trait values and EP). As our sample-size is small (n =15) we were limited to simple model structures (with few variables) and therefore chose to test for different combinations of community functional properties in alternative models. For this same reason, we tested
30544 Lohbeck-bk.indd 116 27-10-14 16:42

Drivers of ecosystem process rates
117
6
each of the ecosystem processes in separate models, instead of all together. The alternative models include all combinations of functional diversity components (richness, evenness and divergence) with community-weighted means (based on different individual traits) plus leaving out the functional diversity and community-weighted mean pathways. This produced 16 alternative models for biomass and litter productivity [3 FD components plus leaving out FD (equals 4) times 3 CWMs plus leaving out CWM (equals 4) makes a total of 16 models] and 20 alternative models for actual and potential decomposition [3 FD components plus leaving out FD (equals 4) times 4 CWMs plus leaving out CWM (equals 5) makes a total of 20 models]. First, we rejected all models with a significantly poor fit (p < 0.05); then, we excluded the models that had no significant links to the EPs we are trying to explain. Subsequently the best fitting models were selected based on the lowest AIC (we present test results for the five best models, given our constraints, in Table A6.1). AIC penalizes for model complexity and thereby tests whether the addition of a functional diversity and a community-weighted mean pathway to the model contributes to explaining variation in EPs, despite the increased complexity associated with additional pathways. In the appendix we presented an additional method based on principal component axes instead of individual indicators for FD and for CWM. Here, PC1 and PC2 are used as compound variables that capture the most important axes of variation in FD and CWM. This reduced the number of alternative models to 9 models per EP (Table A6.5, Fig A6.4). All statistical analyses were carried out using R v. 3.0.0 (R Development Core Team 2011).
Results
A best fitting model, that met our a priori constraints, was found for each of the four ecosystem processes. Results confirm that our conceptual model (in which successional age increases biomass, leading to changes in community functional properties, which in turn affect ecosystem processes; Fig 6.1) adequately describes the data, even though not all causal paths were significant (Fig 6.2). The single best fitting model included both a functional diversity component and a community-weighted mean component for each of the ecosystem process (see Table A6.2). Overall, the selected models explained 25% of biomass productivity, 77% of litter productivity, 24% of actual litter decomposition and 61% of potential litter
30544 Lohbeck-bk.indd 117 27-10-14 16:42

Chapter 6
118
decomposition. In all cases aboveground biomass significantly explained changes in EP rates. Aboveground biomass had a positive effect on ecosystem process rates in case of biomass productivity, litter productivity and actual decomposition and a negative effect on potential decomposition. Additionally, biomass productivity was positively affected by community-weighted mean specific leaf area (nearly significant p = 0.09). And potential decomposition was positively affected by functional divergence, and negatively affected by community-weighted mean of leaf dry matter content (Fig 6.2, A6.2 and Table A6.3). For additional information a table with the pairwise correlation coefficients for all variables is given in the appendix (Table A6.4).
Biomass product
Fdiv SLA
Biomass
Age
0.69
−0.14 0.51
−0.660.38
0.91
R2=0.25
a
Litter product
Feve WD
Biomass
Age
0.90
0.10 −0.01
0.22−0.31
0.90
R2=0.77
b
Actual decomp
Feve LitterN
Biomass
Age
0.50
0.29 0.13
−0.27−0.27
0.90
R2=0.24
c
Potential decomp
Fdiv LDMC
Biomass
Age
−0.41
0.36 −0.36
0.49−0.10
0.90
R2=0.61
d
Figure 6.2: Best fitting (see Table A6.2) structural equation models (df = 4) for each of the ecosystem processes studied along a tropical wet forest successional gradient in Chiapas, Mexico. a) Biomass productivity (Biomass product) was significantly explained by biomass and together with functional divergence (Fdiv) and community-weighted mean specific leaf area (SLA) explained 25% of the variation. b) Litter productivity (Litter product) was explained by biomass and together with functional evenness and community-weighted mean wood density explained 77%. c) Actual decomposition (Actual decomp) was explained by biomass and together with functional evenness (Feve) and litter nitrogen content (LitterN) explained 24% of the variation. d) Litter potential decomposition (Potential decomp) was explained by biomass, functional divergence (Fdiv) and community-weighted mean of leaf dry matter content (LDMC) and explained 61%. Black arrows represent significant relations, grey arrows non-significant ones, given are the standardized path-coefficients (for unstandardized path-coefficients see Table A6.3, for process rates as a function of the main explanatory variable see Fig A6.2).
30544 Lohbeck-bk.indd 118 27-10-14 16:42

Drivers of ecosystem process rates
119
6
Discussion
We assessed drivers of changes in ecosystem process rates during tropical forest succession, and found support for all three alternative hypotheses; the vegetation quantity hypothesis, the niche complementarity hypothesis and the mass ratio hypothesis. Vegetation quantity (biomass) was an important driver for all the four studied ecosystem processes, while vegetation quality (functional diversity and community-weighted mean) was only of additional importance for biomass productivity and for potential decomposition.
Vegetation quantity overrules the effect of vegetation quality in explaining ecosystem processes
Our model explained 25% of the variation in biomass productivity. Biomass was the only factor contributing significantly to productivity, confirming the ‘vegetation quantity hypothesis’ (Figs 6.2a and A6.2a). Other factors included in the best fitting model were functional divergence and community-weighted specific leaf area. Although specific leaf area was not statistically significant (see Table A6.3), it has a potentially strong effect on biomass productivity as indicated by its large standardized coefficient (0.50). These results indicate that, as secondary forests increase in biomass, their absolute annual biomass gain also increases, and at the same time, communities where the species that dominate have large specific leaf area, the annual biomass gain will increase. Such a positive relation between forest productivity and initial biomass has been widely found for mature forest systems (Chisholm et al. 2013) but for secondary forest systems no effect was found (Hughes et al. 1999). Patterns are similar to previous work where the direct effect of basal area on productivity is much larger than the effects of diversity in North American forests (Paquette and Messier 2011), as well as across European forests (Vilà et al. 2013). As secondary forests get older, and contain more biomass, the average size of the trees in a plot also increases. Increasing growth with tree size, at the level of the individual tree (Stephenson et al. 2014), could be one of the underlying mechanisms. Some experimental studies did find diversity effects on productivity, in tropical forest systems (Haggar and Ewel 1997) and in temperate grassland studies (Wilsey and Potvin 2000), but these did not take into account any biomass effects. Niche complementarity as a driver of productivity (and other ecosystem processes) is thought to be primarily important under relatively resource limiting conditions, when species need to
30544 Lohbeck-bk.indd 119 27-10-14 16:42

Chapter 6
120
differentiate their resource uptake strategies to be able to coexist. When key resources are unlimited dominant species (those that most effectively capture resources) may determine biomass productivity (Warren et al. 2009, Paquette and Messier 2011). The positive effect of SLA on productivity may indeed indicate that in the high-light early-successional sites, where high SLA pioneers dominate, productivity is higher than what is expected based on initial biomass only. Along a gradient of tropical forest succession light becomes increasingly limited. One may therefore expect changing drivers of productivity rates from community-weighted mean in early succession when species that most effectively capture light dominate, to functional diversity in late succession when competitively driven niche complementarity starts to shape the community. Previous work at our study site showed that species indeed become increasingly different in their functional strategies during succession, which can be explained by increased resource limitation and hence, increased resource competition (Lohbeck et al. 2014). This suggests that the niche complementarity effect could become important in later successional stages (cf. Fargione et al. 2007). This is in line with the meta-analysis by Cardinale and co-workers (2007) who concluded that the effect of species diversity on productivity increases due to the increased effect of complementarity as experiments run for a longer time. Our chronosequence is relatively short (up to 29 years of succession) and the sharp increase in vegetation quantity early during succession may overrule more subtle effects of vegetation quality on productivity (Martin et al. 2013). Further research should evaluate how the relative contributions of vegetation quantity and quality to productivity change over longer successional gradients.
Litter production was the ecosystem process for which most variance (77%) was explained. The strongest driver was again aboveground standing biomass, in line with the vegetation quantity hypothesis (Figs 6.2b, A6.2b). When more biomass accumulated in the secondary forests, more litter was produced. The best fitting model also included functional evenness and wood density, but these factors did not have a significant effect on litter productivity. Other studies also found increases in litter production during succession, but did not evaluate the underlying drivers (Ewel 1976, Yan et al. 2009, Zhang et al. 2013).
The best model explained 24% of the variation in actual litter decomposition. The strongest factor increasing decomposition was again aboveground standing biomass, confirming the vegetation quantity hypothesis (Figs 6.2c, A6.2c). The model also included functional evenness and litter nitrogen content but these
30544 Lohbeck-bk.indd 120 27-10-14 16:42

Drivers of ecosystem process rates
121
6
did not have a significant effect on actual decomposition, against expectations. A strong positive biomass effect on actual decomposition suggests that stands with higher biomass provide better abiotic conditions for decomposition, i.e. less extreme understory temperatures and higher relative humidity (Lebrija-Trejos et al. 2010b). This biomass effect overrules any effects of biodiversity and litter quality suggesting a major role for abiotic conditions (Pérez-Harguindeguy et al. 2007, Ostertag et al. 2008). This is unlike previous studies showing that leaf characteristics exerted a stronger influence on decomposition rates than local environmental conditions (Xuluc-Tolosa et al. 2003, Cornwell et al. 2008, Carreño-Rocabado 2013). In the common garden experiment we did find significant effects of community functional properties. The best model explained 61% of the variation in potential decomposition rates. Changes in potential decomposition were attributed to standing biomass (confirming again the vegetation quantity hypothesis) but also by functional divergence and community-weighted mean of leaf dry matter content, thereby also confirming the vegetation quality hypothesis (Figs 6.2d, A6.2d). As explained, actual decomposition (in situ) reflects abiotic conditions, decomposer community and litter material, whereas potential decomposition (ex situ) should reflect litter characteristics only. Counterintuitively, the aboveground biomass in the plots where the litter came from, was still a significant predictor of potential leaf decomposition, having a negative effect. A possible explanation is that the decomposer community in the common garden may be predominantly bacteria-based, which is typical for more disturbed sites (Wardle 2004), as the area was before used for sheep grazing and to establish the experiment the vegetation had to be removed causing considerable disturbance to the soil. Such disturbance related decomposer community may have a food preference for litter of more disturbance related tree-species having litter quality characteristics that could not be captured by the community functional properties in the model. Potential decomposition is the only ecosystem process that was significantly affected by vegetation quality, perhaps because the more subtle effects of vegetation quality can be better picked up under standardized conditions. Functional divergence had a positive effect on potential litter decomposition rates. This suggests that a diverse range of decomposer groups was present in the common garden, which by complementary resource use was able to decompose high diverse litter faster than low diverse litter (Gessner et al. 2010, Handa et al. 2014). At the same time, we detected that decomposition rates were negatively related to the average leaf dry
30544 Lohbeck-bk.indd 121 27-10-14 16:42

Chapter 6
122
matter content of the community. Leaf dry matter content is a defense trait and is widely shown to have a negative effect on decomposition rates (Kazakou et al. 2006, Bakker et al. 2011). Both functional diversity and community weighted mean LDMC had a significant effect on potential decomposition rate, indicating that both the niche complementarity hypothesis and the mass ratio hypothesis may explain decomposition rates (cf. Handa et al. 2014). In the literature the relative importance of these contrasting hypotheses is under strong debate where some studies indicate explicit diversity effects on decomposition (Scherer-Lorenzen 2008) whereas other studies found that decomposition rates of litter mixtures rates are driven by the functional characteristics of the average species in the mixture (Garnier et al. 2004, Tardif and Shipley 2013).
Implications for biodiversity ecosystem functioning studiesWe found that changes in ecosystem process rates in secondary forests
depend mainly on the aboveground biomass of the site. This was also the case when using PCA axes instead of individual indicators for CWM and FD (see Fig A6.4). Vegetation quality characteristics (functional diversity and community weighted mean) had notable effects only on biomass productivity and in the common garden decomposition experiment. This suggests that biodiversity may not matter as much for these ecosystem processes as often supposed, at least not during the early phase of secondary succession. Though mostly insignificant, both functional diversity and community weighted mean were maintained in all four best fitting models. This suggests a role for FD and CWM but our study does not have sufficient power to be able to conclude they had causal effects. We argue that more detailed studies are needed to better understand the mechanisms linking biodiversity to ecosystem functioning, especially for species rich tropical forest ecosystems. Experimental studies are urgently needed to clarify such uncertainties but for many ecosystems, like species rich tropical rainforest, a proper experimental setup is an overwhelming task. Such experiments have been carried out and revealed that diversity may not matter since monoculture and mixed species assemblages had the same effect on soil fertility (Ewel et al. 1991), were equally productive (Ewel 1999) and equally effective at resource capture in a Costa Rican experiment (Berish and Ewel 1988). In Panama, litter productivity and decomposition were not affected by diversity (Scherer-Lorenzen et al. 2007a) but in China diversity promoted nitrogen acquisition and retention (Lang et al. 2014). Such experiments, though very informative, are still at the low diversity
30544 Lohbeck-bk.indd 122 27-10-14 16:42

Drivers of ecosystem process rates
123
6
side of the spectrum, typically using different combinations of up to 6 species. We emphasize the need for complementary studies based on observational data, and using statistical methods that allow separating different factors underlying changes in ecosystem processes, such as structural equation modelling (e.g. Paquette and Messier 2011, Vilà et al. 2013, Walker et al. 2013). We found that there may be a strong effect of vegetation quantity, which could overrule any effect of vegetation quality (functional diversity and community-weighted mean). To better understand the mechanisms by which biodiversity may relate to functioning we need to disentangle different factors (qualitative from the quantitative vegetation characteristics) contributing to ecosystem functioning (Bengtsson 1998). Doing otherwise, especially in strong change gradients like the secondary succession gradient studied here, a diversity effect may actually be a biomass effect. Such a lack of control for changes in plant biomass is one of the major criticisms to biodiversity-ecosystem functioning studies (Hodgson et al. 1998, Bolam et al. 2002).
Implications for the recovery of tropical forest functioningWe showed that vegetation quantity is the main driver of changes in rates
of different ecosystem processes during the first three decades of succession. Our results indicate that optimizing carbon capture (productivity) requires large biomass, so to speed up forest recovery, fast-growing species with high SLA might be planted (Martínez-Garza et al. 2013). The same would account for increasing the litter layer and organic matter content of the upper soil: plant fast-growing species that produce large amounts of leaves. To enhance soil quality through increased decomposition rates it may be additionally important to plant species that have functional traits that are complementary to each other to increase functional diversity, though avoiding species with high leaf dry matter content. In combination, these results suggest that the recovery of specific ecosystem processes require specific restoration measures. Combined with clear indications of trade-offs between optimal levels of different ecosystem processes and services (Raudsepp-Hearne et al. 2010), this makes the restoration of ecosystem functioning (being the joined effect of all ecosystem processes) a complex undertaking. Maybe more than realized so far, such restoration requires that the desired ecosystem processes-levels (depending on the stakeholders) are made explicit and that the instruments to achieve the functional restoration goals are adapted to those specific levels.
30544 Lohbeck-bk.indd 123 27-10-14 16:42

Chapter 6
124
We show that vegetation quantity overrules the effects of vegetation quality on ecosystem process rates in tropical secondary forests in Mexico. We argue that different components (qualitative and quantitative) of the plant community should be addressed both separately and in conjunction to be able to more fully understand the mechanism by which biodiversity affects ecosystem processes.
Acknowledgements
We are grateful for the assistance and hospitality of the community of Loma Bonita and especially we thank Gilberto Jamangape for all his help. We thank Judith Westveer for her tremendous efforts in the decomposition experiments, Jorge Rodríguez-Velázquez for data management, Mayra Gavito, Maribel Nava Mendoza, Ana Lidia Sandoval Pérez and Cruz Teresa Arredondo Torres for the nutrient analyses, Daniel Laughlin and Sandra Duran for statistical advice, and Evan Weiher and an anonymous reviewer for their helpful comments on the manuscript. The authors further acknowledge the fruitful discussions that took place in the workshops of ReSerBos (directed by Patty Balvanera) and NeoSelvas (directed by Robin Chazdon). ML and FB were supported by a research grant from Wageningen University and Research centre. FB was supported by NWO-WOTRO (Netherlands Organisation for Scientific Research - Science for Global Development) grant W85-326. FB and MMR were supported by NSF-LTREB DEB-0639393 and #DEB 1147429. MMR was supported by MABOTRO projects SEMARNAT-CONACYT 2002-C01-0597, SEP-CONACYT CB-2005-01-51043, and SEP-CONACYT 2009-129740. LP was partly supported by the Nucleo DiverSus project, which was supported by the Inter-American Institute for Global Change Research (IAI)CRN 2015 and SGP-CRA2015 (through National Science Foundation grants GEO-0452325 and GEO-1138881). LP was also partly funded by European Union’s Seventh Framework Programme ([FP7/2007-2013]) under grant agreement n° 283093; Role Of Biodiversity In climate change mitigatioN (ROBIN).
30544 Lohbeck-bk.indd 124 27-10-14 16:42

Drivers of ecosystem process rates
125
6
Appendix 6
Table A6.1: Ecosystem processes used in this study, their relation to ecosystem services (the benefits to people) and some key references
Ecosystem process Ecosystem service Literature
Biomass productivity Climate regulation (carbon uptake rates), wood provisioning
Clark et al. 2001; Janisch and Harmon 2002
Litter productivity Soil retention, decomposition, soil nutri-ents, net primary production
Ewel 1976; Ostertag et al 2008
Actual (in situ) litter decomposition
Soil quality, soil biotic activity, litter quality, soil nutrients, soil fertility, productivity, nutrient cycling
Swift 2004; Ewel 1976; Cornelis-sen 1996; Wardle 2004
Potential (ex situ) litter decomposition
Litter quality, soil nutrients, soil fertility, productivity, nutrient cycling
Swift 2004; Ewel 1976; Cornelis-sen 1996; Wardle 2004
30544 Lohbeck-bk.indd 125 27-10-14 16:42

Chapter 6
126
Table A6.2: Results of the top five alternative models for each of the ecosystem processes. Given are the functional diversity component included in each model (functional richness, functional evenness, functional divergence or none), the community-weighted mean component included (CWM of Specific Leaf Area [SLA], Leaf Dry Matter Content [LDMC], litter Nitrogen [N], litter Phosporus [P] or none in case of decomposition, community-weighted mean of Specific Leaf Area [SLA], leaf Nitrogen [N]and Wood Density [WD] or none in case of productivity, see also Fig A6.1). Given are the degrees of freedom, test statistic (minimum function chi-square), comparative fit index (CFI), model p-value, model Akaike Informaton Criterion (AIC), Δ AIC compared to the best fitting model, standardized root mean square residual (SRMR), root mean square error of approximation (RMSEA) and the variance of the ecosystem process that was explained by the model (R2)
FD CWM DF χ2 CFI p-value AIC ΔAIC SRMR RSMEA R2
Biomass productivity
1 Divergence SLA 4 4.92 0.97 0.296 328.3 0 0.059 0.124 0.25
2 - SLA 2 4.29 0.94 0.117 337.8 9.5 0.052 0.276 0.22
3 Richness N 4 6.15 0.94 0.189 346.2 17.9 0.125 0.189 0.36
4 Divergence N 4 6.83 0.91 0.145 354.0 25.7 0.148 0.217 0.33
5 * Only 4 models fit criteria
Litter productivity
1 Evenness WD 4 6.89 0.94 0.142 165.5 0 0.078 0.219 0.77
2 Richness WD 4 6.71 0.95 0.152 169.7 4.2 0.073 0.213 0.77
3 Divergence WD 4 8.79 0.9 0.067 177.2 11.7 0.112 0.282 0.76
4 - WD 2 5.15 0.93 0.076 186.6 21.1 0.037 0.324 0.76
5 Evenness - 2 5.49 0.93 0.064 196.9 31.4 0.048 0.341 0.77
Actual litter decomposition
1 Evenness Litter N
4 9.14 0.83 0.058 281.6 0 0.071 0.293 0.24
2* * Only 1 model fits criteria
Potential litter decomposition
1 Divergence LDMC 4 8.87 0.88 0.064 130.4 0 0.096 0.285 0.61
2 - LDMC 2 2.67 0.98 0.263 142.5 12.1 0.043 0.15 0.46
3 Evenness Litter P 4 8.81 0.88 0.066 165.7 35.3 0.092 0.283 0.59
4 Richness - 2 2.99 0.97 0.224 182.4 52 0.046 0.182 0.41
5 Richness Litter P 4 6.07 0.95 0.194 186.1 55.7 0.096 0.186 0.60
30544 Lohbeck-bk.indd 126 27-10-14 16:42

Drivers of ecosystem process rates
127
6
Table A6.3: Test statistics for the single best model for each studied ecosystem process (see also Fig 6.2). Given are the unstandardized path coefficients (path-coefficient), the related standard error, Z-value, P-value and standardized path coefficients (Std estimate) (as found in Fig 6.2). The significant paths are highlighted in bold. For the overall fit of the model (Chi-square, AIC) see Table A6.2. Age refers to the time (in years) elapsed after agricultural field abandonment, F-evenness to functional evenness, F-divergence to functional divergence, SLA to community-weighted mean specific leaf area, WD to community-weighted mean wood density, LDMC to the community-weighted mean leaf dry matter content and Litter N to the nitrogen content of the litter.
Regressions Path-coefficient Std error Z-value p-value Std estimate
Biomass productivity
Biomass ~ age 1.293 0.156 8.311 0.000 0.906
F-divergence ~ biomass 0.005 0.003 1.592 0.111 0.380
SLA ~ biomass -0.074 0.021 -3.456 0.001 -0.666
Biomass productivity ~ BiomassF-divergenceSLA
0.201-3.4131.339
0.0925.7380.792
2.186-0.5951.691
0.0290.5520.091
0.686-0.1440.508
Litter productivity
Biomass ~ age 1.402 0.177 7.904 0.000 0.898
F-evenness ~ biomass -0.002 0.002 -1.243 0.214 -0.306
WD ~ biomass 0.001 0.001 0.859 0.390 0.217
Litter productivity ~ BiomassF-evennessWD
0.0370.555-0.058
0.0060.7181.030
6.7360.773-0.056
0.0000.4390.955
0.9030.101-0.007
Actual decomposition
Biomass ~ age 1.402 0.177 7.904 0.000 0.898
F-evenness ~ biomass -0.001 0.001 -1.029 0.303 -0.257
Litter N ~ biomass -0.062 0.058 -1.073 0.283 -0.267
Litter decomposition ~ BiomassF-evennessLitter N
0.0182.1720.020
0.0091.7380.037
2.0571.2500.555
0.0400.2110.579
0.4950.2910.129
Potential decomposition
Biomass ~ age 1.402 0.177 7.904 0.000 .898
F-divergence ~ biomass -0.001 0.003 -0.378 0.706 -0.097
LDMC ~ biomass 0.001 0.001 2.167 0.030 0.488
Litter decomposition ~ BiomassF-divergenceLDMC
-0.0050.411-1.518
0.0020.1840.767
-2.2002.232-1.980
0.0280.0260.048
-0.4060.360-0.364
30544 Lohbeck-bk.indd 127 27-10-14 16:42

Chapter 6
128
Table A6.4: Results of the correlation analyses based on the 15 successional plots with the variables that are used in the structural equation models, as well as species richness for comparison. This is presented for a) the ecosystem processes biomass and litter productivity and for b) the ecosystem processes actual and potential litter decomposition (because the variables used for the different set of processes differ slightly). Variables were grouped in successional indicators, diversity indicators, weighted mean and ecosystem process indicators. Sric refers to species richness, Fric to functional richness, Feve to functional evenness, Fdiv to functional divergence, SLA to community-weighted mean specific leaf area, WD to community-weighted mean wood density, N to community-weighted mean of leaf nitrogen content, LDMC to the community-weighted mean leaf dry matter content, Litter N to the nitrogen content of the litter and Litter P to the phoshorous content of the litter. Pearson pairwise correlation coefficients are given (* P < 0.05; ** P < 0.01, *** P < 0.001).
a. Correlation table for ecosystem processes biomass and litter productivity
Successional indicators Diversity Weighted mean EP
Age
Biom
ass1
Biom
ass2
Sric
Fric
Feve
Fdiv
SLA
WD
N Biom
ass
prod
uct
Biomass1 0.91***
Biomass2 0.90*** 0.99***
Sric 0.69** 0.75** 0.75**
Fric 0.53* 0.56* 0.56* 0.79***
Feve -0.18 -0.31 -0.31 -0.21 -0.38
Fdiv 0.32 0.38 0.38 0.35 0.26 -0.05
SLA -0.76** -0.67** -0.63* -0.26 0.01 0.04 -0.12
WD 0.18 0.24 0.22 0.07 -0.13 0.19 -0.33 -0.42
N 0.44 0.39 0.41 0.25 0.26 0.03 0.71** -0.22 -0.27
Biomass product
0.21 0.3 0.39 0.18 0.06 -0.22 0.06 0.07 -0.08 0.16
Litter product
0.90*** 0.87*** 0.87*** 0.67** 0.57* -0.18 0.29 -0.56* 0.21 0.45 0.28
1 Biomass used to in the model for biomass productivity; 2 Biomass used to in the model for litter productivity
30544 Lohbeck-bk.indd 128 27-10-14 16:42

Drivers of ecosystem process rates
129
6
b. Correlation table for ecosystem processes actual and potential litter decomposition
Successional ind Diversity Weighted mean EP
Age
Biom
ass
Sric
Fric
Feve
Fdiv
SLA
LDM
C
Litt
er N
Litt
er P
Actu
al
deco
mp
Biomass 0.90***
Sric 0.69** 0.75**
Fric 0.73** 0.65** 0.70**
Feve 0.02 -0.26 -0.09 -0.18
Fdiv -0.35 -0.1 -0.07 -0.44 0.11
SLA -0.76** -0.63* -0.26 -0.28 -0.24 0.23
LDMC 0.31 0.49 0.45 0.35 -0.05 0.14 -0.12
litterN -0.24 -0.27 -0.33 -0.24 -0.03 -0.06 0.38 0.01
litterP -0.37 -0.26 -0.14 -0.45 -0.12 0.39 0.22 -0.16 -0.33
Actual decomp
0.3 0.39 0.39 0.29 0.16 0.09 -0.07 0.49 -0.01 -0.12
Potential decomp
-0.60* -0.64* -0.41 -0.48 0.02 0.36 0.54* -0.52* 0.24 0.58* -0.38
Table A6.5. Eigenvector scores of community functional properties on the first and second principal components (PC1 and PC2). Principal components analysis (PCA) was used to separate plots based on their community functional properties. Separate PCAs are constructed for functional diversity components (functional richness, functional evenness, functional divergence) and community-weighted means as well as for productivity processes and decomposition processes as a different set of traits is used. Values in parentheses indicate variance accounted for by each axis. The PCAs were used to construct the compound variables (PC1 and PC2) that were used in the structural equation models of figure A6.5. Explanations of the abbreviations can be found in the description of Table A6.4.
Functional diversity Community-weighted mean
Biomass and litter productivity
PC1 (49%) PC2 (32%) PC1 (76%) PC2 (20%)
Fric 0.69 -0.04 SLA 0.57 0.61
Feve -0.58 0.57 WD -0.52 0.79
Fdiv 0.43 0.82 N 0.64 0.10
Actual and potential decomposition
PC1 (51%) PC2 (31%) PC1 (35%) PC2 (33%)
Fric 0.67 -0.17 litterN -0.77 0.087
Feve -0.37 -0.92 litterP 0.33 -0.67
Fdiv -0.64 0.35 SLA -0.54 -0.53
LDMC 0.01 0.51
30544 Lohbeck-bk.indd 129 27-10-14 16:42

Chapter 6
130
Vegetation quantity
Mass ratio hypothesis(Functional mean
drives EPs)
Niche complementarity hypothesis
(Functional diversity drives EPs)
Vegetation quantity hypothesis
(Biomass drives EPs)
Vegetation quality
Functional richness *
Aboveground biomass
CWM of LDMC ¥
CWM of SLA §¥
CWM of WD §
CWM of leaf N §
Functional divergence *
Functional evenness *
Litter P ¥
Facet of the vegetation Hypotheses tested Indices used
Litter N ¥
*Multivariate indices based on the following traits:SLA, leaf N and WD for productivity andSLA, LDMC, leaf N and leaf P for decomposition§ used for productivity processes¥ used for decomposition processes
Figure A6.1: Schematic representation of the two different facets of the vegetation (quality and quantity), how these translate into three testable hypotheses on alternative drivers of ecosystem process recovery and what indices are used to test each of these (see also the conceptual model in Fig 6.1). EPs stands for ecosystem processes, CWM for community-weighted mean, WD for wood density, leaf N for leaf nitrogen content, SLA for specific leaf area, LDMC for leaf dry matter content, Litter P and Litter N for litter phosphorus and nitrogen content.
30544 Lohbeck-bk.indd 130 27-10-14 16:42

Drivers of ecosystem process rates
131
6
�
��
��
�
�
�
�
�
�
�
�
�
�
0 10 20 30
−50
510
Biomass (Mg of C/ha)
Bio
mas
s pr
oduc
t (M
g of
C/h
a/yr
)
a
�
�
�
�
�
���
�
�
��
�
�
�
0 10 20 30 40
0.0
0.5
1.0
1.5
2.0
Biomass (Mg of C/ha)
Litte
r pro
duct
(gm
2da
y) b
�
�
�
�
�
��
��
�
�
�
��
�
0 10 20 30 40
−0.5
0.0
0.5
Biomass (Mg of C/ha)
Act
ual d
ecom
p (%
wei
ghtlo
ss/d
ay)
c�
�
�
��
�
�
�
�
�
�
�
�
�
�
0 10 20 30 40
0.4
0.5
0.6
0.7
0.8
0.9
Biomass (Mg of C/ha)
Pote
ntia
l dec
omp
(%w
eigh
tloss
/day
)
d
�
�
�
�
�
�
�
�
�
�
�Biomass (Mg of C/ha)
�
�
�
�
�
�
�
�
�
�
�Biomass (Mg of C/ha)
Figure A6.2: Variation of each studied ecosystem process as a function of the strongest explanatory variable (highest standardized path coefficient), which was aboveground standing biomass in all four ecosystem processes (see Table A6.2). a) Biomass productivity, b) litter productivity, c) actual litter decomposition, d) potential litter decomposition. The fitted line is the ecosystem process as a function of the main explanatory variable, keeping the other factors contributing to the ecosystem process constant at their mean value.
30544 Lohbeck-bk.indd 131 27-10-14 16:42

Chapter 6
132
1 km
Figure A6.3: Image of Mexico indicating the study location in the state of Chiapas in the white circle. Small white circles are the locations of the 15 secondary forest plots (< 1-29 yr) surrounding the village of Loma Bonita in Marques de Comillas. The continuous forest area north of the river Lacantún represents the Montes Azules Biosphere Reserve. The yellow line is the border with Guatemala. Plots of similar age (< 2 years difference) were at least 800 m apart.
30544 Lohbeck-bk.indd 132 27-10-14 16:42

Drivers of ecosystem process rates
133
6
Biomass product
FD_PC2 CWM_PC1
Biomass
Age
0.52
−0.20 0.40
−0.510.12
0.91
R2=0.24
a
Litter product
FD_PC2
Biomass
Age
0.87
0.01
0.12
0.90
R2=0.76
b
Actual decomp
FD_PC1 CWM_PC1
Biomass
Age
0.56
−0.21 −0.20
0.390.48
0.90
R2=0.22
c
Potential decomp
Biomass
Age
−0.64
0.90
R2=0.40
d
Figure A6.4: Best fitting structural equation models for the four ecosystem processes when using compound variables instead of individual indicators (see Fig 6.2 where individual indicators were used). As compound variables we used the principal component axes (PC1 and PC2) when secondary forest plots were separated based on their functional diversity indices (FD_PC1 and FD_PC2) and based on their community-weighted means (CWM_PC1 and CWM_PC2). See table A6.5 for the eigenvectors scores of the community functional properties with PC1 and PC2, note that a slightly different set of traits was used for different processes. a) Biomass productivity (Biomass product) was significantly explained by biomass and together with FD(PC2) and CWM(PC1) explained 24% of the variation (df = 4), b) Litter productivity (Litter product) was explained by biomass and together with FD(PC2) explained 76% (df = 2), c) Actual decomposition (Actual decomp) was explained by biomass and together with FD(PC1) and CWM(PC1) explained 22% of the variation (df = 4) and d) Litter potential decomposition (Potential decomp) was explained by biomass and explained 40% (df = 1). The most suitable structural equation model presented here follows the selection criteria described in the methods, and based on different combinations of PC1 and PC2 for functional diversity and community-weighted mean indicators. Some paths are left out from the figure (unlike in Fig 6.2) because this reduced the AIC based on which the best model was selected. This difference suggests that individual indicators for FD and CWM (as in Fig 6.2) capture more relevant information for explaining ecosystem processes than does the use of compound variables. Black arrows represent significant relations (P < 0.05), grey arrows non-significant ones, given are the standardized path-coefficients.
30544 Lohbeck-bk.indd 133 27-10-14 16:42

30544 Lohbeck-bk.indd 134 27-10-14 16:42

The importance of biodiversity for multiple ecosystem functions
in a human-modified tropical landscape
Madelon Lohbeck
30544 Lohbeck-bk.indd 135 27-10-14 16:42

Chapter 7
136
Abstract
Biodiversity loss is expected to have large negative consequences for ecosystem functioning. Biodiversity is thought to be especially important for the multifunctionality of ecosystems, as different species contribute to different functions, but support for this idea comes mainly from experimental studies. I evaluated the importance of biodiversity for multiple ecosystem functions in a human-modified tropical forest landscape in Chiapas, Mexico. I quantified five key ecosystem functions (standing above-ground biomass, biomass productivity, litter production, wood decomposition and litter decomposition) at the landscape level, and evaluated to what extent individual species contribute to these functions. The species that contributed most to the different ecosystem functions were largely the same small set of dominant species, indicating a limited role of biodiversity for ecosystem multifunctionality. The use of simulations enabled teasing apart the relative importance of species richness, species dominance and species functional traits, and demonstrated that only when minimizing dominance do different species (with different functional traits) contribute to different ecosystem functions. The present study, like most studies on biodiversity-ecosystem functioning, focuses on a narrow range of (biogeochemical) functions. Future studies should address the consequences of biodiversity loss on ecosystem multifunctionality in natural ecosystems, including a wide range of ecosystem functions.
Keywords: biodiversity, dominance, ecosystem functioning, multifunctionality, human-modified landscape, secondary forest, species richness, functional traits
30544 Lohbeck-bk.indd 136 27-10-14 16:42

Biodiversity for multiple ecosystem processes
137
7
Introduction
Despite conservation efforts, the world’s biodiversity is rapidly declining and this decline does not seem to end any time soon (Laurance et al. 2012). There are potentially large consequences of biodiversity loss for ecosystem functioning and ecosystem services (MA 2005) and evidence from natural ecosystems is emerging (e.g. Bunker et al. 2005, Cardinale et al. 2012, Maestre et al. 2012b). Ecosystem functioning refers to the joint effects of all functions that sustain an ecosystem, and ecosystem functions (or processes) can be defined as fluxes of matter and energy over time and space through biological activity (Reiss et al. 2009). Biodiversity (‘the variety of life’) is generally accepted as one of the major drivers of ecosystem functioning (e.g. Balvanera et al. 2006, Midgley 2012), though underlying mechanisms remain highly debated. Biodiversity may affect ecosystem functioning through niche complementarity: highly diverse communities are better able to make optimal use of resources and thereby increasing the fluxes of energy and matter (Tilman et al. 1997).
Though the niche complementarity hypothesis has received considerable support (e.g. Cardinale 2011), there may be large interspecific differences in effects on ecosystem functioning. One way of visualizing this is by plotting the cumulative ecosystem function against the species richness, while ranking species in decreasing contribution to the function. The relationship can vary from linear (all species contribute equally) to highly saturating (few species contribute a lot and many species contribute little to nothing). Empirical evidence shows that species differ in their relative contribution to a specific ecosystem function and that a relatively small subset of species contributes to most of the ecosystem function (Tilman 2001a, Balvanera et al. 2005, Bunker et al. 2005). Hence, most commonly, there is a saturating relationship between species richness and ecosystem functions, with highly functional species in the steep part of the curve and redundant species in the saturating part of the curve (e.g. Naeem et al. 2010). Species that contribute a lot to a specific function, like primary productivity or decomposition rates, often have particular combinations of functional traits to optimally perform those functions (Mouillot et al. 2011, Lohbeck et al. in press), for example N2 fixing trees accumulated carbon up to nine times faster than non-fixing species in Panama (Batterman et al. 2013).
Such an asymptotic relationship between species richness and ecosystem functions suggests that biodiversity is not so important, and that instead the
30544 Lohbeck-bk.indd 137 27-10-14 16:42

Chapter 7
138
presence or abundance of some species (with specific traits) matters. Ample studies have shown that different species exhibit different multivariate functional trait strategies (e.g. Lohbeck et al. 2012), and that specific functional trait values optimize specific ecosystem functions (e.g. Mouillot et al. 2011). As a consequence, considering multiple ecosystem functions will increase the importance of biodiversity (e.g. Hector and Bagchi 2007, Zavaleta et al. 2010). This warrants that limiting studies to single ecosystem functions undermines the importance of biodiversity. Empirical results on ‘biodiversity- ecosystem multifunctionality’ come mainly from experimental grassland studies and clearly show that higher species richness promotes higher levels of ecosystem multifunctionality, often in a linear manner (Hector and Bagchi 2007, Zavaleta et al. 2010, Isbell et al. 2011, Mouillot et al. 2011). The limited evidence from empirical studies shows that this positive linear relationship may not always apply: in boreal and temperate production forests, ecosystem multifunctionality showed a hump-shaped relationship to species richness (Gamfeldt et al. 2013), and in a global study on drylands, multifunctionality showed a saturating relationship with species richness (Maestre et al. 2012b). Natural ecosystems may exhibit a more complex relationship between species richness and multifunctionality due to differences in species dominance and composition between communities, which is ignored in species richness (Maestre et al. 2012a). Species dominance (size and abundance) plays an important role as dominant species contribute disproportionally to selected singular ecosystem functions (Grime 1998, Smith and Knapp 2003, Dangles and Malmqvist 2004). Dominance is a typical phenomenon in natural ecosystems; even in hyperdiverse tropical forest, only 1.4% of the species contribute to more than 50% of the trees (ter Steege et al. 2013).
Dominance indirectly alters the relationship between species richness and (single) cumulative ecosystem functions (Hillebrand et al. 2008), from being linear (with high species evenness) to being asymptotic (with high dominance), for example in the cases of productivity and decomposition (cf. Dangles and Malmqvist 2004, Kirwan et al. 2007). Similarly, I expected that increased species dominance reduces the effect of biodiversity on ecosystem multifunctionality. Underlying this expectation is the prediction that the effect of species dominance is more important than the effect of species traits in determining species’ functionality. If that is true, then the same dominant species drive different ecosystem functions and the effect of additional species, and hence, of species richness on ecosystem multifunctionality is limited (saturating relationship).
30544 Lohbeck-bk.indd 138 27-10-14 16:42

Biodiversity for multiple ecosystem processes
139
7
If instead the effect of species functional traits overrules the effect of species dominance, then different species (with different traits) drive different ecosystem functions and the effect of species richness on ecosystem multifunctionality is strong (linear relationship).
In the current study I focused on the role of species richness, species dominance and functional traits for multiple ecosystem functions in a human-modified tropical forest landscape consisting of secondary forest that established after shifting cultivation and land abandonment. Currently most of the worlds’ tropical forests is naturally regenerated secondary forests (FAO 2010b) and the extent and importance of secondary forests will only continue to increase in the future (Chazdon 2014a). It is thereby vital to understand the magnitude and quality of ecosystem functions provided by these forests in human-modified landscapes (Nadrowski et al. 2010). I focus on 5 key ecosystem functions that quantify major biogeochemical fluxes in the forests; above-ground standing biomass, primary productivity, litter productivity, wood decomposition and leaf-litter decomposition. I ask whether species richness matters for ecosystem multifunctionality and assess the role of species dominance and functional traits in this relationship. I formulated three hypotheses: 1) Few species make up for most of each ecosystem function, 2) largely the same species make up for most of different functions, 3) the importance of species richness for ecosystem multifunctionality increases when reducing species dominance.
Methods
Study landscapeThis study makes use of tropical forest research plots close to the village of
Loma Bonita in the region of Marqués de Comillas, Chiapas, South-eastern Mexico (16°01’N, 90°55’W). Mean annual temperature is 24 °C and mean annual precipitation is 3000 mm, with a dry period (< 100 mm month-1) from February through April (van Breugel et al. 2006). Small hills and valleys with sandy and clay soils of low pH (< 5.5) characterize the research area. Fifteen secondary forest plots with different fallow ages (< 1-29 yr) were established on abandoned maize fields. Additionally, the relative area occupied by secondary forests of different ages in Marqués de Comillas (933 km2) was quantified (Pingarroni 2014). To this end, eleven landscapes (1km2) were selected across the region that represented
30544 Lohbeck-bk.indd 139 27-10-14 16:42
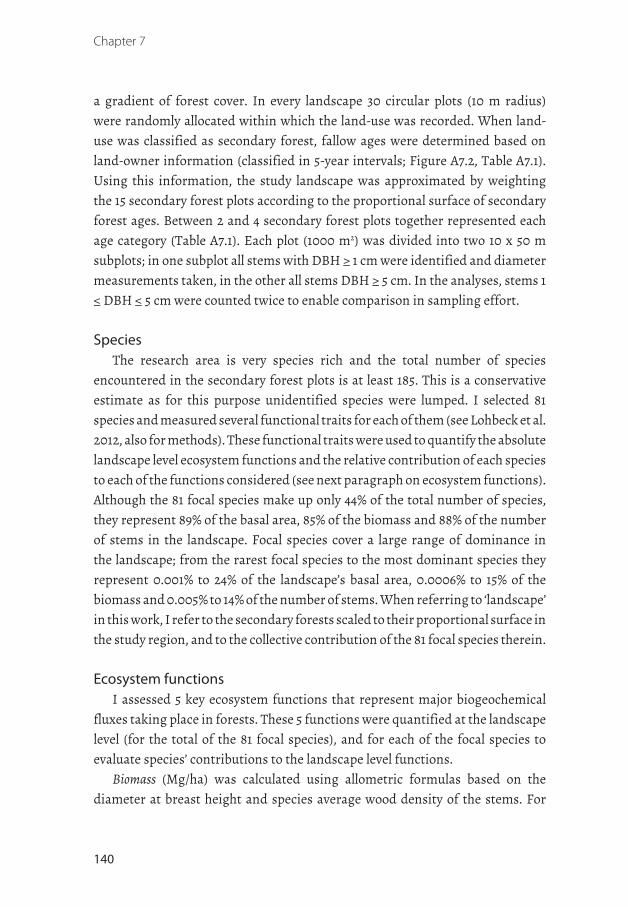
Chapter 7
140
a gradient of forest cover. In every landscape 30 circular plots (10 m radius) were randomly allocated within which the land-use was recorded. When land-use was classified as secondary forest, fallow ages were determined based on land-owner information (classified in 5-year intervals; Figure A7.2, Table A7.1). Using this information, the study landscape was approximated by weighting the 15 secondary forest plots according to the proportional surface of secondary forest ages. Between 2 and 4 secondary forest plots together represented each age category (Table A7.1). Each plot (1000 m2) was divided into two 10 x 50 m subplots; in one subplot all stems with DBH ≥ 1 cm were identified and diameter measurements taken, in the other all stems DBH ≥ 5 cm. In the analyses, stems 1 ≤ DBH ≤ 5 cm were counted twice to enable comparison in sampling effort.
SpeciesThe research area is very species rich and the total number of species
encountered in the secondary forest plots is at least 185. This is a conservative estimate as for this purpose unidentified species were lumped. I selected 81 species and measured several functional traits for each of them (see Lohbeck et al. 2012, also for methods). These functional traits were used to quantify the absolute landscape level ecosystem functions and the relative contribution of each species to each of the functions considered (see next paragraph on ecosystem functions). Although the 81 focal species make up only 44% of the total number of species, they represent 89% of the basal area, 85% of the biomass and 88% of the number of stems in the landscape. Focal species cover a large range of dominance in the landscape; from the rarest focal species to the most dominant species they represent 0.001% to 24% of the landscape’s basal area, 0.0006% to 15% of the biomass and 0.005% to 14% of the number of stems. When referring to ‘landscape’ in this work, I refer to the secondary forests scaled to their proportional surface in the study region, and to the collective contribution of the 81 focal species therein.
Ecosystem functionsI assessed 5 key ecosystem functions that represent major biogeochemical
fluxes taking place in forests. These 5 functions were quantified at the landscape level (for the total of the 81 focal species), and for each of the focal species to evaluate species’ contributions to the landscape level functions.
Biomass (Mg/ha) was calculated using allometric formulas based on the diameter at breast height and species average wood density of the stems. For
30544 Lohbeck-bk.indd 140 27-10-14 16:42

Biodiversity for multiple ecosystem processes
141
7
trees with DBH < 25 cm I used a formula based on secondary forests in Panama (van Breugel et al. 2011), for trees with DBH > 25 cm I used a formula for moist forest (Chave et al. 2005).
Primary productivity (Mg/ha/yr) was the net change in standing aboveground biomass over a one-year interval (end 2011/ start 2012 to end 2012/ start 2013).
Litter productivity (Mg/ha/yr) at the plot level was measured by placing seven littertraps (70 x 100 cm, at a height of 1.3 m) during two months (January-March 2012) at random locations in each site. Each month the litter was collected, dried and weighted. The mass of litter produced in 2 months was multiplied by 6 to get an estimate of the litter produced in a year. As litter production was measured during the dry season, during the peak of litter production, this will overestimate the yearly litter production, nevertheless for the species relative contributions this is unimportant. Plot-level litter production was tightly correlated to the plot biomass (R2 = 0.84, p< 0.001, n= 15). To estimate the litter produced by each tree, I multiplied the relative biomass of each stem by the plot level litter production. I thus inferred species-specific litter production from the plot-level data, assuming that species-litter effects would be reflected in the plot-level litter production.
Wood decomposition (Mg/ha/yr) at the species level was measured for 15 species using a decomposition experiment (litterbag method, 1mm mesh size, 5 replicates per species). Wood samples (15 cm long, diameter 3-5 cm) were incubated in a common garden for 1 year after which the remaining mass was measured. The dry weight before incubation was estimated based on the initial weight and the water content of a representative subsample of the wood. This species specific proportion of wood mass loss after one year of incubation was negatively correlated to the functional trait wood density (g cm-3) of each species (% mass loss in one year = 77.4 - 74.2 x WD; R2= 0.51, p = 0.003). I used the regression equation and species-specific measured wood density to estimate the wood decomposition for the remainder of the 81 species. Subsequently the wood decomposed in the landscape in one year and the contribution of each species thereto was inferred by multiplying the species-specific proportion of weight loss in a year by the species-specific mortality (Mg/ha/yr), derived from the same 2012-2013 time-window.
Litter decomposition (Mg/ha/yr) at the species level was measured for 15 species using a decomposition experiment (litterbag method, 1mm mesh size, 5 replicates per species). Leaf litter, consisting of recently senesced leaves, was collected from > 5 individuals per species by gently shaking the tree, and was incubated in a
30544 Lohbeck-bk.indd 141 27-10-14 16:42

Chapter 7
142
common garden for 2 months. The proportion of weight remaining after 2 months was raised by the exponent of 6.5 to get the proportion of weight remaining after 1 year. This species-specific estimated decomposition was negatively correlated to the leaf dry matter content (g g-1) of the species (% mass loss in 8 weeks = 44.19 - 72.26 x LDMC, R2 = 0.28, p = 0.04). I used the regression equation and species-specific leaf dry matter content to estimate the leaf decomposition for the remainder of the 81 species. Subsequently the contribution of each species to the leaf litter decomposition in the landscape was estimated by multiplying the estimated leaf litter decomposed in a year (proportion of weight) by the leaf litter produced by each of those species (see earlier this section).
In sum, the species-level ecosystem functions were quantified in ways that best suited each of the functions and were based on existing patterns in the data. In some cases the function could be directly measured at each individual tree (biomass and productivity), where the species’ contribution is the sum of each stem belonging to that species and the landscape-level function is the sum of all stems of the focal species in the landscape. In other cases species-level contributions were inferred from the plot level function and scaled-down to the species level (litter production). Lastly there were cases where species specific function values were available for a subset of species and subsequently scaled up to all focal species using functional trait values after which the landscape-level function was quantified using relevant scaling procedures (wood and litter decomposition).
Statistical analysesThe cumulative value of each ecosystem function in the landscape was plotted
against cumulative species richness, by ranking species in decreasing order of the (absolute) contribution to the function, regardless of whether this effect was positive or negative. The saturation of this relationship was quantified based on the area under the curve, which increases when the relationship is more saturating. The area was divided by the square area (maximum landscape level ecosystem function multiplied by the 81 focal species). This resulted in a metric that can range from the minimum value of 0.5 when the relationship is linear, when all species contribute equally to the ecosystem function, to the maximum value of 1, when a single species contributes to all of the ecosystem function. The shape of the curve based on the observed landscape corresponds to
30544 Lohbeck-bk.indd 142 27-10-14 16:42

Biodiversity for multiple ecosystem processes
143
7
hypothesis 1: where I expected a saturating relationship. This was done for each of the 5 ecosystem functions. Subsequently it was assessed whether the subset of species that make up for at least 50% of the function overlapped among different functions. This corresponds to hypothesis 2: where I expected that largely the same species contribute to most of several functions.
The contribution of each species ultimately depends on two factors; one is the species’ dominance and the other is the species characteristics (species level ecosystem function values, related to species level functional traits). Two complementary simulations were carried out to disentangle the effects of species dominances versus those of species characteristics on landscape-level ecosystem functioning. In the first randomization method (R1), all species in the dataset received a species characteristic that was randomly picked from the pool of 81 species. This randomized the species characteristics while conserving the observed species dominances in the landscape and was carried out 1000 times. For each simulation species were ranked in decreasing order of species’ functionality after which the cumulative ecosystem function was plotted against species richness. In the second randomization method (R2) all individual trees in the dataset received a species characteristic that was randomly picked from the pool of 81 species. This attributed species characteristics to each tree regardless of the species the tree belongs to, and was repeated 1000 times. R2, contrary to R1, breaks the observed dominance distribution in the landscape, thereby giving each species approximately equal abundances. Again, species in each simulated landscape were ranked in decreasing order of species’ functionality after which the cumulative ecosystem function was plotted against species richness. The difference in the shape of the relationship between species richness and ecosystem functions for randomization method 1 and 2 gives insight into the effect of species dominance (R1) and the effect of species characteristics (R2). This corresponds to hypothesis 3: where I expected the importance of species richness for ecosystem multifunctionality to increase when the species dominance effect is removed. In other words I expected that R1 would exhibit higher saturation of the curve, indicated by larger area under the curve, and R2 would approach linearity. All statistical analyses were carried out using R v. 3.0.0 (R Development Core Team 2011).
30544 Lohbeck-bk.indd 143 27-10-14 16:42

Chapter 7
144
Results
Cumulative ecosystem function showed a strong asymptotic relation with species richness and this applied to each of the 5 ecosystem functions considered (Fig 7.1). This indicates that species’ contributions to ecosystem functions were highly unequal: some species contributed a lot while most species contributed very little. Only 2 of the 81 species (2.5% of the species evaluated) were needed to make up half of the total wood decomposed, 5 species (6%) were needed for half of total leaf-litter decomposed and for half of the total standing biomass, 6 species (7%) made up for half of the litter produced and 11 species (14%) made up for half of the primary productivity (see also Fig A7.3). Species that were important for one function tended also to be important for the other function and these were the most dominant species in the landscape. For example, Trichospermum mexicanum contributed to 50% of ecosystem functioning for all 5 functions, Schizolobium parahyba, Cordia alliodora, Vochysia guatemalensis and Ochroma pyramidale were important for 4 functions, and Vernonia patens and Luehea speciosa for 2 functions (see also Fig A7.1).
When randomizing species traits over the existing dominance structure I found that the strong saturating nature of the relation between species richness and ecosystem function remained (Fig 7.2a-e, Fig A7.4) and that differences in species characteristics caused the variation around the curve. When randomizing species characteristics and minimizing species dominance at the same time the trend between species richness and ecosystem function approached linearity (Fig 7.2f-j, Fig A7.4), indicating that species contribute much more equally to the ecosystem function. The variation due to functional traits is consistently larger when using the existing (unequal) dominance structure (as indicated by the grey area in Fig 7.2). Results thereby indicate that the species dominance distribution determines the shape of the relation (linear or saturating) between richness and each ecosystem function, whereas the species characteristics determine the variation around the curve (and thereby also the maximum potential value of that function).
30544 Lohbeck-bk.indd 144 27-10-14 16:42

Biodiversity for multiple ecosystem processes
145
7
0 20 40 60 80
−20
020
4060
8010
0
species richness
cum
ulat
ive
func
tion
(%)
biomassproductivitylitter productivitywood decompositionleaf decomposition
Figure 7.1: Landscape level cumulative ecosystem function (percentage of the maximum value) against ranked cumulative species richness for each of the ecosystem functions: biomass, primary productivity, litter productivity, wood decomposition and leaf decomposition. The strong saturating nature of each of the curves indicates that few species contribute a lot to the ecosystem function whereas most species contribute little to nothing. See also Fig A7.1, A7.3. Cumulative productivity descends below zero, and increases somewhat erratically, due to negative productivity effects (mortality) of some species.
30544 Lohbeck-bk.indd 145 27-10-14 16:42

Chapter 7
146
0 20 40 60 80
020
4060
80
species richness
Biom
ass
(Mg/
ha)
a
0 20 40 60 80
020
4060
80
species richness
Biom
ass
(Mg/
ha)
f
0 20 40 60 80
−4−2
02
46
species richness
Prod
uctiv
ity (M
g/ha
/yr) b
0 20 40 60 80−4
−20
24
6species richness
Prod
uctiv
ity (M
g/ha
/yr) g
0 20 40 60 80
02
46
8
species richness
Litte
r pro
duct
ion
(Mg/
ha/y
r) c
0 20 40 60 80
02
46
8
species richness
Litte
r pro
duct
ion
(Mg/
ha/y
r)
h
0 20 40 60 80
0.0
0.5
1.0
1.5
species richness
Woo
d de
com
posi
tion
(Mg/
ha/y
r)
d
0 20 40 60 80
0.0
0.5
1.0
1.5
species richness
Woo
d de
com
posi
tion
(Mg/
ha/y
r)
i
0 20 40 60 80
0.0
1.0
2.0
species richness
Leaf
dec
ompo
sitio
n (M
g/ha
/yr)
e
0 20 40 60 80
0.0
1.0
2.0
species richness
Leaf
dec
ompo
sitio
n (M
g/ha
/yr)
j
species richness species richness
0 20 40 60 80
020
4060
80
species richness
Biom
ass
(Mg/
ha)
a
0 20 40 60 80
020
4060
80
species richness
Biom
ass
(Mg/
ha)
f
0 20 40 60 80
−4−2
02
46
species richness
Prod
uctiv
ity (M
g/ha
/yr) b
0 20 40 60 80−4
−20
24
6
species richness
Prod
uctiv
ity (M
g/ha
/yr) g
0 20 40 60 80
02
46
8
species richness
Litte
r pro
duct
ion
(Mg/
ha/y
r) c
0 20 40 60 80
02
46
8
species richness
Litte
r pro
duct
ion
(Mg/
ha/y
r)
h
0 20 40 60 80
0.0
0.5
1.0
1.5
species richness
Woo
d de
com
posi
tion
(Mg/
ha/y
r)
d
0 20 40 60 80
0.0
0.5
1.0
1.5
species richness
Woo
d de
com
posi
tion
(Mg/
ha/y
r)
i
0 20 40 60 80
0.0
1.0
2.0
species richness
Leaf
dec
ompo
sitio
n (M
g/ha
/yr)
e
0 20 40 60 80
0.0
1.0
2.0
species richness
Leaf
dec
ompo
sitio
n (M
g/ha
/yr)
j
species richness species richness
Figure 7.2: Graphs in the left column: Ranked cumulative species richness against the cumulative ecosystem functions that resulted from the 1000 randomizations using randomization method 1 (R1; randomizing species traits, keeping constant the dominance structure). a) biomass, b) primary productivity, c) litter productivity, d) wood decomposition, e) leaf decomposition. Graphs in the right column: Ranked species richness against the cumulative ecosystem functions that resulted from the 1000 randomizations using randomization method 2 (R2; randomizing species traits, while minimizing species dominance): f) biomass, g) primary productivity, h) litter productivity, i) wood decomposition, j) leaf decomposition. The red line is the observed trend of the study landscape (also shown in Fig 7.1 and Fig A7.3), the black line is the mean of the 1000 simulations (given randomization method 1 or 2), the grey area is the range of variation generated by the 1000 simulations.
30544 Lohbeck-bk.indd 146 27-10-14 16:42

Biodiversity for multiple ecosystem processes
147
7
Discussion
This study evaluates the importance of biodiversity for multiple ecosystem functions in a human-modified tropical landscape. I found that dominance overrules species traits in determining species functionality and due to this a small subset of dominant species matters for different functions. I thus found limited support for the increased importance of biodiversity when considering multiple ecosystem functions.
A number of assumptions had to be made while doing this study. I did not measure ecosystem functions both at the species level and at the landscape level independently. Instead, depending on the ecosystem function and on existing patterns in the data, I inferred plot level function values from the species level data available or the other way around (as explained in the methods). I focused on a relatively narrow subset of 5 ecosystem functions, that are crucial for regulating ecosystem services, of which it is generally established that dominant species contribute disproportionally. Yet, I did a simulation experiment to show the role of species richness in real tropical landscapes considering the highly skewed dominance distribution. Using 2 complementary randomization methods I was able to tease apart the relative importance of species richness, species dominance and species functional traits for multiple ecosystem functions.
Few species matter for each function and those that matter overlap among functions
Cumulative ecosystem function showed a strong asymptotic relation with cumulative species richness and this applied for each of the 5 ecosystem functions considered (Fig 7.2, Fig A7.4). Only between 2 and 11 species (2.5- 14% of the total of 81 species) are responsible for 50% of each ecosystem function (Fig A7.1, A7.3). Such a saturating response of ecosystem functions to increases in species richness is commonly found (Tilman 1999, Hooper et al. 2005, Naeem et al. 2010), and is in line with previous studies on carbon storage in tropical forest and watermelon pollination by bees (Balvanera et al. 2005). The species that contribute to most of the functioning are those species with high biomass which is in line with the mass ratio hypothesis (Grime 1998).
I thus found that when studying each ecosystem function in isolation, a small number of species contributed to most of each function and a large number of species contributed little to nothing. Theory predicts that different species
30544 Lohbeck-bk.indd 147 27-10-14 16:42

Chapter 7
148
contribute to different functions, but I found otherwise; the important species largely overlapped among different ecosystem functions (Fig A7.1).
Dominance alters the species richness - ecosystem multifunctionality relationship
Most of our knowledge on the effects of biodiversity on ecosystem multifunctionality comes from grassland experiments. Typically in such studies species richness is manipulated, while limiting inter-plot differences in species composition and dominance, and may therefore apply to natural ecosystems only to a limited extent (Lepš 2004). Indeed Balvanera et al (2006) conclude in their review that biodiversity effects on ecosystem functioning were stronger in experimental studies that control biodiversity manipulations. In natural ecosystems species dominance is rule, as indicated by the pervasive logarithmic shape of the rank-abundance curve (Whittaker 1965), and I assess its effect on the relationship between species richness and multiple ecosystem functions through simulations.
When species characteristics were randomized over species identity while maintaining the (unequal) dominance structure (R1) I found that simulated landscapes exhibit very similar, highly saturating, relationships between species richness and ecosystem functions; which indicates that few species make up for most of the ecosystem function (Fig 7.2a-e, Fig A7.4). Randomizing trait values produces the variation around the curve, which is large, as discussed in the next paragraph. When species characteristics were randomized over each tree, giving all species near-to-equal abundances (R2), I found that the simulated relationships between richness and ecosystem function approaches linearity (Fig 7.2f-j, Fig A7.4). The increased linearity means that species contribute more equally to each ecosystem function, and that the extent to which species contribute is determined by their characteristics, allowing different species (with different characteristics) to drive different ecosystem functions. Hence, biodiversity is an important driver of ecosystem multifunctionality when evenness is high (cf. Hillebrand et al. 2008 for single ecosystem functions). These results confirm experimental evidence from soil crust communities where species richness increased multifunctionality but this relationship is altered by dominance, composition and spatial distribution (Maestre et al. 2012a). This dominance effect may partly explain why other observational studies similarly found only a weak link between species richness and multifunctionality in global
30544 Lohbeck-bk.indd 148 27-10-14 16:42

Biodiversity for multiple ecosystem processes
149
7
drylands (Maestre et al. 2012b) and in production forests (Gamfeldt et al. 2013). Dominance was previously shown to confound the relation between richness and the single ecosystems functions productivity and decomposition (Dangles and Malmqvist 2004, Kirwan et al. 2007), although other studies found little effect of dominance (Wilsey and Polley 2004, Finn et al. 2013). In the current study I show that dominance reduced the effect of species richness on ecosystem functioning in tropical forest, and that this persists when considering multiple ecosystem functions on a landscape scale.
Effect of functional traits on species richness - ecosystem multifunctionality relationship
The variation around the curve (grey area in Fig 7.2) comes forth out of the variation in the functional trait values that were randomly attributed to either species (R1) or individual trees (R2). This variation is substantial in R1, where species dominances reflected the real and unequal dominances in the landscape. When the effect of dominance was removed (R2), the variation reduces considerably, now the traits determined which species is most important (the ranking). These results indicate that in the study landscape, the effect of species dominance outweighs the effect of species functional traits on ecosystem functioning, as expected. Instead, when species dominance is minimal, the species functional traits determine the species’ contribution to the ecosystem function. This means under high evenness, different species (with different traits) contribute to different functions, and biodiversity becomes important for multiple ecosystem functions. So although the dominant species determine most of the ecosystem functioning, the traits of the dominant species determine how much dominant species contribute in absolute terms and thus how the community functions in absolute terms. The range of possible ecosystem function values due to trait variation was consistently larger when dominance is high. Moreover, the highest potential ecosystem function values in the secondary forest landscape were attained in simulated communities where dominance was high and where dominant species had the right set of traits to optimally perform that particular function. In other words, not high biodiversity (high species richness under high evenness) but instead high dominance created the highest ecosystem function values in the simulated landscapes (cf. Maestre et al. 2012a), which is in line with the mass ratio hypothesis (Grime 1998).
30544 Lohbeck-bk.indd 149 27-10-14 16:42

Chapter 7
150
Focus on a limited set of ecosystem functionsI used 5 biogeochemical ecosystem functions: biomass, primary production,
litter production, wood decomposition and leaf decomposition. These quantify major fluxes in energy and matter, and underlie important regulating services like climate regulation, topsoil protection, soil fertility and nutrient cycling (MA 2005). This type of biogeochemical functions dominates the literature on ecosystem functioning (e.g. Isbell et al. 2011, Maestre et al. 2012b, Gamfeldt et al. 2013), are of global relevance in terms of the ecosystem services they underlie, and are thought to respond strongly to changes in biodiversity (MA 2005). Nevertheless, they represent only a limited subset of all functions that an ecosystem manifests. In my study, the ecosystem functions are treated as additive, which means that the effect of species in a mixed assemblage can be predicted from the effect of each of the species when aggregated (Reiss et al. 2009). This assumption was necessary for enabling the quantification of ecosystem functions at the species and at the landscape level. Indeed many ecosystem functions are additive (Fox 2005), though this ignores any interspecific interaction which are thought to underpin the diversity effect (e.g. Finn et al. 2013). It is important to realize that by definition dominant species contribute more to additive ecosystem functions (Norberg 2004) and that therefore broadening the subset of ecosystem functions to include functions that are not additive will generate considerably different results. Examples of ecosystem functions that may depend on less common species are the accumulation of particular nutrients (Lyons et al. 2005). Maybe it is not so much ecosystem functions (here defined as fluxes of matter and energy over time and space) but rather ecosystem services that depend on less common species, such as invasion resistance (Zavaleta and Hulvey 2004) and presence of culturally important species (Díaz et al. 2011). Typically, those functions and services that depend on rare species are also most vulnerable to species loss (Mouillot et al. 2013). I thereby stress that for evaluating whether biodiversity matters for ecosystem functioning and services, or in contrast, whether truly redundant species exist, there is need to include a much wider range of ecosystem functions (and services).
The role of biodiversity for maintaining multiple ecosystem functionsI found that the effect of dominance on species’ contributions to ecosystem
functions is large and thereby reduces the importance of biodiversity for ecosystem multifunctionality, at a given spatial scale and at a given moment in
30544 Lohbeck-bk.indd 150 27-10-14 16:42

Biodiversity for multiple ecosystem processes
151
7
time. However, at the same time, I have shown that basically any species could potentially matter for ecosystem functioning, given that high dominance is reached. Thus species that are seemingly redundant now (rare species), could be important at any time in the future when due to disease, or any other type of disturbance, populations of dominant species collapse and rare species fill the niches that have come available (Walker et al. 1999). In fact this continuous re-assembly of communities is characteristic for secondary forests where the non-random subset of dominant species changes directionally with fallow age (Lohbeck et al. 2014). Testing effects of spatio-temporal complementarity of species is vital to assess effects of biodiversity loss on maintenance of ecosystem multifunctionality (Bunker et al. 2005, Isbell et al. 2011, Mori et al. 2012). I thereby stress that though biodiversity may not matter so much for ecosystem multifunctionality in a tropical forest landscape at a given moment in time, biodiversity (and rare species) is critically important for ecosystem stability and resilience across temporal and spatial scales (Walker et al. 2004, Isbell et al. 2011, Mouillot et al. 2013). Although neither functional compensation nor species extinction scenarios fall within the scope of this study, both are considered non-random and will greatly affect how ecosystem functioning responds to species loss. Functional compensation can buffer changes in ecosystem functioning with species loss, and the extinction proneness of functionally important species influences how rapid consequences on ecosystem functioning can be expected (Larsen et al. 2005). The strong effect of dominant species on ecosystem functions found in this study, combined with a higher extinction proneness of rare species, indicates that consequences of biodiversity loss on ecosystem functioning may go unnoticed for a long time (cf. Wilsey and Polley 2004). The contrary is true in the animal kingdom: large and functionally important species are more vulnerable to extinction, thereby species loss may cause ecosystem function to collapse quickly after species losses initiate (Duffy 2002).
Given that our secondary forest landscape consists for over 75% of secondary forests with fallow ages < 15 years (Fig A7.2), the species that dominate are mainly disturbance-related species that are least extinction prone under increasing human pressure. Comparing the actual scenario with the randomized scenario (R1) under the existing abundance structure (Fig 7.2a-e) reveals how functionally efficient disturbance-related species are compared to species that are less common (and probably more extinction prone). The functional efficiency of disturbance-related species is higher when the actual curve is positioned higher
30544 Lohbeck-bk.indd 151 27-10-14 16:42

Chapter 7
152
within the grey area of R1 (Fig 7.2a-e), also corresponding to a higher saturation of the actual curve (Fig A7.4). In our landscape, disturbance-related species are less functionally efficient when it comes to biomass and litter production and more efficient when it comes to productivity and wood decomposition. That also means that disturbance, and concurrent increased importance of disturbance related early secondary forest, leads to a disproportionally large reduction in the functions biomass and litter production and a disproportionally small reduction (or even an increase) in the functions productivity and wood decomposition (cf. Larsen et al. 2005). Such non-linear response of ecosystem functionality predicts a collapse of ecosystem functionality at a certain threshold of biodiversity loss (Folke et al. 2004). Understanding role of biodiversity for the maintenance of ecosystem multifunctionality (including its temporal and spatial variability), combined with the species’ extinction proneness under anthropogenic pressure is crucial to assess the fate of human-modified landscapes and more research on this topic for tropical forest ecosystems is therefore urgently needed.
In a species-rich human-modified landscape biodiversity has a limited role for ecosystem multifunctionality due to the large effect of species dominance on the biogeochemical ecosystem functions considered. This suggests the strong link between species richness and ecosystem multifunctionality coming from experimental studies reveals only part of what happens in nature. Although at a given moment in time only few species may be needed for multifunctional ecosystems, it is likely that at larger spatial and temporal scales biodiversity becomes crucial for maintaining healthy multifunctional ecosystems.
Acknowledgements
The author thanks Gilberto Jampangape for assistance during fieldwork and the community of Loma Bonita for assistance and hospitality during my stays. I am grateful to Frans Bongers, Lourens Poorter, Miguel Martínez-Ramos and Patricia Balvanera for constructive feedback and fruitful discussions. I thank Jorge Rodriguez-Velazquez for data-management, Aline Pingarroni for sharing landscape data, Merel Jansen for making my R-scripts work, Judith Westveer for setting up the decomposition experiments. ML was supported by a research grant from Wageningen University and Research Centre.
30544 Lohbeck-bk.indd 152 27-10-14 16:42

Biodiversity for multiple ecosystem processes
153
7
Appendix 7
Figure A7.1: Bargraphs for the contribution of each of the 81 species to the landscape level ecosystem functions. The ten most important species (those that contribute to the first 50% in at least one function) are given unique colours to allow to compare their contribution to different functions. Species to the left of the blue vertical line are those species that make up for the first 50% of the ecosystem function. Negative productivity values for some species indicate mortality.
30544 Lohbeck-bk.indd 153 27-10-14 16:42

Chapter 7
154
<5
5−10
10−15
15−20
20−25
25−30
Figure A7.2: Distribution of secondary forest ages in the landscape of Marques de Comillas, Chiapas (Pingarroni 2014). Each slice represents one age-category (labels give the range of fallow-ages) and the size gives the relative proportion in the secondary forest landscape. These proportions were used to scale up the 15 secondary forest plots to approximate the secondary forest landscape used in this study. Several secondary forest plots together represented each age category (see also Table A7.1).
Table A7.1. Forest landscape characteristics of the human-modified landscape of Marqués de Comillas, Chiapas (Mexico). The percentages presented in the table represent the relative forest cover of that fallow age category in the landscape (based on 73 secondary forest patches throughout Marqués de Comillas (Pingarroni 2014). These were used to scale up from plot-level data (15 secondary forest plots, 1000 m2) to the landscape level, see also Fig A7.2. The number of plots used to represent each age category is given.
Landscape characteristics Fallow age (yrs) % of forest cover # of plots
Very young secondary forest 0-5 23.3 4
Young Secondary forest 5-10 17.8 2
Intermediate secondary forest 10-15 37.0 3
Mid-late secondary forest 15-20 9.6 2
Late secondary forest 20-25 8.2 2
Old secondary forest 25-30 4.1 2
30544 Lohbeck-bk.indd 154 27-10-14 16:42

Biodiversity for multiple ecosystem processes
155
7
�
�
�
�
�
�
��
��
��
���������������������������������������������������������������������
0 20 40 60 80
010
2030
40
biom
ass
(Mg/
ha) a
5 species
�
�
�
�
�
�
�
�
�
�
�
�
��
��
��
��
�������������������������������������������������������������
0 20 40 60 80
01
23
species richness
prod
uctiv
ity (M
g/ha
/yr) b
11 species
�
�
�
�
�
�
�
��
��
����������������������������������������������������������������������
0 20 40 60 80
0.0
1.0
2.0
3.0
species richness
litte
r pro
duct
ivity
(Mg/
ha/y
r)
c
6 species�
�
�
��
����������������������������������������������������������������������������
0 20 40 60 80
0.0
0.5
1.0
1.5
species richness
woo
d de
com
posi
tion
(Mg/
ha/y
r)
d
2 species
�
�
�
�
�
��
��
��
����������������������������������������������������������������������
0 20 40 60 80
0.0
0.5
1.0
1.5
species richness
leaf
dec
ompo
sitio
n (M
g/ha
/yr)
e
5 species
�
�
�
�
�
�
�
�
�
�
�
species richness
�
�
�
�
�
�
�
�
�
�
�
species richness
Figure A7.3: Landscape-level cumulative ecosystem functions against ranked species richness for each of the 5 ecosystem functions assessed in this study: a) biomass, b) primary productivity, c) litter productivity, d) wood decomposition and e) leaf decomposition. The broken line indicates 50% of the maximum ecosystem function value. In each graph the minimum number of species required to attain at least 50% of the ecosystem function is given (see Fig A7.1 for the identities of the species). Productivity increases somewhat erratically, due to negative productivity effects of some species (mortality), species rank was based on decreasing absolute effect on the function, regardless whether this effect was positive or negative.
Satu
ratio
n of
cur
ve
R1 R2
0.4
0.5
0.6
0.7
0.8
0.9
1.0
Biomass
Satu
rate
dnes
s
R1 R2Productivity
R1 R2Litter production
R1 R2Wood decomposition
R1 R2Leaf decomposition
Figure A7.4: Boxplots representing the variation in the shape of the curve when cumulative ecosystem function is plotted against ranked cumulative species richness. The R1 boxplots represent the median and variation of the 1000 randomized landscapes under ‘randomization method 1’, and illustrates the effect of species dominance on the species richness- ecosystem function relationship. The R2 boxplots represent the median and variation of the 1000 randomized landscapes under ‘randomization method 2’, and illustrates the effect of species traits on the species richness- ecosystem function relationship. The horizontal line in each graph represents the saturation of the relationship as found in the actual study landscape (Fig 7.1 and Fig A7.3). Saturation of the curve is based on the standardized area under the curve where 0.5 represents a fully linear relationship and 1 represents a fully saturated relationship.
30544 Lohbeck-bk.indd 155 27-10-14 16:42

30544 Lohbeck-bk.indd 156 27-10-14 16:42

General discussion
Madelon Lohbeck
30544 Lohbeck-bk.indd 157 27-10-14 16:42

Chapter 8
158
Functional ecology of ecosystem recovery on fallow fields In the tropics, the area of secondary forest currently exceeds that of mature
forest (FAO 2010b), and the importance of secondary forest will probably continue to increase in the future (Chazdon 2014a). Agricultural expansion is the main factor reducing tropical forest cover (Geist and Lambin 2002, Kissinger et al. 2012). Through the process of secondary succession, secondary forests can develop after agricultural fields are abandoned. The aim of this thesis was to mechanistically link tropical forest succession with the recovery of ecosystem functioning after agricultural field abandonment using a functional trait-based approach (explained in more detail below). I made use of secondary forest data from a wet forest region in Chiapas (main study site), complemented with data from a dry forest region in Oaxaca, both in Mexico (Fig 1.3). Given the worldwide importance of secondary forests, evaluating to what extent these can maintain biodiversity, ecosystem functions and ecosystem services is timely and urgent. In this last chapter I synthesize the results of the thesis and discuss how derived knowledge contributes to existing scientific theories (Table 8.1). I also place the results from this thesis in the context of the socio-ecological landscape that characterizes the main study region.
Previous work in the main (wet forest) study region in Marqués de Comillas (Chiapas, Mexico) has shown that early succession exhibits a high species turnover and that species richness increases rapidly during secondary succession (van Breugel et al. 2006, Chazdon et al. 2007). Species richness, though intuitive (‘just counting species’), reveals no information on changes in abundance, species composition and species functional traits, which are likely strong indicators of ecosystem response to environmental gradients and of changes in ecosystem functioning and services (Díaz et al. 2006). Functional traits are key to assess a plant’s response to environmental factors (Naeem and Wright 2003), and also determine a plant’s effect on ecosystem processes (Petchey and Gaston 2006). In this thesis I therefore focus on the recovery of functional trait properties of forest communities on abandoned agricultural lands and their consequences for ecosystem functioning.
There is a broad variety of ways in which to quantify how functional trait values are distributed in a community. In this thesis I address several of those and assess how community functional properties respond to the successional gradient (Chapters 2-5), and how they affect secondary forests functioning
30544 Lohbeck-bk.indd 158 27-10-14 16:42

Discussion
159
8
(Chapters 6-7). See also figure 1.4 for how the chapters represent different aspects of the causes and consequences of changing community functional properties during succession.
Changing community functional properties during successionFunctional diversity (i.e., the value, range, and distribution of functional
traits in a given ecosystem; Díaz et al. 2007a) is often proposed as one of the key properties of biodiversity that gives insight into ecosystem response to global change and into community effects on ecosystem functioning (e.g. Tilman 2001b, Micheli and Halpern 2005). However, little is known about how it responds to existing environmental gradients in species-rich ecosystems, neither about how well functional diversity is related to commonly used taxonomic diversity metrics. In Chapter 2 I show that incidence-based functional richness (i.e., total branch length of the functional dendrogram) increases rapidly in the first years of succession and starts levelling off already within the first decades, whereas abundance-weighted functional diversity (i.e., total branch length of the functional dendrogram, weighting distances by species abundances) does not directionally change with succession. Lack of change when weighted for abundance probably reflects the rapid and variable changes in species dominance reported in some of the plots (van Breugel et al. 2006). The asymptotic successional increase in functional richness is very similar to successional increase in species richness (Fig 2.1; cf. Guariguata and Ostertag 2001, Peña-Claros 2003). Indeed, when functional richness is based on multiple traits it closely reflects species richness, as indicated by a strong linear relationship between the two. In contrast, when a single trait is used to calculate functional diversity, species richness may underestimate functional diversity (Fig 2.2; Lohbeck et al. 2012). Using fewer traits, as does weighting by abundance, reduces the effective dimensionality of trait space (Petchey and Gaston 2002a). Such reduction highlights differences in community functional composition (such as the functional identity of dominant species), explaining the loss of a tight fit between species- and functional diversity metrics. The linear relationship between species richness and functional richness when including multiple traits reveals that each species is functionally complementary to any other species, in other words, in the system studied there is no evidence for functional redundancy during early succession (<30 years). It is possible that functional redundancy, which is considered important for resilience, starts to occur in later successional stages and in mature forest
30544 Lohbeck-bk.indd 159 27-10-14 16:42

Chapter 8
160
(Laliberté et al. 2010, Chazdon 2014a). Given these results, I argue that for linking biodiversity and ecosystem functioning, careful consideration is necessary whether weighting for abundance is needed (are dominant species expected to contribute disproportionally? see also chapter 7) and which trait(s) need to be included in functional diversity metrics (see also chapter 6). These choices will depend on the ecological gradient considered (such as the successional gradient studied in this thesis, or a logging intensity gradient; e.g. Carreño-Rocabado 2013), climatic conditions (e.g. dry or wet forest, see also chapter 3 and 4) and the ecosystem function of interest (e.g. primary productivity or decomposition rates, see also chapter 6).
A complementary way to assess responses of community functional properties to the successional gradient is to evaluate single-trait community-weighted means (CWMs; Garnier et al. 2004, Lavorel et al. 2007), as I have done in Chapter 3. Here, traits are weighted by species’ relative basal area thereby assuming that species that achieved larger sizes or have many stems are better adapted to the local environmental conditions. Successional changes in the community-weighted mean are expected to have large consequences for ecosystem functioning as the mass-ratio hypothesis (Grime 1998) predicts that mainly the functional traits of the dominant species determine ecosystem functioning (cf. Garnier et al. 2004). This is assessed not only for the wet forest chronosequence in Chiapas but also for a dry forest chronosequence in Oaxaca (both in Mexico). These forest types differ strongly in their annual precipitation (dry: 900 mm/yr, wet: 3000 mm/yr) and succession is thereby characterized by very different environmental gradients: dry forest successional turnover is mainly driven by the increasing water availability gradient (Lebrija-Trejos et al. 2011, Pineda-García et al. 2013) and wet forest successional turnover by the decreasing light availability gradient (e.g. Bazzaz 1979, Montgomery and Chazdon 2001). I show that the community-weighted functional trait means change with succession in both forest types, but that the traits that matter largely differ for dry and wet forest as a result of the contrasting resource availability gradients (Fig 3.1; Lohbeck et al. 2013). As predicted, during dry forest succession conservative trait values (related to drought tolerance) and drought avoidance decreased (Lebrija-Trejos et al. 2010b, Alvarez-Añorve et al. 2012) while seed size and dependence on biotic dispersal increased (Tabarelli and Peres 2002). Unexpectedly, however, acquisitive leaf trait values also decreased. In wet forest succession, functional composition
30544 Lohbeck-bk.indd 160 27-10-14 16:42

Discussion
161
8
changed from acquisitive to conservative leaf traits, suggesting light availability as the main driver of changes and confirming the long-standing paradigm of light demanding pioneers and shade-tolerant late successional species (Bazzaz and Pickett 1980, Swaine and Whitmore 1988). So, while functional richness levelled-off during early stages of succession (Fig 2.1), functional composition changes linearly (Fig 3.1). This suggests that recovery of functional composition (which can be described as a combination of several community-weighted means) is slower than that of functional richness (but see Poorter et al. in press), which is similar to earlier findings that species composition takes longer to recover than species richness (Finegan 1996, Guariguata and Ostertag 2001, Chazdon 2003, Poorter et al. in press). In early dry forest succession conservative trait values were predominant, as expected because of the harsh dry conditions, but at the same time some acquisitive leaf trait values dominated, like large leaves and high SLA (Fig 3.1). This was unexpected and suggests that these acquisitive species have additional drought coping mechanisms that are not considered in this study (like a deep rooting system and long leaf-less periods during the dry season). The simultaneous dominance of conservative and acquisitive strategies in early dry forest succession is noteworthy given that these are the extremes of the acquisitive-conservative continuum and thereby considered trade-offs (Wright et al. 2004, Shipley et al. 2006).
This provoked me to explore the functional trait trade-offs that constrain dry and wet forest species to adopt different functional strategies, in Chapter 4. I found that secondary forest species from dry and from wet forest exhibit similar functional strategies and trade-offs (Fig 4.2), confirming the existence of fundamental trade-offs in plant resource economics (Díaz et al. 2004, Wright et al. 2004, Reich 2014). In both forest types, two main spectra of trait variation across species were found: the acquisitive-conservative trade-off that runs from cost-efficient leaf area display to enhance fast growth towards dense tissues in leaves and wood to better conserve internal resources, and the trade-off from deciduous, small-seeded species towards species that invest in large biotically dispersed seeds (Fig 4.1). The main axis of variation that mattered for succession in the two forest types reflected different axes of variation: In dry forest the community changed from drought avoiding strategies early in succession to increased abundance of evergreen strategies and having larger seeds late in succession. In wet forest the community changed from species having mainly acquisitive strategies to those with more conservative strategies during
30544 Lohbeck-bk.indd 161 27-10-14 16:42

Chapter 8
162
succession (Fig 4.3). These strategy changes confirmed that the predominant environmental gradient that underlies species turnover contrasts for dry and wet forest: dry forest succession is characterized by increasing water availability and wet forest succession by increasing light scarcity (Lohbeck et al. 2013, Lohbeck et al. submitted). The unexpected finding that both conservative and acquisitive functional traits dominate in early dry forest succession (Chapter 3), combined with the consistent trade-off between acquisitive and conservative strategies (Chapter 4), suggests that the way in which communities are assembled could reveal more insights. The fact that very complementary functional strategies are present in early dry successional sites, indicates that coexisting species complement their resource uptake, also called ‘niche differentiation’. Such functional complementarity was suggested especially relevant when resources are limiting (Hardin 1960, Grime 1973). Indeed water is most limiting in early succession in dry forest (Lebrija-Trejos et al. 2011) whereas in wet forest light becomes increasingly limiting in later successional stages (e.g. Montgomery and Chazdon 2002).
In chapter 5 I therefore explored whether the dominant species along the wet forest successional gradient become increasingly complementary in their light-capture strategies. I asked which are the dominant species, whether or not their functional traits represent a random subset of the whole community, and how this representation changes with succession. I found that in early succession, dominant species represent a functionally narrow subset of species with similar traits, while in late succession, dominant species increasingly represent a wide subset of the species present in the community (Fig 5.2). This trend was found for traits that reflect photosynthetic performance and light capture, and indicates increased light gradient partitioning during wet forest succession, as expected (cf. Kobe 1999). For traits that reflected defence against herbivory no trend was found, suggesting no successional change in herbivore pressure. Therefore, I concluded that during the early successional time window evaluated in this wet forest (up to 25 years after abandonment), the importance of habitat filtering as a driving force fades away rapidly, and the importance of niche differentiation for species dominance starts to emerge (Lohbeck et al. 2014). These conclusions are in line with those of Letcher and colleagues (2012) based on decreasing phylogenetic relatedness during succession in several Neotropical forests. Understanding the drivers of species dominance is important as evidence indicates that mainly the
30544 Lohbeck-bk.indd 162 27-10-14 16:42

Discussion
163
8
functional characteristics of the dominant species determine the functioning of an ecosystem (Grime 1998, Smith and Knapp 2003, Dangles and Malmqvist 2004).
Consequences for ecosystem functioningBiodiversity is celebrated as a major driver of ecosystem functioning (MA
2005, Balvanera et al. 2006, Midgley 2012). In Chapter 6 I evaluated what drives the recovery of ecosystem processes during succession using structural equation modelling. I tested three alternative pathways that could explain changes in ecosystem processes during succession:
1) the vegetation quantity hypothesis predicts a positive relationship between biomass and ecosystem processes and suggests that what matters is the amount of vegetation building up with succession, regardless of biodiversity or functional traits, 2) the niche complementarity hypothesis (Tilman 2001a) predicts a positive relation between functional diversity and ecosystem processes, as functionally more diverse communities are better able to make optimal use of resources, 3) the mass ratio hypothesis (Grime 1998) predicts that traits of dominant species drive ecosystem processes where acquisitive trait values positively relate to ecosystem process rates and conservative trait negatively (Fig 6.1). Hypothesis 1, representing the quantity of the vegetation, thereby contrasts with hypotheses 2 and 3 that represent the quality of the vegetation. Using the ecosystem processes biomass productivity, litter productivity, actual decomposition and potential decomposition I quantified some of the most important fluxes of carbon and nutrients that take place in forests (Hooper et al. 2005). I found that ecosystem process rates were mostly affected by the amount of vegetation in the secondary forests, and that functional diversity and composition were of lesser importance (Fig 6.2). Vegetation quality (FD and CWM) only had additional effects for biomass productivity and in the more controlled (common garden, ex situ) potential decomposition experiment. Thereby I found limited evidence for the importance of biodiversity (FD) for ecosystem functions, as vegetation quantity (biomass) overrules the more subtle effects of vegetation quality (FD and CWM), at least during the tropical forest succession gradient considered (cf. Martin et al. 2013). We recommend future studies that link biodiversity with ecosystem functioning to separate the effects of vegetation quality from those of vegetation quantity on ecosystem processes and services (cf. Bengtsson 1998, Hodgson et al. 1998, Bolam et al. 2002).
30544 Lohbeck-bk.indd 163 27-10-14 16:42

Chapter 8
164
Several studies have indicated that indeed biodiversity may not matter so much for a single ecosystem process, but is of increasing importance when multiple ecosystem functions are considered (Hector and Bagchi 2007, Zavaleta et al. 2010, Isbell et al. 2011, Mouillot et al. 2011). The rationale is that different species contribute to different functions, so maintaining multifunctionality requires many more species than maintaining a single ecosystem function (e.g. Byrnes et al. 2014). In chapter 7 I tested whether indeed different species matter for different ecosystem functions in the studied human-modified tropical wet forest landscape. For this I quantified the functions biomass, productivity, litter production, wood decomposition and litter decomposition at the landscape-level, and the contribution of 81 species to each of those functions. I found that largely the same (dominant) species mattered for different ecosystem functions, indicating a limited role of biodiversity for ecosystem multifunctionality. Using simulations I showed that biodiversity becomes important for multifunctionality when evenness is high, i.e. when species are equally abundant in the system (Fig 7.2; cf. Maestre et al. 2012a), explaining the contrasting results from experimental studies that keep dominance low. It is important to consider that my study, similar to basically all other studies in the field of biodiversity and ecosystem functioning, makes use of a limited set of biogeochemical functions. These functions are treated as additive functions, meaning that the effect of species in a mixed assemblage can be predicted from the effect of each of the species when aggregated (Reiss et al. 2009), and by definition dominant species contribute more to such additive functions (Norberg 2004). I therefore recommend future studies to address the consequences of biodiversity loss on ecosystem multifunctionality in natural ecosystems while including a wide range of ecosystem functions. I conclude that though the importance of biodiversity at a given moment in time may be limited, biodiversity is especially important for maintaining ecosystem multifunctionality across spatial and temporal scales (cf. Bunker et al. 2005, Isbell et al. 2011, Mori et al. 2012).
30544 Lohbeck-bk.indd 164 27-10-14 16:42

Discussion
165
8
Table 8.1: Existing theories on functional ecology of secondary succession and ecosystem function and how this thesis contributed
Theory/ hypothesis Literature Contribution of this thesis
Secondary succession
Secondary succession is a deter-ministic process
(Clements 1916) Some aspects are deterministic, others not, see all chapters
Tropical forest succession is mainly driven by decreasing light availability
(Bazzaz and Pickett 1980, Mont-gomery and Chazdon 2001)
Confirmed for wet forest succes-sion, not for dry forest succes-sion, see chapter 3 and 4
Pioneers are light-demanding, late successional species are shade-tolerant
(Bazzaz and Pickett 1980, Swaine and Whitmore 1988)
Confirmed for wet forest succes-sion, not for dry forest succes-sion, see chapter 3 and 4
Changing tree communities during wet forest succession
Fundamental trade-offs in func-tional strategies underlie species adaptation to environmental gradients
(Wright et al. 2004, Reich 2014) Confirmed, see chapter 4
Biodiversity accumulates with fallow age
(Saldarriaga et al. 1988, Guarig-uata and Ostertag 2001)
Confirmed, though depends on metric, see chapter 2
Functional traits change as re-sponse to environmental filters
(Díaz et al. 1998) Confirmed, see chapter 3 and 4
Functional composition changes with fallow age
(Garnier et al. 2004, Poorter et al. in press)
Confirmed, though how they change depends on climatic zone, see chapter 3 and 4
Assembly processes change from habitat filtering in early succes-sion to niche differentiation in late stages
(Letcher et al. 2012) Confirmed at level of species dominance in wet forest, and reflected in traits that determine light uptake, see chapter 5
High species diversity in tropical forest suggests functional redun-dancy
(Chazdon and Arroyo 2013) No evidence of increased redun-dancy during early successional window, see chapter 2
Biodiversity and ecosystem function
Biomass increases with succes-sion
(Guariguata and Ostertag 2001, van Breugel et al. 2011, Becknell and Powers 2014)
Confirmed, see chapter 6
Ecosystem functioning recovers during succession
(Chazdon 2008) Confirmed, though depends on function, see chapter 6
Functional traits drive ecosystem function
(Díaz et al. 2006) Limited support, biomass over-rules effects of diversity and functional traits as drivers of EF during succession, see chapter 6 and 7
Biodiversity drives ecosystem function
(Balvanera et al. 2006, Díaz et al. 2009, Midgley 2012)
Limited support, biomass over-rules effects of diversity and functional traits as drivers of EF during succession, see chapter 6 and 7
Biodiversity becomes increasing-ly important when multiple eco-system functions are considered
(Hector and Bagchi 2007, Za-valeta et al. 2010, Isbell et al. 2011, Mouillot et al. 2011)
Limited support, mostly the same dominant species drive different EFs, see chapter 7
30544 Lohbeck-bk.indd 165 27-10-14 16:42

Chapter 8
166
The role of secondary forests in human-modified landscapes
Secondary forests are safe-havens for biodiversity in HMLs
(Chazdon et al. 2009) Confirmed for tree species, given that succession is left to unfold, see chapter 1, 2
Secondary forests provide im-portant ecosystem functions and services
(Chazdon 2008) Confirmed given that succession is left to unfold, see chapter 6 and 7
Disturbance/ agricultural expan-sion changes the functioning of secondary forests at the land-scape level
(Melo et al. 2013) Confirmed although change in EF may go unnoticed for a long time, see chapter 7
The need for a landscape approachIn the current study I assessed secondary forests at the stand level which gives
detailed insight into the potential recovery of tropical forest. However, it is well known that the speed of secondary forest regeneration, thus the rates of recovery of biodiversity and ecosystem functions, depend on the landscape matrix (Lamb 2005). The proximity of mature forest as seed sources, as well as landscape connectivity promoting movement animals performing key roles (as seed-dispersers and herbivores), are vital for maintaining plant diversity (Martínez-Garza and González-Montagut 1999, Arroyo-Rodríguez and Mandujano 2006, Jakovac et al. in press). Secondary forests in the main (wet forest) study region in Mexico’s state of Chiapas are located in a human-modified landscape with high pressure for agricultural expansion and intensification. Currently the landscape still holds pockets of mature forest, and is adjacent to the protected area the Montes Azules Biosphere Reserve (de Jong et al. 2000, Martínez-Ramos 2006). In comparable human-modified landscapes in Mexico, like the Los Tuxtlas region in Southern Veracruz, land-use has intensified more quickly, possibly because of better accessibility (Hernandez-Ruedas et al. 2014). Forested landscapes can be positioned on a ‘forest-use intensity gradient’ where more intense use of the forest can be expected with increasing accessibility, where land-tenure is more secure, population density is high and potential land rent is high (Putz and Romero 2014). Such gradient is critical to assess the likely state of tropical forest in a region as well as their restoration potential and effectiveness. Marqués de Comillas’ position towards the low intense forest-uses, with a relatively high percentage of mature forest (32%; Pingarroni 2014), probably contributes to a rather optimistic scenario of biodiversity and ecosystem function recovery as found in this study compared to other regions. In addition, it is important to recognize that this study represents the ‘potential recovery’ when secondary succession is left to
30544 Lohbeck-bk.indd 166 27-10-14 16:42

Discussion
167
8
unfold without further human disturbance. This was possible because land-owners were paid to leave the secondary forests without intervention for the purpose of scientific research. In reality these forests would unlikely reach ages older than about 5 years, when landowners decide to cultivate the land again or convert it into pasture. It is clear that the potential for restoring ecosystem functions and maintaining biodiversity is very limited in such ephemeral forests (cf. van Breugel et al. 2013). Secondary forest management is tightly linked with a complex series of land-use decisions at the household level (Perz and Walker 2002) of which little is known in the study region. Studying the role of (secondary) forest in a landscape approach allows including competing land-uses, external pressures and actor strategies (cf. Sayer et al. 2013). The landscape approach promotes the reconciliation of competing land uses and is an important way towards integrating the different sectoral and project based policies that exert influence on land-use in the area. Recognizing the strong interdependence of food security and the state of the environment, such integration is needed to ensure long-term sustainability (Foresight Program 2011). Currently, the policies that influence land-use in the study area, such as agricultural subsidies and REDD+ programmes (see next paragraph), often have conflicting outcomes and allow limited input from the local inhabitants. Besides being inefficient and costly, it is improbable that the environment or local livelihoods will benefit on the long term given the interdependence of the two. Such sectoral policies, and the lack of local participation may have contributed to the social unrest in the area that prevails up to today. Although no panacea, applying a landscape approach to integrate sectoral policies and streamline them with local actor strategies will be an important step towards multifunctional human-modified landscapes.
External factors influencing forest cover in the study regionThe most important factor driving deforestation in the Lacandon region
is agricultural expansion, and agricultural subsidies further incentivize this expansion (Klepeis and Vance 2003). Agricultural subsidies received by the inhabitants of Loma Bonita are Procampo for cultivating the land (about 1000 MXN or 75US$ / ha/ yr, since 1994), and Progan, per head of cow (about 400 MXN or 30US$ / cow/ yr, since 2003; landowners pers. comm.). Procampo ‘aims to slow down environmental degradation, promote conservation and reforestation to help reduce soil erosion and water pollution caused by excessive use of non-organic pesticides and to promote sustainable development’ (Klepeis and Vance 2003). Procampo was initiated
30544 Lohbeck-bk.indd 167 27-10-14 16:42

Chapter 8
168
as part of the political agenda to liberalize the agricultural sector, and aimed to help farmers deal with increased price insecurity after agrarian price support was phased out as a consequence of the North American Free Trade Agreement (NAFTA). Subsidies are received per area of land dedicated to cultivating crops, livestock or forestry activity, while only pre-1993 land (pre-NAFTA) is subsidized in order to stimulate intensification and reduce pressure on remaining forest. The programme (as of 1995) allows farmers to devote land to different agricultural land-uses, and the only land-use that not subsidized is letting land idle without specific activities, as is usually the case with secondary forest. The structure of the Procampo programme is thereby incompatible with the traditional shifting cultivation system (the milpa), that depends on a fallow period to let the land recover through secondary succession. As the biophysical conditions are such that continued cultivation is very difficult without (chemical) inputs, yields decline over time (except for more fertile areas alongside major rivers). In the Southern Yucatán peninsula this caused people to open up new areas (mature forest) for cultivation, and thereby increased deforestation as an indirect consequence of the rural support programme (Klepeis and Vance 2003). Also it was suggested that Procampo drives the increase of pastureland because pasture is a low-maintenance means to ensure support of the programme (Klepeis and Vance 2003), which is probably further exacerbated by the other agricultural reform programme Progan (subsidies per head of cow). In sum, the subsidiary programs that are in place in the study region incentivizes pastureland expansion and cropland intensification that together are major factors driving deforestation.
Programmes under REDD+ (Reduced Emissions from Deforestation and forest Degradation) could potentially counterbalance this and ensure conservation of the mature forest pockets and late secondary forests that are left in the study region. In fact, Mexico is one of the world’s pioneers in promoting forest carbon trading (Corbera and Brown 2008) and in the state of Chiapas several REDD+ projects are currently taking place, including payments for conserving late secondary forest (landowners pers. comm.). One complication for the successful application of REDD+ in Mexico is that 70% of the forests is managed communally in ejidos (FAO 2010a), commonly characterized by internal conflict and weak communal authorities (Kaimowitz 2008). In the ejido Loma Bonita, nobody receives payments for forest services because they did not qualify the criteria (among which a minimum forest fragment size of 50 ha), whereas in the neighbouring village Chajul people do receive benefits for (secondary) forest
30544 Lohbeck-bk.indd 168 27-10-14 16:42

Discussion
169
8
cover (about 1000 MXN or 75US$ / ha/ yr). For REDD+ initiatives to be successful and equitable, land tenure conflicts need to be resolved, local inhabitants need to be empowered to be able to benefit and objectives should be fine-tuned with conflicting subsidies in the landscape. My evaluation is that, given the above arguments, incentives for conservation will not counterbalance those for cultivation in the near future in the study area.
The future of forests in Marqués de Comillas, Chiapas The Lacandon region shows a trend towards more forest cover in secondary
forest and declining rates of forest clearing (de Jong et al. 2000) which may be an indicator that a forest transition is upcoming. A forest transition occurs when, after initial decline of forest cover due to deforestation, forest cover increases again and eventually reforestation outweighs deforestation (Perz and Skole 2003). The forest transition theory provides an optimistic scenario for forest cover although whether optimism is grounded should depend on the quality of the emerging forests, which can range from diverse secondary forests to monoculture plantations (Melo et al. 2013). A forest transition has been demonstrated in industrial countries and also in some tropical regions, like parts of the Amazon Basin (Perz and Skole 2003) and in tropical countries like Costa Rica, Bangladesh, Rwanda (Rudel et al. 2005) and Vietnam (Lambin and Meyfroidt 2010). Such transition is however by no means guaranteed, as many agricultural landscapes continue to increase forest degradation (Metzger et al. 2009, Karp et al. 2012). When a landscape undergoes a forest transition, it starts with a decline in deforestation rates, which is usually due to increased scarcity of forest resources. The increased forest cover that could follow is usually driven by rural exodus, economic growth and urbanisation (Lambin and Meyfroidt 2010). This assumes a direct relationship between local population density and deforestation (cf. Wright and Muller-Landau 2006a), which is highly contested because reductions in population density often go together with increasing exogenous influence (Sloan 2007). Indeed the extent to which forest grows back and turns into long-lasting forest patches is doubtful given that human population as well as per-capita consumption patterns continue to put pressure on the forests (Ewers et al. 2009). For example in the Brazilian Atlantic Forest out-migration induced changes from subsistence agriculture to large scale intensified agriculture, thereby further reducing forest cover (Bernard et al. 2011).
30544 Lohbeck-bk.indd 169 27-10-14 16:42

Chapter 8
170
In Marqués de Comillas (933km2), the municipality where the ejido of Loma Bonita is located, there are no signs of rural exodus, instead the rural population has been steadily increasing with about 15 % in the last decade (from about 8.500 to almost 10.000 inhabitants in the period 2000-2010;INEGI). Landowners in the village Loma Bonita reported a recent drop in the number of inhabitants due to internal conflicts, though also deny a rural exodus, as young adults often leave to work in the city for a while but generally come back to buy land, create a family and stay. If not the reduced population density, emerging institutions and organisations trying to integrate conservation and development for sustainability (in line with landscape approach) could drive increased forest cover (Bray and Klepeis 2005). However, the same authors reported that initiatives in the 1990s to bring together development objectives and conservation objectives for sustainable forest management in Marqués de Comillas have failed. Although deforestation is slowing down in Marqués de Comillas, reforestation has not overtaken deforestation rates, i.e. forest cover is not increasing. Some authors call this an ‘incipient forest transition’ and argue that strategies aimed to stimulate forest regrowth and tree planting are required (Vaca et al. 2012). Another study comparing the Lacandon forest with eastern and southern Yucatan peninsula found that the Lacandon forest is still far from a forest transition. Reasons are ongoing colonization by settlers inside the reserve and conflicts in land-tenure (Bray and Klepeis 2005). Rudel and collaborators (2002) claim that in areas where labour-saving, income-generating land uses such as cattle ranching is an option, as is the case in Marqués de Comillas, the likelihood of increased forest cover is very small.
I argue that there is a reasonable chance that forest cover will increase in Marqués de Comillas, not with species rich secondary forest, but with monoculture plantations of the African oil palm (Elaeis guineensis). The palm tree is planted for biofuels, and the state of Chiapas is Mexico’s largest producer. The production of palm oil in Chiapas has increased by tenfold in the period 1993-2011 (Fletes-Ocón and Bonanno 2013), due to state-interventions (the programme Procede) and due to the high demand. These plantations require large amounts of pesticides and fertilisers to achieve desired productivity (García Aguirre 2012). Though CO2 is stored in palm oil plantations, this is exactly the type of forest cover increase that does not contribute to biodiversity conservation (Savilaakso et al. 2014). Evaluating what direction the forest landscape is most likely to head towards in the coming decades I quote O’Brien (1998, p 14): “unless the social and
30544 Lohbeck-bk.indd 170 27-10-14 16:42

Discussion
171
8
environmental struggles can develop a common ground, tropical forests of the Lacandon region will continue to be sacrificed to the realities of the day”.
Box 8.1: Land-uses and environmental change: some perspectives from the ‘ejidatarios of Loma Bonita’
Loma Bonita’s land area (total of 1730 ha) consists largely of grazing lands (almost 60%), over 20% is secondary forest, about 15% consist of protected mature forest patches, and cultivated lands make up 5% (Zermeño-Hernández 2008, Pingarroni 2014). To get an overview of land-uses practiced by the inhabitants of Loma Bonita, and their perceptions on changes, semi-structured interviews were carried out early 2013. 28 Respondents that owned land in the ejido (called ‘ejidatarios’) were selected, these represent about half of the households and about 80% of the total number of ejidatarios that live in the village (G. Jamangape pers. comm.). The main income comes from cattle breeding, combined with agricultural subsidies people receive for cultivating the land (Procampo) and for keeping cows (Progan). 75% Of the respondents owned cows (ranging from 3 to 70 cows) and raising cattle is seen as a secure way of saving money (“la vaca es el dinero seguro”). At the moment of study only one third of the respondents (total of 10) practiced shifting cultivation, others cultivated land in the river floodplains where permanent cultivation is practiced. Here, to speed up soil recovery before the next cycle, the biofertiliser Mucuna deeringiana (“nescafe”) is planted. Possibly the importance of shifting cultivation decreases in the study region as has been seen in other regions (cf. Lawrence et al. 2010), and could be explained by the increased area used for extensive grazing lands (Smith et al. 1999) as well as the subsidized intensification of land-use under Procampo (see main text). People that have no property along the riverside can borrow land from the ejido-properties to grow food. Only one respondent had no land under cultivation –at the moment of interviewing- and therefore had to purchase staple foods (as do the inhabitants that do not own land, the pobladores, that represent about a third of the households). Land for shifting cultivation in the study area is used for 1 or 2 harvest cycles after which it is left fallow. Fallow management is basically leaving the land abandoned until trees are slashed and burned before cultivation. The fallow period varies considerably
30544 Lohbeck-bk.indd 171 27-10-14 16:42

Chapter 8
172
per landowner, between 1 and 8 years, and increases with increasing property size. The fallow period has reduced over time, as reported by some of the respondents,
mainly as a result of decreasing land available for cultivation. The mature forest cover in the area has decreased rapidly from 100% when the
first settlers arrived in the mid-‘70s (see Box 1.2) to about 15% today (Pingarroni 2014), and this was usually the first thing respondents mentioned when asked what had changed since they first arrived. Additionally, decreases in populations of wild animals for hunting and decreases in populations of fish in the river were reported. Respondents consistently mentioned reductions in rainfall and increased heat, and more than a third of the respondents dedicated this to the deforestation (“si no tenemos bosque no llueve”). The water level of the adjacent river Lacantún has lowered in the dry periods and become more contaminated, and erosion as well as the frequency of inundations in the wet season have increased. Some respondents mentioned that the climate had become more unpredictable, which was perceived as problematic because people depend on agricultural activities for their income and subsistence. Also a reduction in the availability of wood for construction was reported, nowadays people have to buy wood, though this is mostly still available from within the village. Increased scarcity of preferred species (like Dialium guyanensis and Terminalia amazonica) has also caused a shift towards the use of lower quality but more readily available (secondary forest-) tree species (like Vochysia guatemalensis and Schizolobium parahyba). Most people reported that well-being had improved due to better schools, healthcare, electricity, tap-water, less diseases (notably malaria), less venomous snakes and better accessibility due to the construction of the road.
30544 Lohbeck-bk.indd 172 27-10-14 16:42

30544 Lohbeck-bk.indd 173 27-10-14 16:42

Literature
30544 Lohbeck-bk.indd 174 27-10-14 16:42

175
Literature
Ackerly, D. D. and W. K. Cornwell. 2007. A trait-based approach to community assembly: partitioning of species trait values into within- and among-community components. Ecology Letters 10:135-145.Aerts, R. 1996. Nutrient resorption from senescing leaves of perennials: Are there general patterns? Journal of Ecology 84:597-608.Alvarez-Añorve, M. Y., M. Quesada, G. A. Sánchez-Azofeifa, L. D. Avila-Cabadilla, and J. A. Gamon. 2012. Functional regeneration and spectral reflectance of trees during succession in a highly diverse tropical dry forest ecosystem. American Journal of Botany 99:816-826.Arroyo-Rodríguez, V. and S. Mandujano. 2006. The importance of tropical rain forest fragments to the conservation of plant species diversity in Los Tuxtlas, Mexico. Biodiversity and Conservation 15:4159-4179.Augspurger, C. K. and C. K. Kelly. 1984. Pathogen mortality of tropical tree seedlings: Experimental studies of the effects of dispersal distance, seedling density, and light conditions. Oecologia 61:211-217.Aweto, A. O. 1981. Secondary succession and soil fertility restoration in south-western Nigeria. II. Soil fertility restoration. Journal of Ecology 69:609-614.Baker, N. R. and E. Rosenqvist. 2004. Applications of chlorophyll fluorescence can improve crop production strategies: an examination of future possibilities. Journal of Experimental Botany 55:1607-1621.Bakker, M. A., G. Carreño-Rocabado, and L. Poorter. 2011. Leaf economic traits predict litter decomposition in tropical plants and differ among land-use types. Functional Ecology 25:473-483.Baltzer, J. L., S. J. Davies, S. Bunyavejchewin, and N. S. M. Noor. 2008. The role of desiccation tolerance in determining tree species distributions along the Malay–Thai Peninsula. Functional Ecology 22:221-231.Balvanera, P., C. Kremen, and M. Martínez-Ramos. 2005. Applying community structure analysis to ecosystem function: examples from pollination and carbon storage. Ecological Applications 15:360-375.Balvanera, P., A. B. Pfisterer, N. Buchmann, J.-S. He, T. Nakashizuka, D. Raffaelli, and B. Schmid. 2006. Quantifying the evidence for biodiversity effects on ecosystem functioning and services. Ecology Letters 9:1146-1156.Baraloto, C., E. Marcon, F. Morneau, S. Pavoine, and J.-C. Roggy. 2010a. Integrating functional diversity into tropical forest plantation designs to study ecosystem processes. Annals of Forest Science 67:303.Baraloto, C., C. E. T. Paine, L. Poorter, J. Beauchene, D. Bonal, A.-M. Domenach, B. Hérault, S. Patiño, J.-C. Roggy, and J. Chave. 2010b. Decoupled leaf and stem economics in rain forest trees. Ecology Letters 13:1338-1347.Baraloto, C., T. C. E. Paine, S. Patiño, D. Bonal, B. Hérault, and J. Chave. 2010c. Functional trait variation and sampling strategies in species-rich plant communities. Functional Ecology 24:208-216.Barlow, J., T. A. Gardner, I. S. Araujo, T. C. Avila-Pires, A. B. Bonaldo, J. E. Costa, M. C. Esposito, L. V. Ferreira, J. Hawes, M. I. M. Hernandez, M. S. Hoogmoed, R. N. Leite, et al. 2007. Quantifying the biodiversity value of tropical primary, secondary, and plantation forests. PNAS 104:18555-18560.Barnosky, A. D., N. Matzke, S. Tomiya, G. O. Wogan, B. Swartz, T. B. Quental, C. Marshall, J. L. McGuire, E. L. Lindsey, K. C. Maguire, B. Mersey, and E. A. Ferrer. 2011. Has the Earth’s sixth mass extinction already arrived? Nature 471:51-57.Batterman, S. A., L. O. Hedin, M. van Breugel, J. Ransijn, D. J. Craven, and J. S. Hall. 2013. Key role of symbiotic dinitrogen fixation in tropical forest secondary succession. Nature 502:224–227.Bazzaz, F. A. 1979. The physiological ecology of plant succession. Annual Review of Ecology and Systematics 10:351-371.Bazzaz, F. A. and S. T. A. Pickett. 1980. Physiological ecology of tropical succession: A comparative review. Annual Review of Ecology and Systematics 11:287-310.Becknell, J. M., L. Kissing Kucek, and J. S. Powers. 2012. Aboveground biomass in mature and secondary seasonally dry tropical forests: A literature review and global synthesis. Forest Ecology and Management 276:88-95.Becknell, J. M. and J. S. Powers. 2014. Stand age and soils as drivers of plant functional traits and aboveground biomass in secondary tropical dry forests. Canadian Journal of Forest Research 44:604-613.Bengtsson, J. 1998. Which species? What kind of diversity? Which ecosystem function? Some problems in studies of relations between biodiversity and ecosystem function. Applied Soil Ecology 10:191-199.Berish, C. W. and J. J. Ewel. 1988. Root development in simple and complex tropical successional ecosystems. Plant and Soil 106:73-84.Bernard, E., F. P. Melo, and S. R. R. Pinto. 2011. Challenges and opportunities for biodiversity conservation in the Atlantic Forest in face of bioethanol expansion. Tropical Conservation Science 4:267-275.
30544 Lohbeck-bk.indd 175 27-10-14 16:42

176
Bihn, J. H., G. Gebauer, and R. Brandl. 2010. Loss of functional diversity of ant assemblages in secondary tropical forests. Ecology 91:782-792.Biswas, S. R. and A. U. Mallik. 2011. Species diversity and functional diversity relationship varies with disturbance intensity. Ecosphere 2:1-10.Black, J. N. 1960. The significance of petiole length, leaf area, and light interception in competition between strains of subterrranean clover (Trifolium subterraneum L.) grown in swards. Australian Journal of Agricultural Research 11:277-291.Bohlman, S. A. 2010. Landscape patterns and environmental controls of deciduousness in forests of central Panama. Global Ecology and Biogeography 19:376-385.Bolam, S. G., T. F. Fernandes, and M. Huxham. 2002. Diversity, biomass, and ecosystem processes in the marine benthos. Ecological Monographs 72:599-615.Bongers, F., L. Poorter, W. D. Hawthorne, and D. Sheil. 2009. The intermediate disturbance hypothesis applies to tropical forests, but disturbance contributes little to tree diversity. Ecology Letters 12:798-805.Bongers, F. and J. Popma. 1990. Leaf characteristics of the tropical rain forest flora of Los Tuxtlas, Mexico. Botanical Gazette 151:354-365.Bray, D. B. and P. Klepeis. 2005. Deforestation, forest transitions, and institutions for sustainablity in Southeastern Mexico, 1900-2000. Environment and History 11:195-223.Brooks, T. M., R. A. Mittermeier, C. G. Mittermeier, G. A. B. Da Fonseca, A. B. Rylands, W. R. Konstant, P. Flick, J. Pilgrom, S. Oldfield, G. Magin, and C. Hilton-Taylor. 2002. Habitat loss and extinction in the hotspots of biodiversity. Conservation Biology 16:909-923.Brown, S. and A. E. Lugo. 1990. Tropical secondary forests. Journal of Tropical Ecology 6:1-32.Brown, V. K. 1985. Insect herbivores and pant succession. Oikos 44:17-22.Bruijnzeel, L. A. 2004. Hydrological functions of tropical forests: not seeing the soil for the trees? Agriculture, Ecosystems & Environment 104:185-228.Bu, W., R. Zang, and Y. Ding. 2014. Field observed relationships between biodiversity and ecosystem functioning during secondary succession in a tropical lowland rainforest. Acta Oecologica 55:1-7.Bullock, S. H. 1995. Plant reproduction in neotropical dry forest.in S. H. Bullock and H. A. Mooney, editors. Seasonally Dry Tropical Forests. Cambridge University Press, Cambridge.Bunker, D. E., F. DeClerck, J. C. Bradford, R. K. Colwell, I. Perfecto, O. L. Phillips, M. Sankaran, and S. Naeem. 2005. Species loss and aboveground carbon storage in a tropical forest. Science 310:1029-1031.Butterfield, B. J. and K. N. Suding. 2013. Single-trait functional indices outperform multi-trait indices in linking environmental gradients and ecosystem services in a complex landscape. Journal of Ecology 101:9-17.Byrnes, J. E. K., L. Gamfeldt, F. Isbell, J. S. Lefcheck, J. N. Griffin, A. Hector, B. J. Cardinale, D. U. Hooper, L. E. Dee, J. Emmett Duffy, and R. Freckleton. 2014. Investigating the relationship between biodiversity and ecosystem multifunctionality: challenges and solutions. Methods in Ecology and Evolution 5:111-124.Cardinale, B. J. 2011. Biodiversity improves water quality through niche partitioning. 472:86-89.Cardinale, B. J., J. E. Duffy, A. Gonzalez, D. U. Hooper, C. Perrings, P. Venail, A. Narwani, G. M. Mace, D. Tilman, D. A. Wardle, A. P. Kinzig, G. C. Daily, et al. 2012. Biodiversity loss and its impact on humanity. Nature 486:59-67.Cardinale, B. J., D. S. Srivastava, J. Emmett Duffy, J. P. Wright, A. L. Downing, M. Sankaran, and C. Jouseau. 2006. Effects of biodiversity on the functioning of trophic groups and ecosystems. Nature 443:989-992.Cardinale, B. J., J. P. Wright, M. W. Cadotte, I. T. Carroll, A. Hector, D. S. Srivastava, M. Loreau, and J. J. Weis. 2007. Impacts of plant diversity on biomass production increase through time because of species complementarity. PNAS 104:18123-18128.Carreño-Rocabado, G. 2013. Linking land-use intensification, plant communities and ecosystem processes in lowland Bolivia. PhD thesis. Wageningen University, Wageningen, the Netherlands.Casanoves, F., J. A. Di Rienzo, and L. Pla. 2008. User manual f-Diversity: statistical software for the analysis of functional diversity. 1st edition, Argentina.Casanoves, F., L. Pla, J. A. Di Rienzo, and S. Díaz. 2011. FDiversity: a software package for the integrated analysis of functional diversity. Methods in Ecology and Evolution 2:233-237.Cavender-Bares, J., K. Kitajima, and F. A. Bazzaz. 2004. Multiple trait associations in relation to habitat differentiation among 17 Floridian oak species. Ecological Monographs 74:635-662.
30544 Lohbeck-bk.indd 176 27-10-14 16:42

177
Literature
Challenger, A. and J. Soberón. 2008. Los ecosistemas terrestres. Pages 87-108 in: Capital natural de México. Conabio, México.Chambers, R. and M. Leach. 1989. Trees as savings and security for the rural poor. World Development 17:329-342.Chase, J. M. 2010. Stochastic community assembly causes higher biodiversity in more productive environments. Science 328:1388-1391.Chave, J., C. Andalo, S. Brown, M. Cairns, J. Chambers, D. Eamus, H. Fölster, F. Fromard, N. Higuchi, T. Kira, J. P. Lescure, B. Nelson, et al. 2005. Tree allometry and improved estimation of carbon stocks and balance in tropical forests. Oecologia 145:87-99.Chave, J., D. Coomes, S. Jansen, S. L. Lewis, N. G. Swenson, and A. E. Zanne. 2009. Towards a worldwide wood economics spectrum. Ecology Letters 12:351-366.Chazdon, R. 2003. Tropical forest recovery: legacies of human impact and natural disturbances. Perspectives in Plant Ecology, Evolution and Systematics 6:51-71.Chazdon, R. L. 2008. Beyond deforestation: restoring forests and ecosystem services on degraded lands. Science 320:1458-1460.Chazdon, R. L. 2014a. Second Growth. The Promise of Tropical Forest Regeneration in an Age of Deforestation. University of Chicago Press, Chicago, USA.Chazdon, R. L. 2014b. Second Growth: The Promise of Tropical Forest Regeneration in an Age of Deforestation. The University of Chicago Press, Chicago, USA.Chazdon, R. L. and J. P. Arroyo. 2013. Tropical forests as complex adaptive systems.in C. Messier, K. J. Puettmann, and K. D. Coates, editors. Managing world forests as complex adaptive systems in the face of global change. Routledge, New York, USA.Chazdon, R. L., S. Careaga, C. Webb, and O. Vargas. 2003. Community and phylogenetic structure of reproductive traits of woody species in wet tropical forests. Ecological Monographs 73:331-348.Chazdon, R. L. and F. G. Coe. 1999. Ethnobotany of woody species in second-growth, old-growth and selectively logged forests of northeastern Costa Rica. Conservation Biology 13:1312-1322.Chazdon, R. L., S. G. Letcher, M. van Breugel, M. Martinez-Ramos, F. Bongers, and B. Finegan. 2007. Rates of change in tree communities of secondary Neotropical forests following major disturbances. Philosophical Transactions of the Royal Society B: Biological Sciences 362:273-289.Chazdon, R. L., C. A. Peres, D. Dent, D. Sheil, A. E. Lugo, D. Lamb, N. E. Stork, and S. E. Miller. 2009. The potential for species conservation in tropical secondary forests. Conservation Biology 23:1406-1417.Chisholm, R. A., H. C. Muller-Landau, K. Abdul Rahman, D. P. Bebber, Y. Bin, S. A. Bohlman, N. A. Bourg, J. Brinks, S. Bunyavejchewin, N. Butt, H. Cao, M. Cao, et al. 2013. Scale-dependent relationships between tree species richness and ecosystem function in forests. Journal of Ecology 101:1214-1224.Cingolani, A. M., M. Cabido, D. E. Gurvich, D. Renison, and S. Díaz. 2007. Filtering processes in the assembly of plant communities: Are species presence and abundance driven by the same traits? Journal of Vegetation Science 18:911-920.Clark, D. A., S. Brown, D. W. Kicklighter, J. Q. Chambers, J. R. Thomlinson, J. Ni, and E. A. Holland. 2001. Net primary production in tropical forests: an evaluation and synthesis of existing field data. Ecological Applications 11:371-384.Clements, F. E. 1916. Plant succession: An analysis of the development of vegetation. Carnegie Institute Publication 242.Coley, P. D., J. P. Bryant, and F. S. Chapin. 1985. Resource availability and plant antiherbivore defense. Science 230:895-899.Comita, L. S., S. A. Queenborough, S. J. Murphy, J. L. Eck, K. Xu, M. Krishnadas, N. Beckman, Y. Zhu, and L. Gómez-Aparicio. 2014. Testing predictions of the Janzen-Connell hypothesis: a meta-analysis of experimental evidence for distance- and density-dependent seed and seedling survival. Journal of Ecology 102:845-856.Conti, G. and S. Díaz. 2013. Plant functional diversity and carbon storage – an empirical test in semi-arid forest ecosystems. Journal of Ecology 101:18-28.Corbera, E. and K. Brown. 2008. Building institutions to trade ecosystem services: marketing forest carbon in Mexico. World Development 36:1956-1979.Cornelissen, J. H. C. 1996. An experimental comparison of leaf decomposition rates in a wide range of temperate plant species and types. Journal of Ecology 84:573-582.
30544 Lohbeck-bk.indd 177 27-10-14 16:42

178
Cornelissen, J. H. C., S. Lavorel, E. Garnier, S. Díaz, N. Buchmann, D. E. Gurvich, P. B. Reich, H. ter Steege, H. D. Morgan, M. G. A. v. d. Heijden, J. G. Pausas, and H. Poorter. 2003. A handbook of protocols for standardised and easy measurement of plant functional traits worldwide. Australian Journal of Botany 51:335-380.Cornelissen, J. H. C., N. Pérez-Harguindeguy, S. Díaz, J. P. Grime, B. Marzano, M. Cabido, F. Vendramini, and B. Cerabolini. 1999. Leaf structure and defence control litter decomposition rate across species and life forms in regional floras on two continents. New Phytologist 143:191-200.Cornelissen, J. H. C. and K. Thompson. 1997. Functional leaf attributes predict litter decomposition rate in herbaceous plants. New Phytologist 135:109-114.Cornwell, W. K. and D. D. Ackerly. 2009. Community assembly and shifts in plant trait distributions across an environmental gradient in coastal California. Ecological Monographs 79:109-126.Cornwell, W. K., J. H. C. Cornelissen, K. Amatangelo, E. Dorrepaal, V. T. Eviner, O. Godoy, S. E. Hobbie, B. Hoorens, H. Kurokawa, N. Pérez-Harguindeguy, H. M. Quested, L. S. Santiago, et al. 2008. Plant species traits are the predominant control on litter decomposition rates within biomes worldwide. Ecology Letters 11:1065-1071.Coste, S., C. Baraloto, C. Leroy, and E. Marcon. 2010. Assessing foliar chlorophyll contents with the SPAD-502 chlorophyll meter: a calibration test with thirteen tree species of tropical rainforest in French Guiana. Annals of Forest Science 67:1-5.Dahlgren, J. P., O. Eriksson, K. Bolmgren, M. Strindell, and J. Ehrlén. 2006. Specific leaf area as a superior predictor of changes in field layer abundance during forest succession. Journal of Vegetation Science 17:577-582.Dalling, J. W. and S. P. Hubbell. 2002. Seed size, growth rate and gap microsite conditions as determinants of recruitment success for pioneer species. Journal of Ecology 90:557-568.Dangles, O. and B. Malmqvist. 2004. Species richness-decomposition relationships depend on species dominance. Ecology Letters 7:395-402.Davis, M. A., K. Thompson, and J. P. Grime. 2005. Invasibility: the local mechanism driving community assembly and species diversity. Ecography 28:696-704.de Bello, F., S. Lavorel, S. Díaz, R. Harrington, J. H. C. Cornelissen, R. D. Bardgett, M. P. Berg, P. Cipriotti, C. K. Feld, D. Hering, P. Martins da Silva, S. G. Potts, et al. 2010. Towards an assessment of multiple ecosystem processes and services via functional traits. Biodiversity and Conservation 19:2873-2893.de Bello, F., W. Thuiller, J. Lepš, P. Choler, J. C. Clément, P. Macek, M. T. Sebastià, and S. Lavorel. 2009. Partitioning of functional diversity reveals the scale and extent of trait convergence and divergence. Journal of Vegetation Science 20:475-486.de Jong, B. H. J., G. Montoya-Gomez, K. C. Nelson, L. Soto-Pinto, J. Taylor, and R. Tipper. 1995. Community forest management and carbon sequestration: a feasibility study from Chiapas, Mexico. Interciencia 20:409-416.de Jong, B. H. J., S. Ochoa-Gaona, M. A. Castillo-Santiago, N. Ramírez-Marcial, and M. A. Cairns. 2000. Carbon flux and patterns of land-use/land-cover change in the Selva Lacandona, Mexico. Ambio 29:504-511.de Rouw, A. 1995. The fallow period as a weed-break in shifting cultivation (tropical wet forests). Agriculture, Ecosystems & Environment 54:31-43.de Vos, J. 1988. La Paz de Dios y del Rey: la Conquista de la Selva Lacandona, 1525-1821 Fondo de Cultura Económica, Mexico.de Vos, J. 1996. Oro verde: la Conquista de la Selva Lacandona por los Madereros Tabasqueños, 1822-1949 Fondo de Cultura Económica, Mexico.de Vos, J. 2003. Una Tierra Para Sembrar Sueños: Historia Reciente de la Selva Lacandona, 1950-2000 Fondo de Cultura Económica, Mexico.Dent, D. H. and S. J. Wright. 2009. The future of tropical species in secondary forests: A quantitative review. Biological Conservation 142:2833-2843.Díaz, S. and M. Cabido. 2001. Vive la difference: plant functional diversity matters to ecosystem processes. Trends in Ecology and Evolution 16:646-655.Díaz, S., M. Cabido, and F. Casanoves. 1998. Plant functional traits and environmental filters at a regional scale. Journal of Vegetation Science 9:113-122.
30544 Lohbeck-bk.indd 178 27-10-14 16:42

179
Literature
Díaz, S., M. Cabido, M. Zak, E. Martínez Carretero, and J. Araníbar. 1999. Plant functional traits, ecosystem structure and land-use history along a climatic gradient in central-western Argentina. Journal of Vegetation Science 10:651-660.Díaz, S., J. Fargione, F. S. Chapin, III, and D. Tilman. 2006. Biodiversity loss threatens human well-being. PLoS Biology 4:e277.Díaz, S., A. Hector, and D. A. Wardle. 2009. Biodiversity in forest carbon sequestration initiatives: not just a side benefit. Current Opinion in Environmental Sustainability 1:55-60.Díaz, S., J. G. Hodgson, K. Thompson, M. Cabido, J. H. C. Cornelissen, A. Jalili, G. Montserrat-Martí, J. P. Grime, F. Zarrinkamar, Y. Asri, S. R. Band, S. Basconcelo, et al. 2004. The plant traits that drive ecosystems: Evidence from three continents. Journal of Vegetation Science 15:295-304.Díaz, S., S. Lavorel, F. S. Chapin III, P. A. Tecco, D. E. Gurvich, and K. Grigulis. 2007a. Functional Diversity — at the crossroads between ecosystem functioning and environmental filters. Pages 81-91 in J. G. Canadell, D. E. Pataki, L. F. Pitelka, S. Díaz, S. Lavorel, F. S. Chapin, P. A. Tecco, D. E. Gurvich, and K. Grigulis, editors. Terrestrial Ecosystems in a Changing World. Springer Berlin Heidelberg.Díaz, S., S. Lavorel, F. de Bello, F. Quetier, K. Grigulis, and T. M. Robson. 2007b. Incorporating plant functional diversity effects in ecosystem service assessments. PNAS 104:20684-20689.Díaz, S., F. Quétier, D. M. Cáceres, S. F. Trainor, N. Pérez-Harguindeguy, M. S. Bret-Harte, B. Finegan, M. Peña-Claros, and L. Poorter. 2011. Linking functional diversity and social actor strategies in a framework for interdisciplinary analysis of nature’s benefits to society. PNAS 108:895-902.Dirzo, R., H. S. Young, M. Galetti, G. Ceballos, N. J. B. Isaac, and B. Collen. 2014. Defaunation in the anthropocene. Science 345:401-406.Don, A., J. Schumacher, and A. Freibauer. 2011. Impact of tropical land-use change on soil organic carbon stocks – a meta-analysis. Global Change Biology 17:1658-1670.dos Santos Jr, U. M., J. F. de Carvalho Gonçalves, and T. R. Feldpausch. 2006. Growth, leaf nutrient concentration and photosynthetic nutrient use efficiency in tropical tree species planted in degraded areas in central Amazonia. Forest Ecology and Management 226:299-309.Duffy, J. E. 2002. Biodiversity and ecosystem function: the consumer connection. Oikos 99:201-219.Elmqvist, T., C. Folke, M. Nyström, G. Peterson, J. Bengtsson, B. Walker, and N. Jon. 2003. Response diversity, ecosystem change, and resilience. Frontiers in Ecology and the Environment 1:488-494.Ewel, J. J. 1976. Litter fall and leaf decomposition in a tropical forest succession in Eastern Guatemala. Journal of Ecology 64:293-308.Ewel, J. J. 1986. Designing agricultural ecosystems for the humid tropics. Annual Review of Ecology and Systematics 17:245-271.Ewel, J. J. 1999. Natural systems as models for the design of sustainable systems of land use. Agroforestry Systems 45:1-21.Ewel, J. J., M. J. Mazzarino, and C. W. Berish. 1991. Tropical soil fertility changes under monocultures and successional communities of different structure. Ecological Applications 1:289-302.Ewers, R. M., J. P. W. Scharlemann, A. Balmford, and R. E. Green. 2009. Do increases in agricultural yield spare land for nature? Global Change Biology 15:1716-1726.FAO. 2010a. Evaluación de los recursos forestales mundiales 2010. Informe nacional: México. Rome, Italy.FAO. 2010b. Global forest resources assessment 2010. Chapter 2: Extent of forest resources. Rome, Italy.Fargione, J., D. Tilman, R. Dybzinski, J. HilleRisLambers, C. Clark, W. S. Harpole, J. M. H. Knops, P. B. Reich, and M. Loreau. 2007. From selection to complementarity: shifts in the causes of biodiversity–productivity relationships in a long-term biodiversity experiment. Proceedings of the Royal Society B: Biological Sciences 274:871-876.Feldpausch, T. R., M. A. Rondon, E. C. M. Fernandes, S. J. Riha, and E. Wandelli. 2004. Carbon and nutrient accumulation in secondary forests regenerating on pastures in central Amazonia. Ecological Applications 14:S164-S176.Finegan, B. 1996. Pattern and process in neotropical secondary rain forests: the first 100 years of succession. Trends in Ecology & Evolution 11:119-124.Finn, J. A., L. Kirwan, J. Connolly, M. T. Sebastià, A. Helgadottir, O. H. Baadshaug, G. Bélanger, A. Black, C. Brophy, R. P. Collins, J. Čop, S. Dalmannsdóttir, et al. 2013. Ecosystem function enhanced by combining four functional types of plant species in intensively managed grassland mixtures: a 3-year continental-scale field experiment. Journal of Applied Ecology 50:365-375.
30544 Lohbeck-bk.indd 179 27-10-14 16:42

180
Fletes-Ocón, H. B. and A. Bonanno. 2013. Responses to the crisis of neo-liberal globalization: state intervention in palm oil production in Chiapas, Mexico. International Journal of Sociology of Agriculture and Food 20:313-334.Folke, C., S. Carpenter, B. Walker, M. Scheffer, T. Elmqvist, L. Gunderson, and C. S. Holling. 2004. Regime shifts, resilience, and biodiversity in ecosystem management. Annual Review of Ecology and Systematics 35:557-581.Foresight Program. 2011. The Future of Food and Farming: Challenges and Choices for Global Sustainability. London, UK.Fortunel, C., E. Garnier, R. Joffre, E. Kazakou, H. Quested, K. Grigulis, S. Lavorel, P. Ansquer, H. Castro, P. Cruz, J. Doležal, O. Eriksson, et al. 2009. Leaf traits capture the effects of land use changes and climate on litter decomposability of grasslands across Europe. Ecology 90:598-611.Foster, S. and C. H. Janson. 1985. The relationship between seed size and establishment conditions in tropical woody plants. Ecology 66:773-780.Fox, J. W. 2005. Interpreting the ‘selection effect’ of biodiversity on ecosystem function. Ecology Letters 8:846-856.Freschet, G. T., J. H. C. Cornelissen, R. S. P. Van Logtestijn, and R. Aerts. 2010. Evidence of the ‘plant economics spectrum’ in a subarctic flora. Journal of Ecology 98:362-373.Gamfeldt, L., H. Hillebrand, and P. R. Jonsson. 2008. Multiple functions increase the importance of biodiversity for overall ecosystem functioning. Ecology 89:1223-1231.Gamfeldt, L., T. Snall, R. Bagchi, M. Jonsson, L. Gustafsson, P. Kjellander, M. C. Ruiz-Jaen, M. Froberg, J. Stendahl, C. D. Philipson, G. Mikusinski, E. Andersson, et al. 2013. Higher levels of multiple ecosystem services are found in forests with more tree species. Nature Communications 4:1-8.García Aguirre, M. Á. 2012. Agrofuel plantations in Chiapas and their socio-environmental impact. Voices of Mexico 93:123-125.Garnier, E., J. Cortez, G. Billes, M.-L. Navas, C. Roumet, M. Debussche, G. Laurent, A. Blanchard, D. Aubry, A. Bellmann, C. Neill, and J.-P. Toussaint. 2004. Plant functional markers capture ecosystem properties during secondary succession. Ecology 85:2630-2637.Geist, H. J. and E. F. Lambin. 2002. Proximate causes and underlying driving forces of tropical deforestation. BioScience 52:143-150.Gessner, M. O., C. M. Swan, C. K. Dang, B. G. McKie, R. D. Bardgett, D. H. Wall, and S. Hättenschwiler. 2010. Diversity meets decomposition. Trends in Ecology & Evolution 25:372-380.Giambelluca, T. W. 2002. Hydrology of altered tropical forest. Hydrological Processes 16:1665-1669.Gibson, L., T. M. Lee, L. P. Koh, B. W. Brook, T. A. Gardner, J. Barlow, C. A. Peres, C. J. Bradshaw, W. F. Laurance, T. E. Lovejoy, and N. S. Sodhi. 2011. Primary forests are irreplaceable for sustaining tropical biodiversity. Nature 478:378-381.Givnish, T. J. 2002. Adaptive significance of evergreen vs deciduous leaves: Solving the triple paradox. Silva Fennica 36:703-734.Grime, J. P. 1973. Competitive exclusion in herbaceous vegetation. Nature 242:344-347.Grime, J. P. 1998. Benefits of plant diversity to ecosystems: Immediate, filter and founder effects. Journal of Ecology 86:902-910.Grime, J. P. 2006. Trait convergence and trait divergence in herbaceous plant communities: Mechanisms and consequences. Journal of Vegetation Science 17:255-260.Grime, J. P., K. Thompson, R. Hunt, J. G. Hodgson, J. H. C. Cornelissen, I. H. Rorison, G. A. F. Hendry, T. W. Ashenden, A. P. Askew, S. R. Band, R. E. Booth, C. C. Bossard, et al. 1997. Integrated screening validates primary axes of specialisation in plants. Oikos 79:259-281.Grubb, P. J. 1977. The maintenance of species-richness in plant communities: the importance of the regeneration niche. Biological Reviews 52:107-145.Guariguata, M. R. and R. Ostertag. 2001. Neotropical secondary forest succession: changes in structural and functional characteristics. Forest Ecology and Management 148:185-206.Guo, L. B. and R. M. Gifford. 2002. Soil carbon stocks and land use change: a meta analysis. Global Change Biology 8:345-360.Hacke, U. G., J. S. Sperry, W. T. Pockman, S. D. Davis, and K. A. McCulloh. 2001. Trends in wood density and structure are linked to prevention of xylem implosion by negative pressure. Oecologia 126:457-461.
30544 Lohbeck-bk.indd 180 27-10-14 16:42

181
Literature
Haggar, J. P. and J. J. Ewel. 1997. Primary productivity and resource partitioning in model tropical ecosystems. Ecology 78:1211-1221.Hammond, D. S. and V. K. Brown. 1995. Seed size of woody plants in relation to disturbance, dispersal, soil type in wet Neotropical forests. Ecology 76:2544-2561.Handa, I. T., R. Aerts, F. Berendse, M. P. Berg, A. Bruder, O. Butenschoen, E. Chauvet, M. O. Gessner, J. Jabiol, M. Makkonen, B. G. McKie, B. Malmqvist, et al. 2014. Consequences of biodiversity loss for litter decomposition across biomes. Nature 509:218-221.Hardin, G. 1960. The competitive exclusion principle. Science 131:1292-1297.Hector, A. and R. Bagchi. 2007. Biodiversity and ecosystem multifunctionality. Nature 448:188-190.Helmus, M. R., K. Savage, M. W. Diebel, J. T. Maxted, and A. R. Ives. 2007. Separating the determinants of phylogenetic community structure. Ecology Letters 10:917-925.Hernandez-Ruedas, M. A., V. Arroyo-Rodriguez, J. A. Meave, M. Martinez-Ramos, G. Ibarra-Manriquez, E. Martinez, G. Jamangape, F. P. Melo, and B. A. Santos. 2014. Conserving tropical tree diversity and forest structure: the value of small rainforest patches in moderately-managed landscapes. PLoS ONE 9:e98931.Hillebrand, H., D. M. Bennett, and M. W. Cadotte. 2008. Consequences of dominance: a review of evenness effects on local and regional ecosystem processes. Ecology 89:1510-1520.Hillebrand, H. and B. Matthiessen. 2009. Biodiversity in a complex world: consolidation and progress in functional biodiversity research. Ecology Letters 12:1405-1419.Hodgson, J. G., K. Thompson, P. J. Wilson, and A. Bogaard. 1998. Does biodiversity determine ecosystem function? The ecotron experiment reconsidered. Functional Ecology 12:843-848.Holdaway, R. J. and A. D. Sparrow. 2006. Assembly rules operating along a primary riverbed-grassland successional sequence. Journal of Ecology 94:1092-1102.Holmgren, M. 2000. Combined effects of shade and drought on tulip poplar seedlings: trade-off in tolerance or facilitation? Oikos 90:67-78.Hooper, D. U., F. S. Chapin, J. J. Ewel, A. Hector, P. Inchausti, S. Lavorel, J. H. Lawton, D. M. Lodge, M. Loreau, S. Naeem, B. Schmid, H. Setala, et al. 2005. Effects of biodiversity on ecosystem functioning: a consensus of current knowledge. Ecological Monographs 75:3-35.Howe, H. F. and J. Smallwood. 1982. Ecology of seed dispersal. Annual Review of Ecology and Systematics 13:201-228.Hubbell, S. P. 2001. The unified neutral theory of biodiversity and biogeography. Princeton University Press, Princeton, New Jersey, USA.Hughes, R. F., J. B. Kauffman, and V. J. Jaramillo. 1999. Biomass, carbon, and nutrient dynamics of secondary forests in a humid tropical region of México. Ecology 80:1892-1907.Hughes, R. F., J. B. Kauffman, and V. J. Jaramillo. 2000. Ecosystem-scale impacts of deforestation and land use in a humid tropical region of Mexico. Ecological Applications 10:515-527.INEGI. Instituto Nacional de Estadística y Geografía: Censo de Población y Vivienda. http://www.inegi.org.mx/est/contenidos/Proyectos/ccpv/.Isbell, F., V. Calcagno, A. Hector, J. Connolly, W. S. Harpole, P. B. Reich, M. Scherer-Lorenzen, B. Schmid, D. Tilman, J. van Ruijven, A. Weigelt, B. J. Wilsey, et al. 2011. High plant diversity is needed to maintain ecosystem services. Nature 477:199-202.Ishida, A., T. Nakano, K. Yazaki, S. Matsuki, N. Koike, D. Lauenstein, M. Shimizu, and N. Yamashita. 2008. Coordination between leaf and stem traits related to leaf carbon gain and hydraulics across 32 drought-tolerant angiosperms. Oecologia 156:193-202.Jakovac, A. C. C., M. Peña-Claros, T. W. Kuyper, and F. Bongers. in press. Loss of secondary-forest resilience by land-use intensification in the Amazon. Journal of Ecology.Janisch, J. E. and M. E. Harmon. 2002. Successional changes in live and dead wood carbon stores: implications for net ecosystem productivity. Tree Physiology 22:77-89.Jansen, P. A., F. Bongers, and P. J. Van Der Meer. 2008. Is farther seed dispersal better? Spatial patterns of offspring mortality in three rainforest tree species with different dispersal abilities. Ecography 31:43-52.Junqueira, A. B., G. H. Shepard, and C. R. Clement. 2010. Secondary forests on anthropogenic soils in Brazilian Amazonia conserve agrobiodiversity. Biodiversity and Conservation 19:1933-1961.Kahmen, S. and P. Poschlod. 2004. Plant functional trait responses to grassland succession over 25 years. Journal of Vegetation Science 15:21-32.
30544 Lohbeck-bk.indd 181 27-10-14 16:42

182
Kaimowitz, D. 2008. The prospects for Reduced Emissions from Deforestation and Degradation (REDD) in Mesoamerica. International Forestry Review 10:485-495.Karp, D. S., A. J. Rominger, J. Zook, J. Ranganathan, P. R. Ehrlich, and G. C. Daily. 2012. Intensive agriculture erodes beta-diversity at large scales. Ecology Letters 15:963-970.Kazakou, E., D. Vile, B. Shipley, C. Gallet, and E. Garnier. 2006. Co-variations in litter decomposition, leaf traits and plant growth in species from a Mediterranean old-field succession. Functional Ecology 20:21-30.Keddy, P. A. 1992. Assembly and response rules: Two goals for predictive community ecology. Journal of Vegetation Science 3:157-164.Kirwan, L., A. Lüscher, M. T. Sebastià, J. A. Finn, R. P. Collins, C. Porqueddu, A. Helgadottir, O. H. Baadshaug, C. Brophy, C. Coran, S. Dalmannsdóttir, I. Delgado, et al. 2007. Evenness drives consistent diversity effects in intensive grassland systems across 28 European sites. Journal of Ecology 95:530-539.Kissinger, G., M. Herold, and V. de Sy. 2012. Drivers of deforestation and forest degradation: A synthesis report for REDD+ policymakers. Vancouver Canada.Kitajima, K. 1992. Relationship between photosynthesis and thickness of cotyledons for tropical forest tree species. Functional Ecology 6:582-589.Kitajima, K., A.-M. Llorens, C. Stefanescu, M. V. Timchenko, P. W. Lucas, and S. J. Wright. 2012. How cellulose-based leaf toughness and lamina density contribute to long leaf lifespans of shade-tolerant species. New Phytologist 195:640-652.Kitajima, K. and L. Poorter. 2008. Functional basis for resource niche partitioning by tropical trees. Pages 160-181 in W. P. Carson and S. A. Schnitzer, editors. Tropical Forest Community Ecology. Blackwell Publishing, Chichester.Kitajima, K. and L. Poorter. 2010. Tissue-level leaf toughness, but not lamina thickness, predicts sapling leaf lifespan and shade tolerance of tropical tree species. New Phytologist 186:708-721.Kleinman, P. J. A., D. Pimentel, and R. B. Bryant. 1995. The ecological sustainability of slash-and-burn agriculture. Agriculture, Ecosystems & Environment 52:235-249.Klemick, H. 2011. Shifting cultivation, forest fallow, and externalities in ecosystem services: Evidence from the Eastern Amazon. Journal of Environmental Economics and Management 61:95-106.Klepeis, P. and C. Vance. 2003. Neoliberal policy and deforestation in southeastern Mexico: An assessment of the PROCAMPO program. Economic Geography 79:221-240.Kobe, R. K. 1999. Light gradient partitioning among tropical tree species through differential seedling mortality and growth. Ecology 80:187-201.Kobe, R. K. and K. D. Coates. 1997. Models of sapling mortality as a function of growth to characterize interspecific variation in shade tolerance of eight tree species of northwestern British Columbia. Canadian Journal of Forest Research 27:227-236.Komsta, L. and F. Novomestky. 2012. R-package Moments: Moments, cumulants, skewness, kurtosis and related tests.Kosoy, N., M. Martinez-Tuna, R. Muradian, and J. Martinez-Alier. 2007. Payments for environmental services in watersheds: Insights from a comparative study of three cases in Central America. Ecological Economics 61:446-455.Kraft, N. J. B., R. Valencia, and D. D. Ackerly. 2008. Functional traits and niche-based tree community assembly in an Amazonian forest. Science 322:580-582.Kursar, T. A., B. M. J. Engelbrecht, A. Burke, M. T. Tyree, B. Ei Omari, and J. P. Giraldo. 2009. Tolerance to low leaf water status of tropical tree seedlings is related to drought performance and distribution. Functional Ecology 23:93-102.Laliberté, E. and B. Shipley. 2012. R-package FD: Measuring Functional Diversity from Multiple Traits, and Other Tools for Functional Ecology.Laliberté, E., J. A. Wells, F. DeClerck, D. J. Metcalfe, C. P. Catterall, C. Queiroz, I. Aubin, S. P. Bonser, Y. Ding, J. M. Fraterrigo, S. McNamara, J. W. Morgan, et al. 2010. Land-use intensification reduces functional redundancy and response diversity in plant communities. Ecology Letters 13:76-86.Lamb, D. 2005. Restoration of degraded tropical forest landscapes. Science 310:1628-1632.Lambin, E. F. and P. Meyfroidt. 2010. Land use transitions: Socio-ecological feedback versus socio-economic change. Land Use Policy 27:108-118.
30544 Lohbeck-bk.indd 182 27-10-14 16:42

183
Literature
Lang, A. C., G. von Oheimb, M. Scherer-Lorenzen, B. Yang, S. Trogisch, H. Bruelheide, K. Ma, and W. Härdtle. 2014. Mixed afforestations of young subtropical trees promote nitrogen acquisition and retention. Journal of Applied Ecology 51:224-233.Larsen, T. H., N. M. Williams, and C. Kremen. 2005. Extinction order and altered community structure rapidly disrupt ecosystem functioning. Ecology Letters 8:538-547.Laughlin, D. C. and D. E. Laughlin. 2013. Advances in modeling trait-based plant community assembly. Trends Plant Sci 18:584-593.Laurance, W. F. and D. Carolina Useche and J. Rendeiro and M. Kalka and C. J. A. Bradshaw and S. P. Sloan and S. G. Laurance and M. Campbell and K. Abernethy and P. Alvarez and V. Arroyo-Rodriguez and P. Ashton, et al. 2012. Averting biodiversity collapse in tropical forest protected areas. Nature 489:290-294.Lavorel, S. and E. Garnier. 2002. Predicting changes in community composition and ecosystem functioning from plant traits: revisiting the Holy Grail. Functional Ecology 16:545-556.Lavorel, S., K. Grigulis, P. Lamarque, M. Colace, D. Garden, J. Girel, G. Pellet, and R. Douzet. 2010. Using plant functional traits to understand the landscape distribution of multiple ecosystem services. Journal of Ecology 99:135-147.Lavorel, S., K. Grigulis, S. McIntyre, N. S. G. Williams, D. Garden, J. Dorrough, S. Berman, F. Quétier, A. Thébault, and A. Bonis. 2007. Assessing functional diversity in the field – methodology matters! Functional Ecology 22:134-147.Lawrence, D., C. Radel, K. Tully, B. Schmook, and L. Schneider. 2010. Untangling a decline in tropical forest resilience: constraints on the sustainability of shifting cultivation across the globe. Biotropica 42:21-30.Lebrija-Trejos, E. 2009. Tropical Dry forest Recovery: processes and causes of change. PhD thesis. Wageningen University and Research centre, Wageningen, the Netherlands.Lebrija-Trejos, E., F. Bongers, E. A. Pérez-García, and J. A. Meave. 2008. Successional change and resilience of a very dry tropical deciduous forest following shifting agriculture. Biotropica 40:422-431.Lebrija-Trejos, E., J. A. Meave, L. Poorter, E. A. Pérez-García, and F. Bongers. 2010a. Pathways, mechanisms and predictability of vegetation change during tropical dry forest succession. Perspectives in Plant Ecology, Evolution and Systematics 12:267-275.Lebrija-Trejos, E., E. A. Pérez-García, J. A. Meave, F. Bongers, and L. Poorter. 2010b. Functional traits and environmental filtering drive community assembly in a species-rich tropical system. Ecology 91:386-398.Lebrija-Trejos, E., E. A. Pérez-García, J. A. Meave, L. Poorter, and F. Bongers. 2011. Environmental changes during secondary succession in a tropical dry forest in Mexico. Journal of Tropical Ecology 27:477-489.Leishman, M., I. J. Wright, A. T. Moles, and M. Westoby. 2000. The evolutionary ecology of seed size.in M. Fenner, editor. Seeds: The Ecology of Regeneration in Plant Communities. CAB International, Wallingford, UK.Lepš, J. 2004. What do the biodiversity experiments tell us about consequences of plant species loss in the real world? Basic and Applied Ecology 5:529-534.Letcher, S. G. and R. L. Chazdon. 2009. Rapid recovery of biomass, species richness, and species composition in a forest chronosequence in northeastern Costa Rica. Biotropica 41:608-617.Letcher, S. G., R. L. Chazdon, A. C. S. Andrade, F. Bongers, M. van Breugel, B. Finegan, S. G. Laurance, R. C. G. Mesquita, M. Martínez-Ramos, and G. B. Williamson. 2012. Phylogenetic community structure during succession: Evidence from three Neotropical forest sites. Perspectives in Plant Ecology, Evolution and Systematics 14:79-87.Lohbeck, M., E. Lebrija-Trejos, M. Martinez-Ramos, J. A. Meave, L. Poorter, and F. Bongers. submitted. Functional trait strategies of trees in dry and wet tropical forests are similar but differ in their consequences for succession. Lohbeck, M., L. Poorter, E. Lebrija-Trejos, M. Martínez-Ramos, J. A. Meave, H. Paz, E. A. Pérez-García, I. E. Romero-Pérez, A. Tauro, and F. Bongers. 2013. Successional changes in functional composition contrast for dry and wet tropical forest. Ecology 94:1211-1216.Lohbeck, M., L. Poorter, M. Martínez-Ramos, and F. Bongers. in press. Biomass is the main driver of changes in ecosystem process rates during tropical forest succession. Ecology.Lohbeck, M., L. Poorter, M. Martínez-Ramos, J. Rodriguez-Valázquez, M. Van Breugel, and F. Bongers. 2014. Changing drivers of species dominance during tropical forest succession. Functional Ecology 28:1052-1058.
30544 Lohbeck-bk.indd 183 27-10-14 16:42

184
Lohbeck, M., L. Poorter, H. Paz, L. Pla, M. van Breugel, M. Martínez-Ramos, and F. Bongers. 2012. Functional diversity changes during tropical forest succession. Perspectives in Plant Ecology, Evolution and Systematics 14:89-96.Loranger, J. and B. Shipley. 2010. Interspecific covariation between stomatal density and other functional leaf traits in a local flora. Botany 88:30-38.Loreau, M. 2010. Linking biodiversity and ecosystems: towards a unifying ecological theory. Philosophical Transactions of the Royal Society B: Biological Sciences 365:49-60.Lyons, K. G., C. A. Brigham, B. H. Traut, and M. W. Schwartz. 2005. Rare species and ecosystem functioning. Conservation Biology 19:1019-1024.MA. 2005. Millennium Ecosystems Assessment. World Resources Institute, Washington DC, USA.Macarthur, R. and R. Levins. 1967. The limiting similarity, convergence, and divergence of coexisting species. The American Naturalist 101:377-385.Maestre, F. T., A. P. Castillo-Monroy, M. A. Bowker, and R. Ochoa-Hueso. 2012a. Species richness effects on ecosystem multifunctionality depend on evenness, composition and spatial pattern. Journal of Ecology 100:317-330.Maestre, F. T., J. L. Quero, N. J. Gotelli, A. Escudero, V. Ochoa, M. Delgado-Baquerizo, M. García-Gómez, M. A. Bowker, S. Soliveres, C. Escolar, P. García-Palacios, M. Berdugo, et al. 2012b. Plant species richness and ecosystem multifunctionality in global drylands. Science 335:214-218.Markesteijn, L. and L. Poorter. 2009. Seedling root morphology and biomass allocation of 62 tropical tree species in relation to drought- and shade-tolerance. Journal of Ecology 97:311-325.Markesteijn, L., L. Poorter, H. Paz, L. Sack, and F. Bongers. 2011. Ecological differentiation in xylem cavitation resistance is associated with stem and leaf structural traits. Plant, Cell & Environment 34:137-148.Marteinsdóttir, B. and O. Eriksson. 2013. Trait-based filtering from the regional species pool into local grassland communities. Journal of Plant Ecology:1-9.Martin, P. A., A. C. Newton, and J. M. Bullock. 2013. Carbon pools recover more quickly than plant biodiversity in tropical secondary forests. Proceedings of the Royal Society B: Biological Sciences 280:20132236.Martínez-Garza, C., F. Bongers, and L. Poorter. 2013. Are functional traits good predictors of species performance in restoration plantings in tropical abandoned pastures? Forest Ecology and Management 303:35-45.Martínez-Garza, C. and R. González-Montagut. 1999. Seed rain from forest fragments into tropical pastures in Los Tuxtlas, Mexico. Plant Ecology 145:255-265.Martínez-Ramos, M. 2006. Aspectos ecológicos de la selva húmeda en la región Lacandona: perspectivas para su estudio y conservación. Pages 279-292 in K. Oyama and A. Castillo, editors. Manejo, conservación y restauración de recursos naturales en México: perspectivas desde la investigación científica. Siglo XXI Editores / UNAM, México.Martínez-Ramos, M., N. P. R. Anten, and D. D. Ackerly. 2009. Defoliation and ENSO effects on vital rates of an understorey tropical rain forest palm. Journal of Ecology 97:1050-1061.Martins, P. F. d. S., C. C. Cerri, B. Volkoff, F. Andreux, and A. Chauvel. 1991. Consequences of clearing and tillage on the soil of a natural Amazonian ecosystem. Forest Ecology and Management 38:273-282.Mason, N., C. Lanoiselée, D. Mouillot, P. Irz, and C. Argillier. 2007. Functional characters combined with null models reveal inconsistency in mechanisms of species turnover in lacustrine fish communities. Oecologia 153:441-452.Mason, N. W. H., F. de Bello, D. Mouillot, S. Pavoine, and S. Dray. 2013. A guide for using functional diversity indices to reveal changes in assembly processes along ecological gradients. Journal of Vegetation Science 24:794-806.Mason, N. W. H., K. MacGillivray, J. B. Steel, and J. B. Wilson. 2003. An index of functional diversity. Journal of Vegetation Science 14:571-578.Mason, N. W. H., D. Mouillot, W. G. Lee, and J. B. Wilson. 2005. Functional richness, functional evenness and functional divergence: the primary components of functional diversity. Oikos 111:112-118.Maxwell, K. and G. N. Johnson. 2000. Chlorophyll fluorescence-a practical guide. Journal of Experimental Botany 51:659-668.
30544 Lohbeck-bk.indd 184 27-10-14 16:42

185
Literature
Mayfield, M. M., M. F. Boni, G. C. Daily, and D. Ackerly. 2005. Species and functional diversity of native and human-dominated plant communities. Ecology 86:2365-2372.McGill, B., B. Enquist, E. Weiher, and M. Westoby. 2006. Rebuilding community ecology from functional traits. Trends in Ecology & Evolution 21:178-185.McGrath, D. A., C. K. Smith, H. L. Gholz, and F. d. A. Oliveira. 2001. Effects of land-use change on soil nutrient dynamics in Amazônia. Ecosystems 4:625-645.Melo, F. P., V. Arroyo-Rodriguez, L. Fahrig, M. Martinez-Ramos, and M. Tabarelli. 2013. On the hope for biodiversity-friendly tropical landscapes. Trends in Ecology and Evolution 28:462-468.Méndez-Alonzo, R., H. Paz, R. C. Zuluaga, J. A. Rosell, and M. Olson. 2012. Coordinated evolution of leaf and stem economics in tropical dry forest trees. Ecology 93:2397–2406.Méndez-Alonzo, R., F. Pineda-García, H. Paz, J. A. Rosell, and M. E. Olson. 2013. Leaf phenology is associated with soil water availability and xylem traits in a tropical dry forest. Trees 27:745-754.Merow, C., A. M. Latimer, and J. A. Silander Jr. 2011. Can entropy maximization use functional traits to explain species abundances? A comprehensive evaluation. Ecology 92:1523-1537.Metzger, J. P., A. C. Martensen, M. Dixo, L. C. Bernacci, M. C. Ribeiro, A. M. G. Teixeira, and R. Pardini. 2009. Time-lag in biological responses to landscape changes in a highly dynamic Atlantic forest region. Biological Conservation 142:1166-1177.Micheli, F. and B. S. Halpern. 2005. Low functional redundancy in coastal marine assemblages. Ecology Letters 8:391-400.Midgley, G. F. 2012. Biodiversity and ecosystem function. Science 335:174-175.Minotta, G. and S. Pinzauti. 1996. Effects of light and soil fertility on growth, leaf chlorophyll content and nutrient use efficiency of beech (Fagus sylvatica L.) seedlings. Forest Ecology and Management 86:61-71.Mokany, K., J. Ash, and S. Roxburgh. 2008. Functional identity is more important than diversity in influencing ecosystem processes in a temperate native grassland. Journal of Ecology 96:884-893.Moles, A. T., D. D. Ackerly, C. O. Webb, J. C. Tweddle, J. B. Dickie, A. J. Pitman, and M. Westoby. 2005. Factors that shape seed mass evolution. PNAS 102:10540-10544.Moles, A. T. and M. Westoby. 2004. Seedling survival and seed size: a synthesis of the literature. Journal of Ecology 92:372-383.Montgomery, R. and R. Chazdon. 2002. Light gradient partitioning by tropical tree seedlings in the absence of canopy gaps. Oecologia 131:165-174.Montgomery, R. A. and R. L. Chazdon. 2001. Forest structure, canopy architecture, and light transmittance in tropical wet forest. Ecology 82:2707-2718.Mori, A. S., T. Furukawa, and T. Sasaki. 2012. Response diversity determines the resilience of ecosystems to environmental change. Biological Reviews 88:349-364.Mouchet, M. A., S. Villéger, N. W. H. Mason, and D. Mouillot. 2010. Functional diversity measures: an overview of their redundancy and their ability to discriminate community assembly rules. Functional Ecology 24:867-876.Mouillot, D., D. R. Bellwood, C. Baraloto, J. Chave, R. Galzin, M. Harmelin-Vivien, M. Kulbicki, S. Lavergne, S. Lavorel, N. Mouquet, C. E. Paine, J. Renaud, et al. 2013. Rare species support vulnerable functions in high-diversity ecosystems. PLoS Biology 11:e1001569.Mouillot, D., W. H. N. Mason, O. Dumay, and J. B. Wilson. 2005. Functional regularity: a neglected aspect of functional diversity. Oecologia 142:353-359.Mouillot, D., S. Villéger, M. Scherer-Lorenzen, and N. W. H. Mason. 2011. Functional structure of biological communities predicts ecosystem multifunctionality. PLoS ONE 6:e17476.Murphy, J. and J. P. Riley. 1962. A modified single solution method for the determination of phosphate in natural waters. Analytica Chimica Acta 27:31-36.Myers, J. A. and K. E. Harms. 2009. Seed arrival, ecological filters, and plant species richness: a meta-analysis. Ecology Letters 12:1250-1260.Nadrowski, K., C. Wirth, and M. Scherer-Lorenzen. 2010. Is forest diversity driving ecosystem function and service? Current Opinion in Environmental Sustainability 2:75-79.Naeem, S., D. E. Bunker, A. Hector, M. Loreau, and C. Perrings. 2010. Introduction: the ecological and social implications of changing biodiversity. an overview of a decade of biodiversity and ecosytem functioning research. Pages 3-13 in S. Naeem, D. E. Bunker, A. Hector, M. Loreau, and C. Perrings, editors.
30544 Lohbeck-bk.indd 185 27-10-14 16:42

186
Biodiversity, Ecosystem Functioning, & Human Wellbeing an ecological and economic perspective. Oxford University Press, New York.Naeem, S. and J. P. Wright. 2003. Disentangling biodiversity effects on ecosystem functioning: deriving solutions to a seemingly insurmountable problem. Ecology Letters 6:567-579.Nicotra, A. B., R. L. Chazdon, and S. V. B. Iriarte. 1999. Spatial heterogeneity of light and woody seedling regeneration in tropical wet forests. Ecology 80:1908-1926.Niinemets, Ü. 1998. Are compound-leaved woody species inherently shade-intolerant? An analysis of species ecological requirements and foliar support costs. Plant Ecology 134:1-11.Niinemets, Ü. 1999. Research review. Components of leaf dry mass per area – thickness and density – alter leaf photosynthetic capacity in reverse directions in woody plants. New Phytologist 144:35-47.Niinemets, Ü. 2001. Global-scale climatic controls of leaf dry mass per area, density, and thickness in trees and shrubs. Ecology 82:453-469.Niinemets, Ü., A. Portsmuth, D. Tena, M. Tobias, S. Matesanz, and F. Valladares. 2007. Do we underestimate the importance of leaf size in plant economics? Disproportional scaling of support costs within the spectrum of leaf physiognomy. Annals of Botany 100:283-303.Norberg, J. 2004. Biodiversity and ecosystem functioning: A complex adaptive systems approach. Limnology and Oceanography 49:1269-1277.Norden, N., R. L. Chazdon, A. Chao, Y.-H. Jiang, and B. Vílchez-Alvarado. 2009. Resilience of tropical rain forests: tree community reassembly in secondary forests. Ecology Letters 12:385-394.O’Brien, K. L. 1995. Deforestation and climate change in the Selva Lacandona of Chiapas, Mexico: some preliminary results. Norsk Geografisk Tidsskrift - Norwegian Journal of Geography 49:105-122.O’Brien, K. L. 1998. Sacrificing the forest: Environmental and social struggles in Chiapas. Westview Press, Boulder, Colorado, USA.Oksanen, J., F. G. Blanchet, R. Kindt, P. Legendre, P. R. Minchin, R. B. O’Hara, G. L. Simpson, P. M. Solymos, H. H. Stevens, and H. Wagner. 2011. R-package Vegan: Community Ecology Package.Onoda, Y., M. Westoby, P. B. Adler, A. M. F. Choong, F. J. Clissold, J. H. C. Cornelissen, S. Díaz, N. J. Dominy, A. Elgart, L. Enrico, P. V. A. Fine, J. J. Howard, et al. 2011. Global patterns of leaf mechanical properties. Ecology Letters 14:301-312.Ostertag, R., E. Marín-Spiotta, W. L. Silver, and J. Schulten. 2008. Litterfall and decomposition in relation to soil carbon pools along a secondary forest chronosequence in Puerto Rico. Ecosystems 11:701-714.Pakeman, R. J. and J. Oksanen. 2014. Functional trait metrics are sensitive to the completeness of the species’ trait data? Methods in Ecology and Evolution 5:9-15.Pakeman, R. J. and H. M. Quested. 2007. Sampling plant functional traits: What proportion of the species need to be measured? Applied Vegetation Science 10:91-96.Paquette, A. and C. Messier. 2011. The effect of biodiversity on tree productivity: from temperate to boreal forests. Global Ecology and Biogeography 20:170-180.Parkhill, J. P., G. Maillet, and J. J. Cullen. 2001. Fluorescence-based maximal quantum yield for PSII as a diagnostic of nutrient stress. Journal of Phycology 37:517-529.Pavoine, S., E. Vela, S. Gachet, G. de Bélair, and M. B. Bonsall. 2011. Linking patterns in phylogeny, traits, abiotic variables and space: a novel approach to linking environmental filtering and plant community assembly. Journal of Ecology 99:165-175.Peña-Claros, M. 2003. Changes in forest structure and species composition during secondary forest succession in the Bolivian Amazon. Biotropica 35:450-461.Pérez-García, E. A., J. A. Meave, and C. Gallardo. 2001. Vegetación y flora de la región de Nizanda, Istmo de Tehuantepec, Oaxaca, México. Acta Botanica Mexicana 56:19-88.Pérez-García, E. A., J. A. Meave, J. Villaseñor, J. Gallardo-Cruz, and E. Lebrija-Trejos. 2010. Vegetation heterogeneity and life-strategy diversity in the flora of the heterogeneous landscape of Nizanda, Oaxaca, Mexico. Folia Geobotanica 45:143-161.Pérez-Harguindeguy, N., S. Díaz, E. Garnier, S. Lavorel, H. Poorter, P. Jaureguiberry, M. S. Bret-Harte, W. K. Cornwell, J. M. Craine, D. E. Gurvich, C. Urcelay, E. J. Veneklaas, et al. 2013. New handbook for standardised measurement of plant functional traits worldwide. Australian Journal of Botany 61:167-234.Pérez-Harguindeguy, N., S. Díaz, F. Vendramini, D. E. Gurvich, A. M. Cingolani, M. A. Giorgis, and M. Cabido. 2007. Direct and indirect effects of climate on decomposition in native ecosystems from central Argentina. Austral Ecology 32:749-757.
30544 Lohbeck-bk.indd 186 27-10-14 16:42

187
Literature
Perz, S. G. and D. L. Skole. 2003. Secondary forest expansion in the Brazilian Amazon and the refinement of forest transition theory. Society & Natural Resources 16:277-294.Perz, S. G. and R. T. Walker. 2002. Household life cycles and secondary forest cover among small farm colonists in the Amazon. World Development 30:1009-1027.Petchey, O. L. and K. J. Gaston. 2002a. Extinction and the loss of functional diversity. Proceedings of the Royal Society B: Biological Sciences 269:1721-1727.Petchey, O. L. and K. J. Gaston. 2002b. Functional diversity (FD), species richness and community composition. Ecology Letters 5:402-411.Petchey, O. L. and K. J. Gaston. 2006. Functional diversity: back to basics and looking forward. Ecology Letters 9:741-758.Petchey, O. L. and K. J. Gaston. 2007. Dendrograms and measuring functional diversity. Oikos 116:1422-1426.Petchey, O. L., E. J. O’Gorman, and D. F. B. Flynn. 2010. A functional guide to functional diversity measures. Pages 49-59 in S. Naeem, D. E. Bunker, A. Hector, M. Loreau, and C. Perrings, editors. Biodiversity, ecosystem functioning, & human wellbeing and ecological and economic perspective. Oxford University Press, New York.Pineda-García, F., H. Paz, and F. C. Meinzer. 2013. Drought resistance in early and late secondary successional species from a tropical dry forest: the interplay between xylem resistance to embolism, sapwood water storage and leaf shedding. Plant, Cell & Environment 36:405-418.Pingarroni, A. A. 2014. Diversidad de árboles en una región tropical atropizada. Una aproximación paisajística. MSc thesis. Centro de Investigaciones en Ecosistemas, Universidad Nacional Autónoma de México Morelia, Mexico.Pla, L., F. Casanoves, J. A. di Rienzo, F. Fernandez, and B. Finegan. 2008. Confidence intervals for functional diversity indices considering species abundance.in XXIV International Biometric Conference, Dublin.Poorter, H. and E. Garnier. 1999. Ecological significance of relative growth rate and its components. Pages 81-120 in F. I. Pugnaire and F. Valladares, editors. Handbook of Functional Plant Ecology. Marcel Dekker, New York.Poorter, H., Ü. Niinemets, L. Poorter, I. J. Wright, and R. Villar. 2009. Causes and consequences of variation in leaf mass per area (LMA): a meta-analysis. New Phytologist 182:565-588.Poorter, L. 1999. Growth responses of 15 rain-forest tree species to a light gradient: the relative importance of morphological and physiological traits. Functional Ecology 13:396-410.Poorter, L. and F. Bongers. 2006. Leaf traits are good predictors of plant performance across 53 rain forest species. Ecology 87:1733-1743.Poorter, L. and L. Markesteijn. 2008. Seedling traits determine drought tolerance of tropical tree species. Biotropica 40:321-331.Poorter, L., I. McDonald, A. Alarcón, E. Fichtler, J.-C. Licona, M. Peña-Claros, F. Sterck, Z. Villegas, and U. Sass-Klaassen. 2010. The importance of wood traits and hydraulic conductance for the performance and life history strategies of 42 rainforest tree species. New Phytologist 185:481-492.Poorter, L., M. van de Plassche, S. Willems, and R. G. A. Boot. 2004. Leaf traits and herbivory rates of tropical tree species differing in successional status. Plant Biology 6:746-754.Poorter, L., S. van Gils, M. Toledo, G. Carreño-Rocabado, and M. Peña-Claros. in press. Fast recovery of community functional properties during secondary forest succession. Ecology.Poorter, L., S. J. Wright, H. Paz, D. D. Ackerly, R. Condit, G. Ibarra-Manriquez, K. E. Harms, J. C. Licona, M. Martínez-Ramos, S. J. Mazer, H. C. Muller-Landau, M. Peña-Claros, et al. 2008. Are functional traits good predictors of demographic rates? Evidence from five neotropical forests. Ecology 89:1908-1920.Popma, J. and F. Bongers. 1991. Acclimation of seedlings of three Mexican tropical rain forest tree species to a change in light availability. Journal of Tropical Ecology 7:85-97.Popma, J., F. Bongers, and M. J. A. Werger. 1992. Gap-dependence and leaf characteristics of trees in a tropical lowland rain forest in Mexico. Oikos 63:207-214.Putz, F. E. and C. Romero. 2014. Futures of tropical forests (sensu lato). Biotropica 46:495-505.R Development Core Team. 2011. R: A Language and Environment for Statistical Computing. R Foundation for Statistical Computing, Vienna.
30544 Lohbeck-bk.indd 187 27-10-14 16:42

188
Rasband, W. S. 2008. ImageJ. US National Institutes of Health, Bethesda.Raudsepp-Hearne, C., G. D. Peterson, and E. M. Bennett. 2010. Ecosystem service bundles for analyzing tradeoffs in diverse landscapes. PNAS 107:5242-5247.Reich, P. B. 2014. The world-wide ‘fast-slow’ plant economics spectrum: a traits manifesto. Journal of Ecology 102:275-301.Reich, P. B., D. S. Ellsworth, and C. Uhl. 1995. Leaf carbon and nutrient assimilation and conservation in species of differing successional status in an oligotrophic Amazonian forest. Functional Ecology 9:65-76.Reich, P. B., C. Uhl, M. B. Walters, and D. S. Ellsworth. 1991. Leaf lifespan as a determinant of leaf structure and function among 23 amazonian tree species. Oecologia 86:16-24.Reich, P. B., M. B. Walters, and D. S. Ellsworth. 1997. From tropics to tundra: Global convergence in plant functioning. PNAS.Reich, P. B., I. J. Wright, J. Cavender-Bares, J. M. Craine, J. Oleksyn, M. Westoby, and M. B. Walters. 2003. The evolution of plant functional variation: Traits, spectra, and strategies. International Journal of Plant Sciences 164:S143-S164.Reiss, J., J. R. Bridle, J. M. Montoya, and G. Woodward. 2009. Emerging horizons in biodiversity and ecosystem functioning research. Trends in Ecology & Evolution 24:505-514.Romero, C. and B. M. Bolker. 2008. Effects of stem anatomical and structural traits on responses to stem damage: an experimental study in the Bolivian Amazon. Canadian Journal of Forest Research 38:611-618.Rosenfeld, J. S. 2002. Functional redundancy in ecology and conservation. Oikos 98:156-162.Ross, M. S., M. Carrlngton, L. J. Flynn, and P. L. Ruiz. 2001. Forest succession in tropical hardwood hammocks of the Florida Keys: Effects of direct mortality from hurricane Andrew. Biotropica 33:23-33.Rosseel, Y. 2012. Lavaan: an R package for structural equation modeling. Journal of Statistical Software 48:1-36.Rozendaal, D. M. A., V. H. Hurtado, and L. Poorter. 2006. Plasticity in leaf traits of 38 tropical tree species in response to light; relationships with light demand and adult stature. Functional Ecology 20:207-216.Rudel, T. K., D. Bates, and R. Machinguiashi. 2002. A tropical forest transition? Agricultural change, out-migration, and secondary forests in the Ecuadorian Amazon. Annals of the Association of American Geographers 92:87-102.Rudel, T. K., O. T. Coomes, E. Moran, F. Achard, A. Angelsen, J. Xu, and E. Lambin. 2005. Forest transitions: towards a global understanding of land use change. Global Environmental Change 15:23-31.Ruiz-Benito, P., L. Gómez-Aparicio, A. Paquette, C. Messier, J. Kattge, and M. A. Zavala. 2014. Diversity increases carbon storage and tree productivity in Spanish forests. Global Ecology and Biogeography 23:311-322.Sack, L. 2004. Responses of temperate woody seedlings to shade and drought: do trade-offs limit potential niche differentiation? Oikos 107:110-127.Saldarriaga, J. G., D. C. West, M. L. Tharp, and C. Uhl. 1988. Long-term chronosequence of forest succession in the upper Rio Negro of Colombia and Venezuela. Journal of Ecology 76:938-958.Santos, B. A., C. A. Peres, M. A. Oliveira, A. Grillo, C. P. Alves-Costa, and M. Tabarelli. 2008. Drastic erosion in functional attributes of tree assemblages in Atlantic forest fragments of northeastern Brazil. Biological Conservation 141:249-260.Sapijanskas, J. and M. Loreau. 2010. Cascading extinctions, functional complementarity, and selection in two-trophic-level model communities: A trait-based mechanistic approach. Journal of Theoretical Biology 267:375-387.Sargent, R. D. and D. D. Ackerly. 2008. Plant-pollinator interactions and the assembly of plant communities. Trends in Ecology and Evolution 23:123-130.Savilaakso, S., C. Garcia, J. Garcia-Ulloa, J. Ghazoul, M. Groom, M. R. Guariguata, Y. Laumonier, R. Nasi, G. Petrokofsky, J. Snaddon, and M. Zrust. 2014. Systematic review of effects on biodiversity from oil palm production. Environmental Evidence 3.Sayer, J., Terry Sunderland, J. Ghazoul, Jean-Laurent Pfund, D. Sheil, E. Meijaard, M. Venter, A. K. Boedhihartono, M. Day, C. Garcia, C. v. Oosten, and L. E. Buckk. 2013. Ten principles for a landscape approach to reconciling agriculture, conservation, and other competing land uses. PNAS 110:8349-8356.Scherer-Lorenzen, M. 2008. Functional diversity affects decomposition processes in experimental grasslands. Functional Ecology 22:547-555.
30544 Lohbeck-bk.indd 188 27-10-14 16:42

189
Literature
Scherer-Lorenzen, M., J. L. Bonilla, and C. Potvin. 2007a. Tree species richness affects litter production and decomposition rates in a tropical biodiversity experiment. Oikos 116:2108-2124.Scherer-Lorenzen, M., C. Körner, E.-D. Schulze, M. Scherer-Lorenzen, C. Potvin, J. Koricheva, B. Schmid, A. Hector, Z. Bornik, G. Reynolds, and E. D. Schulze. 2005. The design of experimental tree plantations for functional biodiversity research. Pages 347-376 Forest Diversity and Function. Springer Berlin Heidelberg.Scherer-Lorenzen, M., E. Schulze, A. Don, J. Schumacher, and E. Weller. 2007b. Exploring the functional significance of forest diversity: A new long-term experiment with temperate tree species (BIOTREE). Perspectives in Plant Ecology, Evolution and Systematics 9:53-70.Schleuter, D., M. Daufresne, F. Massol, and C. Argillier. 2010. A user’s guide to functional diversity indices. Ecological Monographs 80:469-484.Schmid, B., J. Joshi, and F. Schläpfer. 2002. Emperical evidence for biodiversity- ecosystem functioning relationship. Pages 120-150 in A. P. Kinzig, S. W. Pacala, and D. Tilman, editors. The Functional Consequences of Biodiversity; Emperical Progress and Theoretical Extensions. Princeton University Press, Princeton, New Jersey, USA.Shannon, C. and W. Weaver. 1949. The mathematical theory of communication. University of Illinois Press, Urbana USA.Sheil, D. 1999. Tropical forest diversity, environmental change and species augmentation: After the intermediate disturbance hypothesis. Journal of Vegetation Science 10:851-860.Sheil, D. and D. F. R. P. Burslem. 2003. Disturbing hypotheses in tropical forests. Trends in Ecology & Evolution 18:18-26.Shipley, B., D. C. Laughlin, G. Sonnier, and R. Otfinowski. 2011. A strong test of a maximum entropy model of trait-based community assembly. Ecology 92:507-517.Shipley, B., M. J. Lechowicz, I. Wright, and P. B. Reich. 2006. Fundamental trade-offs generating the worldwide leaf economics spectrum. Ecology 87:535-541.Siebe, C., M. Martínez-Ramos, G. Segura-Warnholtz, J. Rodríguez-Valázquez, and S. Sánchez-Beltran. 1996. Soil and vegetation patterns in the tropical rainforest at Chajul, Chiapas, southeast Mexico. Pages 40-58 in International Congress on Soils of Tropical Forest Ecosystems. 3rd Conference on Forest Soils. Mulawarman University Press, Samarinda, Indonesia.Sloan, S. P. 2007. Fewer people may not mean more forest for Latin American forest frontiers. Biotropica 39:443-446.Smith, J., S. Ferreira, P. van de Kop, C. A. P. Ferreira, and C. Sabogal. 2003. The persistence of secondary forests on colonist farms in the Brazilian Amazon. Agroforestry Systems 58:125-135.Smith, J., B. Finegan, C. Sabogal, d. S. G. Ferreira, P. Van de Kop, and A. Diaz Barba. 2001. Management of secondary forests in colonist swidden agriculture in Peru, Brazil and Nicaragua. Pages 263-278 in M. Palo, J. Uusivuori, and G. Mery, editors. World Forests Book Series: world forests, markets and policies. Kluwer Academic Publishers, Dordrecht, the Netherlands.Smith, J., P. van de Kop, K. Reategui, I. Lombardi, C. Sabogal, and A. Diaz. 1999. Dynamics of secondary forests in slash-and-burn farming: interactions among land use types in the Peruvian Amazon. Agriculture, Ecosystems and Environment 76:85-98.Smith, M. D. and A. K. Knapp. 2003. Dominant species maintain ecosystem function with non-random species loss. Ecology Letters 6:509-517.Stephenson, N. L., A. J. Das, R. Condit, S. E. Russo, P. J. Baker, N. G. Beckman, D. A. Coomes, E. R. Lines, W. K. Morris, N. Ruger, E. Alvarez, C. Blundo, et al. 2014. Rate of tree carbon accumulation increases continuously with tree size. Nature 507:90-93.Sterck, F. J., L. Poorter, and F. Schieving. 2006. Leaf traits determine the growth-survival trade-off across rain forest tree species. The American Naturalist 167:758-765.Swaine, M. D. and T. C. Whitmore. 1988. On the definition of ecological species groups in tropical rain forests. Plant Ecology 75:81-86.Swenson, N. G., B. J. Enquist, J. Thompson, and J. K. Zimmerman. 2007. The influence of spatial and size scale on phylogenetic relatedness in tropical forest communities. Ecology 88:1770-1780.Swift, M. 2004. Biodiversity and ecosystem services in agricultural landscapes? Are we asking the right questions? Agriculture, Ecosystems & Environment 104:113-134.Szott, L. T., C. A. Palm, and R. J. Buresh. 1999. Ecosystem fertility and fallow function in the humid and subhumid tropics. Agroforestry Systems 47:163-196.
30544 Lohbeck-bk.indd 189 27-10-14 16:42

190
Tabarelli, M. and C. A. Peres. 2002. Abiotic and vertebrate seed dispersal in the Brazilian Altantic forest: implications for forest regeneration. Biological Conservation 106:165-176.Takenaka, A. 1994. Effects of leaf blade narrowness and petiole length on the light capture efficiency of a shoot. Ecological Research 9:109-114.Tardif, A. and B. Shipley. 2013. Using the biomass-ratio and idiosyncratic hypotheses to predict mixed-species litter decomposition. Annals of Botany 111:135-141.Technicon Industrial Systems. 1977. Technicon Publication Methods No. 329-74 W/B. Individual/Simultaneous Determinations of Nitrogen and/or Phosphorus in BD Acid Digest. Technicon Industrial Systems, Tarrytown, New York, USA.ter Steege, H. and N. C. Pitman and D. Sabatier and C. Baraloto and R. P. Salomao and J. E. Guevara and O. L. Phillips and C. V. Castilho and W. E. Magnusson and J. F. Molino and A. Monteagudo and P. Nunez Vargas, et al. 2013. Hyperdominance in the Amazonian tree flora. Science 342:1243092.Tilman, D. 1999. The ecological consequences of changes in biodiversity: a search for general principles. Ecology 80:1455-1474.Tilman, D. 2000. Causes, consequences and ethics of biodiversity. Nature 405:208-211.Tilman, D. 2001a. Diversity and productivity in a long-term grassland experiment. Science 294:843-845.Tilman, D. 2001b. Functional diversity. Pages 109-120 in S. A. Levin, editor. Encyclopedia of Biodiversity. Academia Press, San Diego, USA.Tilman, D., J. Knops, D. Wedin, P. Reich, M. Ritchie, and E. Siemann. 1997. The Influence of functional diversity and composition on ecosystem processes. Science 277:1300-1302.Uriarte, M., N. G. Swenson, R. L. Chazdon, L. S. Comita, W. John Kress, D. Erickson, J. Forero-Montaña, J. K. Zimmerman, and J. Thompson. 2010. Trait similarity, shared ancestry and the structure of neighbourhood interactions in a subtropical wet forest: implications for community assembly. Ecology Letters 13:1503-1514.Vaca, R. A., D. J. Golicher, L. Cayuela, J. Hewson, and M. Steininger. 2012. Evidence of incipient forest transition in Southern Mexico. PLoS ONE 7:e42309.van Breugel , M. 2007. Dynamics of secondary forests. PhD thesis. Wageningen University, Wageningen, the Netherlands.van Breugel, M., F. Bongers, and M. Martínez-Ramos. 2007. Species dynamics during early secondary forest succession: recruitment, mortality and species turnover. Biotropica 39:610-619.van Breugel, M., J. S. Hall, D. Craven, M. Bailon, A. Hernandez, M. Abbene, and P. van Breugel. 2013. Succession of ephemeral secondary forests and their limited role for the conservation of floristic diversity in a human-modified tropical landscape. PLoS ONE 8:e82433.van Breugel, M., M. Martínez-Ramos, and F. Bongers. 2006. Community dynamics during early secondary succession in Mexican tropical rain forests. Journal of Tropical Ecology 22:663-674.van Breugel, M., J. Ransijn, D. Craven, F. Bongers, and J. S. Hall. 2011. Estimating carbon stock in secondary forests: Decisions and uncertainties associated with allometric biomass models. Forest Ecology and Management 262:1648-1657.van Breugel, M., P. van Breugel, P. A. Jansen, M. Martínez-Ramos, and F. Bongers. 2012. The relative importance of above- versus belowground competition for tree growth during early succession of a tropical moist forest. Plant Ecology 213:25-34.van Gelder, H. A., L. Poorter, and F. J. Sterck. 2006. Wood mechanics, allometry, and life-history variation in a tropical rain forest tree community. New Phytologist 171:367-378.Van Nieuwstadt, M. G. L. and D. Sheil. 2005. Drought, fire and tree survival in a Borneo rain forest, East Kalimantan, Indonesia. Journal of Ecology 93:191-201.van Ruijven, J. and F. Berendse. 2005. Diversity–productivity relationships: Initial effects, long-term patterns, and underlying mechanisms. PNAS 102:695-700.Vilà, M., A. Carrillo-Gavilán, J. Vayreda, H. Bugmann, J. Fridman, W. Grodzki, J. Haase, G. Kunstler, M. Schelhaas, and A. Trasobares. 2013. Disentangling biodiversity and climatic determinants of wood production. PLoS ONE 8:e53530.Villar, R. and J. Merino. 2001. Comparison of leaf construction costs in woody species with differing leaf life-spans in contrasting ecosystems. New Phytologist 151:213-226.Villéger, S., N. W. H. Mason, and D. Mouillot. 2008. New multidimensional functional diversity indices for a multifaceted framework in functional ecology. Ecology 89:2290-2301.
30544 Lohbeck-bk.indd 190 27-10-14 16:42

191
Literature
Violle, C., A. Bonis, M. Plantegenest, C. Cudennec, C. Damgaard, B. Marion, D. Le Cœur, and J.-B. Bouzillé. 2010. Plant functional traits capture species richness variations along a flooding gradient. Oikos 120:389-398.Voeks, R. A. 1996. Tropical forest healers and habitat preference. Economic Botany 50:381-400.Wadsworth, G., H. M. Reisenauer, D. R. Gordon, and M. J. Singer. 1990. Effects of length of forest fallow on fertility dynamics in a Mexican utisol. Plant and Soil 122:151-156.Walker, B., C. S. Holling, S. R. Carpenter, and A. Kinzig. 2004. Resilience, adaptability and transformability in social–ecological systems. Ecology and Society 9:5.Walker, B., A. Kinzig, and J. Langridge. 1999. Plant attribute diversity, resilience, and ecosystem function: the nature and significance of dominant and minor species. Ecosystems 2:95-113.Walker, L. R., A. B. Shiels, P. J. Bellingham, A. D. Sparrow, N. Fetcher, F. H. Landau, D. J. Lodge, and T. Kitzberger. 2013. Changes in abiotic influences on seed plants and ferns during 18 years of primary succession on Puerto Rican landslides. Journal of Ecology 101:650-661.Wardle, D. A. 2004. Ecological linkages between aboveground and belowground biota. Science 304:1629-1633.Warren, J., C. J. Topping, and P. James. 2009. A unifying evolutionary theory for the biomass–diversity–fertility relationship. Theoretical Ecology 2:119-126.Webb, C. O., D. D. Ackerly, M. A. McPeek, and M. J. Donoghue. 2002. Phylogenies and community ecology. Annual Review of Ecology and Systematics 33:475-505.Weiher, E. and P. A. Keddy. 1995. The assembly of experimental wetland plant communities. Oikos 73:323-335.Weiher, E., A. van der Werf, K. Thompson, M. Roderick, E. Garnier, and O. Eriksson. 1999. Challenging Theophrastus: A common core list of plant traits for functional ecology. Journal of Vegetation Science 10:609-620.Westoby, M., M. Leishman, J. Lord, H. Poorter, and D. J. Schoen. 1996. Comparative ecology of seed size and dispersal [and discussion]. Philosophical Transactions of the Royal Society B: Biological Sciences 351:1309-1318.Whittaker, R. H. 1965. Dominance and diversity in land plant communities. Science 147:250-260.Wilsey, B. J. and H. W. Polley. 2004. Realistically low species evenness does not alter grassland species-richness-productivity relationships. Ecology 85:2693-2700.Wilsey, B. J. and C. Potvin. 2000. Biodiversity and ecosystem functioning: importance of species evenness in an old field. Ecology 81:887-892.Woo, N. S., M. R. Badger, and B. J. Pogson. 2008. A rapid, non-invasive procedure for quantitative assessment of drought survival using chlorophyll fluorescence. Plant Methods 4:27.Wright, I. J., D. D. Ackerly, F. Bongers, K. E. Harms, G. Ibarra-Manríquez, M. Martínez-Ramos, S. J. Mazer, H. C. Muller-Landau, H. Paz, N. C. A. Pitman, L. Poorter, M. R. Silman, et al. 2007. Relationships among ecologically important dimensions of plant trait variation in seven Neotropical forests. Annals of Botany 99:1003-1015.Wright, I. J., P. B. Reich, M. Westoby, D. D. Ackerly, Z. Baruch, F. Bongers, J. Cavender-Bares, T. Chapin, J. H. C. Cornelissen, M. Diemer, J. Flexas, E. Garnier, et al. 2004. The worldwide leaf economics spectrum. Nature 428:821-827.Wright, J. 2002. Plant diversity in tropical forests: a review of mechanisms of species coexistence. Oecologia 130:1-14.Wright, S. J., K. Kitajima, N. J. B. Kraft, P. B. Reich, I. J. Wright, D. E. Bunker, R. Condit, J. W. Dalling, S. J. Davies, S. Díaz, B. M. J. Engelbrecht, K. E. Harms, et al. 2010. Functional traits and the growth–mortality trade-off in tropical trees. Ecology 91:3664-3674.Wright, S. J. and H. C. Muller-Landau. 2006a. The future of tropical forest species. Biotropica 38:287-301.Wright, S. J. and H. C. Muller-Landau. 2006b. The uncertain future of tropical forest species. Biotropica 38:443-445.Xuluc-Tolosa, F. J., H. F. M. Vester, N. Ramírez-Marcial, J. Castellanos-Albores, and D. Lawrence. 2003. Leaf litter decomposition of tree species in three successional phases of tropical dry secondary forest in Campeche, Mexico. Forest Ecology and Management 174:401-412.
30544 Lohbeck-bk.indd 191 27-10-14 16:42

192
Yan, E. R., X. H. Wang, M. Guo, Q. Zhong, W. Zhou, and Y. F. Li. 2009. Temporal patterns of net soil N mineralization and nitrification through secondary succession in the subtropical forests of eastern China. Plant and Soil 320:181-194.Yates, M. J., G. Anthony Verboom, A. G. Rebelo, and M. D. Cramer. 2010. Ecophysiological significance of leaf size variation in Proteaceae from the Cape Floristic Region. Functional Ecology 24:485-492.Young, K. R., J. J. Ewel, and B. J. Brown. 1987. Seed dynamics during forest succession in Costa Rica. Plant Ecology 71:157-173.Zavaleta, E. S. and K. B. Hulvey. 2004. Realistic species losses disproportionately reduce grassland resistance to biological invaders. Science 306:1175-1177.Zavaleta, E. S., J. R. Pasari, K. B. Hulvey, and G. D. Tilman. 2010. Sustaining multiple ecosystem functions in grassland communities requires higher biodiversity. PNAS 107:1443-1446.Zermeño-Hernández, I. E. 2008. Evaluación del disturbio ecológico provocado por diferentes tipos de uso agrícola del suelo en una región tropical húmeda. MSc thesis. Centro de Investigaciones en Ecosistemas, Universidad Nacional Autónoma de México, Morelia, Mexico.Zhang, K., X. Cheng, H. Dang, C. Ye, Y. Zhang, and Q. Zhang. 2013. Linking litter production, quality and decomposition to vegetation succession following agricultural abandonment. Soil Biology and Biochemistry 57:803–813.Zieminska, K., D. W. Butler, S. M. Gleason, I. J. Wright, and M. Westoby. 2013. Fibre wall and lumen fractions drive wood density variation across 24 Australian angiosperms. AoB PLANTS 5:plt046.Zimmermann, B., A. Zimmermann, H. L. Scheckenbach, T. Schmid, J. S. Hall, and M. van Breugel. 2013. Changes in rainfall interception along a secondary forest succession gradient in lowland Panama. Hydrology and Earth System Sciences 17:4659-4670.
30544 Lohbeck-bk.indd 192 27-10-14 16:42
Summary
30544 Lohbeck-bk.indd 193 27-10-14 16:42

194
The world’s tropical forests are under great threat from deforestation. Once the forest is lost, there is a chance of it growing back, either assisted by reforestation, or unassisted through the natural process of secondary succession and giving rise to secondary forest. One of the main factors reducing tropical forest cover is agricultural expansion, causing loss of habitat and biodiversity. Since biodiversity is generally accepted as one of the major drivers of ecosystem functioning, large consequences for ecosystem functioning and services can be expected. Currently in the tropics, the area of secondary forest exceeds that of mature forest, and the importance of secondary forest will probably continue to increase in the future. Understanding secondary forests’ potential for maintaining biodiversity, ecosystem functions and ecosystem services is thereby vital. The aim of this study was to mechanistically link tropical forest succession with the recovery of ecosystem functioning after agricultural field abandonment using a trait-based approach. Such an approach makes use of functional traits; components of an organism’s phenotype that are key to assess ecosystem responses to global change drivers, and are at the same time indicators of how organisms drive changes in ecosystem functioning. Trait-based approaches could therefore provide a mechanistic way to scale up from organisms to ecosystems and thereby contribute towards a more predictive biodiversity and ecosystem functioning science. For this study I made use of secondary forest data from a wet forest region in Chiapas (main study site), that cover the first 3 decades of succession, complemented with data from a dry forest region in Oaxaca, that cover the first 6 decades of succession. Both are tropical regions in Mexico, characterized by high biodiversity levels and rapid forest loss for agricultural expansion.
Specific objectives were: 1) to determine successional changes in functional diversity, and to what extent these reflect patterns derived from traditional (taxonomic) diversity metrics, 2) to determine successional changes in functional composition, and to what extent these reveal underlying changes in environmental conditions (such as light and water availability) that act as filters on species performance, 3) to reveal fundamental constraints underlying species to adopt certain functional strategies, 4) to unravel the relative importance of community assembly mechanisms (habitat filtering and competitive interactions) that shape successional changes in the distribution of functional traits in the community, 5) to assess which community functional properties (community-weighted mean and functional diversity) drive the recovery of different ecosystem functions (such as net primary productivity and decomposition) during succession, 6) to
30544 Lohbeck-bk.indd 194 27-10-14 16:42

195
Summary
evaluate the importance of biodiversity for multiple ecosystem functions at the landscape level.
Successional recovery of diversity (both taxonomic and functional) in the main (wet forest) study region is evaluated in chapter 2. We also tested whether species diversity is a good predictor of functional diversity. Functional diversity was calculated based on a combination of nine functional traits, and based on two individual traits important for primary production (specific leaf area) and carbon sequestration (wood density). Incidence-based functional diversity indices increased logarithmically with stand basal area, but functional diversity weighted by species’ importance values lacked pattern with succession. Species richness and diversity are strong predictors of functional diversity when all traits were considered; linear relationships indicate that all species are equally functionally complementary. In contrast, when functional diversity was calculated for individual traits and weighted for abundances, species richness may underestimate functional diversity. We conclude that selection of functional trait(s) critically determines functional diversity, with large consequences for studies relating biodiversity to ecosystem functioning.
In chapter 3 we tested whether and how functional composition changes with succession in dry deciduous and wet evergreen forests of Mexico. For this, community-weighted means were calculated based on 11 functional traits measured on 132 species. Successional changes in functional composition are more marked in dry forest than in wet forest and largely characterized by different traits. During dry forest succession, conservative traits related to drought tolerance and drought avoidance decreased, as predicted. Unexpectedly acquisitive leaf traits also decreased, whereas seed size and dependence on biotic dispersal increased. In wet forest succession functional composition changed from acquisitive to conservative leaf traits, suggesting light availability as the main driver of changes. We conclude that distinct suites of traits shape functional composition changes in dry and wet forest succession, responding to different environmental filters.
There is increasing support for the existence of fundamental trait trade-offs that constrain species’ functional strategies. In chapter 4 we evaluated such trait trade-offs among the secondary forest species of the dry deciduous and wet evergreen forests of Mexico, by making species-trait PCA biplots for dry and wet forest and comparing trade-offs. We also evaluated changes in multivariate plant
30544 Lohbeck-bk.indd 195 27-10-14 16:42

196
strategies during succession, by calculating a community-weighted mean based on species scores on the first two PCA-axes. Trait spectra reflected two main trade-off axes that were indeed similar for dry and wet forest species: acquisitive versus conservative species, and drought avoiding species versus evergreen species with large animal-dispersed seeds. Successional change in the most successful plant strategies reflected different spectra depending on the forest type. In dry forest, the community changed from having drought avoiding strategies early in succession to increased abundance of evergreen strategies with larger seeds late in succession. In wet forest, the community changed from species having mainly acquisitive strategies to those with more conservative strategies during succession. These strategy changes confirmed that dry forest succession is predominantly driven by increasing water availability and wet forest succession by increasing light scarcity.
In chapter 5 we used kurtosis to describe secondary forest communities’ functional trait distributions and tested whether these explain patterns in species dominance along the wet forest successional gradient. ‘K-ratio’ was computed by dividing kurtosis based on species dominance by kurtosis based on species presence, and describes how dissimilar the dominant species are compared to the species that are present in terms of their functional traits. This was calculated for 8 functional leaf traits related to a plant’s carbon, water and heat balance. We found that during early succession, dominant species represent a functionally narrow subset of species with similar traits and in late succession dominant species increasingly represent a wide subset of the species present. This trend was found for traits that reflect photosynthetic performance and light capture, and indicates increased competition for light with succession. No trend was found for traits that indicate defense against herbivory, suggesting no successional changes in herbivore pressure. We conclude that during the early successional time window we evaluated, the importance of environmental filtering as a driving force fades away rapidly, and the importance of niche partitioning starts to emerge.
In chapter 6 we analysed the drivers underlying successional changes in rates of key ecosystem functions (biomass productivity, litter productivity, actual (in situ) litter decomposition and potential (ex situ) litter decomposition). We tested the importance of three alternative drivers of ecosystem functioning: vegetation biomass (vegetation quantity hypothesis), community-weighted trait mean (mass-ratio hypothesis) and functional diversity (niche complementarity
30544 Lohbeck-bk.indd 196 27-10-14 16:42

197
Summary
hypothesis). We found that ecosystem function rates changed during succession, and the strongest driver was aboveground biomass for each of the functions. Productivity of aboveground stem biomass and leaf litter as well as actual litter decomposition increased with initial standing vegetation biomass, whereas potential litter decomposition decreased with standing biomass. Additionally, biomass productivity increased with community-weighted mean of specific leaf area and potential litter decomposition decreased with community-weighted mean leaf dry matter content and increased with functional divergence. Our empirical results show that functional diversity and community-weighted means are of secondary importance in explaining changes in ecosystem function rates during tropical forest succession. Instead, simply the amount of vegetation in a site is the major driver of changes, perhaps because the steep biomass build-up during succession overrides more subtle effects of community functional properties on ecosystem functions.
Increasing evidence shows that biodiversity may not be so important for a single ecosystem function but is specifically important for ecosystem multifunctionality, as different species contribute to different functions. In chapter 7 I tested whether indeed different species matter for different ecosystem functions in the human-modified tropical forest landscape. I quantified five key ecosystem functions (standing above-ground biomass, biomass productivity, litter production, wood decomposition and litter decomposition) at the landscape level, and evaluated to what extent individual species contribute to these. I found that only 2.5%-14% of the species were needed to make up at least 50% of each the ecosystem function, demonstrating a strong saturating relationship between species richness and cumulative ecosystem function. Also the small subset of important species largely overlapped among different functions, indicating a limited role of biodiversity for ecosystem multifunctionality. Using simulations I demonstrated that the relationship between species richness and ecosystem function becomes linear when species dominance is reduced, suggesting that biodiversity becomes important for multifunctionality under high evenness.
In sum, in this thesis I found that functional diversity (the range of different functional traits) increases rapidly and functional composition (the weighted average functional trait value) changes directionally with succession (chapter 2 and 3). These reflect changing habitat filters (changing environmental gradients that underlie succession), and also a gradual shift from habitat filtering towards
30544 Lohbeck-bk.indd 197 27-10-14 16:42

198
an increasing effect of competitively driven limiting trait similarity (chapter 4 and 5). Such successional changes suggest strong changes in ecosystem functions, however in situ ecosystem function rates were primarily explained by the total amount of biomass present rather than by biodiversity or functional trait properties of secondary forests (chapter 6). When evaluating the identity of species that drive most of the ecosystem functions I found that different functions were largely driven by the same (dominant) species, implying a limited effect of biodiversity for multifunctionality at a given moment in time and suggesting that biodiversity is mainly important for maintaining multifunctional ecosystems across temporal and spatial scales (chapter 7).
Deforestation is a major threat to natural forests and biodiversity, and I recognize that secondary forests is generally a poor substitute of mature forest. Nevertheless, I show that unassisted recovery through natural succession can be rapid, and contribute considerably to maintenance of biodiversity and ecosystem functions. So while protecting the remaining tracts of mature forests is vital, secondary forests are key components of multifunctional human-modified landscapes with opportunities for optimizing synergies between biodiversity, ecosystem functions and human well-being.
30544 Lohbeck-bk.indd 198 27-10-14 16:42

Samenvatting
30544 Lohbeck-bk.indd 199 27-10-14 16:42

200
Tropisch bos wordt ernstig bedreigd door ontbossing. Waar bos gekapt is, kan het terug groeien; ofwel door actieve herbeplanting, ofwel passief door het natuurlijke proces genaamd secundaire successie. Bos dat terug groeit door secundaire successie heet secundair bos en daarover gaat dit onderzoek.
Een van de voornaamste factoren waardoor het tropisch bosareaal afneemt is de uitbreiding van landbouwgrond, met als gevolg verlies van habitat en biodiversiteit. Biodiversiteit (de verscheidenheid aan levensvormen) is belangrijk voor het functioneren van ecosystemen, en verlies van biodiversiteit heeft naar verwachting dan ook grote consequenties voor ecosysteemfuncties (het functioneren van een ecosysteem) en ecosysteemdiensten (de diensten die ecosystemen kunnen leveren aan de maatschappij). Momenteel beslaat secundair bos een groter oppervlak dan primair (onaangetast) bos, en naar verwachting zal de relevantie van secundair bos alleen maar toenemen in de toekomst. Het is daarom belangrijk om te begrijpen in hoeverre secundair bos kan bijdragen aan het behouden van biodiversiteit, ecosysteemfuncties en ecosysteemdiensten, en daarmee het menselijk welzijn. Het doel van deze studie was om secundaire successie te koppelen aan het herstel van ecosysteemfuncties op verlaten landbouwgrond, daarbij gebruik makend van functionele eigenschappen van planten. Dit zijn de componenten van het fenotype van een plant die verklaren hoe deze reageert op veranderende omstandigheden. Tegelijkertijd bepalen deze eigenschappen de invloed van planten op het functioneren van het ecosysteem. Het gebruik van functionele eigenschappen maakt het mogelijk om op te schalen van individuele planten naar ecosystemen. Dit draagt bij aan een betere voorspelling van de gevolgen van biodiversiteitsverlies op het functioneren van ecosystemen.
Voor deze studie heb ik gebruik gemaakt van gegevens van secundaire bossen uit twee tropische bosgebieden in zuid Mexico. De voornaamste studie regio is een nat tropisch bos gebied in Chiapas. De secundaire bossen variëren in leeftijd van 1 tot ongeveer 30 jaar sinds het beëindigen van landbouwactiviteiten. Daarnaast gebruik ik ook data van secundaire bossen uit een droge tropische regio in Oaxaca, deze bossen variëren in leeftijd van 5 tot ongeveer 60 jaar. Beide bosgebieden worden gekarakteriseerd door hoge biodiversiteit en snel verlies van bosareaal.
Specifieke doelen voor dit onderzoek waren de volgende: i) het bepalen van successionele veranderingen in functionele biodiversiteit (de verscheidenheid aan functionele eigenschappen), en de mate waarin deze patronen overeenkomen
30544 Lohbeck-bk.indd 200 27-10-14 16:42

201
Samenvatting
met meer traditionele indicatoren van diversiteit (zoals soortenrijkdom); ii) het bepalen van successionele veranderingen in functionele compositie (het gewogen gemiddelde van functionele eigenschappen), en de mate waarin deze informatie verstrekken over de onderliggende veranderingen in milieuomstandigheden die het succes van bomen bepalen (zoals de veranderende beschikbaarheid van water en licht gedurende successie); iii) het openbaren van de mate waarin soorten verschillende functionele strategieën (het samenspel van functionele eigenschappen) tegelijkertijd kunnen aannemen; iv) het ontrafelen van het relatieve belang van verschillende mechanismen (d.w.z., die van habitat filters en die van competitie voor hulpbronnen) die bepalen hoe de verdeling van functionele eigenschappen in bossen verandert met successie; v) het bepalen of de functionele eigenschappen van soorten belangrijk zijn voor verschillende ecosysteemfuncties (bijvoorbeeld, productiviteit en afbraak van strooisel) en zo ja, welke maat van opschalen van soorten naar bomengemeenschappen hiervoor het beste is (functionele diversiteit of de eigenschappen van de dominante soorten); vi) het evalueren van het belang van biodiversiteit voor diverse ecosysteemfuncties op landschapsniveau.
In hoofdstuk 2 bestuderen we het herstel van diversiteit (zowel taxonomisch als functioneel) in het natte tropisch bos van Chiapas. We testen of soortenrijkdom een goede voorspeller is van functionele diversiteit. Functionele diversiteit is berekend op basis van negen verschillende functionele eigenschappen, en twee individuele eigenschappen die belangrijk zijn voor de productiviteit (specifiek bladoppervlak, ofwel het bladoppervlak gedeeld door het drooggewicht van het blad) en voor de koolstofopslag in het bos (houtdichtheid). Functionele rijkdom (d.w.z., niet gewogen voor de relatieve biomassa van iedere soort) neemt logaritmisch toe met het grondvlak van het bos gedurende successie. Daarentegen neemt functionele diversiteit (wel gewogen voor de relatieve biomassa van iedere soort) niet voorspelbaar toe of af met successie. Zowel soortenrijkdom als soortendiversiteit zijn sterke voorspellers van functionele rijkdom en diversiteit wanneer alle functionele eigenschappen tegelijkertijd werden meegenomen in de analyse: deze relaties worden gekenmerkt door lineaire functies. Wanneer functionele diversiteit is berekend met een enkele functionele eigenschap en wanneer gewogen is voor de biomassa van soorten, dan onderschat soortenrijkdom de functionele diversiteit. Wij concluderen daarom dat de keuze van functionele eigenschappen van invloed is op functionele diversiteit, met grote consequenties voor studies die biodiversiteit aan ecosysteemfuncties koppelen.
30544 Lohbeck-bk.indd 201 27-10-14 16:42

202
In hoofdstuk 3 testen we of en hoe functionele compositie verandert met successie in een droog, bladverliezend bos en in een nat, groenblijvend bos in Mexico. Hiervoor is voor iedere bomengemeenschap een gewogen gemiddelde bepaald voor 11 functionele eigenschappen die zijn gemeten op 132 boomsoorten. Dit gemeenschap-gewogen gemiddelde is eigenlijk de functionele eigenschap van de meest voorkomende boom in dat bos. Successionele veranderingen in deze gewogen gemiddelde functionele eigenschappen, ofwel functionele compositie, zijn duidelijker in het droge bos en bovendien grotendeels gekarakteriseerd door andere functionele eigenschappen dan in het natte bos: gedurende successie in droog bos worden eigenschappen gericht op het beperken van waterverlies en gericht op het vermijden van droogte steeds minder belangrijk, zoals verwacht. Tegen verwachting in worden ook bladeigenschappen gericht op het maximaliseren van de opname van licht minder belangrijk (zoals bladoppervlak), terwijl de grootte van de zaden en de afhankelijkheid van zaadverspreiders toeneemt. Tijdens successie in nat bos verandert de functionele compositie van bladeren gericht op maximale lichtopname naar bladeren gericht op het beperken van verlies van interne hulpbronnen (zoals water en nutriënten). Dit laatste suggereert dat afnemend licht de voornaamste gradiënt is waaraan soorten zich moeten aanpassen gedurende successie in natte bossen. We concludeerden dat verschillende sets van eigenschappen verantwoordelijk zijn voor veranderingen in functionele compositie in droog en nat bos, omdat die aangestuurd worden door gradiënten van verschillende hulpbronnen: successie in droog bos door toenemende waterbeschikbaarheid en in nat bos door afnemende lichtbeschikbaarheid.
Er zijn duidelijke aanwijzingen voor het bestaan van fundamentele trade-offs die soorten beperken in de mogelijkheid verschillende functionele strategieën tegelijkertijd aan te nemen. In hoofdstuk 4 vergelijken we zulke trade-offs tussen secundaire bossoorten uit droog, bladverliezend bos en uit nat, groenblijvend bos in Mexico. Hiervoor scheiden we soorten van elkaar op basis van hun functionele eigenschappen in zogenaamde principal components analyses (PCA). We maken PCA grafieken voor soorten uit droog bos en uit nat bos en vergelijken welke multivariate strategieën en trade-offs zich vormen. Ook bepalen we successionele veranderingen in multivariate functionele compositie, door het gewogen gemiddelde van de bossen te berekenen gebaseerd op de scoren van soorten op de voornaamste componenten van variatie. De voornaamste twee componenten
30544 Lohbeck-bk.indd 202 27-10-14 16:42

203
Samenvatting
van variatie reflecteren die van acquisitieve naar conservatieve eigenschappen en die van droogte-vermijdende soorten naar groenblijvende soorten met grote, door dieren verspreide zaden. Deze twee componenten blijken vergelijkbaar voor soorten van droog bos en voor soorten van nat bos. Successionele verandering in de meest succesvolle strategieën reflecteren verschillende componenten van variatie afhankelijk van het bostype. In droog bos verandert de bomengemeenschap van voornamelijk droogte-vermijdende strategieën naar groenblijvende strategieën die ook grote zaden hebben. In nat bos daarentegen verandert het bos van acquisitieve strategieën naar conservatieve strategieën. Deze successionele veranderingen in functionele strategieën bevestigen dat droog bos successie wordt aangedreven door toenemende beschikbaarheid van water en nat bos successie door afnemende beschikbaarheid van licht.
In hoofdstuk 5 gebruiken we ‘kurtosis’ (de platheid van een curve) om de distributie van functionele eigenschappen in een bomengemeenschap te beschrijven. We testen vervolgens of deze distributies kunnen verklaren welke soorten dominant worden gedurende de successionele gradiënt. Hiervoor berekenen we de ‘K-ratio’, dit is de kurtosis van de distributie van functionele eigenschappen in de bomengemeenschap gewogen voor soorts-dominantie, gedeeld door de kurtosis van de distributie wanneer alle soorten even zwaar meetellen. Deze ratio is berekend voor 8 verschillende functionele eigenschappen die belangrijk zijn voor de interne koolstof-, water- en hittebalans van planten en beschrijft hoe dominante soorten functioneel verschillen van zeldzamere soorten. We vinden dat de soorten die in het begin van successie dominant zijn een functioneel smal onderdeel zijn van de totale variatie aan functionele eigenschappen in de gemeenschap. In latere successionele stadia vormen de dominante soorten in toenemende mate een breed onderdeel van de totale variatie aan functionele eigenschappen. Deze trend is gevonden voor eigenschappen die belangrijk zijn voor fotosynthese en voor het opvangen van licht, en suggereert een toenemende competitie voor licht gedurende successie in nat bos. We vonden geen trend in de K-ratio voor eigenschappen die belangrijk zijn voor verdediging tegen herbivoren, hetgeen suggereert dat de druk van herbivoren niet verandert gedurende successie. We concluderen dat gedurende het vroeg successionele tijdvenster dat we bestudeerd hebben, de relevantie van milieufilters als aandrijvende kracht snel vermindert en niche partitionering een rol begint te spelen.
30544 Lohbeck-bk.indd 203 27-10-14 16:42

204
In hoofdstuk 6 analyseren we de factoren die verantwoordelijk zijn voor successionele veranderingen in de snelheden van belangrijke ecosysteemprocessen (biomassaproductie, strooiselproductie, werkelijke strooiselafbraak -in situ- en potentiële strooiselafbraak -ex situ-). We testen de relatieve bijdrage van drie factoren op deze processen: de biomassa van de vegetatie (vegetatie-kwantiteit hypothese), de gewogen gemiddelde functionele eigenschap van de vegetatie (massa-ratio hypothese), en functionele diversiteit (niche-complementariteit hypothese). We vinden dat ecosysteemprocessen veranderen over de successionele gradiënt en dat de biomassa van de vegetatie de sterkste drijfveer is. Dit geldt voor elk van de vier functies. Biomassa- en strooiselproductiviteit en werkelijke strooiselafbraak nemen toe met toenemende initiële biomassa van de vegetatie, terwijl potentiële strooiselafbraak afnam met initiële biomassa. Verder neemt biomassaproductiviteit toe met toenemend gewogen gemiddelde van specifiek blad oppervlak; potentiële strooiselafbraak neemt toe met toenemende functionele divergentie, en neemt af met toenemend gewogen gemiddelde van de inhoud van droge materie in de bladeren. Onze resultaten laten zien dat simpelweg de hoeveelheid vegetatie het herstel van ecosysteem processen het sterkst aanstuurt en dat functionele eigenschappen van de planten van secundair belang zijn. Dit zou kunnen komen doordat de sterke accumulatie van biomassa die typerend is voor vroege successie, de subtielere veranderingen in functionele eigenschappen overstemt.
Er is steeds meer bewijs dat biodiversiteit niet zo belangrijk is voor een enkele ecosysteemfunctie, maar des te meer voor meerdere ecosysteemfuncties tegelijkertijd: voor ecosysteem multifunctionaliteit. Dit komt doordat verschillende soorten belangrijk zijn voor verschillende functies dus hoe meer functies je tegelijkertijd bestudeert, hoe meer soorten belangrijk zullen zijn. In hoofdstuk 7 test ik of inderdaad verschillende soorten bijdragen aan verschillende functies op landschapsniveau. Hiervoor kwantificeer ik 5 ecosysteem functies: biomassa, biomassaproductiviteit, strooiselproductiviteit, houtafbraak en strooiselafbraak, en bepaal ik de bijdrage van individuele soorten aan deze functies op landschapsniveau. Ik vind dat slechts 2.5%-14% van de soorten nodig is om meer dan 50% van iedere functie te vervullen. Dit geeft aan dat de relatie tussen soortenrijkdom en accumulatieve ecosysteemfuncties sterk verzadigd is. Daarbij toon ik aan dat de soorten die belangrijk zijn voor één functie, dat ook vaak zijn voor een andere functie, wat aangeeft dat ik maar beperkt bewijs vind voor de
30544 Lohbeck-bk.indd 204 27-10-14 16:42

205
Samenvatting
rol van biodiversiteit voor multifunctionaliteit. Met behulp van simulaties toon ik aan dat deze sterk verzadigde relatie vooral komt door de sterke ongelijkheid in de abundantie van soorten. Het zijn namelijk de dominante soorten die steeds belangrijk blijken voor ecosysteemfuncties. Verder laat ik zien dat biodiversiteit belangrijk wordt voor ecosysteem multifunctionaliteit wanneer de abundantie van soorten gelijkmatiger is.
In het kort, in dit proefschrift laat ik zien dat functionele diversiteit (de variatie aan verschillende functionele eigenschappen) sterk toeneemt met successie en dat functionele compositie (het gewogen gemiddelde van functionele eigenschappen) directionele veranderingen vertonen met successie (hoofdstuk 2 en 3). Deze duiden op de onderliggende gradiënt in milieuomstandigheden waaraan de bomengemeenschap zich moet aanpassen en ook dat er een verandering is in het mechanisme dat het succes van een soort bepaalt; van voornamelijk milieufilters in vroege successie naar steeds sterkere effecten van competitie in latere stadia (hoofdstuk 4 en 5). Het is te verwachten dat deze successionele veranderingen in functionele eigenschappen van de bomengemeenschap grote gevolgen zullen hebben voor het functioneren van het ecosysteem. Echter, ecosysteemprocessen werden voornamelijk bepaald door de hoeveelheid vegetatie in de secundaire bossen, en in mindere mate door de functionele eigenschappen van de soorten die erin staan (hoofdstuk 6). Ook bleek dat het grotendeels dezelfde (dominante) soorten zijn die een voorname rol speelden voor verschillende ecosysteemfuncties, en dat de rol van biodiversiteit op multifunctionaliteit dus beperkt is op een gegeven moment en in een gegeven ruimte. Daarentegen speelt biodiversiteit naar alle waarschijnlijkheid vooral een grote rol voor het behouden van multifunctionaliteit over ruimtelijke en tijdelijke schaal, dus voor de weerbaarheid van tropisch bos (hoofdstuk 7).
Ontbossing vormt een grote bedreiging voor bossen en biodiversiteit en ik erken dat secundair bos over het algemeen een schrale vervanging is van primair bos. Desalniettemin laat ik zien dat secundaire successie voor snel herstel kan zorgen en dat secundair bos aanzienlijk kan bijdragen aan het behoud van biodiversiteit en ecosysteem functies. Dus hoewel de bescherming van de overgebleven stukken primair bos cruciaal is, zijn secundaire bossen belangrijke componenten van multifunctionele antropogene landschappen met daarin mogelijkheden voor het optimaliseren van biodiversiteit, ecosysteemfuncties en ecosysteemdiensten.
30544 Lohbeck-bk.indd 205 27-10-14 16:42

Resúmen
30544 Lohbeck-bk.indd 206 27-10-14 16:42

207
Resúmen
Los bosques tropicales del mundo se encuentran gravemente amenazados por la deforestación. Una vez que se pierde el bosque, existe la posibilidad de que se recupere, ya sea a través de la reforestación o mediante el proceso natural de sucesión secundaria dando lugar al bosque secundario. Uno de los factores principales que causan la reducción de la cubierta boscosa tropical es la expansión de la agricultura, ocasionando la pérdida de hábitat y biodiversidad. Desde que se ha aceptado a la biodiversidad como un mayor factor conducente del funcionamiento de los ecosistemas, se puede esperar grandes consecuencias en el funcionamiento y servicios ecosistémicos. Actualmente en los trópicos, la superficie total de los bosques secundarios sobrepasa al de los bosques maduros, y probablemente la importancia de los bosques secundarios continuará en aumento en el futuro. Por tanto, el entendimiento del potencial que tienen los bosques secundarios para el mantenimiento de la biodiversidad, funciones y servicios ecosistémicos resulta vital. El objetivo de este estudio fue vincular la sucesión tropical secundaria con la recuperación del funcionamiento del ecosistema después del abandono de suelos agrícolas desde un enfoque basado en los atributos de las especies. Dicho enfoque utiliza los rasgos funcionales, los componentes fenotípicos de un organismo que son claves para evaluar las respuestas del ecosistema a factores conducentes del cambio global, y son al mismo tiempo indicadores de como los organismos producen cambios en el funcionamiento del ecosistema. Los enfoques basados en rasgos funcionales podrían, por lo tanto, proveer una forma mecanistica de escalar desde el nivel de los organismos hasta el nivel del ecosistema y así contribuir a que la ciencia pueda ser más útil en hacer predicciones sobre el funcionamiento de la biodiversidad y de los ecosistemas.
Para este estudio utilicé datos de bosques secundarios de dos regiones tropicales en el sur de México. El principal sitio de estudio es de bosque húmedo en Chiapas que abarca las primeras tres décadas de sucesión. El sitio de estudio complementario es de bosque seco en Oaxaca que abarca las primeras seis décadas de sucesión. Ambas son regiones tropicales caracterizadas por su alto nivel de biodiversidad y pérdida rápida de bosques por expansión agrícola.
Los objetivos específicos fueron: i) determinar los cambios sucesionales en la diversidad funcional, y la medida en que estos reflejan tendencias que son el resultado de medidas tradicionales (taxonómicas) de diversidad, ii) determinar los cambios sucesionales en la composición funcional, y la medida en que estos
30544 Lohbeck-bk.indd 207 27-10-14 16:42

208
revelan cambios fundamentales en las condiciones medioambientales (tales como disponibilidad de agua y luz) que actúan como filtros en el desempeño de las especies, iii) revelar las restricciones fundamentales subyacentes que promueven la adopción de ciertas estrategias funcionales por parte de las especies, iv) descifrar la importancia relativa de los mecanismos de ensamblaje de comunidades (filtros que operan en el hábitat e interacciones competitivas) que dan forma a los cambios sucesionales en la distribución de rasgos funcionales en la comunidad, v) evaluar las propiedades funcionales de la comunidad (media ponderada de una comunidad y diversidad funcional) subyacentes de la recuperación de diferentes funciones del sistema (tales como la productividad primaria neta y descomposición) durante la sucesión, vi) evaluar la importancia de la biodiversidad en las múltiples funciones del ecosistema a nivel de paisaje.
La recuperación sucesional de la diversidad (tanto taxonómica como funcional) en la región principal del estudio (bosque húmedo) es evaluada en el capítulo 2. También comprobamos si la diversidad de especies es un buen predictor de la diversidad funcional. Se calculó la diversidad funcional sobre la base de una combinación de nueve rasgos funcionales, y de dos rasgos individuales importantes para la producción primaria (área foliar específica) y para el secuestro de carbono (densidad de la madera). Índices de diversidad funcional basados en su incidencia incrementaron logarítmicamente con el área basal del bosque, pero la diversidad funcional ponderada para valores de importancia de las especies no presentó tendencia alguna con la sucesión. La riqueza y diversidad de especies son fuertes predictores de la diversidad funcional cuando se toma en cuenta todos los rasgos; en tal caso relaciones lineares indican que funcionalmente todas las especies son igualmente complementarios. En contraste, cuando la diversidad funcional fue considerada para rasgos individuales y ponderada por las abundancias de individuos de las especies, la riqueza de especies podría subestimar la diversidad funcional. Concluimos que la selección de rasgos funcionales determina críticamente la diversidad funcional con grandes consecuencias para estudios que relacionan la biodiversidad con el funcionamiento de los ecosistemas.
En el capítulo 3 comprobamos si, y de qué manera, la composición funcional cambia con la sucesión en bosques secos deciduos y bosques húmedos siempre verdes de México. Para esto, se calculó la media ponderada de la comunidad en base a cada uno de 11 rasgos funcionales medidos en un total de 132 especies.
30544 Lohbeck-bk.indd 208 27-10-14 16:42

209
Resúmen
Los cambios sucesionales en la composición funcional son más marcados en el bosque seco que en el bosque húmedo y estos bosques se encuentran ampliamente caracterizados por diferentes rasgos. Durante la sucesión del bosque seco, los rasgos conservativos relacionados a la tolerancia y evasión a la sequía disminuyeron tal como se predijo. Contrario a lo esperado, también disminuyeron los rasgos adquisitivos de las hojas, mientras que aumentaron el tamaño de las semillas y la dependencia en la dispersión biótica. En la sucesión del bosque húmedo la composición funcional cambió de rasgos adquisitivos a rasgos conservativos en las hojas, sugiriendo que la disponibilidad de luz es el mayor responsable de los cambios. Concluimos que los distintos conjuntos de rasgos determinan los cambios en la composición funcional tanto en la sucesión de bosque seco como húmedo respondiendo a diferentes filtros medioambientales.
Cada vez mayor evidencia apoya la existencia de trade-offs mutuas entre rasgos fundamentales que restringen las estrategias funcionales de las especies. En el capítulo 4 evaluamos tales trade-offs mutuas entre rasgos de especies del bosque secundario en el bosque seco deciduo y en el bosque húmedo siempre verde de México, a través de representaciones graficas de Analisis de Componentes Principales (ACP) de los rasgos de las especies para cada uno de los bosques (bosque seco y húmedo) y comparando los trade-offs. También evaluamos los cambios en las estrategias multivariadas de las plantas durante la sucesión, calculando la media ponderada de la comunidad en base a la posición de las especies en las primeras dos ejes del ACP. El espectro de rasgos reflejó dos ejes de trade-offs mutuas que de hecho fueron similares para especies del bosque seco y húmedo: especies adquisitivas versus especies conservativas, y especies que evaden la sequía versus especies siempre verdes con semillas mayormente dispersadas por animales. El cambio sucesional en la estrategia más exitosa de las plantas reflejó espectros diferentes dependiente del tipo de bosque. En el bosque seco la comunidad cambió de poseer estrategias que evaden la sequía en estadios tempranos de la sucesión a un incremento en la abundancia de estrategias siempre verdes con semillas más grandes en estadios tardíos de la sucesión. En el bosque húmedo la comunidad cambió de especies con estrategias principalmente adquisitivas a aquellas con estrategias más conservativas durante la sucesión. Estos cambios de estrategia confirmaron que la sucesión del bosque seco es predominantemente dependiente del incremento en la disponibilidad de agua, y la sucesión del bosque húmedo dependiente del aumento en la escasez de luz.
30544 Lohbeck-bk.indd 209 27-10-14 16:42

210
En el capítulo 5 utilizamos la curtosis (una medida de la forma de una distribucion, una mayor curtosis implica una mayor concentración de datos cerca de la media) para describir la distribución de rasgos funcionales de comunidades de bosques y probamos si estos explican tendencias en la dominancia de especies a lo largo del gradiente sucesional del bosque húmedo. Se computarizó “razón-C” dividiendo la curtosis basada en la dominancia de especies por la curtosis en base de la presencia de especies, y describimos cuan diferentes son las especies dominantes respecto a las especies que se encuentran presentes en cuanto a sus rasgos funcionales. Esta razón-C se calculó para 8 rasgos funcionales de hojas en relación al balance de carbono de la planta, agua y balance de alta temperatura. Encontramos que especies dominantes de etapas tempranas de sucesión representan un subconjunto de especies funcionalmente limitado con rasgos similares y en especies dominantes en etapas sucesionales tardías representan un subconjunto amplio de las especies presentes. Se encontró esta tendencia en rasgos que reflejan el desempeño fotosintético y captación de luz, e indica un aumento en la competencia por luz a lo largo de la sucesión. No se encontró ninguna tendencia para rasgos indicativos de la defensa de las plantas contra la herbivoría, sugiriendo la falta de cambios sucesionales en la presión por herbivoría. Concluimos que durante la etapa sucesional temprana del periodo que evaluamos, la importancia de los filtros medioambientales como fuerzas conducentes desaparecen rápidamente, y la importancia de la diferenciación de nichos emerge.
En el capítulo 6 analizamos los factores subyacentes a los cambios sucesionales en las tasas de funciones ecosistémicas claves (productividad de biomasa, descomposición real y potencial de hojarasca). Evaluamos la importancia de tres factores alternativos conducentes del funcionamiento del ecosistema: biomasa de la vegetación (hipótesis de la cantidad de la vegetación), media de rasgos ponderados de la comunidad (hipótesis de la razón-masa) y diversidad funcional (hipótesis de complementariedad de nichos). Encontramos que las tasas de funcionamiento del ecosistema cambiaron durante la sucesión, y que el factor más conducente fue la biomasa aérea para cada una de las funciones. La productividad de la biomasa aérea y hojarasca al igual que la descomposición real (in situ) de hojarasca aumentó con la biomasa de la vegetación inicial en pie, mientras que la descomposición potencial (ex situ) de hojarasca disminuyó con la biomasa en pie. Además, la productividad de la biomasa aumentó con la media ponderada
30544 Lohbeck-bk.indd 210 27-10-14 16:42

211
Resúmen
del área foliar específica y la descomposición potencial disminuyó con la media ponderada del contenido de materia seca en la hoja y aumentó con la divergencia funcional. Nuestros resultados empíricos muestran que la diversidad funcional y las medias ponderadas de las comunidades tienen importancia secundaria para explicar los cambios en las tasas de funciones ecosistémicas durante la sucesión del bosque tropical. Por el contrario, solamente la cantidad de vegetación en un sitio determinado es el mayor factor conducente de cambios, quizás debido al que el incremento acumulado de biomasa durante la sucesión encubre los efectos de las propiedades funcionales de la comunidad en las funciones del ecosistema.
Un creciente número de evidencias muestra que la biodiversidad podría no ser tan importante para una sola función del ecosistema sino que es específicamente importante para la multifuncionalidad del ecosistema ya que diferentes especies contribuyen a sus diferentes funciones. En el capítulo 7 evalué si es que de hecho las diferentes especies juegan un rol importante en diferentes funciones del ecosistema en un paisaje de bosque tropical bajo modificación humana. Cuantifiqué cinco funciones claves del ecosistema (biomasa aérea en pie, productividad de la biomasa, producción de hojarasca, descomposición de madera y descomposición de hojarasca) a nivel de paisaje, y evalué el grado en el que las especies individuales contribuyen a esto. Encontré que se requerían solo 2.5% - 14% de las especies para lograr al menos 50% de cada función del ecosistema, demostrando una fuerte saturación de relaciones entre la riqueza de especies y la función cumulativa del ecosistema. De igual manera, el pequeño subconjunto de especies importantes se sobreponen grandemente entre las diferentes funciones indicando el rol limitado de la biodiversidad para la multifuncionalidad del ecosistema. Mediante el uso de simulaciones demuestro que las relaciones entre la riqueza de especies y la función del ecosistema se torna linear cuando disminuye la dominancia de especies, sugiriendo que la biodiversidad se torna importante para la multifuncionalidad cuando existe una alta similitud.
En resumen, en esta tesis encontré que la diversidad funcional (el rango de diferentes rasgos funcionales) aumenta rápidamente y la composición funcional (valor promedio ponderado del rasgo funcional) cambia direccionalmente con la sucesión (capítulo 2 y 3). Estos reflejan filtros de hábitat cambiantes (gradientes medioambientales cambiantes que marcan la sucesión), y también un cambio gradual de filtros del hábitat hacia un incremento del efecto de la limitación en
30544 Lohbeck-bk.indd 211 27-10-14 16:42

212
la similitud de rasgos que es conducida por la competencia (capítulo 4 y 5). Tales cambios sucesionales sugieren fuertes cambios en las funciones del ecosistema, sin embargo, las tasas (in situ) de las funciones del ecosistema fueron explicados en primer lugar por la biomasa total presente más que por la biodiversidad o las propiedades de los rasgos funcionales de bosques secundarios (capítulo 6). Cuando se evaluó la identidad de especies más conducentes de las funciones del ecosistema encontré que las diferentes funciones fueron grandemente afectadas por las mismas especies (dominantes), implicando un efecto limitado de la biodiversidad para la multifuncionalidad en un momento dado en el tiempo. Esto sugiere que la biodiversidad es principalmente importante para el mantenimiento de ecosistemas multifuncionales a escalas temporales y espaciales (capítulo 7).
Siendo la deforestación la mayor amenaza de los bosques naturales y de la biodiversidad, reconozco que el bosque secundario es generalmente un pobre sustituto del bosque maduro. No obstante, muestro que la recuperación no asistida del bosque mediante la sucesión natural puede ser rápida y puede contribuir considerablemente al mantenimiento de la biodiversidad, estrategias funcionales y funciones del ecosistema. En tanto, mientras la protección de las extensiones remanentes de bosque maduro resulta vital, los bosques secundarios son componentes claves de la multifuncionalidad de los paisajes bajo modificación humana donde las sinergias entre biodiversidad, funciones y servicios eco-sistémicas pueden ser optimizados.
30544 Lohbeck-bk.indd 212 27-10-14 16:42

Acknowledgements
30544 Lohbeck-bk.indd 213 27-10-14 16:42

214
Doing a PhD was really a wonderful journey, with many things learnt, both sci-entifically and personally. It was also a journey that I could not have completed alone. Therefore, I take this opportunity to thank the people that have helped and supported me along the way, each within their own capacities and in their unique ways.
I start with thanking my team of supervisors, all three have been closely involved with the research progress and with my growth as a researcher: Frans Bongers, Lourens Poorter and Miguel Martínez-Ramos.
Frans, you have supervised me from my MSc theses onwards and I feel very fortunate to have worked with you. Thank you for your trust when giving me the chance to do this PhD. Your enthusiasm, personal involvement and critical attitude really stimulated me to further explore my research interests and to make the most out of it.
Lourens, thank you for your unfailing support. Numerous times you gave me the right advice at exactly the right moment. Your endless enthusiasm gave me the energy to continue working on those aspects of the research that I was ready to give up on.
Miguel, after a brainstorm with you I am always enlightened and full of new ideas. Thank you too for hosting me at the CIEco where I found inspiring and supportive colleagues that helped me with my research but also gave me friendship and made me feel at home.
Several exciting and interesting workshops did not only take me to beautiful places but also introduced me to groups of truly enthusiastic and inspiring people whose ideas have really shaped my learning progress throughout my research. For this I am grateful to Patty Balvanera, coordinator of the Mexican ReSerBos project (Recuperación de Servicios ecosistémicos en Bosques secundarios; translated into recovery of ecosystem services in secondary forest) and to Robin Chazdon, coordinator of the international NeoSelvas project (forest recovery through secondary succession in the Neotropics). Robin, your passion for secondary forests greatly motivated me when working on this thesis.
A word of thanks also goes to Jorge Rodriguez-Velázques who’s technical skills have kept many years of data together in what has now become a truly large and valuable dataset of Chajul’s secondary forests.
30544 Lohbeck-bk.indd 214 27-10-14 16:42

215
Acknowledgements
El trabajo de campo no hubiera sido posible sin el esfuerzo de Gilberto Jampangape García. Él es nuestro colaborador local en el pueblo de Loma Bonita y está siempre disponible para ayudar. ¡Gilberto, agradezco todo lo que haces para el proyecto, y todo lo que has hecho para ayudar mi trabajo de campo! Gracias por tu paciencia con mi español en mi primera visita. Doy también gracias a los otros colaboradores y asistentes de campo: Pascual, Miguel, Audon, Fermín y Adolfo. Además agradezco a toda la comunidad de Loma Bonita por hacerme sentir bienvenida en mi tiempo de trabajo de campo. Sobre todo gracias a los niños y niñas, quienes forman la alegría del pueblo, y quienes siempre vinieron de visita.
I am also very grateful to the Mexican colleagues working at the Nizanda dry forest research site: Jorge Meave, Eduardo Pérez-García, Edwin Lebrija-Trejos, Eunice Romero and Marco Romero. Thanks for allowing me to use the data and for your very insightful comments. Specifically Jorge Meave has been of great help in the interpretation of the results. Further I thank the people of Nizanda village, in particular Dino and Claudia Reyes for their hospitality when visiting them in 2013.
The Forest Ecology and Management chairgroup has been a very inspiring working environment for me, thanks to the staff and PhD students: Paul, Addisalem, Helen, Peter G, Peter vd S, Peter S, Mart, Catarina, Merel, Linar, Canisius, Kwame, Kathelyn, Estela, Masha, Marlene, Tiep, Lu, Monique, Lennart, Geovana, Abeje, Tefera, Emiru, Motuma, Gustavo, Jean, Gabriel, Lucy, Pieter, Frank, Frits, Marielos, Leo, Vency, Ute, Britta, Ellen, Jan, Danaë, and Patrick. I have really enjoyed the coffee breaks (with or without pie) with interesting discussions about science and other aspects of life, and the numerous get-togethers we have had over the years. Thank you Joke for always reminding us of our administrative duties as well as explaining (over and over) again how they work. Special thanks to Merel and Danaë for helping me fixing my R-codes, to Marlene and Estela for helping me translate my summary into Spanish. And, off course thanks to Masha and Catarina for being great paranymphs!
I would like to thank the MSc students I supervised and who contributed to the data-collection for this project: Maria Moretti, Judith Westveer and Leonie Schönbeck. In particular I thank Maria and Judith for making the 2011 fieldwork in Mexico very enjoyable and productive.
30544 Lohbeck-bk.indd 215 27-10-14 16:42

216
During my time at the CIEco in Mexico some people in particular have really contributed to making me feel at home: muchas gracias a Victor & Yashua, Alejandra & Romeo, Susana, Arturo, Pachi, Angela, Margarita, Rojo, Aline & Salomon, Saul and Pauloc.
I am grateful to Mayra Gavito for helping me with the arrangement of chemical analyses on many samples and allowing the use of her lab. I also greatly acknowledge the assistance of Maribel Nava Mendoza, Ana Lidia Sandoval Pérez, Cruz Teresa Arredondo Torres and Eloy Rubicel Pat López with the nutrient analyses. Thanks also to Horacio Paz for the many fruitful and stimulating discussions we have had throughout the years.
A couple of very good friends have really contributed to keeping the symptoms of (what we ended up calling) ‘the PhD-disease’ to a minimum. Ghislaine, Karin and Renske: your friendships mean a lot to me.
I am grateful to my parents Helene and Wim; throughout my life I have been blessed with your love and support, which made me who I am today. I also thank my sisters Sjoukje and especially Evelien who designed the beautiful cover of this thesis.
To Bas; I cannot imagine how I would have managed without you. Thanks for always being there for me.
30544 Lohbeck-bk.indd 216 27-10-14 16:42

217
Short biography
Madelon Lohbeck was born on the 29th of January 1985 in Aberdeen (United Kingdom). Madelon attended the Sint Josef primary school in Nootdorp (1989-1997) and the Stanislas college in Delft (1997-2003). After that, she spent one year travelling in Australia and New Zealand including a 2 month high school exchange in Athelstone, South Australia.
From 2004 to 2010 she studied at Wageningen University where she completed her BSc in Biology, with a minor in Environmental Policy, and two MSc’s, one in Biology, with a minor in Education for Sustainable Development, and the other in Forest and Nature Conservation (both cum laude). During her university degrees Madelon has been active as a volunteer coordinator for Greenpeace and as a nature guide for the Waddenvereniging, doing communication-related activities and environmental awareness raising. She was selected to participate in a field course in Kenya on savannah dynamics with the Tropical Biology Association in 2007. Madelon did an internship at the Kenya Forestry Research Institute (KEFRI) on the topic of plant conservation under the Millennium Seed Banking Project, in Kenya.
It was during the MSc theses in 2008-2009 that she for the first time carried out fieldwork in the tropical forest of Mexico (and learned Spanish). After writing her MSc. theses “Functional diversity changes during secondary forest succession” and “Environmental filtering and functional trait changes during secondary forest succession”, she was challenged to continue to seek answers to the many questions left unanswered. In 2011 she started her PhD thesis at Wageningen University, in collaboration with the Centro de Investigaciones en Ecosistemas (CIEco) of the Universidad Nacional Autónoma de México (UNAM, Mexico). During the PhD she participated in several international collaborations, and she presented her work at international congresses (notably those of the Association for Tropical Biology and Conservation). This trajectory (Jan 2011- Dec 2014) led to the PhD thesis named “Functional ecology of tropical forest recovery” you now hold in your hands.
30544 Lohbeck-bk.indd 217 27-10-14 16:42

218
Madelon is interested in the role that tropical forests play inside dynamic human-modified landscapes and would like to continue studying this topic. In her free time Madelon enjoys walking or running in the forest. She further practices Vipassana meditation and together with her partner Bas Verschuuren tends a vegetable garden in Wageningen where they live.
30544 Lohbeck-bk.indd 218 27-10-14 16:42

219
List of publications
Published/ accepted articles
Lohbeck, M., L. Poorter, M. Martínez-Ramos, and F. Bongers. in press. Biomass is the main driver of changes in ecosystem process rates during tropical forest succession. Ecology.
Lohbeck, M., L. Poorter, M. Martínez-Ramos, J. Rodriguez-Valázquez, M. Van Breugel, and F. Bongers. 2014. Changing drivers of species dominance during tropical forest succession. Functional Ecology 28:1052-1058.
Lohbeck, M., L. Poorter, E. Lebrija-Trejos, M. Martínez-Ramos, J. A. Meave, H. Paz, E. A. Pérez-García, I. E. Romero-Pérez, A. Tauro, and F. Bongers. 2013. Successional changes in functional composition contrast for dry and wet tropical forest. Ecology 94:1211-1216.
Lohbeck, M., L. Poorter, H. Paz, L. Pla, M. van Breugel, M. Martínez-Ramos, and F. Bongers. 2012. Functional diversity changes during tropical forest succession. Perspectives in Plant Ecology, Evolution and Systematics 14:89-96.
Martínez-Ramos, M., L. Barraza, P. Balvanera, J. Benitez-Malvido, F. Bongers, A. Castillo Álvarez, A. D. Cuarón, G. Ibarra-Manriquez, H. Paz, A. Pérez-Jiménez, M. Quesada Avendaño, D. R. Pérez-Salicrup, G. A. Sanchez-Azofeifa, J. E. Schondube, K. Stoner, J. Alvarado Diaz, K. Boege, E. del-Val, M. E. Favila Carillo, I. Suazo-Ortuño, Luis Daniel Ávila-Cabadilla, M. Y. Á. Añorve, M. C. Ramírez, J. C. Mandujano, O. C. Badilla, E. I. d. l. Peña, A. C. Domínguez, M. d. C. G. Gutiérrez, A. P. G. Bonilla, A. M. G. D. Pierro, B. F. Durán, W. A. G. González, O. H. Ordoñez, M. Kaláscka, M. Lohbeck, A. López-Carretero, C. M. Ascencio, S. Maza-Villalobos, M. Méndez-Toribio, F. Mora-Ardila, C. M. Spitzer, C. B. P. Guerrero, L. F. P. Pérez, M. E. P. Pérez, F. P. García, A. R. Rocha, M. R. Ortega, J. Rodríguez-Velázquez, N. M. Schroeder, J. Trilleras-Motha, M. V. Breugel, P. V. d. Sleen, E. V. Galaviz, and I. Z. Hernández. 2012. Manejo de bosques tropicales: bases científicas para la conservación, restauración y provechamiento de ecosistemas en paisajes rurales. Investigación ambiental. Ciencia y Politica Publica 4(2): 111-129
30544 Lohbeck-bk.indd 219 27-10-14 16:42

220
Papers submitted
Letcher, S. G., J. R. Lasky, R. L. Chazdon, N. Norden, S. J. Wright, A. Andrade, J. L. Andrade-Torres, P. Balvanera, J. M. Becknell, T. V. Bentos, R. Bhaskar, F. Bongers, V. Boukili, P. H. S. Brancalion, R. G. César, D. A. Clark, D. B. Clark, D. Craven, A. DeFrancesco, J. M. Dupuy, B. Finegan, E. González-Jiménez, J. S. Hall, K. E. Harms, J. L. Hernández-Stefanoni, P. Hietz, D. Kennard, T. J. Killeen, S. G. Laurance, E. E. Lebrija-Trejos, M. Lohbeck, M. Martínez-Ramos, P. E. S. Massoca, J. A. Meave, R. C. G. Mesquita, F. Mora, R. Muñoz, R. Muscarella, H. Paz, E. A. Pérez-García, F. Pineda-García, J. S. Powers, R. Quesada-Monge, R. R. Rodrigues, I. E. Romero-Pérez, M. E. Sandor, L. Sanaphre-Villanueva, E. Schüller, N. G. Swenson, A. Tauro, M. Uriarte, M. v. Breugel, O. Vargas-Ramírez, R. A. G. Viani, A. Wendt, and G. B. Williamson. Environmental gradients and the evolution of successional habitat specialisation: a test case with 14 Neotropical forest sites. (submitted to Journal of Ecology)
Lohbeck, M., E. Lebrija-Trejos, M. Martinez-Ramos, J. A. Meave, L. Poorter, and F. Bongers. Functional trait strategies of trees in dry and wet tropical forests are similar but differ in their consequences for succession. (Submitted)
30544 Lohbeck-bk.indd 220 27-10-14 16:42

221
PE&RC Training and Education Statement
With the training and education activities listed below the PhD candidate has complied with the requirements set by the C.T. de Wit Graduate School for Production Ecology and Resource Conservation (PE&RC) which comprises of a minimum total of 32 ECTS (= 22 weeks of activities)
Review of literature (4.5 ECTS)- Causes and consequences of functional trait changes during tropical
forest succession; presented in the discussion group Ecological Theory and Applications (2012)
Writing of project proposal (4.5 ECTS)- The functional value of biodiversity; recovery of ecosystem processes during
secondary forest succession in Mexico (2010-2011)
Post-graduate courses (6 ECTS)- Statistics in R; PE&RC (2011)- Linear models; PE&RC (2011)- Mixed linear models; PE&RC (2011)- ALTERnet summer school on biodiversity and ecosystem services; ALTERnet
(2012)- Applying landscape ecology to biodiversity conservation; ATBC (2012)
Laboratory training and working visits (2 ECTS)- Recovery of ecosystem processes during succession; oral presentation;
Biocentre, University of Wurzburg, Germany (2013)- Recovery of ecosystem processes during succession; VU Amsterdam (2013)
Invited review of (unpublished) journal manuscript (2 ECTS)- Acta Oecologica (1); American Journal of Botany (1); Biotropica (3); Ecography
(1); Ecology (1); Forest Ecology and Management (1); Functional Ecology (1); Journal of Ecology (2); Perspectives in Plant Ecology, Evolution and Systematics (1); PlosOne (2); Society and Natural Resources (1); various topics (2011-2014)
30544 Lohbeck-bk.indd 221 27-10-14 16:42

222
Deficiency, refresh, brush-up courses (3 ECTS)- Spanish classes; skype with the Instituto Exclusivo in La Paz, Bolivia (2011-
2013)
Competence strengthening / skills courses (4.5 ECTS)- Editorial assistant PrometheusWiki a wiki for protocols, methods,
explanations and updates standards in Ecological and Environmental Plant Physiology; CSIRO (2011-2013)
- Stress identification and management; PE&RC (2013)- Writing press-releases workshop; WUR (2014)- Tropical plant families; Naturalis (2014)
PE&RC Annual meetings, seminars and the PE&RC weekend (2.1 ECTS)- NAEM Meeting (2011)- PE&RC Day (2011, 2013)- PE&RC Weekend; first year edition (2012)
Discussion groups / local seminars / other scientific meetings (7.5 ECTS)- WEES seminar: traits, fates and rates of dead wood; Hans Cornelissen (2011)- Conference Ecosystem Services Partnership: quantifying, mapping and
modelling ecosystem services (2011)- Plant-soil interactions (2011-2012)- R users discussion group (2011-2013)- Ecological theory and application (2011-2014)- FEM Journal club (2012-2014)- International meeting: ReSerBos network on the recovery of ecosystem
services with secondary succession in Mexico (2013)- Current Themes in Ecology 2013: the future of ecosystems, ecosystems for the
future (2013)- The search for tipping points in heterogeneous landscapes (2013)
International symposia, workshops and conferences (9 ECTS)- ATBC Brazil; oral presentation (2012)- International meeting: ReSerBos network on the recovery of ecosystem
services with secondary succession in Mexico; poster presentation (2012)- Congreso de Ecologia; oral Presentation; Villahermosa (2013)
30544 Lohbeck-bk.indd 222 27-10-14 16:42

223
PE&RC Training and Education Statement
- International meeting: Neoselvas network on secondary forest regeneration and restoration; oral presentation; La Bijagua, Costa Rica (2013)
- ATBC Costa Rica; poster presentation (2013)- International meeting: ReSerBos network on the recovery of ecosystem
services with secondary succession in Mexico; oral Presentation (2014)
Lecturing / supervision of practical‘s / tutorials (3 ECTS)- Advanced forest ecology and management (2011)- Curso Ecología y Conservacíon del Bosque Tropical Húmedo; Chajul
fieldstation, Mexico (2012)- Trends in forest and nature conservation (2013)- Ecological methods (2013)- Landscape ecology (2014)
Supervision of MSc students- Maria Moretti: Fine root functional traits- Judith Westveer: Decomposition processes- Leonie Schönbeck: Leaf hydraulics
30544 Lohbeck-bk.indd 223 27-10-14 16:42

The research described in this thesis was financially supported by Wageningen University
Cover design by Evelien Lohbeck: www.evelienlohbeck.com
Lay-out by Ferdinand van Nispen: www.citroenvlinder-dtp.nl
Financial support from Wageningen University for printing this thesis is gratefully acknowledged
Printed by GVO Drukkers & Vormgevers B.V.| Ponson & Looijen, Ede, The Netherlands
30544 Lohbeck-bk.indd 224 27-10-14 17:07


Functional ecology of tropical forest recovery
Madelon Lohbeck
Functional ecology of tropical forest recovery Madelon Lohbeck