The Neuroanatomy of Verbal Working Memory in Schizophrenia: A Voxel-Based Morphometry Study
Upload
satyawacanachristianuCategory
view
4download
0
Functional but not structural changes associated with learning:An exploration of longitudinal Voxel-Based Morphometry (VBM)
Adam G. Thomasa,*, Sean Marretta, Ziad S. Saadb, Douglas A. Ruffc, Alex Martind, and PeterA. Bandettinia,ea Functional MRI Facility, NIMH, Bethesda, MD, USAb Scientific and Statistical Computing Unit, NIMH, Bethesda, MD, USAc Department of Neurobiology, Harvard Medical School, Boston, MA, USAd Cognitive Neuropsychology Section, NIMH, Bethesda, MD, USAe Functional Imaging Methods Section, NIMH, Bethesda, MD, USA
AbstractVoxel-Based Morphometry (VBM) has been used for several years to study differences in brainstructure between populations. Recently, a longitudinal version of VBM has been used to showchanges in gray matter associated with relatively short periods of training. In the present study weuse fMRI and three different standard implementations of longitudinal VBM: SPM2, FSL, and SPM5to assess functional and structural changes associated with a simple learning task. Behavioral andfMRI data clearly showed a significant learning effect. However, initially positive VBM results werefound to be inconsistent across minor perturbations of the analysis technique and ultimately provedto be artifactual. When alignment biases were controlled for and recommended statistical procedureswere used, no significant changes in grey matter density were found. This work, initially intendedto show structural and functional changes with learning, rather demonstrates some of the potentialpitfalls of existing longitudinal VBM methods and prescribes that these tools be applied andinterpreted with extreme caution.
IntroductionAs early as 1960, researchers demonstrated that learning and experience could produceprofound changes in gross measures of brain morphology in rats such as brain weight andcortical thickness (Krech et al., 1960; Rosenzweig et al., 1972; Klintsova and Greenough,1999). Subsequently, it has been demonstrated that many aspects of brain structure and functioncan be modified by learning — including synaptic density, neural and glial cell size and ratio,vascularization, dendritic branching, fMRI activation, and neurotransmitter concentration(Black, et al., 1990; van Praag et al., 2000; Poldrack, 2000; Floyer-Lea et al., 2006). In somecases, these gross changes in brain structure can be detected after as little as 10 days of training(Kleim et al., 2007).
Recently, an adaptation of voxel-based morphology (VBM) has been introduced that attemptsto non-invasively measure longitudinal changes in gray matter density using MRI (Ashburner
* Corresponding author. Building 10, Rm 1D80, 10 Center Dr, Bethesda, MD 20815, USA. Fax: +1 301 402 1370. [email protected] (A.G.Thomas).Appendix A. Supplementary data: Supplementary data associated with this article can be found, in the online version, at doi:10.1016/j.neuroimage.2009.05.097.
NIH Public AccessAuthor ManuscriptNeuroimage. Author manuscript; available in PMC 2010 November 15.
Published in final edited form as:Neuroimage. 2009 October 15; 48(1): 117–125. doi:10.1016/j.neuroimage.2009.05.097.
NIH
-PA Author Manuscript
NIH
-PA Author Manuscript
NIH
-PA Author Manuscript
and Friston, 2000; Draganski et al., 2004). This within-group approach is statistically morepowerful and does not require the large number of subjects traditionally used in VBM studies.Using this approach Draganski et al. (2004) reported a localized 3% increase in gray matterdensity in MT after 3 months of juggling practice. Draganski et al. (2006) reported bothincreases and decreases in gray matter density associated with 3 months of studying for amedical exam. Most recently Ilg et al. (2008) reported gray matter and functional increases inright occipital cortex associated with 2 weeks of mirror-reading practice.
Many criticisms of VBM have been published since its introduction. Bookstein (2001),Davatzikos (2004) and Crum et al. (2003) are primarily concerned with the automated nonlinearregistration technique used by VBM and the potential problems in establishing functionalhomology between groups. (See Ashburner and Friston (2001) for a rebuttal to some of theseissues.) Although these critiques are focused on between group studies, they illustrate thatrelatively minor differences in brain anatomy or other initial conditions can have significanteffects on final results. While a difference in brain anatomy is not relevant in a longitudinaldesign, sensitivity to initial conditions such as field inhomogeneities may prove problematicfor both cross-sectional and longitudinal studies.
VBM analysis has recently been applied to diffusion tensor MRI (DT-MRI) where authorshave also found reason to be skeptical of the reproducibility of the technique. Jones et al.(2005) notes the large impact of different smoothing kernel sizes in the analysis of DT-MRIdata. They also note the lack of normality in the residual images hampering the ability to makestatistical inferences using parametric methods. Most recently, Jones et al. (2007) demonstratedthat ten different groups analyzing a common DT-MRI dataset using voxel-based methodsdrew widely disparate conclusions. This current state of controversy limits the conclusions onecan draw from VBM-based results in isolation. Because of these controversies, it is critical todemonstrate the reproducibility and convergence with other methods to establish the validityof VBM-based results.
In this work we use longitudinal VBM in combination with fMRI to explore functional andstructural changes associated with learning a simple visual–motor task. In contrast to otherlongitudinal VBM studies, subjects participated in both the control and the learning phase ofthe experiment thus controlling for false positives due to group differences. Since each subjectserves as his or her own control, this within-group approach provides an opportunity to explorethe robustness and sensitivity of longitudinal VBM that is independent from the problemsinherent in establishing homology between groups. We also explore the consistency oflongitudinal VBM results by comparing its implementation in three different softwarepackages: SPM2, FSL, and SPM5. We hypothesized that the regions which show learningrelated changes in functional activation should also demonstrate changes (either increases ordecreases) in gray matter density. We also hypothesized that these results should be consistentacross implementations of VBM.
MethodsSubjects
Twelve healthy, right-hand dominant subjects were included in this study. (mean age: 32.5years, range: 23–40, 6 men, 6 women). All gave informed consent according to a protocolapproved by the NIH IRB. Five other subjects were excluded due to poor quality scans ormissing scan sessions. All of the subjects analyzed participated in both the control and learningphases of the experiment.
Thomas et al. Page 2
Neuroimage. Author manuscript; available in PMC 2010 November 15.
NIH
-PA Author Manuscript
NIH
-PA Author Manuscript
NIH
-PA Author Manuscript
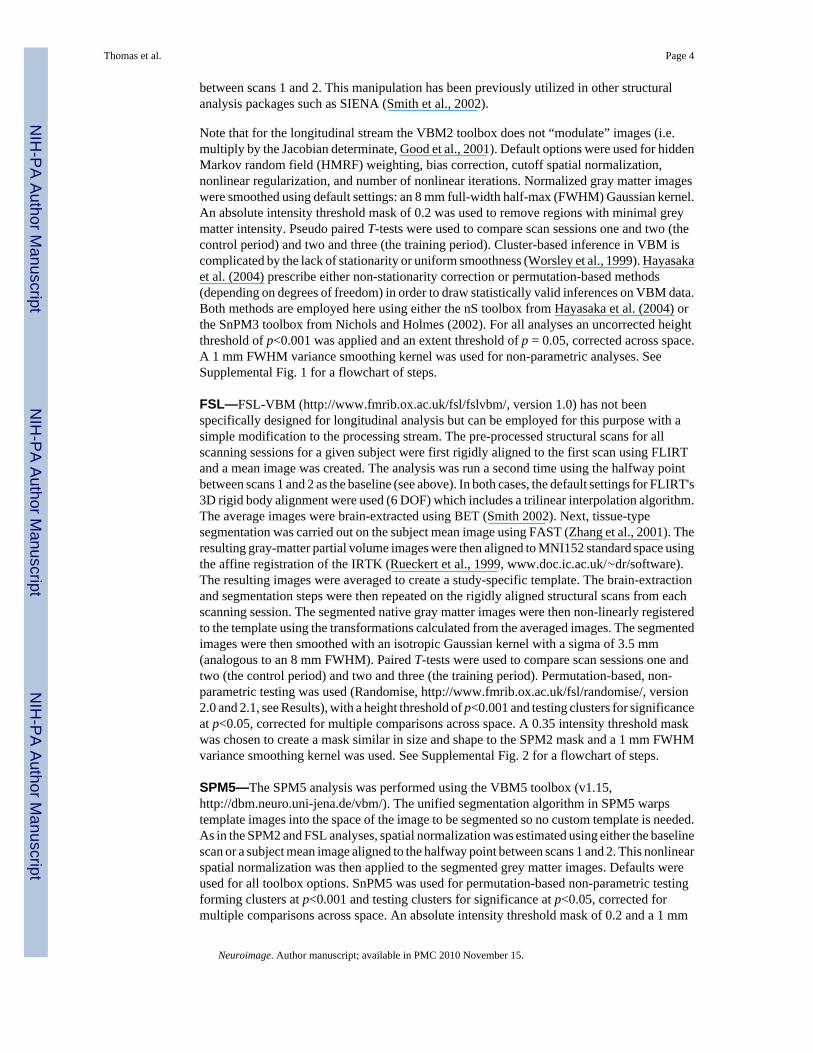
Training paradigmThe experimental paradigm is illustrated in Fig. 1. Subjects initially underwent a baselinestructural MRI scan (scan 1). After a two-week control period the subjects underwent a secondstructural MRI (scan 2) as well as four fMRI scans during which they alternatively performedthe mirror task and the control task (Fig. 1). The control task required the subject to follow arandomly moving white dot on the screen using a joystick held in the right hand. The mirrortask was identical to the control task except that the left–right axis of the joystick was reversed.After scan 2, subjects were trained on the mirror task for a total of 2.5 h over 2 weeks (six 25-minute training sessions). At the end of the training subjects received both structural andfunctional MRI scans identical to those in scan 2. Eight subjects performed the experiment ina continuous four-week block. Four subjects had an interval of 2 to 12 weeks (mean 44.5 days)between the control and learning phase of the experiment. An extra scanning session wasconducted on these subjects at the beginning of the two-week learning phase to serve as abaseline for the learning comparison. Thus, all comparisons on all subjects were over a two-week period.
Scanning protocolAll scans were collected on a 3 T General Electric (GE, HDx 14M3) Scanner using a GE eight-channel head coil. Structural scans consisted of two FSPGR scans (256 × 256, 124 slices, 0.85× 0.85 × 1.2 mm voxels, TI = 400 ms, TE = ∼5 ms). Functional scans consisted of four axialEPI time series (64 × 64, 38 slices, 3.2 × 3.2 × 3.2 mm voxels, TR = 2.5, TE = 30). Each ofthe four 6-minute scans employed a block design of alternating 30-second periods ofperforming one of the two tasks with 30 seconds of fixation. Order of task presentation wascounterbalanced across subjects.
Functional analysesThe first level of fMRI analysis combined like sessions and produced parameter estimates foreach subject's activation compared to baseline in each task. This was carried out using FEAT(FMRI Expert Analysis Tool) Version 5.63, part of FSL (FMRIB's Software Library,www.fmrib.ox.ac.uk/fsl). A second higher level analysis performed a paired T-test to comparesubject's activation before and after training. This was carried out using FLAME (FMRIB'sLocal Analysis of Mixed Effects) stage 1 only (Beckmann et al., 2003, Woolrich et al.,2004). Z-statistic images were thresholded using clusters determined by Z>3.5 and a(corrected) cluster significance threshold of p = 0.05 (Worsley et al., 1992).
Structural analysesPre-processing—For each scanning session the two FSPGR images were rigidly alignedusing a motion-correction algorithm from either SPM2, FSL, or SPM5 and averaged together.In order to correct for image inhomogeneities, intensity bias correction was performed on theaverage images using four iterations of the N3 algorithm (MINC Tools, Sled et al., 1998).
SPM2—The SPM2 analysis was performed in Matlab 7.4 using the VBM2 toolbox (v1.07,http://dbm.neuro.uni-jena.de/vbm/) which implements an optimized VBM pipeline(Ashburner and Friston 2000; Good et al., 2001). The first scan of each subject was used asthe “baseline” to create a custom gray matter template. All structural scans for a given subjectwere fed through the longitudinal analysis pipeline of the VBM2 toolbox such that the firstscan was used as the source for spatial normalization (piecewise linear). The analysis was alsorepeated using the scan immediately before training as the baseline for the template and thesource for spatial normalization. A third iteration was performed using the subject's meanimage aligned to the halfway point between scans 1 and 2 as the baseline. The halfway pointwas determined by taking the square root of the alignment transformation (rigid, 6 DOF)
Thomas et al. Page 3
Neuroimage. Author manuscript; available in PMC 2010 November 15.
NIH
-PA Author Manuscript
NIH
-PA Author Manuscript
NIH
-PA Author Manuscript
between scans 1 and 2. This manipulation has been previously utilized in other structuralanalysis packages such as SIENA (Smith et al., 2002).
Note that for the longitudinal stream the VBM2 toolbox does not “modulate” images (i.e.multiply by the Jacobian determinate, Good et al., 2001). Default options were used for hiddenMarkov random field (HMRF) weighting, bias correction, cutoff spatial normalization,nonlinear regularization, and number of nonlinear iterations. Normalized gray matter imageswere smoothed using default settings: an 8 mm full-width half-max (FWHM) Gaussian kernel.An absolute intensity threshold mask of 0.2 was used to remove regions with minimal greymatter intensity. Pseudo paired T-tests were used to compare scan sessions one and two (thecontrol period) and two and three (the training period). Cluster-based inference in VBM iscomplicated by the lack of stationarity or uniform smoothness (Worsley et al., 1999). Hayasakaet al. (2004) prescribe either non-stationarity correction or permutation-based methods(depending on degrees of freedom) in order to draw statistically valid inferences on VBM data.Both methods are employed here using either the nS toolbox from Hayasaka et al. (2004) orthe SnPM3 toolbox from Nichols and Holmes (2002). For all analyses an uncorrected heightthreshold of p<0.001 was applied and an extent threshold of p = 0.05, corrected across space.A 1 mm FWHM variance smoothing kernel was used for non-parametric analyses. SeeSupplemental Fig. 1 for a flowchart of steps.
FSL—FSL-VBM (http://www.fmrib.ox.ac.uk/fsl/fslvbm/, version 1.0) has not beenspecifically designed for longitudinal analysis but can be employed for this purpose with asimple modification to the processing stream. The pre-processed structural scans for allscanning sessions for a given subject were first rigidly aligned to the first scan using FLIRTand a mean image was created. The analysis was run a second time using the halfway pointbetween scans 1 and 2 as the baseline (see above). In both cases, the default settings for FLIRT's3D rigid body alignment were used (6 DOF) which includes a trilinear interpolation algorithm.The average images were brain-extracted using BET (Smith 2002). Next, tissue-typesegmentation was carried out on the subject mean image using FAST (Zhang et al., 2001). Theresulting gray-matter partial volume images were then aligned to MNI152 standard space usingthe affine registration of the IRTK (Rueckert et al., 1999, www.doc.ic.ac.uk/∼dr/software).The resulting images were averaged to create a study-specific template. The brain-extractionand segmentation steps were then repeated on the rigidly aligned structural scans from eachscanning session. The segmented native gray matter images were then non-linearly registeredto the template using the transformations calculated from the averaged images. The segmentedimages were then smoothed with an isotropic Gaussian kernel with a sigma of 3.5 mm(analogous to an 8 mm FWHM). Paired T-tests were used to compare scan sessions one andtwo (the control period) and two and three (the training period). Permutation-based, non-parametric testing was used (Randomise, http://www.fmrib.ox.ac.uk/fsl/randomise/, version2.0 and 2.1, see Results), with a height threshold of p<0.001 and testing clusters for significanceat p<0.05, corrected for multiple comparisons across space. A 0.35 intensity threshold maskwas chosen to create a mask similar in size and shape to the SPM2 mask and a 1 mm FWHMvariance smoothing kernel was used. See Supplemental Fig. 2 for a flowchart of steps.
SPM5—The SPM5 analysis was performed using the VBM5 toolbox (v1.15,http://dbm.neuro.uni-jena.de/vbm/). The unified segmentation algorithm in SPM5 warpstemplate images into the space of the image to be segmented so no custom template is needed.As in the SPM2 and FSL analyses, spatial normalization was estimated using either the baselinescan or a subject mean image aligned to the halfway point between scans 1 and 2. This nonlinearspatial normalization was then applied to the segmented grey matter images. Defaults wereused for all toolbox options. SnPM5 was used for permutation-based non-parametric testingforming clusters at p<0.001 and testing clusters for significance at p<0.05, corrected formultiple comparisons across space. An absolute intensity threshold mask of 0.2 and a 1 mm
Thomas et al. Page 4
Neuroimage. Author manuscript; available in PMC 2010 November 15.
NIH
-PA Author Manuscript
NIH
-PA Author Manuscript
NIH
-PA Author Manuscript
FWHM variance smoothing kernel were used. All results reported are corrected on the clusterlevel. See Supplemental Fig. 3 for a flowchart of steps.
ResultsBehavior
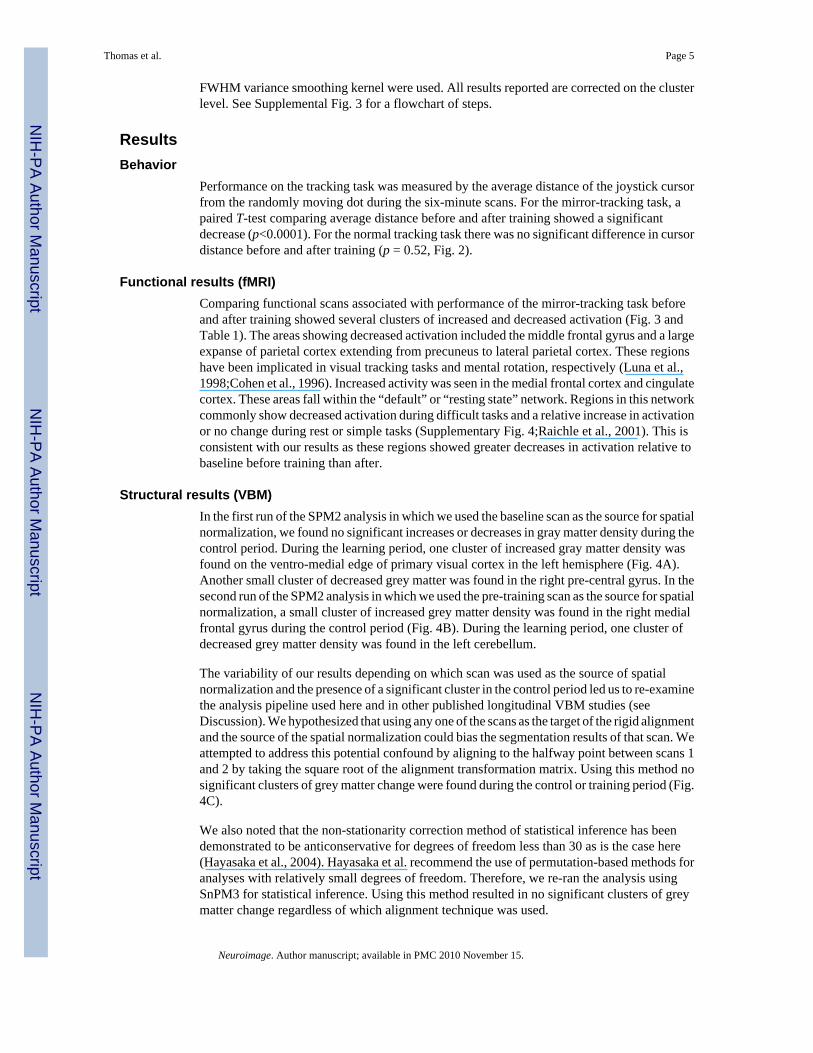
Performance on the tracking task was measured by the average distance of the joystick cursorfrom the randomly moving dot during the six-minute scans. For the mirror-tracking task, apaired T-test comparing average distance before and after training showed a significantdecrease (p<0.0001). For the normal tracking task there was no significant difference in cursordistance before and after training (p = 0.52, Fig. 2).
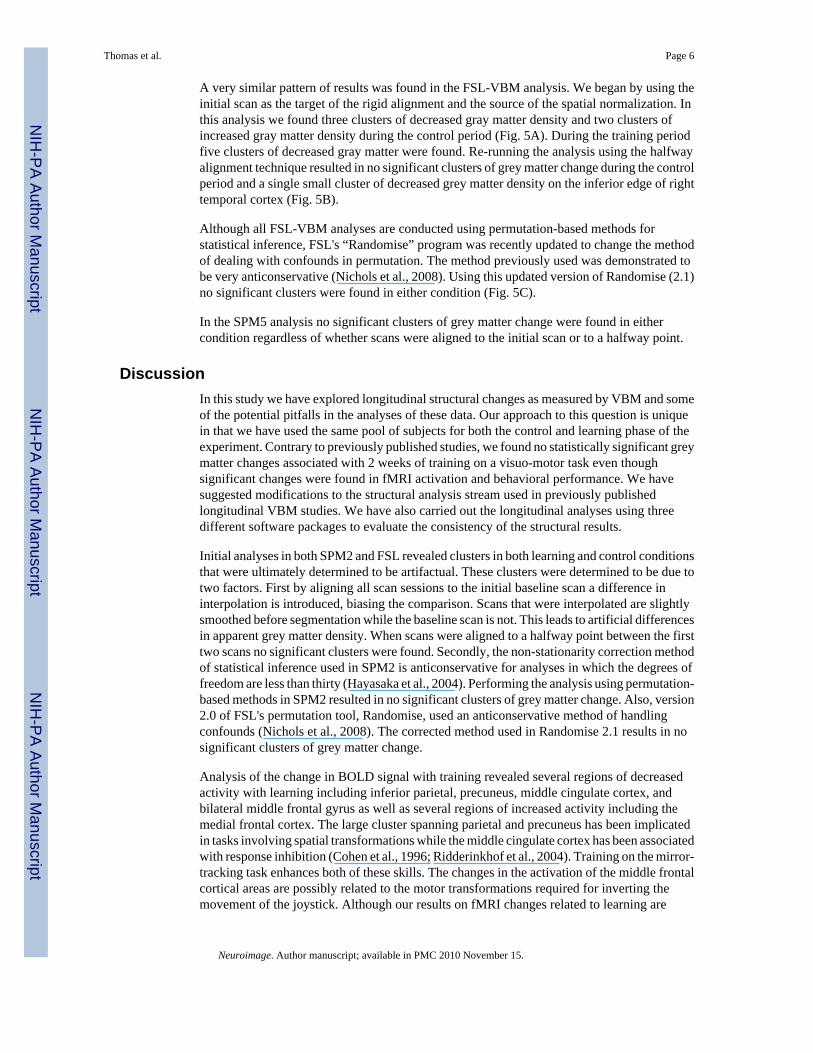
Functional results (fMRI)Comparing functional scans associated with performance of the mirror-tracking task beforeand after training showed several clusters of increased and decreased activation (Fig. 3 andTable 1). The areas showing decreased activation included the middle frontal gyrus and a largeexpanse of parietal cortex extending from precuneus to lateral parietal cortex. These regionshave been implicated in visual tracking tasks and mental rotation, respectively (Luna et al.,1998;Cohen et al., 1996). Increased activity was seen in the medial frontal cortex and cingulatecortex. These areas fall within the “default” or “resting state” network. Regions in this networkcommonly show decreased activation during difficult tasks and a relative increase in activationor no change during rest or simple tasks (Supplementary Fig. 4;Raichle et al., 2001). This isconsistent with our results as these regions showed greater decreases in activation relative tobaseline before training than after.
Structural results (VBM)In the first run of the SPM2 analysis in which we used the baseline scan as the source for spatialnormalization, we found no significant increases or decreases in gray matter density during thecontrol period. During the learning period, one cluster of increased gray matter density wasfound on the ventro-medial edge of primary visual cortex in the left hemisphere (Fig. 4A).Another small cluster of decreased grey matter was found in the right pre-central gyrus. In thesecond run of the SPM2 analysis in which we used the pre-training scan as the source for spatialnormalization, a small cluster of increased grey matter density was found in the right medialfrontal gyrus during the control period (Fig. 4B). During the learning period, one cluster ofdecreased grey matter density was found in the left cerebellum.
The variability of our results depending on which scan was used as the source of spatialnormalization and the presence of a significant cluster in the control period led us to re-examinethe analysis pipeline used here and in other published longitudinal VBM studies (seeDiscussion). We hypothesized that using any one of the scans as the target of the rigid alignmentand the source of the spatial normalization could bias the segmentation results of that scan. Weattempted to address this potential confound by aligning to the halfway point between scans 1and 2 by taking the square root of the alignment transformation matrix. Using this method nosignificant clusters of grey matter change were found during the control or training period (Fig.4C).
We also noted that the non-stationarity correction method of statistical inference has beendemonstrated to be anticonservative for degrees of freedom less than 30 as is the case here(Hayasaka et al., 2004). Hayasaka et al. recommend the use of permutation-based methods foranalyses with relatively small degrees of freedom. Therefore, we re-ran the analysis usingSnPM3 for statistical inference. Using this method resulted in no significant clusters of greymatter change regardless of which alignment technique was used.
Thomas et al. Page 5
Neuroimage. Author manuscript; available in PMC 2010 November 15.
NIH
-PA Author Manuscript
NIH
-PA Author Manuscript
NIH
-PA Author Manuscript
A very similar pattern of results was found in the FSL-VBM analysis. We began by using theinitial scan as the target of the rigid alignment and the source of the spatial normalization. Inthis analysis we found three clusters of decreased gray matter density and two clusters ofincreased gray matter density during the control period (Fig. 5A). During the training periodfive clusters of decreased gray matter were found. Re-running the analysis using the halfwayalignment technique resulted in no significant clusters of grey matter change during the controlperiod and a single small cluster of decreased grey matter density on the inferior edge of righttemporal cortex (Fig. 5B).
Although all FSL-VBM analyses are conducted using permutation-based methods forstatistical inference, FSL's “Randomise” program was recently updated to change the methodof dealing with confounds in permutation. The method previously used was demonstrated tobe very anticonservative (Nichols et al., 2008). Using this updated version of Randomise (2.1)no significant clusters were found in either condition (Fig. 5C).
In the SPM5 analysis no significant clusters of grey matter change were found in eithercondition regardless of whether scans were aligned to the initial scan or to a halfway point.
DiscussionIn this study we have explored longitudinal structural changes as measured by VBM and someof the potential pitfalls in the analyses of these data. Our approach to this question is uniquein that we have used the same pool of subjects for both the control and learning phase of theexperiment. Contrary to previously published studies, we found no statistically significant greymatter changes associated with 2 weeks of training on a visuo-motor task even thoughsignificant changes were found in fMRI activation and behavioral performance. We havesuggested modifications to the structural analysis stream used in previously publishedlongitudinal VBM studies. We have also carried out the longitudinal analyses using threedifferent software packages to evaluate the consistency of the structural results.
Initial analyses in both SPM2 and FSL revealed clusters in both learning and control conditionsthat were ultimately determined to be artifactual. These clusters were determined to be due totwo factors. First by aligning all scan sessions to the initial baseline scan a difference ininterpolation is introduced, biasing the comparison. Scans that were interpolated are slightlysmoothed before segmentation while the baseline scan is not. This leads to artificial differencesin apparent grey matter density. When scans were aligned to a halfway point between the firsttwo scans no significant clusters were found. Secondly, the non-stationarity correction methodof statistical inference used in SPM2 is anticonservative for analyses in which the degrees offreedom are less than thirty (Hayasaka et al., 2004). Performing the analysis using permutation-based methods in SPM2 resulted in no significant clusters of grey matter change. Also, version2.0 of FSL's permutation tool, Randomise, used an anticonservative method of handlingconfounds (Nichols et al., 2008). The corrected method used in Randomise 2.1 results in nosignificant clusters of grey matter change.
Analysis of the change in BOLD signal with training revealed several regions of decreasedactivity with learning including inferior parietal, precuneus, middle cingulate cortex, andbilateral middle frontal gyrus as well as several regions of increased activity including themedial frontal cortex. The large cluster spanning parietal and precuneus has been implicatedin tasks involving spatial transformations while the middle cingulate cortex has been associatedwith response inhibition (Cohen et al., 1996; Ridderinkhof et al., 2004). Training on the mirror-tracking task enhances both of these skills. The changes in the activation of the middle frontalcortical areas are possibly related to the motor transformations required for inverting themovement of the joystick. Although our results on fMRI changes related to learning are
Thomas et al. Page 6
Neuroimage. Author manuscript; available in PMC 2010 November 15.
NIH
-PA Author Manuscript
NIH
-PA Author Manuscript
NIH
-PA Author Manuscript
statistically strong, they are challenging to interpret due to potential changes in the subjects'strategy or changes in the relative difficulty of the task. Most fMRI studies of learning sufferfrom similar difficulties (Poldrack, 2000).
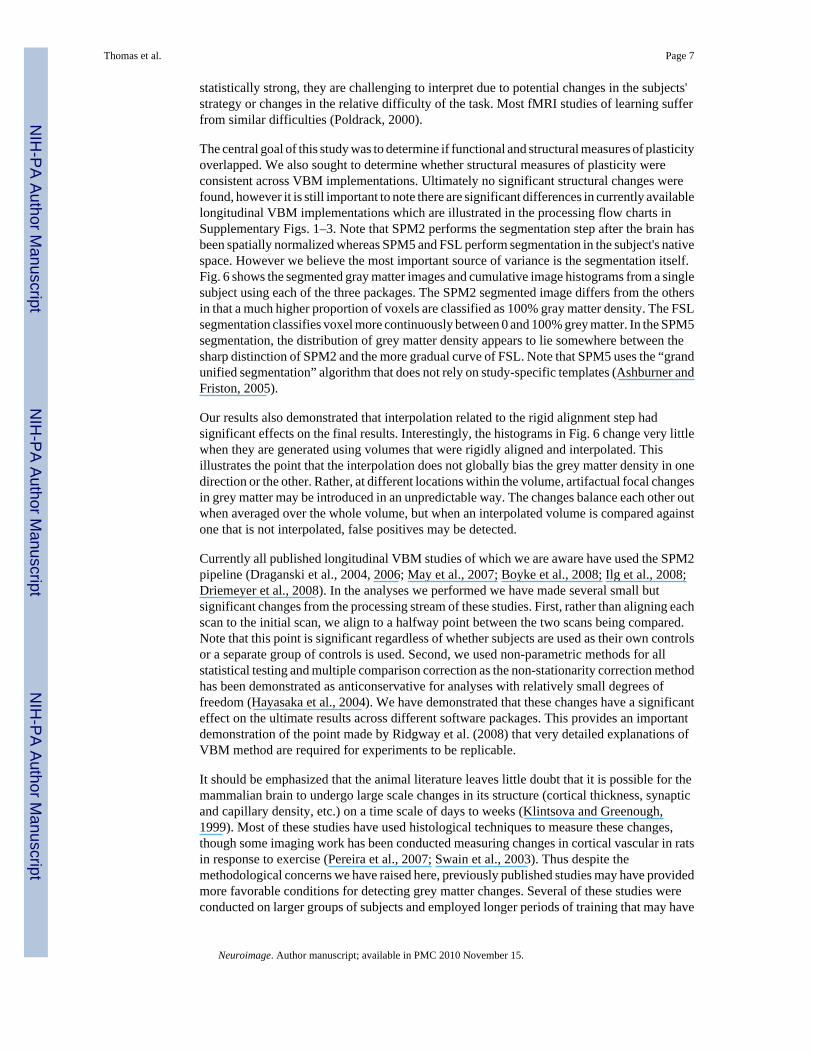
The central goal of this study was to determine if functional and structural measures of plasticityoverlapped. We also sought to determine whether structural measures of plasticity wereconsistent across VBM implementations. Ultimately no significant structural changes werefound, however it is still important to note there are significant differences in currently availablelongitudinal VBM implementations which are illustrated in the processing flow charts inSupplementary Figs. 1–3. Note that SPM2 performs the segmentation step after the brain hasbeen spatially normalized whereas SPM5 and FSL perform segmentation in the subject's nativespace. However we believe the most important source of variance is the segmentation itself.Fig. 6 shows the segmented gray matter images and cumulative image histograms from a singlesubject using each of the three packages. The SPM2 segmented image differs from the othersin that a much higher proportion of voxels are classified as 100% gray matter density. The FSLsegmentation classifies voxel more continuously between 0 and 100% grey matter. In the SPM5segmentation, the distribution of grey matter density appears to lie somewhere between thesharp distinction of SPM2 and the more gradual curve of FSL. Note that SPM5 uses the “grandunified segmentation” algorithm that does not rely on study-specific templates (Ashburner andFriston, 2005).
Our results also demonstrated that interpolation related to the rigid alignment step hadsignificant effects on the final results. Interestingly, the histograms in Fig. 6 change very littlewhen they are generated using volumes that were rigidly aligned and interpolated. Thisillustrates the point that the interpolation does not globally bias the grey matter density in onedirection or the other. Rather, at different locations within the volume, artifactual focal changesin grey matter may be introduced in an unpredictable way. The changes balance each other outwhen averaged over the whole volume, but when an interpolated volume is compared againstone that is not interpolated, false positives may be detected.
Currently all published longitudinal VBM studies of which we are aware have used the SPM2pipeline (Draganski et al., 2004, 2006; May et al., 2007; Boyke et al., 2008; Ilg et al., 2008;Driemeyer et al., 2008). In the analyses we performed we have made several small butsignificant changes from the processing stream of these studies. First, rather than aligning eachscan to the initial scan, we align to a halfway point between the two scans being compared.Note that this point is significant regardless of whether subjects are used as their own controlsor a separate group of controls is used. Second, we used non-parametric methods for allstatistical testing and multiple comparison correction as the non-stationarity correction methodhas been demonstrated as anticonservative for analyses with relatively small degrees offreedom (Hayasaka et al., 2004). We have demonstrated that these changes have a significanteffect on the ultimate results across different software packages. This provides an importantdemonstration of the point made by Ridgway et al. (2008) that very detailed explanations ofVBM method are required for experiments to be replicable.
It should be emphasized that the animal literature leaves little doubt that it is possible for themammalian brain to undergo large scale changes in its structure (cortical thickness, synapticand capillary density, etc.) on a time scale of days to weeks (Klintsova and Greenough,1999). Most of these studies have used histological techniques to measure these changes,though some imaging work has been conducted measuring changes in cortical vascular in ratsin response to exercise (Pereira et al., 2007; Swain et al., 2003). Thus despite themethodological concerns we have raised here, previously published studies may have providedmore favorable conditions for detecting grey matter changes. Several of these studies wereconducted on larger groups of subjects and employed longer periods of training that may have
Thomas et al. Page 7
Neuroimage. Author manuscript; available in PMC 2010 November 15.
NIH
-PA Author Manuscript
NIH
-PA Author Manuscript
NIH
-PA Author Manuscript
resulted in more dramatic grey matter changes. Nonetheless the contrary findings reported hereand the demonstrated susceptibility of longitudinal VBM to false positives warrants a morecareful examination of these methods. The development of a standard and robust method ofinvestigating within-subject structural brain change remains an important challenge.
In an effort to help produce such a standard, all of the raw data used in this experiment will bemade available on the SUMS database at Washington University (Dickson et al., 2001;http://sumsdb.wustl.edu/sums/directory.do?id=6694686). We encourage other researchers todownload these data and reanalyze them with novel methods. It is possible that multivariateanalysis techniques may prove more sensitive than traditional univariate analysis. Some ofthese methods have already been employed on cross-sectional VBM data (Kloppel et al.,2008; Kawasaki et al., 2007). Future studies might employ focused, higher resolution scanningor more targeted pulse sequences to obtain a more detailed picture of underlying changes(Swain et al., 2003; van der Kouwe et al., 2008). We are confident that these techniques incombination with rigorous statistical controls will one day make in vivo measurement of humanbrain structure possible, opening up an entirely new technique in the study of learning andmemory.
Supplementary MaterialRefer to Web version on PubMed Central for supplementary material.
AcknowledgmentsThis work was supported by the NIMH Intramural Research Program. This study utilized the high-performancecomputational capabilities of the Biowulf Linux cluster at the National Institutes of Health, Bethesda, MD(http://biowulf.nih.gov). The authors would like to acknowledge comments and assistance from Rasmus Birn, GangChen, Dan Handwerker, David McMahon, Kevin Murphy, Allison Nugent, and Regina Nuzzo.
ReferencesAshburner J, Friston KJ. Voxel-based morphometry—the methods. NeuroImage 2000;11:805–821.
[PubMed: 10860804]Ashburner J, Friston KJ. Why voxel-based morphometry should be used. NeuroImage 2001;14:1238–
1243. [PubMed: 11707080]Ashburner J, Friston KJ. Unified segmentation. NeuroImage 2005;26:839–851. [PubMed: 15955494]Beckmann CF, Jenkinson M, Smith SM. General multilevel linear modeling for group analysis in FMRI.
NeuroImage 2003;20:1052–1063. [PubMed: 14568475]Black JE, Isaacs KR, Anderson BJ, Alcantara AA, Greenough WT. Learning causes synaptogenesis,
whereas motor activity causes angiogenesis, in cerebellar cortex of adult rats. Proc Natl Acad Sci US A 1990;87:5568–5572. [PubMed: 1695380]
Bookstein FL. “Voxel-based morphometry” should not be used with imperfectly registered images.NeuroImage 2001;14:1454–1462. [PubMed: 11707101]
Boyke J, Driemeyer J, Gaser C, Buechel C, May A. Training-induced brain structure changes in theelderly. J Neurosci 2008;28:7031–7035. [PubMed: 18614670]
Cohen MS, Kosslyn SM, Breiter HC, DiGirolamo GJ, Thompson WL, Anderson AK, Bookheimer SY,Rosen BR, Belliveau JW. Changes in cortical activity during mental rotation — a mapping study usingfunctional MRI. Brain 1996;119:89–100. [PubMed: 8624697]
Cox RW. AFNI: software for analysis and visualization of functional magnetic resonance neuroimages.Comput Biomed Res 1996;29:162–173. [PubMed: 8812068]
Crum WR, Griffin LD, Hill DL, Hawkes DJ. Zen and the art of medical image registration:correspondence, homology, and quality. NeuroImage 2003;20:1425–1437. [PubMed: 14642457]
Davatzikos C. Why voxel-based morphometric analysis should be used with great caution whencharacterizing group differences. NeuroImage 2004;23:17–20. [PubMed: 15325347]
Thomas et al. Page 8
Neuroimage. Author manuscript; available in PMC 2010 November 15.
NIH
-PA Author Manuscript
NIH
-PA Author Manuscript
NIH
-PA Author Manuscript
Dickson J, Drury H, Van Essen DC. ‘The surface management system’ (SuMS) database: a surface-baseddatabase to aid cortical surface reconstruction, visualization and analysis. Philos Trans R Soc Lond,B Biol Sci 2001;356:1277–1292. [PubMed: 11545703]
Draganski B, Gaser C, Busch V, Schuierer G, Bogdahn U, May A. Neuroplasticity: changes in grey matterinduced by training — newly honed juggling skills show up as a transient feature on a brain-imagingscan. Nature 2004;427:311–312. [PubMed: 14737157]
Draganski B, Gaser C, Kempermann G, Kuhn HG, Winkler J, Buchel C, May A. Temporal and spatialdynamics of brain structure changes during extensive learning. J Neurosci 2006;26:6314–6317.[PubMed: 16763039]
Driemeyer J, Boyke J, Gaser C, Buchel C, May A. Changes in gray matter induced by learning—revisited.PLoS ONE 2008;3:e2669. [PubMed: 18648501]
Flitney, D.; Webster, M.; Patenaude, B.; Seidman, L.; Goldstein, J.; Tordesillas Gutierrez, D.; Eickhoff,S.; Amunts, K.; Zilles, K.; Lancaster, J.; Haselgrove, C.; Kennedy, D.; Jenkinson, M.; Smith, S.Anatomical brain atlases and their application in the FSLView visualisation tool. Thirteenth AnnualMeeting of the Organization for Human Brain Mapping; Toronto. 2007.
Floyer-Lea A, Wylezinska M, Kincses T, Matthews PM. Rapid modulation of GABA concentration inhuman sensorimotor cortex during motor learning. J Neurophysiol 2006;95:1639–1644. [PubMed:16221751]
Good CD, Johnsrude IS, Ashburner J, Henson RN, Friston KJ, Frackowiak RS. A voxel-basedmorphometric study of ageing in 465 normal adult human brains. NeuroImage 2001;14:21–36.[PubMed: 11525331]
Hayasaka S, Phan KL, Liberzon I, Worsley KJ, Nichols TE. Nonstationary cluster-size inference withrandom field and permutation methods. NeuroImage 2004;22:676–687. [PubMed: 15193596]
Ilg R, Wohlschlager AM, Gaser C, Liebau Y, Dauner R, Woller A, Zimmer C, Zihl J, Muhlau M. Graymatter increase induced by practice correlates with task-specific activation: a combined functionaland morphometric magnetic resonance imaging study. J Neurosci 2008;28:4210–4215. [PubMed:18417700]
Jones DK, Symms MR, Cercignani M, Howard RJ. The effect of filter size on VBM analyses of DT-MRIdata. NeuroImage 2005;26:546–554. [PubMed: 15907311]
Jones, DK.; Chitnis, XA.; Job, D.; Khong, PL.; Leung, LT.; Marenco, S.; Smith, SM.; Symms, MR. WhatHappens When Nine Different Groups Analyze the Same DT-MRI Data Set Using Voxel-BasedMethods?. Proceeds of ISMRM 15th Annual Meeting; Berlin. 2007. p. 1
Kawasaki Y, Suzuki M, Kherif F, Takahashi T, Zhou SY, Nakamura K, Matsui M, Sumiyoshi T, SetoH, Kurachi M. Multivariate voxel-based morphometry successfully differentiates schizophreniapatients from healthy controls. NeuroImage 2007;34:235–242. [PubMed: 17045492]
Kleim JA, Markham JA, Vij K, Freese JL, Ballard DH, Greenough WT. Motor learning induces astrocytichypertrophy in the cerebellar cortex. Behav Brain Res 2007;178:244–249. [PubMed: 17257689]
Klintsova AY, Greenough WT. Synaptic plasticity in cortical systems. Curr Opin Neurobiol 1999;9:203–208. [PubMed: 10322189]
Kloppel S, Stonnington CM, Chu C, Draganski B, Scahill RI, Rohrer JD, Fox NC, Jack CR Jr, AshburnerJ, Frackowiak RS. Automatic classification of MR scans in Alzheimer's disease. Brain2008;131:681–689. [PubMed: 18202106]
Krech D, Rosenzweig MR, Bennett EL. Effects of environmental complexity and training on brainchemistry. J Comp Physiol Psychol 1960;53:509–519. [PubMed: 13754181]
Kriegeskorte N, Simmons WK, Bellgowan PS, Baker CI. Circular analysis in systems neuroscience: thedangers of double dipping. Nat Neurosci 2009;12:535–540. [PubMed: 19396166]
Luna B, Thulborn KR, Strojwas MH, McCurtain BJ, Berman RA, Genovese CR, Sweeney JA. Dorsalcortical regions subserving visually guided saccades in humans: an fMRI study. Cereb Cortex1998;8:40–47. [PubMed: 9510384]
May A, Hajak G, Ganssbauer S, Steffens T, Langguth B, Kleinjung T, Eichhammer P. Structural brainalterations following 5 days of intervention: dynamic aspects of neuroplasticity. Cereb Cortex2007;17:205–210. [PubMed: 16481564]
Nichols TE, Holmes AP. Nonparametric permutation tests for functional neuroimaging: a primer withexamples. Hum Brain Mapp 2002;15:1–25. [PubMed: 11747097]
Thomas et al. Page 9
Neuroimage. Author manuscript; available in PMC 2010 November 15.
NIH
-PA Author Manuscript
NIH
-PA Author Manuscript
NIH
-PA Author Manuscript
Nichols, TE.; Ridgway, GR.; Webster, M.; Smith, S. GLM Permutation — Nonparametric Inference forArbitrary General Linear Models. 14th Annual Human Brain Mapping Meeting; Melbourne,Australia. 2008.
Pereira AC, Huddleston DE, Brickman AM, Sosunov AA, Hen R, McKhann GM, Sloan R, Gage FH,Brown TR, Small SA. An in vivo correlate of exercise-induced neurogenesis in the adult dentategyrus. Proc Natl Acad Sci U S A 2007;104:5638–5643. [PubMed: 17374720]
Poldrack RA. Imaging brain plasticity: conceptual and methodological issues—a theoretical review.NeuroImage 2000;12:1–13. [PubMed: 10875897]
Raichle ME, MacLeod AM, Snyder AZ, Powers WJ, Gusnard DA, Shulman GL. A default mode of brainfunction. Proc Natl Acad Sci U S A 2001;98:676–682. [PubMed: 11209064]
Ridderinkhof KR, Ullsperger M, Crone EA, Nieuwenhuiss S. The role of the medial frontal cortex incognitive control. Science 2004;306:443–447. [PubMed: 15486290]
Ridgway GR, Henley SMD, Rohrer JD, Scahill RI, Warren JD, Fox NC. Ten simple rules for reportingvoxel-based morphometry studies. NeuroImage 2008;40:1429–1435. [PubMed: 18314353]
Rosenzweig MR, Bennett EL, Diamond MC. Chemical and anatomical plasticity of brain: replicationsand extensions. Macromol Behav 1972:205–277.
Rueckert D, Sonoda LI, Hayes C, Hill DLG, Leach MO, Hawkes DJ. Nonrigid registration using free-form deformations: application to breast MR images. Medical Imaging, IEEE Transactions on1999;18:712–721.
Sled JG, Zijdenbos AP, Evans AC. A nonparametric method for automatic correction of intensitynonuniformity in MRI data. Medical Imaging, IEEE Transactions on 1998;17:87–97.
Smith SM. Fast robust automated brain extraction. Hum Brain Mapp 2002;17:143–155. [PubMed:12391568]
Smith SM, Zhang YY, Jenkinson M, Chen J, Matthews PM, Federico A, De Stefano N. Accurate, robust,and automated longitudinal and cross-sectional brain change analysis. NeuroImage 2002;17:479–489. [PubMed: 12482100]
Swain RA, Harris AB, Wiener EC, Dutka MV, Morris HD, Theien BE, Konda S, Engberg K, LauterburPC, Greenough WT. Prolonged exercise induces angiogenesis and increases cerebral blood volumein primary motor cortex of the rat. Neuroscience 2003;117:1037–1046. [PubMed: 12654355]
van der Kouwe AJW, Benner T, Salat DH, Fischl B. Brain morphometry with multiecho MPRAGE.Neuroimage 2008;40:559–569. [PubMed: 18242102]
van Praag H, Kempermann G, Gage FH. Neural consequences of environmental enrichment. Nat Rev,Neurosci 2000;1:191–198. [PubMed: 11257907]
Woolrich MW, Behrens TE, Beckmann CF, Jenkinson M, Smith SM. Multilevel linear modelling forFMRI group analysis using Bayesian inference. NeuroImage 2004;21:1732–1747. [PubMed:15050594]
Worsley KJ, Evans AC, Marrett S, Neelin P. A three-dimensional statistical analysis for CBF activationstudies in human brain. J Cereb Blood Flow Metab 1992;12:900–918. [PubMed: 1400644]
Worsley KJ, Andermann M, Koulis T, MacDonald D, Evans AC. Detecting changes in nonisotropicimages. Hum Brain Mapp 1999;8:98–101. [PubMed: 10524599]
Zhang Y, Brady M, Smith S. Segmentation of brain MR images through a hidden Markov random fieldmodel and the expectation–maximization algorithm. IEEE Trans Med Imag 2001;20:45–57.
Thomas et al. Page 10
Neuroimage. Author manuscript; available in PMC 2010 November 15.
NIH
-PA Author Manuscript
NIH
-PA Author Manuscript
NIH
-PA Author Manuscript
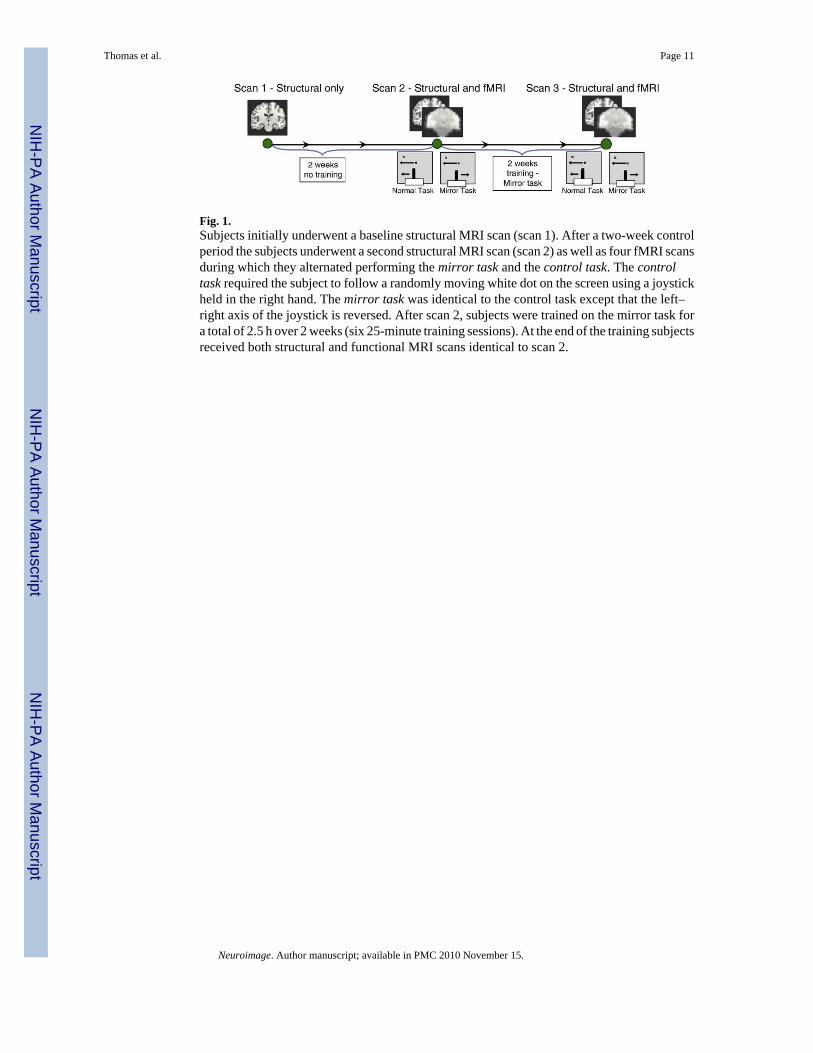
Fig. 1.Subjects initially underwent a baseline structural MRI scan (scan 1). After a two-week controlperiod the subjects underwent a second structural MRI scan (scan 2) as well as four fMRI scansduring which they alternated performing the mirror task and the control task. The controltask required the subject to follow a randomly moving white dot on the screen using a joystickheld in the right hand. The mirror task was identical to the control task except that the left–right axis of the joystick is reversed. After scan 2, subjects were trained on the mirror task fora total of 2.5 h over 2 weeks (six 25-minute training sessions). At the end of the training subjectsreceived both structural and functional MRI scans identical to scan 2.
Thomas et al. Page 11
Neuroimage. Author manuscript; available in PMC 2010 November 15.
NIH
-PA Author Manuscript
NIH
-PA Author Manuscript
NIH
-PA Author Manuscript
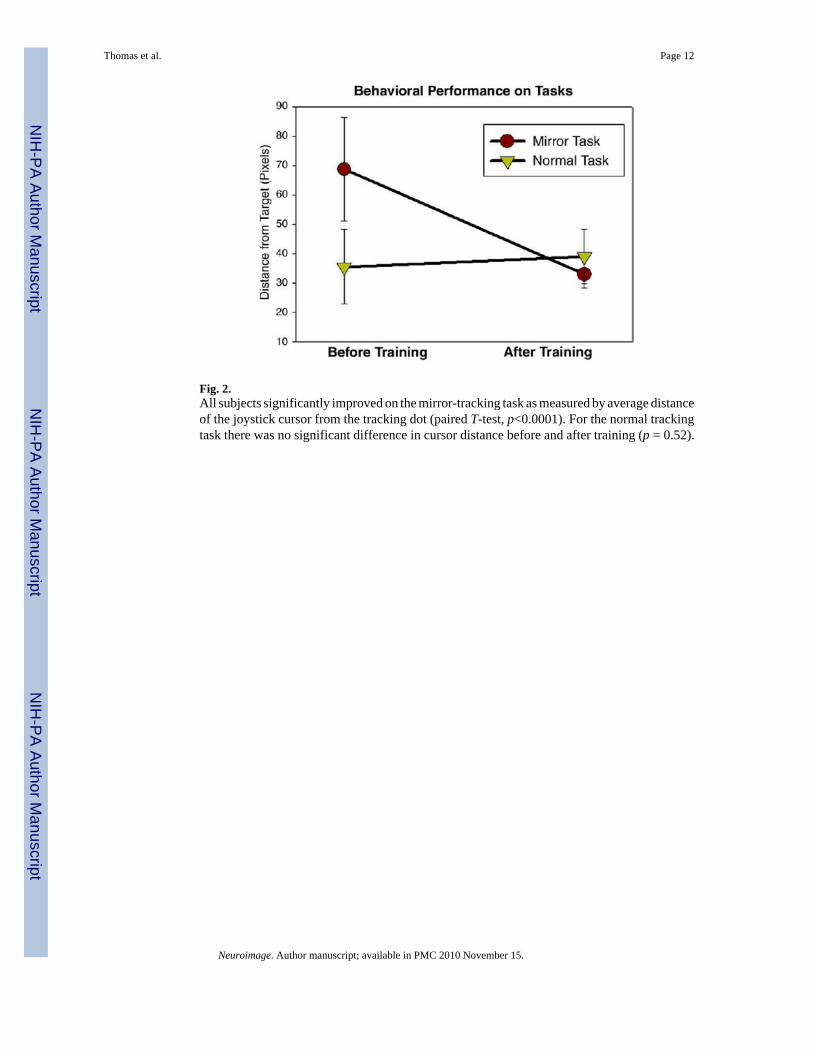
Fig. 2.All subjects significantly improved on the mirror-tracking task as measured by average distanceof the joystick cursor from the tracking dot (paired T-test, p<0.0001). For the normal trackingtask there was no significant difference in cursor distance before and after training (p = 0.52).
Thomas et al. Page 12
Neuroimage. Author manuscript; available in PMC 2010 November 15.
NIH
-PA Author Manuscript
NIH
-PA Author Manuscript
NIH
-PA Author Manuscript
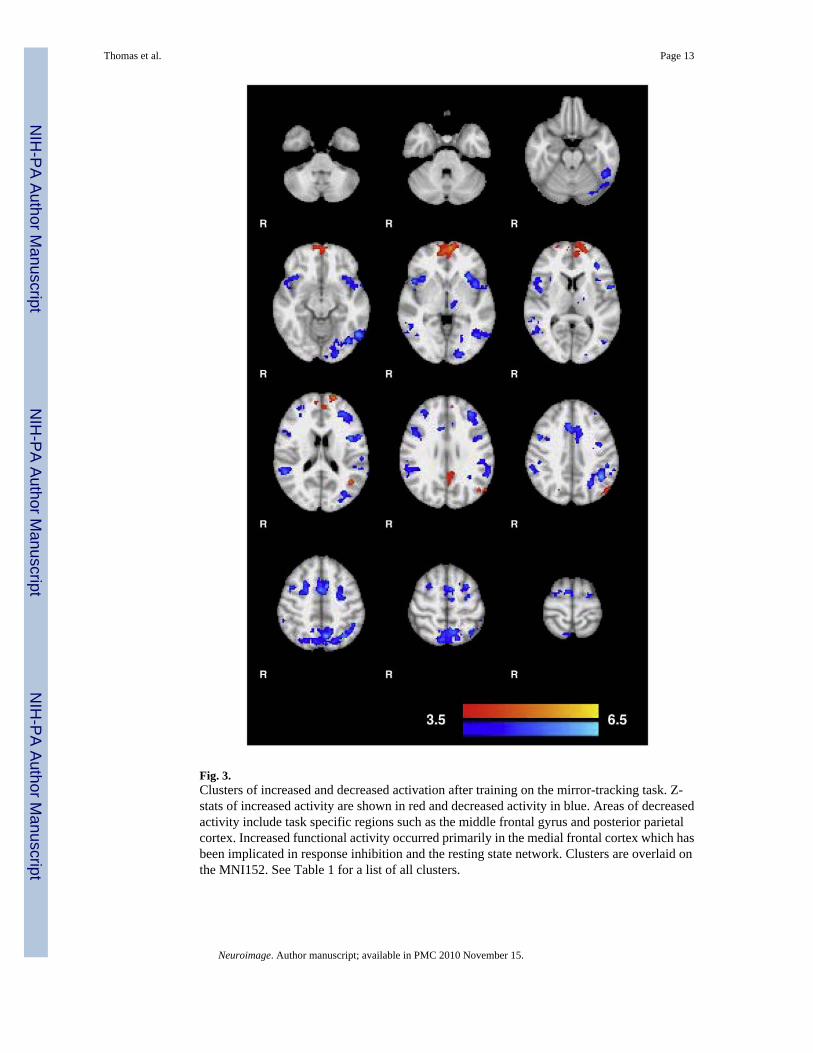
Fig. 3.Clusters of increased and decreased activation after training on the mirror-tracking task. Z-stats of increased activity are shown in red and decreased activity in blue. Areas of decreasedactivity include task specific regions such as the middle frontal gyrus and posterior parietalcortex. Increased functional activity occurred primarily in the medial frontal cortex which hasbeen implicated in response inhibition and the resting state network. Clusters are overlaid onthe MNI152. See Table 1 for a list of all clusters.
Thomas et al. Page 13
Neuroimage. Author manuscript; available in PMC 2010 November 15.
NIH
-PA Author Manuscript
NIH
-PA Author Manuscript
NIH
-PA Author Manuscript
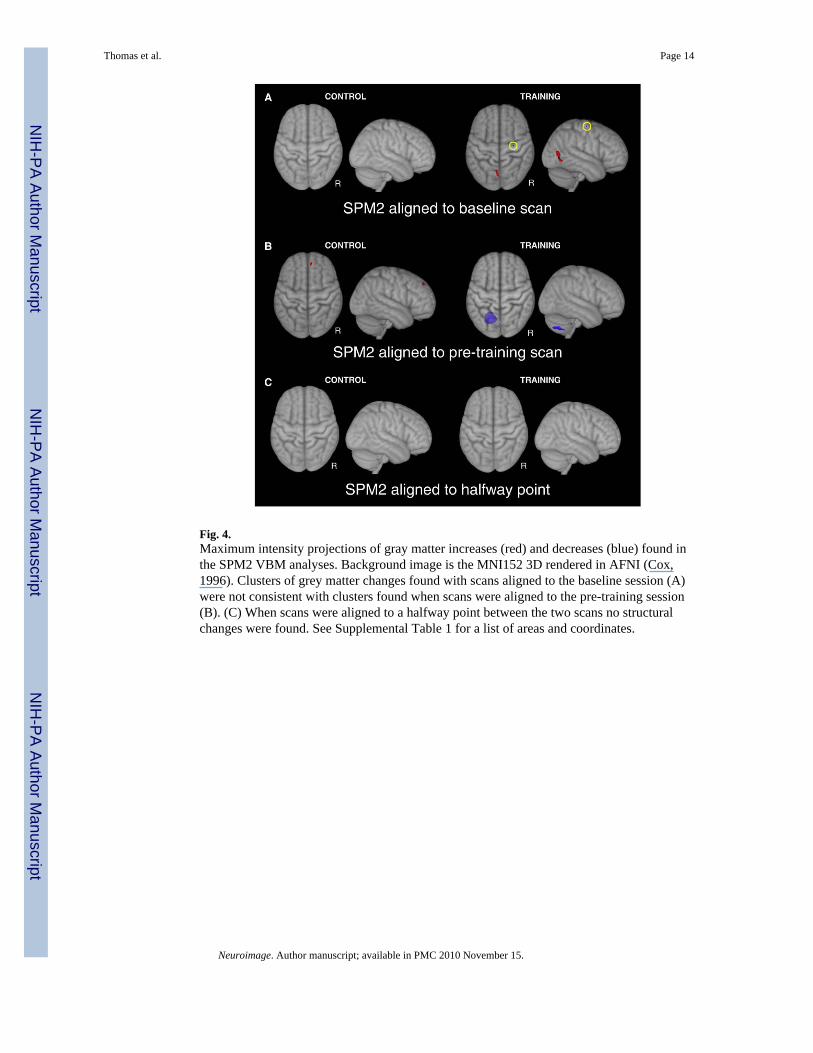
Fig. 4.Maximum intensity projections of gray matter increases (red) and decreases (blue) found inthe SPM2 VBM analyses. Background image is the MNI152 3D rendered in AFNI (Cox,1996). Clusters of grey matter changes found with scans aligned to the baseline session (A)were not consistent with clusters found when scans were aligned to the pre-training session(B). (C) When scans were aligned to a halfway point between the two scans no structuralchanges were found. See Supplemental Table 1 for a list of areas and coordinates.
Thomas et al. Page 14
Neuroimage. Author manuscript; available in PMC 2010 November 15.
NIH
-PA Author Manuscript
NIH
-PA Author Manuscript
NIH
-PA Author Manuscript
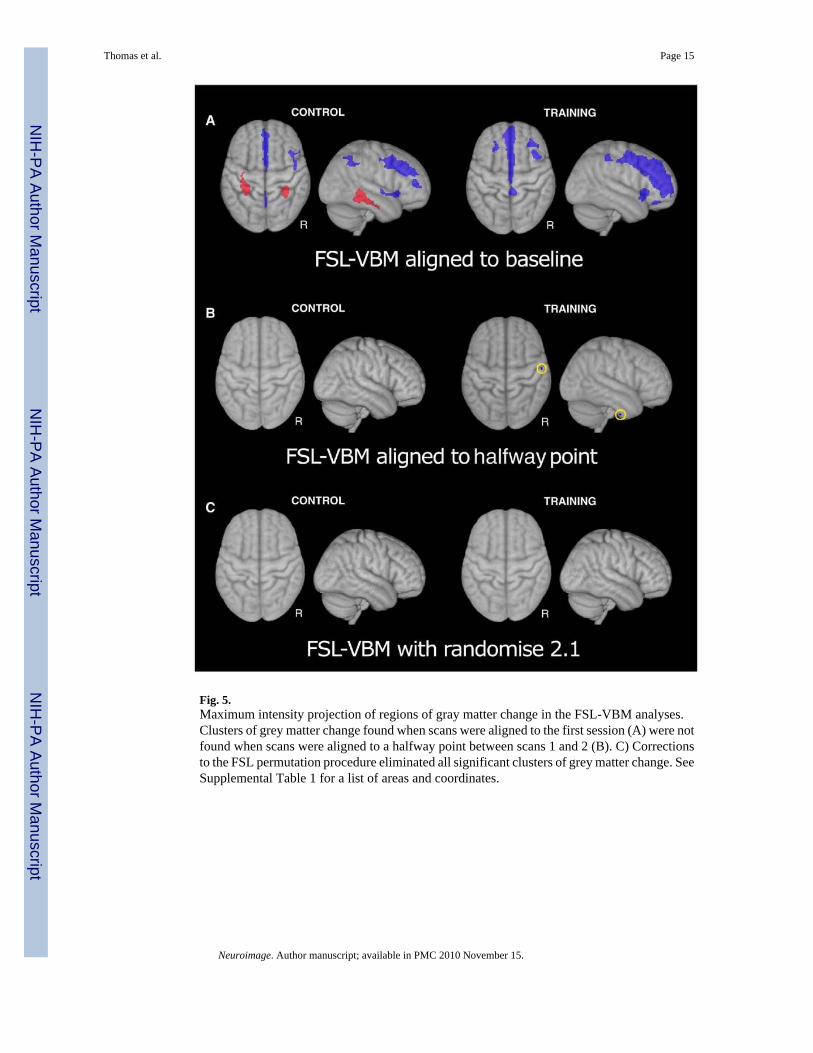
Fig. 5.Maximum intensity projection of regions of gray matter change in the FSL-VBM analyses.Clusters of grey matter change found when scans were aligned to the first session (A) were notfound when scans were aligned to a halfway point between scans 1 and 2 (B). C) Correctionsto the FSL permutation procedure eliminated all significant clusters of grey matter change. SeeSupplemental Table 1 for a list of areas and coordinates.
Thomas et al. Page 15
Neuroimage. Author manuscript; available in PMC 2010 November 15.
NIH
-PA Author Manuscript
NIH
-PA Author Manuscript
NIH
-PA Author Manuscript
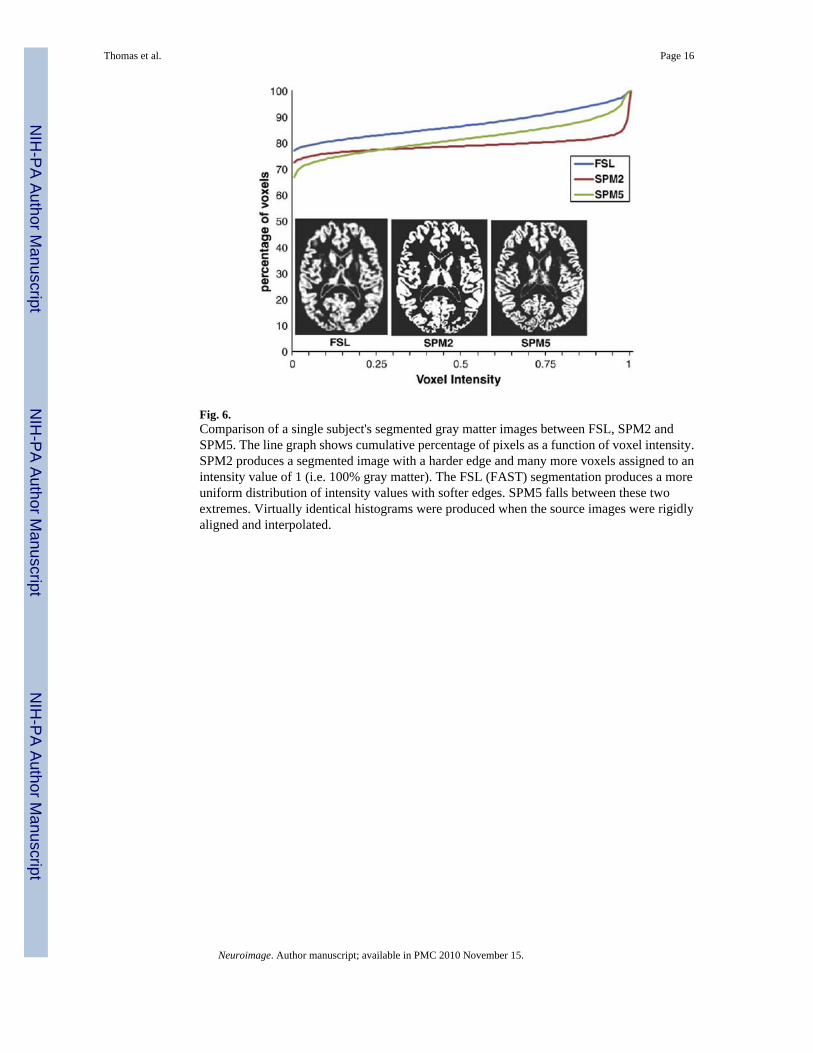
Fig. 6.Comparison of a single subject's segmented gray matter images between FSL, SPM2 andSPM5. The line graph shows cumulative percentage of pixels as a function of voxel intensity.SPM2 produces a segmented image with a harder edge and many more voxels assigned to anintensity value of 1 (i.e. 100% gray matter). The FSL (FAST) segmentation produces a moreuniform distribution of intensity values with softer edges. SPM5 falls between these twoextremes. Virtually identical histograms were produced when the source images were rigidlyaligned and interpolated.
Thomas et al. Page 16
Neuroimage. Author manuscript; available in PMC 2010 November 15.
NIH
-PA Author Manuscript
NIH
-PA Author Manuscript
NIH
-PA Author Manuscript

NIH
-PA Author Manuscript
NIH
-PA Author Manuscript
NIH
-PA Author Manuscript
Thomas et al. Page 17
Tabl
e 1
Clu
ster
s sho
win
g fu
nctio
nal c
hang
e af
ter t
rain
ing.
P-va
lue
# V
oxel
sx
yz
Are
a
Incr
ease
s
<0.0
001
1291
−260
2M
edia
l fro
ntal
<0.0
001
226
−48
−69
31L.
Sup
. occ
ipta
l
0.00
213
0−4
−52
29C
ingu
late
gyr
us
Dec
reas
es
<0.0
001
2987
−6−6
450
L. P
recu
nuou
s/pa
rieta
l
<0.0
001
1698
3910
25R
. Inf
. fro
ntal
gyr
us
<0.0
001
1335
−35
−73
−11
L. O
ccip
ital f
usifo
rm g
yrus
<0.0
001
1237
−42
420
L. P
rece
ntra
l gyr
us
<0.0
001
1217
−18
47Pa
raci
ngul
ate
gyru
s
<0.0
001
1004
54−4
420
R. S
upra
mar
gina
l gyr
us
<0.0
001
672
−35
3622
L. M
iddl
e fr
onta
l gyr
us
<0.0
001
604
−28
−451
L. M
iddl
e fr
onta
l gyr
us
<0.0
001
244
3241
25R
. Fro
ntal
pol
e
<0.0
001
231
−33
−80
19L.
Sup
. occ
ipita
l
0.00
212
4−1
0−1
70
L. T
hala
mus
Clu
ster
s sho
win
g a
chan
ge in
func
tiona
l act
ivity
afte
r 2 w
eeks
of t
rain
ing
on th
e m
irror
-trac
king
task
. Vox
el c
oord
inat
es a
re re
porte
d in
MN
I spa
ce a
nd a
rea
labe
ls w
ere
dete
rmin
ed u
sing
the
Har
vard
–Oxf
ord
Stru
ctur
al A
tlas i
n FS
Lvie
w (F
litne
y et
al.,
200
7).
Neuroimage. Author manuscript; available in PMC 2010 November 15.
Copyright © 2022 FDOKUMEN