Education Longitudinal Study:2002 Field Test Report
392
NATIONAL CENTER FOR EDUCATION STATISTICS Working Paper Series The Working Paper Series was initiated to promote the sharing of the valuable work experience and knowledge reflected in these preliminary reports. These reports are viewed as works in progress, and have not undergone a rigorous review for consistency with NCES Statistical Standards prior to inclusion in the Working Paper Series. U. S. Department of Education Institute of Education Sciences
-
Upload
khangminh22 -
Category
Documents
-
view
1 -
download
0
Transcript of Education Longitudinal Study:2002 Field Test Report

NATIONAL CENTER FOR EDUCATION STATISTICS
Working Paper Series
The Working Paper Series was initiated to promote the sharing of the valuable work experience and knowledge reflected in these preliminary reports. These reports are viewed as works in progress, and have not undergone a rigorous review for consistency with NCES Statistical Standards prior to inclusion in the Working Paper Series.
U. S. Department of Education Institute of Education Sciences

This page intentionally left blank.

NATIONAL CENTER FOR EDUCATION STATISTICS
Working Paper Series
Educational Longitudinal Study of 2002 Base Year Field Test Report
Working Paper No. 2003-03 April 2003
Contact: Jeffrey Owings Project Officer [email protected]
U. S. Department of Education Institute of Education Sciences
ii
U.S. Department of EducationRod Paige Secretary
Institute of Education Sciences Grover J. Whitehurst Director
National Center for Education StatisticsVal Plisko Associate Commissioner
The National Center for Education Statistics (NCES) is the primary federal entity for collecting, analyzing, and reporting data related to education in the United States and other nations. It fulfills a congressional mandate to collect, collate, analyze, and report full and complete statistics on the condition of education in the United States; conduct and publish reports and specialized analyses of the meaning and significance of such statistics; assist state and local education agencies in improving their statistical systems; and review and report on education activities in foreign countries.
NCES activities are designed to address high priority education data needs; provide consistent, reliable, complete, and accurate indicators of education status and trends; and report timely, useful, and high quality data to the U.S. Department of Education, the Congress, the states, other education policymakers, practitioners, data users, and the general public.
We strive to make our products available in a variety of formats and in language that is appropriate to a variety of audiences. You, as our customer, are the best judge of our success in communicating information effectively. If you have any comments or suggestions about this or any other NCES product or report, we would like to hear from you. Please direct your comments to:
National Center for Education Statistics Institute of Education Sciences U.S. Department of Education 1990 K Street NW Washington, DC 20006–5651
April 2003
The NCES World Wide Web Home Page address is http://nces.ed.govThe NCES World Wide Web Electronic Catalog is: http://nces.ed.gov/pubsearch
Suggested Citation
U.S. Department of Education, National Center for Education Statistics. Education Longitudinal Study of 2002 Base Year Field Test Report. NCES 2003-03, by Laura J. Burns, Ruth Heuer, Steven J. Ingels, Judith Pollack, Daniel J. Pratt, Donald Rock, Jim Rogers, Leslie A. Scott, Peter Siegel, and Ellen Stutts. Project officer: Jeffrey Owings. Washington, DC: 2003.
For ordering information on this report, write:
U.S. Department of Education ED Pubs P.O. Box 1398 Jessup, MD 20794–1398
Or call toll free 1–877–4ED–Pubs
Content Contact:Jeffrey Owings (202) 502–7423 [email protected]

iii
ForewordIn addition to official NCES publications, NCES staff and individuals commissioned by
NCES produce preliminary research reports that include analyses of survey results, and presentations of technical, methodological, and statistical evaluation issues.
The Working Paper Series was initiated to promote the sharing of the valuable work experience and knowledge reflected in these preliminary reports. These reports are viewed as works in progress, and have not undergone a rigorous review for consistency with NCES Statistical Standards prior to inclusion in the Working Paper Series.
Copies of Working Papers can be downloaded as pdf files from the NCES Electronic Catalog (http://nces.ed.gov/pubsearch/), or contact Sheilah Jupiter at (202) 502–7363, e-mail: [email protected], or mail: U.S. Department of Education, Institute of Education Sciences, National Center for Education Statistics, 1990 K Street NW, Room 9048, Washington, DC 20006.
Marilyn M. Seastrom Ralph Lee Chief Mathematical Statistician Mathematical Statistician Statistical Standards Program Statistical Standards Program

iv
This page intentionally left blank.

v
Educational Longitudinal Study of 2002 Base Year Field Test Report
Prepared by:
Laura Burns Ruth Heuer
Steven J. Ingels Judy Pollack
Daniel J. Pratt Don Rock Jim Rogers
Leslie A. Scott Peter Siegel Ellen Stutts
Prepared for:
U.S. Department of Education Institute of Education Sciences
National Center for Education Statistics
April 2003

vi
This page intentionally left blank.
vii
AcknowledgmentsThe authors of this report—representing Educational Testing Service (Donald Rock and Judith
Pollack), the Education Statistics Services Institute (Leslie A. Scott), and Research Triangle Institute (all other authors) would like to thank the many individuals who assisted in the planning of the ELS:2002 base year field test.
We are particularly indebted to the ELS:2002 Technical Review Panel, whose members reviewed plans for the study and helped refine them, and provided important suggestions to help guide development of the instrumentation. The following individuals serve as members of the Technical Review Panel: Marco Clark, Richard Duran, Jeremy Finn, Thomas B. Hoffer, Thomas Kane, Sally Kilgore, Richard Lawrence, Samuel Roundfield Lucas, Aaron Pallas, and Andy Rogers.
Special thanks are in order to Jeffrey A. Owings, Project Officer, and Associate Commissioner of Education Statistics in the National Center for Education Statistics (NCES), in whose division ELS:2002 is housed. Other NCES staff who have provided help, support and assistance include Ghedam Bairu, Ilona Berkovits, Kathy Chandler, Bill Fowler, Lisa Hudson, Andrew G. Malizio, Edith McArthur, Samuel Peng, and Marilyn M. Seastrom. Staff in other offices of the U.S. Department of Education who have contributed to the study include Clifford Adelman, Sharon Belli, Jeffery Rodamar, and Marsha Silverberg. We also wish to acknowledge the assistance of Denise M. Davis of the National Commission on Libraries and Information Science.
Our thanks to all of the above for their interest and generosity and for the high quality of their contribution to this study.
Lastly, we would like to acknowledge the help of Lynne Kline and Lil Clark of RTI, who did the final formatting and preparation of this document.

viii
This page intentionally left blank.
ix
Table of Contents
Introduction ...................................................................................................................................................................1
Chapter 1: Field Test Preparation: Sampling and Instrumentation............................................................................11 1.1 Sample Design and Selection..........................................................................................................11 1.1.1 Selection of the Field Test States......................................................................................11 1.1.2 School Sampling...............................................................................................................12 1.1.2.1 Procedures and Results of School Sampling .....................................................12 1.1.2.2 Evaluation of Sampling Frame and Procedures.................................................14 1.1.2.3 Recommendations for the Main Study ...............................................................14 1.1.3 Student Sampling..............................................................................................................16 1.1.3.1 Procedures for Sampling Students.....................................................................16 1.1.3.2 Student Sampling: Evaluation and Results........................................................19 1.1.3.2.1 Student Sample Selection.....................................................................19 1.1.3.2.2 Oversampling .......................................................................................21 1.1.3.2.3 Updating the Student Sample...............................................................21 1.1.3.2.4 Ineligibility and Exclusion ...................................................................22 1.1.3.3 Recommendations for the Main Study ..............................................................22 1.1.4 Sampling Other Populations .............................................................................................23 1.1.4.1 Teacher Sampling..............................................................................................23 1.1.4.2 School Administrators, Parents, Library Media Specialists ..............................24 1.1.4.3 Discussion, Recommendations for Main Study.................................................24 1.2 Instrumentation ...............................................................................................................................24
Chapter 2: Securing Cooperation ...............................................................................................................................27 2.1 Securing Endorsements...................................................................................................................27 2.2 Securing State Cooperation.............................................................................................................28 2.3 Securing District/Diocese and School Cooperation ........................................................................28 2.4 Analysis of School Response Rates ................................................................................................29 2.5 School Response to Incentives and Burden ....................................................................................29 2.6 Securing Parental Permission..........................................................................................................30 2.6.1 Active Consent..................................................................................................................30 2.6.2 Passive Consent ................................................................................................................31 2.7 Recommendations for the Main Study............................................................................................31
Chapter 3: Data Collection ........................................................................................................................................33 3.1 Recruitment and Training of Data Collectors .................................................................................33 3.1.1 Field Staff .........................................................................................................................33 3.1.2 Telephone Staff.................................................................................................................35 3.1.2.1 Institutional Recruiters .......................................................................................35 3.1.2.2 Telephone Interviewers ......................................................................................35 3.2 In-School Survey Procedures and Results ......................................................................................36 3.2.1 Student Survey..................................................................................................................36 3.2.1.1 Description of Student Surveys and Make-Up Sessions.....................................36 3.2.1.2 Student Response Rates and Other Results ........................................................38 3.2.1.3 Discussion, Recommendations for Main Study..................................................39 3.2.2 Facilities Checklist............................................................................................................40 3.2.2.1 Description of Procedures .................................................................................40 3.2.2.2 Discussion, Recommendations for the Main Study...........................................41 3.2.3 Collection of Course Catalogues .....................................................................................41

Table of Contents
x
3.3 Surveys of Other School Populations..............................................................................................42 3.3.1 Teacher Survey .................................................................................................................42 3.3.1.1 Description of Teacher Survey Procedures..........................................................42 3.3.1.2 Teacher Response Rates and Other Results .........................................................42 3.3.1.3 Discussion and Recommendations for Main Study ............................................43 3.3.2 School Administrator Survey............................................................................................43 3.3.2.1 Description of Administrator Survey Procedures ................................................43 3.3.2.2 Response Rates and Other Results.......................................................................45 3.3.2.3 Discussion and Recommendations for Main Study .............................................44 3.3.3 Library Media Center Survey ...........................................................................................44 3.3.3.1 Description of Library Survey Procedures...........................................................44 3.3.3.2 Response Rates and Other Results.......................................................................44 3.3.3.3 Discussion and Recommendations for Main Study .............................................45 3.4 Parent Survey ..................................................................................................................................45 3.4.1 Description of Parent Survey Procedures .........................................................................45 3.4.2 Parent Survey Results .......................................................................................................46 3.4.3 Discussion, Recommendations .........................................................................................46
Chapter 4: Survey Control System and Data Processing............................................................................................47 4.1 Systems Design, Development and Testing....................................................................................47 4.2 Data Capture ...................................................................................................................................48 4.2.1 School, District and State Recruiting................................................................................48 4.2.2 List Processing..................................................................................................................48 4.2.3 Survey Day .......................................................................................................................49 4.2.4 Data Receipt .....................................................................................................................49 4.3 Data Processing and File Preparation..............................................................................................50
Chapter 5: Analysis of Student Survey Results ..........................................................................................................51 5.1 Cognitive Test Battery ....................................................................................................................51 5.1.1 Objectives and Background ..............................................................................................51 5.1.2 Field Test Sample .............................................................................................................52 5.1.3 Number and Description of Items, Timing, Completion Rates.........................................52 5.1.4 Item Performance..............................................................................................................53 5.1.5 Classical Item Analysis.....................................................................................................53 5.1.6 Item Response Theory (IRT) ............................................................................................58 5.1.7 Reliability and Factor Structure ........................................................................................61 5.1.8 Differential Item Functioning (DIF) .................................................................................62 5.1.9 Multiple Choice vs. Open-ended Format..........................................................................63 5.1.10 Test Design .......................................................................................................................64 5.1.11 Test Scores........................................................................................................................67 5.1.12 Measuring Change: Proficiency Levels ...........................................................................68 5.1.13 Item Selection and Revision .............................................................................................69 5.2 Evaluation of Self-Regulated Learning Variables in the ELS:2002 Field Test...............................70 5.2.1 Item Development Process ...............................................................................................70 5.2.2 Scale Descriptions ........................................................................................................71 5.2.2.1 Component 1—Cognitive Component of Self-regulated Learning ....................71 5.2.2.1.1 Self-regulated Learning Strategies..................................................71 5.2.2.1.1.1 Rehersal (Memorization) Strategies Scale ......................................71 5.2.2.1.1.2 Elaboration Strategies Scale ...........................................................72 5.2.2.1.1.3 Control Strategies Scale..................................................................72 5.2.2.1.2 Implicit Theories of Learning .........................................................72 5.2.2.2 Component 2—Motivational Component of Self-Regulated .............................72 5.2.2.2.1 Motivational Preferences ................................................................73 5.2.2.2.1.1 Instrumental Motivation (Utility Interest)Scale—General .............73 5.2.2.2.1.2 Intrinsic Interest Scale—Subject Specific (Math and English).......73

Table of Contents
xi
5.2.2.2.2 Self-regulated Cognitions ...............................................................74 5.2.2.2.2.1 Control Expectation ........................................................................74 5.2.2.2.2.2 Self-Efficacy—Subject Specific (Math and English) .....................74 5.2.2.2.3 Action Control Strategies................................................................75 5.2.2.2.3.1 Effort and Persistence—General.....................................................75 5.2.2.3 Component 3—Socio-cognitive Component of Self-Regulate Learning ...........75 5.2.2.3.1 Learning Style Preference...............................................................75 5.2.2.3.1.1 Preference for Cooperative Learning..............................................75 5.2.2.3.1.2 Preference for Competetive Learning .............................................76 5.2.3 Results of Field Test .........................................................................................................76 5.2.4 Recommendations for the Main Study .............................................................................77 5.2.4.1 Implicit Theories of Learning (131) ...................................................................78 5.2.4.2 Intrinsic Interest Scale—Subject Specific ..........................................................78 5.2.4.3 Instrumental Motivation (utility interest) Scale—general ..................................78 5.2.4.4 Control Expectation Scale ..................................................................................78 5.2.4.5 Self-Efficacy Scales—Subject Specific..............................................................79 5.3 Student Questionnaire Other Items ................................................................................................84 5.3.1 Item by Item Tally of Questions Asked by Students in Survey Session...........................84 5.3.2 Analysis of Editing/Retrieval of Critical Items.................................................................84 5.3.3 Item Nonresponse Analysis ..............................................................................................87 5.3.4 Inter-item Consistency......................................................................................................97 5.3.5 Logical Consistency of Filter and Dependent Questions................................................100 5.3.6 Response Variation by Item Position in Questionnaire ..................................................112
Chapter 6: Analysis of School, Teacher, Library Survey and Facilities Results ....................................................115 6.1 School Administrator Survey........................................................................................................115 6.1.1 Item Nonresponse Analysis ............................................................................................115 6.1.2 Inter-item Consistency....................................................................................................119 6.1.3 Logical Consistency of Responses to Filter Dependent Questions.................................120 6.2 Teacher Survey Responses............................................................................................................120 6.2.1 Item Nonresponse Analysis ............................................................................................120 6.2.2 Inter-item Consistency....................................................................................................124 6.2.3 Logical Consistency of Responses to Filter and Dependent Questions ..........................124 6.2.4 Analysis of Teacher-Student Linkage.............................................................................125 6.3 Library Media Center Survey........................................................................................................126 6.4 Facilities Checklist........................................................................................................................126
Chapter 7: Analysis of Parent Survey Results ..........................................................................................................129 7.1 Parent Survey Responses ..............................................................................................................129 7.1.1 Item Nonresponse Analysis ............................................................................................129 7.1.2 Inter-Item Consistency....................................................................................................136 7.1.3 Logical Consistency of Responses to Filter and Dependent Questions ..........................136 7.2 Comparison of Student and Parent Responses ..............................................................................137 7.3 Parent CATI Reinterview, Mode Effect Analysis.........................................................................138 7.4 Socioeconomic Status ...................................................................................................................143
Appendix A Field Test and Main Study Sampling Specifications ....................................................................151 Appendix B Field Test Letters, Permission Forms, and Scripts ........................................................................227 Appendix C Survey Administrator Debriefing..................................................................................................259 Appendix D Item Analysis Statistics .................................................................................................................271 Appendix E Summary of First Technical Review Panel Meeting.....................................................................295
References .................................................................................................................................................................363

Table of Contents
xii
List of Tables
Table Number 1-1 School sampling, district approval, eligibility, and list-providing by sampling stratum.................14 1-2 Types of student lists provided by schools .................................................................................20 1-3 Types of problems encountered with student lists ..........................................................................20 1-4 Expected and achieved student samples by student stratum ...........................................................20 1-5 Expected and achieved student samples by student stratum ...........................................................21 1-6 Updated list status and number of students added ..........................................................................22 1-7 Sample teachers by subject taught, school type and school urbanicity ...........................................24
5-1 Field test sample counts by subgroup .............................................................................................52 5-2 Test timing, number of items, and completion rates .......................................................................53 5-3 R-biserials for field test items .........................................................................................................55 5-4 Proportion correct on each item by grade, and difference from grade 10-12..................................57 5-5 Summary of classical item analysis statistics..................................................................................58 5-6 IRT “a” (discrimination) parameters for field test items.................................................................59 5-7 IRT “b” (difficulty) parameters for field test items.........................................................................60 5-8 Summary of IRT estimates .............................................................................................................61 5-9 Cognitive test alpha coefficients .....................................................................................................61 5-10 Probability of mastery ..............................................................................................................68 5-11 Analysis of ELS:2002 field test data for self-regulated learning scales..........................................80 5-12 Zero order correlations of self-regulated learning scales ................................................................83 5-13 ELS:2002 field test critical item retrieval .......................................................................................85 5-14 Item Nonresponse on ELS:2002 field test student questionnaire....................................................88 5-15 How far in school R thinks he will get by how sure R is that he will graduate (q63 x q24) ...........98 5-16 How far in school R thinks he will get by how sure R is that he will further his education after leaving high school (q63xq25) ...............................................................................................99 5-17 The use of filters to route students through questionnaire ............................................................101 5-18 Percent of respondents who did not reach the first and last non-critical item in Part III through Part VII of the student questionnaire.............................................................................................113
6-1 Item nonresponse on ELS:2002 field test administrator questionnaire .........................................115 6.2 Item Nonresponse on ELS:2002 field test teacher questionnaire..................................................121
7.1 Types of Nonresponse by mode of administration........................................................................129 7.2 Item Nonresponse on ELS:2002 field test parent questionnaire ...................................................130 7.3 Reliability indices for parent interview.........................................................................................140 7.4 Correlations of socioeconomic proxy items with family income..................................................145
List of Figures
Figure Number
A Longitudinal design for the NCES high school cohorts....................................................................3 3.1 ELS Field Test SA Training Agenda ..............................................................................................34 3.2 Telephone interviewer Training Agenda.........................................................................................36
5-1 Target reading two stage adaptive design .......................................................................................66 5-2 Target mathematics two stage adaptive design ...............................................................................67

1
Introduction
The Education Longitudinal Study of 2002 (ELS: 2002) is conducted by Research Triangle Institute (RTI) – a not-for-profit university-affiliated research organization with headquarters in North Carolina – in behalf of the National Center for Education Statistics (NCES) of the United States Department of Education. The Educational Testing Service and MPR Associates are subcontractors to RTI on the study. This field test report is divided into an introduction and seven chapters. Additional material is contained in five appendices. The seven chapters cover the following topics:
Chapter 1: Field Test Preparation: Sampling and Instrumentation Chapter 2: Securing Cooperation Chapter 3: Data Collection Chapter 4: Survey Control System and Data Processing Chapter 5: Analysis of Student Survey Results Chapter 6: Analysis of School, Teacher, Library Survey and Facilities Results Chapter 7: Analysis of Parent Survey Results
This Introduction serves two purposes. First, it provides an overview of the overall ELS:2002 main study. Second, it provides an overview of the ELS:2002 base year field test.The overview of the main study comprises three sections: historical background of the study, its research objectives, and the study design and schedule. The overview of the 2001 field test provides a brief sketch of the objectives and design of the base year field test.
Historical Background: NCES’ Education High School Longitudinal Studies Program
In response to its mandate to “collect and disseminate statistics and other data related to education in the United States” and the need for policy-relevant, nationally representative longitudinal samples of elementary and secondary students, the U.S. Department of Education’s National Center for Education Statistics (NCES) instituted the National Education Longitudinal Studies program. The aim of this continuing program is to study the educational, vocational, and personal development of students at various stages in their educational careers, and the personal, familial, social, institutional, and cultural factors that may affect that development.

Introduction
2
The high school longitudinal studies program consists of three completed studies: The National Longitudinal Study of the High School Class of 1972 (NLS-72), High School and Beyond (HS&B), and the National Education Longitudinal Study of 1988 (NELS:88). In addition, data collection for the Education Longitudinal Study of 2002, the fourth longitudinal study in this time series, is currently in progress. Taken together, these studies describe (or will describe) the educational experiences of students from four decades—the 1970s, 1980s, 1990s, and 2000s—and not only describe and measure educational attainment but also provide bases for further understanding the correlates of educational success in the United States. Figure A includes a temporal presentation of these four longitudinal education studies, and highlights their component and comparison points. Figure A does not identify all future follow-up points for ELS: 2002; final decisions have yet to be made concerning them. However, the general expectation is that ELS: 2002 sophomores will be followed for at least 10 years.
National Longitudinal Study of the High School Class of 1972 (NLS-72)
The Education Longitudinal Studies program began 30 years ago, with the implementation of the National Longitudinal Study of the High School Class 1972 (NLS-72).1NLS-72 was designed to provide longitudinal data for educational policymakers and researchers that linked educational experiences in high school with important downstream outcomes such as labor market experiences and postsecondary education enrollment and attainment. With a national probability sample of 19,001 high school seniors from 1,061 public and religious and other private schools, the NLS-72 sample was representative of approximately three million high school seniors enrolled in 17,000 U.S. high schools during the spring of the 1971-72 school year.Each member of this cohort was asked to complete a student questionnaire and a cognitive test battery. In addition, administrators at the sample members’ schools were asked to supply information about the schools’ programs, resources, and grading systems, as well as survey data on each student. No parent survey was conducted. However, postsecondary education transcripts were collected from the institutions attended by students. Five follow-up surveys were completed with this student cohort, with the final data collection taking place in 1986, when the sample members were 14 years removed from high school and approximately 32 years old.
1 Riccobono, J.A., Place, C., and Burkheimer, G.J. (1981). National Longitudinal Study: Base Year through Fourth Follow-Up. Washington, DC: U.S. Department of Education, National Center for Education Statistics; Tourangeau, Roger, et al. (1987). The National Longitudinal Study of the High School Class of 1972 (NLS-72) Fifth Follow-Up (1986) Data File User's Manual, Washington, DC: U.S. Department of Education, National Center for Education Statistics

3
Figu
re A
.-Lon
gitu
dina
l des
ign
for t
he N
CES
hig
h sc
hool
coh
orts
NLS
-72=
Nat
iona
l Lon
gitu
dina
l Stu
dy o
f the
Hig
h Sc
hool
Cla
ss o
f 197
2BY
=Bas
e Ye
ar d
ata
colle
ctio
nC
T=C
ogni
tive
test
HST
=Hig
h Sc
hool
Tra
nscr
ipt
HS&
B=H
igh
Scho
ol a
nd B
eyon
d: 1
980
1FU
=1st
follo
w-u
p da
ta c
olle
ctio
nP=
Pare
nt s
urve
yPS
T=Po
st-S
econ
dary
Tra
nscr
ipt
NEL
S:88
=Nat
iona
l Edu
catio
n Lo
ngitu
dina
l Stu
dy o
f 198
82F
U=2
nd fo
llow
-up
data
col
lect
ion
T=Te
ache
r sur
vey
SFA=
Stud
ent F
inan
cial
Aid
ELS:
2002
=Edu
catio
n Lo
ngitu
dina
l Stu
dy o
f 200
23F
U=3
rd fo
llow
-up
data
col
lect
ion
A=Ad
min
stra
tor s
urve
yBY
I=Ba
se Y
ear I
nelig
ible
Stu
dy4F
U=4
th fo
llow
-up
data
col
lect
ion
L=Li
brar
y/m
edia
cen
ter s
urve
yH
SES=
HS
Effe
ctiv
enes
s St
udy
5FU
=5th
follo
w-u
p da
ta c
olle
ctio
nF=
Faci
litie
s ch
eckl
ist
D=D
ropo
ut S
urve
y
Age
BY
2FU
1FU
3FU
4FU
PST
5FU
2FU
-PST
1FU
BY-
CT-P
3FU
BY-C
T-P-
A
3FU
2FU
1FU
-CT-
A-D
4FU
HST
2FU
-CT-
P-T-
A-H
ST-H
SES-
D
3FU
4FU
-PST
1FU
-CT-
T-A-
BYI
-HSE
S-D
BY-C
T-P-
T-A
BY-C
T-P-
T-A-
L-F
1FU
-CT-
A-H
ST-D
Year
of D
ata
Col
lect
ion
Year in School
1213151617181920212223242526272829303132
6789101112
12+1
12+2
12+3
12+4
12+5
12+6
12+7
12+8
12+9
12+1
0
12+1
1
12+1
2
12+1
3
12+1
4
1979
1972
1980
2000
1973
1974
1975
1976
1977
1978
1981
1982
1983
1984
1985
1986
1987
1988
1989
1990
1991
1992
1993
1994
1995
1996
1997
1998
1999
2001
2002
2003
2004
2005
2006
2007
PST
14
ELS:
2002
NEL
S:88
HS&
B: S
opho
mor
e C
OH
OR
TH
S&B:
Sen
ior C
OH
OR
TN
LS-7
2
SFA
SFA
2 FU

Introduction
4
A wide variety of data were collected in the NLS-72 surveys. For example, in addition to background information about the student and his or her family, the base-year and follow-up surveys collected data on each respondent’s educational activities (e.g., schools attended, grades received, degree of satisfaction with education institutions). Participants were also asked about their work experiences, periods of unemployment, job satisfaction, military service, marital status, and children. Attitudinal information on self-concept, goals, and community involvement, and personal evaluations of educational activities were also included in the study.
High School and Beyond (HS&B)
Almost 10 years after the start of NLS-72, the second in the series of NCES longitudinal studies was launched. High School and Beyond (HS&B) included one cohort of high school seniors comparable to the NLS-72 sample; however, the study also extended the age span and analytical range of NCES’ longitudinal studies by surveying a sample of high school sophomores. Base-year data collection took place in the spring of the 1979-80 academic year with a two-stage probability sample. More than 1,000 schools served as the first-stage units, and 58,000 students within these schools were the second-stage units. Both cohorts of HS&B participants were resurveyed in 1982, 1984, and 1986; the sophomore group also responded in 1992.2 In addition, data were collected from teachers, principals, and parents to better understand the school and home contexts for the sample members. As in NLS-72, secondary and postsecondary transcripts were collected for the HS&B cohorts.
With the study design expanded to include a sophomore cohort, HS&B provided critical data on the relationships between early high school experiences and students’ subsequent educational experiences in high school. For the first time, national data were available showing students’ academic growth over time and how family, community, school, and classroom factors promoted or inhibited student learning. Researchers were able to use data from the extensive battery of cognitive tests within the longitudinal study to assess growth in cognitive abilities over time. Moreover, data were then available to analyze the school experiences of students who later dropped out of high school. These data became a rich resource for policymakers and researchers over the next decade and provided an empirical base to inform the debates of the educational reform movement that began in the early 1980s.3
2 For further documentation, see Zahs, D., Pedlow, S., Morrissey, M., Marnell, P. and Nichols, B. (1995). High School and Beyond Fourth Follow-Up Methodology Report. Washington, D.C.: U.S. Department of Education, National Center for Education Statistics, NCES 95-426). 3 For a summary of reforms instituted between the time the HS&B cohort was in high school and the NELS:88 cohort was in middle/junior high and high school, see Rasinski, K., Ingels, S.J., Rock, D.A., and Pollack, J.M. (1993). America’s High School Sophomores: A Ten Year Comparison, Washington, D.C.: U.S. Department of Education, National Center for Education Statistics, (NCES 93-087); or Barton, P., and Coley, R. The Education Reform Decade, 1990, Princeton, NJ: Educational Testing Service.

Introduction
5
National Education Longitudinal Study of 1988 (NELS:88)
Much as NLS-72 captured a high school cohort of the 1970s and HS&B high school cohorts of the 1980s, NELS:88 was designed to study high school students of the 1990s—but with a premeasure of their achievement and status, prior to their entry into high school. Data collection for the National Education Longitudinal Study of 1988 was initiated with the 8th grade class of 1988. At that time, NELS:88 was the most ambitious longitudinal study undertaken by NCES. It further extended the age and grade span of NCES longitudinal studies by collecting data from a middle school/junior high school cohort. Along with the student survey, NELS:88 included surveys of parents, teachers, and school administrators. By beginning with the 8th grade, NELS:88 was able to capture the population of early dropouts—those who left school prior to spring term of 10th
grade—as well as later dropouts (who left after spring of 10th grade) as had been studied in HS&B. The study was designed not only to follow a cohort of students over time (as had the predecessor studies), but also to “freshen” the sample at each of the first two follow-ups, and thus to follow multiple grade-defined cohorts over time. Thus, 10th grade and 12th grade cohorts were included in NELS:88 in the first follow-up (1990) and the second follow-up (1992), respectively. The freshening of the sample not only provided comparability to earlier cohorts from NLS-72 and HS&B, but it enabled researchers to conduct both grade representative cross-sectional and subsequent longitudinal analyses with the data. In late 1992 and early 1993, high school transcripts were collected for sample members, and, in the fall of 2000 and early 2001, postsecondary transcripts were collected, further increasing the analytic potential of the data. Consequently, NELS:88 represents an integrated system of data that tracked students from middle school through secondary and postsecondary education, labor market experiences, and marriage and family formation.4
Education Longitudinal Study of 2002 (ELS:2002).
This section introduces ELS: 2002, lists some of the major research and policy issues that the study will address, and explains the four levels of analysis – cross-sectional, longitudinal, cross-cohort, and international comparison – that can be conducted with ELS: 2002 data. This section also provides a rough schedule for major ELS: 2002 products and results.
ELS:2002: Purposes and Features.
The Education Longitudinal Study of 2002 (ELS: 2002) is designed to monitor the transition of a national sample of young people as they progress from tenth grade through high school and on to postsecondary education and/or the world of work.
ELS: 2002 has two distinctive features. First, it is a longitudinal study, in which the same individuals are surveyed repeatedly over time. Second, in the high school years, it a multilevel study, involving multiple respondent populations that represent students, their parents, their teachers, and their schools. Each of these two features – the 4 For more detailed information about NELS:88, see Curtin, T. R., Ingels, S.J., Wu, S., and Heuer, R. 2002. NELS:88 Base Year to Fourth Follow-up Data File User's Manual, Washington, DC: U.S. Department of Education, National Center for Education Statistics (NCES 2002-323).

Introduction
6
longitudinal nature of the ELS: 2002 design, and its multilevel focus – will be explained in greater detail in the next two paragraphs.
ELS: 2002 is a longitudinal study – it will follow the same individuals – a cohort of high school students – over time. The transition through high school and beyond into postsecondary institutions and the labor market is both complex (there are many different pathways that youth may follow) and prolonged (it takes place over a period of years) – the complexity and timeframe for this transition make longitudinal approaches especially appropriate. By surveying the same young people over time, it is possible to record the changes taking place in their lives. It is also possible to explain these changes, that is, to understand the ways that earlier achievements, aspirations and experience predict and influence what happens to them later. In the first year of data collection (the 2002 base year) ELS:2002 will measure students’ tested achievement in reading and mathematics. ELS: 2002 will also obtain information from students about their attitudes and experiences. These same students will be tested and surveyed again, in a follow-up to take place in two years time, to measure changes such as achievement gains in reading and mathematics, as well as to investigate changes in status such as the situation of students who drop out of school as contrasted to those who persist in their education.Cohort members will be followed for a number of years (probably about 10) thereafter so that later outcomes (such as their access to and persistence in higher education, or their success in the labor market) can be understood in terms of their earlier aspirations, achievement and high school situation.
ELS: 2002 will gather information at multiple levels. It will obtain information not just from students and their school records, but also from students’ parents, their teachers, and the administrators (principal and library media center director) of their schools. Data from their teachers, for example, will provide information about the student and the teachers’ backgrounds and activities. Additionally, teacher reports will provide information about the school, as seen from the teacher’s perspective. This multilevel focus will supply researchers with a comprehensive picture of the home, community and school environments and their influences on the student.
Using this multilevel and longitudinal information, the base year (2002) and first follow-up (2004) of ELS: 2002 will help researchers and policy makers to explore and better understand such issues as the importance of home background and parental aspirations for their child’s success; the influence of different curriculum paths and special programs; the effectiveness of different high schools, and whether their effectiveness varies with their size, organization, climate or ethos, curriculum, academic press, or other characteristics. These data will facilitate understanding of the impact of various instructional methods and curriculum content and exposure in bringing about educational growth and achievement
After the high school years, ELS: 2002 will continue to follow its sample of students into postsecondary education or the labor market. For students who continue on to higher education, ELS: 2002 will measure the effects of their high school careers on subsequent access to postsecondary institutions, their choices of institutions and programs, and as time goes on, their postsecondary persistence, attainment, and eventual

Introduction
7
entry into the labor force and adult roles. For students who go directly into the work force (whether as dropouts or high school graduates), ELS: 2002 will be able to determine how well high schools have prepared these students for the labor market and how they fare within it.
ELS:2002 Research and Policy Issues.
Apart from helping to describe the status of high school students and their schools, ELS: 2002 will provide information to help address a number of key policy and research questions. Issues that can be addressed with data collected in the high school years include the following: Students’ academic growth in math and reading The process of dropping out of high school The role of family background and the home education support system in
fostering students’ educational success The features of effective schools The impact of course taking choices on success in the high school years (and
thereafter) The equitable distribution of educational opportunities as registered in the
distinctive school experiences and performance of students from various groups:students in public and in private high schools; language minority students; students with disabilities; students in urban settings, suburban and rural; students from upper, middle, and lower socioeconomic status levels; and male and female high school students
Steps taken to facilitate the transition from high school to postsecondary education or the world of work
After ELS: 2002 students have completed high school, a new set of issues can be examined. These issues include: The later educational and labor market activities of high school dropouts The transition of those who do not go directly on to postsecondary education to
the world of work Access to and choice of undergraduate and graduate educational institutions Persistence in attaining postsecondary educational goals Progress through the postsecondary curriculum Rates of degree attainment Barriers to persistence and attainment Rate of return on education to both the individual and society Other adult roles, such as family formation and civic participation
The statuses recorded in the post-high school years can generally be regarded as outcomes that can be related back to antecedents in the high school years. In other

Introduction
8
words, ELS: 2002 data can be used to examine the relationship between home background and such school factors as high school course-taking patterns and academic achievement, and subsequent educational and occupational choices and success.
ELS:2002: Levels of Analysis.
The overall scope and design of the study provide for four analytical levels: cross-sectional profiles of the nation’s high school sophomores and
seniors (as well as dropouts after spring of the sophomore year); longitudinal analysis (including examination of life course changes); intercohort comparisons with American high school students of earlier
decades; international comparisons: U.S. 15-year-olds, 15-year-olds in other
nations.
Cross-sectional profiles. Cross-sectional data will permit characterization of the nation’s high school sophomores in the spring of the 2001-2002 school year an will be available with the study’s base year results. Because of sample freshening, the results two years later will provide a basis for profiling the nation’s high school seniors in the spring term of the 2003-2004 school year.
Longitudinal analysis. The primary research objectives of ELS: 2002 are longitudinal in nature. The study provides the basis for within-cohort comparison by following the same individuals over time in order to measure achievement growth in mathematics and reading, and record key transitions. Priority has therefore been placed on items expected to be most useful for predicting or explaining future individual- and group-level achievement, behavioral, and affective outcomes.
Intercohort comparisons. As part of an important historical series of studies which repeats a core of key items each decade, ELS: 2002 offers the opportunity for the analysis of trends in areas of fundamental importance, such as patterns of course-taking and academic performance. For example, researchers will be able to compare ELS: 2002 high school seniors’ experience, attitudes and achievement in 2004 with that of NELS:88 seniors in 1992, HS&B seniors in 1980 and 1982, and NLS-72 seniors in 1972. Such cross-cohort comparisons are of particular importance to measuring the nation’s goals in achieving equity in educational opportunities and outcomes, and in measuring the success of school reform and related initiatives. Trend comparisons can also be made with academic transcript data containing students’ high school course histories and sequences, since comparable transcript studies have been conducted, starting with HS&B (1982) and including NELS:88 (1992) and NAEP (1987, 1990, 1994, 1998 and 2000).
International comparisons. A feature of ELS: 2002 that expands its power beyond that of the predecessor studies is that it will be used to support international comparisons. Items have been included on the ELS: 2002 achievement tests from an international assessment series, the Program in International Student Assessment (PISA).
Introduction
9
The Organization for Economic Cooperation and Development’s (OECD’s) PISA5 is an internationally standardized assessment, jointly developed by the 32 participating countries (including the United States) and administered to 15 year-olds in groups in their schools. PISA covers three domains: reading literacy, numeracy and scientific literacy – a subset of the PISA reading literacy and numeracy items have been included on ELS: 2002. PISA aims to define each domain not merely in terms of mastery of the school curriculum, but also in terms of important knowledge and skills needed in adult life. Emphasis is placed on the mastery of processes, the understanding of concepts and the ability to function in various situations within each domain .
Because of this overlap of items, the ELS: 2002 and PISA tests can be put on the same scale. Though ELS: 2002 is a grade cohort (sophomores) and PISA an age cohort (15 year olds), there is also overlap in sample eligibility (most tenth graders are about 15 years old). Because of the item and sample overlap, ELS:2002 results can be compared with the international results from PISA. Because ELS: 2002 is longitudinal, ELS: 2002 can relate the PISA assessment scores to long-term outcomes (that is, one can see what a particular score on the PISA scale means in terms of longitudinal outcomes, such as postsecondary attainment).
Schedule for release of results and related products:
By mid-2003, the following base year products will be available:
Data files for all study components, including a public use version of the data, accompanied by special data extraction software.
A user’s manual documenting survey procedures and providing guidance for access to the data set.
A descriptive summary report, to make available to the public key findings from the base year study.
Additional reports on selected topics will be prepared under government sponsorship; it is anticipated that non-government researchers will also make extensive use of the released data and publicly publish or report their results.
By mid-2005, the following first follow-up products will be available:
Combined base year-first follow-up data files, including a public use version of the data, accompanied by special data extraction software.
Data file user’s manuals and descriptive reports will also be produced and released.
5 See M. Lemke, et al., (2001), Outcomes of Learning: Results From the 2000 Program for International Student Assessment of 15-Year-Olds in Reading, mathematics, and Science Literacy. (NCES 2002-115). Washington, D.C.: U.S. Department of Education, National Center for Education Statistics.

Introduction
10
Overview of the Base Year Field Test.
The overall purpose of the base year field test was to provide a trial and evaluation of the instruments, forms, sampling, data collection and processing procedures to be used in the main study one year later. As well, the field test provided a basis for evaluating the adequacy of the study design. A major product of the field test will be the recommendations, contained in this report, for how study instrument and procedures can be improved. Data generated in the field test has been used to guide both the final choice of test and questionnaire items and to support specific recommendations for the revision of questionnaire and test items and survey procedures.
The overall design for the field test included testing the process of gaining state, district, and school cooperation, and implementing the six main data-gathering components of the study: a student survey, including both achievement tests and a questionnaire; a parent survey; a teacher survey; a school administrator survey; a survey of library media specialists; and completion of a checklist on the school's facilities and physical plant. A special aspect of data collection procedures that was assessed in the field test was the use of a two-stage adaptive testing format for the assessments in mathematics and reading.
Instruments have been evaluated in a number of ways. For the questionnaires, analyses include evaluation of item nonresponse, test-retest reliabilities, scale reliabilities, and correlations between theoretically-related measures. For the achievement tests in mathematics and reading, item parameters were estimated for both tenth and twelfth grade, and both classical and Item Response Theory techniques employed to determine the most appropriate items for inclusion in the final (base year) forms of the two tests.
The sample for the field test comprised over 50 public and private schools in the five field test states. The states – New York, North Carolina, Texas, Illinois, and Florida – were chosen on the basis of their demographic heterogeneity and regional representativeness. Approximately 26 sophomores and 26 seniors were selected per school. The field test differs from the full-scale study in its requirements in that it is necessary in the field test to collect test observations from both sophomores and seniors at the same time: test items selected for sophomores should be items that show gain at twelfth grade.
The field test for the first follow-up of ELS: 2002 will be held in the spring of 2003. At that time the study will follow base year sophomore cohort participants, and return to the same schools that participated in the base year (2001) field test.
More detailed description of the field test, analysis of field test results, and recommendations for the main study, are set out in the seven chapters that follow.

11
Chapter 1 Field Test Preparation: Sampling and Instrumentation
1.1. Sample Design and Selection
RTI used the field test as a trial and evaluation of the major features of the sample design and sample selection to be used in the main study. Specific features of the sampling plan that were implemented and evaluated include the following:
• selection of field test states (section 1.1.1) • school sample selection and evaluation of the sampling frame (section 1.1.2) • student sampling (section 1.1.3) • oversampling of targeted policy relevant student populations (section 1.1.3) • student eligibility, inclusion and exclusion (section 1.1.3) • sampling of other respondent populations, including teachers, school
administrators, parents, and library media specialists (section 1.1.4).
Each section describes field test procedures, evaluation of the procedures, and recommendations for the main study.
1.1.1. Selection of the Field Test States
RTI selected five states to participate in the ELS:2002 field test: New York, California, Florida, Illinois, and North Carolina. However, the field test came at an awkward time for California public schools in that they were busy with new state initiatives. RTI therefore agreed with state officials that it would be prudent to conduct the field test elsewhere and return only for the main study. Because of its size and heterogeneity (including a large Hispanic population), RTI selected Texas to participate in the field test. Texas had been a field test state in both HS&B and NELS:88. Some of the largest and most politically important school systems are in these states. In addition, this mix of states represents regional variations that may be important in a national study, and offers schools that allowed RTI to represent considerable sociodemographic heterogeneity in the field test sample. Having schools in North Carolina allowed RTI to easily observe field test surveys nearby and therefore learn more from the field test. Schools in these states provided an excellent opportunity to test RTI’s methods and procedures in a realistic operational environment.
Chapter 1 Field Test Preparation: Sampling and Instrumentation
12
1.1.2. School Sampling
1.1.2.1 Procedures and Results of School Sampling
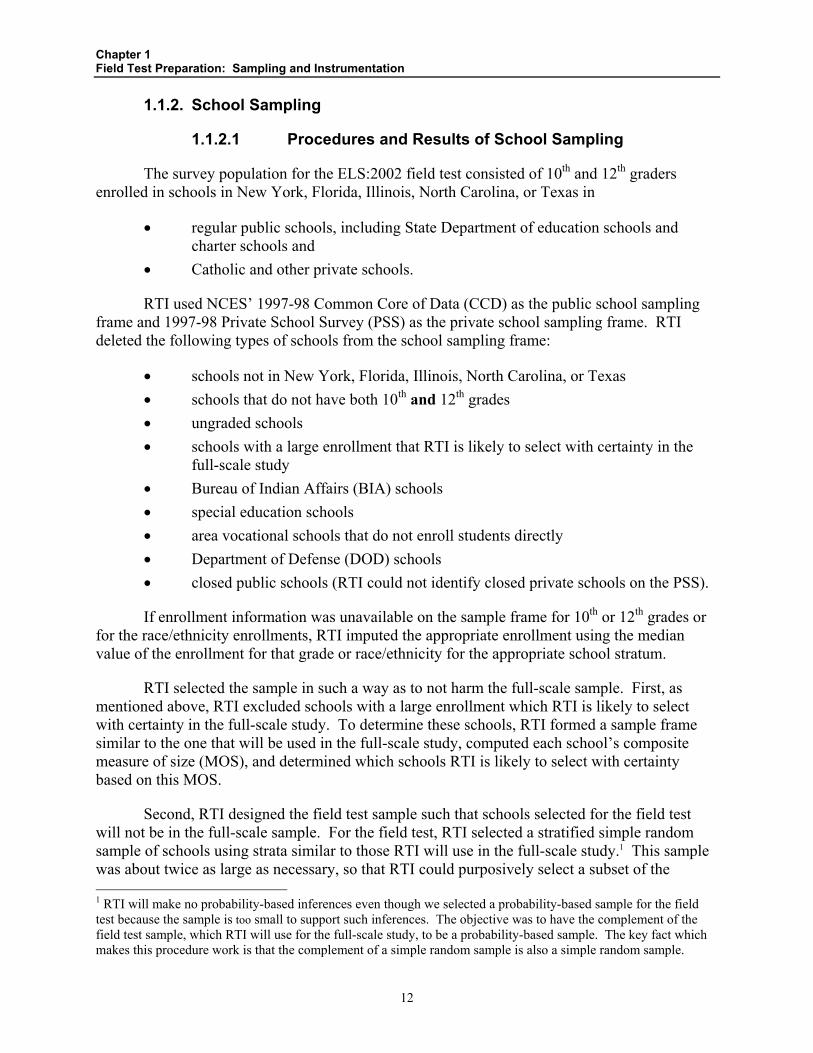
The survey population for the ELS:2002 field test consisted of 10th and 12th graders enrolled in schools in New York, Florida, Illinois, North Carolina, or Texas in
regular public schools, including State Department of education schools and charter schools and
Catholic and other private schools.
RTI used NCES’ 1997-98 Common Core of Data (CCD) as the public school sampling frame and 1997-98 Private School Survey (PSS) as the private school sampling frame. RTI deleted the following types of schools from the school sampling frame:
schools not in New York, Florida, Illinois, North Carolina, or Texas schools that do not have both 10th and 12th grades ungraded schools schools with a large enrollment that RTI is likely to select with certainty in the
full-scale study Bureau of Indian Affairs (BIA) schools special education schools area vocational schools that do not enroll students directly Department of Defense (DOD) schools closed public schools (RTI could not identify closed private schools on the PSS).
If enrollment information was unavailable on the sample frame for 10th or 12th grades or for the race/ethnicity enrollments, RTI imputed the appropriate enrollment using the median value of the enrollment for that grade or race/ethnicity for the appropriate school stratum.
RTI selected the sample in such a way as to not harm the full-scale sample. First, as mentioned above, RTI excluded schools with a large enrollment which RTI is likely to select with certainty in the full-scale study. To determine these schools, RTI formed a sample frame similar to the one that will be used in the full-scale study, computed each school’s composite measure of size (MOS), and determined which schools RTI is likely to select with certainty based on this MOS.
Second, RTI designed the field test sample such that schools selected for the field test will not be in the full-scale sample. For the field test, RTI selected a stratified simple random sample of schools using strata similar to those RTI will use in the full-scale study.1 This sample was about twice as large as necessary, so that RTI could purposively select a subset of the 1 RTI will make no probability-based inferences even though we selected a probability-based sample for the field test because the sample is too small to support such inferences. The objective was to have the complement of the field test sample, which RTI will use for the full-scale study, to be a probability-based sample. The key fact which makes this procedure work is that the complement of a simple random sample is also a simple random sample.

Chapter 1 Field Test Preparation: Sampling and Instrumentation
13
schools to be sample schools. An important benefit of this method of selecting the schools for the field test is that RTI can use more recent versions of the CCD and PSS for the full-scale sampling frame (i.e., the 1999-2000 CCD and PSS) without losing the ability to generalize to the full population. For the full-scale study, RTI will delete field test sample schools from the frame, and each school on the sampling frame will receive a first-stage sampling weight based on the probability that it was not selected for the field test. These weights will be 1.0 for schools not on the field test frame (e.g., certainty schools, new schools, and schools not in the field test states) and will be only slightly greater than 1.0 for the other schools because of the small numbers of schools that RTI will select from each stratum for the field test sample. This method makes no assumptions for the field test and full-scale study sampling frames. The impact of a school closing between the field test and full-scale study should be negligible since RTI will be selecting a probability-proportionate-to-size (PPS) sample of schools for the full-scale study. However, for the full-scale sample schools, RTI will post-stratify the student counts, so that RTI accounts for any differences between the field test and full-scale frames. In order for the sample to be properly allocated for the full-scale study, RTI will allocate the sample before deleting the field test sample schools from the frame, and the full-scale strata need to include the field test strata (See section 1.1.2.3).
RTI selected 160 public and 40 private schools for the field test school sample. RTI stratified the sampling frame by the five states, sector (public, Catholic, and other private), and urbanicity. RTI defined urbanicity as:
Urban: the school is in a large or mid-size central city Suburban: the school is in a large or small town or is on the urban fringe of a large
or mid-size city Rural: the school is in a rural area.
The goal was to have 50 participating schools (i.e., schools providing student lists for sample selection). To ensure 50 participating schools, RTI produced a sample of schools to use as replacement schools in case of school refusal or ineligibility. From the sample of 200 schools, RTI purposively selected half of the schools within each stratum for a sample of 100 schools, and the remaining 100 schools were placed in a reserve pool. Then, RTI purposively assigned 50 of the sample schools to be in the main sample and the other 50 to be in the replacement pool. When a school was ineligible or a nonrespondent, RTI replaced that school with a school from the replacement pool. RTI included 49 of the 50 schools from the replacement pool. RTI did not include any schools from the reserve pool. Table 1-1 shows the number of sampled schools.
After RTI selected the sample of public schools, RTI contacted state education agencies to obtain permission to contact districts and schools in the state. RTI determined in which school districts the sample schools were located. RTI recruited these school districts for their cooperation to allow the sample schools to participate; district-level interviews were not part of the study design.
After RTI selected the school sample and identified the districts for public schools, RTI sent the sample schools and districts to Quality Education Data, Inc. (QED) for them to match the sample with the most recent QED database. For matching schools, QED provided us with the principal’s name. For matching public districts, QED provided us with superintendent’s

Chapter 1 Field Test Preparation: Sampling and Instrumentation
14
name. For Catholic schools, QED provided us with the name of the diocese and locating and contacting information for the diocese. RTI needed this information for our initial contacts with the schools, districts, and dioceses. For schools and public districts that did not match to the QED, RTI obtained current principal or superintendent information from the Internet. For Catholic schools that did not match to the QED, RTI identified the diocese from the Internet.
Table 1-1.—School sampling, district approval, eligibility, and list-providing by sampling stratum
Sampled schools District approval Eligible schools Provided lists School sampling stratum Number Percenta Number Percentb Number Percentb Number Percentc
Total 99 100.00 80 80.81 95 95.96 53 55.79 Public 80 80.81 61 76.25 80 100.00 48 60.00 Catholic 7 7.07 7 100.00 7 100.00 3 42.86 Other private 12 12.12 12 100.00 8 66.67 2 25.00 Urban 36 36.36 32 88.89 35 97.22 20 57.14 Suburban 33 33.33 21 63.64 31 93.94 13 41.94 Rural 30 30.30 27 90.00 29 96.67 20 68.97 Florida 20 20.20 19 95.00 19 95.00 13 68.42 Illinois 20 20.20 16 80.00 19 95.00 10 52.63 New York 19 19.19 13 68.42 18 94.74 8 44.44 North Carolina 20 20.20 17 85.00 19 95.00 11 57.89 Texas 20 20.20 15 75.00 20 100.00 11 55.00 aPercent is based on overall total within column. Details may not sum to 100 percent due to rounding. bPercent is based on number sampled within row. cPercent is based on number eligible within row.
1.1.2.2 Evaluation of Sampling Frame and Procedures
Table 1-1 shows that for the 99 sample schools, RTI received district approval for 80 schools. Only four of these schools were ineligible. The 95 eligible schools yielded 53 (55.8 percent) schools that provided lists.
1.1.2.3 Recommendations for the Main Study
The survey population for the ELS:2002 full-scale study will consist of 10th graders in the 2002 spring term enrolled in the United States in
regular public schools, including State Department of education schools and charter schools and
Catholic and other private schools.
RTI will use NCES’ preliminary 1999-2000 Common Core of Data (CCD) as the public school sampling frame and provisional 1999-2000 Private School Survey (PSS) as the private school sampling frame. RTI recommends deleting the following types of schools from the school sampling frame:
schools with no 10th grade schools with no enrollment ungraded schools

Chapter 1 Field Test Preparation: Sampling and Instrumentation
15
Bureau of Indian Affairs (BIA) schools special education schools area vocational schools that do not enroll students directly schools that are detention centers or correctional facilities Department of Defense (DOD) schools outside of the United States closed public schools (RTI could not identify closed private schools on the PSS).
RTI will select a probability-proportionate-to-size (PPS) sample of approximately 1,600 (1,200 public, 400 private) schools from the school sampling frame. RTI plans to stratify the sampling frame for public schools by the nine-level Census divisions defined as:
New England/Middle Atlantic: CT ME MA NH NJ NY PA RI VT East North Central: IL IN MI OH WI West North Central: IA KS MN MO NE ND SD South Atlantic: DE DC FL GA MD NC SC VA WV East South Central: AL KY MS TN West South Central: AR LA OK TX Mountain: AZ CO ID MT NV NM UT WY Pacific: AK CA HI OR WA.
Each region containing a field test state will be substratified to allow for correct allocation and selection of the school sample. Also, states expected to have a public school sample of at least 30 will be substratified to provide a state representative sample. Within each public school regional stratum or substratum, the schools will be stratified by urbanicity, as defined in section 1.1.2.1. Within each explicit stratum, RTI plans to implicitly stratify by state and measure of size.
RTI will stratify the sampling frame for private schools by Catholic and other private schools. RTI will then stratify by the four-level Census regions defined as:
Northeast: CT ME MA NH NJ NY PA RI VT Midwest: IL IN IA KS MI MN MO NE ND OH SD WI South: AL AR DE DC FL GA KY LA MD MS NC OK SC TN TX VA WV
West: AK AZ CA CO HI ID MT NV NM OR UT WA WY.
Each region containing a field test state will be substratified to allow for correct allocation and selection of the school sample. Within each private school regional stratum or substratum, the schools will be stratified by urbanicity, as defined in section 1.1.2.1. Within each explicit stratum, RTI plans to implicitly stratify by religious affiliation and measure of size.
The sample size goal is to have 800 (600 public, 200 private) participating schools. RTI recommends selecting a sample of 1,600 schools to compensate for the anticipated school nonresponse. RTI suggests using a hybrid approach between using a reserve sample of schools and inflating the school sample size based on expected response rates. RTI would randomly

Chapter 1 Field Test Preparation: Sampling and Instrumentation
16
divide the 1,600 sample schools into release pool 1 (1,000 schools), release pool 2 (143 schools), and a reserve pool (457 schools). All pool 1 schools will be initially released with pool 2 and reserve pool schools being released randomly within stratum, as necessary.
The study representatives for the 2002 National Assessment of Educational Progress (NAEP) have agreed to try to minimize overlap with ELS sample schools in their national school sample selection. They will most likely be able to avoid the majority of ELS schools, especially public schools and schools in release pools 1 and 2. School sampling for the national NAEP 2004 will also likely try to minimize overlap with ELS. Sample overlap between ELS and state NAEP 2002 will not be minimized since the state NAEP sample students will be eighth graders and usually not in high schools. In 2004, SASS can avoid the ELS sample schools, if desired.
Some states may want a state representative sample. RTI would select any state samples as supplemental samples after drawing the national sample. Selecting the state samples in this manner will allow us to not compromise the national design for the promise of state supplements.
1.1.3. Student Sampling
1.1.3.1 Procedures for Sampling Students
RTI asked each field test sample school to provide an electronic or hard-copy listing of all their 10th and 12th grade students currently enrolled.
The information requested for each eligible student was: student ID number Social Security Number (may be the same as the ID number; this item was optional) full name sexrace (white; black; Asian; Native Hawaiian or Other Pacific Islander; American Indian or Alaska Native; other) ethnicity (Hispanic indicator, regardless of race) whether or not an Individualized Education Program (IEP) has been filed for the student (yes, no).
RTI needed the race/ethnicity variables to allow us to oversample Asians and Hispanics.
RTI requested that the electronic list be a column formatted or comma delimited ASCII file or an Excel file. Schools were able to provide the electronic lists via e-mail, using File Transfer Protocol (FTP), or providing a diskette or CD-ROM containing the file. If the school could not provide electronic lists, then RTI asked for hard-copy lists, preferably in alphabetic order within race/ethnicity strata to facilitate stratified systematic sampling. RTI, of course, accepted whatever the school could provide to select the student samples; however, RTI made every effort to facilitate receiving uniformly formatted electronic files from as many schools as possible because RTI could process them more quickly, more reliably, and at less cost.

Chapter 1 Field Test Preparation: Sampling and Instrumentation
17
RTI performed quality assurance (QA) checks on all lists RTI received. Any lists that were unreadable would immediately fail the QA checks. Any school that sent a list of only 10th
graders or only 12th graders would also fail the QA checks. Since RTI stratified the students by Hispanics, Asians, and other race/ethnicity, the list failed the QA checks if it did not allow RTI to stratify the students.
RTI also checked the school’s count of 10th and 12th grade students to verify that the school provided a complete list of eligible students. RTI compared the provided count of 10th
and 12th graders with the count on the frame (CCD or PSS). The CCD contains flags that identify if the enrollment has been imputed, but the PSS does not contain such flags. For schools with an imputed enrollment, RTI did not compare the counts, and the list passed the QA check. For schools with reported enrollment, if any of the counts of 10th and 12th graders for total students or by the race/ethnicity strata on the provided list were 25 percent lower or higher than the frame counts, then the list failed the QA check unless the absolute difference was less than 100.
Schools that failed the QA check were recontacted by the school recruiter to resolve the discrepancy and to verify that the school representative who prepared the student lists clearly understood our request and provided lists of the eligible students. When RTI determined that the initial list provided by the school was not satisfactory, RTI requested a replacement list. If the school confirmed that the list was correct or if the school sent a replacement list, RTI proceeded with selecting sample students. If the school refused to send a replacement list, then RTI proceeded with selecting sample students, if possible.
RTI did not exclude any students from the sampling frame because of disabilities or language problems (as was done in NELS:882 and prior studies). If these students could not complete the student questionnaires or cognitive tests, RTI excused them from doing so, and tried to collect status information from teachers, principals, and parents through those questionnaire components of ELS:2002. Foreign exchange students were ineligible for the study.
RTI randomly selected a sample of approximately 25 10th graders and 25 12th gradersfrom each of the 53 schools. RTI oversampled Hispanic and Asian students by allocating a sample size of 175 Hispanic students in each grade and 150 Asian students in each grade. To accommodate the oversampling, RTI stratified the students within each grade level by Hispanic, Asian, and other race/ethnicity. If a student was both Hispanic and Asian, RTI would place that student in the Hispanic student stratum.
RTI sampled students from schools on a flow basis as RTI received student lists. RTI used stratified systematic sampling procedures for both electronic and hard-copy lists. For each school, RTI fixed the student sample rates rather than the student sample sizes for the following reasons:
to facilitate sampling students on a flow basis as RTI received student lists, and
2 See Ingels, S.J., (1996). Sample Exclusion in NELS:88: Characteristics of Base Year Ineligible Students; Changes in Eligibility Status After Four Years. (NCES 96-723). Washington, D.C.: U.S. Department of Education, National Center for Education Statistics.

Chapter 1 Field Test Preparation: Sampling and Instrumentation
18
because sampling at a fixed rate based on the overall student stratum sampling rate and the school probabilities of selection results in approximately equal overall probabilities of selection within the ultimate school by student strata (which is important for the full-scale study).
For schools that provided electronic lists of students, RTI stratified the lists by race/ethnicity within grade level and selected a stratified systematic sample of students. For schools that provided hard-copy lists, RTI used an efficient two-stage process to select systematic samples from hard-copy lists. RTI first selected sample pages and then selected sample students from the selected pages. RTI set the page sampling rate dependent on the number of students on each page and the number of pages overall. This was particularly efficient for long lists. After RTI selected the sample, RTI keyed the sample. When a hard-copy list included students who must be sampled at different rates (e.g., Hispanic, Asian, and other race students), RTI initially sampled the lists at the highest rate. Then, after RTI keyed the initial sample, RTI subsampled the strata that had the lower sampling rates to achieve the proper sample inclusion rates.
RTI verified that the expected sample size was within reasonable bounds. RTI set a maximum sample size of 32 so that the tests and questionnaires could be administered in one classroom. If the total number of sample students was expected to be less than ten (unless RTI had selected all students) or if the number selected was expected to exceed 32, RTI adjusted the sampling rates accordingly and selected the sample.
RTI selected the student sample in the fall or early winter, when possible, so that RTI could identify sample teachers (see section 1.1.4.1) and prepare materials well in advance of Survey Day.3 However, selecting the sample in advance meant that some students transferred into the sample schools and others left between the time of sample selection and survey day.
For identifying students who transferred into the school since the first list, RTI used a technique known as the “half-open interval rule.” At the time of the initial request for the student lists, RTI informed the school that a second listing of students would be necessary approximately five weeks prior to data collection to allow sample updating. If the school required explicit, or active, parental consent, then RTI requested the second listing approximately seven weeks prior to data collection in order to have enough time to resolve issues related to obtaining permission for students to be in the study. This second list allowed transfer students the opportunity to be selected. The steps in the procedure were as follows:
Step 1: The recruiter requested an updated list of all 10th and 12th grade students. If the school provided electronic lists, then RTI sorted both the first and second lists in the same order. If the school sent hard-copy lists for both the first and second lists, then the school needed to sort the second list in the same way as the first list (e.g., both sorted alphabetically for each stratum), and if the school sent multiple lists per grade the first time, then the school needed to send multiple lists the second time.
3 RTI was still recruiting schools during the spring term, partly due to the late project start, so in some cases initial samples were selected very close to the time of Survey Day.

Chapter 1 Field Test Preparation: Sampling and Instrumentation
19
Step 2: RTI staff then identified the sampled ELS:2002 students on the new list. For students not on this list, RTI determined where they would have been on the list if they were still enrolled.
Step 3: To select transfer students at the same rate as the initial sample, RTI compared the first requested student lists from which RTI selected the sample of approximately 25 10th graders and approximately 25 12th graders to the second lists. If the person immediately following each sampled individual on the second list was not on the first list, then RTI assumed that student to be a transfer student who was then added to the sample. If the last student on the list was a sampled student, then the next student would be the first student on the list (i.e., the list was “circularized”).
Step 4: Whenever RTI added a transfer student to the sample, then RTI determined if the next student on the roster was a transfer student or not. Once RTI identified a student who was not a transfer student, then the process continued for the next sample student on the roster. The sequence of steps 3 and 4 continued, with the addition of more transfer students, until a student who was enrolled at the time of the initial list was reached on the roster.
RTI also used these second lists to identify students who were no longer at the school. If a sample student was not on the second list, then that student was no longer at the school and no longer in the sample. However, RTI still implemented the check for transfer students based on where the student would have been on the second list, if the student was still enrolled.
1.1.3.2. Student Sampling: Evaluation and Results
1.1.3.2.1. Student Sample Selection
Table 1-2 shows that about two-thirds of the schools (66 percent) that sent in lists sent in hard-copy lists even though RTI encouraged schools to send in electronic files. The electronic files were sent via e-mail or on diskette. The majority of the schools that sent hard-copy lists, sent separate lists by grade only (77.1 percent), i.e., they did not send separate lists by race/ethnicity, as requested.
The majority of the lists sent in by schools had no problems and were used to select the student samples. Table 1-3 shows that 12 of the 53 lists had problems. Three of these lists had counts of 10th or 12th graders that were 25 percent greater or less than the expected count indicated on the sampling frame. Nine of the lists did not identify race/ethnicity. Schools with problematic lists were called, and the problem was either resolved over the phone or the school sent in a new list. However, four schools were unable to provide race/ethnicity, so RTI sampled the students from these schools without stratifying, based on the sampling rate for students of other race/ethnicity. Most schools sent only race or ethnicity and not both, usually as one field, but this was not a problem since RTI could still stratify the students.

Chapter 1 Field Test Preparation: Sampling and Instrumentation
20
Table 1-4 shows that RTI expected to select 1,250 10th graders and 1,250 12th graders.However, RTI selected more students than expected: 1,377 10th graders and 1,395 12th graders.The student response rates were less than expected (see section 3.2.1.2), so RTI increased the school sample size to 53 (see section 1.1.2.2). RTI also selected an average of about 26 10th
graders and 26 12th graders per school.
Table 1-2.—Types of student lists provided by schools
Type of list received Frequency PercentTotal 53 100.00 Both electronic and hard-copya 3 5.66 Electronic 15 28.30 Hard-copy 35 66.04 One list 1 2.86 Separate lists by grade only 27 77.14 Separate lists by grade and race/ethnicity 7 20.00 a All three schools that provided both an electronic and hard-copy student list sent the hard-copy lists as separate lists by grade only. In all three cases, the electronic version of the list was used for sampling.
Table 1-3.—Types of problems encountered with student lists
Type of problem Frequency PercentTotal 53 100.00 None 41 77.36 Count out of bounds 3 5.66 Cannot identify strata 9 16.98
Table 1-4.—Expected and achieved student samples by student stratum Students sampled Student eligibilitya
Student stratum Number expected Number achievedb Percent Number eligible Percentc
10th grade 1250 1377 110.16 1296 94.12 Hispanic 175 191 109.14 180 94.24 Asian 150 78 52.00 75 96.15 Other races 925 1108 119.78 1041 93.95 12th grade 1250 1395 111.60 1333 95.56 Hispanic 175 194 110.86 181 93.30 Asian 150 86 57.33 81 94.19 Other races 925 1115 120.54 1071 96.05 aEligibility for this table is based on ability to answer the questionnaire and/or take the test rather than study eligibility. Students who were eligible for the study but unable to participate due to disability or limited English proficiency are considered ineligible for this table. bFour schools did not provide race/ethnicity. cPercent is based on number achieved within row.
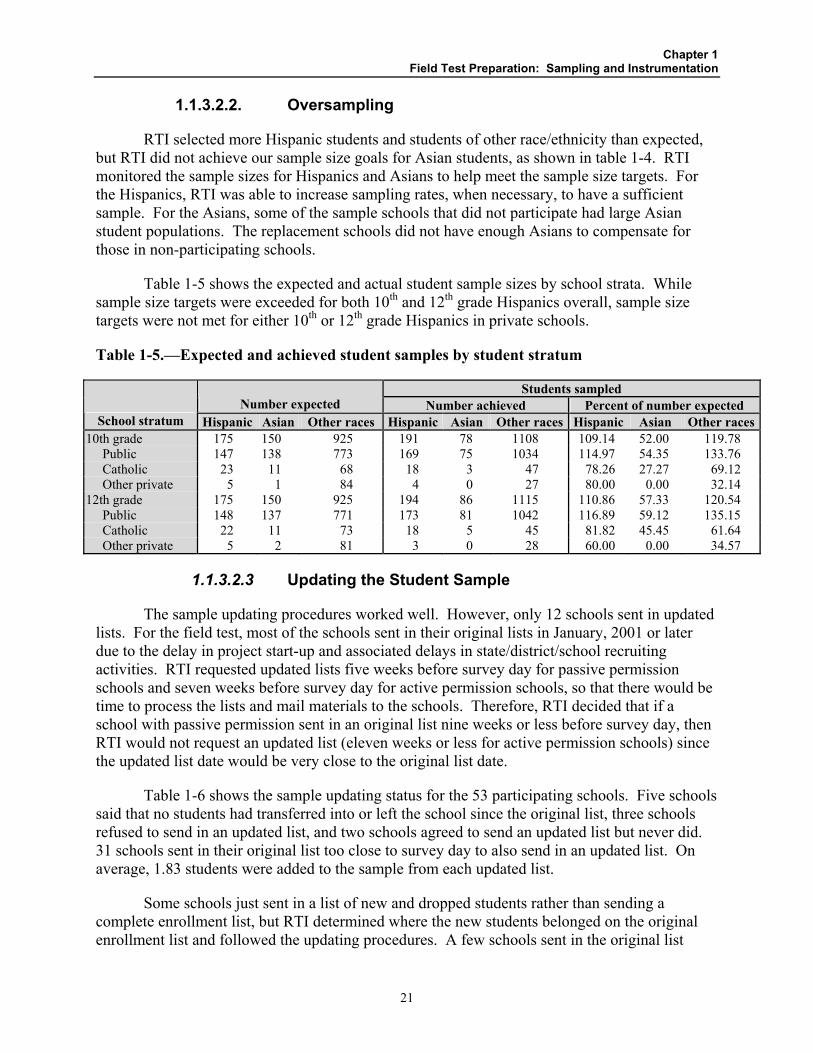
Chapter 1 Field Test Preparation: Sampling and Instrumentation
21
1.1.3.2.2. Oversampling
RTI selected more Hispanic students and students of other race/ethnicity than expected, but RTI did not achieve our sample size goals for Asian students, as shown in table 1-4. RTI monitored the sample sizes for Hispanics and Asians to help meet the sample size targets. For the Hispanics, RTI was able to increase sampling rates, when necessary, to have a sufficient sample. For the Asians, some of the sample schools that did not participate had large Asian student populations. The replacement schools did not have enough Asians to compensate for those in non-participating schools.
Table 1-5 shows the expected and actual student sample sizes by school strata. While sample size targets were exceeded for both 10th and 12th grade Hispanics overall, sample size targets were not met for either 10th or 12th grade Hispanics in private schools.
Table 1-5.—Expected and achieved student samples by student stratum
Students sampled Number expected Number achieved Percent of number expected
School stratum Hispanic Asian Other races Hispanic Asian Other races Hispanic Asian Other races10th grade 175 150 925 191 78 1108 109.14 52.00 119.78 Public 147 138 773 169 75 1034 114.97 54.35 133.76 Catholic 23 11 68 18 3 47 78.26 27.27 69.12 Other private 5 1 84 4 0 27 80.00 0.00 32.14 12th grade 175 150 925 194 86 1115 110.86 57.33 120.54 Public 148 137 771 173 81 1042 116.89 59.12 135.15 Catholic 22 11 73 18 5 45 81.82 45.45 61.64 Other private 5 2 81 3 0 28 60.00 0.00 34.57
1.1.3.2.3 Updating the Student Sample
The sample updating procedures worked well. However, only 12 schools sent in updated lists. For the field test, most of the schools sent in their original lists in January, 2001 or later due to the delay in project start-up and associated delays in state/district/school recruiting activities. RTI requested updated lists five weeks before survey day for passive permission schools and seven weeks before survey day for active permission schools, so that there would be time to process the lists and mail materials to the schools. Therefore, RTI decided that if a school with passive permission sent in an original list nine weeks or less before survey day, then RTI would not request an updated list (eleven weeks or less for active permission schools) since the updated list date would be very close to the original list date.
Table 1-6 shows the sample updating status for the 53 participating schools. Five schools said that no students had transferred into or left the school since the original list, three schools refused to send in an updated list, and two schools agreed to send an updated list but never did.31 schools sent in their original list too close to survey day to also send in an updated list. On average, 1.83 students were added to the sample from each updated list.
Some schools just sent in a list of new and dropped students rather than sending a complete enrollment list, but RTI determined where the new students belonged on the original enrollment list and followed the updating procedures. A few schools sent in the original list

Chapter 1 Field Test Preparation: Sampling and Instrumentation
22
electronically but sent a hard-copy updated list. In these cases, RTI printed out the electronic list sorted the same way as the hard-copy list and followed the updating procedures. For one school, RTI selected two new students, but the school indicated that one student had left the school. The school did not want the other student to participate for reasons specific to that student.
Table 1-6.—Updated list status and number of students added Status Frequency PercentTotal 53 100.00 No time for updated list 31 58.49 Request updated list but did not receive 2 3.77 Final refusal for updated list 3 5.66 School has no updated list 5 9.43 Updated list received 12 22.64 Number of students added 22 Average number of students added per updated list 1.83 NOTE: Details do not sum to 100 percent due to rounding.
1.1.3.2.4. Ineligibility and Exclusion
Table 1-4 indicates that 96.7 percent of 10th graders and 97.9 percent of 12th graders sampled were eligible. After RTI selected the sample and sent the list of sampled students to the school, the school indicated if any students could not participate due to disabilities or language problems. RTI worked with the schools to determine if the ineligible students could complete the questionnaire if they could not complete the test or if RTI could collect information for these students from teachers, principals, and parents through those questionnaire components. However, for most students, RTI was not able to collect any information.
1.1.3.3. Recommendations for the Main Study
RTI recommends that information requested for students include one field for race/ethnicity rather than separate fields for race and ethnicity. Based on the field test, this seems to be how a lot of schools keep their records, and schools are therefore unable to provide separate fields. Hispanic students will be classified as such for sampling, and their race is not important for sampling purposes.
To help encourage schools to send in electronic lists, RTI will offer the option of uploading the file to the ELS website. In addition to being another method of submitting electronic files, uploading may also allay any questions a school has concerning protection of the confidentiality of the information on the lists. However, RTI will also be sensitive to the fact that some schools cannot or will not send electronic files and will only participate if they can send hard-copy lists.
All spring term 2002 sophomores in eligible schools except for foreign exchange studentswill be eligible for the study. This means that several categories of students who were ineligible for HS&B and NELS:88 will be eligible for ELS:2002 (though it does not mean that such students will necessarily be tested or complete questionnaires). RTI recommends the following treatment for students with disabilities or insufficient command of the English language:
schools will be given clear criteria for inclusion and exclusion of students

Chapter 1 Field Test Preparation: Sampling and Instrumentation
23
accommodations may be offered to increase the number of participants to the extent possible, given practical and monetary constraints
disability status will be re-assessed in the follow-up round enrollment status, records, and contextual data will be gathered for students
deemed unable to validly be assessed.
RTI recommends increasing the maximum sample size per school from 32 to 35. This will allow RTI to originally select 32 students and then add students during the updating process. Increasing the maximum allows RTI to adjust the fixed sampling rate less often and therefore minimize unequal weighting. RTI thinks that schools can handle Survey Administrators administering tests and questionnaires to 35 students. RTI can adjust sampling rates or subsample students for any schools that will only participate if the sample is smaller than the selected size.
RTI staff will closely monitor the sample size of Hispanics, Asians, and blacks to ensure that the actual sample sizes are close to the planned sample sizes. The composite size methodology used to select schools and using fixed sampling rates for all sample schools will help the targets to be met. However, if schools have less minority students than indicated on the sampling frame, the actual sizes will be less than the planned sizes. The fixed rates will then be changed, as necessary, to allow the targets to be met.
RTI recommends using the new sample updating procedures used in the field test.However, even in the full-scale study, RTI may not have time to get an updated list for some schools because the original list may come in soon before survey day.
1.1.4 Sampling Other Populations
1.1.4.1 Teacher Sampling
The field test included a teacher survey that gathered teacher reports on students’ learning experiences and performance. These data supplement the parent and student reports, providing another viewpoint on the complex issues of what students have achieved as of the 10th grade and what they are being asked to learn in the 10th grade. RTI sampled only mathematics and English teachers of ELS sampled students, so teachers were in sample only if they taught math and/or English students who were sampled for ELS.
Some sample students may have had more than one or no mathematics or English teacher during the 2000-2001 school year (e.g., different teachers for the fall and spring terms). In these situations, RTI used the fall term teacher as the relevant reference point, if possible. RTI decided which mathematics or English teacher, if any, to include in the teacher sample as follows:
If fall teacher A and spring teacher B, then sample fall teacher A If fall teacher A has left the school and spring teacher B is present, then sample spring teacher B If no fall teacher but one spring teacher, then sample spring teacher If no fall teacher but two or more spring teachers, then randomly select one to be in sample

Chapter 1 Field Test Preparation: Sampling and Instrumentation
24
If no spring teacher but fall teacher, then sample fall teacher If two or more fall teachers, then randomly select one to be in sample If no fall teacher and no spring teacher, then no teacher in sample.
Table 1-7 shows the number of sample teachers that taught mathematics, English, or both subjects. The sample counts are also broken out by type of school and urbanicity.
Table 1-7.—Sample teachers by subject taught, school type, and school urbanicity
Frequency Percent Average per responding school Total 644 100.00 12.15 Math 362 56.21 6.83 English 274 42.55 5.17 Both 8 1.24 0.15 Public schools 618 95.96 12.88 Catholic schools 18 2.80 6.00 Other private schools 8 1.24 4.00 Urban 318 49.38 15.90 Suburban 162 25.16 12.46 Rural 164 25.47 8.20
1.1.4.2 School Administrators, Parents, Library Media Specialists
For each sample student, there was one sample parent. RTI followed the NELS:88 procedures of identifying the sample parent by asking which parent, in two-parent households, is most knowledgeable about the student’s educational situation. For one-parent households, that parent was in the sample.
For each sample school, the principal and library media specialist were also in sample.
1.1.4.3 Discussion, Recommendations for Main Study
For the field test, RTI planned to have about 532 sample teachers in 50 schools, but RTI had 644 in 53 schools. For the approximately 800 schools participating in the full-scale study, RTI expects between 8,500 and 9,700 teachers, based on the overall average sample teachers per school in the field test and accounting for the differences between school sample distributions between the main and field test studies. RTI recommends that the teacher, school administrator, parent, and library media specialist full-scale sampling be done similarly to the field test.
1.2 Instrumentation
The primary aim of ELS:2002 data collection is to obtain policy-relevant information concerning the effectiveness of schools, curriculum paths, special programs, and variations in curriculum content and exposure in bringing about achievement growth and other desirable educational outcomes (for example, persistence in high school). The impact of the high school experience on the transition to work or to postsecondary education will also be examined by the study. To this end, the ELS:2002 instrumentation must capture a wide array of factors that will be used as independent, dependent, and control variables in a variety of analyses of educational outcomes and youth transitions. Like its predecessor studies (NLS-72, HS&B and NELS:88),

Chapter 1 Field Test Preparation: Sampling and Instrumentation
25
ELS:2002 has been designed as a multipurpose survey. Rather than optimize the design to answer a single question or limited set of related questions, the goal of ELS:2002 instrument development is to allow researchers and policy makers to use the resultant data to answer a variety of questions within a broad conceptual framework encompassing the basic processes of schooling in the last two years of high school and the transition of adolescents to the labor market, postsecondary education, and adult roles.
Achievement tests in reading and mathematics will capture status (for both 2002 sophomores and 2004 seniors) and change (for example, gains in mathematics knowledge between the sophomore and senior years). The student questionnaire will elicit basic information on family background, student aspirations and attitudes, and experiences in and out of school.Academic transcripts will provide a continuous picture of coursetaking patterns, sequences and results, for all years of high school. The base year teacher questionnaire will obtain information about the mathematics and English teachers of ELS:2002 sample members, including ratings of individual students. The parent survey will add further depth of information about family background, and explores parental attitudes and aspirations for the child, and parental relationship to and interactions with the school. In both the base year and the first follow-up, a school administrator questionnaire will supply information about school organization and practices. A library media center questionnaire and a facilities checklist round out the information to be obtained in the base year. Mappings to Decennial Census zipcode data and other external data sources will further enrich the future ELS:2002 database.
The process of instrument development began well before award of the ELS:2002 contract. Content specification documents were commissioned for the planned achievement tests in reading and mathematics as well as for the student, parent, teacher and school administrator surveys. These documents provide an instrument development framework by identifying the key ELS:2002 research questions, the constructs that must be considered in answering the research questions, and the variables or data elements that can help to inform each construct. The content specification documents drew heavily on existing item pools (e.g., NAEP, NELS:88 and PISA for the achievement tests; NELS:88 for the questionnaires).
Instrument development was guided by the research objectives of ELS:2002.Questionnaires were designed to meet the longitudinal goals of the study; items were chosen based on their utility in predicting or explaining future outcomes as measured in later survey waves. In addition, the student questionnaire in particular was developed to provide continuity and consistency with earlier education longitudinal studies (particularly to the sophomore cohorts of HS&B and NELS:88) so that cross-cohort comparisons could be made and trend analyses conducted. The questionnaires were updated to address new areas of policy concern as well, and to reflect recent advances in theory. (For example, stress was put on adding items about educational technology, since computers have become a major factor in learning in recent years; plans were made to add psychological scales that reflect recent work in self-efficacy theory and related areas). In general, the development and review process for each questionnaire consisted of the following steps (note that specific achievement test items are not subject to TRP, Interdivisional, or OMB review):
1. Draft data elements shared with other government agencies, policy groups, and interested parties;

Chapter 1 Field Test Preparation: Sampling and Instrumentation
26
2. Review by the ELS:2002 Technical Review Panel (a specially appointed, independent group of substantive, methodological, and technical experts);
3. Inter-divisional review at NCES;
4. Survey instruments revised based on reviewer comments;
5. Justification written for components of instruments;
6. Review of instruments by the federal Office of Management and Budget (OMB);
7. Revision of questionnaires based on OMB comments; and
8. Field testing of instruments, and revision based on field test results.
Test and questionnaire data are analyzed later in this report (Chapters 5, 6 and 7) where recommendations are also made as to the inclusion, deletion and revision of specific items.

27
Chapter 2 Securing Cooperation
2.1 Securing Endorsements
Endorsements from nationally recognized organizations are often instrumental in legitimizing research studies to district and school staffs and encouraging their participation. Schools are barraged with requests for research studies each year, so RTI felt that endorsements would increase the chances of being allowed into the schools.
Prior to the start of the field test, RTI identified organizations likely to be influential in the eyes of the various entities being asked to participate in the study (school administrators, librarians, teachers, students, and parents). RTI contacted those organizations to seek endorsement for the study. In most cases RTI mailed study information to the organizations and followed up with a telephone call. RTI received study endorsements from the following organizations:
American Association of School Administrators American Association of School Librarians American Federation of Teachers Council of Chief State School Officers Council of the Great City Schools National Association of Independent Schools National Association of Secondary School Principals National Catholic Educational Association, Department of Secondary Schools National Education Association National Parent Teacher Association National Resource Center for Safe Schools National School Boards Association National School Safety Center
RTI included the list of endorsing organizations in the packet of recruiting materials that was sent at both the district and school levels.
Chapter 2 Securing Cooperation
28
2.2 Securing State Cooperation
In August 2000, ELS project staff began contacting each of the 5 Chief State School Officers (CSSO) from states selected for the field test (California, Florida, Illinois, New York, and North Carolina). Each CSSO was sent an information package. The package was addressed to the CSSO and contained a lead letter from Jeffrey Owings of NCES, a letter from Dan Pratt of RTI, a study brochure, a list of sampled districts and private schools from their state, and a sample endorsement letter. The packages were sent by Federal Express so that RTI could track receipt.
About one week after sending the information package, RTI contacted the CSSOs by telephone. At that time, RTI confirmed the receipt of the package and determined who had been given responsibility for approving the study for the state. RTI then contacted that person to answer any questions and discuss participation.
RTI received permission to proceed to the district level in 4 states. California asked not to participate due to new initiatives in their state that year. RTI substituted the state of Texas for California.
Upon obtaining permission at the state level, RTI asked to identify someone who could serve as a point of contact in case the districts had any questions about the state’s participation. RTI also asked to get a letter of endorsement from the state. RTI provided a sample letter that the states could follow as a template and included a business reply envelope addressed to RTI to facilitate return of an endorsement letter. RTI received endorsement letters from all five field test states.
2.3 Securing District/Diocese and School Cooperation
After receiving state approval, RTI sent an information package to each district/diocese that had sampled schools in the state. The package was addressed to the superintendent and sent by Federal Express. The package contained a lead letter from Jeffrey Owings of NCES, a letter from Dan Pratt of RTI, a study brochure, a list of endorsing agencies, the state endorsement letter, a list of sampled schools from the district, and a sample endorsement letter.
Several days after sending the information package, RTI contacted the superintendents by telephone. The staff of institutional recruiters conducted telephone contacts with the districts and schools. At the time of the call, the recruiting staff confirmed the receipt of the package and determined who had been given responsibility for approving the study for the district/diocese. The recruiter then contacted that person to answer any questions and discuss participation.
RTI received permission to proceed to the school level from 56 out of 73 districts/dioceses (76.7 percent). This represented a total of 68 schools out of 86 among 73 districts (79.1 percent) (note that while there were 80 public and 7 Catholic schools, one Catholic school was independent of diocesan control). As at the state level, RTI

Chapter 2 Securing Cooperation
29
asked approving districts/dioceses to identify a contact person at the district level and to send a letter of endorsement to us.
For public and Catholic schools, RTI began school-level contact right after obtaining district/diocese approval. For private non-Catholic schools, the contact began as soon as RTI received approval at the state level.
As at the higher levels, RTI sent each school an informational package by Federal Express. The package was addressed to the principal and contained the same materials as the district level package. It also contained a district endorsement letter, if provided, and instructions for sending an enrollment list of 10th and 12th grade students.
Several days after the package was sent, RTI contacted the school by telephone.After determining the appropriate person with whom to speak, the recruiter discussed details about the study and answered any questions. If the school agreed to participate, RTI asked to identify a school coordinator. This person served as a point of contact at the school and was responsible for handling the logistical arrangements. RTI also scheduled a date for survey day and make up day. At the same time, RTI obtained the names of the staff who should receive the school administrator and library media center questionnaires.
2.4 Analysis of School Response Rates
RTI began the field test with a sample of 99 schools (80 public, 7 Catholic and 12 non-Catholic private schools). Four of the non-Catholic private schools were determined to be ineligible (2 schools were ungraded, 1 no longer had a high school and 1 was closed). Therefore our total pool of possible schools to recruit at the school level was 95.RTI recruited a total of 53 schools. Public schools had a response rate of 60 percent (48 participated of 80 sampled). Within public schools, RTI had a response rate of 61.5 percent for urban schools (16 of 26 sampled schools participated), 42.9 percent for suburban schools (12 of 28 schools), and 76.9 percent of rural schools (20 of 26 schools).Catholic schools had a response rate of 42.9 percent (3 of 7 sampled schools participated) and non-Catholic private schools had a response rate of 25 percent (2 schools of the 8 eligible schools participated).
2.5 School Response to Incentives and Burden
The most common objections voiced during the recruitment process were concern about burden, loss of instructional time, and overtesting of students. These were the overwhelming reasons cited for refusals both at the district and school level.
In addressing the concerns, RTI offered flexibility in scheduling to the schools.The field test was conducted from mid-February through the end of May so schools could choose a date when they were less busy. In one school, the principal allowed us to administer the questionnaire to the 10th graders but not to test them.
RTI offered some schools an increased school coordinator honorarium based on high student response rates. In schools with no extra coordinator honoraria, RTI had a response rate of 83.7 percent for 10th graders and 75.8 percent for 12th graders. In schools

Chapter 2 Securing Cooperation
30
where RTI provided extra honoraria for high response rates, RTI actually had a lower response rate for tenth graders – 78.1 percent. The response rate for 12th graders was slightly higher at 76.0 percent. However, the increased honorarium was offered to schools scheduled for the end of the data collection period. This is a time that typically suffers from lower response rates (due to busy school calendars – proms, field trips, standardized testing, etc). It is difficult to determine if the lower response rates indicate that the increased honorarium is ineffective or if the response rates would have been even lower without the increased honoraria.
In four of the active consent schools, RTI offered $10 to each participating student. Once again, the results were disappointing. In schools with no incentive, RTI had a 70.9 percent response rate from 10th graders and 62.0 percent from 12th graders. In the schools with the incentive, RTI had response rates of 63.1 percent and 50.4 percent respectively. It should be noted that there were a total of 9 schools that required active consent and the incentive was offered to schools with the later survey dates. Therefore the same confounding variables apply as they did for the additional coordinator honoraria.
2.6 Securing Parental Permission
During the recruitment process, RTI discussed the parental permission process with the schools. RTI offered passive parental consent unless the school expressed the need for active consent. A total of nine of the field test schools (17.0 percent) required active parental consent.
2.6.1 Active Consent
For schools that required active parental consent, RTI sent information packets via Federal Express to all parents for whom RTI had street addresses. If RTI had a post office box address, RTI sent the packets via regular mail (since Federal Express only delivers to street addresses). For those for whom RTI did not have any addresses, RTI sent parent packets to the school for the coordinator to distribute. Each packet contained a letter about the study, a consent form, a brochure about the study, and an envelope bearing the school coordinator’s name so parents could return the consent form approving or refusing permission for their child to participate. In a few cases, the principal had drafted an endorsement letter that was also included. The packets were sent four weeks prior to each school’s scheduled survey day. Prior to survey day, the survey administrators checked with the coordinators to obtain the names of parents who had not yet sent back a consent form. If they were given telephone numbers, the survey administrators telephoned the parents to prompt them to return the forms.
Very few parents returned forms expressing their refusal to let the student take part. However, many parents did not return the form at all. As a result, only 151 of the 232 eligible tenth grade students (65.1 percent) sampled at schools requiring active permission took part in the study. At the twelfth grade level, the participation rate was even poorer: 126 of the 225 eligible students (56.0 percent).

Chapter 2 Securing Cooperation
31
2.6.2 Passive Consent
For schools that allowed passive parental consent, RTI sent letters via 1st class mail to all parents for whom RTI had mailing addresses. For those for whom RTI did not have mailing addresses, RTI sent the parental packets to the school for the coordinator to distribute. The packets contained a letter about the study, a consent form, a brochure about the study, and an envelope bearing the school coordinator’s name so parents could return the consent form if they did not want their students to participate. These letters were sent two weeks prior to the scheduled survey day. Survey administrators contacted the school coordinators prior to survey day to determine if any parents had sent back forms that refused consent. For those parents, the survey administrators attempted refusal conversion if the school was willing to provide telephone numbers.
As with the active consent schools, very few parents returned forms expressing refusal to let their students take part in the study. As a result, 867 of the 1064 eligible tenth grade students (81.5 percent) and 841 of the 1108 eligible twelfth grade students (75.9 percent) from passive consent schools participated in the study.
2.7 Recommendations for the Main Study
In order to reach target response rates, it is clear that RTI must be able to recruit a higher percentage of sampled schools to participate in the main study as well as increase student participation rates. RTI will address student participation in the next chapter. Our main areas of recommendation for recruitment focus on addressing district/schools concerns, increasing recruiters’ authority to negotiate with districts/schools, and increasing the schools’ perceived benefits for participation. RTI also needs to encourage as many schools as possible to allow passive consent.
With the increase of high stakes testing, many public schools communicated a reluctance to have students lose any more instructional time for the study. Some also voiced the concern that the students were being overtested. It is important that RTI continues to communicate our willingness to schedule survey days to fit the schools’ schedules. With an increased month of data collection (starting in January), RTI will have more flexibility to schedule survey days earlier in the semester when schools tend to be less overtaxed. Additionally, RTI will communicate to schools that, unlike other types of testing, the ELS:2002 study requires no advance preparation of students. This limits their lost instructional time to just 2 hours on survey day. RTI further recommends that, in limited cases, RTI offers to drop study components if this is an obstacle to participation.
Catholic and other private schools had more concerns about being too understaffed to take on the survey. RTI will be in a position to offer either funds to pay for staff to complete the tasks (such as providing enrollment lists) or for our staff to travel to the school to complete the functions. Other concerns of private schools included a mistrust of the government and difficulty in understanding how they would benefit from the study. RTI will emphasize the need for information from private schools in order for the study to be representative of all types of schools.

Chapter 2 Securing Cooperation
32
RTI feels that it is important to give the recruiting staff authority to negotiate with districts and schools. When a district/school is reluctant to participate, recruiters will try to determine what would persuade them to cooperate. RTI recommends that recruiters be permitted to offer to reimburse schools for their efforts and offer financial incentives to participate.
Because schools are besieged with research requests, it is important to convey to schools the benefits of participation in ELS: 2002. RTI believes that some schools may agree if RTI offered them a financial incentive. Another benefit would be to provide schools with research findings. To that end, RTI recommends sending all participating schools a copy of The Condition of Education. In addition, RTI suggests sending participating schools the Education Statistics Quarterly for the duration of their involvement in ELS:2002. This is not only a tangible benefit obtained at the time of recruitment, but the quarterly mailing keeps ELS:2002 in the minds of school administrators for the follow-up.
It is crucial to the response rate that as many schools as possible be encouraged to allow passive parental consent. The field test clearly demonstrated that active consent is more labor-intensive and results in a lower student response rate. To encourage schools to allow passive consent, RTI will send a copy of the passive consent form with the recruitment materials and stating that this is the type of consent that RTI normally uses. RTI hopes that this will encourage a larger number of schools to agree to passive consent.Of course RTI will comply with school requirements for active consent if that is their policy.
RTI recommends that Survey Administrators visit all active consent schools the day prior to survey day to allow them to collect names and contact parents who still have not returned forms. During that phone call, the SAs can dictate the text of a permission note to the parent and request that the parent send the note in with the student the next day.

33
Chapter 3 Data Collection
3.1 Recruitment and Training of Data Collectors
3.1.1 Field Staff
In the field test, RTI hired ten Survey Administrators (SA) – two per state. RTI identified staff from RTI’s National Interviewer File, a database that contains information about available interviewers across the country. Five of the SAs had worked on the School Health Policies and Programs (SHPPS) study the previous year. The other five had experience on a variety of other research studies.
Prior to training, RTI mailed each SA a copy of the survey administrator manual and a home study exercise. The SAs were instructed to read the manual prior to training and complete the home study exercise to be turned in on the first day of training. Project staff conducted training in Durham, NC on February 6-7, 2001. Each SA signed a confidentiality agreement and an affidavit of nondisclosure at the beginning of training. The project officer was present and provided information about prior NCES studies. During training, RTI personnel discussed contacts that had already been made with the schools, as well as contacts that each SA would need to make with the school coordinator prior to survey day. Topics included survey day logistics and administration instructions for the student questionnaire and cognitive tests. RTI trainers introduced the Facilities Checklist and discussed its administration. They discussed criteria for scheduling make-up days and how to set them up with the coordinator. The field supervisor discussed the recruitment, hiring and training procedures for Survey Administrator Assistants (each SA was responsible for hiring his/her own SAAs). While explaining active and passive consent procedures, RTI staff discussed contacting parents for gaining active permission and converting refusals. During the field test, RTI conducted a test (at three of the field test schools) of the 2-stage testing to be used in the full-scale study. At the end of training, RTI trainers met with the three SAs who were responsible for administering the 2-stage test to go over the details of conducting the tests.
The SA training agenda is included below (Figure 3.1).

Chapter 3 Data Collection
34
Figure 3.1 ELS Field Test
SA Training Agenda
Tuesday, Feb. 6, 20018:30 – 8:45 Introductions 8:45 – 9:00 Confidentiality 9:00 – 10:15 Prior NCES studies Overview of ELS
10:15 – 10:30 BREAK
10:30 – 10:45 Prior contact with state/district/schools
10:45 – 11:00 Case Assignment Card
11:00 – 12:00 Working with the school coordinator/using Student Roster
12:00 – 1:00 LUNCH
1:00 – 2:00 Survey day logistics
2:00 –2:55 Questionnaires and edit
2:55 – 3:15 Edit exercise
3:15 – 3:30 BREAK
3:30 – 4:15 Test administration
4:15 – 5:00 Facilities questionnaire
Wednesday, Feb. 7, 20018:30 – 9:30 Post survey duties (forms, reporting, etc)
9:30 – 10:00 Make-Up Day
10:00 – 10:15 BREAK
10:15 – 12:00 Headway administrative procedures
12:00 – 1:00 LUNCH
1:00 – 2:00 Hiring and training SAAs
2:00 – 3:00 Contacting parents (refusals and active permission)
3:00 – 3:15 BREAK
3:15 – 4:00 Assignment distribution
4:00 – 4:30 2 stage testing (for the 3 SAs involved)

Chapter 3 Data Collection
35
3.1.2 Telephone Staff
RTI hired and trained two different groups of telephone staff. The first group was the institutional recruiters who were responsible for contacting and recruiting districts and schools for the field test. They also did questionnaire nonresponse follow-up prompting for school staff. RTI had a staff of five recruiters, all of whom had worked on another education study prior to ELS. The other group of telephone staff was the telephone interviewers. This group was responsible for conducting telephone interviews with parents who did not return mailed questionnaires. In addition, the telephone interviewers conducted reinterviews with a sample of parents.
3.1.2.1 Institutional Recruiters
The staff of institutional recruiters all had experience working on prior RTI education studies. RTI trained the recruiters in two sessions. The first was a 2-day session held in mid-September 2000 that was designed to cover district recruiting. At that time, RTI trained two recruiters to handle district recruiting. In late September, RTI trained an additional 3 recruiters for district recruiting and trained all 5 recruiters to conduct school recruiting. The training covered the overall project objectives and study components. RTI discussed activities that had already taken place at the state level. The recruiters practiced using the computerized survey control system and scripts for the districts/schools. They also had extensive practice on answering common questions.
3.1.2.2 Telephone Interviewers
RTI had a staff of interviewers who were split between daytime and evening/weekend shifts. Having this coverage allowed RTI greater flexibility to contact parents. RTI trained several bilingual staff for the ELS field test to handle interviews in English and Spanish. All of the telephone staff had worked on previous studies in the telephone unit.
In March 2001, RTI trained the telephone interviewers to conduct CATI interviews with parents who had not yet returned mailed questionnaires. RTI trained the staff over 3 evenings. In addition to explaining the study to the staff, trainers discussed contacting parents and answering their questions and concerns. The training included extensive practice conducting mock interviews on the computer. One of the more complicated features of the instrument was a user exit that the interviewers used to code occupations. Trainers spent considerable time explaining the user exit and practicing the coding of various occupations. On the last evening of training, interviewers paired up to interview each other using mock scripts. Training staff observed the pairs as they conducted their interviews. The training agenda is shown below (Figure 3.2).

36
Figure 3.2Telephone Interviewer Training Agenda
Tuesday
6:00 – 6:10 Sign confidentiality forms
6:10 – 6:15 Welcome
6:15 – 7:00 Intro to ELS/Overview
7:00 – 7:45 Contacting parents
7:45 – 8:00 BREAK
8:00 – 10:00 Mock with Q x Qs
Wednesday
6:00 – 7:00 Front end practice
7:00 – 7:30 Occupation user exit
7:30 – 7:45 BREAK
7:45 – 8:45 Practice mock
8:45 – 10:00 Answering questions, refusal conversion
Thursday
6:00 – 7:30 Paired Mock 1
7:30 – 7:45 BREAK
7:45 – 9:15 Paired mock 2
9:15 – 10:00 Quality control/administrative
3.2 In-School Survey Procedures and Results
3.2.1 Student Survey
3.2.1.1 Description of Student Surveys and Make-Up Sessions
After training, each SA recruited, hired, and trained a survey administrator assistant (SAA) to help in the school. In some cases, the SA was able to use the same SAA for all of the assigned schools. However, in a few cases, the schools were far enough away from where the SA lived that it involved an overnight stay. In that case, the SA hired an SAA who lived close to the school.

Chapter 3 Data Collection
37
SAs received case assignment cards for each of their assigned schools. The case assignment cards contained information about the school, including the name and phone number of the school coordinator and the designated survey day and make-up day. Prior to the designated survey day, the SA phoned the coordinator to make sure that the survey day supplies had arrived, arrangements were in place and questionnaires had been distributed to the staff. At the same time, the SA determined if the coordinator had received any parental refusals. If so, the SA began refusal conversion efforts if the school was willing to provide a telephone number for the parent. In active consent schools, the SA also determined from the coordinator which parents had not yet returned permission forms. If the school was willing to provide telephone numbers, the SA began calling the parents to prompt them to return the forms.
On the survey day at each school, the SA checked in with the school coordinator and collected any parental permission forms that had come in. In active consent schools, the SA checked the student roster to make sure that only students who had returned signed permission forms were allowed to participate. In both active and passive consent schools, the SA made sure that no one for whom the school received a parental refusal was allowed to participate unless the parent had rescinded that decision in writing. As students entered the testing room, they were checked off on the student roster. After the majority of the sampled students arrived, the school coordinator was asked to try to locate the students who were not present.
Survey day at each school was staffed with one SA and one SAA. The SA was responsible for the questionnaire and test administration for the 10th graders. The SAA administered tests to the 12th graders. Since 12th grade test administration only took a little over an hour, after the SAA finished dismissing the 12th graders, she went to the 10th
grade location to assist the SA in questionnaire edits and test administration.
The SA/SAA labeled questionnaires and/or test booklets with each student’s ID. Prior to beginning data collection, the SA/SAA read a script to the students describing the study, giving the elements of informed consent and giving instructions for completing the questionnaires/tests.
Tenth grade students were given a student questionnaire to complete during a one-hour group administration. After the questionnaires were collected, the SA gave the students a short break and served a light snack. After the break, the SA handed out cognitive tests. For most schools, RTI used two different test booklets – both containing a math section and a reading section. Students were randomly assigned either test booklet 1 or 2. The booklets were similar in content but contained different test items in order to increase the item pool. Students were given 34 minutes to complete the math section and 37 minutes for the reading section. While the 10th grade students were taking the tests, the SA checked the student questionnaires for critical items. After the tests had been completed, the SA asked students who missed critical items to complete those prior to returning to class. The majority of missing items resulted from students running out of time to finish the questionnaires.

Chapter 3 Data Collection
38
Twelfth grade students only received test booklet 1 or 2. These booklets were identical to the ones the 10th grade students received. The purpose of having the 12th
graders complete the test was to develop items that could measure growth between the 10th grade base year and the first follow-up two years later when the original pool of students are in the 12th grade.
In three schools, RTI piloted the 2-stage test procedures with the tenth graders. In these schools, the SA administered a routing test, followed by the student questionnaire and then the second part of the test. For the routing test, students were given a booklet containing math and reading items. They had 12 minutes to complete the math section and then 13 minutes to do the reading section. After the SA collected them, she handed out the student questionnaires. In the hour that the students had to complete the questionnaires, the SA graded the routing tests. The SA assigned a second math booklet and second reading test booklet (low, medium, or high level) according to the score each student received on the routing test. Students were given 12 minutes to complete the second stage math booklet and 11 minutes to finish the second stage reading booklet.
At the conclusion of the testing, the SA determined whether a make-up day was necessary. The criteria for holding a make-up day was if 3 or more students (10th and 12th grade combined) who had permission to participate were not present for Survey Day.If a make-up day was deemed to be necessary, the SA informed the school coordinator. Make-up days had been scheduled during the recruitment phase of the study. During the field test, make-up days were indicated at 44 of the schools. However, 9 of those schools refused to allow RTI to hold a make-up day. Generally, the reason cited for the refusals was a wish not to have the school routine disrupted for another day.
RTI did conduct a make-up day at 30 of the schools. Because of the smaller number of students, only one person covered make-up day. Generally, the SA conducted the make-up day unless the SAA lived substantially closer to the school. A joint session was held with the 10th and 12th graders who had missed the survey day. The 10th graders started the session about an hour before the 12th graders arrived in order to give them time to complete the student questionnaires. After the 10th graders completed the questionnaires and had their break, the 12th graders arrived and the SA read test instructions to all of the students.
In order to boost response rates, RTI asked some schools that had low response rates to allow us to conduct an additional make-up day. RTI also asked schools that had initially refused a make-up day to reconsider. Unfortunately, because it was so close to the end of the year, very few schools allowed RTI to return. Out of the 17 schools RTI asked for an additional make-up day, 9 refused. RTI returned to 8 schools and tested an average of 2 additional students per grade.
3.2.1.2 Student Response Rates and Other Results
RTI collected forms (questionnaires, tests, or both) from 1,018 of the 1,296 eligible 10th graders (78.5 percent). RTI received a total of 1005 student questionnaires, 944 10th grade student tests, and an additional 47 2-stage tests. Overall 10th grade participation rates were 86.2 percent at Catholic schools, and 96.7 percent at other private

Chapter 3 Data Collection
39
schools. Participation in public schools was 77.7 percent overall – 81.9 percent in rural schools, 75.9 percent in suburban and 74.4 percent in urban schools. As expected, participation in active permission schools was lower than in passive schools – 65.1 percent vs. 81.5 percent.
RTI collected tests from 967 of the eligible 12th graders (72.5 percent). Twelfth graders proved to be more difficult to test–many were involved in work-study programs and were not in school during the time of day that RTI conducted testing.
The two-stage testing procedures went well. Out of 47 tests, all but 3 were scored correctly by the SA. Of the three scored in error, only 1 error resulted in the student being assigned the wrong test booklet for the second test (medium vs. high level on the math test).
3.2.1.3. Discussions, Recommendations for the Main Study
As RTI expected, the student questionnaire was too lengthy. RTI had anticipated that some of the students would not be able to complete the entire questionnaire in the allotted one hour time period. What RTI found was that virtually none of the students were able to complete the questionnaire in that length of time. The SAs had to conduct critical item retrieval with almost every student. It was rare that a student didn’t know the answer to a critical item; it was simply a matter of not having time to complete it. RTI cannot extend the length of time that the students are out of class to allow the students more time to complete the questionnaire. Therefore the student questionnaire will need to be shortened considerably in order to allow time for the majority of students to finish (see section 5.3.6).
Student participation was lower than hoped for the field test. This is often the case in field tests where procedures are being worked out. Clearly response rates will need to be bolstered for the full-scale study. Areas that need to be improved include notification of all school staff, increased notification of students, some sort of student incentive, and scheduling of make-up days.
One of the problems that RTI discovered during the SA debriefing was that in many cases, teachers were not releasing students to attend Survey Day. The teachers were either not aware that the study was going on or felt that the student could not afford to miss class. RTI recommends drafting a letter that the principal can sign and have distributed to all staff prior to survey day. The letter would explain the ELS:2002 study and its importance and encourage teachers to cooperate by releasing sampled students. RTI also recommends that posters about the study be posted in the teacher lounge to further increase visibility of the study.
Another problem area was that students did not always seem to be aware of the study. While RTI mailed a letter to their parents, this information was not necessarily communicated to the students. RTI also provided survey invitations to be distributed to the sampled students but the coordinator did not always distribute these. RTI suggests that in schools where the SA visits the day prior to survey day that she distributes the invitations while she is at the school. In schools where the SA is not visiting prior to

Chapter 3 Data Collection
40
survey day, RTI suggests offering to pay student helpers to pass out invitations if the coordinator is reluctant or unable to do so. RTI also recommends that a postcard be sent to each student approximately 1 week prior to the school’s survey day. In addition, the SAs will encourage the school coordinators to announce student names the day before and day of survey day to make sure as many students attend as possible. To encourage school coordinators to be more proactive in notifying students, RTI suggests offering a graduated honorarium based on student response rates. All coordinators would receive a base honorarium of $50 but that amount would be increased for high response rates (e.g. 90 percent and above) at the school.
Some students seem to respond well to an incentive. The 10th graders in the field test seemed to be pleased to get a snack. One student even mentioned that if they had known they were getting snacks, more students would have attended. RTI will add the mention of a snack in the letter to the parent and the student postcards. RTI also suggests giving some sort of inexpensive gift (such as a highlighter) to participating students. RTI learned that in one of the field test schools, the principal had provided cash for a drawing for participating students. RTI suggests offering, in some schools in the full-scale study, a small amount of money to be used in a drawing as a method of increasing response rates.
RTI discovered from the field test that more than one make-up day would bolster student participation. In several cases, the survey day was cancelled due to bad weather so our make-up day became the survey day. Then it was difficult to schedule another make-up day because the school calendar was full by that time. A survey day and two make-up days would allow greater flexibility at each school. Also, schools should be discouraged from selecting a make-up day that occurs the day after survey day. RTI found that in active consent schools, the SAs needed additional time to contact parents who had not returned permission forms for survey day. By allowing a longer interval between survey day and make-up day, the SAs would have more time to contact these parents. An additional benefit of discouraging make-up days one day after survey day is that if a student is out sick on survey day, he still might not be back to school by the next day. By scheduling the make-up day later, students who were ill on survey day will be more likely to be back in school.
3.2.2 Facilities Checklist
3.2.2.1 Description of Procedures
On survey day, the SA completed the Facilities Checklist by observing and reporting on various conditions at the school, inside and outside of the building. The form was designed to be completed by the SA without assistance from school personnel. Procedures included reporting on conditions visible from the school’s front hallway, student bathrooms, five classrooms, the school’s parking lot and adjacent property. SAs were also asked to report on various security measures observed throughout the school building. SAs reported that the Facilities Checklist took about 30 minutes to complete.

Chapter 3 Data Collection
41
3.2.2.2 Discussion, Recommendations for the Main Study
While most of the items on the Facilities Checklist were fairly simple to complete, SAs reported that several items were problematic. The problematic areas involved difficulty in accessing some of the areas and difficulty in determining if some items were present by observation.
The most problematic task was finding 5 empty classrooms in which to conduct a series of observations. It was originally thought that this could be done during class changes. However, this did not prove to be feasible because teachers often remained in the classrooms during class change; sometimes in conference with students. Also, class changes were so brief that the SA couldn’t observe more than one or two classrooms during each change (and thus would have to wait around for the next change). In an attempt to avoid waiting, the SAs tried to find empty classrooms during class periods.However, there was rarely more than one empty classroom at any given time in most schools. Consequently, SAs spent a lot of time trying to locate classrooms to observe. According to SA reports, more than half of the time it took to complete the Facilities Checklist was spent trying to locate 5 empty classrooms. Additionally, when classrooms were empty, they were often locked. This hampered the SA’s ability to conduct observations. Sometimes the SA was able to peek into the empty classroom through a window in the door but it was difficult to observe the entire classroom in this manner. Some SAs contacted school personnel to unlock classrooms for this task but this took time in order to locate someone with keys. It is also possible that it may be perceived as intrusive since RTI had not previously informed the school coordinator that the SA would need help with the task. RTI recommends that the number of classroom observations be reduced to one. This would make the task a lot more manageable.
Another area that was sometimes problematic to observe was the student bathrooms. SAs were instructed to observe the student bathroom appropriate to his/her sex. In at least one school, bathrooms are kept locked during class periods (to discourage smoking). The SA was forced to try to observe the bathroom during class change when it was crowded with students. Another problem that RTI may encounter during the full-scale study is single sex schools. If the SA is of the opposite sex, observation of the student bathrooms will be problematic. RTI will expand instructions in the SA manual detailing how to handle these problems.
The other item that caused problems for the SAs was determining whether certain items were present at the school. One example was an emergency alarm or call button in the classroom. This is sometimes not visible so the SAs felt that they needed to ask school personnel to determine if they had it. In an attempt to minimize the need for help from school staff, RTI recommends that any items that cannot be easily observed be moved from the Facilities Checklist to the School Administrator questionnaire.
3.2.3 Collection of Course Catalogues
At the time the recruiters contacted the schools for enrollment lists, RTI asked that they provide us with a course catalogue. Some of the schools mailed catalogues in at that time. However, in a lot of cases, the SA picked up the catalogue on survey day. Two

Chapter 3 Data Collection
42
schools reported that they do not have a course catalogue. RTI collected 42 of the course catalogues from the field test schools. RTI made prompting calls to schools to retrieve catalogues. In some cases RTI was told that the catalogue was available on-line. For the full-scale study, RTI needs to capture information about on-line catalogues. RTI needs to note on case assignment cards when a catalogue needs to be picked up and encourage SAs to be more proactive in requesting them. RTI also needs to integrate follow-up procedures with other nonresponse calls to schools.
3.3 Surveys of Other School Populations
3.3.1 Teacher Survey
3.3.1.1. Description of Teacher Survey Procedures
The Teacher Questionnaire was designed to obtain detailed information about sampled students, classes that the teacher taught these specific students, school climate and practices, and teacher background. After the student sample was selected, each school was asked to provide RTI with each 10th grade sampled student’s fall math and English courses and the names of the teachers of those courses. Using this information, RTI generated a list for each teacher indicating the sampled ELS students from those classes. RTI packaged the student list along with a lead letter, a brochure about ELS, a Teacher Questionnaire and a postage-paid return envelope into individual packets. If the teacher was being asked to report on more than 16 students, RTI also included in the packet a supplemental booklet and an incentive form offering $40 for completion of the questionnaire. RTI mailed all of these teacher packets to the school coordinator for distribution to the teachers approximately 2 weeks prior to survey day. The lead letter instructed teachers to complete the questionnaire and either mail it to RTI or give it to the SA on survey day. RTI mailed nonresponding teachers a postcard reminding them to complete and return the survey. At the end of the data collection period, RTI telephoned school coordinators to ask them to prompt teachers who had not returned a questionnaire. If the coordinator would permit it, RTI attempted to contact the teachers directly by phone or e-mail.
3.3.1.2. Teacher Response Rates and Other Results
RTI found that very few teachers had their questionnaires completed and ready for pick up on survey day. The majority of questionnaires that were returned were mailed in. RTI received 453 teacher questionnaires. Of the 1,018 student respondents, 918 (90.2 percent) had at least one of their teachers complete a questionnaire. English teachers provided data for 785 of the respondents (77.1 percent) while math teachers reported on 793 of the respondents (77.9 percent).
The majority of teachers were only asked to report on a small number of students. About half were asked to report on one or two students (31.2 percent were asked to report on one, 18.9 percent were asked to report on two). Over three-quarters (76.8 percent) were asked to report on five or fewer students. However, 15 teachers were asked to report on 16 or more students. The highest number of students for one teacher was 31.

Chapter 3 Data Collection
43
Based on reports from school coordinators, the Teacher Questionnaire was perceived as too long and quite burdensome. As expected, teachers have multiple priorities and completing the Teacher Questionnaire tended to come last unless the school coordinator or principal strongly encouraged completion.
3.3.1.3 Discussion and Recommendations for Main Study
In order to increase teacher response rates (and thus student coverage) for the full-scale study, RTI needs to address burden, provide incentives, and schedule more timely nonresponse follow-up.
The Teacher Questionnaire was quite lengthy and took substantially more time than RTI had estimated in the burden statement. In order to address this problem, the Technical Review Panel recommended that RTI cut two sections out of the teacher questionnaire – course information and school climate. This should reduce the total questionnaire length by almost 50 percent.
RTI believes that it is important to offer teachers some amount of remuneration for their effort of providing student reports. In the field test, RTI only initially offered incentives to teachers who were being asked to report on over 16 students. Ironically this group, while having the largest burden, also had one of the highest response rates (88.9 percent). RTI believes this is due to the $40 incentive that they were offered. It is clear that all teachers have considerable pressure on their time and deserve to be compensated for providing student reports. RTI proposes paying teachers on a sliding scale, based on the number of students they have to report on. RTI suggests the scale be as follows: up to 5 students, $10; 6-10 students - $20; 11-15 students - $30; and 16 or more students - $40.
Because of the late timing of the field test, RTI did not begin nonresponse follow-up calls to the schools until the data collection period was almost over. Unfortunately, this occurred close to the end of the school year when teachers were overwhelmed with end of the school year activities (e.g., determining final grades) and getting ready to leave for the summer. RTI believes that the prompting would be much more effective if it was done earlier in the school year. RTI recommends that the SAs continue to prompt teachers on survey day and make-up days. Once two weeks has elapsed since the school’s final make-up day, RTI should begin mail and phone prompting of nonresponding teachers.
3.3.2 School Administrator Survey
3.3.2.1 Description of Administrator Survey Procedures
At the time RTI recruited the school, the recruiters briefly described the school administrator questionnaire and asked for the name of the person who should receive it. Any knowledgeable school staff member could complete the first five sections of this questionnaire. However, the final section on school governance and climate needed to be completed by the principal. This last section took approximately 5 minutes to complete.

Chapter 3 Data Collection
44
When RTI mailed survey materials to the school coordinator, RTI included a questionnaire packet for the person identified as the school administrator respondent.The packet contained a lead letter and a brochure about ELS, the administrator questionnaire, and a postage-paid return envelope. Like the teacher questionnaire, the lead letter for the school administrator asked that the respondent either give the completed questionnaire to the SA or mail it back to RTI. As with the teachers, few administrators had completed their surveys prior to survey day. RTI sent reminder postcards to nonresponding school administrators. At the same time RTI called to prompt teacher non-respondents, RTI also asked for school administrator questionnaires. If school administrators said that they were too busy to complete the questionnaire, RTI offered the option of completing an abbreviated questionnaire containing a minimal number of critical items. Four school administrators completed the shortened questionnaire.
3.3.2.2 Response Rates and Other Results
RTI received school administrator questionnaires from 48 schools for a response rate of 90.6 percent. These questionnaires represented a coverage of 935 of the 1,018 participating 10th grade students (91.8 percent).
During the prompting calls, RTI got a lot of complaints from administrators who felt that it was an extremely long questionnaire – taking substantially longer time to complete than the 35 minutes RTI cited in the burden estimate. RTI discovered that some schools did not keep statistics in the form that RTI was asking for and administrators felt compelled to calculate the statistics rather than providing an estimate. This proved extremely labor-intensive and likely contributed to nonresponse.
3.3.2.3 Discussion and Recommendations for Main Study
It is critical that RTI cut the length of this questionnaire to reduce respondent burden. Besides the sheer volume of questions, RTI should also take a close look at allowing response categories for some of the questions rather than asking for a straight percentage. This format would be easier for administrators to answer and might encourage them to estimate rather than calculate answers if data are not readily available.
As with teacher questionnaires, it is important for the SAs to prompt for the school administrator questionnaire each time they are at a school. Even if this does not result in a completed questionnaire at the time, it keeps the questionnaire in the administrator’s mind and increases the chance that it will be completed. RTI also needs to begin mail and telephone prompting within 2 weeks after the last scheduled make-up day at the school.
3.3.3 Library Media Center Survey
3.3.3.1 Description of Library Survey Procedures
At the time RTI recruited the school, the recruiter asked the coordinator to identify the person who should receive the library media center questionnaire. This could be the school library media center coordinator or any one else who was knowledgeable

Chapter 3 Data Collection
45
about the school’s library media center. When RTI mailed the school materials to the coordinator, RTI included a personalized packet for the person identified as the respondent for the questionnaire. This packet included a lead letter and brochure describing ELS, the Library Media Center questionnaire, and a postage-paid return envelope. As with the other school personnel, the lead letter asked the recipient to complete the questionnaire and either give it to the SA or mail it back to RTI. RTI sent reminder postcards to nonresponding library media center coordinators. RTI also conducted telephone prompting for the few nonrespondents.
3.3.3.2 Response Rates and Other Results
RTI received library media center questionnaires from 49 schools (92.5 percent). This represents a student coverage rate of 94.2 percent (959 of the 1,018 student participants). Most questionnaires had been received prior to the beginning of nonresponse prompting. In the four schools where RTI did not receive the library media center questionnaires, RTI experienced a high rate of teacher nonresponse and generally lower student response rates, suggesting that study participation concerns were pervasive at these schools.
3.3.3.3 Discussion and Recommendations for the Main Study
The Library Media Center Survey was the shortest instrument at approximately 15 minutes. The brevity of the questionnaire probably contributed to a higher initial response rate. Substantial cuts to the instrument do not appear to be necessary.
For the full-scale study, the SAs need to continue to prompt during each school visit. Like the other school staff, RTI will also begin prompting of nonrespondents within 2 weeks of the final make-up day at the school.
3.4 Parent Survey
3.4.1 Description of Parent Survey Procedures
At the time RTI selected the ELS sample from the school enrollment list, RTI asked each school to provide home addresses for the parents of each sampled student. In many cases, the schools provided RTI with addresses for all sampled students. In a few cases, schools provided addresses if they had a signed release on file for the student. In those cases, RTI was provided with some, but not all, of the addresses for sampled students. In other cases, the school would not provide us with any home addresses.
RTI mailed parent questionnaires on the school’s scheduled survey day for all parents for whom RTI had been provided addresses. For parents for whom RTI had no address, RTI had to wait to mail the parent questionnaire until the student questionnaire was sent in and the locator information was scanned.
Parent questionnaire packets contained a lead letter and brochure explaining the study, the parent questionnaire and a postage paid return envelope. Packets were

Chapter 3 Data Collection
46
addressed “To the Parent/Guardian of [student’s name]”. Questionnaire instructions asked for the parent who was most knowledgeable about the child’s education to complete the questionnaire. Questionnaires were available in English and Spanish.
One week after each parent questionnaire was mailed, RTI sent out a thank you/reminder postcard. The postcard thanked the parents who had already completed and returned the questionnaire and asked those who had not to do so. Four weeks after the initial questionnaire mailing, RTI began contacting parents by phone and asking them to complete the survey by telephone interview. For parents who expressed great reluctance to participate, RTI offered an abbreviated telephone interview to gather critical items.
3.4.2 Parent Survey Results
Of the 1,018 student respondents, 817 of their parents provided parent questionnaire data (80.3 percent coverage). Additionally, 36 parents of student non-participants (nonrespondents or those incapable of participating in test/questionnaire sessions) provided data. Of the 853 parent participants, 527 responded by mail and 326 were interviewed (315 full interviews and 11 partial interviews).
3.4.3 Discussion and Recommendations
RTI learned through the field test that home addresses provided by the school are not always current. RTI received many questionnaire packets back due to bad addresses.The addresses provided by the students are a better source of current address information.
While telephone information is also more reliable from student questionnaire data than school information, RTI’s telephone staff reported that students sometimes provided the number for their personal phone line for the home number. When the interviewers called those numbers, the students were suspicious about why they were asking for the parent on that line. Students were often evasive and reluctant to let the interviewer talk to the parent, apparently fearing that they were in trouble at school. For the full scale-study, it would be helpful if the locator section specified that the parents’ home phone numbers were wanted.
RTI found that using a mail questionnaire to do a telephone interview is often a complicated process. Lengthy response categories that were used on the mail questionnaire sometimes proved unwieldy to read by phone. For the full-scale study, the mail questionnaire needs to be closely examined and adapted for easier telephone administration.
RTI also found that asking for the “most knowledgeable” parent sometimes caused problems in 2-parent homes. Both parents were probably sufficiently knowledgeable to answer the questions but when each parent insisted that the other was more knowledgeable, it caused many repeat phone calls until one parent finally agreed to participate. For the telephone follow-up, RTI suggests that we simply ask for a parent who is knowledgeable about the child’s education.

47
Chapter 4 Survey Control System and Data Processing
4.1 Systems Design, Development and Testing
All systems were designed with the Main Study processes in mind. The effort was to test systems in a smaller environment, hoping to reveal points in which improvements could be implemented on a larger scale. The following systems were developed for the field test and require minor adjustment for the main study:
Recruiting system Survey Control System Survey Day Materials generation programs Survey Administrator Telephone touch tone data capture systems TELEform Scanning questionnaires SQL database storing scanned TELEform responses Alchemy image database Parent CATI interview Parent CATI and Scanned data concatenation programs Data cleaning programs Web-Based Integrated Management System (IMS) Production reports
Creation of the above systems underwent the full development process including design, programming, testing, and implementation. Some procedures were specific to the field test and did not require Main Study preparation documentation and quality review but provided valuable analytic information for the field test (e.g., Parent Reinterview questionnaire, Test Booklets). Some features of the systems were not always tested or relevant to a small sample size and may require analysis to further efficient processing during the main study. For example, Survey Day printing applications and procedures were geared towards smaller and more select data preparation staff, rather than turn-key processes used for larger scale operations. Standard shop procedures can be implemented in these instances to compensate for smaller-scale practices used in the Field Test.

Chapter 4 Survey Control System and Data Processing
48
In all other instances, programs, procedures, and databases were designed to reuse major components that apply to the Main Study. Specifications for the questionnaires were designed in word processing documents, and updated to reflect final version of the Field Test. These specifications serve as a springboard to the Main Study development processes, utilizing features to clearly indicate changes to Field Test versions that serve as specification changes for the programmer. Testing will also benefit from this process, indicating items in the questionnaire that have changed and require unit testing.
The Survey Control System is a large and complex relational SQL database that evolves as demand for information increases. The core design of the system is the same, however, components have been allowed to be added and views of information changed as demands require. Strict permissions have been placed on this system to limit access for making changes.
4.2 Data Capture
4.2.1 School, District and State Recruiting
ELS is a complex study involving many levels of participation and relationships across levels. The Survey Control System (SCS) was designed to provide detail at each level and link tables to integrate relationships. Prior to, and throughout the recruiting effort, the SCS has provided the following functionality:
Tables to contain pre-sampled lists Post-sampled information State, District, and School contact information State, District, and School status and record of call detail State, District, and School status tables reporting in detail and summary (interactive views provided by SQL which allow users to determine what level of granularity they need to see) Hierarchy of required tasks and information in order to begin school level recruiting School’s Enrollment list status and updated student detail School’s Teacher information linked to selected students
4.2.2 List processing
Programmers worked closely with the sampling statisticians to process lists provided by schools. The programmers provided data files to the statisticians with students loaded from the enrollment lists. Student selection procedures were implemented and data files providing the selected students were sent back to the Survey Control System. This provided the framework for the identification of teachers linked to the students, and organization of what materials would be produced on Survey Day. So that students selected for Survey Day accurately reflect the student body, modification occurs just prior to Survey Day so that any selected students no longer enrolled at the school can be coded out and newly selected students can be added. During the Main

Chapter 4 Survey Control System and Data Processing
49
Study it will be important to have the ability to trigger each step so that processes do not fall behind, and identify and adjust systems so that anomalies will not prevent Survey Day activities from proceeding (e.g., schools not sending names of students). Furthermore, new reports will be developed to help recruiters work with the various stages of the sample as it evolves into a final list of students and teachers for Survey Day.
4.2.3 Survey Day
The Survey Control System served as the information database driving all survey day activities. The packet of materials specific to a respondent was all generated from the SCS (e.g., labels, lists, active vs. passive forms, etc.) and dates specific to events were maintained as well. The storing of this information was thoroughly tested and should be an excellent process for the Main Study. However, access to this information must be organized differently for a larger sample such as the Main Study sample. In preparation for the Field Test Survey Day, the SCS was the source of information to “review” that all data, tasks and events were ready. The Main Study will have more schools to prepare for on a Survey Day, so the emphasis on the SCS “alerting” staff to problems will be much more critical. Our solution is to provide more reports with critical information and alerts for target dates specific to the success of the Survey Day. The field test enabled our systems to be tested, however further controls and routine procedures need further attention in order to streamline and make procedures more efficient, handling the larger volume of schools to process in the Main Study.
4.2.4 Data Receipt
RTI’s Data Preparation unit received all materials returned to RTI after a school’s survey day was complete. Procedures were established to systematically receipt all required forms from a given school, including wanding of barcoded labels. Points along the process have been identified to streamline the tasks and place much greater emphasis on quality control (e.g., how to handle partially filled questionnaires or identifying defective forms) that will make reports more accurate and subsequent tasks more efficient.
All questionnaires were designed for TELEform scanning, and after receipt and batching, a form was ready to be scanned. A TELEform questionnaire contains fields that are recognized by scanning software identifying item responses and interpreting text (Optical Character Recognition). Verifiers reviewed data that were not interpreted accurately by the software or data that were not consistent with ranges. Once verification was complete, the data were committed to a SQL server database and the image was written to the server. This provided immediate access to questionnaire raw data and a repository of images accessible by any ELS staff.
Streamline procedures are being evaluated for the Main Study such that an accurate number of staff and equipment be identified and available to handle the larger volume.

Chapter 4 Survey Control System and Data Processing
50
4.3 Data Processing and File Preparation
All TELEform questionnaire scanning was stored directly in the SQL server database. SAS datasets were created through an ODBC link to the SQL server database.CATI applications were used to supplement questionnaires where PAPI was not always possible (parent interview). Cleaning programs were designed to concatenate CATI and SQL stored data into SAS datasets adjusting and cleaning variables where formats were not consistent. Special attention should be focused on this concatenation in the Main Study verifying that results stay consistent, ruling out possible format problems.
All respondent records in the final dataset were verified with the Survey Control System to spot inconsistencies in response and/or eligibility status. The data files serve as a check against the SCS to ensure all respondent information is included in production reports.
Item documentation procedures were developed for the Field Test ensuring that variable labels and value labels are recorded and included as input to the process that creates ECB input files. The variable labels and value labels were pulled directly from the final questionnaires, and undergo modification to fit label specifications.
Frequency reviews were conducted on concatenated and cleaned formatted datasets. Programmers, questionnaire design analysts, and task leaders participated in the frequency reviews. Special relationships may provide consistency checks across the dataset ensuring the accuracy of the questionnaire and data. Further QC analysis was conducted on the scanned data reviewing both randomly selected forms and forms containing outliers. The review consisted of pulling hard copy forms and comparing responses with data values in the raw datasets. This ensures quality across the scanning and verification processes.

51
Chapter 5 Analysis of Student Survey Results
5.1 Cognitive Test Battery
5.1.1 Objectives and Background
The purpose of the ELS:2002 cognitive test battery is to provide measures of student achievement in reading and mathematics that can be related to student background variables and educational processes, for individuals and for population subgroups. The tests must provide accurate measurement of the status of individuals at a given point in time, as well as of their cognitive growth over time. Like the earlier longitudinal studies, the National Longitudinal Study of 1972 (NLS-72), High School and Beyond (HS&B) in 1980, and the National Education Longitudinal Study of 1988 (NELS:88), the ELS:2002 database will be used to study factors that contribute to individual differences in achievement. This requirement, as well as the need to measure a wide range of students' skills accurately over a period of time, suggest design features for the ELS:2002 test battery. The tests must be vertically equated to provide measurement of gain over time. Assessment procedures that minimize floor and ceiling effects are required to assess the lowest and highest achieving students. Both normative and proficiency level scores will be provided for different analysis purposes. In addition, the ELS:2002 test specifications and item selection must result in tests that have the potential for comparison with scores from NELS:88, the National Assessment of Educational Progress (NAEP), and the Program for International Student Assessment (PISA).
Cognitive test items were field tested on samples of 10th and 12th graders. The results will be used to select test items to be administered to a national sample of 10th
graders in 2002. Items on which 12th grade field test participants performed better than 10th
graders will be targeted for selection, so that test scores can be related to educational processes during the period covered by the survey. A second field test, of 12th graders only, will be conducted in 2003 in preparation for the two-year follow-up of the national sample to be conducted in 2004, when the majority of the national sample will be in 12th grade.

Chapter 5 Analysis of Student Survey Results
52
5.1.2 Field Test Sample
Nearly 2000 students in 53 schools took sets of reading and mathematics items in the spring, 2001 field test. About half of these students were in grade 10, the rest were 12th graders. Students were randomly assigned to one of two field test booklets, each of which had a set of math items followed by a set of reading items. There were about equal numbers of males and females, and enough Black and Hispanic participants that differential item functioning could be evaluated for these groups.
Table 5-1.—Field test sample counts by subgroup Form 1 Math
Form 2 Math
Form 1 Reading
Form 2 Reading
Total 943 968 939 961
Grade 10 462 482 459 476 Grade 12 481 486 480 485
Male 419 452 415 450 Female 457 448 457 443
White 489 486 487 485 Black 125 157 124 155 Hispanic 158 181 157 180 Other/Unknown 74 74 74 72
5.1.3 Number and Description of Items, Timing, Completion Rates
About 80 math and 80 reading items were field tested, half in each of the two booklets. (The numbers of items are somewhat ambiguous, since some open-ended items had several parts, which were scored separately, and alternative ways of scoring partial credit were also counted separately.) Forms 1 and 2 each contained both subjects, with the form the basis for random assignment of the test. Table 5.1 gives breakdowns by grade, sex, and race/ethnicity for those who completed Form 1 or Form 2, but not for those who participated in the trial of the 2-stage test (the latter produced no data for analysis but rather was a methodological trial). The tests contained a mix of multiple choice and open-ended items. Some of the open-ended math items required setting up formulas, solving equations, or writing explanations. There were open-ended reading items that asked students to interpret graphical information as well as explain reasons for answers. The multiple-choice items and some open-ended responses were scanned for scoring; the rest of the open-ended responses were hand-scored by trained readers according to pre-determined criteria.
Completion rates indicated that for about one-fourth of the students the tests were somewhat too long for the time allowed. This was particularly true for the reading forms: the last reading passage in each booklet consisted of around 2000 words, or about 5 pages. The high proportion of students who answered most of the test questions, as well as the consistency of results (see later section on reliability), suggest that most of the students were motivated to take the test seriously. The completion rates in Table 5-2 count separately scored parts as separate items.

Chapter 5 Analysis of Student Survey Results
53
Table 5-2.—Test timing, number of items, and completion rates Form 1 Math Form 2 Math Form 1 Reading Form 2 Reading
Time (minutes) 34 34 37 37
# Questions 38 41 37 35 Separate Parts 44 43 39 37
Completion Rates Avg. # Answered 36.8 39.5 35.3 33.6 % Reaching End 90% 70% 73% 76% % Reaching 3/4 95% 96% 92% 91%
5.1.4 Item Performance
Two different methodologies were used to evaluate item performance: classical item analysis and Item Response Theory (IRT) estimation. The two methods reinforce each other in that both generate estimates of item difficulty and discrimination. In addition, each supplies a unique perspective on some aspects of the items that is not provided by the other tool.
As mentioned above, some of the scoring rubrics allowed for partial credit, which permitted a comparison of partial credit vs. right/wrong scoring. Analysis of the field test data was carried out treating these alternative scorings as separate items for the purpose of evaluating item statistics. (For example, math item "EBM020" appears twice in the tables of item statistics, once for each of two scoring alternatives.) This treatment has the effect of adding an extra point to the total number right score for answers that were scored correct by both scoring procedures. Six math and two reading items were scored in this manner. The slight distortion in item statistics that results from this treatment is balanced by the convenience of being able to evaluate various alternatives at the same time.
Similarly, one math and one reading item consisted of multiple parts. The field test analysis treated each of these parts as a separate item (see math item "EBN028A" through "EBN028C" in the tables), although the final test might possibly combine the scoring into a single item. In this manner, the difficulty and quality of each piece could be examined and its contribution to the instrument evaluated.
5.1.5 Classical Item Analysis
Classical item analysis provides information on the total test, descriptive statistics for each test item, and the correlation of each item with total test score. For multiple choice items, the number of test takers choosing each response option was computed, along with the average total test score for each of the response-option groups. Similarly, counts and means for incorrect, partially correct, and correct groups were computed for open-ended items. The same statistics were computed for students who omitted each item but answered subsequent item(s) in the test, and for those who omitted the item and did NOT answer any subsequent items ("not reached"). Item analysis tables also show

Chapter 5 Analysis of Student Survey Results
54
"P+" (the percentage of correct responses) and R-biserials (adjusted correlations of item score with total test score). These statistics were reviewed to identify possible flaws in individual items, for example:
An incorrect response option that is selected by very few test takers may need to be replaced by a more plausible choice. An item omitted by an unusually large number of test takers may have something unclear or offensive in the presentation. For each item, the mean total test score for students choosing the correct response should be substantially higher than the score means for each of the incorrect groups. If this is not the case, it is possible that the question stem, the keyed correct response, or one or more of the incorrect response options may be ambiguous or incorrect. Items that are much too easy (very high P+), with nearly all test takers able to answer correctly, may not be serving a useful purpose on the test. Very difficult items (such as a 4-choice item with a P+ of .25 or below, which could result from random guessing) may or may not be serving a useful purpose.Examination of the mean scores for those answering right and wrong can suggest whether the test item is helping to distinguish between high and low ability students or is merely being guessed at random.
The r-biserial statistic is a measure of discrimination, or how well each test item relates to the skill being measured by the test as a whole. Low r-biserials (below about .40) generally indicate items that are not strong measures of the overall construct. Table 5-3 summarizes the r-biserials for the field test items. The alternative scoring methods used for the 6 math and 2 reading items resulted in double-counting of correct answers, which would have the effect of increasing the r-biserial coefficient slightly for these items. Since all but one of them had very high r-biserials (.68 or above), the effect on interpretation of item quality was negligible.

Chapter 5 Analysis of Student Survey Results
55
Table 5-3—R-biserials for field test items
Math Reading Form 1 Form 2 Form 1 Form 2
EBM001 .48 EBN001 .50 EBE001 .56 EBF001 .43 EBM002 .57 EBN002 .42 EBE002 .62 EBF002 .45 EBM003 .62 EBN003 .69 EBE003 .71 EBF003 .64 EBM004 .58 EBN004 .57 EBE004 .67 EBF004 .74 EBM005 .70 EBN005 .65 EBE005 .66 EBF005 .59 EBM006 .68 EBN006 .56 EBE006 .53 EBF006 .74 EBM007 .67 EBN007 .67 EBE007 .57 EBF007 .47 EBM008 .63 EBN008 .62 EBE008 .61 EBF008 .72 EBM009 .52 EBN009 .67 EBE009 .75 EBF009 .69 EBM010 .59 EBN010 .65 EBE010 .57 EBF010 .70 EBM011 .71 EBN011 .68 EBE011 .67 EBF011 .69 EBM012 .73 EBN012 .70 EBE012 .70 EBF012 .59 EBM013 .64 EBN013 .67 EBE013 .68 EBF013 .72 EBM014 .64 EBN014 .77 EBE014 .52 EBF014 .67 EBM015 .56 EBN015 .47 EBE015 .51 EBF015 .57 EBM016 .42 EBN016 .60 EBE016 .68 EBF016 .76 EBM017 .33 EBN017 .54 EBE017 .56 EBF017B .77 EBM018 .57 EBN018 .68 EBE018 .67 EBF017C .20 EBM019 .45 EBN019 .61 EBE019 .65 EBF017D .73 EBM019 .45 EBN020 .61 EBE020 .52 EBF018 .76 EBM020 .89 EBN021 .64 EBE021 .30 EBF019 .80 EBM020 .88 EBN022 .55 EBE022 .42 EBF020 .67 EBM021 .95 EBN023 .52 EBE023 .59 EBF021 .65 EBM021 .93 EBN024 .61 EBE024 .67 EBF022 .71 EBM022 .56 EBN025 .43 EBE025 .73 EBF023 .58 EBM023 .55 EBN026 .29 EBE025 .73 EBF024 .63 EBM024 .63 EBN027 .32 EBE026 .68 EBF025 .65 EBM025 .61 EBN028A .75 EBE026 .68 EBF026 .75 EBM026 .74 EBN028B .50 EBE027 .75 EBF028 .47 EBM027 .46 EBN028C .70 EBE028 .67 EBF029 .56 EBM028 .88 EBN29A-F .71 EBE029 .64 EBF030 .31 EBM028 .76 EBN030 .70 EBE030 .41 EBF031 .49 EBM029 .83 EBN031 .64 EBE031 .53 EBF032 .37 EBM029 .78 EBN032 .70 EBE032 .44 EBF033 .50 EBM030 .64 EBN033 .71 EBE033 .43 EBF034 .55 EBM031 .70 EBN034 .51 EBE034 .36 EBF035 .50 EBM032 .72 EBN035 .41 EBE035 .49 EBF036 .42 EBM033 .48 EBN036 .57 EBE036 .52 EBM034 .88 EBN037 .49 EBE037 .27 EBM034 .88 EBN038 .63 EBM035 .36 EBN039 .32 EBM036 .36 EBN040 .45 EBM037 .48 EBN041 .26 EBM038 .47 Mean .64 .58 .58 .60
Chapter 5 Analysis of Student Survey Results
56
Performance for the field test 10th graders answering each item was compared with percent correct for the 12th grade respondents to identify the test items with substantial differences. These items have the best potential for measuring gains in the national sample that could be related to educational processes. Percent correct and grade 10 to grade 12 difference for the field test items are shown in Table 5-4.

Cha
pter
5
Anal
ysis
of S
tude
nt S
urve
y R
esul
ts
57
Tab
le 5
-4.—
Prop
ortio
n co
rrec
t on
each
item
by
grad
e, a
nd d
iffer
ence
from
gra
de 1
0-12
M
ath
Rea
ding
Fo
rm 1
Fo
rm 2
Fo
rm 1
Fo
rm 2
Ite
mG
r. 10
G
r. 12
D
iffer
ence
Ite
mG
r. 10
G
r. 12
Diff
eren
ce
Item
Gr.
10
Gr.
12
Diff
eren
ce
Item
Gr.
10
Gr.
12
Diff
eren
ce
EBM
001
.92
.95
.03
EBN
001
.86
.89
.03
EBE0
01
.92
.95
.03
EBF0
01
.61
.71
.10
EBM
002
.81
.86
.06
EBN
002
.83
.89
.06
EBE0
02
.80
.88
.08
EBF0
02
.44
.52
.09
EBM
003
.81
.87
.06
EBN
003
.90
.94
.04
EBE0
03
.85
.87
.02
EBF0
03
.75
.82
.08
EBM
004
.70
.79
.10
EBN
004
.79
.85
.07
EBE0
04
.65
.75
.10
EBF0
04
.73
.79
.05
EBM
005
.66
.76
.10
EBN
005
.69
.75
.06
EBE0
05
.55
.73
.17
EBF0
05
.57
.66
.09
EBM
006
.65
.73
.09
EBN
006
.67
.70
.03
EBE0
06
.52
.61
.09
EBF0
06
.60
.71
.10
EBM
007
.56
.65
.09
EBN
007
.76
.83
.07
EBE0
07
.43
.51
.07
EBF0
07
.43
.50
.07
EBM
008
.45
.66
.21
EBN
008
.80
.84
.05
EBE0
08
.39
.57
.18
EBF0
08
.59
.72
.12
EBM
009
.95
.97
.02
EBN
009
.54
.67
.13
EBE0
09
.53
.69
.15
EBF0
09
.41
.54
.13
EBM
010
.77
.81
.03
EBN
010
.72
.80
.08
EBE0
10
.49
.53
.04
EBF0
10
.55
.67
.11
EBM
011
.63
.65
.02
EBN
011
.79
.81
.02
EBE0
11
.80
.86
.07
EBF0
11
.49
.60
.11
EBM
012
.45
.52
.07
EBN
012
.76
.86
.10
EBE0
12
.56
.67
.11
EBF0
12
.80
.84
.04
EBM
013
.35
.45
.10
EBN
013
.49
.62
.14
EBE0
13
.75
.83
.08
EBF0
13
.68
.78
.09
EBM
014
.43
.48
.05
EBN
014
.69
.75
.06
EBE0
14
.54
.59
.05
EBF0
14
.62
.68
.06
EBM
015
.21
.28
.07
EBN
015
.64
.72
.09
EBE0
15
.50
.61
.11
EBF0
15
.69
.76
.08
EBM
016
.35
.41
.07
EBN
016
.81
.86
.05
EBE0
16
.66
.78
.12
EBF0
16
.74
.79
.05
EBM
017
.33
.46
.12
EBN
017
.76
.83
.07
EBE0
17
.64
.72
.07
EBF0
17B
.85
.94
.09
EBM
018
.15
.24
.09
EBN
018
.17
.30
.14
EBE0
18
.50
.64
.14
EBF0
17C
.44
.40
-.04
EBM
019
.39
.36
-.03
EBN
019
.55
.65
.10
EBE0
19
.62
.76
.13
EBF0
17D
.72
.83
.11
EBM
019
.39
.36
-.03
EBN
020
.61
.72
.11
EBE0
20
.39
.58
.19
EBF0
18
.38
.49
.11
EBM
020
.37
.48
.11
EBN
021
.40
.47
.07
EBE0
21
.26
.32
.06
EBF0
19
.66
.77
.11
EBM
020
.38
.49
.11
EBN
022
.48
.56
.08
EBE0
22
.31
.44
.13
EBF0
20
.54
.58
.04
EBM
021
.13
.18
.05
EBN
023
.37
.43
.06
EBE0
23
.43
.54
.11
EBF0
21
.61
.68
.07
EBM
021
.20
.28
.08
EBN
024
.23
.30
.06
EBE0
24
.60
.68
.08
EBF0
22
.59
.67
.08
EBM
022
.52
.51
-.01
EBN
025
.51
.54
.03
EBE0
25
.39
.50
.11
EBF0
23
.39
.46
.07
EBM
023
.20
.21
.01
EBN
026
.24
.24
.01
EBE0
25
.39
.50
.11
EBF0
24
.48
.54
.06
EBM
024
.74
.78
.04
EBN
027
.22
.29
.07
EBE0
26
.31
.39
.09
EBF0
25
.48
.58
.10
EBM
025
.28
.36
.08
EBN
028A
.5
9 .6
3 .0
4 EB
E026
.3
1 .3
9 .0
9 EB
F026
.5
4 .6
3 .0
9 EB
M02
6 .5
3 .5
9 .0
6 EB
N02
8B
.18
.25
.07
EBE0
27
.67
.77
.10
EBF0
28
.33
.36
.03
EBM
027
.65
.69
.04
EBN
028C
.2
9 .3
4 .0
4 EB
E028
.4
6 .6
4 .1
8 EB
F029
.4
5 .5
7 .1
2 EB
M02
8 .2
2 .3
6 .1
4 EB
N29
A-F
.57
.63
.06
EBE0
29
.32
.41
.09
EBF0
30
.28
.31
.02
EBM
028
.77
.82
.05
EBN
030
.27
.36
.09
EBE0
30
.22
.27
.05
EBF0
31
.28
.32
.04
EBM
029
.03
.04
.01
EBN
031
.49
.50
.01
EBE0
31
.28
.35
.07
EBF0
32
.32
.34
.02
EBM
029
.46
.55
.08
EBN
032
.59
.65
.07
EBE0
32
.22
.30
.08
EBF0
33
.30
.28
-.02
EBM
030
.72
.80
.08
EBN
033
.50
.58
.08
EBE0
33
.49
.54
.04
EBF0
34
.51
.59
.09
EBM
031
.51
.59
.08
EBN
034
.46
.51
.05
EBE0
34
.29
.31
.02
EBF0
35
.44
.52
.09
EBM
032
.24
.28
.04
EBN
035
.50
.56
.06
EBE0
35
.57
.56
-.01
EBF0
36
.23
.34
.12
EBM
033
.23
.35
.12
EBN
036
.14
.23
.08
EBE0
36
.53
.64
.11
EBM
034
.21
.31
.09
EBN
037
.70
.75
.05
EBE0
37
.33
.34
.00
EBM
034
.22
.31
.09
EBN
038
.59
.63
.04
EB
M03
5 .1
4 .2
2 .0
8 EB
N03
9 .2
5 .3
2 .0
7
EBM
036
.15
.23
.08
EBN
040
.51
.53
.02
EB
M03
7 .1
0 .0
9 .0
0 EB
N04
1 .2
4 .2
6 .0
2
EBM
038
.21
.28
.08
Av
erag
e .4
4 .5
0 .0
6 Av
erag
e .5
4 .6
0 .0
6 Av
erag
e .5
0 .5
9 .0
9 Av
erag
e .5
3 .6
0 .0
8

Chapter 5 Analysis of Student Survey Results
58
Table 5-5 summarizes the classical item statistics for the field test forms. It shows high average r-biserials for the items, and substantial differences in average number correct between grade 10 and grade 12: about a third to a half standard deviation for each form. Comparisons of average number correct in this table may be made between grades, but not between forms, because form 1 and form 2 do not contain the same number of items. Detailed tables of all item analysis statistics can be found in Appendix D.
Table 5-5.—Summary of classical item analysis statistics Math Reading
Form 1 Form 2 Form 1 Form 2 Average R-Biserial .64 .58 .58 .60 Average P+
Grade 10 44 .54 .50 .53 Grade 12 .50 .60 .59 .60
Average Number Correct (s.d.) 18.2 (8.4) 23.0 (8.2) 19.8 (8.0) 19.4 (8.1) Grade 10 16.8 21.7 17.8 17.9 Grade 12 19.5 24.3 21.7 20.9
5.1.6 Item Response Theory (IRT)
Item Response Theory (IRT) provides an alternative way of measuring item difficulty and discrimination. The Parscale program uses a 3-parameter IRT model to estimate item characteristics and test taker ability. The IRT "a" parameter is an estimate of the discriminating ability of a test item, or how well it serves to distinguish between adjacent levels of ability. This is somewhat analogous to the r-biserial, but applies to a certain point on the ability continuum rather than an overall correlation. Items with "a" parameters of about 1.0 or higher are doing a good job of discriminating levels of ability. The "b" parameter is a difficulty estimate, analogous to the percent correct, but compensating for the possibility of guessing. Items with a range of difficulty that matches the estimated ability range of the test takers will be selected. The guessing parameter, "c", estimates the probability of a very low-skilled person answering the item correctly. It is important in obtaining estimates of probabilities of correct answers, but less important for the purpose of the field test, that is, selecting items for the operational grade 10 test. The Parscale program uses the scored item responses to compute these item parameter estimates and ability estimates by iterating on the data until the system converges to within a predetermined tolerance.
Tables 5-6 and 5-7 show "a" and "b" parameters respectively for each of the field test items. Table 5-8 summarizes item and student performance in terms of the IRT metrics. Differences of one third to one half standard deviation between grade 10 and grade 12 are consistent with the classical item statistics.

Chapter 5 Analysis of Student Survey Results
59
Table 5-6.—IRT "a" (discrimination) parameters for field test items Math Reading
Form 1 Form 2 Form 1 Form 2 EBM001 .76 EBN001 .67 EBE001 .99 EBF001 .58 EBM002 .85 EBN002 .55 EBE002 .95 EBF002 .64 EBM003 1.17 EBN003 1.32 EBE003 1.30 EBF003 .97 EBM004 1.09 EBN004 .78 EBE004 1.03 EBF004 1.33 EBM005 1.35 EBN005 1.01 EBE005 .99 EBF005 .84 EBM006 1.14 EBN006 1.40 EBE006 .90 EBF006 1.35 EBM007 1.20 EBN007 1.07 EBE007 1.35 EBF007 .87 EBM008 1.19 EBN008 .93 EBE008 .98 EBF008 1.27 EBM009 1.07 EBN009 1.09 EBE009 1.50 EBF009 1.42 EBM010 .93 EBN010 1.11 EBE010 .96 EBF010 1.26 EBM011 1.29 EBN011 1.15 EBE011 1.12 EBF011 1.03 EBM012 1.36 EBN012 1.19 EBE012 1.19 EBF012 .77 EBM013 .99 EBN013 1.69 EBE013 1.19 EBF013 1.03 EBM014 1.42 EBN014 1.62 EBE014 .63 EBF014 1.02 EBM015 1.68 EBN015 .60 EBE015 .70 EBF015 .76 EBM016 1.34 EBN016 .88 EBE016 1.06 EBF016 1.66 EBM017 .64 EBN017 .74 EBE017 .73 EBF017B 1.50 EBM018 1.89 EBN018 1.54 EBE018 1.43 EBF017C 1.15 EBM019 .49 EBN019 .85 EBE019 .96 EBF017D 1.06 EBM019 .43 EBN020 .93 EBE020 1.02 EBF018 1.18 EBM020 1.85 EBN021 1.15 EBE021 .96 EBF019 1.90 EBM020 3.90 EBN022 1.48 EBE022 .91 EBF020 1.28 EBM021 1.89 EBN023 1.01 EBE023 1.02 EBF021 1.44 EBM021 1.58 EBN024 1.09 EBE024 .88 EBF022 1.16 EBM022 .56 EBN025 .62 EBE025 1.23 EBF023 .83 EBM023 .61 EBN026 1.07 EBE025 .95 EBF024 1.09 EBM024 .99 EBN027 1.04 EBE026 1.06 EBF025 .96 EBM025 .66 EBN028A 1.41 EBE026 .83 EBF026 1.36 EBM026 1.02 EBN028B 1.36 EBE027 1.23 EBF028 .70 EBM027 .45 EBN028C 1.41 EBE028 1.05 EBF029 1.20 EBM028 1.71 EBN29A-F .92 EBE029 .87 EBF030 .82 EBM028 1.25 EBN030 .93 EBE030 .71 EBF031 .94 EBM029 1.54 EBN031 1.53 EBE031 1.16 EBF032 1.03 EBM029 1.07 EBN032 .88 EBE032 1.15 EBF033 1.31 EBM030 1.44 EBN033 1.35 EBE033 .45 EBF034 1.24 EBM031 1.15 EBN034 .48 EBE034 .73 EBF035 1.42 EBM032 1.21 EBN035 .58 EBE035 .64 EBF036 1.59 EBM033 1.08 EBN036 .64 EBE036 .87 EBM034 1.55 EBN037 .53 EBE037 .54 EBM034 1.40 EBN038 1.02 EBM035 1.61 EBN039 .77 EBM036 1.92 EBN040 .50 EBM037 1.60 EBN041 .93 EBM038 1.44 Mean 1.27 1.02 .98 1.14

Chapter 5 Analysis of Student Survey Results
60
Table 5-7.—IRT "b" (difficulty) parameters for field test items Math Reading
Form 1 Form 2 Form 1 Form 2 EBM001 -2.29 EBN001 -1.78 EBE001 -2.10 EBF001 -.17 EBM002 -1.24 EBN002 -1.86 EBE002 -1.32 EBF002 .64 EBM003 -1.10 EBN003 -1.65 EBE003 -1.25 EBF003 -.93 EBM004 -.49 EBN004 -1.18 EBE004 -.59 EBF004 -.69 EBM005 -.45 EBN005 -.51 EBE005 -.32 EBF005 -.10 EBM006 -.46 EBN006 .17 EBE006 .17 EBF006 -.28 EBM007 -.07 EBN007 -.85 EBE007 .62 EBF007 .82 EBM008 .15 EBN008 -.99 EBE008 .44 EBF008 -.33 EBM009 -2.34 EBN009 -.07 EBE009 -.13 EBF009 .45 EBM010 -.95 EBN010 -.59 EBE010 .44 EBF010 -.05 EBM011 -.27 EBN011 -.81 EBE011 -1.05 EBF011 .09 EBM012 .27 EBN012 -.90 EBE012 -.13 EBF012 -1.10 EBM013 .67 EBN013 .27 EBE013 -.79 EBF013 -.61 EBM014 .59 EBN014 -.45 EBE014 .11 EBF014 -.19 EBM015 1.35 EBN015 -.46 EBE015 .29 EBF015 -.52 EBM016 1.42 EBN016 -1.18 EBE016 -.54 EBF016 -.40 EBM017 1.54 EBN017 -1.00 EBE017 -.38 EBF017B -.82 EBM018 1.55 EBN018 1.13 EBE018 .22 EBF017C 2.22 EBM019 1.35 EBN019 -.02 EBE019 -.35 EBF017D -.55 EBM019 .86 EBN020 -.23 EBE020 .75 EBF018 .39 EBM020 1.16 EBN021 .63 EBE021 2.03 EBF019 -.25 EBM020 1.50 EBN022 .63 EBE022 1.35 EBF020 .30 EBM021 1.54 EBN023 .86 EBE023 .53 EBF021 .18 EBM021 1.16 EBN024 1.22 EBE024 -.29 EBF022 -.04 EBM022 .04 EBN025 .69 EBE025 .54 EBF023 .75 EBM023 1.73 EBN026 2.05 EBE025 .33 EBF024 .47 EBM024 -.52 EBN027 2.02 EBE026 1.21 EBF025 .33 EBM025 1.30 EBN028A .16 EBE026 .94 EBF026 .12 EBM026 .08 EBN028B 1.73 EBE027 -.46 EBF028 1.45 EBM027 -.08 EBN028C 1.02 EBE028 .23 EBF029 .68 EBM028 1.12 EBN29A-F -.10 EBE029 .85 EBF030 2.07 EBM028 -.27 EBN030 .84 EBE030 2.01 EBF031 1.46 EBM029 3.12 EBN031 .57 EBE031 1.23 EBF032 1.60 EBM029 .78 EBN032 -.22 EBE032 1.61 EBF033 1.26 EBM030 -.60 EBN033 .26 EBE033 .59 EBF034 .44 EBM031 .00 EBN034 .34 EBE034 2.05 EBF035 .71 EBM032 1.05 EBN035 .99 EBE035 .29 EBF036 1.28 EBM033 1.51 EBN036 1.80 EBE036 .22 EBM034 1.24 EBN037 -.69 EBE037 2.49 EBM034 1.17 EBN038 .06 EBM035 1.90 EBN039 2.25 EBM036 1.82 EBN040 .50 EBM037 2.10 EBN041 2.13 EBM038 1.52 Mean .56 .16 .30 .29

Chapter 5 Analysis of Student Survey Results
61
Table 5-8.—Summary of IRT estimates
Math Reading Form 1 Form 2 Form 1 Form 2
Average Item "a" Parameter (Discrimination) 1.27 1.02 .98 1.14 Average Item "b" Parameter (Difficulty) .56 .16 .30 .29 Average Student Ability Parameter
Grade 10 (s.d.) -.17 (.94) -.18 (.96) -.24 (.97) -.20 (1.0) Grade 12 (s.d.) .16 (1.0) .18 (1.0) .23 (.98) .19 (.96)
The IRT system also provides for both statistical and graphical approaches to evaluating how well the IRT model is doing in representing the actual data. Graphs of item response functions were reviewed for each of the field test items to determine how well the estimates fit data for 10th graders and for 12th graders. The graphs also show whether the fit is satisfactory at all ability levels, or only within a limited range. Fit statistics provide a numerical way to evaluate the success of the IRT model for estimating performance on each item.
These two methodologies reinforce and complement each other by providing overlapping as well as unique information for evaluating item performance. Both classical item statistics and IRT offer measures of item difficulty and discrimination. In addition, classical item statistics supply information on performance of distractors (incorrect response options) and omit rates.IRT offers fit statistics and information on where along the ability continuum the item performs best. This is particularly useful in selecting items for the two-stage test design described below, where the ability range in which the item must perform is controlled to some extent in the second stage section. Combining information from the two methodologies provides a good idea of how well an item is performing, whether any revisions might be desirable, and whether the item would most appropriately be used for all students or within a restricted range of ability.
5.1.7 Reliability and Factor Structure
Reliabilities for the test sections were high, about .90 for each of the four approximately 40-item field test sections (see Table 5-9). Coefficient alpha measures the internal consistency of the test, that is, the extent to which variance in performance on individual items is related to variance in performance on the whole test.
Table 5-9.—Cognitive test alpha coefficients
Math ReadingForm 1 .91 .89 Form 2 .89 .90
The reliabilities for the operational test in 10th grade will be influenced by two offsetting factors. The operational test will probably contain slightly fewer items than each of the field test sections. Since the reliability coefficient is dependent on the number of items, a slightly lower reliability might be expected. Conversely, the two-stage design, which matches test items to test takers' ability in the second stage, would be expected to raise the reliability of scores. As a result, the reliability of the operational test can be expected to be similar to the .90 found for the field test sections.

Chapter 5 Analysis of Student Survey Results
62
Exploratory factor analysis was carried out for each cognitive test section, looking for any clustering of items by topic or format. Examination of eigenvalues indicated a strong primary factor. Varimax rotations of two to five factors were carried out, and the factor loadings examined for evidence of clustering. Multiple choice items did not appear to be tapping a different set of skills from open-ended items, nor did sets of items with similar content or process characteristics show a tendency to fall on the same factor. Any clustering of items that was found appeared to be related solely to item difficulty. These results suggest that the choices of reading and math items selected for the operational test need not be unduly dependent on format considerations.
5.1.8 Differential Item Functioning (DIF)
Cognitive test items were checked for differential item functioning (DIF) for males compared with females, and for Black and Hispanic students compared with White students. It is not necessarily expected that different subgroups of students will have the same average performance on a set of items. But when students from different groups are matched on overall ability, performance on each test item for the matched groups should be about the same. There should be no relative advantage or disadvantage based on the student's gender or racial/ethnic group unless it is an essential feature of the specifications of the test.
The Differential Item Functioning procedure (DIF) carries out comparisons of subgroup performance for a focal group (e.g., females) compared with a reference group (e.g., males) matched on a criterion (e.g., number right on the whole test). It is based on the Mantel-Haenszel odds-ratio and its associated chi-square. Items are classified as "A", "B", or "C" depending on the statistical significance of subgroup differences as well as effect sizes. Items identified as having "C" level DIF have detectable differences that are both sizeable and statistically significant. A finding of differential functioning, however, does not automatically mean that the difference in performance is unfairly related to subgroup membership. A judgment that these items are unfair to particular population groups requires not only the measure of DIF, but also a determination that the difference in performance is not related to the construct being measured.In other words, different population subgroups may have differential exposure or skill in solving test items relating to a topic that is to be measured. If so, the finding of differential performance may be an important and valid measure of the targeted skill.
Analysis of the field test items, using total number right score as the matching criterion, showed 5 math items and 2 reading items with C-level DIF. These were about evenly split between 4 items favoring the focal group (female, Black, or Hispanic students) and 3 items that appeared relatively easier for the reference group (male or White students). In each case, DIF was present for only one of the three gender and ethnic group contrasts. These items will be reviewed, and if necessary, revised or deleted from the tests.
For some test items, particularly the longer or more difficult tasks that fell at the end of the field test forms, low response rates precluded analysis of differential item functioning. A minimum of 100 responses in each subgroup was required for the procedure to be carried out.

Chapter 5 Analysis of Student Survey Results
63
5.1.9 Multiple Choice vs. Open-ended Format
The math and reading field tests each contained a mix of multiple choice and open-ended item formats. Differences between the formats were found with respect to omit rates, scorability, and scoring cost.
Students participating in low-risk tests for previous national surveys such as NELS:88 and NAEP have generally been quite cooperative and willing to answer questions that do not take a great deal of effort. However, as the effort required increases, there has been evidence that cooperation decreases. Analysis of the field test results showed a pattern consistent with previous experience: students were much more likely to respond to multiple choice questions, even if they didn't know the right answer, than to the open-ended tasks. Omit rates for the 16 math and 4 reading open-ended items were much higher than for the multiple choice questions. This was true even for items that required only a very short answer. About half of the open-ended items were omitted by 200 or more of the approximately 900 test takers who received the test form. For most of these items, the mean score for the students omitting the item was similar to or lower than the mean for the test takers who answered the question incorrectly. But not allof the omits were for low ability students. Many who probably could have answered the questions correctly chose to skip them instead, even if they answered subsequent--and possibly harder--multiple-choice items.
Data preparation methods differed for multiple choice compared with open-ended test questions. Responses to the multiple-choice questions were scanned, and scored by computer. The open-ended questions that required only a short answer (such as a number or a word or two) were scanned, while the extended free response questions (carrying out a mathematical procedure, or writing an explanation) were scored by readers trained to apply established scoring rubrics. For the extended open-ended items in particular, but also to a lesser extent for the brief responses, issues of scoring reliability and expense were noted.
For the short-answer questions, obstacles to scoring reliability were primarily due to one of two factors: the ability of the scanning software to interpret handwritten responses correctly, and the difficulty of anticipating and judging all possible versions of correct or incorrect answers. Letters and numbers were not always written clearly enough to be scanned correctly: the scanner picked up some g's as 9's, b's as 6's, letter o's as zeroes, etc., and incorrectly inserted spaces between digits of some numeric responses. There were numerous instances of abbreviations and misspellings that resulted in a wide variety of scanned responses. For one question that had only 6 possible answers (choosing from a set of 6 countries in a graph the one that matched the criteria posed in the question), more than 125 different scanned responses were captured from about 800 field test students. Presumably, in the 10th grade operational sample of approximately 20,000 students, many more versions of each answer would be encountered.Judgments would need to be made as to which of the 6 possible countries the test taker intended to choose, for each of the scanned versions of handwritten responses. A more difficult judgment would need to be made about the correctness of unanticipated responses. In the example described above, the country names were abbreviated on the graph. The correct choice turned up in the scanned responses in about 40 versions of various spellings and abbreviations. For all of these, it is clear that the respondent was choosing the set of bars on the graph that matched the

Chapter 5 Analysis of Student Survey Results
64
question being asked. But is the task simply to choose the right bars, or also to demonstrate knowledge of correct names of countries? This scoring difficulty and ambiguity could be removed without compromising the intent of the question by reframing this question in multiple choice format, with the 6 country names on the graph as the response options.
Evaluation of the extended open-ended responses, which were read individually by human scorers, was much more complex. Reliability of scoring requires that students' responses to test questions be evaluated in a consistent manner. The readers who scored the open-ended field test items prepared a detailed summary of difficulties they encountered, which included:
finding responses that weren't covered by the rubric not being able to read or interpret the student's intentions not being clear about how to judge responses that had a correct answer with incorrect work or no work shown,or the opposite: correct work shown, but a final answer that was incorrect or mislabeled
If there is a possibility of different readers scoring the same response differently, the reliability of the test scores is compromised.
Some of the scoring rubrics specified a partial credit option. In analyzing the field test data, classical item statistics were reviewed that broke out partial credit responses separately, as well as scoring the items as right/wrong only. The IRT scaling procedures for partial credit scoring are much more complex than for right/wrong answers and were not used in analysis of the field test data. It is not clear that there is enough to be gained by using partial credit scoring to justify the extra cost and complication it would entail in scaling the scores for the national sample.
Even if the challenge of meeting scoring reliability standards could be met, it would be very expensive to employ human readers to evaluate responses to numerous extended open-ended test questions for a sample of approximately 20,000 students. It is important that this expense be justified by the extra information provided by the open-ended questions that could not be obtained in a more efficient manner. For at least some of the open-ended items, as in the country graph example above, it would be possible to recast the item in multiple choice format without seriously altering the purpose of the item. For this example and several other questions, the open-endedness of the item does not test any additional skill, but just complicates scoring unnecessarily. The measurement objectives of understanding the text, the graph, the question, etc. could be achieved by a multiple-choice question that could be answered more quickly and evaluated more reliably and at less expense.
5.1.10 Test Design
Accurate measurement of individual achievement requires that each student answer test items of appropriate difficulty. Items that are much too hard for a given student provide very little information about the student's skill level; nor are items that are much too easy for the student very useful. Those test items that are at or near a particular student's ability level are the most valuable in pinpointing the precise standing of an individual relative to the skill being measured. There are
Chapter 5 Analysis of Student Survey Results
65
several approaches to ensuring that a student is administered test items that are appropriate to his or her level of achievement. One is simply to give a very long test, with a wide enough range of item difficulties that at least some of the test items will be appropriate for any given student. Another approach, computer-adaptive testing, can measure individual achievement very accurately with a relatively small number of items by selecting each subsequent test question from a large, pre-calibrated item pool according to the student's correct or incorrect responses to the previous items administered. Neither of these approaches is practical given the constraints of the ELS:2002 survey. The limited time available for testing (approximately 60 minutes for two subject areas) does not allow for tests that could be long enough to contain all of the items needed for all students. The substantial development and hardware costs of computer-adaptive tests ruled out their use for this survey. However, ideas borrowed from both of these extremes have been drawn upon in designing the structure of the ELS:2002 cognitive tests.
ELS:2002 will utilize a two-stage test design to maximize the reliability of individual measurement. Each student will begin the data collection session by taking a brief routing test in reading, and another in mathematics. Performance on the routing tests, which will contain a broad range of item difficulties, will determine the selection of one of several (probably 3) alternative second-stage forms of varying difficulty. Selecting the set of second-stage test items whose difficulty level best matches the ability level demonstrated on the routing test enhances the reliability of measurement for each student. This design also serves to minimize floor and ceiling effects since low and high ability students will receive tests of appropriate difficulty. Through the use of Item Response Theory and common items linking all forms of the tests, scores can be put on the same scale for the purpose of cross-sectional comparisons. Enough 10th grade items will be reused in forms that will be developed for the 2004 follow-up survey so that gains in achievement over time may be measured.

Chapter 5 Analysis of Student Survey Results
66
Figure 5-1 below shows the proposed design for the ELS:2002 grade 10 reading test.
A short routing test of approximately 15 items will be scored while students are completing the Student Questionnaire. On the basis of cut points to be determined by simulations based on field test results, a low, middle, or high difficulty second stage form of about 15 items will be selected. It is anticipated that approximately half of the tenth graders will be routed to the middle-difficulty form, with about 25 percent taking each of the extreme versions. The high and low forms will each share about 5 items with the middle form so as to stabilize the score scale. Each student will answer a total of about 30 reading items in 30 minutes. The exact number of items in the final design will be adjusted depending on testing time, distribution of item difficulties, and number of usable items linked to each selected reading passage. Item Response Theory (IRT) procedures will be used to put the different test forms on the same scale.
25%
50%
25%
Routing Test (15 Items)
High Level 10 Unique Items
Middle Level 5 Unique Items
5 Shared Items
Low Level 10 Unique Items
5 Shared Items
Second Stage (15 Items Each)
Figure 5-1.—Target Reading Two Stage Adaptive Design

Chapter 5 Analysis of Student Survey Results
67
The design of the math test is similar (see Figure 5-2). Since the math items do not require the investment of time in reading a passage before the questions can be answered, the 30 minute time slot should be sufficient for approximately 40 items, 15 in the routing test, and 25 in each of the second stage forms. More overlap will be possible between second stage forms than for the reading tests.
Care will be taken for both sets of second stage tests, reading and mathematics, to include some difficult items on the easier forms, and some easy items on the harder forms. Thus measurement error or errors in hand-scoring the routing test should not result in a student being given a completely inappropriate test.
A similar multi-level structure is anticipated for the twelfth grade test battery. Plans forhow many levels of each subject will be required in grade 12, and their content, will await analysis of the grade 10 operational test in 2002 and the grade 12 field test to be conducted in 2003.
5.1.11 Test Scores
The ELS:2002 cognitive test scores will be used to analyze students' status at each point in time, as well as gains from grade 10 to grade 12. Several types of scores, offering different perspectives on achievement, are planned for inclusion in the ELS:2002 database. A total scale score in each subject, reading and math, will provide an overall measure of achievement that is useful for cross-sectional analysis of population subgroups' performance and gaps between groups. The total scale score will represent the whole pool of test items in each subject, and will be estimated using all items administered to each student. Total scale scores are also useful for
25%
50%
25%
Routing Test (15 Items)
High Level 15 Unique Items
Middle Level 5 Unique Items
10 Shared Items
Low Level 15 Unique Items
10 Shared Items
Second Stage (25 Items Each)
Figure 5-2.—Target Mathematics Two Stage Adaptive Design

Chapter 5 Analysis of Student Survey Results
68
correlation analysis with status variables such as demographics, school type, or behavioral measures. Quartile scores in each subject, and a reading/math composite and quartile, will be included in the database for the convenience of researchers who require a control measure or categorizing variable. Total scale scores (or the IRT ability estimates on which they are based) will be standardized within each grade level to facilitate norm-referenced analyses. Proficiency probability scores, derived from the overall IRT model, will be provided for analysis of status and gain in specific skills represented by subsets of the item pool.
5.1.12 Measuring Change: Proficiency Levels
While a total scale score may be useful in studying subgroup differences in status at a point in time, longitudinal gains in total scale score points can be difficult to interpret, or even misleading. Low-achieving and high-achieving groups of students may each make similar gains over time in terms of total score points. If the follow-up test has a ceiling effect (i.e., not enough very difficult items to test the most advanced students), it may even appear that high achievers are learning less during these years than are their less-skilled classmates. Similarly, if the base year tests are so difficult that a substantial number of students perform at chance level, estimates of their gains over time may also be attenuated. Studying raw score gains (time 2 - time 1) assumes that scale units are equivalent both within and across occasions. Residualized gain scores (time 2 - predicted time 2) do not explicitly require that the scale units be equivalent on both occasions, but still do not address the idea that different skills are tapped by different points on the score scale. For this reason, scores on a series of proficiency levels will be reported for the reading and math tests.
Within each of the subject area tests, clusters of several items will be identified that mark critical points along the developmental curve. These hierarchical item clusters are referred to as "proficiency levels" or "superitems." Students will be assumed to have mastered a particular skill if they perform well (e.g., at least 3 correct answers in a cluster of 4) on the set of items that represent the skill. Poor performance (e.g., 2 or more wrong answers out of 4) will be interpreted as failure to master the skill. IRT scoring makes it possible to compute the probability of proficiency for each cluster of items. This will permit analysis of gains not only in terms of total score points gained, but also with respect to students' mastery of critical skills. Probabilities of proficiency provide information on how much (in terms of changes in probability of mastery) and where on the growth curve an individual made his/her maximum change. Table 5-10 illustrates this idea.
Measuring Individual Gains and Identifying the Location of Maximum Gain
Table 5-10.—Probability of mastery Grade 10 Grade 12 Difference
L1 L2 L3 L4 L5 L1 L2 L3 L4 L5 L1 L2 L3 L4 L5 Student 1 Student 2
.99 .28 .07 .00 .00 1.0 .99 .89 .08 .00
1.0 .84 .42 .04 .00 1.0 1.0 1.0 .99 .77
.01 .56 .35 .04 .00
.00 .01 .11 .91 .77
The individual represented by the first line was proficient at Level 1 in Grade 10 (probability = .99), but had only minimal skills at the higher levels (probability = .28 or less). The greatest gains in probability of proficiency by Grade 12 were made at Level 2. Analysis of family, school, and behavioral variables operating for this individual can illuminate the processes that are conducive to

Chapter 5 Analysis of Student Survey Results
69
gains in the skills marked by this level. Similarly, the second line in the table represents a more advanced student, who was already quite proficient in the Level 1, 2 and 3 skills in Grade 10, and made his or her greatest gain at Level 4.
5.1.13 Item Selection and Revision
A number of constraints resulting from design issues will guide the selection and revision of items for the grade 10 test forms. These include:
Alignment of the test specifications with those of NELS:88 to insure that scores can be interpreted similarly Inclusion of sufficient numbers of items from NELS:88 to facilitate being able to put the NELS:88 and ELS:2002 scores on the same scale Supplementing the relatively academic reading pool of ELS:2002 with more "real world" literacy applications from PISA; similarly for mathematics problem solving applications. Supplementing the multiple choice items with short free response questions, while maintaining attention to limitations of testing time and scoring costs Sufficient numbers of items to produce reliabilities in the range of .85 - .95 Inclusion of necessary items marking hierarchical levels of proficiency
Findings from psychometric analysis of field test data will also be used to guide the selection and revision of test items for the grade 10 two-stage tests. Psychometric considerations of item difficulty, discrimination, differential item functioning, and potential for gain over time will be:
Item quality: r-biserials above about .40; IRT "a" parameters of 1.0 or higher Matching the range of item difficulty to test takers' ability: wide range of difficulty for routing test; targeted ranges for second stage forms Fit to IRT model: along the whole range of ability for routing test items, targeted ranges for second stage forms Enough very easy and very hard items to avoid floor and ceiling effects Review/deletion/revision of items with C-level DIF for population subgroups Selection of items that show better performance in grade 12 than grade 10 Review/deletion/revision of multiple choice items with flaws in distractor analysis Possible reformatting of some short-answer open-ended items to multiple choice format Selection of reading passages associated with enough items that satisfy item quality, difficulty and fit objectives.

Chapter 5 Analysis of Student Survey Results
70
5.2 Evaluation of Self-Regulated Learning Variables in the ELS:2002 Field Test
The Education Longitudinal Study of 2002 field test (conducted in 2001) evaluated the validity and reliability of several student-based motivational items taken directly from the 2000 Program for International Student Assessment (PISA). The items appeared on the ELS:2002 field test student questionnaire, which was administered to a purposive sample of 1,005 sophomores in five field test states. This section of the field test report discusses the results of the evaluation and recommendations for the main study. The discussion begins with a presentation of the item development process and description of the scales. Field test results are discussed next, followed by recommendations.
5.2.1 Item Development Process
Twelve scales (comprising 51 questionnaire items) measuring five of six dimensions of self-regulated learning were evaluated: (1) self-regulated learning strategies, (2) motivational preferences, (3) self-regulated cognitions, (4) action control strategies, and (5) learning style preference (Baumert, O’Neil & Peschar, 1998; Peschar, Veenstra, Molenaar, Boomsma, Huisman, & van der Wal, 1999). The sixth dimension evaluated—implicit theories of learning—was measured through two newly constructed items not included on the PISA student questionnaire.
The 12 scales and four items were developed based on a dynamic model of knowledge acquisition. Researchers have long recognized that an essential component of knowledge acquisition or learning, whether formally in school or informally once out of the education system, is certain general competencies concerning knowing how to learn (resulting in high-quality learning), which cut across curricula. For example, key to learning both mathematics in school and a new trade or occupation later in life are certain “how to learn” skills, such as the ability to organize, regulate one’s own learning, choose an appropriate learning strategy, learn independently and in a group, and overcome difficulties in the learning process. Possession of these general learning skills is a precondition for both successful academic performance and the continuous acquisition of knowledge over the lifespan (Trier, 1991). An important feature of the model is the operation of these learning skills as both independent (predictor) and dependent (criterion or indicator) variables.
The six dimensions operationally define the cognitive, motivational, and socio-cognitive components of the specific cross-curricular competency of self-regulated learning. The PISA scales used in ELS are the products of an extensive development process, which began in the early 1990s when the notion to include non-academic, cross-curricular competencies as international education indicators was first discussed (Tier, 1991; Trier & Peschar, 1995). At that time, a project plan was developed (Peschar, 1993) and a feasibility study conducted in nine countries between 1993 and 1996. On the basis of the feasibility study, pre-existing instruments measuring similar constructs were reviewed and scales selected for evaluation in the 1999 PISA field test. The scales were selected based on their theoretical, psychometric, and educational relevance. Furthermore, only scales that measured constructs that were curriculum relevant, teachable and malleable were selected. After the 1999 PISA field test, only scales demonstrating good psychometric behavior in all 22 field-test countries were selected for inclusion on the 2000 main-study PISA student questionnaire.

Chapter 5 Analysis of Student Survey Results
71
The items are included in ELS:2002 to create a more fully specified model, with greater explanatory power, of academic achievement and economic attainment. Whereas PISA is not a longitudinal study, through ELS:2002, the effect of self-regulated learning competencies on life-long learning can be investigated, along with the relationship between self-regulated learning skills and academic achievement and other valuable outcomes and behaviors.
5.2.2 Scale Descriptions
5.2.2.1 Component 1—Cognitive Component of Self-regulated Learning
Two dimensions—self-regulated learning strategies and implicit theories of learning—define the cognitive component of self-regulated learning.
5.2.2.1.1 Self-regulated Learning Strategies
The literature identifies three types of self-regulated learning strategies (e.g., Baumert, 1993; Zimmerman & Schunk, 1989; Schunk & Zimmerman, 1994). The first type, strategies of information processing (cognitive strategies), is represented by the learning strategies of elaboration and rehearsal. Planning and execution strategies, such as monitoring and adaptation, typify the second category of strategies called control strategies (meta-cognitive strategies). The third type of learning strategies is resource-management strategies. Resource management strategies involve the successful deployment of resources, particularly motivation (internal strategies) and time (external strategies). Because the intercorrelations between the control and the resource-management strategies scales are high, the two sub-dimensions have been collapsed into a single sub-dimension labeled control strategies (Baumert, Fend, O'Neil, & Peschar, 1998).
5.2.2.1.1.1 Rehearsal (Memorization) Strategies ScaleWhen I study: I try to memorize everything that might be covered. I memorize as much as possible. I memorize all new material so that I can recite it. I practice by saying the material to myself over and over.
The rehearsal (memorizing) scale is the short version of the KSI (Baumert, Heyn & Koller, 1994), which is based on the inventories Goals and Strategies for Studying Science (GSSS: Nolen & Haladyna, 1990a; b), and the Motivated Learning Strategies Questionnaires(MLSQ; Pintrich, Smith, Garcia & McKeachie, 1993). The KSI is also similar to the Inventoryof Student Learning Strategies (LIST; Wild & Schiefele, 1994), which was adapted from the MSLQ.
Across the 22 PISA field-test countries, coefficient (Cronbach's) alphas, a standard measure of internal consistency, for the rehearsal scale ranged from .63 to .83.

Chapter 5 Analysis of Student Survey Results
72
5.2.2.1.1.2 Elaboration Strategies Scale When I study: I try to relate new material to things I have learned in other subjects. I figure out how the information might be useful in the real world. I try to understand the material better by relating it to things I already know. I figure out how the material fits in with what I have learned.
The elaboration scale is the short version of the KSI Elaboration scale (Baumert, Heyn & Koller, 1994). The items are similar to other elaboration scales and items appearing in the MSLQ (Pintrich et al., 1993) and the GSSS (Nolen & Haladyna, 1990a; 1990b).
Coefficient alphas for the elaboration strategies scale across the 22 PISA field-test countries ranged from .71 to .81.
5.2.2.1.1.3 Control Strategies Scale When I study: I start by figuring out what, exactly, I need to learn. I force myself to check to see if I remember what I have learned. I try to figure out, as I read, which concepts I still haven't really understood. I make sure that I remember the most important things. When I study, and I don't understand something, I look for additional information to clarify this.
The control strategies scale reflects the optimal selection of items from the planning, monitoring, and regulation subscales of the KSI (Baumert, Heyn & Koller, 1994). Coefficient alphas for the control strategies scale across the 22 PISA field-test countries ranged from .62 to .81.
5.2.2.1.2 Implicit Theories of Learning
5.2.2.1.2.1 Implicit Theory of Learning—Math People can learn to be good in math. You have to be born with the ability to be good in math.
Two new items were developed to measure individuals’ perceptions of mathematics ability. Beliefs about math as an acquired skill or an inherent aptitude have been found to enhance or undermine learning and performance, affecting motivation, goal setting, interests and choices (Bandura, 1997; Dweck & Leggert, 1988).

Chapter 5 Analysis of Student Survey Results
73
5.2.2.2 Component 2 – Motivational Component of Self-regulate Learning
Three dimensions comprise the motivational component of self-regulated learning: (1) motivational preferences, (2) self-regulated cognitions, and (3) action control strategies.
5.2.2.2.1 Motivational Preferences
To learn, students need to be sufficiently motivated. Motivation regulates the investment of time and energy. Two sub-dimensions, instrumental motivation and intrinsic interest, operationally define the motivational preferences dimension.
5.2.2.2.1.1 Instrumental Motivation (Utility Interest) Scale—GeneralI study:
To increase my job opportunities. To ensure that my future will be financially secure. To get a good job.
The three items operationally defining instrumental motivation are from the Intrinsic Learning Motivation Scale (Schiefele & Moschner, 1997). Coefficient alphas for the scale across the 22 PISA field-test countries ranged from .77 to .86.
5.2.2.2.1.2 Intrinsic Interest Scale—Subject Specific (Math And English)
Math:When I do math, I sometimes get totally absorbed. Math is important to me personally. Because doing math is fun, I wouldn't want to give it up. English:Because reading is fun, I wouldn't want to give it up. I read in my spare time. When I read, I sometimes get totally absorbed.
Items comprising the subject-specific intrinsic interest scales were adapted from sub-scales on the Intrinsic Learning Motivation Scale (Schiefele, 1997), and interest scales used in the longitudinal study Learning Processes, Educational Careers and Psycho-social Development in Adolescence (Baumert et al., 1997). Similar scales also appeared in the German TIMSS/II and TIMSS/III. The scales measure personal valence, positive emotion, flow and self-intentionality towards the specific subject areas of mathematics and English.
Coefficient alphas for the math interest scale across the 22 PISA field-test countries ranged from .71 to .90. Coefficient alphas for the English interest scale ranged from .78 to .90.

Chapter 5 Analysis of Student Survey Results
74
5.2.2.2.2 Self-regulated Cognitions
Self-regulated cognitions regulate actions. According to the literature on achievement and performance (Bandura, 1997), some of the motivational forces behind actions are self-efficacy, self-concept, and control beliefs or expectations. These three constructs were measured in the ELS:2002 field test by the scales control expectation, action control strategies, and self-efficacy beliefs. To reduce respondent burden and cost, the construct of self-concept was not measured in the ELS:2002 field test because information on the operation of subject-specific and academic self-concept scales (Marsh and Yeung, 1996) is already available from several other NCES cross-sectional and longitudinal studies, particularly NELS:88 and PISA.
5.2.2.2.2.1 Control Expectation
When I sit myself down to learn something really hard, I can learn it. If I decide not to get any bad grades, I can really do it. If I decide not to get any problems wrong, I can really do it. If I want to learn something well, I can.
The control expectation scale is a modified version of a similar scale appearing in the MSLQ (Pintrich et al., 1993). In the PISA field test, coefficient alphas across all 22 field-test countries ranged from .69 to .84.
5.2.2.2.2.2 Self-Efficacy—Subject Specific (Math and English) Math:I'm certain I can understand the most difficult material presented in my math texts. I'm confident I can understand the most complex material presented by my math teacher. I'm confident I can do an excellent job on my math assignments. I’m confident I can do an excellent job on my math tests. I'm certain I can master the skills being taught in my math class.
English:I'm certain I can understand the most difficult material presented in my English texts. I'm confident I can understand the most complex material presented by my English teacher. I'm confident I can do an excellent job on my English assignments. I’m confident I can do an excellent job on my English tests. I'm certain I can master the skills being taught in my English class.
Slightly modified versions of the PISA self-efficacy items were used in ELS:2002 field test. PISA measures global self-efficacy beliefs only, not subject- or task-specific self-efficacy beliefs as recommended by Bandura (1997). Beliefs about one’s ability or confidence to perform certain actions and tasks vary by actions and tasks. An individual may feel very confident he or she will perform well on English tests but not on math tests. Measuring subject-specific self-efficacy beliefs enhances their predictive power. Another alteration made to the PISA self-efficacy items was to separate the item “I’m confident I can do an excellent job on my math (English) assignments and tests” into two items. Again, self-efficacy beliefs vary by tasks and actions; an individual may feel extremely confident he or she can do an excellent job on homework assignments but not necessarily on tests.

Chapter 5 Analysis of Student Survey Results
75
The ELS:2002 field test items, like the PISA items, were taken with some changes from the self-efficacy scale in the MSLQ (Pintrich et al., 1993). Across the 22 PISA field-test countries, coefficient alphas were .78 or greater for a global measure of self-efficacy.
5.2.2.2.3 Action Control Strategies
“Action control strategies shield the performance of actions from competing intentions and help to overcome difficulties” (Baumert, Fend, O’Neil & Peschar, 1998). Achievement requires focused effort and persistence until the job is done. The single global sub-dimension of effort and persistence will be used in ELS:2002 field test to measure students’ action control strategies.
5.2.2.2.3.1 Effort And Persistence—General
When studying: I try to work as hard as possible. I keep working even if the material is difficult. I try to do the best to acquire the knowledge and skills taught. I put forth my best effort.
The four-item scale has been tested by O’Neil and Herl (1998) producing a coefficient alpha of .90 for U.S., Taiwanese and Brazilian high school students. In the PISA field test, alpha coefficients ranged from .76 to .87 across the 22 field-test countries.
5.2.2.3 Component 3—Socio-cognitive Component of Self-Regulate Learning
A single dimension composed of two sub-dimensions, preference for cooperative learning and preference for competitive learning, operationally defines the socio-cognitive component of self-regulated learning.
5.2.2.3.1 Learning Style Preference
High quality learning requires the ability to learn on one’s own as well as in groups, particularly in today’s environment of work groups and project teams.
5.2.2.3.1.1 Preference for Cooperative Learning
I like to work with other students. I learn most when I work with other students. I do my best work when I work with other students. I like to help other people do well in group assignments. It is helpful to put together everyone’s ideas when working a project.
The 5-item preference for cooperative learning scale was developed by Marsh et al. (1999) and has registered reliabilities (coefficient alphas) of over .80.

Chapter 5 Analysis of Student Survey Results
76
5.2.2.3.1.2 Preference for Competitive Learning
I like to try to be better than other students. Trying to be better than others makes me work well. I would like to be the best at something. I learn faster if I’m trying to do better than the others.
Owens and Barnes (1992) developed the ELS:2002 preference for competitive learning scale. In the PISA field test, the 4-item scale registered coefficient alphas ranging from .74 to .81.
5.2.3 Results of Field Test
Coefficient alphas (Cronbach, 1970) were computed for all scales to evaluate their reliability (internal consistency) (Bohrnstedt, 1983). Item-to-total statistics were also calculated to assess the contribution each item made to its respective scale’s internal consistency. This evaluation aided in identifying items that might be dropped to reduce respondent burden. If the removal of an item from a scale would increase the scale’s internal consistency (reliability), the item was dropped from the scale (and questionnaire). As an additional evaluative test, all scales were correlated with one another. The correlation matrix helped to identify redundant scales or constructs.
Table 5-11 presents basic statistics on each scale (i.e., mean, standard deviation [SD]), minimum-maximum scale value, alpha coefficient, and the alpha coefficient when a weak item is removed (item-to-total statistic). Table 1 also includes the response options and values for all scales. For example, the response options for the Rehearsal (memorization) Strategies Scale are:1=almost never, 2=sometimes, 3=often, and 4=almost always. Each scales’ alpha coefficient in the PISA field test is reported in parentheses in the column headed “Alpha coefficient”. The numbers in parentheses following the scale items (under the column headed Construct/Scale) are the field test student questionnaire item numbers for the items.
Table 5-12 presents the zero-order correlations among all variables.
Similar to the PISA field test results, results of the ELS:2002 field test reveal high alpha coefficients for all 12 self-regulated learning scales, indicating highly reliable scales. Alpha coefficients for the 12 scales ranged from a low of r = .80 (Intrinsic Interest Math Scale, Preference for Competitive Learning Scale) to a high of r = .93 (Self-Efficacy in English Scale).In general, the scales showed higher alpha coefficients in the ELS:2002 field test than the PISA field test, where alpha coefficients ranged from a low of r = .62 (Control Strategies Scale) to a high of r = .90 (Intrinsic Interest Math and English Scales). The higher alpha coefficients in the ELS:2002 field test are probably due to a more heterogeneous student population in the United States than in the international countries participating in the PISA field test (e.g., Denmark).1
1 Alpha coefficients were calculated separately for each of the 22 countries participating in the PISA field test. The ranges shown in parentheses in Table 1 are the ranges of alpha coefficients for these 22 countries.

Chapter 5 Analysis of Student Survey Results
77
The item-to-total statistics identified three scales for which reliability would be improved if an item was deleted. These scales were:
(1) Intrinsic Interest—Math alpha before: r = .80 ; alpha after item 130a removed: r = .84 (2) Intrinsic Interest—English alpha before: r = .86 ; alpha after item 130k removed: r = .89 (3) Preference for
Competitive Learning alpha before: r = .80 ; alpha after item 130j removed: r = .83
A correlation coefficient was computed as a measure of the association of the two Implicit Theories of Learning. A high, negative correlation was expected, indicating that individuals hold either one or the other belief about math, but not both. That is, people believe strongly that either one can acquire the skill to be good at math or math is an innate ability.
The correlation coefficient was r = -.12. While the correlation coefficient was in the expected, negative, direction, indicating people tend to hold one belief over the other, the strength of the relationship, although statistically significant, was low (Cohen, 1988), with one item explaining only .01 amount of variance in the other (R2 = .01). With a mean of 2 (agree) for the item “People can learn to be good at math,” and a mean of 2.87 (or 3; disagree) for the item “You have to be born with the ability to be good in math”, it appears that the responding students do not hold strong beliefs about the origins of mathematics ability.
Finally, all scales were correlated with one another as a means of identifying redundant constructs that could be removed from the student questionnaire. Table 12 displays these zero-order correlations. Scales that correlated highly with one another—those with an r of .60 and higher—were:
Control Strategies and Rehearsal r = .72 Control Strategies and Elaboration r = .75 Control Strategies and Instrumental Motivation r = .69 Control Strategies and Control Expectation r = .60 Control Strategies and Effort and Persistence r = .85 Effort and Persistence and Rehearsal r = .64 Effort and Persistence and Elaboration r = .74 Effort and Persistence and Instrumental Motivation r = .70 Effort and Persistence and Control Expectation r = .63 Control Expectation and Elaboration r = .60 Control Expectation and Math Efficacy r = .61
Both the Control Strategies scale and the Effort and Persistence scale correlated highly with five other scales, almost half of the other constructs.
5.2.4 Recommendations for the Main Study
Strict adherence to a questionnaire administration time of 45 minutes required that some self-regulated learning scales be dropped from the student questionnaire. With the scales all registering impressively high alpha coefficients, which scales to drop was decided based on the zero-order correlations and the recommendations of members of the ELS:2002 Technical Review Panel (TRP).
Chapter 5 Analysis of Student Survey Results
78
Six scales—comprising 25 items and measuring five constructs—were selected for the main study student questionnaire. These items are listed below.
5.2.4.1 Implicit Theories of Learning (131)
Response options—Strongly agree (1); agree (2); disagree (3); strongly disagree (4)
People can learn to be good in math. You have to be born with the ability to be good in math.
5.2.4.2 Intrinsic Interest Scale–Subject Specific
Response options—Strongly agree (1); agree (2); disagree (3); strongly disagree (4)
Math:
Delete: When I do math, I sometimes get totally absorbed. (130a)Replace with: I like math.
Math is important to me personally. (130m) Because doing math is fun, I wouldn’t want to give it up. (130f)
The internal consistency analysis showed that the alpha coefficient would increase from .80 to .84 if item 130a were deleted. Recommend deleting item 130a, but replacing it with another item—I like math—for use when analyzing the data through structural equation modeling.
English:
Because reading is fun, I wouldn’t want to give it up. (130d) I read in my spare time. (130h) Delete: When I read, I sometimes get totally absorbed. (130k)Replace with: I like English.
Similarly, the internal consistency analysis showed that the alpha coefficient of this scale would increase from .86 to .89 if item 130k were deleted. Recommend deleting item 130K, but replacing it with another item—I like English—for use when analyzing the data through structural equation modeling.
5.2.4.3 Instrumental Motivation (utility interest) Scale–general
Response options -- Almost never (1); sometimes (2); often (3); almost always (4)
I study: To increase my job opportunities. (132k) To ensure that my future will be financially secure. (132v) To get a good job. (132f)
5.2.4.4 Control Expectation Scale Response options–Almost never (1); sometimes (2); often (3); almost always (4) When I sit myself down to learn something really hard, I can learn it. (132g)

Chapter 5 Analysis of Student Survey Results
79
If I decide not to get any bad grades, I can really do it. (132s) If I decide not to get any problems wrong, I can really do it. (132x) If I want to learn something well, I can. (132dd)
5.2.4.5 Self-Efficacy Scales—Subject Specific
Response options–Almost never (1); sometimes (2); often (3); almost always (4)
Math:I’m certain I can understand the most difficult material presented in my math texts. (132c) I’m confident I can understand the most complex material presented by my math teacher. (132o) I’m confident I can do an excellent job on my math assignments. (132z) I’m confident I can do an excellent job on my math tests. (132b) I’m certain I can master the skills being taught in my math class. (132ff)
English:I’m certain I can understand the most difficult material presented in my English texts. (132d) I’m confident I can understand the most complex material presented by my English teacher. (132h) I’m confident I can do an excellent job on my English assignments. (132l) I’m confident I can do an excellent job on my English tests. (132n) I’m certain I can master the skills being taught in my English class. (132p)

80
Tab
le 5
-11—
Ana
lysi
s of E
LS:
2002
fiel
d te
st d
ata
for
self-
regu
late
d le
arni
ng sc
ales
Con
stru
ct/S
cale
M
ean
SDM
in-M
ax
Alp
haC
oeff
icie
nta
Alp
ha if
Item
(s) R
emov
ed
Cog
nitiv
e C
ompo
nent
of S
elf-
Reg
ulat
ed L
earn
ing
I. Se
lf-R
egul
ated
Lea
rnin
g St
rate
gies
1.R
ehea
rsal
(mem
oriz
atio
n) st
rate
gies
scal
e A
lmos
t nev
er (1
); so
met
imes
(2);
oft
en (3
); a
lmos
t alw
ays (
4)
Whe
n I s
tudy
:
I try
to m
emor
ize
ever
ythi
ng th
at m
ight
be
cove
red
(132
a)
I m
emor
ize
as m
uch
as p
ossi
ble
(132
i)
I mem
oriz
e al
l new
mat
eria
l so
that
I ca
n re
cite
it (1
32r)
I pra
ctic
e by
sayi
ng th
e m
ater
ial t
o m
ysel
f ove
r and
ove
r (13
2w)
2.49
.7
2 1-
4 .8
1
(.63-
.83)
Non
e
2.E
labo
ratio
n st
rate
gies
scal
e
W
hen
I stu
dy:
I t
ry to
rela
te n
ew m
ater
ial t
o th
ings
I ha
ve le
arne
d in
oth
er su
bjec
ts (1
32q)
I fig
ure
out h
ow th
e in
form
atio
n m
ight
be
usef
ul in
the
real
wor
ld (1
32y)
I try
to u
nder
stan
d th
e m
ater
ial b
ette
r by
rela
ting
it to
thin
gs I
alre
ady
know
(1
32cc
)
I fig
ure
out h
ow th
e m
ater
ial f
its in
with
wha
t I h
ave
lear
ned
(132
ee)
2.57
.7
3 1-
4 .8
3
(.71-
.81)
Non
e
3.C
ontr
ol st
rate
gies
scal
e
W
hen
I stu
dy:
I s
tart
by fi
gurin
g ou
t wha
t, ex
actly
, I n
eed
to le
arn
(132
e)
I f
orce
mys
elf t
o ch
eck
to se
e if
I rem
embe
r wha
t I h
ave
lear
ned
(132
u)
I t
ry to
figu
re o
ut, a
s I re
ad, w
hich
con
cept
s I st
ill h
aven
’t re
ally
und
erst
ood
(132
aa)
I m
ake
sure
that
I re
mem
ber t
he m
ost i
mpo
rtant
thin
gs (1
32j)
A
nd I
don’
t und
erst
and
som
ethi
ng, I
look
for a
dditi
onal
info
rmat
ion
to c
larif
y
th
is (1
32gg
)
2.71
.6
9 1-
4 .8
3
(.62-
.81)
Non
e
II.
Impl
icit
Theo
ries
of L
earn
ing
(131
) St
rong
ly a
gree
(1);
agre
e (2
); di
sagr
ee (3
); st
rong
ly d
isag
ree
(4)
Peop
le c
an le
arn
to b
e go
od in
mat
h
Y
ou h
ave
to b
e bo
rn w
ith th
e ab
ility
to b
e go
od in
mat
h 2.
02
2.87
.7
3 .8
2 1-
4 1-
4
r = -.
12, p
<.01
Mot
ivat
iona
l Com
pone
nt o
f Sel
f-R
egul
ated
Lea
rnin
g II
I. M
otiv
atio
nal P
refe
renc
es
4.In
stru
men
tal m
otiv
atio
n (u
tility
inte
rest
) sca
le –
gen
eral
A
lmos
t nev
er (1
); so
met
imes
(2);
oft
en (3
); a
lmos
t alw
ays (
4)
I s
tudy
:
To in
crea
se m
y jo
b op
portu
nitie
s (13
2k)
To
ens
ure
that
my
futu
re w
ill b
e fin
anci
ally
secu
re (1
32v)
To g
et a
goo
d jo
b (1
32f)
2.65
.8
3 1-
4 .8
5
(.77-
.86)
Non
e
a The
alph
a co
effic
ient
for t
he U
nite
d St
ates
is sp
ecifi
ed fi
rst f
ollo
wed
in p
aren
thes
es b
y th
e ra
nge
of a
lpha
coe
ffic
ient
s for
the
22 c
ount
ries p
artic
ipat
ing
in P
ISA
.

81
Tab
le 5
-11—
Ana
lysi
s of E
LS:
2002
fiel
d te
st d
ata
for
self-
regu
late
d le
arni
ng sc
ales
(con
tinue
d)
Con
stru
ct/S
cale
M
ean
SDM
in-M
ax
Alp
haC
oeff
icie
nta
Alp
ha if
Item
(s) R
emov
ed
5.In
trin
sic
inte
rest
scal
e –
subj
ect s
peci
fic
Stro
ngly
agr
ee (1
); a
gree
(2);
dis
agre
e (3
); st
rong
ly d
isag
ree
(4)
M
ath:
W
hen
I do
mat
h, I
som
etim
es g
et to
tally
abs
orbe
d (1
30a)
Mat
h is
impo
rtant
to m
e pe
rson
ally
(130
m)
B
ecau
se d
oing
mat
h is
fun,
I w
ould
n’t w
ant t
o gi
ve it
up
(130
f)
En
glis
h:
Bec
ause
read
ing
is fu
n, I
wou
ldn’
t wan
t to
give
it u
p (1
30d)
I rea
d in
my
spar
e tim
e (1
30h)
Whe
n I r
ead,
I so
met
imes
get
tota
lly a
bsor
bed
(130
k)
2.55
2.46
.74
.64
1-4
1-4
.80
(.71-
.90)
.86
(.78-
.90)
.84,
if 1
30a
dele
ted
.89,
if 1
30k
dele
ted
IV.
Self-
Reg
ulat
ed C
ogni
tions
6.
Con
trol
Exp
ecta
tion
Alm
ost n
ever
(1);
som
etim
es (2
); o
ften
(3);
alm
ost a
lway
s (4)
W
hen
I sit
mys
elf d
own
to le
arn
som
ethi
ng re
ally
har
d, I
can
lear
n it
(132
g)
If
I de
cide
not
to g
et a
ny b
ad g
rade
s, I c
an re
ally
do
it (1
32s)
If I
deci
de n
ot to
get
any
pro
blem
s wro
ng, I
can
real
ly d
o it
(132
x)
If
I w
ant t
o le
arn
som
ethi
ng w
ell,
I can
(132
dd)
2.87
.7
3 1-
4 .8
2
(.69-
.84)
Non
e
7.Se
lf-E
ffic
acy
– su
bjec
t spe
cific
Mat
h:
I’m
cer
tain
I ca
n un
ders
tand
the
mos
t diff
icul
t mat
eria
l pre
sent
ed in
my
mat
h
Te
xts (
132c
)
I’m
con
fiden
t I c
an u
nder
stan
d th
e m
ost c
ompl
ex m
ater
ial p
rese
nted
by
my
mat
h te
ache
r (13
2o)
I’
m c
onfid
ent I
can
do
an e
xcel
lent
job
on m
y m
ath
assi
gnm
ents
(132
z)
I’
m c
onfid
ent I
can
do
an e
xcel
lent
job
on m
y m
ath
test
s (13
2b)
I’
m c
erta
in I
can
mas
ter t
he sk
ills b
eing
taug
ht in
my
mat
h cl
ass (
132f
f)
Engl
ish:
I’
m c
erta
in I
can
unde
rsta
nd th
e m
ost d
iffic
ult m
ater
ial p
rese
nted
in m
y
En
glis
h te
xts (
132d
)
I’m
con
fiden
t I c
an u
nder
stan
d th
e m
ost c
ompl
ex m
ater
ial p
rese
nted
by
my
Engl
ish
teac
her (
132h
)
I’m
con
fiden
t I c
an d
o an
exc
elle
nt jo
b on
my
Engl
ish
assi
gnm
ents
(132
l)
I’m
con
fiden
t I c
an d
o an
exc
elle
nt jo
b on
my
Engl
ish
test
s (13
2n)
I’
m c
erta
in I
can
mas
ter t
he sk
ills b
eing
taug
ht in
my
Engl
ish
clas
s (13
2p)
2.56
2.70
.83
.80
1-4
1-4
.92
.93
(.78
+)
Non
e
Non
e
V.
Actio
n C
ontr
ol S
trat
egie
s
8.E
ffor
t and
per
sist
ence
A
lmos
t nev
er (1
); so
met
imes
(2);
oft
en (3
); a
lmos
t alw
ays (
4)
W
hen
stud
ying
:
I try
to w
ork
as h
ard
as p
ossi
ble
(132
m)
I
keep
wor
king
eve
n if
the
mat
eria
l is d
iffic
ult (
132t
)
I try
to d
o th
e be
st to
acq
uire
the
know
ledg
e an
d sk
ills t
augh
t (13
2bb)
I pu
t for
th m
y be
st e
ffor
t(132
hh)
2.76
.7
4 1-
4 .8
5
(.76-
.87)
Non
e
a The
alph
a co
effic
ient
for t
he U
nite
d St
ates
is sp
ecifi
ed fi
rst f
ollo
wed
in p
aren
thes
es b
y th
e ra
nge
of a
lpha
coe
ffic
ient
s for
the
22 c
ount
ries p
artic
ipat
ing
in P
ISA
.

82
Tab
le 5
-11—
Ana
lysi
s of E
LS:
2002
Fie
ld T
est D
ata
for
Self-
Reg
ulat
ed L
earn
ing
Scal
es (c
ontin
ued)
Con
stru
ct/S
cale
M
ean
SDM
in-M
ax
Alp
ha C
oeff
icie
nta
Alp
ha if
Item
(s)
Rem
oved
So
cio-
cogn
itive
Com
pone
nt o
f Sel
f-R
egul
ated
Lea
rnin
g IV
. Le
arni
ng S
tyle
Pre
fere
nce
9.Pr
efer
ence
for
coop
erat
ive
lear
ning
St
rong
ly a
gree
(1);
agr
ee (2
); d
isag
ree
(3);
stro
ngly
dis
agre
e (4
)
I lik
e to
wor
k w
ith o
ther
stud
ents
(130
b)
I
lear
n th
e m
ost w
hen
I wor
k w
ith o
ther
stud
ents
(130
e)
I
do m
y be
st w
ork
whe
n I w
ork
with
oth
er st
uden
ts (1
30i)
I
like
to h
elp
othe
r peo
ple
do w
ell i
n gr
oup
assi
gnm
ents
(130
l)
It is
hel
pful
to p
ut to
geth
er e
very
one’
s ide
as w
hen
wor
king
a o
n pr
ojec
t
(1
30n)
2.14
.5
6 1-
4 .8
2
(.80
+)
Del
ete
n --
doe
sn’t
cont
ribut
e; a
lpha
rem
ains
.8
2
10.
Pref
eren
ce fo
r co
mpe
titiv
e le
arni
ng
I
like
to tr
y to
be
bette
r tha
n ot
her s
tude
nts (
130c
)
Try
ing
to b
e be
tter t
han
othe
rs m
akes
me
wor
k w
ell (
130g
)
I w
ould
like
to b
e th
e be
st a
t som
ethi
ng (1
30j)
I
lear
n fa
ster
if I’
m tr
ying
to d
o be
tter t
han
the
othe
rs (1
30o)
2.12
.6
2 1-
4 .8
0
(.74-
.81)
Del
ete
j -- a
lpha
cha
nges
to
.83
Impu
lsiv
ity/R
isk
Stro
ngly
agr
ee (1
); A
gree
(2);
Dis
agre
e (3
); st
rong
ly d
isag
ree
(4)
I
ofte
n ac
t on
the
spur
of m
omen
t with
out s
topp
ing
to th
ink
(129
a)
I
don
't de
vote
muc
h th
ough
t and
effo
rt to
pre
pari
ng fo
r the
futu
re (1
29b)
I o
ften
do w
hate
ver b
rings
me
plea
sure
her
e an
d no
w, e
ven
at th
e co
st o
f
som
e di
stan
t goa
l (12
9c)
I
'm m
ore
conc
erne
d w
ith w
hat h
appe
ns to
me
in th
e sh
ort r
un th
an in
the
long
Run
(129
d)
I
like
to te
st m
ysel
f eve
r now
and
then
by
doin
g so
met
hing
a li
ttle
risky
(129
e)
S
omet
imes
I w
ill ta
ke a
risk
just
for t
he fu
n of
it (1
29f)
I so
met
imes
find
it e
xciti
ng to
do
thin
gs fo
r whi
ch I
mig
ht g
et in
to tr
oubl
e
(
129g
)
Exc
item
ent a
nd a
dven
ture
are
mor
e im
porta
nt to
me
than
secu
rity
(129
h)
2.57
.5
9 1-
4 .8
5 D
elet
e b
-- a
lpha
cha
nges
to
.86
a The
alph
a co
effic
ient
for t
he U
nite
d St
ates
is sp
ecifi
ed fi
rst f
ollo
wed
in p
aren
thes
es b
y th
e ra
nge
of a
lpha
coe
ffic
ient
s for
the
22 c
ount
ries p
artic
ipat
ing
in P
ISA
.

83
Tab
le 5
-12.
—Ze
ro-o
rder
cor
rela
tions
of
self-
regu
late
d le
arni
ng sc
ales
Rehearsal
Elaboration
ControlStrategies
Instrumental Motivation
Math Interest
EnglishInterest
ControlExpectation
MathEfficacy
Risk/Impulse
EnglishEfficacy
Effort and Persistence
CooperativeLearning
CompetitiveLearning
Reh
ears
al1.
00E
labo
ratio
n .5
6**1.
00C
ontr
ol S
trat
egie
s .7
2**.7
5**1.
00In
stru
men
tal M
otiv
atio
n
.53**
.59**
.69**
1.00
Mat
h In
tere
st (R
) -.1
8**
-.27**
-.2
5**-.2
3**1.
00E
nglis
h In
tere
st (R
) -.1
0 -.2
3**
-.17**
-.10*
.13**
1.00
Con
trol
Exp
ecta
tion
.49**
.60**
.68**
.47**
-.30**
-.16**
1.00
Mat
h E
ffic
acy
.40**
.41**
.52**
.34**
-.52**
-.05
.61**
1.00
Ris
k/Im
puls
e (R
) -.2
1**
-.25**
-.3
6**-.3
3**-.0
9-.1
5**.2
5**.1
8**1.
00E
nglis
h E
ffic
acy
.39**
.46**
.53**
.40**
.01
-.31**
.52**
.33**
.28**
1.00
Eff
ort a
nd P
ersi
sten
ce
.64**
.74**
.85**
.70**
-.24**
-.20**
.63**
.48**
.36**
.50**
1.00
Coo
pera
tive
Lea
rnin
g (R
) -.1
8**
-.14**
-.1
3*-.0
9.1
8**.3
3**-.0
3-.0
6.0
0-.1
1*-.1
3**1.
00C
ompe
titiv
e L
earn
ing
(R)
-.25**
-.2
9**
-.27**
-.23**
.33**
.12**
-.30**
-.31**
-.06
-.18**
-.24**
.20**
1.00
Not
e: (R
) mea
ns re
vers
e sc
ale,
for e
xam
ple,
1 =
mor
e in
tere
sted
in m
ath/
Engl
ish
and
4 =
less
inte
rest
ed in
mat
h/En
glis
h in
stea
d of
1 =
less
ef
ficac
ious
and
4 =
mor
e ef
ficac
ious
. **
p<.0
1, 2
-taile
d te
st.
* p<.0
5, 2
-taile
d te
st.
Chapter 5 Analysis of Student Survey Results
84
5.3 Student Questionnaire: Other Items
All of the following analyses of the field test student questionnaire data are based on 922 cases.2 The analyses presented in the remainder of this chapter are tallies of student questions about questionnaire items, the percent of missing data retrieved for each critical item, item-level rates of nonresponse, a check on inter-item consistency, percent of students successfully navigating each filter question, and item-level response rate variation by position in the questionnaire. When these analyses indicated that the questionnaire needed refinement, the problem was investigated thoroughly. The results of these investigations are presented here and will inform instrument development for the full-scale study.
5.3.1 Item by Item Tally of Questions Asked by Students in Survey Session
One way to assess the quality of the survey items is to field questions from respondents as they complete the questionnaire. Prior to starting work on the questionnaire, the survey administrators told students that if they did not understand a question or did not know how to answer, they should raise their hand to seek assistance.As the survey administrators responded to each student, they noted on tally sheets which item was at issue and the nature of the student's confusion. When an item frequently causes difficulty, it may be that respondents do not understand the question, that the response options are not exhaustive, or that they are unable to provide the requested information because they do not know.
The survey administrators' combined reports show that overall students asked very few questions. For the majority of the items, not a single student sought assistance from any of the survey administrators. Most other items only generated a question or two. However, there were a couple of questions in Part I: Information for Future Follow-up that caused trouble for a number of students. Students who did not have contact with a parent did not know how to respond when asked for his or her address.Other students told the survey administrators that they were unable to provide complete addresses, particularly for relatives or close friends. RTI suggests that the survey administrators encourage students to report as much information as they know rather than leave the address blank. In addition, RTI recommends adding an "I don't know any of his/her address" response option for these questions.
5.3.2 Analysis of Editing/Retrieval of Critical Items
Thirty-one questions, many with multiple parts, were designated critical items. These are data elements that were deemed essential for locating students for follow up, central to ELS:2002's policy concerns, of high analytic importance, or prone to be
2 Records with “spotty data” were removed for these analyses. In early April, as it became clear that most students were unable to finish the questionnaire, survey administrators began instructing students to complete the parts out of sequential order to be sure that questions in parts 6 and 7 had sufficient numbers of respondents for analyses. The middle of the questionnaire is blank for a number of students who completed the questionnaire after this date. It appears that these studentsstarted working from beginning to end and later jumped forward to the last two parts of the questionnaire. The spottiness of the data for these questionnaires made assigning accurate "not reached" codes impossible. This in turn affected the calculationof rates of nonresponse. Therefore, it was decided that all field test analyses on the student questionnaire data would be restricted to the 922 cases for which the order of completion was known.

Chapter 5 Analysis of Student Survey Results
85
accidentally skipped. To maximize the response rates for these items, survey administrators were instructed to follow these procedures. They were to edit each student's questionnaire, noting which critical items were improperly blank. When releasing students from the session, the survey administrators were responsible for holding back all those with incomplete critical items for the purpose of reviewing these items with each student individually. If the student declined to answer when prompted, the survey administrators were instructed to mark an "x" by the question to indicate that retrieval had been attempted.
Table 5-13 lists each critical item and its description. The number of students to whom the question applied and the number who left the item blank follow in the next two columns. Note that an "I don't know" response is not considered blank for these purposes. Finally, the last column indicates the percent of cases with missing data for which retrieval was attempted. If the critical item retrieval had proceeded as intended, retrieval would have been attempted for all of the cases missing data.
Table 5-13—ELS:2002 field test critical item retrieval
Variable Variable Label NNumber missing (not
including DKs) Percent for which retrieval
was attempted 1A R^S Last Name 922 3 33.3 1B R^S First Name 922 2 50.0 1C R^S Middle Initial 922 117 1.7 1D R^S Street Address 922 10 20.4 1E R^S City 922 4 51.2 1F R^S State 922 5 40.7 1G R^S Zip Code 922 13 23.4 1H R^S Phone Number 907 7 14.3 IJ R^S E-Mail 626 45 8.9
2AA Mother^S Last Name 922 11 9.3 2AB Mother^S First Name 922 13 15.6 2AC Mother^S Middle Initial 922 221 2.7 2B Does Mother Have Same Address/Tel 922 14 0.0 3A Mother^S Street Address 44 18 5.6 3B Mother^S City 44 19 5.3 3C Mother^S State 44 21 4.8 3D Mother^S Zip Code 44 24 4.2 3E Mother^S Phone Number 37 12 8.3 4A Mother^S Work Phone 755 11 36.3
6AA Father^S Last Name 922 41 26.7 6AB Father^S First Name 922 49 22.4 6AC Father^S Middle Initial 922 286 6.3 6B Does Father Have Same Address/Tel 922 36 19.5 7A Father^S Street Address 234 97 1.0 7B Father^S City 234 107 22.4 7C Father^S State 234 108 23.1 7D Father^S Zip Code 234 162 21.0 7E Father^S Phone Number 202 97 23.7 8A Father^S Work Phone 830 46 21.7
10A Relative/Friend^S Last Name 922 34 3.0 10B Relative/Friend^S First Name 922 47 21.2 10C Relative/Friend^S Middle Initial 922 500 6.2 10D Relative/Friend^S Street Address 922 234 0.4 10E Relative/Friend^S City 922 104 12.5 10F Relative/Friend^S State 922 104 12.5 10G Relative/Friend^S Zip Code 922 290 9.7 10H Relative/Friend^S Phone Number 882 132 15.2 13A R^S Birth Month 922 7 14.5 13B R^S Birth Day 922 8 12.6 13C R^S Birth Year 922 7 14.5 14 R^S Sex 922 15 6.8 15 R^S Ssn 922 37 13.5
38A Time On All Homework In School 922 34 11.7

Chapter 5 Analysis of Student Survey Results
86
Table 5-13—ELS:2002 field test critical item retrieval (continued) Variable Variable Label N
Number missing (not including DKs)
Percent for which retrieval was attempted
38B Time On All Homework Outside School 922 26 11.7 47 Use Computer Any Setting 922 29 10.5
48A How Often Use Computer-Write 763 15 0.0 48B How Often Use Computer-E-Mail/Chat-Rooms 763 23 0.0 48C How Often Use Computer-Play Games 763 27 0.0 48D How Often Use Computer-Learn Abt Colleges 763 30 0.0 48E How Often Use Internet-School Work 763 23 0.0 48F How Often Use Computer-Surf The Internet 763 27 0.0 48G How Often Use Internet-Learn Abt Interst 763 28 0.0 48H How Often Use Internet-Shop 763 27 0.0 48I How Often Use Computer-Job Tasks 763 38 0.0 48J How Often Use Computer-Get Online Info 763 28 0.0 48K How Often Use Computer-Homework 763 25 0.0 48L How Often Use Computer-Communicate W/Tchr 763 33 0.0 48M How Often Use Computer-Get Class Info 763 27 0.0 48N How Often Use Computer-Programming 763 30 0.0 60A Important Being Successful In Line Work 922 20 5.1 60B Important Finding Right Person To Marry 922 23 4.4 60C Important Having Lots Of Money 922 23 4.4 60D Important To Have Strong Friendships 922 22 4.6 60E Important To Be Able To Find Steady Work 922 25 4.1 60F Important To Help Others In Community 922 29 3.5 60G Give My Children Better Opportunities 922 30 3.4 60H Important Living Close Parents,Relatives 922 23 4.4 60I Important Getting Away From This Area 922 27 7.5 60J Working To Correct Economic Inequalities 922 32 3.2 60K Important Having Children 922 26 3.9 60L Important Having Leisure Time 922 30 3.4 60M Important Getting Away From Parents 922 28 3.6 60N Important Becoming Expert In Field 922 26 3.9 60O Important Getting Good Education 922 20 5.1 63 How Far In School R Thinks He Will Get 922 49 2.1 84 Is English R^S Native Language 922 32 6.3 85 R^S Native Language 167 26 3.9 96 Has R Ever Worked For Pay Outside Home 922 30 0.0
97A Month, Last Time R Worked For Pay 284 38 0.0 97B Year, Last Time R Worked 284 39 0.0 98A Month Started Current Job 494 85 3.5 98B Year Started Current Job 494 86 2.3
112A Mother/Female Guardian^S Occ Category 836 97 3.1 112B Mother/Female Guardn^S Occ Cat-Othr Spec 203 86 2.3 114A Father/Male Guardian^S Occ Category 826 93 8.6 114B Father/Male Guardian^S Occ Cat-Othr Spec 172 90 7.8 115A Father^S Highest Level Of Education 894 116 5.2 115B Mother^S Highest Level Of Education 910 114 5.3 122 R Is Hispanic 922 65 4.7 123 Hispanic Subdivision 230 64 1.6 124 R^S Race/Ethnicity 922 81 0.0 125 Asian Subdivision 132 83 0.0 126 Pacific Islander Subdivision 85 81 0.0
Clearly, the retrieval failed. There are two possible explanations for these results.The survey administrators may have prompted students who left the question blank, but did not have time or forgot to indicate that retrieval had been attempted for this question. However, it seems unlikely that so many students would have refused to answer. An alternative scenario is that survey administrators simply did not have enough time to complete the critical item retrieval as students were leaving. Many students did not reach critical items towards the end of the booklet because they were unable to complete the questionnaire in the hour allotted. Therefore, the survey administrators had many unanswered critical items to review with students. The full-scale questionnaire will be a more manageable length so fewer items will need attention. But this alone will not solve the problem. Locating the 31 critical items was difficult because they were scattered

Chapter 5 Analysis of Student Survey Results
87
throughout the questionnaire. For the full-scale study RTI recommends reducing the number of critical items and placing them in clusters so locating them is less time consuming. Furthermore, RTI recommends instructing the survey administrators to begin the critical item retrieval before the end of the session with students who have finished the test early.
5.3.3 Item nonresponse analysis
The following discussion addresses rates of nonresponse at the item level for student questionnaire items that RTI recommends retaining for the full-scale study based on policy prioritizations and analytic importance. For those items with high rates of item nonresponse, RTI explores the reasons for missing data and suggests remedies. Item nonresponse was calculated using the following formula:
Number of respondents with in-scope response Number of completed interviews for which question was intended and reached
The denominator for the nonresponse rate excludes cases for which the item does not apply (i.e., legitimate skip) or for which the item was not reached (see 5.3.6 for a discussion of nonresponse due to position in the student questionnaire).
Items with a nonresponse rate of 12 percent or more have been singled out for comment. For critical items, the threshold was lowered to 5 percent. A lower rate of nonresponse would be expected for these questions since the survey administrators were instructed to prompt students for the information if the critical item was initially left blank.
Table 5-14 lists each item that had a relatively high level of nonresponse in the field test. Critical items are marked with an asterisk. The variable name and descriptive label are followed by the number of students to whom the question applied (i.e., the denominator in the equation above). The next three columns contain rates of nonresponse.
Generally, the reason for nonresponse is not captured in the questionnaire data.However, some items have a "don't know" response option. For these questions, the percent of students who chose this answer is reported in the fourth column. The figure in the second to last column contains all other types of nonresponse. This includes "don't know" when an explicit option is not provided, refusals, as well as respondent error. For example, a student may mistakenly skip a question, provide more than one answer when only one is acceptable, or change his/her mind about an answer and not erase thoroughly. Although these types of nonresponse are not distinguishable in the data, one can often make an educated guess about which is largely responsible for nonresponse for a given item. Finally, the rightmost column contains the total nonresponse rate, the sum of the preceding two columns.
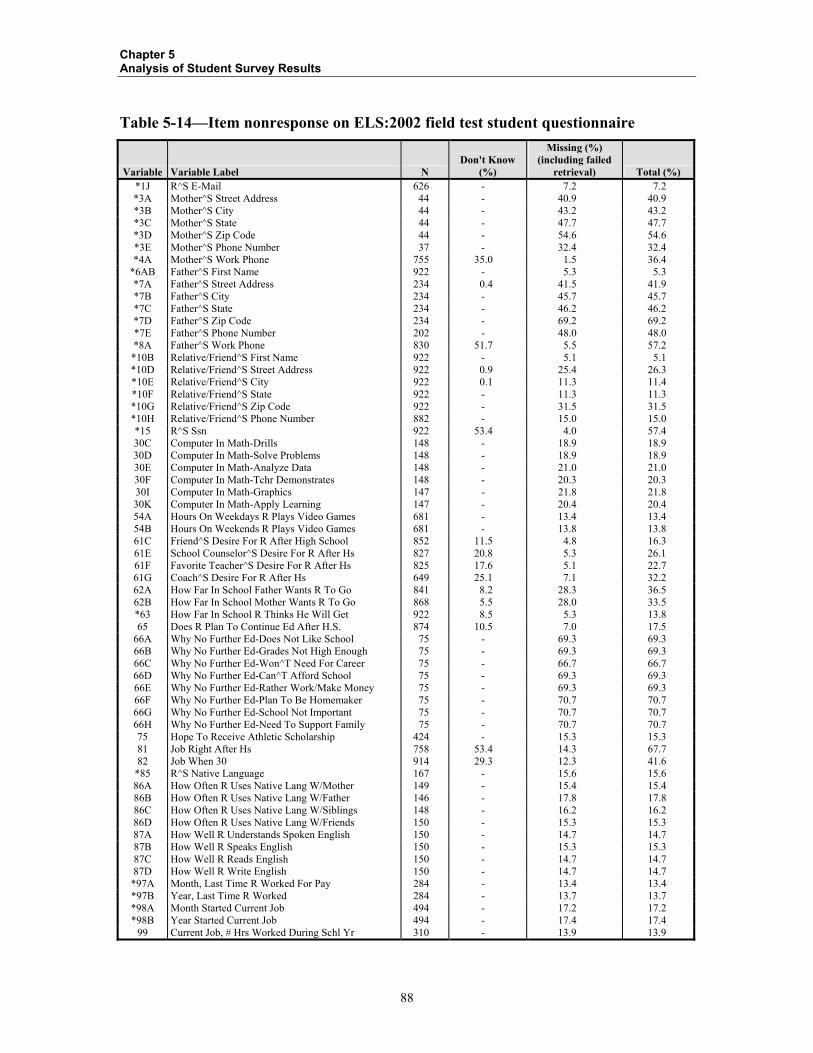
Chapter 5 Analysis of Student Survey Results
88
Table 5-14—Item nonresponse on ELS:2002 field test student questionnaire
Variable Variable Label NDon't Know
(%)
Missing (%) (including failed
retrieval) Total (%) *1J R^S E-Mail 626 - 7.2 7.2 *3A Mother^S Street Address 44 - 40.9 40.9 *3B Mother^S City 44 - 43.2 43.2 *3C Mother^S State 44 - 47.7 47.7 *3D Mother^S Zip Code 44 - 54.6 54.6 *3E Mother^S Phone Number 37 - 32.4 32.4 *4A Mother^S Work Phone 755 35.0 1.5 36.4
*6AB Father^S First Name 922 - 5.3 5.3 *7A Father^S Street Address 234 0.4 41.5 41.9 *7B Father^S City 234 - 45.7 45.7 *7C Father^S State 234 - 46.2 46.2 *7D Father^S Zip Code 234 - 69.2 69.2 *7E Father^S Phone Number 202 - 48.0 48.0 *8A Father^S Work Phone 830 51.7 5.5 57.2 *10B Relative/Friend^S First Name 922 - 5.1 5.1 *10D Relative/Friend^S Street Address 922 0.9 25.4 26.3 *10E Relative/Friend^S City 922 0.1 11.3 11.4 *10F Relative/Friend^S State 922 - 11.3 11.3 *10G Relative/Friend^S Zip Code 922 - 31.5 31.5 *10H Relative/Friend^S Phone Number 882 - 15.0 15.0 *15 R^S Ssn 922 53.4 4.0 57.4 30C Computer In Math-Drills 148 - 18.9 18.9 30D Computer In Math-Solve Problems 148 - 18.9 18.9 30E Computer In Math-Analyze Data 148 - 21.0 21.0 30F Computer In Math-Tchr Demonstrates 148 - 20.3 20.3 30I Computer In Math-Graphics 147 - 21.8 21.8 30K Computer In Math-Apply Learning 147 - 20.4 20.4 54A Hours On Weekdays R Plays Video Games 681 - 13.4 13.4 54B Hours On Weekends R Plays Video Games 681 - 13.8 13.8 61C Friend^S Desire For R After High School 852 11.5 4.8 16.3 61E School Counselor^S Desire For R After Hs 827 20.8 5.3 26.1 61F Favorite Teacher^S Desire For R After Hs 825 17.6 5.1 22.7 61G Coach^S Desire For R After Hs 649 25.1 7.1 32.2 62A How Far In School Father Wants R To Go 841 8.2 28.3 36.5 62B How Far In School Mother Wants R To Go 868 5.5 28.0 33.5 *63 How Far In School R Thinks He Will Get 922 8.5 5.3 13.8 65 Does R Plan To Continue Ed After H.S. 874 10.5 7.0 17.5
66A Why No Further Ed-Does Not Like School 75 - 69.3 69.3 66B Why No Further Ed-Grades Not High Enough 75 - 69.3 69.3 66C Why No Further Ed-Won^T Need For Career 75 - 66.7 66.7 66D Why No Further Ed-Can^T Afford School 75 - 69.3 69.3 66E Why No Further Ed-Rather Work/Make Money 75 - 69.3 69.3 66F Why No Further Ed-Plan To Be Homemaker 75 - 70.7 70.7 66G Why No Further Ed-School Not Important 75 - 70.7 70.7 66H Why No Further Ed-Need To Support Family 75 - 70.7 70.7 75 Hope To Receive Athletic Scholarship 424 - 15.3 15.3 81 Job Right After Hs 758 53.4 14.3 67.7 82 Job When 30 914 29.3 12.3 41.6 *85 R^S Native Language 167 - 15.6 15.6 86A How Often R Uses Native Lang W/Mother 149 - 15.4 15.4 86B How Often R Uses Native Lang W/Father 146 - 17.8 17.8 86C How Often R Uses Native Lang W/Siblings 148 - 16.2 16.2 86D How Often R Uses Native Lang W/Friends 150 - 15.3 15.3 87A How Well R Understands Spoken English 150 - 14.7 14.7 87B How Well R Speaks English 150 - 15.3 15.3 87C How Well R Reads English 150 - 14.7 14.7 87D How Well R Write English 150 - 14.7 14.7 *97A Month, Last Time R Worked For Pay 284 - 13.4 13.4 *97B Year, Last Time R Worked 284 - 13.7 13.7 *98A Month Started Current Job 494 - 17.2 17.2 *98B Year Started Current Job 494 - 17.4 17.4
99 Current Job, # Hrs Worked During Schl Yr 310 - 13.9 13.9

Chapter 5 Analysis of Student Survey Results
89
Table 5-14—Item nonresponse on ELS:2002 field test student questionnaire (continued)
Variable Variable Label NDon't Know
(%)
Missing (%) (including failed
retrieval) Total (%)
100 How Many Of Those Hrs Are On The Weekend 305 - 13.8 13.8 101 Type Of Work R Does On Current Job 301 - 23.3 23.3 102 How Much Does/Did R Earn Per Hour On Job 301 - 15.6 15.6 103 How R Got Current Job 301 - 12.6 12.6 111 Mother/Female Guardian^S Occupation 886 2.5 19.4 21.9 113 Father/Male Guardian^S Occupation 865 8.3 20.2 28.6
*115A Father^S Highest Level Of Education 894 11.9 13.0 24.8 *115B Mother^S Highest Level Of Education 910 8.0 12.5 20.6 *122 R Is Hispanic 922 - 7.1 7.1 *123 Hispanic Subdivision 230 - 27.8 27.8 *124 R^S Race/Ethnicity 922 - 8.8 8.8 *125 Asian Subdivision 132 - 62.9 62.9 132Z R Is Confident About Math Assignments 509 - 12.0 12.0
132BB R Tries Best To Learn What Is Taught 506 - 12.5 12.5 132DD R Can Learn Something Well If Wants To 505 - 12.7 12.7 132FF R Can Master Skills Taught In Math Class 503 - 12.3 12.3 132HH R Puts Forth Best Effort 503 - 12.1 12.1
Before discussing each item in detail, it is useful to summarize what has been learned overall. There were two recurring reasons for high rates of nonresponse. First, nonresponse to a filter question inflates the rate of nonresponse to its dependent questions. The response to the filter question determines whether an unanswered dependent question is a legitimate skip or missing data. Therefore, if any students neglected to answer the filter question it is not possible to calculate a precise nonresponse rate for the follow-up item(s) because the number of legitimate skips is unknown.
When missing data's legitimacy is dependent on the response to a filter question, the rate reported in table 5-14 is actually the highest end of a range of possible nonresponse. This assumes that all of those students who did not answer the filter question would have been directed to proceed to the dependent question(s) if they had. On the low end of the range, the assumption is that all those respondents who failed to answer the filter question would have answered in such a way as to legitimately skip around the dependent question(s). This is reported in the discussion of nonresponse for these dependent items.
A second common problem was respondent error that was often caused by a poorly formatted question. For example, it was found that data entry fields were sometimes only partially completed. For questions of this format, respondents were instructed to write their numeric answer in the boxes provided and then, beneath each handwritten number, fill in the circle corresponding to it. The scanning equipment was only programmed to read the darkened circles. The handwritten numbers were only intended to serve as a guide to the respondent. Any written answers that were not translated into the scannable circles were lost.
The layout of embedded gate questions was also problematic. In an effort to reduce burden for the majority of respondents, sometimes the filter was contained within the question itself. The respondent reads the question and then is given the option of

Chapter 5 Analysis of Student Survey Results
90
skipping the rest of the question if it does not apply to him. Reading from left to right, the respondent first encounters the circle to be marked, then the filter statement, and finally a bold arrow leading to directions to skip to another question. It seems that many respondents who skipped the rest of the question forgot to fill in the circle to the left of the filter statement.
Finally, in a number of instances, students selected two or more responses when only one was acceptable. For most "mark one response" questions, the rate of multiple marks was negligible (and therefore not reported). However, when students were asked to select an expected or achieved level of education, many marked more than one. In NELS:88, it was found that some respondents selected the highest level of education and those coming before it. Therefore, these results were anticipated for ELS:2002. In the field test, the fact that a multiple response was given was noted when it occurred, but no data was stored for that variable for that case. For the full-scale study, RTI recommends adopting the NELS:88 procedure of recording the highest level of education selected by the respondent.
Question 1, Item j) Respondent's email address (critical item)
This is a new data element for the NCES high school cohort studies. Since 1988 when the first round of data collection for NELS:88 was conducted, the use of e-mail has increased tremendously. E-mail addresses promise to be valuable when attempting to locate students who move after the base year. A third of the 922 student respondents (32.1 percent) legitimately skipped this item by indicating that they did not have an e-mail address. Of the others, 7.2 percent did not provide an address. In 41 of these 45 cases, either the survey administrator did not alert the student to the missing information or the survey administrator neglected to indicate on the questionnaire that she had unsuccessfully attempted to collect the information. Implementing the recommendations for the critical item retrieval process (see 5.3.2) should reduce the percent of students who skip this question.
Question 3, Items a-e): Mother's address and home telephone number (critical items)
The alarmingly high rates of nonresponse for these items concerning the mother's contact information are in part due to nonresponse to filter question 2b. Fourteen students did not indicate whether their mother or female guardian lived with them. The rates of nonresponse reported in table 5-14 assume that all of these students lived apart from their mother and, therefore, inappropriately skipped this series of questions. If, on the other hand, all 14 did in fact live with their mother or a female guardian, the rates of nonresponse for these items drop considerably, but still remain high (up to 33.3 percent). Survey administrators reported anecdotal evidence that many students who did not live with their mother did not know her address or phone number. For the full-scale study, RTI suggests that students be instructed to fill in as much as they know. Also, RTI recommends adding "I don't know any of her address" and "I don't know her telephone number" response options. With these in place, fewer questionnaires will require the survey administrators' retrieval effort for these critical items.

Chapter 5 Analysis of Student Survey Results
91
Question 4) Mother's work telephone number (critical item)
Nearly one in five respondents reported that their mother does not work. Of those whose mothers were employed, virtually all of the non-respondents indicated that they did not know their mother's work telephone number. A mere 1.4 percent skipped the question altogether. Although many students do not have the telephone number readily available, it is still worthwhile to collect this information from those students who do.
Question 6a, Item b) Father's first name (critical item)
Just over 5 percent of respondents did not write in their father's first name in the space provide. Some survey administrators reported that some of the students in their sessions told them that they did not know their father's first name because they had never had contact with him.
Question 7, Items a-e) Father's address and home telephone number (critical items)
As was the case with items in question 3, the rates of nonresponse for these items are inflated by nonresponse to the filter question. But given that the rates remain high when accounting for this bias, RTI recommends adding "I don't know" response options for students who do not have any contact with their father or male guardian.
Question 8) Father's work telephone number (critical item)
Half of the students who had a working father indicated that they did not know his telephone number at his place of business. Only 5.5 percent skipped this question entirely.
Question 10, Items b, d-h) Name, address, and telephone number of a relative or close friend
The survey administrators reported that students often had a hard time selecting a relative or close friend for whom they knew a complete address and telephone number. This is reflected in the rates of nonresponse for these items, particularly for street address and zip code. RTI recommends adding instructions to provide as much information as possible.
Question 15) Social security number (critical item)
Just over half of these sophomores indicated that they did not know their social security number. Only a few students refused to provide the information when prompted by the survey administrator. Despite the high rate of nonresponse for this question, RTI recommends retaining it for the full-scale study. It is a piece of information that is quick to provide and is an invaluable tool for finding students for follow-ups.

Chapter 5 Analysis of Student Survey Results
92
Question 30, Items c-f, i, k) In your current math class, how often do you use computers in the following ways?
This is a new question. The vast majority of students indicated that they did not use computers in their math class or that they were not taking a math course. Of those who did not mark either of these indicators, and thus should have answered the following items, roughly one fifth did not. It may well be the case that some students who did not use computers in their math class failed to fill in the appropriate circle and therefore were erroneously counted as illegitimate skips. The formatting of these embedded gate questions may be to blame. The circles to be filled are to the left of the response options while the arrow leads the eye to the right and then on to the next question. Students may not have seen the response circle or have forgotten to return to fill it in before moving on to question 31. RTI recommends either creating a separate gate question or reformatting the embedded gate.
Question 54, Items a and b) During the school year, how many hours a day do you usually play video or computer games such as Nintendo or Play Station?
In NELS:88 second follow-up, this question, paired with categorical response options, worked well. In the ELS field test, students were asked to write in their answer in a data entry field. One must consider the possibility that students are less likely to answer questions that are open ended because it is harder to pinpoint a specific number than it is to choose a range within which one's answer falls. However, low rates of nonresponse to other open ended questions with a constrained print response format (see questions 35-38 for an example of this format) suggest that the data entry field format was problematic. The proper way to respond to this question was to write in the number of hours and minutes in the three boxes provided and then, under each number, fill in the circle corresponding to it. Although instructions were provided at the beginning of the questionnaire booklet and reviewed by the survey administrator, students may have not darkened the circles below their handwritten answer. In that case, their response was not recorded because the scanning equipment was not programmed to read the handwritten numbers; they were merely meant to guide students as they filled in the circles. In addition, seventeen students (2.5 percent) darkened the circles incorrectly. Their answers were uninterpretable because they filled in a circle in the tens digit column, but not the ones digit column. RTI recommends using constrained print fields instead of these data entry fields throughout the questionnaire to reduce error.
Question 61, Items c, e-g) What do the following people think is the most important thing for you to do right after high school?
Students were provided with an "I don't know" response option in anticipation of these field test results. The nonresponse to these items is largely due to students' lack of awareness of various people's expectations for them after high school. An "I don't know" response provides valuable information because it suggests that a
Chapter 5 Analysis of Student Survey Results
93
student has not yet discussed post high school plans with a particular person or people. The percent of respondents who inappropriately skipped each item is less than 8 percent.
Question 62, Items a and b) How far in school do you think your father and mother want you to go?
As with the items in question 61, a "don't know" response option was provided for respondents who had not discussed their educational plans with their parents.Likewise, this response is not considered lost data since it provides some insight into how much a parent discusses his/her desires for the 10th grader's education. About one third of cases are missing data for these questions. About half of these are due to multiple responses to this single response question. Although students were instructed to mark one level of education, many students selected more than one (the highest level and those below). In the field test, instances of multiple response were noted, but no data was stored. For the full-scale study, RTI recommends recording the highest level of education selected by the respondent when more than one is marked.
Question 63) As things stand now, how far in school do you think you will get? (critical item)
As in the previous two questions about expectations for after high school, students were allowed to indicate that they did not know. Over half of the nonresponse rate is accounted for by those selecting this option. The remainder of the nonresponse falls in the "missing" column. Most of these missing data are the result of multiple marks. Three percent of respondents chose more than one answer so no data was recorded for them.
Question 65) Do you plan to continue your education past high school at some time in the future?
About 10 percent of the respondents reported that they did not know. The ambiguity in the “do not know” response option may explain some of the remaining nonresponse. “Do not know” may mean that the respondent does not know if he will continue his education. Alternatively, it could mean that the respondent is unsure when he will continue his education. Some respondents may have left the question unanswered because they did not want their “do not know” response to be misconstrued. Therefore, RTI recommends distinguishing between these two responses.
Question 66) Which of the following are reasons why you have decided NOT to continue your education after high school?
The rates of nonresponse for question 66 are inflated to about 70 percent because roughly 50 students who failed to answer question 65 also did not answer question 66. For the reported rate of nonresponse, RTI assumed that all of these 50 or so students would have been routed to question 66 if they had answered question 65. Therefore, the reported rate of nonresponse is the upper bound on

Chapter 5 Analysis of Student Survey Results
94
the actual rate of nonresponse. Because RTI does not know the educational plans for these 50 students and therefore their eligibility for question 66, it is not possible to pinpoint an actual rate of nonresponse. However, RTI knows that the real rate of nonresponse falls somewhere between 7 percent and 70 percent; most likely at the lower end of this range. Less than 2 percent of those who responded to question 65 indicated that they planned to end their education at or before high school graduation. Only one of these 14 students (7 percent) inappropriately skipped question 66.
Question 75) Do you hope to receive an athletic scholarship to pay for all or part of your college expenses?
This question only applied to respondents who plan to continue their education past high school and would like to participate in college athletics. Almost all of the students who inappropriately missed this question also failed to answer the filter question (73). If RTI removes these students from the numerator of the nonresponse equation, the rate drops to 0.7 percent. The true rate of nonresponse falls somewhere between this lower estimate and 15.3 percent.
Questions 81 and 82) Write in the name of the job or occupation that you expect or plan to have right after high school/at age 30.
As anticipated, many sophomores did not have a particular job or occupation in mind for the short or the long term. Most of the students who planned to work, but failed to provide an occupation reported that they did not know what job they expected to have after high school graduation and at age 30.
Question 85) What is your native language (the first language you learned to speak when you were a child)? (critical item)
The filter question to this dependent question asks if English is the respondent's native language. Every student who identified himself as a non-native English speaker also named his first language in this question. Therefore, all of those counted as non-respondents are ones who also failed to answer question 84.Depending on how many of these are native English speakers, the actual rate of nonresponse lies between zero and 15.6 percent; most likely at the low end of this range given that non-native English speakers are a small percent of the ELS sample.
Question 86, Items a-d) How often do you speak your native language with… a) your mother, b) your father, c) your brothers and sisters, d) your friends
Excluding students who did not answer filter question 84 from the count of non-respondents reduces the rates by about half. These lower rates are most likely a better estimate of the true nonresponse than the higher bound. Nonetheless, the somewhat elevated level may be partly attributed to the fact that the students answering this section are less proficient with English than their native-speaking counterparts.

Chapter 5 Analysis of Student Survey Results
95
Question 87, Items a-d) How well do you do the following? a) understand spoken English, b) speak English, c) read English, d) write English
Similar to question 86, about half of the non-respondents did not answer the filter question for the language section so it is unknown whether they were eligible for question 87 or not. Assuming that the majority of these students are native English speakers, the true rate of nonresponse is closer to 8 or 9 percent than 15 percent.
Question 97, Items a and b) When did you last work for pay, not counting work around the house? (critical item)
A student's eligibility for this question was dependent on his/her response to question 96. If RTI assumes that all students who neglected to answer this filter question had never worked for pay or were currently employed, then the rate of nonresponse drops to about 4 percent.
Question 98, Items a and b) When did you start your current or most recent job? (critical item)
This question only applied to respondents who had at some time been employed for pay, not counting work around the house. Some of the non-respondents also did not answer filter question 96. However, removing these cases from the analysis yields a lower bound estimate of actual nonresponse that is still quite high at around 12 percent. Two groups of students were eligible for this question: currently employed students and previously employed students who were not currently working. Roughly 4 percent of the first group inappropriately skipped question 98 as compared to about 17 percent of the latter group. This suggests that most students were lost in the transition from question 97 to question 98. Perhaps the students who indicated that they were no longer working thought that the first follow-up question (97) was for them and the second follow-up question (98) was for those who were still working. It would be advisable to provide a "go to question 98" arrow to assist these respondents.
Question 99) How many hours do/did you usually work each week on your current or most recent job during this school year?
The rate of nonresponse to this question only dips slightly, from 14 percent to 12 percent, when non-respondents to gate question 96 are removed from the calculation. Therefore, this can not be considered a large factor in the rate of nonresponse for this question. Rather it seems that the gate embedded in the question was poorly formatted. Reading from left to right, the student first encounters the circle to be marked, then the statement "I have not worked during this school year," and finally a bold arrow leading to directions to skip to question 105. It is likely that many students who had not worked during the school year did not remember to return to the circle to fill it in before proceeding to question 105. RTI recommends either creating a separate gate question or reformatting the embedded gate.

Chapter 5 Analysis of Student Survey Results
96
Questions 100-103) Series of questions about work during this school year.
The calculated nonresponse for these questions is inflated by the likelihood that many students who had not worked during the school year failed to mark the appropriate indicator in the two gate questions (96 and 99).
Question 101) What kind of work do/did you do for pay on your current or most recent job during this school year?
Multiple marks were a large contributor to this item's nonresponse rate. Although students were instructed to report on their highest paying job if they held more than one, about one third of the missing data is the result of multiple responses to this "mark one response" question. The "mark one response" instructions should be displayed more prominently in the full-scale version of the questionnaire.
Questions 111 and 113) Write in the name of the job you mother/father does.
Although "does not apply" and "don't know" response options were not provided for these questions, these variables were coded as such if the student left the field blank and selected one of these in the follow-up question in which he/she categorizes the parent's occupation. Some of the nonresponse is accounted for by "don't know" responses. The remaining non-respondents may have skipped the question because they were unsure of the job title or had an unemployed parent (and failed to mark "does not apply" in the follow-up question). For the full-scale study, RTI recommends asking students to describe what their parents do on the job. This may be easier for some students to answer. Also, RTI suggests providing a "does not apply" response option.
Question 115, Items a and b) How far in school did your parents go? Indicate your father's and mother's highest level of education? (critical items)
Although missing data was considerable for these questions, their inclusion in the full-scale questionnaire is imperative. These questions will provide data on family SES in the event that a parent does not complete a parent questionnaire.The fact that many students do not know their parents' educational attainment cannot be remedied. However, nonresponse can be reduced in the full-scale study by selecting the highest level when there are multiple marks. In the field test, about 5 percent of students marked more than one level of education for each parent. If these were assigned the highest value, the percent "missing" would drop to about 7 percent each.
Questions 122-125) Race/ethnicity series (critical items)
These are all critical items. As such, they were excluded from the application of a "not reached" code because, theoretically, it was impossible to not reach this series because the survey administrator would have called it to the student's attention if he/she had not finished the questionnaire. However, in practice the survey administrators were unable to complete the critical item retrieval for all

Chapter 5 Analysis of Student Survey Results
97
questionnaires in the time given. Furthermore, about 20 percent of respondents were unable to reach the question immediately preceding this series. Taken together, the elevated rates of nonresponse can be in part attributed to students not reaching these questions. Given the importance of the data on race and ethnicity, RTI recommends moving this series to the beginning of the questionnaire.
Question 123) Which one of the following are you? [applies to Hispanic respondents]
The rate of nonresponse is almost entirely due to the fact that over a quarter of respondents did not indicate in the previous question whether they were Hispanic or not. If RTI assumes that all of these students were not Hispanic, the nonresponse rate is near zero. Only one student who indicated that he/she was Hispanic did not indicate his/her origin (0.6 percent).
Question 125) Which one of the following are you? [applies to Asian respondents]
The estimated nonresponse is dramatically inflated by the fact that about 9 percent of respondents failed to indicate their race in the filter question. When these cases are removed from the calculation, the rate drops to about 4 percent. Given that Asians were a relatively small percent of the ELS sample, it is safe to assume that the actual rate of nonresponse is much closer to this lower bound than the upper bound.
Question 132, Items z, bb, dd, ff, and hh) How often do the following things apply to you?
This series of items about study habits and academic self-concept is new. The rate of nonresponse increased with each item in the series and then dropped off considerably with the following question (133). This pattern suggests that nonresponse can be attributed in large part to respondent fatigue. The considerable length of the list of items deterred some from completing it. For the full-scale study, RTI recommends reducing the number of items to a more manageable length.
5.3.4 Inter-item Consistency
A further test of the quality of the data gathered is a comparison of responses to pairs of questions that are intended to elicit logically consistent information. Because many worthwhile research agendas competed for space on the field test questionnaire, there are not many pairs of questions that gather overlapping information. Nonetheless, the field test data allows for the assessment of several questions about the student's educational expectations. Two of these questions appear early on (questions 24 and 25) and two much later (questions 63 and 65) in the questionnaire.
The first question that the students encounter about educational expectations asks how sure they are that they will graduate from high school (question 24). Twelve pages later, they are asked how far in school they think they will get. There are two potential types of apparent inconsistencies. Respondents may first indicate that they are likely to graduate from high school, but later lower those expectations. Alternatively, students

Chapter 5 Analysis of Student Survey Results
98
may initially report that high school graduation is improbable, but later indicate that they expect to attend a post-secondary program. Of course, the latter pair of responses is not strictly inconsistent; students may enroll in some post-secondary programs without graduating from high school by becoming exam certified or completing a GED program. For some post-secondary programs, these qualifications are not necessary either. Nonetheless, the traditional and most common route to post-secondary education is through high school graduation.
Table 5-15.—How far in school R thinks he will get by how sure R is that he will graduate (q63 x q24)
Frequency PercentRow Pct Col Pct
Very sure I won’t graduate
I probably won’t graduate
I’ll probably graduate
Very sure I’ll graduate Total
Total 8 9 111 739 867 0.92 1.04 12.80 85.24 100.0 Retrieval attempt failed 0 0 0 1 1
Percent 0.00 0.00 0.00 0.12 0.12 Row Pct 0.00 0.00 0.00 100.00 Col Pct 0.00 0.00 0.00 0.14
Don’t know 1 3 24 49 77 Percent 0.12 0.35 2.77 5.65 8.88 Row Pct 1.30 3.90 31.17 63.64 Col Pct 12.50 33.33 21.62 6.63
Less than HS 0 2 3 2 7 Percent 0.00 0.23 0.35 0.23 0.81 Row Pct 0.00 28.57 42.86 28.57 Col Pct 0.00 22.22 2.70 0.27
HS or GED only 1 2 14 26 43 Percent 0.12 0.23 1.61 3.00 4.96 Row Pct 2.33 4.65 32.56 60.47 Col Pct 12.50 22.22 12.61 3.52
Attend or complete 2-year program 2 1 19 43 65 Percent 0.23 0.12 2.19 4.96 7.50 Row Pct 3.08 1.54 29.23 66.15 Col Pct 25.00 11.11 17.12 5.82
Attend college, but not complete 4 years 2 0 12 22 36
Percent 0.23 0.00 1.38 2.54 4.15 Row Pct 5.56 0.00 33.33 61.11 Col Pct 25.00 0.00 10.81 2.98
Graduate from college 2 1 32 308 343 Percent 0.23 0.12 3.69 35.52 39.56 Row Pct 0.58 0.29 9.33 89.80 Col Pct 25.00 11.11 28.83 41.68
MA or equivalent 0 0 6 143 149 Percent 0.00 0.00 0.69 16.49 17.19 Row Pct 0.00 0.00 4.03 95.97 Col Pct 0.00 0.00 5.41 19.35
Ph.D., M.D., other advanced degree 0 0 1 145 146 Percent 0.00 0.00 0.12 16.72 16.84 Row Pct 0.00 0.00 0.68 99.32 Col Pct 0.00 0.00 0.90 19.62
Frequency Missing=55
Table 5-15 shows that almost all sophomores (99.4 percent) who reported in question 24 that they probably or surely would graduate from high school provided answers consistent with this information in question 63. On the other hand, 8 of the 17 students who indicated that they probably or surely would not graduate from high school

Chapter 5 Analysis of Student Survey Results
99
later, in question 63, speculated that they would attend or graduate from a post-secondary program. As explained above, the pairing of these two events is not impossible, but it is unusual. Furthermore, the comparison is not necessarily generalizable given that it only involves 17 students. However, these results prompted further investigation.
Students were also asked at the beginning of the questionnaire how sure they were to further their education after leaving high school (question 25). Table 5-16, a cross tabulation of responses to this question with students' expected educational attainment, reveals the same trend. That is, many students who initially reported that they did not plan to continue their education after high school, subsequently predicted that they would. Specifically, 14 of the 47 students who first indicated that they did not plan to go on for further education later projected that they would attend or complete a post-secondary program.
Table 5-16.—How far in school R thinks he will get by how sure R is that he will further his education after leaving high school (q63xq25)
Frequency PercentRow Pct Col Pct
Very sure I won’t go
I probably won’t go I’ll probably go Very sure I’ll go Total
Total 15 32 207 610 864 1.74 3.70 23.96 70.60 100.00 Retrieval attempt failed 0 0 0 1 1
Percent 0.00 0.00 0.00 0.12 0.12 Row Pct 0.00 0.00 0.00 100.00 Col Pct 0.00 0.00 0.00 0.16
Don’t know 2 9 41 25 77 Percent 0.23 1.04 4.75 2.89 8.91 Row Pct 2.60 11.69 53.25 32.47 Col Pct 13.33 28.13 19.81 4.10
Less than HS 1 1 5 0 7 Percent 0.12 0.12 0.58 0.00 0.81 Row Pct 14.29 14.29 71.43 0.00 Col Pct 6.67 3.13 2.42 0.00
HS or GED only 5 15 21 2 43 Percent 0.58 1.74 2.43 0.23 4.98 Row Pct 11.63 34.88 48.84 4.65 Col Pct 33.33 46.88 10.14 0.33
Attend or complete 2-year program 2 5 33 24 64 Percent 0.23 0.58 3.82 2.78 7.41 Row Pct 5.56 2.78 63.89 27.78 Col Pct 13.33 3.13 11.11 1.64
Attend college, but not complete 4 years 2 1 66 273 342 Percent 0.23 0.12 7.64 31.60 39.58 Row Pct 0.58 0.29 19.30 79.82 Col Pct 13.33 3.13 31.88 44.75
Graduate from college 2 1 66 273 342 Percent 0.23 0.12 2.66 1.16 4.17 Row Pct 0.58 0.29 19.30 79.82 Col Pct 13.33 3.13 31.88 44.75
MA or equivalent 0 0 10 139 149 Percent 0.00 0.00 1.16 16.09 17.25 Row Pct 0.00 0.00 6.71 93.29 Col Pct 0.00 0.00 4.83 22.79
Ph.D., M.D., other advanced degree 1 0 8 136 145 Percent 0.12 0.00 0.93 15.74 16.78 Row Pct 0.69 0.00 5.52 93.79 Col Pct 6.67 0.00 3.86 22.30
Frequency Missing=58

Chapter 5 Analysis of Student Survey Results
100
There are two plausible explanations for this finding. First, students were asked to predict their highest level of educational attainment immediately after reporting how far their parents wanted them to go. If a student was freshly reminded that a parent's expectations were higher than the goals set for himself (as reported in question 25), he may aim higher so as not to feel like a disappointment to his parents. In fact, most of the 14 students with inconsistent responses had a parent who wanted them to attain some level of post-secondary education.
Students may also have misinterpreted question 25 leading to the apparent inconsistency. The question asks, "How sure are you that you will go on for further education after you leave high school?" Some respondents may have assumed that the question meant how likely they were to do so immediately after leaving high school.There is evidence to support this conclusion. The majority of students who provided conflicting answers indicated in question 65 that they were planning to postpone their education for a year or more after high school.
Consequently, this analysis yields two recommendations for the full-scale questionnaire. Students should be asked to predict their highest level of education prior to reporting their parents' expectations for them. In addition, question 25 should be rephrased so it is clear that it refers to education at any time in the future. Finally, redundancy in questionnaire data elements will be eliminated in the main study.
5.3.5 Logical Consistency of Filter and Dependent Questions
The use of filter and dependent questions helps to reduce burden on respondents by routing them around questions that do not pertain to them. This allows more questions to be asked since most students will only be eligible for a subset. Each filter question directs some respondents to the following dependent question(s) and others to skip one or more subsequent questions. When skip instructions are introduced, there is the potential for errors that may compromise the data. Some respondents who are directed to skip around one or more questions fail to do so and answer questions that do not pertain to them, thus adding to their burden and defeating the purpose of filter questions. However, since superfluous data can be deleted the consequences for the data are not great. Errors also occur when respondents skip questions intended for them. This mistake is the more serious of the two since the lost data is irretrievable. Therefore, the following analyses of filter and their dependent questions will focus on these incorrect skips. However, cross tabulations are provided for those readers interested in both types of errors. The field test student questionnaire contained 23 filter questions. Table 5-17 identifies each filter question, the routing for each response, and an explanation of each path's purpose.

Chapter 5 Analysis of Student Survey Results
101
Table 5-17—The use of filters to route students through questionnaire Filter Path 1 Path 2 Path 3 Use of skip pattern 2b 3-6b 4-6b 6a-6b Path 1) Directs students who do not live with their mother to go to
question 3 (mother's address and telephone number); Path 2) Allows students whose mother shares his/her address and telephone number to skip question 3; Path 3) Allows students whose mother/female guardian is deceased to skip questions pertaining to her address, telephone numbers, and email address
6b 7-22a 8-22a 10-22a Path 1) Directs students who do not live with their father to go to question 7 (father's address and telephone number); Path 2) Allows students whose father shares his/her address and telephone number to skip question 7; Path 3) Allows students whose father/male guardian is deceased to skip questions pertaining to his address, telephone numbers, and email address
22a 23-30a 22b-30a
- Path 1) Allows students who have not had an unexcused absence from school to skip out of a series of questions about the school's action in that instance;Path 2) Students who have had an unexcused absence should go to 22b
30a 31-32a 30b - Path 1) Allows students who are not taking a math class to skip a series of questions about that math class; Path 2) Students who are taking a math class should go to 30b
30b 31-32a 30c-32a - Path 1) Allows students who do not use computers in math class to skip a series of questions about computer use in that class; Path 2) Students who use computers in their math class should go to 30c
32a 33-47 32c - Path 1) Allows students who are not taking an English class to skip a series of questions about that English class; Path 2) Students who are taking an English class should go to 32b
32b 33-47 32c-47 - Path 1) Allows students who do not use computers in English class to skip a series of questions about computer use in that class; Path 2) Students who use computers in English class should go to 32c
47 48-56 53-56 - Path 1) Students who indicate in question 47 that they use a computer are directed to go to question 48; Path 2) Allows students who do not use a computer in any setting to skip the following questions about how he/she uses a computer
56 57-65 60-65 - Path 1) Students who attend schools with a library media center are directed to go to question 57; Path 2) Allows students whose school does not have a library media center to skip out of a series of questions about the school's library media center
65 66 67, 68 68 Path 1) Students who do not plan to continue their education are directed to go to question 66; Path 2) Allows a student who plans to continue his/her education after high school to skip a question about reasons for not continuing education; Path 3) Allows a student who does not know if he/she will continue education to skip a question about reasons for not continuing education, as well a question pertaining to those who have plans to continue education
66 80 - - Path 1) Directs students who do not plan to continue after high school around a series of questions that pertains to students who do

Chapter 5 Analysis of Student Survey Results
102
Table 5-17—The use of filters to route students through questionnaire (continued)Filter Path 1 Path 2 Path 3 Use of skip pattern 68 69-73 73 - Path 1) Directs students who are aware of academic requirements for
college entrance to proceed to a series of questions about these requirements; Path 2) Allows students who are unaware of minimum academic standards for college admission to skip a series of questions about those standards
73 74-76 80-84 - Path 1) Directs students who would like to play collegiate sports to go to question 74; Path 2) Allows students who do not wish to participate in athletics at the college level to skip a series of questions pertaining to college sports
76 77-80 80-84 - Path 1) Directs students who are aware of academic requirements for participation in college athletics to proceed to a series of questions about those standards; Path 2) Allows students who are unaware of minimum academic standards for participation in collegiate athletic programs to skip a series of questions about these standards
84 94-96 85-89 - Path 1) Allows students whose native language is English to skip all of Part IV: Language; Path 2) Directs non-native English speakers to continue with Part IV
89 90-96 92-96 - Path 1) Directs non-native speakers who have received help with language skills in school to go to question 90; Path 2) Allows students who have not received special help in school in reading, writing, or speaking English to skip around questions that ask about such help
96 105-109
98, 99 97-99 Path 1) Allows students who have never worked for pay to skip a series of questions about paid employment; Path 2) Allows students who are currently employed to skip a question that asks when they last worked for pay Path 3) Directs students who had worked for pay, but were not currently working to question 97
99 105-109
100-109
- Path 1) Allows students who have not worked during the current school year to skip questions about employment during this school year; Path 2) Students who worked during the field test school year proceed to a series of questions about that employment
109 111-122
110-122
111-122
Path 1) Allows students who do not care for younger siblings, relatives, or a child of their own during the school year to skip a question about how many hours they are responsible for their care; Path 2) Directs students who do child care for their family to go to question 110; Path 3) Allow students who do not have younger siblings, relatives, or a child of their own to skip question about their care
122 123 124 - Path 1) Directs students who are Hispanic or Latino/Latina to identify with a particular group in the follow-up question; Path 2) Skips non-Hispanic students around this follow-up question
124 125, (126), 127-142
126-142
127-142
Path 1) Directs Asian students to identify with a particular subgroup in a follow-up question Path 2) Directs Native Hawaiian or other Pacific Islander students to identify with a particular subgroup in a follow-up question Path 3) Allows students who are neither Asian or Native Hawaiian/Pacific Islander to skip out of the two follow-up questions

Chapter 5 Analysis of Student Survey Results
103
Table 5-17—The use of filters to route students through questionnaire (continued)Filter Path 1 Path 2 Path 3 Use of skip pattern 142 143-
145 145 - Path 1) Directs students who indicate that there is someone that they
admire to a follow up question about that person's relationship to them and that person's age Path 2) Allows students who do not admire anyone to skip follow up questions about an admired person
145 146-148
148 - Path 1) Directs students who have bet money on sporting events to indicate how often they have done so and with whom Path 2) Allows students who have not bet money on sports to skip these follow-up questions
Generally, the 10th grade respondents were very capable of following the routing instructions. In most cases, only a very small fraction inappropriately bypassed a question that should have been answered. And those who were instructed to skip one or more questions, almost always jumped to the correct one.
Filter Question 2b (critical item):
Path 1) Thirty-four respondents indicated that their mother's address and telephone number was different from what they reported for themselves in question 1. Twenty-two of these provided a complete address for their mother (65 percent) and another three reported partial addresses. Three wrote in "don't know" and one "refuse." The remaining five (14 percent) inappropriately skipped the address fields altogether. Twenty-eight (82 percent) provided telephone numbers, including four who had not provided an address.
Filter Question 6b (critical item):
Path 1) Two hundred and fifteen students reported that their father had a different address and telephone number than they did. Almost a third (29 percent) of these students provided complete addresses and another third provided partial addresses. The remaining 38 percent did not provide any address. Fourteen of these students wrote in "don't know" and one "refuse." Half of the path 1 students did not provide a telephone number for their father or male guardian.
Filter Question 22a:
Path 2) The filter for question 22 is embedded within it. After reading the question, students were given an option to indicate in 22a that they have not had an unexcused absence and bypass 22b-i. A little more than half of the students did not mark the filter, suggesting by default that the subitems (b-i) about unexcused absences did in fact pertain to them. Of these students, 14.5 percent failed to answer 22b.

Chapter 5 Analysis of Student Survey Results
104
EBS022A(NEVER HAD AN UNEXCUSED ABSENCE) EBS022B(WHEN ABSENT SCHOOL DID NOTHING)
Frequency ‚ Row Pct ‚ -9‚ -3‚Don^t ‚No ‚Yes ‚ Total ‚ ‚ ‚Know ‚ ‚ ‚ ƒƒƒƒƒƒƒƒƒƒƒƒƒƒƒƒƒˆƒƒƒƒƒƒƒƒˆƒƒƒƒƒƒƒƒˆƒƒƒƒƒƒƒƒˆƒƒƒƒƒƒƒƒˆƒƒƒƒƒƒƒƒˆ Unmarked ‚ 70 ‚ 0 ‚ 64 ‚ 197 ‚ 153 ‚ 484 ‚ 14.46 ‚ 0.00 ‚ 13.22 ‚ 40.70 ‚ 31.61 ‚ ƒƒƒƒƒƒƒƒƒƒƒƒƒƒƒƒƒˆƒƒƒƒƒƒƒƒˆƒƒƒƒƒƒƒƒˆƒƒƒƒƒƒƒƒˆƒƒƒƒƒƒƒƒˆƒƒƒƒƒƒƒƒˆ Had no unexcused ‚ 0 ‚ 434 ‚ 0 ‚ 1 ‚ 0 ‚ 435 absences ‚ 0.00 ‚ 99.77 ‚ 0.00 ‚ 0.23 ‚ 0.00 ‚ ƒƒƒƒƒƒƒƒƒƒƒƒƒƒƒƒƒˆƒƒƒƒƒƒƒƒˆƒƒƒƒƒƒƒƒˆƒƒƒƒƒƒƒƒˆƒƒƒƒƒƒƒƒˆƒƒƒƒƒƒƒƒˆ Total 70 434 64 198 153 919
Frequency Missing = 3
Recommendation: The high rate of nonresponse to the first dependent item is most likely due to the filter's format (see a discussion of this format in 5.3.3). Therefore, RTI recommends redesigning the gate so that the circle to be marked is more prominent.
Filter Questions 30a and b:
Path 2) Almost 20 percent of students who did not mark "not taking math" or "don't use computers in math class" illegitimately skipped question 30c.EBS030A/B(NOT TAKING MATH/NO COMPUTER USE)
EBS030C(COMPUTER IN MATH-DRILLS) Frequency ‚ Row Pct ‚ -9‚ -3‚Never ‚Rarely ‚Less ‚Once or ‚Every ‚ Total ‚ ‚ ‚ ‚ ‚than ‚twice a ‚day or ‚ ‚ ‚ ‚ ‚ ‚once a ‚week ‚almost ‚ ‚ ‚ ‚ ‚ ‚week ‚ ‚everyday‚ ƒƒƒƒƒƒƒƒƒƒƒƒƒƒƒƒƒˆƒƒƒƒƒƒƒƒˆƒƒƒƒƒƒƒƒˆƒƒƒƒƒƒƒƒˆƒƒƒƒƒƒƒƒˆƒƒƒƒƒƒƒƒˆƒƒƒƒƒƒƒƒˆƒƒƒƒƒƒƒƒˆ Unmarked ‚ 28 ‚ 0 ‚ 51 ‚ 36 ‚ 9 ‚ 10 ‚ 14 ‚ 148 ‚ 18.92 ‚ 0.00 ‚ 34.46 ‚ 24.32 ‚ 6.08 ‚ 6.76 ‚ 9.46 ‚ ƒƒƒƒƒƒƒƒƒƒƒƒƒƒƒƒƒˆƒƒƒƒƒƒƒƒˆƒƒƒƒƒƒƒƒˆƒƒƒƒƒƒƒƒˆƒƒƒƒƒƒƒƒˆƒƒƒƒƒƒƒƒˆƒƒƒƒƒƒƒƒˆƒƒƒƒƒƒƒƒˆ Not taking Math ‚ 0 ‚ 87 ‚ 7 ‚ 2 ‚ 0 ‚ 1 ‚ 1 ‚ 98 ‚ 0.00 ‚ 88.78 ‚ 7.14 ‚ 2.04 ‚ 0.00 ‚ 1.02 ‚ 1.02 ‚ ƒƒƒƒƒƒƒƒƒƒƒƒƒƒƒƒƒˆƒƒƒƒƒƒƒƒˆƒƒƒƒƒƒƒƒˆƒƒƒƒƒƒƒƒˆƒƒƒƒƒƒƒƒˆƒƒƒƒƒƒƒƒˆƒƒƒƒƒƒƒƒˆƒƒƒƒƒƒƒƒˆ Don^t use ‚ 0 ‚ 598 ‚ 37 ‚ 13 ‚ 4 ‚ 8 ‚ 9 ‚ 669 computers in Math‚ 0.00 ‚ 89.39 ‚ 5.53 ‚ 1.94 ‚ 0.60 ‚ 1.20 ‚ 1.35 ‚ ƒƒƒƒƒƒƒƒƒƒƒƒƒƒƒƒƒˆƒƒƒƒƒƒƒƒˆƒƒƒƒƒƒƒƒˆƒƒƒƒƒƒƒƒˆƒƒƒƒƒƒƒƒˆƒƒƒƒƒƒƒƒˆƒƒƒƒƒƒƒƒˆƒƒƒƒƒƒƒƒˆ Total 28 685 95 51 13 19 24 915
Frequency Missing = 7
Recommendation: This question provides further evidence that the embedded filters were accidentally left unmarked by many students. It is likely that students either did not notice the circle to be marked or had forgotten about it when they had reached the instructions to skip to another question (see discussion in 5.3.3). RTI recommends creating a separate filter question.
Filter Questions 32a and c:
Path 2) Roughly 10 percent of the students who left the filters unmarked failed to answer the initial follow-up question about computer use in English class.

Chapter 5 Analysis of Student Survey Results
105
EBS032A(NOT TAKING ENGLISH/NO COMPUTER USE) EBS032C(COMPUTER IN ENGLISH-SPELL, VOC, GRAMMAR)
Frequency ‚ Row Pct ‚ -9‚ -3‚Never ‚Rarely ‚Less ‚Once or ‚Every ‚ Total ‚ ‚ ‚ ‚ ‚than ‚twice a ‚day or ‚ ‚ ‚ ‚ ‚ ‚once a ‚week ‚almost ‚ ‚ ‚ ‚ ‚ ‚week ‚ ‚everyday‚ ƒƒƒƒƒƒƒƒƒƒƒƒƒƒƒƒƒˆƒƒƒƒƒƒƒƒˆƒƒƒƒƒƒƒƒˆƒƒƒƒƒƒƒƒˆƒƒƒƒƒƒƒƒˆƒƒƒƒƒƒƒƒˆƒƒƒƒƒƒƒƒˆƒƒƒƒƒƒƒƒˆ Unmarked ‚ 32 ‚ 0 ‚ 129 ‚ 52 ‚ 19 ‚ 33 ‚ 14 ‚ 279 ‚ 11.47 ‚ 0.00 ‚ 46.24 ‚ 18.64 ‚ 6.81 ‚ 11.83 ‚ 5.02 ‚ ƒƒƒƒƒƒƒƒƒƒƒƒƒƒƒƒƒˆƒƒƒƒƒƒƒƒˆƒƒƒƒƒƒƒƒˆƒƒƒƒƒƒƒƒˆƒƒƒƒƒƒƒƒˆƒƒƒƒƒƒƒƒˆƒƒƒƒƒƒƒƒˆƒƒƒƒƒƒƒƒˆ Not taking ‚ 0 ‚ 77 ‚ 1 ‚ 1 ‚ 2 ‚ 1 ‚ 2 ‚ 84 English ‚ 0.00 ‚ 91.67 ‚ 1.19 ‚ 1.19 ‚ 2.38 ‚ 1.19 ‚ 2.38 ‚ ƒƒƒƒƒƒƒƒƒƒƒƒƒƒƒƒƒˆƒƒƒƒƒƒƒƒˆƒƒƒƒƒƒƒƒˆƒƒƒƒƒƒƒƒˆƒƒƒƒƒƒƒƒˆƒƒƒƒƒƒƒƒˆƒƒƒƒƒƒƒƒˆƒƒƒƒƒƒƒƒˆ Don^t use com- ‚ 0 ‚ 489 ‚ 26 ‚ 10 ‚ 5 ‚ 10 ‚ 8 ‚ 548 puters in English‚ 0.00 ‚ 89.23 ‚ 4.74 ‚ 1.82 ‚ 0.91 ‚ 1.82 ‚ 1.46 ‚ ƒƒƒƒƒƒƒƒƒƒƒƒƒƒƒƒƒˆƒƒƒƒƒƒƒƒˆƒƒƒƒƒƒƒƒˆƒƒƒƒƒƒƒƒˆƒƒƒƒƒƒƒƒˆƒƒƒƒƒƒƒƒˆƒƒƒƒƒƒƒƒˆƒƒƒƒƒƒƒƒˆ Total 32 566 156 63 26 44 24 911
Frequency Missing = 11
Recommendation: RTI recommends eliminating all embedded filter questions and creating separate filter questions.
Filter Question 47 (Critical Item):
Path 1) This filter-dependent pair was highly effective. Of the 734 students who indicated that they do use a computer, only four (0.5 percent) failed to answer question 48a. Both the filter and the dependent question were critical items, which probably contributed to the very low failure rate.EBS047(USE COMPUTER ANY SETTING)
EBS048A(HOW OFTEN USE COMPUTER-WRITE)
Frequency‚ Row Pct ‚ -9‚ -3‚Rarely ‚Less ‚Once or ‚Every ‚ Total ‚ ‚ ‚or never‚than ‚twice a ‚day or ‚ ‚ ‚ ‚ ‚once a ‚week ‚almost ‚ ‚ ‚ ‚ ‚week ‚ ‚everyday‚ ƒƒƒƒƒƒƒƒƒˆƒƒƒƒƒƒƒƒˆƒƒƒƒƒƒƒƒˆƒƒƒƒƒƒƒƒˆƒƒƒƒƒƒƒƒˆƒƒƒƒƒƒƒƒˆƒƒƒƒƒƒƒƒˆ -9 ‚ 10 ‚ 0 ‚ 6 ‚ 4 ‚ 2 ‚ 4 ‚ 26 ‚ 38.46 ‚ 0.00 ‚ 23.08 ‚ 15.38 ‚ 7.69 ‚ 15.38 ‚ ƒƒƒƒƒƒƒƒƒˆƒƒƒƒƒƒƒƒˆƒƒƒƒƒƒƒƒˆƒƒƒƒƒƒƒƒˆƒƒƒƒƒƒƒƒˆƒƒƒƒƒƒƒƒˆƒƒƒƒƒƒƒƒˆ -2 ‚ 1 ‚ 0 ‚ 0 ‚ 1 ‚ 1 ‚ 0 ‚ 3 ‚ 33.33 ‚ 0.00 ‚ 0.00 ‚ 33.33 ‚ 33.33 ‚ 0.00 ‚ ƒƒƒƒƒƒƒƒƒˆƒƒƒƒƒƒƒƒˆƒƒƒƒƒƒƒƒˆƒƒƒƒƒƒƒƒˆƒƒƒƒƒƒƒƒˆƒƒƒƒƒƒƒƒˆƒƒƒƒƒƒƒƒˆ No ‚ 0 ‚ 141 ‚ 13 ‚ 4 ‚ 1 ‚ 0 ‚ 159 ‚ 0.00 ‚ 88.68 ‚ 8.18 ‚ 2.52 ‚ 0.63 ‚ 0.00 ‚ ƒƒƒƒƒƒƒƒƒˆƒƒƒƒƒƒƒƒˆƒƒƒƒƒƒƒƒˆƒƒƒƒƒƒƒƒˆƒƒƒƒƒƒƒƒˆƒƒƒƒƒƒƒƒˆƒƒƒƒƒƒƒƒˆ Yes ‚ 4 ‚ 0 ‚ 196 ‚ 291 ‚ 195 ‚ 48 ‚ 734 ‚ 0.54 ‚ 0.00 ‚ 26.70 ‚ 39.65 ‚ 26.57 ‚ 6.54 ‚ ƒƒƒƒƒƒƒƒƒˆƒƒƒƒƒƒƒƒˆƒƒƒƒƒƒƒƒˆƒƒƒƒƒƒƒƒˆƒƒƒƒƒƒƒƒˆƒƒƒƒƒƒƒƒˆƒƒƒƒƒƒƒƒˆ Total 15 141 215 300 199 52 922
Recommendation: No revisions are necessary.
Filter Question 56:
Path 1) Of the 736 students who indicated that their school has a library media center in question 56, all but 12 (1.6 percent) proceeded to the series of dependent questions.

Chapter 5 Analysis of Student Survey Results
106
EBS056(DOES SCHOOL HAVE LIBRARY) EBS057A(HOW OFTEN USE SCHL LIB-COURSE ASSIGNMENT)
Frequency‚ Row Pct ‚ -9‚ -3‚Never ‚Rarely ‚Some- ‚Often ‚ Total ‚ ‚ ‚ ‚ ‚times ‚ ‚ ƒƒƒƒƒƒƒƒƒˆƒƒƒƒƒƒƒƒˆƒƒƒƒƒƒƒƒˆƒƒƒƒƒƒƒƒˆƒƒƒƒƒƒƒƒˆƒƒƒƒƒƒƒƒˆƒƒƒƒƒƒƒƒˆ -9 ‚ 41 ‚ 0 ‚ 22 ‚ 16 ‚ 17 ‚ 1 ‚ 97 ‚ 42.27 ‚ 0.00 ‚ 22.68 ‚ 16.49 ‚ 17.53 ‚ 1.03 ‚ ƒƒƒƒƒƒƒƒƒˆƒƒƒƒƒƒƒƒˆƒƒƒƒƒƒƒƒˆƒƒƒƒƒƒƒƒˆƒƒƒƒƒƒƒƒˆƒƒƒƒƒƒƒƒˆƒƒƒƒƒƒƒƒˆ No ‚ 0 ‚ 50 ‚ 1 ‚ 1 ‚ 0 ‚ 0 ‚ 52 ‚ 0.00 ‚ 96.15 ‚ 1.92 ‚ 1.92 ‚ 0.00 ‚ 0.00 ‚ ƒƒƒƒƒƒƒƒƒˆƒƒƒƒƒƒƒƒˆƒƒƒƒƒƒƒƒˆƒƒƒƒƒƒƒƒˆƒƒƒƒƒƒƒƒˆƒƒƒƒƒƒƒƒˆƒƒƒƒƒƒƒƒˆ Yes ‚ 12 ‚ 0 ‚ 239 ‚ 272 ‚ 180 ‚ 33 ‚ 736 ‚ 1.63 ‚ 0.00 ‚ 32.47 ‚ 36.96 ‚ 24.46 ‚ 4.48 ‚ ƒƒƒƒƒƒƒƒƒˆƒƒƒƒƒƒƒƒˆƒƒƒƒƒƒƒƒˆƒƒƒƒƒƒƒƒˆƒƒƒƒƒƒƒƒˆƒƒƒƒƒƒƒƒˆƒƒƒƒƒƒƒƒˆ Total 53 50 262 289 197 34 885
Frequency Missing = 37
Recommendation: No revisions are necessary.
Filter Question 65:
Path 1) Of the 14 students who did not plan to continue their education past high school, only one (7.1 percent) incorrectly skipped the dependent question.EBS065(DOES R PLAN TO CONTINUE ED AFTER H.S.) EBS066A(WHY NO FURTHER ED-DOES NOT LIKE SCHOOL) Frequency ‚ Row Pct ‚ -9 ‚ -3 ‚No ‚Yes ‚ Total ƒƒƒƒƒƒƒƒƒƒƒƒƒƒƒƒƒˆƒƒƒƒƒƒƒƒˆƒƒƒƒƒƒƒƒˆƒƒƒƒƒƒƒƒˆƒƒƒƒƒƒƒƒˆ -9 ‚ 51 ‚ 0 ‚ 5 ‚ 5 ‚ 61 ‚ 83.61 ‚ 0.00 ‚ 8.20 ‚ 8.20 ‚ ƒƒƒƒƒƒƒƒƒƒƒƒƒƒƒƒƒˆƒƒƒƒƒƒƒƒˆƒƒƒƒƒƒƒƒˆƒƒƒƒƒƒƒƒˆƒƒƒƒƒƒƒƒˆ Don't know ‚ 0 ‚ 86 ‚ 1 ‚ 5 ‚ 92 ‚ 0.00 ‚ 93.48 ‚ 1.09 ‚ 5.43 ‚ ƒƒƒƒƒƒƒƒƒƒƒƒƒƒƒƒƒˆƒƒƒƒƒƒƒƒˆƒƒƒƒƒƒƒƒˆƒƒƒƒƒƒƒƒˆƒƒƒƒƒƒƒƒˆ No, don't plan to‚ 1 ‚ 0 ‚ 6 ‚ 7 ‚ 14 continue ed after‚ 7.14 ‚ 0.00 ‚ 42.86 ‚ 50.00 ‚ HS ‚ ‚ ‚ ‚ ‚ ƒƒƒƒƒƒƒƒƒƒƒƒƒƒƒƒƒˆƒƒƒƒƒƒƒƒˆƒƒƒƒƒƒƒƒˆƒƒƒƒƒƒƒƒˆƒƒƒƒƒƒƒƒˆ Yes, right after ‚ 0 ‚ 559 ‚ 10 ‚ 5 ‚ 574 HS ‚ 0.00 ‚ 97.39 ‚ 1.74 ‚ 0.87 ‚ ƒƒƒƒƒƒƒƒƒƒƒƒƒƒƒƒƒˆƒƒƒƒƒƒƒƒˆƒƒƒƒƒƒƒƒˆƒƒƒƒƒƒƒƒˆƒƒƒƒƒƒƒƒˆ Yes, after out of‚ 0 ‚ 102 ‚ 7 ‚ 5 ‚ 114 school one year ‚ 0.00 ‚ 89.47 ‚ 6.14 ‚ 4.39 ‚ ‚ ‚ ‚ ‚ ‚ ƒƒƒƒƒƒƒƒƒƒƒƒƒƒƒƒƒˆƒƒƒƒƒƒƒƒˆƒƒƒƒƒƒƒƒˆƒƒƒƒƒƒƒƒˆƒƒƒƒƒƒƒƒˆ Yes, after more ‚ 0 ‚ 16 ‚ 1 ‚ 2 ‚ 19 than one year ‚ 0.00 ‚ 84.21 ‚ 5.26 ‚ 10.53 ‚ ƒƒƒƒƒƒƒƒƒƒƒƒƒƒƒƒƒˆƒƒƒƒƒƒƒƒˆƒƒƒƒƒƒƒƒˆƒƒƒƒƒƒƒƒˆƒƒƒƒƒƒƒƒˆ Total 52 763 30 29 874
Frequency Missing = 48
Recommendation: No revisions are necessary.
Filter Question 68:
Path 1) Only 3 (0.5 percent) of the 613 students who answered "Yes" to filter question 68 failed to answer dependent question 69.

Chapter 5 Analysis of Student Survey Results
107
EBS068(R KNOWS OF ADMISSION STANDARDS) EBS069(R KNOWS THAT STANDARDS VARY BY COLLEGE) Frequency‚ Row Pct ‚ -9 ‚ -3 ‚No ‚Yes ‚ Total ƒƒƒƒƒƒƒƒƒˆƒƒƒƒƒƒƒƒˆƒƒƒƒƒƒƒƒˆƒƒƒƒƒƒƒƒˆƒƒƒƒƒƒƒƒˆ -9 ‚ 58 ‚ 0 ‚ 1 ‚ 15 ‚ 74 ‚ 78.38 ‚ 0.00 ‚ 1.35 ‚ 20.27 ‚ ƒƒƒƒƒƒƒƒƒˆƒƒƒƒƒƒƒƒˆƒƒƒƒƒƒƒƒˆƒƒƒƒƒƒƒƒˆƒƒƒƒƒƒƒƒˆ -3 ‚ 0 ‚ 9 ‚ 0 ‚ 1 ‚ 10 ‚ 0.00 ‚ 90.00 ‚ 0.00 ‚ 10.00 ‚ ƒƒƒƒƒƒƒƒƒˆƒƒƒƒƒƒƒƒˆƒƒƒƒƒƒƒƒˆƒƒƒƒƒƒƒƒˆƒƒƒƒƒƒƒƒˆ No ‚ 0 ‚ 170 ‚ 3 ‚ 4 ‚ 177 ‚ 0.00 ‚ 96.05 ‚ 1.69 ‚ 2.26 ‚ ƒƒƒƒƒƒƒƒƒˆƒƒƒƒƒƒƒƒˆƒƒƒƒƒƒƒƒˆƒƒƒƒƒƒƒƒˆƒƒƒƒƒƒƒƒˆ Yes ‚ 3 ‚ 1 ‚ 31 ‚ 578 ‚ 613 ‚ 0.49 ‚ 0.16 ‚ 5.06 ‚ 94.29 ‚ ƒƒƒƒƒƒƒƒƒˆƒƒƒƒƒƒƒƒˆƒƒƒƒƒƒƒƒˆƒƒƒƒƒƒƒƒˆƒƒƒƒƒƒƒƒˆ Total 61 180 35 598 874
Frequency Missing = 48
Recommendation: No revisions are necessary.
Filter Question 73:
Path 1) Only 4 (1.1 percent) of the 366 10th graders who would like to participate in college sports inappropriately bypassed question 74. EBS073(R WOULD LIKE TO PLAY COLLEGIATE SPORTS) EBS074(TYPE OF SPORT R WOULD LIKE TO PLAY) Frequency‚ Row Pct ‚ -9‚ -3‚Team ‚In- ‚Both ‚ Total ‚ ‚ ‚sports ‚dividual‚ ‚ ‚ ‚ ‚only ‚sports ‚ ‚ ƒƒƒƒƒƒƒƒƒˆƒƒƒƒƒƒƒƒˆƒƒƒƒƒƒƒƒˆƒƒƒƒƒƒƒƒˆƒƒƒƒƒƒƒƒˆƒƒƒƒƒƒƒƒˆ -9 ‚ 64 ‚ 0 ‚ 4 ‚ 2 ‚ 1 ‚ 71 ‚ 90.14 ‚ 0.00 ‚ 5.63 ‚ 2.82 ‚ 1.41 ‚ ƒƒƒƒƒƒƒƒƒˆƒƒƒƒƒƒƒƒˆƒƒƒƒƒƒƒƒˆƒƒƒƒƒƒƒƒˆƒƒƒƒƒƒƒƒˆƒƒƒƒƒƒƒƒˆ -3 ‚ 0 ‚ 10 ‚ 0 ‚ 0 ‚ 0 ‚ 10 ‚ 0.00 ‚ 100.00 ‚ 0.00 ‚ 0.00 ‚ 0.00 ‚ ƒƒƒƒƒƒƒƒƒˆƒƒƒƒƒƒƒƒˆƒƒƒƒƒƒƒƒˆƒƒƒƒƒƒƒƒˆƒƒƒƒƒƒƒƒˆƒƒƒƒƒƒƒƒˆ No ‚ 0 ‚ 403 ‚ 8 ‚ 7 ‚ 8 ‚ 426 ‚ 0.00 ‚ 94.60 ‚ 1.88 ‚ 1.64 ‚ 1.88 ‚ ƒƒƒƒƒƒƒƒƒˆƒƒƒƒƒƒƒƒˆƒƒƒƒƒƒƒƒˆƒƒƒƒƒƒƒƒˆƒƒƒƒƒƒƒƒˆƒƒƒƒƒƒƒƒˆ Yes ‚ 4 ‚ 0 ‚ 217 ‚ 21 ‚ 124 ‚ 366 ‚ 1.09 ‚ 0.00 ‚ 59.29 ‚ 5.74 ‚ 33.88 ‚ ƒƒƒƒƒƒƒƒƒˆƒƒƒƒƒƒƒƒˆƒƒƒƒƒƒƒƒˆƒƒƒƒƒƒƒƒˆƒƒƒƒƒƒƒƒˆƒƒƒƒƒƒƒƒˆ Total 68 413 229 30 133 873
Frequency Missing = 49
Recommendation: No revisions are necessary.
Filter Question 76:
Path 1) Nearly all (99.6 percent) of the 262 sophomores who knew of academic standards for participation on collegiate sports teams correctly proceeded to the follow-up question about how they learned of these requirements.

Chapter 5 Analysis of Student Survey Results
108
EBS076(R KNOWS OF ACADEMIC STANDARDS FOR SPORTS) EBS077A(HOW LEARNED ATHLETIC STANDARDS-COUNSELOR) Frequency‚ Row Pct ‚ -9 ‚ -3 ‚No ‚Yes ‚ Total ƒƒƒƒƒƒƒƒƒˆƒƒƒƒƒƒƒƒˆƒƒƒƒƒƒƒƒˆƒƒƒƒƒƒƒƒˆƒƒƒƒƒƒƒƒˆ -9 ‚ 71 ‚ 0 ‚ 2 ‚ 2 ‚ 75 ‚ 94.67 ‚ 0.00 ‚ 2.67 ‚ 2.67 ‚ ƒƒƒƒƒƒƒƒƒˆƒƒƒƒƒƒƒƒˆƒƒƒƒƒƒƒƒˆƒƒƒƒƒƒƒƒˆƒƒƒƒƒƒƒƒˆ -3 ‚ 0 ‚ 405 ‚ 4 ‚ 0 ‚ 409 ‚ 0.00 ‚ 99.02 ‚ 0.98 ‚ 0.00 ‚ ƒƒƒƒƒƒƒƒƒˆƒƒƒƒƒƒƒƒˆƒƒƒƒƒƒƒƒˆƒƒƒƒƒƒƒƒˆƒƒƒƒƒƒƒƒˆ No ‚ 0 ‚ 121 ‚ 3 ‚ 1 ‚ 125 ‚ 0.00 ‚ 96.80 ‚ 2.40 ‚ 0.80 ‚ ƒƒƒƒƒƒƒƒƒˆƒƒƒƒƒƒƒƒˆƒƒƒƒƒƒƒƒˆƒƒƒƒƒƒƒƒˆƒƒƒƒƒƒƒƒˆ Yes ‚ 1 ‚ 0 ‚ 154 ‚ 107 ‚ 262 ‚ 0.38 ‚ 0.00 ‚ 58.78 ‚ 40.84 ‚ ƒƒƒƒƒƒƒƒƒˆƒƒƒƒƒƒƒƒˆƒƒƒƒƒƒƒƒˆƒƒƒƒƒƒƒƒˆƒƒƒƒƒƒƒƒˆ Total 72 526 163 110 871
Frequency Missing = 51
Recommendation: No revisions are necessary.
Filter Question 84 (critical item):
Path 2) Students who have difficulty reading English are more likely to have difficulty following filter question instructions. Therefore, this item was designated a critical item so Survey Administrators would be sure that non-native English speakers did not inadvertently skip out of this section of the questionnaire. This measure was successful. All of the 135 students who reported that English was not their first language also identified their native language in question 85.EBS084(IS ENGLISH R^S NATIVE LANGUAGE) EBS085A(R^S NATIVE LANGUAGE) Frequency‚ Row Pct ‚-9 ‚-3 ‚RETRIEV- ‚ANSWERED‚ Total ‚ ‚ ‚AL FAILED‚ ‚ ƒƒƒƒƒƒƒƒƒˆƒƒƒƒƒƒƒƒˆƒƒƒƒƒƒƒƒˆƒ ƒƒƒƒƒƒƒˆƒƒƒƒƒƒƒƒˆ -9 ‚ 25 ‚ 0 ‚ 0 ‚ 5 ‚ 30 ‚ 83.33 ‚ 0.00 ‚ 0.00 ‚ 16.67 ‚ ƒƒƒƒƒƒƒƒƒˆƒƒƒƒƒƒƒƒˆƒƒƒƒƒƒƒƒˆƒƒƒƒ ƒƒƒƒˆƒƒƒƒƒƒƒƒˆ -2 ‚ 0 ‚ 0 ‚ 1 ‚ 1 ‚ 2 ‚ 0.00 ‚ 0.00 ‚ 50.0 0 ‚ 50.00 ‚ ƒƒƒƒƒƒƒƒƒˆƒƒƒƒƒƒƒƒˆƒƒƒƒƒƒƒƒˆƒƒƒƒƒƒƒ ƒˆƒƒƒƒƒƒƒƒˆ No ‚ 0 ‚ 0 ‚ 0 ‚ 135 ‚ 135 ‚ 0.00 ‚ 0.00 ‚ 0.00 ‚ 100.00 ‚ ƒƒƒƒƒƒƒƒƒˆƒƒƒƒƒƒƒƒˆƒƒƒƒƒƒƒƒˆƒƒƒƒƒƒƒƒ ˆƒƒƒƒƒƒƒƒˆ Yes ‚ 0 ‚ 735 ‚ 2 ‚ 18 ‚ 755 ‚ 0.00 ‚ 97.35 ‚ 0.26 ‚ 2.38 ‚ ƒƒƒƒƒƒƒƒƒˆƒƒƒƒƒƒƒƒˆƒƒƒƒƒƒƒƒˆƒƒƒƒƒƒƒƒ ˆƒƒƒƒƒƒƒƒˆ Total 25 735 3 159 922
Recommendation: No revisions are necessary. Continue to designate this a critical item.
Filter Question 89:
Path 1) Twelve of the 14 (85.7 percent) non-native English speakers who indicated that they had received special English language help proceeded to the following question as they were directed to do.

Chapter 5 Analysis of Student Survey Results
109
EBS089(SPECIAL HELP IN READING/WRITING ENGLISH) EBS090A(HELP IN FORM OF INDIVIDUAL TUTORING) Frequency‚ Row Pct ‚ -9 ‚ -3 ‚No ‚Yes ‚ Total ƒƒƒƒƒƒƒƒƒˆƒƒƒƒƒƒƒƒˆƒƒƒƒƒƒƒƒˆƒƒƒƒƒƒƒƒˆƒƒƒƒƒƒƒƒˆ -9 ‚ 25 ‚ 0 ‚ 0 ‚ 2 ‚ 27 ‚ 92.59 ‚ 0.00 ‚ 0.00 ‚ 7.41 ‚ ƒƒƒƒƒƒƒƒƒˆƒƒƒƒƒƒƒƒˆƒƒƒƒƒƒƒƒˆƒƒƒƒƒƒƒƒˆƒƒƒƒƒƒƒƒˆ -3 ‚ 0 ‚ 733 ‚ 0 ‚ 3 ‚ 736 ‚ 0.00 ‚ 99.59 ‚ 0.00 ‚ 0.41 ‚ ƒƒƒƒƒƒƒƒƒˆƒƒƒƒƒƒƒƒˆƒƒƒƒƒƒƒƒˆƒƒƒƒƒƒƒƒˆƒƒƒƒƒƒƒƒˆ No ‚ 0 ‚ 119 ‚ 8 ‚ 0 ‚ 127 ‚ 0.00 ‚ 93.70 ‚ 6.30 ‚ 0.00 ‚ ƒƒƒƒƒƒƒƒƒˆƒƒƒƒƒƒƒƒˆƒƒƒƒƒƒƒƒˆƒƒƒƒƒƒƒƒˆƒƒƒƒƒƒƒƒˆ Yes ‚ 2 ‚ 0 ‚ 7 ‚ 5 ‚ 14 ‚ 14.29 ‚ 0.00 ‚ 50.00 ‚ 35.71 ‚ ƒƒƒƒƒƒƒƒƒˆƒƒƒƒƒƒƒƒˆƒƒƒƒƒƒƒƒˆƒƒƒƒƒƒƒƒˆƒƒƒƒƒƒƒƒˆ Total 27 852 15 10 904
Frequency Missing = 18
Recommendation: Consider designating this a critical item.
Filter Question 96 (critical item):
Path 3) Almost all of the students (95.7 percent) who had worked for pay but were not currently employed correctly continued on to the following question. EBS096(HAS R EVER WORKED FOR PAY OUTSIDE HOME) EBS097B(YEAR, LAST TIME R WORKED) Frequency ‚ Percent ‚ Row Pct ‚ Col Pct ‚ -9‚ -3‚ANSWERED‚ Total ƒƒƒƒƒƒƒƒƒƒƒƒƒƒƒƒƒˆƒƒƒƒƒƒƒƒˆƒƒƒƒƒƒƒƒˆƒƒƒƒƒƒƒƒˆ -9 ‚ 28 ‚ 0 ‚ 2 ‚ 30
‚ 93.33 ‚ 0.00 ‚ 6.67 ‚ ƒƒƒƒƒƒƒƒƒƒƒƒƒƒƒƒƒˆƒƒƒƒƒƒƒƒˆƒƒƒƒƒƒƒƒˆƒƒƒƒƒƒƒƒˆ No, never worked ‚ 0 ‚ 428 ‚ 0 ‚ 428 for pay ‚ 0.00 ‚ 100.00 ‚ 0.00 ‚ ƒƒƒƒƒƒƒƒƒƒƒƒƒƒƒƒƒˆƒƒƒƒƒƒƒƒˆƒƒƒƒƒƒƒƒˆƒƒƒƒƒƒƒƒˆ Yes, currently ‚ 0 ‚ 210 ‚ 0 ‚ 210 enployed ‚ 0.00 ‚ 100.00 ‚ 0.00 ‚ ƒƒƒƒƒƒƒƒƒƒƒƒƒƒƒƒƒˆƒƒƒƒƒƒƒƒˆƒƒƒƒƒƒƒƒˆƒƒƒƒƒƒƒƒˆ Yes, but not ‚ 11 ‚ 0 ‚ 243 ‚ 254 currently ‚ 4.33 ‚ 0.00 ‚ 95.67 ‚ employed ‚ ‚ ‚ ‚ ƒƒƒƒƒƒƒƒƒƒƒƒƒƒƒƒƒˆƒƒƒƒƒƒƒƒˆƒƒƒƒƒƒƒƒˆƒƒƒƒƒƒƒƒˆ Total 39 638 245 922
Recommendation: No revisions are necessary.
Filter Question 99: Number of hours worked per week during school year
Path 2) Only 2 students (0.8 percent) who were routed to question 100 from question 99 incorrectly skipped it.

Chapter 5 Analysis of Student Survey Results
110
EBS99 (CURRENT JOB, # HRS WORKED DURING SCHL YR) EBS100 (HOW MANY OF THOSE HRS ARE ON THE WEEKEND) Frequency‚ Row Pct ‚-9 ‚-3 ‚ANSWERED‚ Total ƒƒƒƒƒƒƒƒƒˆƒƒƒƒƒƒƒƒˆƒƒƒƒƒƒƒƒˆƒƒƒƒƒƒƒƒˆ -9 ‚ 40 ‚ 0 ‚ 3 ‚ 43 ‚ 93.02 ‚ 0.00 ‚ 6.98 ‚ ƒƒƒƒƒƒƒƒƒˆƒƒƒƒƒƒƒƒˆƒƒƒƒƒƒƒƒˆƒƒƒƒƒƒƒƒˆ -3 ‚ 0 ‚ 551 ‚ 8 ‚ 559 ‚ 0.00 ‚ 98.57 ‚ 1.43 ‚ ƒƒƒƒƒƒƒƒƒˆƒƒƒƒƒƒƒƒˆƒƒƒƒƒƒƒƒˆƒƒƒƒƒƒƒƒˆ ANSWERED ‚ 2 ‚ 1 ‚ 263 ‚ 266 ‚ 0.75 ‚ 0.38 ‚ 98.87 ‚ ƒƒƒƒƒƒƒƒƒˆƒƒƒƒƒƒƒƒˆƒƒƒƒƒƒƒƒˆƒƒƒƒƒƒƒƒˆ Total 42 552 274 868
Frequency Missing = 54
Recommendation: No revisions are necessary.
Filter Question 109: Care for younger siblings, relatives, or own child
Path 2) Almost all (94.5 percent) of eligible students answered question 110. EBS109(DOES R BABYSIT OWN CHILD, OR SIBLINGS) EBS110HR(HOURS PER DAY SPENT BABYSITTING) Frequency ‚ Row Pct ‚-9 ‚-3 ‚ANSWERED‚ Total ƒƒƒƒƒƒƒƒƒƒƒƒƒƒƒˆƒƒƒƒƒƒƒƒˆƒƒƒƒƒƒƒƒˆƒƒƒƒƒƒƒƒˆ -9 ‚ 51 ‚ 0 ‚ 5 ‚ 56 ‚ 91.07 ‚ 0.00 ‚ 8.93 ‚ ƒƒƒƒƒƒƒƒƒƒƒƒƒƒƒˆƒƒƒƒƒƒƒƒˆƒƒƒƒƒƒƒƒˆƒƒƒƒƒƒƒƒˆ Does not apply ‚ 0 ‚ 62 ‚ 0 ‚ 62 ‚ 0.00 ‚ 100.00 ‚ 0.00 ‚ ƒƒƒƒƒƒƒƒƒƒƒƒƒƒƒˆƒƒƒƒƒƒƒƒˆƒƒƒƒƒƒƒƒˆƒƒƒƒƒƒƒƒˆ No ‚ 0 ‚ 395 ‚ 6 ‚ 401 ‚ 0.00 ‚ 98.50 ‚ 1.50 ‚ ƒƒƒƒƒƒƒƒƒƒƒƒƒƒƒˆƒƒƒƒƒƒƒƒˆƒƒƒƒƒƒƒƒˆƒƒƒƒƒƒƒƒˆ Yes ‚ 17 ‚ 0 ‚ 292 ‚ 309 ‚ 5.50 ‚ 0.00 ‚ 94.50 ‚ ƒƒƒƒƒƒƒƒƒƒƒƒƒƒƒˆƒƒƒƒƒƒƒƒˆƒƒƒƒƒƒƒƒˆƒƒƒƒƒƒƒƒˆ Total 68 457 303 828
Frequency Missing = 94
Recommendation: No revisions are necessary.
Filter Question 122 (critical item): Hispanic/Latino/Latina
Path 1) Only one student who indicated that he/she was Hispanic inappropriately skipped the subsequent question.

Chapter 5 Analysis of Student Survey Results
111
EBS122(R IS HISPANIC) EBS123(HISPANIC SUBDIVISION)
Frequency ‚ Row Pct ‚-9 ‚-3 ‚-2 ‚ANSWERED‚ Total ƒƒƒƒƒƒƒƒƒƒƒƒƒˆƒƒƒƒƒƒƒƒˆƒƒƒƒƒƒƒƒˆƒƒƒƒƒƒƒƒˆƒƒƒƒƒƒƒƒˆ -9 ‚ 60 ‚ 0 ‚ 0 ‚ 2 ‚ 62 ‚ 96.77 ‚ 0.00 ‚ 0.00 ‚ 3.23 ‚ ƒƒƒƒƒƒƒƒƒƒƒƒƒˆƒƒƒƒƒƒƒƒˆƒƒƒƒƒƒƒƒˆƒƒƒƒƒƒƒƒˆƒƒƒƒƒƒƒƒˆ -2 ‚ 2 ‚ 0 ‚ 1 ‚ 0 ‚ 3 ‚ 66.67 ‚ 0.00 ‚ 33.33 ‚ 0.00 ‚ ƒƒƒƒƒƒƒƒƒƒƒƒƒˆƒƒƒƒƒƒƒƒˆƒƒƒƒƒƒƒƒˆƒƒƒƒƒƒƒƒˆƒƒƒƒƒƒƒƒˆ Not Hispanic ‚ 0 ‚ 672 ‚ 3 ‚ 17 ‚ 692 ‚ 0.00 ‚ 97.11 ‚ 0.43 ‚ 2.46 ‚ ƒƒƒƒƒƒƒƒƒƒƒƒƒˆƒƒƒƒƒƒƒƒˆƒƒƒƒƒƒƒƒˆƒƒƒƒƒƒƒƒˆƒƒƒƒƒƒƒƒˆ Hispanic ‚ 1 ‚ 0 ‚ 0 ‚ 164 ‚ 165 ‚ 0.61 ‚ 0.00 ‚ 0.00 ‚ 99.39 ‚ ƒƒƒƒƒƒƒƒƒƒƒƒƒˆƒƒƒƒƒƒƒƒˆƒƒƒƒƒƒƒƒˆƒƒƒƒƒƒƒƒˆƒƒƒƒƒƒƒƒˆ Total 63 672 4 183 922
Recommendation: No revisions are necessary.
Filter Question 124c (critical item): Asian race Path 1) The vast majority of Asian students (94.1 percent) provided their Asian origin.EBS124C(R^S RACE/ETHNICITY-ASIAN)
EBS125(ASIAN SUBDIVISION)
Frequency ‚ Row Pct ‚-9 ‚-3 ‚-2 ‚ANSWERED‚ Total ƒƒƒƒƒƒƒƒƒƒƒƒƒƒƒˆƒƒƒƒƒƒƒƒˆƒƒƒƒƒƒƒƒˆƒƒƒƒƒƒƒƒˆƒƒƒƒƒƒƒƒˆ -9 ‚ 80 ‚ 0 ‚ 0 ‚ 1 ‚ 81 ‚ 98.77 ‚ 0.00 ‚ 0.00 ‚ 1.23 ‚ ƒƒƒƒƒƒƒƒƒƒƒƒƒƒƒˆƒƒƒƒƒƒƒƒˆƒƒƒƒƒƒƒƒˆƒƒƒƒƒƒƒƒˆƒƒƒƒƒƒƒƒˆ Asian unmarked ‚ 0 ‚ 778 ‚ 5 ‚ 7 ‚ 790 ‚ 0.00 ‚ 98.48 ‚ 0.63 ‚ 0.89 ‚ ƒƒƒƒƒƒƒƒƒƒƒƒƒƒƒˆƒƒƒƒƒƒƒƒˆƒƒƒƒƒƒƒƒˆƒƒƒƒƒƒƒƒˆƒƒƒƒƒƒƒƒˆ Asian ‚ 3 ‚ 0 ‚ 0 ‚ 48 ‚ 51 ‚ 5.88 ‚ 0.00 ‚ 0.00 ‚ 94.12 ‚ ƒƒƒƒƒƒƒƒƒƒƒƒƒƒƒˆƒƒƒƒƒƒƒƒˆƒƒƒƒƒƒƒƒˆƒƒƒƒƒƒƒƒˆƒƒƒƒƒƒƒƒˆ Total 83 778 5 56 922
Recommendation: No revisions are necessary.
Filter Question 142: Describe admired person
Path 1) Almost all students who described an admired person in question 142 (96.5 percent) also answered the dependent question.

Chapter 5 Analysis of Student Survey Results
112
EBS142A(PERSON R ADMIRES THE MOST IS POPULAR) EBS143A(R^S RELATIONSHIP TO THE ADMIRED PERSON)
Frequency‚ Row Pct ‚ -9‚ -3‚Friend ‚Parent ‚Relative‚Teacher/‚Boy/girl‚Other ‚ Total ‚ ‚ ‚ ‚ ‚ ‚coach ‚friend/ ‚ ‚ ‚ ‚ ‚ ‚ ‚ ‚ ‚spouse ‚ ‚ ƒƒƒƒƒƒƒƒƒˆƒƒƒƒƒƒƒƒˆƒƒƒƒƒƒƒƒˆƒƒƒƒƒƒƒƒˆƒƒƒƒƒƒƒƒˆƒƒƒƒƒƒƒƒˆƒƒƒƒƒƒƒƒˆƒƒƒƒƒƒƒƒˆƒƒƒƒƒƒƒƒˆ -9 ‚ 6 ‚ 0 ‚ 5 ‚ 0 ‚ 1 ‚ 0 ‚ 0 ‚ 0 ‚ 12 ‚ 50.00 ‚ 0.00 ‚ 41.67 ‚ 0.00 ‚ 8.33 ‚ 0.00 ‚ 0.00 ‚ 0.00 ‚ ƒƒƒƒƒƒƒƒƒˆƒƒƒƒƒƒƒƒˆƒƒƒƒƒƒƒƒˆƒƒƒƒƒƒƒƒˆƒƒƒƒƒƒƒƒˆƒƒƒƒƒƒƒƒˆƒƒƒƒƒƒƒƒˆƒƒƒƒƒƒƒƒˆƒƒƒƒƒƒƒƒˆ -3 ‚ 0 ‚ 45 ‚ 2 ‚ 0 ‚ 0 ‚ 0 ‚ 4 ‚ 0 ‚ 51 ‚ 0.00 ‚ 88.24 ‚ 3.92 ‚ 0.00 ‚ 0.00 ‚ 0.00 ‚ 7.84 ‚ 0.00 ‚ ƒƒƒƒƒƒƒƒƒˆƒƒƒƒƒƒƒƒˆƒƒƒƒƒƒƒƒˆƒƒƒƒƒƒƒƒˆƒƒƒƒƒƒƒƒˆƒƒƒƒƒƒƒƒˆƒƒƒƒƒƒƒƒˆƒƒƒƒƒƒƒƒˆƒƒƒƒƒƒƒƒˆ No ‚ 4 ‚ 0 ‚ 83 ‚ 42 ‚ 19 ‚ 6 ‚ 20 ‚ 17 ‚ 191 ‚ 2.09 ‚ 0.00 ‚ 43.46 ‚ 21.99 ‚ 9.95 ‚ 3.14 ‚ 10.47 ‚ 8.90 ‚ ƒƒƒƒƒƒƒƒƒˆƒƒƒƒƒƒƒƒˆƒƒƒƒƒƒƒƒˆƒƒƒƒƒƒƒƒˆƒƒƒƒƒƒƒƒˆƒƒƒƒƒƒƒƒˆƒƒƒƒƒƒƒƒˆƒƒƒƒƒƒƒƒˆƒƒƒƒƒƒƒƒˆ Yes ‚ 8 ‚ 2 ‚ 87 ‚ 13 ‚ 23 ‚ 3 ‚ 16 ‚ 3 ‚ 155 ‚ 5.16 ‚ 1.29 ‚ 56.13 ‚ 8.39 ‚ 14.84 ‚ 1.94 ‚ 10.32 ‚ 1.94 ‚ ƒƒƒƒƒƒƒƒƒˆƒƒƒƒƒƒƒƒˆƒƒƒƒƒƒƒƒˆƒƒƒƒƒƒƒƒˆƒƒƒƒƒƒƒƒˆƒƒƒƒƒƒƒƒˆƒƒƒƒƒƒƒƒˆƒƒƒƒƒƒƒƒˆƒƒƒƒƒƒƒƒˆ Total 18 47 177 55 43 9 40 20 409
Frequency Missing = 513
Recommendation: No revisions are necessary.
Filter Question 145: Bet money on sporting event
Path 1) All of the students who reported betting money on sports within the last year proceeded to the dependent question.EBS145(R BET MONEY ON SPORTS LAST YR)
EBS146(HOW OFTEN R BET MONEY ON SPORTS LAST YR)
Frequency‚ Row Pct ‚ -9‚ -3‚Daily ‚At least‚At least‚Several ‚At least‚I don't ‚ Total ‚ ‚ ‚ ‚once/wk ‚once/ ‚times in‚once in ‚know ‚ ‚ ‚ ‚ ‚ ‚month ‚year ‚ year ‚ ‚ ƒƒƒƒƒƒƒƒƒˆƒƒƒƒƒƒƒƒˆƒƒƒƒƒƒƒƒˆƒƒƒƒƒƒƒƒˆƒƒƒƒƒƒƒƒˆƒƒƒƒƒƒƒƒˆƒƒƒƒƒƒƒƒˆƒƒƒƒƒƒƒƒˆƒƒƒƒƒƒƒƒˆ -9 ‚ 2 ‚ 0 ‚ 1 ‚ 1 ‚ 0 ‚ 0 ‚ 2 ‚ 2 ‚ 8 ‚ 25.00 ‚ 0.00 ‚ 12.50 ‚ 12.50 ‚ 0.00 ‚ 0.00 ‚ 25.00 ‚ 25.00 ‚ ƒƒƒƒƒƒƒƒƒˆƒƒƒƒƒƒƒƒˆƒƒƒƒƒƒƒƒˆƒƒƒƒƒƒƒƒˆƒƒƒƒƒƒƒƒˆƒƒƒƒƒƒƒƒˆƒƒƒƒƒƒƒƒˆƒƒƒƒƒƒƒƒˆƒƒƒƒƒƒƒƒˆ No ‚ 0 ‚ 297 ‚ 2 ‚ 1 ‚ 1 ‚ 0 ‚ 0 ‚ 8 ‚ 309 ‚ 0.00 ‚ 96.12 ‚ 0.65 ‚ 0.32 ‚ 0.32 ‚ 0.00 ‚ 0.00 ‚ 2.59 ‚ ƒƒƒƒƒƒƒƒƒˆƒƒƒƒƒƒƒƒˆƒƒƒƒƒƒƒƒˆƒƒƒƒƒƒƒƒˆƒƒƒƒƒƒƒƒˆƒƒƒƒƒƒƒƒˆƒƒƒƒƒƒƒƒˆƒƒƒƒƒƒƒƒˆƒƒƒƒƒƒƒƒˆ Yes ‚ 0 ‚ 0 ‚ 1 ‚ 6 ‚ 7 ‚ 12 ‚ 37 ‚ 11 ‚ 74 ‚ 0.00 ‚ 0.00 ‚ 1.35 ‚ 8.11 ‚ 9.46 ‚ 16.22 ‚ 50.00 ‚ 14.86 ‚ ƒƒƒƒƒƒƒƒƒˆƒƒƒƒƒƒƒƒˆƒƒƒƒƒƒƒƒˆƒƒƒƒƒƒƒƒˆƒƒƒƒƒƒƒƒˆƒƒƒƒƒƒƒƒˆƒƒƒƒƒƒƒƒˆƒƒƒƒƒƒƒƒˆƒƒƒƒƒƒƒƒˆ Total 2 297 4 8 8 12 39 21 391
Frequency Missing = 531
Recommendation: No revisions are necessary.
5.3.6 Response Variation by Item Position in Questionnaire
An important purpose of the field test instrument is to estimate the number of questions 10th grade students are capable of completing in a given time frame. Since the majority of students were unable to complete the field test questionnaire in the hour allotted, survey administrators instructed respondents in some schools (those participating after April 2, 2001) to complete the parts of the questionnaire out of sequence to insure that items at the end of the instrument were answered by a sufficient number of students to allow for meaningful analysis. Therefore, the following analysis of item nonresponse by position in the questionnaire is restricted to data gathered from students who completed the parts in sequential order (n=337).
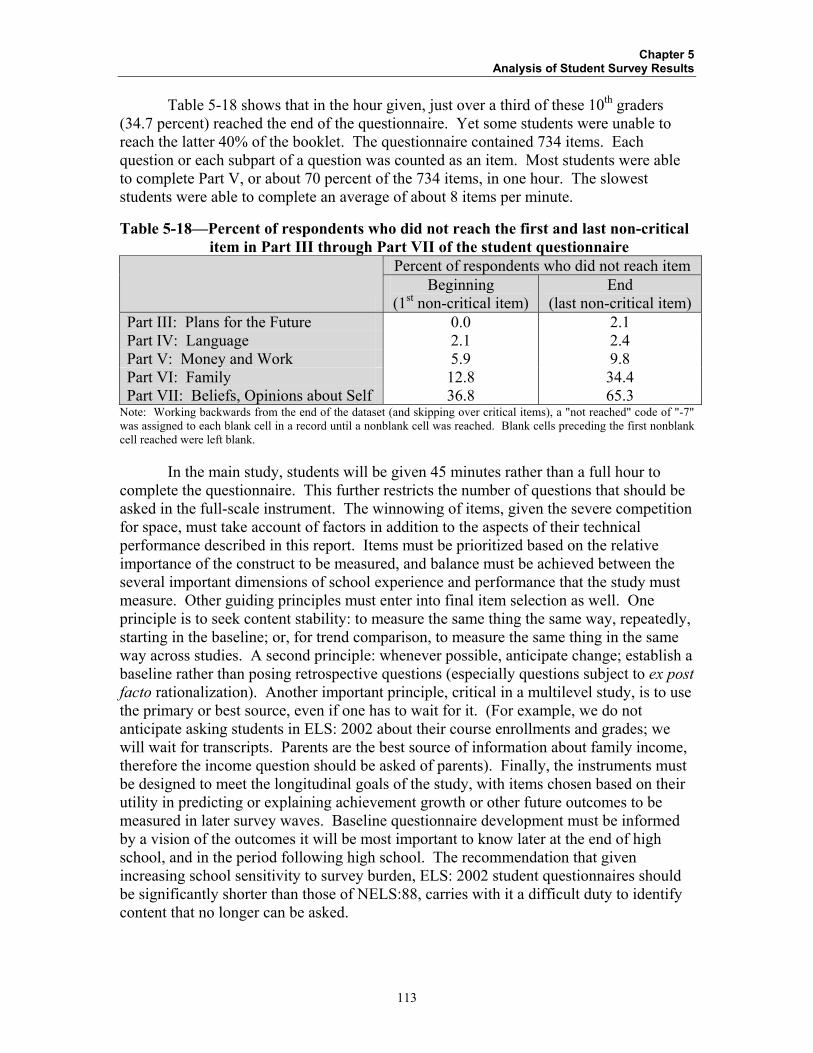
Chapter 5 Analysis of Student Survey Results
113
Table 5-18 shows that in the hour given, just over a third of these 10th graders (34.7 percent) reached the end of the questionnaire. Yet some students were unable to reach the latter 40% of the booklet. The questionnaire contained 734 items. Each question or each subpart of a question was counted as an item. Most students were able to complete Part V, or about 70 percent of the 734 items, in one hour. The slowest students were able to complete an average of about 8 items per minute.
Table 5-18—Percent of respondents who did not reach the first and last non-critical item in Part III through Part VII of the student questionnaire
Percent of respondents who did not reach item Beginning
(1st non-critical item) End
(last non-critical item) Part III: Plans for the Future 0.0 2.1 Part IV: Language 2.1 2.4 Part V: Money and Work 5.9 9.8 Part VI: Family 12.8 34.4 Part VII: Beliefs, Opinions about Self 36.8 65.3
Note: Working backwards from the end of the dataset (and skipping over critical items), a "not reached" code of "-7" was assigned to each blank cell in a record until a nonblank cell was reached. Blank cells preceding the first nonblank cell reached were left blank.
In the main study, students will be given 45 minutes rather than a full hour to complete the questionnaire. This further restricts the number of questions that should be asked in the full-scale instrument. The winnowing of items, given the severe competition for space, must take account of factors in addition to the aspects of their technical performance described in this report. Items must be prioritized based on the relative importance of the construct to be measured, and balance must be achieved between the several important dimensions of school experience and performance that the study must measure. Other guiding principles must enter into final item selection as well. One principle is to seek content stability: to measure the same thing the same way, repeatedly, starting in the baseline; or, for trend comparison, to measure the same thing in the same way across studies. A second principle: whenever possible, anticipate change; establish a baseline rather than posing retrospective questions (especially questions subject to ex post facto rationalization). Another important principle, critical in a multilevel study, is to use the primary or best source, even if one has to wait for it. (For example, we do not anticipate asking students in ELS: 2002 about their course enrollments and grades; we will wait for transcripts. Parents are the best source of information about family income, therefore the income question should be asked of parents). Finally, the instruments must be designed to meet the longitudinal goals of the study, with items chosen based on their utility in predicting or explaining achievement growth or other future outcomes to be measured in later survey waves. Baseline questionnaire development must be informed by a vision of the outcomes it will be most important to know later at the end of high school, and in the period following high school. The recommendation that given increasing school sensitivity to survey burden, ELS: 2002 student questionnaires should be significantly shorter than those of NELS:88, carries with it a difficult duty to identify content that no longer can be asked.

Chapter 5 Analysis of Student Survey Results
114
This page is intentionally blank.

115
Chapter 6 Analysis of School, Teacher, Library Survey and Facilities Results
6.1 School Administrator Survey Responses
6.1.1 Item Nonresponse Analysis
A total of 48 school administrator questionnaires were completed, four of which were abbreviated. The following report of item nonresponse focuses on questions that ELS staff recommend retaining for the full-scale study. Of these items, ones missing data from 12 percent or more of the school administrators are reported in Table 6.1 and discussed below.
Item nonresponse was calculated by dividing the number of administrators who inappropriately skipped a question by the number of administrators who were eligible for that question. The following formula was used:
Number of illegitimate skips (# questionnaire respondents - # legitimate skips)
Each case missing data has a relatively large impact on the overall nonresponse rate because there are only 48 questionnaires. Furthermore, some of the items applied to fewer than half of schools, such that two or three inappropriate skips resulted in a nonresponse rate over 12 percent.
Table 6.1—Item nonresponse on ELS:2002 field test administrator questionnaire Variable Variable Label n Total Missing (%)
12G % In Gang Prevention Program 14 21.4 12J % In Crisis Prevention Program 22 13.6
20BB Internships-10th Grd Eligible 18 22.2 20BC Mentoring-10th Grd Eligible 18 22.2 20BD Service Learning-10th Grd Eligible 25 16.0 20BE School Enterprise-10th Grd Eligible 10 40.0 37HA Number Of Full-Time History Faculty 44 29.6 38B % Part-Time Certified Teachers In School 48 14.6 39B % Part-Time Teachers Teach Out Of Field 48 14.6 40A Lowest Salary Paid To Full-Time Teachers 45 17.8 40B Highest Salary Paid To Full-Time Teachrs 45 17.8 42C Teachers Evaluate Teachers 44 13.6 42D Students Evaluate Teachers 44 13.6
50AA Minimum Competency Test Given In Grade 7 33 15.2 50BA Subjects On Grade 7 Test 7 71.4 50AB Minimum Competency Test Given In Grade 8 33 12.1 50BB Subjects On Grade 8 Test 8 50.0
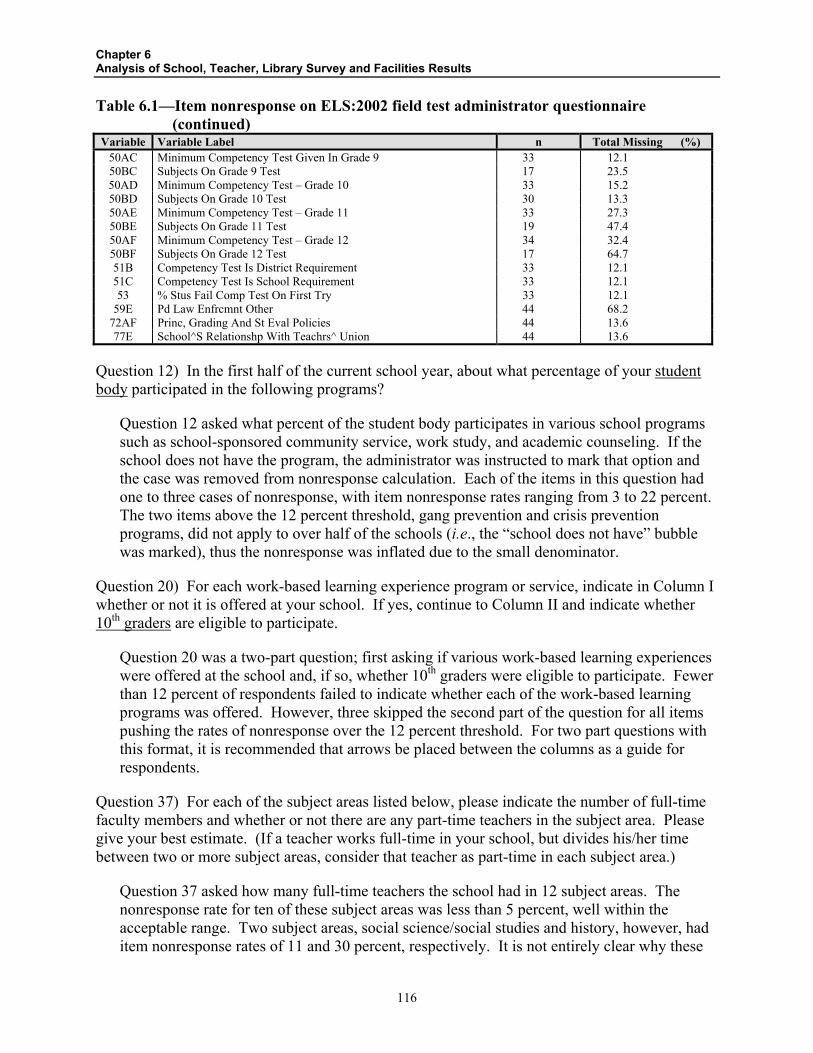
Chapter 6 Analysis of School, Teacher, Library Survey and Facilities Results
116
Table 6.1—Item nonresponse on ELS:2002 field test administrator questionnaire (continued)
Variable Variable Label n Total Missing (%) 50AC Minimum Competency Test Given In Grade 9 33 12.1 50BC Subjects On Grade 9 Test 17 23.5 50AD Minimum Competency Test – Grade 10 33 15.2 50BD Subjects On Grade 10 Test 30 13.3 50AE Minimum Competency Test – Grade 11 33 27.3 50BE Subjects On Grade 11 Test 19 47.4 50AF Minimum Competency Test – Grade 12 34 32.4 50BF Subjects On Grade 12 Test 17 64.7 51B Competency Test Is District Requirement 33 12.1 51C Competency Test Is School Requirement 33 12.1 53 % Stus Fail Comp Test On First Try 33 12.1
59E Pd Law Enfrcmnt Other 44 68.2 72AF Princ, Grading And St Eval Policies 44 13.6 77E School^S Relationshp With Teachrs^ Union 44 13.6
Question 12) In the first half of the current school year, about what percentage of your student body participated in the following programs?
Question 12 asked what percent of the student body participates in various school programs such as school-sponsored community service, work study, and academic counseling. If the school does not have the program, the administrator was instructed to mark that option and the case was removed from nonresponse calculation. Each of the items in this question had one to three cases of nonresponse, with item nonresponse rates ranging from 3 to 22 percent. The two items above the 12 percent threshold, gang prevention and crisis prevention programs, did not apply to over half of the schools (i.e., the “school does not have” bubble was marked), thus the nonresponse was inflated due to the small denominator.
Question 20) For each work-based learning experience program or service, indicate in Column I whether or not it is offered at your school. If yes, continue to Column II and indicate whether 10th graders are eligible to participate.
Question 20 was a two-part question; first asking if various work-based learning experiences were offered at the school and, if so, whether 10th graders were eligible to participate. Fewer than 12 percent of respondents failed to indicate whether each of the work-based learning programs was offered. However, three skipped the second part of the question for all items pushing the rates of nonresponse over the 12 percent threshold. For two part questions with this format, it is recommended that arrows be placed between the columns as a guide for respondents.
Question 37) For each of the subject areas listed below, please indicate the number of full-time faculty members and whether or not there are any part-time teachers in the subject area. Please give your best estimate. (If a teacher works full-time in your school, but divides his/her time between two or more subject areas, consider that teacher as part-time in each subject area.)
Question 37 asked how many full-time teachers the school had in 12 subject areas. The nonresponse rate for ten of these subject areas was less than 5 percent, well within the acceptable range. Two subject areas, social science/social studies and history, however, had item nonresponse rates of 11 and 30 percent, respectively. It is not entirely clear why these

Chapter 6 Analysis of School, Teacher, Library Survey and Facilities Results
117
particular subject areas were problematic. It is possible that administrators were unable to clearly distinguish between these two subject areas and, consequently, the teachers teaching these subjects. Considering that all of the administrators who did not provide a count of full-time history teachers did provide a count of social science/social studies teachers (with the exception of one who did not respond to the question at all), it is likely that the history teachers were included in the count of social science/social studies teachers for that school.
Question 38) What percentage of full-time and part-time teachers in your school are certified? (If you share a teacher with another school, please count that teacher as part-time.)
Question 38 asked what percent of full-time and part-time teachers were certified. Then question 39 asked what percent of these teachers taught in their field of certification. Seven respondents (15 percent) did not report on part-time teachers in each of these questions. Four of these indicated that they had no part-time teachers in question 37. Coding these as legitimate skips, as would be done in the main study, reduces the nonresponse to 6 percent.
Question 40) What are lowest and highest annual salaries currently paid to full-time teachers on your school’s payroll?
The item nonresponse rate was 18 percent for each of the two parts of question 40, which asked the minimum and maximum salary currently paid to teachers at that school. No discernable pattern for the nonresponse was found. Income is a sensitive question in all surveys; it is possible school administrators in some schools do not have access to or are not allowed to provide that information or they may simply be unwilling to share that sensitive information.
Question 42) Does your school currently use any of these forms of teacher evaluation?
Teacher evaluation was the focus of question 42. For schools that have formal teacher evaluation systems in place, the administrator was to mark which types of teacher evaluations were performed: principal evaluation of teachers, teacher evaluation of teachers, and student evaluation of teachers. Approximately 14 percent of administrators failed to respond (yes/no) to teacher evaluation of teachers and student evaluation of teachers. One possible explanation is that these administrators mistook this for a “check one” or “check all that apply” item, since most marked the first row and left the other two rows blank.
Question 50) Indicate whether the minimum competency or proficiency test for graduation is given to students in each grade listed below. Do not include retesting of students. If the test is given, mark all subject areas that the test covers in that grade.
Question 50 was a multiple part question that asked about competency tests for each grade level (7th through 12th). The administrator first indicated whether a competency test is given for the particular grade and, if so, which subject areas it covers (math, science, English, history/social studies). The nonresponse rates were above the 12 percent threshold for both parts at every grade level. One problem with the question is that it asks about testing “for graduation,” for each grade level. RTI recommends the wording be altered to “for promotion or graduation” for the full-scale interview. For grades 7 and 8 the nonresponse rates were artificially high because many of the schools do not have these grades (based on the results to
Chapter 6 Analysis of School, Teacher, Library Survey and Facilities Results
118
question 3) yet failed to note that in the appropriate place for this question. Removal of these cases from the analysis results in an acceptable level of nonresponse to the first part; the nonresponse rates for the subject areas remained above the 12 percent threshold despite only one case of missing data because very few schools include these grade levels and administer competency tests to students in those grades. The nonresponse rates to whether a competency test was given ranged from 12 to 32 percent for grades 9 through 12, increasing with each successive grade. The reason for these high rates of nonresponse is unclear. The nonresponse to the subject area of the tests for grades 9 through 12 ranged from 15 to 65 percent. All of this nonresponse can be attributed to the nonresponse to the first part of the question, a filter that determined whether the subject area of the tests should be asked. (See chapter 5 for a more detailed discussion of the nonresponse to filter items inflating the rate of nonresponse to its dependent items.) If one were to assume that nonresponse to the filter question meant that the test is not given at the grade in question, resulting in a legitimate skip of the subject areas of the test, the nonresponse drops to 0 percent for all grades.
Question 51) Is competency testing a state, district, or school requirement?
Competency tests were also the focus of question 51 of the administrator interview. This question asked whether competency testing is a state, district, or school requirement, and provided yes/no response options for each. Nonresponse to the district and school requirement items was 12 percent. One possible explanation is that some administrators are not sure whether the testing is a district or a school requirement. Another explanation is that these administrators did not see the instruction to mark one response on each line and assumed they were to choose one (i.e., after marking “yes” to state requirement they proceeded to the next question).
Question 53) In the most recent test administration, what percentage of students taking the competency test failed (or were found to be below an acceptable level of proficiency in) any or all subject areas on their first attempt? (If your school has competency tests at multiple grade levels, report for the test given to the highest grade.)
Question 53 asked what percentage of students failed one or more subject areas of the competency attempt. Of the 33 cases to which this question applied, 12 percent did not respond. These cases do not show a pattern of nonresponse similar to other items in the questionnaire, although three of the four cases that failed to respond to this item also did not answer the earlier question of teacher’s salaries. Like the salary items, the competency test failure rate may be considered a sensitive question. Schools with high failure rates may have been reluctant to provide that information.
Question 59) During the 2000-2001 school year, at what times did your school regularly use paid law enforcement or security services at school?
The nonresponse rate to the question regarding the use of law enforcement or security services (question 59) at various times was quite low for all but the last item, “other” (which included space to specify what that other time was). The nonresponse rate was 68 percent for “other.” It appears that these schools had no other security but failed to mark the appropriate response.

Chapter 6 Analysis of School, Teacher, Library Survey and Facilities Results
119
Question 72) We are interested in how decisions are made at your school. The grid below contains decisions that are often made in the course of running a school. The grid also lists individuals or groups who often make these decisions. For each decision (a-h), please MARK ONE RESPONSE for each decision maker, indicating how much influence the decision maker typically has.
Question 72 asked about decision-making at the school. The question, to be answered by the principal, asked about a number of different types of decisions (e.g., hiring/firing, grouping students into classes, course offerings) and how much influence various people associated with the school (e.g., the principal, teachers, parents) had in making these decisions. This grid required a total of 48 responses (8 different decision rows by 6 columns of individuals/groups). The nonresponse rate was over the 12 percent threshold for nearly every item in the grid with the exception of the principal column. For this reason, and to reduce burden, it is recommended that this question be limited to the influence of the principal only in the full-scale questionnaire. This will allow room for the response labels to be placed above the “bubbles” rather than forcing the respondent to refer to a coding legend. In addition, the long explanation is unnecessary and should be changed to “How much influence do you as a principal have on the following?”
The one item in the principal column with greater than 12 percent nonresponse was establishing policies and practices for grading and student evaluation, which had 14 percent nonresponse. Five of these six cases failed to answer this question of grading policies for any of the people/groups making decisions, suggesting that this was a difficult item for respondents to answer. Three of these six cases did not answer any of the items in the grid, and two of the three did not answer any items in this entire section of the interview (that was to be filled out by the principal).
Question 77) How would you characterize your school’s relationship with each of the following individuals or groups?
Question 77 asked the principal to indicate how cooperative the school was with various individuals, groups and communities. Only one of these items, teachers' association or union, had a rate of nonresponse over the 12 percent threshold. Six of the 44 school principals (14 percent) who were asked this question failed to respond. Three of these six skipped question 77 altogether.
6.1.2 Inter-item Consistency
Early on in the questionnaire, the administrator was asked to indicate all grade levels, from pre-kindergarten to 13+, his/her school served. This data should match the school's grade levels as reported in question 50. In this question, the respondent was asked about competency testing at each grade level from 7 to 12. If the school did not have one of these grades, the administrator would mark the "School does not have this grade" option and move on to the next.
There was perfect consistency in these reports for grades 9 through 12. However, there was some inconsistency in the grade 7 and grade 8 comparisons. Specifically, one respondent who initially did not select grade 7, later indicated that competency testing was given at this level. Likewise, two administrators provided inconsistent data for grade 8; first indicating that

Chapter 6 Analysis of School, Teacher, Library Survey and Facilities Results
120
the school did not include grade 8 and later reporting that competency testing was given in grade 8. It is likely that in these three instances, the schools did not serve these middle grades, but the administrator reported on competency testing system-wide.
6.1.3 Logical Consistency of Responses to Filter and Dependent Questions
The school administrator questionnaire contained 38 pairs of filter and dependent items. Overall, the routing directions appear to have been clear. All of the administrators who were directed to the dependent question navigated correctly for eighteen of the filter-dependent pairs; most other dependent questions were inappropriately skipped only once.
However, the findings suggest some ways to improve a few questions. Question 19 contained a series of filter and dependent items. For each vocational program or service listed, the respondent first indicated if it was offered in the school. If so, the administrator was supposed to indicate whether or not 10th graders were eligible for this program. Two of the 44 respondents (4 of the 48 administrators completed an abbreviated version of the questionnaire which did not contain question 19) systematically failed to answer the second part of the question when they had indicated that a particular vocational program or service was offered. Adding an arrow between the columns would be an improvement to this format.
At first glance, it appears that 4 of the 41 the administrators whose schools had content standards for academic subjects (question 45) did not report on the main source of the content standards in the following question. In fact, these respondents selected more than one source. Since multiple choices could not be stored in the single data field, no data was written to the data file for these cases. Therefore, RTI recommends allowing more than one answer to this question in the main study.
Finally, it appears that some of the administrators whose schools required a minimum competency test for graduation (question 49) failed to proceed to the follow-up question. Five of the 33 eligible administrators did not indicate whether their school had a 7th grade or if a competency test was offered in that grade. However, all of these administrators completed some part of the grid of items. Therefore, the routing instructions worked properly. However, this question would be improved by instructing the respondents to mark the "school does not have this grade" indicator if it applies.
6.2 Teacher Survey Responses
6.2.1 Item nonresponse Analysis
The following analysis of item nonresponse is based on data from 453 teacher questionnaires. Using the following formula, the rate of nonresponse for each item on the teacher questionnaire was calculated to help identify problematic questions:
Number of illegitimate skips(# questionnaire respondents - # legitimate skips)

Chapter 6 Analysis of School, Teacher, Library Survey and Facilities Results
121
All items that have the greatest relevance to key educational issues, and are therefore recommended for the full-scale study, but have relatively high nonresponse rates (12 percent or greater) are discussed in detail. Table 6-2 lists these items. The causes of the missing data were explored and modifications are recommended as necessary.
The first part of the questionnaire asked teachers to evaluate each student on their list individually. Most teachers had only one or two students on their list while a few had twenty-five or more (mean=4.1, median=2.0, mode=1). Therefore, the nonresponse rates for items pertaining to the 5th to 32nd student on teachers' lists are based on a very small number of cases. For these items, just a few illegitimate skips push the nonresponse rate over the 12 percent threshold. Therefore, the following discussion excludes items from the first part of the questionnaire that were asked of fewer than fifty teachers.
Table 6.2.—Item nonresponse on ELS:2002 field test teacher questionnaire
Variable Variable label NDon't Know
(%) Missing
(%) Total(%)
9AA Parent 1 Level Of Involvement 450 35.6 3.3 38.9 9BA Parent 2 Level Of Involvement 307 38.1 2.9 41.0 9CA Parent 3 Level Of Involvement 224 32.1 3.1 35.3 9DA Parent 4 Level Of Involvement 168 29.8 5.4 35.1 9EA Parent 5 Level Of Involvement 139 41.7 2.2 43.9 9FA Parent 6 Level Of Involvement 115 43.5 5.2 48.7 9GA Parent 7 Level Of Involvement 96 36.5 2.1 38.5 9IA Parent 9 Level Of Involvement 69 27.5 5.8 33.3 9JA Parent 10 Level Of Involvement 60 41.7 3.3 45.0 20DB Spoke To Studnt 4 Counslor-Re Behavior 90 - 12.2 12.2 20EB Spoke To Studnt 5 Counslor-Re Behavior 68 - 13.2 13.2 20FB Spoke To Studnt 6 Counslor-Re Behavior 55 - 12.7 12.7 20GA Spoke To Studnt 7 Counslor-Perfrmance 62 - 12.9 12.9 23GD How Well Stdnt 7 Expresses Thoughts 53 - 13.2 13.2 61AA Tchr^S Hispanic Background 49 - 57.1 57.1 66AA Years Taught Total K-12 453 - 54.8 54.8 66AB Years Taught At Elementary Level 453 - 74.8 74.8 71AB Bachelor^S Degree Minor 439 - 34.9 34.9 72AA Graduate Degree Major 224 - 14.3 14.3 72AB Graduate Degree Minor 209 - 56.5 56.5 73AA Undergraduate Courses Taken In Subject 453 52.8 7.5 60.3 73BA Graduate Courses Taken In Subject 453 24.5 24.7 49.2 83AA Additional Ft Jobs Related To Education 84 - 20.2 20.2 85AA Additional Pt Jobs Related To Education 164 - 15.2 15.2
Only two questions in Part I repeatedly had high nonresponse rates; question 9 and question 20.
Question 9) How involved are the parents of this student in his/her academic performance?
The nonresponse rates for this item across the first ten students ranged from a low of 33 percent to a high of 45 percent. Almost all of the nonresponse is accounted for by teachers’ reports that they did not know how involved a student's parents were in his/her education. Very few teachers (2 percent to 6 percent) skipped the items. "Don't know" responses are informative in that they provide insight into the parent-teacher relationship, or lack thereof.

Chapter 6 Analysis of School, Teacher, Library Survey and Facilities Results
122
Question 20) Have you spoken to a guidance counselor or another member of the school staff this school year about the following? a) Student's poor academic performance, b) Student's disruptive behavior in school
The nonresponse rates for these items only rise above the 12 percent threshold when the number of eligible teachers drops below one hundred. Then the nonresponse rates hover between 12 and 14 percent. It may be that some teachers did not notice the legend for the "not necessary" response option. Without this guidance, they may not have been sure how to answer. For the main study, ELS staff recommends making this key more prominent.
Question 61) Which one of the following best describes your background? [applies to Hispanic (or Latino/Latina) respondents]
This is part of a series of questions about race and ethnicity that follows the guidelines set by the federal government. All of the self-reported Hispanic teachers (question 60) followed through and answered this more specific question about their Hispanic origin. Therefore, all of the teachers counted as non-respondents for question 61 are ones who also skipped the filter question. An estimated 95 percent of these teachers are not Hispanic (since roughly 95 percent of the teachers who did respond to the filter question were not Hispanic), and therefore, should have been counted as legitimate skips. Following these assumptions, the true rate of nonresponse is estimated to be roughly 8 percent.
Question 63) Which one of the following best describes your background? [applies to Asian respondents]
Only one teacher identified himself as Asian in question 62. This respondent followed the directions correctly and answered question 63. However, nineteen teachers skipped both the race question and this follow-up question for Asian respondents. The actual nonresponse rate depends on whether these teachers should have answered question 63. Given that only a tiny fraction of the responding teachers were Asian, most if not all of these 19 non-responding teachers legitimately skipped this dependent question. Therefore, the true nonresponse rate is quite small.
Question 66, Items a and b) Counting this year, how many years in total have you taught (at either the elementary or secondary level)? Please also note the number of years taught at each level.
Three-quarters of the teachers failed to indicate how many years of teaching experience they had at the elementary level. It is highly probable that these teachers had only taught at the secondary level. Rather than writing in "00" they left the fields blank. Apparently they also assumed that they did not need to report total years of experience given that they had only taught at the one level.For the main study, RTI suggests instructing respondents to write in "00" if they had never taught at the elementary level. (See 6.2.2 for further discussion of this question).

Chapter 6 Analysis of School, Teacher, Library Survey and Facilities Results
123
Question 71, Items a and b) What were your major and minor (or 2nd major) fields of study for your bachelor's degree?
It appears that many teachers with two majors at the undergraduate level marked both in one column and skipped the "Minor/2nd major" column. These skips explain some of the missing data for the minor field of study, but there are other factors as well. Multiple marks again account for a good part of the missing data for minor, although to a lesser extent. It is also likely that many respondents who did not have a minor or 2nd major neglected to darken the "Does not apply" response option. For the main study, RTI recommends collecting both majors selected in the "Major" column and storing one in the "Minor/2nd major" field.
Question 72, Items a and b) What were your major and minor (or 2nd major) fields of study for your highest graduate degree?
The graduate level major is missing from the data for 14 percent of eligible cases.Roughly 20 percent of this missing data is the result of multiple marks. It is unclear how to account for the remainder. It is possible that the list of majors was not comprehensive enough. Therefore, RTI recommends expanding the selection of majors to incorporate those most frequently noted in the "other specify" field.Several factors contribute to the rate of nonresponse for the graduate minor/2nd
major. As indicated above, some respondents marked both fields of study in the "major" column and probably skipped this second column. Also, given the rigor of many graduate programs, second majors and minor concentrations are less common than at the undergraduate level. Therefore, it is likely that the majority of the nonresponse for the minor/2nd major field of study is due to teachers skipping this column rather than choosing the "Does not apply" response option.
Question 73, Items a and b) How many undergraduate and graduate courses have you taken in the subject area of the class(es) you teach the students named on the enclosed list? If none, mark "00."
There are two flaws that contributed to the high rates of nonresponse for these questions. First, a large proportion of teachers did not remember how many undergraduate and graduate courses they had taken (53 percent and 25 percent, respectively). The open-ended response format makes this question more cognitively challenging. While teachers may not remember precisely how many courses they took, they are more likely to be able to choose a numeric range within which their course-taking falls. Another concern is that a quarter of the teachers skipped the part of the question about graduate courses altogether. It appears that teachers whose highest degree was a bachelor's degree assumed that this part of the question did not pertain to them. The data reveals that over a third (37.4 percent) of those whose highest degree was a bachelor's degree or less skipped this second part whereas only 6.6 percent of those with higher degrees failed to answer. Given these findings, RTI recommends that categorical response options be provided for respondents. One of these responses should be "none."

Chapter 6 Analysis of School, Teacher, Library Survey and Facilities Results
124
Question 83) Is this full-time work related to the field of education?
A teacher's candidacy for this question depends on whether he/she holds a full-time job in addition to his/her duties at the school. Only 84 teachers (15.6 percent) reported that they do. However, another 16 did not answer this filter question. The nonresponse rate reported in table 6-2 assumes that all of these 16 teachers held a full-time job and, therefore, inappropriately skipped question 83. This calculation most likely overestimates the true rate of nonresponse since the majority of teachers do not hold an additional full-time position. Assuming momentarily that all of these 16 teachers legitimately skipped question 83, RTI finds that the nonresponse rate falls to a mere 1.5 percent. The actual rate of nonresponse is probably only slightly more than this low estimate.
Question 85) Is this part-time work related to the field of education?
Almost all of these non-respondents also did not answer the filter question. Removing these cases from the analysis causes the rate of nonresponse to drop from 15 percent to 1 percent. Since two-thirds of reporting teachers indicated that they did not have a part-time job, it is likely that more than half of the non-respondents also did not. Therefore, it can be deduced that the true rate of nonresponse falls in the lower half of the range.
6.2.2 Inter-item Consistency
Teachers were asked how many years they had taught altogether (at either the elementary or secondary level), and how many of those years of teaching were spent in their current school. It would be logically inconsistent for a respondent to report more years in their current school than they had taught in total. A cross tabulation of these data reveals that the questions were somewhat unclear.
Over half of the 453 teachers (54.7 percent) did not report the total number of years they had taught. Most of these teachers had only worked at the secondary level and therefore thought it would be redundant to report total years. What is more puzzling is that ten teachers wrote in zero in the total years field. Almost all of these teachers reported that they had worked in their present school at least one year however. This suggests that the instructions for entering total years of teaching were unclear. The heading over the entry boxes read "Total (K-12)." It appears that these ten teachers (and perhaps some of those who left the total years field blank) interpreted this as years taught at both the elementary and secondary level at the same time. RTI advises asking for the total years taught after asking for years as an elementary and secondary teacher.
6.2.3 Logical Consistency of Responses to Filter and Dependent Questions
There were fourteen sets of filter and dependent questions in the teacher questionnaire. The vast majority of teachers negotiated these easily. The percent of cases missing data for the first dependent question following the filter was less than 5 percent for twelve of these fourteen.

Chapter 6 Analysis of School, Teacher, Library Survey and Facilities Results
125
For the other two (questions 71 and 72), the rate of missing data was inflated by multiple marks (see the discussion of nonresponse to these items in 6.2.1). Removing the cases of multiple marks reveals that the percent of teachers who inappropriately skipped these questions about major fields of study at the undergraduate and graduate level was less than 5 percent.
6.2.4 Analysis of Teacher-Student Linkage
Twenty percent of the teachers (86 teachers) were selected at random and project staff reviewed their forms to verify that the code numbers and initials for the students assigned to them matched what the teachers entered on their form. A number of recurring mistakes were found:
No initials. Nine of the teachers in the sample (10.5 percent) failed to write the students’ initials on their form. Incorrect last name initial. For two students (out of 388 assigned to the 86 teachers selected, 0.5 percent), the code number and first name initial were correct but the last name initial was incorrect. Possible explanations are that the handwriting was unclear, the name was misspelled in our records or the teacher simply made a mistake. No code number. Two teachers (2.3 percent) failed to fill in the code number for their students.Incorrect code number – used student number. Four teachers (4.7 percent) misunderstood the coding system, coding the first student on his/her list as 01, the second as 02, the third as 03, etc. rather than using the code number assigned to those students. Incorrect code number – computer error. Due to a computer programming error where RTI provided a list with incorrect code numbers, teachers at two schools (3 teachers, 3.5 percent) entered the wrong code number on their forms. Incorrect code number – unknown reason. The code number was incorrect but the initials were correct for two students (0.5 percent) of the teachers sampled. The reason for this error is unclear. Missing student. Three teachers (3.5 percent) failed to include one or two students on their list. Possible explanations are that the students were not in their class (in which case the teacher did not follow instructions) or the list they received was incomplete. Extra students. One teacher (1.2 percent) evaluated more students than were assigned to him/her. Wrong column on form. Rather than placing the first student in their list in column 1 and so on, two teachers (2.3 percent) placed their students in the column that corresponded with the student’s code (e.g., placed student with code number 06 in column 6). This did not affect the data.
Of these problems, incorrect or missing code number for the student has the greatest negative impact, as data cannot be matched with a student. Since this is a vital piece of information, greater emphasis on the need for this information is recommended for the full-scale instructions and form. Furthermore, the format of the list of students provided to the teacher should be altered to eliminate, or at least reduce, the potential for entering the incorrect code number or using the wrong column on the form. Missing or incorrect initials (with correct code numbers) was a frequent problem and, while this does not invalidate the data, RTI also recommends stressing the importance of this piece of information in the full-scale study.

Chapter 6 Analysis of School, Teacher, Library Survey and Facilities Results
126
One additional problem that was noticed during quality control review was the misinterpretation of the instructions following question 2. The teacher form indicated that the teacher had taught the student in one semester but not the other and, according to the instructions, they should have proceeded to answer questions for that student but failed to do so.RTI recommends clarifying the instructions on the form for the full scale, perhaps adding “(i.e., if you marked “no” to both question 1 and question 2)”.
6.3 Library Media Center Survey
Forty-nine library staff members completed the library media center questionnaire. Three questions accounted for most of the items with nonresponse over the 12 percent threshold. The first of these (question 6) asked respondents to report on the kinds of employees on staff (e.g., state-certified library media specialists, paid library aides) and their time commitment to that position (i.e., four categories from full-time to less than half-time). If the respondent indicated that a certain type of employee was on the library staff, then he was instructed to write in the number of that type in each of the employment categories. All but one respondent completed this question, but many of those who did repeatedly committed two errors. About ten respondents neglected to mark "No" if they did not have a particular employee type on staff, leading to roughly a 20 percent nonresponse rate for the questions about whether state-certified teachers and other noncertified professionals were on staff. In addition, although respondents were asked to mark "00" if none of their staff members worked in a particular employment category, most simply entered the numbers for the employment categories that pertained to their staff and left the other fields blank. There were only three instances in which the respondent indicated that a particular type of employee was on staff and then left all four of the following employment category fields empty. For the main study, blank fields will be recoded to zero when at least one of the other employment category fields is filled with a response. Nonetheless, to lessen burden, it is recommended that three part-time categories be combined into one. Respondents will have fewer fields for which entering "00" is necessary and therefore, may be more inclined to do so.
Library staff members were also asked a number of questions about the availability of various technologies in their library media center (questions 11 and 12). Many of these items had very high nonresponse rates. Respondent fatigue is one explanation for this. The list contains 21 pieces of technological equipment and asks several questions about each one. Respondents may have grown weary of answering each and every question. Therefore, ELS staff recommends reducing the number of questions asked about each. The question about where the equipment is located was problematic for an additional reason. The intent was for respondents to indicate that the equipment was in the computer lab or elsewhere in the library media center. However, many respondents reported that a particular piece of equipment was located in both of these areas. Therefore, data was often lost due to multiple marks. If it is retained for the full-scale study, it is recommended that multiple responses be allowed for this question.
6.4 Facilities Checklist
The items on the facilities checklist worked well with a couple of exceptions. Based on a debriefing with the survey administrators, RTI advises modifying the facilities checklist in the following ways. As was noted in Chapter 3 (3.2.2.2), the survey administrators had difficulty

Chapter 6 Analysis of School, Teacher, Library Survey and Facilities Results
127
locating five unlocked and unoccupied classrooms. This became a time-consuming and burdensome endeavor for the survey administrators and sometimes involved school personnel. RTI recommends retaining question 5 for the main study, but only requiring the survey administrators to report on one classroom. The survey administrators requested further revisions to this question. Some SAs reported that some of the classrooms they observed did not have windows. Therefore, RTI recommends adding a "not applicable" response option for the items that pertain to windows. In addition, a number of the items asked about in this question and elsewhere on the checklist were not easily visible. Some survey administrators gathered this information from school personnel. RTI recommends removing these items so that RTI does not burden school staff nor receive potentially biased information.
The question about the school's parking lot(s) also posed some problems. Some survey administrators noted in the margins of question 7 that the school did not have a parking lot.Therefore, RTI recommends adding a filter for this question. There was also confusion about what to count as an entrance or exit. RTI recommends clarifying these terms by specifying that a driveway must connect to roads off school property to be considered an entrance or exit.

Chapter 6 Analysis of School, Teacher, Library Survey and Facilities Results
128
This page is intentionally left blank.

129
Chapter 7 Analysis of Parent Survey Results
7.1 Parent Survey Responses
7.1.1 Item Nonresponse Analysis
Parent data was gathered by two different modes. The primary means of data collection was a paper and pencil questionnaire sent to the parent's home. In addition, a parallel computer assisted telephone interview (CATI) instrument was developed to follow-up with parents who did not return a completed questionnaire. A total of 853 parents responded to the parent component of ELS; 527 by questionnaire and 326 by telephone interview. Eleven of the 326 telephone interviews were abbreviated and have been excluded from subsequent analyses, leaving 842 parents.
This bimodal approach is relevant to the discussion of item nonresponse in two ways.Except in rare instances, the paper and pencil items did not provide respondents with "don't know" response options. Furthermore, while respondents were informed that they could refuse to answer any question and were reminded of this before particularly sensitive items by way of a note, an explicit "refuse" option was not provided on the questionnaire. Therefore, it is up to the data analyst to surmise whether a particular item's high rate of nonresponse is caused by either the parent's inability or unwillingness to provide the information. On the other hand, parents responding by telephone were able to tell the interviewer their reason for not answering a question. Table 7-1 provides a summary of how missing data is accounted for by mode in the following discussion of item nonresponse.
Table 7.1.—Types of nonresponse by mode of administrationDon't know Refuse Missing
Questionnaire Respondent chose "don't know" (only applicable to select questions)
Not an explicit response option
1) Respondent did not know (when "don't know" response option was not available); 2) Respondent refused to answer; 3) Respondent inadvertently skipped a question intended for them; or 4) Respondent did not complete questionnaire
CATI Respondent told interviewer that he/she did not know
Respondent told interviewer that he/she was not willing to answer
1) Respondent did not complete interview

Chapter 7 Analysis of Parent Survey Results
130
The nonresponse rate in Table 7-2 is divided into several categories; "don't know," "refuse," and "missing." As explained above, "don't knows” (with some exceptions) and refusals are only distinguished as such in the telephone interview data. Therefore, questionnaire respondents who left an item blank for either of these reasons are accounted for in the percent "missing." Missing data that is the result of an unfinished questionnaire or incomplete interview is also counted as "missing."
The rates of nonresponse reported in table 7-2 combine the rates for the questionnaire and interview. They were calculated using the following formula:
Number of illegitimate skips ________ _(# of questionnaire and interview respondents # legitimate skips)
The denominator for the nonresponse rate excludes cases for which the item does not apply (i.e., legitimate skip).
The discussion that follows focuses on questions that are suggested for the full-scale study based on their centrality to policy concerns. Table 7.2 lists each of these variables for which data is missing for at least 12 percent of parents.
Table 7.2.—Item nonresponse on ELS:2002 field test parent questionnaire
Variable Variable Label nDon't
Know (%) Refuse (%) Missing
(%) Total(%)
2 BIO/ADPT PARENT LIVES W/10TH GR AND R 42 0.0 0.0 14.3 14.3 4 PARTNER^S RELATIONSHIP TO 10TH GRADER 766 0.0 0.0 12.4 12.4
8A # LIVE W/TEEN - TEEN^S FULL/ADPT BROS 842 0.0 0.0 12.4 12.4 8B # LIVE W/TEEN - TEEN^S HALF BROTHERS 842 0.0 0.0 29.8 29.8 8C # LIVE W/TEEN - TEEN^S STEP BROTHERS 842 0.0 0.0 31.0 31.0 8D # LIVE W/TEEN - TEEN^S FULL/ADPT SIS 842 0.0 0.0 14.9 14.9 8E # LIVE W/TEEN - TEEN^S HALF SISTERS 842 0.0 0.0 30.6 30.6 8F # LIVE W/TEEN - TEEN^S STEP SISTERS 842 0.0 0.0 32.1 32.1 8G # LIVE W/TEEN - TEEN^S CHILDREN 842 0.0 0.0 27.2 27.2 8H # LIVE W/TEEN - TEEN^S GRANPARENTS 842 0.0 0.0 27.8 27.8 8I # LIVE W/TEEN - OTH RELATIVES UNDER 18 842 0.0 0.0 26.6 26.6 8J # LIVE W/TEEN -OTH RELATIVES 18 AND OVER 842 0.0 0.0 28.4 28.4 8K # LIVE W/TEEN - NON-RELATIVES UNDER 18 842 0.0 0.0 27.6 27.6 8L # LIVE W/TEEN -NON-RELATIVES 18 AND OVER 842 0.0 0.0 29.3 29.3 20 ASIAN ETHNIC BACKGROUND 70 0.0 0.0 45.7 45.7 23 NUMBER OF YEARS AGO MOTHER CAME TO U.S. 170 0.6 0.0 16.5 17.1 26 MOTHER^S OCCUPATN BEFORE COMING TO U.S. 170 2.4 0.0 10.0 12.4 28 NUMBER OF YEARS AGO FATHER CAME TO U.S. 180 8.9 0.0 14.4 23.3 31 FATHER^S OCCUPATN BEFORE COMING TO U.S. 180 4.4 0.0 16.7 21.1 35 GRADES 10TH GRADER COMPLETED OUTSIDE US 69 1.5 0.0 15.9 17.4 36 GRADE 10TH GR IN WHEN BEGAN SCHL IN U.S. 69 2.9 1.5 18.8 23.2
39A HOW OFTEN SPEAK NATIV LANG W/SPOUSE/PTNR 126 0.0 0.0 12.7 12.7 44B SPOUSE^S HIGHEST LEVEL OF EDUC COMPLETED 785 0.9 0.0 18.5 19.4 45B R^S FATHER^S HIGHEST LEVEL OF ED COMPLTD 842 8.1 0.6 5.5 14.1 45C SPOUSE^S MOTHER^S HIGHEST LEVL ED CMPLTD 787 10.2 1.0 18.0 29.2 45D SPOUSE^S FATHER^S HIGHEST LEVL ED CMPLTD 783 12.9 1.0 18.4 32.3 52 SPOUSE/PRTNR^S CURRENT WORK STATUS 160 0.0 0.6 56.3 56.9 53 SPOUSE/PRTNR EVER HELD REGULAR JOB IN US 153 0.7 0.7 56.9 58.2 54 SPOUSE/PARTNER^S CURRNT/MOST RECENT JOB 751 0.1 0.0 13.2 13.3
56A DID 10TH GRADER ATTEND DAY CARE PROGRAM 842 1.8 0.0 12.0 13.8 56B DID 10TH GRADER ATTEND NURSERY/PRESCHOOL 842 1.7 0.1 10.9 12.7 56C DID 10TH GRADER ATTEND HEAD START PRGRM 842 2.3 0.1 16.8 19.1 62A HELD BACK BECAUSE OF PARENTAL REQUEST 110 0.9 0.0 19.1 20.0 62B HELD BACK BECAUSE OF SCHOOL REQUEST 110 0.9 0.0 16.4 17.3 62C HELD BACK BECAUSE OF OTHER REASON 110 3.6 0.0 28.2 31.8
79A2 TEEN^S 2ND FRIEND^S FIRST NAME 842 0.2 0.0 16.3 16.5 79B2 2ND FRIEND ATTENDS SAME SCHOOL 842 0.0 0.0 14.3 14.3

Chapter 7 Analysis of Parent Survey Results
131
Table 7.2.—Item nonresponse on ELS:2002 field test parent questionnaire (continued)
Variable Variable Label nDon't
Know (%) Refuse (%) Missing
(%) Total(%)
79C2 R HAS MET 2ND FRIEND^S MOTHER 842 0.1 0.0 14.6 14.7 79D2 R HAS MET 2ND FRIEND^S FATHER 842 0.0 0.0 14.9 14.9 79A3 TEEN^S 3RD FRIEND^S FIRST NAME 842 0.1 0.0 27.9 28.0 79B3 3RD FRIEND ATTENDS SAME SCHOOL 842 0.1 0.0 26.7 26.8 79C3 R HAS MET 3RD FRIEND^S MOTHER 842 0.0 0.0 26.8 26.8 79D3 R HAS MET 3RD FRIEND^S FATHER 842 0.0 0.0 27.2 27.2 79A4 TEEN^S 4TH FRIEND^S FIRST NAME 842 0.1 0.0 43.2 43.4 79B4 4TH FRIEND ATTENDS SAME SCHOOL 842 0.4 0.0 41.9 42.3 79C4 R HAS MET 4TH FRIEND^S MOTHER 842 0.1 0.0 42.0 42.2 79D4 R HAS MET 4TH FRIEND^S FATHER 842 0.1 0.0 42.0 42.2 79A5 TEEN^S 5TH FRIEND^S FIRST NAME 842 0.0 0.0 54.0 54.0 79B5 5TH FRIEND ATTENDS SAME SCHOOL 842 0.2 0.0 52.6 52.9 79C5 R HAS MET 5TH FRIEND^S MOTHER 842 0.1 0.0 52.6 52.7 79D5 R HAS MET 5TH FRIEND^S FATHER 842 0.1 0.0 52.6 52.7 94B HOW OFTEN R E-MAILS TCHRS/STAFF ABT TEEN 735 0.1 0.0 32.9 33.1 94C HOW OFT R USES CMPTR-LEARN ABT SCH EVENT 735 0.1 0.0 32.0 32.1 94D HOW OFT R USES CMPTR-COMPLAIN ABT POLICY 735 0.1 0.0 34.3 34.4 94E HOW OFT R USE CMPTR-TELL SCHL CLASSES 735 0.1 0.0 35.1 35.2 94F HOW OFT R USES CMPTR-GET INFO ON HOMEWRK 735 0.0 0.0 34.4 34.4 95 DOES SCHOOL HAVE VOICE-MESSAGING SYSTEM 842 23.2 0.0 1.3 24.5
97H SCH PREPARING STUDENTS WELL FOR JOBS 842 10.7 0.1 2.4 13.2 97K PARENTS HAVE ADEQUATE SAY IN SCHL POLICY 842 13.8 0.2 2.4 16.4 97L PARENTS WK TOGETHR SUPPORTING SCH POLICY 842 13.4 0.2 2.0 15.7 97P DRINKING ON SCHL GROUNDS IS A PROBLEM 842 12.0 0.1 1.9 14.0 97Q DRUG USE ON SCHL GROUNDS IS A PROBLEM 842 14.5 0.5 2.0 17.0 97R SALE/USE OF DRUGS ON WAY TO SCHL IS PROB 842 17.6 0.5 1.5 19.6 97S THEFT ON SCHL GROUNDS IS A PROBLEM 842 15.7 0.4 2.0 18.1 97U LACK OF DISCIPLINE IN CLASS IS A PROBLEM 842 10.1 0.1 2.0 12.2 104 MONEY R SET ASIDE FOR TEEN^S FUTURE ED 434 7.1 7.1 17.3 31.6
Question 2) Does one or both of your tenth grader's biological or adoptive parents live in the same household as you and your tenth grader?
This question is one of an opening series of questions that has not previously been used in the NCES high school cohort studies. This series of several questions help the respondent identify and specify the person referred to as the "spouse/partner" throughout the rest of the questionnaire or interview. This item's nonresponse rate is misleading. In the filter question, a mere 3.4 percent of those who indicated that they were the tenth grader's grandparent, relative, or guardian. Every one of these respondents answered this follow-up question; a 0 percent nonresponse rate. However, six people skipped both the filter and this dependent question. Given that the vast majority of those who answered the opening question were the tenth grader's biological, adoptive, step-, or foster parent, it is highly likely that most, if not all, of the six cases which were counted as illegitimate skips were in fact legitimate.
Question 4) What is your spouse/partner's relationship to the tenth grader named on the front cover? Please use a definition of "spouse/partner" for your family situation as instructed in Question 2 or Question 3.
The majority of the parents who skipped this question reported in the previous one that they did not have a spouse or partner. As the questionnaire is designed, these parents should have marked "does not apply" in this question. Recoding

Chapter 7 Analysis of Parent Survey Results
132
these as legitimate skips, as would be done in the main study, drops the rate of nonresponse to 2 percent. For the main study, RTI recommends routing these parents around question 4 to reduce their burden.
Question 8, Items a-l) How many of the following people live in the same household with the tenth grader named on the front cover of the booklet? Do not include: yourself, your spouse/partner (as defined in Question 2 or 3), or the tenth grader named on the front cover.
Only parents completing a paper and pencil questionnaire skipped these items. Those who were interviewed by telephone always answered. Comparing the questionnaire and interview frequencies suggests that questionnaire respondents were skipping an item when zero was the appropriate answer. For example, 51 percent of CATI respondents reported that their tenth grader did not have any full or adoptive brothers living in the same household as compared to only 37 percent of parents who returned a questionnaire. Yet an additional 20 percent of this latter group of parents skipped the question. RTI recommends instructing questionnaire respondents to mark "0" if applicable.
Question 20) Which one of the following are you? [applies to Asian respondents]
Almost all of these non-respondents also neglected to identify with a racial category in the filter question. Only one respondent (2.6 percent) who reported that he/she was Asian failed to specify his/her origin in this follow-up.
Questions 23 and 28) How many years ago did she/he [tenth grader's biological mother/father] come to the United States to stay?
These questions' dependency on filters accounts for some of their high rates of nonresponse. However, the majority of the parents who were missing data for these questions previously reported that their tenth grader's biological mother or father was born outside the United States (57.1 percent and 76.9 percent, respectively). The response format may have caused confusion. It appears that a number of these parents wrote their answer in the boxes, but did not mark the corresponding numbers in the columns below. Because the scanner only read data from the columns, the handwritten numbers were not recorded. Since this response format is so error prone, RTI recommends against its use in the full-scale study.
Questions 26 and 31) What kind of work did your tenth grader's mother/father do most recently before coming to the United States?
It is likely that self-coding an occupation was a difficult and cumbersome task for immigrant respondents who may have had limited English skills. Therefore, to lessen the burden on these parents in the main study, RTI recommends collecting open-ended responses.

Chapter 7 Analysis of Parent Survey Results
133
Question 35) What grade(s) has your tenth grader completed outside the United States?
Like all dependent questions, the calculated nonresponse rate is inflated by the inclusion of parents who did not answer the filter question in the count of illegitimate skips. In this case, removing those uncertain cases from the analysis reduces the rate of nonresponse to an acceptable 3.4 percent.
Question 36) What grade was your tenth grader placed in when he/she started school in the United States?
This question elicited a few "don't know" and "refusal" responses in the CATI interviews. Therefore, it is likely that some of the missing questionnaire data can also be attributed to parents' inability or unwillingness to provide the information. Since this is a dependent question, the reported rate of nonresponse may also be somewhat inflated by the assumption that parents who skipped the filter question on the paper and pencil questionnaire had a student who attended school outside the United States. Only 5.1 percent of the parents who reported that their tenth grader attended school outside the United States failed to answer this question.
Question 39, Item a) How often is the language referred to in Question 38 used with your partner/spouse?
Of the 16 parents who left this question unmarked, four did not indicate if English was their native language so their eligibility for this dependent question is uncertain. Of the remaining 12, nine indicated in the first series of questions that they did not have a spouse or partner (as defined by ELS). Therefore, these respondents legitimately skipped the question, but failed to mark the "does not apply" response option.
Question 44, Item b) What is the highest level of education you and your spouse/partner have completed? REMINDER: Use "spouse/partner" definition from Question 2 or Question 3.
Almost two-thirds of the non-responding parents had indicated in question 3 that they did not have a spouse or partner. Therefore, if these parents had marked "does not apply" as appropriate, they would have been removed from the calculation of item nonresponse. Doing so decreases the percent missing to 7.4 percent. In addition, 30 respondents chose multiple levels of education (e.g., each level achieved rather than the highest only). Recording the highest level selected, as RTI recommends for the main study, reduces the percent missing to a mere 3.0 percent and the total nonresponse to 4.0 percent.
Question 45, Items b-d) What is the highest level of education your parents and your spouse/partner's parents completed? REMINDER: Use "spouse/partner" definition from Question 2 or Question 3.
This is the first time this question has been used in a NCES high school cohort study. It promises to advance research on intergenerational socio-economic mobility. A sizeable portion of the nonresponse is accounted for by the fact that

Chapter 7 Analysis of Parent Survey Results
134
many respondents simply did not know the highest level of education completed by their own parents or their spouse/partner's parents (ranging from 4.6 percent for respondent's mother to 13 percent for spouse's father). In addition, a handful of interviewees refused to answer each part. The percent missing is reasonably low for the respondent's father, but much greater for the spouse's parents. Once again, RTI finds that many respondents who did not have a spouse or partner neglected to mark "does not apply." Throwing out these cases, the percent missing decreases to 6.9 percent for spouse's mother and 7.4 percent for spouse's father. Finally, replacing multiple marks with the highest level of education reduces the rates by another 1 percent.
Questions 52-54) Series of questions about respondent's spouse/partner's employment
If all questionnaire respondents who did not have a spouse or partner had selected "does not apply" in the filter question for this series (question 51), the rates of nonresponse would have been significantly lower. Of the 88 parents who skipped this filter, 79 indicated earlier that they did not have a spouse or partner. By recoding these 79 cases as legitimate skips, the percent of non-responding parents falls to 1.3 percent, 13.6 percent, 10.8 percent, and 2.8 percent, respectively.Although the rates for questions 52 and 53 remain undesirably high, they are most likely overestimated. In fact most of the parents who skipped the filter probably would have reported that their spouse/partner was working at least part-time.
Question 56, Items a-c) Did your tenth grader attend any of the following pre-first-grade programs? a. Day care program, b. Nursery or preschool, c. Head Start
Although between 10 percent and 20 percent of parents skipped each of these three items, only 3 parents (0.4 percent) left all four parts of the question, a through d, blank. Nearly all of the parents who partially completed the question only checked a response to an item if the answer was "yes." Other multiple part questions like this that worked well had every other row shaded. This is the only formatting difference. Therefore, RTI recommends consistently shading every other row for questions with multiple items.
Question 62, Items a-c) Was your tenth grader held back a grade because of…a. parental request, b. school request, c. other reason?
The very high rates of nonresponse for these items are in part explained by nonresponse to the filter question. However, a larger contributor was the fact that the items were not shaded. As in question 56, this seems to have led respondents to check only the items that were true for them. If the answer was "no," they simply skipped the item. This reinforces the importance of shading to distinguish each item and to make each response option stand out.
Question 79, Items a-d) For up to 5 of your tenth grader's close friends, please indicate the following: a. Friend's first name (or nickname) b. Does this friend attend the same school as your tenth grader? c. Have you met this friend's mother? c. Have you met this friend's father?

Chapter 7 Analysis of Parent Survey Results
135
About 92 percent of the parents answered each of these questions for at least one of their tenth grader's friends. With each additional friend, the percent of parents reporting drops to 85 percent, 73 percent, 58 percent, and 47 percent. Parents were not required to identify five close friends so those who did not were not improperly skipping questions. However, RTI recommends reducing the number of friends to three given the severe attrition.
Question 94, Items b-f) How often do you use a computer whether at home or at work or in another setting in the following ways?
Just over 100 parents reported that they did not have access to a computer in any setting and legitimately skipped the rest of this question. Roughly a third of the remaining parents did not mark this embedded filter (indicating by default that they did have access to a computer) and the series of dependent questions. As pointed out elsewhere in this report, the design of these embedded filter questions is flawed. Specifically, moving from left to right, the respondent first sees the check box, then the filter statement followed by a bold arrow with instructions to skip to the next question. It would be very easy for a parent to forget to return to mark the check box before skipping forward to the next question. Consequently, it may be that RTI has an underestimate of the number of parents who do not have a computer available for use.
Question 95) Does your tenth grader's school have a voice-messaging system that you can call for information about school events, activities and programs, or leave messages for your tenth grader's teachers, school administrator or other staff?
Very few parents skipped this question, but almost a quarter indicated that they did not know if their tenth grader's school had a voice-messaging system. This is not a surprising result given that many schools do not have this equipment. However, it also provides useful information about parents’ efforts to be informed of all school-parent communication systems available to them.
Question 97, Items h, k, l, p, q-s, u) How much do you agree or disagree with each of the following statements concerning your tenth grader's school?
A "don't know" response option was provided for each of these items on the questionnaire. The bulk of the nonresponse for these items falls in this category. For these cases, the parent's assessment of the school on these dimensions was not captured, but something equally valuable was learned. Specifically, the parent's awareness, or lack thereof, is measured. A mode effect emerges when comparing the questionnaire and CATI data. On all items, the proportion of questionnaire respondents choosing "don't know" was two to three times greater than the proportion of interviewees doing so. For the full-scale study, RTI recommends reading "don't know" as a response option for CATI respondents to minimize this mode effect.

Chapter 7 Analysis of Parent Survey Results
136
Question 104) About how much money have you set aside for your tenth grader's future educational needs?
This question was unanswered by almost a third of the parents who indicated that they had done something specific in order to have some money for their tenth grader's education after high school (question 82). Seven percent of the parents told the interviewer that they did not know, seven percent declined to answer the interviewer, and 17 percent left the boxes blank on the hard copy questionnaire.Changing this from an open-ended item to a categorical one would make this question less cognitively challenging and less sensitive.
7.1.2 Inter-item Consistency
Parents were asked how many siblings the tenth grader has in two ways. A roster was used to count the number of various relatives, including adoptive, half-, and step-brothers and sisters, living in the same household with the tenth grader. Parents also reported the total number of siblings, including those who did not share a home with the tenth grader. Many students have older brothers or sisters who have moved out or half- or stepsiblings who live with another parent. Therefore, the total number of siblings may be greater than the number who live with the 10th grader. However, the converse is false.
For the most part, parents' responses were logical. Of the 657 respondents who answered both questions, 96.0 percent reported the same number or fewer co-resident siblings than the total number. For the problematic questionnaire cases (n=9), the source of the error is unknown.Given the very high rate of consistency and the random nature of the discrepancies, no revisions are recommended for these questions.
7.1.3 Logical Consistency of Responses to Filter and Dependent Questions
Filter and dependent questions may introduce error in data gathered from self-administered questionnaires because respondents may inappropriately skip a question intended for them or answer one for which they are not eligible. One benefit of CATI is that it removes this potential by selecting the appropriate questions for the respondent based on his previous responses. Therefore, analysis of the logical consistency of responses to filter and dependent questions in the parent data was limited to data collected by questionnaire (n=527).
The analyses investigated the prevalence of lost data due to inappropriate skips. The percent of parents who were missing data for the first dependent question following a filter despite being routed to it was calculated. Although a number of the first dependent questions were missing data for more than 5 percent of the eligible cases, misrouting was rarely at fault.
Five of the dependent questions with more than 5 percent nonresponse (questions 16 - 8.8 percent, 23 - 18.4 percent, 25 - 18.8 percent, 28 - 15.1 percent, and 30 - 22.5 percent) had a data entry field response format that requires a respondent to mark the number corresponding to the digit they wrote in the box at the top of the column. Unfortunately, many respondents appear to have written their response in the unscanned boxes, but neglected to mark the corresponding numbers below. Therefore, their answers were not recorded. RTI recommends changing the data entry format for the main study.

Chapter 7 Analysis of Parent Survey Results
137
Three dependent questions (58, 61, and 103) contain multiple items of which the first was skipped by 50.0 percent (3 of 6), 30.2 percent and 8.7 percent of the respondents, respectively.However, most of these errant respondents answered at least one of the items in these questions reducing the rates of inappropriate skips to 16.7 percent (1 of 6), 0 percent, and 1.2 percent.Focusing in on these cases reveals that these respondents were only marking those items for which their answer was "yes."
Finally, question 42, which asked Protestant respondents to classify their religious beliefs, was skipped by 7.8 percent of eligible parents. This may be in part due to the sensitive nature of the question. However, anecdotal reports from telephone interviews suggest that many people did not know how to classify themselves.
In summary, incompletely marked responses account for most of the missing data for dependent questions in the parent questionnaire data. Very few parents appear to have been misrouted. Therefore, the use of filter and dependent questions is appropriate for the main study.
7.2 Comparisons of Student and Parent Responses
Some questions were asked of both parents and students. This served two purposes, first to assess the reliability of the information collected and second to determine who was the better source for a given data element. These parallel items, discussed below, included number of siblings, use of a language other than English, and parent/child interactions. Additional items pertaining to parents’ occupation and education, asked in both the parent and student interviews, are addressed in the section on socioeconomic status.
Siblings. Parents and students were asked the number of siblings the 10th grader has, but the questions were asked quite differently. The parent interview asked for a total count of the 10th grader’s siblings including adoptive, half-, and step-brothers and sisters, regardless of whether they live in the same household. Item nonresponse was less than 0.4 percent for this item. The student interview asked a series of questions: whether the respondent has a twin brother or sister, how many older brothers and sisters (including adopted, step-, and half-) and how many younger brothers and sisters (including adopted, step-, and half-). The nonresponse for these items ranged from 16 to 25 percent.
These student interview sibling counts were added together and the result was compared with the parent’s response. Each item allowed responses of zero, one, two, three, four, five, and six or more, this final category making exact matches impossible to determine for those reporting six or more to any of the counts. Of the 499 cases that could be accurately matched, 208 (42 percent) agreed. Where they disagreed, the parent reported one more sibling than the 10th grader did 57 percent (167 out of 291 cases) of the time. It is not clear whether this high rate of disagreement is due to parents incorrectly including the 10th grader in their count of siblings, the inaccurate reporting of “blended” families, or the differences in how the questions are asked on the two interviews.
Language. Students whose native language is something other than English were asked how often (never, sometimes, about half the time, or always/most of the time) they speak their native language with each of their parents. Parents whose first language was not English were

Chapter 7 Analysis of Parent Survey Results
138
asked how often they speak their native language with their partner/spouse and child. Thus while it is possible to compare the frequency of language use between the parent who answered the questionnaire and the 10th grader, there is no direct question on the parent questionnaire about the other parent’s language use with the child. For this reason the item was only evaluated for the parent who answered the questionnaire. There were too few father/child pairs to analyze.Of the 64 mother/child pairs whose native language was not English, 36 (56 percent) had an exact match on the frequency with which they speak the language with each other. There are a couple of possible explanations why agreement is not higher: 1) the “sometimes” category may be too vague, or 2) the question in the parent questionnaire asks about language use with their child/children, not specifically the 10th grader (language use may vary from one child to another in the family).
Parent/student interactions. There was a series of questions in the student questionnaire that asked how often (never, sometimes, or often) the respondent discussed various academic-oriented issues such as course selection, class studies, college entrance exams, going to college, news events, and personal problems with one or both parents. A parallel set of items concerning frequency of providing advice or information to the 10th grader for each of these issues was asked of parents. Roughly two-thirds of the cases had responses from both the student and the parent to these items. Agreement was quite low for each of the items, ranging from 38 to 49 percent. Not surprising, however, parents reported greater frequency of interaction with their 10th grader on every issue except going to college.
7.3 Reliability of Parent Interview Responses
The temporal stability of a subset of items from the parent interview was evaluated through a reinterview, administered to a randomly selected subsample of 147 respondents. A total of 103 parents (70.1 percent) participated in the reinterview. Analyses were based on the 98 cases where the same parent responded to both the original interview and the reinterview. Of these 98, approximately 57 filled out a self-administered questionnaire for the original interview and responded by CATI in the reinterview; 26 percent were originally interviewed by telephone and filled out a self-administered questionnaire for the reinterview; and 15 were interviewed by telephone in both interview administrations. Sample sizes were too small to allow for analysis of mode effects.
The reinterview was designed to target items which were newly designed for the ELS:2002 interview or revised since their use in a prior NELS interview. The items selected were factual in nature, rather than attitudinal, and the responses, therefore, were expected to remain stable between the initial interview and the reinterview.
Reinterview respondents were contacted at least 2 weeks after completing the initial interview, and their responses in the initial interview and the reinterview were compared. Two measures of temporal stability were computed for all paired responses. The first, percentagreement, was based on an exact match between the two variables for categorical variables; for continuous variables, the two responses were considered to match when their values fell within

Chapter 7 Analysis of Parent Survey Results
139
one standard deviation unit of each other.1 The second measure evaluated the temporal stability using three relational statistics: Cramer’s V, Kendall’s tau-b ( b), and the Pearson product-moment correlation coefficient (r). The properties of the particular variable dictated which statistic to use. Cramer’s V statistic was used for items with discrete, unordered response categories (e.g., yes/no responses). Kendall’s tau-b ( b) statistic, which takes into account tied rankings,2 was used for questions answered using ordered categories (e.g., never, seldom, usually, always). For items yielding interval or ratio scale responses (e.g., amount of money saved for education), the Pearson product-moment correlation coefficient (r) was used.
Percent agreement and appropriate correlational analyses were used to estimate the response stability between the two interview administrations. Lack of agreement or low correlation between the interview and reinterview responses reflects instability over short time periods due to measurement error. To the extent this occurs, items need to be deleted or revised prior to administration in the full-scale interview. In contrast, high indices of agreement suggest
that interview responses were relatively free of measurement errors that cause response instability over short periods of time.
Effective sample sizes are presented for all results because analyses were restricted to cases with determinate responses for an item in both interviews. Sample sizes also vary due to the applicability of the item (e.g., religious affiliation items were asked only of those who indicated they were protestant). Results of the reliability analyses are presented in table 7.3.
Family composition. The overall temporal stability for items pertaining to family composition is high. Percent agreement is over 94 percent for all items. The relational statistic ranges from 0.86 to 0.99. Two parents apparently provided their 10th grader’s year of birth in the reinterview rather than their own (both were originally interviewed by telephone and the reinterview was self-administered); removing them from the analysis results in 98 percent agreement for that item.
1 This is equivalent to within one-half standard deviation of the average (best estimate of actual value) of the two responses.
2 c.f. Kendall, M. (1945). The treatment of ties in rank problems. Biometrika, 33, 88-93 and Agresti, A. (1984). Analysis of Ordinal Categorical Data. New York, NY: Wiley & Sons.

Chapter 7 Analysis of Parent Survey Results
140
Table 7.3.—Reliability indices for parent interview
Item description Number of
cases 1Percent
agreement 2Relational
statistic Family composition Parent has spouse/partner living in the same household 84 97.6 0.913
Spouse/partner’s relationship to 10th grader 79 94.9 0.883
Marital status 95 94.7 0.863
Birth year 95 95.8 0.994
Race Hispanic 97 97.9 0.933
White 92 96.7 0.923
Black or African American 92 100.0 1.003
Asian 92 100.0 1.003
Native Hawaiian or Other Pacific Islander 92 100.0 1.003
American Indian or Alaska Native 92 98.9 NA5
Other 92 95.7 0.503
Birthplace Mother’s (of 10th grader) place of birth 93 100.0 1.003
Father’s (of 10th grader) place of birth 95 98.9 1.003
10th grader’s place of birth 95 100.0 1.003
Religion Religious background 95 78.9 0.803
Conservative 54 70.4 0.413
Fundamentalist 54 94.4 0.743
Born-again 54 85.2 0.673
Pentecostal 54 100.0 1.003
Charismatic 54 98.1 NA5
Evangelical 54 88.9 0.353
Mainline 54 87.0 -0.073
Liberal and Progressive 54 92.6 0.633
None 54 87.0 0.313
Other 54 88.9 -0.063
Education Respondent’s highest level of education 85 76.5 0.864
Spouse/partner’s highest level of education 72 70.8 0.864
10th grader’s school experiences and family interaction Held back a grade 98 99.0 0.944
Behavior problem at school 96 95.8 0.593
Parent checks homework 98 60.2 0.564
Parent discusses report card with 10th grader 96 87.5 0.294
Parent knows where 10th grader is 98 89.8 0.634
Parent makes and enforces 10th grader’s curfew 97 79.4 0.034
Frequency of talking about school experiences 96 90.6 0.474
Frequency of dining with 10th grader 97 42.3 0.374
Future education of 10th grader Highest education level expected 94 68.1 0.734
Saved for higher education 91 80.0 0.603
Amount of money saved for higher education 30 96.7 0.886
Income Household income 90 74.4 0.884
1 Analyses were conducted only for respondents with determinate responses on both the initial interview and the reinterview; not all questions were applicable to all respondents.
2 This percentage reflects an exact match of the paired responses. 3 Cramer’s V relational statistic used. 4 Kendall’s tau-b relational statistic used. 5 Relational statistic not computed as reinterview item had fewer than two nonmissing levels. 6 Pearson product moment correlation coefficient, r relational statistic used. NOTE: Analyses are based on 98 respondents to the reliability reinterview.

Chapter 7 Analysis of Parent Survey Results
141
Race and ethnicity. The ELS:2002 field test interview included two, newly conceptualized, race-ethnicity items designed to address revised federal standards for maintaining, collecting, and presenting data on race and ethnicity.3 The new federal standards have two categories for data on ethnicity: "Hispanic or Latino," and "Not Hispanic or Latino." There are five categories for data on race: American Indian or Alaska Native, Asian, Black or African American, Native Hawaiian or Other Pacific Islander, and White. Additionally, the standards allow for the provision of multiple races; hence the self-administered questionnaire instructed respondents to mark all that apply.
The overall temporal stability for race and ethnicity items is high. Percent agreement is over 95 percent for all items. The relational statistic is 0.92 or greater for all except “other race” which has a relational statistic of 0.50. The reason for this low relational statistic relative to the percent agreement is that the majority (93 percent) of respondents said “no” during the interview and reinterview; however, two-thirds of those in the minority (“yes”) category reversed responses by the time of the reinterview.
Place of birth. Birthplace items asked whether the person in question was born in the United States, Puerto Rico, or in another country. Reliability indices for these birthplace items exhibit perfect agreement for two of the three items. The question asking about father’s birthplace has a percent agreement of 98.9 and a relational statistic of 1.00.
Religion. The first item in this series asked the respondent’s religious background (25 categories provided) and those who responded with a Protestant denomination were asked to describe their beliefs, marking all that apply.
Religious background has only marginally acceptable values, with 79 percent agreement and a relational statistic of 0.80. Some of the mismatches for religious background may be due to coding religion in one of the interviews under the “other Christian” or “other (non Christian)” categories when it was actually one of those listed (and chosen as such in their other interview).It is interesting to note that the majority of these mismatched “other” responses came out of the CATI reinterview (where the original interview was self-administered). CATI administration of this item was difficult due to the lengthy set of response options; it is possible that the telephone interviewers failed to recognize the correct category since the respondent did not have the list to choose from (as they did in the self-administered interview).
3 Standards for Maintaining, Collecting, and Presenting Federal Data on Race and Ethnicity. 1997. Federal Register, 62:210, 58788-58790. Washington, DC: U.S. Government Printing Office.

Chapter 7 Analysis of Parent Survey Results
142
“Conservative” religious beliefs have unacceptably low values of temporal stability. This may be attributed to the term “conservative” being rather loosely defined in religious circles, whereas many of the other belief items are not only clearly defined but also often included in the name of the religious denomination. The low relational statistics for “fundamentalist,” “evangelical,” “liberal/progressive,” and “none” are attributable to the unbalanced distribution of responses (i.e., few responded with “yes” and, of those who did, many reversed their response between the original interview and the reinterview). Likewise, the negative relational statistic for “mainline” and “other” is due to the lack of any stability of the infrequent “yes” response (i.e., no one responded with “yes” to both the original interview and the reinterview for these items).
Education. The education items collected the highest level of education for the respondent (parent/guardian of the 10th grader) and the respondent’s spouse or partner, if applicable. The overall temporal stability for these items is marginally acceptable. Percent agreement is 76 percent for the respondent and 71 percent for the respondent’s spouse. The relational statistic is 0.86 for both. The incongruity between question wording, which asked the highest level completed, and response options, which included levels that were not completion of a degree, may have contributed to the lower reliability of these items.
Likewise the difference between administration of the interview using CATI (where the respondent does not see the response options) and in hardcopy form may have had an effect. The difference in the way TELEform and CATI handle multiple responses may have also played a role. In the field test, TELEform did not record datum when multiple marks were scanned for a question allowing only one response. Instead, the ID number for these cases were recorded in a separate file. Since highly educated respondents are more likely to select more than one degree (since they have multiple degrees), they are under-represented in the questionnaire data. Furthermore, since most of these education level comparisons involved one questionnaire response, the data for this reliability analysis under-represents the more highly educated respondents. This bias may have contributed to the lower reliability of the responses to these education level questions.
School experiences of 10th grader. A number of questions were asked in the parent interview about their interactions with their 10th grader, and their 10th grader’s school experiences. Only one of these items, whether or not the 10th grader was held back a grade, has high levels of temporal stability with 99 percent agreement and 0.94 relational statistic. An additional four items, behavior problem, discusses report card, knows where 10th grader is, and frequency of talking about school experiences, have reasonably good percent agreement, ranging from 87 to 95 percent; however their relational statistics, ranging from 0.29 to 0.59, are poor.The remaining items, checks homework, makes/enforces curfew, and eats together, have poor to marginally acceptable percent agreement, ranging from 42 to 79 percent; their relational statistics are also poor, ranging from 0.03 to 0.56.
The reason for the low relational statistic (relative to percent agreement) for behavior problems is due to the instability of the infrequent “yes” response. The four items “check homework”, “discuss report card”, “know where 10th grader is” and “make/enforce curfews” were each asked with four response options of never, seldom, usually, always. An analysis of

Chapter 7 Analysis of Parent Survey Results
143
the cases where the interview and reinterview responses do not match show the majority (64, 92, 100, and 65 percent, respectively) changed from usually to always or vice versa. Changing these response options to “sometimes” and “always/almost always” may improve temporal stability. No similar pattern was found with never and seldom.
The question “In a typical week, how often do you eat at least one meal a day with your tenth grader” proved to have the lowest percent agreement of all items in the reinterview. The most consistent response, not surprisingly, is “7 days a week” (27 percent). The poor temporal stability of this item may be due, in part, to the greater number of response options (0 days per week to 7 days per week) as well as the difficulty in accurately estimating a typical week. It is possible that a “typical week” changed between the original interview and reinterview for some respondents due to seasonal extracurricular activities. Providing ranges for responses (e.g., two days per week or fewer, three to five days per week, six or seven days per week) is one possible solution for improving reliability of this item.
Educational expectations for 10th grader. Three items were asked regarding the future education of the 10th grader, namely how far in school the respondent wants his/her 10th grader to go, whether the respondent has done anything specific to have some money for the 10th grader’s education, and, if so, how much money had been saved for the 10th grader’s future education. The amount of money saved for the 10th grader’s future education has high temporal stability, while the other two items exhibit only marginally acceptable results. Percent agreement ranges from 68 to 97 percent, and relational statistics range from 0.60 to 0.88. For the question of how much education they desire for their 10th grader, there were 30 cases for which the two responses did not match; for 26 of those cases the mismatched responses were just one category higher or lower than the original.
Income. Income questions are typically among the most unreliable measures in interviews. In an attempt to overcome this problem, the ELS questionnaire collected family income using categorical ranges of amounts rather than requiring the respondent to enter an exact amount. Percent agreement shows marginally acceptable response stability over time at 74 percent. The relational statistic of 0.88 is quite good. Of the 23 cases where the two responses did not match, only 5 differ by more than one category, indicating that the two responses, while not an exact match, are close.
7.4 Socioeconomic Status
Parent Education and Occupation. Because parental occupation and education items contribute to a measure of socioeconomic status, which, in turn, is expected to be related to many of the outcomes assessed in ELS:2002, these questions are critical.
Past studies, including the NELS:88 field test, have shown high rates of nonresponse to parental education and occupation in the student data. It is expected that the tenth graders participating in the ELS:2002 field test would be better informed of their parents’ occupations and educational attainment (compared with the eighth graders interviewed in the NELS:88 field test), and therefore have lower rates of nonresponse.

Chapter 7 Analysis of Parent Survey Results
144
Occupation and education of both parents were asked in the ELS:2002 student interview.Occupation and education of respondent and respondent’s spouse/partner were asked in the parent interview. Nonresponse was indeed a problem for these questions in the student interview, with nonresponse rates of 9 to 18 percent. Nonresponse rates were under 2 percent for these items on the parent questionnaire, well within the acceptable range.
The occupation question differed slightly between the two versions, with the student interview asking what kind of work the parent does and the parent question asking for a description of the current or most recent job. Furthermore, the student questionnaire allowed the respondent to write in a description in the event that it did not fall into the categories listed while the parent questionnaire did not, making comparison of the “other” response ambiguous. Excluding cases with missing data, nonresponse, or “other” response on either interview, only about half of the parent occupation data could be matched with student data (447 out of the 806 cases [55 percent] for mother’s occupation and 369 [46 percent] for father’s occupation). Of these that could be matched, 52 percent were in agreement on mother’s occupation and 49 percent were in agreement on father’s occupation. These results are very similar to those of the NELS:88 base year interview.
The results for the education questions were marginally better. Of the 806 cases, 581 (72 percent) were eligible for matching on mother’s education, with 319 (55 percent) resulting in an exact match between the student and parent interview. Similarly, 475 cases (59 percent) met the criteria for matching father’s education, of which 255 cases (54 percent) were in agreement.
The critical nature of the SES variable and the data elements that contribute to it, combined with the lower rates of nonresponse and greater accuracy on the part of parents in providing this information, suggest implementing a sample design that maximizes the participation of parents for the full scale study.
Household items as a proxy for income. In ELS, as in NELS, the socioeconomic status (SES) index is a composite of five equally weighted, standardized components: father’s education, mother’s education, family income, father’s occupation, and mother’s occupation.Data from the parent survey are used to construct this variable and student data are substituted where parent data are missing. Because students are not reliable reporters of family income, it was critical to collect a proxy for income to substitute for missing parent survey income data.
Question 116 of the student interview was designed to be a proxy for family income. In this question, students were asked to identify which items (from a list) their family had in their home. The items were based on a similar question from the NELS:88 base year questionnaire, however the list was altered to drop technologically obsolete items (e.g., typewriter) and to include relatively new technology items (e.g., Internet access, DVD player, fax machine, digital camera).
Family income was asked in the parent questionnaire and an analysis was performed to determine which of the household items best correlated with income. The highest correlations, each with pr<0.0001, were dishwasher, Internet access, fax machine, computer, and daily newspaper, shown in table 7.4. Eight of the proxy items— encyclopedia, VCR, microwave oven, digital camera, specific place to study, washing machine, calculator, and dictionary—had

Chapter 7 Analysis of Parent Survey Results
145
poor correlation with income (pr>.01); RTI therefore recommends excluding these items from the full scale questionnaire. It is interesting to note that five of these eight items with poor correlation (dictionary, washing machine, microwave oven, VCR, and calculator) were reported in homes of a very high percentage of students (greater than 92 percent), indicating that these items are quite common and thus are not good indicators of socioeconomic status.
Table 7.4.—Correlations of socioeconomic proxy items with family income Socioeconomic proxy item Point biserial correlation Prob > |R| Specific place to studya 0.06928 0.0967 Daily newspaper 0.19899 0.0001 Regularly received magazine 0.14674 0.0004 Encyclopediaa 0.02885 0.4906 Computer 0.20234 0.0001 Dictionarya 0.10422 0.0125 Internet access 0.26395 0.0001 DVD player 0.14398 0.0006 Electric dishwasher 0.30997 0.0001 Clothes dryer 0.13060 0.0018 Washing machinea 0.08241 0.0494 Microwave ovena 0.03763 0.3711 More than 50 books 0.12740 0.0024 VCRa 0.03596 0.3932 Pocket calculatora 0.09944 0.0180 Room of your own 0.15266 0.0003 Fax machine 0.24308 0.0001 Digital cameraa 0.04849 0.2490 aDenotes items recommended for exclusion from the full scale questionnaire. SOURCE: U.S. Department of Education, National Center for Education Statistics, Education Longitudinal Study:2002 (ELS:2002).

Chapter 7 Analysis of Parent Survey Results
146
This page is intentionally left blank.

151
Appendix A Field Test and Main Study Sampling Specifications

Appendix A—Field Test and Main Study Sampling Specifications
152
This page is intentionally blank.

153
Education Longitudinal Study:2002(ELS:2002)
Sampling Specifications
Prepared by:
Research Triangle Institute P.O. Box 12194
Research Triangle Park, NC 27709

Appendix A—Field Test and Main Study Sampling Specifications
154

Appendix A—Field Test and Main Study Sampling Specifications
155
I. INTRODUCTION
The ELS:2002 field test will allow RTI and NCES to evaluate some of the sample design features that we plan to implement in the ELS:2002 base year sample design. These sampling specifications provide details of the field test sample design, as well as a preliminary sample design for the base year full-scale study. As mentioned throughout this document, we will evaluate certain design features before finalizing the base year sample design. Section IIcontains details of the field test sample design, Section III contains the full-scale sample design, Section IV contains weighting plans for the full-scale study, Section V contains our plans for freshening the sample and weighting in the first follow-up, and Appendix A contains details of the school and student sampling.
II. FIELD TEST SAMPLE
A. School Frame and Sample
We plan to use NCES’ 1997-98 Common Core of Data (CCD) as the public school sampling frame and 1997-98 Private School Survey (PSS) as the private school sampling frame. The CCD provides a very complete list of public schools. Since the CCD and PSS data files have been used as school frames for a number of other school-based surveys, it is particularly advantageous to use these files in ELS:2002 for comparability and standardization across NCES surveys.
The survey population for the ELS:2002 field test consists of 10th and 12th graders enrolled in schools in New York, California, Florida, Illinois, or North Carolina in
regular public schools, including State Department of Education schools and
Catholic and other private schools.
We will delete the following types of schools from the school sampling frame:
Schools not in New York, California, Florida, Illinois, or North Carolina. We will use state FIPS code to identify state because this code is the state in which the school is located as opposed to the state in the mailing address. Location state and mailing address state are different for several schools.
Schools which do not have both 10th grade and 12th grade (See Section II-C). We will use the low grade and high grade indicators to identify such schools.
Ungraded schools. If the low grade and high grade indicators are both ‘UG’ or ‘00’, then we will classify the school as ungraded.
Schools with a large enrollment which we are likely to select with certainty in the full-scale study. See discussion below.
Bureau of Indian Affairs (BIA) schools. On the CCD, several of the BIA schools have BIA appended to the school’s name. We also have a list of BIA schools from the BIA Office of Indian Education Programs website. We will manually

Appendix A—Field Test and Main Study Sampling Specifications
156
match this list to the CCD by school name to identify the BIA schools on the CCD.
Special education schools. We will classify schools as such if the indicator of school type is special education.
Area vocational schools that do not enroll students directly. We will classify public schools as such if the indicator of school type is vocational and total enrollment is zero.
Department of Defense (DOD) schools. We will identify these schools using the state FIPS code = 58.
Closed public schools. We will identify closed public schools using the status code on the CCD. We cannot identify closed private schools on the PSS.
If enrollment information is unavailable on the sample frame for 10th or 12th grades or for the race/ethnicity enrollments, we will impute the appropriate enrollment using the median value of the enrollment for that grade or race/ethnicity for the appropriate school stratum.
We will select a sample of 50 schools enrolling 10th and 12th grade students from the states of New York, California, Florida, Illinois, and North Carolina. Some of the largest and most politically important school systems are in these states. In addition, this mix of states represents regional variations that may be important in a national study, and offers schools that will allow us to represent considerable sociodemographic heterogeneity in our field test sample. Having schools in North Carolina will allow RTI to easily observe field test surveys nearby and therefore learn more from the field test. Schools in these states will provide an excellent opportunity to test our methods and procedures in a realistic operational environment.
We will select the sample in such a way as to not harm the full-scale sample. First, as mentioned above, we will exclude schools with a large enrollment which we are likely to select with certainty in the full-scale study. To determine these schools, we will form a sample frame similar to the one that will be used in the full-scale study, compute each school’s composite measure of size (MOS), and determine which schools we are likely to select with certainty based on this MOS.
Second, we will design the field test sample such that schools we select for the field test will not be in the full-scale sample. For the field test, we will select a stratified simple random sample of schools using strata similar to those we will use in the full-scale study.1 This sample will be about twice as large as necessary, so that we can purposively select a subset of the schools to be sample schools. An important benefit of this method of selecting the schools for the field test is that we can use more recent versions of the CCD and PSS for the full-scale sampling frame (e.g., the 1999-2000 CCD and PSS) without losing the ability to generalize to the full population. For the full-scale study, we will delete field test sample schools from the frame, and 1 We will make no probability-based inferences even though we will select a probability-based sample for the field test because the sample will be too small to support such inferences. Our objective is to have the complement of the field test sample, which we will use for the full-scale study, to be a probability-based sample. The key fact which makes this procedure work is that the complement of a simple random sample is also a simple random sample.

Appendix A—Field Test and Main Study Sampling Specifications
157
each school on the sampling frame will receive a first-stage sampling weight based on the probability that it was not selected for the field test. These weights will be 1.0 for schools not on the field test frame (e.g., certainty schools, new schools, and schools not in the field test states) and will be only slightly greater than 1.0 for the other schools because of the small numbers of schools that we will select from each stratum for the field test sample. This method makes no assumptions for the field test and full-scale study sampling frames. The impact of a school closing between the field test and full-scale study should be negligible since we will be selecting a probability-proportionate-to-size (PPS) sample of schools for the full-scale study. However, for the full-scale sample schools, we will post-stratify the student counts, so that we account for any differences between the field test and full-scale frames. In order for the sample to be properly allocated for the full-scale study, we will allocate the sample before deleting the field test sample schools from the frame, and the full-scale strata need to include the field test strata (See Section II-A).
We will select 40 public and 10 private schools for the field test school sample. We will stratify the sampling frame by the five states, sector (public, Catholic, and other private), and urbanicity. We will define urbanicity as:
Urban: the school is in a large or mid-size central city;
Suburban: the school is in a large or small town or is on the urban fringe of a large or mid-size city; and
Rural: the school is in a rural area.
We will identify Catholic schools as those schools with a Roman Catholic affiliation.
Table 1 shows the number of participating schools we expect in each stratum. Since this is a field test, we evenly distributed the sample between the five states.
To enable us to implement the required methods in all types of school environments, we would ideally select at least two year-round schools within the field test sample, including both single track and multiple track year-round schools. However, the CCD does not provide an identifier of such schools. Therefore, after we select the simple random sample of schools but before we purposively select a subsample, we will attempt to identify at least two year-round schools, if any such schools are in sample. To gain such information, we will look at sample school and/or district websites and perhaps call sample schools and/or districts to identify year-round schools and the type of track of such schools.
After we select the simple random sample of schools but before we purposively select a subsample, we will also attempt to include some schools that are presumed to have overall low achievement in order to include some students who are low ability; this will allow for a betterestimate of the floor effect of the cognitive tests. We will attempt to identify such schools by contacting schools, districts, and/or the websites of schools and districts. We may also be able to identify such public schools by looking at the percentage of students receiving free lunch at a public school, however the variable on the CCD containing the number of students receiving free lunch is missing for about 20% of the schools.

158
Tab
le 1
—Sc
hool
sam
ple
size
s and
yie
lds f
or E
LS:
2002
fiel
d te
st
Tot
alN
ew Y
ork
Cal
iforn
iaFl
orid
aIl
linoi
sN
orth
Car
olin
a
Scho
ol S
tratu
m
Sam
pled
sc
hool
s
Parti
ci-
patin
gsc
hool
sSa
mpl
edsc
hool
s
Parti
ci-
patin
gsc
hool
sSa
mpl
edsc
hool
s
Parti
ci-
patin
gsc
hool
sSa
mpl
ed
scho
ols
Parti
ci-
patin
gsc
hool
sSa
mpl
edsc
hool
s
Parti
ci-
patin
gsc
hool
sSa
mpl
edsc
hool
s
Parti
ci-
patin
gsc
hool
s
Tot
al10
0 50
20
10
20
10
20
10
20
10
20
10
Publ
ic, t
otal
80
40
16
8 16
8
16
8 16
8
16
8
Publ
ic, u
rban
26
13
6
3 6
3 4
2 6
3 4
2
Publ
ic, s
ubur
ban
26
13
6 3
4 2
6 3
4 2
6 3
Publ
ic, r
ural
28
14
4
2 6
3 6
3 6
3 6
3
Cat
holic
, tot
al10
5
2 1
4 2
2 1
2 1
0 0
Cat
holic
, urb
an
6 3
0 0
2 1
2 1
2 1
0 0
Cat
holic
, sub
urba
n 4
2 2
1 2
1 0
0 0
0 0
0
Cat
holic
, rur
al
0 0
0 0
0 0
0 0
0 0
0 0
Oth
er p
riva
te, t
otal
10
5 2
1 0
0 2
1 2
1 4
2
Oth
er p
rivat
e, u
rban
2
1 0
0 0
0 0
0 0
0 2
1
Oth
er p
rivat
e, su
burb
an
4 2
0 0
0 0
2 1
2 1
0 0
Oth
er p
rivat
e, ru
ral
4 2
2 1
0 0
0 0
0 0
2 1
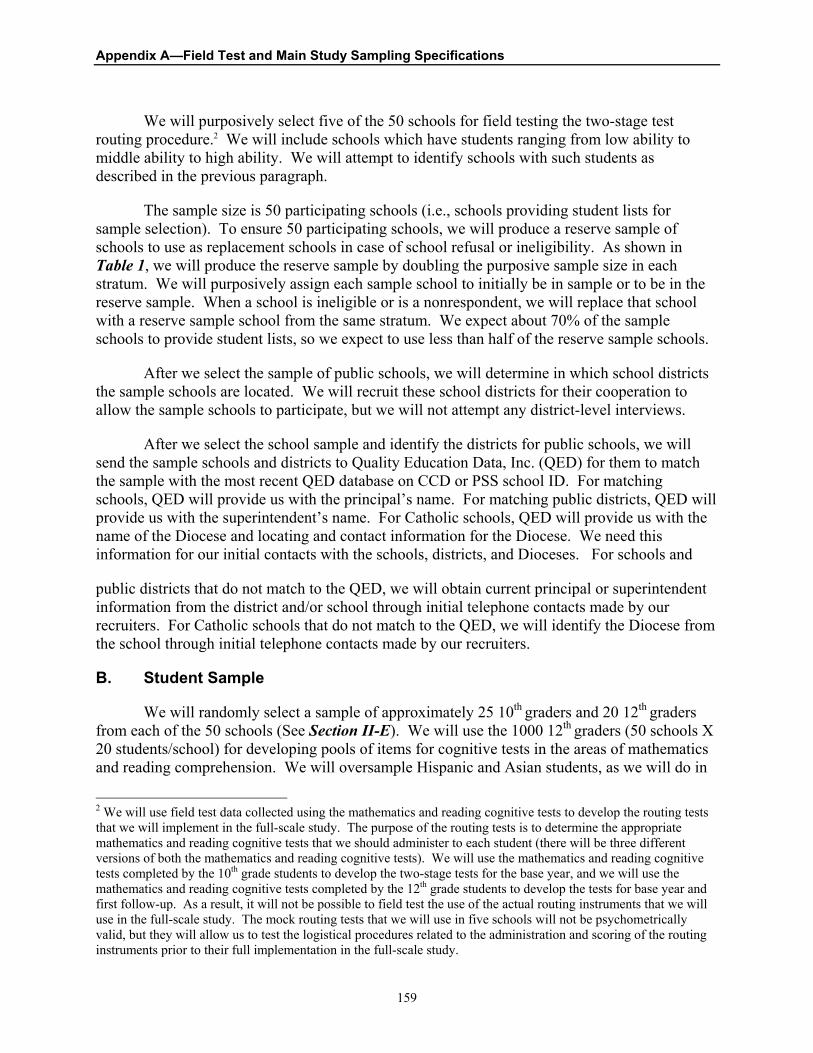
Appendix A—Field Test and Main Study Sampling Specifications
159
We will purposively select five of the 50 schools for field testing the two-stage test routing procedure.2 We will include schools which have students ranging from low ability to middle ability to high ability. We will attempt to identify schools with such students as described in the previous paragraph.
The sample size is 50 participating schools (i.e., schools providing student lists for sample selection). To ensure 50 participating schools, we will produce a reserve sample of schools to use as replacement schools in case of school refusal or ineligibility. As shown in Table 1, we will produce the reserve sample by doubling the purposive sample size in each stratum. We will purposively assign each sample school to initially be in sample or to be in the reserve sample. When a school is ineligible or is a nonrespondent, we will replace that school with a reserve sample school from the same stratum. We expect about 70% of the sample schools to provide student lists, so we expect to use less than half of the reserve sample schools.
After we select the sample of public schools, we will determine in which school districts the sample schools are located. We will recruit these school districts for their cooperation to allow the sample schools to participate, but we will not attempt any district-level interviews.
After we select the school sample and identify the districts for public schools, we will send the sample schools and districts to Quality Education Data, Inc. (QED) for them to match the sample with the most recent QED database on CCD or PSS school ID. For matching schools, QED will provide us with the principal’s name. For matching public districts, QED will provide us with the superintendent’s name. For Catholic schools, QED will provide us with the name of the Diocese and locating and contact information for the Diocese. We need this information for our initial contacts with the schools, districts, and Dioceses. For schools and
public districts that do not match to the QED, we will obtain current principal or superintendent information from the district and/or school through initial telephone contacts made by our recruiters. For Catholic schools that do not match to the QED, we will identify the Diocese from the school through initial telephone contacts made by our recruiters.
B. Student Sample
We will randomly select a sample of approximately 25 10th graders and 20 12th gradersfrom each of the 50 schools (See Section II-E). We will use the 1000 12th graders (50 schools X 20 students/school) for developing pools of items for cognitive tests in the areas of mathematics and reading comprehension. We will oversample Hispanic and Asian students, as we will do in
2 We will use field test data collected using the mathematics and reading cognitive tests to develop the routing tests that we will implement in the full-scale study. The purpose of the routing tests is to determine the appropriate mathematics and reading cognitive tests that we should administer to each student (there will be three different versions of both the mathematics and reading cognitive tests). We will use the mathematics and reading cognitive tests completed by the 10th grade students to develop the two-stage tests for the base year, and we will use the mathematics and reading cognitive tests completed by the 12th grade students to develop the tests for base year and first follow-up. As a result, it will not be possible to field test the use of the actual routing instruments that we will use in the full-scale study. The mock routing tests that we will use in five schools will not be psychometrically valid, but they will allow us to test the logistical procedures related to the administration and scoring of the routing instruments prior to their full implementation in the full-scale study.

Appendix A—Field Test and Main Study Sampling Specifications
160
the full-scale study, by determining the Hispanic and Asian student sample sizes needed per school to obtain 230 responding 10th grade Hispanic and Asian students and 200 responding 12th
grade Hispanic and Asian students. To accommodate the oversampling, we will stratify the students within each grade level by Hispanic, Asian, and other race/ethnicity. If a student is both Hispanic and Asian, we will place that student in the Hispanic student stratum.
We will not exclude any students from the sampling frame because of disabilities or language problems (as was done in NELS:88). Specifically, the ELS:2002 field test and full-scale study will include students with
severe mental disabilities;
command of the English language that is not sufficient for understanding the survey materials; or
physical or emotional problems.
If these students cannot complete the student questionnaires or cognitive tests, we will excuse them from doing so, and we will collect status information from teachers, principals, and parents through those questionnaire components of ELS:2002. We will provide guidelines to the schools specifically stating which students should be excused from the test only or from both the test and questionnaire. Foreign exchange students will be ineligible for the study.
For the field test sample, we will inflate the 12th grade student sample size within each race/ethnicity stratum for a total sample size of 1,087. This will guarantee 1000 completed 12th
grade cognitive tests, which is necessary for designing the cognitive test better by providing sufficient statistical power for Item Response Theory analysis. However, for the field test sample, we will not inflate the 10th grade sample size because 1,250 sampled 10th graders will yield approximately 1,150 completed tests, given a 92% response rate, which is sufficient for designing the cognitive tests. Tables 2 and 3 show allocations and yields for 10th and 12th
graders, respectively, for list-providing schools. As shown in Table 3 we will inflate the sample of 12th graders to anticipate a 92% response rate.
C. Specifications for Enrollment Lists
We will ask each sample school to provide an electronic or hard-copy listing of all their 10th and 12th grade students currently enrolled.
The information requested for each eligible student will be:
student ID number;
Social Security Number (may be the same as the ID number; this item is optional);
full name;
sex;
race (white; black; Asian; Native Hawaiian or Other Pacific Islander; American Indian or Alaska Native; other);

Appendix A—Field Test and Main Study Sampling Specifications
161
ethnicity (Hispanic indicator, regardless of race); and
whether or not an Individualized Education Program (IEP) has been filed for the student (yes, no).
We will need the race/ethnicity variables in both the full-scale study and in the field test to allow us to oversample Asians and Hispanics. The race, ethnicity, sex, and IEP variables may be useful for nonresponse adjustments in the full-scale study. Asking for these variables during the field test will ensure that we have procedures in place to obtain them during the full-scale study.
We will request that the school provide, if possible, two electronic lists of the enrolled students, one for 10th graders and one for 12th graders. We will request that the electronic lists be ASCII files and column formatted. Schools will be able to provide the electronic lists via e-mail, using File Transfer Protocol (FTP), or providing a diskette or CD-ROM containing the file. If the school cannot provide electronic lists, then we will ask for hard-copy lists, preferably in alphabetic order within race/ethnicity strata to facilitate stratified systematic sampling. We will, of course, accept whatever the school can provide to select the student samples; however, we will make every effort to facilitate receiving uniformly formatted electronic files from as many schools as possible because we can process them more quickly, more reliably, and at less cost.For the field test, we will only include schools that have both 10th and 12th grades in the school sample, to ensure that we may conduct both 10th and 12th grade test administrations at every school.
The specifications for the list request will be clearly presented and their importance explained in the School Coordinator’s packet. In addition to informational items described in Section II-C, the coordinator’s packet will contain detailed instructions for preparing the student lists, school ID labels to place on all diskettes and hardcopy lists, an express mail airbill, and instructions for sending the file layouts and data files to RTI via e-mail or FTP if either of those options is desired. The detailed instructions will include guidelines identifying the eligible students and data elements to be listed by the school, completed hardcopy examples, a transmittal form with the file layout for electronic files, and a checklist for proper completion of hard-copy lists.
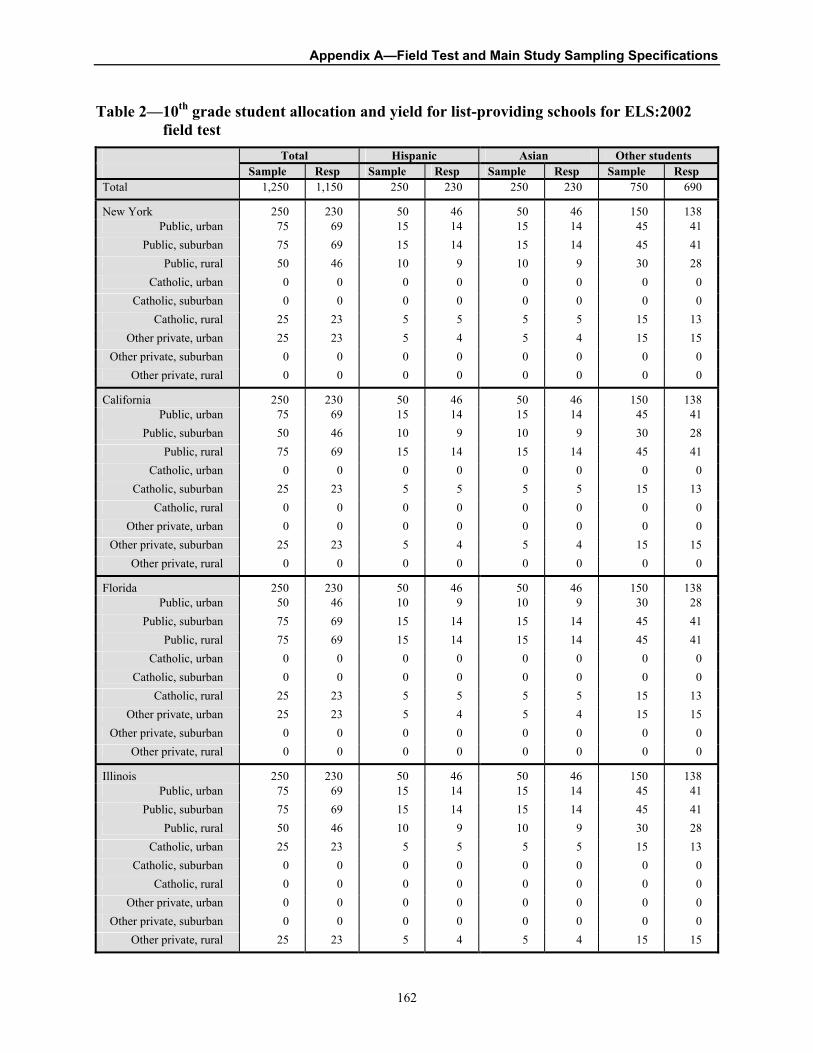
Appendix A—Field Test and Main Study Sampling Specifications
162
Table 2—10th grade student allocation and yield for list-providing schools for ELS:2002 field test
Total Hispanic Asian Other students Sample Resp Sample Resp Sample Resp Sample Resp
Total 1,250 1,150 250 230 250 230 750 690
New York 250 230 50 46 50 46 150 138 Public, urban 75 69 15 14 15 14 45 41
Public, suburban 75 69 15 14 15 14 45 41 Public, rural 50 46 10 9 10 9 30 28
Catholic, urban 0 0 0 0 0 0 0 0 Catholic, suburban 0 0 0 0 0 0 0 0
Catholic, rural 25 23 5 5 5 5 15 13 Other private, urban 25 23 5 4 5 4 15 15
Other private, suburban 0 0 0 0 0 0 0 0 Other private, rural 0 0 0 0 0 0 0 0
California 250 230 50 46 50 46 150 138 Public, urban 75 69 15 14 15 14 45 41
Public, suburban 50 46 10 9 10 9 30 28 Public, rural 75 69 15 14 15 14 45 41
Catholic, urban 0 0 0 0 0 0 0 0 Catholic, suburban 25 23 5 5 5 5 15 13
Catholic, rural 0 0 0 0 0 0 0 0 Other private, urban 0 0 0 0 0 0 0 0
Other private, suburban 25 23 5 4 5 4 15 15 Other private, rural 0 0 0 0 0 0 0 0
Florida 250 230 50 46 50 46 150 138 Public, urban 50 46 10 9 10 9 30 28
Public, suburban 75 69 15 14 15 14 45 41 Public, rural 75 69 15 14 15 14 45 41
Catholic, urban 0 0 0 0 0 0 0 0 Catholic, suburban 0 0 0 0 0 0 0 0
Catholic, rural 25 23 5 5 5 5 15 13 Other private, urban 25 23 5 4 5 4 15 15
Other private, suburban 0 0 0 0 0 0 0 0 Other private, rural 0 0 0 0 0 0 0 0
Illinois 250 230 50 46 50 46 150 138 Public, urban 75 69 15 14 15 14 45 41
Public, suburban 75 69 15 14 15 14 45 41 Public, rural 50 46 10 9 10 9 30 28
Catholic, urban 25 23 5 5 5 5 15 13 Catholic, suburban 0 0 0 0 0 0 0 0
Catholic, rural 0 0 0 0 0 0 0 0 Other private, urban 0 0 0 0 0 0 0 0
Other private, suburban 0 0 0 0 0 0 0 0 Other private, rural 25 23 5 4 5 4 15 15

Appendix A—Field Test and Main Study Sampling Specifications Table 2 (continued)
163
Total Hispanic Asian Other students Sample Resp Sample Resp Sample Resp Sample Resp
North Carolina 250 230 50 46 50 46 150 138 Public, urban 75 69 15 14 15 14 45 41
Public, suburban 50 46 10 9 10 9 30 28 Public, rural 75 69 15 14 15 14 45 41
Catholic, urban 0 0 0 0 0 0 0 0 Catholic, suburban 25 23 5 5 5 5 15 13
Catholic, rural 0 0 0 0 0 0 0 0 Other private, urban 0 0 0 0 0 0 0 0
Other private, suburban 0 0 0 0 0 0 0 0 Other private, rural 25 23 5 4 5 4 15 15

Appendix A—Field Test and Main Study Sampling Specifications
164
Table 3—12th grade student allocation and yield for list-providing schools for ELS:2002 field test
Total Hispanic Asian Other Students Sample Resp Sample Resp Sample Resp Sample Resp
Total 1,087 1,000 217 200 217 200 653 600 New York 217 200 43 40 43 40 131 120
Public, urban 65 60 13 12 13 12 39 36Public, suburban 65 60 13 12 13 12 39 36
Public, rural 43 40 9 8 9 8 25 24Catholic, urban 0 0 0 0 0 0 0 0
Catholic, suburban 0 0 0 0 0 0 0 0Catholic, rural 22 20 4 4 4 4 14 12
Other private, urban 22 20 4 4 4 4 14 12Other private, suburban 0 0 0 0 0 0 0 0
Other private, rural 0 0 0 0 0 0 0 0
California 217 200 43 40 43 40 131 120Public, urban 65 60 13 12 13 12 39 36
Public, suburban 43 40 9 8 9 8 25 24Public, rural 65 60 13 12 13 12 39 36
Catholic, urban 0 0 0 0 0 0 0 0Catholic, suburban 22 20 4 4 4 4 14 12
Catholic, rural 0 0 0 0 0 0 0 0Other private, urban 0 0 0 0 0 0 0 0
Other private, suburban 22 20 4 4 4 4 14 12Other private, rural 0 0 0 0 0 0 0 0
Florida 217 200 43 40 43 40 131 120
Public, urban 43 40 9 8 9 8 25 24Public, suburban 65 60 13 12 13 12 39 36
Public, rural 65 60 13 12 13 12 39 36Catholic, urban 0 0 0 0 0 0 0 0
Catholic, suburban 0 0 0 0 0 0 0 0Catholic, rural 22 20 4 4 4 4 14 12
Other private, urban 22 20 4 4 4 4 14 12Other private, suburban 0 0 0 0 0 0 0 0
Other private, rural 0 0 0 0 0 0 0 0 Illinois 218 200 44 40 44 40 130 120
Public, urban 65 60 13 12 13 12 39 36Public, suburban 65 60 13 12 13 12 39 36
Public, rural 44 40 9 8 9 8 26 24Catholic, urban 22 20 4 4 5 4 13 12
Catholic, suburban 0 0 0 0 0 0 0 0Catholic, rural 0 0 0 0 0 0 0 0
Other private, urban 0 0 0 0 0 0 0 0Other private, suburban 0 0 0 0 0 0 0 0
Other private, rural 22 20 5 4 4 4 13 12North Carolina 218 200 44 40 44 40 130 120
Public, urban 65 60 13 12 13 12 39 36Public, suburban 44 40 9 8 9 8 26 24
Public, rural 65 60 13 12 13 12 39 36Catholic, urban 0 0 0 0 0 0 0 0
Catholic, suburban 22 20 4 4 5 4 13 12Catholic, rural 0 0 0 0 0 0 0 0
Other private, urban 0 0 0 0 0 0 0 0Other private, suburban 0 0 0 0 0 0 0 0
Other private, rural 22 20 5 4 4 4 13 12

Appendix A—Field Test and Main Study Sampling Specifications
165
D. Quality Assurance Checks
We will perform quality assurance (QA) checks on all lists we receive. Any lists that are unreadable will immediately fail the QA checks. Any school that sends a list of only 10th graders or only 12th graders will also fail the QA checks. Since we will stratify the students by Hispanics, Asians, and other race/ethnicity, the list will fail the QA checks if it does not allow us to stratify the students.
We will also check the school’s count of 10th and 12th grade students to verify that the school provided a complete list of eligible students. We will compare the provided count of 10th
and 12th graders with the count on the frame (CCD or PSS). We will estimate the race/ethnicity breakdowns by assuming the percentage of students in the school of a certain race/ethnicity is similar to the percentage of that race/ethnicity for 10th and 12th graders. The CCD contains flags which identify if the enrollment has been imputed, but the PSS does not contain such flags. For schools with an imputed enrollment, we will not compare the counts, and the list will pass the QA check. If any of the counts of 10th and 12th graders for total students or by the race/ethnicity strata on the provided list are 25% lower or higher than the frame counts, then the list will fail the QA check unless the absolute difference is less than 100.
Schools that fail the QA check will be recontacted by the school Recruiter to resolve the discrepancy and to verify that the school representative who prepared the student lists clearly understood our request and provided lists of the eligible students. When we determine that the initial list provided by the school is not satisfactory, we will request a replacement list. If the school confirms that the list is correct or if the school sends a replacement list, we will proceed with selecting sample students. If the school refuses to send a replacement list, then we will proceed with selecting sample students, if possible.
We will evaluate these QA checks after the field test and make any necessary revisions before we begin receiving lists for the full-scale study.
E. Student Sample from Lists
We will sample students from schools on a flow basis as we receive student lists. We will use stratified systematic sampling procedures for both electronic and hard-copy lists. For each school, we will fix the student sample rates rather than the student sample sizes for the following reasons:
to facilitate sampling students on a flow basis as we receive student lists, and
because sampling at a fixed rate based on the overall student stratum sampling rate and the school probabilities of selection results in approximately equal overall probabilities of selection within the ultimate school by student strata. See Appendix A for mathematical details of student sampling.
For schools that provide electronic lists of students, we will stratify the lists by race/ethnicity within grade level and select a stratified systematic sample of students.

Appendix A—Field Test and Main Study Sampling Specifications
166
For schools that provide hard-copy lists, we will use an efficient two-stage process that we have previously developed to select systematic samples from hard-copy lists. We will first select sample pages and then select sample students from the selected pages. We set the page sampling rate so that approximately 10 students are selected from each page. This is particularly efficient for long lists. After we select the sample, we will key the sample. When a hard-copy list includes students who must be sampled at different rates (e.g., Hispanic, Asian, and other race students), we will initially sample the lists at the highest rate. Then, after we key the initial sample, we will subsample the strata which had the lower sampling rates to achieve the proper sample inclusion rates.
After we select the student sample, we will verify that the sample size is within reasonable bounds of the school’s expected sample size. If the total number of sample students is less than ten (unless we have selected all students) or if the number selected exceeds the expected number by more than 20, then we will adjust the sampling rates accordingly and re-select the sample.
We will modify our list processing and sampling menu system, so that it will help us efficiently process lists, do quality checks on lists, and sample students from the lists. The menu system allows us to view data files, SAS logs, and SAS output; run SAS programs; and input status codes, problem codes and descriptions, and sample counts into the Survey Control System (SCS). We will also make any necessary modifications to our program to break up names into first, middle, and last names if the name is sent as one field.
The SCS will keep track of the status of the list processing and sampling. When we receive a list, we will enter the receipt date, type of list, and information about the sender into the SCS. We will enter the results of the QA checks into the SCS and keep track of follow-up telephone calls to the schools to resolve QA problems. As we select the student samples, we will add data to the SCS for each sample student, including a unique study ID number (other than the SSN), the school’s CCD or PSS ID , student SSN, student ID, and student stratum. We will also create a master sample file which will be a dataset of all sample students which will include unique study ID number (other than the SSN), the school’s CCD or PSS ID , student SSN, student ID, student stratum, school sampling weight, and student sampling weight. (While some of these data elements are not necessary for the field test, e.g., sampling weights, we will generate them so that we do not need to modify the software developed for the field test to produce this sample file for the full-scale study.)
We will select the student sample in the fall so that we can identify sample teachers (see Section II-F) and prepare materials well in advance of Survey Day. However, selecting the sample in advance means that some students will have transferred into the sample schools and others will have left between the time of sample selection and survey day.
For identifying students who have transferred into the school since the first list, we will use a technique known as the “half-open interval rule.” The steps are similar to those for “freshening” the sample with 12th graders in the first follow-up (See Section V-A). At the time of the initial request for the student lists, we will inform the school that a second listing of students will be necessary approximately 2 weeks prior to data collection to allow sample updating. If the school requires explicit, or active, parental consent, then we will request the second listing approximately 4 weeks prior to data collection in order to have enough time to

Appendix A—Field Test and Main Study Sampling Specifications
167
resolve issues related to obtaining permission for students to be in the study. This second list will allow transfer students the opportunity to be selected. The steps in the procedure are as follows:
Step 1: The Recruiter will request an updated list of all 10th and 12th grade students. If the school provides electronic lists, then we will sort both the first and second lists in the same order. If the school sends hard-copy lists for both the first and second lists, then the school needs to sort the second list in the same way as the first list (e.g., both sorted alphabetically for each stratum), and if the school sends multiple lists per grade the first time, then the school needs to send multiple lists the second time.
Step 2: The Recruiter will then identify the sampled ELS:2002 students on the new list. For students not on this list, the Recruiter will determine where they would have been on the list if they were still enrolled.
Step 3: To select transfer students at the same rate as the initial sample, we will compare the first requested student lists from which we selected the sample of 25 10th graders and 20 12th graders to the second lists. If the person immediately following each sampled individual on the second list is not on the first list, then we will assume that student is a transfer student and we will include that student in the sample. If the last student on the list is a sampled student, then the next student will be the first student on the list (i.e., we will “circularize” the list).
During the field test, we will verify with school personnel that students we identify transferred into the school. However, we will include any student not on the first list for any reason. If we discover that a significant number of students that should be on the first list have been left off, then we will evaluate our procedures for requesting the first lists.
Step 4: Whenever we add a transfer student to the sample, then we will determine if the next student on the roster is a transfer student or not.Once we identify a student who is not a transfer student, then the process will continue for the next sample student on the roster. The Recruiter will continue the sequence of steps 3 and 4, adding more transfer students, until a student who was enrolled at the time of the initial list is reached on the roster.
We will also use these second lists to identify students who are no longer at the school. If a sample student is not on the second list, then that student is no longer at the school and no longer in the sample. However, we will still implement the check for transfer students based on where the student would have been on the second list, if the student was still enrolled. If a large number of students are no longer on the school’s list, then we will determine what situations may have caused this and how to deal with this in the full-scale study (e.g., selecting a supplemental sample).

Appendix A—Field Test and Main Study Sampling Specifications
168
Since this sample updating procedure was not used in NELS:88, we will test the procedure during the field test. We will randomly select half of the schools within each state to update both the 10th and 12th grade lists using the new procedures. The other half of the schools will use the NELS:88 sample updating procedure. For the latter method, the school Recruiter will call the school to determine which sample students are still at the school and to obtain a supplementary roster of students who have transferred into the school since the first student list was provided. We will stratify the supplementary roster similarly to the initial roster, and we will select a random sample. These samples of 25 schools will give us qualitative evidence of how well our new updating procedure will work in practice.
The student sampling and updating procedures implemented in the field test will be as comparable as possible to those planned for the full-scale study, so that we can field test the procedures and have them in place for the full-scale study.
F. Teacher and Parent Samples
ELS:2002 will include a teacher survey that gathers teacher reports on students’ learning experiences and performance. These data supplement the parent and student reports, providing another viewpoint on the complex issues of what students have achieved as of the 10th grade and what they are being asked to learn in the 10th grade. We will sample only mathematics and English teachers of ELS sampled students, so teachers will be in sample only if they teach students who were sampled for ELS. The teacher sample size will be approximately 532.
Some sample students may have more than one or no mathematics or English teacher during the 2000-2001 school year (e.g., different teachers for the fall and spring terms). In these situations, we provisionally recommend using the fall term teacher as the relevant reference point, if possible. We will decide which mathematics or English teacher, if any, to include in the teacher sample as follows:
If fall teacher A and spring teacher B, then sample fall teacher A;
If fall teacher A has left the school and spring teacher B is present, then sample spring teacher B;
If no fall teacher but one spring teacher, then sample spring teacher;
If no fall teacher but two or more spring teachers, then randomly select one to be in sample;
If no spring teacher but fall teacher, then sample fall teacher;
If two or more fall teachers, then randomly select one to be in sample; and
If no fall teacher and no spring teacher, then no teacher in sample.
For each sample student, there will be one sample parent. We will follow the NELS:88 procedures of identifying the sample parent by asking which parent, in two-parent households, is most knowledgeable about the student’s educational situation. For one-parent households, that parent is in the sample.

Appendix A—Field Test and Main Study Sampling Specifications
169
III. FULL-SCALE SAMPLE
A. School Sample
We will use the most recent Common Core of Data (CCD) and Private School Survey (PSS) data files of public and private schools, respectively, as the sampling frames. We expect the 1999-2000 CCD and PSS files to be available for frame construction.
The survey population for the full-scale ELS:2002 consists of 10th graders enrolled in school in the United States (50 states and District of Columbia) in
regular public schools, including State Department of Education schools and
Catholic and other private schools.
We will exclude these types of schools from the school sampling frame:
Schools with no 10th grade;
Ungraded schools;
Bureau of Indian Affairs (BIA) schools;
Special education schools;
Area vocational schools that do not enroll students directly;
Department of Defense (DOD) schools; and
Closed public schools.
We will identify such schools as described in Section II-A.
If 10th grade enrollment is unavailable on the sample frame for any school, we will impute the enrollment for 10th grade using the median value of the enrollment for that grade for the appropriate stratum.
We will select a stratified probability-proportionate-to-size (PPS) sample of schools. For selecting schools, we will use a composite size measure methodology that was developed by RTI statisticians (Folsom, Potter, and Williams, 1987). This methodology will allow us to (1) achieve the targeted sample sizes of Hispanic, Asian, and other students; (2) have approximately equal sampling weights for students within each of the race/ethnic groups; and (3) have approximately equal total student sample sizes within each sampled school. Detailed discussion of the use of a composite size measure is in Appendix A. We will select a sample of 800 (600 public, 200 private) schools from the school sampling frame. We will stratify the sampling frame for public schools by an eight-level NCES regional variable defined as:
New England: CT ME MA NH RI VT;
Mideast: DE DC MD NJ NY PA;
Great Lakes: IL IN MI OH WI;
Plains: IA KS MN MO NE ND SD;

Appendix A—Field Test and Main Study Sampling Specifications
170
Southeast: AL AR FL GA KY LA MS NC SC TN VA WV;
Southwest: AZ NM OK TX;
Rocky Mountains: CO ID MT UT WY; and
Far West: AK CA HI NV OR WA.
We will substratify each region which contains a field test state, so that we correctly allocate and select the school sample. The substrata will be each state in the field test and all other states.For example, we will substratify the Southeast by NC, FL, and all other states. Within each of these public school regional strata or substrata, we will stratify by metropolitan status defined as:
Urban: the school is in a large or mid-size central city;
Suburban: the school is in a large or small town or is on the urban fringe of a large or mid-size city; and
Rural: the school is in a rural area.
We will stratify the sampling frame for Catholic and other private schools by Catholic and other private schools. We will identify Catholic schools as those schools with affiliation identified on the PSS as Roman Catholic. We will then stratify by a four-level NCES regional variable defined as:
Northeast: CT DE DC ME MD MA NH NJ NY PA RI VT;
North Central: IL IN IA KS MI MN MO NE ND OH SD WI;
Southeast: AL AR FL GA KY LA MS NC SC TN VA WV; and
West: AK AZ CA CO HI ID MT NV NM OK OR TX UT WA WY;
We will substratify each region which contains a field test state, so that we correctly allocate and select the school sample. The substrata will be each state in the field test and all other states.For example, we will substratify the Southeast by NC, FL, and all other states. Within each of these private school regional strata or substrata, we will stratify the private schools by metropolitan status defined similarly to the public school metropolitan status strata.
We will allocate the 600 public schools proportional to the number of 10th gradestudents contained within each public school stratum or substratum. We will allocate 100 Catholic schools and 100 other private schools proportional to the number of 10th grade students contained within each Catholic and other private school stratum or substratum, respectively. Table 4 gives an approximate allocation of schools to the strata, based on 1997-98 CCD and PSS data.
We will select a sample larger than 800 schools to compensate for the anticipated nonresponse, but we have not yet decided upon a method for doing so. One possibility is to follow the NELS:88 procedures and have a reserve sample of schools. We would use these reserve schools for replacements in the event that a school is ineligible or does not respond. We would produce the reserve sample by doubling the sample size in each stratum. We would

Appendix A—Field Test and Main Study Sampling Specifications
171
randomly assign half of the schools in each stratum to be in the reserve sample, and we would use these reserve schools to replace nonresponding or ineligible schools within the same stratum in random order. Another possibility is to inflate the school sample size based on expected response and eligibility rates for the strata. Response rates will vary across strata because some types of schools have higher response rates while other types of schools have lower response rates. We would check response rates from past studies, such as NELS:88, to help determine the expected response rates. We plan to consult with statisticians at NCES, RTI, and perhaps from other organizations to help determine the method that we will use. We will attempt to collect some information from school refusals to assist later with weight adjustments for, and statistical analysis of, school nonresponse.
As described in Section II-A, we will determine in which school districts the public sample schools are located. We will recruit these school districts for their cooperation to allow the sample schools to participate, but we will not attempt any district-level interviews. We will also send the sample schools and districts to Quality Education Data, Inc. (QED) for them to match the sample with the most recent QED database on CCD or PSS ID.
B. Student Sample
We will randomly select a sample of approximately 25 10th graders from within each of the selected 600 public and 200 private schools. We will obtain lists of 10th grade students from each sampled school. We will sample students on a flow basis as we receive students lists. We will use stratified systematic sampling procedures for both electronic and hard-copy lists. The strata will be Hispanic, Asian, and other race/ethnicity. Sections II-C, II-D, and II-E describe the details of the specifications for enrollment lists, quality assurance checks, and sampling and updating students from lists.

Appendix A—Field Test and Main Study Sampling Specifications
172
Table 4—Preliminary school strata and sample allocationRegion/metro status Sample size
Public Schools
Total public Urban SuburbanRural
600 195 321 84
New England Urban SuburbanRural
266
164
Mid East Urban SuburbanRural
90304911
Great Lakes Urban SuburbanRural
99305316
PlainsUrban SuburbanRural
45102312
Southeast Urban SuburbanRural
141 427524
SouthwestUrban SuburbanRural
713231
8Rocky Mountains Urban SuburbanRural
236
134
Far West Urban SuburbanRural
105 3961
5Catholic Schools
Total Private Urban SuburbanRural
100 5939
2NortheastUrban SuburbanRural
351817
0Central Urban SuburbanRural
321812
2

Appendix A—Field Test and Main Study Sampling Specifications
173
Region/metro status Sample size
South Urban SuburbanRural
1410
40
WestUrban SuburbanRural
1913
60
Other Private Schools
Total Private Urban SuburbanRural
100 444412
NortheastUrban SuburbanRural
269
134
Central Urban SuburbanRural
18882
South Urban SuburbanRural
311413
4WestUrban SuburbanRural
251310
2

Appendix A—Field Test and Main Study Sampling Specifications
174
As described in Section II-E and Appendix A, we will fix student sample rates rather than student sample sizes. We will add to the total student sample size of 20,000 (800 x 25) to select additional Hispanic (if necessary) and Asian/American students in order to estimate subpopulation parameters within precision requirements. Table 5 lists these precision requirements, along with required sample sizes to meet the requirements. We calculated the required sample sizes under the following assumptions:
use of two-tailed tests with significance of alpha = .05 to test differences between means and proportions with required power of 80%;
use a value of p = .30 to calculate sample sizes for estimates and tests of proportions;
use a mean value of 50 with standard deviation of 15 to calculate sample size for estimates and tests of mean;
design effect is 2.0; and
correlation between the main study and the first follow-up study is 0.6.
Table 5—Domain sample size requirements
Precision Requirement Required Respondent
Sample Size Detect a 15% change in proportions across waves with 80% power using a two-tailed alpha = .05 test 1,356 Detect a 5% change in means across waves with 80% power using a two-tailed alpha = .05 test 454 Produce relative standard errors of 10% or less for proportion estimates based on a single wave of data 467 Produce relative standard errors of 2.5% or less for mean estimates based on a single wave of data 288
We chose the largest required sample size (N = 1,356 respondents at the end of the second follow-up) for subpopulation estimation. We will use augmentation/oversampling to ensure that each of the subpopulations has a minimum sample size of 1,356. Hence, we will be able to achieve the precision requirements as follows:
detect a 15% change in proportions across waves with 80% power using a two-tailed alpha = .05 test;
detect a 5% change in means across waves with 99% power using a two-tailed alpha = .05 test;
produce relative standard errors of 6% or less for proportion estimates based on a single wave of data; and
produce relative standard errors of 1.25% or less for mean estimates based on a single wave of data.
We inflated this sample size by the expected student response rate of 92% at the baseline and an expected response rate of 95% at the first follow-up. In addition, we increased this number by 10% to account for ineligibles and those we are unable to locate in later years. This

Appendix A—Field Test and Main Study Sampling Specifications
175
gives an initial (baseline) sample size of 1,710 Asian and 1,710 Hispanic students. Our approximations using the race/ethnic percentages for public schools from the 1997-98 CCD indicate that in a sample of 15,000 public school students (600 x 25), we would expect to sample a minimum of 636 Asian students, 1928 Hispanic students, and 12,436 others, without any oversampling. (The file indicates that about 4.2% of public school students are Asian and 12.9% are Hispanic.) Thus, we will increase the sample size to include additional public school students in the sample, and the total initial student sample size will be 21,074 (20,000 + 1710 – 636). We will allocate a sample size of 1,710 Asians, so that we meet the precision requirements. We will allocate the remaining sample size proportionally to the Hispanic and other race student strata, but we will adjust the sample sizes, if necessary, to meet the precision requirements for Hispanics. After, we select the school sample, we will adjust the sample rates, if necessary, depending on the actual number of expected Asians and Hispanics in the sample schools. The CCD and PSS files contain the counts of students in each of the public schools who are Asian, Hispanic, black, white, and other, and we will be able to use this information in determining each school’s composite measure of size. We will also use these counts in the quality assurance (QA) checks, as described in Section II-D.
Some categories of students who were ineligible for NELS:88 will be eligible for ELS:2002. These include students with severe mental disabilities, students whose command of the English language is not sufficient for understanding the survey materials, and students with physical or emotional problems. While these categories of students may be unable to complete the questionnaire and tests, we will attempt to collect transcript, parent, and teacher data for them. As mentioned in Section II-B, we will provide guidelines to the schools specifically stating which students should be excused from the test only or from both the test and questionnaire. Foreign exchange students will be ineligible for the study.
C. Teacher and Parent Samples
ELS:2002 will include a teacher survey that gathers teacher reports on students’ learning experiences and performance. These data supplement the parent and student reports, providing another viewpoint on the complex issues of what students have achieved as of the 10th grade and what they are being asked to learn in the 10th grade. As described in Section II-F, we will sample only mathematics and English teachers of ELS sampled students, so teachers will be in sample only if they teach students who were sampled for ELS. The teacher sample size will be approximately 8,500, however after the field test, we should have a better estimate of the teacher sample size.
For sample students with more than one or no mathematics or English teacher during the 2000-2001 school year (e.g., different teachers for the fall and spring terms), there will be one sample teacher for that subject, as described in Section II-F.
For each sample student, there will be one sample parent, as described in Section II-F.

Appendix A—Field Test and Main Study Sampling Specifications
176
IV. BASE YEAR WEIGHTS AND VARIANCE ESTIMATES
The ELS:2002 multilevel and multicomponent design introduces significant complexity to the task of weighting the base year data. Notwithstanding the complexity of the design, we are committed to keeping the base year weights as simple and intuitive as possible. There could be as few as three base year weights: a weight for student questionnaire completion, a contextual data weight for the “expanded” sample of questionnaire-eligible and questionnaire-ineligible(traditionally excluded) sophomores, and a school weight. To the extent permitted by achievement of response rate goals and the need to support special analytic objectives, we will keep the base year weights as simple—that is, as few in number—as possible.
We will compute statistical analysis weights for use in analysis of the ELS:2002 base year survey data to achieve the following study objectives:
to enable design-unbiased estimates of population totals, and
to reduce the potential for nonresponse bias.
We will achieve the first objective by computing initial, design-based weights that are equal to the reciprocal of the probability of selection for each sampling unit (e.g., sample student). The methodologies that we will use to perform the weight adjustments for achieving the second objective include the following:
Divisors formed as weighted response rates within “weighting classes” defined by cross-classifying categorical variables known for respondents and nonrespondents.
Divisors formed by fitting bounded logistic response propensity models. When fit using survey weighted, logistic regression algorithms, these individual response propensities are smoothed and bounded versions of the weighting class nonresponse adjustments.
Ratio-adjustment multipliers formed for post-strata to force nonresponse adjusted weight sums to replicate administrative record based population totals for the units of interest (e.g., schools or students). Raking and generalized raking extensions accommodate more control variables, while smoothing and bounding the adjustments.
When response rates are high and the numbers of variables available for both responding and nonresponding units is limited, the weighting class method cannot be substantially improved. This method may be sufficient for school-level nonresponse. When these conditions are not satisfied, the bounded logistic regression and generalized raking procedures afford considerable opportunity for improved reduction of nonresponse bias, relative to the weighting class methods.
The bounded logistic regression methodology that RTI will use for most nonresponse adjustments has several properties that will result in efficient and effective weight adjustments for ELS:2002. Some of those properties include the following:

Appendix A—Field Test and Main Study Sampling Specifications
177
The models can accommodate a large number of statistically significant predictors of response status, which results in greater reduction of nonresponse bias.
The reweighted respondent sample total for any predictor variable will be equal to its full-sample weighted total because we use generalized raking equations developed by Folsom (1991) to obtain the logistic regression coefficients for the response propensity model. Specifically, if ri is the zero/one response indicator for the i-th sample member and Xi = ( 1, xi ) with xi depicting the row vector of response predictor variables, possibly including continuous measures, then the inverse logistic response propensity weight multiplier is
and the generalized raking solution equations are
where wi is the full sample base weight, XiT depicts the column vector of predictors, and the
summations extend over all sample members. A Newton-Raphson algorithm that typically converges rapidly, even for models with relatively large (100 plus element) predictor vectors, xi, is used to fit the model.
We will use automatic interaction detection (AID) to efficiently identify significant interaction terms for the logistic regression models. AID performs segmentation analysis, and it will help us develop good models for predicting propensity to respond, therefore effectively adjusting for nonresponse. By including dummy variables for all but one of the cells of the AID partition in the response propensity model, we can be confident that we have included all important interactions. We will then have weights which provide effective compensation for nonresponse bias.
We limit the variance inflation resulting from the inverse logistic response propensity weight multipliers, i, by using an adaptation of Deville and Särndal’s (1992) bounded exponential function to create a constrained logistic function that is bounded below by a prespecified lower limit, L. This leads to an upper bound on the weight multipliers of L-1. This adaptation allows us to incorporate the typical rule-of-thumb type bounds
ˆ 1i [ 1 + exp ( -Xi
ˆ ) ] (1)
i sriw i [ 1 + exp ( -X i
ˆ ) ] X Ti =
i sw i X T
i (2)

Appendix A—Field Test and Main Study Sampling Specifications
178
that are often placed on weighting class adjustments (e.g., i-1 is required
to be less than two or three).
The generalized raking methodology that we will use for most poststratification weight adjustments also has several properties that will result in efficient and effective weight adjustments for ELS:2002. Some of those properties include the following:
The generalized raking models will include continuous variables, which allows control to known population totals for continuous outcomes.
Another advantage of our bounded generalized raking algorithm over standard raking is the ability to preset upper and lower bounds, say U=2 and L=0.5, for the poststratification weight adjustments. Specifically, an adaptation of Deville and Särndal’s (1992) bounded exponential function is used in which the weight adjustment factor is
(3)
where Xi depicts the row vector of the poststratification model factors and depicts the row vector of generalized raking coefficients. Using the bounded adjustment factors ensures that the weight variation will not be unduly inflated by the poststratification adjustment.
The first step in the sample weighting process is to identify the sets of respondents for which statistical analyses will be supported. For the ELS:2002 base year sample, analysis weights may be needed for each of the following sets of respondents:
student questionnaire respondents;
mathematics test respondents;
reading test respondents;
students with contextual data, including sample students ineligible for the questionnaire administration (e.g., students whose English language proficiency is severely limited and those with severe disabilities);
responding principals;
responding teachers (for one or more teacher reports);
responding parents; and
combinations of the above.
i exp ( Xiˆ )i exp ( Xiˆ )

Appendix A—Field Test and Main Study Sampling Specifications
179
To the extent that sets of respondents are similar (e.g., no more than 5% difference in number of respondents and weight totals), we will consider computing a single set of weights for multiple sets of respondents to avoid a plethora of different analysis weights. However, if it is easier for the data analysts to have a separate weight for each set of respondents, we can generate a separate analysis weight for each set of respondents. As noted above, though, we would like to limit the set of weights to the extent possible (e.g., student questionnaire respondents, students with contextual data, and a school weight).
For each set of respondents, the steps implemented to compute the statistical analysis weights will be the following:
Calculate the school-level design weights equal to the reciprocals of the schools’ unconditional probabilities of selection adjusted for not being selected for the field test sample. (See Section II-A).
Calculate adjustments for school-level nonresponse to the request for student lists, usually using bounded logistic regression to model response propensity. For the set of responding principals, calculate additional adjustments for nonresponse of principals from participating schools.
Calculate the student-level design weight components equal to the reciprocals of the conditional probabilities of selecting the students, given selection of the sample schools. For students who transferred into the school between the time of the initial sample selection and sample updating 2 to 4 weeks prior to test administration, this probability of selection is identical to that for the student on the original list to which the transfer student is linked (i.e., the original sample student immediately preceding the transfer student on the sampling frame).
Calculate adjustments for nonresponse of students, teachers, parents, and other sets of respondents based on the student sample, usually using bounded logistic regression models for response propensity.
Perform generalized raking or poststratification to population totals based on the most current administrative record totals.
Investigate the need to trim and smooth outlier weights to reduce mean squared error, using generalized raking or poststratification for the smoothing step.
The data needed to support the logistic models for school-level nonresponse will come from the school-level sampling frame, as well as from the data obtained for nonresponding schools during the school recruitment task. Predictors of school-level nonresponse will include sector (public, Catholic, or other private), region, metropolitan status (urban, suburban, or rural), and enrollment. The predictors of student-level nonresponse will include these same predictors of school-level nonresponse plus the additional data that will be obtained on the sampling frame for all enrolled students: sex, race, ethnicity, and participation in an IEP.
Because of the central importance of the analysis weights to the validity of every statistical analysis, a senior statistician will thoroughly check each set of weights before we
Appendix A—Field Test and Main Study Sampling Specifications
180
release them for use in statistical analyses. The most fundamental type of check will be verification of totals that are algebraically equivalent (e.g., marginal totals of the weights of eligible students prior to nonresponse adjustment and of respondents after nonresponse adjustment). In addition, various analytic properties of the initial weights, the weight adjustment factors, and the final weights will be examined both overall and within sampling strata, including the:
distribution of the weights;
ratio of the maximum weight divided by the minimum weight; and
unequal weighting design effect, or variance inflation effect (1 + CV2).
We recommend that Taylor series linearization methods be used to compute design-consistent estimates of standard errors for ELS:2002 survey statistics. This methodology is used both by RTI’s proprietary SUDAAN software and by NCES’s DAS. To support these variance computations, each statistical analysis file will include not only the statistical analysis weight but also the first-stage sampling stratum and generic IDs representing the primary sampling units (i.e., the individual schools).
The ELS:2002 full-scale sampling plan will include more detailed specifications for the sample weighting and variance estimation procedures. We will submit all weight adjustment procedures to NCES for review and approval by the COTR prior to implementation. The final methodology report for ELS:2002 to be incorporated in the user’s manual will contain documentation of the final weighting and variance estimation procedures. In addition, it will include methodological analyses of survey design effects for key survey outcomes for the primary analysis domains and analyses of the potential for nonsampling errors, such as frame errors and nonresponse bias.

Appendix A—Field Test and Main Study Sampling Specifications
181
V. FIRST FOLLOW-UP
A. Sample Freshening
The basis for the sampling frame for the ELS:2002 first follow-up will be the sample of schools and students used in the ELS:2002 base year sample. There are two slightly different target populations, or populations of inferential interest, for the follow-up. One population consists of those students who are enrolled in the 10th grade in 2002. The other population consists of those students who are enrolled in the 12th grade in 2004. Because of this latter target population, the first follow-up will include, and will need procedures to deal with students at the base year sample school who are currently enrolled in the 12th grade but who were not in 10th
grade in the United States during the 2002 school year. During 2002 such students may have been out of the country, may have been enrolled in school in the U.S. in a grade other than 10th
(either at the sampled school or at some other school), or may have been enrolled in an ineligible school.
We will freshen the sample by including students who could not have been a part of the ELS:2002 sample. We will do this in order to make the follow-up sample representative of all high school 12th graders and address the target population consisting of students in the 12th grade in 2004. We will refine and test the freshening procedures during the first follow-up field test. The Recruiter will identify students eligible for inclusion in the freshening through telephone calls to the school. The freshening steps are as follows:
Step 1: The Recruiter will ask to have an alphabetical list (by stratum) of all 12th grade students e-mailed, faxed, sent via FTP, or mailed.
Step 2: The Recruiter will then identify the ELS:2002 base year sampled students on the list. For students not on the list, the Recruiter will determine where they would have been on the list if they were still enrolled.
Step 3: The Recruiter will next contact the school to determine, for each of the sampled students, whether the next person on the list is eligible for the freshened sample (i.e., not in the 10th grade in the U.S. in 2001-2002). If the base-year student is the last one on the list, then the next student will be the first student on the roster (i.e., we will “circularize” the roster). There will be the same number of next students as there are ELS:2002 sample students. If the next student is eligible for the freshened sample, then we select that student into the freshened sample. If the next student is not eligible for the freshened sample, then we do not select that student into the freshened sample.
Step 4: Whenever we add a student to the freshened sample in step 3, then the Recruiter determines the next student on the roster after the newly added student and repeats step 3. The Recruiter will continue the sequence of steps 3 and 4, adding more students to the freshened
Appendix A—Field Test and Main Study Sampling Specifications
182
sample, until reaching on the roster a student who was in 10th grade in the United States in the 2000-2001 school year (2001-2002, for the full-scale study).
B. Weights and Variance Estimates
We will compute two types of statistical analysis weights for respondents in the ELS:2002 first follow-up sample: cross-sectional weights and panel weights. We will compute the cross-sectional weights to support analyses based only on the responses of the participants in the second follow-up survey. This will include both the 10th grade cohort interviewed two years after the base survey and the cohort of current 12th grade students, including the students selected for sample “freshening.”
The sets of respondents for whom we will compute follow-up survey weights are similar to those described in Section IV regarding the base-year survey weights. However, we will now be considering the response status in the follow-up survey for the cross-sectional weights and the response status in both the base-year and the follow-up survey for the panel weights. We will again consider the possibility of using a single set of weights for two or more comparable sets of respondents to avoid creating a plethora of statistical analysis weights. Our goal will be to keep the weighting scheme as simple as possible.
The target population for the follow-up survey and, hence, for the cross-sectional weights consists of the union of the members of the base-year 10th grade cohort who have not migrated out of the population (e.g., died or moved outside the U.S.) plus all 12th grade students enrolled in study-eligible schools at the time of the 2004 follow-up. Analyses of both the 10th grade cohort and the 12th grade cohort will be supported by the cross-sectional weights by treating the cohort of interest as the analysis domain, or subpopulation, for which estimates are required.
In addition, a new cross-sectional weight will be required to support analysis of dropouts.
The steps required for computing the cross-sectional weights for each set of respondents to the follow-up survey will be the following
Begin with the school-level weights adjusted for nonresponse from the base-year weighting process.
Calculate the design-based student sampling weight component as follows:
– For members of the 10th grade cohort who are still at the base-year school at the time of the follow-up survey, the design weight component is simply the reciprocal of their conditional probability of selection into the base-year sample (including those who were base-year nonrespondents).

Appendix A—Field Test and Main Study Sampling Specifications
183
– For members of the 10th grade cohort who have transferred out of the base-year school at the time of the follow-up survey, the design weight component is the reciprocal of the product of their conditional probability of selection into the base-year sample times the rate at which transfer students were subsampled.
– For members of the 12th grade cohort who were not enrolled in the 10th grade in a study-eligible school in 2002 (i.e., members of the freshening sample), the design weight component is the same as that for the student on the sampling frame to which the student was linked for sample selection (i.e., the base-year sample student immediately preceding the new sample student on the sampling frame).
Calculate adjustments for nonresponse of students (questionnaire completers; questionnaire and test completers), contextual student sample (test-eligible and test ineligible), dropouts, and transcripts3, usually using bounded logistic regression models for response propensity. Important predictors of response status are likely to include sample component (in 10th grade cohort and still in the sample school, transferred out, dropped out, out-of-sequence [retained or early graduate], or in the freshening sample), base year response status, school characteristics available from the sampling frame, and the data obtained on the student sampling frame (sex, race/ethnicity, and IEP status), especially for the members of the freshening sample.
Perform generalized raking to known population totals simultaneously for both the 10th grade cohort and the 12th grade cohort. For members of the 10th grade cohort, the base-year population totals will be preserved, except for adjustments for migration out of the cohort due to death or moving outside the eligible population of schools. For the 12th grade cohort, we will base the raking or poststratification totals on up-to-date administrative record totals for the Year 2004 12th grade population.
Investigate the need to trim and smooth outlier weights to reduce mean squared error, using generalized raking procedures for the smoothing step.
The steps required for computing the panel weights for each set of respondents to both the base-year and follow-up surveys will be the following:
Begin with the base-year analysis weights, fully adjusted for nonresponse and poststratified to base-year population totals.
3 To complete the picture of the first follow-up weights, it should be noted that, although the timing makes this a task to be conducted after the conclusion of the current contract, there is a further possible nonresponse-adjusted weight that may be required. This weight would reflect the presence or absence of academic transcripts for each sample student. As with other nonresponse-adjusted weights attached to the student, a high response rate may obviate the need for such a weight.

Appendix A—Field Test and Main Study Sampling Specifications
184
Adjust for members of the 10th grade cohort who have become ineligible because of death or transfer out of the U.S.
Calculate nonresponse adjustments using bounded logistic regression models for response propensity. Include all base-year poststratificationfactors in the model so that the base-year population totals will be preserved, except as modified by the fact that some members of the cohort have become ineligible for follow-up. Important predictors of response status are likely to include sample component (in 10th grade cohort and still in the sample school, transferred out, or dropped out), base year response status, school characteristics available from the sampling frame, and the data obtained on the student sampling frame (gender, race/ethnicity, and IEP status).
Investigate the need to trim and smooth outlier weights to reduce mean squared error, using generalized raking procedures for the smoothing step.
As discussed in Section IV, we will thoroughly check all statistical analysis weights before we release them for use in statistical analyses. We will submit all specifications for sample weighting to NCES for approval prior to implementation. The final analysis files will support use of Taylor series linearization methods for computing design-consistent estimates of standard errors. The final methodology report to be incorporated in the user’s manual will include methodological analysis of survey design effects and the potential for nonsampling errors.

Appendix A—Field Test and Main Study Sampling Specifications
185
REFERENCES
Chromy, J.R. (1979). "Sequential Sample Selection Methods." Proceedings of the AmericanStatistical Association Section on Survey Research Methods, pp. 401-406.
Deville, J. and Särndal, C. (1992). “Calibration Estimators in Survey Sampling.” Journal of the American Statistical Association, Vol. 87, No. 418, pp. 376-382.
Folsom, R.E. (1991). "Exponential and Logistic Weight Adjustments for Sampling and Nonresponse Error Reduction." Proceedings of the Social Statistics Section of the American Statistical Association, 197-202.
Folsom, R.E., F.J. Potter and S.R. Williams (1987). "Notes on a Composite Size Measure for Self-Weighting Samples in Multiple Domains." Proceedings of the American Statistical Association Section on Survey Research Methods, pp. 792-796.
Williams, R.L. and J.R. Chromy (1980). "SAS Sample Selection MACROS." Proceedings of the Fifth Annual SAS Users Group International Conference, pp. 392-396.

Appendix A—Field Test and Main Study Sampling Specifications
186
APPENDIX A: DETAILS OF ELS:2002 SCHOOL AND STUDENT SAMPLING
A.1 School Sampling
This appendix gives the mathematical details of the school sampling design for the full-scale survey. We will use a composite measure of size sampling approach to select the school sample because, as demonstrated by Folsom et al (1987), composite measure of size sampling designs are useful for achieving self-weighting samples for multiple analysis domains (e.g., student by school strata) in multistage sampling designs with equal workloads for all primary sampling units (schools).
We begin by defining notation for the strata, the student sampling rates, and the composite measure of size for schools, as follows:
(1) r = 1, 2, ..., 48 indexes the school strata. (Region by Metro Status by Public/Catholic/Other Private)
(2) s = 1, 2, 3 indexes the student strata.
(3) j = 1, 2, ..., J(r) indexes the schools in stratum “r.”
(4) Mrs(j) = number of students enrolled in the 10th grade in 2002 who belong to student stratum “s” at the j-th school in stratum “r” based on the latest QED data.
(5) mrs = number of students, adjusted for nonresponse, to be selected from student stratum “s” within the r-th school stratum, referred to henceforth as student stratum “rs.”
The overall population sampling rate for student stratum “rs” then is given by
where
frs mrs / Mrs ( ) ,
Mrs( )J(r)
j 1Mrs(j) .

Appendix A—Field Test and Main Study Sampling Specifications
187
We will compute the student sampling rates, frs, based on the final sample allocation and frame data regarding the population sizes.
We will then define the composite measure of size for the j-th school in stratum “r” as
which is the number of students that would be selected from the j-th school if all schools on the frame were to be sampled.
We will select an independent sample of schools for each school stratum using Chromy's sequential, pmr sampling algorithm to select schools with probabilities proportional to their measures of size (Chromy, 1979). However, rather than allow multiple selections of sample schools, we will select with certainty those schools with expected frequencies of selection greater than unity (1.00), and we will select the remainder of the school sample from the remaining schools in each stratum. This process makes it unnecessary to select multiple second-stage samples of students by precluding schools with multiple selections at the first stage of sampling. Therefore, the expected frequency of selection for the j-th school in school stratum “r” is given by
where
and nr is the number of non-certainty selections from stratum “r.”
Within each of the “r” school strata, we will stratify implicitly by sorting the stratum “r” sampling frame in a serpentine manner (see Williams and Chromy, 1980) by state. The objectives of this additional, implicit stratification are to ensure proportionate representation of all states.
S r(j)3
s 1f rs Mrs(j) ,
r ( j )
nr S r ( j )
S r ( ), for non certa inty selections;
1 , for certainty selections ;
S r ( )J(r)
j 1Sr ( j ) ,
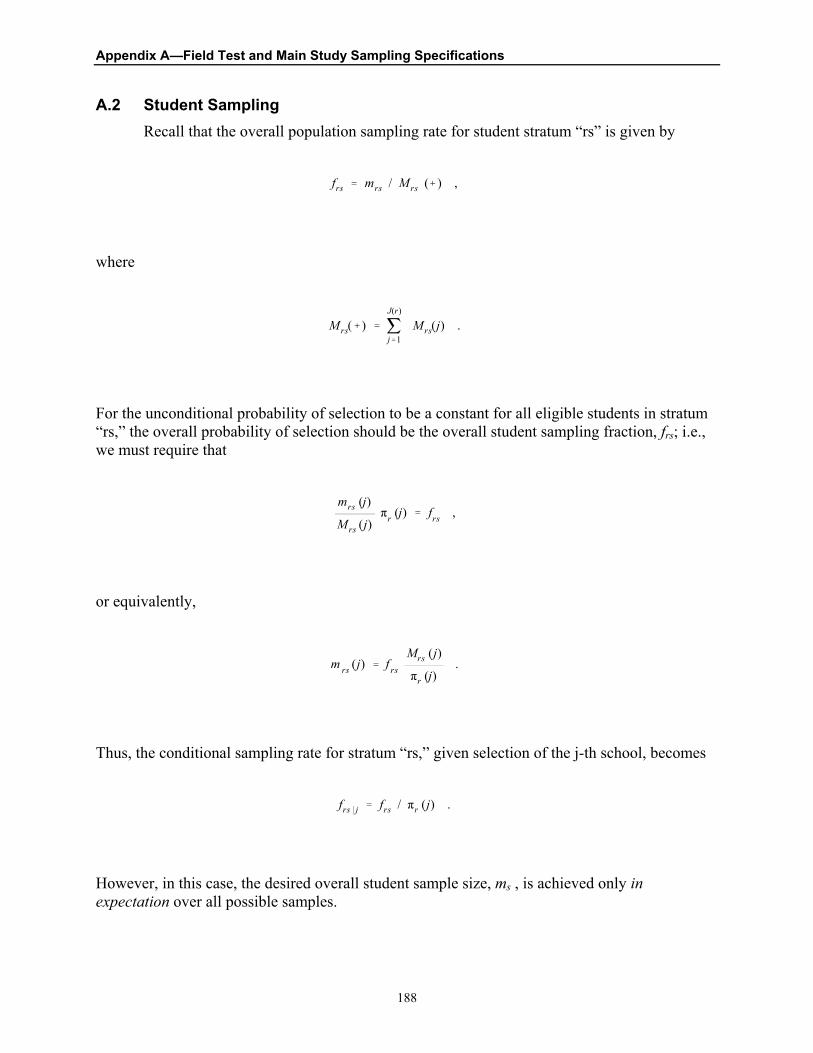
Appendix A—Field Test and Main Study Sampling Specifications
188
A.2 Student SamplingRecall that the overall population sampling rate for student stratum “rs” is given by
where
For the unconditional probability of selection to be a constant for all eligible students in stratum “rs,” the overall probability of selection should be the overall student sampling fraction, frs; i.e., we must require that
or equivalently,
Thus, the conditional sampling rate for stratum “rs,” given selection of the j-th school, becomes
However, in this case, the desired overall student sample size, ms , is achieved only in expectation over all possible samples.
frs mrs / Mrs ( ) ,
Mrs( )J(r)
j 1Mrs(j) .
mrs (j)
Mrs (j) r (j) frs ,
m rs (j) f rs
Mrs (j)
r (j).
frs j frs / r (j) .

Appendix A—Field Test and Main Study Sampling Specifications
189
Achieving the desired sample sizes with equal probabilities within strata in the particular sample that has been selected and simultaneously adjusting for school nonresponse and ineligibility requires that
where “R” denotes the set of eligible, responding schools. If we let the conditional student sampling rate for stratum “rs” in the j-th school be
we then require
or equivalently,
where
Since it will be necessary to set the student sampling rates before we have complete information on eligibility and response status, we will calculate Mrs as follows:
j Rm rs (j) mrs ,
f̂rs j f̂ rs / r (j) ,
i Rf̂ rs
Mrs (j)
r (j)mrs ,
f̂ rs mrs / M̂rs ,
M̂rsj R
Mrs (j)
r (j).

Appendix A—Field Test and Main Study Sampling Specifications
190
where “S” denotes the set of all sample schools,
Er = the school eligibility factor for school stratum “r,”
Rr = the school response factor for school stratum “r,”
Ers = the student eligibility factor for student stratum “rs.”
M̂ rsj S
Mrs (j)
r (j)[ Er Rr Ers ] ,
191
Main Study Sampling Specifications

Appendix A—Field Test and Main Study Sampling Specifications
192

193
Education Longitudinal Study:2002(ELS:2002)
Sampling Specifications for the Base Year Full-Scale Study
Prepared by:
Research Triangle Institute P.O. Box 12194
Research Triangle Park, NC 27709 March 16, 2001
Sample Design Consultants: Peter Siegel, RTI
James Chromy, RTI Daniel Pratt, RTI
Steven Ingels, RTI Martin Frankel, Abt Associates Inc.
Jeffrey Owings, NCES Steven Kaufman, NCES
Ralph Lee, NCES

Appendix A—Field Test and Main Study Sampling Specifications
194

Appendix A—Field Test and Main Study Sampling Specifications
195
I. Introduction
These sampling specifications provide details of the ELS:2002 base year full-scale sample design, as well as preliminary plans for the base year full-scale weighting and for the sampling and weighting in the base year full-scale first follow-up. Section II contains the full-scale sample design, Section III contains weighting plans for the full-scale study, Section IVcontains our plans for freshening the sample and weighting in the first follow-up, and AppendixA contains details of the school and student sampling.

Appendix A—Field Test and Main Study Sampling Specifications
196
II. FULL-SCALE SAMPLE
A. School Frame
We plan to select the school sample in March 2001. We will use the preliminary 1999-2000 Common Core of Data (CCD) and the provisional 1999-2000 Private School Survey (PSS) data files of public and private schools, respectively, as the sampling frames.
The survey population for the full-scale ELS:2002 consists of spring term 10th graders in 2002 enrolled in school in the United States (50 states and District of Columbia) in
regular public schools, including State Department of Education schools and charter schools and
Catholic and other private schools.
We will exclude these types of schools from the school sampling frame:
Schools with no 10th grade. We will use the low grade and high grade indicators to identify such schools. However, there are a couple of hundred schools that have grade levels not including a 10th grade but do have a positive 10th grade enrollment. There are also schools with a grade span including 10th grade but that have zero 10th grade enrollments. We will include such schools as long as the school name does not indicate that the school is an elementary, middle, or junior high school.
Schools with no enrollment, which indicates that the school does not directly enroll students. Students at such schools are counted with their “home” school, and will be in the student population.
Ungraded schools. If the low grade and high grade indicators are both ‘UG’ or ‘00’, then we will classify the school as ungraded, unless the 10th grade enrollment is greater than zero.
Bureau of Indian Affairs (BIA) schools. We will identify such schools using the state FIPS code = 59.
Special education schools. We will classify schools as such if the indicator of school type is special education. Some schools for the blind and deaf are not indicated as special education, so we will exclude schools with the words “blind”, “unsighted”, “deaf”, or “impaired” in the school name (after manual verification).
Area vocational schools that do not enroll students directly. We will classify public schools as such if the indicator of school type is vocational and total enrollment is zero.
Schools that are detention centers or correctional facilities. We will exclude schools with the words “detention”, “correctional”, or “jail” in the school name (after manual verification).
Department of Defense (DOD) schools outside of the United States. We will identify such schools using the state FIPS code = 58.

Appendix A—Field Test and Main Study Sampling Specifications
197
Closed public schools. We will identify these schools using the status code on the CCD. We cannot identify closed private schools on the PSS.
If 10th grade enrollment is unavailable on the school sample frame for any school, we will impute the enrollment for 10th grade based on the school’s total enrollment, if known, or otherwise by using the median value of the enrollment for that grade for the appropriate stratum.
New high schools are not very common, and they are most common for small private schools. Since we will be selecting schools from a sampling frame which will be two years old during the school year of the study, we will explore the possibility of updating the sample by adding some new schools to the sample. We will do a frame comparison between the 1998-1999 CCD and the 1999-2000 CCD and between the 1997-1998 PSS and the 1999-2000 PSS to determine the frequency of new high schools. If the number of new high schools is significant, then we will determine a reasonable approach to determining the presence of new schools that will open in the fall of 2001 and how to select a sample of these schools. One possibility is during the spring of 2001, we could determine the presence of new schools that will open in the fall of 2001. We could identify such new schools perhaps by asking all or a sample of states and/or districts during ELS spring 2001 activities. Then, we could select a sample of these new schools to be included in ELS:2002.
We selected the field test sample in such a way as to not harm the full-scale sample. First, we excluded several schools with a large enrollment which we are likely to select with certainty in the full-scale study. To determine these schools, we formed a sample frame similar to the one that will be used in the full-scale study, computed each school’s composite measure of size (MOS), and determined which schools we are likely to select with certainty based on this MOS.
Second, we designed the field test sample such that schools selected for the field test will not be in the full-scale sample. For the field test, we selected a stratified simple random sample of schools using strata similar to those we will use in the full-scale study. We will make no probability-based inferences for the field test even though we will select a probability-based sample because the sample will be too small to support such inferences. Our objective is to have the complement of the field test sample, which we will use for the full-scale study, to be a probability-based sample. The key fact which makes this procedure work is that the complement of a simple random sample is also a simple random sample and therefore representative of the full population. For the full-scale study, we will delete field test sample schools from the frame, and each school on the sampling frame will receive a first-stage sampling weight based on the probability that it was not selected for the field test. These weights will be 1.0 for schools not on the field test frame (e.g., certainty schools, new schools, and schools not in the field test states) and will be only slightly greater than 1.0 for the other schools because of the small numbers of schools that we selected from each stratum for the field test sample. We will multiply these weights by the full-scale school sampling weights so that we can make inferences to the full population. An important benefit of this method of selecting the schools for the field test is that we can use more recent versions of the CCD and PSS for the full-scale sampling frame (e.g., the 1999-2000 CCD and PSS) without losing the ability to generalize to the full population. This method makes no assumptions for the field test and full-scale study sampling frames. The impact of a school closing between the field test and full-scale study should be negligible since

Appendix A—Field Test and Main Study Sampling Specifications
198
we will be selecting a probability-proportionate-to-size (PPS) sample of schools for the full-scale study. However, for the full-scale sample schools, we will post-stratify the student counts, so that we account for any differences between the field test and full-scale frames. In order for the sample to be properly allocated for the full-scale study, we will allocate the sample before deleting the field test sample schools from the frame, and the full-scale strata need to include the field test strata. We will use the NCES unique school identification numbers when matching the field test frame to the full-scale frame. We will sort nonmatches within state by school name and other fields as necessary and then manually check for additional matches.
B. School Sample
We will select a stratified probability-proportionate-to-size (PPS) sample of schools. For selecting schools, we will use a composite size measure methodology that was developed by RTI statisticians (Folsom, Potter, and Williams, 1987). This methodology will allow us to (1) achieve the targeted sample sizes of Hispanic, Asian, and other students; (2) have approximately equal sampling weights for students within each of the race/ethnic groups; and (3) have approximately equal total student sample sizes within each sampled school. We will select a sample of approximately 800 (600 public, 200 private) schools from the school sampling frame. We will stratify the sampling frame for public schools by the nine-level Census divisions defined as:
New England/Middle Atlantic: CT ME MA NH NJ NY PA RI VT;
East North Central: IL IN MI OH WI;
West North Central: IA KS MN MO NE ND SD;
South Atlantic: DE DC FL GA MD NC SC VA WV;
East South Central: AL KY MS TN;
West South Central: AR LA OK TX;
Mountain: AZ CO ID MT NV NM UT WY; and
Pacific: AK CA HI OR WA.
We will combine the New England and Middle Atlantic Census divisions to be consistent with the NELS:88 stratification. We will substratify each region which contains a field test state (FL, IL, NC, NY, and TX), so that we correctly allocate and select the school sample. We will also substratify states which we expect to have a public school sample size of at least 30 and therefore have a state-representative sample. Based on the 1997-98 CCD, we expect CA, FL, NY, and TX to have state-representative samples. Three of these states already will be substrata because they are in the field test. The substrata will be each state in the field test, each state with a state-representative sample, and all other states. For example, we will substratify the South Atlantic by NC, FL, and all other states. Within each of these public school regional strata or substrata, we will stratify by metropolitan status based on CCD locale codes and defined as:
Urban: the school is in a large or mid-size central city;

Appendix A—Field Test and Main Study Sampling Specifications
199
Suburban: the school is in a large or small town or is on the urban fringe of a large or mid-size city; and
Rural: the school is in a rural area, either inside or outside a MSA.
These definitions are consistent with the NELS:88 stratification. Within each explicit stratum, we will implicitly stratify by state.
We will stratify the sampling frame for Catholic and other private schools by Catholic and other private schools. We will identify Catholic schools as those schools with affiliation identified on the PSS as Roman Catholic. We will then stratify by the four-level Census regions defined as:
Northeast: CT ME MA NH NJ NY PA RI VT;
Midwest: IL IN IA KS MI MN MO NE ND OH SD WI;
South: AL AR DE DC FL GA KY LA MD MS NC OK SC TN TX VA WV; and
West: AK AZ CA CO HI ID MT NV NM OR UT WA WY;
We will substratify each region which contains a field test state, so that we correctly allocate and select the school sample. There are no states with a private school state-representative sample. The substrata will be each state in the field test and all other states. For example, we will substratify the South by NC, FL, and all other states. Within each of these private school regional strata or substrata, we will stratify the private schools by metropolitan status based on PSS data and defined similarly to the public school metropolitan status strata. Within each explicit stratum, we will implicitly stratify by religious affiliation.
We will allocate 600 participating public schools proportional to the number of 10th
grade students contained within each public school stratum or substratum. We will allocate 100 participating Catholic schools and 100 participating other private schools proportional to the number of 10th grade students contained within each Catholic and other private school stratum or substratum, respectively. Table 1 gives an approximate allocation of schools to the strata, based on 1997-98 CCD and PSS data.
We will select a sample larger than 800 schools to compensate for the anticipated nonresponse. In NELS:88 there was a reserve sample of schools. A sample was drawn which was twice as large as needed, and within each substratum, schools were randomly assigned to the main sample pool (pool 1) or the reserve sample pool (pool 2). All of the pool 1 sample schools were fielded. If the number of responding schools in a stratum was below a prespecified target number, then some, but not necessarily all, schools from pool 2 were contacted (Spencer et al., 1990). Other assessment studies, such as NAEP and some international studies, also use a reserve sample of schools. However, some of the methods used cause concern about whether the final sample is still a probability sample and about how to compute response rates.
Some studies, such as SASS, inflate the school sample size based on expected response and eligibility rates for the strata. For this method to be effective, there needs to be solid, recent experience about expected response rates by stratum.

Appendix A—Field Test and Main Study Sampling Specifications
200
For ELS:2002, we propose a hybrid approach of the two methods mentioned above to account for school nonresponse. We will randomly divide the sample by stratum into two release pools and a reserve pool. The two release pools will be the basic sample with the schools in the second pool being released randomly within stratum in waves as needed to achieve the sample size goal. Also, we will release the reserve pool selectively in waves by simple random sampling within stratum for strata with very low response rates, if necessary. To determine the overall sample size, we need to make assumptions about the expected response rate. Based on historical response rates in NELS:88 and HS&B, we expect an overall response rate of approximately 70%, but we will try to achieve a response rate greater than 70%. We plan to increase the sample size to 1,600 since there is uncertainty about achieving a response rate of at least 70% (sample size of 1,143). Such a response rate may be harder to achieve now than was the case in NELS and HS&B because we are discovering in the field test that schools and districts are raising concerns about allowing access to students in a school environment, the amount of high stakes testing in schools, and the inundation of research studies in schools.
We will select a PPS sample of all 1,600 schools, as described above. We will randomly select 1,000 of the 1,600 schools for the first release pool. Based on response rates from NELS:88, we expect rates possibly higher than 80 percent in a few strata, such as urban Catholic schools in the Northeast and much less than 80 percent in a few strata, such as other private schools in the Northeast. Therefore, the 1,000 schools in the first release pool assumes an 80 percent overall response rate, but the sample size in some strata will assume greater than an 80 percent response rate. The sample size in some other strata will assume less than an 80 percent response rate. We will randomly select 143 schools from the remaining 600 schools for the second release pool to get a 70% overall response rate, and all remaining 457 schools will be in the reserve pool. We will not assume less than a 50 percent response rate in any strata if simulations that we will run indicate that we may have problems with self-representing schools in those strata. This approach is similar to other probability samples done when response rates by stratum are uncertain. With this sampling method, extra schools released may be in districts that have already refused. We will compute the unweighted response rate as the number of responding schools divided by the number of released, eligible schools.
Keith Rust, the Sampling Director for NAEP, has provisionally agreed to let us select the ELS:2002 school sample before he selects the national NAEP 2002 school sample. He will then minimize overlap between the two samples when he draws the NAEP sample. He prefers to minimize overlap with our primary sample and not our reserve sample. However, with our proposed hybrid approach, we need to select all schools at the same time. Ideally, NAEP will minimize overlap with all ELS sample schools, but if NAEP will only minimize overlap with the 1,000 or 1,143 schools in the basic sample (release pools 1 and/or 2), then any ELS schools in release pool 2 and/or the reserve pool that are also chosen for NAEP or the reserve pool for NAEP may need to be in both samples or treated as ELS nonrespondents. Also, in 2004, the ELS sample schools will already have been selected, so we will advise that national NAEP 2004 try to avoid these sample schools. We will not minimize overlap with schools in the 2002 state NAEP since the state NAEP sample students will be eighth graders and usually not in high schools. If any ELS schools do overlap with any schools in state NAEP, the NAEP students and most teachers would not be involved in ELS. In 2004, SASS can avoid the ELS sample schools, if desired.

Appendix A—Field Test and Main Study Sampling Specifications
201
Some states may contract with RTI for state supplements to the sample so that the sample is state-representative for certain states. However, at the time that we select the ELS national sample, we will not know for certain which states these will be. We do not want to compromise the national design for the promise of state supplements, so we will select any state supplemental samples after selecting the national sample. We will do so by using the Keyfitz or random rounding procedure taking into account schools’ prior probabilities of selection. We will also use the Keyfitz or random rounding procedure to minimize overlap between the state supplemental samples and the national NAEP 2002 sample schools. However, this will only work in large states and when we select the state supplemental sample after the NAEP sample schools have been identified.
After we select the sample of public schools, we will determine in which school districts the public sample schools are located and in which dioceses the Catholic schools are located.We will recruit these school districts and dioceses for their cooperation to allow the sample schools to participate, but we will not attempt any district-level interviews. We will purchase a database of schools, school districts, and dioceses from Quality Education Data, Inc. (QED). After selecting the sample schools, we will match the sample schools with the QED database on CCD or PSS school ID and other fields, as necessary, such as name, address, and phone number. For matching schools, we will get the principal’s name from the QED file. After we identify the districts for public schools and the dioceses for Catholic schools, we will match the sample districts and dioceses with the QED database on CCD or PSS district ID and other fields, as necessary, such as name, address, and phone number. For matching public districts, we will get the superintendent’s name from the QED file, and for matching diocese, we will get the contact’s name, phone number, and address from the QED file since these are not available on the PSS file. We need this information for our initial contacts with the schools, districts, and dioceses.For schools, public districts, and diocese that do not match to the QED, we will obtain current principal, superintendent, or contact information, respectively, from the Internet or from the district/diocese and/or school through initial telephone contacts made by our recruiters. For example, we will use the American Schools Directory (ASD) on the Internet to obtain principal names for public and private schools.

Appendix A—Field Test and Main Study Sampling Specifications
202
Table 1—Preliminary school strata and sample allocationRegion/metro status Sample size
Public Schools
Total public Urban SuburbanRural
600 195 321 84
New England Urban SuburbanRural
266
164
Mid East Urban SuburbanRural
90304911
Great Lakes Urban SuburbanRural
99305316
PlainsUrban SuburbanRural
45102312
Southeast Urban SuburbanRural
141 427524
SouthwestUrban SuburbanRural
713231
8Rocky Mountains Urban SuburbanRural
236
134
Far West Urban SuburbanRural
105 3961
5Catholic Schools
Total Private Urban SuburbanRural
100 5939
2NortheastUrban SuburbanRural
351817
0
Central Urban
3218

Appendix A—Field Test and Main Study Sampling Specifications
203
Region/metro status Sample size
SuburbanRural
122
South Urban SuburbanRural
1410
40
WestUrban SuburbanRural
1913
60
Other Private Schools
Total Private Urban SuburbanRural
100 444412
NortheastUrban SuburbanRural
269
134
Central Urban SuburbanRural
18882
South Urban SuburbanRural
311413
4WestUrban SuburbanRural
251310
2
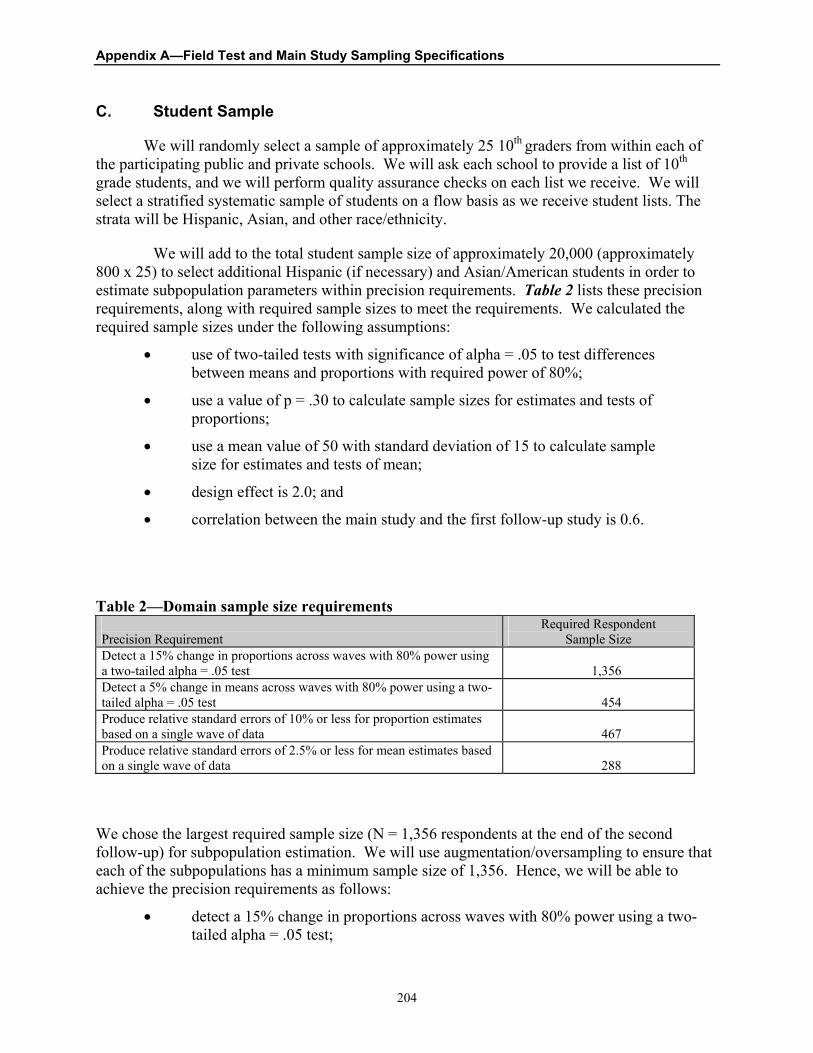
Appendix A—Field Test and Main Study Sampling Specifications
204
C. Student Sample
We will randomly select a sample of approximately 25 10th graders from within each of the participating public and private schools. We will ask each school to provide a list of 10th
grade students, and we will perform quality assurance checks on each list we receive. We will select a stratified systematic sample of students on a flow basis as we receive student lists. The strata will be Hispanic, Asian, and other race/ethnicity.
We will add to the total student sample size of approximately 20,000 (approximately 800 x 25) to select additional Hispanic (if necessary) and Asian/American students in order to estimate subpopulation parameters within precision requirements. Table 2 lists these precision requirements, along with required sample sizes to meet the requirements. We calculated the required sample sizes under the following assumptions:
use of two-tailed tests with significance of alpha = .05 to test differences between means and proportions with required power of 80%;
use a value of p = .30 to calculate sample sizes for estimates and tests of proportions;
use a mean value of 50 with standard deviation of 15 to calculate sample size for estimates and tests of mean;
design effect is 2.0; and
correlation between the main study and the first follow-up study is 0.6.
Table 2—Domain sample size requirements
Precision Requirement Required Respondent
Sample Size Detect a 15% change in proportions across waves with 80% power using a two-tailed alpha = .05 test 1,356 Detect a 5% change in means across waves with 80% power using a two-tailed alpha = .05 test 454 Produce relative standard errors of 10% or less for proportion estimates based on a single wave of data 467 Produce relative standard errors of 2.5% or less for mean estimates based on a single wave of data 288
We chose the largest required sample size (N = 1,356 respondents at the end of the second follow-up) for subpopulation estimation. We will use augmentation/oversampling to ensure that each of the subpopulations has a minimum sample size of 1,356. Hence, we will be able to achieve the precision requirements as follows:
detect a 15% change in proportions across waves with 80% power using a two-tailed alpha = .05 test;

Appendix A—Field Test and Main Study Sampling Specifications
205
detect a 5% change in means across waves with 99% power using a two-tailed alpha = .05 test;
produce relative standard errors of 6% or less for proportion estimates based on a single wave of data; and
produce relative standard errors of 1.25% or less for mean estimates based on a single wave of data.
We inflated this sample size by the expected student response rate of 92% at the baseline and an expected response rate of 95% at the first follow-up. In addition, we increased this number by 10% to account for ineligibles and those we are unable to locate in later years. This gives an initial (baseline) sample size of 1,710 Asian and 1,710 Hispanic students. Our approximations using the race/ethnic percentages for public schools from the 1999-2000 CCD indicate that in a sample of approximately 15,000 public school students (approximately 600 x 25), we would expect to sample a minimum of 651 Asian students, 2,042 Hispanic students, and 12,307 others, without any oversampling. (The file indicates that about 4.3% of public school students are Asian and 13.6% are Hispanic.) Thus, we will increase the sample size to include additional public school students in the sample, and the total initial student sample size will be approximately 21,059 (approximately 20,000 + 1710 – 651). We will allocate a sample size of 1,710 Asians, so that we meet the precision requirements. We will allocate the remaining sample size proportionally to the Hispanic and other race student strata, but we will adjust the sample sizes, if necessary, to meet the precision requirements for Hispanics. After, we select the school sample, we will adjust the sample rates, if necessary, depending on the actual number of expected Asians and Hispanics in the sample schools. The CCD and PSS files contain the counts of students in each of the public schools who are Asian, Hispanic, black, white, and other, and we will be able to use this information in determining each school’s composite measure of size.
D. Student Eligibility
All spring term 2002 sophomores in eligible schools except for foreign exchange studentswill be eligible for the study. This means that several categories of students who were ineligible for HS&B and NELS:88 will be eligible for ELS:2002 (though it does not mean that such students will necessarily be tested or complete questionnaires).
In NELS:88, the following categories of students were deemed ineligible:
Students with disabilities (including students with physical or mental disabilities, or serious emotional disturbance, and who normally will have an assigned IEP) whose degree of disability was deemed by school officials to make it be impractical or inadvisable to assess them;
Students whose command of the English language was insufficient, in the judgment of school officials, for understanding the survey materials and who therefore could not validly be assessed in English.

Appendix A—Field Test and Main Study Sampling Specifications
206
In ELS:2002, the treatment of these categories of students will be addressed in the following way. First, schools will be given clear criteria for inclusion and exclusion of students. Students should not be excluded categorically (e.g., just because they receive special education services, have IEPs, receive bilingual education or ESL services) but rather on a case-by-case (individual) basis. It is our assumption that many IEP or LEP students will be able to participate, and when the school is in doubt, the student should be included. The ELS:2002 test battery is an adaptive test, and thus better suited to students with learning disabilities, than a conventional test. More specifically, the ELS:2002 battery is a two-stage assessment (routing test and second-stage test) that is designed to avoid floor effects and therefore contains many items that are well below grade level. Students of lower achievement will be routed to a simpler second-stage form of the test (that is, one with easier items, items that correspond to their mastery level). We will also note the several testing accommodations (see below) that we can provide, and encourage schools to permit us to survey and test students under these special conditions.
Second, to the extent possible, given practical and monetary constraints, accommodations may be offered to increase the number of participants. All tests taken under conditions of special accommodations will be flagged, and the nature of the accommodation noted.
In theory, many kinds of accommodations are possible. There are accommodations of test presentation, of response, of setting, and of allotted testing time.
Accommodations can be in regard to test presentation -- e.g., on math tests one might read problems aloud, have someone sign the directions, use a taped version of the test, provide a Braille edition of the test, or a large-print edition, or use of magnifying equipment. While ELS cannot, for example, provide Braille translations, when a school can assist in providing a presentational accommodation (as with magnifying equipment, or an aide who translates directions into American Sign Language), its use will be acceptable.
A second type of accommodation is that for response -- response in Braille, sign language, use of keyboard, specially designed writing tool and so on. ELS:2002 will not have a special way to answer the potential need for response accommodations.
A third accommodation is setting -- small group, individual (say for an emotionally disturbed student). This accommodation is not difficult to provide, but it is costly. Within cost constraints (assuming extreme rarity of the need for this kind of accommodation), we may be able to provide this accommodation.
A fourth kind of accommodation is timing. Although tests were strictly timed in the three prior high school longitudinal studies, giving extra time poses less of a threat to validity for ELS:2002, given that it is an adaptive test and if extra time is restricted to the second stage of the test. In any case, instances in which extra time is provided would be flagged. There are three ways of proceeding -- give extra time in one session; keep testing time constant in minutes tested but give more breaks; or split test sessions over several days. There are costs, currently unbudgeted, for any of these approaches, although multi-day sessions have the biggest impact on

Appendix A—Field Test and Main Study Sampling Specifications
207
the budget. We will explore the cost and practicality of extending the length of the testing session for students requiring this accommodation.
Third, disability status will be re-assessed in the follow-up round. A special substudy of excluded students was conducted in NELS:88 (Ingels, 1996). It was found that there was considerable change in eligibility status, especially for students excluded for reasons of their English language proficiency, across rounds (for example 71% of base year excluded LEPs became eligible over time, as did 57% of the entire excluded group). Since for ELS, like NELS:88, the sample design calls for generating representative senior cohorts as well as sophomore, these status changes should be taken into account. Moreover, the senior year will be treated as a baseline for a new panel (that is, 2004 seniors), making data collected from excluded sophomores who progress to senior year in the modal sequence fully usable for the study.
Fourth, enrollment status, records, and contextual data will be gathered for students deemed unable to validly be assessed. For example, in addition to documenting the reasons test-exempted students could not be assessed, we will track their enrollment status so that we will know whether they are in school or are dropouts two years later. We will collect parent questionnaires for these students. We will collect teacher reports for these students. Finally, we will collect high school transcripts for these students as well. A contextual or expanded sample weight – in distinction to the student questionnaire completion weight – will be created to facilitate analysis that includes students who are exempted from completing the survey forms.
E. Specifications for Enrollment Lists
We will ask each sample school to provide an electronic or hard-copy listing of all their 10th grade students currently enrolled.
The information requested for each eligible student will be:
student ID number;
Social Security Number (may be the same as the ID number; this item is optional);
full name;
sex;
race/ethnicity (white; black; Asian; Native Hawaiian or Other Pacific Islander; American Indian or Alaska Native; Hispanic; other); and
whether or not an Individualized Education Program (IEP) is currently filed for the student (yes, no).
We will need the race/ethnicity variables to allow us to oversample Asians and Hispanics. The race, ethnicity, sex, and IEP variables may be useful for nonresponse adjustments.
We will request that the electronic list be a column formatted or comma delimited ASCII file or Excel file. Schools will be able to provide the electronic lists via e-mail, using File

Appendix A—Field Test and Main Study Sampling Specifications
208
Transfer Protocol (FTP), providing a diskette or CD-ROM containing the file, or uploading the file to the ELS website. If the school cannot provide electronic lists, then we will ask for hard-copy lists, preferably in alphabetic order within race/ethnicity strata to facilitate stratified systematic sampling. We will, of course, accept whatever the school can provide to select the student samples; however, we will make every effort to facilitate receiving uniformly formatted electronic files from as many schools as possible because we can process them more quickly, more reliably, and at less cost.
The specifications for the list request will be clearly presented and their importance explained in the School Coordinator’s packet. In addition to informational items described in Section II-E, the coordinator’s packet will contain detailed instructions for preparing the student lists, school ID labels to place on all diskettes and hardcopy lists, an express mail airbill, and instructions for sending the file layouts and data files to RTI via e-mail, FTP, or uploading if any of those options is desired. The detailed instructions will include guidelines identifying the eligible students and data elements to be listed by the school, completed hardcopy examples, a transmittal form with the file layout for electronic files, and a checklist for proper completion of hard-copy lists.
F. Quality Assurance Checks
We will perform quality assurance (QA) checks on all lists we receive. Any lists that are unreadable will immediately fail the QA checks. Since we will stratify the students by Hispanics, Asians, and other race/ethnicity, the list will fail the QA checks if it does not allow us to stratify the students.
We will also check the school’s count of 10th grade students to verify that the school provided a complete list of eligible students. For public and private schools, we will compare the provided counts of 10th graders with the total counts and counts by strata on the frame (CCD and PSS). The PSS does not provide counts by the strata, so we will estimate the race/ethnicity breakdowns by assuming the percentage of students in the school of a certain race/ethnicity is similar to the percentage of that race/ethnicity for 10th graders. The CCD and PSS contain flags which identify if the enrollment has been imputed, but the PSS. For schools with an imputed enrollment, we will not compare the counts, and the list will pass the QA check. If any of the counts of 10th graders for total students or by the race/ethnicity strata on the provided list are 25% lower or higher than the frame counts, then the list will fail the QA check unless the provided count is greater than zero and the absolute difference is less than 100. However, if the provided count of Hispanics or Asians is zero and the frame count is less than five, the count will not fail the QA check.
Schools that fail the QA check will be recontacted by the school Recruiter to resolve the discrepancy and to verify that the school representative who prepared the student lists clearly understood our request and provided lists of the eligible students. When we determine that the initial list provided by the school is not satisfactory, we will request a replacement list. If the school confirms that the list is correct or if the school sends a replacement list, we will proceed with selecting sample students. If the school refuses to send a replacement list, then we will proceed with selecting sample students, if possible.
G. Student Sample from Lists

Appendix A—Field Test and Main Study Sampling Specifications
209
We will sample students from schools on a flow basis as we receive student lists. We will use stratified systematic sampling procedures for both electronic and hard-copy lists. For each school, we will fix the student sample rates rather than the student sample sizes for the following reasons:
to facilitate sampling students on a flow basis as we receive student lists, and
because sampling at a fixed rate based on the overall student stratum sampling rate and the school probabilities of selection results in approximately equal overall probabilities of selection within the ultimate school by student strata. See Appendix A for mathematical details of student sampling.
Each time we release schools from the second release pool or the reserve sample pool, we will adjust the sampling rates to account for the nonresponding schools and the new schools.
For schools that provide electronic lists of students, we will stratify the lists by race/ethnicity within grade level and select a stratified systematic sample of students.
For schools that provide hard-copy lists, we will use an efficient two-stage process that we have previously developed to select systematic samples from hard-copy lists. We will first select sample pages and then select sample students within strata from the selected pages. We set the page sampling rate so that approximately 10 students are selected from each page. This is particularly efficient for long lists. After we select the sample, we will key the sample.
When a hard-copy list includes Hispanic and other race students together who must be sampled at different rates, we will initially sample the lists at the higher student sampling rate. Then, after we key the initial sample, we will subsample the stratum which had the lower sampling rates to achieve the proper sample inclusion rates. When a hard-copy list includes Asian students not separated form the other students, we will key a student identifier for these Asian students and separately select a systematic sample. This will avoid potential sample size and precision problems for the Asian students that may occur due to clustering of last names on the enrollment list.
After we select the student sample, we will verify that the sample size is within reasonable bounds of the school’s expected sample size. If the total number of sample students is less than ten (unless we have selected all students) or if the number selected is greater than 35, then we will adjust the sampling rates accordingly and re-select the sample.
We will modify our list processing and sampling menu system, so that it will help us efficiently process lists, do quality checks on lists, and sample students from the lists. The menu system allows us to view data files, SAS logs, and SAS output; run SAS programs; and input status codes, problem codes and descriptions, and sample counts into the Survey Control System (SCS). We will also make any necessary modifications to our program to break up names into first, middle, and last names if the name is sent as one field.
The SCS will keep track of the status of the list processing and sampling. When we receive a list, we will enter the receipt date, type of list, and information about the sender into the SCS. We will enter the results of the QA checks into the SCS and keep track of follow-up telephone calls to the schools to resolve QA problems. As we select the student samples, we will

Appendix A—Field Test and Main Study Sampling Specifications
210
add data to the SCS for each sample student, including a unique student study ID number (other than the SSN), the school’s study ID, student SSN, student ID, grade, IEP indicator, name, sex, race/ethnicity, and student stratum. We will also create a master sample file which will be a dataset of all sample students which will include the data we are adding to the SCS, school sampling weight, and student sampling weight.
H. Sample Updating
We will select the student sample in the fall so that we can identify sample teachers (see Section II-I) and prepare materials well in advance of Survey Day. However, selecting the sample in advance means that some students will have transferred into the sample schools and others will have left between the time of sample selection and survey day.
In previous studies such as HS&B and NELS:88, as part of the sample updating procedure schools were asked to supply a list of students in the indicated grade who had newly enrolled in the school since the time that the original sample had been drawn. Analysis of such lists both in NELS:88 (Ingels, Scott & Taylor, 1998, p.112) and in the NAEP trial assessments (Spencer, 1991, p.6) suggested that there was systematic and serious underreporting of students who had transferred in. It is in order to address this problem that we are proposing to collect complete enrollment lists at both the time of initial sampling and the time of the sample update.
For identifying students who have transferred into the school since the first list was prepared, we will use a technique known as the “half-open interval rule.” The steps are similar to those for “freshening” the sample with 12th graders in the first follow-up (see Section IV-A).At the time of the initial request for the student lists, we will inform the school that a second listing of students will be necessary approximately three weeks prior to data collection to allow sample updating. If the school requires explicit, or active, parental consent, then we will request the second listing approximately five weeks prior to data collection in order to have enough time to resolve issues related to obtaining permission for students to be in the study. This second list will allow transfer students the opportunity to be selected. The steps in the procedure are as follows:
Step 1: The Recruiter will request an updated list of all 10th grade students. If the school provides electronic lists, then we will sort both the first and second lists in the same order. If the school sends hard-copy lists for both the first and second lists, then the school needs to sort the second list in the same way as the first list (e.g., both sorted alphabetically for each stratum).
Step 2: We will perform QA checks and problem resolution similar to the procedures described in Section II-F. We will expect the counts of students within each stratum to be similar to the counts on the first list. If any of the counts of 10th graders for total students or by the race/ethnicity strata on the updated list are 25% lower or higher than the counts on the original list, then the list will fail QA check unless the provided count is greater than zero and the absolute difference is less than 50. However, if the updated count of Hispanics or Asians is zero and the original count was less than three, the count will not fail the QA check.

Appendix A—Field Test and Main Study Sampling Specifications
211
Step 3: We will then identify the sampled ELS:2002 students on the new list. For students not on this list, we will determine where they would have been on the list if they were still enrolled.
Step 4: To select transfer students at the same rate as the initial sample, we will compare the first requested student lists from which we selected the sample of approximately 25 10th graders to the second lists. If the person immediately following each sampled individual within the race/ethnicity strata4 on the second list is not on the first list (for whatever reason), then we will assume that student is a transfer student and we will include that student in the sample. If the last student on the list is a sampled student, then the next student will be the first student on the list (i.e., we will “circularize” the list).
Step 5: Whenever we add a transfer student to the sample, then we will determine if the next student on the roster is a transfer student or not.Once we identify a student who is not a transfer student, then the process will continue for the next sample student on the roster. We will continue the sequence of steps 4 and 5, adding more transfer students, until a student who was enrolled at the time of the initial list is reached on the roster.
We will also use these second lists to identify students who are no longer at the school. If a sample student is not on the second list, then that student is no longer at the school and no longer in the sample. However, we will still implement the check for transfer students based on where the student would have been on the second list, if the student was still enrolled.
I. Teacher and Parent Samples
ELS:2002 will include a teacher survey that gathers teacher reports on students’ learning experiences and performance. These data supplement the parent and student reports, providing another viewpoint on the complex issues of what students have achieved as of the 10th grade and what they are being asked to learn in the 10th grade. We will sample only mathematics and English teachers of ELS sampled students, so teachers will be in sample only if they teach students who were sampled for ELS. The teacher sample size is estimated to be approximately 8,500.
Some sample students may have more than one or no mathematics or English teacher during the 2001-2002 school year (e.g., different teachers for the fall and spring terms). In these situations, we recommend using the fall term teacher as the relevant reference point, if possible.We will decide which mathematics or English teacher, if any, to include in the teacher sample as follows:
If fall teacher A and spring teacher B, then sample fall teacher A;
4 Race/ethnicity strata for students on both the original and new lists are based on the original list that was used for sampling, even if the student’s race/ethnicity is reported differently on the new list.

Appendix A—Field Test and Main Study Sampling Specifications
212
If fall teacher A has left the school and spring teacher B is present, then sample spring teacher B;
If no fall teacher but one spring teacher, then sample spring teacher;
If no fall teacher but two or more spring teachers, then randomly select one to be in sample;
If no spring teacher but fall teacher, then sample fall teacher;
If two or more fall teachers, then randomly select one to be in sample; and
If no fall teacher and no spring teacher, then no teacher in sample.
For each sample student, there will be one sample parent. We will follow the NELS:88 procedures of identifying the sample parent by asking which parent, in two-parent households, is most knowledgeable about the student’s educational situation. For one-parent households, that parent is in sample.
III. BASE YEAR WEIGHTS AND VARIANCE ESTIMATES
The ELS:2002 multilevel and multicomponent design introduces significant complexity to the task of weighting the base year data. Notwithstanding the complexity of the design, we are committed to keeping the base year weights as simple and intuitive as possible. There could be as few as three final (i.e., nonresponse adjusted) base year weights: a weight for student questionnaire completion, a contextual data weight for the “expanded” sample of questionnaire-eligible and questionnaire-ineligible (traditionally excluded) sophomores, and a school weight. To the extent permitted by achievement of response rate goals and the need to support special analytic objectives, we will keep the base year weights as simple—that is, as few in number—as possible.
We will compute statistical analysis weights for use in analysis of the ELS:2002 base year survey data to achieve the following study objectives:
to enable design-unbiased estimates of population totals, and
to reduce the potential for nonresponse bias.
We will achieve the first objective by computing initial, design-based weights that are equal to the reciprocal of the probability of selection for each sampling unit (e.g., sample student). The methodologies that we will use to perform the weight adjustments for achieving the second objective include the following:
Divisors formed as weighted response rates within “weighting classes” defined by cross-classifying categorical variables known for respondents and nonrespondents.

Appendix A—Field Test and Main Study Sampling Specifications
213
Divisors formed by fitting bounded logistic response propensity models. When fit using survey weighted, logistic regression algorithms, these individual response propensities are smoothed and bounded versions of the weighting class nonresponse adjustments.
Ratio-adjustment multipliers formed for post-strata to force nonresponse adjusted weight sums to replicate administrative record based population totals for the units of interest (e.g., schools or students). Raking and generalized raking extensions accommodate more control variables, while smoothing and bounding the adjustments.
When response rates are high and the numbers of variables available for both responding and nonresponding units is limited, the weighting class method cannot be substantially improved. This method may be sufficient for school-level nonresponse. When these conditions are not satisfied, the bounded logistic regression and generalized raking procedures afford considerable opportunity for improved reduction of nonresponse bias, relative to the weighting class methods.
The bounded logistic regression methodology that RTI will use for most nonresponse adjustments has several properties that will result in efficient and effective weight adjustments for ELS:2002. Some of those properties include the following:
The models can accommodate a large number of statistically significant predictors of response status, which results in greater reduction of nonresponse bias.
The reweighted respondent sample total for any predictor variable will be equal to its full-sample weighted total because we use generalized raking equations developed by Folsom (1991) to obtain the logistic regression coefficients for the response propensity model. Specifically, if ri is the zero/one response indicator for the i-th sample member and Xi = ( 1, xi ) with xi depicting the row vector of response predictor variables, possibly including continuous measures, then the inverse logistic response propensity weight multiplier is
and the generalized raking solution equations are
ˆ 1i [ 1 + exp ( -Xi
ˆ ) ] (1)

Appendix A—Field Test and Main Study Sampling Specifications
214
where wi is the full sample base weight, XiT depicts the column vector of predictors, and the
summations extend over all sample members. A Newton-Raphson algorithm that typically converges rapidly, even for models with relatively large (100 plus element) predictor vectors, xi, is used to fit the model.
We will use automatic interaction detection (AID) to efficiently identify significant interaction terms for the logistic regression models. AID performs segmentation analysis, and it will help us develop good models for predicting propensity to respond, therefore effectively adjusting for nonresponse. By including dummy variables for all but one of the cells of the AID partition in the response propensity model, we can be confident that we have included all important interactions. We will then have weights which provide effective compensation for nonresponse bias.
We limit the variance inflation resulting from the inverse logistic response propensity weight multipliers, i, by using an adaptation of Deville and Särndal’s (1992) bounded exponential function to create a constrained logistic function that is bounded below by a prespecified lower limit, L. This leads to an upper bound on the weight multipliers of L-1. This adaptation allows us to incorporate the typical rule-of-thumb type bounds that are often placed on weighting class adjustments (e.g., i
-1 is required to be less than two or three).
The generalized raking methodology that we will use for most poststratification weight adjustments also has several properties that will result in efficient and effective weight adjustments for ELS:2002. Some of those properties include the following:
The generalized raking models will include continuous variables, which allows control to known population totals for continuous outcomes.
Another advantage of our bounded generalized raking algorithm over standard raking is the ability to preset upper and lower bounds, say U=2 and L=0.5, for the poststratification weight adjustments. Specifically, an adaptation of Deville and Särndal’s (1992) bounded exponential function is used in which the weight adjustment factor is
(3)
i sriw i [ 1 + exp ( -X i
ˆ ) ] X Ti =
i sw i X T
i (2)
i exp ( Xiˆ )i exp ( Xiˆ )
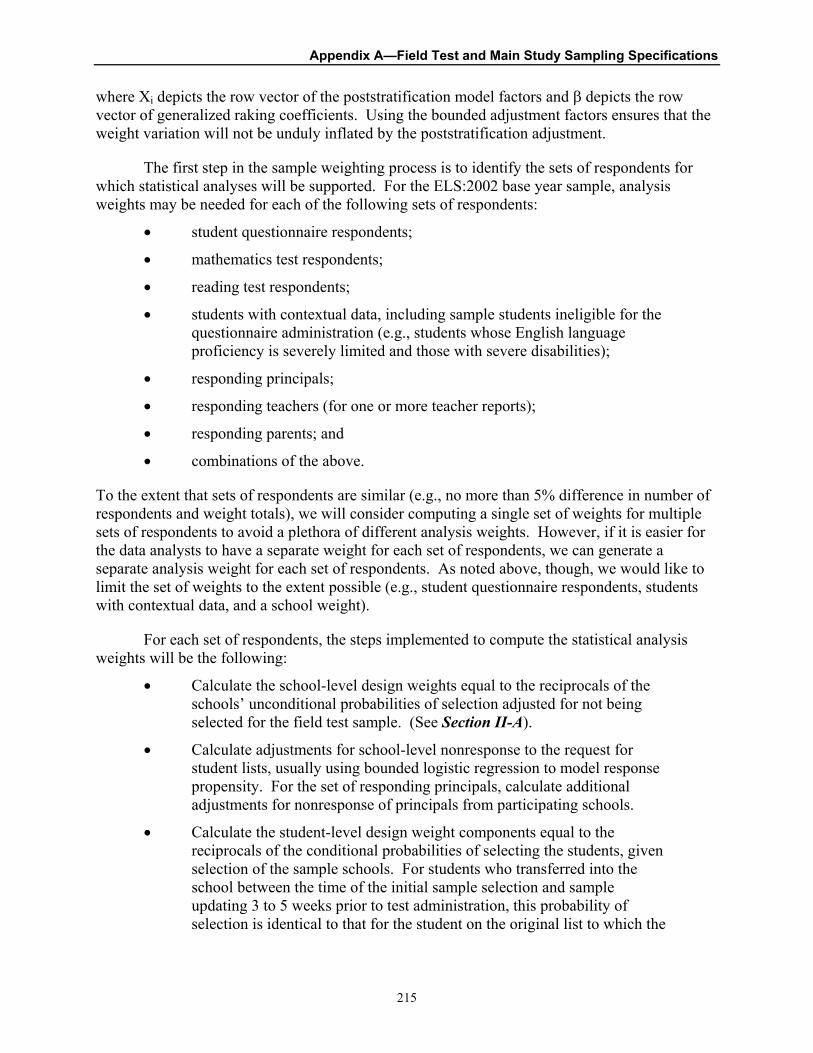
Appendix A—Field Test and Main Study Sampling Specifications
215
where Xi depicts the row vector of the poststratification model factors and depicts the row vector of generalized raking coefficients. Using the bounded adjustment factors ensures that the weight variation will not be unduly inflated by the poststratification adjustment.
The first step in the sample weighting process is to identify the sets of respondents for which statistical analyses will be supported. For the ELS:2002 base year sample, analysis weights may be needed for each of the following sets of respondents:
student questionnaire respondents;
mathematics test respondents;
reading test respondents;
students with contextual data, including sample students ineligible for the questionnaire administration (e.g., students whose English language proficiency is severely limited and those with severe disabilities);
responding principals;
responding teachers (for one or more teacher reports);
responding parents; and
combinations of the above.
To the extent that sets of respondents are similar (e.g., no more than 5% difference in number of respondents and weight totals), we will consider computing a single set of weights for multiple sets of respondents to avoid a plethora of different analysis weights. However, if it is easier for the data analysts to have a separate weight for each set of respondents, we can generate a separate analysis weight for each set of respondents. As noted above, though, we would like to limit the set of weights to the extent possible (e.g., student questionnaire respondents, students with contextual data, and a school weight).
For each set of respondents, the steps implemented to compute the statistical analysis weights will be the following:
Calculate the school-level design weights equal to the reciprocals of the schools’ unconditional probabilities of selection adjusted for not being selected for the field test sample. (See Section II-A).
Calculate adjustments for school-level nonresponse to the request for student lists, usually using bounded logistic regression to model response propensity. For the set of responding principals, calculate additional adjustments for nonresponse of principals from participating schools.
Calculate the student-level design weight components equal to the reciprocals of the conditional probabilities of selecting the students, given selection of the sample schools. For students who transferred into the school between the time of the initial sample selection and sample updating 3 to 5 weeks prior to test administration, this probability of selection is identical to that for the student on the original list to which the

Appendix A—Field Test and Main Study Sampling Specifications
216
transfer student is linked (i.e., the original sample student immediately preceding the transfer student on the sampling frame).
Calculate adjustments for nonresponse of students, teachers, parents, and other sets of respondents based on the student sample, usually using bounded logistic regression models for response propensity.
Perform generalized raking or poststratification to population totals based on the most current administrative record totals.
Investigate the need to trim and smooth outlier weights to reduce mean squared error, using generalized raking or poststratification for the smoothing step.
The data needed to support the logistic models for school-level nonresponse will come from the school-level sampling frame, as well as from the data obtained for nonresponding schools during the school recruitment task. Predictors of school-level nonresponse will include sector (public, Catholic, or other private), region, metropolitan status (urban, suburban, or rural), and enrollment. The predictors of student-level nonresponse will include these same predictors of school-level nonresponse plus the additional data that will be obtained on the sampling frame for all enrolled students: sex, race, ethnicity, and participation in an IEP.
Because of the central importance of the analysis weights to population estimation, a senior statistician will thoroughly check each set of weights before we release them for use in statistical analyses. The most fundamental type of check will be verification of totals that are algebraically equivalent (e.g., marginal totals of the weights of eligible students prior to nonresponse adjustment and of respondents after nonresponse adjustment). In addition, various analytic properties of the initial weights, the weight adjustment factors, and the final weights will be examined both overall and within sampling strata, including the:
distribution of the weights;
ratio of the maximum weight divided by the minimum weight; and
unequal weighting design effect, or variance inflation effect (1 + CV2).
We recommend that Taylor series linearization methods be used to compute design-consistent estimates of standard errors for ELS:2002 survey statistics. This methodology is used both by RTI’s proprietary SUDAAN software and by NCES’s DAS. To support these variance computations, each statistical analysis file will include not only the statistical analysis weight but also the first-stage sampling stratum and generic IDs representing the primary sampling units (i.e., the individual schools).
We will submit all weight adjustment procedures to NCES for review and approval by the COTR prior to implementation. The final methodology report for ELS:2002 to be incorporated in the user’s manual will contain documentation of the final weighting and variance estimation procedures. In addition, it will include methodological analyses of survey design effects for key survey outcomes for the primary analysis domains and analyses of the potential for nonsampling errors, such as frame errors and nonresponse bias.

Appendix A—Field Test and Main Study Sampling Specifications
217
IV. FIRST FOLLOW-UP
A. Sample Freshening
The basis for the sampling frame for the ELS:2002 first follow-up will be the sample of schools and students used in the ELS:2002 base year sample. There are two slightly different target populations, or populations of inferential interest, for the follow-up. One population consists of those students who are enrolled in the 10th grade in 2002. The other population consists of those students who are enrolled in the 12th grade in 2004. Because of this latter target population, the first follow-up will include, and will need procedures to deal with, students at the base year sample school who are currently enrolled in the 12th grade but who were not in 10th
grade in the United States during the 2002 school year. During 2002 such students may have been out of the country, may have been enrolled in school in the U.S. in a grade other than 10th
(either at the sampled school or at some other school), or may have been enrolled in an ineligible school. Also, some students may now be re-enrolled in school, although in the 2002 school year they were temporarily out of school, owing to illness or incarceration, home schooling, or school dropout.
We will freshen the sample by including students who could not have been a part of the ELS:2002 sample. We will do this in order to make the follow-up sample representative of all high school 12th graders and address the target population consisting of students in the 12th grade in 2004. We will refine and test the freshening procedures during the first follow-up field test. The freshening steps are as follows:
Step 1: The Recruiter will ask to have an alphabetical list (by stratum) of all 12th grade students e-mailed, faxed, sent via FTP, or mailed.
Step 2: We will perform QA checks and problem resolution similar to the procedures described in Sections II-F and II-H.
Step 3: We will then identify the ELS:2002 base year sampled students on the list. For students not on the list, the Recruiter will determine where they would have been on the list if they were still enrolled.
Step 4: We will next contact the school to determine, for each of the sampled students, whether the next person on the list within the race/ethnicity strata5 is eligible for the freshened sample (i.e., not in the 10th grade in the U.S. in 2001-2002). If the base-year student is the last one on the list, then the next student will be the first student on the roster (i.e., we will “circularize” the roster). There will be the same number of next students as there are ELS:2002 sample students. If the next student is eligible for the freshened sample, then we select that student into the freshened sample. If the next student is not eligible for the freshened sample, then we do not select that student into the freshened sample.
5 Race/ethnicity strata for students on both the original and new lists are based on the original list that was used for sampling, even if the student’s race/ethnicity is reported differently on the new list.

Appendix A—Field Test and Main Study Sampling Specifications
218
Step 5: Whenever we add a student to the freshened sample in step 4, then we will determine the next student on the roster after the newly added student and repeats step 4. The Recruiter will continue the sequence of steps 4 and 5, adding more students to the freshened sample, until reaching on the roster a student who was in 10th grade in the United States in the 2000-2001 school year (2001-2002, for the full-scale study).
B. Weights and Variance Estimates
We will compute two types of statistical analysis weights for respondents in the ELS:2002 first follow-up sample: cross-sectional weights and panel weights. We will compute the cross-sectional weights to support analyses based only on the responses of the participants in the second follow-up survey. This will include both the 10th grade cohort interviewed two years after the base survey and the cohort of current 12th grade students, including the students selected for sample “freshening.”
The sets of respondents for whom we will compute follow-up survey weights are similar to those described in Section III regarding the base-year survey weights. However, we will now be considering the response status in the follow-up survey for the cross-sectional weights and the response status in both the base-year and the follow-up survey for the panel weights. We will again consider the possibility of using a single set of weights for two or more comparable sets of respondents to avoid creating a plethora of statistical analysis weights. Our goal will be to keep the weighting scheme as simple as possible.
The target population for the follow-up survey and, hence, for the cross-sectional weights consists of the union of the members of the base-year 10th grade cohort who have not migrated out of the population (e.g., died or moved outside the U.S.) plus all 12th grade students enrolled in study-eligible schools at the time of the 2004 follow-up. Analyses of both the 10th grade cohort and the 12th grade cohort will be supported by the cross-sectional weights by treating the cohort of interest as the analysis domain, or subpopulation, for which estimates are required.
In addition, a new cross-sectional weight will be required to support analysis of dropouts.
The steps required for computing the cross-sectional weights for each set of respondents to the follow-up survey will be the following
Begin with the school-level weights adjusted for nonresponse from the base-year weighting process.
Calculate the design-based student sampling weight component as follows:
– For members of the 10th grade cohort who are still at the base-year school at the time of the follow-up survey, the design weight component is simply the reciprocal of their conditional

Appendix A—Field Test and Main Study Sampling Specifications
219
probability of selection into the base-year sample (including those who were base-year nonrespondents).
– For members of the 10th grade cohort who have transferred out of the base-year school at the time of the follow-up survey, the design weight component is the reciprocal of the product of their conditional probability of selection into the base-year sample times the rate at which transfer students were subsampled.
– For members of the 12th grade cohort who were not enrolled in the 10th grade in a study-eligible school in 2002 (i.e., members of the freshening sample), the design weight component is the same as that for the student on the sampling frame to which the student was linked for sample selection (i.e., the base-year sample student immediately preceding the new sample student on the sampling frame).
Calculate adjustments for nonresponse of students (questionnaire completers; questionnaire and test completers), contextual student sample (test-eligible and test ineligible), dropouts, and transcripts6, usually using bounded logistic regression models for response propensity. Important predictors of response status are likely to include sample component (in 10th grade cohort and still in the sample school, transferred out, dropped out, out-of-sequence [retained or early graduate], or in the freshening sample), base year response status, school characteristics available from the sampling frame, and the data obtained on the student sampling frame (sex, race/ethnicity, and IEP status), especially for the members of the freshening sample.
Perform generalized raking to known population totals simultaneously for both the 10th grade cohort and the 12th grade cohort. For members of the 10th grade cohort, the base-year population totals will be preserved, except for adjustments for migration out of the cohort due to death or moving outside the eligible population of schools. For the 12th grade cohort, we will base the raking or poststratification totals on up-to-date administrative record totals for the Year 2004 12th grade population.
Investigate the need to trim and smooth outlier weights to reduce mean squared error, using generalized raking procedures for the smoothing step.
The steps required for computing the panel weights for each set of respondents to both the base-year and follow-up surveys will be the following:
6 To complete the picture of the first follow-up weights, it should be noted that, although the timing makes this a task to be conducted after the conclusion of the current contract, there is a further possible nonresponse-adjusted weight that may be required. This weight would reflect the presence or absence of academic transcripts for each sample student. As with other nonresponse-adjusted weights attached to the student, a high response rate may obviate the need for such a weight.

Appendix A—Field Test and Main Study Sampling Specifications
220
Begin with the base-year analysis weights, fully adjusted for nonresponse and poststratified to base-year population totals.
Adjust for members of the 10th grade cohort who have become ineligible because of death or transfer out of the U.S.
Calculate nonresponse adjustments using bounded logistic regression models for response propensity. Include all base-year poststratificationfactors in the model so that the base-year population totals will be preserved, except as modified by the fact that some members of the cohort have become ineligible for follow-up. Important predictors of response status are likely to include sample component (in 10th grade cohort and still in the sample school, transferred out, or dropped out), base year response status, school characteristics available from the sampling frame, and the data obtained on the student sampling frame (gender, race/ethnicity, and IEP status).
Investigate the need to trim and smooth outlier weights to reduce mean squared error, using generalized raking procedures for the smoothing step.
As discussed in Section III, we will thoroughly check all statistical analysis weights before we release them for use in statistical analyses. We will submit all specifications for sample weighting to NCES for approval prior to implementation. The final analysis files will support use of Taylor series linearization methods for computing design-consistent estimates of standard errors. The final methodology report to be incorporated in the user’s manual will include methodological analysis of survey design effects and the potential for nonsampling errors.

Appendix A—Field Test and Main Study Sampling Specifications
221
REFERENCES
Chromy, J.R. (1979). "Sequential Sample Selection Methods." Proceedings of the AmericanStatistical Association Section on Survey Research Methods, pp. 401-406.
Deville, J. and Särndal, C. (1992). “Calibration Estimators in Survey Sampling.” Journal of the American Statistical Association, Vol. 87, No. 418, pp. 376-382.
Folsom, R.E. (1991). "Exponential and Logistic Weight Adjustments for Sampling and Nonresponse Error Reduction." Proceedings of the Social Statistics Section of the American Statistical Association, 197-202.
Folsom, R.E., F.J. Potter and S.R. Williams (1987). "Notes on a Composite Size Measure for Self-Weighting Samples in Multiple Domains." Proceedings of the American Statistical Association Section on Survey Research Methods, pp. 792-796.
Ingels, Steven J. (1996). Sample Exclusion in NELS:88 – Characteristics of Base Year Ineligible Students; Changes in Eligibility Status After Four Years. Washington, D.C.: National Center for Education Statistics (NCES 96-723).
Ingels, Steven, Leslie Scott, and John Taylor (1998). NELS:88 Base Year Through Second Follow-Up Final Methodology Report. NCES Working Paper 9806. Washington, D.C.: National Center for Education Statistics.
Spencer, Bruce D. (1991). “Eligibility/Exclusion Issues in the 1990 Trial State Assessment.” In George Borhnstedt, editor, Assessing Student Achievement in the States: Background Studies for the Evaluation of the NAEP Trial State Assessment. National Academy of Education. Stanford: Stanford University.
Spencer, Bruce D., M. Frankel, S. Ingels, K. Rasinski, R. Tourangeau, J. Owings (1990). National Education Longitudinal Study of 1988 Base Year Sample Design Report.Washington, D.C.: National Center for Education Statistics (NCES 90-463).
Williams, R.L. and J.R. Chromy (1980). "SAS Sample Selection MACROS." Proceedings of the Fifth Annual SAS Users Group International Conference, pp. 392-396.

Appendix A—Field Test and Main Study Sampling Specifications
222
APPENDIX A: DETAILS OF ELS:2002 SCHOOL AND STUDENT SAMPLING
A.1 School Sampling
This appendix gives the mathematical details of the school sampling design for the full-scale survey. We will use a composite measure of size sampling approach to select the school sample because, as demonstrated by Folsom et al (1987), composite measure of size sampling designs are useful for achieving self-weighting samples for multiple analysis domains (e.g., student by school strata) in multistage sampling designs with equal workloads for all primary sampling units (schools).
We begin by defining notation for the strata, the student sampling rates, and the composite measure of size for schools, as follows:
(1) r = 1, 2, ..., 66 indexes the school strata. (Region by Metro Status by Public/Catholic/Other Private)
(2) s = 1, 2, 3 indexes the student strata.
(3) j = 1, 2, ..., J(r) indexes the schools in stratum “r.”
(4) Mrs(j) = number of students enrolled in the 10th grade in 2002 who belong to student stratum “s” at the j-th school in stratum “r” based on the latest QED data.
(6) mrs = number of students, adjusted for nonresponse, to be selected from student stratum “s” within the r-th school stratum, referred to henceforth as student stratum “rs.”
The overall population sampling rate for student stratum “rs” then is given by
where
frs mrs / Mrs ( ) ,
Mrs( )J(r)
j 1Mrs(j) .
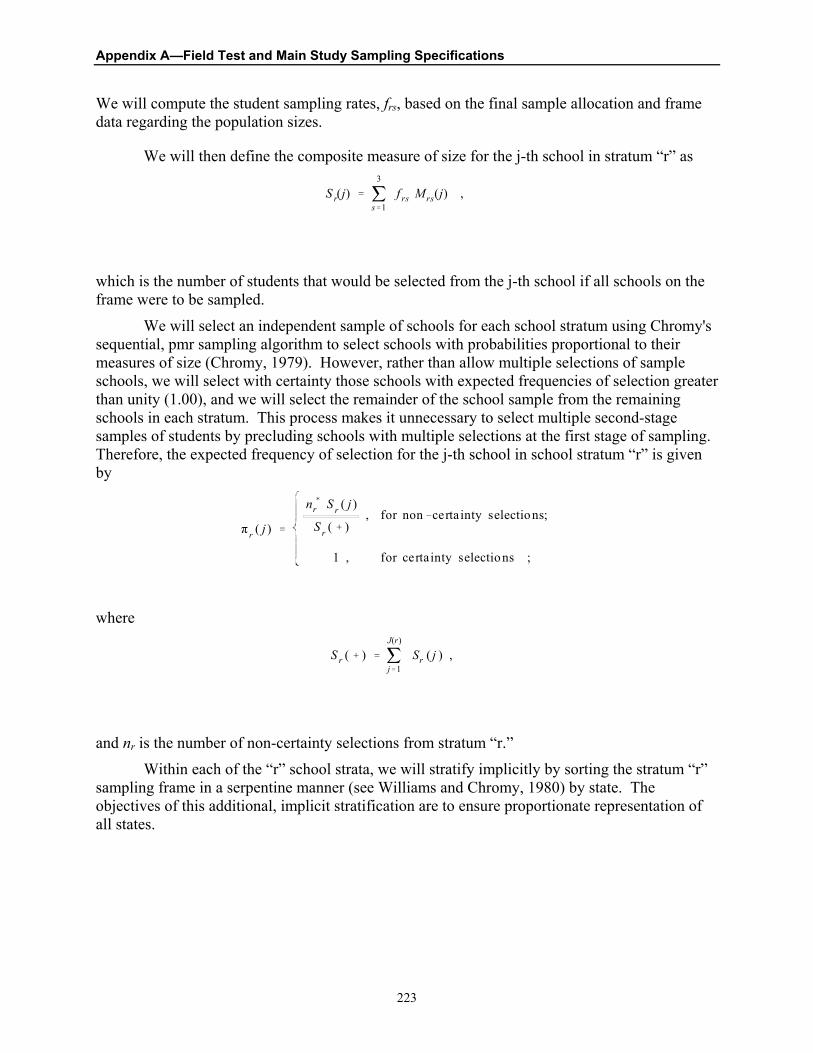
Appendix A—Field Test and Main Study Sampling Specifications
223
We will compute the student sampling rates, frs, based on the final sample allocation and frame data regarding the population sizes.
We will then define the composite measure of size for the j-th school in stratum “r” as
which is the number of students that would be selected from the j-th school if all schools on the frame were to be sampled.
We will select an independent sample of schools for each school stratum using Chromy's sequential, pmr sampling algorithm to select schools with probabilities proportional to their measures of size (Chromy, 1979). However, rather than allow multiple selections of sample schools, we will select with certainty those schools with expected frequencies of selection greater than unity (1.00), and we will select the remainder of the school sample from the remaining schools in each stratum. This process makes it unnecessary to select multiple second-stage samples of students by precluding schools with multiple selections at the first stage of sampling. Therefore, the expected frequency of selection for the j-th school in school stratum “r” is given by
where
and nr is the number of non-certainty selections from stratum “r.”
Within each of the “r” school strata, we will stratify implicitly by sorting the stratum “r” sampling frame in a serpentine manner (see Williams and Chromy, 1980) by state. The objectives of this additional, implicit stratification are to ensure proportionate representation of all states.
S r(j)3
s 1f rs Mrs(j) ,
r ( j )
nr S r ( j )
S r ( ), for non certa inty selections;
1 , for certainty selections ;
S r ( )J(r)
j 1Sr ( j ) ,

Appendix A—Field Test and Main Study Sampling Specifications
224
A.2 Student SamplingRecall that the overall population sampling rate for student stratum “rs” is given by
where
For the unconditional probability of selection to be a constant for all eligible students in stratum “rs,” the overall probability of selection should be the overall student sampling fraction, frs; i.e., we must require that
or equivalently,
Thus, the conditional sampling rate for stratum “rs,” given selection of the j-th school, becomes
However, in this case, the desired overall student sample size, ms , is achieved only in expectation over all possible samples.
Achieving the desired sample sizes with equal probabilities within strata in the particular sample that has been selected and simultaneously adjusting for school nonresponse and ineligibility requires that
frs mrs / Mrs ( ) ,
Mrs( )J(r)
j 1Mrs(j) .
mrs (j)
Mrs (j) r (j) frs ,
m rs (j) f rs
Mrs (j)
r (j).
frs j frs / r (j) .

Appendix A—Field Test and Main Study Sampling Specifications
225
where “R” denotes the set of eligible, responding schools. If we let the conditional student sampling rate for stratum “rs” in the j-th school be
we then require
or equivalently,
where
Since it will be necessary to set the student sampling rates before we have complete information on eligibility and response status, we will calculate Mrs as follows:
where “S” denotes the set of all sample schools,
Er = the school eligibility factor for school stratum “r,”
Rr = the school response factor for school stratum “r,”
Ers = the student eligibility factor for student stratum “rs.”
j Rm rs (j) mrs ,
f̂rs j f̂ rs / r (j) ,
i Rf̂ rs
Mrs (j)
r (j)mrs ,
f̂ rs mrs / M̂rs ,
M̂rsj R
Mrs (j)
r (j).
M̂ rsj S
Mrs (j)
r (j)[ Er Rr Ers ] ,

Appendix A—Field Test and Main Study Sampling Specifications
226
This page is intentionally left blank.

227
Appendix B Field Test Letters, Permission Forms, and Scripts

Appendix B—Field Test Letter, Permission Forms and Scripts
228
This page is intentionally blank.
Appendix B—Field Test Letter, Permission Forms and Scripts
229
<Title><fname><lname> <aname> — (agency name - either state, district, or school) <add1><add2><city>, <state> <zip>
Dear <Title><lname>:
The purpose of this letter is to inform your state education agency about the Education Longitudinal Study (ELS). As you may already know, ELS is a comprehensive longitudinal study that provides trend data about critical transitions experienced by young people as they develop, attend secondary and postsecondary schools, and embark on careers. We will be conducting a field test for ELS in the Spring of 2001. The main study will take place in the Spring of 2002. We will begin with a 10th grade cohort and data collection will take place approximately every two years. ELS is sponsored by the National Center for Education Statistics, U.S. Department of Education.
We ask your agency to support the participation of districts and schools in your state in ELS. The public school districts and private schools in your state which have been selected for the field test are named on the enclosed list. We will provide you with a list of the public school districts and private schools which have been selected for the main study in 2001 after that sample has been drawn.
The study will collect data at each school as follows:
� student cognitive tests in reading and math � student questionnaire � parent questionnaire � teacher questionnaires � school administrator questionnaire � school media center questionnaire
Study reports will not identify participating districts, schools, students, parents, or individual staff. To provide you with more information about the study, we have enclosed an ELS brochure.
Field test data will be collected at schools between February and April 2001.Followup for the field test will occur in 2003. Main study data will be collected in the Spring of 2002 and followup will occur in 2004. It may be possible to augment the

Appendix B—Field Test Letter, Permission Forms and Scripts
230
school and student sample to provide state level estimates. If you are interested in such an augmentation, we will provide you with details at a later date.
Your support for the study will help ensure the voluntary participation of the schools in your state. It would be very helpful if your agency would provide us with a letter in support of school participation in the ELS effort. We have enclosed an example letter of support for your use or modification along with a pre-addressed envelope that you can use to return the letter of support to Research Triangle Institute (RTI), the data collection contractor.
Within a few days, a representative of RTI will call you to discuss any questions that you may have. In the meantime, if you have any questions please contact Dan Pratt at RTI at (919) 541-6615; the toll-free number for ELS is (877) 226-0150. You also may contact me at (202) 502-7423.
Thank you for your support of ELS.
Sincerely,
Jeffrey Owings, Ph.D. Associate Commissioner, Elementary/Secondary & Libraries Studies Division National Center for Education Statistics

Appendix B—Field Test Letter, Permission Forms and Scripts
231
LEAD LETTER – STATE (RTI)
<Title><fname><lname> <aname> — (agency name - either state, district, or school) <add1><add2><city>, <state> <zip>
Dear <Title><lname>:
As the letter from Dr. Jeffrey Owings of the National Center for Education Statistics indicates, Research Triangle Institute (RTI) will be collecting data for the Education Longitudinal Study (ELS). We are excited about this opportunity to further knowledge about the effect of students' high school experiences on their future education and career plans.
We are also currently going through the approval process to gain endorsement from the Council of Chief State School Officers. They have endorsed each of the prior related National Center for Education Statistics-sponsored longitudinal studies. We hope that you will join us in endorsing this important study. We have enclosed a list of schools from your state which have been included in the ELS sample. The schools on the first list have been selected to participate as the primary sample. The ones on the second list have been selected as a backup sample. The backup sample will not be contacted unless we need to replace schools from the primary sample. Upon approval from your state, we will begin to contact the districts from the primary sample.
In a few days, our representative will contact you to discuss any questions or concerns that you may have. If you have any questions in the meantime, please feel free to contact me at (919) 541-6615. The toll-free number for ELS is (877) 226-0150.
Sincerely,
Dan Pratt Project Director Education Longitudinal Study

Appendix B—Field Test Letter, Permission Forms and Scripts
232
This page is intentionally blank.

Appendix B—Field Test Letter, Permission Forms and Scripts
233
<Title><fname><lname> <aname> — (agency name - either state, district, or school) <add1> <add2> <city>, <state> <zip>
Dear <Title><lname>:
The purpose of this letter is to inform your school district about the Education Longitudinal Study (ELS). As you may already know, ELS is a comprehensive longitudinal study that provides trend data about critical transitions experienced by young people as they develop, attend secondary and postsecondary schools, and embark on careers. We will be conducting the first phase of data collection for ELS in the Spring of 2001. The main study will take place in the Spring of 2002. We will begin with a 10th grade cohort and data collection will take place approximately every two years. ELS is sponsored by the National Center for Education Statistics, U.S. Department of Education.
We ask your agency to support the participation of schools in your district in ELS. The schools in your district which have been selected for the field test are named on the enclosed list.
The study will collect data at each school as follows: � student cognitive tests in reading and math � student questionnaire � parent questionnaire � teacher questionnaires � school administrator questionnaire � school media center questionnaire
Study reports will not identify participating districts, schools, students, parents, or individual staff. To provide you with more information about the study, we have enclosed an ELS brochure.
Field test data will be collected at schools between February and April 2001. Follow-up for the field test will occur in 2003.
Your support for the study will help ensure the voluntary participation of the schools in your district. It would be very helpful if you would provide us with a letter in support of school participation in the ELS effort. We have enclosed an example letter of support for your use or modification along with a pre-addressed envelope that you can use to return the letter of support to Research Triangle Institute (RTI), the data collection contractor.
Within a few days, a representative of RTI will call you to discuss any questions that you may have. In the meantime, if you have any questions please contact Dan Pratt at RTI at (919) 541-6615; the toll-free number for ELS is (877) 226-0150. You also may contact me at (202) 502-7423.
Thank you for your support of ELS.
Sincerely,
Jeffrey Owings, Ph.D. Associate Commissioner, Elementary/Secondary & Libraries Studies Division National Center for Education Statistics

Appendix B—Field Test Letter, Permission Forms and Scripts
234
This page is intentionally blank.

Appendix B—Field Test Letter, Permission Forms and Scripts
235
LEAD LETTER - DISTRICT (RTI)
<Title><fname><lname> <aname> — (agency name - either state, district, or school) <add1><add2><city>, <state> <zip>
Dear <Title><lname>:
As the letter from Dr. Jeffrey Owings of the National Center for Education Statistics indicates, Research Triangle Institute (RTI) will be collecting data for the Education Longitudinal Study (ELS). We are excited about this opportunity to further knowledge about the effect of students' high school experiences on their future education and career plans.
<State approver’s name>, an education official representing your state who we contacted earlier, has given us approval to contact your district about ELS. We are also currently going through the approval process to gain endorsement from the Council of Chief State School Officers. They have endorsed each of the prior related National Center for Education Statistics-sponsored longitudinal studies. We hope that you will join us in endorsing this important study. We have enclosed a list of schools from your district which have been included in the ELS sample. The schools on the first list have been selected to participate as the primary sample. The ones on the second list have been selected as a backup sample. The backup sample will not be contacted unless we need to replace schools from the primary sample. Upon approval from your district, we will begin to contact the schools from the primary sample.
In a few days, our representative will contact you to discuss any questions or concerns that you may have. If you have any questions in the meantime, please feel free to contact me at (919) 541-6615. The toll-free number for ELS is (877) 226-0150.
Sincerely,
Dan Pratt Project Director Education Longitudinal Study

Appendix B—Field Test Letter, Permission Forms and Scripts
236
This page is intentionally blank.

Appendix B—Field Test Letter, Permission Forms and Scripts
237
<Title><fname><lname> <aname> — (agency name - school) <add1><add2><city>, <state> <zip>
Dear <Title><lname>:
I am writing to request your school’s support for the Education Longitudinal Study (ELS). ELS is sponsored by the National Center for Education Statistics, U.S. Department of Education and conducted by Research Triangle Institute (RTI), a non-profit research organization in North Carolina.
As you may already know, ELS is a comprehensive longitudinal study that will follow a sophomore cohort over time, so that the effects of the high school experience upon their later educational, occupational, and social outcomes can be better understood.In addition, ELS will provide trend data through comparisons with earlier studies of the critical transitions experienced by young people as they develop, attend secondary and postsecondary schools, and embark upon careers. We will be conducting the first phase of data collection for ELS in the Spring of 2001.
The study will collect data at each school as follows:
� student cognitive tests in reading and math � student questionnaire � parent questionnaire � teacher questionnaires � school administrator questionnaire � school media center questionnaire
Study reports will not identify participating districts, schools, students, parents, or individual staff. To provide you with more information about the study, we have enclosed an ELS brochure. The National Association of Secondary School Principals recently endorsed ELS. Some of the other endorsing organizations are noted in the brochure.
Field test data will be collected at schools between February and April 2001.Follow-up for the field test will occur in 2003.

Appendix B—Field Test Letter, Permission Forms and Scripts
238
ELS complies with the provisions of the Family Education Rights and Privacy Act, 20 USC 1232g (FERPA). The study will be conducted so that study participants can not be identified other than by representatives of the research study.
Within a few days, a representative of RTI will call you to discuss any questions that you may have. In the meantime, if you have any questions please contact Dan Pratt at RTI at (919) 541-6615; the toll-free number for ELS is (877) 226-0150. You also may contact me at (202) 502-7423.
Thank you for your support of ELS.
Sincerely,
Jeffrey Owings, Ph.D. Associate Commissioner, Elementary/Secondary & Libraries Studies Division National Center for Education Statistics

Appendix B—Field Test Letter, Permission Forms and Scripts
239
<Title><fname><lname><aname> <add1><add2><city>,<state><zip>
Dear <Title><lname>:
As the letter from Dr. Jeffrey Owings of the National Center for Education Statistics indicates, Research Triangle Institute (RTI) will be collecting data for the Education Longitudinal Study (ELS). We are excited about this opportunity to further knowledge about the impact of the high school experience on academic performance and on future education and career choices.
The goal of the study is to better understand the impact of the high school experience on students’ academic performance, and to explore the transition from high school to postsecondary education, the work force, and other adult roles. ELS will help us investigate the features of effective schools and programs, the factors that promote academic growth over time, the process of dropping out of (and returning to) school, and the role of educational institutions in promoting equity and equal educational opportunity. Because ELS is a longitudinal study, it can effectively address important research and policy questions about educational processes. Because ELS builds upon earlier longitudinal studies, it will also support time series or trend data about youth in the high school years and in the transition to higher education and the labor market.
[only insert this paragraph for public schools] Earlier we contacted <state contact person> from your state education agency and <district contact> from your school district to let them know that we would be contacting your school about ELS.
In order for the data to be useful to the National Center for Education Statistics, and to education researchers in general, it is vital that as many schools as possible participate in ELS. Each selected school statistically represents many other schools with similar characteristics.
We would appreciate it if you could designate someone at your school who can be a study contact person, or ELS school coordinator, for us. We realize that your staff is busy. At the conclusion of data collection at your school, we would like to offer $25 to your ELS school coordinator as a token of appreciation for his/her assistance.
The study staff will draw a sample of approximately 25 students each from the 10th and 12th grades. In order to select a sample of your students, we need for you to provide us with a list of your 10th and 12th grade students. We also need a list of your full time teaching staff. We have included instructions on how to prepare these lists.
In a few days, our representative will contact you to discuss any questions or concerns that you may have. If you have any questions in the meantime, please feel free to contact me at (919) 541-6615. The toll-free number for ELS is (877) 226-0150.
Sincerely,
Dan Pratt Project Director Education Longitudinal Study
Appendix B—Field Test Letter, Permission Forms and Scripts
240
This page is intentionally blank.

Appendix B—Field Test Letter, Permission Forms and Scripts
241
Dear Parent or Guardian:
Your child has been selected to participate in the first phase of the Education Longitudinal Study of 2002 (ELS:2002). ELS:2002 is a comprehensive longitudinal study that provides information about the transitions experienced by young people as they develop, attend school, and start careers. Approximately 2500 students in five states have been selected to participate in this phase of the study. In the spring of 2001, we will be conducting ELS:2002 at your child’s school.
The U.S. Department of Education sponsors this study. Research Triangle Institute (RTI) has been contracted to collect the data for the study. The purpose of the study is to provide information that will be used by Congress, researchers, and policymakers to improve the quality of education in America. Your son or daughter will be asked to complete a student questionnaire and a cognitive assessment instrument at his/her school with approximately 25 other students from the tenth grade class. The time for completing the questionnaire and cognitive assessment instrument will be approximately 2.5 hours. The questionnaire will ask questions about his or her plans for the future, family and school life, and schoolwork. The cognitive assessment instrument will measure achievement in reading and mathematics. In addition, we would like to ask you to complete a Parent questionnaire that will provide important background information. We will also ask your child’s English and Math teachers to complete a Teacher questionnaire, which will include questions about your teenager’s classroom experiences.
An important feature of this study is that it follows the same students as they progress through school and eventually enter the work force and/or pursue higher education. In two years, we would like to contact your child again for a follow up questionnaire and cognitive assessment. We would also like to get a copy of his/her high school transcript. School transcripts will be used to determine what courses he or she has taken.
We cannot replace your child in our sample with anyone else. In order to locate our sample members in the future, we will ask your teenager for his or her address and telephone number and those of a relative or close friend.
Participation is voluntary. There is no penalty if you or your child elect not to participate. However, we do need your help in collecting these data. Your child was selected to represent many others. His/her responses are necessary to make the results of this important study accurate and timely. The National Center for Education Statistics (NCES) of the U.S. Department of Education is authorized by federal law (Public Law 103-382) to conduct the Education Longitudinal Study of 2002. Researchers may use the data for statistical purposes only and are subject to fines and imprisonment for misuse. Data will be combined to produce statistical reports for Congress and others. No individual data (e.g., names or addresses) will be reported.
Research procedures for this study involve no significant risks to respondents – students will only be asked to complete survey questionnaires and a cognitive assessment instrument in reading and math. Your child may refuse to answer any question that makes him/her feel uncomfortable. While there are no direct benefits to your child for participating, the survey may benefit all of the nation’s students by providing timely data relevant to educational policy making.
Because we plan to recontact your child in two years, we will notify you of any significant information about the study that may influence your willingness to allow your child to continue to participate. You or your child may withdraw from the study at any point.
If for any reason you object to your son or daughter’s participation, you may simply deny permission. If you do not want your son or daughter to participate, please fill out the

Appendix B—Field Test Letter, Permission Forms and Scripts
242
enclosed form and return it to your child’s school in the enclosed envelope as soon as possible. If you are willing to allow your son or daughter to participate, you do not need to return this form.
The enclosed brochure gives more information about the study. If you have any questions about ELS:2002 or your teenager’s participation in the survey, please call Amy Rees at RTI toll-free at 1-877-226-0150 between 9 AM and 5 PM Eastern time, Monday through Friday. If you have questions about your child’s rights as a study participant, you may call Dr. Kerrie Boyle at RTI toll free at (800) 334-8571, extension 6959. Both of these individuals can be reached at: Research Triangle Institute, P.O. Box 12194, Research Triangle Park, NC 27709.
We thank you in advance for your cooperation in this important research.
Sincerely,
Jeffrey Owings, Ph.D. Associate Commissioner, Elementary/Secondary & Libraries Studies Division
National Center for Education Statistics
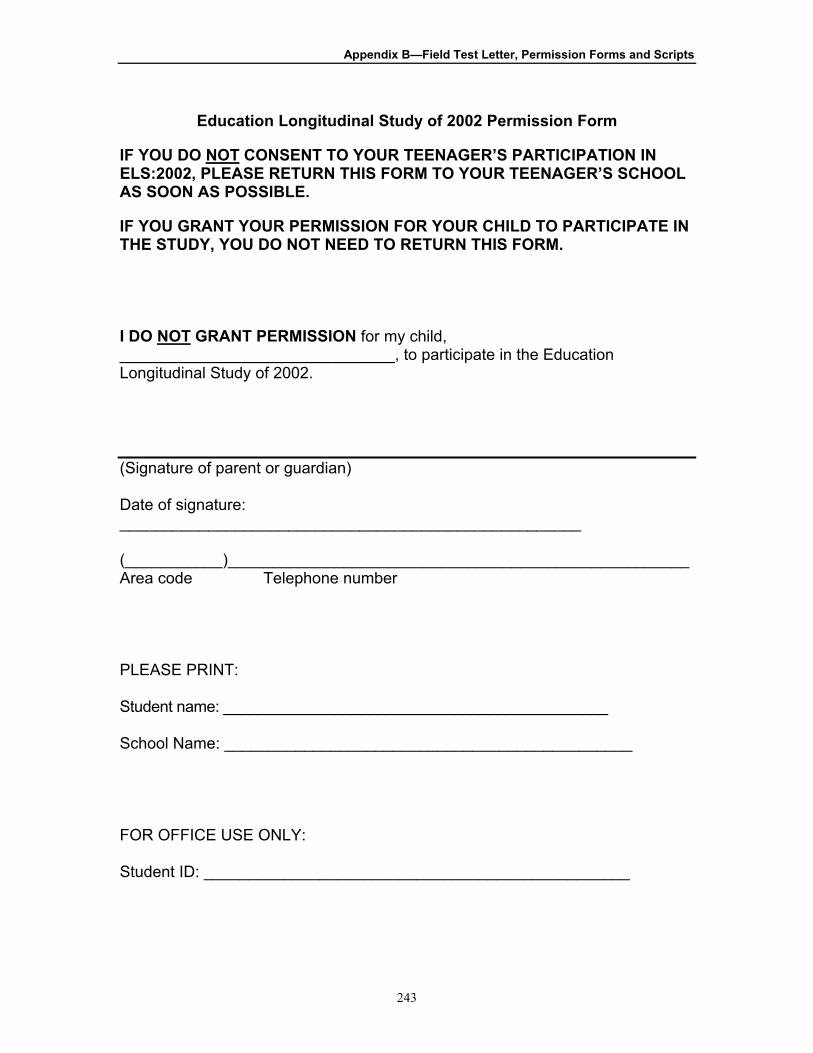
Appendix B—Field Test Letter, Permission Forms and Scripts
243
Education Longitudinal Study of 2002 Permission Form
IF YOU DO NOT CONSENT TO YOUR TEENAGER’S PARTICIPATION IN ELS:2002, PLEASE RETURN THIS FORM TO YOUR TEENAGER’S SCHOOL AS SOON AS POSSIBLE.
IF YOU GRANT YOUR PERMISSION FOR YOUR CHILD TO PARTICIPATE IN THE STUDY, YOU DO NOT NEED TO RETURN THIS FORM.
I DO NOT GRANT PERMISSION for my child, _______________________________, to participate in the Education Longitudinal Study of 2002.
(Signature of parent or guardian)
Date of signature: ____________________________________________________
(___________)____________________________________________________Area code Telephone number
PLEASE PRINT:
Student name: _____________________________________________
School Name: ______________________________________________
FOR OFFICE USE ONLY:
Student ID: ________________________________________________

Appendix B—Field Test Letter, Permission Forms and Scripts
244
This page is intentionally blank.

Appendix B—Field Test Letter, Permission Forms and Scripts
245
Dear Parent or Guardian:
Your child has been selected to participate in the first phase of the Education Longitudinal Study (ELS). ELS is a comprehensive longitudinal study that provides information about the transitions experienced by young people as they develop, attend school, and start careers. Approximately 2500 students in five states have been selected to participate in this phase of the study. In the spring of 2001, we will be conducting ELS at your child’s school.
The U.S. Department of Education sponsors this study. Research Triangle Institute (RTI) has been contracted to collect the data for the study. The purpose of the survey is to provide information that will be used by Congress, researchers, and policymakers to improve the quality of education in America. Your son or daughter will be asked to complete a student questionnaire and a cognitive assessment instrument at his/her school with approximately 25 other students from the tenth grade class. The time for completing the questionnaire and cognitive assessment instrument will be approximately 2.5 hours. The questionnaire will ask questions about his or her plans for the future, family and school life, and schoolwork. The cognitive assessment instrument will measure achievement in reading and mathematics. In addition, we would like to ask you to complete a Parent questionnaire that will provide important background information. We will also ask your child’s English and Math teachers to complete a Teacher questionnaire, which will include questions about your teenager’s classroom experiences.
Research procedures for this study involve no significant risks to respondents – students will only be asked to complete survey questionnaires and a cognitive assessment instrument in reading and math. Your child may refuse to answer any question that makes him/her feel uncomfortable. We will be offering $10 to each selected student from your child’s school who participates in the study as a token of our appreciation for his/her help. While there are no direct benefits to your child for participating, the survey may benefit all of the nation’s students by providing timely data relevant to educational policy making.
An important feature of this study is that it follows the same students as they progress through school and eventually enter the work force and/or pursue higher education. In two years, we would like to contact your child again for a follow up questionnaire and cognitive assessment. We would also like to get a copy of his/her high school transcript. School transcripts will be used to determine what courses he or she has taken.
We cannot replace your child in our sample with anyone else. In order to locate our sample members in the future, we will ask your teenager for his or her address and telephone number and those of a relative or close friend.
Participation is voluntary. There is no penalty if you or your child elect not to participate. However, we do need your help in collecting these data. Your child was selected to represent many others. His/her responses are necessary to make the results of this important study accurate and timely. The National Center for Education Statistics (NCES) of the U.S. Department of Education is authorized by federal law (Public Law 103-382) to conduct the Education Longitudinal Study.

Appendix B—Field Test Letter, Permission Forms and Scripts
246
Researchers may use the data for statistical purposes only and are subject to fines and imprisonment for misuse. Data will be combined to produce statistical reports for Congress and others. No individual data (e.g., names or addresses) will be reported.
Because we plan to recontact your child in two years, we will notify you of any significant information about the study that may influence your willingness to allow your child to continue to participate. You or your child may withdraw from the study at any point.
If for any reason you object to your son or daughter’s participation, you may simply deny permission. However, we will need to know whether you will allow your son or daughter to participate in this study. Please take a moment to fill out the attached form and return it to your teenager’s school.
The enclosed brochure gives more information about the study. If you have any questions about ELS or your teenager’s participation in the survey, please call Amy Rees at RTI toll-free at 1-877-226-0150 between 9 AM and 5 PM Eastern time, Monday through Friday. If you have questions about your child’s rights as a study participant, you may call Dr. Kerrie Boyle at RTI toll free at (800) 334-8571, extension 6959. Both of these individuals can be reached at: Research Triangle Institute, P.O. Box 12194, Research Triangle Park, NC 27709.
We thank you in advance for your cooperation in this important research.
Sincerely,
Jeffrey Owings, Ph.D. Associate Commissioner, Elementary/Secondary & Libraries Studies Division National Center for Education Statistics

Appendix B—Field Test Letter, Permission Forms and Scripts
247
Education Longitudinal Study Permission Form
Please sign the form under the line that indicates your decision about your child’s participation in the study.
PLEASE RETURN THIS FORM TO YOUR TEENAGER’S SCHOOL AS SOON AS POSSIBLE. WE HAVE ENCLOSED AN ENVELOPE ADDRESSED TO THE SCHOOL COORDINATOR.
I give permission for my child, __________________________, to participate in the Education Longitudinal Study.
_______________________________________________________ (Signature of parent or guardian)
Date of Signature: _________________________________________
I do not give permission for my child, _________________________, to participate in the Education Longitudinal Study.
_______________________________________________________(Signature of parent or guardian)
Date of Signature: ________________________________________
PLEASE PRINT:
Student name: _____________________________________________
Telephone number: _________________________________________
School Name: ______________________________________________
FOR OFFICE USE ONLY:Student ID: ________________________________________________

Appendix B—Field Test Letter, Permission Forms and Scripts
248
This page is intentionally blank.

Appendix B—Field Test Letter, Permission Forms and Scripts
249
SCRIPT FOR 10th GRADE ADMINISTRATION
Good morning/afternoon. My name is ________________________. I would like to thank you for taking part in the Education Longitudinal Study (called ELS for short). As you may remember, we sent information about this study home to your parent or guardian.
I represent Research Triangle Institute (RTI), a non-profit research organization. RTI has been hired by the U.S. Department of Education to administer the ELS survey.
ELS is an education study. We’re interested in finding out about students’ school-related experiences as well as their plans for the future. We’re also interested in assessing the level of academic achievement of students in America. For this part of the study, we’ll be surveying about 1,250 tenth grade students.
We think that the best way to learn about students and what they think is to ask students themselves. So we would like you to fill out a student questionnaire. The information you provide on this questionnaire will help educators and government officials to understand your needs and interests better. Your contribution will be helpful in developing effective programs and services for future high school students.
Besides the student questionnaire, we would also like you to complete a math and reading test. This will not affect your grades here at the school – as a matter of fact, no one at the school will ever see your individual scores. The total amount of time for you to fill out the questionnaire and take the test today is about 2.5 hours.
Let me assure you that all the information you give us will be kept strictly confidential. Nobody from your school or city will ever know how you answered. No names or other information that could identify you or your family will be published. All of the answers to the questions we ask will be combined with the answers of students in other schools. We will use these combined responses to compare groups of people rather than individuals. Results will be published in statistical form.
I want to remind you that your participation in ELS is voluntary. However, we need your help to get a true picture of what students are thinking and experiencing across the country. Because you were scientifically selected, you are making a very special contribution to our study. You have the right to refuse to answer any question.
Besides the questionnaire and test that you’re doing today, we will also be sending a Parent survey to your parent/guardian. We will also be asking your math and English teacher to fill out a questionnaire about your classroom performance.
In about 2 years, we will contact you again about participating in the follow up to this study. For that reason, we’ll be asking you to provide contact information so we will be able to get in touch with you then. At that time, we’ll also be asking the school for a copy of your high school transcript. Before we begin, does anyone have any questions?
GO OVER INSTRUCTIONS FOR COMPLETING THE QUESTIONNAIRE.

Appendix B—Field Test Letter, Permission Forms and Scripts
250
If you have any questions while filling out the questionnaire, please raise your hand and I will come help you.
You have 1 hour to complete the questionnaire.
AFTER 1 HOUR, COLLECT THE QUESTIONNAIRES. COUNT TO MAKE SURE YOU HAVE ALL OF THEM. GIVE STUDENTS A 5-MINUTE REFRESHMENT BREAK. STUDENTS SHOULD NOT LEAVE THE ROOM DURING THIS BREAK.
AFTER THE REFRESHMENT BREAK IS OVER, BEGIN THE COGNITIVE TESTS.
SCRIPT FOR ADMINISTERING THE COGNITIVE TESTS
Please take your seats and we’ll get started on the last part of the survey. I will now pass out the test booklets and some scratch paper. As your name is called, please raise your hand.
(PASS OUT TEST BOOKLETS MAKING SURE THAT THEY HAVE THE CORRECT ID FOR EACH STUDENT)
During this part of the survey, everybody must begin answering questions and stop answering them at the same time – unless you finish earlier than the amount of time given for the particular test. If you do complete a section early and come to the word “STOP”, check back over your answers. Do NOT go on to the next section.
Please keep your booklet closed until I tell you to open it. This booklet will probably look similar to tests you've taken before. However, there is one big difference – your name will not be attached to the answers. We will not report this score to your parents, your teachers, or anybody else. We won’t even be able to tell you.
You should try to answer every question, but do not be surprised if some of the questions seem very hard or seem to cover subject matter you have not studied. The way the tests are designed, most students will not be able to answer all of the questions. If you really have no idea how to answer a question, just leave it blank and go on to the next question. If you are not sure of the answer to a question but have some idea what the answer might be, mark the answer that you think it is.
These tests are given to find out how much students in different schools around the country are learning. They’re not intended to show how any one particular student is doing. I will tell you when to start and when to stop according to the amount of time you are allotted for each section of the booklet. If you finish a section before time is up, you may check your work on that section only – do NOT go on to the next section until I tell you to.
These tests are going to be scanned by a computer so it’s important that you mark them carefully. Please do not doodle in the questionnaire – it may cause the computer to misread the page. You may not use a calculator. If you need to calculate an answer, you may use blank paper that I have provided. If you want to change your answer, please erase the first answer completely – do notcross through it or X the answer out.
Before we begin, let’s go over the practice examples at the beginning of the first section. Because we are trying out a large number of questions, different people have different tests.

Appendix B—Field Test Letter, Permission Forms and Scripts
251
(GO OVER PRACTICE EXAMPLES IN THE TEST BOOKLET)
You will have 34 minutes to complete the first section. When you get to the end of that section, you will see an instruction that tells you to stop. Do not go on to the next section. If you finish before I call time, go back over the first section and check your answers.
Before we begin, does anyone have any questions? (ANSWER QUESTIONS) Begin.
WHILE STUDENTS ARE COMPLETING THE TESTS, YOU NEED TO EDIT THE STUDENT QUESTIONNAIRES
WARN STUDENTS WHEN THERE IS 10 MINUTES LEFT AND 5 MINUTES LEFT. STOP THE STUDENTS AFTER THE 34 MINUTES.
BEGINNING THE 2nd SECTION
You will have 37 minutes to complete the 2nd section of the test. If you finish before I call time, go back over the 2nd section and check your answers. Do not return to the first section.
ENDING THE SURVEY
Would everyone please hand their tests to (SAA). (WAIT UNTIL ALL TESTS ARE COLLECTED – SAA SHOULD COUNT TO MAKE SURE ALL HAVE BEEN TURNED IN) I want to thank you for participating in ELS. We’ve enjoyed working with you. We will be contacting you again in a couple of years. We hope that you will be able to participate at that time.
IF EDITING STILL NEEDS TO BE DONE: There are a few students whose names are on the board who I haven’t had a chance to speak to yet. Could you please stay for a few minutes?
Thanks for your help. You may return to class (ISSUE PASSES IF APPROPRIATE).

Appendix B—Field Test Letter, Permission Forms and Scripts
252
This page is intentionally blank.

Appendix B—Field Test Letter, Permission Forms and Scripts
253
SCRIPT FOR 10th GRADE 2 STAGE TEST ADMINISTRATION
Good morning/afternoon. My name is ________________________. I would like to thank you for taking part in the Education Longitudinal Study (known as ELS for short). As you may remember, we sent information about this study home to your parent or guardian.
I represent Research Triangle Institute (RTI), a non-profit research organization. RTI has been hired by the U.S. Department of Education to administer the ELS survey.
ELS is an education study. We’re interested in finding out about students’ school-related experiences as well as their plans for the future. We’re also interested in assessing the level of academic achievement of students in America. For this part of the study, we’ll be assessing about 1,250 tenth grade students.
In order to do this, we would like you to complete a couple of math and reading tests and complete a questionnaire. This will not affect your grades here at the school – as a matter of fact, no one at the school will ever see your individual scores.
I’m going to give you Math and Reading tests first (they are in the same booklet). You will write your answers on the answer sheet that I have given you. After that, I will hand out the student questionnaires for you to fill out. After that, we’ll take a short break. After the break, I will give you one more math and one more reading test. The total amount of time for you to fill out the tests and questionnaire today is about 2.5 hours.
Let me assure you that all the information you give us will be kept strictly confidential. Nobody from your school or city will ever know how you answered. No names or other information that could identify you will be published. All of the answers to the questions we ask will be combined with the answers of students in other schools. We will use these combined responses to compare groups of people rather than individuals. Results will be published in statistical form.
I want to remind you that your participation in ELS is voluntary. However, we need your help to get a true picture of what students know about math and reading. Because you were scientifically selected, you are making a very special contribution to our study. You have the right to refuse to answer any question.
Besides the questionnaire and tests that you’re doing today, we will also be sending a Parent survey to your parent/guardian. We will also be asking your math and English teacher to fill out a questionnaire about your classroom performance.
In about 2 years, we will contact you again about participating in the follow up to this study. For that reason, we’ll be asking you to provide contact information so we will be able to get in touch with you then. At that time, we’ll also be asking the school for a copy of your high school transcript.
ADMINISTERING TEST W
For this test, everybody must begin answering questions and stop answering them at the same time – unless you finish earlier than the amount of time given for the particular test. If you do complete a section early and come to the word “STOP”, check back over your answers of the section that you just finished. Do NOT go on to the next section.

Appendix B—Field Test Letter, Permission Forms and Scripts
254
Please keep your booklet closed until I tell you to open it. This booklet will probably look similar to tests you've taken before. However, there is one big difference – your name will not be attached to the answers. We will not report this score to your parents, your teachers, or anybody else. We won’t even be able to tell you.
You should try to answer every question, but do not be surprised if some of the questions seem very hard or seem to cover subject matter you have not studied. The way the tests are designed, most students will not be able to answer all of the questions. If you really have no idea how to answer a question, just leave it blank and go on to the next question. If you are not sure of the answer to a question but have some idea what the answer might be, mark the answer that you think it is.
These tests are given to find out how much students in different schools around the country are learning. They’re not intended to show how any one particular student is doing. I will tell you when to start and when to stop according to the amount of time you are allotted for each section of the booklet. If you finish a section before time is up, you may check your work on that section only – do NOT go on to the next section until I tell you to.
These tests are going to be scanned by a computer so it’s important that you mark them carefully. Please do not doodle in the questionnaire – it may cause the computer to misread the page. You may not use a calculator. If you need to calculate an answer, you may use blank paper that I have provided. If you want to change your answer, please erase the first answer completely – do notcross through it or X the answer out.
For the first test, you’ll be filling in your answers on the answer sheet I gave you. Before we begin, let’s go over the practice examples at the beginning of the first section.
(GO OVER PRACTICE EXAMPLES IN TEST BOOKLET W WITH STUDENTS)
You will have 12 minutes to complete the first section. When you get to the end of that section, you will see an instruction that tells you to stop. Do not go on to the next section. If you finish before I call time, go back over the first section and check your answers.
Before we begin, does anyone have any questions? (ANSWER QUESTIONS) Begin.
(WARN STUDENTS WHEN THERE IS 5 MINUTES LEFT. STOP THE STUDENTS AFTER THE 12 MINUTES)
BEGINNING THE SECOND PART OF TEST W
You will have 13 minutes to do the second part of Test W. If you finish before I call time, go back over the 2nd part and check your answers. Do not return to the first section.
(WARN STUDENTS WHEN THERE IS 5 MINUTES LEFT. STOP THE STUDENTS AFTER THE 13 MINUTES)
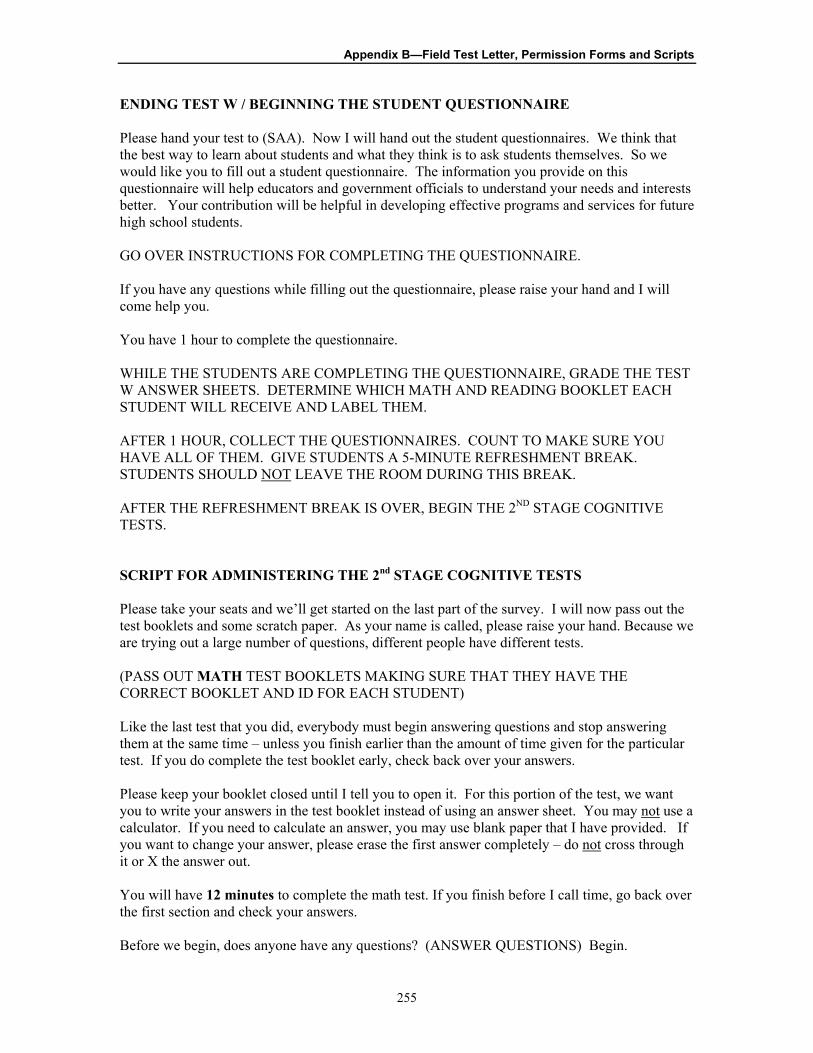
Appendix B—Field Test Letter, Permission Forms and Scripts
255
ENDING TEST W / BEGINNING THE STUDENT QUESTIONNAIRE
Please hand your test to (SAA). Now I will hand out the student questionnaires. We think that the best way to learn about students and what they think is to ask students themselves. So we would like you to fill out a student questionnaire. The information you provide on this questionnaire will help educators and government officials to understand your needs and interests better. Your contribution will be helpful in developing effective programs and services for future high school students.
GO OVER INSTRUCTIONS FOR COMPLETING THE QUESTIONNAIRE.
If you have any questions while filling out the questionnaire, please raise your hand and I will come help you.
You have 1 hour to complete the questionnaire.
WHILE THE STUDENTS ARE COMPLETING THE QUESTIONNAIRE, GRADE THE TEST W ANSWER SHEETS. DETERMINE WHICH MATH AND READING BOOKLET EACH STUDENT WILL RECEIVE AND LABEL THEM.
AFTER 1 HOUR, COLLECT THE QUESTIONNAIRES. COUNT TO MAKE SURE YOU HAVE ALL OF THEM. GIVE STUDENTS A 5-MINUTE REFRESHMENT BREAK. STUDENTS SHOULD NOT LEAVE THE ROOM DURING THIS BREAK.
AFTER THE REFRESHMENT BREAK IS OVER, BEGIN THE 2ND STAGE COGNITIVE TESTS.
SCRIPT FOR ADMINISTERING THE 2nd STAGE COGNITIVE TESTS
Please take your seats and we’ll get started on the last part of the survey. I will now pass out the test booklets and some scratch paper. As your name is called, please raise your hand. Because we are trying out a large number of questions, different people have different tests.
(PASS OUT MATH TEST BOOKLETS MAKING SURE THAT THEY HAVE THE CORRECT BOOKLET AND ID FOR EACH STUDENT)
Like the last test that you did, everybody must begin answering questions and stop answering them at the same time – unless you finish earlier than the amount of time given for the particular test. If you do complete the test booklet early, check back over your answers.
Please keep your booklet closed until I tell you to open it. For this portion of the test, we want you to write your answers in the test booklet instead of using an answer sheet. You may not use a calculator. If you need to calculate an answer, you may use blank paper that I have provided. If you want to change your answer, please erase the first answer completely – do not cross through it or X the answer out.
You will have 12 minutes to complete the math test. If you finish before I call time, go back over the first section and check your answers.
Before we begin, does anyone have any questions? (ANSWER QUESTIONS) Begin.

Appendix B—Field Test Letter, Permission Forms and Scripts
256
WHILE STUDENTS ARE COMPLETING THE TESTS, EDIT THE STUDENT QUESTIONNAIRES
WARN STUDENTS WHEN THERE IS 5 MINUTES LEFT. STOP THE STUDENTS AFTER THE 12 MINUTES.
Please turn in your math booklets.
HAND OUT READING TESTS.
You will have 11 minutes to complete the reading test. If you finish before I call time, go back over the test and check your answers.
ENDING THE SURVEY
Would everyone please hand their tests to (SAA). (WAIT UNTIL ALL TESTS ARE COLLECTED – SAA SHOULD COUNT TO MAKE SURE ALL HAVE BEEN TURNED IN) I want to thank you for participating in ELS. We’ve enjoyed working with you. We will be contacting you again in a couple of years. We hope that you will be able to participate at that time.
IF EDITING STILL NEEDS TO BE DONE: There are a few students whose names are on the board who I haven’t had a chance to speak to yet. Could you please stay for a few minutes?
Thanks for your help. You may return to class (ISSUE PASSES IF APPROPRIATE).

Appendix B—Field Test Letter, Permission Forms and Scripts
257
SCRIPT FOR 12th GRADE STUDENT COGNITIVE TEST
Good morning/afternoon. My name is ________________________. I would like to thank you for taking part in the Education Longitudinal Study (known as ELS for short). As you may remember, we sent information about this study home to your parent or guardian.
I represent Research Triangle Institute (RTI), a non-profit research organization. RTI has been hired by the U.S. Department of Education to administer the ELS survey.
ELS is an education study. We’re interested in finding out about students’ school-related experiences as well as their plans for the future. We’re also interested in assessing the level of academic achievement of students in America. For this part of the study, we’ll be assessing about 1,250 twelfth grade students.
In order to do this, we would like you to complete a math and reading test. This will not affect your grades here at the school – as a matter of fact, no one at the school will ever see your individual scores. The total amount of time for you to fill out the test today is about 1.5 hours.
Let me assure you that all the information you give us will be kept strictly confidential. Nobody from your school or city will ever know how you answered. No names or other information that could identify you will be published. All of the answers to the questions we ask will be combined with the answers of students in other schools. We will use these combined responses to compare groups of people rather than individuals. Results will be published in statistical form.
I want to remind you that your participation in ELS is voluntary. However, we need your help to get a true picture of what students know about math and reading. Because you were scientifically selected, you are making a very special contribution to our study. You have the right to refuse to answer any question.
For this test, everybody must begin answering questions and stop answering them at the same time – unless you finish earlier than the amount of time given for the particular test. If you do complete a section early and come to the word “STOP”, check back over your answers of the section that you just finished. Do NOT go on to the next section.
Please keep your booklet closed until I tell you to open it. This booklet will probably look similar to tests you've taken before. However, there is one big difference – your name will not be attached to the answers. We will not report this score to your parents, your teachers, or anybody else. We won’t even be able to tell you.
You should try to answer every question, but do not be surprised if some of the questions seem very hard or seem to cover subject matter you have not studied. The way the tests are designed, most students will not be able to answer all of the questions. If you really have no idea how to answer a question, just leave it blank and go on to the next question. If you are not sure of the answer to a question but have some idea what the answer might be, mark the answer that you think it is.
These tests are given to find out how much students in different schools around the country are learning. They’re not intended to show how any one particular student is doing. I will tell you when to start and when to stop according to the amount of time you are allotted for each section of the booklet. If you finish a section before time is up, you may check your work on that section only – do NOT go on to the next section until I tell you to.

Appendix B—Field Test Letter, Permission Forms and Scripts
258
These tests are going to be scanned by a computer so it’s important that you mark them carefully. Please do not doodle in the questionnaire – it may cause the computer to misread the page. You may not use a calculator. If you need to calculate an answer, you may use blank paper that I have provided. If you want to change your answer, please erase the first answer completely – do notcross through it or X the answer out.
Before we begin, let’s go over the practice examples at the beginning of the first section. Because we are trying out a large number of questions, different people have different tests.
(GO OVER PRACTICE EXAMPLES IN TEST BOOKLET WITH STUDENTS)
You will have 34 minutes to complete the first section. When you get to the end of that section, you will see an instruction that tells you to stop. Do not go on to the next section. If you finish before I call time, go back over the first section and check your answers.
Before we begin, does anyone have any questions? (ANSWER QUESTIONS) Begin.
(WARN STUDENTS WHEN THERE IS 10 MINUTES LEFT AND 5 MINUTES LEFT. STOP THE STUDENTS AFTER THE 34 MINUTES)
BEGINNING THE 2ND PART OF THE TEST
You will have 37 minutes to complete the 2nd section of the test. If you finish before I call time, go back over the 2nd section and check your answers. Do not return to the first section.
ENDING THE SURVEY
Would everyone please hand their tests to me. (WAIT UNTIL ALL TESTS ARE COLLECTED – SAA SHOULD COUNT TO MAKE SURE ALL HAVE BEEN TURNED IN) I want to thank you for participating in ELS. We’ve enjoyed working with you.
Thanks for your help. You may return to class (ISSUE PASSES IF APPROPRIATE).

259
Appendix C Survey Administrator Debriefing

Appendix C—Survey Administrator Debriefing
260
This page is intentionally blank.

Appendix C—Survey Administrator Debriefing
261
Education Longitudinal Study Survey Administrator Debriefings
5/3/01 & 5/4/01
RTI Staff: Dan Pratt, Ellen Stutts, Donna Jewell, Amy Rees, Jim Rogers, Sheila Hill, Laura Burns,
and Steven Ingels.
SAs calling in on 5/3/01: Nancy Dane (NC), Pat Duerfeldt (FL), Dianne Helm (IL), and Jack Sloan (IL).
SAs calling in on 5/4/01: Fred Allen (TX), Carol Block (FL), Denise Simms (TX), and Lorna Skaaren (NY).
Goal of this call: We want to find out what happened in the field - what worked and what didn't. What works well and what we can change to make it work better.
1. Getting school cooperation at schools with SC and Students
A. School Coordinator
Did SC follow-up on what they were supposed to do? Not always.
Usually the SA had no idea that groundwork was not laid ahead of time
Who was the best kind of coordinator?
Somebody at school everyday. Detail-oriented person.
Principal bent over backwards - didn't have to check with anyone.
Pat - vice principal was worst. Jack agreed.
Principal was best.
Counselors seem to know all the students and are more concerned about getting students to attend.
Was not able to detect whether SC was doing what we needed at contact calls.
Some SAs said the principal was usually too busy.
Some SCs were very casual about responsibility. Secretary was responsible was high turnout.
Passive schools - the SC took responsibility and told students they had to be there.
Active schools - the SC was more laid back and didn't encourage students as much.

Appendix C—Survey Administrator Debriefing
262
May be able to reach principal at 7 AM or 7 PM.
Didn't always have the room we thought we had. Sometimes teachers had not been notified and had planned something in the room.
Recommendation:
1. Definitely need to identify a backup coordinator.
How can we entice SC? Money didn't do. Timing was crucial - find out when spring break is.
Principal had more authority and bought into it more.
Teachers were more reluctant to send kids - felt they needed classroom time more than test.
Focussed more on voluntary nature.
Someone that graduated from school (principal and teacher) did extra.
Recommendations:
1. Find out when spring break is.
2. Include letters from district/superintendent.
3. More information to parents up front.
4. Ask principal to send out letters to teachers to increase buy in.
Could you tell that you were going to have problems at the school based on initial contact with school?
Yes, especially in the active consent schools.
If SC stated they had low expectations, the school had low turnout.
Danger signals of no groundwork – general vagueness, saying “we’ll work on that when you get here.”
Buy-in increased if superintendent wants the study to happen.
Recommendations:
1. Visit school late afternoon before SD to go over preliminary arrangements so that the next morning was not as hectic. Check room, refusals, make sure school box was opened and that you knew where SD box was going to be.
2. Have recruiters briefly go over response rates ahead of time. Close gap between recruiting calls and SA calls.
3. Need buy in of entire school – send letters to all teachers about study.

Appendix C—Survey Administrator Debriefing
263
B. Students
What were some ways to get students to attend and participate?
Pat's best school: Principal offered additional $25 to students - it was a drawing among those attending.
Announcements the day before and the day of testing - especially when called by name.
Difficult to follow up with missing students first thing in the morning – coordinator too busy.
Find the troublemakers and separate them - always an instigator.
Classroom setting is more conducive to testing. Table setting more conducive to talking. If table setting, need to limit number of students at each table.
Helps if coordinator asks the students to take the study seriously because they are representing the school.
Very good students didn't want to miss class. They didn't want to have to make up work or get behind. Teachers reluctant to send students with academic problems – can’t afford to miss class.
Active schools that received $10 - didn't seem to make a difference. Some kids had not read letter and didn't know about it.
Students that joked around - Some SCs asked them to focus and please take it seriously.
Snacks - Students loved it. Principals said they didn't need it. A nice touch - made them settle in for 2nd hour. Students were very appreciative. Cleaned up after themselves.
They really appreciated snacks. They felt rewarded. Problem when 10th and 12th graders in same room.
Recommendations:
1. Students seemed to do much better when the principal (or SC) spoke to them at beginning of session about importance of study.
2. Letting them know about refreshments ahead of time was enticing. Might be a good idea to let students know in letter.
3. Put up posters in the school advertising ELS. 4. Send letter to parents – survey day is coming up, make sure students are rested
and at school on time.

Appendix C—Survey Administrator Debriefing
264
2. Refusal conversion
Any instances where schools did not allow you to contact parents or students?
Dianne had 2.
What were some problems encountered in refusal conversion efforts?
Getting refusal numbers prior to SD was difficult.
MD was too close to SD to attempt conversions between.
Parents are allowing students to decide whether they want to do it or not.
Students felt they had too much schoolwork already and didn't want to miss any class time.
Students worried about making up time and concerned teachers would not believe where they are.
Pat asked students if they would reconsider.
Schools just have too much going on already.
Calling parents didn't make a big difference. Parents were signing forms and putting them in bookbags, but the students never returned it to the school.
Several parents commented that there was not a date on the form or letter for SD. They just had not done it yet because they didn't know when it was due back.
Some of the addresses were bad and parents had never received permission forms.
Parent refusal - usually from the student. Carol had both parent and student refusals. Parent refusal was due to already being over tested and didn't need one more or that they didn't want the student to miss more class time.
Recommendations:
1. A letter from the principal to the teachers explaining study and telling which students were asked to participate may help.
2. One SA suggested handwritten note to school to provide approval if time was too short to mail out active consent form. Dictated wording to parents.

Appendix C—Survey Administrator Debriefing
265
3. Procedures in general
Time of day - after 1st period seems to be best. Lots of schools don't have homeroom (seemed to be better turnout at schools with homerooms). Tardiness is a problem. Must be done before lunch.
Can’t always get into the building first thing in the morning – makes it tougher to set up.
Some would like to have materials sent to SA ahead of time instead of school - some like it to going to school.
Pre-labeling questionnaires ahead of time.
Morning is definitely best until students start stressing over missing lunch.
Set-up time was a problem for Carol when secretary forgot to notify SC that she had arrived.
Lorna had a room conflict with drama teacher trying to rehearse.
Auditorium allowed room to space students.
A regular classroom worked fine.
The library worked well even for both groups of students at the same time.
Timing of the tests was not a problem.
Edit time was stressful. It was difficult to watch for questions and edit especially with a large group of students.
Very difficult to get things packed up the same day and shipped out. Quality control is better at home. If flying, allow plenty of time to pack up materials before your return flight.
Critical Items edit Critical items missed were usually due to lack of time. Didn't know contact address. Question about when student's job started was blank a lot - they just skipped it for some reason.
Identifying critical items that the SA had tried to obtain data for and was unable to do so was not a problem. Usually happened for contact information and SSN. Students would tell them that they didn't want to get the information.
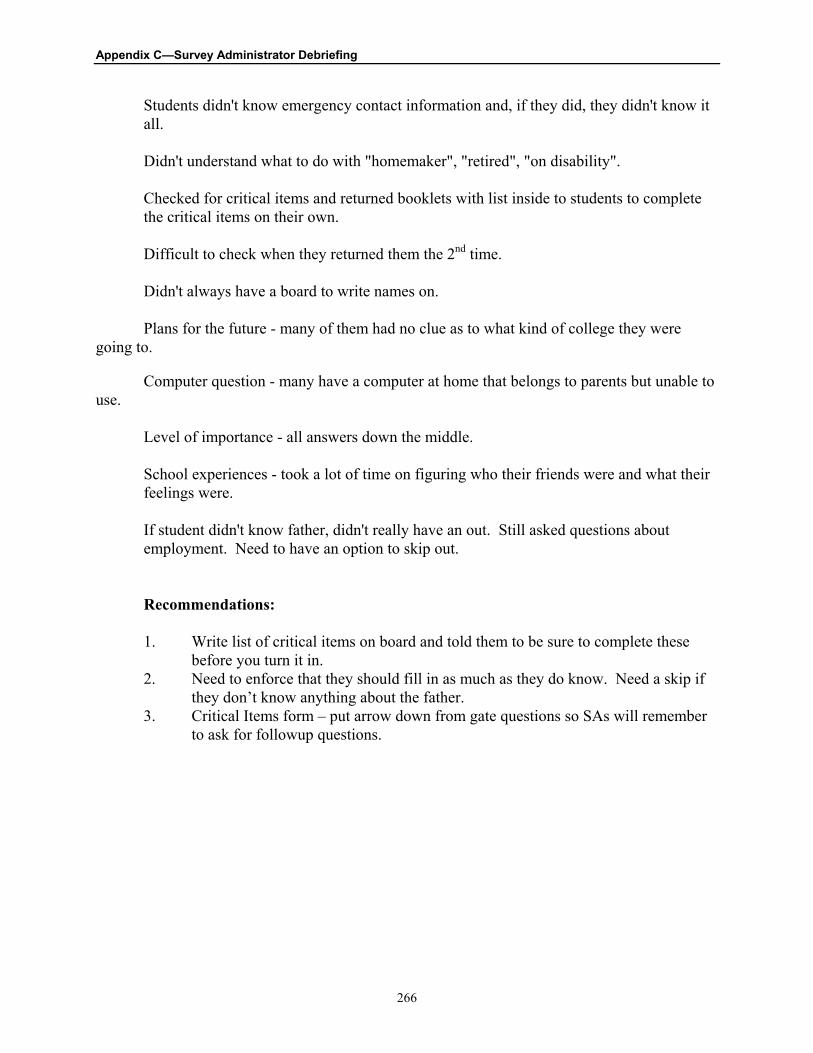
Appendix C—Survey Administrator Debriefing
266
Students didn't know emergency contact information and, if they did, they didn't know it all.
Didn't understand what to do with "homemaker", "retired", "on disability".
Checked for critical items and returned booklets with list inside to students to complete the critical items on their own.
Difficult to check when they returned them the 2nd time.
Didn't always have a board to write names on.
Plans for the future - many of them had no clue as to what kind of college they were going to.
Computer question - many have a computer at home that belongs to parents but unable to use.
Level of importance - all answers down the middle.
School experiences - took a lot of time on figuring who their friends were and what their feelings were.
If student didn't know father, didn't really have an out. Still asked questions about employment. Need to have an option to skip out.
Recommendations:
1. Write list of critical items on board and told them to be sure to complete these before you turn it in.
2. Need to enforce that they should fill in as much as they do know. Need a skip if they don’t know anything about the father.
3. Critical Items form – put arrow down from gate questions so SAs will remember to ask for followup questions.

Appendix C—Survey Administrator Debriefing
267
4. Materials
What would make your job easier?
It is hard to get all the paperwork done and packed up the same day as SD.
Schools made the decision when students were able to participate.
Recommendations:
1. A folder for each school would be helpful with school name, SC, phone number on outside.
2. A brown envelope with a label provided. 3. School id # on every form with school name. 4. It would be nice if transmittal form were 2-part NCR so wouldn't have to copy
event codes from SD to MD form. 5. Checklist/packing list (NCR) for everything that needs to be sent in on SD and
MD.6. CAC (or envelope) - a grid or place to record dates for when calls need to be
made to the schools. 7. School Coordinator Checklist – add time to show up at school, time survey
begins, space for comments. 8. Transmittal Form - a place for comment beside each student, place for
extenuating circumstances - science fair, bomb scares, state volleyball championship.
9. Wanted to have NCR forms (in different colors) for the student roster and transmittal form. SA wants to keep a copy of form and have SD and MD copy.
10. Keep all schools in looseleaf notebook with divider pages with school information.
11. Pencils are terrible. Need a new vendor for main study. 12. Letter to the students that mentions the refreshments and a token gift (ELS
pencils).13. Supplies to schools not the SA. 14. Provide SC with an envelope to collect teacher questionnaires to give to SA on
SD.15. After SD, account for each student with the coordinator – send out letters to all
missing students. 16. Would like to be able to indicate when students are not taking things seriously -
perhaps add a "for office use only" box on the front of test and questionnaire booklets.
17. Currently no sense of urgency for teacher/other staff questionnaires – need to indicate in letter that SA will pick them up on SD.
Facilities Checklist

Appendix C—Survey Administrator Debriefing
268
It is very difficult to do without assistance from the school.
It was hard to find 5 empty classrooms without assistance.
Hard to observe all of the items - how many entrances; emergency call buttons; telephones.
Empty classrooms were often locked.
Bathrooms locked during classroom periods.
How do you tell whether a mirror is metal or glass.
It was difficult to get into 5 classrooms.
Sometimes classes were locked; sometimes they were open.
Some had escorts carry them around so they could get in the rooms.
No problems with any items on list - sometimes the call button was not obvious.
Carol asked some questions of SC.
No problem gaining access.
Recommendations:
1. Need to add "classroom has no windows" as an option for questions about windows.
2. Give SA the Facilities Checklist ahead of time to take the day before SA when visits school to work out final arrangements.
About how long did it take to complete? 30-35 minutes. It would have only been 10 minutes without the 5 classrooms questions.
When did you complete the checklist? Usually after survey completed. Sometimes did a little here and a little there but hard to do with everything new and trying to find your way around. By the end of day, schools want SA out – don’t want them hanging around to do
checklist.

Appendix C—Survey Administrator Debriefing
269
5. Touch-tone data entry
Worked great!
On MD, was unsure of whether data would be overwritten or not based on.
Very straight forward. Worked very well. No problems getting through.
Recommendations:
1. Make 1st question "is this SD or MD?" 2. Report form should have a place for school name as well as id #.
3. Need more training on it. 4. Need to be clearer about what to include and not include in numbers. 5. Place on form for date and time that called in report. 6. Place on form to record type of weather on the day phoned in report.
6. Training
Two days seemed rushed for training.
Recommendations:1. SAs should see teacher questionnaires at training. Enforce to teachers that they
can do it in pieces and they don't have to do it all at once. 2. Have the SA meet with the SAA ahead of time. Need to offer more money. 3. Address how to deal with disruptive students. 4. Dealing with students that finish early and are ready to go. 5. More time dealing with forms and disposition of each form. 6. Simulate a survey day start to finish. Complete run through of what needs to
happen at school. 7. Emphasize no survey without signed form for active schools. If school is active
and parent refuses, school can't give permission at time of SD or MD. 8. Need to review the questionnaire during training so that SA is familiar with the
questions.9. Dressing appropriately for schools - don't overdress or underdress. Don't wear
heels.10. First morning at 1st school was very chaotic. The SAs need to be prepared for
this.
Appendix C—Survey Administrator Debriefing
270
7. Other topics
2-stage testing: Was no problem for Pat's school. Went smoothly. Had a classroom setting and bright students.
The fewer the students, the better things went. Over 20 students in a room is hard to manage – may help to have SAA there though.
Had very few discipline problems, students were well-behaved.
Timing of tests & questionnaires: Not a problem with timing for anyone.
School administrator questionnaire – some information resides at district (or has to be looked up on a student-by-student basis)
Forgot to pick up permission forms prior to completing survey. SC gave a list but not forms until after.
Hiring SAAsFred had 2 SAAs go to 2 schools with him. Used the NIF and personal contacts.
Denise used a RTI FI that she knew. Carol used people she had worked with before.
What should SAs do with extra questionnaires and tests?Dan & Ellen will decide and Sheila will notify the SAs.
SC comments: The best time for testing is November and December. Teacher questionnaire - suggest that we include a gift certificate to Barnes & Noble or somewhere.

271
Appendix D Item Analysis Statistics
Appendix D—Item Analysis Statistics
272
This page is intentionally blank.

273
ELS2002 SPRING 2001 FIELD TEST ANALYSIS 10:59:30 6/11/01 PAGE 3
Reading Form 1 F4STAT 4.47V
ITEM ANALYSIS
================================================================================================================================
| | NOT RCH OMIT A B C * D E | TOTAL |
|
| ITEM 1 N | 0 4 13 18 872 14 12 | 933 | R BIS = 0.5624 P+ = 0.9346 |
| PERCENT | 0.00 0.43 1.39 1.93 93.46 1.50 1.29 | 100.00 | PT BIS = 0.2894
|
| EBE001 MEAN SCORE | 0.00 11.25 8.31 10.06 20.41 9.71 17.25 | 19.80 |
|
================================================================================================================================
| | NOT RCH OMIT A B * C D E | TOTAL |
|
| ITEM 2 N | 0 6 28 781 45 28 45 | 933 | R BIS = 0.6225 P+ = 0.8371 |
| PERCENT | 0.00 0.64 3.00 83.71 4.82 3.00 4.82 | 100.00 | PT BIS = 0.4152
|
| EBE002 MEAN SCORE | 0.00 10.33 9.64 21.26 12.09 9.36 16.31 | 19.80 |
|
================================================================================================================================
| | NOT RCH OMIT A B C D * E | TOTAL |
|
| ITEM 3 N | 0 7 13 17 67 797 32 | 933 | R BIS = 0.7106 P+ = 0.8542 |
| PERCENT | 0.00 0.75 1.39 1.82 7.18 85.42 3.43 | 100.00 | PT BIS = 0.4610
|
| EBE003 MEAN SCORE | 0.00 13.43 9.31 8.65 12.12 21.32 9.75 | 19.80 |
|
================================================================================================================================
| | NOT RCH OMIT A B C D E * | TOTAL |
|
| ITEM 4 N | 0 10 68 41 35 132 647 | 933 | R BIS = 0.6699 P+ = 0.6935 |
| PERCENT | 0.00 1.07 7.29 4.39 3.75 14.15 69.35 | 100.00 | PT BIS = 0.5102
|
| EBE004 MEAN SCORE | 0.00 10.40 12.32 14.39 13.49 14.50 22.50 | 19.80 |
|
================================================================================================================================
| | NOT RCH OMIT A B C * D E | TOTAL |
|
| ITEM 5 N | 0 12 59 155 593 46 68 | 933 | R BIS = 0.6634 P+ = 0.6356 |
| PERCENT | 0.00 1.29 6.32 16.61 63.56 4.93 7.29 | 100.00 | PT BIS = 0.5180
|
| EBE005 MEAN SCORE | 0.00 11.83 11.97 15.51 22.92 12.83 15.31 | 19.80 |
|
================================================================================================================================
| | NOT RCH OMIT A * B C D E | TOTAL |
|
| ITEM 6 N | 0 8 524 71 127 133 70 | 933 | R BIS = 0.5305 P+ = 0.5616 |
| PERCENT | 0.00 0.86 56.16 7.61 13.61 14.26 7.50 | 100.00 | PT BIS = 0.4213
|
| EBE006 MEAN SCORE | 0.00 12.50 22.76 14.94 16.40 17.36 14.21 | 19.80 |
|
================================================================================================================================
| | NOT RCH OMIT A * B C D E | TOTAL |
|
| ITEM 7 N | 0 14 433 71 70 256 89 | 933 | R BIS = 0.5712 P+ = 0.4641 |
| PERCENT | 0.00 1.50 46.41 7.61 7.50 27.44 9.54 | 100.00 | PT BIS = 0.4548
|
| EBE007 MEAN SCORE | 0.00 16.57 23.69 13.00 14.70 17.64 17.07 | 19.80 |
|
================================================================================================================================
| | NOT RCH OMIT A B C D E * | TOTAL |
|
| ITEM 8 N | 0 18 112 183 113 63 444 | 933 | R BIS = 0.6082 P+ = 0.4759 |
| PERCENT | 0.00 1.93 12.00 19.61 12.11 6.75 47.59 | 100.00 | PT BIS = 0.4847
|
| EBE008 MEAN SCORE | 0.00 13.28 14.28 18.24 16.48 13.48 23.85 | 19.80 |
|
================================================================================================================================
| | NOT RCH OMIT A B C D E * | TOTAL |
|
| ITEM 9 N | 0 7 38 19 288 16 565 | 933 | R BIS = 0.7468 P+ = 0.6056 |
| PERCENT | 0.00 0.75 4.07 2.04 30.87 1.71 60.56 | 100.00 | PT BIS = 0.5882
|
| EBE009 MEAN SCORE | 0.00 12.86 12.92 9.68 14.51 13.06 23.58 | 19.80 |
|
================================================================================================================================
| | NOT RCH OMIT A B C * D | TOTAL |
|
| ITEM 10 N | 0 15 171 140 466 141 | 933 | R BIS = 0.5673 P+ = 0.4995 |
| PERCENT | 0.00 1.61 18.33 15.01 49.95 15.11 | 100.00 | PT BIS = 0.4527
|
| EBE010 MEAN SCORE | 0.00 10.27 16.18 16.27 23.41 16.81 | 19.80 |
|
================================================================================================================================

274
ELS2002 SPRING 2001 FIELD TEST ANALYSIS 10:59:30 6/11/01 PAGE 4
Reading Form 1 F4STAT 4.47V
ITEM ANALYSIS
================================================================================================================================
| | NOT RCH OMIT A B * C D | TOTAL |
|
| ITEM 11 N | 0 13 65 765 47 43 | 933 | R BIS = 0.6707 P+ = 0.8199 |
| PERCENT | 0.00 1.39 6.97 81.99 5.04 4.61 | 100.00 | PT BIS = 0.4583
|
| EBE011 MEAN SCORE | 0.00 11.23 11.08 21.51 12.30 13.40 | 19.80 |
|
================================================================================================================================
| | NOT RCH OMIT A B * C D | TOTAL |
|
| ITEM 12 N | 1 11 116 568 95 142 | 933 | R BIS = 0.6968 P+ = 0.6088 |
| PERCENT | 0.11 1.18 12.43 60.88 10.18 15.22 | 100.00 | PT BIS = 0.5484
|
| EBE012 MEAN SCORE | 7.00 9.91 12.44 23.30 14.66 16.13 | 19.80 |
|
================================================================================================================================
| | NOT RCH OMIT A B C * D | TOTAL |
|
| ITEM 13 N | 2 12 36 107 726 50 | 933 | R BIS = 0.6849 P+ = 0.7781 |
| PERCENT | 0.21 1.29 3.86 11.47 77.81 5.36 | 100.00 | PT BIS = 0.4904
|
| EBE013 MEAN SCORE | 8.00 11.17 10.36 14.16 21.89 10.98 | 19.80 |
|
================================================================================================================================
| | NOT RCH OMIT A B C D * | TOTAL |
|
| ITEM 14 N | 3 17 174 156 63 520 | 933 | R BIS = 0.5178 P+ = 0.5573 |
| PERCENT | 0.32 1.82 18.65 16.72 6.75 55.73 | 100.00 | PT BIS = 0.4114
|
| EBE014 MEAN SCORE | 6.67 12.88 17.21 16.63 13.22 22.72 | 19.80 |
|
================================================================================================================================
| | NOT RCH OMIT A B C * D | TOTAL |
|
| ITEM 15 N | 4 17 67 277 504 64 | 933 | R BIS = 0.5076 P+ = 0.5402 |
| PERCENT | 0.43 1.82 7.18 29.69 54.02 6.86 | 100.00 | PT BIS = 0.4040
|
| EBE015 MEAN SCORE | 6.25 13.59 11.37 18.10 22.77 15.16 | 19.80 |
|
================================================================================================================================
| | NOT RCH OMIT A B C D * | TOTAL |
|
| ITEM 16 N | 8 12 91 82 79 661 | 933 | R BIS = 0.6838 P+ = 0.7085 |
| PERCENT | 0.86 1.29 9.75 8.79 8.47 70.85 | 100.00 | PT BIS = 0.5163
|
| EBE016 MEAN SCORE | 6.50 11.08 15.76 12.01 13.18 22.44 | 19.80 |
|
================================================================================================================================
| | NOT RCH OMIT A B * C D | TOTAL |
|
| ITEM 17 N | 8 12 109 621 36 147 | 933 | R BIS = 0.5619 P+ = 0.6656 |
| PERCENT | 0.86 1.29 11.68 66.56 3.86 15.76 | 100.00 | PT BIS = 0.4337
|
| EBE017 MEAN SCORE | 6.50 11.50 13.08 22.25 11.33 17.93 | 19.80 |
|
================================================================================================================================
| | NOT RCH OMIT A B C D * | TOTAL |
|
| ITEM 18 N | 8 10 171 58 164 522 | 933 | R BIS = 0.6690 P+ = 0.5595 |
| PERCENT | 0.86 1.07 18.33 6.22 17.58 55.95 | 100.00 | PT BIS = 0.5314
|
| EBE018 MEAN SCORE | 6.50 13.50 15.73 14.67 14.96 23.55 | 19.80 |
|
================================================================================================================================
| | NOT RCH OMIT A B * C D | TOTAL |
|
| ITEM 19 N | 21 12 56 623 160 61 | 933 | R BIS = 0.6466 P+ = 0.6677 |
| PERCENT | 2.25 1.29 6.00 66.77 17.15 6.54 | 100.00 | PT BIS = 0.4986
|
| EBE019 MEAN SCORE | 9.29 13.33 12.30 22.60 15.56 14.15 | 19.80 |
|
================================================================================================================================
| | NOT RCH OMIT A B C * D | TOTAL |
|
| ITEM 20 N | 23 16 150 135 437 172 | 933 | R BIS = 0.5197 P+ = 0.4684 |
| PERCENT | 2.47 1.71 16.08 14.47 46.84 18.44 | 100.00 | PT BIS = 0.4140
|
| EBE020 MEAN SCORE | 9.65 15.38 17.09 15.10 23.31 18.72 | 19.80 |
|
================================================================================================================================

275
ELS2002 SPRING 2001 FIELD TEST ANALYSIS 10:59:30 6/11/01 PAGE 5
Reading Form 1 F4STAT 4.47V
ITEM ANALYSIS
================================================================================================================================
| | NOT RCH OMIT A B C D * | TOTAL |
|
| ITEM 21 N | 26 13 261 246 125 262 | 933 | R BIS = 0.3029 P+ = 0.2808 |
| PERCENT | 2.79 1.39 27.97 26.37 13.40 28.08 | 100.00 | PT BIS = 0.2272
|
| EBE021 MEAN SCORE | 10.00 15.85 17.87 22.00 15.91 22.69 | 19.80 |
|
================================================================================================================================
| | NOT RCH OMIT A * B C D | TOTAL |
|
| ITEM 22 N | 28 12 338 325 139 91 | 933 | R BIS = 0.4203 P+ = 0.3623 |
| PERCENT | 3.00 1.29 36.23 34.83 14.90 9.75 | 100.00 | PT BIS = 0.3279
|
| EBE022 MEAN SCORE | 10.29 15.58 23.26 19.43 16.01 17.54 | 19.80 |
|
================================================================================================================================
| | NOT RCH OMIT A B C * D | TOTAL |
|
| ITEM 23 N | 28 10 194 219 435 47 | 933 | R BIS = 0.5917 P+ = 0.4662 |
| PERCENT | 3.00 1.07 20.79 23.47 46.62 5.04 | 100.00 | PT BIS = 0.4713
|
| EBE023 MEAN SCORE | 10.29 16.70 17.13 17.26 23.81 11.89 | 19.80 |
|
================================================================================================================================
| | NOT RCH OMIT A * B C D E | TOTAL |
|
| ITEM 24 N | 45 9 565 50 73 42 149 | 933 | R BIS = 0.6716 P+ = 0.6056 |
| PERCENT | 4.82 0.96 60.56 5.36 7.82 4.50 15.97 | 100.00 | PT BIS = 0.5289
|
| EBE024 MEAN SCORE | 11.20 15.78 23.20 13.00 12.04 12.93 17.79 | 19.80 |
|
================================================================================================================================
| | NOT RCH OMIT A B C * | TOTAL |
|
| ITEM 25 N | 51 57 456 0 369 | 933 | R BIS = 0.7324 P+ = 0.3955 |
| PERCENT | 5.47 6.11 48.87 0.00 39.55 | 100.00 | PT BIS = 0.5770
|
| EBE025 MEAN SCORE | 11.41 12.40 17.07 0.00 25.48 | 19.80 |
|
================================================================================================================================
| | NOT RCH OMIT A B * | TOTAL |
|
| ITEM 26 N | 51 57 456 369 | 933 | R BIS = 0.7324 P+ = 0.3955 |
| PERCENT | 5.47 6.11 48.87 39.55 | 100.00 | PT BIS = 0.5770
|
| EBE025 MEAN SCORE | 11.41 12.40 17.07 25.48 | 19.80 |
|
================================================================================================================================
| | NOT RCH OMIT A B C * | TOTAL |
|
| ITEM 27 N | 60 180 449 0 244 | 933 | R BIS = 0.6789 P+ = 0.2615 |
| PERCENT | 6.43 19.29 48.12 0.00 26.15 | 100.00 | PT BIS = 0.5026
|
| EBE026 MEAN SCORE | 11.78 14.24 19.45 0.00 26.52 | 19.80 |
|
================================================================================================================================
| | NOT RCH OMIT A B * | TOTAL |
|
| ITEM 28 N | 60 180 449 244 | 933 | R BIS = 0.6789 P+ = 0.2615 |
| PERCENT | 6.43 19.29 48.12 26.15 | 100.00 | PT BIS = 0.5026
|
| EBE026 MEAN SCORE | 11.78 14.24 19.45 26.52 | 19.80 |
|
================================================================================================================================
| | NOT RCH OMIT A * B C D | TOTAL |
|
| ITEM 29 N | 67 10 620 76 91 69 | 933 | R BIS = 0.7474 P+ = 0.6645 |
| PERCENT | 7.18 1.07 66.45 8.15 9.75 7.40 | 100.00 | PT BIS = 0.5771
|
| EBE027 MEAN SCORE | 11.79 17.20 23.06 11.58 13.46 16.07 | 19.80 |
|
================================================================================================================================
| | NOT RCH OMIT A B C * D | TOTAL |
|
| ITEM 30 N | 74 9 114 129 469 138 | 933 | R BIS = 0.6655 P+ = 0.5027 |
| PERCENT | 7.93 0.96 12.22 13.83 50.27 14.79 | 100.00 | PT BIS = 0.5310
|
| EBE028 MEAN SCORE | 12.32 17.11 14.96 14.88 24.00 18.32 | 19.80 |
|
================================================================================================================================

276
ELS2002 SPRING 2001 FIELD TEST ANALYSIS 10:59:30 6/11/01 PAGE 6
Reading Form 1 F4STAT 4.47V
ITEM ANALYSIS
================================================================================================================================
| | NOT RCH OMIT A B C D * E | TOTAL |
|
| ITEM 31 N | 126 34 135 163 137 288 50 | 933 | R BIS = 0.6396 P+ = 0.3087 |
| PERCENT | 13.50 3.64 14.47 17.47 14.68 30.87 5.36 | 100.00 | PT BIS = 0.4877
|
| EBE029 MEAN SCORE | 15.00 16.44 18.56 18.36 16.07 25.61 19.04 | 19.80 |
|
================================================================================================================================
| | NOT RCH OMIT A B C D * E | TOTAL |
|
| ITEM 32 N | 140 40 149 156 175 186 87 | 933 | R BIS = 0.4130 P+ = 0.1994 |
| PERCENT | 15.01 4.29 15.97 16.72 18.76 19.94 9.32 | 100.00 | PT BIS = 0.2889
|
| EBE030 MEAN SCORE | 15.71 18.95 20.60 16.76 20.82 24.41 19.00 | 19.80 |
|
================================================================================================================================
| | NOT RCH OMIT A B C D E * | TOTAL |
|
| ITEM 33 N | 145 37 159 178 95 81 238 | 933 | R BIS = 0.5337 P+ = 0.2551 |
| PERCENT | 15.54 3.97 17.04 19.08 10.18 8.68 25.51 | 100.00 | PT BIS = 0.3932
|
| EBE031 MEAN SCORE | 15.97 16.84 18.40 19.79 19.15 15.88 25.15 | 19.80 |
|
================================================================================================================================
| | NOT RCH OMIT A B * C D E | TOTAL |
|
| ITEM 34 N | 149 28 196 200 165 59 136 | 933 | R BIS = 0.4441 P+ = 0.2144 |
| PERCENT | 15.97 3.00 21.01 21.44 17.68 6.32 14.58 | 100.00 | PT BIS = 0.3157
|
| EBE032 MEAN SCORE | 16.03 15.29 21.26 24.61 19.75 14.08 18.25 | 19.80 |
|
================================================================================================================================
| | NOT RCH OMIT A B * C D | TOTAL |
|
| ITEM 35 N | 224 12 208 360 97 32 | 933 | R BIS = 0.4339 P+ = 0.3859 |
| PERCENT | 24.01 1.29 22.29 38.59 10.40 3.43 | 100.00 | PT BIS = 0.3410
|
| EBE033 MEAN SCORE | 17.23 20.08 19.16 23.22 15.86 15.34 | 19.80 |
|
================================================================================================================================
| | NOT RCH OMIT A B C D * | TOTAL |
|
| ITEM 36 N | 234 12 207 123 151 206 | 933 | R BIS = 0.3595 P+ = 0.2208 |
| PERCENT | 25.08 1.29 22.19 13.18 16.18 22.08 | 100.00 | PT BIS = 0.2572
|
| EBE034 MEAN SCORE | 17.50 22.67 20.44 17.55 18.85 23.65 | 19.80 |
|
================================================================================================================================
| | NOT RCH OMIT A * B C D | TOTAL |
|
| ITEM 37 N | 239 9 386 160 64 75 | 933 | R BIS = 0.4881 P+ = 0.4137 |
| PERCENT | 25.62 0.96 41.37 17.15 6.86 8.04 | 100.00 | PT BIS = 0.3861
|
| EBE035 MEAN SCORE | 17.56 23.89 23.46 18.38 14.34 15.33 | 19.80 |
|
================================================================================================================================
| | NOT RCH OMIT A B * C D | TOTAL |
|
| ITEM 38 N | 245 7 75 401 142 63 | 933 | R BIS = 0.5237 P+ = 0.4298 |
| PERCENT | 26.26 0.75 8.04 42.98 15.22 6.75 | 100.00 | PT BIS = 0.4154
|
| EBE036 MEAN SCORE | 17.69 23.43 14.48 23.61 16.87 16.33 | 19.80 |
|
================================================================================================================================
| | NOT RCH OMIT A B C * D | TOTAL |
|
| ITEM 39 N | 256 0 143 258 227 49 | 933 | R BIS = 0.2718 P+ = 0.2433 |
| PERCENT | 27.44 0.00 15.33 27.65 24.33 5.25 | 100.00 | PT BIS = 0.1984
|
| EBE037 MEAN SCORE | 17.89 0.00 18.81 20.78 22.59 14.65 | 19.80 |
|
================================================================================================================================

277
ELS2002 SPRING 2001 FIELD TEST ANALYSIS 10:59:30 6/11/01 PAGE 7
Reading Form 1 F4STAT 4.47V
TEST ANALYSIS
NUMBER OF ITEMS ANALYSED = 39
SUM OF RIGHTS = 18476.0000
SUM OF RIGHTS SQUARED = 10039518.0000
SUM OF WRONGS = 14636.0000
SUM OF WRONGS SQUARED = 6155846.0000
SUM OF RIGHTS X WRONGS = 6118440.0000
ALPHA RELIABILITY = 0.8922
STD. ERROR OF MEASUREMENT = 2.6119
SQUARED STD. ERR. OF MEAS. = 6.8222
- FORMULA SC0RE STATISTICS
NUMBER OF CASES PROCESSED = 933.0
MINIMUM SCORE = 1.0000
MAXIMUM SCORE = 39.0000
SUM OF SCORES = 18476.0000
SUM OF SQUARED SCORES = 424906.0000
MEAN SCORE = 19.8028
STANDARD DEVIATION (N) = 7.9542
STANDARD DEVIATION (N-1) = 7.9584
FORMULA SCORE = RIGHTS ONLY.

278
ELS2002 SPRING 2001 FIELD TEST ANALYSIS 17:53:21 6/11/01 PAGE 3
Reading Form 2 F4STAT 4.47V
ITEM ANALYSIS
================================================================================================================================
| | NOT RCH OMIT A B C * D | TOTAL |
|
| ITEM 1 N | 0 14 76 211 614 34 | 949 | R BIS = 0.4254 P+ = 0.6470 |
| PERCENT | 0.00 1.48 8.01 22.23 64.70 3.58 | 100.00 | PT BIS = 0.3308
|
| EBF001 MEAN SCORE | 0.00 16.57 14.70 16.54 21.38 13.21 | 19.40 |
|
================================================================================================================================
| | NOT RCH OMIT A B C D * | TOTAL |
|
| ITEM 2 N | 0 11 52 241 193 452 | 949 | R BIS = 0.4503 P+ = 0.4763 |
| PERCENT | 0.00 1.16 5.48 25.40 20.34 47.63 | 100.00 | PT BIS = 0.3589
|
| EBF002 MEAN SCORE | 0.00 11.82 11.08 18.71 15.82 22.44 | 19.40 |
|
================================================================================================================================
| | NOT RCH OMIT A * B C D | TOTAL |
|
| ITEM 3 N | 0 6 740 59 69 75 | 949 | R BIS = 0.6394 P+ = 0.7798 |
| PERCENT | 0.00 0.63 77.98 6.22 7.27 7.90 | 100.00 | PT BIS = 0.4571
|
| EBF003 MEAN SCORE | 0.00 8.33 21.36 11.58 11.83 14.05 | 19.40 |
|
================================================================================================================================
| | NOT RCH OMIT A B C D * | TOTAL |
|
| ITEM 4 N | 0 9 107 60 59 714 | 949 | R BIS = 0.7422 P+ = 0.7524 |
| PERCENT | 0.00 0.95 11.28 6.32 6.22 75.24 | 100.00 | PT BIS = 0.5436
|
| EBF004 MEAN SCORE | 0.00 12.11 13.00 10.52 10.68 21.92 | 19.40 |
|
================================================================================================================================
| | NOT RCH OMIT A B C * D | TOTAL |
|
| ITEM 5 N | 0 16 138 111 575 109 | 949 | R BIS = 0.5914 P+ = 0.6059 |
| PERCENT | 0.00 1.69 14.54 11.70 60.59 11.49 | 100.00 | PT BIS = 0.4657
|
| EBF005 MEAN SCORE | 0.00 15.63 15.43 14.34 22.44 14.13 | 19.40 |
|
================================================================================================================================
| | NOT RCH OMIT A B C D * | TOTAL |
|
| ITEM 6 N | 0 14 93 113 116 613 | 949 | R BIS = 0.7396 P+ = 0.6459 |
| PERCENT | 0.00 1.48 9.80 11.91 12.22 64.59 | 100.00 | PT BIS = 0.5754
|
| EBF006 MEAN SCORE | 0.00 14.29 13.75 12.32 13.27 22.84 | 19.40 |
|
================================================================================================================================
| | NOT RCH OMIT A B C * D E | TOTAL |
|
| ITEM 7 N | 0 15 133 130 434 187 50 | 949 | R BIS = 0.4743 P+ = 0.4573 |
| PERCENT | 0.00 1.58 14.01 13.70 45.73 19.70 5.27 | 100.00 | PT BIS = 0.3774
|
| EBF007 MEAN SCORE | 0.00 12.87 17.60 14.76 22.72 17.91 14.98 | 19.40 |
|
================================================================================================================================
| | NOT RCH OMIT A B C D E * | TOTAL |
|
| ITEM 8 N | 0 9 100 81 53 88 618 | 949 | R BIS = 0.7242 P+ = 0.6512 |
| PERCENT | 0.00 0.95 10.54 8.54 5.58 9.27 65.12 | 100.00 | PT BIS = 0.5623
|
| EBF008 MEAN SCORE | 0.00 9.56 14.16 13.05 10.94 13.97 22.73 | 19.40 |
|
================================================================================================================================
| | NOT RCH OMIT A B * C D E | TOTAL |
|
| ITEM 9 N | 0 12 165 446 112 82 132 | 949 | R BIS = 0.6911 P+ = 0.4700 |
| PERCENT | 0.00 1.26 17.39 47.00 11.80 8.64 13.91 | 100.00 | PT BIS = 0.5506
|
| EBF009 MEAN SCORE | 0.00 11.83 15.57 24.13 14.36 14.85 16.03 | 19.40 |
|
================================================================================================================================
| | NOT RCH OMIT A B C D E * | TOTAL |
|
| ITEM 10 N | 0 10 140 89 55 82 573 | 949 | R BIS = 0.6951 P+ = 0.6038 |
| PERCENT | 0.00 1.05 14.75 9.38 5.80 8.64 60.38 | 100.00 | PT BIS = 0.5477
|
| EBF010 MEAN SCORE | 0.00 9.10 15.15 12.25 12.55 15.24 22.99 | 19.40 |
|
================================================================================================================================

279
ELS2002 SPRING 2001 FIELD TEST ANALYSIS 17:53:21 6/11/01 PAGE 4
Reading Form 2 F4STAT 4.47V
ITEM ANALYSIS
================================================================================================================================
| | NOT RCH OMIT A B C D * | TOTAL |
|
| ITEM 11 N | 6 13 168 151 107 504 | 949 | R BIS = 0.6859 P+ = 0.5311 |
| PERCENT | 0.63 1.37 17.70 15.91 11.28 53.11 | 100.00 | PT BIS = 0.5464
|
| EBF011 MEAN SCORE | 7.50 10.54 17.29 14.01 12.53 23.55 | 19.40 |
|
================================================================================================================================
| | NOT RCH OMIT A * B | TOTAL |
|
| ITEM 12 N | 6 85 707 151 | 949 | R BIS = 0.5934 P+ = 0.7450 |
| PERCENT | 0.63 8.96 74.50 15.91 | 100.00 | PT BIS = 0.4371
|
| EBF012 MEAN SCORE | 7.50 12.04 21.47 14.35 | 19.40 |
|
================================================================================================================================
| | NOT RCH OMIT A * B | TOTAL |
|
| ITEM 13 N | 8 77 633 231 | 949 | R BIS = 0.7250 P+ = 0.6670 |
| PERCENT | 0.84 8.11 66.70 24.34 | 100.00 | PT BIS = 0.5592
|
| EBF013 MEAN SCORE | 6.63 9.94 22.59 14.26 | 19.40 |
|
================================================================================================================================
| | NOT RCH OMIT A * B C D | TOTAL |
|
| ITEM 14 N | 8 23 595 202 68 53 | 949 | R BIS = 0.6679 P+ = 0.6270 |
| PERCENT | 0.84 2.42 62.70 21.29 7.17 5.58 | 100.00 | PT BIS = 0.5229
|
| EBF014 MEAN SCORE | 6.63 13.78 22.66 13.61 14.06 16.11 | 19.40 |
|
================================================================================================================================
| | NOT RCH OMIT A B C * D | TOTAL |
|
| ITEM 15 N | 15 29 104 74 657 70 | 949 | R BIS = 0.5744 P+ = 0.6923 |
| PERCENT | 1.58 3.06 10.96 7.80 69.23 7.38 | 100.00 | PT BIS = 0.4377
|
| EBF015 MEAN SCORE | 7.07 14.10 13.78 12.35 21.76 17.93 | 19.40 |
|
================================================================================================================================
| | NOT RCH OMIT A B * C D | TOTAL |
|
| ITEM 16 N | 16 29 56 690 103 55 | 949 | R BIS = 0.7576 P+ = 0.7271 |
| PERCENT | 1.69 3.06 5.90 72.71 10.85 5.80 | 100.00 | PT BIS = 0.5653
|
| EBF016 MEAN SCORE | 7.00 13.86 11.64 22.20 11.78 13.02 | 19.40 |
|
================================================================================================================================
| | NOT RCH OMIT A * B C | TOTAL |
|
| ITEM 17 N | 19 70 770 77 13 | 949 | R BIS = 0.7691 P+ = 0.8114 |
| PERCENT | 2.00 7.38 81.14 8.11 1.37 | 100.00 | PT BIS = 0.5312
|
| EBF017B MEAN SCORE | 6.84 11.47 21.47 10.39 11.31 | 19.40 |
|
================================================================================================================================
| | NOT RCH OMIT A * B C | TOTAL |
|
| ITEM 18 N | 20 74 359 454 42 | 949 | R BIS = 0.2022 P+ = 0.3783 |
| PERCENT | 2.11 7.80 37.83 47.84 4.43 | 100.00 | PT BIS = 0.1586
|
| EBF017C MEAN SCORE | 7.20 12.03 21.04 20.44 12.95 | 19.40 |
|
================================================================================================================================
| | NOT RCH OMIT A B C * D | TOTAL |
|
| ITEM 19 N | 20 74 50 140 665 0 | 949 | R BIS = 0.7261 P+ = 0.7007 |
| PERCENT | 2.11 7.80 5.27 14.75 70.07 0.00 | 100.00 | PT BIS = 0.5508
|
| EBF017D MEAN SCORE | 7.20 11.36 11.36 14.46 22.31 0.00 | 19.40 |
|
================================================================================================================================
| | NOT RCH OMIT A B C D * | TOTAL |
|
| ITEM 20 N | 26 17 64 178 266 398 | 949 | R BIS = 0.7606 P+ = 0.4194 |
| PERCENT | 2.74 1.79 6.74 18.76 28.03 41.94 | 100.00 | PT BIS = 0.6022
|
| EBF018 MEAN SCORE | 8.15 11.41 14.47 14.79 16.73 25.13 | 19.40 |
|
================================================================================================================================

280
ELS2002 SPRING 2001 FIELD TEST ANALYSIS 17:53:21 6/11/01 PAGE 5
Reading Form 2 F4STAT 4.47V
ITEM ANALYSIS
================================================================================================================================
| | NOT RCH OMIT A B C * D | TOTAL |
|
| ITEM 21 N | 29 20 79 71 646 104 | 949 | R BIS = 0.7977 P+ = 0.6807 |
| PERCENT | 3.06 2.11 8.32 7.48 68.07 10.96 | 100.00 | PT BIS = 0.6114
|
| EBF019 MEAN SCORE | 8.07 11.60 12.04 11.77 22.78 13.86 | 19.40 |
|
================================================================================================================================
| | NOT RCH OMIT A B C * D | TOTAL |
|
| ITEM 22 N | 30 23 124 185 502 85 | 949 | R BIS = 0.6698 P+ = 0.5290 |
| PERCENT | 3.16 2.42 13.07 19.49 52.90 8.96 | 100.00 | PT BIS = 0.5337
|
| EBF020 MEAN SCORE | 8.03 11.78 15.35 16.96 23.47 12.69 | 19.40 |
|
================================================================================================================================
| | NOT RCH OMIT A B * C D | TOTAL |
|
| ITEM 23 N | 46 16 98 575 74 140 | 949 | R BIS = 0.6477 P+ = 0.6059 |
| PERCENT | 4.85 1.69 10.33 60.59 7.80 14.75 | 100.00 | PT BIS = 0.5101
|
| EBF021 MEAN SCORE | 10.04 14.69 15.03 22.73 12.54 16.06 | 19.40 |
|
================================================================================================================================
| | NOT RCH OMIT A B * C D | TOTAL |
|
| ITEM 24 N | 48 13 112 564 157 55 | 949 | R BIS = 0.7079 P+ = 0.5943 |
| PERCENT | 5.06 1.37 11.80 59.43 16.54 5.80 | 100.00 | PT BIS = 0.5590
|
| EBF022 MEAN SCORE | 10.02 14.15 14.42 23.13 15.24 12.62 | 19.40 |
|
================================================================================================================================
| | NOT RCH OMIT A B C D * | TOTAL |
|
| ITEM 25 N | 50 18 99 205 200 377 | 949 | R BIS = 0.5762 P+ = 0.3973 |
| PERCENT | 5.27 1.90 10.43 21.60 21.07 39.73 | 100.00 | PT BIS = 0.4541
|
| EBF023 MEAN SCORE | 10.14 16.89 13.41 17.54 18.30 23.92 | 19.40 |
|
================================================================================================================================
| | NOT RCH OMIT A B C D * E | TOTAL |
|
| ITEM 26 N | 72 20 154 63 123 436 81 | 949 | R BIS = 0.6346 P+ = 0.4594 |
| PERCENT | 7.59 2.11 16.23 6.64 12.96 45.94 8.54 | 100.00 | PT BIS = 0.5051
|
| EBF024 MEAN SCORE | 11.57 17.45 17.75 13.37 14.54 23.83 18.23 | 19.40 |
|
================================================================================================================================
| | NOT RCH OMIT A B C * D E | TOTAL |
|
| ITEM 27 N | 74 17 96 137 454 113 58 | 949 | R BIS = 0.6507 P+ = 0.4784 |
| PERCENT | 7.80 1.79 10.12 14.44 47.84 11.91 6.11 | 100.00 | PT BIS = 0.5187
|
| EBF025 MEAN SCORE | 11.51 15.12 15.47 15.74 23.78 16.96 16.41 | 19.40 |
|
================================================================================================================================
| | NOT RCH OMIT A B * C D E | TOTAL |
|
| ITEM 28 N | 82 23 109 496 61 92 86 | 949 | R BIS = 0.7485 P+ = 0.5227 |
| PERCENT | 8.64 2.42 11.49 52.27 6.43 9.69 9.06 | 100.00 | PT BIS = 0.5966
|
| EBF026 MEAN SCORE | 12.12 15.09 15.12 24.01 13.79 14.41 15.69 | 19.40 |
|
================================================================================================================================
| | NOT RCH OMIT A B C D * E | TOTAL |
|
| ITEM 29 N | 92 56 148 141 103 275 134 | 949 | R BIS = 0.4683 P+ = 0.2898 |
| PERCENT | 9.69 5.90 15.60 14.86 10.85 28.98 14.12 | 100.00 | PT BIS = 0.3532
|
| EBF028 MEAN SCORE | 12.98 17.36 17.75 18.16 16.97 23.87 20.50 | 19.40 |
|
================================================================================================================================
| | NOT RCH OMIT A B C * D | TOTAL |
|
| ITEM 30 N | 124 10 132 184 415 84 | 949 | R BIS = 0.5627 P+ = 0.4373 |
| PERCENT | 13.07 1.05 13.91 19.39 43.73 8.85 | 100.00 | PT BIS = 0.4468
|
| EBF029 MEAN SCORE | 14.66 14.90 14.67 17.56 23.50 18.18 | 19.40 |
|
================================================================================================================================
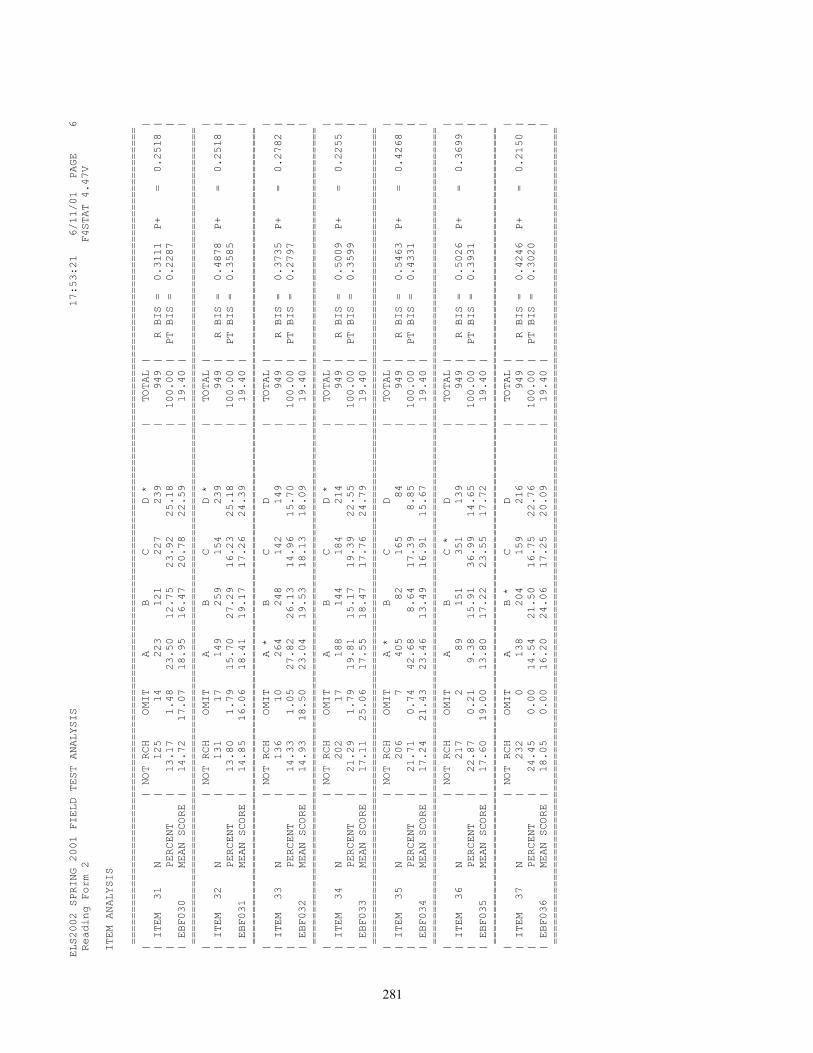
281
ELS2002 SPRING 2001 FIELD TEST ANALYSIS 17:53:21 6/11/01 PAGE 6
Reading Form 2 F4STAT 4.47V
ITEM ANALYSIS
================================================================================================================================
| | NOT RCH OMIT A B C D * | TOTAL |
|
| ITEM 31 N | 125 14 223 121 227 239 | 949 | R BIS = 0.3111 P+ = 0.2518 |
| PERCENT | 13.17 1.48 23.50 12.75 23.92 25.18 | 100.00 | PT BIS = 0.2287
|
| EBF030 MEAN SCORE | 14.72 17.07 18.95 16.47 20.78 22.59 | 19.40 |
|
================================================================================================================================
| | NOT RCH OMIT A B C D * | TOTAL |
|
| ITEM 32 N | 131 17 149 259 154 239 | 949 | R BIS = 0.4878 P+ = 0.2518 |
| PERCENT | 13.80 1.79 15.70 27.29 16.23 25.18 | 100.00 | PT BIS = 0.3585
|
| EBF031 MEAN SCORE | 14.85 16.06 18.41 19.17 17.26 24.39 | 19.40 |
|
================================================================================================================================
| | NOT RCH OMIT A * B C D | TOTAL |
|
| ITEM 33 N | 136 10 264 248 142 149 | 949 | R BIS = 0.3735 P+ = 0.2782 |
| PERCENT | 14.33 1.05 27.82 26.13 14.96 15.70 | 100.00 | PT BIS = 0.2797
|
| EBF032 MEAN SCORE | 14.93 18.50 23.04 19.53 18.13 18.09 | 19.40 |
|
================================================================================================================================
| | NOT RCH OMIT A B C D * | TOTAL |
|
| ITEM 34 N | 202 17 188 144 184 214 | 949 | R BIS = 0.5009 P+ = 0.2255 |
| PERCENT | 21.29 1.79 19.81 15.17 19.39 22.55 | 100.00 | PT BIS = 0.3599
|
| EBF033 MEAN SCORE | 17.11 25.06 17.55 18.47 17.76 24.79 | 19.40 |
|
================================================================================================================================
| | NOT RCH OMIT A * B C D | TOTAL |
|
| ITEM 35 N | 206 7 405 82 165 84 | 949 | R BIS = 0.5463 P+ = 0.4268 |
| PERCENT | 21.71 0.74 42.68 8.64 17.39 8.85 | 100.00 | PT BIS = 0.4331
|
| EBF034 MEAN SCORE | 17.24 21.43 23.46 13.49 16.91 15.67 | 19.40 |
|
================================================================================================================================
| | NOT RCH OMIT A B C * D | TOTAL |
|
| ITEM 36 N | 217 2 89 151 351 139 | 949 | R BIS = 0.5026 P+ = 0.3699 |
| PERCENT | 22.87 0.21 9.38 15.91 36.99 14.65 | 100.00 | PT BIS = 0.3931
|
| EBF035 MEAN SCORE | 17.60 19.00 13.80 17.22 23.55 17.72 | 19.40 |
|
================================================================================================================================
| | NOT RCH OMIT A B * C D | TOTAL |
|
| ITEM 37 N | 232 0 138 204 159 216 | 949 | R BIS = 0.4246 P+ = 0.2150 |
| PERCENT | 24.45 0.00 14.54 21.50 16.75 22.76 | 100.00 | PT BIS = 0.3020
|
| EBF036 MEAN SCORE | 18.05 0.00 16.20 24.06 17.25 20.09 | 19.40 |
|
================================================================================================================================

282
ELS2002 SPRING 2001 FIELD TEST ANALYSIS 17:53:21 6/11/01 PAGE 7
Reading Form 2 F4STAT 4.47V
TEST ANALYSIS
NUMBER OF ITEMS ANALYSED = 37
SUM OF RIGHTS = 18413.0000
SUM OF RIGHTS SQUARED = 10090177.0000
SUM OF WRONGS = 13770.0000
SUM OF WRONGS SQUARED = 5698996.0000
SUM OF RIGHTS X WRONGS = 6182138.0000
ALPHA RELIABILITY = 0.8986
STD. ERROR OF MEASUREMENT = 2.5718
SQUARED STD. ERR. OF MEAS. = 6.6142
- FORMULA SC0RE STATISTICS
NUMBER OF CASES PROCESSED = 949.0
MINIMUM SCORE = 1.0000
MAXIMUM SCORE = 37.0000
SUM OF SCORES = 18413.0000
SUM OF SQUARED SCORES = 419173.0000
MEAN SCORE = 19.4025
STANDARD DEVIATION (N) = 8.0772
STANDARD DEVIATION (N-1) = 8.0815
FORMULA SCORE = RIGHTS ONLY.

283
ELS2002 SPRING 2001 FIELD TEST ANALYSIS 13:08:59 6/10/01 PAGE 3
Math Form 1 F4STAT 4.47V
ITEM ANALYSIS
================================================================================================================================
| | NOT RCH OMIT A * B C D | TOTAL |
|
| ITEM 1 N | 0 10 873 31 10 17 | 941 | R BIS = 0.4845 P+ = 0.9277 |
| PERCENT | 0.00 1.06 92.77 3.29 1.06 1.81 | 100.00 | PT BIS = 0.2572
|
| EBM001 MEAN SCORE | 0.00 14.10 18.79 9.55 10.30 10.12 | 18.19 |
|
================================================================================================================================
| | NOT RCH OMIT A B C * D | TOTAL |
|
| ITEM 2 N | 0 4 97 52 782 6 | 941 | R BIS = 0.5654 P+ = 0.8310 |
| PERCENT | 0.00 0.43 10.31 5.53 83.10 0.64 | 100.00 | PT BIS = 0.3806
|
| EBM002 MEAN SCORE | 0.00 10.00 11.46 10.87 19.63 8.50 | 18.19 |
|
================================================================================================================================
| | NOT RCH OMIT A B * C D | TOTAL |
|
| ITEM 3 N | 0 7 71 786 47 30 | 941 | R BIS = 0.6230 P+ = 0.8353 |
| PERCENT | 0.00 0.74 7.55 83.53 4.99 3.19 | 100.00 | PT BIS = 0.4167
|
| EBM003 MEAN SCORE | 0.00 15.71 10.17 19.74 10.62 9.00 | 18.19 |
|
================================================================================================================================
| | NOT RCH OMIT A B C D * | TOTAL |
|
| ITEM 4 N | 0 5 24 20 195 697 | 941 | R BIS = 0.5841 P+ = 0.7407 |
| PERCENT | 0.00 0.53 2.55 2.13 20.72 74.07 | 100.00 | PT BIS = 0.4317
|
| EBM004 MEAN SCORE | 0.00 11.60 9.63 7.70 12.84 20.33 | 18.19 |
|
================================================================================================================================
| | NOT RCH OMIT A * B C D | TOTAL |
|
| ITEM 5 N | 0 18 655 109 88 71 | 941 | R BIS = 0.7041 P+ = 0.6961 |
| PERCENT | 0.00 1.91 69.61 11.58 9.35 7.55 | 100.00 | PT BIS = 0.5354
|
| EBM005 MEAN SCORE | 0.00 10.67 21.15 11.39 10.97 12.14 | 18.19 |
|
================================================================================================================================
| | NOT RCH OMIT A B * C D | TOTAL |
|
| ITEM 6 N | 0 8 109 645 161 18 | 941 | R BIS = 0.6767 P+ = 0.6854 |
| PERCENT | 0.00 0.85 11.58 68.54 17.11 1.91 | 100.00 | PT BIS = 0.5175
|
| EBM006 MEAN SCORE | 0.00 12.50 13.26 21.13 10.91 10.50 | 18.19 |
|
================================================================================================================================
| | NOT RCH OMIT A * B C D | TOTAL |
|
| ITEM 7 N | 0 11 566 114 217 33 | 941 | R BIS = 0.6656 P+ = 0.6015 |
| PERCENT | 0.00 1.17 60.15 12.11 23.06 3.51 | 100.00 | PT BIS = 0.5247
|
| EBM007 MEAN SCORE | 0.00 12.00 21.77 12.94 12.67 13.30 | 18.19 |
|
================================================================================================================================
| | NOT RCH OMIT A B C D * | TOTAL |
|
| ITEM 8 N | 0 9 37 247 125 523 | 941 | R BIS = 0.6297 P+ = 0.5558 |
| PERCENT | 0.00 0.96 3.93 26.25 13.28 55.58 | 100.00 | PT BIS = 0.5005
|
| EBM008 MEAN SCORE | 0.00 11.78 8.76 14.40 13.25 21.94 | 18.19 |
|
================================================================================================================================
| | NOT RCH OMIT A * B C D | TOTAL |
|
| ITEM 9 N | 0 1 904 19 9 8 | 941 | R BIS = 0.5205 P+ = 0.9607 |
| PERCENT | 0.00 0.11 96.07 2.02 0.96 0.85 | 100.00 | PT BIS = 0.2285
|
| EBM009 MEAN SCORE | 0.00 7.00 18.58 9.79 7.44 7.88 | 18.19 |
|
================================================================================================================================
| | NOT RCH OMIT A B * C D | TOTAL |
|
| ITEM 10 N | 0 5 25 739 103 69 | 941 | R BIS = 0.5889 P+ = 0.7853 |
| PERCENT | 0.00 0.53 2.66 78.53 10.95 7.33 | 100.00 | PT BIS = 0.4187
|
| EBM010 MEAN SCORE | 0.00 14.60 12.80 20.02 11.55 10.67 | 18.19 |
|
================================================================================================================================
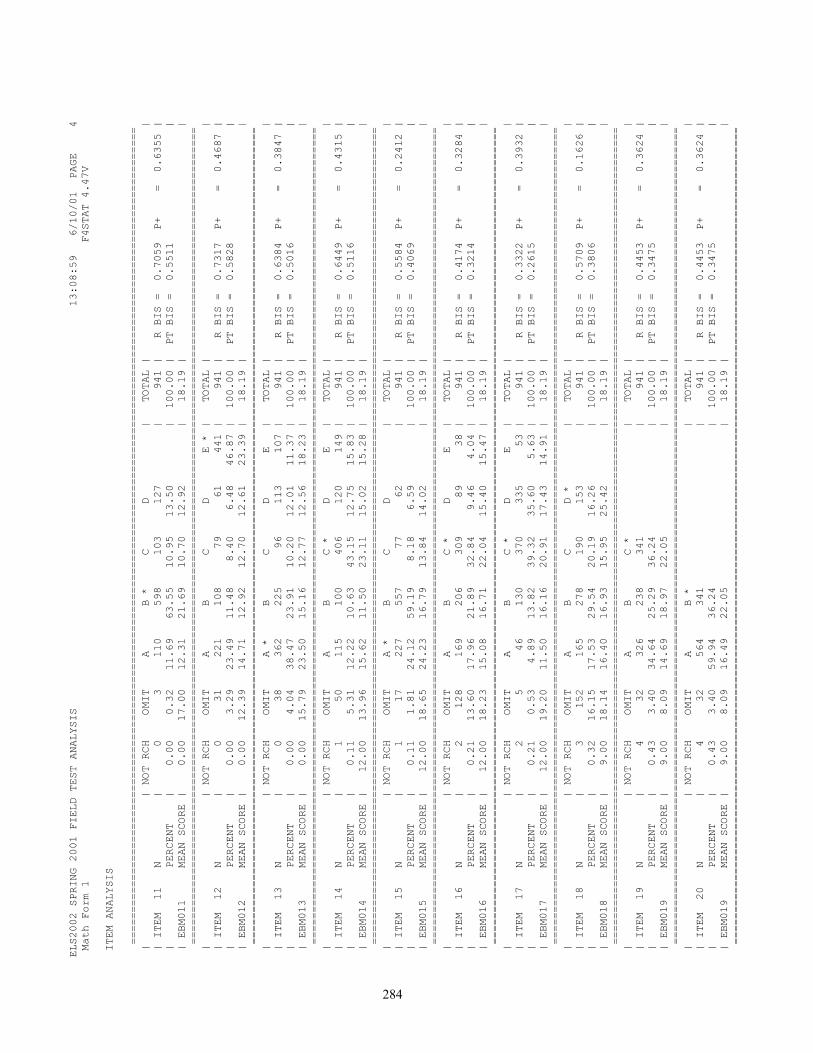
284
ELS2002 SPRING 2001 FIELD TEST ANALYSIS 13:08:59 6/10/01 PAGE 4
Math Form 1 F4STAT 4.47V
ITEM ANALYSIS
================================================================================================================================
| | NOT RCH OMIT A B * C D | TOTAL |
|
| ITEM 11 N | 0 3 110 598 103 127 | 941 | R BIS = 0.7059 P+ = 0.6355 |
| PERCENT | 0.00 0.32 11.69 63.55 10.95 13.50 | 100.00 | PT BIS = 0.5511
|
| EBM011 MEAN SCORE | 0.00 17.00 12.31 21.69 10.70 12.92 | 18.19 |
|
================================================================================================================================
| | NOT RCH OMIT A B C D E * | TOTAL |
|
| ITEM 12 N | 0 31 221 108 79 61 441 | 941 | R BIS = 0.7317 P+ = 0.4687 |
| PERCENT | 0.00 3.29 23.49 11.48 8.40 6.48 46.87 | 100.00 | PT BIS = 0.5828
|
| EBM012 MEAN SCORE | 0.00 12.39 14.71 12.92 12.70 12.61 23.39 | 18.19 |
|
================================================================================================================================
| | NOT RCH OMIT A * B C D E | TOTAL |
|
| ITEM 13 N | 0 38 362 225 96 113 107 | 941 | R BIS = 0.6384 P+ = 0.3847 |
| PERCENT | 0.00 4.04 38.47 23.91 10.20 12.01 11.37 | 100.00 | PT BIS = 0.5016
|
| EBM013 MEAN SCORE | 0.00 15.79 23.50 15.16 12.77 12.56 18.23 | 18.19 |
|
================================================================================================================================
| | NOT RCH OMIT A B C * D E | TOTAL |
|
| ITEM 14 N | 1 50 115 100 406 120 149 | 941 | R BIS = 0.6449 P+ = 0.4315 |
| PERCENT | 0.11 5.31 12.22 10.63 43.15 12.75 15.83 | 100.00 | PT BIS = 0.5116
|
| EBM014 MEAN SCORE | 12.00 13.96 15.62 11.50 23.11 15.02 15.28 | 18.19 |
|
================================================================================================================================
| | NOT RCH OMIT A * B C D | TOTAL |
|
| ITEM 15 N | 1 17 227 557 77 62 | 941 | R BIS = 0.5584 P+ = 0.2412 |
| PERCENT | 0.11 1.81 24.12 59.19 8.18 6.59 | 100.00 | PT BIS = 0.4069
|
| EBM015 MEAN SCORE | 12.00 18.65 24.23 16.79 13.84 14.02 | 18.19 |
|
================================================================================================================================
| | NOT RCH OMIT A B C * D E | TOTAL |
|
| ITEM 16 N | 2 128 169 206 309 89 38 | 941 | R BIS = 0.4174 P+ = 0.3284 |
| PERCENT | 0.21 13.60 17.96 21.89 32.84 9.46 4.04 | 100.00 | PT BIS = 0.3214
|
| EBM016 MEAN SCORE | 12.00 18.23 15.08 16.71 22.04 15.40 15.47 | 18.19 |
|
================================================================================================================================
| | NOT RCH OMIT A B C * D E | TOTAL |
|
| ITEM 17 N | 2 5 46 130 370 335 53 | 941 | R BIS = 0.3322 P+ = 0.3932 |
| PERCENT | 0.21 0.53 4.89 13.82 39.32 35.60 5.63 | 100.00 | PT BIS = 0.2615
|
| EBM017 MEAN SCORE | 12.00 19.20 11.50 16.16 20.91 17.43 14.91 | 18.19 |
|
================================================================================================================================
| | NOT RCH OMIT A B C D * | TOTAL |
|
| ITEM 18 N | 3 152 165 278 190 153 | 941 | R BIS = 0.5709 P+ = 0.1626 |
| PERCENT | 0.32 16.15 17.53 29.54 20.19 16.26 | 100.00 | PT BIS = 0.3806
|
| EBM018 MEAN SCORE | 9.00 18.14 16.40 16.93 15.95 25.42 | 18.19 |
|
================================================================================================================================
| | NOT RCH OMIT A B C * | TOTAL |
|
| ITEM 19 N | 4 32 326 238 341 | 941 | R BIS = 0.4453 P+ = 0.3624 |
| PERCENT | 0.43 3.40 34.64 25.29 36.24 | 100.00 | PT BIS = 0.3475
|
| EBM019 MEAN SCORE | 9.00 8.09 14.69 18.97 22.05 | 18.19 |
|
================================================================================================================================
| | NOT RCH OMIT A B * | TOTAL |
|
| ITEM 20 N | 4 32 564 341 | 941 | R BIS = 0.4453 P+ = 0.3624 |
| PERCENT | 0.43 3.40 59.94 36.24 | 100.00 | PT BIS = 0.3475
|
| EBM019 MEAN SCORE | 9.00 8.09 16.49 22.05 | 18.19 |
|
================================================================================================================================

285
ELS2002 SPRING 2001 FIELD TEST ANALYSIS 13:08:59 6/10/01 PAGE 5
Math Form 1 F4STAT 4.47V
ITEM ANALYSIS
================================================================================================================================
| | NOT RCH OMIT A B C * | TOTAL |
|
| ITEM 21 N | 9 506 239 4 183 | 941 | R BIS = 0.8946 P+ = 0.1945 |
| PERCENT | 0.96 53.77 25.40 0.43 19.45 | 100.00 | PT BIS = 0.6223
|
| EBM020 MEAN SCORE | 9.33 15.20 16.73 18.00 28.80 | 18.19 |
|
================================================================================================================================
| | NOT RCH OMIT A B * | TOTAL |
|
| ITEM 22 N | 9 506 239 187 | 941 | R BIS = 0.8826 P+ = 0.1987 |
| PERCENT | 0.96 53.77 25.40 19.87 | 100.00 | PT BIS = 0.6170
|
| EBM020 MEAN SCORE | 9.33 15.20 16.73 28.57 | 18.19 |
|
================================================================================================================================
| | NOT RCH OMIT A B C * | TOTAL |
|
| ITEM 23 N | 9 290 488 54 100 | 941 | R BIS = 0.9494 P+ = 0.1063 |
| PERCENT | 0.96 30.82 51.86 5.74 10.63 | 100.00 | PT BIS = 0.5652
|
| EBM021 MEAN SCORE | 9.33 13.81 17.26 26.17 31.92 | 18.19 |
|
================================================================================================================================
| | NOT RCH OMIT A B * | TOTAL |
|
| ITEM 24 N | 9 290 488 154 | 941 | R BIS = 0.9263 P+ = 0.1637 |
| PERCENT | 0.96 30.82 51.86 16.37 | 100.00 | PT BIS = 0.6186
|
| EBM021 MEAN SCORE | 9.33 13.81 17.26 29.90 | 18.19 |
|
================================================================================================================================
| | NOT RCH OMIT A B * | TOTAL |
|
| ITEM 25 N | 11 41 431 458 | 941 | R BIS = 0.5577 P+ = 0.4867 |
| PERCENT | 1.17 4.36 45.80 48.67 | 100.00 | PT BIS = 0.4448
|
| EBM022 MEAN SCORE | 10.27 11.49 14.96 22.02 | 18.19 |
|
================================================================================================================================
| | NOT RCH OMIT A B * | TOTAL |
|
| ITEM 26 N | 16 103 652 170 | 941 | R BIS = 0.5511 P+ = 0.1807 |
| PERCENT | 1.70 10.95 69.29 18.07 | 100.00 | PT BIS = 0.3769
|
| EBM023 MEAN SCORE | 11.50 12.82 17.45 24.91 | 18.19 |
|
================================================================================================================================
| | NOT RCH OMIT A * B C D | TOTAL |
|
| ITEM 27 N | 16 65 652 29 109 70 | 941 | R BIS = 0.6281 P+ = 0.6929 |
| PERCENT | 1.70 6.91 69.29 3.08 11.58 7.44 | 100.00 | PT BIS = 0.4784
|
| EBM024 MEAN SCORE | 11.50 14.35 20.86 12.07 11.83 10.86 | 18.19 |
|
================================================================================================================================
| | NOT RCH OMIT A B * | TOTAL |
|
| ITEM 28 N | 24 245 457 215 | 941 | R BIS = 0.6099 P+ = 0.2285 |
| PERCENT | 2.55 26.04 48.57 22.85 | 100.00 | PT BIS = 0.4395
|
| EBM025 MEAN SCORE | 12.25 15.62 16.69 24.95 | 18.19 |
|
================================================================================================================================
| | NOT RCH OMIT A B * | TOTAL |
|
| ITEM 29 N | 28 137 339 437 | 941 | R BIS = 0.7370 P+ = 0.4644 |
| PERCENT | 2.98 14.56 36.03 46.44 | 100.00 | PT BIS = 0.5869
|
| EBM026 MEAN SCORE | 12.00 13.87 13.64 23.47 | 18.19 |
|
================================================================================================================================
| | NOT RCH OMIT A B * | TOTAL |
|
| ITEM 30 N | 33 211 231 466 | 941 | R BIS = 0.4576 P+ = 0.4952 |
| PERCENT | 3.51 22.42 24.55 49.52 | 100.00 | PT BIS = 0.3651
|
| EBM027 MEAN SCORE | 12.70 15.75 14.97 21.28 | 18.19 |
|
================================================================================================================================
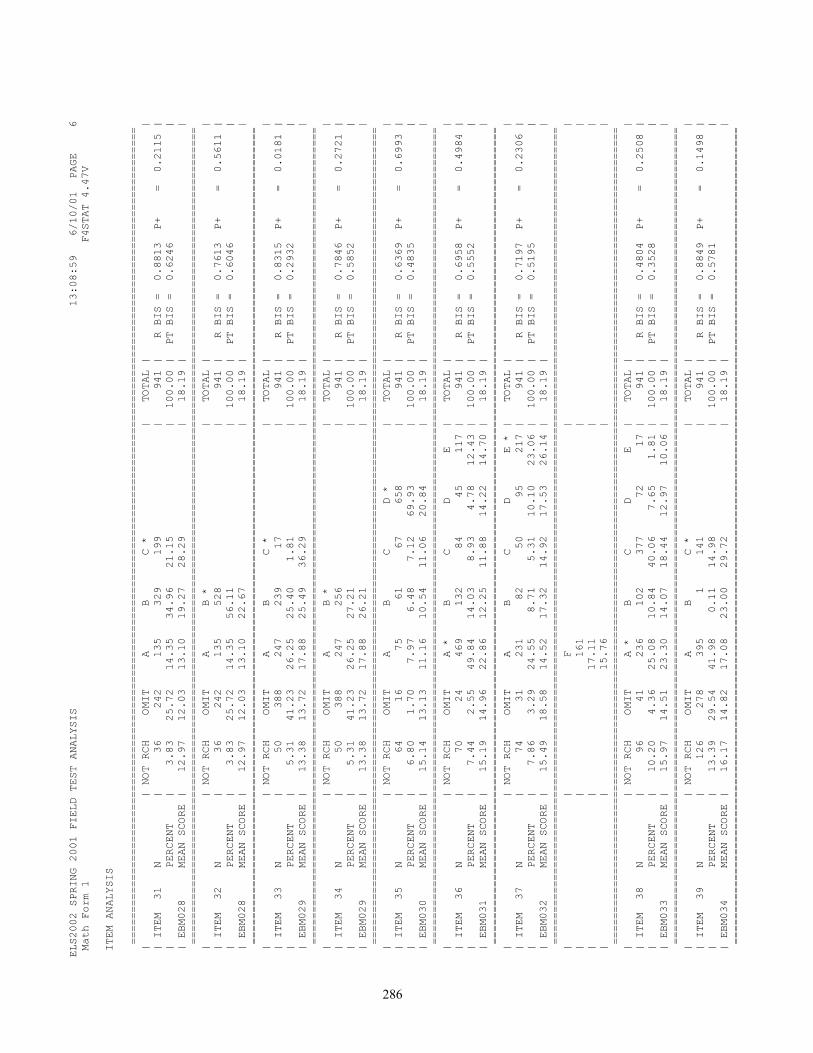
286
ELS2002 SPRING 2001 FIELD TEST ANALYSIS 13:08:59 6/10/01 PAGE 6
Math Form 1 F4STAT 4.47V
ITEM ANALYSIS
================================================================================================================================
| | NOT RCH OMIT A B C * | TOTAL |
|
| ITEM 31 N | 36 242 135 329 199 | 941 | R BIS = 0.8813 P+ = 0.2115 |
| PERCENT | 3.83 25.72 14.35 34.96 21.15 | 100.00 | PT BIS = 0.6246
|
| EBM028 MEAN SCORE | 12.97 12.03 13.10 19.27 28.29 | 18.19 |
|
================================================================================================================================
| | NOT RCH OMIT A B * | TOTAL |
|
| ITEM 32 N | 36 242 135 528 | 941 | R BIS = 0.7613 P+ = 0.5611 |
| PERCENT | 3.83 25.72 14.35 56.11 | 100.00 | PT BIS = 0.6046
|
| EBM028 MEAN SCORE | 12.97 12.03 13.10 22.67 | 18.19 |
|
================================================================================================================================
| | NOT RCH OMIT A B C * | TOTAL |
|
| ITEM 33 N | 50 388 247 239 17 | 941 | R BIS = 0.8315 P+ = 0.0181 |
| PERCENT | 5.31 41.23 26.25 25.40 1.81 | 100.00 | PT BIS = 0.2932
|
| EBM029 MEAN SCORE | 13.38 13.72 17.88 25.49 36.29 | 18.19 |
|
================================================================================================================================
| | NOT RCH OMIT A B * | TOTAL |
|
| ITEM 34 N | 50 388 247 256 | 941 | R BIS = 0.7846 P+ = 0.2721 |
| PERCENT | 5.31 41.23 26.25 27.21 | 100.00 | PT BIS = 0.5852
|
| EBM029 MEAN SCORE | 13.38 13.72 17.88 26.21 | 18.19 |
|
================================================================================================================================
| | NOT RCH OMIT A B C D * | TOTAL |
|
| ITEM 35 N | 64 16 75 61 67 658 | 941 | R BIS = 0.6369 P+ = 0.6993 |
| PERCENT | 6.80 1.70 7.97 6.48 7.12 69.93 | 100.00 | PT BIS = 0.4835
|
| EBM030 MEAN SCORE | 15.14 13.13 11.16 10.54 11.06 20.84 | 18.19 |
|
================================================================================================================================
| | NOT RCH OMIT A * B C D E | TOTAL |
|
| ITEM 36 N | 70 24 469 132 84 45 117 | 941 | R BIS = 0.6958 P+ = 0.4984 |
| PERCENT | 7.44 2.55 49.84 14.03 8.93 4.78 12.43 | 100.00 | PT BIS = 0.5552
|
| EBM031 MEAN SCORE | 15.19 14.96 22.86 12.25 11.88 14.22 14.70 | 18.19 |
|
================================================================================================================================
| | NOT RCH OMIT A B C D E * | TOTAL |
|
| ITEM 37 N | 74 31 231 82 50 95 217 | 941 | R BIS = 0.7197 P+ = 0.2306 |
| PERCENT | 7.86 3.29 24.55 8.71 5.31 10.10 23.06 | 100.00 | PT BIS = 0.5195
|
| EBM032 MEAN SCORE | 15.49 18.58 14.52 17.32 14.92 17.53 26.14 | 18.19 |
|
================================================================================================================================
| | F |
|
| | 161 |
|
| | 17.11 |
|
| | 15.76 |
|
================================================================================================================================
| | NOT RCH OMIT A * B C D E | TOTAL |
|
| ITEM 38 N | 96 41 236 102 377 72 17 | 941 | R BIS = 0.4804 P+ = 0.2508 |
| PERCENT | 10.20 4.36 25.08 10.84 40.06 7.65 1.81 | 100.00 | PT BIS = 0.3528
|
| EBM033 MEAN SCORE | 15.97 14.51 23.30 14.07 18.44 12.97 10.06 | 18.19 |
|
================================================================================================================================
| | NOT RCH OMIT A B C * | TOTAL |
|
| ITEM 39 N | 126 278 395 1 141 | 941 | R BIS = 0.8849 P+ = 0.1498 |
| PERCENT | 13.39 29.54 41.98 0.11 14.98 | 100.00 | PT BIS = 0.5781
|
| EBM034 MEAN SCORE | 16.17 14.82 17.08 23.00 29.72 | 18.19 |
|
================================================================================================================================

287
ELS2002 SPRING 2001 FIELD TEST ANALYSIS 13:08:59 6/10/01 PAGE 7
Math Form 1 F4STAT 4.47V
ITEM ANALYSIS
================================================================================================================================
| | NOT RCH OMIT A B * | TOTAL |
|
| ITEM 40 N | 126 278 395 142 | 941 | R BIS = 0.8834 P+ = 0.1509 |
| PERCENT | 13.39 29.54 41.98 15.09 | 100.00 | PT BIS = 0.5781
|
| EBM034 MEAN SCORE | 16.17 14.82 17.08 29.68 | 18.19 |
|
================================================================================================================================
| | NOT RCH OMIT A B C D E * | TOTAL |
|
| ITEM 41 N | 153 148 83 110 156 177 114 | 941 | R BIS = 0.3554 P+ = 0.1211 |
| PERCENT | 16.26 15.73 8.82 11.69 16.58 18.81 12.11 | 100.00 | PT BIS = 0.2195
|
| EBM035 MEAN SCORE | 17.14 19.39 16.37 17.18 17.22 17.23 23.14 | 18.19 |
|
================================================================================================================================
| | NOT RCH OMIT A B C D * E | TOTAL |
|
| ITEM 42 N | 162 34 40 121 385 145 54 | 941 | R BIS = 0.3555 P+ = 0.1541 |
| PERCENT | 17.22 3.61 4.25 12.86 40.91 15.41 5.74 | 100.00 | PT BIS = 0.2339
|
| EBM036 MEAN SCORE | 17.35 19.41 14.57 17.10 18.32 22.78 11.81 | 18.19 |
|
================================================================================================================================
| | NOT RCH OMIT A B C D E * | TOTAL |
|
| ITEM 43 N | 177 58 41 405 119 73 68 | 941 | R BIS = 0.4792 P+ = 0.0723 |
| PERCENT | 18.81 6.16 4.36 43.04 12.65 7.76 7.23 | 100.00 | PT BIS = 0.2544
|
| EBM037 MEAN SCORE | 17.47 20.10 16.17 17.64 18.03 15.75 25.82 | 18.19 |
|
================================================================================================================================
| | NOT RCH OMIT A B C * D E | TOTAL |
|
| ITEM 44 N | 184 0 300 147 186 18 106 | 941 | R BIS = 0.4685 P+ = 0.1977 |
| PERCENT | 19.55 0.00 31.88 15.62 19.77 1.91 11.26 | 100.00 | PT BIS = 0.3271
|
| EBM038 MEAN SCORE | 17.46 0.00 17.60 17.94 23.71 13.17 12.62 | 18.19 |
|
================================================================================================================================
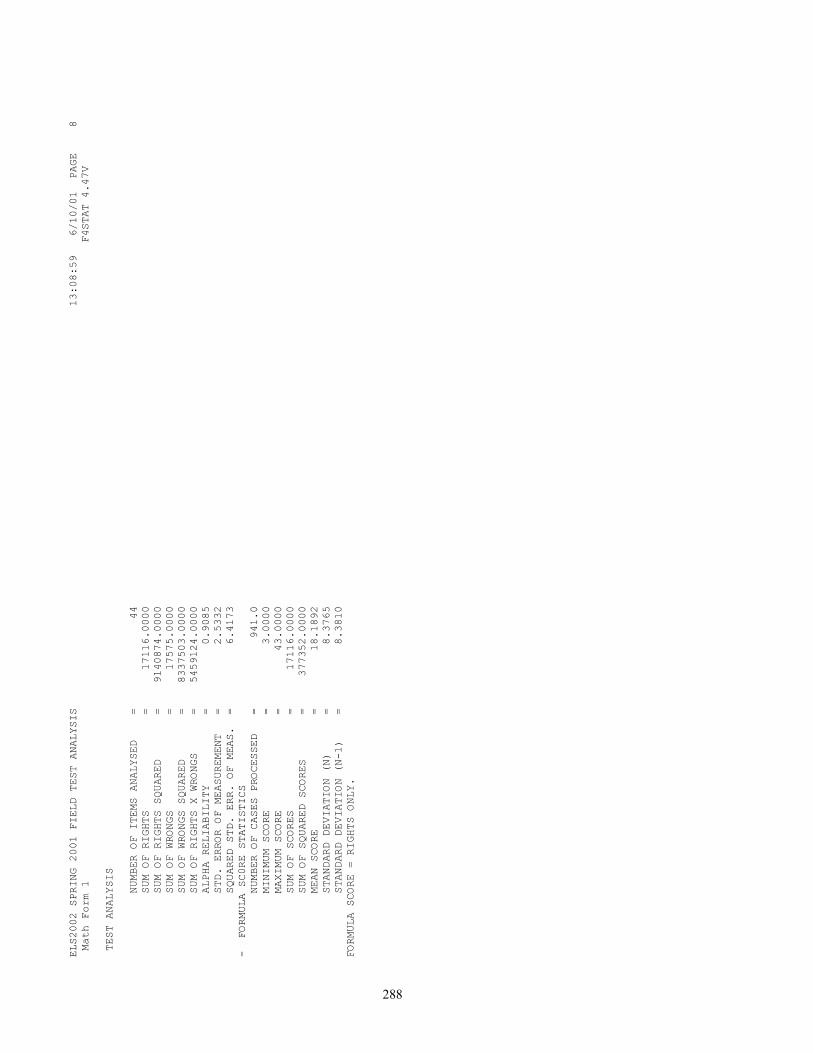
288
ELS2002 SPRING 2001 FIELD TEST ANALYSIS 13:08:59 6/10/01 PAGE 8
Math Form 1 F4STAT 4.47V
TEST ANALYSIS
NUMBER OF ITEMS ANALYSED = 44
SUM OF RIGHTS = 17116.0000
SUM OF RIGHTS SQUARED = 9140874.0000
SUM OF WRONGS = 17575.0000
SUM OF WRONGS SQUARED = 8337503.0000
SUM OF RIGHTS X WRONGS = 5459124.0000
ALPHA RELIABILITY = 0.9085
STD. ERROR OF MEASUREMENT = 2.5332
SQUARED STD. ERR. OF MEAS. = 6.4173
- FORMULA SC0RE STATISTICS
NUMBER OF CASES PROCESSED = 941.0
MINIMUM SCORE = 3.0000
MAXIMUM SCORE = 43.0000
SUM OF SCORES = 17116.0000
SUM OF SQUARED SCORES = 377352.0000
MEAN SCORE = 18.1892
STANDARD DEVIATION (N) = 8.3765
STANDARD DEVIATION (N-1) = 8.3810
FORMULA SCORE = RIGHTS ONLY.

289
ELS2002 SPRING 2001 FIELD TEST ANALYSIS 14:06:30 6/10/01 PAGE 3
Math Form 2 F4STAT 4.47V
ITEM ANALYSIS
================================================================================================================================
| | NOT RCH OMIT A B * C D | TOTAL |
|
| ITEM 1 N | 0 3 80 843 36 5 | 967 | R BIS = 0.4987 P+ = 0.8718 |
| PERCENT | 0.00 0.31 8.27 87.18 3.72 0.52 | 100.00 | PT BIS = 0.3127
|
| EBN001 MEAN SCORE | 0.00 10.67 16.81 24.00 15.83 14.60 | 23.01 |
|
================================================================================================================================
| | NOT RCH OMIT A B * C D | TOTAL |
|
| ITEM 2 N | 0 3 40 829 87 8 | 967 | R BIS = 0.4217 P+ = 0.8573 |
| PERCENT | 0.00 0.31 4.14 85.73 9.00 0.83 | 100.00 | PT BIS = 0.2721
|
| EBN002 MEAN SCORE | 0.00 12.00 14.82 23.92 19.38 12.75 | 23.01 |
|
================================================================================================================================
| | NOT RCH OMIT A * B C D | TOTAL |
|
| ITEM 3 N | 0 3 890 27 29 18 | 967 | R BIS = 0.6942 P+ = 0.9204 |
| PERCENT | 0.00 0.31 92.04 2.79 3.00 1.86 | 100.00 | PT BIS = 0.3796
|
| EBN003 MEAN SCORE | 0.00 8.67 23.93 12.70 11.28 14.28 | 23.01 |
|
================================================================================================================================
| | NOT RCH OMIT A * B C D | TOTAL |
|
| ITEM 4 N | 0 12 783 77 41 54 | 967 | R BIS = 0.5685 P+ = 0.8097 |
| PERCENT | 0.00 1.24 80.97 7.96 4.24 5.58 | 100.00 | PT BIS = 0.3935
|
| EBN004 MEAN SCORE | 0.00 17.08 24.58 17.64 16.59 14.07 | 23.01 |
|
================================================================================================================================
| | NOT RCH OMIT A B * C D | TOTAL |
|
| ITEM 5 N | 0 4 228 691 27 17 | 967 | R BIS = 0.6504 P+ = 0.7146 |
| PERCENT | 0.00 0.41 23.58 71.46 2.79 1.76 | 100.00 | PT BIS = 0.4893
|
| EBN005 MEAN SCORE | 0.00 12.75 17.42 25.55 12.26 13.94 | 23.01 |
|
================================================================================================================================
| | NOT RCH OMIT A B * C D | TOTAL |
|
| ITEM 6 N | 0 15 97 650 138 67 | 967 | R BIS = 0.5596 P+ = 0.6722 |
| PERCENT | 0.00 1.55 10.03 67.22 14.27 6.93 | 100.00 | PT BIS = 0.4307
|
| EBN006 MEAN SCORE | 0.00 15.07 18.89 25.48 17.08 18.93 | 23.01 |
|
================================================================================================================================
| | NOT RCH OMIT A B C * D | TOTAL |
|
| ITEM 7 N | 0 8 31 77 765 86 | 967 | R BIS = 0.6735 P+ = 0.7911 |
| PERCENT | 0.00 0.83 3.21 7.96 79.11 8.89 | 100.00 | PT BIS = 0.4760
|
| EBN007 MEAN SCORE | 0.00 12.50 15.13 14.62 25.02 16.41 | 23.01 |
|
================================================================================================================================
| | NOT RCH OMIT A B * C D | TOTAL |
|
| ITEM 8 N | 0 20 60 778 76 33 | 967 | R BIS = 0.6175 P+ = 0.8046 |
| PERCENT | 0.00 2.07 6.20 80.46 7.86 3.41 | 100.00 | PT BIS = 0.4300
|
| EBN008 MEAN SCORE | 0.00 13.35 17.12 24.75 16.39 13.64 | 23.01 |
|
================================================================================================================================
| | NOT RCH OMIT A B C D * | TOTAL |
|
| ITEM 9 N | 0 11 78 213 84 581 | 967 | R BIS = 0.6697 P+ = 0.6008 |
| PERCENT | 0.00 1.14 8.07 22.03 8.69 60.08 | 100.00 | PT BIS = 0.5280
|
| EBN009 MEAN SCORE | 0.00 21.00 17.23 18.02 16.75 26.55 | 23.01 |
|
================================================================================================================================
| | NOT RCH OMIT A B C * D | TOTAL |
|
| ITEM 10 N | 0 18 63 76 720 90 | 967 | R BIS = 0.6519 P+ = 0.7446 |
| PERCENT | 0.00 1.86 6.51 7.86 74.46 9.31 | 100.00 | PT BIS = 0.4804
|
| EBN010 MEAN SCORE | 0.00 17.33 14.84 14.97 25.32 18.10 | 23.01 |
|
================================================================================================================================

290
ELS2002 SPRING 2001 FIELD TEST ANALYSIS 14:06:30 6/10/01 PAGE 4
Math Form 2 F4STAT 4.47V
ITEM ANALYSIS
================================================================================================================================
| | NOT RCH OMIT A B * C D | TOTAL |
|
| ITEM 11 N | 0 11 52 761 112 31 | 967 | R BIS = 0.6766 P+ = 0.7870 |
| PERCENT | 0.00 1.14 5.38 78.70 11.58 3.21 | 100.00 | PT BIS = 0.4803
|
| EBN011 MEAN SCORE | 0.00 14.45 15.00 25.07 16.04 14.10 | 23.01 |
|
================================================================================================================================
| | NOT RCH OMIT A B C D * E | TOTAL |
|
| ITEM 12 N | 0 15 60 34 43 768 47 | 967 | R BIS = 0.6988 P+ = 0.7942 |
| PERCENT | 0.00 1.55 6.20 3.52 4.45 79.42 4.86 | 100.00 | PT BIS = 0.4923
|
| EBN012 MEAN SCORE | 0.00 15.73 15.83 13.56 12.47 25.07 17.23 | 23.01 |
|
================================================================================================================================
| | NOT RCH OMIT A B C * | TOTAL |
|
| ITEM 13 N | 0 5 159 268 535 | 967 | R BIS = 0.6655 P+ = 0.5533 |
| PERCENT | 0.00 0.52 16.44 27.71 55.33 | 100.00 | PT BIS = 0.5291
|
| EBN013 MEAN SCORE | 0.00 15.60 17.58 18.55 26.92 | 23.01 |
|
================================================================================================================================
| | NOT RCH OMIT A B C * D | TOTAL |
|
| ITEM 14 N | 0 14 89 118 687 59 | 967 | R BIS = 0.7652 P+ = 0.7104 |
| PERCENT | 0.00 1.45 9.20 12.20 71.04 6.10 | 100.00 | PT BIS = 0.5771
|
| EBN014 MEAN SCORE | 0.00 15.64 15.04 15.66 26.04 16.12 | 23.01 |
|
================================================================================================================================
| | NOT RCH OMIT A B * C D | TOTAL |
|
| ITEM 15 N | 1 5 114 654 130 63 | 967 | R BIS = 0.4699 P+ = 0.6763 |
| PERCENT | 0.10 0.52 11.79 67.63 13.44 6.51 | 100.00 | PT BIS = 0.3610
|
| EBN015 MEAN SCORE | 6.00 13.60 21.29 25.06 18.08 15.95 | 23.01 |
|
================================================================================================================================
| | NOT RCH OMIT A B C * D | TOTAL |
|
| ITEM 16 N | 1 10 50 42 801 63 | 967 | R BIS = 0.6008 P+ = 0.8283 |
| PERCENT | 0.10 1.03 5.17 4.34 82.83 6.51 | 100.00 | PT BIS = 0.4059
|
| EBN016 MEAN SCORE | 6.00 14.80 13.58 16.71 24.53 16.90 | 23.01 |
|
================================================================================================================================
| | NOT RCH OMIT A B * C D | TOTAL |
|
| ITEM 17 N | 1 8 92 764 70 32 | 967 | R BIS = 0.5369 P+ = 0.7901 |
| PERCENT | 0.10 0.83 9.51 79.01 7.24 3.31 | 100.00 | PT BIS = 0.3799
|
| EBN017 MEAN SCORE | 6.00 20.88 18.46 24.62 15.43 15.22 | 23.01 |
|
================================================================================================================================
| | NOT RCH OMIT A B * C D E | TOTAL |
|
| ITEM 18 N | 1 25 174 223 117 48 379 | 967 | R BIS = 0.6777 P+ = 0.2306 |
| PERCENT | 0.10 2.59 17.99 23.06 12.10 4.96 39.19 | 100.00 | PT BIS = 0.4892
|
| EBN018 MEAN SCORE | 6.00 16.64 23.68 30.37 21.20 23.60 19.31 | 23.01 |
|
================================================================================================================================
| | NOT RCH OMIT A B * C D E | TOTAL |
|
| ITEM 19 N | 2 34 40 558 100 63 170 | 967 | R BIS = 0.6123 P+ = 0.5770 |
| PERCENT | 0.21 3.52 4.14 57.70 10.34 6.51 17.58 | 100.00 | PT BIS = 0.4851
|
| EBN019 MEAN SCORE | 7.50 20.12 18.75 26.43 17.87 16.76 18.88 | 23.01 |
|
================================================================================================================================
| | NOT RCH OMIT A B C D * | TOTAL |
|
| ITEM 20 N | 2 33 79 146 86 621 | 967 | R BIS = 0.6056 P+ = 0.6422 |
| PERCENT | 0.21 3.41 8.17 15.10 8.89 64.22 | 100.00 | PT BIS = 0.4718
|
| EBN020 MEAN SCORE | 7.50 20.21 16.54 18.97 16.29 25.91 | 23.01 |
|
================================================================================================================================

291
ELS2002 SPRING 2001 FIELD TEST ANALYSIS 14:06:30 6/10/01 PAGE 5
Math Form 2 F4STAT 4.47V
ITEM ANALYSIS
================================================================================================================================
| | NOT RCH OMIT A B C * D E | TOTAL |
|
| ITEM 21 N | 2 49 187 111 403 149 66 | 967 | R BIS = 0.6390 P+ = 0.4168 |
| PERCENT | 0.21 5.07 19.34 11.48 41.68 15.41 6.83 | 100.00 | PT BIS = 0.5057
|
| EBN021 MEAN SCORE | 7.50 18.10 20.52 17.46 27.94 21.26 17.35 | 23.01 |
|
================================================================================================================================
| | NOT RCH OMIT A B * C D | TOTAL |
|
| ITEM 22 N | 2 16 191 493 56 209 | 967 | R BIS = 0.5454 P+ = 0.5098 |
| PERCENT | 0.21 1.65 19.75 50.98 5.79 21.61 | 100.00 | PT BIS = 0.4351
|
| EBN022 MEAN SCORE | 7.50 16.44 20.05 26.52 15.61 20.05 | 23.01 |
|
================================================================================================================================
| | NOT RCH OMIT A B C D * | TOTAL |
|
| ITEM 23 N | 2 6 285 190 98 386 | 967 | R BIS = 0.5163 P+ = 0.3992 |
| PERCENT | 0.21 0.62 29.47 19.65 10.13 39.92 | 100.00 | PT BIS = 0.4071
|
| EBN023 MEAN SCORE | 7.50 20.83 21.01 20.84 17.26 27.12 | 23.01 |
|
================================================================================================================================
| | NOT RCH OMIT A B C D E * | TOTAL |
|
| ITEM 24 N | 7 83 168 149 199 127 234 | 967 | R BIS = 0.6064 P+ = 0.2420 |
| PERCENT | 0.72 8.58 17.37 15.41 20.58 13.13 24.20 | 100.00 | PT BIS = 0.4421
|
| EBN024 MEAN SCORE | 10.14 20.84 19.77 20.37 21.24 23.40 29.45 | 23.01 |
|
================================================================================================================================
| | NOT RCH OMIT A B C * D | TOTAL |
|
| ITEM 25 N | 9 50 99 172 477 160 | 967 | R BIS = 0.4323 P+ = 0.4933 |
| PERCENT | 0.93 5.17 10.24 17.79 49.33 16.55 | 100.00 | PT BIS = 0.3449
|
| EBN025 MEAN SCORE | 11.22 23.20 19.36 18.78 25.89 21.82 | 23.01 |
|
================================================================================================================================
| | NOT RCH OMIT A B * C D E | TOTAL |
|
| ITEM 26 N | 13 130 80 198 226 223 97 | 967 | R BIS = 0.2889 P+ = 0.2048 |
| PERCENT | 1.34 13.44 8.27 20.48 23.37 23.06 10.03 | 100.00 | PT BIS = 0.2033
|
| EBN026 MEAN SCORE | 11.62 23.93 22.32 26.31 22.93 20.89 22.18 | 23.01 |
|
================================================================================================================================
| | NOT RCH OMIT A B C * D E | TOTAL |
|
| ITEM 27 N | 15 147 148 241 203 84 129 | 967 | R BIS = 0.3161 P+ = 0.2099 |
| PERCENT | 1.55 15.20 15.31 24.92 20.99 8.69 13.34 | 100.00 | PT BIS = 0.2237
|
| EBN027 MEAN SCORE | 11.93 22.98 23.30 21.72 26.58 22.57 21.05 | 23.01 |
|
================================================================================================================================
| | NOT RCH OMIT A * B C D E | TOTAL |
|
| ITEM 28 N | 20 127 501 136 102 20 17 | 967 | R BIS = 0.7526 P+ = 0.5181 |
| PERCENT | 2.07 13.13 51.81 14.06 10.55 2.07 1.76 | 100.00 | PT BIS = 0.6001
|
| EBN028A MEAN SCORE | 12.20 16.14 27.77 17.51 21.27 15.95 18.88 | 23.01 |
|
================================================================================================================================
| | F |
|
| | 44 |
|
| | 4.55 |
|
| | 19.25 |
|
================================================================================================================================

292
ELS2002 SPRING 2001 FIELD TEST ANALYSIS 14:06:30 6/10/01 PAGE 6
Math Form 2 F4STAT 4.47V
ITEM ANALYSIS
================================================================================================================================
| | NOT RCH OMIT A B C D E | TOTAL |
|
| ITEM 29 N | 20 137 29 100 42 367 95 | 967 | R BIS = 0.4977 P+ = 0.1830 |
| PERCENT | 2.07 14.17 3.00 10.34 4.34 37.95 9.82 | 100.00 | PT BIS = 0.3414
|
| EBN028B MEAN SCORE | 12.20 16.91 17.21 23.85 24.26 23.34 22.07 | 23.01 |
|
================================================================================================================================
| | F * |
|
| | 177 |
|
| | 18.30 |
|
| | 28.95 |
|
================================================================================================================================
| | NOT RCH OMIT A B * C D E | TOTAL |
|
| ITEM 30 N | 21 129 143 257 249 53 41 | 967 | R BIS = 0.7001 P+ = 0.2658 |
| PERCENT | 2.17 13.34 14.79 26.58 25.75 5.48 4.24 | 100.00 | PT BIS = 0.5198
|
| EBN028C MEAN SCORE | 12.62 16.20 19.76 30.12 23.27 20.38 22.46 | 23.01 |
|
================================================================================================================================
| | F |
|
| | 74 |
|
| | 7.65 |
|
| | 20.68 |
|
================================================================================================================================
| | NOT RCH OMIT A B * | TOTAL |
|
| ITEM 31 N | 25 104 335 503 | 967 | R BIS = 0.7125 P+ = 0.5202 |
| PERCENT | 2.59 10.75 34.64 52.02 | 100.00 | PT BIS = 0.5680
|
| EBN29A-F MEAN SCORE | 13.12 16.51 19.01 27.50 | 23.01 |
|
================================================================================================================================
| | NOT RCH OMIT A B * | TOTAL |
|
| ITEM 32 N | 33 89 577 268 | 967 | R BIS = 0.7002 P+ = 0.2771 |
| PERCENT | 3.41 9.20 59.67 27.71 | 100.00 | PT BIS = 0.5240
|
| EBN030 MEAN SCORE | 14.45 16.36 21.28 29.98 | 23.01 |
|
================================================================================================================================
| | NOT RCH OMIT A * B C D | TOTAL |
|
| ITEM 33 N | 37 19 452 186 227 46 | 967 | R BIS = 0.6361 P+ = 0.4674 |
| PERCENT | 3.83 1.96 46.74 19.23 23.47 4.76 | 100.00 | PT BIS = 0.5067
|
| EBN031 MEAN SCORE | 14.86 17.37 27.46 18.47 20.85 17.11 | 23.01 |
|
================================================================================================================================
| | NOT RCH OMIT A B * | TOTAL |
|
| ITEM 34 N | 42 80 321 524 | 967 | R BIS = 0.6972 P+ = 0.5419 |
| PERCENT | 4.34 8.27 33.20 54.19 | 100.00 | PT BIS = 0.5549
|
| EBN032 MEAN SCORE | 14.95 15.06 19.18 27.21 | 23.01 |
|
================================================================================================================================
| | NOT RCH OMIT A B C D * E | TOTAL |
|
| ITEM 35 N | 56 28 85 142 80 478 98 | 967 | R BIS = 0.7136 P+ = 0.4943 |
| PERCENT | 5.79 2.90 8.79 14.68 8.27 49.43 10.13 | 100.00 | PT BIS = 0.5694
|
| EBN033 MEAN SCORE | 15.66 18.39 20.36 18.99 16.94 27.75 18.46 | 23.01 |
|
================================================================================================================================
| | NOT RCH OMIT A B * | TOTAL |
|
| ITEM 36 N | 83 73 418 393 | 967 | R BIS = 0.5078 P+ = 0.4064 |
| PERCENT | 8.58 7.55 43.23 40.64 | 100.00 | PT BIS = 0.4011
|
| EBN034 MEAN SCORE | 17.05 16.53 21.57 27.00 | 23.01 |
|
================================================================================================================================

293
ELS2002 SPRING 2001 FIELD TEST ANALYSIS 14:06:30 6/10/01 PAGE 7
Math Form 2 F4STAT 4.47V
ITEM ANALYSIS
================================================================================================================================
| | NOT RCH OMIT A B C D * E | TOTAL |
|
| ITEM 37 N | 106 48 107 114 139 429 24 | 967 | R BIS = 0.4111 P+ = 0.4436 |
| PERCENT | 10.96 4.96 11.07 11.79 14.37 44.36 2.48 | 100.00 | PT BIS = 0.3267
|
| EBN035 MEAN SCORE | 18.08 18.90 22.52 21.95 21.53 26.02 14.92 | 23.01 |
|
================================================================================================================================
| | NOT RCH OMIT A B * | TOTAL |
|
| ITEM 38 N | 122 71 631 143 | 967 | R BIS = 0.5709 P+ = 0.1479 |
| PERCENT | 12.62 7.34 65.25 14.79 | 100.00 | PT BIS = 0.3717
|
| EBN036 MEAN SCORE | 18.13 20.83 22.53 30.36 | 23.01 |
|
================================================================================================================================
| | NOT RCH OMIT A B C D * | TOTAL |
|
| ITEM 39 N | 133 16 21 100 101 596 | 967 | R BIS = 0.4851 P+ = 0.6163 |
| PERCENT | 13.75 1.65 2.17 10.34 10.44 61.63 | 100.00 | PT BIS = 0.3810
|
| EBN037 MEAN SCORE | 18.71 17.44 19.29 17.18 21.48 25.48 | 23.01 |
|
================================================================================================================================
| | NOT RCH OMIT A B C D * E | TOTAL |
|
| ITEM 40 N | 165 45 36 62 171 459 29 | 967 | R BIS = 0.6286 P+ = 0.4747 |
| PERCENT | 17.06 4.65 3.72 6.41 17.68 47.47 3.00 | 100.00 | PT BIS = 0.5010
|
| EBN038 MEAN SCORE | 19.52 22.62 16.33 18.08 18.96 27.35 17.41 | 23.01 |
|
================================================================================================================================
| | NOT RCH OMIT A B C * D E | TOTAL |
|
| ITEM 41 N | 184 33 164 100 212 67 207 | 967 | R BIS = 0.3159 P+ = 0.2192 |
| PERCENT | 19.03 3.41 16.96 10.34 21.92 6.93 21.41 | 100.00 | PT BIS = 0.2256
|
| EBN039 MEAN SCORE | 19.74 21.33 24.60 19.49 26.51 21.60 23.47 | 23.01 |
|
================================================================================================================================
| | NOT RCH OMIT A B * C D E | TOTAL |
|
| ITEM 42 N | 208 11 116 391 67 133 41 | 967 | R BIS = 0.4466 P+ = 0.4043 |
| PERCENT | 21.51 1.14 12.00 40.43 6.93 13.75 4.24 | 100.00 | PT BIS = 0.3526
|
| EBN040 MEAN SCORE | 20.16 17.18 19.54 26.53 18.04 24.29 19.15 | 23.01 |
|
================================================================================================================================
| | NOT RCH OMIT A B * C D E | TOTAL |
|
| ITEM 43 N | 288 0 169 169 141 146 54 | 967 | R BIS = 0.2640 P+ = 0.1748 |
| PERCENT | 29.78 0.00 17.48 17.48 14.58 15.10 5.58 | 100.00 | PT BIS = 0.1791
|
| EBN041 MEAN SCORE | 22.16 0.00 24.09 26.21 20.70 22.11 22.56 | 23.01 |
|
================================================================================================================================

294
ELS2002 SPRING 2001 FIELD TEST ANALYSIS 14:06:30 6/10/01 PAGE 8
Math Form 2 F4STAT 4.47V
TEST ANALYSIS
NUMBER OF ITEMS ANALYSED = 43
SUM OF RIGHTS = 22248.0000
SUM OF RIGHTS SQUARED = 13525366.0000
SUM OF WRONGS = 15984.0000
SUM OF WRONGS SQUARED = 7151924.0000
SUM OF RIGHTS X WRONGS = 6788056.0000
ALPHA RELIABILITY = 0.8949
STD. ERROR OF MEASUREMENT = 2.6704
SQUARED STD. ERR. OF MEAS. = 7.1309
- FORMULA SC0RE STATISTICS
NUMBER OF CASES PROCESSED = 967.0
MINIMUM SCORE = 2.0000
MAXIMUM SCORE = 42.0000
SUM OF SCORES = 22248.0000
SUM OF SQUARED SCORES = 577478.0000
MEAN SCORE = 23.0072
STANDARD DEVIATION (N) = 8.2372
STANDARD DEVIATION (N-1) = 8.2415
FORMULA SCORE = RIGHTS ONLY. `

295
Appendix E Summary of First Technical Review Panel Meeting

Appendix E—Summary of First Technical Review Panel Meeting
296

297
Education Longitudinal Study:2002
(ELS:2002)
First Technical Review Panel Meeting June 27-28, 2000
Meeting Summary
Submitted by: Research Triangle Institute
PO Box 12194 Research Triangle Park, NC 27709

Appendix E—Summary of First Technical Review Panel Meeting
298
Appendix E—Summary of First Technical Review Panel Meeting
299
EDUCATION LONGITUDINAL STUDY:2002 (ELS:2002)
First Technical Review Panel Meeting June 27-28, 2000
Hotel Washington, Washington, D.C.
ATTENDING
Kathy Chandler, Marco Clark (Heather Gossart), Denise Davis, Richard Duran, Jeremy Finn, Bill Fowler, Kelly Hall, Robin Henke, Steven Ingels, Thomas Kane, Phil Kaufman, Sally Kilgore, Richard Lawrence, Samuel Lucas, Edith McArthur, Marilyn McMillen, Jeffrey Owings, Aaron Pallas, Judith Pollack, Daniel Pratt, John Riccobono, Donald Rock, Andy Rogers, Leslie Scott, Peter Siegel, Ellen Stutts
A complete list of the ELS:2002 Technical Review Panel and Staff is provided as attachment A.
WELCOME AND INTRODUCTIONS
Dr. Owings and Mr. Pratt welcomed the Technical Review Panel (TRP) members to the first ELS:2002 TRP meeting. Panel members introduced themselves. Following the introductions, Mr. Pratt informed the members in attendance that work on data element design and test development was done prior to RTI being awarded the contract so that the tight project schedule would not be adversely affected. In addition, he urged panelists to think about the burden placed on participants in the study when determining the importance of data elements. Finally, he reviewed the agenda for the meeting, which is included as attachment B.
Dr. Owings then presented a brief history and overview of NCES (National Center for Education Statistics) sponsored longitudinal studies including: NLS-72, HS&B, NELS:88, BPS, B&B, ECLS-K, ECLS-B and ELS:2002. He identified the following as the primary goals of ELS:2002: collection of longitudinal data about critical transitions experienced by tenth grade students; integration of data collected from sample students (including dropouts), parents, teachers, and school administrators; linkage to NLS-72, HS&B and NELS:88; and linkage to NAEP and PISA.
Dr. Owings reiterated the importance of determining the single best source of data in order to reduce the burden of participation. He also urged panelists to keep in mind the following factors throughout the questionnaire design process: identification of predictor and outcome variables, cross sectional goals, longitudinal goals, OMB clearance process, field test procedures and instruments, and full scale data collection. In conclusion, he expressed his excitement for the project and the significance of having the hindsight of previous longitudinal studies.
SAMPLE DESIGN
Mr. Siegel then presented the sample design for the base year full-scale sample. He noted that the survey population will consist of tenth grade students enrolled in regular public schools, catholic schools and other private schools within the fifty states and the District of Columbia. The Common Core of Data (CCD) will be used as the public school sampling frame and the Private School Survey (PSS) as the private school sampling frame. Six hundred public schools, one hundred Catholic schools and one hundred other private schools will be selected. The initially proposed design includes a reserve of sample schools that will also be selected at the same time to serve as replacements for schools that are either ineligible or refuse to participate. Mr. Siegel specified that approximately twenty-five students per school will be selected in order to allow for a total estimated sample size of 21,074. He continued the presentation by mentioning the stratification processes for both the schools and the students.

Appendix E—Summary of First Technical Review Panel Meeting
300
Dr. Finn expressed concern about not sampling enough African American students. Similarly, Mr. Rogers asked about the process for sampling Hispanics. Mr. Siegel explained that the students will be stratified by race/ethnicity to ensure proper representation; given the numbers of blacks in the student population, sufficient numbers will be obtained in the sample to meet the study’s precision requirements.
Dr. McMillen mentioned the usefulness of using the census regions for both public and private schools. In addition, she noted the importance of stratifying the other private schools implicitly. Dr. McMillen and Dr. Scott also raised the issue of school sample design and whether oversampling schools might be considered as an alternative to the school replacement approach.
Dr. McArthur questioned how dropouts will be distinguished from transfers when alphabetized enrollment lists arrive at RTI. Mr. Siegel noted that identification of dropouts will be important in the first follow-up in 2004. Mr. Siegel explained that in the base year schools will be asked to provide a second enrollment list prior to survey day. This sample update will help identify students who have transferred into the school after the receipt of the original list (as well as those who have transferred out since initial sampling). Transfer students will be selected only if they are not on the first list, but are included on the second list immediately after a sample student. If a sample student is not on the second list, then that student is no longer at the school and is not included in the sample.
Mr. Siegel completed his presentation concerning the base year full-scale sample after mentioning that mathematics and English teachers of ELS students and one parent per ELS student will also be sampled. The handouts pertaining to the sample design are included in the summary as attachment C.
Following the full-scale presentation, Mr. Siegel briefly presented the sample design criteria for the field test sample. Although the field test sample will be similar to the full-scale sample the survey population will only consist of students enrolled in schools in New York, California, Florida, Illinois or North Carolina. Ten schools from each state stratified by state, sector and metropolitan status, will participate in the study. There will be a total of fifty schools participating in the field test.
DATA COLLECTION PLANS
Ms. Stutts then presented an overview of the ELS data collection procedures, including school recruitment, data collection of the four instruments, preparation for survey day and informed consent. (The meeting handout is provided as attachment D.) She highlighted the importance of seeking endorsements from national educational organizations as well as approval at both the state and district level. Ms. Stutts elaborated on the procedures for administering the four instruments (student, parent, teacher, and administrator) and the cognitive tests. She noted that each school would be assigned a survey administrator (SA) and a survey administrator assistant (SAA). They will be responsible for administering the student questionnaire, cognitive tests and picking up the teacher and administrator surveys. The SA and SAA will determine if a make up day is required to administer the surveys and tests to missing students.
Mr. Rogers cautioned that we need to be aware of the limited amount of space at some schools. His comment elicited a discussion led by Dr. Finn, Dr. Kilgore and Dr. Scott about not only the space considerations, but also the conditions of the school. Ms. Stutts noted that many issues will be handled on a school by school basis. This will include being cognizant of the space availability, condition of the facilities, the days of the week and the time of year at which the tests are given. She also emphasized the importance of training the SAs and SAAs properly.
Dr. Duran suggested that endorsing agencies personally contact schools that are difficult to get on board. Dr. Scott and Mr. Rogers agreed with Dr. Duran and also mentioned the possibility of using parent groups and other influential groups within the community to stimulate excitement and support for the study. Dr. Lucas cautioned against recruiting influential groups within the community. He is fearful that it may create a bias and compromise the validity of the results.

Appendix E—Summary of First Technical Review Panel Meeting
301
In conclusion, Ms. Stutts introduced the field test schedule. She noted that RTI will begin recruiting districts in the summer and continue institution contacting through the early fall. The surveys and cognitive tests will be administered in mid-February through late April. The project schedule as presented by Mr. Pratt is provided as attachment E.
SPECIAL POPULATIONS
Next, Mr. Pratt presented an overview of the schedule, which is included in the summary as attachment E and led a discussion about the procedures for dealing with special populations. He detailed how special populations were dealt with in NELS:88. In NELS:88, 5.3 percent of the base year sample was excluded due to their inability to complete the cognitive test battery, because of language or disability barriers. In ELS:2002, students who cannot complete the survey instruments will remain in the sample. In the base year, contextual data will be collected from their parents, teachers and principals. In the first follow-up, their eligibility status will be re-evaluated. Even if they still cannot directly participate, school administrator data and academic transcripts will be gathered for them. If they can participate in the first follow-up, they will also complete the appropriate student instruments. Foreign exchange students will not be included in the sample. A contextual data weight will be used in addition to the student questionnaire respondent weight. Mr. Pratt underscored the importance of collecting key information as part of initial sampling, such as race/ethnicity and whether or not an Individualized Education Plan (IEP) is on file for the student. He reiterated that there will be oversampling of Asians and Hispanics.
Several panelists expressed concern about what provisions would be made for students with IEP’s that put restrictions on their testing, e.g., required various kinds of accommodations. In general, the study is not in a position to provide special accommodations. However, Dr. Rock and Ms. Pollack from the Educational Testing Service, agreed that allowing students with cognitive disabilities to have extra time on the cognitive tests would not negatively impact the validity of their responses. Also, they stressed the importance of training the SAs and SAAs on how to deal with such cases and noting in the data file that extra time was provided. In addition, guidelines will be supplied to the school and SA/SAA prior to survey day to be certain that students are not excluded unnecessarily.
Dr. Kilgore raised concern about the cognitive tests only being administered in English. She suggested that RTI make itself aware of any state laws that require assessment tests to be conducted in both English and Spanish.
ELS:2002 QUESTIONNAIRE DATA ELEMENTS AND TEST CONTENT
To supply historical context and decision criteria for the meeting, Dr. Ingels offered remarks on principles guiding the instrument development process. The data element drafts presented to the TRP were begun prior to contract award. One guiding assumption was the desirability of a high degree of overlap with the prior NCES longitudinal studies, so that ELS can extend the trend line on cross-cohort comparisons. Prior steps were to review questionnaires from the predecessor longitudinal studies (especially HS&B and NELS:88, which also had sophomore questionnaires), to review the NELS:88 bibliography to identify which research questions had been addressed and which items had been successfully used to address them, and to examine methodological work that examined the quality of NELS questionnaire items (such as McLaughlin & Cohen’s NELS:88 Survey Item Evaluation Report).
Dr. Ingels indicated that an important consideration was the target length of each ELS:2002 instrument. Target length for main study instruments will be 30-45 minutes for the teacher questionnaire (depending on how many students are to be rated, which will vary by teacher) and 30 minutes for the school questionnaire. (These prescribed lengths are similar to the NELS:88 base year in 1988, but significantly shorter than the instruments for NELS sophomores in 1990.) Target length for the parent questionnaire will be 30 minutes. Target length for the student questionnaire is 45 minutes (though 60 minutes will be allotted in the survey session, to allow for various factors, particularly the likelihood of some students starting late). In the field test, slightly longer (by up to 10%) questionnaires are permissible, so that more items can be tested and alternative measures evaluated. Dr. Ingels indicated that with the exception of the teacher, which still needs cutting, the data element drafts were about the appropriate length for the field test. New items, then, could be added, but would have to replace items currently on

Appendix E—Summary of First Technical Review Panel Meeting
302
the draft that are deemed marginal or low priority. Dr. Ingels asked the panelists both to help evaluate the proposed items, and identify any gaps where new or additional measures might be required.
Dr. Ingels reviewed key questionnaire design precepts that should be used in evaluating which items will have most utility for the ELS instruments. First, ELS will be a general purpose data set, designed to be of maximum usefulness for investigating a broad range of educational phenomena with important policy implications.
Second, measuring change in the student cohort is the central, though not the sole objective of the design. This is an important principle for setting priorities in item selection and considering the kinds of issues that, as a longitudinal study, ELS can best address, but cannot be addressed by other (cross-sectional) surveys.
Third, a further focus is to extend the trend line for time series comparisons with two earlier sophomore cohorts (HS&B in 1980, NELS:88 in 1990), as well as seniors (in 2004) to NLS-72 (1972), HS&B (1980 and 1982) and NELS:88 (1992) seniors. An implication of this focus is high content overlap with earlier rounds, and conservatism in revision of past items, so that comparability can be maintained. At the same time, past items that were unsuccessful or are obsolete or no longer useful must be dropped or revised, and new items must be included to address emerging policy concerns, the changed circumstances of schools and schooling, and to reflect recent advances in research paradigms.
Fourth, though of lower priority, cross-sectional results are also of importance. It should be noted that in the base year, ELS will provide generalizability both at the student and school level, with representative samples of sophomores and of American high schools teaching sophomores. Cross-sectional student generalizability (and a new panel for future longitudinal analysis) will be secured again in the first follow-up (2004), through sample freshening that will make for a representative sample of high school seniors.
Fifth, it should be noted that for most purposes the student is the basic unit of analysis in ELS; other respondent populations (teachers, parents, principals) supply contextual data for understanding student outcomes. The student-linked teacher sample will support no generalizations about the nation’s teachers or about ELS schools, and this fact has important implications for the content of the teacher questionnaire. (However, ELS may, through the School Crime and Safety supplement, have an independent sample of teachers from which national generalizations about teachers’ perceptions of school crime, safety and climate might be made.) The major challenge for designing the ELS teacher instrument is to identify measures important to predicting and explaining later student outcomes. The teacher survey will take place only in the baseline and there will be no information provided about the teachers or instructional practices to which the sample has been exposed to in the three subsequent terms prior to the re-administration (2004) of the cognitive test battery (though the transcript study will supply full information about course taking).
STUDENT QUESTIONNAIRE
The student questionnaire is divided into seven content areas: school experiences and activities, plans for the future, non-English language use, money and work, family, and opinions about self. In addition, the questionnaire asks students to provide locating information.
There was extensive discussion concerning a number of content areas and many suggestions were offered about revisions that can be made to the items or the degree of usefulness of specific data elements. The discussion included recommendations for the reference period of the awards and recognition item, review of crime and safety items, the utility of various questions concerned with last absence from school, the recasting of items about high school program type, and the question series on student employment. The Panel also suggested various ways to update the household item list (used in the construction of the socioeconomic status variable when family income data is not available from the parent). One new area, suggested by the National Collegiate Athletic Association, involves questions about student gambling on sporting events.
It was, also, felt necessary to substantially update coverage about computer use, beyond what had been offered in earlier studies such as NELS:88. A number of new computer resource and use items were added to the data element drafts, both on the student and school administrator questionnaires. There was much discussion of the aspects of

Appendix E—Summary of First Technical Review Panel Meeting
303
computer use most closely related to later student achievement and other outcomes, and the best sources of these items. Given the importance of this area, it was agreed that further design work might be pursued after the TRP.
One area identified as in need of improvement by some HS&B and NELS:88 researchers were the rating scales and psychological variables. Dr. Scott proposed field testing several new scales pertaining to student motivation, self-concept, self-efficacy and learning strategies. Dr. Scott’s new scales are primarily taken from the PISA Cross-Cutting Competencies questionnaire. Psychometric properties of the proposed scales are well documented from the PISA field test, and given that ELS and PISA test scores are to be equated, this further link may be of special interest. A question was raised concerning how much of the final main study questionnaire can include psychological variables given the intense competition for space. However, there was a strong overall consensus that the scales proposed by Dr. Scott should be field-tested and evaluated for their potential contribution to the main study, even if not all can be included in the final instrument. The suggested psychological variables have been included as attachment F.
COGNITIVE TEST DESIGN
Next, Dr. Rock presented information about the cognitive test design (hand-outs included as attachment G). Dr. Rock emphasized that the long-term goals of the cognitive assessments in ELS are to accurately measure status and change in reading and mathematics at 10th grade and at 12th grade and between 10th and 12th grade. Additionally, to link ELS sophomore results to the international PISA age cohort (age 15) through common item equating. Further linkages can be forged to past longitudinal studies (NELS:88, HS&B), to NAEP, and in reading only, to ALLS (Adult Literacy and Lifeskills Survey, formerly ILSS). Dr. Rock presented test specifications for the mathematics and reading battery item pools, showing content areas (e.g. arithmetic, algebra, geometry, etc.; literacy, science, social studies reading) and processes (e.g., skill/knowledge, understanding/comprehension, problem solving; reproduction of detail, comprehension of thought, inference or evaluate judgement) to be measured.
Dr. Rock also explained the general two-stage adaptive design of the ELS:2002 test battery, in which a routing test will determine the student’s ability level, and send the student to the appropriate second-stage form, depending on whether the student’s ability is high, middle level, or low in the specific subject. The two-stage design will secure more efficient measurement in less time, and help to minimize floor and ceiling effects. Also, more testing time will be allowed in each subject--in NELS:88 four subjects were tested, in ELS:2002, only two subjects. The field test, however, will not use a two-stage test-- rather, the object will be to test a large pool of items. The assessment design for the field test will therefore be spiraled, and employ two non-overlapping forms and to be administered to samples of both sophomores and seniors.
Dr. Rock stressed that the instruments will be designed for change measurement, with linking items to facilitate vertical scaling. He will use a curriculum-based model of growth of knowledge, and identify multiple criterion-referenced points that anchor scales so that one can determine where (at what skill or proficiency level) change on the vertical scale is occurring.
Score reporting is expected similar to that in NELS:88 with both normative and proficiency scores, including (after the first follow-up) continuous probabilities of proficiency to measure gain. In the field test, however, analysis will concentrate on the following steps. First, estimating traditional item-level statistics; second, estimating Item Response Theory (IRT) parameters. Items will be selected for the routing test using the following four criteria. (1) Items will be selected that show good IRT parameters and fits to their IRT traces across and within grades. (2) Items must be consistent with test specifications (content, process, and difficulty). In addition, (3) items will show gain between 10th and 12th grade and (4) provide linking items to NELS:88, NAEP and PISA. Items will be selected for the second stage forms by carrying out simulations to establish cutting scores to meet target distributions.
PARENT QUESTIONNAIRE
Following the Cognitive Test Design, Dr. Ingels presented the Parent Questionnaire. The parent questionnaire is divided into sections on family background, the student’s school life, family life, parent opinions about their child’s school, expectations and plans for the student, financial information and educational costs. In addition, the questionnaire also includes information for follow-up and later locating.

Appendix E—Summary of First Technical Review Panel Meeting
304
It was stressed that the parent questionnaire would be translated into Spanish, and that bilingual interviewers or other bilinguals would be utilized so that parents from other language groups could participate as well. Some highlights of the detailed discussion of data elements are as follows.
Dr. Finn advocated for additional parental monitoring items. He noted that the importance of parental monitoring to academic performance warranted expanded coverage of this area, and suggested items asking about homework, report cards, curfew enforcement, eating dinner as a family, and cell phone or beeper contact with children.
Dr. Pallas recommended expanding the coverage of social capital issues. A handout, provided as attachment H, outlines proposed questions within this expanded approach.
Dr. Kane and others agreed that it would be useful to add the recommended assets questions to the information gathered on income, since assets and income do not necessarily correlate highly. He suggested that the FAFSA form be used as a model for some of the financial information and educational cost questions.
The panel also reviewed and made suggestions regarding, among others, proposed items on family structure, language and immigration, occupation and work, and parental interactions with the school.
TEACHER QUESTIONNAIRE
Dr. Ingels introduced the teacher survey by raising a design issue. He explained that in NELS:88, both for 1988 eighth graders and 1990 sophomores, the spring teacher had been asked to rate the student sample members. A spring rating was sought so that the teacher reports on students and the information about classroom content coverage and instructional practices would coincide in time with the test scores. However, in 1992, for the senior year survey, preference was given to enlisting the fall teacher in the survey. The rationale for this (apart from the general feeling that students are somewhat disengaged in the spring term of senior year) was that high school teachers are typically exposed to many students, and given a survey that begins in late January, if a student has a new teacher in the spring term, that teacher may have had too little exposure to the student to be a reliable rater. Dr. Ingels made the recommendation that for ELS, the participation of the fall teacher should be solicited, as was done in the NELS:88 second follow-up; the panel concurred. (Of course, in cases where there is no fall teacher or the fall teacher has left, but there is a spring teacher in the subject, the spring teacher would be substituted.)
Dr. Henke presented the Teacher Questionnaire to the TRP and highlighted that it will only be administered once in ELS, to base year teachers of English and mathematics who instruct an ELS sample member. One topic for panel discussion was the possibility that the teacher questionnaire might provide some kind of information generalizable to teachers in the school or to teachers in the two departments, as opposed to being limited to providing contextual data on the student. If through the Crime and Safety supplement, a comparatively small number of teachers could be added to the study in the two subjects in order to achieve a departmental census, this design would underwrite school-level department-based generalizations about, for example, school climate. If the instructional practices items were administered to this census of teachers, assuming students in later rounds were asked to identify which teachers had taught them between spring 2002 and spring 2004, the longitudinal value as well as the generalizability of the teacher data would be enhanced. However, Ms. Chandler indicated that current thinking suggested that a departmental design would not be employed for the crime and safety supplement, but rather, a random sample of teachers, with some degree of potential overlap with the linked teachers. Under these circumstances, the task of item selection for the ELS teacher questionnaire should be guided by the need to obtain baseline information from the teacher useful in student-level analyses of later outcomes.
In the Student Information section, the TRP identified some items that might better be asked of parents, and made suggestions for revising the wording of other data elements. In the Class Information section, the question was raised of whether there should be further technology questions. A final resolution to this issue has been assigned to a subcommittee of the Panel that will convene in a few weeks’ time. In terms of the Teacher Background and Activities section, minor emendations were suggested for some items. For the section on School Organization and Climate, it was cautioned that the linked design teachers will not be representative of teachers in the school, or even of teachers in the two departments, English and Mathematics. Items on substance abuse and cheating were

Appendix E—Summary of First Technical Review Panel Meeting
305
recommended. Ms. Chandler distributed for discussion some further draft data elements that extend coverage of crime and safety issues. The documents are included as attachment I.
SCHOOL ADMINISTRATOR QUESTIONNAIRE
Dr. Ingels presented the proposed data items for the school administrator questionnaire. He noted that principals can delegate the first four sections of the school administrator questionnaire to a member of their staff. These four sections require factual answers about school characteristics, student characteristics, teaching staff characteristics and school practices and programs. The fifth and final section, which covers school governance and climate, contains questions about the principal’s goals, attitudes, and ratings of aspects of the school. This section must be completed only by the principal.
In the extensive discussion of school administrator questionnaire data elements, a number of questions were identified for deletion, while others were expanded. It was concluded that while many of the vocational education items could be dropped, others might be added to cover changes in the area since NELS. Further review of the vocational education coverage will take place following the TRP meeting. There were also some items identified concerning the transition from high school that, while important, could better be asked in 2004, when the school administrator questionnaire will be repeated and sample members will be seniors. Ms. Chandler distributed for discussion some further draft data elements that extend coverage of crime and safety issues, which are included in Attachment J.
Throughout the discussion of the four questionnaires, Dr. Owings, Mr. Pratt and Dr. Ingels emphasized that while the schedule for OMB submission makes development time very short, the continued input of the TRP is very much desired. Panelists were encouraged to contact RTI and NCES staff with their further suggestions for areas that need to be addressed, items that are not useful or items that should be revised.
SUPPLEMENTAL COMPONENTS
FACILITIES
Dr. Fowler of NCES addressed two issues: the desirability of a student resource measure derived from a teacher's salary and benefits; an observer's assessment of the school's facilities, safety and security. There are currently plans to modify the ELS:2002 contract to provide for such a facilities checklist.
Dr. Fowler stressed three points related to the teacher salary/benefit information collection:
1. the usefulness of past longitudinal studies has been limited by the absence of a student-level fiscal resource measure;
2. district and/or school level fiscal data may mask individual differences that exist across schools and classrooms;
3. we know relatively little about how funds are used at the individual student, classroom and school levels.
Dr. Fowler noted that another NCES longitudinal survey, the Early Childhood Longitudinal Survey-Kindergarten Cohort (ECLS-K), devised survey instruments to address these issues and provide data that can be used to address equity, resource intent, and adequacy considerations. District business offices or private school administrators responded to a mailed salary and benefits questionnaire. Salary and benefit information was requested for all principals and each of the teachers sampled. Unweighted response rates were in the high 80s. Total compensation (base salary + merit pay + employee benefits) for a student's teacher and average compensation (total compensation/class size) could be computed for individual students included in the sample.

Appendix E—Summary of First Technical Review Panel Meeting
306
In addition, ECLS-K took advantage of observers in the schools (who typically visited 5 schools) to observe and rate the facilities and safety and security of the school. Response rates were in the low 90s. The ECLS-K facilities checklist is included as attachment K. A revised checklist will be used by the SA or SAA on survey day to record the condition of the facilities at the school should the facilities component be approved for funding.
LIBRARIES
Ms. Davis briefly presented information about a media center survey. If the survey is funded it will be incorporated into ELS as a 6 page questionnaire. The school’s media specialist will provide information about student access to and use of the library/media center, and also about its use in supporting the school’s curriculum through assistance to teachers in the planning and delivery of instruction. However, regardless of whether the media center survey is funded she cited the importance of determining the availability and uses of media centers and technology in schools today.

Appendix E—Summary of First Technical Review Panel Meeting
307
Attachment A ELS:2002 Technical Review Panel and Staff Contact List
Revised 8/2000
Dr. Clifford Adelman U.S. Department of Education Office of Educational Research and Improvement Capitol Place (Rm. 617A) 555 New Jersey Avenue, NW Washington, DC 20208 T: (202)219-2251 F: (202)501-3005 E: [email protected]
Ms. Kathy Chandler U.S. Department of Education National Center for Education Statistics 1990 K Street NW, Room 9042 Washington, DC 20006 T: (202)502-7326 F: (202)502-7455 E: [email protected]
Ms. Denise M. Davis National Commission on Libraries and Information Science 1110 Vermont Avenue NW Suite 820 Washington, DC 20005 T: (202)606-9200 F: (202)606-9203 E: [email protected]
*Dr. Richard Duran University of California at Santa Barbara Graduate School of Education 2206 Phelps Hall Santa Barbara, CA 93106 T: (805)893-3555 F: (805)893-7264 E: [email protected]
*Dr. Jeremy Finn State University of New York at Buffalo Graduate School of Education 409 Baldy Hall Buffalo, NY 14260 T: (W) (716)645-2482 T: (H) (716)636-5795
F: (716)645-6616 E: [email protected]
Dr. Bill Fowler U.S. Department of Education National Center for Education Statistics 1990 K Street NW Washington, DC 20006 T: (202)502-7338 F: E: [email protected]
Dr. Patrick Gonzalez U.S. Department of Education National Center for Education Statistics 1990 K Street NW Washington, DC 20006 T: (202)502-7346 F: E: [email protected]
*Ms. Heather A. Gossart Bishop McNamara High School 6800 Marlboro Pike Forestville, MD 20747 T: (301)735-8401 F: (301)735-0934 E: [email protected]
Ms. Kelly Hall Research Triangle Institute PO Box 12194 RTP, NC 27709 T: (919)541-7034 F: (919)541-7014 E: [email protected]
Dr. Robin Henke MPR Associates 2150 Shattuck Avenue Suite 800 Berkeley, CA 94704 T: (510)849-4942 F: (510)849-0794 E: [email protected]
Dr. Lisa Hudson U.S. Department of Education National Center for Education Statistics 1990 K Street, NW Room 9024 Washington, DC 20006 T: (202)502-7358 F: E: [email protected]

Appendix E—Summary of First Technical Review Panel Meeting
308
Dr. Steven J. Ingels Research Triangle Institute 1615 M Street NW Room 722 Washington, DC 20036 T: (202)728-1962 F: (202)728-2095 E: [email protected]
*Dr. Thomas Kane Harvard University Kennedy School of Government 79 John F. Kennedy Street Cambridge, MA 02138 T: (617)496-1072 F: (617)495-2179 E: [email protected]
Dr. Phil Kaufman MPR Associates 2150 Shattuck Avenue Suite 800 Berkeley, CA 94704 T: (510)849-4942 F: (510)849-0794 E: [email protected]
*Dr. Sally Kilgore Modern Red School House 208 23rd Avenue Nashville, TN 37221 T: (615)320-8804 F: E: [email protected]
*Dr. Richard Lawrence St. Cloud State University 245 Stewart Hall 720 Fourth Avenue South St. Cloud, MN 56301 T: (W) (320)255-3974 T: (H) (218)829-7346 F: (320)255-3974 E: [email protected]
*Dr. Samuel R. Lucas University of California-Berkeley 410 Barrows Hall #1980 Berkeley, CA 94720 T: (510)642-9564 F: (510)643-8292 E: [email protected]
Dr. Andrew G. Malizio U.S. Department of Education National Center for Education Statistics 1990 K Street, NW Room 8005 Washington, DC 20006
T: (202)502-7387 F: (202)502-7450
Dr. Edith McArthur U.S. Department of Education National Center for Education Statistics 1990 K Street, NW Room 9081 Washington, DC 20006 T: (202)502-7393 F: E: [email protected]
Dr. Marilyn McMillen U.S. Department of Education National Center for Education Statistics 1990 K Street, NW Room 9051 Washington, DC 20006 T: (202)502-7303 F: E: [email protected]
Dr. Jeffrey Owings U.S. Department of Education National Center for Education Statistics 1990 K Street, NW Room 9105 Washington, DC 20006 T: (202)502-7423 F: (202)502-7475 E: [email protected]
*Dr. Aaron Pallas Michigan State University College of Education 437 Erickson Hall East Lansing, MI 48824 T: (517)355-6682 F: (517)353-6393 E: [email protected]

Appendix E—Summary of First Technical Review Panel Meeting
309
Dr. Samuel Peng U.S. Department of Education National Center for Education Statistics 1990 K Street, NW Room 9112 Washington, DC 20006 T: (202)502-7427 F: E: [email protected]
Ms. Judith M. Pollack Educational Testing Service Rosedale Road Mailstop 18-T Princeton, NJ 08541 T: (609)734-1507 F: E: [email protected]
Mr. Daniel J. Pratt Research Triangle Institute P.O Box 12194 RTP, NC 27709 T: (919)541-6615 F: (919)541-6178 E: [email protected]
Dr. John A. Riccobono Research Triangle Institute P.O Box 12194 RTP, NC 27709 T: (919)541-7006 F: (919)541-7014 E: [email protected]
Dr. Donald A. Rock Educational Testing Service Rosedale Road Mailstop 17-E Princeton, NJ 08541 T: (W) (609)734-5655 T: (H) (609)896-2659 F: E: (W) [email protected] E: (H) [email protected]
*Mr. Andy Rogers Los Angeles Unified School District 450 N. Grand Avenue Rm. G300 Los Angeles, CA 90012 T: (213)633-1622 F: (213)626-4638 E: [email protected]
*Dr. Barbara Schneider National Opinion Research Center 1155 E. 60th Street Chicago, IL 60637 T: (773)256-6361 F: (773)256-6313 E: [email protected]
Dr. Leslie A. Scott Education Statistics Services Institute 1000 Thomas Jefferson Street, NW Washington, D.C. 20007
T: (202)295-6866 F:
Mr. Peter H. Siegel Research Triangle Institute PO Box 12194 RTP, NC 27709
T: (919)541-6348 F: (919)541-6416 E: [email protected]
Ms. Ellen Stutts Research Triangle Institute PO Box 12194 RTP, NC 27709 T: (919)541-6037 F: (919)541-7198 E: [email protected]
*Technical Review Panel Members (Non-Federal)

Appendix E—Summary of First Technical Review Panel Meeting
310
Attachment B AGENDA
First Meeting of the Education Longitudinal Study:2002 Technical Review Panel Hotel Washington, Washington, DC
Tuesday, June 27, 2000
TIME TOPIC PRESENTER
Welcome, Introductions, and Study Overview
9:00 - 9:30 Continental breakfast
9:30 - 9:45 Welcome from NCES; TRP introductions; Objectives and format of meeting
Jeff Owings
Dan Pratt
9:45 - 10:45 Brief history and objectives of ELS:2002
Sample design (schools, teachers, students)
Data collection plans (recruitment, preparation for survey day, informed consent, survey day operations, non-response follow-up)
Special populations; ELS:2002 schedule
Jeff Owings
Peter Siegel
Ellen Stutts
Dan Pratt
10:45 - 11:00 BREAK ELS:2002 Instrument- and Cognitive Test- Development
11:00 - 12:30 Student Survey (overview; length and format constraints; analytic aims; balance of new and trend items; content areas and constructs to be measured; review of data elements)
Steven Ingels
12:30 - 1:30 LUNCH
1:30 – 3:00 Cognitive Test Design Don Rock
Judy Pollack
3:00 - 3:15 BREAK
3:15 - 4:45 Parent Survey (overview; length and format constraints; analytic aims; content areas and constructs to be measured; review of data elements)
Steven Ingels
4:45 - 5:15 Summary of day 1 and plans for day 2; Administrative issues
Dan Pratt
Kelly Hall

Appendix E—Summary of First Technical Review Panel Meeting
311
Attachment B--continued
Wednesday, June 28, 2000
TIME TOPIC PRESENTER
ELS:2002 Instrument Development – continued
8:30 - 9:00 Continental Breakfast
9:00 - 9:15 New/Unsettled Issues from Day 1 Dan Pratt
9:15 - 10:45 Teacher Survey (overview; length and format constraints; analytic aims; content areas and constructs to be measured; review of data elements)
Steven Ingels
Phil Kaufman
10:45 - 11:00 BREAK
11:00 - 12:30 School Administrator Survey (overview; length and format constraints; analytic aims; content areas and constructs to be measured; review of data elements)
Steven Ingels
12:30 - 1:30 LUNCH
1:30 - 2:30 Supplemental Components
Libraries
Facilities
Crime and violence
Denise Davis
Bill Fowler
Kathy Chandler
2:30 - 3:00 Summary of meeting; Plans for second TRP meeting
Dan Pratt

Appendix E—Summary of First Technical Review Panel Meeting
312
Attachment C SUMMARY OF ELS:2002 SAMPLE DESIGN
Base year full-scale sample
We will use the Common Core of Data (CCD) as the public school sampling frame and the Private School Survey (PSS) as the private school sampling frame.
The survey population will consist of 10th grade students enrolled in school in the United States (50 states and District of Columbia) in regular public schools, including State Department of Education schools, and in Catholic and other private schools.
We will select a stratified probability-proportionate-to-size (PPS) sample of schools in such a way to achieve targeted sample sizes of Hispanic, Asian, and other students.
We will stratify the public schools by an eight-level NCES regional variable and metropolitan status. We will stratify private schools by Catholic and other private, a four-level Census regional variable, and metropolitan status.
We will select 600 public schools, 100 Catholic schools, and 100 other private schools. We will also select a reserve sample of schools to use as replacements when a sample school is ineligible or does not respond.
We will select approximately 25 10th graders per school. The total student sample size will be 21,074 to allow for enough Asian public school sample students to meet precision requirements
We will stratify the students by Hispanic, Asian, and other race/ethnicity.
We will not exclude any students from the sampling frame because of disabilities or language problems (as was done in NELS:88).
We will ask each sample school to provide an electronic or hard-copy listing of all their 10th grade students currently enrolled.
We will perform quality assurance checks on all lists that we receive to confirm that the lists contain all eligible students and the information we need for sampling. We will follow up with schools whose lists fail the checks.
From each list, we will select a stratified systematic sample of students. We will sample students on a flow basis as we receive student lists.

Appendix E—Summary of First Technical Review Panel Meeting
313
For identifying students who have transferred into the school after we receive the enrollment list but before survey day, we will request an updated list of 10th graders. We will select transfer students into sample if they are not on the first list but are listed immediately after a sample student on the second list. If a sample student is not on the second list, then that student is no longer at the school and no longer in the sample.
We will sample mathematics and English teachers of ELS sample students, so teachers will be in sample only if they teach students who were sampled for ELS. The teacher sample size will be approximately 532.
For each sample student, there will be one sample parent.
Base year field test sample
The field test sample will be as similar to the full-scale sample as possible since the purpose of the field test is to test the procedures that we will use in the full-scale study.
The survey population will consist of 10th and 12th grade students enrolled in school in New York, California, Florida, Illinois, or North Carolina in regular public schools, including State Department of Education schools, and in Catholic and other private schools.
We will select a simple random sample of schools twice as large as necessary, so that we can purposively select a subset of the schools to be sample schools.
We will stratify the schools by state, sector (public, Catholic, and other private schools), and metropolitan status.
The sample size will be 40 public schools, 5 Catholic schools, and 5 other private schools.We will select a reserve sample of schools to use as replacements when a sample school is ineligible or does not respond.
We will select approximately 25 10th graders and 20 12th graders per school. We will also select a reserve sample of 12th graders to use as replacements when a sample 12th grade student does not complete the test. This will guarantee 1000 completed 12th grade cognitive tests which is necessary for designing the cognitive test better by providing sufficient statistical power for Item Response Theory analysis.
We will select student, teacher, and parent samples similarly to the full-scale procedures.

Appendix E—Summary of First Technical Review Panel Meeting
314
First follow-up sample
The basis for the sampling frames for the field test and full-scale first follow-up will be the sample of schools and students in the base year field test and full-scale samples, respectively.
We will follow a subsample of base year sample students who have transferred to a different school between the 10th and 12th grades.
We will include all base year sample students who have dropped out of school between the 10th and 12th grades.
We will freshen the sample to include a sample of students at each base year sample school who are enrolled in 12th grade at the time of the follow-up but were not in 10th
grade in the United States during the base year.

Appendix E—Summary of First Technical Review Panel Meeting
315
Attachment D
Brief Overview of ELS:2002 Data Collection Procedures
School Recruitment
RTI will seek endorsements from national educational organizations
RTI will mail information packets and then follow up with telephone call
States are recruited first - will be provided with the names of districts involved in study
After state approval, districts will be recruited - will be provided with the names of the schools sampled
After district approval, schools will be recruited
For Catholic schools, diocese approval will be sought if appropriate.
For private schools in general, RTI will start at the school level. If there is a higher governing body, we will get approval or endorsement at that level.
Data Collection Instruments and Procedures
1. Student survey: questionnaire and cognitive tests
administered in group setting by trained survey administrator
Survey administrator (SA) will determine who is missing from test on survey day
Survey makeup day scheduled with school coordinator
Field test 2001 - sophomore questionnaire, test forms A and B are randomly assigned; senior test forms A and B randomly assigned
Main study 2002 - Sophomore questionnaire, routing test determines the difficulty level of the math and reading items the student will receive
Field test 2003 - Senior/dropout questionnaires, cognitive test
Main study 2004 - Senior/dropout questionnaire, cognitive test (may be 2 stage or level may depend on base year score)

Appendix E—Summary of First Technical Review Panel Meeting
316
2. School Administrator questionnaire
mailed to school in advance of survey day
self-administered
SA will collect while at school. If school administrator is not finished, SA will collect during survey make up day.
Telephone/mail/e-mail/field follow up for nonresponders
3. Teacher questionnaire
administered to math and English teachers of selected students
mailed to school in advance of survey day
self-administered
SA will collect while at school. If teacher is not finished, SA will collect during survey make up day.
Telephone/mail/e-mail/field follow up for nonresponders
4. Parent questionnaire If school will provide addresses, will be mailed to parents; otherwise, sent home with students self-administered parents will mail back to RTI Telephone/e-mail/field follow up for nonresponders
Preparation for Survey Day
1. Recruit school
identify contact at school to act as coordinator
determine if active or passive parental permission is required
2. Request class list from school
3. Select students for study
4. Identify math and English teachers linked to those students
5. Within 1 month of survey day, request class list from school again to identify any students who have transferred in or out of the school
6. Mail school coordinator permission slips for parents; mail all surveys except student survey

Appendix E—Summary of First Technical Review Panel Meeting
317
7. If active permission is required from parents, recontact school to make sure permission slips are being received
Informed Consent Required of all participants
Student participation requires parental consent as well as consent from the student
Survey Day Operations
1. Survey administrator (SA) and survey administrator assistant (SAA) check in with school coordinator
2. SA and SAA set up room for administration of student survey
3. SA checks for parental permission
4. Students called to designated survey room
5. SA reads informed consent and instructions to students
6. SA and SAA administer student survey (for main study, score the routing test and determine follow up items in math and reading)
7. SA and SAA collect all student surveys, pick up teacher and school administrator surveys, determine if make up day is required for missing students
Appendix E—Summary of First Technical Review Panel Meeting
318

Appendix E—Summary of First Technical Review Panel Meeting
319
Attachment E
ELS:2002 Schedule Overview
Base Year Field Test
• School Sampling - 7/2000• Recruitment - 8/2000-12/2000• List Receipt & Student Sampling - 10/2000 - 2/2001 • Ship Questionnaires - 1/2001 - 3/2001 • Survey/Make-up Day - 2/2001 - 4/2001 • Non-response follow-up - 3/2001 - 6/2001
Base Year Full-Scale Study
• School Sampling - 3/2001• Recruitment - 3/2001 -11/2001• List Receipt & Student Sampling - 8/2001 - 11/2001 • Ship Questionnaires - 1/2002 - 3/2002 • Survey/Make-up Day - 1/2002 - 4/2002 • Non-response follow-up - 2/2002 - 7/2002
Base Year Products
• Restricted-use and public-use ECBs • User Manual with Codebooks (integrated) • Descriptive Summary Report • All products adjudicated and available around the middle of 2003
First Follow-up Study
• First follow-up field test and full-scale data collection are part of current contract
• Schedule for the first follow-up is similar to base year: 2 years following the base year
• High school transcript data collection anticipated in late 2004 • Final adjudicated products available in 2005 (after planned end date for
current contract)

Appendix E—Summary of First Technical Review Panel Meeting
320

Appendix E—Summary of First Technical Review Panel Meeting
321
Attachment F
Psychological Variablesfor ELS:2002 Student Questionnaire
Recommended replicating PISA Self-regulated Learning scales (field tested in spring of 1999)
Self-regulated learning operationalized as 3 global dimension and 7 sub-dimensions:
(A) learning strategies (1) learning strategies
(B) motivation (2) motivational preferences (3) goal orientation (4) action control (5) learning preferences (6) implicit theories of learning
(C) self-concept (7) self-regulated cognition
Measured on PISA with 51 items and 14 scales
Administration time = 10 minutes
Theoretical significance
Various theories – one American (Pintrich & DeGroot, 1990) theory is that different levels of Motivation result in different uses of learning strategies, and hence differences in academic achievement
Self-regulated learning is a mediator or a dependent variable
Criteria for Selecting Scales
Dimension should contain more than 1 scale to prevent a lack of balance
Overlap between scales should be avoided
The measured construct should be teachable
The measured construct should be amenable to influence through policy intervention
Analysis Measurement Methods
Cronbachs’ alpha
Factor analysis and subgroup comparison (LISREL)
Confirmatory/exploratory scaling within nonparametric IRT (Using MSP); and,
where relevant and possible, logistic IRT modeling (using ConQuest/OPLM)

Appendix E—Summary of First Technical Review Panel Meeting
322
Scale Items
Scales:
(1) How often do these things apply to you? Almost never, sometimes, often, almost always
(2) How much do you disagree or agree with each of the following?
Disagree, disagree somewhat, agree somewhat, agree
A1: Memorising A1Q1A01 - When I study, I try to memorise everything that might be covered. A1Q1H08 - When I study, I memorise as much as possible. A1Q1N14 - When I study, I memorise all new material so that I can recite it. A1Q1T20 - When I study, I practice by saying the material to myself over and over.
A2-1 Elaboration A2Q1D04 - When I study, I try to relate new material to things I have learned in other subjects. A2Q1K11 - When I study, I figure out how the information might be useful in the real world. A2Q1Q17 - When I study, I try to understand the material better by relating it to things I already
know.A2Q1W23 - When I study, I figure out how the material fits in with what I have learned.
A3: Control strategies A3Q1AA27 -When I study, I start by figuring out what, exactly, I need to learn. A3Q1B02 - When I study, I force myself to check to see if I remember what I have learned. A3Q1I09 - When I study, I try to figure out, as I read, which concepts I still haven't really understood.A3Q1P16 - When I study, I make sure that I remember the most important things. A3Q1V22 - When I study, and I don't understand something, I look for additional information To clarify the point.
B2: Instrumental motivation B2Q1C03 - I study to increase my job opportunities. B2Q1J10 - I study to ensure that my future will be financially secure. B2Q1R18 - I study to get a good job.

Appendix E—Summary of First Technical Review Panel Meeting
323
B7: Interest (subject related) MathB7Q2B29 - I do math in my spare time. B7Q2E32 - When I do math, I sometimes get totally absorbed. B7Q2G34 - Math is important to me personally. B7Q2J37 - Because doing math is fun, I wouldn't want to give it up. Verbal
B7Q2A28 - Reading is important to me personally. B7Q2D31 - Because reading is fun, I wouldn't want to give it up. B7Q2F33 - I read in my spare time. B7Q2I36 - When I read, I sometimes get totally absorbed.
C2: Ego orientation C2Q3D04 - I feel most successful if I can demonstrate that I'm smart. C2Q3I09 - I feel most successful if I get better grades than the others. C2Q3O15 - I feel most successful if I'm the only one who knows the right answer. C2Q3U21 - I feel most successful if I know more than the others.
D2-2: Control expectation (alternative) D2Q4I31 - When I sit myself down to learn something really hard, I can learn it. D2Q4J32 - If I decide not to get any bad grades, I can really do it. D2Q4K33 - If I decide not to get any problems wrong, I can really do it. D2Q4L34 - If I want to learn something well, I can.
D2-3: Self-efficacy (alternative) D2Q4N36 - I'm certain I can understand the most difficult material presented in readings D2Q4P38 - I'm confident I can understand the most complex material presented by the teacher. D2Q4Q39 - I'm confident I can do an excellent job on assignments and tests. D2Q4S41 - I'm certain I can master the skills being taught..
D3: Self-concept verbal D3Q3A01 - I'm hopeless in English classes (R). D3Q3J10 - I learn things quickly in English classes. D3Q3R18 - I get good marks in English.
D4: Self-concept math D4Q3F06 - I get good marks in mathematics. D4Q3K11 - Mathematics is one of my best subjects. D4Q3P16 - I have always done well in mathematics.

Appendix E—Summary of First Technical Review Panel Meeting
324
D5: Self-concept academic D5Q3E05 - I learn things quickly in most school subjects. D5Q3N14 - I do well in tests in most school subjects. D5Q3V22 - I'm good at most school subjects.
E1: Effort and Persistence in learning: general E1Q5C03 - When studying, I work as hard as possible. E1Q5E05 - When studying, I keep working even if the material is difficult. E1Q5G07 - When studying, I try to do my best to acquire the knowledge and skills taught. E1Q5I09 - When studying, I put forth my best effort.
F1: Cooperative learning F1Q6A11 - Working in a group now helps me work with other people later. F1Q6D14 - I do not like working with other people (R). F1Q6G17 - Working in a group scares me (R). F1Q6J20 - We get the work done faster if we all work together.
F2: Competitive learning F2Q6C13 - I like to try to be better than other students. F2Q6F16 - Trying to be better than others makes me work well. F2Q6H18 - I would like to be the best at something. F2Q6K21 - I learn faster if I'm trying to do better than the others.

325
Tab
le 1
.--R
esul
ts o
f PIS
A F
ield
Tes
t of S
elf-
Reg
ulat
ed L
earn
ing/
Cro
ss-C
urri
cula
r C
ompe
tenc
ies S
cale
s D
imen
sion/
C
onst
ruct
Sub-
dim
ensio
n Sp
ecifi
c Sc
ale
# of
ite
ms
PISA
*
reco
mm
enda
tion
Com
men
ts
A
1 M
emor
izat
ion
.6
3-.8
3 4
NS-
yes
Kep
t for
face
val
idity
A
2-1
Ela
bora
tion
.7
1-.8
1 4
G-y
esC
ogni
tive
Stra
tegi
es
A2-
2 Tr
ansf
orm
atio
n .7
1-.8
1 4
G-n
o Si
mila
r to
elab
orat
ion
A.
Lea
rnin
g St
rate
gies
(Zim
mer
man
& S
chun
k)
Con
trol
St
rate
gies
A
3 Pl
anni
ng/m
onito
ring
/ R
egul
atio
n
.62-
.81
5G
-yes
B2
Inst
rum
enta
l mot
ivat
ion
(util
ity in
tere
st)
.77-
.86
3G
-yes
Mak
e su
bjec
t spe
cific
B3
Com
petit
ive
mot
ivat
ion
.77-
.85
3 M
-no
Sim
ilar t
o co
mpe
titiv
e le
arni
ng (F
2)
B4
Inte
rest
-bas
ed m
otiv
atio
n (g
ener
al)
.59-
.81
4 N
S-no
O
verla
ps w
ith su
bjec
t sp
ecifi
c sc
ales
.7
1-.9
0 3
B. M
otiv
atio
nal P
refe
renc
es
(Int
eres
t)
(Bau
mer
t; D
eci &
Rya
n;
Ecc
les)
B7
Intr
insi
c in
tere
st m
ath
In
trin
sic
inte
rest
ver
bal
.78-
.90
3E
-yes
x 2
Sh
ow se
x di
ffer
ence
s
C.
Goa
l Ori
enta
tion
C
1 Ta
sk o
rient
atio
n (le
arni
ng g
oal)
.62-
.78
N
S-no
(Dw
eck;
Mar
sh &
Kol
ler)
C2
Ego
ori
enta
tion
(per
form
ance
goa
l)75
-.85
4G
-yes
Show
sex
diff
eren
ces;
kee
p ev
en th
ough
not
bal
ance
d
5
.
D1
Age
ncy
belie
f—ef
fort
.70-
.84
4 G
-no
Sim
ilar t
o ag
ency
bel
ief—
abili
ty (D
2-1)
D
2-1
Age
ncy
belie
f—ab
ility
.5
8-.8
4 3
M-n
o Si
mila
r to
cont
rol
expe
ctat
ions
(D2-
2)
D2-
2 C
ontr
ol e
xpec
tatio
n .6
9-.8
4 4
VG
-yes
M
ake
subj
ect s
peci
fic
Self-
effic
acy
(Ban
dura
; D
eci &
R
yan)
D
2-3
Self-
effic
acy
.7
8+4-
8 V
G-y
es
Mak
e su
bjec
t spe
cific
D
3 Se
lf-co
ncep
t—ve
rbal
.7
5-.8
4 3
E-y
es
Show
s sex
diff
eren
ces
D4
Self-
conc
ept—
mat
h
.84+
3E
-yes
Sh
ows s
ex d
iffer
ence
s D
5 Se
lf-co
ncep
t—ac
adem
ic
.76-
.84
3V
G-y
es
D.
Self-
regu
late
d co
gniti
on
Self-
conc
ept
(Mar
sh)
D6
Self-
conc
ept—
gene
ral
Bel
ow .7
0 4
NS-
no

326
Dim
ensio
n/
Con
stru
ctSu
b-di
men
sion
Spec
ific
Scal
e #
of
item
sPI
SA*
reco
mm
enda
tion
Com
men
ts
E1
Eff
ort &
per
sist
ence
ge
nera
l .7
6-.8
7 4
E-y
es
Show
sex
diff
eren
ce
.59-
.87
3
E. A
ctio
n C
ontr
ol
(O’N
eil &
Her
l; Pe
scha
r)
E2 E
ffor
t & p
ersi
sten
ce m
ath
E
ffor
t & p
ersi
sten
ce v
erba
l .5
9-.7
7 3
NS-
no
F1 C
oope
rativ
e le
arni
ng
Bel
ow .6
5 4
NS-
no
App
ly fo
r ba
lanc
e w
ith F
2 F.
Lea
rnin
g Pr
efer
ence
s
(Ow
ens &
Bar
nes)
F2 C
ompe
titiv
e le
arni
ng
.74-
.81
4G
--ye
sSi
mila
r to
com
petit
ive
mot
ivat
ion;
show
s sex
di
ffer
ence
s G
. Im
plic
it Le
arni
ng
Theo
ries
(Dw
eck
& L
egge
t)
St
abili
ty o
f lea
ning
B
elow
.60
3 N
S-no
Su
bstit
ute
lear
ning
bel
iefs
(s
ee b
elow
)
Impo
rtanc
e of
Eff
ort f
or
perf
orm
ance
.6
1-.7
4 4
NS-
no
Subs
titut
e le
arni
ng b
elie
fs
Impo
rtanc
e of
abi
lity
for
perf
orm
ance
.6
0-.7
4 4
NS-
no
Subs
titut
e le
arni
ng b
elie
fs
NEW
-Im
plic
it le
arni
ng
belie
fs
(a
) D
o yo
u ag
ree
or d
isag
ree
with
the
follo
win
g st
atem
ents
: (b
) ab
ility
in m
ath
can
be le
arne
d (a
ltern
ativ
e--o
r peo
ple
can
lear
n to
be
very
goo
d in
mat
h)
(c)
abili
ty in
Eng
lish
(rea
ding
/writ
ing)
can
be
lear
ned
(alte
rnat
ive-
-or p
eopl
e ca
n le
arn
to b
e ve
ry g
ood
in
Engl
ish)
(d
) yo
u ha
ve to
be
born
with
the
abili
ty to
be
very
goo
d in
mat
h yo
u ha
ve to
be
born
with
the
abili
ty to
be
very
go
od in
Eng
lish
(rea
ding
/writ
ing)
Sc
ales
mis
sing
abo
ve –
2-it
em sa
les o
nly;
no
FT d
ata
pres
ente
d B
1 co
mpl
ianc
e—ge
nera
l B
5 co
mpl
ianc
e—su
bjec
t rel
ated
B
6 in
stru
men
tal m
otiv
atio
n—su
bjec
t rel
ated
* NS
= N
ot S
trong
, sca
le d
oes n
ot m
eet m
inim
um c
riter
ia in
all
coun
tries
M
= M
oder
ate,
a g
ood
scal
e ca
n be
dev
elop
ed
G =
Goo
d, a
lmos
t all
crite
ria m
et in
all
but 1
cou
ntry
V
G =
Ver
y G
ood,
all
crite
ria m
et e
xcep
t 1 c
riter
ion
in 1
cou
ntry
, or a
ll cr
iteria
met
in a
ll co
untri
es sa
tisfa
ctor
ily
E =
Exce
llent
, all
crite
ria m
et h
ighl
y in
all
coun
tries
.

Appendix E—Summary of First Technical Review Panel Meeting
327
Attachment G
The Development of the ELS:2002 Cognitive Battery Donald A Rock & Judy Pollack
The long term goals of the cognitive assessment of ELS:2002 are:
1) Accurate Measurement of Status and Change between the:
a. 10th and 12th grades in Reading and Mathematics
b. NELS88 Sophomores and Seniors and ELS Sophomores and Seniors.
2) Link ELS 10th grade sample to the PISA 15-year-old sample in Mathematics and Reading.
Accomplishing the above goals requires that a pool of items be assembled from the following sources- a subset of the Reading and Mathematics items used in NELS:88 and similar subsets from the PISA and the NAEP item pools. This combined pool of items will then be field tested on a sample of 10th and 12th graders. The primary objective of the field test will be to identify both NELS:88 items and PISA items that demonstrate relatively invariant item parameters. That is, select that subset of the field test items whose original item parameters seem to provide a good fit to the field test data. These selected items will provide the “linking items” that can be used to put the ELS:2002 scores on the NELS:88 scale and also provide a cross-walk to the PISA scale. Successfully putting the ELS:2002 scores on the NELS:88 score scale will enable one to measure and compare gains across the two longitudinal cohorts using the same “ruler”. Similarly common item linking with PISA will allow International comparisons in Mathematics and Reading between 15 year/Sophomores from ELS:2002 and 15 year olds from a number of foreign countries. A second goal of the field test is to test the operational feasibility of a variation of the two-stage adaptive testing procedure that was used in NELS:88. NCES has been a pioneer in the use of two-stage adaptive tests beginning with NELS:88 and more recently in their Early Childhood Longitudinal Study (ECLS). The use of adaptive tests (i.e. tailoring item difficulty to the examinees’ ability level) increases measurement precision and more importantly for longitudinal studies minimizes floor and ceiling effects, the bane of all gain score measurement.

328
Gen
eral
Tw
o St
age
Adap
tive
Des
ign
25 %
50 %
25 %
Hi L
evel M
iddl
e L
evel Lo
wLe
vel
Rou
ting
Test
Se
cond
stag
e(3
form
s)

Appendix E—Summary of First Technical Review Panel Meeting
329
Figure 1 shows the basic model for two-stage testing as was used in NELS:88 and as will be used in ELS with some variation.
Typically two-stage adaptive testing administers a broad band routing test and depending on how well one does on the routing test, he/she is routed to one of three second stage tests each of which varies in their level of difficulty. Individuals who do poorly on the routing test get the easier second stage test. Those who do very well on the routing test are assigned to the most difficult second stage test while the remainder receive the middle level second stage form. NELS:88 did not use a concurrent routing test i.e., given a routing test immediately before assigning the second stage test. The examinee was assigned one of three forms varying in difficulty depending on how he/she did in their previous testing.
In ELS we propose to give a concurrent broadband routing test and depending on his/her score on the routing test assign a second stage form. This requires scoring the routing test on site and then assign the second stage test. A small sub-sample of the field test participants will be given a pre-constructed two stage test and the operational process will be carried out to insure that there will be no snags in the full scale operation. The on site scoring of the routing test must be objective and easily and quickly done. This puts certain constraints on the types of items that would be appropriate for the routing test.For example, extended free response items would not be appropriate for the routing test since it must be scored quickly and accurately on site.
Construction of Field Test Item Pool
The more immediate or short term goals were to develop the field test pool of items and a spiralled field test design that would provide sufficient observations on each item and yet keep the testing time under an hour. More specifically it was proposed that two field test forms be developed and spiraled among a thousand sophomores and a thousand seniors.
Operationally the two field test forms will each consist of both Reading Comprehension and Mathematics items. These two forms will be designed for the ELS:2001 field test. It was proposed that there be a total of 90 non-lapping items in both field test forms. Form A will have 40 reading and 50 mathematics items as will form B. In order to accomplish this the following tasks have either been completed or are presently underway:
(1) Review the NELS:88 final item parameters for the 81 item pool in mathematics and the 54 item pool in Reading comprehension. This review focused on those items in NELS:88 that were good candidates for linking items. Completed
(2) Review the NELS:88 content/process specifications in both Reading and Mathematics and identify those content or process cells where there may be a shortage of items with good item parameters. Completed.
(3) Review the distributions of the NELS:88 senior cohort for near perfect scores separately for mathematics and reading. This may also entail re-running the test
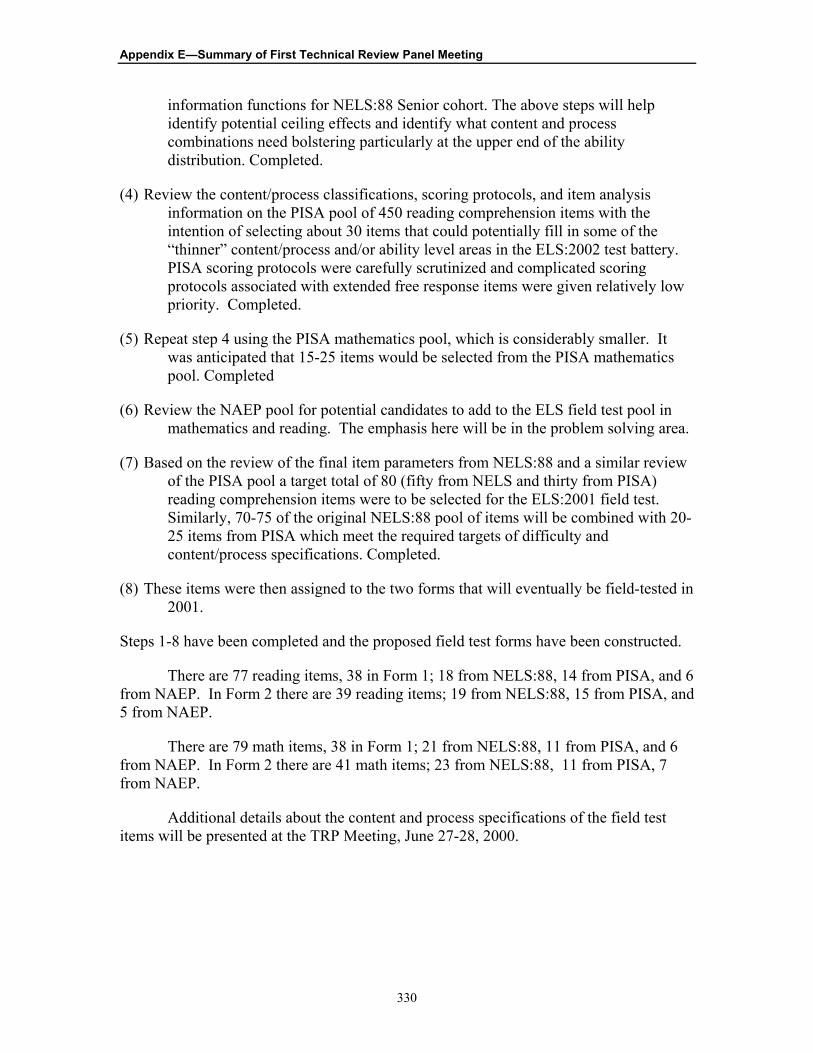
Appendix E—Summary of First Technical Review Panel Meeting
330
information functions for NELS:88 Senior cohort. The above steps will help identify potential ceiling effects and identify what content and process combinations need bolstering particularly at the upper end of the ability distribution. Completed.
(4) Review the content/process classifications, scoring protocols, and item analysis information on the PISA pool of 450 reading comprehension items with the intention of selecting about 30 items that could potentially fill in some of the “thinner” content/process and/or ability level areas in the ELS:2002 test battery.PISA scoring protocols were carefully scrutinized and complicated scoring protocols associated with extended free response items were given relatively low priority. Completed.
(5) Repeat step 4 using the PISA mathematics pool, which is considerably smaller. It was anticipated that 15-25 items would be selected from the PISA mathematics pool. Completed
(6) Review the NAEP pool for potential candidates to add to the ELS field test pool in mathematics and reading. The emphasis here will be in the problem solving area.
(7) Based on the review of the final item parameters from NELS:88 and a similar review of the PISA pool a target total of 80 (fifty from NELS and thirty from PISA) reading comprehension items were to be selected for the ELS:2001 field test.Similarly, 70-75 of the original NELS:88 pool of items will be combined with 20-25 items from PISA which meet the required targets of difficulty and content/process specifications. Completed.
(8) These items were then assigned to the two forms that will eventually be field-tested in 2001.
Steps 1-8 have been completed and the proposed field test forms have been constructed.
There are 77 reading items, 38 in Form 1; 18 from NELS:88, 14 from PISA, and 6 from NAEP. In Form 2 there are 39 reading items; 19 from NELS:88, 15 from PISA, and 5 from NAEP.
There are 79 math items, 38 in Form 1; 21 from NELS:88, 11 from PISA, and 6 from NAEP. In Form 2 there are 41 math items; 23 from NELS:88, 11 from PISA, 7 from NAEP.
Additional details about the content and process specifications of the field test items will be presented at the TRP Meeting, June 27-28, 2000.

Appendix E—Summary of First Technical Review Panel Meeting
331
Guiding Principles in Developing Measures and Models for Measuring Change in NELS:88 and ELS
Theoretical approach to developing measurement models and their application to quantifying change or growth in both NELS:88 and ELS.
The successful measurement of cognitive growth or change requires: (1) a theoretical model of the cognitive growth process, (2) a measurement model that can capture and quantify the stages in the growth process, and (3) a statistical model that can quantify not only the extent of gain or growth but can pinpoint where on the growth curve an individual is making his or her maximum gains. The application of the above three principles suggests that optimally one might have to hypothesize a separate growth curve or function for every individual under study. Often one can approximate the ideal, i.e., every individual having his or her own growth curve, by a simpler model which pre-supposes one general growth curve with individuals located at different points on that curve. We have found this simpler model to provide quite good fits to much of the longitudinal data we have worked with, such as High School and Beyond, National Educational Longitudinal Study of 1988 (NELS:88) and the Early Childhood Longitudinal Study. This simpler model has a greater probability of fitting data where one can assume a common curriculum and similar academic goals. Fortunately, this is more often then not present in a society with required school attendance at least through high school.
Modeling change as described above requires one to insure that the developmental theory and the associated stages are reflected in the measurement instrument. The stages can reflect the different depths of knowledge in a particular content area, an academic sequencing, and/or reflect a hierarchy of problem solving skills within a particular content area. The measurement model referred to in (2) above must have the ability to place tasks (i.e., items in the measuring instrument) that mark critical stages in the growth process on a latent ability scale. One can then think of critical score points along the latent ability scale as reflecting dividing lines between stages on the growth curve. The Item Response Theory (IRT) model is particularly appropriate for such situations. Using the IRT model, one can then locate where on the growth curve any given student is making his or her greatest changes. That is, Jane is showing her maximum gains in higher level problem solving and/or applications (located on the upper end of the growth curve) while Jim is showing the same absolute amount of gain (i.e., equivalent in terms of score points gained) but his gain is at the lower end of the curve that is marked by knowledge of fundamental factual information. The typical application that uses the gain in score points without reference to where on the curve they take place is ignoring the most important information which discriminates between Jane and Jim.

332
TE
STSP
EC
IFIC
AT
ION
S FO
R T
HE
EL
SM
AT
HE
MA
TIC
SFI
EL
DT
EST
A
RIT
HM
ET
IC
AL
GE
BR
A
GE
OM
ET
RY
D
AT
A/P
RO
B
AD
VT
OPI
C
TO
TA
L
%
SKIL
L/K
NO
W
NN
NN
NN
N
NN
NN
N
N
PP
PP
P P
9
8A
A
4
122
28
UN
D/C
OM
P N
NN
NN
N
NN
NN
N
NN
N
N
N
PP
P
PP
PPP
P
A
A
AA
A
7
97
43
3038
PR
OB
SOL
V
NN
N
NN
NN
N
NN
NN
N
N
N
PP
PPP
P P
A
A
AA
A
34
134
327
34
TO
TA
L
1921
248
879
%
24
2730
1010
*N
, P, &
A =
PE
R IT
EM C
OU
NT
S N
= N
EL
S IT
EM
P
= PI
SA IT
EM
A
= N
AE
P IT
EM
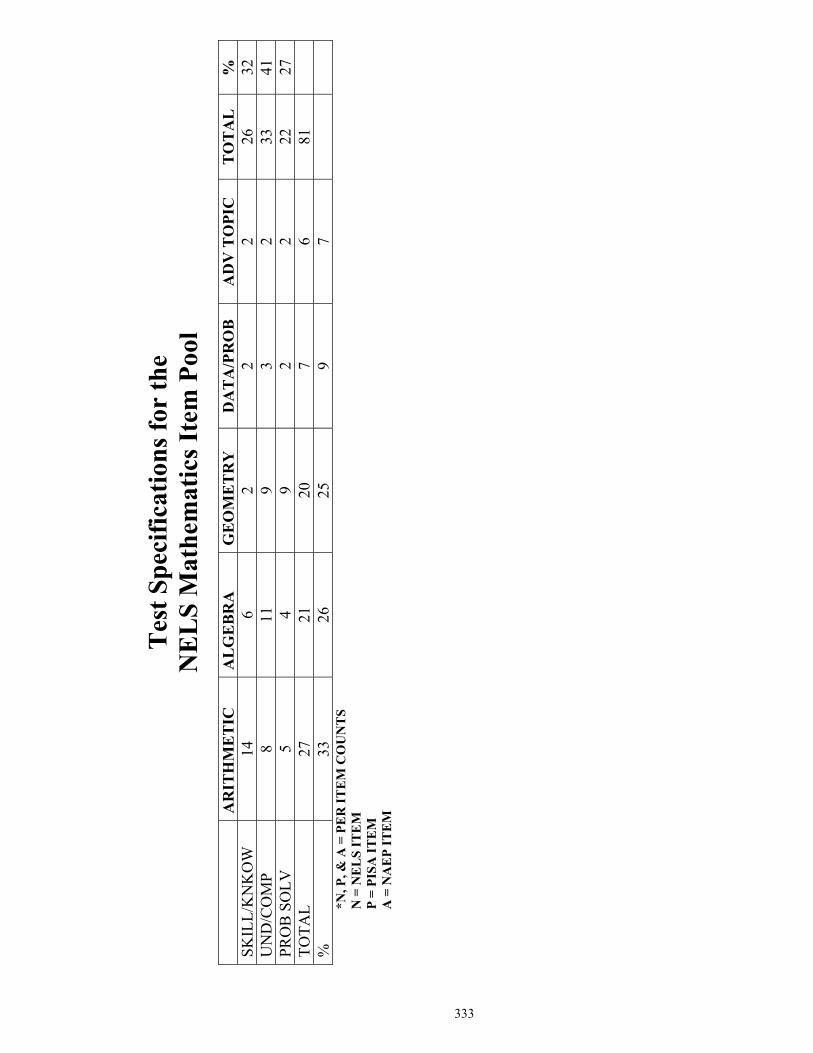
333
Tes
t Spe
cific
atio
ns fo
r th
eN
EL
S M
athe
mat
ics I
tem
Poo
l
AR
ITH
ME
TIC
A
LG
EB
RA
G
EO
ME
TR
Y
DA
TA
/PR
OB
A
DV
TO
PIC
T
OT
AL
%
SK
ILL/
KN
KO
W
14
6 2
2 2
26
32
UN
D/C
OM
P 8
11
9 3
2 33
41
PR
OB
SO
LV
5 4
9 2
2 22
27
TO
TAL
27
21
20
7 6
81
%
33
26
25
9
7
*N
, P, &
A =
PE
R IT
EM C
OU
NT
S N
= N
EL
S IT
EM
P
= PI
SA IT
EM
A
= N
AE
P IT
EM

334
TE
STSP
EC
IFIC
AT
ION
S FO
R T
HE
E
LS
RE
AD
ING
FIE
LD
TE
STIT
EM
POO
L
C
ON
TE
NT
L
ITE
RA
CY
SC
IEN
CE
SO
CIA
L
STU
DIE
S/O
TH
ER
TO
TA
L
%
RE
PRO
DU
CT
ION
N
NN
N
N
N
OF
PP
PPP
PPPP
D
ET
AIL
5
5 6
16
21
CO
MPR
EH
EN
SIO
N
NN
NN
NN
NN
NN
NN
N
OF
PP
PPPP
P PP
P
T
HO
UG
HT
A
A
A
6 7
13
26
34
INFE
RE
NC
E
NN
NN
NN
NN
NN
N
N
NN
NN
N
OR
PPPP
PPP
PPP
EV
AL
UA
TIV
E
AA
AA
AA
AA
JU
DG
EM
EN
T
15
7 13
35
45
T
OT
AL
26
19
32
77
%
34
25
41
*N, P
, & A
= P
ER
ITEM
CO
UN
TS
N =
NE
LS
ITE
M
P =
PISA
ITE
M
A =
NA
EP
ITE
M

335
TE
STSP
EC
IFIC
AT
ION
S FO
R T
HE
N
EL
SR
EA
DIN
GIT
EM
POO
L
CO
NT
EN
T
LIT
ER
AC
YSC
IEN
CE
SOC
IAL
ST
UD
IES/
OT
HE
RT
OT
AL
%R
EPR
OD
UC
TIO
N O
F D
ET
AIL
5
1 3
9 17
C
OM
PRE
HE
NSI
ON
OF
TH
OU
GH
T
5 3
12
20
27
INFE
RE
NC
E O
R E
VA
LU
AT
IVE
JU
DG
EM
EN
T
14
4 7
25
46
TO
TA
L
24
8 22
54
%
44
15
41

336
PSY
CH
OM
ET
RIC
PRO
PER
TIE
S O
F T
HE
NE
LS:
88SC
OR
ES
B
ASE
YEA
R
FIR
STFO
LLO
W-U
P SE
CO
ND
FOLL
OW
-UP
REA
DIN
G
.80
.86
.85
MA
TH
.89
.93
.94

Appendix E—Summary of First Technical Review Panel Meeting
337
Attachment H The Measurement of Social Capital in ELS:2002
6/28/00
The Measurement of Social Capital in ELS:2002Some guiding principles:
Social capital can be thought of as the resources that individuals can access through dyadic social relations that enable them to realize their intentions (i.e., achieve their goals).
The relevant resources that individuals can access as social capital are infon-nation, help, and social support.
Social capital must be measured independently from social and academic outcomes. We cannot infer the presence or absence of social capital from students' academic success.
Social capital is defined in relation to a particular goal. What may be "positive" social capital for one goal may be "negative" social capital for another.
The intentions (goals) of individuals cannot be assumed; they must be measured directly. We cannot assume that all parents and their children are striving for educational success.
In a study such as ELS:2002, there are several forms of social capital that are relevant:
(a) The relations between students and their parents that enable the students to reach their educational goals
(b) The relations between parents and their children that enable the parents to reach their educational goals for their children
(c) The relations between students and their peers that enable the students to reach their educational goals
(d) The relations between parents and teachers that enable parents to reach their educational goals for their children
(e) The relations among teachers that enable them to reach their workplace goals
Social theory suggests that the most fruitful approach is to link social capital to social structure by mapping the embeddedness of individuals (e.g., students, parents, teachers) in social networks. Although we are unable to do this in ELS:2002, the more information we have about such networks, the better off we will be analytically.

Appendix E—Summary of First Technical Review Panel Meeting
338
6/28/00 For the parent survey:
Since your tenth grader's school opened last Fall, how many times have you done the following?:
a. Given my teenager advice about his or her academic program b. Given my teenager advice about what courses to take c. Given my teenager advice about study skills d. Provided my teenager with infon-nation about the education needed for the
job(s) he or she hopes to have in the future e. Provided my teenager with information about how to get into the college of his
or her choice f. Helped my teenager with his/her homework g. Helped my teenager prepare for an important standardized test (e.g., college
entrance test, mandatory graduation test)
Looking back over the past year, bow often did the following occur? a. The parent(s) of one of my teenager's friends gave me advice about how to help
my teenager do well in school b. The parent(s) of one of my teenager's friends gave me advice about teachers
and/or courses at my teenager's school c. The parent(s) of one of my teenager's friends gave me information about
financial aid for college d. The parent(s) of one of my teenager's friends did me a favor e. I did a favor for the parent(s) of one of my teenager's friends f. The parent(s) of one of my teenager's friends gave me advice about how to raise
my teenager g. The parent(s) of one of my teenager's friends supervised my teenager on an
educational outing or field trip

Appendix E—Summary of First Technical Review Panel Meeting
339
6/28/00
For each of your tenth grader's close friends, please indicate the following: Friend #1 Friend #2 Friend #3 Friend #4 Friend #5 Friend's first name (or nickname)Does this friend attend the same school as your child? Do you know this child's mother? If yes: Please write in the child's mother's occupation Do you know this child's father?If yes: Please write in the child's father's occupation

Appendix E—Summary of First Technical Review Panel Meeting
340
6/28/00
For the student survey:
Please write down the names of your best friends at school. Please fill in up to five names. If you have fewer close friends, provide less than five names. Please use proper names, not nicknames.
Friend #1 Friend #2 Friend #3 Friend #4 Friend #5 Friend's proper nameWhat is this friend's sex?What is this friend's race or ethnicity?What grade is this friend in?How important is getting good grades to this friend?Do you know this friend's mother?If yes: Please write in the friend's mother's occupation
Do you know this friend's father?
If yes: Please write in the friend's father's occupationDoes your parent(s) know this friend's mother?Does your parent(s) know this friend's father?

341
Att
achm
ent I
Tea
cher
Que
stio
nnai
re
Con
tent
A
rea
Stem
N
ew o
r R
evis
ed
Item
So
urce
Con
tent
A
rea
1:
Hav
e yo
u sp
oken
with
this
stud
ent's
par
ents
this
sem
este
r ab
out t
he fo
llow
ing?
R
evis
ed
1.6b
St
uden
t's d
isru
ptiv
e be
havi
or in
scho
ol
?
Con
tent
A
rea
1:
Has
this
stud
ent f
alle
n be
hind
in sc
hool
wor
k be
caus
e of
a
disc
iplin
ary
actio
n?
New
, Add
af
ter 1
.8
?
Con
tent
A
rea
1:
How
ofte
n is
this
stud
ent b
ullie
d by
ano
ther
stud
ent?
N
ew
?
Con
tent
A
rea
1:
How
ofte
n do
es th
is st
uden
t bul
ly o
ther
stud
ents
N
ew
?
Con
tent
A
rea
2:
Cla
ssIn
form
atio
n
Plea
se a
nsw
er th
e fo
llow
ing
ques
tions
for t
he m
ost r
ecen
t pe
riod
you
taug
ht th
e cl
ass o
f Que
stio
ns:
1-25
?
Con
tent
A
rea
3:
Teac
her
Bac
kgro
und
and
Act
iviti
es
Hav
e yo
u pa
rtici
pate
d in
any
of t
he fo
llow
ing
activ
ities
du
ring
the
past
scho
ol y
ear?
R
evis
ed,
Add
to
Serie
s 3.2
0
Trai
ning
to re
cogn
ize
early
war
ning
si
gns o
f pot
entia
lly v
iole
nt st
uden
ts.
SSO
CS
Con
tent
A
rea
4:
Scho
ol
Clim
ate
Usi
ng th
e sc
ale
prov
ided
, ple
ase
indi
cate
the
exte
nt to
w
hich
you
agr
ee o
r dis
agre
e w
ith e
ach
of th
e fo
llow
ing
stat
emen
ts.
Rev
ised
to
Add
to
Serie
s 4.1
This
scho
ol is
safe
. ?
. I f
eel s
afe
at sc
hool
Con
tent
A
rea
4:
Scho
ol
Clim
ate
In th
e la
st 3
0 da
ys, d
id a
nyon
e ta
ke m
oney
or t
hing
s di
rect
ly fr
om y
ou b
y fo
rce,
wea
pons
, or t
hrea
ts a
t sch
ool?
N
ew
No/
Yes
/If y
es, h
ow m
any
times
did
this
in
volv
e lo
sses
of $
10 o
r mor
e?
1976
NIE
Saf
e Sc
hool
Stu
dy
(rev
)
H
ow m
any
times
did
this
invo
lve
loss
es
of $
10 o
r les
s?

342
Con
tent
A
rea
Stem
N
ew o
r R
evis
ed
Item
So
urce
Con
tent
A
rea
4:
Scho
ol
Clim
ate
In th
e la
st 3
0 da
ys, d
id a
nyon
e st
eal t
hing
s of y
ours
from
yo
ur d
esk,
coa
t clo
set,
or o
ther
pla
ce a
t sch
ool?
N
ew
If y
es, h
ow m
any
times
did
this
invo
lve
loss
es o
f $10
or m
ore?
19
76 N
IE S
afe
Scho
ol S
tudy
H
ow m
any
times
did
this
invo
lve
lose
s of
$10
or l
ess?
C
onte
nt
Are
a 4:
Sc
hool
C
limat
e
In t
he la
st 3
0 da
ys, w
ere
you
a vi
ctim
of r
ape
or
atte
mpt
ed ra
pe a
t sch
ool?
If y
es, H
ow m
any
times
wer
e yo
u a
vict
im o
f rap
e? H
ow m
any
times
wer
e yo
u a
vict
im o
f atte
mpt
ed ra
pe?
1976
NIE
Saf
e Sc
hool
Stu
dy
Con
tent
A
rea
4:
Scho
ol
Clim
ate
In th
e la
st 3
0 da
ys, d
id so
meo
ne p
hysi
cally
atta
ck y
ou
and
hurt
you
(not
incl
udin
g ra
pe o
r rap
e at
tem
pts r
epor
ted
in th
e pr
evio
us q
uest
ion)
at s
choo
l?
If
yes
, How
man
y tim
es w
ere
you
atta
cked
and
hur
t so
badl
y th
at y
ou sa
w
a do
ctor
? H
ow m
any
times
wer
e yo
u at
tack
ed a
nd h
urt b
ut n
ot so
bad
ly th
at
you
saw
a d
octo
r?
1976
NIE
Saf
e Sc
hool
Stu
dy
Con
tent
A
rea
4:
Scho
ol
Clim
ate
In th
e la
st 3
0 da
ys h
ow m
any
times
did
stud
ents
swea
r at
you
or m
ake
obsc
ene
rem
arks
or g
estu
res t
o yo
u?
Res
pons
e ca
tego
ries:
N
ever
, Onc
e or
twic
e, A
few
tim
es, M
any
times
New
1976
NIE
Saf
e Sc
hool
Stu
dy
Con
tent
A
rea
4:
Scho
ol
Clim
ate
In th
e la
st 3
0 da
ys h
ow m
any
times
did
any
stud
ents
th
reat
en to
hur
t you
? R
espo
nse
cate
gorie
s:
Nev
er, O
nce
or tw
ice,
A fe
w ti
mes
, Man
y tim
es
New
1976
NIE
Saf
e Sc
hool
Stu
dy
Con
tent
A
rea
4:
Scho
ol
Clim
ate
In th
e la
st 3
0 da
ys h
ow m
any
times
did
stud
ents
swea
r at
you
or m
ake
obsc
ene
rem
arks
or g
estu
res t
o yo
u?
Res
pons
e ca
tego
ries:
N
ever
, Onc
e or
twic
e, A
Few
tim
es, M
any
times
New
1976
NIE
Saf
e Sc
hool
Stu
dy
Con
tent
A
rea
4:
Scho
ol
Clim
ate
In th
e la
st 3
0 da
ys h
ow m
any
times
did
you
hes
itate
to
conf
ront
mis
beha
ving
stud
ents
for f
ear o
f you
r ow
n sa
fety
?
Res
pons
e ca
tego
ries:
N
ever
, Onc
e or
twic
e, A
Few
tim
es, M
any
times
New
1976
NIE
Saf
e Sc
hool
Stu
dy
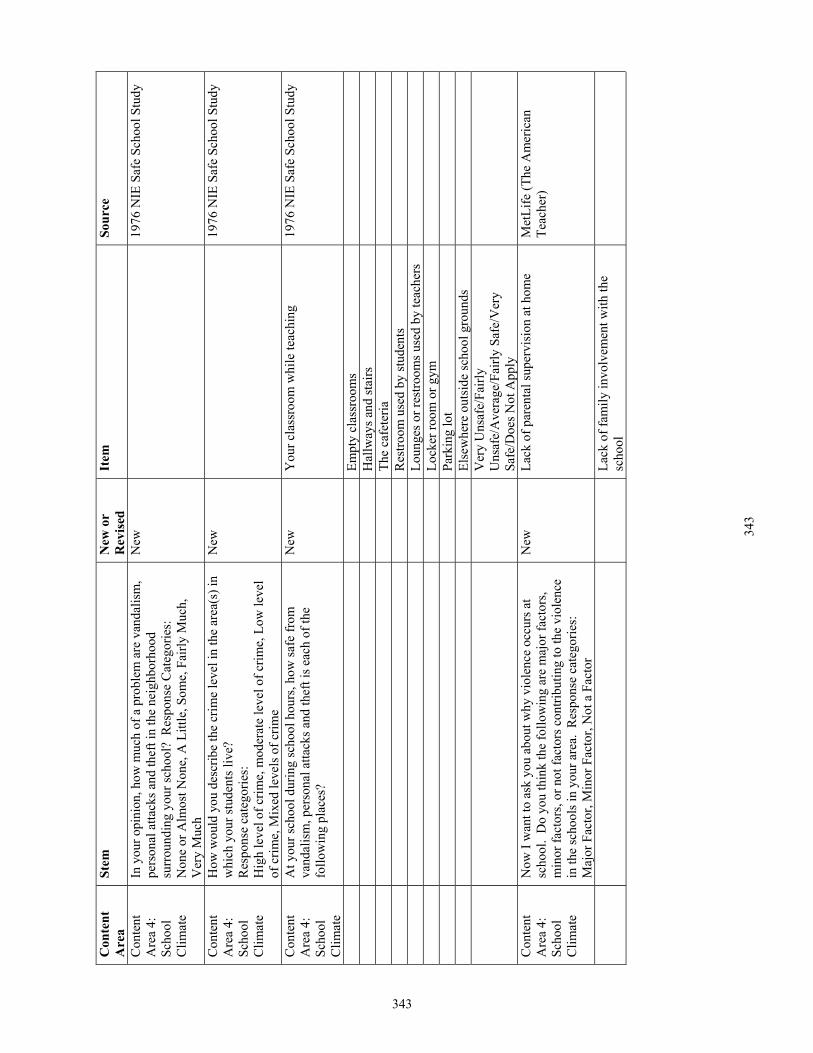
343
343
Con
tent
A
rea
Stem
N
ew o
r R
evis
ed
Item
So
urce
Con
tent
A
rea
4:
Scho
ol
Clim
ate
In y
our o
pini
on, h
ow m
uch
of a
pro
blem
are
van
dalis
m,
pers
onal
atta
cks a
nd th
eft i
n th
e ne
ighb
orho
od
surr
ound
ing
your
scho
ol?
Res
pons
e C
ateg
orie
s:
Non
e or
Alm
ost N
one,
A L
ittle
, Som
e, F
airly
Muc
h,
Ver
y M
uch
New
1976
NIE
Saf
e Sc
hool
Stu
dy
Con
tent
A
rea
4:
Scho
ol
Clim
ate
How
wou
ld y
ou d
escr
ibe
the
crim
e le
vel i
n th
e ar
ea(s
) in
whi
ch y
our s
tude
nts l
ive?
R
espo
nse
cate
gorie
s:
Hig
h le
vel o
f crim
e, m
oder
ate
leve
l of c
rime,
Low
leve
l of
crim
e, M
ixed
leve
ls o
f crim
e
New
1976
NIE
Saf
e Sc
hool
Stu
dy
Con
tent
A
rea
4:
Scho
ol
Clim
ate
At y
our s
choo
l dur
ing
scho
ol h
ours
, how
safe
from
va
ndal
ism
, per
sona
l atta
cks a
nd th
eft i
s eac
h of
the
follo
win
g pl
aces
?
New
Y
our c
lass
room
whi
le te
achi
ng
1976
NIE
Saf
e Sc
hool
Stu
dy
Em
pty
clas
sroo
ms
Hal
lway
s and
stai
rs
The
cafe
teria
R
estro
om u
sed
by st
uden
ts
Loun
ges o
r res
troom
s use
d by
teac
hers
Lo
cker
room
or g
ym
Park
ing
lot
Else
whe
re o
utsi
de sc
hool
gro
unds
V
ery
Uns
afe/
Fairl
y U
nsaf
e/A
vera
ge/F
airly
Saf
e/V
ery
Safe
/Doe
s Not
App
ly
Con
tent
A
rea
4:
Scho
ol
Clim
ate
Now
I w
ant t
o as
k yo
u ab
out w
hy v
iole
nce
occu
rs a
t sc
hool
. D
o yo
u th
ink
the
follo
win
g ar
e m
ajor
fact
ors,
min
or fa
ctor
s, or
not
fact
ors c
ontri
butin
g to
the
viol
ence
in
the
scho
ols i
n yo
ur a
rea.
Res
pons
e ca
tego
ries:
M
ajor
Fac
tor,
Min
or F
acto
r, N
ot a
Fac
tor
New
La
ck o
f par
enta
l sup
ervi
sion
at h
ome
Met
Life
(The
Am
eric
an
Teac
her)
La
ck o
f fam
ily in
volv
emen
t with
the
scho
ol

344
Con
tent
A
rea
Stem
N
ew o
r R
evis
ed
Item
So
urce
Th
e st
uden
t's lo
w a
chie
vem
ent l
evel
B
ored
om o
r lac
k of
mot
ivat
ion
to le
arn
Pove
rty
Gan
g or
gro
up m
embe
rshi
p
Pe
er g
roup
pre
ssur
e
In
volv
emen
t with
dru
gs o
r alc
ohol
Th
e st
uden
t's ra
cial
or e
thni
c ba
ckgr
ound
C
onte
nt
Are
a 4:
Sc
hool
C
limat
e
Wha
t per
cent
age
of st
uden
ts a
t you
r sch
ool d
o yo
u th
ink
expe
rienc
e vi
olen
ce, a
t hom
e or
in th
eir n
eigh
borh
ood,
on
a re
gula
r bas
is?
New
Met
Life
(The
Am
eric
an
Teac
her)
(rev
)
Con
tent
A
rea
4:
Scho
ol
Clim
ate
Whe
n ac
ts o
f vio
lenc
e oc
cur i
n yo
ur sc
hool
, do
you
thin
k th
at te
ache
rs w
ho
are
near
by re
port
all,
som
e or
onl
y a
few
of t
hose
inci
dent
s to
the
prop
er a
utho
ritie
s?
New
Met
Life
(The
Am
eric
an
Teac
her)
(rev
)
Con
tent
A
rea
4:
Scho
ol
Clim
ate
Wha
t per
cent
age
of st
uden
ts in
you
r sch
ool r
egul
arly
ca
rry
wea
pons
such
as h
andg
uns o
r kni
ves t
o sc
hool
? N
ew
M
etLi
fe (T
he A
mer
ican
Te
ache
r)
Con
tent
A
rea
4:
Scho
ol
Clim
ate
Hav
e yo
u ev
er b
roug
ht so
met
hing
to sc
hool
with
you
for
prot
ectio
n?
New
Met
Life
(The
Am
eric
an
Teac
her)
Con
tent
A
rea
4:
Scho
ol
Clim
ate
Do
you
thin
k th
at, i
n yo
ur sc
hool
, the
am
ount
of e
ffor
t sp
ent o
n ad
dres
sing
vio
lenc
e is
mor
e th
an a
dequ
ate,
ad
equa
te, o
r les
s tha
n ad
equa
te?
R
espo
nse
cate
gorie
s:
Mor
e th
an a
dequ
ate,
Ade
quat
e, L
ess t
han
adeq
uate
New
Met
Life
(The
Am
eric
an
Teac
her)

345
345
Con
tent
A
rea
Stem
N
ew o
r R
evis
ed
Item
So
urce
Con
tent
A
rea
4:
Scho
ol
Clim
ate
To th
e be
st o
f you
r kno
wle
dge,
how
ofte
n do
the
follo
win
g ty
pes o
f pro
blem
s occ
ur a
t you
r sch
ool?
R
espo
nse
cate
gorie
s: H
appe
ns d
aily
, Hap
pens
at l
east
on
ce a
wee
k; H
appe
ns a
t lea
st o
nce
a m
onth
; Hap
pens
on
occa
sion
; Nev
er h
appe
ns
New
St
uden
t rac
ial t
ensi
ons
SSO
CS
St
uden
t bul
lyin
g
St
uden
t ver
bal a
buse
of t
each
ers
Wid
espr
ead
diso
rder
in c
lass
room
s
St
uden
t act
s of d
isre
spec
t for
teac
hers
U
ndes
irabl
e ga
ng a
ctiv
ities
U
ndes
irabl
e cu
lt or
ext
rem
ist g
roup
ac
tiviti
es.

Appendix E—Summary of First Technical Review Panel Meeting
346

Appendix E—Summary of First Technical Review Panel Meeting
347
Attachment J
National Center for Education StatisticsU.S. Department of Education Washington, D.C. 20006
FORM APPROVED O.M.B. NO.: 1850-0761 EXPIRATION DATE: 12/31/2000
Please have this questionnaire completed by the person most knowledgeable about your school's disciplinary actions. However, please provide the principal's responses on questions 12 and 20. Please keep a copy of the completed questionnaire for your records.
This survey is authorized by law (20 U.S.C. 122le-1). While you are not required to respond, your cooperation is needed to make the results of this survey comprehensive, accurate, and timely. All information you provide will be treated as, confidential and used only for research or statistical purposes by the survey sponsors, their contractors, and collaborating researchers for the purposes of analyzing data and preparing scientific reports and articles. Any information publicly released (such as statistical summaries) will be in a format that does not personally identify you.
Label
IF ABOVE INFORMATION IS INCORRECT, PLEASE MAKE CORRECTIONS DIRECTLY ON LABEL. Name of person completing form: ____________________________ Telephone: _________________ Title/position: ________________________________________Number of years at this school ________ Best days and times to reach you (in case of questions): ________________________________________E-mail: __________________________________________
According to the Paperwork Reduction Act of 1995, no persons are required to respond to a collection of information unless such collection displays a valid OMB control number. The valid OMB control number for this information collection is 1850-0761. The time required to complete this information collection is estimated to average I hour per response, including the time to review instructions, search existing data resources, gather the data needed, and complete and review the information collection. If you have any comments concerning the accuracy of the time estimate(s) or suggestions for improving this form, please write to: U.S. Department of Education, Washington, D.C. 20202-465 1. If you have comments or concerns regarding the status of your individual submission of this form, write directly to: National Center for Education Statistics, 1990 K Street, N.W., Room 9042, Washington, D.C. 20006.
Please respond by April 17, 2000.
PLEASE RETURN CONWLETED FORM TO: IF YOU HAVE ANY QUESTIONS, CONTACT
School Survey on Crime and Safety, 711909 Dr. Bradford Chaney Westat 800-937-8281, ext. 3946 1650 Research Boulevard Fax: 1-800-533-0239 Rockville,MD 20850-3129 E-mail: [email protected]

Appendix E—Summary of First Technical Review Panel Meeting
348
Definitions
The following words are underlined wherever they appear in the questionnaire,
At school / at your school - include activities happening in school buildings, on school grounds, on school buses, and at places that are holding school-sponsored events or activities. Unless otherwise specified, only respond for those times that were normal school hours or school activities/events were in session. Cult or extremist group - a group that espouses radical beliefs and practices, which may include a religious component, that are widely seen as threatening the basic values and cultural norms of society at large. Firearm/explosive device - any weapon that is designed to (or may readily be converted to) expel a projectile by the action of an explosive. This includes guns, bombs, grenades, mines, rockets, missiles, pipe bombs, or similar devices desigded to explode and capable of causing bodily han-n or property damage. Gang - an ongoing loosely organized association of. three or more persons, whether formal or informal, that has a common name, signs, symbols or colors, whose members engage, either individually or collectively, in violent or other forms of illegal behavior. Hate crime - a criminal offense or threat against a person, property, or society that is motivated, in whole or in part, by the offender's bias against a race, color, national origin, ethnicity, gender, religion, disability, or sexual orientation. Insubordination - a deliberate and inexcusable defiance of or refusal to obey a school rule, authority, or a reasonable order. It includes but is not limited to direct defiance of school authority, failure to attend assigned detention or on-campus super-vision, failure to respond to a call slip, and physical or verbal intimidation/abuse. Intimidation - to frighten, compel, or deter by actual or implied threats. It includes bullying and sexual harassment. Physical attack or fight - an actual and intentional touching or striking of another person against his or her will, or the intentional causing of bodily harm to an individual. Rape - forced sexual intercourse (vaginal, anal, or oral penetration). Includes penetration from a foreign object. Robbery - the taking or attempting to take anything of value that is owned by another person or organization, under confrontational circumstances by force or threat of force or violence and/or by putting the victim in fear. A key difference between robbery and theft/larceny is that robbery involves a threat or battery. Sexual battery - an incident that includes threatened rape, fondling, indecent liberties, child molestation, or sodomy. Classification of these incidents should take into consideration the age and developmentally appropriate behavior of the offender(s). Sexual harassment - unsolicited, offensive behavior that inappropriately asserts sexuality over another person. The behavior may be verbal or non-verbal. Special education student - a child with a disability, defined as mental retardation, hearing impairments (including deafness), speech or language impairments, visual impairments (including blindness), serious emotional disturbance, orthopedic impairments, autism, traumatic brain injury, other health impairments, or specific leaning disabilities, and who needs special education and related services and receives these under the Individuals with Disabilities Education Act (IDEA). Specialized school - a school that is specifically for students who were referred for disciplinary reasons. The school may also have students who were referred for other reasons. The school may be at the same location as your school. Theft/larceny (taking things over $10 without personal confrontation) - the unlawful taking of another person's property without personal confrontation, threat, violence, or bodily hann. Included are pocket picking, stealing purse or backpack (if left unattended or no force was used to take it from owner), theft from a building, theft from a motor vehicle or motor vehicle parts or accessories, theft of bicycles, theft from vending machines, and all other types of thefts. Vandalism - the willful damage or destruction of school property including bombing, arson, graffiti, and other acts that cause Property damage. Includes damage caused by computer hacking. Violence - actual, attempted, or threatened fight or assault. Weapon - any instrument or object used with the intent to threaten, injure, or kill. Includes look-alikes if they are used to threaten others.
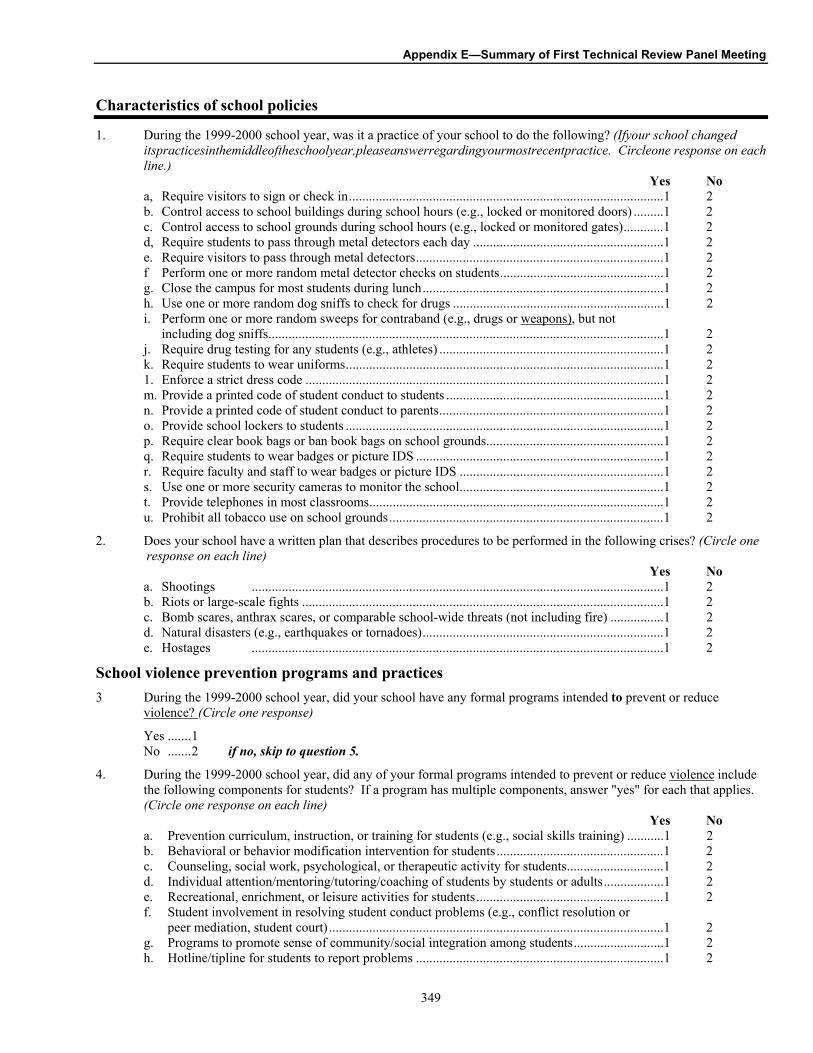
Appendix E—Summary of First Technical Review Panel Meeting
349
Characteristics of school policies
1. During the 1999-2000 school year, was it a practice of your school to do the following? (Ifyour school changeditspracticesinthemiddleoftheschoolyear,pleaseanswerregardingyourmostrecentpractice. Circleone response on each line.)
Yes Noa, Require visitors to sign or check in..............................................................................................1 2 b. Control access to school buildings during school hours (e.g., locked or monitored doors) .........1 2 c. Control access to school grounds during school hours (e.g., locked or monitored gates)............1 2 d, Require students to pass through metal detectors each day .........................................................1 2 e. Require visitors to pass through metal detectors..........................................................................1 2f Perform one or more random metal detector checks on students.................................................1 2 g. Close the campus for most students during lunch........................................................................1 2 h. Use one or more random dog sniffs to check for drugs ...............................................................1 2 i. Perform one or more random sweeps for contraband (e.g., drugs or weapons), but not including dog sniffs ......................................................................................................................1 2 j. Require drug testing for any students (e.g., athletes) ...................................................................1 2k. Require students to wear uniforms...............................................................................................1 2 1. Enforce a strict dress code ...........................................................................................................1 2 m. Provide a printed code of student conduct to students .................................................................1 2 n. Provide a printed code of student conduct to parents...................................................................1 2 o. Provide school lockers to students ...............................................................................................1 2 p. Require clear book bags or ban book bags on school grounds.....................................................1 2 q. Require students to wear badges or picture IDS ..........................................................................1 2 r. Require faculty and staff to wear badges or picture IDS .............................................................1 2 s. Use one or more security cameras to monitor the school.............................................................1 2 t. Provide telephones in most classrooms........................................................................................1 2 u. Prohibit all tobacco use on school grounds..................................................................................1 2
2. Does your school have a written plan that describes procedures to be performed in the following crises? (Circle oneresponse on each line)
Yes Noa. Shootings ...........................................................................................................................1 2 b. Riots or large-scale fights ............................................................................................................1 2 c. Bomb scares, anthrax scares, or comparable school-wide threats (not including fire) ................1 2 d. Natural disasters (e.g., earthquakes or tornadoes)........................................................................1 2e. Hostages ...........................................................................................................................1 2
School violence prevention programs and practices 3 During the 1999-2000 school year, did your school have any formal programs intended to prevent or reduce
violence? (Circle one response)
Yes .......1 No .......2 if no, skip to question 5.
4. During the 1999-2000 school year, did any of your formal programs intended to prevent or reduce violence include the following components for students? If a program has multiple components, answer "yes" for each that applies. (Circle one response on each line)
Yes Noa. Prevention curriculum, instruction, or training for students (e.g., social skills training) ...........1 2 b. Behavioral or behavior modification intervention for students..................................................1 2 c. Counseling, social work, psychological, or therapeutic activity for students.............................1 2 d. Individual attention/mentoring/tutoring/coaching of students by students or adults..................1 2 e. Recreational, enrichment, or leisure activities for students........................................................1 2 f. Student involvement in resolving student conduct problems (e.g., conflict resolution or peer mediation, student court) ....................................................................................................1 2 g. Programs to promote sense of community/social integration among students...........................1 2
h. Hotline/tipline for students to report problems ..........................................................................1 2

Appendix E—Summary of First Technical Review Panel Meeting
350
Words that are underlined are defined at the beginning of this questionnaire-5. During the 1999-2000 school year, did your school do the following to prevent or reduce violence? (Circle one
response on each line.) Yes No
a. Training, supervision, or technical assistance in classroom management for teachers ..............1 2 b. Review, revision, or monitoring of school-wide discipline practices and procedures ...............1 2 c. Training faculty or staff in crime prevention .............................................................................1 2d. Reorganizing school, grades, or schedules (e.g., school within a school, "houses" or "teams"of students) ...................................................................................................................1 2
6. In the last 3 years, did your school complete any architectural or environmental modifications to reduce opportunities for crime and violence? (Circle one response)
Yes .....1 No ......2
7. Which of the following does your school do to involve or help parents? (Circle one response on each line) Yes No
a. Have a formal process to obtain parent input on policies related to school crime and discipline. .................................................................................................................................... 1 2 b. Provide training or technical assistance to parents in dealing with students' problem behavior.. 1 2 c. Have a program that involves parents at school helping to maintain school discipline .............. 1 2
8. During the 1999-2000 school year, at what times did your school regularly use paid law enforcement or security services at school? (Circle one response on each line)
......................................................................................................................... Yes No a, At any time during school hours ................................................................................................1 2 b. While students were arriving or leaving.....................................................................................1 2 c. At selected school activities (e.g., athletic and social events, open houses, science fairs).........1 2 d. When school/school activities not occurring..............................................................................1 2 e. Other (please specify).................................................................................................................1 2
If your school did not regularly use paid law enforcement or security services or it used them only when school and school activities were not occurring, skip to question 10.
9. On average, how many hours per week did at least one paid law enforcement or security person provide law enforcement or security services, wear a uniform or other identifiable clothing, or carry a firearm at your school? If two or more people did these in the same hour, count that as only 1 hour.
Total number of hours that at least one paid law enforcement or security person
a. Was on duty per week, on average _____ hours b. Wore a uniform or other identifiable clothing _____ hours c. Carried a firearm _____ hours
10. During the 1999-2000 school year, did your school or district train any teachers or aides to recognize early warning signs of potentially violent students? Please consider only classroom teachers or aides, and not administrators or counselors. (Circle one response)
Yes .................. 1 No .................. 2 If no, skip to question 12.
11. How many classroom teachers or aides were involved in the training? On average, how many hours of training did each of those teachers or aides receive during the 1999-2000 school year? (Round to the nearest ha@f hour)a. Number of classroom teachers or aides involved in training ............._____ b. Average number of hours of training per participant in 1999-2000 ............._____
Words that are underlined are defined at the beginning of this questionnaire

Appendix E—Summary of First Technical Review Panel Meeting
351
12. To what extent do the following factors limit your school's efforts to reduce or prevent crime? (Circle one response on each line.)
Limin in Limin in Does not Major way minor way limit
a. Lack of or inadequate teacher training in classroom management.....................................1 2 3 b. Lack of or inadequate alternative placements/programs for disruptive students ...............1 2 3 c. Likelihood of complaints from parents ..............................................................................1 2 3 d. Lack of teacher support for school policies........................................................................1 2 3 e. Lack of parental support for school policies ......................................................................1 2 3 f. Teachers' fear of student reprisal........................................................................................1 2 3 g. Fear of litigation ................................................................................................................1 2 3 h. Teacher contracts ...............................................................................................................1 2 3 i. Inadequate funds ................................................................................................................1 2 3 j. Inconsistent application of school policies.........................................................................1 2 3 k. Fear of district or state reprisal...........................................................................................1 2 3 1. Federal policies on disciplining disabled students..............................................................1 2 3 m. Other federal policies on discipline and safety...................................................................1 2 3 n. State or district policies on discipline and safety ...............................................................1 2 3
Violent'deaths at school and elsewhere
13. In 1999-2000, did any of your school's students, faculty, or staff die from violent causes (i.e., homicide or suicide, but Dotaccidents)? Do not limit yourself to deaths occurring at school. (Circle one response)Yes .............. 1 No .............. 2 If no, skip to question 15.
14. Please provide the following information about the violent deaths that occurred. When counti4g deaths at school, please include violent deaths in school buildings, on school grounds, on school buses, and at places that are holding scbool-sponsored events or activities, even if those activities are not officially on school grounds. For this question, count deaths at school, regardless of whether they happened during normal school hours. If the incident occurred at school, but the person died later at a hospital or other location because of the incident, count the death as occurring at school. (Write the number in each category).
Cause of death Student Faculty Staff
Homicidea. At school b. Elsewhere
Suicidec. At school d. Elsewhere
The frequency of other incidents at schools
15. In 1999-2000, how many incidents at your school involved a shooting with intent to harm (whether or not anyone was hurt)? Please count the number of incidents, not the number of shooters or shots fired. Count only incidents that occurred at school,. The same incident could be reported on both lines a and b below if both a student and a nonstudent performed a shooting during that incident. (Write "O " if there were no shootings)
Incidents in which either students Or nonstudents used firearms with intent to harm .......... _____
a. incidents in which students used firearms with intent to harm ................................... _____
b. Incidents in which nonstudents used firearms with intent to harm ............................. _____
Words that are underlined are defined at the beginning of this questionnaire.

Appendix E—Summary of First Technical Review Panel Meeting
352
16. Please provide the number of incidents at your school during the 1999-2000 school year using the categories below. (Count all incidents, regardless of whether students or nonstudents were involved. Include incidents that happened at school regardless of whether they happened during normal school hours. Count only the number of incidents, not the number of victims or offenders, regardless of whether any disciplinary action was taken. Write "O" if there were no incidents in a category. Count only the most serious offense when an incident involved multiple offenses. For example, if an incident included rape and robbery, include the incident only under rape. If an offense does notfit well within the categories provided, do not include it)
Number reported to Number Number Total police or that were that were Number of other law hate gang- Incidents enforcement crimes related
a. Rape or attempted rape................................................................. ____ ____ ____ ____ b. Sexual battery other than rape (include threatened rape) ............. ____ ____ ____ ____ c. Physical attack or fight................................................................. ____ ____ ____ ____
1. With weapon ............................................................................ ____ ____ ____ ____ 2. Without weapon ................................................................... ____ ____ ____ ____
d. Threats of physical attack............................................................. ____ ____ ____ ____ 1. With weapon ............................................................................ ____ ____ ____ ____ 2. Without weapon ....................................................................... ____ ____ ____ ____
e. Robbery (taking things by force).................................................. ____ ____ ____ ____ 1. With weapon ........................................................................ ____ ____ ____ ____ 2. Without weapon ................................................................... ____ ____ ____ ____
f. Theft/larcenv (taking things over S 1 0 without personal confrontation)............................................................................... ____ ____ ____ ____ g. Possession of fireann/explosive device ........................................ ____ ____ ____ ____ h. Possession of knife or sharp object .............................................. ____ ____ ____ ____ i. Distribution of illegal drugs ......................................................... ____ ____ ____ ____ j. Possession or use of alcohol or illegal drugs................................ ____ ____ ____ ____ k. Sexual harassment........................................................................ ____ ____ ____ ____ 1. Vandalism .................................................................................... ____ ____ ____ ____
17. During the previous 2 school years, how many of the following incidents occurred at school, regardless of whether they happened during normal school hours or they were reported to police? (See the instructionsfor question 16)
1997-1998 1998-1999a. Physical attack or fight (do not include rape or sexual battery).............................. _____ _____b. Theft/larceny (taking things over $ 1 0 without personal confrontation)................ _____ _____ c. Vandalism............................................................................................................... _____ _____
18. How many times in 1999-2000 were school activities disrupted by actions such as bomb threats or anthrax threats? Exclude all firealarms from your response, including false alarms.
Number of disruptions .......... _____
Disciplinary problems and actions
19. To the best of your knowledge, how often do the following types of problems occur at your school? (Circle one response on each line)
Happens at Happens at Happens Happens least once a least once a on Never daily week month occasion happens
a. Student racial tensions.........................................................1 2 3 4 5b. Student bullying ..................................................................1 2 3 4 5 c. Student verbal abuse of teachers .........................................1 2 3 4 5 d. Widespread disorder in classrooms.....................................1 2 3 4 5 e. Student acts of disrespect for teachers.................................1 2 3 4 5 f. Undesirable gang activities .................................................1 2 3 4 5 g. Undesirable cult or extremist group activities.....................1 2 3 4 5
Words that are underlined are defined at the beginning of this questionnaire.
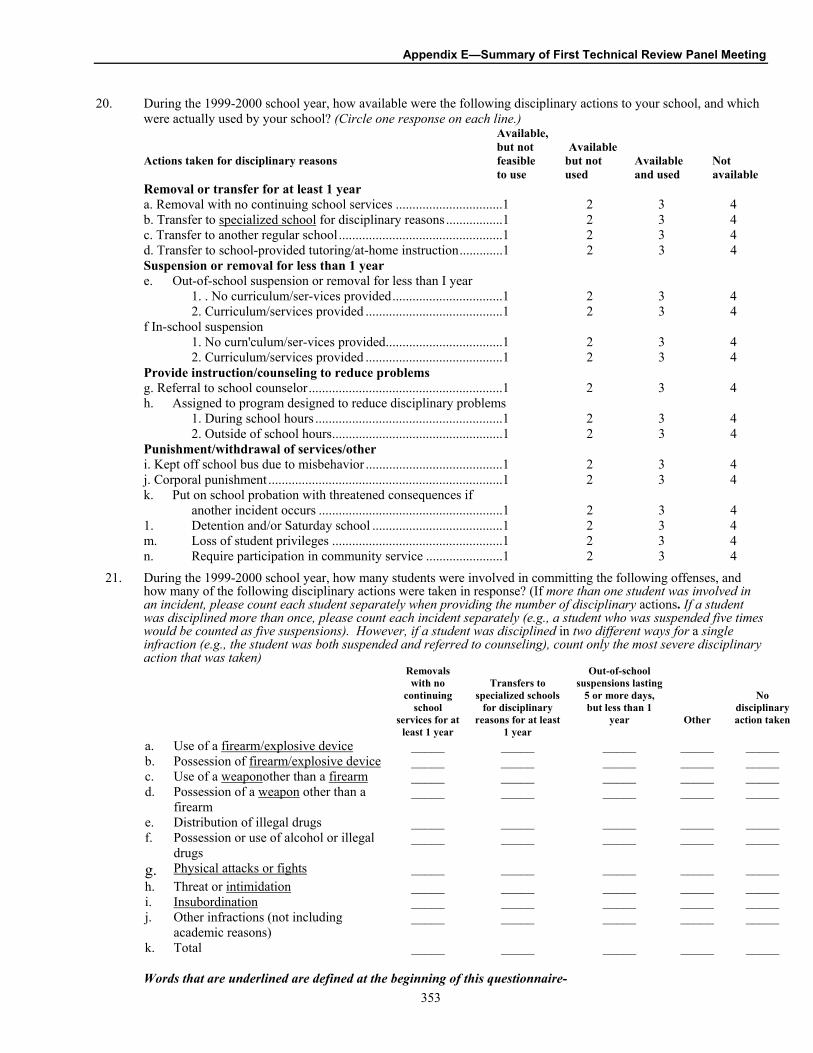
Appendix E—Summary of First Technical Review Panel Meeting
353
20. During the 1999-2000 school year, how available were the following disciplinary actions to your school, and which were actually used by your school? (Circle one response on each line.)
Available, but not Available
Actions taken for disciplinary reasons feasible but not Available Notto use used and used available
Removal or transfer for at least 1 year a. Removal with no continuing school services ................................1 2 3 4 b. Transfer to specialized school for disciplinary reasons .................1 2 3 4 c. Transfer to another regular school.................................................1 2 3 4 d. Transfer to school-provided tutoring/at-home instruction.............1 2 3 4
Suspension or removal for less than 1 yeare. Out-of-school suspension or removal for less than I year 1. . No curriculum/ser-vices provided.................................1 2 3 4 2. Curriculum/services provided .........................................1 2 3 4
f In-school suspension 1. No curn'culum/ser-vices provided...................................1 2 3 4 2. Curriculum/services provided .........................................1 2 3 4 Provide instruction/counseling to reduce problems
g. Referral to school counselor..........................................................1 2 3 4 h. Assigned to program designed to reduce disciplinary problems 1. During school hours ........................................................1 2 3 4 2. Outside of school hours...................................................1 2 3 4 Punishment/withdrawal of services/other
i. Kept off school bus due to misbehavior .........................................1 2 3 4 j. Corporal punishment ......................................................................1 2 3 4
k. Put on school probation with threatened consequences if another incident occurs .......................................................1 2 3 4 1. Detention and/or Saturday school .......................................1 2 3 4 m. Loss of student privileges ...................................................1 2 3 4 n. Require participation in community service .......................1 2 3 4
21. During the 1999-2000 school year, how many students were involved in committing the following offenses, and how many of the following disciplinary actions were taken in response? (If more than one student was involved inan incident, please count each student separately when providing the number of disciplinary actions. If a studentwas disciplined more than once, please count each incident separately (e.g., a student who was suspended five timeswould be counted as five suspensions). However, if a student was disciplined in two different ways for a singleinfraction (e.g., the student was both suspended and referred to counseling), count only the most severe disciplinary action that was taken)
Removals with no
continuingschool
services for at least 1 year
Transfers to specialized schools
for disciplinary reasons for at least
1 year
Out-of-school suspensions lasting
5 or more days, but less than 1
year Other
Nodisciplinaryaction taken
a. Use of a firearm/explosive device _____ _____ _____ _____ _____ b. Possession of firearm/explosive device _____ _____ _____ _____ _____ c. Use of a weaponother than a firearm _____ _____ _____ _____ _____ d. Possession of a weapon other than a
firearm _____ _____ _____ _____ _____
e. Distribution of illegal drugs _____ _____ _____ _____ _____ f. Possession or use of alcohol or illegal
drugs _____ _____ _____ _____ _____
g. Physical attacks or fights _____ _____ _____ _____ _____ h. Threat or intimidation _____ _____ _____ _____ _____ i. Insubordination _____ _____ _____ _____ _____ j. Other infractions (not including
academic reasons) _____ _____ _____ _____ _____
k. Total _____ _____ _____ _____ _____
Words that are underlined are defined at the beginning of this questionnaire-

Appendix E—Summary of First Technical Review Panel Meeting
354
22. Think of those times during the 1999-2000 school year that special education students committed an offense that normally would result in a suspension or expulsion of more than 10 school days for children without disabilities.
Please enter the number of outcomes for each of those offenses, using the categories below. Only offenses All such involving drugs offenses or weapons
a. Placement was changed (including a suspension or expulsion) 1 . After a due process hearing ........................................... _____ _____ 2. After a court-ordered injunction ........................................... _____ _____ 3. Without a due process hearing or court injunction (e.g., parents did not object). ... _____ _____
b. Placement was not changed 1 . No due process hearing or court session was held (e.g., did not seek a change) .. _____ _____ 2. Due process hearing did not approve change ........................................... _____ _____ 3. Court did not approve change ........................................... _____ _____
School characteristics 23. As of October 1, 1999, what was the total enrollment at your school? 24. What percentage of your current students fit the following criteria? a. Eligible for free or reduced-price lunch ..............................................................................._____% b. Limited English proficient (LEP)........................................................................................._____% c. Special education students ..................................................................................................._____% d. Male ........................................................................................................................._____% e. Below 156 percentile on standardized tests ........................................................................._____% f. Likely to go to college after high school.............................................................................._____% g. Consider academic achievement to be very important........................................................._____%
25. How many classroom changes do most students make in a typical day? (Count going to lunch and then returning to the same or a different classroom as two classroom changes. Do not count morning arrival or afternoon departure)
Typical number of classroom changes
26. How many paid staff are at your school in the following categories? Full time Part time
a. Classroom teachers or aides (including special education teachers).......................... _____ _____ b. Counselors/mental health professionals..................................................................... _____ _____ c. Special education teachers ......................................................................................... _____ _____
27. How would you describe the crime level in the area(s) in which your students live? (Choose only one response.)
High level of crime............................................................................................................................1 Moderate level of crime ....................................................................................................................2 Low level of crime ............................................................................................................................3 Mixed levels of crime........................................................................................................................4
28. Which of the following best describes your school? (Circle one response)
Regular school .......................................................................................................................1 Charter school ........................................................................................................................2 Have magnet program for part of school ...............................................................................3 Totally a magnet school .........................................................................................................4 Other (specify)........................................................................................................................529. On average, what percentage of your students are absent without excuse each day? ........... _____% 30. In 1999-2000, how many students transferred to or from your school after the school year had started? Please report
on the total mobility, not just transfers due to disciplinary actions. (If a student transferred more than once in the school year, count each transfer separately)a. Transferred to the school b. Transferred from the school
31. Please provide the following dates. a. Starting date for your 1999-2000 academic school year _____/_____/1999 b. Ending date for your 1999-2000 academic school year _____/_____/2000 c. Date you completed this questionnaire _____/_____/2000
Words that are underlined are defined at the beginning of this questionnaire.

Appendix E—Summary of First Technical Review Panel Meeting
355
Attachment K

Appendix E—Summary of First Technical Review Panel Meeting
356
ECLS-K FACILITIES RATING INSTRUMENT
1. For each of the following, circle "YES" if the facility was available to students; “NO” if the school does not have a facility orif it is not available to students. By available, we mean an area, separate from the classrooms, readily accessible to thestudents. For each of the facilities that are available and that you are able to observe, rate the condition andenvironmental factors using the following rating scale:
(S) Satisfactory: The facility had enough space for purpose; bright light; open-air, airy; "like new" condition, minimalroutine repairs needed, clean; comfortable, moderate noise.
(U) Unsatisfactory: The facility was crowded; dim lighting; stale air; repairs required, dirty, graffiti; uncomfortable,stuffy (too hot or cold); loud distractive noise (e.g., screaming, yelling).
The last column, Handicap Accessibility, refers to doors that are wide enough for wheel chairs, grab bars in bathrooms,and ramps and/or elevators in multi-floor buildings. Circle “YES” if these features are available; “NO” if these features arenot available.
Available ObservedSpace/
size Light Ventilation
Physicalcondition
(ceiling, walls,floors, etc.)
Roomtemperature
Noiselevel
Handicapaccessibility
a. Classroom S U S U S U S U S U S U YES NO
b. Media center YES NO YES NO S U S U S U S U S U S U YES NO
c. Library YES NO YES NO S U S U S U S U S U S U YES NO
d. Art room YES NO YES NO S U S U S U S U S U S U YES NO
e. Music room YES NO YES NO S U S U S U S U S U S U YES NO
f. Cafeteria YES NO YES NO S U S U S U S U S U S U YES NO
g. Computer lab YES NO YES NO S U S U S U S U S U S U YES NO
h. Studentbathrooms YES NO YES NO S U S U S U S U S U S U YES NO
i. Facultybathrooms YES NO YES NO S U S U S U S U S U S U YES NO
j. Place for indoorplay(gymnasium,multipurposeroom)
YES NO YES NO S U S U S U S U S U S U YES NO
k. Outsideplayground YES NO YES NO S U S U YES NO
l. School building(hallways,stairwells,common areas)
YES NO S U S U S U S U S U S U YES NO

Appendix E—Summary of First Technical Review Panel Meeting
357
2. For each of the following, circle "YES" or "NO" for physical security in building. (CIRCLE ALL THAT YOU OBSERVED.)
Yes No Yes, but not enforced
a. Security guard .................................................................... 1 2 3b. Metal detectors ................................................................... 1 2 3c. Security cameras................................................................ 1 2 3d. Window/door bars............................................................... 1 2 3e. Exit doors that only open from inside.................................. 1 2 3f. Fencing around school ....................................................... 1 2 3g. Sign-in policies ................................................................... 1 2 3h. Visitors are greeted and directed by an adult to sign
in at office ...........................................................................1 2 3
i. Internal communication system (e.g., intercoms) ............... 1 2 3j. Fire alarms.......................................................................... 1 2 3k. Fire extinguishers ............................................................... 1 2 3l. Fire sprinklers ..................................................................... 1 2 3
3. Based on the effectiveness of the security measures listed in question two, please rate your overall perceived feeling ofsafety for children in this school. Use the definitions provided below when making your choice. (CIRCLE ONE.)
Very Safe: The school has at least 6 of the safety measures listed in question two. All of these measures are inuse and are effective. (If not all are in use, rate the school as “Safe”.) No other safety measures are needed toprotect the students.Safe: The school has 4-5 of the security measures listed in question two. Although some additional measurescould be added, the overall safety of the school is adequate. Most of the measures that the school does have areeffective and in use.Unsafe: The school has 2-3 of the safety measures listed in question two. Some of the measures are notenforced, and many more security measures are needed.Very Unsafe: The school has less than 0-1 measures of security. Other security measures are definitely needed.
Very safe Safe Unsafe Very unsafe
1 2 3 4
3a. Please indicate if the following factors are present in the neighborhood surrounding the school.
A little Some A lot
a. Litter/trash ......................................................................... 1 2 3b. Graffiti ............................................................................... 1 2 3c. Boarded up buildings ........................................................ 1 2 3d. Persons congregated on streets ....................................... 1 2 3
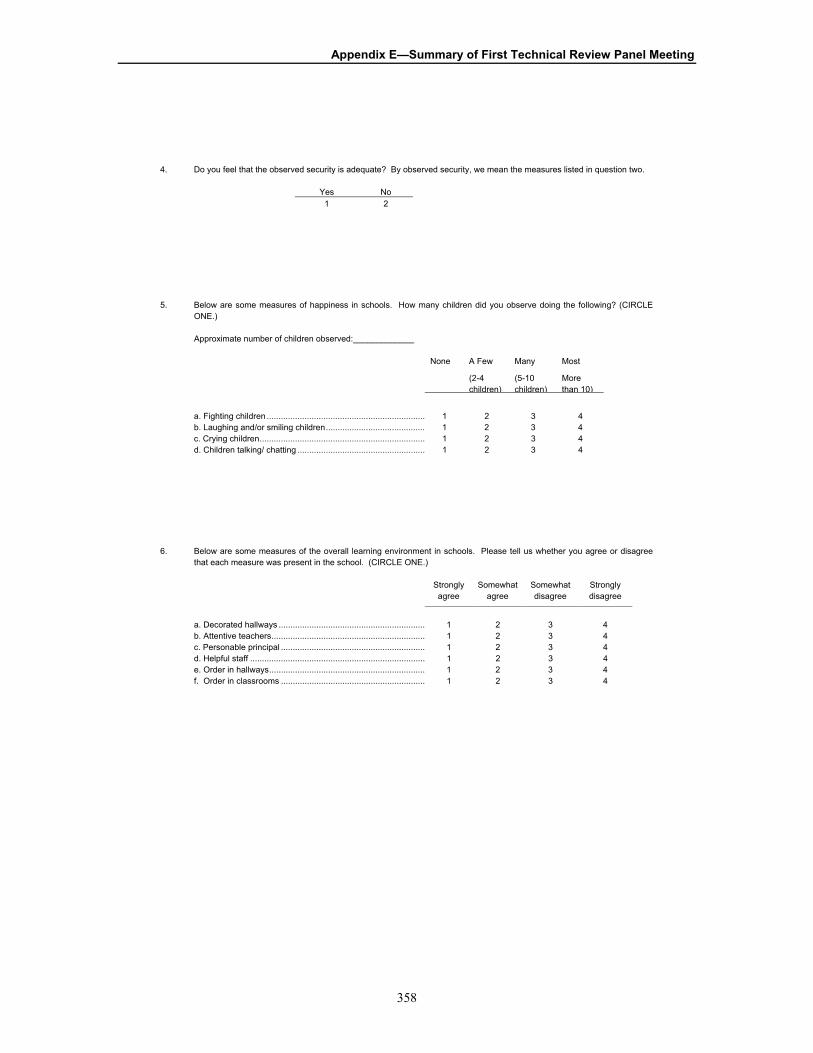
Appendix E—Summary of First Technical Review Panel Meeting
358
4. Do you feel that the observed security is adequate? By observed security, we mean the measures listed in question two.
Yes No1 2
5. Below are some measures of happiness in schools. How many children did you observe doing the following? (CIRCLEONE.)
Approximate number of children observed:_____________
None A Few
(2-4children)
Many
(5-10children)
Most
Morethan 10)
a. Fighting children ................................................................... 1 2 3 4b. Laughing and/or smiling children.......................................... 1 2 3 4c. Crying children...................................................................... 1 2 3 4d. Children talking/ chatting ...................................................... 1 2 3 4
6. Below are some measures of the overall learning environment in schools. Please tell us whether you agree or disagreethat each measure was present in the school. (CIRCLE ONE.)
Stronglyagree
Somewhatagree
Somewhatdisagree
Stronglydisagree
a. Decorated hallways .............................................................. 1 2 3 4b. Attentive teachers................................................................. 1 2 3 4c. Personable principal ............................................................. 1 2 3 4d. Helpful staff .......................................................................... 1 2 3 4e. Order in hallways.................................................................. 1 2 3 4f. Order in classrooms ............................................................. 1 2 3 4
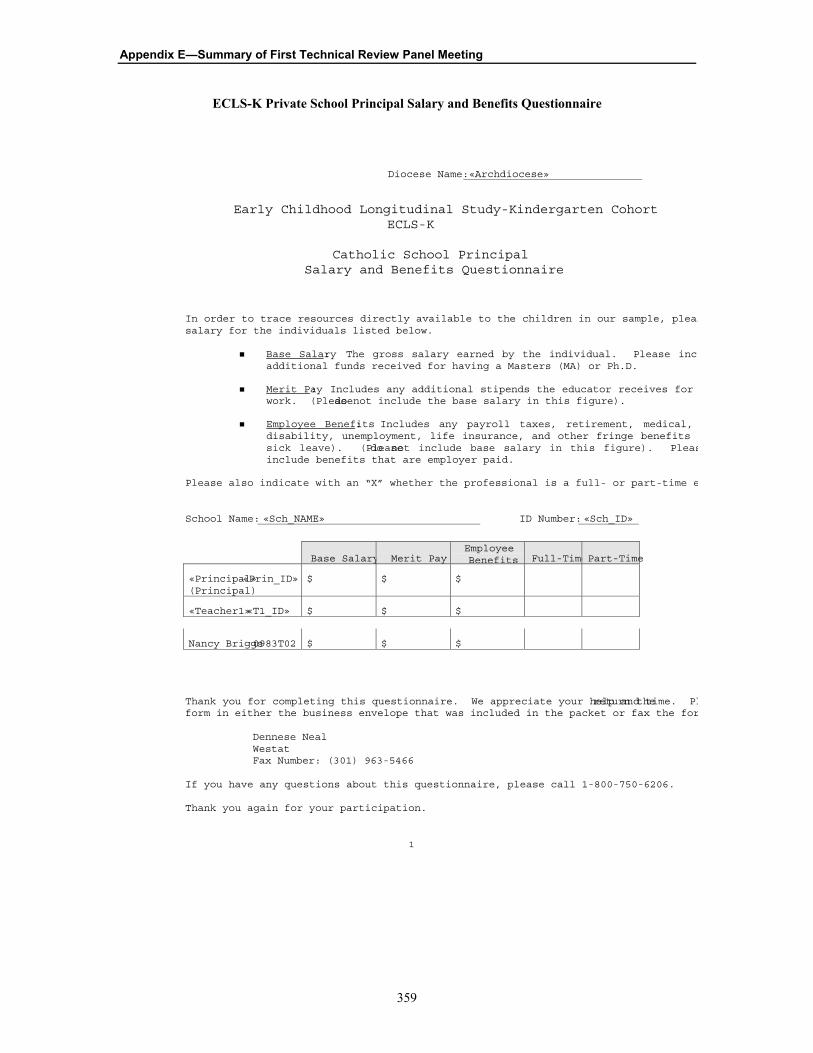
Appendix E—Summary of First Technical Review Panel Meeting
359
ECLS-K Private School Principal Salary and Benefits Questionnaire
Diocese Name:«Archdiocese»
1
Early Childhood Longitudinal Study-Kindergarten CohortECLS-K
Catholic School PrincipalSalary and Benefits Questionnaire
In order to trace resources directly available to the children in our sample, pleassalary for the individuals listed below.
� Base Salary: The gross salary earned by the individual. Please incladditional funds received for having a Masters (MA) or Ph.D.
� Merit Pay: Includes any additional stipends the educator receives for work. (Please do not include the base salary in this figure).
� Employee Benefits: Includes any payroll taxes, retirement, medical, disability, unemployment, life insurance, and other fringe benefits sick leave). (Please do not include base salary in this figure). Pleasinclude benefits that are employer paid.
Please also indicate with an “X” whether the professional is a full- or part-time e
School Name: «Sch_NAME» ID Number: «Sch_ID»
Base Salary Merit PayEmployeeBenefits Full-TimePart-Time
«Principal»«Prin_ID»(Principal)
$ $ $
«Teacher1»«T1_ID» $ $ $
Nancy Briggs0983T02 $ $ $
Thank you for completing this questionnaire. We appreciate your help and time. Plreturn theform in either the business envelope that was included in the packet or fax the for
Dennese NealWestatFax Number: (301) 963-5466
If you have any questions about this questionnaire, please call 1-800-750-6206.
Thank you again for your participation.

Appendix E—Summary of First Technical Review Panel Meeting
360
Diocese Name:«Archdiocese»
2
Early Childhood Longitudinal Study-Kindergarten CohortECLS-K
Private School PrincipalSalary and Benefits Questionnaire
In order to trace resources directly available to the children in our sample, pleassalary for the individuals listed below.
� Base Salary: The gross salary earned by the individual. Please incladditional funds received for having a Masters (MA) or Ph.D.
� Merit Pay: Includes any additional stipends the educator receives for work. (Please do not include the base salary in this figure).
� Employee Benefits: Includes any payroll taxes, retirement, medical, disability, unemployment, life insurance, and other fringe benefits sick leave). (Please do not include base salary in this figure). Pleasinclude benefits that are employer paid.
Please also indicate with an “X” whether the professional is a full- or part-time e
School Name: «Sch_NAME» ID Number: «Sch_ID»
Base Salary Merit PayEmployeeBenefits Full-TimePart-Time
«PrinFirstName»«PrinLastName»(Principal)
$ $ $
«Teacher1»«T1_ID» $ $ $
Thank you for completing this questionnaire. We appreciate your help and time. Plreturn theform in either the business envelope that was included in the packet or fax the for
Dennese NealWestatFax Number: (301) 963-5466
If you have any questions about this questionnaire, please call 1-800-750-6206.
Thank you again for your participation.

Appendix E—Summary of First Technical Review Panel Meeting
361
Diocese Name:«Archdiocese»
3
Early Childhood Longitudinal Study-Kindergarten CohortECLS-K
Public School Business AdministratorSalary and Benefits Questionnaire
In order to trace resources directly available to the children in our sample, pleassalary for the individuals listed below.
� Base Salary: The gross salary earned by the individual. Please incladditional funds received for having a Masters (MA) or Ph.D.
� Merit Pay: Includes any additional stipends the educator receives for work. (Please do not include the base salary in this figure).
� Employee Benefits: Includes any payroll taxes, retirement, medical, disability, unemployment, life insurance, and other fringe benefits sick leave). (Please do not include base salary in this figure). Pleasinclude benefits that are employer paid.
Please also indicate with an “X” whether the professional is a full- or part-time e
School Name: «Sch_NAME» ID Number: «Sch_ID»
Base Salary Merit PayEmployeeBenefits Full-TimePart-Time
«Principal»(Principal)
$ $ $
«Teacher1»«T1_ID» $ $ $
Thank you for completing this questionnaire. We appreciate your help and time. Plreturn theform in either the business envelope that was included in the packet or fax the for
Dennese NealWestatFax Number: (301) 963-5466
If you have any questions about this questionnaire, please call 1-800-750-6206.
Thank you again for your participation.

Appendix E—Summary of First Technical Review Panel Meeting
362

363
References Agresti, A. 1984. Analysis of Ordinal Categorical Data. New York, NY: Wiley & Sons.
Bandura, Albert. 1997. Self-Efficacy: The Exercise of Control. New York: W. H. Freeman & Co.
Barton, Paul E., and Coley, Richard J. 1990 . The Education Reform Decade. Princeton, N.J.: Educational Testing Service.
Baumert, J., Fend, H., O'Neil, H. F., & Peschar, J. L. 1998 . Prepared for life-long learning: Frame of reference for the measurement of self-regulated learning as a cross-curricular competency (CCC) in the PISA project. Paris: OECD.
Baumert, J., Gruehn, S., Heyn, S., Köller, O., & Schnabel, K.-U. 1997 . Bildungsverläufe und Psychosoziale Entwicklung im Jugendalter (BIJU): Dokumentation – Band I. Berlin: Max-Planck-Institut für Bildungsforschung.
Baumert, J., Heyn, S., & Köller, O. 1994. Das Kieler Lernstrategien-Inventar (KSI). Kiel: Institut Für die Pädagogik der Naturwissenschaften an der Universität Kiel.
Baumert, J. 1993 . Lernstrategien, motivationale Orientierung und Selbstwirksamkeitsüberzeugungen im Kontext schulischen Lernens. Unterrichtswissenschaft, 4, 327-354.
Bohrnstedt, George W. 1983. Measurement. IN P.H. Rossi, J.D. Wright and A.B. Anderson (Eds.), Handbook of Survey Research. San Diego: Academic Press.
Cohen, J. 1988. Statistical Power Analysis for the Behavioral Sciences. Hillside, NJ: Erlbaum.
Cronbach, Lee J. 1970. Essentials of PsychologicalTesting. New York: Harper and Row.
Curtin, T.R., Ingels, Steven J., Wu, Shiying, and Heuer, Ruth. 2002. NELS:88 Base Year to Fourth Follow-Up Data File User's Manual. (NCES 2002-323). Washington, DC: U.S. Department of Education, National Center for Education Statistics.
Ingels, Steven J. 1996. Sample Exclusion in NELS:88: Characteristics of Base Year Ineligible Students; Changes in Eligibility Status After Four Years. (NCES 96-723). Washington, D.C.: U.S. Department of Education, National Center for Education Statistics.
Kendall, M. 1945. The Treatment of ties in rank problems. Biometrika, 33, 88-93.

References
364
Lemke, Mariann, et al. 2002. Outcomes of Learning: Results from the 2000 Program for International Student Assessment of 15-year-Olds in Reading, Mathematics, and Science Literacy. (NCES 2002-115). Washington, DC: U.S. Department of Education, National Center for Education Statistics.
Marsh, Herbert, and Yeung, A.S. 1996. The distinctiveness of affects in specific school subjects. American Educational Research Journal.
Nolen, S. B. & Haladyna, T. M. 1990a. Motivation and studying n high school science. Journal of Research in Science Teaching, 27, 115-126.
Nolen, S. B. & Haladyna, T. M. 1990b. A construct validation of measures of students’ study strategy beliefs and perceptions of teacher goals. Education and Psychological Measurement, 191-202.
Peschar, J. L., Veenstra, R., Boomsma, A., Huisman, M., & van derWal, M. 1999. Self-Regulated learning as a cross-curricular competency: The construction of instruments in 22 countries for the PISA main study 2000. Washington, D.C.: American Institutes for Research.
Peschar, J. L. 1993. Prepared for real life: Establishing indicators for non-curriculum bound indicators (NOBS) in a comparative setting. Project proposal for the OECD Network A Meeting in Vilamoura, Portugal.
Pintrich, P.R., and E.V. DeGroot. 1990. “Motivational and Self-regulated Learning Components of Classroom Academic Performance.” Journal of Educational Psychology, 82.
Pintrich, P. R., Smith, D. A. F., Garcia, T., & McKeachie, W. J. 1993. Reliability and predictive validity of the motivated strategies for learning questionnaire (MLSQ). Educational and Psychological Measurement, 53, 801-813.
Rasinski, Kenneth A., Ingels, Steven J., Rock, Donald A., and Pollack, Judith M. 1993. America's High School Sophomores: A Ten Year Comparison. (NCES 93-087). Washington, DC: U.S. Department of Education, National Center for Education Statistics.
Riccobono, John A., Place, C., and Burkheimer, G.J. 1981. National Longitudinal Study: Base Year through Fourth Follow-Up. Washington, DC: U.S. Department of Education, National Center for Education Statistics.
Schiefele, U., & Moschner, B. 1997. Unpublished scales on self-concept, motivation, interest, learning strategies, epistemological beliefs, need for cognition, and learning environment.
Schunk, D. H., & Zimmerman, B. J. (Eds.) 1994. Self-regulation of learning and performance: Issues and educational applications. Hillside, NJ: Erlbaum.
Standards for Maintaining, Collecting, and Presenting Federal Data on Race and Ethnicity. 1997. Federal Register,62:210, 58788-58790. Washington, DC: U.S. Government Printing Office.
Tourangeau, Roger E. 1987. The National Longitudinal Study o f the High School Class of 1972 (NLS-72) Fifth Follow-Up (1986) Data File User's Manual. Washington, DC: U.S. Department of Education, National Center for Education Statistics.
Trier, U. P., & Peschar, J. L. 1995. Cross-curricular competencies: Rationale and strategy for developing a new indicator. IN Measuring what students learn. Paris: OECD.

References
365
Trier, U. P. 1991. Non-curriculum bound outcomes. Proposal presented at the Network A Meeting of the OECD-INES Project on educational indicators in Paris, France.
Wild, K. P., & Schiefele, U. 1994. Lernstrategien im Studium: Ergebnisse zur Faktorenstruktur und Reliabilität eomes meiem Fragebogens. Zeitschrift für Differentielle und Diagnostische Psychologie, 15, 185-200.
Zahs, Daniel, Pedlow, Steven, Morrissey, Marjorie, Marnell, Pat, and Nichols, Bronwyn. 1995. High School and Beyond Fourth Follow-Up Methodology Report. (NCES 95-426). Washington, DC: U.S. Department of Education, National Center for Education Statistics.
Zimmerman, B. J., & Schunk, D. H. 1989. Self-regulated learning and academic achievement: Theory, research and practice. New York: Springer.
References
366

Listing of NCES Working Papers to Date
Working papers can be downloaded as .pdf files from the NCES Electronic Catalog (http://nces.ed.gov/pubsearch/). You can also contact Sheilah Jupiter at (202) 502–7363 ([email protected]) if you are interested in any of the following papers.
Listing of NCES Working Papers by Program Area No. Title NCES contact
Baccalaureate and Beyond (B&B) 98–15 Development of a Prototype System for Accessing Linked NCES Data Steven Kaufman
2001–15 Baccalaureate and Beyond Longitudinal Study: 2000/01 Follow-Up Field Test Methodology Report
Andrew G. Malizio
2002–04 Improving Consistency of Response Categories Across NCES Surveys Marilyn Seastrom
Beginning Postsecondary Students (BPS) Longitudinal Study 98–11 Beginning Postsecondary Students Longitudinal Study First Follow-up (BPS:96–98) Field
Test Report Aurora D’Amico
98–15 Development of a Prototype System for Accessing Linked NCES Data Steven Kaufman 1999–15 Projected Postsecondary Outcomes of 1992 High School Graduates Aurora D’Amico 2001–04 Beginning Postsecondary Students Longitudinal Study: 1996–2001 (BPS:1996/2001)
Field Test Methodology Report Paula Knepper
2002–04 Improving Consistency of Response Categories Across NCES Surveys Marilyn Seastrom
Common Core of Data (CCD) 95–12 Rural Education Data User’s Guide Samuel Peng 96–19 Assessment and Analysis of School-Level Expenditures William J. Fowler, Jr. 97–15 Customer Service Survey: Common Core of Data Coordinators Lee Hoffman 97–43 Measuring Inflation in Public School Costs William J. Fowler, Jr. 98–15 Development of a Prototype System for Accessing Linked NCES Data Steven Kaufman
1999–03 Evaluation of the 1996–97 Nonfiscal Common Core of Data Surveys Data Collection, Processing, and Editing Cycle
Beth Young
2000–12 Coverage Evaluation of the 1994–95 Common Core of Data: Public Elementary/Secondary School Universe Survey
Beth Young
2000–13 Non-professional Staff in the Schools and Staffing Survey (SASS) and Common Core of Data (CCD)
Kerry Gruber
2002–02 School Locale Codes 1987 – 2000 Frank Johnson
Data Development 2000–16a Lifelong Learning NCES Task Force: Final Report Volume I Lisa Hudson 2000–16b Lifelong Learning NCES Task Force: Final Report Volume II Lisa Hudson
Decennial Census School District Project 95–12 Rural Education Data User’s Guide Samuel Peng 96–04 Census Mapping Project/School District Data Book Tai Phan 98–07 Decennial Census School District Project Planning Report Tai Phan
Early Childhood Longitudinal Study (ECLS) 96–08 How Accurate are Teacher Judgments of Students’ Academic Performance? Jerry West 96–18 Assessment of Social Competence, Adaptive Behaviors, and Approaches to Learning with
Young Children Jerry West
97–24 Formulating a Design for the ECLS: A Review of Longitudinal Studies Jerry West 97–36 Measuring the Quality of Program Environments in Head Start and Other Early Childhood
Programs: A Review and Recommendations for Future Research Jerry West
1999–01 A Birth Cohort Study: Conceptual and Design Considerations and Rationale Jerry West 2000–04 Selected Papers on Education Surveys: Papers Presented at the 1998 and 1999 ASA and
1999 AAPOR Meetings Dan Kasprzyk
2001–02 Measuring Father Involvement in Young Children's Lives: Recommendations for a Fatherhood Module for the ECLS-B
Jerry West

No. Title NCES contact 2001–03 Measures of Socio-Emotional Development in Middle Childhood Elvira Hausken
2001–06 Papers from the Early Childhood Longitudinal Studies Program: Presented at the 2001 AERA and SRCD Meetings
Jerry West
2002-05 Early Childhood Longitudinal Study-Kindergarten Class of 1998–99 (ECLS–K), Psychometric Report for Kindergarten Through First Grade Elvira Hausken
Education Finance Statistics Center (EDFIN) 94–05 Cost-of-Education Differentials Across the States William J. Fowler, Jr. 96–19 Assessment and Analysis of School-Level Expenditures William J. Fowler, Jr. 97–43 Measuring Inflation in Public School Costs William J. Fowler, Jr. 98–04 Geographic Variations in Public Schools’ Costs William J. Fowler, Jr.
1999–16 Measuring Resources in Education: From Accounting to the Resource Cost Model Approach William J. Fowler, Jr.
Education Longitudinal Study: 2002 (ELS:2002)2003-03 Education Longitudinal Study of 2002 Base Year Field Test Report Jeffrey Owings
High School and Beyond (HS&B) 95–12 Rural Education Data User’s Guide Samuel Peng
1999–05 Procedures Guide for Transcript Studies Dawn Nelson
1999–06 1998 Revision of the Secondary School Taxonomy Dawn Nelson 2002–04 Improving Consistency of Response Categories Across NCES Surveys Marilyn Seastrom
HS Transcript Studies 1999–05 Procedures Guide for Transcript Studies
Dawn Nelson 1999–06 1998 Revision of the Secondary School Taxonomy Dawn Nelson 2003–01 Mathematics, Foreign Language, and Science Coursetaking and the NELS:88 Transcript
DataJeffrey Owings
2003–02 English Coursetaking and the NELS:88 Transcript Data Jeffrey Owings
International Adult Literacy Survey (IALS) 97–33 Adult Literacy: An International Perspective Marilyn Binkley
Integrated Postsecondary Education Data System (IPEDS) 97–27 Pilot Test of IPEDS Finance Survey Peter Stowe 98–15 Development of a Prototype System for Accessing Linked NCES Data Steven Kaufman
2000–14 IPEDS Finance Data Comparisons Under the 1997 Financial Accounting Standards for Private, Not-for-Profit Institutes: A Concept Paper
Peter Stowe
National Assessment of Adult Literacy (NAAL) 98–17 Developing the National Assessment of Adult Literacy: Recommendations from
Stakeholders Sheida White
1999–09a 1992 National Adult Literacy Survey: An Overview Alex Sedlacek 1999–09b 1992 National Adult Literacy Survey: Sample Design Alex Sedlacek 1999–09c 1992 National Adult Literacy Survey: Weighting and Population Estimates Alex Sedlacek 1999–09d 1992 National Adult Literacy Survey: Development of the Survey Instruments Alex Sedlacek 1999–09e 1992 National Adult Literacy Survey: Scaling and Proficiency Estimates Alex Sedlacek 1999–09f 1992 National Adult Literacy Survey: Interpreting the Adult Literacy Scales and Literacy
LevelsAlex Sedlacek
1999–09g 1992 National Adult Literacy Survey: Literacy Levels and the Response Probability Convention
Alex Sedlacek
2000–05 Secondary Statistical Modeling With the National Assessment of Adult Literacy: Implications for the Design of the Background Questionnaire
Sheida White
2000–06 Using Telephone and Mail Surveys as a Supplement or Alternative to Door-to-Door Surveys in the Assessment of Adult Literacy
Sheida White
2000–07 “How Much Literacy is Enough?” Issues in Defining and Reporting Performance Standards for the National Assessment of Adult Literacy
Sheida White
2000–08 Evaluation of the 1992 NALS Background Survey Questionnaire: An Analysis of Uses with Recommendations for Revisions
Sheida White
2000–09 Demographic Changes and Literacy Development in a Decade Sheida White

No. Title NCES contact 2001–08 Assessing the Lexile Framework: Results of a Panel Meeting Sheida White 2002–04 Improving Consistency of Response Categories Across NCES Surveys Marilyn Seastrom
National Assessment of Educational Progress (NAEP) 95–12 Rural Education Data User’s Guide Samuel Peng 97–29 Can State Assessment Data be Used to Reduce State NAEP Sample Sizes? Steven Gorman 97–30 ACT’s NAEP Redesign Project: Assessment Design is the Key to Useful and Stable
Assessment Results Steven Gorman
97–31 NAEP Reconfigured: An Integrated Redesign of the National Assessment of Educational Progress
Steven Gorman
97–32 Innovative Solutions to Intractable Large Scale Assessment (Problem 2: Background Questionnaires)
Steven Gorman
97–37 Optimal Rating Procedures and Methodology for NAEP Open-ended Items Steven Gorman 97–44 Development of a SASS 1993–94 School-Level Student Achievement Subfile: Using
State Assessments and State NAEP, Feasibility Study Michael Ross
98–15 Development of a Prototype System for Accessing Linked NCES Data Steven Kaufman 1999–05 Procedures Guide for Transcript Studies Dawn Nelson 1999–06 1998 Revision of the Secondary School Taxonomy Dawn Nelson 2001–07 A Comparison of the National Assessment of Educational Progress (NAEP), the Third
International Mathematics and Science Study Repeat (TIMSS-R), and the Programme for International Student Assessment (PISA)
Arnold Goldstein
2001–08 Assessing the Lexile Framework: Results of a Panel Meeting Sheida White 2001–11 Impact of Selected Background Variables on Students’ NAEP Math Performance Arnold Goldstein 2001–13 The Effects of Accommodations on the Assessment of LEP Students in NAEP Arnold Goldstein 2001–19 The Measurement of Home Background Indicators: Cognitive Laboratory Investigations
of the Responses of Fourth and Eighth Graders to Questionnaire Items and Parental Assessment of the Invasiveness of These Items
Arnold Goldstein
2002–04 Improving Consistency of Response Categories Across NCES Surveys Marilyn Seastrom 2002-06 The Measurement of Instructional Background Indicators: Cognitive Laboratory
Investigations of the Responses of Fourth and Eighth Grade Students and Teachers to Questionnaire Items
Arnold Goldstein
2003-06 NAEP Validity Studies: The Validity of Oral Accommodation in Testing Patricia Dabbs 2003-07 NAEP Validity Studies: An Agenda for NAEP Validity Research Patricia Dabbs 2003-08 NAEP Validity Studies: Improving the Information Value of Performance Items in Large
Scale Assessments Patricia Dabbs
2003-09 NAEP Validity Studies: Optimizing State NAEP: Issues and Possible Improvements Patricia Dabbs 2003-10 A Content Comparison of the NAEP and PIRLS Fourth-Grade Reading Assessments Marilyn Binkley 2003-11 NAEP Validity Studies: Reporting the Results of the National Assessment of Educational
ProgressPatricia Dabbs
2003-12 NAEP Validity Studies: An Investigation of Why Students Do Not Respond to Questions Patricia Dabbs 2003-13 NAEP Validity Studies: A Study of Equating in NAEP Patricia Dabbs 2003-14 NAEP Validity Studies: Feasibility Studies of Two-Stage Testing in Large-Scale
Educational Assessment: Implications for NAEP Patricia Dabbs
2003-15 NAEP Validity Studies: Computer Use and Its Relation to Academic Achievement in Mathematics, Reading, and Writing
Patricia Dabbs
2003-16 NAEP Validity Studies: Implications of Electronic Technology for the NAEP Assessment Patricia Dabbs 2003-17 NAEP Validity Studies: The Effects of Finite Sampling on State Assessment Sample
RequirementsPatricia Dabbs
2003-19 NAEP Quality Assurance Checks of the 2002 Reading Assessment Results of Delaware Janis Brown
National Education Longitudinal Study of 1988 (NELS:88) 95–04 National Education Longitudinal Study of 1988: Second Follow-up Questionnaire Content
Areas and Research Issues Jeffrey Owings
95–05 National Education Longitudinal Study of 1988: Conducting Trend Analyses of NLS-72, HS&B, and NELS:88 Seniors
Jeffrey Owings
95–06 National Education Longitudinal Study of 1988: Conducting Cross-Cohort Comparisons Using HS&B, NAEP, and NELS:88 Academic Transcript Data
Jeffrey Owings
95–07 National Education Longitudinal Study of 1988: Conducting Trend Analyses HS&B and NELS:88 Sophomore Cohort Dropouts
Jeffrey Owings
95–12 Rural Education Data User’s Guide Samuel Peng

No. Title NCES contact 95–14 Empirical Evaluation of Social, Psychological, & Educational Construct Variables Used
in NCES Surveys Samuel Peng
96–03 National Education Longitudinal Study of 1988 (NELS:88) Research Framework and Issues
Jeffrey Owings
98–06 National Education Longitudinal Study of 1988 (NELS:88) Base Year through Second Follow-Up: Final Methodology Report
Ralph Lee
98–09 High School Curriculum Structure: Effects on Coursetaking and Achievement in Mathematics for High School Graduates—An Examination of Data from the National Education Longitudinal Study of 1988
Jeffrey Owings
98–15 Development of a Prototype System for Accessing Linked NCES Data Steven Kaufman 1999–05 Procedures Guide for Transcript Studies Dawn Nelson 1999–06 1998 Revision of the Secondary School Taxonomy Dawn Nelson 1999–15 Projected Postsecondary Outcomes of 1992 High School Graduates Aurora D’Amico 2001–16 Imputation of Test Scores in the National Education Longitudinal Study of 1988 Ralph Lee 2002–04 Improving Consistency of Response Categories Across NCES Surveys Marilyn Seastrom 2003–01 Mathematics, Foreign Language, and Science Coursetaking and the NELS:88 Transcript
DataJeffrey Owings
2003–02 English Coursetaking and the NELS:88 Transcript Data Jeffrey Owings 2003-18 Report for Computation of Balanced Repeated Replicate (BRR) Weights for the Third
(NELS88:1994) and Fourth (NELS88:2000) Follow-up Surveys Dennis Carroll
National Household Education Survey (NHES) 95–12 Rural Education Data User’s Guide Samuel Peng 96–13 Estimation of Response Bias in the NHES:95 Adult Education Survey Steven Kaufman 96–14 The 1995 National Household Education Survey: Reinterview Results for the Adult
Education Component Steven Kaufman
96–20 1991 National Household Education Survey (NHES:91) Questionnaires: Screener, Early Childhood Education, and Adult Education
Kathryn Chandler
96–21 1993 National Household Education Survey (NHES:93) Questionnaires: Screener, School Readiness, and School Safety and Discipline
Kathryn Chandler
96–22 1995 National Household Education Survey (NHES:95) Questionnaires: Screener, Early Childhood Program Participation, and Adult Education
Kathryn Chandler
96–29 Undercoverage Bias in Estimates of Characteristics of Adults and 0- to 2-Year-Olds in the 1995 National Household Education Survey (NHES:95)
Kathryn Chandler
96–30 Comparison of Estimates from the 1995 National Household Education Survey (NHES:95)
Kathryn Chandler
97–02 Telephone Coverage Bias and Recorded Interviews in the 1993 National Household Education Survey (NHES:93)
Kathryn Chandler
97–03 1991 and 1995 National Household Education Survey Questionnaires: NHES:91 Screener, NHES:91 Adult Education, NHES:95 Basic Screener, and NHES:95 Adult Education
Kathryn Chandler
97–04 Design, Data Collection, Monitoring, Interview Administration Time, and Data Editing in the 1993 National Household Education Survey (NHES:93)
Kathryn Chandler
97–05 Unit and Item Response, Weighting, and Imputation Procedures in the 1993 National Household Education Survey (NHES:93)
Kathryn Chandler
97–06 Unit and Item Response, Weighting, and Imputation Procedures in the 1995 National Household Education Survey (NHES:95)
Kathryn Chandler
97–08 Design, Data Collection, Interview Timing, and Data Editing in the 1995 National Household Education Survey
Kathryn Chandler
97–19 National Household Education Survey of 1995: Adult Education Course Coding Manual Peter Stowe 97–20 National Household Education Survey of 1995: Adult Education Course Code Merge
Files User’s Guide Peter Stowe
97–25 1996 National Household Education Survey (NHES:96) Questionnaires: Screener/Household and Library, Parent and Family Involvement in Education and Civic Involvement, Youth Civic Involvement, and Adult Civic Involvement
Kathryn Chandler
97–28 Comparison of Estimates in the 1996 National Household Education Survey Kathryn Chandler 97–34 Comparison of Estimates from the 1993 National Household Education Survey Kathryn Chandler 97–35 Design, Data Collection, Interview Administration Time, and Data Editing in the 1996
National Household Education Survey Kathryn Chandler
97–38 Reinterview Results for the Parent and Youth Components of the 1996 National Household Education Survey
Kathryn Chandler

No. Title NCES contact 97–39 Undercoverage Bias in Estimates of Characteristics of Households and Adults in the 1996
National Household Education Survey Kathryn Chandler
97–40 Unit and Item Response Rates, Weighting, and Imputation Procedures in the 1996 National Household Education Survey
Kathryn Chandler
98–03 Adult Education in the 1990s: A Report on the 1991 National Household Education Survey
Peter Stowe
98–10 Adult Education Participation Decisions and Barriers: Review of Conceptual Frameworks and Empirical Studies
Peter Stowe
2002–04 Improving Consistency of Response Categories Across NCES Surveys Marilyn Seastrom
National Longitudinal Study of the High School Class of 1972 (NLS-72) 95–12 Rural Education Data User’s Guide Samuel Peng
2002–04 Improving Consistency of Response Categories Across NCES Surveys Marilyn Seastrom
National Postsecondary Student Aid Study (NPSAS) 96–17 National Postsecondary Student Aid Study: 1996 Field Test Methodology Report Andrew G. Malizio
2000–17 National Postsecondary Student Aid Study:2000 Field Test Methodology Report Andrew G. Malizio 2002–03 National Postsecondary Student Aid Study, 1999–2000 (NPSAS:2000), CATI
Nonresponse Bias Analysis Report. Andrew Malizio
2002–04 Improving Consistency of Response Categories Across NCES Surveys Marilyn Seastrom 2003–20 Imputation Methodology for the National Postsecondary Student Aid Study: 2004 James Griffith
National Study of Postsecondary Faculty (NSOPF) 97–26 Strategies for Improving Accuracy of Postsecondary Faculty Lists Linda Zimbler 98–15 Development of a Prototype System for Accessing Linked NCES Data Steven Kaufman
2000–01 1999 National Study of Postsecondary Faculty (NSOPF:99) Field Test Report Linda Zimbler 2002–04 Improving Consistency of Response Categories Across NCES Surveys Marilyn Seastrom 2002–08 A Profile of Part-time Faculty: Fall 1998 Linda Zimbler
Postsecondary Education Descriptive Analysis Reports (PEDAR) 2000–11 Financial Aid Profile of Graduate Students in Science and Engineering Aurora D’Amico
Private School Universe Survey (PSS) 95–16 Intersurvey Consistency in NCES Private School Surveys Steven Kaufman 95–17 Estimates of Expenditures for Private K–12 Schools Stephen Broughman 96–16 Strategies for Collecting Finance Data from Private Schools Stephen Broughman 96–26 Improving the Coverage of Private Elementary-Secondary Schools Steven Kaufman 96–27 Intersurvey Consistency in NCES Private School Surveys for 1993–94 Steven Kaufman 97–07 The Determinants of Per-Pupil Expenditures in Private Elementary and Secondary
Schools: An Exploratory Analysis Stephen Broughman
97–22 Collection of Private School Finance Data: Development of a Questionnaire Stephen Broughman 98–15 Development of a Prototype System for Accessing Linked NCES Data Steven Kaufman
2000–04 Selected Papers on Education Surveys: Papers Presented at the 1998 and 1999 ASA and 1999 AAPOR Meetings
Dan Kasprzyk
2000–15 Feasibility Report: School-Level Finance Pretest, Private School Questionnaire Stephen Broughman
Progress in International Reading Literacy Study (PIRLS) 2003–05 PIRLS-IEA Reading Literacy Framework: Comparative Analysis of the 1991 IEA
Reading Study and the Progress in International Reading Literacy Study Laurence Ogle
2003-10 A Content Comparison of the NAEP and PIRLS Fourth-Grade Reading Assessments Marilyn Binkley 2003–21 U.S. 2001 PIRLS Nonresponse Bias Analysis Laurence Ogle
Recent College Graduates (RCG) 98–15 Development of a Prototype System for Accessing Linked NCES Data Steven Kaufman
2002–04 Improving Consistency of Response Categories Across NCES Surveys Marilyn Seastrom
Schools and Staffing Survey (SASS) 94–01 Schools and Staffing Survey (SASS) Papers Presented at Meetings of the American
Statistical Association Dan Kasprzyk
94–02 Generalized Variance Estimate for Schools and Staffing Survey (SASS) Dan Kasprzyk 94–03 1991 Schools and Staffing Survey (SASS) Reinterview Response Variance Report Dan Kasprzyk

No. Title NCES contact 94–04 The Accuracy of Teachers’ Self-reports on their Postsecondary Education: Teacher
Transcript Study, Schools and Staffing Survey Dan Kasprzyk
94–06 Six Papers on Teachers from the 1990–91 Schools and Staffing Survey and Other Related Surveys
Dan Kasprzyk
95–01 Schools and Staffing Survey: 1994 Papers Presented at the 1994 Meeting of the American Statistical Association
Dan Kasprzyk
95–02 QED Estimates of the 1990–91 Schools and Staffing Survey: Deriving and Comparing QED School Estimates with CCD Estimates
Dan Kasprzyk
95–03 Schools and Staffing Survey: 1990–91 SASS Cross-Questionnaire Analysis Dan Kasprzyk 95–08 CCD Adjustment to the 1990–91 SASS: A Comparison of Estimates Dan Kasprzyk 95–09 The Results of the 1993 Teacher List Validation Study (TLVS) Dan Kasprzyk 95–10 The Results of the 1991–92 Teacher Follow-up Survey (TFS) Reinterview and Extensive
ReconciliationDan Kasprzyk
95–11 Measuring Instruction, Curriculum Content, and Instructional Resources: The Status of Recent Work
Sharon Bobbitt & John Ralph
95–12 Rural Education Data User’s Guide Samuel Peng 95–14 Empirical Evaluation of Social, Psychological, & Educational Construct Variables Used
in NCES Surveys Samuel Peng
95–15 Classroom Instructional Processes: A Review of Existing Measurement Approaches and Their Applicability for the Teacher Follow-up Survey
Sharon Bobbitt
95–16 Intersurvey Consistency in NCES Private School Surveys Steven Kaufman 95–18 An Agenda for Research on Teachers and Schools: Revisiting NCES’ Schools and
Staffing Survey Dan Kasprzyk
96–01 Methodological Issues in the Study of Teachers’ Careers: Critical Features of a Truly Longitudinal Study
Dan Kasprzyk
96–02 Schools and Staffing Survey (SASS): 1995 Selected papers presented at the 1995 Meeting of the American Statistical Association
Dan Kasprzyk
96–05 Cognitive Research on the Teacher Listing Form for the Schools and Staffing Survey Dan Kasprzyk 96–06 The Schools and Staffing Survey (SASS) for 1998–99: Design Recommendations to
Inform Broad Education Policy Dan Kasprzyk
96–07 Should SASS Measure Instructional Processes and Teacher Effectiveness? Dan Kasprzyk 96–09 Making Data Relevant for Policy Discussions: Redesigning the School Administrator
Questionnaire for the 1998–99 SASS Dan Kasprzyk
96–10 1998–99 Schools and Staffing Survey: Issues Related to Survey Depth Dan Kasprzyk 96–11 Towards an Organizational Database on America’s Schools: A Proposal for the Future of
SASS, with comments on School Reform, Governance, and Finance Dan Kasprzyk
96–12 Predictors of Retention, Transfer, and Attrition of Special and General Education Teachers: Data from the 1989 Teacher Followup Survey
Dan Kasprzyk
96–15 Nested Structures: District-Level Data in the Schools and Staffing Survey Dan Kasprzyk 96–23 Linking Student Data to SASS: Why, When, How Dan Kasprzyk 96–24 National Assessments of Teacher Quality Dan Kasprzyk 96–25 Measures of Inservice Professional Development: Suggested Items for the 1998–1999
Schools and Staffing Survey Dan Kasprzyk
96–28 Student Learning, Teaching Quality, and Professional Development: Theoretical Linkages, Current Measurement, and Recommendations for Future Data Collection
Mary Rollefson
97–01 Selected Papers on Education Surveys: Papers Presented at the 1996 Meeting of the American Statistical Association
Dan Kasprzyk
97–07 The Determinants of Per-Pupil Expenditures in Private Elementary and Secondary Schools: An Exploratory Analysis
Stephen Broughman
97–09 Status of Data on Crime and Violence in Schools: Final Report Lee Hoffman 97–10 Report of Cognitive Research on the Public and Private School Teacher Questionnaires
for the Schools and Staffing Survey 1993–94 School Year Dan Kasprzyk
97–11 International Comparisons of Inservice Professional Development Dan Kasprzyk 97–12 Measuring School Reform: Recommendations for Future SASS Data Collection Mary Rollefson 97–14 Optimal Choice of Periodicities for the Schools and Staffing Survey: Modeling and
Analysis Steven Kaufman
97–18 Improving the Mail Return Rates of SASS Surveys: A Review of the Literature Steven Kaufman 97–22 Collection of Private School Finance Data: Development of a Questionnaire Stephen Broughman 97–23 Further Cognitive Research on the Schools and Staffing Survey (SASS) Teacher Listing
FormDan Kasprzyk

No. Title NCES contact 97–41 Selected Papers on the Schools and Staffing Survey: Papers Presented at the 1997 Meeting
of the American Statistical Association Steve Kaufman
97–42 Improving the Measurement of Staffing Resources at the School Level: The Development of Recommendations for NCES for the Schools and Staffing Survey (SASS)
Mary Rollefson
97–44 Development of a SASS 1993–94 School-Level Student Achievement Subfile: Using State Assessments and State NAEP, Feasibility Study
Michael Ross
98–01 Collection of Public School Expenditure Data: Development of a Questionnaire Stephen Broughman 98–02 Response Variance in the 1993–94 Schools and Staffing Survey: A Reinterview Report Steven Kaufman 98–04 Geographic Variations in Public Schools’ Costs William J. Fowler, Jr. 98–05 SASS Documentation: 1993–94 SASS Student Sampling Problems; Solutions for
Determining the Numerators for the SASS Private School (3B) Second-Stage Factors Steven Kaufman
98–08 The Redesign of the Schools and Staffing Survey for 1999–2000: A Position Paper Dan Kasprzyk 98–12 A Bootstrap Variance Estimator for Systematic PPS Sampling Steven Kaufman 98–13 Response Variance in the 1994–95 Teacher Follow-up Survey Steven Kaufman 98–14 Variance Estimation of Imputed Survey Data Steven Kaufman 98–15 Development of a Prototype System for Accessing Linked NCES Data Steven Kaufman 98–16 A Feasibility Study of Longitudinal Design for Schools and Staffing Survey Stephen Broughman
1999–02 Tracking Secondary Use of the Schools and Staffing Survey Data: Preliminary Results Dan Kasprzyk 1999–04 Measuring Teacher Qualifications Dan Kasprzyk 1999–07 Collection of Resource and Expenditure Data on the Schools and Staffing Survey Stephen Broughman 1999–08 Measuring Classroom Instructional Processes: Using Survey and Case Study Fieldtest
Results to Improve Item Construction Dan Kasprzyk
1999–10 What Users Say About Schools and Staffing Survey Publications Dan Kasprzyk 1999–12 1993–94 Schools and Staffing Survey: Data File User’s Manual, Volume III: Public-Use
CodebookKerry Gruber
1999–13 1993–94 Schools and Staffing Survey: Data File User’s Manual, Volume IV: Bureau of Indian Affairs (BIA) Restricted-Use Codebook
Kerry Gruber
1999–14 1994–95 Teacher Followup Survey: Data File User’s Manual, Restricted-Use Codebook Kerry Gruber 1999–17 Secondary Use of the Schools and Staffing Survey Data Susan Wiley 2000–04 Selected Papers on Education Surveys: Papers Presented at the 1998 and 1999 ASA and
1999 AAPOR Meetings Dan Kasprzyk
2000–10 A Research Agenda for the 1999–2000 Schools and Staffing Survey Dan Kasprzyk 2000–13 Non-professional Staff in the Schools and Staffing Survey (SASS) and Common Core of
Data (CCD) Kerry Gruber
2000–18 Feasibility Report: School-Level Finance Pretest, Public School District Questionnaire Stephen Broughman 2002–04 Improving Consistency of Response Categories Across NCES Surveys Marilyn Seastrom
Third International Mathematics and Science Study (TIMSS)2001–01 Cross-National Variation in Educational Preparation for Adulthood: From Early
Adolescence to Young Adulthood Elvira Hausken
2001–05 Using TIMSS to Analyze Correlates of Performance Variation in Mathematics Patrick Gonzales 2001–07 A Comparison of the National Assessment of Educational Progress (NAEP), the Third
International Mathematics and Science Study Repeat (TIMSS-R), and the Programme for International Student Assessment (PISA)
Arnold Goldstein
2002–01 Legal and Ethical Issues in the Use of Video in Education Research Patrick Gonzales
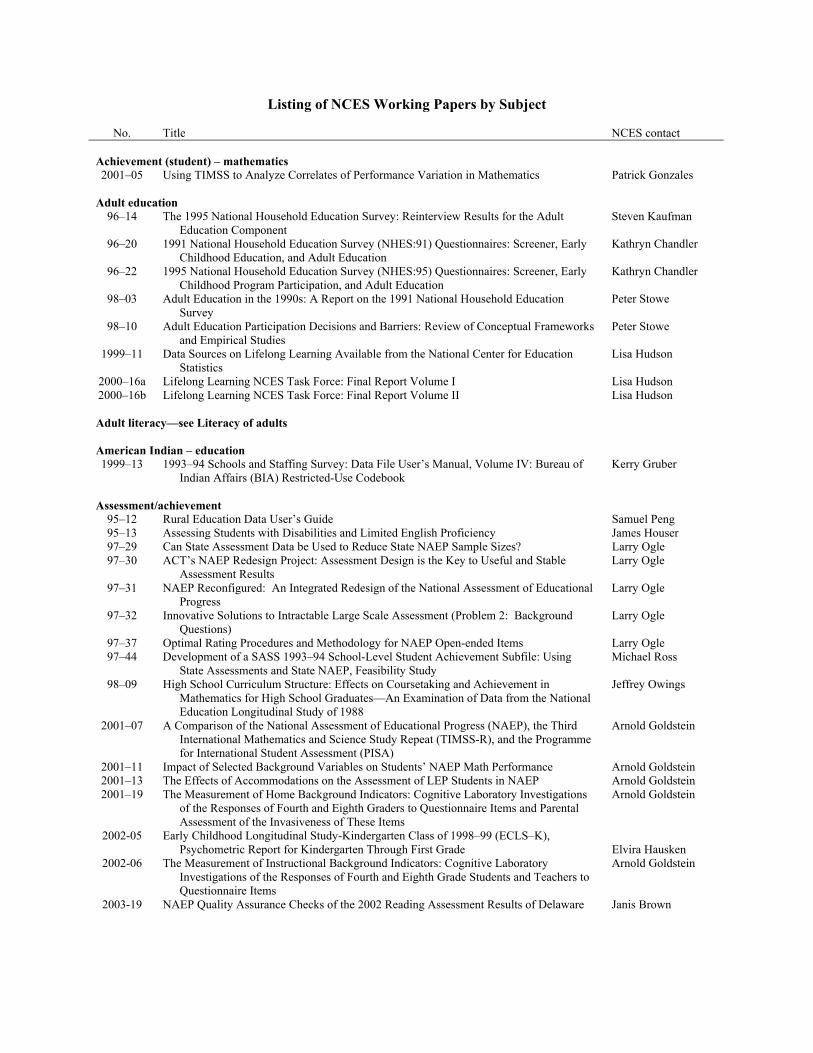
Listing of NCES Working Papers by Subject
No. Title NCES contact
Achievement (student) – mathematics 2001–05 Using TIMSS to Analyze Correlates of Performance Variation in Mathematics Patrick Gonzales
Adult education 96–14 The 1995 National Household Education Survey: Reinterview Results for the Adult
Education Component Steven Kaufman
96–20 1991 National Household Education Survey (NHES:91) Questionnaires: Screener, Early Childhood Education, and Adult Education
Kathryn Chandler
96–22 1995 National Household Education Survey (NHES:95) Questionnaires: Screener, Early Childhood Program Participation, and Adult Education
Kathryn Chandler
98–03 Adult Education in the 1990s: A Report on the 1991 National Household Education Survey
Peter Stowe
98–10 Adult Education Participation Decisions and Barriers: Review of Conceptual Frameworks and Empirical Studies
Peter Stowe
1999–11 Data Sources on Lifelong Learning Available from the National Center for Education Statistics
Lisa Hudson
2000–16a Lifelong Learning NCES Task Force: Final Report Volume I Lisa Hudson 2000–16b Lifelong Learning NCES Task Force: Final Report Volume II Lisa Hudson
Adult literacy—see Literacy of adults
American Indian – education 1999–13 1993–94 Schools and Staffing Survey: Data File User’s Manual, Volume IV: Bureau of
Indian Affairs (BIA) Restricted-Use Codebook Kerry Gruber
Assessment/achievement 95–12 Rural Education Data User’s Guide Samuel Peng 95–13 Assessing Students with Disabilities and Limited English Proficiency James Houser 97–29 Can State Assessment Data be Used to Reduce State NAEP Sample Sizes? Larry Ogle 97–30 ACT’s NAEP Redesign Project: Assessment Design is the Key to Useful and Stable
Assessment Results Larry Ogle
97–31 NAEP Reconfigured: An Integrated Redesign of the National Assessment of Educational Progress
Larry Ogle
97–32 Innovative Solutions to Intractable Large Scale Assessment (Problem 2: Background Questions)
Larry Ogle
97–37 Optimal Rating Procedures and Methodology for NAEP Open-ended Items Larry Ogle 97–44 Development of a SASS 1993–94 School-Level Student Achievement Subfile: Using
State Assessments and State NAEP, Feasibility Study Michael Ross
98–09 High School Curriculum Structure: Effects on Coursetaking and Achievement in Mathematics for High School Graduates—An Examination of Data from the National Education Longitudinal Study of 1988
Jeffrey Owings
2001–07 A Comparison of the National Assessment of Educational Progress (NAEP), the Third International Mathematics and Science Study Repeat (TIMSS-R), and the Programme for International Student Assessment (PISA)
Arnold Goldstein
2001–11 Impact of Selected Background Variables on Students’ NAEP Math Performance Arnold Goldstein 2001–13 The Effects of Accommodations on the Assessment of LEP Students in NAEP Arnold Goldstein 2001–19 The Measurement of Home Background Indicators: Cognitive Laboratory Investigations
of the Responses of Fourth and Eighth Graders to Questionnaire Items and Parental Assessment of the Invasiveness of These Items
Arnold Goldstein
2002-05 Early Childhood Longitudinal Study-Kindergarten Class of 1998–99 (ECLS–K), Psychometric Report for Kindergarten Through First Grade Elvira Hausken
2002-06 The Measurement of Instructional Background Indicators: Cognitive Laboratory Investigations of the Responses of Fourth and Eighth Grade Students and Teachers to Questionnaire Items
Arnold Goldstein
2003-19 NAEP Quality Assurance Checks of the 2002 Reading Assessment Results of Delaware Janis Brown

No. Title NCES contact
Beginning students in postsecondary education 98–11 Beginning Postsecondary Students Longitudinal Study First Follow-up (BPS:96–98) Field
Test Report Aurora D’Amico
2001–04 Beginning Postsecondary Students Longitudinal Study: 1996–2001 (BPS:1996/2001) Field Test Methodology Report
Paula Knepper
Civic participation 97–25 1996 National Household Education Survey (NHES:96) Questionnaires:
Screener/Household and Library, Parent and Family Involvement in Education and Civic Involvement, Youth Civic Involvement, and Adult Civic Involvement
Kathryn Chandler
Climate of schools 95–14 Empirical Evaluation of Social, Psychological, & Educational Construct Variables Used
in NCES Surveys Samuel Peng
Cost of education indices94–05 Cost-of-Education Differentials Across the States William J. Fowler, Jr.
Course-taking 95–12 Rural Education Data User’s Guide Samuel Peng 98–09 High School Curriculum Structure: Effects on Coursetaking and Achievement in
Mathematics for High School Graduates—An Examination of Data from the National Education Longitudinal Study of 1988
Jeffrey Owings
1999–05 Procedures Guide for Transcript Studies Dawn Nelson 1999–06 1998 Revision of the Secondary School Taxonomy Dawn Nelson 2003–01 Mathematics, Foreign Language, and Science Coursetaking and the NELS:88 Transcript
DataJeffrey Owings
2003–02 English Coursetaking and the NELS:88 Transcript Data Jeffrey Owings
Crime97–09 Status of Data on Crime and Violence in Schools: Final Report Lee Hoffman
Curriculum 95–11 Measuring Instruction, Curriculum Content, and Instructional Resources: The Status of
Recent Work Sharon Bobbitt &
John Ralph 98–09 High School Curriculum Structure: Effects on Coursetaking and Achievement in
Mathematics for High School Graduates—An Examination of Data from the National Education Longitudinal Study of 1988
Jeffrey Owings
Customer service 1999–10 What Users Say About Schools and Staffing Survey Publications Dan Kasprzyk 2000–02 Coordinating NCES Surveys: Options, Issues, Challenges, and Next Steps Valena Plisko 2000–04 Selected Papers on Education Surveys: Papers Presented at the 1998 and 1999 ASA and
1999 AAPOR Meetings Dan Kasprzyk
Data quality 97–13 Improving Data Quality in NCES: Database-to-Report Process Susan Ahmed
2001–11 Impact of Selected Background Variables on Students’ NAEP Math Performance Arnold Goldstein 2001–13 The Effects of Accommodations on the Assessment of LEP Students in NAEP Arnold Goldstein 2001–19 The Measurement of Home Background Indicators: Cognitive Laboratory Investigations
of the Responses of Fourth and Eighth Graders to Questionnaire Items and Parental Assessment of the Invasiveness of These Items
Arnold Goldstein
2002-06 The Measurement of Instructional Background Indicators: Cognitive Laboratory Investigations of the Responses of Fourth and Eighth Grade Students and Teachers to Questionnaire Items
Arnold Goldstein
2003-19 NAEP Quality Assurance Checks of the 2002 Reading Assessment Results of Delaware Janis Brown
Data warehouse 2000–04 Selected Papers on Education Surveys: Papers Presented at the 1998 and 1999 ASA and
1999 AAPOR Meetings Dan Kasprzyk

No. Title NCES contact
Design effects 2000–03 Strengths and Limitations of Using SUDAAN, Stata, and WesVarPC for Computing
Variances from NCES Data Sets Ralph Lee
Dropout rates, high school 95–07 National Education Longitudinal Study of 1988: Conducting Trend Analyses HS&B and
NELS:88 Sophomore Cohort Dropouts Jeffrey Owings
Early childhood education96–20 1991 National Household Education Survey (NHES:91) Questionnaires: Screener, Early
Childhood Education, and Adult Education Kathryn Chandler
96–22 1995 National Household Education Survey (NHES:95) Questionnaires: Screener, Early Childhood Program Participation, and Adult Education
Kathryn Chandler
97–24 Formulating a Design for the ECLS: A Review of Longitudinal Studies Jerry West 97–36 Measuring the Quality of Program Environments in Head Start and Other Early Childhood
Programs: A Review and Recommendations for Future Research Jerry West
1999–01 A Birth Cohort Study: Conceptual and Design Considerations and Rationale Jerry West 2001–02 Measuring Father Involvement in Young Children's Lives: Recommendations for a
Fatherhood Module for the ECLS-B Jerry West
2001–03 Measures of Socio-Emotional Development in Middle School Elvira Hausken 2001–06 Papers from the Early Childhood Longitudinal Studies Program: Presented at the 2001
AERA and SRCD Meetings Jerry West
2002-05 Early Childhood Longitudinal Study-Kindergarten Class of 1998–99 (ECLS–K), Psychometric Report for Kindergarten Through First Grade
Elvira Hausken
Educational attainment 98–11 Beginning Postsecondary Students Longitudinal Study First Follow-up (BPS:96–98) Field
Test Report Aurora D’Amico
2001–15 Baccalaureate and Beyond Longitudinal Study: 2000/01 Follow-Up Field Test Methodology Report
Andrew G. Malizio
Educational research 2000–02 Coordinating NCES Surveys: Options, Issues, Challenges, and Next Steps Valena Plisko 2002–01 Legal and Ethical Issues in the Use of Video in Education Research Patrick Gonzales
Eighth-graders 2001–05 Using TIMSS to Analyze Correlates of Performance Variation in Mathematics Patrick Gonzales
Employment 96–03 National Education Longitudinal Study of 1988 (NELS:88) Research Framework and Issues Jeffrey Owings 98–11 Beginning Postsecondary Students Longitudinal Study First Follow-up (BPS:96–98) Field
Test Report Aurora D’Amico
2000–16a Lifelong Learning NCES Task Force: Final Report Volume I Lisa Hudson 2000–16b Lifelong Learning NCES Task Force: Final Report Volume II Lisa Hudson 2001–01 Cross-National Variation in Educational Preparation for Adulthood: From Early
Adolescence to Young Adulthood Elvira Hausken
Employment – after college 2001–15 Baccalaureate and Beyond Longitudinal Study: 2000/01 Follow-Up Field Test
Methodology Report Andrew G. Malizio
Engineering 2000–11 Financial Aid Profile of Graduate Students in Science and Engineering Aurora D’Amico
Enrollment – after college2001–15 Baccalaureate and Beyond Longitudinal Study: 2000/01 Follow-Up Field Test
Methodology Report Andrew G. Malizio
Faculty – higher education 97–26 Strategies for Improving Accuracy of Postsecondary Faculty Lists Linda Zimbler

No. Title NCES contact 2000–01 1999 National Study of Postsecondary Faculty (NSOPF:99) Field Test Report Linda Zimbler 2002–08 A Profile of Part-time Faculty: Fall 1998 Linda Zimbler
Fathers – role in education 2001–02 Measuring Father Involvement in Young Children's Lives: Recommendations for a
Fatherhood Module for the ECLS-B Jerry West
Finance – elementary and secondary schools 94–05 Cost-of-Education Differentials Across the States William J. Fowler, Jr. 96–19 Assessment and Analysis of School-Level Expenditures William J. Fowler, Jr. 98–01 Collection of Public School Expenditure Data: Development of a Questionnaire Stephen Broughman
1999–07 Collection of Resource and Expenditure Data on the Schools and Staffing Survey Stephen Broughman 1999–16 Measuring Resources in Education: From Accounting to the Resource Cost Model
ApproachWilliam J. Fowler, Jr.
2000–18 Feasibility Report: School-Level Finance Pretest, Public School District Questionnaire Stephen Broughman
Finance – postsecondary 97–27 Pilot Test of IPEDS Finance Survey Peter Stowe
2000–14 IPEDS Finance Data Comparisons Under the 1997 Financial Accounting Standards for Private, Not-for-Profit Institutes: A Concept Paper
Peter Stowe
Finance – private schools 95–17 Estimates of Expenditures for Private K–12 Schools Stephen Broughman 96–16 Strategies for Collecting Finance Data from Private Schools Stephen Broughman 97–07 The Determinants of Per-Pupil Expenditures in Private Elementary and Secondary
Schools: An Exploratory Analysis Stephen Broughman
97–22 Collection of Private School Finance Data: Development of a Questionnaire Stephen Broughman 1999–07 Collection of Resource and Expenditure Data on the Schools and Staffing Survey Stephen Broughman 2000–15 Feasibility Report: School-Level Finance Pretest, Private School Questionnaire Stephen Broughman
Geography 98–04 Geographic Variations in Public Schools’ Costs William J. Fowler, Jr.
Graduate students 2000–11 Financial Aid Profile of Graduate Students in Science and Engineering Aurora D’Amico
Graduates of postsecondary education2001–15 Baccalaureate and Beyond Longitudinal Study: 2000/01 Follow-Up Field Test
Methodology Report Andrew G. Malizio
Imputation2000–04 Selected Papers on Education Surveys: Papers Presented at the 1998 and 1999 ASA and
1999 AAPOR Meeting Dan Kasprzyk
2001–10 Comparison of Proc Impute and Schafer’s Multiple Imputation Software Sam Peng 2001–16 Imputation of Test Scores in the National Education Longitudinal Study of 1988 Ralph Lee 2001–17 A Study of Imputation Algorithms Ralph Lee 2001–18 A Study of Variance Estimation Methods Ralph Lee 2003–20 Imputation Methodology for the National Postsecondary Student Aid Study: 2004 James Griffith
Inflation97–43 Measuring Inflation in Public School Costs William J. Fowler, Jr.
Institution data 2000–01 1999 National Study of Postsecondary Faculty (NSOPF:99) Field Test Report Linda Zimbler
Instructional resources and practices 95–11 Measuring Instruction, Curriculum Content, and Instructional Resources: The Status of
Recent Work Sharon Bobbitt & John Ralph
1999–08 Measuring Classroom Instructional Processes: Using Survey and Case Study Field Test Results to Improve Item Construction
Dan Kasprzyk

No. Title NCES contact
International comparisons 97–11 International Comparisons of Inservice Professional Development Dan Kasprzyk 97–16 International Education Expenditure Comparability Study: Final Report, Volume I Shelley Burns 97–17 International Education Expenditure Comparability Study: Final Report, Volume II,
Quantitative Analysis of Expenditure Comparability Shelley Burns
2001–01 Cross-National Variation in Educational Preparation for Adulthood: From Early Adolescence to Young Adulthood
Elvira Hausken
2001–07 A Comparison of the National Assessment of Educational Progress (NAEP), the Third International Mathematics and Science Study Repeat (TIMSS-R), and the Programme for International Student Assessment (PISA)
Arnold Goldstein
International comparisons – math and science achievement2001–05 Using TIMSS to Analyze Correlates of Performance Variation in Mathematics Patrick Gonzales
Libraries94–07 Data Comparability and Public Policy: New Interest in Public Library Data Papers
Presented at Meetings of the American Statistical Association Carrol Kindel
97–25 1996 National Household Education Survey (NHES:96) Questionnaires: Screener/Household and Library, Parent and Family Involvement in Education and Civic Involvement, Youth Civic Involvement, and Adult Civic Involvement
Kathryn Chandler
Limited English Proficiency95–13 Assessing Students with Disabilities and Limited English Proficiency James Houser
2001–11 Impact of Selected Background Variables on Students’ NAEP Math Performance Arnold Goldstein 2001–13 The Effects of Accommodations on the Assessment of LEP Students in NAEP Arnold Goldstein
Literacy of adults 98–17 Developing the National Assessment of Adult Literacy: Recommendations from
Stakeholders Sheida White
1999–09a 1992 National Adult Literacy Survey: An Overview Alex Sedlacek 1999–09b 1992 National Adult Literacy Survey: Sample Design Alex Sedlacek 1999–09c 1992 National Adult Literacy Survey: Weighting and Population Estimates Alex Sedlacek 1999–09d 1992 National Adult Literacy Survey: Development of the Survey Instruments Alex Sedlacek 1999–09e 1992 National Adult Literacy Survey: Scaling and Proficiency Estimates Alex Sedlacek 1999–09f 1992 National Adult Literacy Survey: Interpreting the Adult Literacy Scales and Literacy
LevelsAlex Sedlacek
1999–09g 1992 National Adult Literacy Survey: Literacy Levels and the Response Probability Convention
Alex Sedlacek
1999–11 Data Sources on Lifelong Learning Available from the National Center for Education Statistics
Lisa Hudson
2000–05 Secondary Statistical Modeling With the National Assessment of Adult Literacy: Implications for the Design of the Background Questionnaire
Sheida White
2000–06 Using Telephone and Mail Surveys as a Supplement or Alternative to Door-to-Door Surveys in the Assessment of Adult Literacy
Sheida White
2000–07 “How Much Literacy is Enough?” Issues in Defining and Reporting Performance Standards for the National Assessment of Adult Literacy
Sheida White
2000–08 Evaluation of the 1992 NALS Background Survey Questionnaire: An Analysis of Uses with Recommendations for Revisions
Sheida White
2000–09 Demographic Changes and Literacy Development in a Decade Sheida White 2001–08 Assessing the Lexile Framework: Results of a Panel Meeting Sheida White
Literacy of adults – international 97–33 Adult Literacy: An International Perspective Marilyn Binkley
Mathematics98–09 High School Curriculum Structure: Effects on Coursetaking and Achievement in
Mathematics for High School Graduates—An Examination of Data from the National Education Longitudinal Study of 1988
Jeffrey Owings
1999–08 Measuring Classroom Instructional Processes: Using Survey and Case Study Field Test Results to Improve Item Construction
Dan Kasprzyk

No. Title NCES contact 2001–05 Using TIMSS to Analyze Correlates of Performance Variation in Mathematics Patrick Gonzales 2001–07 A Comparison of the National Assessment of Educational Progress (NAEP), the Third
International Mathematics and Science Study Repeat (TIMSS-R), and the Programme for International Student Assessment (PISA)
Arnold Goldstein
2001–11 Impact of Selected Background Variables on Students’ NAEP Math Performance Arnold Goldstein 2002-06 The Measurement of Instructional Background Indicators: Cognitive Laboratory
Investigations of the Responses of Fourth and Eighth Grade Students and Teachers to Questionnaire Items
Parental involvement in education 96–03 National Education Longitudinal Study of 1988 (NELS:88) Research Framework and
Issues Jeffrey Owings
97–25 1996 National Household Education Survey (NHES:96) Questionnaires: Screener/Household and Library, Parent and Family Involvement in Education and Civic Involvement, Youth Civic Involvement, and Adult Civic Involvement
Kathryn Chandler
1999–01 A Birth Cohort Study: Conceptual and Design Considerations and Rationale Jerry West 2001–06 Papers from the Early Childhood Longitudinal Studies Program: Presented at the 2001
AERA and SRCD Meetings Jerry West
2001–19 The Measurement of Home Background Indicators: Cognitive Laboratory Investigations of the Responses of Fourth and Eighth Graders to Questionnaire Items and Parental Assessment of the Invasiveness of These Items
Arnold Goldstein
Participation rates 98–10 Adult Education Participation Decisions and Barriers: Review of Conceptual Frameworks
and Empirical Studies Peter Stowe
Postsecondary education 1999–11 Data Sources on Lifelong Learning Available from the National Center for Education
Statistics Lisa Hudson
2000–16a Lifelong Learning NCES Task Force: Final Report Volume I Lisa Hudson 2000–16b Lifelong Learning NCES Task Force: Final Report Volume II Lisa Hudson 2003–20 Imputation Methodology for the National Postsecondary Student Aid Study: 2004 James Griffith
Postsecondary education – persistence and attainment 98–11 Beginning Postsecondary Students Longitudinal Study First Follow-up (BPS:96–98) Field
Test Report Aurora D’Amico
1999–15 Projected Postsecondary Outcomes of 1992 High School Graduates Aurora D’Amico
Postsecondary education – staff 97–26 Strategies for Improving Accuracy of Postsecondary Faculty Lists Linda Zimbler
2000–01 1999 National Study of Postsecondary Faculty (NSOPF:99) Field Test Report Linda Zimbler 2002–08 A Profile of Part-time Faculty: Fall 1998 Linda Zimbler
Principals2000–10 A Research Agenda for the 1999–2000 Schools and Staffing Survey Dan Kasprzyk
Private schools 96–16 Strategies for Collecting Finance Data from Private Schools Stephen Broughman 97–07 The Determinants of Per-Pupil Expenditures in Private Elementary and Secondary
Schools: An Exploratory Analysis Stephen Broughman
97–22 Collection of Private School Finance Data: Development of a Questionnaire Stephen Broughman 2000–13 Non-professional Staff in the Schools and Staffing Survey (SASS) and Common Core of
Data (CCD) Kerry Gruber
2000–15 Feasibility Report: School-Level Finance Pretest, Private School Questionnaire Stephen Broughman
Projections of education statistics 1999–15 Projected Postsecondary Outcomes of 1992 High School Graduates Aurora D’Amico
Public school finance 1999–16 Measuring Resources in Education: From Accounting to the Resource Cost Model Approach William J. Fowler, Jr. 2000–18 Feasibility Report: School-Level Finance Pretest, Public School District Questionnaire Stephen Broughman
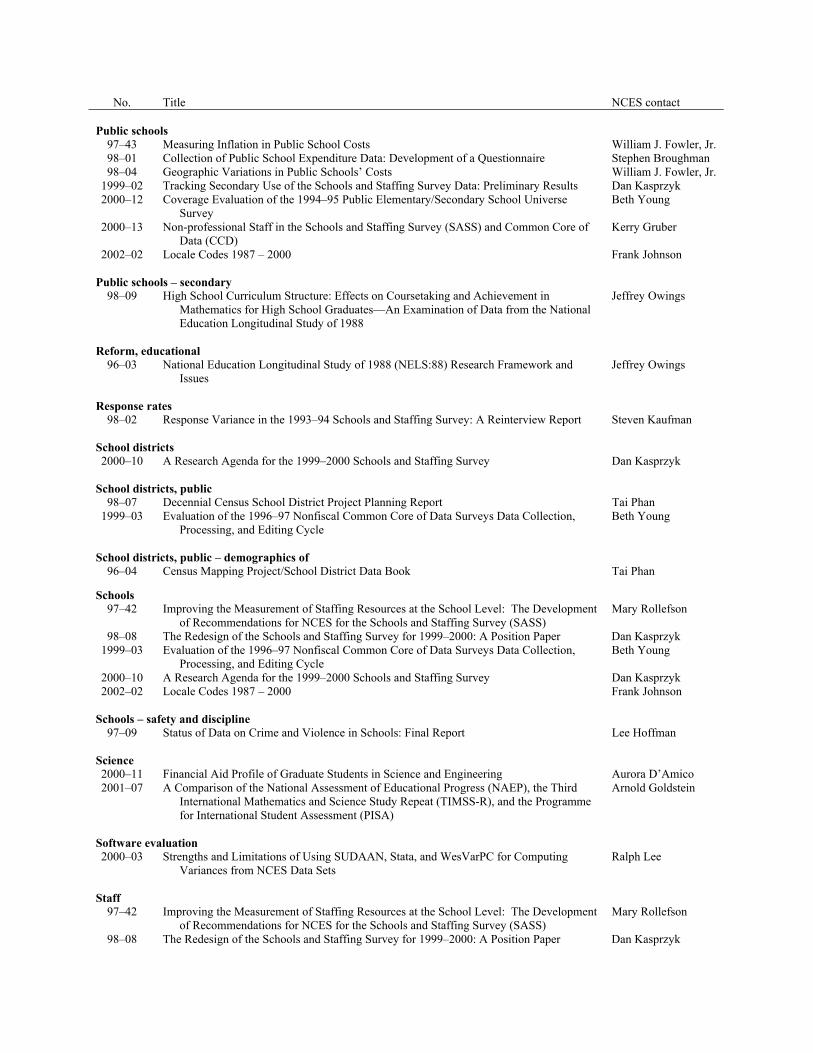
No. Title NCES contact
Public schools 97–43 Measuring Inflation in Public School Costs William J. Fowler, Jr. 98–01 Collection of Public School Expenditure Data: Development of a Questionnaire Stephen Broughman 98–04 Geographic Variations in Public Schools’ Costs William J. Fowler, Jr.
1999–02 Tracking Secondary Use of the Schools and Staffing Survey Data: Preliminary Results Dan Kasprzyk 2000–12 Coverage Evaluation of the 1994–95 Public Elementary/Secondary School Universe
Survey Beth Young
2000–13 Non-professional Staff in the Schools and Staffing Survey (SASS) and Common Core of Data (CCD)
Kerry Gruber
2002–02 Locale Codes 1987 – 2000 Frank Johnson
Public schools – secondary 98–09 High School Curriculum Structure: Effects on Coursetaking and Achievement in
Mathematics for High School Graduates—An Examination of Data from the National Education Longitudinal Study of 1988
Jeffrey Owings
Reform, educational 96–03 National Education Longitudinal Study of 1988 (NELS:88) Research Framework and
Issues Jeffrey Owings
Response rates 98–02 Response Variance in the 1993–94 Schools and Staffing Survey: A Reinterview Report Steven Kaufman
School districts 2000–10 A Research Agenda for the 1999–2000 Schools and Staffing Survey Dan Kasprzyk
School districts, public 98–07 Decennial Census School District Project Planning Report Tai Phan
1999–03 Evaluation of the 1996–97 Nonfiscal Common Core of Data Surveys Data Collection, Processing, and Editing Cycle
Beth Young
School districts, public – demographics of96–04 Census Mapping Project/School District Data Book Tai Phan
Schools 97–42 Improving the Measurement of Staffing Resources at the School Level: The Development
of Recommendations for NCES for the Schools and Staffing Survey (SASS) Mary Rollefson
98–08 The Redesign of the Schools and Staffing Survey for 1999–2000: A Position Paper Dan Kasprzyk 1999–03 Evaluation of the 1996–97 Nonfiscal Common Core of Data Surveys Data Collection,
Processing, and Editing Cycle Beth Young
2000–10 A Research Agenda for the 1999–2000 Schools and Staffing Survey Dan Kasprzyk 2002–02 Locale Codes 1987 – 2000 Frank Johnson
Schools – safety and discipline 97–09 Status of Data on Crime and Violence in Schools: Final Report Lee Hoffman
Science 2000–11 Financial Aid Profile of Graduate Students in Science and Engineering Aurora D’Amico 2001–07 A Comparison of the National Assessment of Educational Progress (NAEP), the Third
International Mathematics and Science Study Repeat (TIMSS-R), and the Programme for International Student Assessment (PISA)
Arnold Goldstein
Software evaluation 2000–03 Strengths and Limitations of Using SUDAAN, Stata, and WesVarPC for Computing
Variances from NCES Data Sets Ralph Lee
Staff97–42 Improving the Measurement of Staffing Resources at the School Level: The Development
of Recommendations for NCES for the Schools and Staffing Survey (SASS) Mary Rollefson
98–08 The Redesign of the Schools and Staffing Survey for 1999–2000: A Position Paper Dan Kasprzyk

No. Title NCES contact
Staff – higher education institutions 97–26 Strategies for Improving Accuracy of Postsecondary Faculty Lists Linda Zimbler
2002–08 A Profile of Part-time Faculty: Fall 1998 Linda Zimbler
Staff – nonprofessional 2000–13 Non-professional Staff in the Schools and Staffing Survey (SASS) and Common Core of
Data (CCD) Kerry Gruber
State1999–03 Evaluation of the 1996–97 Nonfiscal Common Core of Data Surveys Data Collection,
Processing, and Editing Cycle Beth Young
2003-19 NAEP Quality Assurance Checks of the 2002 Reading Assessment Results of Delaware Janis Brown
Statistical methodology97–21 Statistics for Policymakers or Everything You Wanted to Know About Statistics But
Thought You Could Never Understand Susan Ahmed
2003–20 Imputation Methodology for the National Postsecondary Student Aid Study: 2004 James Griffith
Statistical standards and methodology 2001–05 Using TIMSS to Analyze Correlates of Performance Variation in Mathematics Patrick Gonzales 2002–04 Improving Consistency of Response Categories Across NCES Surveys Marilyn Seastrom
Students with disabilities95–13 Assessing Students with Disabilities and Limited English Proficiency James Houser
2001–13 The Effects of Accommodations on the Assessment of LEP Students in NAEP Arnold Goldstein
Survey methodology 96–17 National Postsecondary Student Aid Study: 1996 Field Test Methodology Report Andrew G. Malizio 97–15 Customer Service Survey: Common Core of Data Coordinators Lee Hoffman 97–35 Design, Data Collection, Interview Administration Time, and Data Editing in the 1996
National Household Education Survey Kathryn Chandler
98–06 National Education Longitudinal Study of 1988 (NELS:88) Base Year through Second Follow-Up: Final Methodology Report
Ralph Lee
98–11 Beginning Postsecondary Students Longitudinal Study First Follow-up (BPS:96–98) Field Test Report
Aurora D’Amico
98–16 A Feasibility Study of Longitudinal Design for Schools and Staffing Survey Stephen Broughman 1999–07 Collection of Resource and Expenditure Data on the Schools and Staffing Survey Stephen Broughman 1999–17 Secondary Use of the Schools and Staffing Survey Data Susan Wiley 2000–01 1999 National Study of Postsecondary Faculty (NSOPF:99) Field Test Report Linda Zimbler 2000–02 Coordinating NCES Surveys: Options, Issues, Challenges, and Next Steps Valena Plisko 2000–04 Selected Papers on Education Surveys: Papers Presented at the 1998 and 1999 ASA and
1999 AAPOR Meetings Dan Kasprzyk
2000–12 Coverage Evaluation of the 1994–95 Public Elementary/Secondary School Universe Survey
Beth Young
2000–17 National Postsecondary Student Aid Study:2000 Field Test Methodology Report Andrew G. Malizio 2001–04 Beginning Postsecondary Students Longitudinal Study: 1996–2001 (BPS:1996/2001)
Field Test Methodology Report Paula Knepper
2001–07 A Comparison of the National Assessment of Educational Progress (NAEP), the Third International Mathematics and Science Study Repeat (TIMSS-R), and the Programme for International Student Assessment (PISA)
Arnold Goldstein
2001–11 Impact of Selected Background Variables on Students’ NAEP Math Performance Arnold Goldstein 2001–13 The Effects of Accommodations on the Assessment of LEP Students in NAEP Arnold Goldstein 2001–19 The Measurement of Home Background Indicators: Cognitive Laboratory Investigations
of the Responses of Fourth and Eighth Graders to Questionnaire Items and Parental Assessment of the Invasiveness of These Items
Arnold Goldstein
2002–01 Legal and Ethical Issues in the Use of Video in Education Research Patrick Gonzales 2002–02 Locale Codes 1987 – 2000 Frank Johnson 2002–03 National Postsecondary Student Aid Study, 1999–2000 (NPSAS:2000), CATI
Nonresponse Bias Analysis Report. Andrew Malizio

No. Title NCES contact 2002-06 The Measurement of Instructional Background Indicators: Cognitive Laboratory
Investigations of the Responses of Fourth and Eighth Grade Students and Teachers to Questionnaire Items
Arnold Goldstein
2003-03 Education Longitudinal Study of 2002 Base Year Field Test Report Jeffrey Owings 2003–21 U.S. 2001 PIRLS Nonresponse Bias Analysis Laurence Ogle
Teachers 98–13 Response Variance in the 1994–95 Teacher Follow-up Survey Steven Kaufman
1999–14 1994–95 Teacher Followup Survey: Data File User’s Manual, Restricted-Use Codebook Kerry Gruber 2000–10 A Research Agenda for the 1999–2000 Schools and Staffing Survey Dan Kasprzyk
Teachers – instructional practices of 98–08 The Redesign of the Schools and Staffing Survey for 1999–2000: A Position Paper Dan Kasprzyk
2002-06 The Measurement of Instructional Background Indicators: Cognitive Laboratory Investigations of the Responses of Fourth and Eighth Grade Students and Teachers to Questionnaire Items
Arnold Goldstein
Teachers – opinions regarding safety 98–08 The Redesign of the Schools and Staffing Survey for 1999–2000: A Position Paper Dan Kasprzyk
Teachers – performance evaluations 1999–04 Measuring Teacher Qualifications Dan Kasprzyk
Teachers – qualifications of 1999–04 Measuring Teacher Qualifications Dan Kasprzyk
Teachers – salaries of94–05 Cost-of-Education Differentials Across the States William J. Fowler, Jr.
Training 2000–16a Lifelong Learning NCES Task Force: Final Report Volume I Lisa Hudson 2000–16b Lifelong Learning NCES Task Force: Final Report Volume II Lisa Hudson
Variance estimation 2000–03 Strengths and Limitations of Using SUDAAN, Stata, and WesVarPC for Computing
Variances from NCES Data Sets Ralph Lee
2000–04 Selected Papers on Education Surveys: Papers Presented at the 1998 and 1999 ASA and 1999 AAPOR Meetings
Dan Kasprzyk
2001–18 A Study of Variance Estimation Methods Ralph Lee 2003-18 Report for Computation of Balanced Repeated Replicate (BRR) Weights for the Third
(NELS88:1994) and Fourth (NELS88:2000) Follow-up Surveys Dennis Carroll
2003–20 Imputation Methodology for the National Postsecondary Student Aid Study: 2004 James Griffith
Violence 97–09 Status of Data on Crime and Violence in Schools: Final Report Lee Hoffman
Vocational education 95–12 Rural Education Data User’s Guide Samuel Peng
1999–05 Procedures Guide for Transcript Studies Dawn Nelson 1999–06 1998 Revision of the Secondary School Taxonomy Dawn Nelson