UNDERGRADUATE OCEANOGRAPHIC RESEARCH: A LONGITUDINAL TRANSECT OF PUGET SOUND MAY 2002 AND HISTORICAL...
21
1 UNDERGRADUATE OCEANOGRAPHIC RESEARCH: A LONGITUDINAL TRANSECT OF PUGET SOUND MAY 2002 AND HISTORICAL COMPARISON WYNNAE M. OSENGA CYNTHIA TOMKINS CHERYL GREENGROVE UNIVERSITY OF WASHINGTON - TACOMA Abstract During the spring of 2002, undergraduate students at University of Washington, Tacoma and Seattle jointly participated in a survey of Puget Sound aboard the R/V Thompson as part of courses offered at each campus. This provided a unique opportunity to obtain a rare longitudinal transect of hydrographic data extending from 100 nm offshore through the Strait of Juan de Fuca and the Main Basin to the Nisqually Delta. Data collected includes temperature, salinity, dissolved oxygen, fluorescence, and nutrients. We present here our analysis of the vertical and horizontal distribution of these physical and chemical oceanographic properties, as well as an evaluation of temporal characteristics by comparing these parameters with available historical data. Introduction Puget Sound is a fjord that was formed by glaciers during the last ice age. The current formation was shaped only fifteen thousand years ago, which geologically, makes it a young body of water. Puget Sound is essentially an estuary of continental proportions. The circulation patterns are driven by three factors: ocean tides, freshwater inputs, and winds (Ebbesmeyer et al. 2001). Several rivers drain into this complex system of sills, which gives it a unique pattern of water circulation and chemistry. The sills protect the basin by slowing down water exchange from the Pacific Ocean and they also cause upwelling in the water column. Nutrients that are stirred up within the basin and brought in by the rivers make Puget Sound extremely rich in aquatic biodiversity (Strickland 1983). Studies have been done to determine the characteristics of small areas of this system, for example, Admiralty Inlet (Bjorklund 1998) or Possession Sound (Lana 1998), but they only show a small piece of the puzzle.
-
Upload
independent -
Category
Documents
-
view
4 -
download
0
Transcript of UNDERGRADUATE OCEANOGRAPHIC RESEARCH: A LONGITUDINAL TRANSECT OF PUGET SOUND MAY 2002 AND HISTORICAL...

1
UNDERGRADUATE OCEANOGRAPHIC RESEARCH: A LONGITUDINAL TRANSECT OF PUGET SOUND MAY 2002 AND
HISTORICAL COMPARISON
WYNNAE M. OSENGA CYNTHIA TOMKINS
CHERYL GREENGROVE
UNIVERSITY OF WASHINGTON - TACOMA Abstract During the spring of 2002, undergraduate students at University of Washington, Tacoma and Seattle jointly participated in a survey of Puget Sound aboard the R/V Thompson as part of courses offered at each campus. This provided a unique opportunity to obtain a rare longitudinal transect of hydrographic data extending from 100 nm offshore through the Strait of Juan de Fuca and the Main Basin to the Nisqually Delta. Data collected includes temperature, salinity, dissolved oxygen, fluorescence, and nutrients. We present here our analysis of the vertical and horizontal distribution of these physical and chemical oceanographic properties, as well as an evaluation of temporal characteristics by comparing these parameters with available historical data. Introduction
Puget Sound is a fjord that was formed by glaciers during the last ice age. The
current formation was shaped only fifteen thousand years ago, which geologically, makes
it a young body of water. Puget Sound is essentially an estuary of continental
proportions. The circulation patterns are driven by three factors: ocean tides, freshwater
inputs, and winds (Ebbesmeyer et al. 2001). Several rivers drain into this complex
system of sills, which gives it a unique pattern of water circulation and chemistry. The
sills protect the basin by slowing down water exchange from the Pacific Ocean and they
also cause upwelling in the water column. Nutrients that are stirred up within the basin
and brought in by the rivers make Puget Sound extremely rich in aquatic biodiversity
(Strickland 1983). Studies have been done to determine the characteristics of small areas
of this system, for example, Admiralty Inlet (Bjorklund 1998) or Possession Sound (Lana
1998), but they only show a small piece of the puzzle.

2
In May of 2002 the University of Washington Tacoma’s (UWT) Water Resources
and Pollution (TESC 431) class along with University of Washington Seattle’s (UWS)
Field Investigations in Marine Biology (OCEAN/SAFS 351) class spent five days aboard
the R.V. Thomas G. Thompson gathering water property data along a large transect of the
Puget Sound. Figure 1 shows our sampling locations. Our goal was to get an overall
look at how the water characteristics change from the open ocean into and through the
Puget Sound. We present our data here, as well as an historical analysis comparing water
properties along similar transects with data collected on PRISM and Collias cruises.
PRISM (Puget Sound Regional Synthesis Model) is a program at the University
of Washington, Seattle with the goal of developing an understanding and description of
the environmental factors shaping the Puget Sound region. The overall theme of the
PRISM program to gain an understanding of water movement through the atmosphere,
across the land, into rivers and streams, and throughout the waterways of Puget Sound.
Since 1998, PRISM has completed two longitudinal transect cruises each year, in June
and December, collecting water quality data from Admiralty Inlet south to the Nisqually
basin.
Collias is a historical data set of Puget Sound water properties spanning 14 years:
from 1952 through 1966. This data is the first extensive systematic sampling of
oceanographic water properties along set transects completed in this area. It is used in
this paper as a baseline from which we can do our comparison studies.

3
Figure 1. Sampling locations for May 2002 R/V Thompson. Station # Station/Site
North Latitude
West Longitude
Distance between stations (Nautical Miles) Depth (m)
1 Carkeek PK 47.728 -122.4 11.33NM to station #20 131.3m 2 Abyssal Plain 48.167 -126.498 17NM 2327.8m 3 Lower Slope 48.235 -126.163 8NM 1472.2m 4 Upper Slope 48.282 -125.916 7.5NM 361.9m 5 Shelf Break 48.317 -125.783 21.5NM 174.3m 6 Shelf Break 2 48.4 -125.267 20NM 123.7m 7 Tattosh Island 48.489 -124.773 17NM 274.5m 8 Straits #1 48.387 -124.428 18.5NM 229m 9 Straits #2 48.252 -124.108 14NM 166.7m
10 Straits #3 48.23 -123.731 16NM 163.4m 11 Dungeness spit 48.178 -123.443 22.5NM 121.6m
12 Atop Admiralty Inlet 48.21 -122.884 16.5NM 198.3m
13 Inside Admiralty Inlet 47.984 -122.622 12NM 100.3m
14 Main Basin- Triple Junction 47.868 -122.4 8NM to station #1 154.2m
20 S. of Alki 47.567 -122.428 7.5NM 133.1m 19 E. Passage Midway 47.433 -122.371 8NM 180.9m 18 N. of Brown's Point 47.335 -122.438 4NM 184.1m 17 Dalco Passage 47.329 -122.521 6.5NM 91.8m 16 S. of Narrow Bridge 47.238 -122.577 6.25NM 101.8m 15 Nisqually Basin 47.138 -122.666 NA 131.3m
Table 1. Locations by name and latitude and longitude for May 2002 R/V Thompson.

4
Figure 2: Comparison of Thompson, PRISM and Collias transect sampling locations. Methods
We ran a west to east transect from approximately 91 nautical miles off the coast
of Washington (stations 2-7), through the Strait of Juan de Fuca (stations 8-11), south-
east through Admiralty Inlet (stations 12, 13), south through the Triple Junction to the
East Passage (stations 1, 14, 18-20), and south-west to the Nisqually basin (stations 15-
17) (Table 1). We used the last four most current years of PRISM data and three of the
early 1950’s years of the Collias data. We chose comparisons with these data because
they occurred at the same time of year as our May 2002 cruise and sampled roughly the
same transect in Puget Sound as we did (Figure 1).
During this voyage we collected water, plankton and sediment samples to
determine the physical, biological, chemical and geological characteristics of this unique
estuarine system. The primary instrument utilized for water sample collection and testing

5
was a Seabird CTD (conductivity, temperature, depth) equipped with a dissolved oxygen
sensor, fluorometer and transmissometer. Once the CTD is lowered overboard, vertical
movement can be monitored and controlled electronically from inside the vessel. The
CTD has 24, ten-liter PVC Niskin bottles arranged in a circular “rosette”. Each bottle
can be electronically closed to trap water at a chosen depth for further analysis on board
the ship. Two bottles were tripped at each specified depth so there was always a backup
sample in case a Niskin failed to operate.
Nutrient water samples were obtained from most CTD drops for later analysis by
the University of Washington, Marine Chemistry Lab. These water samples were frozen
after collection and then transported to the lab. All samples were analyzed for
ammonium, nitrate, nitrite, phosphate and silicate.
Contoured hydrographic profile plots were made using Surfer software (Surfer
1999). Data used was obtained from CTD downcast records for Thompson and PRISM
profiles and from log records for historical Collias profiles. Data sets were used as-is; no
smoothing programs were used to remove anomalous data. All comparison profile plots
were made at the same scale in both distance, depth and water property gradient to allow
for the most accurate comparisons.
6
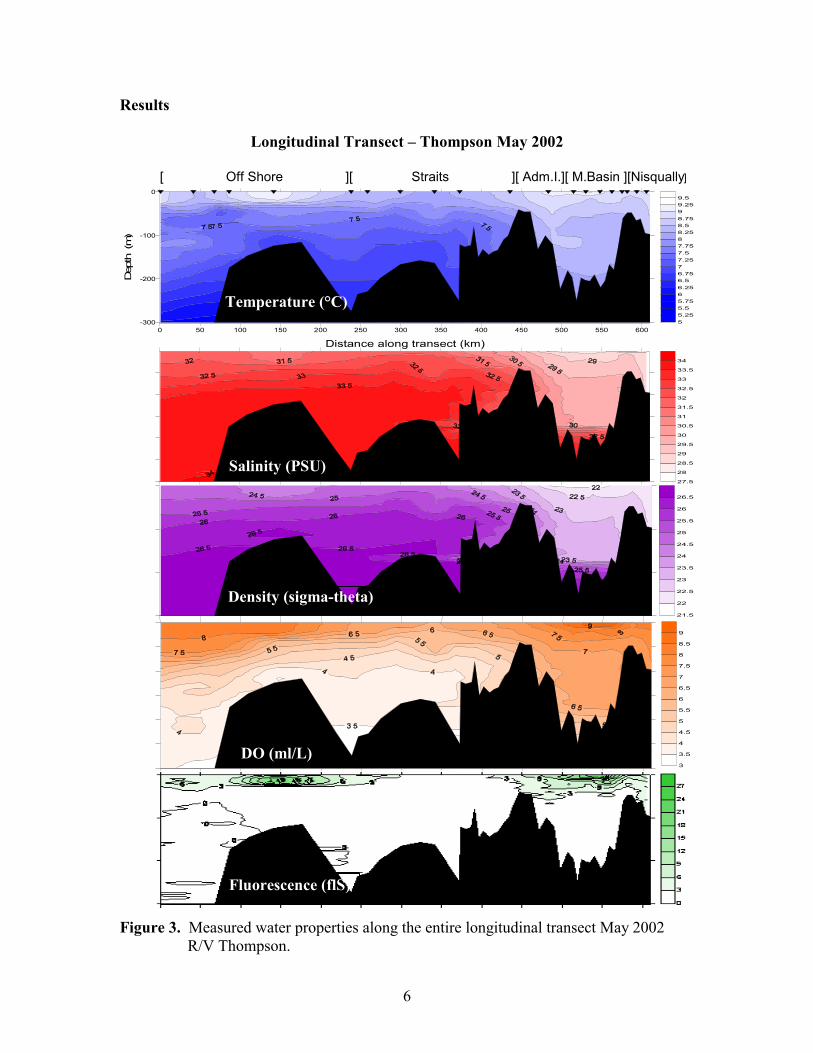
Results
Longitudinal Transect – Thompson May 2002 [ Off Shore ][ Straits ][ Adm.I.][ M.Basin ][Nisqually] Figure 3. Measured water properties along the entire longitudinal transect May 2002 R/V Thompson.
55.255.55.7566.256.56.7577.257.57.7588.258.58.7599.259.5
0 50 100 150 200 250 300 350 400 450 500 550 600
Distance along transect (km)
-300
-200
-100
0
Dep
th (
m)
27.5
28
28.5
29
29.5
30
30.5
31
31.5
32
32.5
33
33.5
34
21.5
22
22.5
23
23.5
24
24.5
25
25.5
26
26.5
3
3.5
4
4.5
5
5.5
6
6.5
7
7.5
8
8.5
9
DO (ml/L)
Density (sigma-theta)
Salinity (PSU)
Fluorescence (flS)
Temperature (°C)

7
Fluorescence and nutrient transect: Thompson May ‘02 [ Off Shore ][ Straits ][ Adm.I.][ M.Basin ][Nisqually]
0 50 100 150 200 250 300 350 400 450 500 550 600Distance along transect (km)
-300
-200
-100
0
Dep
th (m
)
0
3
6
9
12
15
18
21
24
27
0
0.4
0.8
1.2
1.6
2
2.4
0
0.1
0.2
0.3
0.4
0.5
0.6
0
4
8
12
16
20
24
28
32
36
5
12
19
26
33
40
47
54
61
Figure 4. Fluorescence is concentrated between the sills and at the continental shelf, which corresponds with the presence of nutrients. Surface water nutrients are lower in these areas due to uptake by plankton.
Fluorescence (flS)
Ammonium (µM)
Nitrite (µM)
Nitrate (µM)
Silicate (µM)
8
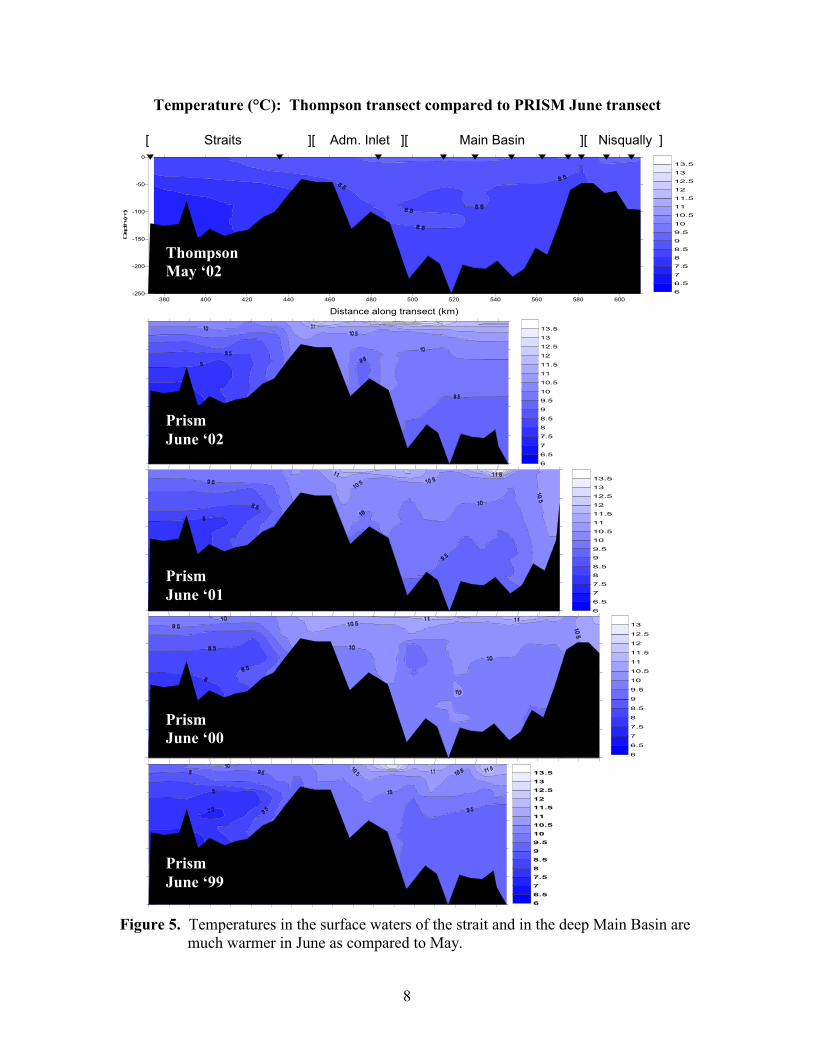
Temperature (°C): Thompson transect compared to PRISM June transect
[ Straits ][ Adm. Inlet ][ Main Basin ][ Nisqually ] Figure 5. Temperatures in the surface waters of the strait and in the deep Main Basin are much warmer in June as compared to May.
380 400 420 440 460 480 500 520 540 560 580 600
Distance along transect (km)
-250
-200
-150
-100
-50
0
Depth (m)
6
6.5
7
7.5
8
8.5
9
9.5
10
10.5
11
11.5
12
12.5
13
13.5
6
6.5
7
7.5
8
8.5
9
9.5
10
10.5
11
11.5
12
12.5
13
13.5
6
6.5
7
7.5
8
8.5
9
9.5
10
10.5
11
11.5
12
12.5
13
13.5
6
6.5
7
7.5
8
8.5
9
9.5
10
10.5
11
11.5
12
12.5
13
66.5
77.58
8.5
99.510
10.511
11.512
12.513
13.5
Thompson May ‘02
Prism June ‘02
Prism June ‘01
Prism June ‘00
Prism June ‘99

9
Temperature (°C): Thompson transect compared to Collias June transect [ Straits ][ Adm.Inlet][ Main Basin ][Nisqually]
260 280 300 320 340 360 380 400 420 440 460 480 500 520 540 560 580 600Distance along transect (km)
-250
-200
-150
-100
-50
0
Depth
(m
)
6
6.5
7
7.5
8
8.5
9
9.5
10
10.5
11
11.5
12
12.5
13
13.5
6
6.5
7
7.5
8
8.5
9
9.5
10
10.5
11
11.5
12
12.5
13
13.5
6
6.5
7
7.5
8
8.5
9
9.5
10
10.5
11
11.5
12
12.5
13
13.5
6
6.5
7
7.5
8
8.5
9
9.5
10
10.5
11
11.5
12
12.5
13
13.5
Figure 6. Temperatures are more stratified in the strait and surface waters of the Main Basin in June.
Thompson May ‘02
Collias June ‘57
Collias June ‘54
Collias June ‘53

10
Temperature (°C): Thompson transect compared to Collias May transect [ Straits ][ Adm.I ][ Main Basin ][Nisqually]
260 280 300 320 340 360 380 400 420 440 460 480 500 520 540 560 580 600Distance along transect (km)
-250
-200
-150
-100
-50
0
Depth
(m
)
6
6.5
7
7.5
8
8.5
9
9.5
10
10.5
11
11.5
12
12.5
13
13.5
6
6.5
7
7.5
8
8.5
9
9.5
10
10.5
11
11.5
12
12.5
13
13.5
6
6.5
7
7.5
8
8.5
9
9.5
10
10.5
11
11.5
12
12.5
13
13.5
6
6.5
7
7.5
8
8.5
9
9.5
10
10.5
11
11.5
12
12.5
13
13.5
Figure 7. May water temperatures are consistent in both the strait and deep Main Basin.
Thompson May ‘02
Collias May ‘55
Collias May ‘54
Collias May ‘53

11
Salinity (PSU): Thompson transect compared to PRISM June transect [ Straits ][ Adm. Inlet ][ Main Basin ][ Nisqually ]
380 400 420 440 460 480 500 520 540 560 580 600Distance along transect (km)
-250
-200
-150
-100
-50
0
Dept
h (m
)
2424.52525.52626.52727.52828.52929.53030.53131.53232.53333.5
2424.52525.52626.52727.52828.52929.53030.53131.53232.53333.5
2424.52525.52626.52727.52828.52929.53030.53131.53232.53333.5
2424.52525.52626.52727.52828.52929.53030.53131.53232.53333.5
2424.52525.52626.52727.52828.52929.53030.53131.53232.53333.5
Figure 8. Salinity is much higher in the strait as compared to the Main Basin. In June 2001 the salinity in the Main Basin is well mixed with virtually no stratification.
Thompson May ‘02
Prism June ‘02
Prism June ‘01
Prism June ‘00
Prism June ‘99

12
Salinity (PSU): Thompson transect compared to Collias June transect [ Straits ][ Adm.Inlet][ Main Basin ][Nisqually]
2424.52525.52626.52727.52828.52929.53030.53131.53232.53333.5
2424.52525.52626.52727.52828.52929.53030.53131.53232.53333.5
2424.52525.52626.52727.52828.52929.53030.53131.53232.53333.5
260 280 300 320 340 360 380 400 420 440 460 480 500 520 540 560 580 600Distance along transect (km)
-250
-200
-150
-100
-50
0
Depth
(m
)
2424.52525.52626.52727.52828.52929.53030.53131.53232.53333.5
Figure 9. The sill at Admiralty Inlet prevents mixing of the more saline waters in the strait with the fresher water in the Main Basin. In June 1953 and 1954 the surface waters within the Main Basin are highly stratified.
Collias June ‘53
Collias June ‘54
Collias June ‘57
Thompson May ‘02

13
Salinity (PSU): Thompson transect compared to Collias May transect
[ Straits ][ Adm.I ][ Main Basin ][Nisqually]
2424.52525.52626.52727.52828.52929.53030.53131.53232.53333.5
18
19
20
21
22
23
24
25
26
27
28
29
30
31
32
33
2424.52525.52626.52727.52828.52929.53030.53131.53232.53333.5
260 280 300 320 340 360 380 400 420 440 460 480 500 520 540 560 580 600Distance along transect (km)
-250
-200
-150
-100
-50
0
Depth
(m
)
2424.52525.52626.52727.52828.52929.53030.53131.53232.53333.5
Figure 10. May salinity patterns are consistent, showing the highest salinity in the strait and downwelling on the basin side of Admiralty Inlet. May 1954 shows a significant freshwater input and highly stratified surface waters within the
Main Basin.
Thompson May ‘02
Collias May ‘55
Collias May ‘54
Collias May ‘53

14
Dissolved Oxygen (ml/L): Thompson transect compared to PRISM June transect [ Straits ][ Adm. Inlet ][ Main Basin ][ Nisqually ]
2
3
4
5
6
7
8
9
10
11
12
13
14
15
16
2
3
4
5
6
7
8
9
10
11
12
13
14
15
16
2
3
4
5
6
7
8
9
10
11
12
13
14
15
16
2
3
4
5
6
7
8
9
10
11
12
13
14
15
16
380 400 420 440 460 480 500 520 540 560 580 600Distance along transect (km)
-250
-200
-150
-100
-50
0
Dep
th (m
)
2
3
4
5
6
7
8
9
10
11
12
13
14
15
16
Figure 11. Dissolved oxygen levels in the deep Main Basin are higher than in the strait. The variation seen in June 2001 is a variation in the original CTD data.
Prism June ‘02
Prism June ‘01
Prism June ‘00
Prism June ‘99
Thompson May ‘02

15
Dissolved Oxygen (ml/L): Thompson transect compared to Collias June transect [ Straits ][ Adm.Inlet][ Main Basin ][Nisqually]
260 280 300 320 340 360 380 400 420 440 460 480 500 520 540 560 580 600Distance along transect (km)
-250
-200
-150
-100
-50
0
Dep
th (m
)
2
3
4
5
6
7
8
9
10
11
12
13
14
15
16
0
1
2
3
4
5
6
7
8
9
10
11
12
13
14
15
16
2
3
4
5
6
7
8
9
10
11
12
13
14
15
16
2
3
4
5
6
7
8
9
10
11
12
13
14
15
16
Figure 12. June dissolved oxygen levels remain fairly constant in the deep Main Basin.
Thompson May ‘02
Collias June ‘57
Collias June ‘54
Collias June ‘53

16
Dissolved Oxygen (ml/L): Thompson transect compared to Collias May transect [ Straits ][ Adm.I ][ Main Basin ][Nisqually]
0
1
2
3
4
5
6
7
8
9
10
11
12
13
14
15
16
0
1
2
3
4
5
6
7
8
9
10
11
12
13
14
15
16
0
1
2
3
4
5
6
7
8
9
10
11
12
13
14
15
16
260 280 300 320 340 360 380 400 420 440 460 480 500 520 540 560 580 600Distance along transect (km)
-250
-200
-150
-100
-50
0
Dep
th (m
)
0
1
2
3
4
5
6
7
8
9
10
11
12
13
14
15
16
Figure 13. May dissolved oxygen levels in the deep Main Basin remain fairly constant.
Thompson May ‘02
Collias May ‘55
Collias May ‘54
Collias May ‘53

17
Fluorescence (flS): Thompson transect compared to PRISM June transect [ Straits ][ Adm. Inlet ][ Main Basin ][ Nisqually ]
0
3
6
9
12
15
18
21
24
27
0
3
6
9
12
15
18
21
24
27
0
3
6
9
12
15
18
21
24
27
380 400 420 440 460 480 500 520 540 560 580 600Distance along transect (km)
-250
-200
-150
-100
-50
0
Depth (m)
0
3
6
9
12
15
18
21
24
27
0
3
6
9
12
15
18
21
24
27
Figure 14. Fluorescence is mostly concentrated above and between the sills. The plankton bloom that can be seen in May 2002 is virtually gone by June 2002.
Thompson May ‘02
Prism June ‘02
Prism June ‘01
Prism June ‘00
Prism June ‘99

18
Discussion
May water properties over the years remain fairly constant in the deep Puget
Sound Main Basin; temperature around 8- 8.5°C, salinity 29.5- 30.0 PSU, approximately
6.5 ml/L DO and fluorescence concentrated above and between the sills in the top 20
meters of the water column.
Upwelling and downwelling in Puget Sound occur primarily in or near the sill
zones of Admiralty Inlet and Tacoma Narrows, with upwelling north of Tacoma Narrows
in E. Passage and extreme downwelling at Admiralty Inlet (Ebbesmeyer et al 1984).
Denser, higher salinity water flows inland along the bottom of Admiralty Inlet with the
deep exterior water immediately seaward of Admiralty Inlet always exceeding the density
and salinity of water in the main basin (Ebbesmeyer et al 1984; Cannon 1983).
Ebbesmeyer and Cannon (2001) showed that water temperature stratification and salinity
stratification below 25 meters in the Main Basin follow one another closely due to this
tidal mixing action. All of these known patterns and characteristics are evident in the
salinity comparison plots (Figures 8-10), as well as the temperature plots (Figures 5-7).
Comparing several years of hydrographic data allows unusual water property
patterns to be easily seen; these anomalies can then be associated with known
climatological events. We found that June 1999 PRISM data shows cooler temperatures
and lower salinity in the straits and Puget Sound, consistent with the Western Regional
Climate Center’s classification of La Nina oceanographic conditions for this year
(Figures 5 and 8). May 1954 Collias data shows a huge fresh water input and strong
salinity stratification (Figure 10). Historical climate records show the winter of 1953-54
having record snowfall (NCDC/ NOAA 2003). The areas of extreme stratification are

19
due to snowmelt entering the Puget Sound at the Triple Junction and Nisqually regions.
Salinity in June 2001 PRISM data shows the Main Basin is well mixed with almost no
stratification (Figure 8). This is consistent with the lack of freshwater input due to 2001
being a drought year (Newton 2003).
Climatological events are not always so easily seen. Though 1957 is reported as
an El Nino year (Dexter et al 1985); we found that June 1957 Collias data does show
deeper temperature stratification in the Main Basin, but overall temperature and salinity
patterns are not significantly different than non-El Nino years (Figures 6 and 9).
It would be useful for future studies to obtain long hydrographic sections that
would allow for comparisons of offshore oceanic conditions with water properties and
circulation in Puget Sound.

20
Literature Cited Bjorklund, T.A, 1998, Characterizing a Deep Water Intrusion at the Landward Admiralty
Inlet Sill, Puget Sound, WA. B.S. Thesis, School of Oceanography, University of Washington.
Cannon, Glenn A, 1983, An Overview of Circulation in the Puget Sound Estuarine
System, NOAA Technical Memorandum ERL PMEL-48, Pacific Marine Environmental Laboratory Seattle, 30pp.
Collias, Eugene E., N. McGary and C. Barnes, 1974, Atlas of Physical and Chemical Properties of Puget Sound and its Approaches, University of Washington Press, Seattle, 235pp.
Dexter, R.N., L.S. Goldstein, P.M. Chapman, and E.A. Quinlan, 1985, Temporal Trends in Selected Environmental Parameters Monitored in Puget Sound, NOAA Technical Memorandum NOS OMA 19, Rockville, Maryland, 38pp.
Ebbesmeyer, C.C. and Cannon, G.A, 2001, Review of Puget Sound Physical
Oceanography related to the Triple Junction Region, Report for King County Department of Natural Resources, 34pp.
Ebbesmeyer, C.C, G.A. Cannon, and C.A. Barnes, 1984, Synthesis of Current
Measurements in Puget Sound, Washington- Volume 3: Circulation in Puget Sound: An Interpretation Based on Historical Records of Currents, NOAA Technical Memorandum NOS OMS 5, Rockville, Maryland, 73pp.
Lana, A.D, 1998, Circulation Patterns in Possession Sound, Washington, and their effects on the possible distribution of sewage from a new outfall, B.S. Thesis, School of Oceanography, University of Washington.
Strickland, R.M, 1983, The Fertile Fjord: Plankton in Puget Sound, Puget Sound Books,
Washington Sea Grant Program, Seattle, WA, 145pp. Surfer 7 Users Guide: Contouring and 3D Surface Mapping for Scientists and Engineers.
1999. Golden Software, Inc. Golden, Colorado. 619pp. NCDC/NOAA: accessed 4/20/03.
http://www.ncdc.noaa.gov/servlets/SCoptions11?state=Washington&short=45

21
Acknowledgements
Dr. Cheryl Greengrove and her Water Resources and Pollution Students, TESC 431 Spring, 2002.
Dr. Mitsuhiro Kawase, University of Washington, Seattle for providing PRISM and Collias data. The crew of the R/V Thomas G. Thompson, May 2002 voyage. Dr. Richard G. Keil and his Marine Biology Students, OCEAN/SAFS 351 Dr. Jan Newton, Washington State Department of Ecology, for information related to seasonal temperature and freshwater input. Presentation at the 2003 Puget Sound/ Georgia Basin Research Conference: “Changes in the Strait of Juan de Fuca and Puget Sound during the 2000 drought.” 3/31/2003 Dr. Glenn A. Cannon, University of Washington, Seattle for directing us to meteorological information helpful in our understanding of the variances we found.