Oceanographic characteristics of an impacted coastal bay: Baía de Guanabara, Rio de Janeiro, Brazil
35
Pergamon Continental She(fResearch, Vol. 17, No. 13, pp. 1609-1 643, 1997 0 1 997 Elsevier Science Ltd PII: SO278-4343(a7)00028-9 All rights r e~~ed. Printed in Great Britain 02784343197 $1 7.00 + 0.00 Oceanographic characteristics of an impacted coastal bay: Baia de Guanabara, Rio de Janeiro, Brazil BJORN KJERFVE*?, CESAR H. A. RIBEIRO?, GILBERT0 T. M. DIASI, ALESSANDRO M. FILIPPOt and VALERIA DA SILVA QUARESMAT (Received 23 February 1996; accepted 29 May 1996) Abstract-Baia de Guanabara is a 384 km2 eutrophic coastal bay in Brazil, impacted by the polluted discharge from the Rio de Janeiro metropolitan area. The structurally controlled bay has a central channel with a depth of 30 m and a sandy bottom near the entrance, reflecting wave and tidal forcing. In contrast, the bay-averaged water depth is 5.7 m and the bottom sediments are mostly muds as a result of the Holocene transgression and rapid fluvial sedimentation, accelerated by channelization of rivers and deforestation. An extensive sand bank is located seaward of the bay entrance and a flood- oriented sand wave system indicates sand transport into the bay. The mean freshwater discharge measures 100+59 m3 s-' and is greatest in the rainy austral summer in December and January. Tides are mixed mainly semidiurnal with a range of 0.7 m, and peak spring tidal currents reach 0.5 m s-' inside the bay and 1.6 m s-' near the bay entrance. The passage of northward propagating polar fronts results in regular strong southwesterly winds and heavy wave forcing. The bay has mean salinities from 21.0 to 34.5560 with an average of 29.5+4.8%. The vertical salinity stratification, As/s, varies from 0.06 to 0.21 and is relatively weak and inversely proportional to rms tidal currents. The residual circulation is characterized by both gravitational circulation and transverse residual tidal circulation, measuring 800 and 400 m3 s-I, respectively. The renewal time of 50% of the bay water volume is 11.4 days. Untreated sewage runoff enters the bay from the west, resulting in locally poor water quality, where the near-bottom mean dissolved oxygen measures only 3.1 mg 1- ' and results in anoxic bottom muds. The worst water quality is indicated by average fecal coliform of 1140 counts ml-' and excessive ammonia and phosphate loading. The average chlorophyll concentration in this region responds to the nutrient loading and exceeds 130 pg I-' although 57 pg I-' is the overall mean for the bay. The atomic N:P ratio measures 14 for the bay as a whole. 8 1997 Elsevier Science Ltd. All rights reserved 1. INTRODUCTION Large coastal bays are commonly found on all continents, particularly along coasts which are or have been tectonically active. Basement structural control characterizes such bays, including San Francisco Bay (USA) (Conomos, 1979), Tokyo Bay (Japan), Bahia Concepcion (Chile) (Ahumada et al., 1983), and Baia de Guanabara (Brazil), although all of these systems have been extensively modified by recent sedimentary processes. Coastal bays at times exhibit processes typical of coastal plain estuaries, but they are usually too large and sufficiently complex and variable to defy being classified simply as estuaries. Many *Marine Science Program, Department of Geological Sciences and Belle W. Baruch Institute for Marine Biology and Coastal Research, University of South Carolina, Columbia, SC 29208, U.S.A. t Departamento de Geoquimica, Universidade Federal Fluminense, CEP-24020-007Niteroi, RJ, Brazil. f Departamento de Geologia, LAGEMAR, Universidade Federal Fluminense, CEP-24251-970 Niteroi, RJ, Brazil.
Transcript of Oceanographic characteristics of an impacted coastal bay: Baía de Guanabara, Rio de Janeiro, Brazil

Pergamon Continental She(fResearch, Vol. 17, No. 13, pp. 1609-1 643, 1997
0 1 997 Elsevier Science Ltd
PII: SO278-4343(a7)00028-9 All rights r e ~ ~ e d . Printed in Great Britain
02784343197 $ 1 7.00 + 0.00
Oceanographic characteristics of an impacted coastal bay: Baia de Guanabara, Rio de Janeiro, Brazil
BJORN KJERFVE*?, CESAR H. A. RIBEIRO?, GILBERT0 T. M. DIASI, ALESSANDRO M. FILIPPOt and VALERIA DA SILVA QUARESMAT
(Received 23 February 1996; accepted 29 May 1996)
Abstract-Baia de Guanabara is a 384 km2 eutrophic coastal bay in Brazil, impacted by the polluted discharge from the Rio de Janeiro metropolitan area. The structurally controlled bay has a central channel with a depth of 30 m and a sandy bottom near the entrance, reflecting wave and tidal forcing. In contrast, the bay-averaged water depth is 5.7 m and the bottom sediments are mostly muds as a result of the Holocene transgression and rapid fluvial sedimentation, accelerated by channelization of rivers and deforestation. An extensive sand bank is located seaward of the bay entrance and a flood- oriented sand wave system indicates sand transport into the bay. The mean freshwater discharge measures 100+59 m3 s-' and is greatest in the rainy austral summer in December and January. Tides are mixed mainly semidiurnal with a range of 0.7 m, and peak spring tidal currents reach 0.5 m s-' inside the bay and 1.6 m s-' near the bay entrance. The passage of northward propagating polar fronts results in regular strong southwesterly winds and heavy wave forcing. The bay has mean salinities from 21.0 to 34.5560 with an average of 29.5+4.8%. The vertical salinity stratification, As/s, varies from 0.06 to 0.21 and is relatively weak and inversely proportional to rms tidal currents. The residual circulation is characterized by both gravitational circulation and transverse residual tidal circulation, measuring 800 and 400 m3 s-I, respectively. The renewal time of 50% of the bay water volume is 11.4 days. Untreated sewage runoff enters the bay from the west, resulting in locally poor water quality, where the near-bottom mean dissolved oxygen measures only 3.1 mg 1- ' and results in anoxic bottom muds. The worst water quality is indicated by average fecal coliform of 1140 counts ml-' and excessive ammonia and phosphate loading. The average chlorophyll concentration in this region responds to the nutrient loading and exceeds 130 pg I - ' although 57 pg I - ' is the overall mean for the bay. The atomic N:P ratio measures 14 for the bay as a whole. 8 1997 Elsevier Science Ltd. All rights reserved
1. INTRODUCTION
Large coastal bays are commonly found on all continents, particularly along coasts which are or have been tectonically active. Basement structural control characterizes such bays, including San Francisco Bay (USA) (Conomos, 1979), Tokyo Bay (Japan), Bahia Concepcion (Chile) (Ahumada et al., 1983), and Baia de Guanabara (Brazil), although all of these systems have been extensively modified by recent sedimentary processes. Coastal bays at times exhibit processes typical of coastal plain estuaries, but they are usually too large and sufficiently complex and variable to defy being classified simply as estuaries. Many
*Marine Science Program, Department of Geological Sciences and Belle W. Baruch Institute for Marine Biology and Coastal Research, University of South Carolina, Columbia, SC 29208, U.S.A.
t Departamento de Geoquimica, Universidade Federal Fluminense, CEP-24020-007 Niteroi, RJ, Brazil. f Departamento de Geologia, LAGEMAR, Universidade Federal Fluminense, CEP-24251-970 Niteroi, RJ,
Brazil.

1610 B. Kjerfve et a/.
bays exhibit intermittent two-layered gravitational or estuarine circulation, but this circulation is usually confined to only the deeper channels and is seldom simply aligned with a main axis of the system as in the case of most coastal plain estuaries. Residual tidal circulation is usually another important circulation mode in large bays. Considering seasonal and spatial variability, a coastal bay can at different times and locations be shown to warrant classification within each region of the classical estuarine circulation- stratification diagram (Hansen and Rattray, 1966) (Fig. 1).
Pritchard (1952) promoted tectonically formed systems as one of four separate categories of estuaries, but his suggestion has largely been ignored. Kjerfve (1994) has again proposed a separate classification category for coastal bays to encompass tectonically formed systems. To adopt such a separate classification category seems appropriate. Structurally controlled coastal bays such as Baia de Guanabara, deserve and need to be treated as a separate geomorphic type. It is our objective to describe the oceanographic characteristics of Baia de Guanabara, Brazil, and focus attention on the salient processes and characteristics and their variability of this large coastal bay.
Baia de Guanabara (Fig. 2) is the most prominent coastal bay in Brazil. The cities of Rio de Janeiro, Duque de Caxias, Siio Gon~a lo , Niterbi, and many smaller communities are located along its margins. Of the more than 11 million inhabitants who live in the greater Rio de Janeiro metropolitan area, domestic, largely untreated, runoff from at least 7.81 million people discharge directly into the bay. The fact that the population is growing by 1.1 % annually (IBGE, 1991) will not help to relieve the pressure on the infrastructure. Baia de Guanabara is bordered by 6000 industries, with more than 6000 additional industries in the drainage basin, and is home to two oil refineries responsible for the processing of 17O/0 of
Circulation lJ,/Uf 1 Fig. I . Classification of Baia de Guanabara, near the ocean entrance, according to the non- dimensional Hansen and Rattray (1966) stratification-circulation diagram, based on current measurements a t stations C1 and C2 and water quality measurements at stations W1. W2, and W3.
Other sites in the bay are likely to classify very differently in this diagram.

Oceanographic characteristics of an impacted coastal bay 161 1
Fig. 2. Map of Baia de Guanabara, showing sites with tidal measurements (Tl-T15). water qualit) measurements (Wl-W13), current measurements (C1<3), and meteorological measurements (M 1
and M5).
the national oil. Baia de Guanabara is traversed by the 6-lane 13-km long Rio-Niteroi highway bridge, completed in 1975. More than 2000 commercial ships dock annually in the port of Rio de Janeiro (CDRJ, 1993), in Brazil second only to the Santos estuary. The bay is also the home to two navy bases, a shipyard, and a large number of ferries, fishing boats, and yachts.
Baia de Guanabara is centered on lat. S 22'50' and long. W 43'101, and measures 384 km2 as determined by planimetry of a chart to scale 1:50 000. Islands constitute 56 km2, leaving a water surface area of 328 km2. The perimeter of the bay has a length of
1612 B. Kjerfve et al.
131 km as measured on the same chart. The mean water volume is 1.87 x lo9 m3. The bay measures 28 km from approximately west to east and 30 km from approximately south to north. The narrow entrance to Baia de Guanabara is only 1.6 km wide, extending between the forts, Forte ,550 Jo5o on the west side of the entrance and Fortaleza Santa Cruz on the east side.
Dredging takes place continuously in the port area to a design depth of 17 m in support of shipping and docking activities. Due to urban construction, including two commercial airports, residential development, roads, and bridges, the bay surface area has been reduced by 10% as a result of land reclamation, principally the narrow channel area separating Ilha do Governador-Ilha do Fund50 from the mainland, Flamengo beach, downtown Niteroi, downtown Rio de Janeiro, and the two commercial airports, Santos Dumont and Gale20 (Amador, 1980a). Although encroached on by urban expansion, the inner margins of Baia de Guanabara is still bordered by a 90 km2 fringing mangrove system (Pires, 1992), of which 43 km2 is an environmental protection area, Guapimirim (FEEMA, 1990).
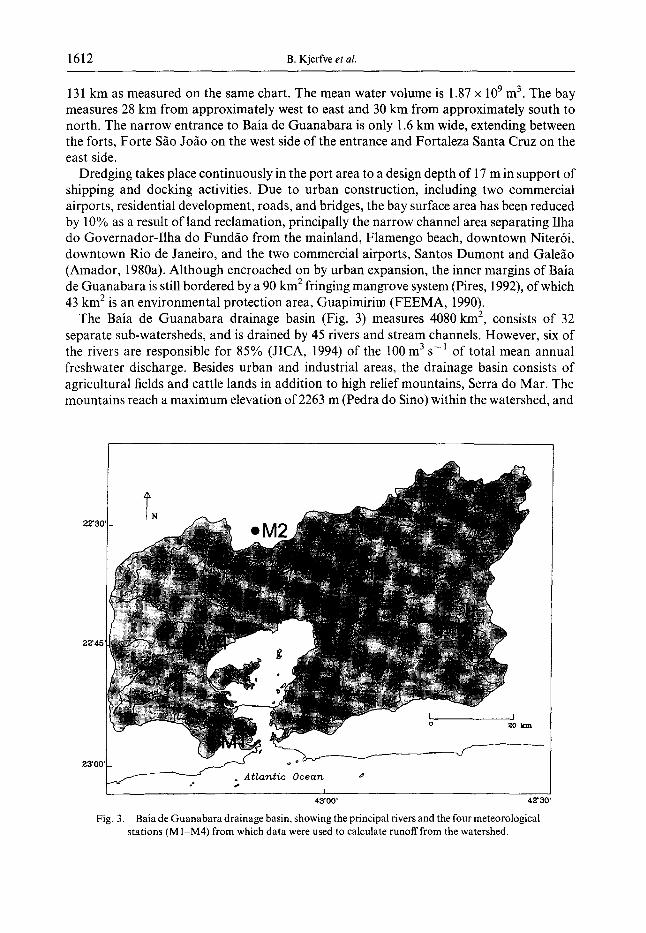
The Baia de Guanabara drainage basin (Fig. 3) measures 4080 km2, consists of 32 separate sub-watersheds, and is drained by 45 rivers and stream channels. However, six of the rivers are responsible for 85% (JICA, 1994) of the 100 m3 s-' of total mean annual freshwater discharge. Besides urban and industrial areas, the drainage basin consists of agricultural fields and cattle lands in addition to high relief mountains, Serra do Mar. The mountains reach a maximum elevation of 2263 m (Pedra do Sino) within the watershed, and
. Atlantic Ocean p-- . P
Fig. 3. Baia de Guanabara drainage basin, showing the principal rivers and the four meteorological stations (M 1LM4) from which data were used to calculate runoff from the watershed.

Oceanographic characteristics of an impacted coastal bay 1613
used to be covered by the Atlantic rain forest, Mata Atllntica. Nowadays, the basin is only partially vegetated with vestiges of the Mata Atllntica, which in places still extends to the shoreline, as in the case of Ilha Grande, a large island well to the southwest of the bay. Much of the indigenous vegetation has been cut, and only appears as small areas of intact rainforest on the mountain slopes and as preserved mangrove wetlands along the inner fringes of the bay.
In spite of the pollution control plan created by FEEMA (1979), the water quality situation in Baia de Guanabara has become critical. Although several sewage treatment plants have been constructed in the past 20 years, increasing the total number to six, only 15% of the enormous amount of domestic and industrial waste discharged into the bay was subjected to any form of sewage treatment in 1991. On a daily basis, 6000 tons of garbage is generated in the area surrounding the bay (Silva et al., 1990). Ferreira (1995) found that 18 ton day-' of petroleum hydrocarbons enter the bay, of which 85% has its source in urban runoff. Large amounts of suspended solids, organic matter, heavy metals, and hydrocarbons are discharged into Baia de Guanabara and accumulate in the bottom sediments. High input rates of nutrients have resulted in eutrophication of bay waters (Rebello et al., 1988; Lavrado et al., 1991), at the same time that the fisheries yield has declined to 10% of the level three decades ago (FEEMA, 1990).
Still, no comprehensive oceanographic overview of Baia de Guanabara seems to exist, although the bay has been studied extensively for many decades (Oliveira, 1947,1950, 1958; Oliveira et al., 1971), and several management schemes have been proposed (FEEMA, 1978, 1990). Noteworthy studies are the assessment of water quality in Baia de Guanabara (Coelho and Fonseca, 1977; Mayr et a/., 1989; Braga et a/., 1993:1, ecological disturbance (Flores et al., 1979; Teixeira et al., 1987; Villac, 1990), health problems related to waste and pollution loading (Araujo et a/., 1990, 1991), distribution of sediments (Amador, 1992), and studies of heavy metals in the bottom sediments (Pfeiffer et al., 1982; Caqbnia, 1984; Rebello and van den Berg, 1986; Leal, 1988; Rezende and Lacerda, 1986). Although many studies of Baia de Guanabara have involved extensive data collection efforts (Paranhos and Mayr, 1993; Paranhos et al., 1993; JICA, 1994), the hydrological and oceanographic data have not previously been adequately interpreted or synthesized.
3. AVAILABLE DATA AND ANALYSIS PROCEDURES
We have collected existing environmental data and information about Baia de Guanabara with source materials obtained primarily from Departamento Nacional de Meteorologia (DENEMET), Departamento de Hidrografia e Navegaqiio (DHN), and Funda$io Estadual de Engenharia do Meio Ambiente (FEEMA), and other state and national government agencies as well as from literature sources and our measurements. These data have been subjected to analysis, synthesis and interpretation.
Monthly temperature and rainfall data were obtained from DENEMET for more than 40 stations throughout the Baia de Guanabara drainage basin. For calculations of runoff, we chose to use the temperature and rainfall data from four representative sites (Ml-M4), where data exist for 30-year normals (1961-1990). Hourly wind data were obtained from Telecomunicaqdes Aeronauticas S/A (TASA) from the Santos Dumont airport (M5) in Rio de Janeiro for 1990. Wind-data collected by DENEMET every 3 h were also obtained for a 5-year period, 1987-1991, from Aterro do Flamengo (Ml). These latter data were used to calculate occurrences of frontal passages and associated winds.

1614 B. Kjerfve el al.
A detailed bathymetric map was computer-constructed by interpretation of the original DHN sounding charts at a scale of 1: 10 000, and isobaths were plotted at meter intervals. To show the bottom sediment distribution, we started with a map initially produced by Amador (1992). However, we included some modifications based on detailed bottom sampling, principally in the vicinity of the Rio-Niteroi bridge. Horizontal positioning was confirmed with a global positioning system (GPS) satellite receiver. In addition, side-scan sonar (EG&G 260) and high resolution seismic (EG&G Uniboom and Raytheon RTT 1000A) surveys were undertaken annually as part of post-graduate courses in marine geology and geophysics at Departamento de Geologia, LAGEMAR, Universidade Federal Fluminense, 1986-1994.
Hourly tidal water level measurements were made by DHN at 15 locations (Tl-T15) in Baia de Guanabara for sometimes as few as 30 days and sometimes as many as 668 days from different years during the 2oth century. The hourly water level data were subjected to harmonic analysis (Franco, 1988), and constituent amplitudes and phases calculated for 24 to more than 100 constituents, depending on the length of the water level time series. Some of these data have been used for tidal predictions by DHN but have otherwise not been synthesized or published.
Time series of current measurements were made as a part of a foreign aid study by Japan International Cooperation Agency (JICA, 1994) at three locations (CI-C3) in Baia de Guanabara for 15 days in 1992, using Aanderaa RCM-7 impellered current meters. At the seaward two stations (Cl and C2), near surface and near bottom speed and direction measurements were made every 10 min. At a third station (C3) near Ilha do Governador, measurements were made every 10 min with a single instrument deployed near the surface. Besides being listed in the resulting technical report (JICA, 1994), these data have neither been used nor published. All directions are given as true north ("T), having been corrected for the large local declination, where magnetic north is 21" west of true north.
FEEMA has systematically collected water quality data in the bay from 13 sites (Wl- W13) near the surface and near the bottom during the period 1980-1993, including 13 separate parameters, and 8916 individual observations once outliers (defined as values >30 of all the samples for a parameter) have been removed, corresponding to approximately 4% of all observations. Although the sample frequency is irregular, varying from monthly to seasonal, and there are no measurements during 30 months between 1986 and 1988, the data still represents an invaluable data set. The water quality parameters include temperature, salinity, total dissolved nitrogen, total dissolved phosphorus, ammonia, nitrate, nitrite, orthophosphate, chlorophyll a, dissolved oxygen, biochemical oxygen demand, total coliform, and fecal coliform. Temperature was measured with a mercury thermometer, and salinity was determined based on silver nitrate titration (Strickland and Parsons, 1972). Nitrate was reduced to nitrite in a cadmium column and determined by diazotizing with sulphanilamide, then corrected for initially present nitrite (Strickland and Parsons, 1972), and nitrite was determined by reaction with sulphanilamide in acid solution (Strickland and Parsons, 1972). Ammonia was determined by the indophenol method (FEEMA, 1983) orthophosphate was determined by reaction of the ions with acidified molybdate reagent (APHA, 1975), total dissolved nitrogen was determined by the Kjeldahl acid digestion technique (FEEMA, 1983), and total dissolved phosphorous was determined by reactions with ammonia- molybdate and ascorbic acid (APHA, 1975). Chlorophyll a was determined by the acetone extraction method, and dissolved oxygen by the Winkler method (Strickland and Parsons,

Oceanographic characteristics of an impacted coastal bay 1615
1972). BOD was measured after incubation for 5 days, but the data are not presented here. Fecal coliform concentrations were counted by the method of multiple tubes (APHA, 1975), and likewise total coliform counts which also are not presented here. Other parameters were calculated from the original data, e.g. a nitrogen-phosphorus ratio, oxygen saturation (Grasshoff et al., 1983), and o~ (Fofonoff and Millard, 1983).
4. GEOLOGICAL SETTING
The southeast coast of Brazil is dominated by the prominent Serra do Mar mountains. This coast-parallel mountain range was uplifted during the Tertiary at the time of the formation of the Santos basin along the margin of the adjacent continental shelf. It consists of semi-grabens which define blocks of successive escarpments, oriented southwest to northeast, and aligned with the remaining underlying Precambrian rocks. The Baia de Guanabara basin is located in one of these 30-km wide Tertiary depressions, alternately referred to as Baixada Fluminense or the Guanabara rift (Ruellan, 1944; Almeida, 1976; Asmus and Ferrari, 1978; Ferrari, 1990). Outcrops of Precambrian rocks abound throughout the basin, exemplified by the 400-m high Sugar Loaf, P lo de Apca r , at the western side of the entrance to the bay near Forte SBo JoBo. Baia de Guanabara, as it currently exists, is oriented south to north. This changed physiography evolved during the Quaternary because of adjustments due to drainage patterns during lower stands of sea level, then modified by the marine transgression during the Holocene.
Existing sedimentary remnants of the upper Tertiary are represented by the Macacu and pre-Macacu formations to the northeast of the bay (Meis and Amador, 1972, 1977). Drilling in the bay only revealed late Pleistocene deposits in the form of braided fluvial sands related to the Caceribu formation (Amador, 1980b, 1993). During the most recent marine transgression 5000 years BP, relative sea level reached + 4 m above the present level, and the area of the bay measured 800 km2, or more than twice the present extent. Elevated paleo-beaches and marine terraces ( + 4 m) are common around the bay (Amador. 1974; Amador and Ponzi, 1974).
Flooding of the drainage basin during the Holocene marine transgression caused intense mud deposition on top of the fluvial Pleistocene sands in the bay. As indicated by high- resolution seismic profiling, these mud deposits attain a thickness of more than 10 m in the vicinity of the Rio-Niteroi bridge (Dias, 1989). Along the interior margin of the bay, the alignment of mangrove wetlands conforms with the southwest-northeast orientation of the basin and also the orientation of the dominant river system reaching the bay, the Rio Guapimirim and Rio Macacu systems.
During the past 50 years, the meandering Rio Macacu and other rivers have been channelized in order to reclaim alluvial lands for creation of urban areas, and in the process shortening the river length by a factor of three. This produced increased river flow velocities, scouring, and sediment transport to the bay. As a result of the channelization and also because of deforestation of the basin, sedimentation in the bay has accelerated. The mean sedimentation rate, which was 0.24m century-' for 1849-1922, increased to 0.81 m century-' from 1938 to 1962 (Amador, 1980a), and varied spatially from 0.57 to 3.50 m century - ' within the bay (Amador, 1992). JICA (1994) reported sedimentation rates determined by *'OP~ dating and demonstrated that the rate has been 0.5 m century-' since 1955.

1616 B. Kjerfve er al.
5. BATHYMETRY AND BOTTOM SEDIMENT PROCESSES
The complex bathymetry of Baia de Guanabara is shown in Fig. 4. A relatively flat central channel stretches from the bay mouth to a line between Santos Dumont airport (M5) and Gragoata with a median width of 400 m, as defined by the 30-m isobath. Within the central channel, there is a depression which reaches a depth of 58 m (Fig. 4), and numerous outcrops of crystalline basement rock. Many of these outcrops exist below water level throughout the bay, representing a risk to navigation. A line Santos Dumont-Gragoata is the major choking point of the bay. Between this section and the section defined by Ilha das Cobras-Ponta da Arma~iio, the central channel widens to 900 m, and subsequently loses its characteristics as the bay becomes progressively more shallow. Typical depths in the section represented by the Rio-Niterbi bridge are 20 m. From the bridge to the inner margins of the bay, the depths become very shallow because of extensive mud sedimentation. The area- weighted depth of the bay is only 5.7 m, and the hypsometric curve of Baia de Guanabara is shown in Fig. 5.
The map of bottom sediment distribution (Fig. 6) is characterized by sand, muddy sand, sandy mud, and mud (Amador, 1992). However, our recent detailed sampling indicated that
Fig. 4. Isobaths for Baia de Guanabara in meter intervals, synthesized from thousands of fathometer traces, showing the complex bathymetric details of the bay, and indicating the structural
control on the bathymetry.

Oceanographic characteristics of an impacted coastal bay 1617
Percent
Fig. 5. Hypsometric depth distribution in Baia de Guanabara, integrated from a hydrographic chart at a scale of 150 000.
the sands in the central channel extend from the adjacent continental shelf but only to the Rio-Niteroi bridge, which is a slight modification to the Amador (1992) sediment map. Isolated areas of relict sands are found northeast and southwest of Ilha de Governador (Amador, 1992), as a result of strong tidal scouring. Otherwise. extensive mud deposits cover the interior parts of the bay as a result of the active transport of fluvial clastic materials to the bay, accelerated by anthropogenic activities in the drainage basin. Extensive silty clay deposits have been mapped to a scale of 1.25 000 by Baptista Batista Neto (1993) in the Jurujuba-Icarai embayment near the bay entrance, demonstrating the existence of a sandy mud transition zone at a depth of 5 m. Other embayments presumably also have a similar transition zone.
A huge submerged sand bank exists seaward of the bay mouth. It consists of medium quartzose sands, which extend upward to a depth of 12 m. This shoal, which appears to enter the bay, has been kept from growing further by tidal exchanges and the flux of fresh water out of the bay. The sand shoal is similar to the adjacent sub-aerial sand barrier formation along the 200-km coast of the state of Rio de Janeiro from the entrance to Baia de Sepetiba to Arraial do Cabo, and were it not for the seaward pressure gradient due to the freshwater runoff from the bay, it is likely that this sand bank would also have been transformed into an emergent barrier system. The contrast between the sand bank and the sandy flat central channel inside the bay mouth is strikingly pronounced (Fig. 7).
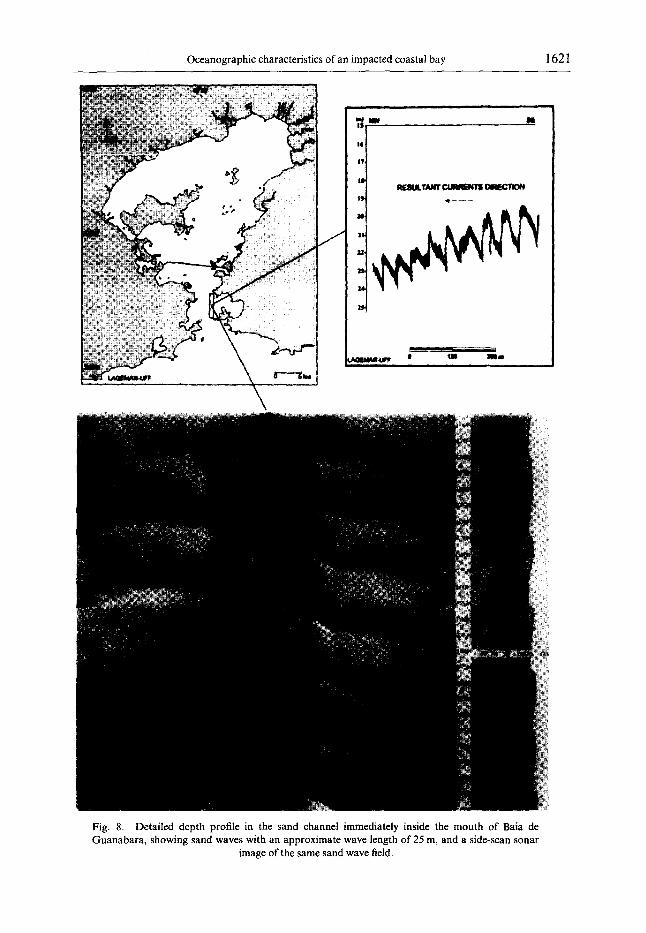
The bottom sediment distribution of the bay (Fig. 6) reflects the hydrodynamic forcing, indicated by the sand shoal, and also by sand waves, which exist along the eastern margin of the central channel between the 10- and 26-m isobaths between Morro do Morcego and Gragoata. The sand wave system (Fig. 8) exhibits waves with heights between 2.5 and 0.5 m and a wavelength between 98 and 18 m. They decrease in height and wavelength in the direction of the bay in response to decreasing energy, which in turn explains the progressive increase in mud deposition further into the bay. The sand waves are asymmetrical with the steeper slope facing the bay (Fig. 8), indicating progression of the waves and associated sand

1618 B. Kjerfve et al.
MUD
SAMPLES ELMO AMADOR
$ NITEROI LAGEMAR-UFF DHN
RIO DE JANEIRO
-. /-: \ {,. ,
Fig. 6. Bottom sediment distribution in Baia de Guanabara showing sand, muddy sand, sandy mud, and mud substrates, based on published data by Amador (1992), as modified from new bottom
substrate sampling by DHN and LAGEMARIUFF.
transport into Baia de Guanabara. The sand waves are a function of both very energetic ocean swells, which regularly enter from the south-southwest during frontal passages, and also the dominance of flood-directed tidal bottom currents.
6. CLIMATE, WEATHER AND METEOROLOGICAL FORCING
The Baia de Guanabara climate is tropical humid wet with wet warm summers and dry cool winters with a strong marine influence, Aw according to Koppen (1900). The mean

Oceanographic characteristics of an impacted coastal bay 1619
Fig. 7. South to north depth profile through Baia de Guanabara from seaward of the Forte SBo JoBo-Fortaleza Santa Cruz (0 km) cross-section to a point west of Batalha on the northern margin of
the bay.
annual air temperature is 23.7"C, and the mean annual relative humidity is 78% at sea level (DENEMET, 1992). The mean 30-year rainfall varies across the drainage basin from 29 1 mm month- ' in the mountains to a minimum value of 30 mm month- ' in the winter in low-lying areas. The mean annual rainfall at the Aterro do Flamengo meteorological station (MI), representative of Baia de Guanabara, is 1173 mm annually, and the mean annual evaporation is 1 198 mm (DENEMET, 1992). There is a well defined wet (December--April) and dry (June-August) season. During the austral summer, heavy rains at times exceed 10 mm in a couple of hours, producing intense runoff and flooding of low-lying fringe areas (Alcdntara and Washington, 1989).
During the austral winter months, June through August, sharp polar frontal systems propagate northward at 500 km day-' from the South Atlantic and give rise to intense, short-duration southerly winds as the front arrives. A recent satellite study indicated that an average of 13 cold fronts of polar origin arrived at the Rio de Janeiro (Fluminense) coast during the austral winter months, with an average of 6 days between consecutive fronts (Stech and Lorenzzetti, 1992). The wind intensity frequently exceeds 10 m s- ' during passages of fronts (Vilela, 1992), the system normally passes in less than 12-24 h, and winds from the south and southwest may occasionally exceed 25 m s- ' along the ocean beaches. The arrival of a polar front is typically preceded by warm temperatures and winds from the north or northeast. As the front propagates across the coastline, polar air masses cause the temperature to drop 5-10°C, and the surface winds quickly shift direction anticlockwise to become intense southwesterly winds.
However, frontal passages are not limited to the austral winter but occur on a year- around basis. In 1990, 52 fronts arrived and crossed the Fluminense coast, and the 5-year Aterro do Flamengo wind data set indicates that an average of 46 fronts arrive annually (Filippo, 1997). In 1990, a slightly larger number of fronts arrived during April, but the fronts were otherwise approximately evenly distributed between the months. The austral summer months December and January are in general the windiest period of the year in the Baia de Guanabara basin.
Heavy ocean swells with heights of 2-4 m and periods 8-12 s at times precede the arrival of fronts. The display of spectacularly breaking waves on the adjacent ocean beaches are reduced to occasionally damaging low-frequency oscillations in the lower bay. The only available study on waves in the vicinity of Rio de Janeiro was done near Macae In the Campos basin 170 km east northeast of the bay entrance, indicating a median significant

1620 B. Kjerfve et al.
wave height between 1.3 and 1.8 m with an associated period of 7 s during normal periods of anticyclonic dominance (Souza, 1988).
The most frequent winds blow over Baia de Guanabara from the southeast (21 % of the time), from the south (17%), and from the north (14%), based on continuous hourly measurements for all of 1990 at the Aeroporto Santos Dumont (M5). Twenty-four percent of the time, the winds are less than 1 m s-'. The mean monthly wind speed is 3 m s- '. The maximum sustained wind recorded in 1990, inside the bay at Aterro do Flamengo, blew from the south with a speed of 14.4 m s-' and occurred in April.
7. FRESHWATER INPUT
To assess gravitational circulation, vertical stratification, and salinity distribution in Baia de Guanabara, it is essential to know the freshwater discharge. Unfortunately, none of the 45 streams and rivers that drain into Baia de Guanabara is gauged permanently, and there is no existing model to estimate the freshwater input. To remedy this, we estimated the freshwater input to Baia de Guanabara based on a simple empirical model (Holland, 1978; Kjerfve, 1990; Kjerfve et al., 1996), where the total runoff from the drainage basin (m3 s-') is computed as
where r is the precipitation rate (mm month-'; but converted to m s-' for use in equation (I)), Aflr is the non-dimensional runoff ratio, and the integration is performed over the corresponding drainage area (m2) (Schreiber, 1904; Holland, 1978; Kjerfve, 1990). The runoff ratio is
and Eo (mm month-') is the potential evapotranspiration
where T is the mean monthly air temperature in degrees absolute (K). To estimate the total mean monthly rate of freshwater discharge into Baia de Guanabara,
we divided the drainage basin into four sub-areas with distinctly different elevations, temperatures (Fig. 9), and rainfall rates (Fig. 10). The temperature and rainfall data are based on multi-year data from one representative meteorological station within each of the four sub-areas. The sub-areas were measured by planimetry, and the data for each site and sub-area are shown in Table 1.
The monthly freshwater discharge rate was calculated (Table 1) by summing the discharges for the four sub-areas from equation (1) for each month. However, an additional monthly discharge correction of 25 m3 s-' was applied to account for fresh water pumped into the Baia de Guanabara drainage basin. To provide sufficient quantities of potable water for metropolitan Rio de Janeiro, Companhia Estadual de ~ ~ u a e Esgoto (CEDAE) pumps a total of 40 m3 s-' from Rio Paraiba do Sul, the closest river and drainage basin to the north. An estimated 25 m3 s-' of this water becomes runoff into Baia de Guanabara (CEDAE, personal communication).
Oceanographic characteristics of an impacted coastal bay 1621
Fig. 8. Detailed depth profile in the sand channel immediately inside the mouth of Baia de Guanabara, showing sand waves with an approximate wave length of 25 m, and a side-scan sonar
image of the same sand wave field.


Oceanographic characteristics of an impacted coastal bay 1623
Jan APr Jul Oct
Month
Fig. 9. Monthly mean temperatures, 1961-1990, for the four meteorological stations (MlLM4) taken to be representative of the four sub-areas used to calculate fresh water discharge.
Jan A P ~ Jul Oct
Month Fig. 10. Monthly rainfall rates, 1961-1990, for the four meteorological stations (MI-M4) taken to
be representative of the four sub-areas used to calculate fresh water discharge.

1624 B. Kjerfve et al.
Table 1 . Summary data for the four meteorological stations used in the runoff calculations, including long-term monthly temperature andrainfall mean and monthly rms values, and the calculatedmean andmonthly rms runoff ratios
and discharges
Site Lat/Long Elev (S /W ( 4
MI. Aterro do Flamengo 22"55'/24"10' 5 M2. Petropolis 22"311/43"1 1' 824 M3. Escola UniZo 22"35'/42"56' 35 M4. Sgo Bento 22"44'/43"18' 105 From Rio Paraiba do Sul 25
Total
Area Temp Rain Aflfir Q R
(km2) K) (mm) (-1 (m3 S-I)
706 23.6k2.0 1173k33 0.16k0.08 5 k 4 1076 17.9k2.1 2001k84 0 . 4 1 ~ 0 . 1 6 33+24 1644 24.2k2.1 1736k72 0.2650.14 29+25 702 22.9f 2.5 1290k65 0.19+0.15 8 + 8
The calculations yielded different monthly runoff ratios for the four sub-areas, varying from 0.01 at low elevations in the austral winter to 0.57 at high elevations in the austral summer. The mean runoff ratios were 0.16 for Aterro do Flamengo, 0.41 for Petropolis, 0.26 for Escola UniBo, and 0.19 for SBo Bento, and the corresponding mean discharge rates from the four sub-areas 5, 33, 29, 8 m3 s-', respectively, in addition to the contribution from Paraiba do Sul (Table 1). The mean and rms calculated fresh water discharge into Baia de Guanabara is 100 + 59 m3 s-' with a range from 33 m3 s-' in July to 186 m3 s-' in January and December based on the 30-year normal temperature and rainfall data. The calculated discharge is shown in Fig. 11.
Our monthly fresh water discharge estimates are on the average lower by a factor of four as compared to the estimates by JICA (1994). Although the JICA (1994) study measured the discharges of 25 of the 45 rivers and streams in the drainage basin, this was only done on four occasions per site (during the rainy season in October and November 1992, and during the dry season in May and June 1993) with no attempt to establish rating curves. Also, a number of the JICA measurement sites were influenced by tidal variations, where even measurements during low tide are likely to yield erroneous freshwater discharge rates. In our opinion, the JICA (1994) study is at best incomplete, and does not appear correct in view of the prevalence of high salinities and weak stratification in Baia de Guanabara. Although our analysis does not consider individual streams and rivers, and in spite of the fact that the runoff model is very simple, the monthly mean fresh water discharge is realistic and probably consistent with actual runoff values. However, this simple model should not be applied to individual runoff events as it only is a way to calculate long-term mean fresh water discharges from non-gauged drainage basins.
8. TIDAL AND LOW-FREQUENCY WATER LEVEL VARIABILITY
Baia de Guanabara experiences strong tidal variability with respect to both bay water level changes and currents, which respond primarily to the semidiurnal forcing. Harmonic amplitudes and phases (Franco, 1988) were calculated on the hourly DHN water level data from the 15 locations within the bay. The characteristics of the nine constituents with the largest response in Baia de Guanabara are shown in Table 2, and the harmonic amplitude and phase data are summarized in Table 3.

Oceanographic characteristics of an impacted coastal bay 1625
Fig. I I. Calculated monthly fresh water discharge (m3 s-') into Baia de Guanabara.
0
Table 2. The nine most important tidal constituents in Baia cie Guanabara
I I
Symbol
I I I I I
Constituent name Period Relative magnitude
Jan APr Jul Oct
Month
- -
Long-term Sa Mm
Diurnal 0 I KI
Solar annual Monthly lunar
365.24 days 27.55 days
Principal lunar 25.82 h Declinational luni-solar 23.93 h
Semidiurnal N2 Larger lunar elliptical 12.66 h M I Principal lunar 12.42 h Sz Principal lunar 12.00 h K2 Declinational luni-solar 1 1.97 h
Shallo~v-njater (non-astronomical) M4 First M2 over-tide 6.21 h -
All constituents are astronomical with the exception of M4. which is a shallow water constituent due to the asymmetry of the water level variation. The relative magnitude refers to the magnitude of the tide-producing force at the different constituent frequencies, where M2 has been assigned the value 100 (Defant, 1960).

Site Lat/Lon Year Days of record Sa Mm K , 0 , N2 M 2 SZ K2 M 4 M W L Form number
(s/ w) H/Gw H/Gw H/Gw H/Gw H/Gw H/Gw H/Gw H/Gw H/Gw z,(m)
TI. Fortaleza Santa Cruz 22"56.2/43"08.2 1979 T2. Cais do Porto 22"53.7/43"10.7 1965 T3. Ilha Fiscal 22"53.8/43"09.9 1965166 T4. Ponta da Armagio 22"53.0/43"08.1 1984-86 T5. Ilha da ConceigBo 22"52.0/43"07.0 1966 T6. Mocangu; Grande 22"52.3/43"07.9 1964 T7. Ponta do Caju 22"52.6/43"12.2 1966 T8. Born Jesus 22"52.0/43"12.0 1906107 T9. Ilha do Engenho 22"50.4/43"06.4 1978179 T10. Saco do PinhBo 22"46.8/43"10.3 1959 TI 1 , Ilha do Boqueiriio 22"46.0/43"09.1 1906107 T12. Ilha de Paqueta 22"45.6/43"06.6 1973 TI 3. Ilha de Brocoio 22"45.3/43"07.0 1909/10 T14. Batalha 22"43.8/43"09.0 1906107 T15. Foz do Rio Meriti 22"48.8/43"17.4 1972

Oceanographic characteristics of an impacted coastal bay 1627
The mean tidal range1 in Baia de Guanabara is approximately 0.7 m and does not vary significantly spatially. The fortnightly spring tidal range measures 1.1 m and the neap tidal range is 0.3 m, with a repeat cycle every half lunar month as can be expected in a predominantly semidiurnal regime. However, the semidiurnal tidal range is strongly modulated by the declinational fortnightly cycle with diurnal tides exhibiting a 0.4-m tropic tidal range and a 0.1-m equatorial tidal range, with a repeat cycle every half sidereal month.
The tidal form number is the ratio of the amplitude of the main diurnal and semidiurnal harmonic water level amplitudes
and indicates the type of tide (Defant, 1960). The mean form number for Baia de Guanabara is 0.33 with a variability from 0.28 to 0.41, indicating that the tide is mixed mainly semidiurnal.
A comparison of the tidal water level responses to the relative magnitudes of the tide- producing force (Table 2) indicates that K1 measures only 30% of its expected magnitude, N2 70%, O1 75%, whereas S2 is amplified and measures 120%. This is a demonstration of how the shape and depth of Baia de Guanabara modifies the tidal response. Considering the dimensions of Baia de Guanabara, the time for tidal progression from the bay entrance to the far reaches of the bay should be approximately 1 h. The tidal phases (epochs) listed in Table 3, indicate that the actual progression times are faster, with the semidiurnal constituent tides occurring everywhere within 21 min in the case of M2 and within 36 min in the case of S2. The diurnal constituents show more variability with respect to tidal progression, with O1 high tide occurring everywhere within 2.0 h and K1 showing still more deviation.
Further, the seven tide measurement sites with one or more years of data (Table 3) indicate that the annual signal, Sa, is more than ten times greater than expected based on the tide-producing force. The discrepancy is explained by the radiational response of the bay water level at the annual frequency because of the seasonal water temperature cycle, the freshwater runoff cycle, and possibly systematically varying wind and pressure effects. The seasonal mean sea level fluctuation measures approximately 6 cm near the ocean entrance (T2 and T3) and reach 22 cm at the inner margin of the bay (TI l), with the high water level occurring in December and January. On the average during a year, the mean sea level (Table 3) is as much as 6 cm higher at the inner reaches of the bay compared to the entrance of the bay, principally due to the discharge of fresh water at the northeastern extreme of the bay.
9. CURRENTS
Time series current meter measurements were made by JICA (1994) at three sites. They cover 15 days in October-November 1992 from two moorings (Cl and C2) near the bay entrance, each with surface and bottom current meters, and a third mooring (C3) with surface measurements only (Fig. 2). The current velocity data were subjected to harmonic
here 1s an unfortunate practice in much of the scientific Brazilian marine biology and marine geology literature, and also in common speech, to refer to tidalamplitucle when ~idalrange is intended. The range, ol'course, 1s the vertical distance between high and low waters and is twice as large as the amplitude.

1628 B. Kjerfve et al.
Table 4. Summary listing of harmonic amplitude (cm s-'1, Greenwich phase Gw (") (=epoch), and direction of major andminor axes ,'"T) of tidal currents measured by JICA (1994) from three sites, in two instances at two depths
per site, in Baia de Guanabara, 24 October-13 November 1992 --
Site C1 C 1 C2 C2 C3 Surface Bottom Surface Bottom Surface
Lat ("S)/Lon ("W) 22"54.3/43"09.2 22"54.2/43"09.2 22"54.3/43"08.5 22"54.3/43"08.5 22"50.0/43"09.3
Instrument depth (m) Mean water depth (m) Days of record Vector mean (cm s-'/"T) Ebb direction ("T) Flood direction ("T) K , (cm ~-~/"Gw/major "T) KI (cm s-'/"Gw/rninor "T) 0, (cm s-'/"Gw/major 'T) 0, (cm s-'/"Gw/rninor "T) M2 (cm s-'/"Gw/major "T) M2 (cm s-'/"Gw/minor "T) S2 (cm s-'/"Gw/major "T) S2 (cm s-'rGw/rninor "T) M4 (cm s-'/"Gw/major "T) M4 (cm s-'/"Gw/minor "T) Current form #
The current measurements were made every 10 min and directions refer to true north ("T). Magnetic north is currently 21 west of true north.
analysis by JICA (1994), and the results are synthesized in Table 4, and shown as tidal ellipses in Fig. 12. The vector tidal form number is less than 0.25 at each of these sites and depths (Table 4), indicating that the currents primarily are semidiurnal in nature with a smaller diurnal contribution as compared to the water level variations.
The harmonic analysis of the current meter records, show that the currents in the entrance cross-section largely oscillate rectilinearly towards 165"T on ebb tides and towards 345"T on flood tides (Table 4). JICA (1994) found that measured flood currents were systematically faster than ebb currents. Peak flood currents reached values of 0.85 m s-' and 1.56 m s-' near the surface at stations C1 and C2, respectively, and 0.96 m s-' and 1.05 m s- ' near the bottom. Maximum ebb speeds, in comparison, measured 0.65 m s-' and 1.37 m s-' near the surface at station C1 and C2, respectively, and 0.57 m s-' and 0.53 m s-' near the bottom (JICA, 1994). Maximum measured flood and ebb currents at station C3 near the surface in the main channel reached 0.54 m s-' and 0.44 m s- ', respectively (JICA, 1994). Peak current speeds decrease by a factor 3-4 on neap tides as compared to spring tides.
Shallow water tidal effects are primarily represented by the M4 constituent and are the result of friction and other local nonlinear effects. The shallow water effect is appreciable in both water level (Table 3) and current variations (Table 4), and is signified by large asymmetries in the ebb-flood current distribution. The average range of M4 water level variations is 13 cm or 19% of M Z The Mq currents are very large with an amplitude between 0.10 and 0.25 m s-' for the five current meter records, or between 42% and 54% of the MZ current amplitudes. Shallow water effects are not explained by astronomical forcing.
The phase of currents relative to water level variations is neither uniform nor

Oceanographic characteristics of an impacted coastal bay 1629
Fig. 12. Harmonic current ellipses for the K I , 01, M2 and S2 constituents from the near surface measurements at C1, C2, and C3 in October-November 1992, drawn to the same scale.
straightforward. In the Gragoata-Santos Dumont cross-section, the peak M2 flood current along the major axis (into and out of the bay) lags high tide by an average 120" or by 30" more than can be expected in an ideal standing tide, while the S2 peak flood current along the major axis lags high tide by 130" or 40" more than for an ideal standing tide. Bottom

1630 B. Kjerfve et al.
friction presumably is the main dynamic reason for these phase shifts. These conclusions are based on inspection of the currents measured at C 1 and C2 and tides at T2 and T3 (Tables 2 and 3). Whereas the M2 and S2 harmonics account for 62% of the diurnal-semidiurnal tidal variations, they account for more than 70% of the diurnal-semidiurnal currents. At current meter location C3, the situation is very similar.
10. SALINITY AND TEMPERATURE DISTRIBUTIONS AND VERTICAL STRATIFICATION
Baia de Guanabara is characterized by high salinities and temperatures. Based on 775 measurements by FEEMA near the surface and near the bottom at 13 stations (Fig. 1) during the period 198&1993, the mean salinity was 29Sf 4.8%0 with a total range from 9.9 to 36.8%0. Based on 660 measurements by FEEMA from the same depths and stations, the mean water temperature is 24.2 f 2.6"C with a total range from 17.0 to 31 .O°C. The mean and rms salinity and temperatures measured at the 13 FEEMA stations (Wl-W13) (Fig. 2) are shown in Table 5.
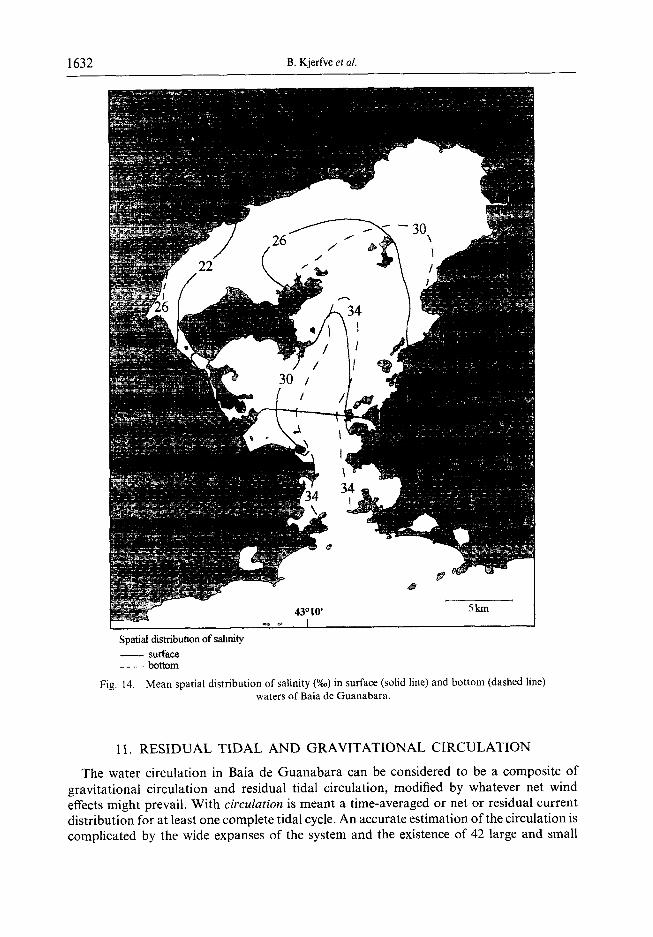
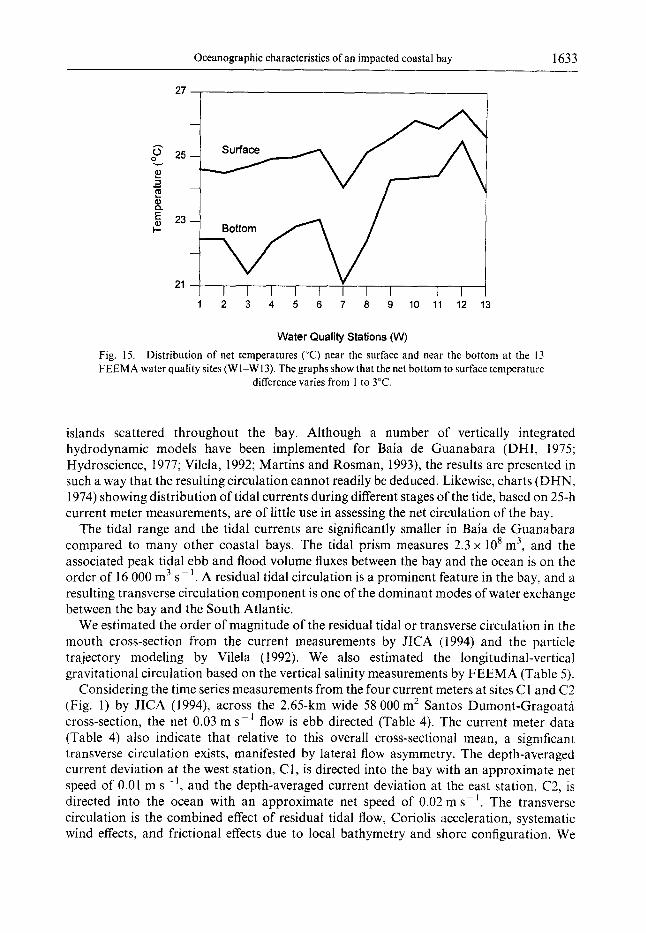
As can be expected, the net salinity (Figs 13 and 14) decreases horizontally from the ocean entrance towards the inner reaches of Baia de Guanabara, at the surface from 3 1 .8%0 (W 1) to 21.0%0 (W12) and near the bottom from 34.59%0 (W3) to 26.1%0 (W12), in response to the discharge of fresh water along the interior margins. At the same time, the temperature (Fig. 15) increases from the ocean entrance to the inner reaches of the bay, at the surface from 24.6"C (Wl) to 26.5"C (W12), and near the bottom from 21.4"C (W3) to 25.5"C (W12), in response to the advection into the bay of colder ocean water. The entrance of cold water into Baia de Guanabara on a regular basis, particularly during the austral summer, is associated
Table 5. Summury mean + rms values ofsalinity (%o) and temperature ("C) in surface and bottom waters o f Baia de Guanabara based on data collected by FEEMA 1980-1992
Site no. (FEEMA #) Sal (%o) (0 m depth) Sal (%o) (depth) Temp. ("C) (0 m depth) Temp ("C) (depth)
Mean + rms
Each set of mean and rms values are based on approximately 30 observations in the period 1980-1993. The total statistics for salinity are based on 775 titrations and the total number for temperature is based on 610 observations. The total range of salinity variations was 9.9-36.8%0, and the total range of temperature variations was 17.0- 3 1 .PC.

Oceanographic characteristics of an impacted coastal bay 1631
Water Quality Stations (W)
Fig. 13. Distribution of net salinities (%a) near the surface and near the bottom at the 13 FEEMA water quality sites (WI-W13). The graphs show that the net bottom to surface salinity difference
varies from 2 to 5%0 but typically measures 2%0.
with the Ilha do Cabo Frio upwelling system, centered 100 km to the east of the bay entrance with cold waters, often 13-15T, surfacing as the Brazil current veers from the coast, allowing South Atlantic Central Waters to ascend onto the shelf and upwell (Martin and Flexor, 1992). It should be noted that the very deep W7 station in the central channel is trapping salty and cold water with a net salinity of 34.4%0 and a net temperature of 21. I "C at a depth of 24 m.
The vertical salinity (density) stratification is moderate to weak with the vertical net salinity difference seldom exceeding 4%0. The non-dimensional net stratification parameter As/s (Hansen and Rattray, 1966) varies between 0.21 and 0.06, is more pronounced near the freshwater sources, and averages 0.08 in the Santos Dumont-Gragoata cross-section. Another measure of the dynamic vertical stratification is the non-dimensional Estuarine Richardson number
I t is the ratio of buoyancy energy from river freshwater input and the kinetic tidal energy in breaking down stratification (Fischer, 1972; Fischer et al., 19791, where g is gravity, p is mean water density, and Ap is the difference between ocean and river water densities as calculated from the temperature and salinity data (Fofonoff and Millard, 1983) (Table 5). B is channel width, and u,,,, is the root mean square tidal current speed. As the Estuarine Richardson number transits from 0.08 to 0.8, a system varies from well mixed to strongly stratified (Fischer er a/., 1979). Considering the typical u,.,, value in the Santos Dumont- Gragoata section to be 0 .7msP ' , where B=2.65 km, and Ap/p=0.027 kgm-', the Estuarine Richardson number measures 0.03 in the bay entrance area, indicating well mixed conditions. However, further into the bay with lower u,.,,,, velocities and a greater width, the Estuarine Richardson number increases to 0.1 in the bridge cross-section, indicating a moderately stratified system.
1632 B. Kjerfve et al.
I I I
Spatial distribution of dni ty - surface - - - - bottom
Fig. 14. Mean spatial distribution of salinity (%o) in surface (solid line) and bottom (dashed line) waters of Baia de Guanabara.
11. RESIDUAL TIDAL AND GRAVITATIONAL CIRCULATION
The water circulation in Baia de Guanabara can be considered to be a composite of gravitational circulation and residual tidal circulation, modified by whatever net wind effects might prevail. With circulation is meant a time-averaged or net or residual current distribution for at least one complete tidal cycle. An accurate estimation of the circulation is complicated by the wide expanses of the system and the existence of 42 large and small
Oceanographic characteristics of an impacted coastal bay 1633
Water Quality Stations (W)
Fig. 15. Distribution of net temperatures ("C) near the surface and near the bottom at the 13 FEEMA water quality sites (WI-W13). The graphs show that the net bottom to surface temperature
difference varies from 1 to 3°C.
islands scattered throughout the bay. Although a number of vertically integrated hydrodynamic models have been implemented for Baia de Guanabara (DHI, 1975; Hydroscience, 1977; Vilela, 1992; Martins and Rosman, 1993), the results are presented in such a way that the resulting circulation cannot readily be deduced. Likewise, charts (DHN, 1974) showing distribution of tidal currents during different stages of the tide, based on 25-h current meter measurements, are of little use in assessing the net circulation of the bay.
The tidal range and the tidal currents are significantly smaller in Baia de Guanabara compared to many other coastal bays. The tidal prism measures 2.3 x lo8 m3, and the associated peak tidal ebb and flood volume fluxes between the bay and the ocean is on the order of 16 000 m3 s-I. A residual tidal circulation is a prominent feature in the bay. and a resulting transverse circulation component is one of the dominant modes of water exchange between the bay and the South Atlantic.
We estimated the order of magnitude of the residual tidal or transverse circulation in the mouth cross-section from the current measurements by JICA (1994) and the particle trajectory modeling by Vilela (1992). We also estimated the longitudinal-vertical gravitational circulation based on the vertical salinity measurements by FEEMA (Table 5).
Considering the time series measurements from the four current meters at sites C1 and C2 (Fig. 1) by JICA (1994), across the 2.65-km wide 58 000 m2 Santos Dumont-Gragoati cross-section, the net 0.03 m s-' flow is ebb directed (Table 4). The current meter data (Table 4) also indicate that relative to this overall cross-sectional mean, a significant transverse circulation exists, manifested by lateral flow asymmetry. The depth-averaged current deviation at the west station, C1, is directed into the bay with an approximate net speed of 0.01 m s-l, and the depth-averaged current deviation at the east station, C2, is directed into the ocean with an approximate net speed of 0.02 m s- ' . The transverse circulation is the combined effect of residual tidal flow, Coriolis acceleration, systematic wind effects, and frictional effects due to local bathymetry and shore configuration. We

1634 B. Kjerfve et al.
assume that equally much water enters and leaves the bay at the same time as a result of the transverse circulation. We also assume that the transverse and gravitational circulation modes are weakly coupled and thus can be treated independently. If the average transverse circulation velocity is taken to be 0.015 m s-I, the transverse circulation is manifested by a bay-directed transport of approximately 400 m3 s-' in the western part of the cross-section and an equal seaward transport in the eastern half of the cross-section. In view of the limited cross-sectional flow data, the calculations of the transverse circulation should only be considered an order of magnitude estimate.
The fresh water discharge, mixed by tide and wind action, produces an internal density distribution in the bay. The density distribution is manifested by systematic longitudinal- vertical salinity gradients from bay to ocean. These give rise to pressure gradients, which drive a gravitational circulation with net outflow (Q,,,) in a surface layer and net inflow at depth (Qin). In the entrance to the bay, the net advective water balance can be written
where rainfall and evaporation are approximately equal. Considering the bay system to be two-layered with ss being the net surface salinity and s~ being the net bottom layer salinity, in a steady state situation, the salt balance can be expressed as
Qour ss + Qin S B = 0 (7)
Combining equation (6) and equation (7), it is possible to calculate the net discharges involved in the gravitational circulation in the entrance section from
.? E
Using the mean river discharge (Table l), and mean salinity data from site W3 (Table 5), which best represents the entrance to the bay although it is located 3 km inside the Santos Dumont-Gragoata cross-section, we calculated Q,,, z 900 m3 s- ' and Qin - 800 m3 s- I. Since horizontal eddy diffusion has been ignored, and all horizontal exchanges are assumed to be advective, the calculated magnitude of the gravitational circulation is also an order of magnitude estimate. The energetic ebb-flood oscillatory tidal current produces a longitudinal net turbulent diffusive exchange which has been ignored in this analysis.
The water volume which participates in the two-layered gravitational circulation is nine times greater than the freshwater input, most likely with significant variations between the dry season (diminished gravitational circulation) and the wet season (increased gravitational circulation). At the same time, the average transverse circulation is approximately four times larger than the freshwater input, and varies strongly between spring (enhanced) and neap (diminished) tides.
According to the Hansen and Rattray (1966) non-dimensional circulation-stratification classification, Baia de Guanabara is a type 2a system near the entrance (Fig. I), type 2b further into the bay, and, probably l a and l b elsewhere. Dynamically the bay is similar to many coastal plain estuaries with a large residual tidal transverse circulation component. The non-dimensional parameter v is on the order of 0.5, indicating that half of the salt transported into the bay is due to the gravitational circulation and the remainder due to longitudinal and transverse tidal dispersion. But then Baia Guanabara is in reality three- dimensional, and in this respect different from the two-dimensional representation of the Hansen and Rattray (1966) classification model.

Oceanographic characteristics of an impacted coastal bay 1635
12. WATER RENEWAL
One measure of water renewal in coastal systems is calculation of the time for renewal of 50% of the water volume. Pritchard (1961) assumed a first-order kinetic relationship and steady state conditions, such that
where Wrepresents the mass of water present in the bay at an arbitrary starting time; and K
is a rate constant (s-'), defined by the ratio of the sum of all water inputs to the system divided by the bay volume (Kjerfve et al., 1996)
K = QR + QP + Qin + Q ~ r a n s v where QR is the river discharge; Qp is the direct precipitation on the bay surface; Qin is the bay inflow due to the gravitational circulation; err,,, is the inflow due to the transverse circulation, and V is the mean bay volume, 1.87 x lo9 m3. Integration of equation (9) from an arbitrary starting time to such a time that 50% of the original water volume in the system has been renewed yields the 50% renewal time
which besides steady state requires that the bay is well mixed on a time scale which is short relative to ~ S ~ O / , , the 50% water renewal time. To calculate T S O % , we assumed the flux terms to measure QR= 100 m3 s-I, Q ~ = 12 m3 s-I, e in=800 m3 s-I, and ~,,,,,=400 m3 s- ' . It then follows that the time for renewal of 50% of the water volume in Baia de Guanabara is 11.4 days. This rapid water renewal explains why Baia de Guanabara has relatively good water quality in the lower parts of the bay in spite of the input of huge quantities of untreated sewage. However, since Baia de Guanabara most certainly is not well mixed on a time scale of a few days, the calculated T ~ ~ % water renewal rate should be considered as a mean bay estimate with renewal times in the interior parts of the bay being significantly longer.
13. WATER QUALITY
Although the FEEMA water quality data have been collected from 13 sites in Baia de Guanabara (Wl-W13) (Fig. 2) between 1980 and 1993, weak experimental design and inadequate repeat sampling make temporal trend analysis impossible. However, the extensive data set does allow for spatial analysis of water quality parameters. The data are summarized in Table 6.
Higher mean concentrations of nutrients are found near the inner western margin of the bay, due to enrichment from sewage runoff and less efficient water renewal. At the innermost sites, there are significant differences in total nitrogen, total phosphorus, ammonia, and phosphate concentrations between surface and bottom waters. Nutrient concentrations are elevated in low salinity surface waters, reflecting the runoff source, whereas no significant vertical nutrient variation otherwise exists. At the innermost sites, ammonia is elevated tenfold and phosphate fivefold as compared to measurements near the bay entrance. The

1636 B. Kjerfve et al.
Table 6 . Summary meanf rms values of total nitrogen ( T N ) , total phosphorus ( T P ) , ammonia ( N U 3 ) , nitrate (NO3), nitrite ( N 0 2 ) , phosphate (POI) , chlorophyll a, dissolved oxygen, and fecal coliform in surface and bottom
waters of Baia de Guanabara, based on samples collected by FEEMA 1980-1993
Site Depth TN TP NH3 NO1 NO1 PO4 Chl-a DO Fecal coliform pg-at N I - ' pg-at P I -' pg-at N I-' pg-at N I - ' pg-at N I-' pg-at P I - ' pg-at N I- ' mg I - ' (100 ml)-'
W1 (#24) surface 63.9f 28.0 2.2k0.7 3.2k3.4 bottom 64.8k27.4 2.5k0.9 8.6k6.6
W2 (#64) surface 60.7k33.8 2.4f0.9 2.9k3.3 bottom 61.4k34.6 2.2k0.8 3.6k2.6
W3 (#63) surface 57.7k21.7 2.2k0.8 2.5+ 3.3 bottom 47.8f26.9 2.0f0.7 5.5f2.8
W4(#26) surface 69.2k31.2 2.8f 1.3 3.7f 4.5 bottom 75.2k37.9 2.9f 1.2 8.2k6.2
W5 (#22) surface 83.3k70.0 l3.4f 4.2 38.6f35.6 bottom 83.3k31.9 6.8k 1.1 17.7k9.7
W6 (#28) surface 137.2k 51.4 6 .75 2.8 28.6f 19.2 bottom 89.5k40.8 3.52 1.0 12.9k9.3
W7 (#62) surface 50.9k26.3 2.7+ 1.0 3.4k3.6 bottom 50.9k 18.0 2.Sf 1.1 5.6f2.8
W8 (#27) surface 68.8+ 31.6 2.7f 1.4 2.0f 2.2 bottom 59.4k23.9 2 S f 0.7 8.9k4.8
W9 (#O) surface 76.4k32.4 3.4+ 1.6 1.7+ 1.4 bottom 64.2k36.2 3.5+ 1.3 4.1 k4.0
W10(#42) surface 111.6f 34.2 5.3k2.7 6.9f 10.1 bottom 94.9k41.6 4.8k2.7 8.7k7.9
Wl l (#20) surface 226.3 k86.4 l3.4f 7.4 44.7f 35.8 bottom 141.3k52.7 6.8k3.1 28.1 k20.4
W12 (#40) surface 330.0k 140.3 25Sf 16.2 124.2k82.3 bottom 235.4k77.0 l4.7f 4.8 91.2k48.6
W13 (#43) surface 209.8k60.3 12.3k4.0 56.2k23.1 bottom l39.Sf 47.7 7.5k 1.7 36.9k 17.1
Each set of mean and rms values are based on approximately 30 observations. The bottom sampling depth for each stations is shown in Table 5.
percentage of the ammonia fraction in the dissolved inorganic nitrogen rises from 55% in the lower bay to 90% near point sources of runoff. At the same time, the dissolved inorganic phosphorus and nitrogen fractions increase from 15% in the lower bay to 35% in the inner western part of the bay, as compared to the total P and N content in the bay, calculated from the values in Table 6.
There are also significant differences in total dissolved nitrogen, total dissolved phosphorus, ammonia, and phosphate concentrations between surface and bottom waters at the inner sampling stations. Higher concentrations are found in less saline surface waters, reflecting the freshwater source of these nutrients. In particular, the ammonia and phosphate values suggest sewage influence.
The mean N:P ratio in Baia de Guanabara is 14, calculated as the atomic ratio of dissolved inorganic nitrogen (NH3 + NO3) to dissolved inorganic phosphorous (PO4) for 427 individual sets of observations. Surface values are on the average 13, and bottom values 14.8. Dissolved nitrogen and phosphorus ratios vary substantially between coastal systems and reflect the net consequence of all uptake and regeneration processes of each nutrient (Nixon and Pilson, 1984). For eutrophic systems, Ryther and Dunstan (1971) suggested a N:P ratio lower than the Redfield ratio (16), since the N:P ratio for domestic sewage is approximately 10 (Barnes and Hughes, 1988). On the other hand, Boynton et al. (1982) have found higher N:P ratios in heavily anthropogenically-enriched estuaries (e.g. Venice

Oceanographic characteristics of an impacted coastal bay 1637
Lagoon, Italy, and Hudson River, U.S.A.). This is also the case for Baia de Guanabara, where the N:P ratio varies from 15.5 to 19.7 in the bottom waters at the most polluted sites, where anoxic conditions are present and biogeochemical phosphorous trapping may occur close to the reduced water-sediment interface.
Dissolved oxygen concentrations show large temporal fluctuations in both surface and bottom waters. Mean values do not vary significantly horizontally with the exception of sites near the discharge of pollution-rich runoff, where bottom dissolved oxygen concentrations varied from 3.1 to 4.3 mg 1-' (Fig. 16). On the other hand, the bay is strongly stratified vertically with dissolved oxygen in the bottom layer on the averaged lowered by 2.3-4.8 mg 1-' (2045%) as compared to surface waters. In the surface waters, the mean dissolved oxygen concentration for all stations is 8.4 mg 1-' (124% saturation) and in the bottom layer 5.1 mg 1-' (73% saturation). Dissolved oxygen concentrations at times reach anoxic conditions at the inner bay sites near the bottom. Surface waters, in contrast, are frequently supersaturated with respect to dissolved oxygen, even in highly polluted areas, which reflects the high rate of phytoplankton primary production (Rebello et al., 1988). The consumption of dissolved oxygen in oxygenation of sewage organic matter at the innermost bay sites is consistent with very high levels of biochemical oxygen demand (BOD).
Anoxic bottom waters in heavily polluted coastal systems allow heavy metals to be incorporated into bottom sediments by means of sediment trapping. This keeps many toxic and harmful heavy metals and other substances from being taken up by the biota (Carvalho and Lacerda, 1992). However, should the anoxic sediments in the future become oxygenized, remineralization of heavy metals, trapped nutrients, and organic substances would most likely show increased concentrations in the water column. This could potentially result in health and water quality problems. Improved treatment of sewage reaching the bay would most likely increase the dissolved oxygen concentration in the water column, and could act to increase the rate of remineralization of materials trapped and buried within the bottom sediments.
In spite of the common occurrence of background fecal coliform bacteria in the marine environment (Hagler et al., 1993), high fecal coliform concentration is nevertheless a certain indicator of the presence of domestic sewage pollution. Although the main part of the bay has relatively low levels of fecal coliform counts, on the average measuring only 0.2- 10 counts ml-I, there is a serious problem at the sampling sites in the inner parts of the bay near sources of untreated sewage sources, where counts on average exceed 1000 counts ml-' and often reach > 1400 counts ml-', e.g. at site W12.
Chlorophyll a was only measured near the surface. Based on a total of 378 observations at the 13 sites, concentrations were very high even for a eutrophic bay. The mean concentration was 57 pgl- ' , and concentrations at the innermost stations were systematically highest. This is explained by the ample availability of dissolved nutrients which enter the bay along the inner margins in the form of raw sewage. Chlorophyll a values at sites in the central channel do not exceed 25 pg I-', while the concentration ranged from 50 to 134 pg 1- ' at sites in the northernmost parts of the bay. The exception is site W9, which is located closest to the large Guapimirim mangrove area. The mangroves presumably help to filter sediments and nutrients from the water column, and as a result, the mean chlorophyll a concentration only measures 27 pg 1-I.

1638 B. Kjerfve et al.
I - - 0 I I Spatial distribution of dissolved oxygen (rng F' ) - surface - - - - bottom
Fig. 16. Mean spatial distribution of dissolved oxygen (mg I - ' ) in surface (solid line) and bottom (dashed line) waters of Baia de Guanabara.
14. A POLLUTED EUTROPHIC BAY
In Brazil, CONAMA (1986) prescribes use of water bodies according to water quality criteria based on concentrations of dissolved oxygen, BOD, fecal coliform, and other parameters. Although Baia de Guanabara is a highly impacted coastal bay, the major part of the bay still has waters classified for secondary human impact, i.e. yachting, recreational fishery, etc. On the other hand, the western and innermost parts of the bay near Ilha

Oceanographic characteristics of an impacted coastal bay 1639
Governador and Ilha do Fundiio are seriously impacted with polluted runoff with elevated levels of nitrogen and phosphorus compounds, allowing for intense phytoplankton production. In this inner part of the bay, Secchi disk depths are less than 0.75 m, and suspended solids concentrations greater than 25 mg 1-' (JICA, 1994). This is also where dissolved oxygen concentrations are lowest, and chlorophyll a and fecal coliform concentrations are highest. Baia de Guanabara suffers from being both a polluted and eutrophic coastal bay.
A number of investigators (Caphia, 1984; Lacerda et al., 1988; Barrocas, 1994) have demonstrated that high levels of heavy metals are buried within the highly anoxic sediments in the inner reaches of Baia de Guanabara. If current efforts to improve the water quality are to succeed during the coming decades, care must be taken not to dredge or otherwise disturb the bottom sediments in the inner bay. Oxidation of these sediments in all likelihood would result in dissolution and release of heavy metals, and therefore pose the risk of organisms incorporating these metals into the food web. An example of a potential risk to human health is the mussel, Perna perna L., which is harvested on a commercial scale in Baia de Guanabara (Rezende and Lacerda, 1986). Thus, the improvement of the bay water quality, especially when combined with aeration of anoxic sediments is a potential health risk. Cleaning up Baia de Guanabara is not a simple problem and the heavy metals, nutrients, and organic matter trapped in the bottom sediments in the inner portion of the bay can be thought of as a time bomb still to be detonated.
Acknowledgements-This work was funded with resources from Conselho Nacional de Desenvolvimento Cientifico e Tecnologico (CNPq) and Fundagrio de Amparo a Pesquisa do Estado do Rio de Janeiro (FAPRJ). We thank those agencies and individuals who shared their data with us, especially DHNand FEEMA. In particular, we would like to thank Maria Helena Severo de Souza and Ana Claudia de Paula of DHN for help to obtain the harmonic constants and for verifying the correctness of the computed current phase lags, respectively. We would also like to extend our thanks to Victor Monteiro Barbosa Coelho and Elizabeth Cristina da Rocha Lima of FEEMA for help in obtaining the JICA (1994) report and the FEEMA water quality data set. This is contribution no. 11 16 from the Belle W. Baruch Institute for Marine Biology and Coastal Research.
REFERENCES
Ahumada, B. R., Rudolph, A. and Martinez, V. (1983) Circulation and fertility of waters in Concepcion bay. Estuarine, Coastal and Shelf Science 16, 95-105.
Alclntara, F. and Washington, D. C. (1989) An analytical synoptic-dynamic study about the severe weather event over the city of Rio de Janeiro on Jan 2, 1987. In Coastlines of Brazil, eds. 0. Magoon and C. Neves, pp. 195-204. American Society of Civil Engineers, New York, NY.
Almeida, F. F. M. (1976) The system of continental rifts bordering the Santos Basin. Anais da Academia Brasileira de Ciincias 58(suplemento), 15-26.
Amador, E. S. (1974) Praias fosseis de rechcavo da Baia de Guanabara. Anais da Academia Brasileira de Citncias 46, 253-262.
Amador, E. S. (1980) Assoreamento da Baia de Guanabara - taxas de sedimenta~lo. Anais da Acudemia Brasileira de Ciincia 52(4), 723-742.
Amador, E. S. (1980) Unidades sedimentares cenbzoicas do rechcavo da Baia de Guanabara (folhas Petropolis e Itaborai). Anais da Academia Brasileira de Ciincia 52(4), 743-761.
Amador, E. S. (1992) Sedimentos de fundo da Baia de Guanabara - uma sintese. In Anais do III Congresso da Associapfo Brasileira de Estudos do Quaternario - ABEQUA, pp. 199-224. Belo Horizonte, MG, Brazil.
Amador, E. S. and Ponzi, V. R. A. (1974) Estratigrafia e sedimentaqfio dos depositos fluvio-marinhos da orla da Baia de Guanabara. Anais da Academia Brasileira de CiCncias 46, 253-262.
Amador, E. S. (1993) Baia de Guanabara: um balanpo historico. Capitulo 7. In Natureza e sociedade no Rio de Janeiro, M. A. Abreu, organizador, pp. 201-258. Prefeitura do Rio de Janeiro, RJ, Brazil, DGDIC.

1640 B. Kjerfve et al.
APHA (1975) Standard Methods for the Examination of Water and Wastewater, 14th edn. American Public Health Association, APHA-AWWA-WPCF, Washington, DC, 847 pp.
Asmus, H. E. and Ferrari, A. L. (1978) Hip6tese sobre a causa do tectonismo Cenozonico na regiLo sudeste do Brasil. Aspectos Estructurais da Margem Continental Leste e Sudeste do Brasil. SPrie Projeto REMAC 4, 75-88.
Araujo, M. A., GuimarLes, V. F., Mendon, L. C. and Hagler, A. N. (1990) Staphylococcus aureus and fecal Streptococci in fresh and marine surface waters of Rio de Janeiro, Brazil. Revista de Microbiologia 21(2), 141-147.
Ara~jo , F. V., van Weerelt, M. D. M., Franco, G. M. O., Soares, C. G. A., Hagler, A. N. and Mendon~a-Hagler, L. C. (1991) Classification based on coliform count of coastal waters in metropolitan Rio de Janeiro, Brazil. In Coastal Zone PI, Vol. 4 , Proceedings of the VZZ Symposium on Coastal and Ocean Management, eds. 0 . T. Magoon, H. Converse, V. Tippie, L. T. Tobin and D. Clark, pp. 3246-3258. American Society of Civil Engineers. Long Beach, CA.
Barnes, R. K. S. and Hughes, R. N. (1988) An Introduction to Marine Ecology, 2"* edition. Blackwell Scientific Publications, London, 351 pp.
Barrocas, P. R. G. (1994) Geoquimica do mercurio nos sedimentos do Rio SLo JoLo de Meriti: sistema da Baia de Guanabara. M S . thesis, Departamento de Geoquimica, Universidade Federal Fluminense, Niteroi, RJ, Brazil, 132 pp.
Batista Neto, J. A. (1993) Sedimentologia e geomorfologia da Enseada de Jurujuba (Baia de Guanabara). M.S. thesis, Departamento de Geologia, Universidade Federal Fluminense, Niterbi, RJ, Brazil, 131 pp.
Boynton, W. R., Kemp, W. M. and Keefe, C. W. (1982) A comparative analysis of nutrients and other factors influencing estuarine phytoplanktonic production. In Estuarine Comparisons, ed. V. S. Kennedy, pp. 69-90. Academic Press, New York, NY.
Braga, C. Z. F., Setzer, A. W. and Lacerda, L. D. (1993) Water quality assessment with simultaneous Landsat- 5 TM data at Guanabara Bay, Rio de Janeiro, Brazil. Remote Sensing of Environment 45, 95-106.
CaGBnia, A. J. (1984) Distribui@o de cobre, chumbo e zinco em sedimentos superficiais da area norte da Baia de Guanabara, Rio de Janeiro. M.S. thesis, Departamento de Geoquimica, Universidade Federal Fluminense, Niter&, RJ, Brazil, 73 pp.
Carvalho, C. E. V. and Lacerda, L. D. (1992) Heavy metals in Guanabara Bay biota: Why such low concentrations? Ciincia e Cultura 44, 184-186.
CDRJ (1993) Relatorio estatistico anual - 1992. Companiha Docas do Rio de Janeiro. Rio de Janeiro, RJ, Brazil.
Coelho, V. M. D and Fonseca, M. R. M. B. (1977) UtilizaqLo de modelos matematicos da Baia de Guanabara no controle da poluipiio de suas aguas. In Meio ambiente: varios estudos, pp. 121-143. ParticipaGLo da Fundaplo Estadual de Engenharia do Meio Ambiente (FEEMA) no IX Congresso Brasileiro de Engenharia Sanitaria. Cadernos FEEMA, FEEMA-DICOMT, S6rie Tecnica 2. Rio de Janeiro, RJ, Brazil, 228 pp.
CONAMA (1986) Resolugko n 20. Conselho Nacional do Meio Ambiente. Brasilia, DF, Brazil. Conomos, T. J. (ed.) (1979) San Francisco Bay: The Urbanized Estuary. Pacific Division of the American
Association for the Advancement of Science, San Francisco, CA. Defant, A. (1960) Physical Oceanography, Vol. 2. Pergamon Press, New York, 598 pp. DENEMET (1992) Normais Climatologicas (1961-1990) EstaGLo Aterro do Flamengo. Ministerio da
Agricultura e Reforma Agraria, Secretaria Nacional de Irrigagio, Departamento Nacional de Meteorologia, Rio de Janeiro, RJ, Brazil.
DHI (1975) Baia de Guanabara: System 21 demonstration. Danish Hydraulics Institute Technical Report, Niterbi, RJ, Brazil.
DHN (1974) Cartas de correntes de mare: Baia de Guanabara. 1" edi@o. DG-10-V-1. Departamento de Hidrografia e Navegago, Niteroi, RJ, Brazil, 15 pp.
Dias, G. T. M. (1989) Baia de Guanabara - Faceis sedimentares superficias. Sismo estratigrafia. Resumo l o Congresso Sociedade Brasileira de Geofisica, Rio de Janeiro, RJ, Brazil.
FEEMA (1978) ZmplantapTo da rede de monitoragem na Regiko Metropolitana. Projeto FUNDREM 068.6.01.1, 3 volumes. Fundacgo Estadual de Engenharia do Meio Ambiente, Rio de Janeiro, RJ, Brazil, 178 pp.
FEEMA (1979) Manual do meio arnbiente: sistema de licenciamento de atividades poluidoras (SLAP) . Manual de procedimentos, normas e leg is lap?^. FundagLo Estadual de Engenharia do Meio Ambiente. FEEMAIAGGS. Rio de Janeiro, RJ, Brazil, 305 pp.
FEEMA (1983) Manual do rneio ambiente: rnitodos. Funda~iio Estadual de Engenharia do Meio Ambiente. FEEMAIDICOMT, Vol. 2. Rio de Janeiro, RJ, Brazil, 126 pp.

Oceanographic characteristics of an impacted coastal bay 1641
FEEMA (1990) Projeto de recuperapTo gradual do ecosshtema da Baia & Guanabara, Vol. 1. FundaqLo Estadual de Engenharia do Meio Arnbiente, Rio de Janeiro, RJ, Brazil, 203 pp.
Ferrari, A. L. (1990) A geologia do "Rift" da Guanabara (RJ) na sua po rgo centro-ocidental e sua relap50 com o embasamento prh-cambriano. In Anais do XXXVZ Congresso Brasileiro & Geologia, pp. 2858-2871. Natal, RN, Brazil.
Ferreira, H. 0 . (1995) Aporte de hidrocarbonetos de petroleo para a Baia de Guanabara. M.S. thesis, Departamento de Geoquimica, Universidade Federal Fluminense. Niterbi, RJ, Brazil, 86 pp.
Filippo, A. M. (1997) Passagem de frentes frias na Baia de Guanabara: impact0 no nivel do mar. M.S. thesis, Departamento de Geoquimica, Universidade Federal Fluminense.
Fischer, H. B. (1972) Mass transport mechanisms in partially stratified estuaries. Journal of Fluid Mechanics 53, 672487.
Fischer, H. B., List, E. J., Koh, R. C. Y., Imberger, J. and Brooks, N. H. (1979) Mixing in Inland and Coastal Waters. Academic Press, New York, 483 pp.
Flores Jr., R. G., Barreto, M. K. and Costa, H. R. (1979) On the relationship between ecological and physio- chemical water quality parameters: a case study at the Guanabara Bay, Rio de Janeiro. In Ecological Diversity in Theory and Practice. Statistical Ecological Series, Vol. 6, eds. J. F. Grassle, G. P. Patil, W. Smith and C. Tallie, pp. 195-206. International Co-operative Publishing House, Fairland.
Fofonoff, N. P. and Millard, R. C. (1983) Algorithms for Computation of Fundamental Properties of Seawater. Unesco Technical Paper in Marine Science, 44, 53 pp.
Franco, A. F. (1988) Tides: Fundamentals, Analysis and Prediction, second edition. FundagiXo Centro Tecnologico de Hidraulica, SBo Paulo, SP, Brazil, 249 pp.
Grasshoff, K., Ehrhardt, M. and Kremling, K. (eds.) (1983) Methods of Seawater Analysis, 2nd edition. Verlag Chemie, Weinheim, 419 pp.
Hagler, A. N., Rosa, C. A,, Morais, P. B., Hagler, L. C. M., Franco, G. M. O., Araujo, F. V. and Soares, C. A. G. (1993) Yeasts and coliform bacteria of water accumulated in bromeliads of mangrove and sand dune ecosystems of Southeast Brazil. Canadian Journal of Microbiology 39, 973-977.
Hansen, D. V. and Rattray, M. (1966) New dimensions in estuary classification. Limnology and Oceanography 11, 319-326.
Holland, H. D. (1978) The Chemistry of the Atmosphere and Oceans. John Wiley and Sons, New York, 351 pp. Hydroscience (1977) Water Quality Model of Guanabara Bay. Environmental Control Programme in the State of
Rio de Janeiro, Brasil. BRA-731003 Technical Report 5. Report prepared for the World Health Organization (WHO) acting as Executive Agency for the United Nations Development Program (UNDP). Hydroscience, Inc., New Jersey, 142 pp., Appendices A-J.
IBGE (1991) Sinopse preliminar do censo demografico de 1991. FundagPo Institute Brasileiro de Geografia e Estatistica 18, Rio de Janeiro, RJ, Brazil, 78 pp.
JlCA (1994) The Study on Recuperation of the Guanabara Bay Ecosystem, 8 volumes. Japan International Cooperation Agency. Kokusai Kogyo Co., Ltd., Tokyo.
Kjerfve, B. (1 990) Manual for Investigation of Hydrological Process in Mangroves I~cosystems. UNESCO,IUNDP, New Delhi, 79 pp.
Kjerfve, B. (1994) Coastal lagoons. In Coastal Lagoon Processes, ed. B. Kjerfve, pp. 1-8. Elsevier, Amsterdam. Kjerfve. B., Schettini, C. A. F., Knoppers, B., Lessa, G. and Ferreira, H. 0 . (1996) Hydrology and salt balance in
a large hypersaline coastal lagoon: Lagoa de Araruama, Brazil. Estuarine, Coastal and Shelf Sciences 42, 701-725.
Koppen, W. (1900) Versuch einer Klassifikation der Klimate, vorzugsweise nach ihren Beziehungen zur Pflanzenwelt. Geographische Zeitschrft 6, 593-61 1 and 657479.
Lacerda, L. D., Souza, C. M. M. and Pestana, M. H. D. (1988) Geochemical distribution of Cd, Cu, Cr and Pb in sediments along the southeastern Brazilian coast. In Metals in Coastal Environments of Latin America, eds. U . Seeliger, L. D. Lacerda and S. R. Patchineelam, pp. 86-89. Springer, Berlin.
Lavrado, H. P., Mayr, L. M., Carvalho, V. and Paranhos, R. (1991) Evolution (198G1990) of ammonia and dissolved oxygen in Guanabara Bay, RJ, Brazil. In Proceedings of the 7th Symposium on Coastal and Ocean Management. Coastal Zone 91, eds. 0 . T. Magoon, H. Converse and V. Tippie, Vol. 4, pp. 3234--3245. American Society of Civil Engineers, New York.
Leal, L. M. (1988) Reatividade do cobre antropogknico depositado nos sedimentos da Baia de Guanabara. M.S. thesis, Departamento de Quimica, Pontificia Universidade Catolica, Rio de Janeiro, RJ, Brazil, 107 pp.
Martin, L. and Flexor, J. M. (1992) Lagoon sediments of the Cabo Frio region as records of the variations of the local upwelling during the last 7,000 years. In Paleoclimatic Changes and the Carbon Cycle, eds. L. D .

1642 B. Kjerfve et al.
Lacerda, B. Turcq, B. Knoppers and B. Kjerfve, pp. 35-40. Serie Geoquimica Ambiental No 1. Socidade Brasileira de Geoquimica, Rio de Janeiro, RJ, Brazil, 114 pp.
Martins, R. P. and Rosman, P. C. C. (1993) Um modelo 2DH de circula$lo em corpos d'aqua com areas alagaveis. X Simposio Brasileiro de Recursos Hidricos. I Simposio de Recursos Hidricos do Cone Sul. Anais 5,475-484.
Mayr, L. M., Tenenbaum, D. R., Villac, M. C., Paranhos, R., Nogueira, C. R., Bonecker, S. L. C. and Bonecker, A. C. T. (1989) Hydrobiological characterization of Guanabara Bay. In Coastlines of Brazil, eds. 0. Magoon and C. Neves, pp. 124-138. American Society of Civil Engineers, New York.
Meis, M. R. M. and Amador, E. S. (1972) FormaGo Macacu - Considerac;des a respeito do neocenozoico da Baia de Guanabara. Anais da Academia Brasileira de Ciincias 44, 602.
Meis, M. R. M. and Amador, E. S. (1977) ContribuiGo ao estudo do neocenozoico da Baixada da Guanabara. Revista Brasileira de Geografia 7 , 150-174.
Nixon, S. W. and Pilson, M. E. Q. (1984) Estuarine total system metabolism and organic exchange calculated from nutrient ratios: an example from Narragansett Bay. In The Estuary as a Filter, ed. V. S. Kennedy, pp. 261-290. Academic Press, New York.
Oliveira, L. P. H. (1947) Distribui~lo geografica da fauna e flora da Baia de Guanabara. Memdrias do Znstituto Oswaldo Cruz 45, 709-734.
Oliveira, L. P. H. (1950) Levantamento biogeografico da Baia de Guanabara. Memorias do Instituto Oswaldo Cruz 48, 363-39 1.
Oliveira, L. P. H. (1958) Poluiqlo das aguas maritimas, estragos na flora e fauna do Rio de Janeiro. Memdrias do Znstituto Oswaldo Cruz 56, 39-59.
Oliveira, L. P. H., Krau, L. and Miranda, A. A. S. (1971) Pllncton poluido da Guanabara corn copepodos Cletocamptos e rotifera Rotaria. Arquivos do Museu Nacional54, 55-56.
Paranhos, R., Mayr, L. M., Lavrado, H. P. and Castilho, P. C. (1993) Temperature and salinity trends in Guanabara Bay (Brazil) from 1980 to 1990. Arquivo de Biologia Tecnologia 36, 685494.
Paranhos, R. and Mayr, L. M. (1993) Seasonal patterns of temperature and salinity in Guanabara Bay, Brazil. Fresenius Environmental Bulletin 2, 647-652.
Pfeiffer, W. C., Fiszman, M., Lacerda, L. D., van Weerelt, M. and Carbonell, N. (1982) Chromium in water suspended particles, sediments and biota in Iraja River estuary. Environmental Pollution (Serie B) 4, 193- 205.
Pires, I. 0 . (1992) Monitoramento dos manguezais da APA-Guapimirim atraves de correlaplo de dados da fitomassa e da radilncia TM/Landsat. Ph.D. dissertation, Departamento de Geografia Fisica, Universidade de Slo Paulo, Slo Paulo, SP, Brazil.
Pritchard, D. W. (1952) Estuarine hydrography. In Advances in Geophysics, ed. H . E. Landsberg, Vol. 1, pp. 243- 280. Academic Press, New York.
Pritchard, D. W. (1961) Salt balance and exchange rate for Chincoteague Bay. Cheseapeake Science 1, 48-57. Rebello, A. L. and van den Berg, C. (1986) Organic copper interaction in Guanabara Bay. The Science of the
Total Environment 58, 37-45. Rebello, A. L., Ponciano, C. R. and Melges, L. H. (1988) Avaliaplo da produtividade primaria e da
disponibilidade de nutrientes na Baia de Guanabara. Anais da Academia Brasileira de Ci&cias 60,419430. Rezende, C. E. and Lacerda, L. D. (1986) Metais pesados em mexilhdes (Perna perna L.) no litoral do Estado do
Rio de Janeiro. Revista Brasileira de Biologia 46, 239-247. Ruellan, F. (1944) A evolupiio geomorfologica da Baia de Guanabara e regides vizinhas. Revista Brasileira de
Geografia 6, 445-508. Ryther, J. H. and Dunstan, W. M. (1971) Nitrogen, phosphorus and eutrophication in coastal marine
environment. Science 171, 1008-1013. Schreiber, P. (1904) ijber die Beziehungen zwischen dem Niederschlag und der Wasserfhrung der Fliisse in
Mittleeuropa. Meteorologische Zeitschrifr 21, 441452. Silva, C. S., Rodrigues, J. C. V. and Clrnara, N. L. (1990) Saneamento basico e problemas ambientais na regiLo
metropolitana do Rio de Janeiro. Revista Brasielira de Geografia 52, 5-106. Souza, M. H. S. (1988) Clima de ondas ao norte do Estado do Rio de Janeiro. MS thesis, Departamento de
Engenharia Ocelnica, Universidade Federal do Rio de Janeiro, Rio de Janeiro, RJ, Brazil, 181 pp. Strickland, J. D. H. and Parsons, T. R. (1972) A Practical Handbook of Seawater Analysis, 2nd edition. Fisheries
Research Board of Canada Bulletin 167, Ottawa, 310 pp. Stech, J. L. and Lorenzzetti, J. A. (1992) The response of the South Brazil Bight to the passage of wintertime cold
fronts. Journal of Geophysical Research 97, 9507-9520.

Oceanographic characteristics of an impacted coastal bay 1643
Teixeira, V. L., Pereira, R. C., Marques, A. N., LeitHo, C. M. and Silva, C. A. R. (1987) Seasonal variations in infralittoral seaweed communities under a pollution gradient in Baia de Guanabara, Rio de Janeiro (Brazil). Ci6ncia e Cultura 39, 423428.
Vilela, C. P. X. (1992) Investigafio do efeito de ventos na circula@o da Baia de Guanabara, Rio de Janeiro. M.S. thesis, Departamento de Engenharia Ocelnica, Universidade Federal do Rio de Janeiro, Rio de Janeiro, RJ, Brazil, 65 pp.
Villac, M. C. (1990) 0 fitopllncton como urn instrumento de diagnose e monitoramento ambiental: estudo de caso da Baia de Guanabara (RJ, Brad). M.S. thesis, Departamento de Geografia, Universidade Federal do Rio de Janeiro, Rio de Janeiro, RJ, Brazil, 193 pp.