Establishing the ecological quality status of soft-bottom mining-impacted coastal water bodies in...
15
See discussions, stats, and author profiles for this publication at: https://www.researchgate.net/publication/7914173 Establishing the ecological quality status of soft-bottom mining-impacted coastal water bodies in the scope of the Water... Article in Marine Pollution Bulletin · May 2005 DOI: 10.1016/j.marpolbul.2004.11.019 · Source: PubMed CITATIONS 91 READS 142 5 authors, including: Some of the authors of this publication are also working on these related projects: Tolerance to HEAT stress induced by climate change in the seaGRASS Posidonia oceanica View project Assessment of the bioavailability of metals in sediments acidified by infusion using CO2 bivalves (Crassostrea brasiliana) View project Lázaro Marín-Guirao Stazione Zoologica Anton Dohrn di Napoli 71 PUBLICATIONS 996 CITATIONS SEE PROFILE Augusto Cesar Universidade Federal de São Paulo 60 PUBLICATIONS 787 CITATIONS SEE PROFILE Arnaldo Marín University of Murcia 132 PUBLICATIONS 1,830 CITATIONS SEE PROFILE Javier Lloret Marine Biological Laboratory 46 PUBLICATIONS 634 CITATIONS SEE PROFILE All content following this page was uploaded by Lázaro Marín-Guirao on 03 December 2016. The user has requested enhancement of the downloaded file. All in-text references underlined in blue are added to the original document and are linked to publications on ResearchGate, letting you access and read them immediately.
Transcript of Establishing the ecological quality status of soft-bottom mining-impacted coastal water bodies in...
Seediscussions,stats,andauthorprofilesforthispublicationat:https://www.researchgate.net/publication/7914173
Establishingtheecologicalqualitystatusofsoft-bottommining-impactedcoastalwaterbodiesinthescopeoftheWater...
ArticleinMarinePollutionBulletin·May2005
DOI:10.1016/j.marpolbul.2004.11.019·Source:PubMed
CITATIONS
91
READS
142
5authors,including:
Someoftheauthorsofthispublicationarealsoworkingontheserelatedprojects:
TolerancetoHEATstressinducedbyclimatechangeintheseaGRASSPosidoniaoceanicaView
project
AssessmentofthebioavailabilityofmetalsinsedimentsacidifiedbyinfusionusingCO2bivalves
(Crassostreabrasiliana)Viewproject
LázaroMarín-Guirao
StazioneZoologicaAntonDohrndiNapoli
71PUBLICATIONS996CITATIONS
SEEPROFILE
AugustoCesar
UniversidadeFederaldeSãoPaulo
60PUBLICATIONS787CITATIONS
SEEPROFILE
ArnaldoMarín
UniversityofMurcia
132PUBLICATIONS1,830CITATIONS
SEEPROFILE
JavierLloret
MarineBiologicalLaboratory
46PUBLICATIONS634CITATIONS
SEEPROFILE
AllcontentfollowingthispagewasuploadedbyLázaroMarín-Guiraoon03December2016.
Theuserhasrequestedenhancementofthedownloadedfile.Allin-textreferencesunderlinedinblueareaddedtotheoriginaldocumentandarelinkedtopublicationsonResearchGate,lettingyouaccessandreadthemimmediately.
www.elsevier.com/locate/marpolbul
Marine Pollution Bulletin 50 (2005) 374–387
Establishing the ecological quality status of soft-bottommining-impacted coastal water bodies in the scope of the
Water Framework Directive
Lazaro Marın-Guirao a,*, Augusto Cesar b, Arnaldo Marın a, Javier Lloret a, Ruben Vita a
a Departamento de Ecologıa e Hidrologıa, Facultad de Biologıa, Universidad de Murcia, 30100-Murcia, Spainb Departamento de Ecotoxicologıa, Universidade Santa Cecilia, Santos 11045-907, SP, Brazil
Abstract
The aim of the present study was to check the usefulness of the benthic biotic indices proposed for application in the European
water framework directive (WFD 2000/60/EC) for the ecological quality classification of coastal water bodies, together with some
other benthic methodologies used in different countries of the world. The different approaches were applied in two marine ecosys-
tems affected by the same heavy metal contamination source, coastal waters off Portman and the Mar Menor coastal lagoon, both in
SE Spain. Two marine biotic indices proposed for application in the Directive (AMBI and BENTIX) were used, together with com-
munity descriptors (abundance, Shannon–Wiener diversity, Margalef�s species richness, Pielou�s evenness and Simpson�s Domi-nance), the relative benthic index (RBI) and the abundance-biomass comparison method (ABC). Water-sediment interface
toxicity bioassays using sea urchin embryos and sediment metal analysis served to check the classifications obtained. The classical
community descriptors pointed to a progressive variation in benthic communities along the metal contamination gradient of Port-
man, but, they did not correctly characterize the environmental status of the lagoon stations. Although the RBI was the index that
best classified the sites according to their degree of pollution, the selection of indicator species can bias the results. Since the AMBI,
the BENTIX and the ABC method are based on the pollution resulting from organic enrichment, their application in the case of
purely toxic pollution may not be successful, as was found to be the case in these two mining-polluted ecosystems. Therefore,
the development of new indicator lists according to the type of pollutant may serve to improve the results obtained with organic
enrichment-based indices when studying other kinds of disturbance. Finally, we found the toxicity tests to be useful tools for the
environmental assessment of aquatic ecosystems, and recommend their inclusion in the WFD.
� 2004 Elsevier Ltd. All rights reserved.
Keywords: Water Framework Directive; Toxicity bioassays, Marine biotic indices, AMBI, BENTIX, RBI, ABC method; Mining wastes
1. Introduction
The European water framework directive (WFD2000/60/EC) establishes a framework for the protection
of all water bodies to prevent their deterioration and to
ensure the achievement of good quality status by 2015.
The Directive includes inland surface waters, ground
waters, transitional waters and coastal waters as catego-
0025-326X/$ - see front matter � 2004 Elsevier Ltd. All rights reserved.doi:10.1016/j.marpolbul.2004.11.019
* Corresponding author. Tel.: +34 968364977; fax: +34 968363963.
E-mail address: [email protected] (L. Marın-Guirao).
ries of water bodies, and develops the concept of ecolog-
ical quality status (EcoQ), which is judged according to
five classes (High, Good,Moderate, Poor and Bad). ThisEcoQ will be based on the status of, among other fac-
tors, elements reflecting biological quality, including
the composition and abundance of benthic invertebrate
fauna. In May 2001, a ‘‘common implementation strat-
egy’’ (CIS) was agreed to assist with the implementation
of the WFD, with the COAST working group dealing
with coastal waters. To establish the ecological quality
of soft-bottom benthos and to classify coastal water
L. Marın-Guirao et al. / Marine Pollution Bulletin 50 (2005) 374–387 375
bodies, this group has proposed two marine biotic indi-
ces, the AMBI (Borja et al., 2000) and the BENTIX
(Simboura and Zenetos, 2002), which are based on the
sensitivity/tolerance of benthic fauna to stress gradients
mainly caused by organic enrichment pollution, declar-
ing that methods combining composition, abundanceand sensitivity are the most promising (Vincent et al.,
2002).
Great quantities of wastes are produced during min-
ing activities and these are sometimes discharged into
water-bodies, where they cause problems related with
metal pollution. Metals, in aquatic ecosystems are accu-
mulated in sediments, where they may reach concentra-
tions several orders of magnitude higher than in water(Bryan and Langston, 1992). Since sediments constitute
one of the most important compartments in aquatic eco-
systems, providing the habitat for many organisms
(Ingersoll, 1995), their contamination by metals would
cause deleterious effects on benthic organisms.
Historically, the Sierra of Cartagena-Portman (Mur-
cia, SE-Spain) was exploited to extract pyrite and lead
sulphide. During the 20th century, the mineral laundriesused floating techniques to extract metal, producing
great quantities of mining wastes. These muddy wastes
were discharged into the Portman Bay (Mediterranean
Sea) and the adjacent Mar Menor coastal lagoon, pro-
ducing a high degree of sediment metal contamination.
Mining operations pumped 3000–10,000tons of tailings
per day into Portman Bay from 1958 to 1991, first di-
rectly into the bay and later, when the bay was filledup through an outfall more than 2km in length. In total,
approximately 50 million tons of mine tailings were
dumped into Portman Bay during this period, including
heavy metals known to be toxic, such as cadmium, cop-
per, lead and zinc. For its part, the Mar Menor is the
biggest hypersaline coastal lagoon of Spain and one of
the biggest in Europe and the Mediterranean Sea. The
lagoon is relatively shallow with a mean depth of 3.5mand a maximum depth of just over 6m. Until the
1950s, wastes from the mining activities were discharged
into the coastal lagoon through the temporary streams
that exist in the area. Even now, when torrential rains
occur, the tailings that remain in the mountains continue
to enter the lagoon. Previous studies (Cesar et al., 2004;
DeLeon et al., 1982, 1984; Perez and Puente, 1989) have
reported high concentrations of Zn, Pb, and Cd in thesediments of both ecosystems.
In the present study, the biotic indices (AMBI and
BENTIX) were applied in both the above mentioned
heavy metal-polluted Mediterranean ecosystems to test
their applicability in metal pollution assessment. In
addition, we used classical community descriptive
parameters (abundance, Shannon–Wiener diversity,
Margalef�s species richness, Pielou�s evenness and Simp-son�s Dominance), the relative biotic index (RBI)(Anderson et al., 1998) developed for regional applica-
tion in North America estuarine habitats and adapted
to our conditions, and the widely used abundance bio-
mass comparison (ABC) method (Warwick, 1986). We
also employed water–sediment interface toxicity bioas-
says, using sea urchin embryos, and sediment physico-
chemical analysis to evaluate the EcoQ classificationobtained with the different indices since, in marine and
estuarine ecosystems, biological approaches may be
complemented by toxicity and chemical assessment
methods to serve as independent evaluations of the eco-
logical quality (Dauer, 1993; Elliot, 1994).
The aim of the present study was to examine the use-
ful application of the benthic biotic indices proposed in
the Directive 2000/60/EC for the classification of coastalwater bodies, together with some other benthic method-
ologies employed worldwide, in two marine ecosystems
affected by the same heavy metal contamination source
(Mediterranean Sea and Mar Menor lagoon).
2. Methods
2.1. Study areas and sampling points
The study took place close to the Spanish Mediterra-
nean coast off the Cartagena-Portman Sierra and in the
Mar Menor coastal lagoon (SE Spain), both corre-
sponding to the category of ‘‘coastal water bodies’’. Sed-
iment samples were collected off the Portman coast in
March 2002, along a spatial gradient in the same depthrange (10–15m). Six sampling stations ran from the
mine outlet in Portman Bay in the direction of the Mar-
ine Reserve of Cabo de Palos-Islas Hormigas (WSW-
ENE; Fig. 1). Sandy soft-bottoms characterized all these
stations, which were located in rocky exposed coastal
sections. A full description of both study areas can be
found in Calvın-Calvo (1999). In the Mar Menor la-
goon, six sampling stations were selected in the southernbasin of the lagoon, with similar salinity ranges to min-
imise possible differences in structure and composition
between populations due to the natural gradients char-
acteristic of coastal lagoons. Two of these stations,
BW and PW, were located at the mouth of two tempo-
rary streams through which the wastes were discharged
into the lagoon (Fig. 1). Sediment samples were col-
lected in May 2001. Four replicate sediment sampleswere collected by SCUBA divers from all points in both
Mediterranean ecosystems.
2.2. Community descriptive parameters
Benthic faunal samples were obtained by SCUBA di-
vers using a 0.09m2 hand grab and sieved through a
0.5mm mesh bag. The macroinvertebrates retained onthe screen were fixed with 4% buffered formalin, and
later washed and transferred to 70% isopropyl alcohol
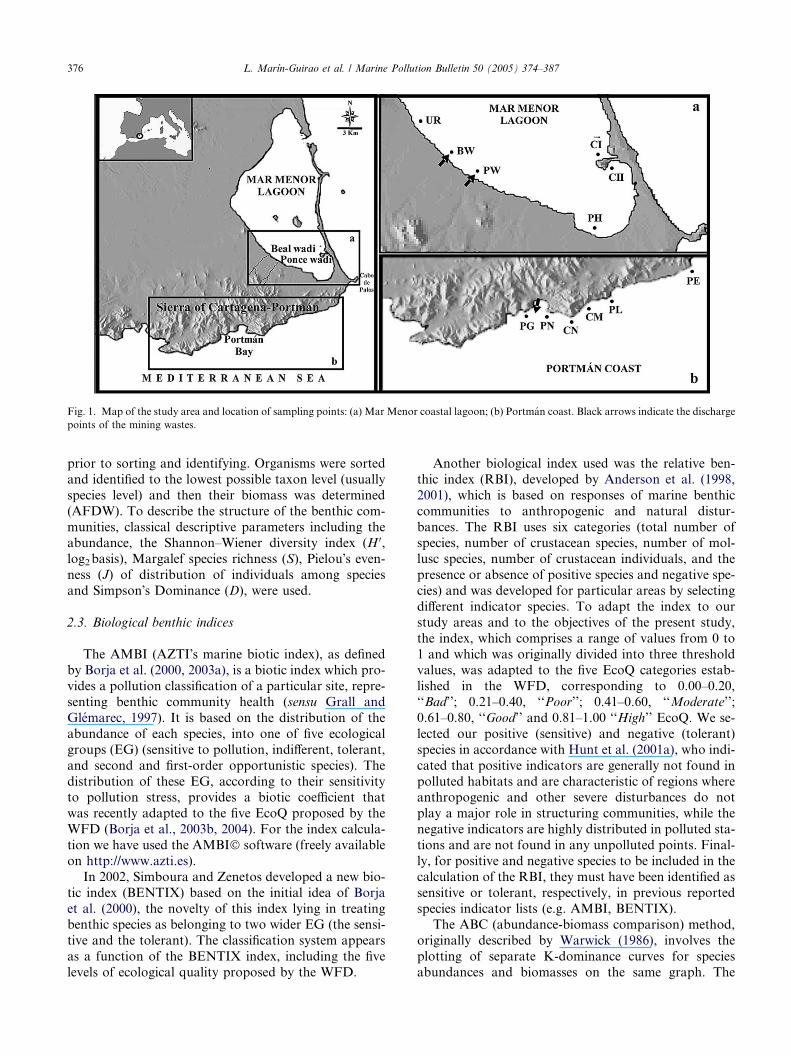
Fig. 1. Map of the study area and location of sampling points: (a) Mar Menor coastal lagoon; (b) Portman coast. Black arrows indicate the discharge
points of the mining wastes.
376 L. Marın-Guirao et al. / Marine Pollution Bulletin 50 (2005) 374–387
prior to sorting and identifying. Organisms were sorted
and identified to the lowest possible taxon level (usually
species level) and then their biomass was determined
(AFDW). To describe the structure of the benthic com-
munities, classical descriptive parameters including theabundance, the Shannon–Wiener diversity index (H 0,
log2basis), Margalef species richness (S), Pielou�s even-ness (J) of distribution of individuals among species
and Simpson�s Dominance (D), were used.
2.3. Biological benthic indices
The AMBI (AZTI�s marine biotic index), as definedby Borja et al. (2000, 2003a), is a biotic index which pro-
vides a pollution classification of a particular site, repre-
senting benthic community health (sensu Grall and
Glemarec, 1997). It is based on the distribution of the
abundance of each species, into one of five ecological
groups (EG) (sensitive to pollution, indifferent, tolerant,
and second and first-order opportunistic species). The
distribution of these EG, according to their sensitivityto pollution stress, provides a biotic coefficient that
was recently adapted to the five EcoQ proposed by the
WFD (Borja et al., 2003b, 2004). For the index calcula-
tion we have used the AMBI� software (freely availableon http://www.azti.es).
In 2002, Simboura and Zenetos developed a new bio-
tic index (BENTIX) based on the initial idea of Borja
et al. (2000), the novelty of this index lying in treatingbenthic species as belonging to two wider EG (the sensi-
tive and the tolerant). The classification system appears
as a function of the BENTIX index, including the five
levels of ecological quality proposed by the WFD.
Another biological index used was the relative ben-
thic index (RBI), developed by Anderson et al. (1998,
2001), which is based on responses of marine benthic
communities to anthropogenic and natural distur-
bances. The RBI uses six categories (total number ofspecies, number of crustacean species, number of mol-
lusc species, number of crustacean individuals, and the
presence or absence of positive species and negative spe-
cies) and was developed for particular areas by selecting
different indicator species. To adapt the index to our
study areas and to the objectives of the present study,
the index, which comprises a range of values from 0 to
1 and which was originally divided into three thresholdvalues, was adapted to the five EcoQ categories estab-
lished in the WFD, corresponding to 0.00–0.20,
‘‘Bad’’; 0.21–0.40, ‘‘Poor’’; 0.41–0.60, ‘‘Moderate’’;
0.61–0.80, ‘‘Good’’ and 0.81–1.00 ‘‘High’’ EcoQ. We se-
lected our positive (sensitive) and negative (tolerant)
species in accordance with Hunt et al. (2001a), who indi-
cated that positive indicators are generally not found in
polluted habitats and are characteristic of regions whereanthropogenic and other severe disturbances do not
play a major role in structuring communities, while the
negative indicators are highly distributed in polluted sta-
tions and are not found in any unpolluted points. Final-
ly, for positive and negative species to be included in the
calculation of the RBI, they must have been identified as
sensitive or tolerant, respectively, in previous reported
species indicator lists (e.g. AMBI, BENTIX).The ABC (abundance-biomass comparison) method,
originally described by Warwick (1986), involves the
plotting of separate K-dominance curves for species
abundances and biomasses on the same graph. The
L. Marın-Guirao et al. / Marine Pollution Bulletin 50 (2005) 374–387 377
position of one curve with respect to the other identifies
three sediment conditions: undisturbed, moderately dis-
turbed and grossly disturbed. The W statistic of Clarke
(1990) measures the area between the two curves, values
close to zero indicating a moderately disturbed status,
while those far from zero (positive or negative) indicateundisturbed or grossly disturbed, respectively. The W-
statistics that goes from �1 to 1 were divided into fiveclasses, the boundaries between classes being set accord-
ing to the results of the graphs in the following way:
�1.00 <W < �0.50 ‘‘Bad’’ EcoQ, �0.49 <W < �0.15‘‘Poor’’ EcoQ, �0.14 <W < 0.14 ‘‘Moderate’’ EcoQ,
0.15 <W < 0.49 ‘‘Good’’ EcoQ and 0.50 <W < 1.00
‘‘High’’ EcoQ.
2.4. Toxicity tests
The toxicity of the sediment–water interface was
determined using the embryo larval development tests
with two sea urchin species, Arbacia lixula and Paracen-
trotus lividus, following the procedures described by
Cesar et al. (2004) and in accordance with the acceptedguidelines (Environment Canada, 1992; USEPA, 1995,
2002; CETESB, 1999). Two milliliters of the surface of
an intact (unhomogenized) sediment core were intro-
duced carefully through a syringe (5ml) with a cut tip,
and 8ml of dilution seawater (1 sediment/4 water) were
introduced carefully to minimize resuspension. Test
tubes were allowed to stabilize for 24h and then a circu-
lar mesh (100lm) with the same diameter as the testtube was placed carefully on the sediment–water inter-
face with the help of a clean glass rod. The duration
of sub-chronic tests was 28h for P. lividus and 38h for
A. lixula, after which times the number of normally
developed pluteus larvae was counted. Sediment sam-
ples from El Fraile Island (60km from Portman Bay),
where the sea urchins were collected, were used as con-
trol to validate the tests. To associate the five EcoQ withthe results obtained in the toxicity bioassays using sea
urchin embryos, the average of the results for both spe-
cies were calculated and the percentage of normally
developed pluteus obtained was divided into the
five EcoQ proposed by the WFD: 0–20% of Plu-
teus = ‘‘Bad’’ EcoQ, 21–40% = ‘‘Poor’’ EcoQ, 41–
60% = ‘‘Moderate’’ EcoQ, 61–80% = ‘‘Good’’ EcoQ
and 81–100% = ‘‘High’’ EcoQ. The established thresh-old values were tested against several sediment quality
attributes, such as metal concentrations or the molar
difference between the acid volatile sulfide concentra-
tions and the simultaneous extracted metals.
2.5. Physico-chemical analysis
Sediment particle size distribution was determined bymechanical dry sieving. The total organic carbon (TOC)
content was determined in the fine fraction (<63lm)
with a Carlo Erba Instruments (EA1108) elemental ana-
lyser following sample preparation with 1N HCl to
decompose the carbonate (Verdardo et al., 1990). The
percentage of organic matter in the samples was esti-
mated by the loss of weight on ignition at 450 �C for 6h.Sediment samples for the acid volatile sulphide (AVS)
and simultaneously extracted metals (SEM) were ana-
lyzed by a cold-acid purge-and-trap technique described
in detail by Allen et al. (1993). The hydrogen sulfide was
determined with an ion selective silver/sulfide electrode
(ThermoOrion, model 9616). The SEM (Zn, Cd, Pb
and Cu) were measured with an optical emission spec-
trometer (Optima 2000 DV—Perquin Elmer) in the case
of the Portman samples, and by anodic stripping vol-tammetry (Metrohm 646 VA Processor) with hanging
mercury drop for the sediments from the Mar Menor.
2.6. Data analysis
Benthic community analysis was performed using the
PRIMER v5 (Plymouth routines in marine ecological
research) software package (Clarke and Gorley, 2001).The Bray–Curtis similarity matrix was used on trans-
formed (double root) total invertebrate abundance data,
and classification was performed on the similarity ma-
trix using the multidimensional scaling (MDS) also pro-
posed by the CIS working group 2.4 (COAST), created
by the Common Implementation Strategy (Vincent
et al., 2002). To estimate the degree of association be-
tween the results obtained using the different methodol-ogies here described (biological benthic indices,
community descriptors and toxicity tests) and the load
of the pollutant content in the sediments (metal concen-
trations, SEM, SEM-AVS), the results were standar-
dised by subtracting the mean and dividing by the
standard deviation before running a Pearson correlation
analysis (computer application Statistica v4.5�).
3. Results
3.1. Physico-chemical analysis
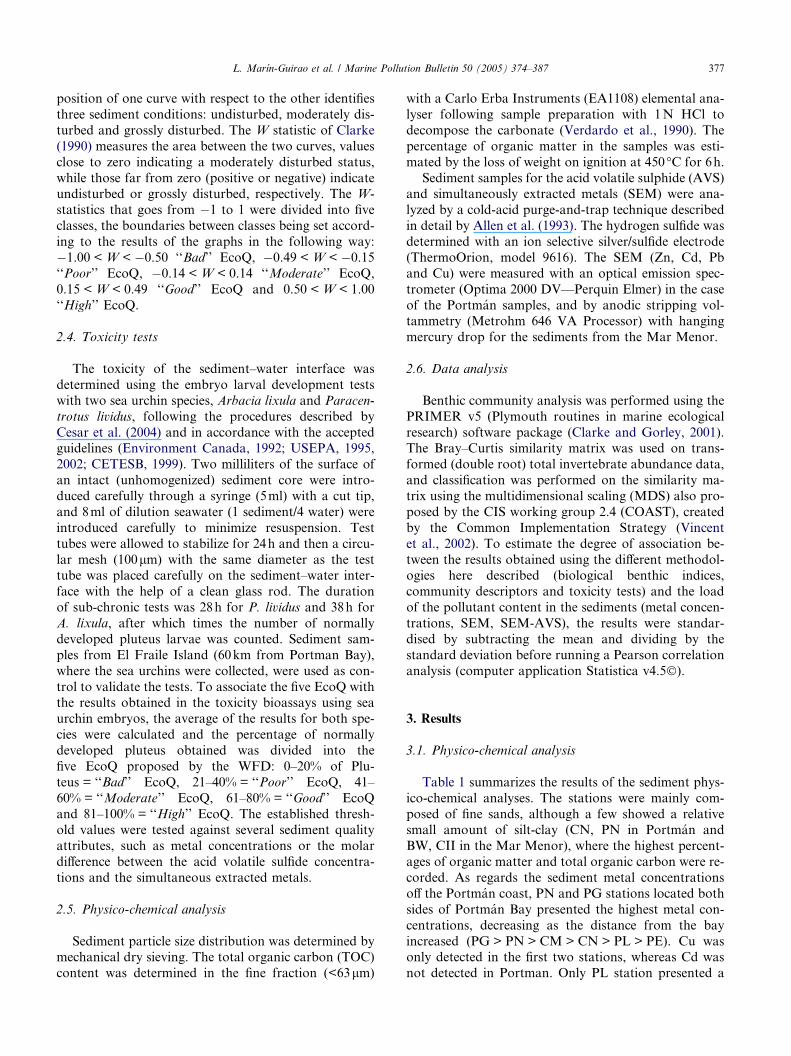
Table 1 summarizes the results of the sediment phys-
ico-chemical analyses. The stations were mainly com-
posed of fine sands, although a few showed a relativesmall amount of silt-clay (CN, PN in Portman and
BW, CII in the Mar Menor), where the highest percent-
ages of organic matter and total organic carbon were re-
corded. As regards the sediment metal concentrations
off the Portman coast, PN and PG stations located both
sides of Portman Bay presented the highest metal con-
centrations, decreasing as the distance from the bay
increased (PG > PN > CM > CN > PL > PE). Cu wasonly detected in the first two stations, whereas Cd was
not detected in Portman. Only PL station presented a

Table1
Summaryofthesedimentphysico-chemicalanalyses
Stations
parametersPortman
MarMenor
PG
PN
CN
CM
PL
PE
UR
BW
PW
PH
CI
CII
%Silt-clay
4.19±0.11
4.32±2.74
0.23±0.17
2.98±1.05
0.72±0.07
0.41±0.11
0.45±0.19
10.53±5.29
0.58±0.10
0.18±0.12
0.16±0.02
8.39±0.58
%Sand
95.81±0.12
79.30±9.10
61.52±9.43
96.94±0.96
99.28±0.07
99.59±0.11
99.07±0.45
89.15±6.62
95.00±0.49
89.94±2.60
96.31±6.14
81.67±8.48
%OM
6.22±0.5
5.16±0.81
1.38±0.15
2.28±0.10
0.74±0.08
0.73±0.07
3.08±0.18
8.17±0.32
2.43±0.41
2.23±0.07
3.17±0.14
3.06±0.02
%TOC
18.32±3.32
16.67±0.53
0.58±0.02
1.49±0.18
0.29±0.007
0.12±0.004
0.85±0.02
1.60±0.24
1.40±0.03
0.90±0.02
1.17±0.05
1.29±0.61
NH4
0.003±0.00050.006±0.00
0.007±0.00050.005±0.0005
0.006±0.00
0.004±0.00050.005±0.001
0.010±0.0030.006±0.0010.005±0.0004
0.007±0.001
0.007±0.002
Zn
15.34±3.07
13.47±0.45
0.34±0.02
1.17±0.19
0.21±0.005
0.08±0.00
6.37±1.09
62.07±4.35
4.12±0.43
0.81±0.02
1.14±0.14
0.97±0.23
Pb
2.98±0.31
3.14±0.20
0.20±0.005
0.30±0.02
0.08±0.008
0.04±0.00
6.62±0.21
45.98±13.10
1.25±0.15
1.21±0.09
0.29±0.01
0.25±0.04
Cu
0.007±0.009
0.003±0.005BDL
BDL
BDL
BDL
0.06±0.02
0.55±0.02
0.18±0.03
0.02±0.004
0.02±0.004
0.03±0.008
Cd
BDL
BDL
BDL
BDL
BDL
BDL
0.01±0.001
0.02±0.01
0.005±0.0010.002±0.0005
0.003±0.0005
0.004±0.001
SEM
18.32±3.32
16.67±0.054
0.59±0.03
1.49±0.18
0.29±0.008
0.12±0.005
13.06±1.21
108.62±14.48
5.56±0.50
2.04±0.10
1.46±0.14
1.25±0.26
AVS
0.32±0.31
0.28±0.09
0.25±0.04
0.30±0.05
0.29±0.07
0.012±0.005
1.48±0.67
2.44±2.72
5.46±1.10
0.50±0.04
1.47±0.33
2.83±0.97
SEM-AVS
18.00±3.02
16.39±0.52
0.340±0.03
1.185±0.22
�0.005±0.06
0.105±0.01
11.58±0.81
106.18±5.18
0.10±0.08
1.54±0.14
�0.02±0.02
�1.58±0.78
Percentageofthefinefraction(%silt-clay),sand(%sand),organicmattercontent(%OM)andtotalorganiccarboncontent(%TOC),ammoniumconcentration(mg/l),heavymetalconcentrations(Zn,Pb,CuandCd),
simultaneouslyextractedmetals(SEM=Zn+Pb+Cu+Cd)andacidvolatilesulphideconcentration(AVS).Metals,SEMandAVSconcentrationsaregivenin(lmol/gdrysed.).BDL=belowdetectionlimits,forCuand
Cdare0.003and0.002lmol/gdrysed.,respectively.Meanvalues±S.D.
378 L. Marın-Guirao et al. / Marine Pollution Bulletin 50 (2005) 374–387
negative molar difference between the SEM and the
AVS analyzed, the rest of the stations showing a positive
difference. In PN and PG stations this positive difference
was high (>15lmol/g dry sed.), indicating the possiblebioavailability of metals. According to the classification
proposed by Long et al. (1995), PG and PN stationswere highly polluted by Zn and Pb, whereas the rest of
stations were classified as lowly polluted by the four
metals, except CM station, which was classified as mod-
erately polluted by Pb (Table 3). In the Mar Menor, the
highest metal concentrations were found in stations UR,
BW and PW, the two first presenting high molar differ-
ences between the SEM and the AVS concentration. For
the rest of the stations, the metal concentrations wererelatively low, both CI and CII stations presenting neg-
ative SEM-AVS molar differences. Every station in the
lagoon presented low pollution levels for Cu and Cd
(Long et al., 1995), whereas the Zn levels classified UR
and BW as highly polluted and PW station as moder-
ately polluted. Pb levels pointed to a high degree of pol-
lution in UR, BW, PW and PH stations and a moderate
degree of pollution in CI and CII (Table 3).
3.2. Toxicity tests
Both species of sea urchin larvae presented a similar
pattern of response in both ecosystems with the highest
toxicity effects being recorded in those sediments show-
ing a high metal content. These corresponded to sites
located close to the mine discharges (PG and PN inPortman coast and BW, PW and UR in the Mar Menor)
(Table 2). Control samples validated the results obtained
in the tests, since 89.7 ± 5.5 and 87.5 ± 5.3 percentage of
normally developed pluteus larvae were achieved for
A. lixula and P. lividus, respectively. The mean values
obtained by jointly considering the response of both spe-
cies and the established threshold values, classified the
stations in the following way: for Portman coast, highEcoQ in PE, good EcoQ in PL, moderate EcoQ in
CM, poor EcoQ in CN and a bad EcoQ for both PN
and PG stations. In the case of the Mar Menor coastal
lagoon, the toxicity results classified the CI station as
having a good EcoQ, as moderate EcoQ the PH station,
PW and UR stations corresponded to the poor EcoQ
while BW stations had a bad EcoQ (Table 4).
3.3. Community descriptive parameters and
multivariate analysis
In total, 83 species were found in Portman coast and
only four species, Ampelisca typica, Apseudes latreillei,
Photis longipes and Tellina donacina, were present in
every station. The minimum value of the abundance,
species richness S, diversity H and evenness J was at-tained at station PG, which is located close to the
mining wastes discharge, to the west side of Portman
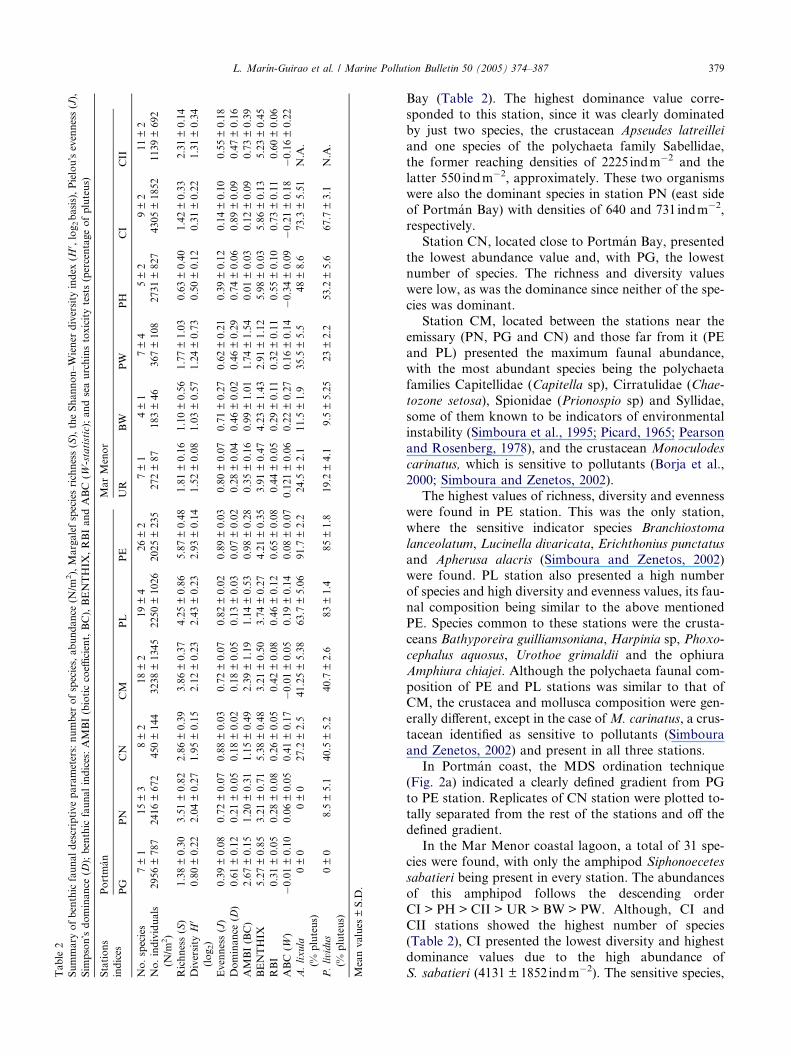
Table2
Summaryofbenthicfaunaldescriptiveparameters:numberofspecies,abundance(N/m2),Margalefspeciesrichness(S),theShannon–Wienerdiversityindex(H
0 ,log2basis),Pielou�sevenness(J),
Simpson�sdominance(D);benthicfaunalindices:AMBI(bioticcoefficient,BC),BENTHIX,RBIandABC(W
-statistic);andseaurchinstoxicitytests(percentageofpluteus)
Stations
indices
Portman
MarMenor
PG
PN
CN
CM
PL
PE
UR
BW
PW
PH
CI
CII
No.species
7±1
15±3
8±2
18±2
19±4
26±2
7±1
4±1
7±4
5±2
9±2
11±2
No.individuals
(N/m2)
2956±7872416±672
450±144
3238±13452250±10262025±235
272±87
183±46
367±108
2731±827
4305±1852
1139±692
Richness(S)
1.38±0.303.51±0.822.86±0.39
3.86±0.37
4.25±0.86
5.87±0.48
1.81±0.161.10±0.561.77±1.03
0.63±0.40
1.42±0.33
2.31±0.14
Diversity
H0
(log2)
0.80±0.222.04±0.271.95±0.15
2.12±0.23
2.43±0.23
2.93±0.14
1.52±0.081.03±0.571.24±0.73
0.50±0.12
0.31±0.22
1.31±0.34
Evenness(J)
0.39±0.080.72±0.070.88±0.03
0.72±0.07
0.82±0.02
0.89±0.03
0.80±0.070.71±0.270.62±0.21
0.39±0.12
0.14±0.10
0.55±0.18
Dominance(D)
0.61±0.120.21±0.050.18±0.02
0.18±0.05
0.13±0.03
0.07±0.02
0.28±0.040.46±0.020.46±0.29
0.74±0.06
0.89±0.09
0.47±0.16
AMBI(BC)
2.67±0.151.20±0.311.15±0.49
2.39±1.19
1.14±0.53
0.98±0.28
0.35±0.160.99±1.011.74±1.54
0.01±0.03
0.12±0.09
0.73±0.39
BENTHIX
5.27±0.853.21±0.715.38±0.48
3.21±0.50
3.74±0.27
4.21±0.35
3.91±0.474.23±1.432.91±1.12
5.98±0.03
5.86±0.13
5.23±0.45
RBI
0.31±0.050.28±0.080.26±0.05
0.42±0.08
0.46±0.12
0.65±0.08
0.44±0.050.29±0.110.32±0.11
0.55±0.10
0.73±0.11
0.60±0.06
ABC(W)
�0.01±0.100.06±0.050.41±0.17
�0.01±0.05
0.19±0.14
0.08±0.070.121±0.060.22±0.270.16±0.14
�0.34±0.09
�0.21±0.18
�0.16±0.22
A.lixula
(%pluteus)
0±0
0±0
27.2±2.5
41.25±5.38
63.7±5.06
91.7±2.2
24.5±2.1
11.5±1.9
35.5±5.5
48±8.6
73.3±5.51N.A.
P.lividus
(%pluteus)
0±0
8.5±5.1
40.5±5.2
40.7±2.6
83±1.4
85±1.8
19.2±4.1
9.5±5.25
23±2.2
53.2±5.6
67.7±3.1
N.A.
Meanvalues±S.D.
L. Marın-Guirao et al. / Marine Pollution Bulletin 50 (2005) 374–387 379
Bay (Table 2). The highest dominance value corre-
sponded to this station, since it was clearly dominated
by just two species, the crustacean Apseudes latreillei
and one species of the polychaeta family Sabellidae,
the former reaching densities of 2225 indm�2 and the
latter 550 indm�2, approximately. These two organismswere also the dominant species in station PN (east side
of Portman Bay) with densities of 640 and 731 indm�2,
respectively.
Station CN, located close to Portman Bay, presented
the lowest abundance value and, with PG, the lowest
number of species. The richness and diversity values
were low, as was the dominance since neither of the spe-
cies was dominant.Station CM, located between the stations near the
emissary (PN, PG and CN) and those far from it (PE
and PL) presented the maximum faunal abundance,
with the most abundant species being the polychaeta
families Capitellidae (Capitella sp), Cirratulidae (Chae-
tozone setosa), Spionidae (Prionospio sp) and Syllidae,
some of them known to be indicators of environmental
instability (Simboura et al., 1995; Picard, 1965; Pearsonand Rosenberg, 1978), and the crustacean Monoculodes
carinatus, which is sensitive to pollutants (Borja et al.,
2000; Simboura and Zenetos, 2002).
The highest values of richness, diversity and evenness
were found in PE station. This was the only station,
where the sensitive indicator species Branchiostoma
lanceolatum, Lucinella divaricata, Erichthonius punctatus
and Apherusa alacris (Simboura and Zenetos, 2002)were found. PL station also presented a high number
of species and high diversity and evenness values, its fau-
nal composition being similar to the above mentioned
PE. Species common to these stations were the crusta-
ceans Bathyporeira guilliamsoniana, Harpinia sp, Phoxo-
cephalus aquosus, Urothoe grimaldii and the ophiura
Amphiura chiajei. Although the polychaeta faunal com-
position of PE and PL stations was similar to that ofCM, the crustacea and mollusca composition were gen-
erally different, except in the case ofM. carinatus, a crus-
tacean identified as sensitive to pollutants (Simboura
and Zenetos, 2002) and present in all three stations.
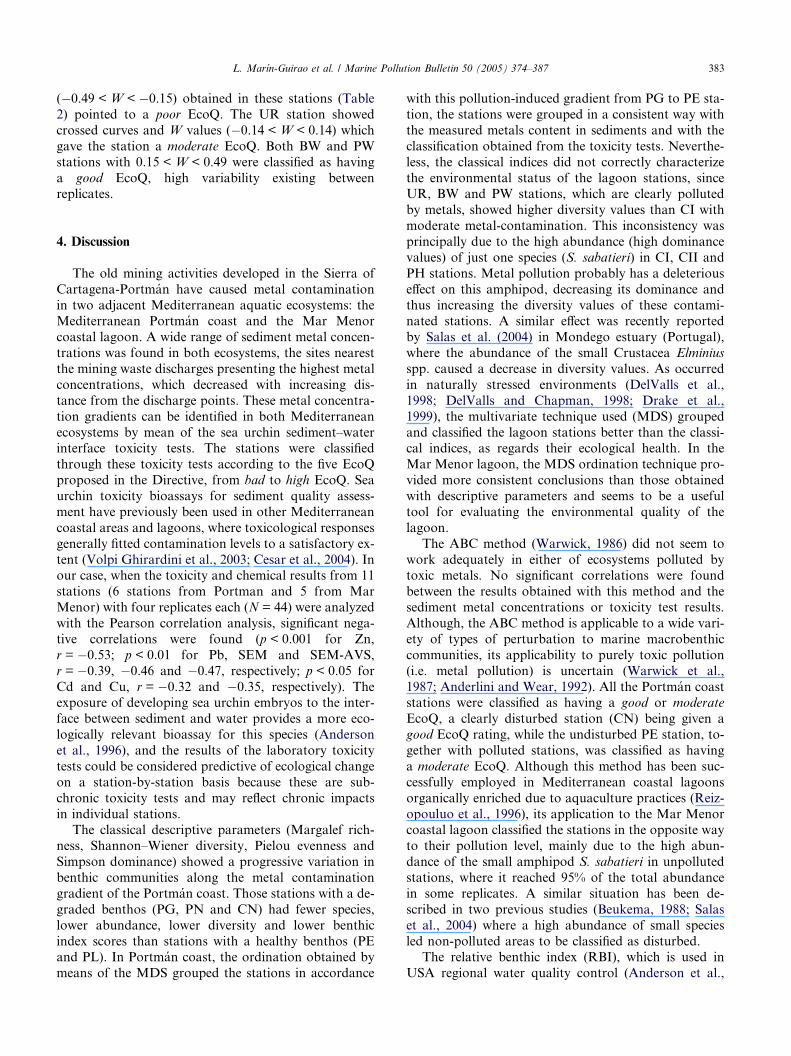
In Portman coast, the MDS ordination technique
(Fig. 2a) indicated a clearly defined gradient from PG
to PE station. Replicates of CN station were plotted to-
tally separated from the rest of the stations and off thedefined gradient.
In the Mar Menor coastal lagoon, a total of 31 spe-
cies were found, with only the amphipod Siphonoecetes
sabatieri being present in every station. The abundances
of this amphipod follows the descending order
CI > PH > CII > UR > BW > PW. Although, CI and
CII stations showed the highest number of species
(Table 2), CI presented the lowest diversity and highestdominance values due to the high abundance of
S. sabatieri (4131 ± 1852 indm�2). The sensitive species,
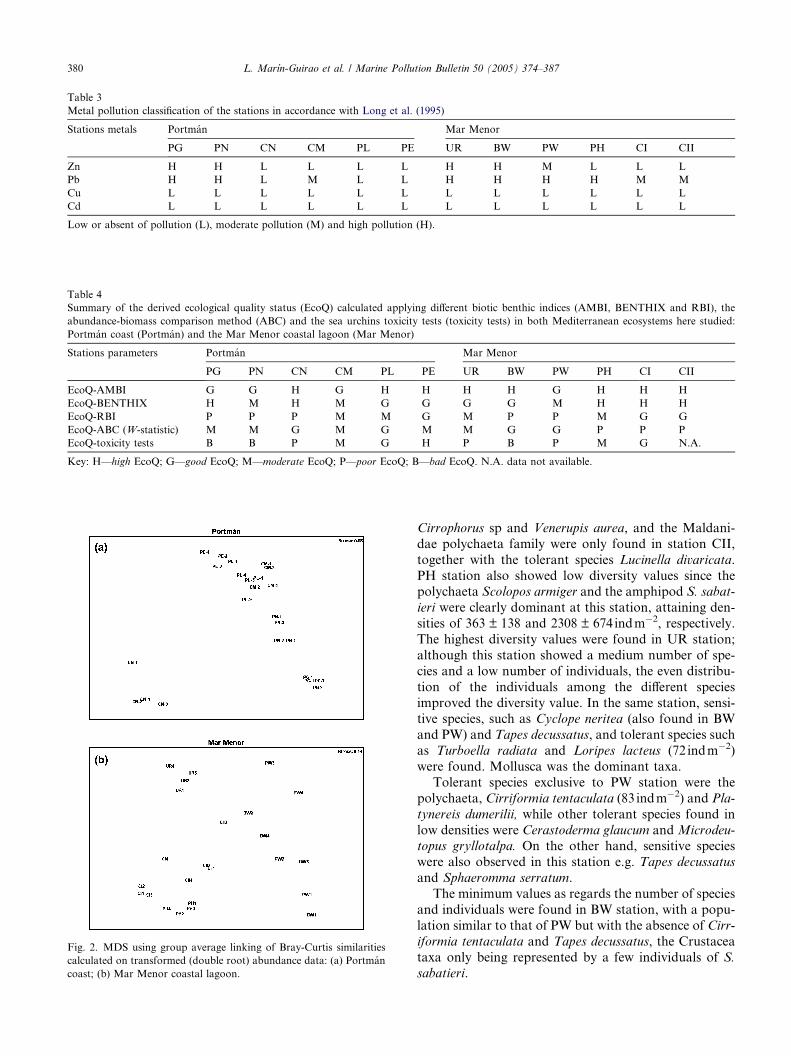
Table 3
Metal pollution classification of the stations in accordance with Long et al. (1995)
Stations metals Portman Mar Menor
PG PN CN CM PL PE UR BW PW PH CI CII
Zn H H L L L L H H M L L L
Pb H H L M L L H H H H M M
Cu L L L L L L L L L L L L
Cd L L L L L L L L L L L L
Low or absent of pollution (L), moderate pollution (M) and high pollution (H).
Table 4
Summary of the derived ecological quality status (EcoQ) calculated applying different biotic benthic indices (AMBI, BENTHIX and RBI), the
abundance-biomass comparison method (ABC) and the sea urchins toxicity tests (toxicity tests) in both Mediterranean ecosystems here studied:
Portman coast (Portman) and the Mar Menor coastal lagoon (Mar Menor)
Stations parameters Portman Mar Menor
PG PN CN CM PL PE UR BW PW PH CI CII
EcoQ-AMBI G G H G H H H H G H H H
EcoQ-BENTHIX H M H M G G G G M H H H
EcoQ-RBI P P P M M G M P P M G G
EcoQ-ABC (W-statistic) M M G M G M M G G P P P
EcoQ-toxicity tests B B P M G H P B P M G N.A.
Key: H—high EcoQ; G—good EcoQ; M—moderate EcoQ; P—poor EcoQ; B—bad EcoQ. N.A. data not available.
Fig. 2. MDS using group average linking of Bray-Curtis similarities
calculated on transformed (double root) abundance data: (a) Portman
coast; (b) Mar Menor coastal lagoon.
380 L. Marın-Guirao et al. / Marine Pollution Bulletin 50 (2005) 374–387
Cirrophorus sp and Venerupis aurea, and the Maldani-
dae polychaeta family were only found in station CII,
together with the tolerant species Lucinella divaricata.
PH station also showed low diversity values since thepolychaeta Scolopos armiger and the amphipod S. sabat-
ieri were clearly dominant at this station, attaining den-
sities of 363 ± 138 and 2308 ± 674 indm�2, respectively.
The highest diversity values were found in UR station;
although this station showed a medium number of spe-
cies and a low number of individuals, the even distribu-
tion of the individuals among the different species
improved the diversity value. In the same station, sensi-tive species, such as Cyclope neritea (also found in BW
and PW) and Tapes decussatus, and tolerant species such
as Turboella radiata and Loripes lacteus (72 indm�2)
were found. Mollusca was the dominant taxa.
Tolerant species exclusive to PW station were the
polychaeta, Cirriformia tentaculata (83 indm�2) and Pla-
tynereis dumerilii, while other tolerant species found in
low densities were Cerastoderma glaucum andMicrodeu-
topus gryllotalpa. On the other hand, sensitive species
were also observed in this station e.g. Tapes decussatus
and Sphaeromma serratum.
The minimum values as regards the number of species
and individuals were found in BW station, with a popu-
lation similar to that of PW but with the absence of Cirr-
iformia tentaculata and Tapes decussatus, the Crustacea
taxa only being represented by a few individuals of S.sabatieri.

L. Marın-Guirao et al. / Marine Pollution Bulletin 50 (2005) 374–387 381
The MDS ordination technique classified the coastal
lagoon stations into three groups according to their fau-
nal composition similarities (Fig. 2b). One group was
composed of PH, CI and CII stations, with a replicate
of the latter station (CII3) outside the group. UR station
formed another group with the four replicates wellgrouped, and both wadi stations (BW and PW), whose
replicates were mixed and dispersed to the right side of
the plot, formed the third group.
3.4. Biological benthic indices
3.4.1. AMBI
The application of the AMBI to the Mediterraneancoast of Portman ordered the stations in the following
way: PG > CM > PN > CN > PL > PE. PE, PL and
CN stations were identified as unpolluted, the last pre-
senting the greatest variance between replicates (Table
2). The biotic coefficient classified these stations as hav-
ing a high EcoQ (Table 4), pointing to an impoverished
benthic community health. On the other hand, PG, PN
and CM stations were classified as slightly polluted siteswith a good EcoQ, indicating an unbalanced benthic
community health. The first showed the highest biotic
coefficient values and highest concordance between rep-
licates, and the last the highest variability between repli-
cates (from unpolluted to mainly polluted). In every case
the percentage of individuals not assigned to any EG
was low (<5%).
In the case of the Mar Menor coastal lagoon, theAMBI classified all stations as unpolluted with a high
EcoQ, except PW which was classified as slightly pol-
luted (good EcoQ). The biotic index pointed to normal
benthic community health in PH and CI stations, an
unbalanced state of health in PW station and an impov-
erished benthic community health in the rest of the sta-
tions (UR, BW and CII). There was strong uniformity
among the classifications of the replicates in every sta-tion except PW, where unpolluted and meanly polluted
replicates were classified. The percentage of individuals
not assigned to any EG was low (<10%) in every station.
3.4.2. BENTIX
The results obtained applying the BENTIX to both
marine ecosystems are shown in Table 2. In the Portman
coastal stations the pollution classification indicatedthat CN and PG stations were pristine sites with a high
EcoQ. A good EcoQ rating was achieved in PE and PL
stations, with a slightly polluted classification. PN and
CM stations were classified as moderately polluted sites,
both corresponding to a moderate EcoQ (Table 4).
When the BENTIX was applied to the Mar Menor,
the stations were classified as follows. A pristine pollu-
tion classification and a high EcoQ was given to PH,CI and CII stations, with a high degree of concordance
between replicates. Although they showed some tolerant
species (Heteromastus filiformis, Cirriformia tentaculata
and Cerastoderma glaucum), the great abundance of
the amphipod S. sabatieri increased the percentage of
individuals belonging to the EGI (sensitive species) to
higher than 85%. UR and BW stations were classified
as slightly polluted or transitional sites with a good
EcoQ. The latter station presented a high degree of var-
iability between replicates, from high EcoQ (BEN-
TIX = 6) in one replicate where just one sensitive
organism was present (Cyclope neritea) to moderate
EcoQ (BENTIX = 2.5) due to the presence of some
H. filiformis and because 94% of its fauna, principally
S. armiger, were not assigned to any EG. PW station
was classified as moderately polluted, with replicatescorresponding to different EcoQ scores: poor EcoQ for
two replicates, mainly composed of H. filiformis and
C. tentaculata, and one replicate with a good EcoQ pre-
senting a few individuals of S. sabatieri, S. serratum and
C. neritea. The percentage of individuals not assigned to
any EG varies widely between stations, with the lowest
percentages corresponding to ‘‘pristine’’ stations
(<15%) and the highest to ‘‘polluted’’ stations (2.4–94%).
3.4.3. RBI
The values obtained applying the RBI to the two
Mediterranean ecosystems studied are shown in Table
2. In the case of Portman coast the positive/sensitive
indicator species selected belonged to the species Phoxo-
cephalus aquosus, Urothoe grimaldii (Amphipoda) andBranchiostoma lanceolatum (Branchiostomida), while
the negative/tolerant indicator species was the Tanaida-
cea Apseudes latreillei. When the index was divided into
the five ecological statuses proposed in the WFD, the
stations were classified in the following way: a good
EcoQ was given to PE station, located far from the
waste outlet, a moderate EcoQ to PL and CM stations
in the middle of the transect and a poor EcoQ to PN,PG and CN, the stations closest to the bay (Table 4).
Identified as positive/sensitive species in the Mar
Menor coastal lagoon were Siphonoecetes sabatieri
(Amphipoda) and Chamelea gallina (Bivalvia) and as
negative/tolerant the Tanaidacea, Leptochelia dubia. When
the RBI was applied in this ecosystem, CI and CII sta-
tions were classified as having a good EcoQ, UR and
PH stations a moderate EcoQ and those stations locatedin the mouth of the temporary streams, where the min-
ing wastes were historically discharged, a poor EcoQ.
The selected positive and negative species are in
accordance with the classification proposed by Simbo-
ura and Zenetos (2002) and Borja et al. (2000) and cor-
respond to sensitive and tolerant species, respectively.
3.4.4. Abundance-biomass comparison method
The application of the ABC method to the Mediter-
ranean coast of Portman (Fig. 3) and the values of the

Fig. 3. ABC plots.
382 L. Marın-Guirao et al. / Marine Pollution Bulletin 50 (2005) 374–387
W statistic obtained (Table 2) showed that stations PL
and CN, with both their abundance and biomass plots
clearly separated, could be classified as undisturbed.
TheW statistic obtained in these two stations was higher
than 0.15, indicating a good EcoQ, whereas in the rest of
stations (PE, CM, PN and PG) a moderate degree of
disturbance was found, since both curves were close
and crossed each other. The W statistic calculated
(�0.14 <W < 0.14) classified these stations as having amoderate EcoQ (Table 4).
In the Mar Menor lagoon, PH, CI and CII stations
seemed to be moderately to grossly disturbed as the
abundance curves lay above the biomass curves
(Fig. 3). The negative values of the W statistic
L. Marın-Guirao et al. / Marine Pollution Bulletin 50 (2005) 374–387 383
(�0.49 <W < �0.15) obtained in these stations (Table2) pointed to a poor EcoQ. The UR station showed
crossed curves and W values (�0.14 <W < 0.14) whichgave the station a moderate EcoQ. Both BW and PW
stations with 0.15 <W < 0.49 were classified as having
a good EcoQ, high variability existing betweenreplicates.
4. Discussion
The old mining activities developed in the Sierra of
Cartagena-Portman have caused metal contamination
in two adjacent Mediterranean aquatic ecosystems: theMediterranean Portman coast and the Mar Menor
coastal lagoon. A wide range of sediment metal concen-
trations was found in both ecosystems, the sites nearest
the mining waste discharges presenting the highest metal
concentrations, which decreased with increasing dis-
tance from the discharge points. These metal concentra-
tion gradients can be identified in both Mediterranean
ecosystems by mean of the sea urchin sediment–waterinterface toxicity tests. The stations were classified
through these toxicity tests according to the five EcoQ
proposed in the Directive, from bad to high EcoQ. Sea
urchin toxicity bioassays for sediment quality assess-
ment have previously been used in other Mediterranean
coastal areas and lagoons, where toxicological responses
generally fitted contamination levels to a satisfactory ex-
tent (Volpi Ghirardini et al., 2003; Cesar et al., 2004). Inour case, when the toxicity and chemical results from 11
stations (6 stations from Portman and 5 from Mar
Menor) with four replicates each (N = 44) were analyzed
with the Pearson correlation analysis, significant nega-
tive correlations were found (p < 0.001 for Zn,
r = �0.53; p < 0.01 for Pb, SEM and SEM-AVS,
r = �0.39, �0.46 and �0.47, respectively; p < 0.05 forCd and Cu, r = �0.32 and �0.35, respectively). Theexposure of developing sea urchin embryos to the inter-
face between sediment and water provides a more eco-
logically relevant bioassay for this species (Anderson
et al., 1996), and the results of the laboratory toxicity
tests could be considered predictive of ecological change
on a station-by-station basis because these are sub-
chronic toxicity tests and may reflect chronic impacts
in individual stations.The classical descriptive parameters (Margalef rich-
ness, Shannon–Wiener diversity, Pielou evenness and
Simpson dominance) showed a progressive variation in
benthic communities along the metal contamination
gradient of the Portman coast. Those stations with a de-
graded benthos (PG, PN and CN) had fewer species,
lower abundance, lower diversity and lower benthic
index scores than stations with a healthy benthos (PEand PL). In Portman coast, the ordination obtained by
means of the MDS grouped the stations in accordance
with this pollution-induced gradient from PG to PE sta-
tion, the stations were grouped in a consistent way with
the measured metals content in sediments and with the
classification obtained from the toxicity tests. Neverthe-
less, the classical indices did not correctly characterize
the environmental status of the lagoon stations, sinceUR, BW and PW stations, which are clearly polluted
by metals, showed higher diversity values than CI with
moderate metal-contamination. This inconsistency was
principally due to the high abundance (high dominance
values) of just one species (S. sabatieri) in CI, CII and
PH stations. Metal pollution probably has a deleterious
effect on this amphipod, decreasing its dominance and
thus increasing the diversity values of these contami-nated stations. A similar effect was recently reported
by Salas et al. (2004) in Mondego estuary (Portugal),
where the abundance of the small Crustacea Elminius
spp. caused a decrease in diversity values. As occurred
in naturally stressed environments (DelValls et al.,
1998; DelValls and Chapman, 1998; Drake et al.,
1999), the multivariate technique used (MDS) grouped
and classified the lagoon stations better than the classi-cal indices, as regards their ecological health. In the
Mar Menor lagoon, the MDS ordination technique pro-
vided more consistent conclusions than those obtained
with descriptive parameters and seems to be a useful
tool for evaluating the environmental quality of the
lagoon.
The ABC method (Warwick, 1986) did not seem to
work adequately in either of ecosystems polluted bytoxic metals. No significant correlations were found
between the results obtained with this method and the
sediment metal concentrations or toxicity test results.
Although, the ABC method is applicable to a wide vari-
ety of types of perturbation to marine macrobenthic
communities, its applicability to purely toxic pollution
(i.e. metal pollution) is uncertain (Warwick et al.,
1987; Anderlini and Wear, 1992). All the Portman coaststations were classified as having a good or moderate
EcoQ, a clearly disturbed station (CN) being given a
good EcoQ rating, while the undisturbed PE station, to-
gether with polluted stations, was classified as having
a moderate EcoQ. Although this method has been suc-
cessfully employed in Mediterranean coastal lagoons
organically enriched due to aquaculture practices (Reiz-
opouluo et al., 1996), its application to the Mar Menorcoastal lagoon classified the stations in the opposite way
to their pollution level, mainly due to the high abun-
dance of the small amphipod S. sabatieri in unpolluted
stations, where it reached 95% of the total abundance
in some replicates. A similar situation has been de-
scribed in two previous studies (Beukema, 1988; Salas
et al., 2004) where a high abundance of small species
led non-polluted areas to be classified as disturbed.The relative benthic index (RBI), which is used in
USA regional water quality control (Anderson et al.,

384 L. Marın-Guirao et al. / Marine Pollution Bulletin 50 (2005) 374–387
2001; Hunt et al., 2001a), was the index that best classi-
fied the sites according to their degree of pollution. The
results obtained with this index were highly positively
correlated with the toxicity results (p < 0.001; r = 0.69)
and negatively correlated with the chemical analysis
(p < 0.05 for Zn, SEM and SEM-AVS; r = �0.38,�0.34 and �0.33, respectively). The index is based ontoxicology and natural history, taking into account the
responses of marine benthic communities to anthropo-
genic and natural disturbances, and was developed for
particular areas by selecting different indicator species
(Anderson et al., 1996). The selection of indicator spe-
cies must be based on known responses to anthropo-
genic and other disturbances and related naturalhistory, such as life history traits and abundance pat-
terns along environmental gradients and between study
stations (Anderson et al., 1998). Accordingly, the selec-
tion of indicator species along an environmental gradi-
ent or between stations can bias the results obtained
with the RBI, since species are selected in relation to
their presence-abundance in both extremes of the gradi-
ent or in polluted-undisturbed stations. In this sense, be-fore selecting a species as being positive/sensitive or
negative/tolerant, we must be sure that this same species
has previously been cited as indicator in the same type of
pollution. Moreover, the RBI does not take into ac-
count the absence of truly unpolluted stations, as may
be the case in the Mar Menor lagoon, limiting the selec-
tion of positive and/or negative species and therefore its
applicability.One of the benthic biotic indices proposed by the CIS
working group 2.4 (Coast) (Vincent et al., 2002) for
application within the scope of the WFD is the Azti�smarine biotic index (AMBI) (Borja et al., 2000). When
the AMBI was employed in both Mediterranean ecosys-
tems, only high and good EcoQ classifications were ob-
tained and no significant correlations were found
between this index and the metal content of sediments.Although, the classification obtained with this index
did not seem to be very conservative since 9 out of 12
stations were classified as having a high EcoQ, in the
case of Portman coast the scores of the AMBI ordered
the stations in a more or less similar way to the ordina-
tion provided by the chemical results. In a previous
work, Borja et al. (2003a) analyzed three stations along
a deep-transect off Portman Bay, obtaining a good EcoQ(2.0 < BC < 2.3), a classification that we thought over
generous because Cesar et al. (2004) found high levels
of metals and toxicity in stations located near those
studied by Borja et al. (2003a). In this sense, we thought
that, since the indicative species list generated for the
AMBI is mainly based on organic-pollution literature
(Borja et al., 2000), when pure toxic substances, such
as metals, are responsible for the disturbance, the speciesresponse is not the same and the classification obtained
will not reflect the real ecological status. Something sim-
ilar may occur when employing the BENTIX (Simboura
and Zenetos, 2002), the other benthic biotic index pro-
posed by the CIS working group 2.4 (Vincent et al.,
2002), to communities affected by toxic pollutants. The
indicator species lists proposed by Simboura and Zene-
tos (2002), which depend on the type of community, arebased on organic pollution literature and, furthermore,
the index was validated in Saronikos, a Greek Gulf that
receives much organic pollution. Therefore, its appli-
cation in the case of purely toxic pollution will not
necessarily be successful. The BENTIX classification
obtained for both ecosystems studied here was not
correlated with the classification obtained with the tox-
icity tests, and only the sediment copper concentrationwas negatively correlated with the BENTIX results
(p < 0.05, r = �0.30). The failure of the index in theMar Menor coastal lagoon was not surprising, as limita-
tions in its use in estuaries and lagoons have been de-
scribed previously (Simboura and Zenetos, 2002).
We found the indicator species lists presented for the
BENTIX to be incomplete since a very small number of
Crustacea species were included, and it is known thatthis taxon is generally more sensitive to environmental
contaminants and other anthropogenic disturbances
than most other components of the infauna, particu-
larly polychaetes (Pearson and Rosenberg, 1978). The
list of indicator species proposed in the AMBI includes
a higher number of species and is more complete than
that of Simboura and Zenetos. Although the applica-
tion of both indices requires a high level of taxonomiceffort, the fact that many of the species listed in the
AMBI are also classified at a family level means that
any such effort using this index will be lower. When
both species lists (AMBI and BENTIX) are compared,
it can be seen that some species are classified into differ-
ent ecological groups; for example, Perinereis cultrifera
and Aonides oxycephala are classified by the AMBI as
species tolerant to excess organic matter enrichment(EGIII), whereas in the case of the BENTIX they are
classified as sensitive to disturbance in general (EG1).
The development of this type of environmental tool re-
quires the consensus of scientists in the assignation of
species to a particular ecological group. Recently con-
troversy arose concerning the two above mentioned
indices and their application as new monitoring tools
in the WFD (Borja et al., 2004; Simboura, 2004). Inour case, when the indices were applied in two different
ecosystems impacted by mining wastes, neither pro-
vided good results, and even species described as sensi-
tive to pollution were found in heavily polluted stations
(e.g. Cyclope neritea, in BW station). Although both
indices (AMBI and BENTIX) did not correctly charac-
terize the sites here studied, we support the philosophy
on which they are based (indicative species), but, asmany other authors have suggested (e.g. Washington,
1984), we accept that a biotic index is unlikely to be

L. Marın-Guirao et al. / Marine Pollution Bulletin 50 (2005) 374–387 385
universally applicable, since organisms are not equally
sensitive to all types of anthropogenic disturbance
and are likely to respond differently to different types
of perturbation. The above applied benthic biotic indi-
ces were developed for cases of organic enrichment pol-
lution and have been seen to clearly classify sitesaccordingly (Borja et al., 2000, 2003b; Salas et al.,
2004; Simboura and Zenetos, 2002). Therefore the
development of new indicator lists as a function of
the type of pollutant may serve to improve the results
of such indices when studying other kinds of distur-
bance. We consider the development of new indicative
species lists more specifically related to the type of con-
tamination (metals, pesticides, hydrocarbons, etc.) to bevery important. Indeed, one of the objectives in the
initial phase of the WFD is the development of ‘‘type-
specific’’ reference conditions, a description of the bio-
logical quality elements that exist, or would exist, in
waters of high biological status, i.e. with no or only
very minor disturbance from human activities (WFD
2000/60/EC). Those reference conditions and their bio-
logical values could be used for the species selection, asthe populations found in these conditions would be
composed of, among others, sensitive species and, in
contrast, tolerant species will be found only in polluted
stations. Therefore, these biological reference values
could support the creation of new indicator lists as a
function of the type of pollution. Other tools that
would help in the development of new species indicator
lists could be ecotoxicological tests; it is supposed thatwhen a site presents sediment toxicity, organisms living
in those sediments must be tolerant of the pollutants
that characterize the site and so will be included as
tolerant organisms in the required species lists. In fact,
Chapman (1995) affirmed that one of the primary
advantages of laboratory toxicity tests was their ability
to establish and to validate field bioindicators.
In conclusion, when establishing the ecological qual-ity status of soft-bottom aquatic ecosystems as regards
benthic measurements, not every type of pollution
should be treated in the same way, since different biolog-
ical responses arise depending on the type of pollution.
Hence, for biological benthic indices to be applied with-
in the Directive new indicator species lists for different
kinds of pollutants need to be developed as they seem
to be good environmental tools in the case of organicenrichment pollution. We consider toxicity tests to be
useful environmental tools for the environmental assess-
ment of aquatic ecosystems, as is demonstrated here and
in other studies (e.g. Bryn et al., 1998; Hunt et al.,
2001b; Cesar et al., 2004). They are technically well
developed (USEPA, 1994; ASTM, 1997) and are widely
accepted as useful tools for a wide variety of research
and regulatory purposes (Swartz, 1989; Burton, 1991;Luoma and Ho, 1993). As such, they should be taken
into account before applying the Directive in the same
way as other non-European countries have incorporated
them in their environmental monitoring policies (Envi-
ronment Canada, 1992; CETESB, 1999; Kiddon et al.,
2003; USEPA, 1995, 2002). In addition, the use of differ-
ent methodologies, such as toxicity tests, multivariate
ordination techniques and/or pollutant chemical analy-sis, is highly recommended before establishing the envi-
ronmental quality of an aquatic system (Dauer, 1993;
Elliot, 1994) since, they help to avoid inconsistencies
when classifying the sites.
Acknowledgments
We are grateful to the anonymous referee for his use-
ful comments and constructive suggestions. We wish to
thank Philip Thomas for checking the English of the
manuscript. This work was funded by the European Re-
gional Development Fund (ERDF), Consejerıa de Agri-
cultura, Agua y Medio Ambiente, Region de Murcia,
Programa Seneca 2001 (AGR/24/FS/02).
References
Allen, H.E., Gongmin, F., Deng, B., 1993. Analysis of acid volatile
sulfide (AVS) and simultaneously extracted metals (SEM) for
estimation of potential toxicity in aquatic sediments. Environmen-
tal Toxicology and Chemistry 12, 1441–1453.
American Society for Testing and Materials, 1997. Standard guide for
conducting 10-day static sediment toxicity tests with marine and
estuarine amphipods. E1367-92. In: Annual Book of ASTM
Standards, Philadelphia, PA, vol. 11.05, pp. 731–756.
Anderlini, V.C., Wear, R.G., 1992. The effects of sewage and natural
seasonal disturbances on benthic macrofaunal communities in
Fitzroy Bay, Wellington, New Zealand. Marine Pollution Bulletin
24, 21–26.
Anderson, B., Hunt, J., Hester, M., Phillips, B., 1996. Assessment of
sediment toxicity at the sediment–water interface. In: Ostrander,
G.K. (Ed.), Techniques in Aquatic Toxicology. Lewis Publishers,
Ann Arbor, MI.
Anderson, B.S., Hunt, J.W., Phillips, B.M., Fairey, R., Roberts, C.A.,
Oakden, J.M., Puckett, H.M., Stephenson, M., Tjeerdema, R.S.,
Long, E.R., Wilson, C.J., Lyons, J.M., 1998. Chemistry, toxicity
and benthic community conditions in selected sediments of the Los
Angeles Region. Final Report. State Water Resources Control
Board, Sacramento, CA, USA.
Anderson, B.S., Hunt, J.W., Phillips, B.M., Fairey, R., Roberts, C.A.,
Oakden, J.M., Puckett, H.M., Stephenson, M., Tjeerdema, R.S.,
Long, E.R., Wilson, C.J., Lyons, J.M., 2001. Sediment quality in
Los Angeles Harbor, USA: A Triad assessment. Environmental
Toxicology and Chemistry 20, 359–370.
Beukema, J.J., 1988. An evaluation of the ABC method abundance/
biomass comparison as applied to macrozoobenthic communities
living on tidal flats in the Dutch Wadden Sea. Marine Biology 99,
425–433.
Borja, A., Franco, J., Perez, V., 2000. A marine biotic index to
establish the ecological quality of soft-bottom benthos within
European estuarine and coastal environments. Marine Pollution
Bulletin 40, 1100–1114.
Borja, A., Muxika, I., Franco, J., 2003a. The application of a marine
biotic index to different impact sources affecting soft-bottom

386 L. Marın-Guirao et al. / Marine Pollution Bulletin 50 (2005) 374–387
benthic communities along European coasts. Marine Pollution
Bulletin 46, 835–845.
Borja, A., Muxika, I., Franco, J., 2003b. Classification tools for
marine ecological quality assessment: the usefulness of macroben-
thic communities in an area affected by a submarine outfall. ICES
CM 2003/Session J-02, Tallinn (Estonia), 24–28 September 2003.
Borja, A., Franco, J., Perez, V., 2004. The biotic indices and the water
framework directive: the required consensus in the new benthic
monitoring tools. Marine Pollution Bulletin 48, 405–408.
Bryan, G.W., Langston, W.J., 1992. Bioavailability, accumulation and
effects of heavy metals in sediments with special reference to United
Kingdom estuaries: a review. Environmental Pollution 76, 89–131.
Bryn, M.P., Brian, S.A., Hunt, J.W., 1998. Spatial and temporal
variation in results of purple urchin (Strongylocentrotus purpuratus)
toxicity tests with zinc. Environmental Toxicology and Chemistry
17, 453–459.
Burton Jr., G.A., 1991. Assessing the toxicity of freshwater sediments.
Environmental Toxicology and Chemistry 10, 1585–1627.
Calvın-Calvo, J.C. (Ed.), 1999. El litoral sumergido de la Region de
Murcia. Cartografıa bionomica y valores ambientales. Consejerıa
de Medio Ambiente, Agricultura y Agua. Region de Murcia. 128
pp.
Cesar, A., Marın, A., Marın-Guirao, L., Vita, R., 2004. Amphipod
and sea urchin tests to assess the toxicity of Mediterranean
sediments: the case of Portman bay. Scientia Marina 68 (Suppl. 1),
205–213.
CETESB, 1999. Metodo de ensaio: Agua do mar—Teste de toxicidade
cronica de curta duracao com Lytechinus variegatus, Lamark, 1816
(Echinodermata: Echinoidea). L5.250. Cia. de Tecnologia de
Saneamento Ambiental do Estado de Sao Paulo, Brasil, 22 p.
Chapman, J.C., 1995. The role of ecotoxicology testing in assessing
water quality. Australian Journal of Ecology 20, 7–20.
Clarke, K.R., 1990. Comparisons of dominance curves. Journal of
Experimental Marine Biology and Ecology 138, 143–157.
Clarke, K.R., Gorley, R.N., 2001. PRIMER v5: User Manual/
Tutorial. Plymouth, United Kingdom.
Dauer, D.M., 1993. Biological criteria, environmental health and
estuarine macrobenthic community structure. Marine Pollution
Bulletin 26, 249–257.
DeLeon, A.R., Guerrero J., Faraco F., 1982. Evolution of the
pollution of the coastal lagoon of Mar Menor. VI Journees �Etud.Pollutions, Cannes, CIESM.
DeLeon, A.R., Mas, J., Guerrero, J., Jornet, A., 1984. Monitoring of
heavy metals in superficial sediment and some marine organisms
from the western Mediterranean coast. VIIes Journees Etud.
Pollutions, Lucerne, CIESM, pp. 321–326.
DelValls, T.A., Chapman, P.M., 1998. The use of multivariate analysis
to link the sediment quality triad components to site-specific
sediment quality values in the Gulf of Cadiz (Spain) and in San
Francisco Bay (USA). Ciencias Marinas 24, 313–336.
DelValls, T.A., Conradi, M., Garcıa-Adiego, E., Forja, J.M., Gomez-
Parra, A., 1998. Analysis of macrobenthic community structure in
relation to different environmental sources of contamination in two
littoral ecosystems from the Gulf of Cadiz (SW Spain). Hydrobi-
ologia 385, 59–70.
Drake, P., Baldo, F., Saez, V., Arias, A., 1999. Macrobenthic
community structure in estuarine pollution assessment on the Gulf
of Cadiz (SW Spain): Is the phylum-level meta-analysis approach
applicable? Marine Pollution Bulletin 38, 1038–1047.
Elliot, M., 1994. The analysis of macrobenthic community data.
Marine Pollution Bulletin 28, 62–64.
Environment Canada, 1992. Biological test method: Fertilization assay
using echinoids (sea urchins and sand dollars), amended November
1997. EPS 1/RM/27. North Vancouver, BC, 97 pp.
Grall, J., Glemarec, M., 1997. Using biotic indices to estimate
macrobenthic community perturbations in the Bay of Brest.
Estuarine, Coastal and Shelf Science 44, 43–53.
Hunt, J.W., Anderson, B.S., Phillips, B.M., Tjeerdema, R.S., Taberski,
K.M., Wilson, C.J., Puckett, H.M., Stephenson, M., Fairey, R.,
Oakden, J., 2001a. A large-scale categorization of sites in San
Francisco Bay, USA, based on the sediment quality triad, toxicity
identification evaluations, and gradient studies. Environmental
Toxicology and Chemistry 20, 1252–1265.
Hunt, J.W., Anderson, B.S., Phillips, B.M., Newman, R.S., Tjeer-
dema, R.S., Fairey, R., Puckett, H.M., Stephenson, M., Smith,
R.W., Wilson, C.J., Taberski, K.M., 2001b. Evaluation and use of
sediment toxicity reference sites for statistical comparisons in
regional assessments. Environmental Toxicology and Chemistry
20, 1266–1275.
Ingersoll, C.G., 1995. Sediment tests. In: Rand, G.M. (Ed.), Funda-
mentals of Toxicology Effects, Environmental Fate and Risk
Assessment, second ed. Taylor and Francis, pp. 231–255.
Kiddon, J.A., Paul, J.F., Buffum, H.W., Strobel, C.S., Hale, S.S., Cobb,
D., Brown, B.S., 2003. Ecological condition of US Mid-Atlantic
estuaries, 1997–1998. Marine Pollution Bulletin 46, 1224–1244.
Long, E.R., MacDonald, D.D., Smith, S.L., Calder, F.D., 1995.
Incidence of adverse biological effects within ranges of chemical
concentrations in marine and estuarine sediments. Environmental
Management 19, 81–97.
Luoma, S.N., Ho, K.T., 1993. Appropriate uses of marine and
estuarine sediment biassays. In: Calow, P. (Ed.), Handbook of
Ecotoxicology. Blackwell Scientific, Oxford, UK, pp. 193–226.
Pearson, T.H., Rosenberg, R., 1978. Macrobenthic succession in
relation to organic enrichment and pollution of the marine
environment. Oceanography and Marine Biology Annual Review
16, 229–311.
Perez, J.G., Puente, C.R., 1989. Estudio de la contaminacion marina
entre Cabo de Palos y Cabo Tinoso (SE-Espana). Concentraciones
de cadmio, plomo y cinc en sedimentos superficiales. Informes
Tecnicos Instituto Espan ol de Oceanografıa. MAPA. 13 pp.
Picard, J., 1965. Recherches qualitatives sur les biocenoses marines des
substrats meubles dragables de la region marseillaise. Recueil del
Travaux de la Station Marine d�Endourme 52 (36), 1–160.Reizopouluo, S., Thessalou-Legaki, M., Nicolaidou, A., 1996. Assess-
ment of disturbance in Mediterranean lagoons: an evaluation of
methods. Marine Biology 125, 189–197.
Salas, F., Neto, J.M., Borja, A., Marques, J.C., 2004. Evaluation of
the applicability of a marine biotic index to characterize the status
of estuarine ecosystems: the case of Mondego estuary (Portugal).
Ecological Indicators 4, 215–225.
Simboura, N., 2004. BENTIX Index vs. Biotic Index in monitoring: an
answer to Borja et al., 2003. Marine Pollution Bulletin 48, 404–405.
Simboura, N., Zenetos, A., 2002. Benthic indicators to use in
Ecological Quality classification of Mediterranean soft bottom
marine ecosystems, including a new Biotic Index. Mediterranean
Marine Science 3 (2), 77–111.
Simboura, N., Zenetos, A., Panayotidis, P., Makra, A., 1995. Changes
of benthic community structure along an environmental pollution
gradient. Marine Pollution Bulletin 30 (7), 470–474.
Swartz, R.C., 1989. Marine sediment toxicity tests. In: Contaminated
Marine Sediments—Assessment and Remediation. National Acad-
emy Press, Washington, DC, pp. 115–129.
USEPA, 1994. Methods for assessing the toxicity of sediment-
associated contaminants with estuarine and marine amphipods.
EPA/600/-94/025, Narragansett, Rhode Island 02882.
USEPA, 1995. Short-term methods for estimating the chronic toxicity
of effluents and receiving waters to west coast marine and estuarine
organisms. EPA/600/R-95–136. Cincinnati, OH.
USEPA, 2002. Short-term methods for estimating the chronic toxicity
of effluents and receiving waters to marine and estuarine organ-
isms. EPA-821-R-02-014. Washington, DC 20460.
Verdardo, D.J., Forelich, P.N., Mc Intyre, A., 1990. Determination of
organic carbon and nitrogen in marine sediments using the Carlo
Erba NA-1500 analyzer. Deep Sea Research 37, 157–165.
L. Marın-Guirao et al. / Marine Pollution Bulletin 50 (2005) 374–387 387
Vincent, C., Heinrich, H., Edwards, A., Nygaard, K., Haythornthwa-
ite, J., 2002. Guidance on typology, reference conditions and
classification systems for transitional and coastal waters. Produced
by: CIS Working Group 2.4 (Coast), Common Implementation
Strategy of the Water Framework Directive, European Commis-
sion, 119 pp.
Volpi Ghirardini, A.M., Arizzi Novelli, A., Losso, C., Ghetti, P.F.,
2003. Sea urchin bioassays for sediment quality assessment in the
lagoon of Venice (Italy). Chemistry and Ecology 19, 99–111.
Warwick, R.M., 1986. A new method for detecting pollution effects on
marine macrobenthic communities. Marine Biology 92, 557–562.
Warwick, R.M., Pearson, T.H., Ruswahyuni, 1987. Detection of
pollution on marine macrobenthos: Further evaluation of the
species abundance/biomass method. Marine Biology 95, 193–
200.
Washington, H.G., 1984. Diversity, biotic and similarity indices. A
review with special relevance to aquatic ecosystems. Water
Research 18, 653–694.