Assessing the efficiency of connectivity measures with regard to the EU-Water Framework Directive in...
30
DRAFT ASSESSING THE EFFICIENCY OF CONNECTIVITY MEASURES WITH REGARD TO THE EU-WATER FRAMEWORK DIRECTIVE IN A DANUBE-TRIBUTARY SYSTEM A. Zitek, S. Schmutz & M. Jungwirth Department of Water, Atmosphere and Environment, Institute of Hydrobiology and Aquatic Ecosystem Management, University of Natural Resources and Applied Life Sciences, Max- Emanuelstraße 17, 1180 Vienna, Austria This paper has not been submitted elsewhere in identical or similar form, nor will it be during the first three months after its submission to Hydrobiologia. Correspondence: A. Zitek, Institute of Hydrobiology and Aquatic Ecosystem Management, University of Natural Resources and Applied Life Sciences, Max-Emanuelstraße 17, 1180 Vienna, Austria (Fax + 43 1 47654 5217; email [email protected] )
Transcript of Assessing the efficiency of connectivity measures with regard to the EU-Water Framework Directive in...

DR
AFT
ASSESSING THE EFFICIENCY OF CONNECTIVITY MEASURES WITH REGARD TO THE EU-WATER FRAMEWORK DIRECTIVE IN
A DANUBE-TRIBUTARY SYSTEM
A. Zitek, S. Schmutz & M. Jungwirth
Department of Water, Atmosphere and Environment, Institute of Hydrobiology and Aquatic Ecosystem Management, University of Natural Resources and Applied Life Sciences, Max-Emanuelstraße 17, 1180 Vienna, Austria
This paper has not been submitted elsewhere in identical or similar form, nor will it be during the first three months after its submission to Hydrobiologia.
Correspondence: A. Zitek, Institute of Hydrobiology and
Aquatic Ecosystem Management, University of Natural Resources and Applied Life Sciences, Max-Emanuelstraße 17, 1180 Vienna, Austria
(Fax + 43 1 47654 5217; email [email protected])

DR
AFT
ABSTRACT The effect of restoring connectivity for fish by the construction of 11 fish ladders in the Pielach and Melk rivers, both tributaries to the Danube in Austria, was monitored using electric fishing and fish traps between 1999 and 2004. To assess the efficiency of connectivity rehabilitation measures pre- and post-project data combining electric fishing and trap catch data were analysed by means of three fish-based assessment methods: a MUlti-Level concept for a Fish-based, river-type-specific Assessment of ecological integrity (MULFA), the Fish Index Austria (FIA) and the European Fish Index (EFI). The effect of adding qualitative trap catch data to electric fishing data on metrics and indices was also tested and the magnitude of the effect was related to the distance of the sites from the river mouth. The results clearly demonstrated the significant contribution of connectivity rehabilitation measures to the ecological integrity of rivers like the River Pielach where morphological conditions are good, whereas remaining channelisation still limits the success of connectivity measures in the River Melk. Trap catch data were found to represent an essential source of additional information to assess the efficiency of connectivity measures shortly after their implementation. The negative correlations of the magnitude of the effect of different indices and metrics with the distance of assessment sites from river mouths obviously underline the importance of the river Danube as a source for the re-colonisation process. While the indices tested were found to have limited ability to reflect short term response of fish assemblages to continuum rehabilitation, guild metrics were able to detect improvements of the ecological status shortly after the implementation of connectivity measures. Six metrics showed significant differences between pre and post-project data reflecting the expected increase of the ecological integrity: (1) Fish Region Index (FRI; FIA, MULFA), (2) number of subdominant species and (3) number of flow-guilds (FIA), (4) number of type specific species (MULFA), (5) number of benthic species and (6) number of potamodromous species (EFI); the FRI differences were only significant when trap catch data were added. The EFI indicated a decline of ecological integrity through increases in the density of omnivorous species and the relative number of tolerant species as well as a decrease in the relative number of intolerant species. Significantly decreasing responses with the distance from the river mouth were documented by the EFI and MULFA-index, the FRI (FIA, MULFA), total biomass and for the number of type specific species (MULFA).

DR
AFT
INTRODUCTION Freshwater ecosystems have suffered the most intense intervention of all ecosystems over the past 100 years of human history, with severe consequences on fish biodiversity (Cowx & Collares-Pereira, 2002). Many fish species are now extinct, rare or endangered; the need for conservation action is paramount and the conservation of fish diversity remains one of the most difficult challenges facing the EU in preserving our natural biological diversity (Delpeuch, 2002). In 2000 the European Union launched the Water Framework Directive (WFD, http://www.euwfd.com) (WFD, 2000). The main focus of the WFD is the management of river basins, the natural geographical and hydrological unit. One of the key objectives of the WFD is to achieve “good ecological status” of running waters by 2015. The re-establishment of longitudinal (and lateral) connectivity for fish on the catchment level is thought to be crucial for achieving the central targets of the WFD. As the term “restoration” usually describes a total return to an original state and to a state that is perfect and healthy, the term rehabilitation as “action of restoring a thing to a previous condition” without the implication of perfection (Bradshaw, 1996) is probably more appropriate for the efforts, undertaken for fulfilling the EU-WFD requirements. With regard to interruptions in connectivity, the total removal of a barrier would be the restoration of the longitudinal continuum; building fish ladders is usually rehabilitation, because in most cases fish migration (up- and downstream) remains affected by the barrier in certain ways. Therefore within the present paper the term “rehabilitation” will be used. Although Roni et al. (2002) rank the re-connection of stream habitat as the most important of rehabilitation activities in their prioritization hierarchy due to its high cost-effectiveness, studies are not available describing the effectiveness of connectivity restoration in contributing to the overall ecological integrity of rivers with regard to the EU-WFD. Detailed information and deep understanding of the potential contribution of different types of measures on the ecological integrity of rivers are necessary to define the most effective combination of rehabilitation measures. Out of nearly 200 European freshwater fish species, 67 are now considered to be threatened by a variety of human activities. Major causes have been identified for 48 of these, and over half of these are associated with obstructions to migration pathways at dams and weirs (Northcote, 1998). The main consequences of continuum interruptions on riverine fish include increased vulnerability to stochastic processes and loss of genetic variability (Meldgaard et al., 2003; Habicht et al., 2004; Laroche & Durand, 2004), the reduction of population size and the loss of species (Backiel, 1985; Utzinger et al., 1998; Rieman & Dunham, 2000; Gehrke et al., 2002; Morita & Yamamoto, 2002; Cumming, 2004). Rheophilic species are known to be especially sensitive to connectivity problems (Penczak et al., 1998). As fish are adapted to the four dimensional nature of rivers (Ward, 1989) connectivity influences fish distribution at different spatial and temporal scales (Jungwirth, 1998) and migration has been often regarded as an adaptive phenomenon to increase growth, survival and abundance (Northcote, 1978). The establishment of fish migration facilities (Ackerbauministerium, 1891) and fish migration monitoring (Scheuring, 1949) have a considerably long tradition in Austria with currently increasing importance (Jungwirth et al., 1998). In recent years, various types of constructions have been used to re-establish the river continuum in Austria (Jungwirth, 1996; Eberstaller & Gumpinger, 1997; Unfer & Zitek, 2000). Until recently the focus was mainly on the technical details of fish passes construction related to the biological features of migrating fish (Clay,

DR
AFT
1995; Larinier et al., 2002), and standardized approaches for evaluating the individual functionality of fish passes are still rare and mainly available only at the national scale (Woschitz et al., 2003; Ebel et al., 2006; Schwevers & Adam, 2006). Increasingly nowadays the re-establishment of connectivity is seen as a catchment wide task integrating various spatial and temporal scales (Wiesner et al., 2006), that only can be fulfilled using integrated approaches (Schmutz et al., 2002). Although fish are well known as good indicators for the ecological integrity of rivers (Schiemer, 2000), especially for the connectivity of habitats at different spatial/temporal levels (Jungwirth et al., 2000), information on the overall effect of connectivity measures on the targeted populations and assemblages is widely lacking (Bryant et al., 1999). An efficient fish pass might be of little value, if habitat to which fish are migrating for spawning, feeding or survival, is either not available or is severely degraded (Northcote, 1998). On the other hand, habitat restoration measures might not lead to a full recovery of the type-specific fish fauna if barriers still act as “press disturbances” to delay or preclude recovery of fish assemblages (Niemi et al., 1990; Detenbeck et al., 1992). The term “press disturbance” is widely used to describe those human pressures that involve significant long term modifications of instream habitat shifting the whole system to an alternate state, like land-use change, channelization, loss of connectivity and flow regulation. In the absence of press disturbances, recovery processes of fish populations can potentially take place very fast, mainly influenced by the presence of source populations in undisturbed stretches upstream or downstream of impacted sites (Niemi et al., 1990; Detenbeck et al., 1992). Standardized approaches based on the assessment of the deviation of the present status of the ecological integrity from undisturbed river-type-specific conditions were developed to assess the ecological status of rivers and the effect of rehabilitation measures on fish with regard to the EU-WFD. In Austria, a first approach involved the development of a MUlti-Level concept for a Fish-based, river-type-specific Assessment of ecological integrity (MULFA) (Schmutz et al., 2000). This uses a five-tiered normative scheme following the reference approach. Based on this, the Fish Index Austria (FIA) was developed by Haunschmid et al. (2006). It is a multi-metric index which measures the deviation of a type-specific reference fish community using nine metrics pre-selected by expert judgement and thoroughly tested on their reaction to different pressures taking into account species composition, abundance and age structure. On a European scale the European Fish Index (EFI) represents the first fish-based assessment method applicable on a large geographical scale (Pont et al., 2006). To assess the effect of connectivity measures in a Danube/tributary network shortly after implementation, pre- and post-project data combining electric fishing and trap catch data were analysed by means of the three fish-based assessment methods, MULFA, FIA and EFI. The following hypotheses were tested:
(1) the reestablishment of the river continuum leads to significant differences between pre- and post-project data measured by the reaction of the different indices and metrics.
(2) trap catch data contribute significantly to the reactions of indices and metrics. (3) the magnitude of the effects of connectivity measures shortly after implementation
is highest at low distances from “source” populations of the river Danube.

DR
AFT
MATERIAL AND METHODS
STUDY AREA The study area is situated about 90 km west of Vienna between 15°30'38'' East, 48°14'24'' North and 15°14'28'' East, 48°09'03'' North (WGS84) and consists of the Pielach and Melk, both medium sized tributaries discharging into the Danube at river kilometre 2034 (distance from the Black Sea) (Table 1). The continuum in the Pielach and Melk rivers within the study area is disrupted by four artificial falls as a result of river engineering measures and six weirs built for hydroelectric power production. Within the frame of the LIFE-Nature project “Living space of Danube salmon” (LIFE99 NAT/A/006054) six interruptions to the continuum in the Pielach (P1-P6, Fig. 1) and four in the Melk (M1-M4, Fig. 1) were bypassed by different types of fish passes between 01.10.2000 and 24.06.2003 (Table 2). While the Melk is mostly channelised, the Pielach has retained some of its natural morphological characteristics, such as meandering sections, side arms, dynamic gravel bars, large woody debris, small oxbows, inundation areas and floodplain forests (Schmutz et al., 2002). Both, the Pielach and Melk rivers are affected by water abstraction (37%, 5%) and impoundment (15%, 26%) within the study area and are situated at the transition from hyporhithral to epipotamal zones, whereas lowland river characteristics prevail in the Melk(Schmutz et al., 2002).
Insert Table 1 here Insert Table 2 here
Insert Figure 1 here
ASSESSMENT An extensive monitoring programme was carried out between 1999 and 2004 using electric fishing and traps to evaluate the efficiency of measures to improve connectivity in the Pielach and Melk rivers (Zitek & Schmutz, 2004). Fish stocks within the study area at the Pielach and Melk rivers were estimated prior to (1999) and after the implementation of the measures (2003) at representative mesohabitats using electric fishing and the removal method. For the analyses, neighbouring mesohabitats were combined into stretches with lengths of 10-20 times the river width except in two stretches of the Melk where 4.5 and 7 times the river width were used (Table 3 and Table 4). The methodology generally followed the CEN directive “Water analysis – fishing with electricity” (EN 14011) and the national standard (Haunschmid et al., 2006). Small-sized species and juveniles were probably underestimated due to the selectivity of electric fishing. In the Pielach sampling in 2003 was restricted to the lower section of the study area (~ 8 km length below P4, see Fig. 1) as the fish pass at P4 was finished only at the end of the monitoring period. In total three sampling stretches at the Pielach and six at the Melk were used for analyses (Fig. 1).
Insert Table 3 here Insert Table 4 here
Between 2001 and 2004 nine restored interruptions to the continuum were monitored using fish-traps (see Tab. 2 for details). The trap system used was an adaptation of the resistant board weir described by Tobin (1994) with 1 cm screen spacing (Mühlbauer et al., 2003). A quantitative assessment of immigrating fish from the Danube was conducted directly upstream of P1 in 2001 and 2002 using the same system with 2 cm spacing focusing on larger individulas conducting the spawning migration (Mühlbauer et al., 2003; Zitek & Schmutz, 2004). At this site, downstream migration was also assessed in 2001 using downstream

DR
AFT
oriented nets (mesh size: 1 cm). Trap catch data were qualitatively merged with electrofishing data by arbitrarily adding one individual per ha (MULFA, FIA) and one individual per run (EFI) to electrofishing data for species only recorded in traps in order to anticipate the ongoing recolonisation process, assuming that these species might also be found by electric fishing in future. As all surveyed fish ladders were found to be functioning well (Zitek, unpublished data); quantitative effects of the type of fish ladder on the re-colonisation process have not yet been integrated into the analyses.
DATA ANALYSIS Data were analysed using three different assessment methods: the MULFA-System (Schmutz et al., 2000), the FIA (Haunschmid et al., 2006) and the EFI (Pont et al., 2006). In principle all three approaches follow the EU-WFD as they are based on the assessment of the deviation of the present status from undisturbed river-type-specific conditions. Therefore, the definition of the undisturbed river type-specific fish fauna (the “reference”-situation) is a pre-requisite for all three methods. Both, the FIA and MULFA fully meet the requirements of the EU-WFD as they include different metrics describing species composition, abundance and age structure; the EFI does not include any information on the age structure and is therefore, strictly speaking, not in conformity with the WFD.
MULFA. The MULFA-approach uses seven criteria at five different biological organisation levels (Schmutz et al., 2000). A five-tiered normative scheme is used to assess the deviation of each parameter from the reference condition (status class=1) based on a qualitative verbal judgement. Except for the Fish Region Index (FRI), which may have both positive and negative responses, all other metrics are expected to respond positively to rehabilitation measures. The type specific fish assemblages for the Pielach and Melk rivers were defined based on historical abiotic data, historical fish data, data of reference sites and reference models. River specific species were divided into dominant, abundant and rare species. Only dominant and abundant species were treated as species with self sustaining populations in the reference condition. Species, that were supposed to immigrate into river tributaries from the river Danube only during spawning time were treated as rare species at the lowest river sections at both rivers (P1-P2 and M1-M2, Fig.1). Biomass and density values for the reference condition were defined on the basis of national studies conducted at similar rivers and at relatively undisturbed river sections within the study area (Jungwirth, 1984; Kaufmann et al., 1991). The FRI and the guild composition for the reference condition were calculated as weighted means using arbitrarily relations of dominant, abundant and rare species of 100:10:1. Species were classified as self sustaining by roughly estimating the number of adults within the study area and interpreting the age structure. Population age structure was interpreted only on the basis of dominant or abundant species and classified using absolute catch data divided into three age classes (0+, juveniles and adult) by expert judgement. The total MULFA-index was calculated as an arithmetic mean of the single metric indices. To translate the qualitative verbal scheme of class boundaries described in Schmutz et al. (2000) into absolute standardized numbers, cut values for the different status classes were defined by expert judgement (Table 5).
Insert Table 5 here

DR
AFT
FIA The Fish Index Austrian (FIA) (Haunschmid et al., 2006) analyzes the deviation of the actual fish assemblage from historically and actually pre-defined reference fish assemblages according to river types using nine metrics: percentage of dominant species, percentage of subdominant species, percentage of rare species, presence of reproductive guilds, presence of flow preference guilds (further named as number of flow-guilds), FRI, biomass, population structure of dominant species and subdominant species. The metrics were tested according to reaction of reference and impaired sites and redundancies by statistical analysis. Except for the FRI with possible reactions in both directions all other metrics are expected to react positively to rehabilitation measures. The total index is calculated by a weighted mean of single categories: 2x species composition index ((4x dominant species + 2x subdominant species + rare species + flow-guilds + spawning-guilds) / 9) + 3x population age structure index ((2x reproducing dominant species + reproducing subdominant species) / 3) plus 1x FRI divided by six. Biomass is defined as an additional knock-out criterion and leads to a status class of four or five if below 50 or below 25 kg/ha respectively. The same applies to significant deviation of the fish region index regarding reference values. Deviations larger than 0.6, 0.9 or 1.2 lead to total status classifications of 3, 4 or 5 respectively. It is possible to adapt the type-specific reference fish assemblage that is pre-defined within the available software programme, if reliable additional historical information is available. For the present analysis the pre-defined reference fish assemblage was changed based on the reference assemblage developed for the MULFA. Dominant species were determined as dominant, abundant species as subdominant ones and rare species as rare species. Species only immigrating from the Danube into both tributaries during spawning were defined as rare species for the lowest river sections (P1-P2 and M1-M2, Fig. 1).
EFI The EFI measures the deviation of the actual fish fauna from a predicted river type specific fish assemblage using ten metrics (Pont et al., 2006); the assemblage structure of the river type specific fish fauna is predicted by 13 abiotic variables. Generally most of the ten fish metrics are expected to be positively linked to rehabilitation measures except the density of omnivorous and phytophilic species as well as the relative number of tolerant species that are supposed to be positively related to human disturbances and therefore expected to react negatively (with decreasing values) to rehabilitation measures. For the EFI calculation a software programe freely available on the web (http://fame.boku.ac.at) was used.
Statistical analyses Differences of the overall indices and the observed individual metrics between pre-project electric fishing data (“pre”), post-project electric fishing data (“post”) and post-project electric fishing data merged with trap data (“post/trap”) were analyzed using the Mann-Whitney-test (Sokal & Rohlf, 2001). All tests were carried out individually and results then summarized in a table. Potential correlations of the effect size of connectivity measures with the distance of sites from the river mouth were tested using Spearman rank correlation. To calculate the magnitude of the effect, an un-weighted approach was chosen using the “log response ratio”, ln(effect magnitude), which is the natural logarithm of the ratio between the values of the experimental (“post/trap”) and control group (“pre”) (Gurevitch & Hedges, 2001). Due to the low sample size at the Pielach, statistical tests are of limited explanatory power there. Statistical analyses were conducted using SPSS®
12.0 (Bühl & Zöfel, 2004). Statistical significance levels were set at ≤0.05 (“strong significance”) and ≤0.1 (“weak significance”).

DR
AFT
RESULTS A total of 39 species and 8 guilds out of the reference fish assemblage (42 species and 8 guilds) were documented from the study area (Table 6). Species presently not documented and probably extinct from the study area are Carassius carassius (L.), Lampetra planeri (Bloch) and Leuciscus souffia agassizi (Val.). In total 30 species (77%) were caught by electric fishing and 37 (95%) species by traps (Table 6). 10 to 18 species and 10 to 16 were found inhabiting the sampling reaches in the Melk and Pielach rivers prior to rehabilitation of connectivity; 11 to 21 species (Melk) and 13 to 19 species (Pielach) were found within the sampling reaches during monitoring of the situation after the measures had been implemented (Tables 6-8). In traps 9 to 31 species (Melk) and 11 to 29 species (Pielach) were caught. In total, more species (39 versus 32) were found in the Melk than in the Pielach (Tables 7 and 8). Species documented in most sampling reaches were Alburnoides bipunctatus (Bloch), Βarbatula barbatula (L.), Barbus barbus (L.), Chondrostoma nasus (L.), Cottus gobio (L.), Gobio gobio (L.), Hucho hucho (L.), Leuciscus cephalus (L.), Leuciscus leuciscus (L.), Phoxinus phoxinus (L.) and Salmo trutta f.f. (L.) and species occurring in most of the traps were B. barbus, C. nasus, C. gobio, Cyprinus carpio (L.), G. gobio, L. cephalus, L. leuciscus, P. fluviatilis, S. trutta f.f. and Thymallus thymallus (L.) (Table 6).
Insert Table 6 here Insert Table 7 here Insert Table 8 here
Sixteen species only were found after the implementation of the connectivity measures: out of these, nine species (23%, Abramis ballerus (L.), Abramis sapa (Pallas), Blicca bjoerkna (L.), Gobio albipinnatus (Lukasch), Gymnocephalus baloni (Holcik & Hensel), Gymnocephalus schraetser (L.), Leuciscus idus (L.), Sander lucioperca (L.) and Silururs glanis (L.)) were only documented by traps, six species were found during the post-project monitoring by electric fishing and in traps (Abramis brama (L.), Alburnus alburnus (L.), Cobitis taenia (L.), Gymnocephalus cernuus (L.), Tinca tinca (L.) and Vimba vimba (L.)) and one species was only documented during the post-project electric fishing programme (Rhodeus sericeus amarus (L.)).
INDICES Strong significant differences between pre:post and pre:post/trap data were documented with the EFI at both rivers, but the decreasing index values reflected a reduction of the ecological integrity, as the EFI is scaled between zero and 1 (=excellent condition); with the MULFA a weakly significant difference between pre:post/trap data in the Pielach was documented indicating the expected enhancement of the ecological integrity (Table 9, Figure 2). Post:post/trap comparisons were never significant.
Insert Figure 2 here Insert Table 9 here
METRICS AND CONTRIBUTION OF TRAP CATCH DATA Significant differences between pre and post-project data without trap catch data were found for the FRI (FIA, MULFA) in the Pielach and Melk. An increase of the density of omnivorous species and relative number of tolerant species (Pielach and Melk, EFI), an increase in the density of phytophilic species and a decrease in the relative number of intolerant species (Pielach, EFI) indicated a decrease of the ecological integrity as the EFI generally expects rehabilitation measures to decrease the density of omnivorous species, relative number of
DR
AFT
tolerant species, density of phytophilic species and increase the relative number of intolerant species (EFI, Tab. 10, see also material & methods). Significant differences between pre and post/trap data reflected an increase in ecological integrity for the number of subdominant species and number of flow guilds (Melk, FIA), the number of type specific species (Melk, MULFA), number of benthic species and number of potamodromous species (Melk, EFI). The density of omnivorous species (Melk), the relative number of intolerant and tolerant species (Pielach and Melk, EFI), as described above, reacted significantly but inversely to their expected behaviour this being interpreted as a decrease of ecological integrity by the EFI. Due the addition of trap data, significant differences between post and post/trap data were found for number of rare species (FIA), number of type specific species (MULFA), number of benthic species, number of rheophilic species, number of potamodromous species and relative number of tolerant species (EFI); the documented increasing values clearly indicate the positive effect of connectivity measures, although, as mentioned above, the EFI inversely interprets the increase of the relative number of tolerant species as a sign for a decreasing ecological integrity.
Insert Table 10 here
MAGNITUDE OF EFFECT A significant correlation of the ln (effect size) and the distance from the river mouth was found for the EFI in the Melk and for the MULFA index in the Pielach (Fig. 3). In the case of the MULFA, a high negative effect indicates a stronger increase in the ecological integrity being measured with status classes from 1 (=reference condition) to five (=bad condition), however in the case of the EFI a negative effect reflects a decrease in ecological integrity. Significant negative correlations of the ln(effect size) with distance to mouth were found for the FRI (FIA, MULFA) at the river Melk, for the biomass (MULFA) at the river Pielach, and for the number of type specific species (MULFA) at the rivers Melk and Pielach indicating a stronger increase of metric values near the river mouth (Fig. 4).
DISCUSSION The EU-WFD currently represents the driving force for river rehabilitation throughout Europe. As a basis for setting the optimal combination of measures to reach the target of the “good ecological” status of water bodies, a deep understanding of the combined effects of human pressures as well as the effects of each type of measure and their subsequent combinations on the ecological integrity of rivers is crucial. From a catchment point of view the most complicated and urgent problem seems to be the rehabilitation of the continuum as most of European rivers are highly fragmented by weirs and migration obstacles (Dynesius & Nilsson, 1994; Northcote, 1998). The three main questions regarding connectivity and its rehabilitation are: 1) what are the effects of physical barriers, 2) what are the effects of restoring connectivity at the catchment level and 3) what combination of measures is most adequate to achieve good ecological status? Fish indices such as the MuLFA, FIA and EFI have been developed for standardized assessment of the effect of pressures with regard to the EU-WFD based on the assessment of the deviation of the present ecological status from undisturbed river type-specific conditions. However, their potential to evaluate the effects of rehabilitation measures has not been assessed. Most of the European rivers are affected by multiple pressures. In this paper we compared the effect of continuum rehabilitation in a morphologically near-natural river (Pielach) with a channelized river (Melk). A significant increase of the ecological integrity was only documented in the Pielach with the MULFA-index. A small but not significant reaction of the MULFA-index and FIA to connectivity measures was found in the Melk. This is mainly due to the channelization that is still acting as

DR
AFT
a “press” disturbance in the Melk. The bad morphological situation at the Melk seems primarily to negatively influence the population structure of dominant and subdominant species (FIA) and the density and biomass as well as the number of self-sustaining species (MULFA). Although the number of reproductive guilds (FIA) and the number of guilds in general (MULFA) are still not at reference level in both rivers, the population structure of dominant and subdominant species and the density and biomasses are significantly better at the near-natural Pielach River. Long-term recovery in the Melk is only expected if the morphological conditions will be significantly improved. The EFI showed a decrease in ecological integrity after implementation of the measures mainly because three metrics: density of omnivorous species, relative number of tolerant (both supposed to decrease with decreasing pressure) and relative number of intolerant species (supposed to increase with decreasing pressure) responded to rehabilitation significantly in the opposite manner. The reasons for that could be: that the EFI has been calibrated mainly against water quality pressure gradients (Pont et al., 2006) and opening the continuum enabled immigration of all kind of species including non-sensitive species, being considered to indicate degradation; additionally reproductive effects increasing the density of e.g. omnivorous species have influenced the results (Zitek, unpublished data). Within the present project generally the density based metrics as well as the FRI were reacting mainly to a natural variation of fish densities due to reproductive effects; however the significant positive reaction of metrics like number of accompanying species, number of flow-guilds, number of type specific species, number of benthic species and number of potamodromous species is clearly a result of the re-establishment of the river continuum. Re-connecting tributaries to the Danube showed significant benefits for both the tributary and main river fish assemblages, a result that is also suggested by other authors (Lelek, 1987). The effect decreased with the distance from the source populations located in the Danube. Some indices (EFI, Melk; MULFA, Pielach) and metrics (FRI, Melk; biomass, Pielach; number of type specific species, Melk and Pielach) showed at clear negative correlation with the distance from the river mouth. This underlies the hypothesis that recovery is a function of availability and distance of source populations (Sheldon & Meffe, 1995; Schlosser, 1998). The importance of tributaries and the availability and distance of source populations should be included in the decision making process for prioritizing connectivity rehabilitation measures. Currently, only few approaches exist for deciding which barrier to restore in multiple-fragmented river systems (O'Hanley & Tomberlin, 2005) although facing the high number of continuum disruptions a hierarchical strategy at catchment level is needed to prioritize rehabilitation measures (Roni et al., 2002). Successful rehabilitation of fish populations generally requires the integration of different scales (Feist et al., 2003), analysis of conditions at the watershed or landscape scale (Allan, 2004) as well as the integration of other human pressures to the river system like water abstraction, hydropeaking or impoundments. As stream fish are exposed to both natural and anthropogenic disturbances that can alter population distribution and abundance (Ensign et al., 1997), understanding the effects of combined human pressures, the natural fluctuations of fish populations and the recovery processes is crucial for a sound interpretation of the effects of different combinations of rehabilitation measures and a reliable assessment of the ecological integrity. For example, at a given site, factors such as the distance to source populations of potential colonists and “press” disturbances like the occurrence of barriers to movement or channelization are known to preliminarily influence the recovery process. Additionally, life history traits (Ensign et al., 1997) and homing effects (Zitek, unpublished data) might define potential recovery rates of fish populations in lowland rivers. The direction of re-settlement (drift of fish from upstream river sections or re-colonisation from downstream) together with local habitat conditions
DR
AFT
might also significantly influence the temporal pattern of how a fish assemblage recovers from disturbance (Unfer & Schmutz, 1998; Zitek et al., 2004a, b). A combination of different field sampling methods is supposed to enlarge the species coverage of sampled river systems (Gammon & Simon, 2000). Especially the monitoring of the immediate response of river stretches after re-establishing fish passage at continuum disruptions was found to require detailed observations of the initial re-colonisation process. Fish traps located at fish passes provided the additional information needed to assess the immediate response to continuum rehabilitation. Including trap catch data was found to significantly change the result of indexes as well as single metric values. Many of the immigrating species were only recorded in traps and not at the monitoring sites. In future a further challenging step would be to link the efficiency of fish passes to the overall recovery of upstream and downstream fish populations and assemblages because fish ladders with low efficiency might not be adequate to maintain or restore populations (Oldani & Baigun, 2002). While within the present project the existing fish indices for assessing the ecological integrity still failed in reflecting short-term response of continuum opening, individual metrics responding to the immigration of new species were able to detect the initial recovery process. This immediate response, mainly caused by upstream migrants, is supposed to be followed by a comprehensive recovery of the fish assemblages which should be reflected by fish indices in the long term, provided that all main pressures have been removed from the river.
ACKNOWLEDGEMENTS This study was conducted within the frame of the EU-LIFE Nature project “Living space of the Danube salmon” (LIFE99 NAT/A/006054) funded by the Government of Lower Austria and the EU and we would like to thank a large team of students and colleagues for the assistance at field work. We also want to thank R. Haunschmid and N. Schotzko for their valuable contributions to the description of the FIA. We gratefully thank two anonymous referees for their reviews and constructive comments on this manuscript and R. Welcomme for the dedicated assistance in improving the English of the text.
REFERENCES Ackerbauministerium, k. k., Ed. 1891. Anleitung betreffend der Herstellung von Fischwegen. Wien, k.k. Hof- und Staatsdruckerei.
Allan, J. D., 2004. Landscapes and riverscapes: The influence of land use on stream ecosystems. Annual Review of Ecology Evolution and Systematics 35: 257-284.
Backiel, T., 1985. Fall of migratory populations and changes in commercial fisheries in impounded rivers in Poland. Habitat modifications and Freshwater Fisheries. Proceedings of a Symposium of European Fisheries Advisory Comission, FAO. J. S. Alabaster, Ed. London, Butterworths: 28-41.
Bradshaw, A. D., 1996. Underlying principles of restoration. Canadian Journal of Fisheries and Aquatic Sciences 53: 3-9.
Bryant, M. D., B. J. Frenette and S. J. McCurdy, 1999. Colonization of a watershed by anadromous salmonids following the installation of a fish ladder in Margaret Creek, southeast Alaska. North American Journal of Fisheries Management 19: 1129-1136.

DR
AFT
Bühl, A. and P. Zöfel, 2004. SPSS Version 12, Einführung in die moderne Datenalyse unter Windows. München, Addison Wesley Verlag. 734.
Clay, C. H., 1995. Design of Fishways and Other Fish Facilities. Lewis Publishers. 248.
Cowx, I. G. and M. J. Collares-Pereira, 2002. Freshwater fish conservation: options for the future. Freshwater Fish Conservation - Options for the Future. M. J. Collares-Pereira, I. G. Cowx and M. M. Coelho, Eds. Oxford, Fishing News Books: 443-452.
Cumming, G. S., 2004. The impact of low-head dams on fish species richness in Wisconsin, USA. Ecological Applications 14: 1495–1506.
Delpeuch, B., 2002. Foreword. Freshwater Fish Conservation - Options for the Future. M. J. Collares-Pereira, I. G. Cowx and M. M. Coelho, Eds. Oxford, Fishing News Books - Blackwell Science: vii-viii.
Detenbeck, N. E., P. W. DeVore, G. J. Niemi and A. Lima, 1992. Recovery of temperate-stream fish communities from disturbance: a review of case studies and synthesis of theory. Environmental management 16: 33-53.
Dynesius, M. and C. Nilsson, 1994. Fragmentation and flow regulation of river systems in the northern third of the world. Science 266: 753-762.
Ebel, G., F. Fredrich, A. Gluch, C. Lecour and F. Wagner, 2006. Methodenstandard für die Funktionskontrolle von Fischaufstiegsanlagen. Sindelfingen. BWK. 115.
Eberstaller, J. and C. Gumpinger, 1997. Überfallfreies Umgehungsgerinne an der Pielach. Österreichs Fischerei 50. Jahrgang, Heft 2/3: 47 - 51.
Ensign, W. E., K. N. Leftwich, P. L. Angermeier and C. A. Dolloff, 1997. Factors Influencing Stream Fish Recovery Following a Large-Scale Disturbance. Transactions of the American Fisheries Society 126: 895-907.
Feist, B. E., E. A. Steel, G. R. Pess and R. E. Bilby, 2003. The influence of scale on salmon habitat restoration priorities. Animal Conservation 6: 271-282.
Gammon, J. R. and T. P. Simon, 2000. Variation in a Great River Index of Biotic Integrity over a 20-year period. Hydrobiologia 422-423: 291-304.
Gehrke, P. C., D. M. Gilligan and M. Barwick, 2002. Changes in fish communities of the Shoalhaven River 20 years after construction of Tallowa Dam, Australia. River Research and Applications 18: 265-286.
Habicht, C., J. B. Olsen, L. Fair and J. E. Seeb, 2004. Smaller effective population sizes evidenced by loss of microsatellite alleles in tributary-spawning populations of Sockeye Salmon from the Kvichak River, Alaska drainage. Environmental Biology of Fishes 69: 51-62.
Haunschmid, R., W. Honsig-Erlenburg, R. Petz-Glechner, S. Schmutz, N. Schotzko, T. Spindler, G. Unfer and G. Wolfram, 2006. Methodik-Handbuch: Fischbestandsaufnahmen in Fließgewässern. Mondsee. Bundesamt für Wasserwirtschaft, Institut für Gewässerökologie, Fischereibiologie und Seenkunde. 39.

DR
AFT
Haunschmid R., Wolfram, G., Spindler, T., Honsig-Erlenburg, W., Wimmer, R., Jagsch, A., Kainz, E., Hehenwarter, K., Wagner, B., Konecny, R., Riedmüller, R., Ibel, G., Sasano, B. and N. Schotzko, 2006: Erstellung einer fischbasierten Typologie österreichischer Fliessgewässer sowie einer Bewertungsmethode des fischökologischen Zustandes gemäß EU-Wasserrahmenrichtlinie. Schriftenreihe des BAW Band 23, Wien; 104 p. Jungwirth, M., 1984. Auswirkungen von Fließgewässerregulierung auf Fischbestände Teil II. Wasserwirtschaft-Wasservorsorge: Forschungsarbeiten. Wien, Bundesministerium für Land- und Forstwirtschaft. 188.
Jungwirth, M., 1996. Bypass channels at weirs as appropriate aids for fish migration in rhithral rivers. Regulated rivers: research & management 12: 483-492.
Jungwirth, M., 1998. River continuum and fish migration - going beyond the longitudinal river corridor in understanding ecological integrity. Fish Migration and Fish Bypasses. M. Jungwirth, S. Schmutz and S. Weiss, Eds. Oxford - London - Berlin, Blackwell Sciences Ltd. Fishing News Books: 19 - 32.
Jungwirth, M., S. Muhar and S. Schmutz, 2000. Fundamentals of fish ecological integrity and their relation to the extended serial discontinuity concept. Hydrobiologia 422: 85-97.
Jungwirth, M., S. Schmutz and S. Weiss, Eds. 1998. Fish Migration and Fish Bypasses. Oxford - London - Berlin, Fishing News Books, Blackwell Sciences.
Kaufmann, T., S. Muhar, J. Raderbauer, O. Rathschüler, S. Schmutz, H. Waidbacher and G. Zauner, 1991. Fischökologische Studie Mur. Wien. Abt. für Hydrobiologie, Fischereiwirtschaft und Aquakultur, Universität für Bodenkultur. 104.
Larinier, M., F. Travade and J. P. Porcher, 2002. Fishways: biological basis, design criteria and monitoring. Bulletin Français de la Pêche et de la Pisciculture 364 (Supplement).
Laroche, J. and J. D. Durand, 2004. Genetic structure of fragmented populations of a threatened endemic percid of the Rhone river: Zingel asper. Heredity 92: 329-334.
Lelek, A., 1987. Threatened Fishes of Europe. The freshwater fishes of Europe. 9. Wiesbaden, AULA-Verlag. 343.
Meldgaard, T., E. E. Nielsen and V. Loeschcke, 2003. Fragmentation by weirs in a riverine system: a study of genetic variation in time and space among populations of European grayling (Thymallus thymallus) in a Danish river system. Conservation Genetics 4: 735-747.
Morita, K. and S. Yamamoto, 2002. Effects of habitat fragmentation by damming on the persistence of stream-dwelling charr populations. Conservation Biology 16: 1318-1323.
Mühlbauer, M., E. Traxler, A. Zitek and S. Schmutz, 2003. Das dynamische Fischwehr - Ein hochwassersicheres Fischwehr zur Untersuchung der Fischwanderung an kleinen bis mittelgrossen Flüssen. Österreichs Fischerei 56: 136 - 148.
Niemi, G. J., P. Devore, N. Detenbeck, D. Taylor, A. Lima, J. Pastor, J. D. Yount and R. J. Naiman, 1990. Overview of case-studies on recovery of aquatic systems from disturbance. Environmental Management 14: 571-587.

DR
AFT
Northcote, T. G., 1978. Migratory strategies and production in freshwater fishes. Ecology of Freshwater Fish Production. S. D. Gerking, Ed. Oxford-London-Edinburgh-Melbourne, Blackwell Scientific Publications: 326-359.
Northcote, T. G., 1998. Migratory behaviour of fish and its significance to movement trough riverine fish passage facilities. Fish Migration an Fish Bypasses. M. Jungwirth, S. Schmutz and S. Weiss, Eds. Oxford - London - Berlin, Blackwell Science Ltd. Fishing News Books: 3-18.
O'Hanley, J. R. and D. Tomberlin, 2005. Optimizing the removal of small fish passage barriers. Environmental Modeling & Assessment 10: 85-98.
Oldani, N. O. and C. R. M. Baigun, 2002. Performance of a fishway system in a major South American dam on the Parana River (Argentina-Paraguay). River Research and Applications 18: 171-183.
Penczak, T., L. Glowacki, W. Galicka and H. Koszalinski, 1998. A long-term study (1985-1995) of fish populations in the impounded Warta River, Poland. Hydrobiologia 368: 157-173.
Pont, D., B. Hugueny, U. Beier, D. Goffaux, A. Melcher, R. Noble, C. Rogers, N. Roset and S. Schmutz, 2006. Assessing river biotic condition at a continental scale: a European approach using functional metrics and fish assemblages. Journal of Applied Ecology 43: 70-80.
Rieman, B. E. and J. B. Dunham, 2000. Metapopulations and salmonids: a synthesis of life history patterns and empirical observations. Ecology Freshwater Fish 9: 51-64.
Roni, P., T. J. Beechie, R. E. Bilby, F. E. Leonetti, M. M. Pollock and G. R. Pess, 2002. A review of stream restoration techniques and a hierarchical strategy for prioritizing restoration in Pacific northwest watersheds. North American Journal of Fisheries Management 22: 1-20.
Scheuring, L., 1949. Fischpässe, ihre Leistung und Zweckmäßigkeit. Österreichs Fischerei 2: 26-31.
Schiemer, F., 2000. Fish as indicators for the assessment of the ecological integrity of large rivers. Hydrobiologia 422-423: 271-278.
Schlosser, I. J., 1998. Fish recruitment, dispersal, and trophic interactions in a heterogeneous lotic environment. Oecologia 113: 260-268.
Schmutz, S., M. Kaufmann, B. Vogel, M. Jungwirth and S. Muhar, 2000. A multi-level concept for fish-based, river-type-specific assessment of ecological integrity. Hydrobiologia 422: 279-289.
Schmutz, S., A. Zitek, S. Zobel, M. Jungwirth, N. Knopf, E. Kraus, T. Bauer and T. Kaufmann, 2002. Integrated approach for the conservation and restoration of Danube salmon (Hucho hucho L.) populations in Austria. Freshwater Fish Conservation - Options for the Future. M. J. Collares-Pereira, I. G. Cowx and M. M. Coelho, Eds. Oxford, Fishing News Books - Blackwell Science: 157-173.
Schwevers, U. and B. Adam, 2006. Funktionskontrolle von Fischaufstiegsanlagen. Hennef. DWA. 123.

DR
AFT
Sheldon, A. L. and G. K. Meffe, 1995. Short-term recolonization by fishes of experimentally defaunated pools of a coastal plain stream. Copeia: 828-837.
Sokal, R. R. and F. J. Rohlf, 2001. Biometry: the principles and practice of statistics in biological research. New York, W. H. Freeman and Company.
Tobin, J. h., 1994. Construction and Performance of a Portable Resistance Board Weir for Counting Migrating Salmon in Rivers. Kenai. U. S. Fish and Wildlife Service, Kenai Fishery Resource Office. 27.
Unfer, G. and S. Schmutz, 1998. The course of fish colonisation in the Marchfeldkanal, a man-made canal- the first two years. Verhandlungen des internationalen Vereines für Limnologie 26: 2335-2340.
Unfer, G. and A. Zitek, 2000. Der Vertical-Slot-Fischpass: eine Fischwanderhilfe für räumlich beengte Verhältnisse. Österreichs Fischerei 53: 332-339.
Utzinger, J., C. Roth and A. Peter, 1998. Effects of environmental parameters on the distribution of bullhead Cottus gobio with particular consideration of the effects of obstructions. Journal of Applied Ecology 35: 882-892.
Ward, J. V., 1989. The 4-dimensional nature of lotic ecosystems. Journal of the North American Benthological Society 8: 2-8.
WFD, 2000. Directive 2000/60/EC of the European Parliament and Council of 23 October 2000 establishing a framework for Community action in the field of water policy.
Wiesner, C., Jungwirth, M. , S. Schmutz, G. Unfer and A. Zitek, 2006. Importance of connectivity in the Danube river catchment. International DWA Symposium on Water Resources Management: Free passage for Aquatic Fauna in Rivers and other Water Bodies, 03.-07. April 2006, Berlin. DWA-Themen: 142-150.
Woschitz, G., J. Eberstaller and S. Schmutz, 2003. Mindestanforderungen bei der Überprüfung von Fischmigrationshilfen (FMH) und Bewertung der Funktionsfähigkeit. Richtlinien der Fachgruppe Fischereisachverständige beim österreichischen Fischereiverband. Richtlininie 1/2000, Österreichischer Fischereiverband. 16.
Zauner, G. and J. Eberstaller, 2000. Classification scheme of the Austrian fish fauna based on habitat requirements. Verhandlungen des internationalen Vereines für Limnologie 27: 2101-2106.
Zitek, A. and S. Schmutz, 2004. Efficiency of restoration measures in a fragmented Danube/tributary network. Proceedings of the fifth international conference on ecohydraulics - aquatic habitats: analysis and restoration (12.-17. 09.04), Madrid. IAHR: 652-657.
Zitek, A., S. Schmutz, G. Unfer and A. Ploner, 2004a. Fish drift in a Danube/sidearm-system: I. Site-, species-, and stage-specific drift. Journal of Fish Biology 65: 1319-1338.
Zitek, A., S. Schmutz, G. Unfer and A. Ploner, 2004b. Fish drift in a Danube/sidearm-system: II. Seasonal and diurnal patterns. Journal of Fish Biology 65: 1339-1357.

DR
AFT
Tables Table 1: Main characteristics of the rivers Danube, Melk and Pielach (general and at study site). General characteristic Danube Pielach MelkTotal length (km) 2850 67.5 35.7Catchment size (km²) 801463 591 295
Streamorder 9 4 5Altitude (maA) 209–196 252–205 233–206Gradient (‰) 0.4 2.23 1.6Meanflow (m³s-1) ~1900 ~6.5 ~3Flowregime Moderate-nival Pluvio-nival Winter-pluvialFishregion Epipotamal Hyporhithral/Epipotamal Epipotamal
Characteristic at study site

DR
AFT
Table: 2: Types of barriers and fish ladders location (distance from mouth), bypassed heights, length, slope and minimum discharge of fish ladders, date of completion and monitoring time frame at the Pielach and Melk (* migration barrier at low flow condition in the Danube).
River Code Migration barrier Distance from mouth [m]
Bypassed height [m] Measure Length
[m]Slope [%]
Minimum discharge
[ls-1]
Date of completion Monitoring time
Pielach P1 artificial fall* 0 1.5 nature-like rock-ramp 25 6 total flow 01.10.00 02.04.-14.07.01, 19.02.-27.06.02
Pielach P2 weir 1600 2.8 bypass channel 220 1.3 500 15.09.0230.09.02-17.10.02,
05.03.-23.06.03, 11.03.-16-06.04
Pielach P3 artificial fall 5500 1.8 nature-like rock-ramp 35 5.1 > 700 08.07.02 05.03.-23.06.03Pielach P4 weir 8300 4 bypass channel 280 1.4 300 02.06.03 06.06.-26.06.03Pielach P5 weir 13300 2.2 bypass channel 296 0.7 300 24.06.03 -Pielach P6 weir 17500 1.6 bypass channel 164 1.0 250-300 02.04.02 03.04.-07.06.02Melk M1 artificial fall 250 3.4 nature-like rock-ramp 89 3.8 total flow 10.10.02 07.03.-26.06.03Melk M2 artificial fall 7000 1 nature-like rock-ramp 30 3.3 total flow 01.10.00 29.05.-09.07.01Melk M3 weir 9500 3.5 pool-and-weir-pass 110 3.2 250 01.04.03 19.04.-22.06.03Melk M4 weir 12600 0.9 nature-like rock-ramp 65 1.4 total flow 12.10.00 18.05.-09.07.01

DR
AFT
Table 3: Characteristics of sampling sites at the river Pielach; additional parameters to be filled in the EFI spreadsheet used to calculate the reference fish assemblage of the EFI are: Country (Aut), Ecoregion (9), River region (Danube), Rivername (Pielach), Catchment class (1000 km²), Catchment size (591 km²), Flow regime (Permanent), Geotype (Calcareous), Mean annual air temperature (8.8), Slope (2.2), Sampling Strategy (Whole), Method (Wading), Day/Night (Day), No. of runs (1), Runs separated (Total).
Stream segmentPre/Post Pre Post Pre Post Pre PostSite 1 1a 2 2a 3 3aDate 17.11.99 24.11.03 18.11.99 25.11.03 18.11.99 26.11.03
1 Altitude 201 202 211 211 220 2212 Distance from source (km) 67.14 66.6 63.6 63.6 60.95 59.753 Distance to mouth (km) 0.36 0.9 3.9 3.9 6.55 7.754 Fished area (m²) 8068 5040 3933 1155 2890 55655 Wetted width (m) 23 20 20 11 17 216 Length (m) 347 252 200 110 170 2657 Mean depth 100 35 90 90 90 808 Maximum depth 180 140 200 150 250 2009 Water temperature 8.6 7.8 8 7.6 5.8 7.1
10 Conductivity 610 583 589 577 575 62911 Morphology Nature-like Nature-like Nature-like Nature-like Nature-like Nature-like12 Residual flow Partially Yes No No Yes Yes13 Impoundment No No No No No No
P3-P4
Para
met
er P1-P2 P2-P3

DR
AFT
Table 4: Characteristics of sampling sites at the river Melk; additional parameters to be filled in the EFI spreadsheet used to calculate the reference fish assemblage of the EFI are: Country (Aut), Ecoregion (9), River region (Danube), Rivername (Melk), Catchment class (1000 km²), Catchment size (295 km²), Flow regime (Permanent), Geotype (Calcareous), Mean annual air temperature (8.8), Slope (1.6), Sampling Strategy (Whole), Method (Wading), Day/Night (Day), No. of runs (1), Runs separated (Total).
Stream segmentPre/Post Pre Post Pre Post Pre Pre Pre Post Post Post Pre Post
Site 1 1a 2 2a 3 4 5 3a 4a 5a 6 6aDate 17.11.99 26.11.03 18.11.99 26.11.03 18.11.99 01.12.99 01.12.99 27.11.03 27.11.03 27.11.03 02.12.99 28.11.03
1 Altitude 217 217 220 220 224 224 225 224 224 225 227 227
2 Distance from source (km) 28.35 28.35 26.30 26.45 23.70 23.45 23.10 23.70 23.45 23.10 21.05 21.053 Distance to mouth (km) 7.35 7.35 9.4 9.25 12 12.25 12.6 12 12.25 12.6 14.65 14.654 Fished area (m²) 2213 1995 1065 3835 1200 2613 2040 1750 1854 800 1729 3560
5 Wetted width (m) 15 21 8 13 8 13 17 10 9 8 11 136 Length (m) 150 95 142 295 150 201 120 175 206 100 153 2677 Mean depth 100 100 50 70 40 50 70 50 50 50 90 908 Max. depth 400 200 100 200 75 200 160 90 100 150 250 2509 Water temperature 4.4 6.8 4.3 6.9 3.9 2.3 2.3 6.7 8.4 8.4 5.1 7.3
10 Conductivity 604 575 6.5 558 625 619 622 576 561 561 554 55111 Habitat Channelized Channelized Channelized Channelized Channelized Nature-like Nature-like Channelized Nature-like Nature-like Re-structured Re-structured12 Residual flow No No Yes Yes No No No No No No No No13 Impoundment No No No Partially No No No No No No No No
upstream M4
Para
met
er M1-M2 M2-M3 M3-M4

DR
AFT
Table 5: Class boundaries for metrics of the MULFA method (Schmutz et al., 2000) developed for this study. Criteria
1.0 1.5 2.0 2.5 3.0 3.5 4.0 4.5 5.0bad
No. of. type specific species missing (%) 0-15 15-20 20-30 30-40 40-50 50-60 60-70 - >70No. of species with self sustaining populations missing (%) 0-20 - 20-35 35-50 50-60 60-70 70-80 - >80
Fish region changes (absolute numbers) 0.0-02 - 0.2-0.4 - 0.4-0.8 - 0.8-1.2 - >1.2No. of guilds missing (%) 0 - 0 - 0-40 - 40-70 - >70Guild compositionBiomass (density) missing (%) 0-20 20-30 30-40 30-50 50-60 60-70 70-80 80-90 >90Population age structure changes
Ecological integrity levels
based on absolute numbers of 0+, 1+ and >1+ individuals of dominant and abundant species per sampling site by expert judgement
relation of dominant guilds, and no.of guilds by expert judgement
high good fair poor

DR
AFT
Table 6: List of river type specific species within the study area, results of electric fishing (pre, post) and trap monitoring (trap) per site and total for rivers Pielach and Melk; x=species occurrence; numbers=how often a species was documented per method; species, only documented after implementation of connectivity measures (post, trap) are marked in grey; all river type specific species (n=42) are shown; for explanations of guild abbreviations see legends of tables 7 and 8.
Trap Pre Post Trap Pre Post Trap Pre Post Pre Post Total Trap Pre Post Trap Pre Post Trap Pre Pre Pre Post Post Post Trap Pre Post Pre Post Total Pre Post Total0.20 0.36 0.90 1.60 3.90 3.90 5.50 6.55 7.75 0.25 7.35 7.35 7.00 9.40 9.25 9.50 12.00 12.25 12.60 12.00 12.25 12.60 12.60 14.65 14.65P1 1 1a P2 2 2a P3 3 3a M1 1 1a M2 2 2a M3 3 4 5 3a 4a 5a M4 6 6a
is ballerus (L.) I/R x 1 1 xis brama (L.) I/E x x 1 x 1 x 1 1 x 2 xis sapa (Pallas) O/R x 1 1 x
des bipunctatus (Bloch) R/R x x x x x x x x x 3 3 x 3 x x x x x x x x x 5 4 x 8 7 x 3 xburnus (L.) I/E x x x 1 x 2 x x x x x x x x x 6 x 3 7 x 5 x
aspius (L.) I/R x 1 x x x x x x x 1 3 x 3 1 3 x 4 xa barbatula (L.) R/R x x x x x x x 3 3 x 1 x x x x x x x x x x x x x 6 6 x 1 9 9 x 2 x
(L.) R/R x x x x x x x x x 3 3 x 3 x x x x x x x x x x x x x x x x 6 6 x 4 9 9 x 7 x (L.) I/E x 1 x 1 x 1 2 xsius (L.) L/L -
us gibelio (Bloch) I/L x x 1 x 1 x x x x 2 1 2 x 3 xostoma nasus (L.) R/R x x x x x x x x x 3 3 x 3 x x x x x x x x x x x x x x x 6 6 x 3 9 9 x 6 x
s taenia (L.) O/E x 1 x x x 1 x 1 2 x 1 x gobio (L.) R/R x x x x x x x x x 3 3 x 3 x x x x x x x x x x x x x x 6 5 x 3 9 8 x 6 x
arpio (L.) I/L x x x x x x 1 2 x 3 x x x x x x 1 2 x 3 2 4 x 6 xius (L.) I/L x x 1 x 1 x x x x x x x 2 4 x 1 2 5 x 2 x
nnatus (Lukash) R/R x 1 x 1 2 x (L.) R/R x x x x x x x x 3 3 x 2 x x x x x x x x x x x x x x x 6 6 x 3 9 9 x 5 x
cephalus baloni (Holcik & Hensel) O/L x 1 1 xcephalus cernuus (L.) I/E x x 1 x 1 1 x 1 xcephalus schraetser (L.) O/R x 1 x 1 2 x
cho (L.) R/R x x x x x x x x x 3 3 x 3 x x x x x x x x 5 2 x 1 8 5 x 4 xaneri (Bloch) R/R -
cus cephalus (L.) I/E x x x x x x x x x 3 3 x 3 x x x x x x x x x x x x x x x x 6 6 x 4 9 9 x 7 xus idus (L.) I/E x 1 x 1 2 xus leuciscus (L.) I/R x x x x x x x x 3 3 x 2 x x x x x x x x x x x x x x 5 6 x 3 8 9 x 5 x
cus souffia agassizi (Val.) R/R -ta (L.) I/E x x 1 x 1 x x 1 1 x 2 1 x 1 xluviatilis (L.) I/E x x x x x x x 1 3 x 3 x x x x x x x 1 4 x 2 2 7 x 5 x
nus (L.) I/E x x x x x x x 3 3 x 1 x x x x x x x x x x x x x 6 6 x 1 9 9 x 2 xorhinus marmoratus (Pallas) I/E x 1 x x x 1 1 x 1 1 1 x 2 x
iceus amarus (Bloch) L/L x x 2 x 2 x x rutilus (L.) I/E x x 2 x x x x x 3 x 2 3 x 4 x
ia balcanica (Karaman) O/E x x 2 x 2 x x trutta forma fario (L.) R/R x x x x x x x 3 1 x 3 x x x x x x x x x x x x x x x 6 5 x 4 9 6 x 7 x
operca (L.) I/E x 1 x 1 2 xnius erythrophthalmus (L.) L/L x x x 1 x 2 x x x x 2 1 x 1 2 2 x 3 x
s (L.) I/E x 1 1 x thymallus (L.) R/R x x x x x x x 2 2 x 3 x x x x x x x x 5 x 3 7 2 x 6 x
inca (L.) L/L x 1 x x x x x 2 x 3 2 x 4 xba (L.) O/R x x 1 x 1 x x x 1 x 2 2 x 3 x
zingel (L.) O/R x x 1 x 1 x x x 1 1 1 2 1 x 2 xumber of guilds/species 8 29 16 19 16 11 13 11 12 13 16 21 23 31 31 18 15 12 16 21 14 10 13 14 13 15 11 9 13 14 23 25 28 35 23 28 30 37 39
ion
Electric fishingTotal trapElectric fishing
Total trapElectric fishing
Total trap
ame/guild/stretch IDce from river mouth (km)ring
P2-P3 P3-P4Pielach Melk
P1-P2
Total
P1-P4 M1-upstream M4Pielach & Melk
P1-P4 and M1-upstream M4M1-M2 upstream M4M2-M3 M3-M4
AbramAbramAbramAlburnoiAlburnus alAspiusBarbatulBarbus barbusBlicca bjoerknaCarassius carasCarassiChondrCobitiCottusCyprinus cEsox lucGobio albipiGobio gobioGymnoGymnoGymnoHucho huLampetra plLeucisLeuciscLeuciscLeucisLota loPerca fPhoxinus phoxiProterRhodeus serRutilusSabanajewSalmoSander luciScardiSilurus glaniThymallusTinca tVimba vimZingelTotal n
River sectRiver
Species nDistanMonito
DR
AFT
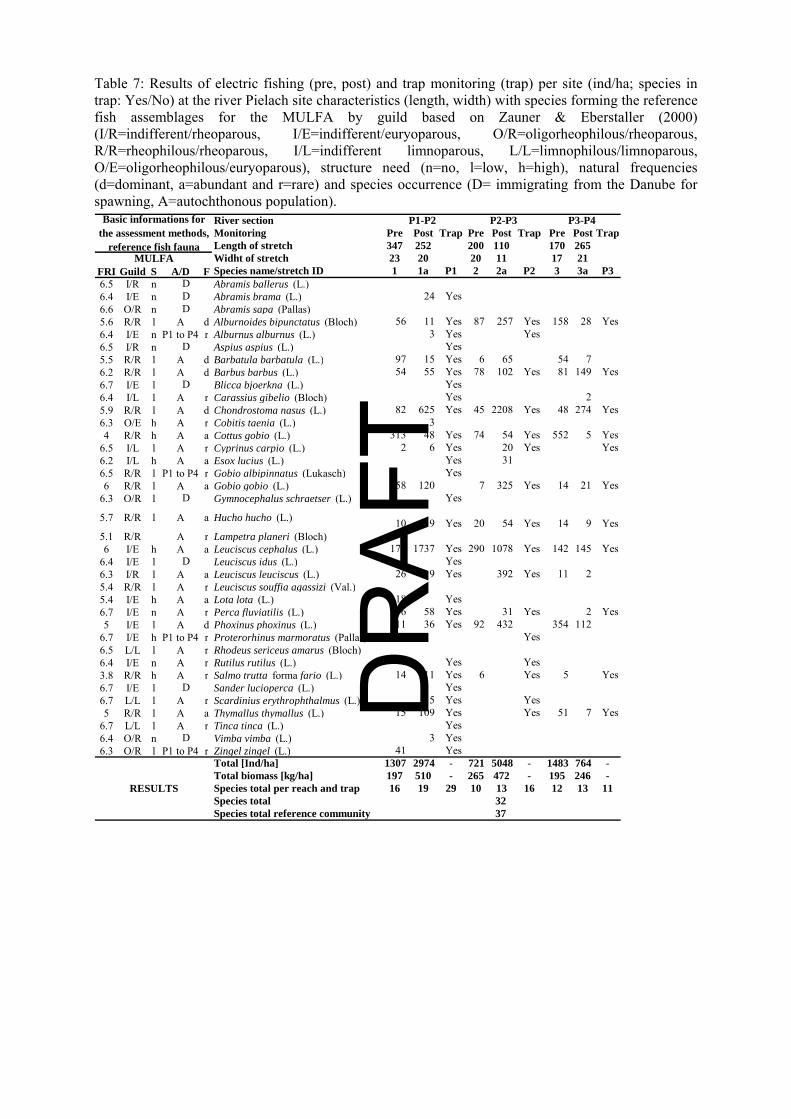
Table 7: Results of electric fishing (pre, post) and trap monitoring (trap) per site (ind/ha; species in trap: Yes/No) at the river Pielach site characteristics (length, width) with species forming the reference fish assemblages for the MULFA by guild based on Zauner & Eberstaller (2000) (I/R=indifferent/rheoparous, I/E=indifferent/euryoparous, O/R=oligorheophilous/rheoparous, R/R=rheophilous/rheoparous, I/L=indifferent limnoparous, L/L=limnophilous/limnoparous, O/E=oligorheophilous/euryoparous), structure need (n=no, l=low, h=high), natural frequencies (d=dominant, a=abundant and r=rare) and species occurrence (D= immigrating from the Danube for spawning, A=autochthonous population).
River sectionMonitoring Pre Post Trap Pre Post Trap Pre Post TrapLength of stretch 347 252 200 110 170 265Widht of stretch 23 20 20 11 17 21
FRI Guild S A/D F Species name/stretch ID 1 1a P1 2 2a P2 3 3a P36.5 I/R n Abramis ballerus (L.)6.4 I/E n Abramis brama (L.) 24 Yes6.6 O/R n Abramis sapa (Pallas)5.6 R/R l A d Alburnoides bipunctatus (Bloch) 56 11 Yes 87 257 Yes 158 28 Yes6.4 I/E n P1 to P4 r Alburnus alburnus (L.) 3 Yes Yes6.5 I/R n Aspius aspius (L.) Yes5.5 R/R l A d Barbatula barbatula (L.) 97 15 Yes 6 65 54 76.2 R/R l A d Barbus barbus (L.) 54 55 Yes 78 102 Yes 81 149 Yes6.7 I/E l Blicca bjoerkna (L.) Yes6.4 I/L l A r Carassius gibelio (Bloch) Yes 25.9 R/R l A d Chondrostoma nasus (L.) 82 625 Yes 45 2208 Yes 48 274 Yes6.3 O/E h A r Cobitis taenia (L.) 34 R/R h A a Cottus gobio (L.) 313 48 Yes 74 54 Yes 552 5 Yes
6.5 I/L l A r Cyprinus carpio (L.) 2 6 Yes 20 Yes Yes6.2 I/L h A a Esox lucius (L.) Yes 316.5 R/R l P1 to P4 r Gobio albipinnatus (Lukasch) Yes6 R/R l A a Gobio gobio (L.) 58 120 7 325 Yes 14 21 Yes
6.3 O/R l Gymnocephalus schraetser (L.) Yes
5.7 R/R l A a Hucho hucho (L.) 10 9 Yes 20 54 Yes 14 9 Yes5.1 R/R A r Lampetra planeri (Bloch)6 I/E h A a Leuciscus cephalus (L.) 179 1737 Yes 290 1078 Yes 142 145 Yes
6.4 I/E l Leuciscus idus (L.) Yes6.3 I/R l A a Leuciscus leuciscus (L.) 26 9 Yes 392 Yes 11 25.4 R/R l A r Leuciscus souffia agassizi (Val.)5.4 I/E h A a Lota lota (L.) 18 Yes6.7 I/E n A r Perca fluviatilis (L.) 6 58 Yes 31 Yes 2 Yes5 I/E l A d Phoxinus phoxinus (L.) 311 36 Yes 92 432 354 112
6.7 I/E h P1 to P4 r Proterorhinus marmoratus (Pallas) Yes6.5 L/L l A r Rhodeus sericeus amarus (Bloch)6.4 I/E n A r Rutilus rutilus (L.) Yes Yes3.8 R/R h A r Salmo trutta forma fario (L.) 14 11 Yes 6 Yes 5 Yes6.7 I/E l Sander lucioperca (L.) Yes6.7 L/L l A r Scardinius erythrophthalmus (L.) 15 Yes Yes5 R/R l A a Thymallus thymallus (L.) 15 109 Yes Yes 51 7 Yes
6.7 L/L l A r Tinca tinca (L.) Yes6.4 O/R n Vimba vimba (L.) 3 Yes6.3 O/R l P1 to P4 r Zingel zingel (L.) 41 Yes
Total [Ind/ha] 1307 2974 - 721 5048 - 1483 764 -Total biomass [kg/ha] 197 510 - 265 472 - 195 246 -Species total per reach and trap 16 19 29 10 13 16 12 13 11Species totalSpecies total reference community
D
D
D
D
Basic informations for the assessment methods,
reference fish fauna
D
MULFA
DDD
P3-P4P2-P3P1-P2
3237
RESULTS
D

DR
AFT
Table 8: Results of electric fishing (pre, post) and trap monitoring (trap) per site (ind/ha; species in trap: Yes/No) at the river Melk, site characteristics (length, width) with species forming the reference fish assemblages for the MULFA by guild based on Zauner & Eberstaller (2000) (for further explanations of abbreviations see legend of table 7, except for OL=oligorheophilous/limnoparous)
River sectionMonitoring Pre Post Trap Pre Post Trap Pre Pre Pre Post Post Post Trap Pre Post TrapLength of stretch 150 95 142 295 150 201 120 175 206 100 153 267Widht of stretch 15 21 8 13 8 13 17 10 9 8 11 13
FRI Guild S A/D F Species name/site 1 1a M1 2 2a M2 3 4 5 3a 4a 5a M3 6 6a M46.5 I/R n Abramis ballerus (L.) Yes6.4 I/E n Abramis brama (L.) Yes6.6 O/R n Abramis sapa (Pallas) Yes5.6 R/R l A d Alburnoides bipunctatus (Bloch) 86 244 147 4 421 21 389 13 256.4 I/E n A a Alburnus alburnus (L.) 2770 Yes 1785 Yes 7 111 30 Yes 1776.5 I/R n A r Aspius aspius (L.) 16 Yes 13 Yes 105 Yes 175.5 R/R l A d Barbatula barbatula (L.) 67 60 319 60 292 146 232 121 553 122 187 62 Yes6.2 R/R l A d Barbus barbus (L.) 80 8 Yes 27 176 Yes 24 210 181 131 474 293 Yes 578 323 Yes6.7 I/E l Blicca bjoerkna (L.) Yes6.5 L/L l A r Carassius carassius (L.)6.4 I/L l A r Carassius gibelio (Bloch) Yes 6 Yes 285.9 R/R l A a Chondrostoma nasus (L.) 113 3405 Yes 1173 1987 Yes 471 232 789 1361 516 30 Yes 53 8686.3 O/E h A a Cobitis taenia (L.) Yes 44 R/R h A r Cottus gobio (L.) 550 67 481 9 Yes 227 165 32 53 274 15 Yes 19 Yes
6.5 I/L l A r Cyprinus carpio (L.) 21 Yes 13 Yes 7 Yes6.2 I/L h A a Esox lucius (L.) 8 Yes 9 47 16 30 86.5 R/R l A r Gobio albipinnatus (Lukasch) Yes6 R/R l A a Gobio gobio (L.) 359 440 Yes 1683 492 892 514 742 737 2800 183 Yes 592 1066 Yes
6.7 O/L l Gymnocephalus baloni (Holcik & Hensel) Yes6.5 I/E l Gymnocephalus cernuus (L.) 16 Yes6.3 O/R l Gymnocephalus schraetser (L.) Yes5.7 R/R l A a Hucho hucho (L.) 64 24 13 15 5 34 Yes 405.1 R/R A a Lampetra planeri (Bloch)6 I/E h A a Leuciscus cephalus (L.) 112 22623 Yes 1815 909 Yes 227 648 611 486 5553 898 Yes 724 1656 Yes
6.4 I/E l A r Leuciscus idus (L.) Yes6.3 I/R l A a Leuciscus leuciscus (L.) 6 32 Yes 128 245 Yes 9 106 34 37 61 Yes 94 1045.4 R/R l A r Leuciscus souffia agassizi (Val.)5.4 I/E h A r Lota lota (L.) 22 66.7 I/E n A r Perca fluviatilis (L.) 11 222 Yes 101 Yes 5 35 I/E l A d Phoxinus phoxinus (L.) 112 12 1674 47 1006 336 291 156 574 61 919 84 Yes
6.7 I/E h A a Proterorhinus marmoratus (Pallas) 6 44 Yes6.5 L/L l A r Rhodeus sericeus amarus (Bloch) 157 76.4 I/E n A a Rutilus rutilus (L.) Yes 138 4 23 Yes6.3 O/E h A r Sabanajewia balcanica (Karaman) 34 93.8 R/R h A r Salmo trutta forma fario (L.) 66 119 Yes 226 6 Yes 32 47 57 6 32 Yes 27 11 Yes6.7 I/E l Sander lucioperca (L.) Yes6.7 L/L l A r Scardinius erythrophthalmus (L.) Yes 55 6 276.7 I/E h Silurus glanis (L.) Yes5 R/R l A r Thymallus thymallus (L.) 6 Yes 9 Yes 32 4 16 Yes
6.7 L/L l A r Tinca tinca (L.) Yes Yes 21 3 Yes6.4 O/R n Vimba vimba (L.) Yes 6 Yes6.3 O/R l A r Zingel zingel (L.) 5 Yes 5
Total [Ind/ha] 1693 30069 7965 6113 3237 2755 3139 3129 11432 1758 3309 4419Total biomass [kg/ha] 222 142 - 486 672 - 340 452 941 625 214 161 - 1187 760 -Species total per reach and trap 18 15 31 16 21 12 10 13 14 13 15 11 14 13 14 9Species totalSpecies total reference community
M2-M3 M3-M4
D
upstream M4
DDD
MULFA
M1-M2
RESULTS
Basic informations for the assessment methods,
reference fish fauna
4239
D
D
DDD
D

DR
AFT
Table 9: Differences between pre, post and post/trap data for the three indices (EFI, FIA and MULFA) in rivers Pielach and Melk analyzed using the Mann-Whitney-test (**strong significance, *weak significance); due to the low number of sampling sites (n=3) at the river Pielach significances are only given with one decimal place. Index Monitorig Pielach MelkEFI Pre-Post 0.1* 0.041**
Pre-Post/trap 0.1* 0.015**Post-Post/trap 1.0 0.937
FIA Pre-Post 0.7 0.818Pre-Post/trap 0.4 0.937Post-Post/trap 0.4 0.589
MULFA Pre-Post 0.4 0.394Pre-Post/trap 0.1* 1.000Post-Post/trap 0.7 0.310

DR
AFT
Table 10: Single metric values [median (minimum-maximum)] for the FIA, MULFA and EFI and significances (P) for the differences between pre, post and post/trap using the Mann-Whitney-test (**strong significances and *weak significances are additionally marked with grey colour; Pr-Pre, Po-Post, Po/tr-Post/trap); additionally the type of reaction of the metric is shown (+, as expected; -, contrary to expectation; 0, no significant reaction); biomass is only shown as a metric of the MULFA index, although it is also used as knock-out criterion within the FIA; metrics of the EFI provided by the software but not used for the index calculation are shown in brackets; post/trap information is only given for metrics, where trap catch data were contributing; due to the low number of sampling sites (n=3) for the river Pielach significances are only given with one decimal place. Index Metric Reaction Monitoring Melk Test P Pielach Test P
FRI + Pre 5.7 (5.1-5.8) Pr-po 0.002** 5.2 (4.9-5.6) Pr-po 0.1*Post 6.0 (5.9-6.1) 5.9 (5.8-5.9)
Number of subdominant species reproducing 0 Pre 3.5 (2-6) Pr-po 0.180 5 (3-6) Pr-po 1.0Post 5 (3-6) Po-po/tr 1.000 5 (4-6) Po-po/tr 0.7
Number of subdominant species + Pre 5.5 (5-7) Pr-po 0.394 6 (4-7) Pr-po 0.7Post 6.5 (5-7) Pr-po/tr 0.041** 6 (6-7) Pr-po/tr 0.4Post/Trap 7 (6-9) Po-po/tr 0.132 7 (6-8) Po-po/tr 0.4
Number of flow-guilds + Pre 4 (3-4) Pr-po 0.310 3 (3-4) Pr-po 1.0Post 4 (3-5) Pr-po/tr 0.026** 3 (3-5) Pr-po/tr 0.4Post/Trap 5 (4-5) Po-po/tr 0.310 5 (3-5) Po-po/tr 0.7
Number of reproductive guilds 0 Pre 5 (4-7) Pr-po 0.937 4 (3-5) Pr-po 0.4Post 5 (4-7) Pr-po/tr 0.699 5 (4-5) Pr-po/tr 0.4Post/Trap 5.5 (4-7) Po-po/tr 0.699 5 (4-6) Po-po/tr 0.7
Number of dominant species reproducing 0 Pre 3.5 (3-4) Pr-po 0.485 4 (4-5) Pr-po 1.0Post 3 (2-4) Po-po/tr 1.000 4 (4-5) Po-po/tr 1.0
Number of dominant species 0 Pre 4 (3-4) Pr-po 0.699 5 (5-5) Pr-po 1.0Post 4 (3-4) Pr-po/tr 0.699 5 (5-5) Pr-po/tr 1.0Post/Trap 4 (3-4) Po-po/tr 1.000 5 (5-5) Po-po/tr 1.0
Number of rare species + Pre 4.5 (3-8) Pr-po 1.000 1 (1-3) Pr-po 1.0Post 4.5 (1-7) Pr-po/tr 0.132 1 (1-7) Pr-po/tr 0.2Post/Trap 6.5 (3-20) Po-po/tr 0.093* 6 (2-16) Po-po/tr 0.4
Biomass 0 Pre 469 (222-1187) Pr-po 0.394 197 (195-265) Pr-po 0.2Post 419 (142-760) 472 (246-510)
Density 0 Pre 3188 (1693-7965) Pr-po 0.310 1307 (721.-1483) Pr-po 0.4Post 5266 (1758-30103) 2974 (764-5048)
FRI + Pre 5.6 (5.2-5.8) Pr-po 0.002** 5.2 (4.9-5.6) Pr-po 0.1*Post 6.0 (5.9-6.1) 5.9 (5.8-5.9)
Number of guilds 0 Pre 4.5 (2-6) Pr-po 0.818 3 (2-5) Pr-po 0.4Post 4.5 (4-6) Pr-po/tr 0.394 4 (4-7) Pr-po/tr 0.2Post/Trap 5 (4-8) Po-po/tr 0.310 5 (4-7) Po-po/tr 0.7
Number of self sustaining species 0 Pre 6.5 (6-10) Pr-po 0.394 9 (7-11) Pr-po 1.0Post 8.5 (5-9) Po-po/tr 1.000 9 (8-11) Po-po/tr 1.0
Number of type specific species + Pre 13.5 (10-18) Pr-po 0.699 12 (10-16) Pr-po 0.4Post 14.5 (11-20) Pr-po/tr 0.026** 13 (13-19) Pr-po/tr 0.2Post/Trap 17.5 (16-35) Po-po/tr 0.026** 19 (15-31) Po-po/tr 0.2
(Density all species) (0) Pre 1415 (696-4789) Pr-po 0.132 567 (198-635) Pr-po 0.2Post 2793 (1413-3447) Pr-po/tr 0.132 1748 (600-3298) Pr-po/tr 0.2Post/trap 2824 (1500-3452) Po-po/tr 0.589 1774 (606-3359) Po-po/tr 0.7
Density of insectivorous species 0 Pre 166 (17.-376) Pr-po 0.180 164 (36-253) Pr-po 0.7Post 47 (13-286) Pr-po/tr 0.310 85 (31-225) Pr-po/tr 0.7Post/trap 50 (16-286) Po-po/tr 0.699 87 (32-242) Po-po/tr 0.7
Density of omnivorous species - Pre 256 (50-1399) Pr-po 0.026** 74 (69-110) Pr-po 0.1*Post 1037 (526-2216) Pr-po/tr 0.026** 961 (119-1139) Pr-po/tr 0.1*Post/trap 1046 (537-2256) Po-po/tr 0.699 987 (120-1149) Po-po/tr 0.7
Density of phytophilic species - Pre 11 (0-47) Pr-po 0.937 0 (0-1) Pr-po 0.1*Post 17 (0-33) Pr-po/tr 0.180 16 (2-26) Pr-po/tr 0.1*Post/trap 32 (11-50) Po-po/tr 0.132 22 (4-35) Po-po/tr 0.7
(Number of all species) (+) Pre 13 (10-18) Pr-po 0.394 12 (9-18) Pr-po 0.4Post 14.5 (11-23) Pr-po/tr 0.004** 13 (13-20) Pr-po/tr 0.2Post/trap 19.5 (16-37) Po-po/tr 0.026** 20 (16-33) Po-po/tr 0.2
Number of benthic species + Pre 5 (4-8) Pr-po 0.180 5 (3-8) Pr-po 0.4Post 6.5 (5-10) Pr-po/tr 0.004** 6 (6-9) Pr-po/tr 0.4Post/trap 9 (6-20) Po-po/tr 0.065* 7 (7-16) Po-po/tr 0.4
Number of rheophilic species + Pre 11.5 (10-14) Pr-po 0.310 12 (9-15) Pr-po 1.0Post 10.5 (9-13) Pr-po/tr 0.132 11 (10-14) Pr-po/tr 0.4Post/trap 13 (12-21) Po-po/tr 0.026** 13 (13-19) Po-po/tr 0.4
Number of long distance migrants 0 Pre 0 (0-0) Pr-po 1.000 0 (0-0) Pr-po 1.0Post 0 (0-0) Pr-po/tr 1.000 0 (0-0) Pr-po/tr 1.0Post/trap 0 (0-0) Po-po/tr 1.000 0 (0-0) Po-po/tr 1.0
Number of potamodromous species + Pre 5 (4-6) Pr-po 0.394 5 (5-7) Pr-po 1.0Post 4.5 (3-7) Pr-po/tr 0.004** 5 (4-8) Pr-po/tr 0.4Post/trap 7 (6-9) Po-po/tr 0.009** 6 (6-11) Po-po/tr 0.4
Relative density of lithophilic species 0 Pre 81.3 (73.4-84.4) Pr-po 0.818 99.4 (95.1-100) Pr-po 0.2Post 81.1 (57.3-85.8) Pr-po/tr 0.589 92.7 (92.1-96.7) Pr-po/tr 0.2Post/trap 81.0 (57.3-84.2) Po-po/tr 0.699 92.1 (91.5-96.4) Po-po/tr 0.4
Relative number of intolerant species - Pre 32.1 (16.7-40) Pr-po 0.132 41.7 (38.9-44.4) Pr-po 0.1*Post 20.2 (14.2-33.3) Pr-po/tr 0.026** 25 (23.1-30.8) Pr-po/tr 0.1*Post/trap 22.5 (16.2-25) Po-po/tr 0.818 25 (21.2-31.3) Po-po/tr 1.0
Relative number of tolerant species - Pre 7.7 (0-11.1) Pr-po 0.004** 0 (0-11.1) Pr-po 0.1*Post 13.8 (9.1-23.1) Pr-po/tr 0.002** 15.4 (15.4-20) Pr-po/tr 0.1*Post/trap 21.9 (12.5-26.3) Po-po/tr 0.093* 20 (18.7-24.2) Po-po/tr 0.2
MU
LFA
EFI
FIA

DR
AFT
Figure captions Figure 1: Study area: location of migratory barriers, sampling sites and fish ladders. Figure 2: Minimum, maximum and median of the total indices for six stretches to illustrate the differences between pre- post and post/trap monitoring data for the EFI, FIA, and MULFA at the rivers Melk (n=6) and Pielach (n=3). Figure 3: Significant correlations between Ln(effect size) of the total indices of the EFI and the MULFA and distance from river mouth analysed using the Spearman rank correlation for the Melk (n=6) and river Pielach (n=3); distance in km. Figure 4: Significant correlations between Ln(effect size) of the single metric values of the FIA and the MULFA and distance from river mouth analysed using the Spearman rank correlation for the Melk (n=6) and river Pielach (n=3); distance in km.

DR
AFT
Fig. 1

DR
AFT
Fig. 2
Melk (n=6) Pielach (n=3)
Pre Post Post/Trap
0.0
0.2
0.4
0.6
0.8
1.0
EFI
Pre Post Post/Trap
0.0
0.2
0.4
0.6
0.8
1.0
EFI
Pre Post Post/Trap
1
2
3
4
5
FIA
Pre Post Post/Trap
FIA
1
2
3
4
5
Pre Post Post/Trap
MonitoringPre Post Post/Trap
Monitoring
1
2
3
4
5
MULFAMULFA
1
2
3
4
5

DR
AFT
Melk (n=6) Pielach (n=3)
0.00 2.00 4.00 6.00 8.00
Distance
-0.35
-0.30
-0.25
-0.20
-0.15
LN(e
ffect
siz
e)
MULFA
rS = 1.000**, n = 3, P < 0.01
Fig. 3
8.00 10.00 12.00 14.00
Distance
-0.25
-0.20
-0.15
-0.10
-0.05
0.00
0.05
LN(e
ffect
siz
e)
EFI
rS = 0.771*, n = 6, P = 0.072

DR
AFT
Melk (n=6) Pielach (n=3)
Fig. 4
8.00 10.00 12.00 14.00
0.00
0.03
0.06
0.09
0.12
0.15
0.18
LN(e
ffect
siz
e)FRI (FIA)
rS = -0.943**, n = 6, P = 0.005
0.00 2.00 4.00 6.00 8.00
0.00
0.20
0.40
0.60
0.80
1.00
LN(e
ffect
siz
e)
Biomass (MULFA)
rS = -1.000**, n = 3, P = 0.000
8.00 10.00 12.00 14.00
Distance0.00 2.00 4.00 6.00 8.00
Distance
0.00
0.10
0.20
0.30
0.40
0.50
0.60
0.70LN
(effe
ct s
ize)
No. of typ. spec. sp. (MULFA)
rS = -1.000**, n = 3, P = 0.000
0.00
0.10
0.20
0.30
0.40
0.50
0.60
0.70
LN(e
ffect
siz
e)
No. of typ. spec. sp. (MULFA)
rS = -1.000**, n = 6, P = 0.000