Effects of Invasive Non-Native Species on the Native Biodiversity in the River Rhine
Upload
khangminh22Category
view
3download
0
TRANSPORT MARKET STUDY (RFC 9 RHD)

2/158
Project name Transport Market Study for the Railway Freight Corridor Rhine-Danube (RFC RHD)
Recipient ÖBB Infrastruktur AG
Document type Transport Market Study Report
Version Final version
Date 31/01/2020; updated on 5/02/2020, finalised on 28/02/2020; final adaptions on 31/03/2020 and 07/04/2020.
Prepared by Impuls Consulting Group GmbH in cooperation with Ramboll Deutschland GmbH
Checked by HIBR, GPH
Description Deliverable Final Version Report Transport Market Study RFC 9 RHD; pre-final presentation (ppt) delivered on 19/1/2020 and presented at MCWG on 22/1/2020; final presentation (ppt) delivered on 5/02/2020.

3/158
CONTENT
EXECUTIVE SUMMARY 14 Background 14 Scope of Analysis 14 Current situation 15 Projections 23 Results 25 Conclusions and recommendations 25
1. Introduction 28 1.1 Objectives and methodology 28 1.2 TMS-Goals 29 1.3 General information 29 2. Corridor definition and catchment area 30 2.1 Definition of the corridor 30 2.2 Member states and corridor area 32 2.3 Detailed routing and border crossing points 32 2.3.1 Detailed railway routing RFC 9 RHD 32 2.3.2 Detailed road route overview 41 2.3.3 IWW and short sea shipping 42 2.3.4 Interconnections with other corridors 43 2.3.5 Corridor border crossing points 46 2.4 EU border crossing procedures and trusted hand-over 47 2.4.1 Overall status 47 2.4.2 Border crossing measures 48 2.4.3 Trusted handover – ATTI 50 2.4. Proposed Terminals and Ports 50 3. General socio-economic development on the corridor 57 3.1 Introduction 57 3.2 Country overviews 58 3.2.1 France 58 3.2.2 Germany 60 3.2.3 Austria 63 3.2.4 Czech Republic 66 3.2.5 Slovakia 69 3.2.6 Hungary 72 3.2.7 Romania 75 3.3 Economic development 78 3.3.1 Macroeconomic development inside the corridor region 78 3.3.2 Economic development outside the corridor region 80 3.3.3 Summary and conclusions 81 3.4 Social and demographic development 82 3.4.1 Demographic development 82 3.4.2 Social development 83 3.4.3 Summary and conclusions 84

4/158
3.5 Transport market development 84 3.5.1 Freight transport by mode and modal split 84 3.5.2 Share of international freight transport and infrastructure
investments 86 3.5.3 Types of goods transported via rail 88 3.5.4 RFC 9 RHD infrastructure compliance 89 3.5.5 Summary and Conclusions 91 3.6 Political developments 92 3.6.1 Overview 92 3.6.2 Geopolitical factors 96 3.7 Technical factors 96 3.7.1 Rail sector 97 3.7.2 Road sector 98 3.7.3 Logistics and supply-chain developments 98 3.7.4 Summary and conclusions 99 4. Analysis of the RFC 9 RHD current transport market 100 4.1 Methodology 100 4.1.1 Data collection 100 4.1.2 Official transport statistic and existing studies 100 4.1.3 Data provision by Infrastructure Managers 101 4.2 Transport volumes per O/D trade lane and mode 102 4.2.1 Methodology and Data Assessment 102 4.2.2 Received Data 102 4.2.3 Harmonization of Data 102 4.2.4 Qualitative Assessment of Data 103 4.3 Corridor Assessment 103 4.3.1 Origin-Destination-Matrix 103 4.3.2 Economic Areas 105 4.4 Railway freight and passenger analysis between Slovakia and
Ukraine 107 4.4.1 General overview of existing studies and international programs 107 4.4.2 Analysis of passenger traffic by rail 107 4.4.3 Analysis of freight traffic by rail 108 4.5 Review of Constanta Port international connection 111 4.5.1 Constanta Port development projects 2019 113 4.6 Review of IWW ports along the river Rhine 114 4.6.1 Karlsruhe Inland Port 115 4.6.2 Mannheim Inland Port 115 4.6.3 Ludwigshafen Inland Port 115 4.7 Description of factors influencing the choice of transport mode 116 4.7.1 Description of quality parameters per transport mode 122 4.7.2 Analysis of quality service offered 125 4.7.3 Summary of advantages and disadvantage of available transport
modes 126 4.8 Train path allocation 127 4.8.1 Current situation 127 4.8.2 Timetable Redesign Project (TTR) 127 4.9 Main bottlenecks and missing links 128 4.9.1 General operational and administrative bottlenecks 128 4.9.2 Infrastructure bottlenecks 128
5/158
5. Evaluation of the future transport market development on the corridor 129
5.1 Methodology 129 5.2 Transport volumes per O/D trade lane and train type per 2017 130 5.3 Transport volumes per O/D trade lane and train type per 2022 131 5.4 Amount of trains Country to Country 133 5.5 Conclusions on the forecast 134 6. RESULTS OF SURVEY 136 6.1 Proportion ad-hoc traffic compared to timetable traffic 136 6.2 Criteria for choice of transport mode 136 6.3 Future development of freight traffic volumes until 2022 138 6.4 Additional comments of respondents 138 7. SWOT-Analysis 139 7.1 Institutional 140 7.2 Economical 141 7.3 Organisational 142 7.4 Infrastructural, technical and logistical 143 8. CONCLUSIONS 144 8.1 Institutional 144 8.2 Economical 144 8.3 Organisational 144 8.4 Infrastructural, technical and logistical 145 8.5 Summary of main Conclusions 145
Annex 1: LIST OF References (PEST ANALYSIS) 146 Annex 2: NUTS 2 AND 3 REGIONS ALONG THE CORRIDOR 148 Annex 3: MODAL SPLIT FIGUREs 152 Annex 4: DATA RECEIVED 153 Annex 5: QUESTIONNAIRE 154

6/158
LIST OF TABLES
Table 1: O-D-Matrix for corridor trains on the RFC 9 RHD in 2017 20 Table 2: O-D-Matrix for passenger trains on the RFC 9 RHD in
2017 20 Table 3: Comparison tons regarding BT, CT, and SW – 2017 and
2022 24 Table 4: Comparison trains regarding BT, CT, and SW – 2017 and
2022 24 Table 5: Recommended corridor routing per section within RFC 9
RHD 41 Table 6: List of border crossings for RFC 9 RHD 46 Table 7: List of multimodal terminals, yards and depots along the RFC
9 RHD area 56 Table 8: Sector statistics in terms of contribution to GDP (CIA World
Factbook) 79 Table 9: Average external costs 2016 by country and transport mode
(excluding congestion) in Euro-Cent/TKM (Van Essen et al., 2019) 93
Table 10: Origin-Destination-Matrix of transported tons via mode rail (EUROSTAT 2015) 101
Table 11: O-D-Matrix for corridor trains on the RFC 9 RHD in 2017 104 Table 12: O-D-Matrix for passenger trains on the RFC 9 RHD in
2017 105 Table 13: Analysis of transport modes per given criteria 120 Table 14: Analysis of transport modes per given criteria - II 123 Table 15: Advantages & Disadvantages per transport mode 126 Table 16: Trains regarding BT, CT, and SW in 2017 130 Table 17: Tons regarding BT, CT, and SW in 2017 131 Table 18: Freight volume in tons regarding BT, CT, and SW – forecast
for 2022 132 Table 19: Derived trains regarding BT, CT, and SW – forecast for
2022 133 Table 20: Comparison tons regarding BT, CT, and SW – 2017 and
2022 134 Table 21: Comparison trains regarding BT, CT, and SW – 2017 and
2022 134 Table 22: Survey: Ranking of criteria for the choice of transport mode
in general 136 Table 23: Survey: Ranking of market-related criteria 136 Table 24: Survey: Ranking of technical criteria 137 Table 25: Survey: Ranking of infrastructural criteria 137 Table 26: Survey: Ranking of important measure 137 Table 27: Survey: growth expectations for Europe in general 138 Table 28: Survey: growth expectations for Corridor 9 138

7/158
LIST OF FIGURES
Figure 1: Recommended Routing RFC 9 RHD including principal, diversionary and connecting lines 19
Figure 2: Main routing RFC 9 RHD and economical areas 22 Figure 3: Forecasting process used 23 Figure 4: O-D-Graph for corridor trains on RFC 9 RHD in 2022 incl.
growth rates from 2017 24 Figure 5: Methodology for the TMS* 28 Figure 6: NUTS classification (source: Eurostat) 30 Figure 7: RFC 9 RHD identification per NUTS 2 31 Figure 8: RFC 9 RHD identification per NUTS 3 31 Figure 9: Recommended Routing RFC 9 RHD including principal,
diversionary and connecting lines 33 Figure 10: Recommended Routing of corridor matched to corridor trains
(2017) 34 Figure 11: Recommended Routing RFC 9 RHD in Germany 35 Figure 12: Recommended Routing RFC 9 RHD in Austria 35 Figure 13: Recommended Routing RFC 9 RHD in Czech Republic 36 Figure 14: Recommended Routing RFC 9 RHD in Slovakia 36 Figure 15: Recommended Routing RFC 9 RHD in Hungary 37 Figure 16: Recommended Routing RFC 9 RHD in Romania 37 Figure 17: Corridor Road Network Map (source: TENtec interactive
map, DG MOVE 2018) 42 Figure 18: Rhine- Danube corridor, IWW connection and relevant ports
along the corridor (TENtec interactive map, 2018) 42 Figure 19: Overview of short sea shipping types in Constanta and Galati
ports (Source: Consultant map and analysis of maritime links of Romania ports – R-D 2017) 43
Figure 20: Overview of the RFC 9 RHD corridor and its interaction with other TEN-T railway routes 45
Figure 21: Spatial inventory of all identified cross-border rail connections (prepared by EU, 2018) 48
Figure 22: General overview of available ports along the railway network corridor 51
Figure 23: France: GDP/capita (in ‘000 EUR, Source: Eurostat) 58 Figure 24: France: import statistics 2017 (in % of overall imports,
Source: Eurostat) 58 Figure 25: France: export statistics 2017 (in % of overall exports,
Source: Eurostat) 58 Figure 26: France: imports and exports 2013-2017 (in MIO EUR,
Source: Eurostat) 59 Figure 27: France: freight transport development (in MIO TKM, Source
OECD) 59 Figure 28: France: container transports for rail and sea (in Thousand
Tons, Source: OECD) 59 Figure 29: France: infrastructure investments (in Billion EUR, Source:
OECD) 59 Figure 30: France: Types of goods transported by rail in 2012 and 2017
(in TKM, Source: Eurostat) 60 Figure 31: France: Types of goods transported by road and rail in 2017
(in TKM, Source: Eurostat) 60

8/158
Figure 32: Germany: GDP/capita (in ‘000 EUR, Source: Eurostat) 61 Figure 33: Germany: import statistics 2017 (in % of overall imports,
Source: Eurostat) 61 Figure 34: Germany: export statistics 2017 (in % of overall exports,
Source: Eurostat) 61 Figure 35: Germany: imports and exports 2013-2017 (in MIO EUR,
Source: Eurostat) 62 Figure 36: Germany: freight transport development (in MIO TKM,
Source: OECD) 62 Figure 37: Germany: container transports for rail and sea (in Thousand
Tons, Source: OECD) 62 Figure 38: Germany: infrastructure investments (in Billion EUR, Source:
OECD) 62 Figure 39: Germany: Types of goods transported by rail in 2012 and
2017 (in TKM, Source: Eurostat) 63 Figure 40: Germany: Types of goods transported by road and rail in
2017 (in TKM, Source: Eurostat) 63 Figure 41: Austria: GDP/capita (in ‘000 EUR, Source: Eurostat) 64 Figure 42: Austria: import statistics 2017 (in % of overall imports,
Source: Eurostat) 64 Figure 43: Austria: export statistics 2017 (in % of overall exports,
Source: Eurostat) 64 Figure 44: Austria: imports and exports 2013-2017 (in MIO EUR,
Source: Eurostat) 65 Figure 45: Austria: freight transport development (in MIO TKM, Source
OECD) 65 Figure 46: Austria: container transports for rail and sea (in Thousand
Tons, Source: OECD) 65 Figure 47: Austria: infrastructure investments (in Billion EUR, Source:
OECD) 65 Figure 48: Austria: Types of goods transported by rail in 2012 and
2017 (in TKM, Source: Eurostat) 66 Figure 49: Austria: Types of goods transported by road and rail in 2017
(in TKM, Source: Eurostat) 66 Figure 50: Czech Republic: GDP/capita (in ‘000 EUR, Source:
Eurostat) 67 Figure 51: Czech Republic: import statistics 2017 (in % of overall
imports, Source: Eurostat) 67 Figure 52: Czech Republic: export statistics 2017 (in % of overall
exports, Source: Eurostat) 67 Figure 53: Czech Republic: imports and exports 2013-2017 (in MIO
EUR, Source: Eurostat) 68 Figure 54: Czech Republic: freight transport development (in MIO TKM,
Source OECD) 68 Figure 55: Czech Republic: container transports for rail and sea (in
Thousand Tons, Source: OECD) 68 Figure 56: Czech Republic: infrastructure investments (in Billion EUR,
Source: OECD) 68 Figure 57: Czech Republic: Types of goods transported by rail in 2012
and 2017 (in TKM, Source: Eurostat) 69 Figure 58: Czech Republic: Types of goods transported by road and rail
in 2017 (in TKM, Source: Eurostat) 69

9/158
Figure 59: Slovakia: GDP/capita (in ‘000 EUR, Source: Eurostat) 70 Figure 60: Slovakia: import statistics 2017 (in % of overall imports,
Source: Eurostat) 70 Figure 61: Slovakia: export statistics 2017 (in % of overall exports,
Source: Eurostat) 70 Figure 62: Slovakia: imports and exports 2013-2017 (in MIO EUR,
Source: Eurostat) 71 Figure 63: Slovakia: freight transport development (in MIO TKM,
Source OECD) 71 Figure 64: Slovakia: container transports for rail and sea (in Thousand
Tons, Source: OECD) 71 Figure 65: Slovakia: infrastructure investments (in Billion EUR, Source:
OECD) 71 Figure 66: Slovakia: Types of goods transported by rail in 2012 and
2017 (in TKM, Source: Eurostat) 72 Figure 67: Slovakia: Types of goods transported by road and rail in
2017 (in TKM, Source: Eurostat) 72 Figure 68: Hungary: GDP/capita (in ‘000 EUR, Source: Eurostat) 73 Figure 69: Hungary: import statistics 2017 (in % of overall imports,
Source: Eurostat) 73 Figure 70: Hungary: export statistics 2017 (in % of overall exports,
Source: Eurostat) 73 Figure 71: Hungary: imports and exports 2013-2017 (in MIO EUR,
Source: Eurostat) 74 Figure 72: Hungary: freight transport development (in MIO TKM,
Source OECD) 74 Figure 73: Hungary: container transports for rail and sea (in Thousand
Tons, Source: OECD) 74 Figure 74: Hungary: infrastructure investments (in Billion EUR, Source:
OECD) 74 Figure 75: Hungary: Types of goods transported by rail in 2012 and
2017 (in TKM, Source: Eurostat) 75 Figure 76: Hungary: Types of goods transported by road and rail in
2017 (in TKM, Source: Eurostat) 75 Figure 77 Romania: GDP/capita (in ‘000 EUR, Source: Eurostat) 76 Figure 78: Romania: import statistics 2017 (in % of overall imports,
Source: Eurostat) 76 Figure 79: Romania: export statistics 2017 (in % of overall exports,
Source: Eurostat) 76 Figure 80: Romania: imports and exports 2013-2017 (in MIO EUR,
Source: Eurostat) 77 Figure 81: Romania: freight transport development (in MIO TKM,
Source OECD) 77 Figure 82: Romania: container transports for rail and sea (in Thousand
Tons, Source: OECD) 77 Figure 83: Romania: infrastructure investments (in Billion EUR, Source:
OECD) 77 Figure 84: Romania: Types of goods transported by rail in 2012 and
2017 (in TKM, Source: Eurostat) 78 Figure 85: Romania: Types of goods transported by road and rail in
2017 (in TKM, Source: Eurostat) 78

10/158
Figure 86: GDP per capita in purchasing power parity standards (2017, in EUR, Source: Eurostat) 79
Figure 87: GDP/capita change 2010-2017 (in %, Source: Eurostat) 79 Figure 88: Past and predicted change in real GPD/capita (in %, Source:
IMF) 79 Figure 89: Past and predicted real GDP/capita (in $, Source IMF) 79 Figure 90: Investment in the industrial production sector (in MIO EUR,
Source: Eurostat) 80 Figure 91: Change in investments in the industrial production sector
2010- 2017 (in %, Source: Eurostat) 80 Figure 92: Past and predicted annual changes in imports of goods (in
%, Source: IMF) 80 Figure 93: Past and predicted annual changes in exports of goods (in
%, Source: IMF) 80 Figure 94: Annual value of exports to Asia (in MIO EUR, Source:
Eurostat) 81 Figure 95: Relative share of exports to Asia (in %, Source: Eurostat) 81 Figure 96: Annual value of imports from Asia (in MIO Euro, Source:
Eurostat) 81 Figure 97: Relative share of imports from Asia (in %, Source:
Eurostat) 81 Figure 98: Population density (persons/square km, Source: Eurostat) 82 Figure 99: Change in population 2010-2017 (in %, Source: Eurostat) 82 Figure 100: Past and predicted population development (in MIO
inhabitants, Source: IMF) 83 Figure 101: Past and predicted annual population change rates (in %,
Source: IMF) 83 Figure 102: Household disposable income/capita in 2017 (in EUR,
Source: Eurostat) 83 Figure 103: Household disposable change between 2010 and 2017 (in
%, Source: Eurostat) 83 Figure 104: Share of population living with risk of poverty (in %, Source:
Eurostat) 84 Figure 105: Past and predicted unemployment rates (in %, Source:
IMF) 84 Figure 106: Freight transported via rail (in MIO TKM, Source: OECD) 85 Figure 107: Freight transported via road (in MIO TKM, Source: OECD) 85 Figure 108: Modal split freight rail (in %, Source: Eurostat) 86 Figure 109: Modal split passenger train (in %, Source: Eurostat) 86 Figure 110: Modal split freight road (in %, Source: Eurostat) 86 Figure 111: Modal split passenger car (in %, Source: Eurostat) 86 Figure 112: Modal split freight inland waterways (in %, Source:
Eurostat) 86 Figure 113: Modal split passenger bus (in %, Source: Eurostat) 86 Figure 114: Share of international transport in total rail freight transport
(in %, Source: Eurostat) 88 Figure 115: Per-capita investments rail (in EUR/capita, Source: OECD) 88 Figure 116: Share of international transport in total road freight
transport (in %, Source: Eurostat) 88 Figure 117: Per-capita investments road (in EUR/capita, Source:
OECD) 88

11/158
Figure 118: Share of international transport in total inland waterway freight transport (in %, Source: Eurostat) 88
Figure 119: Per-capita investments inland waterways (in EUR/capita, Source: OECD) 88
Figure 120: Types of goods transported by rail in all corridor countries in 2012 and 2017 (in MIO TKM, Source: Eurostat) 89
Figure 121: Types of goods transported by road and rail in all corridor countries in 2017 (in MIO TKM, Source: Eurostat) 89
Figure 122: Rail link compliance (from CNC Workplan, 2018) 90 Figure 123: Terminal compliance (from CNC Workplan (2018)) 91 Figure 124: Average external costs 2016 for EU28: freight transport
(excluding congestion) (Van Essen et al., 2019) 93 Figure 125: Pollution indicators across Europe for 2015 as share of
population above WHO thresholds (includes PM 10, PM 2.5, N2O, O3; Source: Environment Agency Austria) 94
Figure 126: Air quality perceptions (Eurobarometer, 2017) 94 Figure 127: OECD Environmental Policy Stringency Index (EPS) 95 Figure 128: Origin to Destination of transported tons via mode rail
(EUROSTAT 2015 101 Figure 129: Data harmonisation process – Step 1 103 Figure 130: Data harmonisation process – Step 2 103 Figure 131: General overview of cargo traffic to the east 109 Figure 132: Overview of UA rail infrastructure and freight station on the
border crossing points 109 Figure 133: Selected railway projects from Ukrainian National Transport
Strategy 110 Figure 134: Traffic flow by types of products, 2017 111 Figure 135: Comparable analysis of the Black Sea counties container
traffic and relevant grow against 2015 112 Figure 136: Overview of international directions and connections to other
ports in Black sea and Asian countries 113 Figure 137: Constanta investment projects, 2021-2027 114 Figure 138: Costs variation per mode and distance 117 Figure 139: Modal split options overview and possible complementary
options 118 Figure 140: Overview of mode competitiveness and mode
complementary factors 119 Figure 141: Specification of transport mode in relation with good size
and distance 121 Figure 142: Decision making process from a customer perspective 124 Figure 143: Forecasting process used 129 Figure 144: O-D-Graph for corridor trains on RFC 9 RHD in 2022 incl.
growth rates from 2017 134
12/158
ABBREVIATIONS AB Allocation Body
ATTI Agreement on freight Train Transfer Inspections
BSEG Black Sea Economic Co-operation Group
BT Block Train
CFR Căile Ferate Române - Romanian State Railways
CIS Commonwealth of Independent States
CNC Core Network Corridor
COTIF Convention concerning International Carriage by Rail
CSS Customer Satisfaction Survey
CT Combined Transport Train
DB Deutsche Bahn
ERFA European Rail Freight Association
ERTMS European Rail Traffic Management System
EU European Union
FTE Forum Train Europe
GDP Gross Domestic Product
GYSEV Győr-Sopron-Ebenfurti Vasút Zártkörűen Működő Részvénytársaság – Raab-Oedenburg-Ebenfurter Eisenbahn Aktiengesellschaft
IFI International Financing Institutions
IM Infrastructure Manager
IWW Inland Waterway
MÁV MÁV Hungarian State Railways Private Company Limited by Shares
NUTS Nomenclature des unités territoriales statistiques
O/D Origin/Destination
ÖBB Österreichische Bundesbahnen
PaP Pre-arranged Paths
RCG Rail Cargo Group
RFC Rail Freight Corridor
RIS River Information Services
RNE Rail Net Europe

13/158
RU Railway Undertaking
SNCF Société nationale des chemins de fer français - French National Railway
SW Single Wagon train
Správa železnic Czech Infrastructure Manager
TEN-T Trans-European Transport Network
TMS Transport Market Study
TRACECA
TSI
Transport Corridor Europe-Caucasus-Asia
Technical Specifications for Interoperability
TTR Timetable Redesign Project
UIC Union Internationale des Chemins de fer
UZ Ukrzaliznytsia – Ukrainan Railways
VPE VPE Rail Capacity Allocation Ltd.
ZSR Železnice Slovenskej republiky – Slovak Railways
ZSSK Železničná spoločnosť Slovensko

14/158
EXECUTIVE SUMMARY
Background
In 2010, the EU mapped out 9 freight corridors with the objective to make rail freight transport more competitive, with the Rail Freight Corridor 9 Czech – Slovak (RFC 9 CS) among them. This corridor has now been extended to form the Rail Freight Corridor 9 Rhine-Danube (RFC 9 RHD) (Regulation (EU) No 913/2010; changes in Regulation (EU) No 1316/2013). As an essential part of the implementation plan for the freight corridor a Transport Market Study (TMS) has to be carried out according to Article 9.3 of the Regulation - “Measures for implementing the freight rail corridor plan”.
The main objective of the TMS is to recommend a routing alignment for the Rail Freight Corridor 9 according to expected future traffic. Therefore, the TMS provides a detailed overview of the corridor’s current operational status and a fact-driven outlook regarding the freight market development and potential future customer demand along the corridor.
RFC 9 RHD has a highly important strategic role, being one of the main East-West links across Continental Europe.
Scope of Analysis
The study focuses on the following major areas:
• Analysis of the geographical characteristics of the catchment area and Member States in terms of relevance to transport;
• A detailed PEST-Analysis for the relevant Member States • Analysis and evaluation of the current transport market situation covering all traffic modes; • Multimodal traffic flow evaluation; • Brief analysis of possible modal shift; • Analysis of commodities; • SWOT-Analysis of the rail freight traffic in the corridor; • Forecast of the transport market development and traffic growth; • Deduction of requirements to railway infrastructure and operational or organizational
improvements in railway freight traffic to improve the railway sector’s competitiveness and to adequately meet market demand;
• Identification of logistic service opportunities;
Investigations and analyses have been carried out for major corridor sections, transport nodes, IWW networks, ports and multimodal terminals identifying gaps and proposing solutions to improve RFC 9 RHD.

15/158
Current situation
Economic development Overall, the economic indicators suggest a fairly positive outlook regarding freight transport overall (all modes) with economic development expected to remain positive in the entire corridor region. Particularly relevant for rail freight transport is the development of the industrial production sector, as it generates goods that typically have a relatively high propensity of being transported via rail. With few exceptions, investments in industries have grown along the corridor over the past years. Given the positive macro-economic forecast, we can also expect further industrial growth. Investments in the industrial sector have grown particularly strongly in Germany, which at the same time also has the highest GDP/capita and therefore a dominant position in terms of trade (both imports and exports) with Asia among the countries located along the corridor. Even if only a minor share of this trade can be directed via RFC 9 RHD, it will be substantial.
Social and demographic development
Substantial demographic shifts have been happening along the corridor region over the past decade. While the population has grown strongly in Austria and Germany, substantial population decline could be observed especially in Hungary and Romania. These shifts have been driven by differentials in income levels and employment. Especially young, high-skilled workers have left the regions located in the Eastern part of the corridor. The population decline is expected to continue, however, to a lesser extent than it has been happening over past years. The same is true for population growth: especially Austria’s population is expected to continue growing.
The population decline in the Eastern parts of the corridor region may lead to a lower local demand for goods in these regions. Local productivity is also likely to be negatively affected. However, due to the composition of the migrating population high-skilled professions are probably affected more; these in turn tend to produce goods with low rail-affinity (or services that do not require transport at all). Sectors that typically require low-skilled labour (e.g. mining) as input, and at the same time, produce goods with high rail-affinity, are likely to be less affected by the population decline. This seems to be in particular true for the car manufacturing sector: major car manufacturers, including German brands, have moved their production to lower-wage countries in Eastern Europe, in particular to Hungary and Slovakia (e.g. Audi in Győr, Volkswagen Slovakia in Bratislava).
The fact that within the corridor region migration is directed towards more productive areas with a substantial share of industry (e.g. Southern Germany), in turn is likely to increase imports and exports in those areas (e.g. trade between Germany and China), overall benefitting potential trade flow prospects on RFC 9 RHD.
Political development
With improved infrastructure that is in line with the standards, travel times are expected to decrease, and reliability and punctuality are expected to improve. Also, possibilities for multimodal transport are expected to improve, leading to shorter door-to-door travel times. This will lead to decreases in the inconvenience that rail has compared to road in terms of travel times and reliability.
However, besides the infrastructural factors, improvements are also necessary regarding operational procedures, for instance aiming at yielding reductions in waiting times at borders (which are often highly uncertain in duration) and offering more integrated and flexible logistics solutions (providing flexible door-to-door solutions).
Another important political aspect is to achieve a level playing field regarding the internalisation of external cost. The European Commission’s “Green Deal” is very likely to launch relevant political measures to achieve this goal.
Geopolitically, trade relations with most Asian economies are stable, and for the main Asian trading partner, China, mostly governed by the WTO framework. New tariffs or other forms of trade barriers
16/158
are rather unlikely to be established soon. On the contrary, negotiations for an investment Agreement between the European Union and China have been ongoing since 2013, as part of the EU-China 2020 Strategic Agenda for Cooperation. Nevertheless, there are specific policies that may affect trade between Europe and Asia, such as China regulating the sale of fossil-fuel vehicles by imposing quota for electric vehicles. Another one is the current subsidies provided by the Chinese government for Eurasian rail services (approximately 2000-5000 USD/TEU), which at some point might be phased out, leading to a yet higher price differential between rail and sea freight rates (ITF, 2019).
Technical development
Overall, in line with past developments, we expect freight transport demand to increase further due to more globalized supply chains and realignment towards emerging markets. This is in spite of some developments that may flatten freight transport volumes to some extent such as digitization and 3D-printing. The extent to which the freight volume increase can be captured by the rail sector depends, among other factors, on technological developments.
Currently, rail freight transport suffers from limited competitiveness compared to road transport: long travel times, unreliability, inflexibility. These are to a substantial extent caused by technological and infrastructure-related factors such as bottlenecks, border waiting times, limited technical and organizational compatibility & coordination, too national perspective of IMs Ministries/Authorities, no awareness of the international character of rail freight. If in the process of unification of the transport market substantial improvements and compliance with EU standards can be seen, a substantial increase in demand can be expected.
While the rail sector exhibits comparatively limited technological developments, the road sector may face several disruptive technologies in future years, among which are large-capacity vehicles (through mega-trucks and/or platooning), (at least partially) self-driving trucks and electrification. Especially the larger size vehicles and self-driving capabilities are expected to improve cost efficiency of road transport even further. Even if stricter environmental regulations, for instance in the form of marginal cost pricing, are implemented, the cost advantage of road transport would therefore likely prevail, rendering the outlook for rail traffic rather challenging from a cost perspective. However, it is currently uncertain when these technologies will be introduced on the market and to which extent, they are accommodated by adaptations in the legal framework as well as in the infrastructure.
Conclusion
The positive economic developments and more globalized supply chains result in a traffic increase in all modes. BUT: The modal share of road transport is still increasing both in the passenger as well as the freight sector in the Corridor area; however, there are differences in the modal split developments, with rail modal share increasing in some and decreasing in other countries. It is lowest in France (just above 10% in 2017), followed by Germany (17.8% in 2017), while it is highest in Slovakia (32.9% in 2017). Between 2010 and 2017, we observe a decline in rail modal share in Austria, Czech Republic, Slovakia. In the remaining countries, the rail modal share is fairly stable.
This is partly caused by different priorities in national governments infrastructure investments, as the Corridor countries typically perform highest per-capita infrastructure investment in road transport (except for Austria); Germany and Romania also show significant investments in inland waterways.
Partly, the higher attractiveness of road transport is the result of • hurdles of competitiveness of rail transport (long travel times, lack of reliability, inflexibility),
partially caused by operational and administrative bottlenecks, border waiting times, limited technical and organizational compatibility & coordination and missing reliable multi-channel planning of works, partly due to lack of financing.

17/158
• comparatively limited technological developments, whereas road transport may undergo some disruptive developments within the next 1-2 decades (e.g. self-driving trucks leading to substantially lower operating costs; electric trucks leading to competitive road transport even under-pricing of (environmental) externalities; platooning, mega-trucks improving cost efficiency.
With improved infrastructure that is in line with the standards, travel times are expected to decrease, and reliability and punctuality are expected to improve. Also, possibilities for multimodal transport are expected to improve, leading to shorter door-to-door travel times. This will lead to decreases in the inconvenience that the rail has compared to road in terms of travel times and reliability.
In addition, the so-called “soft-measures” (i.e. requiring almost no investment) need to be executed to bolster the competitiveness of the corridor regarding speeding up the border-handling processes, the harmonization of rules and TSI among others.
Potentials to increase the modal share of rail transport also lie in digital cargo management/tracking and the increasing importance of environmental aspects, resulting in a higher relevance of the internalization of external cost in the political discussion (e.g. Handbook on external costs of transport). In addition, a highly flexible capacity allocation for ad-hoc transport needs is essential for the attractiveness of rail freight. Rail Net Europe has therefore introduced the TTR (Timetable Redesign) Project.
Regarding the external costs of freight transport rail freight transport is currently not competitive with road transport along various dimensions, which is one of the reasons for the low modal split of freight rail in most EU countries. Even with improvements in infrastructure, rail freight transport will still be subject to longer travel times and less flexibility than road transport along most routes, although the relative disadvantages are expected to become substantially smaller, as in many countries substantial investments in rail infrastructure are planned (e.g. in Germany and Austria).
External cost, such as local air pollution, greenhouse gases, noise, congestion, accidents, well-to-tank emission, habitat damage, are not reflected in the costs of transport yet. The external costs associated with heavy goods vehicles are higher in all countries than for rail, often by a factor exceeding 3. The difference would have been even more pronounced if congestion costs (which is mostly absent on the rail due to fixed timetables that already consider capacity constraints) had been included. The societal awareness about this issue is increasing in all countries along the corridor. The willingness to translate this higher awareness into concrete political measures (incentives, taxes etc.) still varies a lot among the different countries.
BUT: If the technological developments in the road sector are successfully introduced in the market (and allowed for by EU and national regulations and infrastructure provisions), the growth potential of the freight rail sector may still be limited due to a persistent lack of competitiveness, in terms of flexibility, speed and reliability (see also results from survey p. 137).
Although cost, time, and quality have been the relevant decision points in the past, the requirements for sustainable transport are growing with a significant impact on related business models. According to the results from our survey, environmental issues will play a more significant role in the choice of mode of transport in the future; e.g. already today some customers from automotive require 100% green electricity in the logistics chain (as a result from national regulations in Germany).
In the face of environmental and climate concerns being increasingly present in the public discourse, and citizens increasingly expecting policy makers to act upon their concerns, policy makers at the EU level, but also at the national, regional and local level are expected to increasingly support regulations and policies that benefit the environment.

18/158
Recommended routing (please refer to figure 1 below)
Based on a two-step-approach, the principal lines, possible diversionary lines, and, if suitable, connecting lines have been discussed with the relevant stakeholders and a recommendation for the final routing has been elaborated by the consultant. Final approval will be done by the relevant bodies. The routing contains:
• Principal lines (blue), • Diversionary lines (red), and • Connecting lines (yellow) to Ukraine only.

19/158
Figure 1: Recommended Routing RFC 9 RHD including principal, diversionary and connecting lines

20/158
Current traffic
In the following section the focus is put on corridor trains, defined as international trains passing at least one of the border crossing points defined along the RFC 9 RHD. This filter allows to concentrate on the relevant train numbers within the TMS, as e.g. transports within one and the same country will not be considered. Furthermore, the corridor trains will be reduced to border crossings relevant within the corridor. Thus, transports not directly crossing such a border are automatically filtered and not shown in the overall results.
The following table gives an overview with regard to the O-D Matrix of corridor trains along RFC 9 RHD in 2017 based on the existing data.
from / to Austria Czech Republic France Germany Hungary Romania Slovakia Ukraine
Austria 16.500 7.100 100 3.800
Czech Republic 2.200 6.600
France 200
Germany 14.600 2.000 200 600 200 10
Hungary 7.800 800 5.100
Romania 100 200 5.100
Slovakia 4.000 7.100 10 300
Ukraine 300
Table 1: O-D-Matrix for corridor trains on the RFC 9 RHD in 2017
from / to Austria Czech Republic France Germany Hungary Romania Slovakia Ukraine
Austria 45.7000 8.000 6.000
Czech Republic 33.400 34.700
France 2.300
Germany 44.900 23.800 2.400
Hungary 8.400
Romania
Slovakia 6.000 31.600 23.500
Ukraine 23.500
Table 2: O-D-Matrix for passenger trains on the RFC 9 RHD in 2017

21/158
Economic Areas
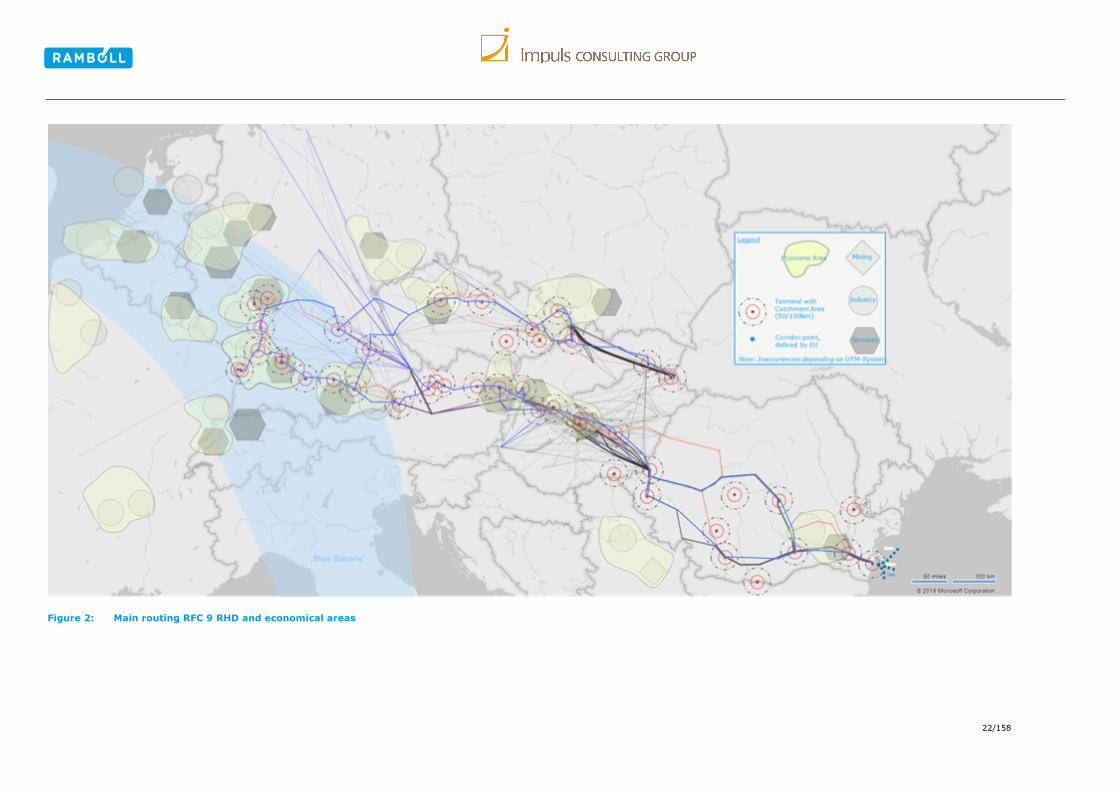
The following figure shows a graphical match of the recommended routing, all train data with 200 and more corridor trains per year – nearly one train per day – with the economic areas close to the corridor, mining, industrial, and service industry and the so-called ‘blue banana’ with more than 110 million inhabitants. In the Eastern part the Port of Constanta is both the gate to the Black Sea for import-export for the corridor, but even more important also the entry point to the world market for Eastern Countries. Finally, the terminals as hubs within this network are shown including a 50km (red circles) and 100 km (dotted circles) catchment area.
It can be clearly seen, that the RFC 9 RHD is connecting all relevant economic areas; the terminals are giving access to these areas within a suitable catchment area per terminal. Thus again showing that the proposed routing of the corridor aligns with the major economic hubs of the regions in a sensible way.
22/158
Figure 2: Main routing RFC 9 RHD and economical areas

23/158
Projections
Methodology
The traffic forecast is based on findings of the analysis of current situation and the PEST analysis. The results of the comprehensive PEST analysis are described in detail in chapter 3. The major socio-economic factors, having a special influence on the transport development in the corridor for the short-term forecast is the overall GDP development.
The forecast is based on the amount of trains running from country to country, crossing an international border. Here, the share of trains is split into three categories:
• BT – Block Trains • CT – Combined Transport Trains • SW – Single Wagon Load Trains
In a next step the average gross and net tons, as well as wagons per train are combined with the amount of trains. The individual multiplication of trains and average tons transforms the basic data from trains into tonnage transported in 2017 per rail. This approach was chosen as forecasts using a Compound Annual Growth Rates (CAGR) for the time span between 2017 and 2022 can only be made on tons and later be transformed back into number of trains.
The utilization of trains has to be considered here as well. Additional tons gained (through growth) will first be covered by increasing the utilization of existing trains before establishing additional services.
The following figure gives an overview on the approach used.
Figure 3: Forecasting process used

24/158
Forecast results 2017 - 2022
The following tables are showing the comparison of additional tons and trains for the forecast period. The growth with 7,5 million additional tons will result in 4,500 extra corridor trains along the corridor. Relatively speaking, an overall growth of about 9% in freight per ton will result in a 5 % growth on corridor trains overall, reflecting the increase of efficiency (better load ratio for existing trains) as well.
Category 2017 2022 Absolute growth Relative growth
BT 48,100,600 52.748.600 4.648.000 8,81%
CT 17,084,100 18.875.100 1.791.000 9,49%
SW 10,168,000 11.192.300 1.024.300 9,15%
Total Tons 75,352,700 82,816,000 7,463,300 9,01%
Table 3: Comparison tons regarding BT, CT, and SW – 2017 and 2022
Category 2017 2022 Absolute growth Relative growth
BT 50,700 53,500 2,800 5.23%
CT 17,500 18,420 920 4.99%
SW 14,900 15,700 800 5.10%
Total Trains 83,100 87,620 4,520 5.16%
Table 4: Comparison trains regarding BT, CT, and SW – 2017 and 2022
The following figure shows the destinations on a country level for 2022 and the changes from 2017. The thickness of the connecting line indicates the amount of corridor trains between the countries.
Figure 4: O-D-Graph for corridor trains on RFC 9 RHD in 2022 incl. growth rates from 2017
25/158
Results
Based on the results and the overall finding the following conclusions regarding the growth of corridor trains can be drawn from the consultant’s point of view:
• The share of combined transport (CT) and single wagon load train (SW) is decreasing from the Western part to the Eastern part of the corridor. Single wagon trains can only survive with substantial governmental support through subsidies (e.g. in Austria). In many countries this willingness decreased substantially in recent years (e.g. in France).
• The increase of block trains to the east is also partly due to the fact that single wagon load trains cannot be clearly separated from this block trains within part of the data sets received. In addition, block trains are cheaper to run, so they are more competitive from a cost perspective.
• Taking into account the estimations of potential declining demands on BT and lower growth on SW plus its complex production system, the main focus in corridor train development should be put on CT along the corridor (especially regarding the development of access points, i.e. terminals) – but not necessarily the only one.
• The potential for higher growth regarding CT is based on the following facts:
1. The production system itself is a viable solution for future transport requirements and development due to its flexibility.
2. Shuttle-Systems with standardized transport equipment can be introduced.
3. There is potential for increasing the utilization of trains with non-cranable semi-trailer (for instance using the Nikrasa technology).
4. If the CT terminals are upgraded / promoted, then they are very likely to attract cargo from road and thus increase the modal split in favour of rail.
Conclusions and recommendations
Based on the results of a SWOT-Analysis the following conclusions have been developed on how to take advantage of the strengths and opportunities, by minimizing the threats and weaknesses (risks) from an IM point of view (taking into account where the IMs will be able to change or influence the parameters identified within the SWOT-Analysis).
Institutional A coordinated implementation process concerning the institutional reform steps across all RFC 9 RHD countries in order to maximise the strengths, which the liberalisation brings to freight traffic growth, should be the goal of all stakeholders involved. A harmonised approach will help to overcome the different levels of implementation and harmonisation on the corridor concerning the EU-wide implementation of homogenous technical and safety regulations and rules in all member states of the RFC 9 RHD.
Economic The future economic developments and the effects on RFC 9 RHD should be closely monitored. And the coherent (i.e. due to the economic development) needs for investments in order to fulfil EU-wide and national policies on moving freight from road to rail communicated. An efficient infrastructure pricing regime keeping rail freight competitive is also of high importance.
Organisational This study provides the number of corridor trains on the major O/D relations and for specific line sections of the preliminary route for the current situation as well as a forecast for 2022. These numbers are based in data provided by the IMs and may be used as one input for the development of the Pre-arranged paths (PaP) offer. Nonetheless it has to be noted, that the current information

26/158
available on corridor trains is hampered by the different data interfaces and information available in the IMs databases on corridor trains.
The current distribution of corridor trains clearly shows that the majority of corridor trains are not crossing more than 2 corridor borders. And this information is also not fully consistent due to a lack of additional information attached to the trains itself in the database.
This is contrary to the overall distribution of transport volumes along the corridor. This is likely to have its origins in the existing production system, where SW traffic at the border stations/yards is being consolidated into international trains, but also in the change of national to international train numbers (and vice versa) at these stations as well as with trains delayed more than 24hrs receiving new train numbers. This can be easily remedied within the current organisation and should help improve operations and monitors the effect on the corridor trains in the future.
The establishment of a C-OSS along the whole RFC should be accompanied by the establishment of a transparent pricing and billing regime along RFC 9 RHD for corridor trains (including the national access fee regimes).
Cross-border harmonisation of path information management supporting the complete path management process chain including feasibility study, path request, capacity allocation, train operation monitoring and train performance management, billing and statistical reporting is clearly necessary. Following the standards set by RailNetEurope the related interfaces for information exchange with RU’s and IM’s should be further implemented and adapted to specific needs of the RFC 9 RHD.
A continuous conduction of regular stakeholder interviews or stakeholder conferences along the corridor, using the information to enhance the services of the C-OSS and to ensure the attractiveness and utilisation of the offered PaPs will clearly benefit the RFC 9 RHD and its commercial success.
Infrastructural, technical and logistical To allow a higher train utilisation and hence support lowering of operational costs as well as higher transport volumes without additional train path capacity the (gradual) standardisation of technical parameters of network / terminals (depending on traffic demand), following the TEN-T standards for new and upgraded lines (train length 740m train, 22,5 t axle load) should be given priority.
To support further growth of intermodal transport, terminals should be developed according to customer requirements.
The harmonisation of signalling and train control systems with the establishment of ERTMS is also essential for the future success of the corridor.
Within the terminals the extension of storage capacity in coordination/cooperation with the terminal operators should be focused on together with the enhancement of terminal capacities, including a 7 days/24 hours-operation, where necessary.

27/158
Recommendations Overall the RFC 9 RHD has a potential to attract continental freight load and to connect large Western European Markets with a maritime gate to the East – the Port of Constanta. Aim should be to foster the understanding of the RFC 9 RHD as a backbone, integrating different stakeholders (e.g. ministries, authorities,…) and forming a robust and attractive transport chain – for pre-, main-and on-carriage. To strengthen the overall competitiveness of rail freight, a focus should be put on the following issues:
• Increasing the availability of suitable (intermodal) transport loading units and (bulk) goods with access points (terminals) including enough storage and transhipment capabilities.
• Harmonized infrastructure approach regarding signalling (ERTMS) and train parameters (train length) and removal of bottleneck (infrastructural, administrative and operational)
• Short-term efficiency to be realized by so-called “soft-measures”, e.g. harmonized administrative processes and handling at borders, coordination of ongoing and planned works resulting in unexpected re-routings in connection with longer running times (see also Rail Technical and Operational Issues affecting Interoperability - Logbook)
• Harmonized processes at borders and enforcing interoperability • A harmonization of train data along RFC 9 RHD to allow for an automated data integration,
an efficient traffic management (including performance supervision) and a precise definition of ETA in the future is also strongly recommended.
• Implementation of TTR along RFC 9 RHD • Implementation of language knowledge in Train Control Centre (English) • Implementation of an efficient “border–regime” including the use of trusted hand-over (ATTI)
among RUs, including “mitigation measures” where necessary, e.g. reduction of language requirements to a reasonable level from a practical point of view.
• Use the almost “historical” window of opportunity for environmental issues to increase political pressure to create a level-playing field among transport modes (e.g. regarding the internalisation of external costs).

28/158
1. INTRODUCTION 1.1 Objectives and methodology
The main objective of the TMS is to identify the final alignment of the Rail Freight Corridor 9 according to expected future traffic. Therefore, the TMS provides a detailed overview of the corridor’s current operational status ensuring specific study results, recommendations regarding the freight market development and potential future customer demand along the corridor. Since the RFC 9 RHD has a highly important strategic role, being one of the main East-West links across Continental Europe, the study will become an important prerequisite for the development of an implementation plan for RFC 9 RHD. In order to achieve the goals (see below), the study focuses on the following major issues:
• Analysis of geographical aspects of the catchment area and Member States in terms of relevance to transport;
• A detailed PEST-Analysis for the relevant Member States • Analysis and evaluation of the current transport market situation covering all traffic modes; • Multimodal traffic flow evaluation; brief analysis of possible modal shift; • Analysis of commodities; • SWOT-Analysis of the rail freight traffic in the corridor; • Forecast of the transport market development and traffic growth; • Deduction of requirements to railway infrastructure and operational and organizational
improvements in railway freight traffic in order to improve the railway sector’s competitiveness and to adequately meet market demand;
• Identification of logistic service opportunities;
Investigations and analyses have been carried out for major corridor sections, transport nodes, IWW network, ports and multimodal terminals identifying gaps and proposing solutions to improve RFC 9 RHD.
Figure 5: Methodology for the TMS*
*due to partly retarded data deliveries the processing and evaluation of data could only be started in September.

29/158
1.2 TMS-Goals
The study aims at
• the analysis of catchment area, railway and road networks (as well as their connection), border crossing points, IWW ports and relevant multimodal terminals;
• allowing the definition of the final alignment for the corridor; • the provision of information on main identified bottlenecks; • forecast for the short-medium-term (2022) developments;
The TMS thus forms a crucial part in allowing the RFC 9 RHD to meet three major challenges:
1. Strengthening cooperation between infrastructure managers on key aspects, such as allocation of paths, deployment of interoperable systems and infrastructure development;
2. Establishing the right balance between freight and passenger traffic flow, taking into account market needs and common targets;
3. Promoting intermodality between rail and other transport modes by integrating terminals into the corridor management process;
1.3 General information
As defined by the Regulation (EU) No 913/2010 the Rail Freight Corridor 9 Rhine-Danube (RFC 9 RHD) offers services along the following routing: Strasbourg- Stuttgart-München-Wels/Linz, Strasbourg-Mannheim-Frankfurt- Würzburg- Nürnberg- Regensburg- Passau- Wels/ Linz, München/ Nürnberg- Praha- Ostrava/ Přerov- Žilina- Košice- UA border (Chop), Wels/ Linz- Vienna – Bratislava // Sopron – Győr – Budapest, Vienna/ Bratislava- Budapest-Arad- Brașov/ Craiova- București- Constanța – (Sulina).
As an essential part of the implementation plan for the freight corridor a TMS has to be carried out according to Article 9 “Measures for implementing the freight rail corridor plan” part 3 (9.3) of the Regulation.

30/158
2. CORRIDOR DEFINITION AND CATCHMENT AREA 2.1 Definition of the corridor
The Rhine-Danube Core Network Corridor is the transport backbone linking Central and South-Eastern Europe. Running from the Strasbourg area and South-West Germany to the Romanian ports of the Black Sea and the Slovak-Ukrainian border (in two distinct branches), it comprises intermediate sections in nine0F
1 Member States, and connects them to neighbouring countries Serbia, Bosnia-Herzegovina, Moldova and Ukraine. Several segments of the Rhine-Danube Core Network Corridor are shared with segments of the Orient-East Med Core Network Corridor as well. The Rhine-Danube Core Network Corridor includes around 5,800km1F
2 of rail network, 4,500km of roads and 3,900km of waterways.
The RFC 9 RHD as part of this Corridor provides the main east–west link between continental Europe, connecting France and Germany, Austria, Czech Republic, Slovakia, Hungary and Romania all along the Rhine, Main and Danube rivers to the Black Sea by improving (high speed) rail and inland waterway interconnections. The countries that have first been aligned with the project were Czech Republic and Slovakia.
The corridor area (in the sense of catchment area of the corridor) was defined on the basis of the European NUTS (Nomenclature of Units for Territorial Statistics) classification.
• NUTS 1 – major socio-economic region (country) • NUTS 2 – administrative region for regional politics • NUTS 3 – small (administrative) region for further diagnosis
Figure 6: NUTS classification (source: Eurostat)
For the purposes of this study NUTS-2 and NUTS-3 regions were used. Basically, the corridor area is based on NUTS-2 regions, as for these areas relevant statistical data from Eurostat is available. The use of NUTS-3 regions in several cases allowed for a more precise definition of the corridor area, especially in densely populated areas.
1 Croatia and Bulgaria among them due to connection to the IWW 2 The network length is based on a pre-defined routing

31/158
Figure 7: RFC 9 RHD identification per NUTS 2
Figure 8: RFC 9 RHD identification per NUTS 3
A complete list of the NUTS regions is shown in Annex 2.
The clear definition of the corridor area was important, as all international freight train relations (corridor trains/additional trains) with their origin and destination within the corridor area were to be analysed.
The corridor area in the countries involved was elaborated in close cooperation with the concerned Infrastructure Managers and finally agreed with the Management Board.
In addition, there are other TEN-T corridors and respective Rail Freight Corridors which are crossing or partly consistent with the RFC 9 RHD. On the east side by Scandinavian- Mediterranean and Rhine-Alpine corridors, on the West by Orient/East-Med and partly by Mediterranean (only in Budapest region). This could lead to improving the benefits of increasing international freight and passenger traffic flows in Europe, creating unified logistic junctions for freight goods, as well as efficient border crossing procedures.

32/158
2.2 Member states and corridor area
The RFC 9 RHD corridor officially includes seven Member States. The preliminary length of the RFC 9 RHD is about 5775 km. The TMS analysis covers all seven EU-countries.
The corridor is divided into two branches:
1. Czech-Slovak corridor (Czech Slovakian Axis): the path from Frankfurt (and Munich) via Schirnding to the Slovakian /Ukrainian border (Chop), linking Praha, Žilina, Košice, along the way.
2. Danube Axis: the connection from Strasbourg and via Frankfurt and Southern Germany (Stuttgart) with the Central European cities of Vienna, Bratislava and Budapest, passing through the Romanian capital Bucharest to culminate at the Black Sea port of Constanta.
2.3 Detailed routing and border crossing points
2.3.1 Detailed railway routing RFC 9 RHD
Based on a two-step-approach, the principal lines, possible diversionary lines, and, if suitable, connecting lines have been discussed with the relevant stakeholders and a recommendation for the final routing has been elaborated by the consultant.
The recommended corridor routing with principal, connecting and diversionary lines was developed in several stages; the 1st step of the routing-alignment was based on the analysis of the current corridor trains (2017) and the preliminary routing. The proposed routing was then checked against all trains running on the corridor to validate the alignment.
Based on the input received from the stakeholders the alignment from stage 1 was further developed in a 2nd step. It contains:
• Principal lines (blue), • Diversionary lines (red), and • Connecting lines (yellow) to Ukraine only.
The following figure shows the recommended route alignment of RFC 9 RHD. Final approval will be done by the relevant bodies (MaBo, ExBo,…) in 2020. Section 2.3.1.1 to 2.3.1.6 include the specific figures per country and 2.3.1.7 the table with all sections for the RFC 9 RHD

33/158
Figure 9: Recommended Routing RFC 9 RHD including principal, diversionary and connecting lines

34/158
Figure 10: Recommended Routing of corridor matched to corridor trains (2017)
A graphical check-up for all available corridor trains per annum with detailed corridor routing shows that the alignment of the corridor is located properly.

35/158
2.3.1.1 Detailed railway routing Germany
Figure 11: Recommended Routing RFC 9 RHD in Germany
2.3.1.2 Detailed railway routing Austria
Figure 12: Recommended Routing RFC 9 RHD in Austria

36/158
2.3.1.3 Detailed railway routing Czech Republic
Figure 13: Recommended Routing RFC 9 RHD in Czech Republic
2.3.1.4 Detailed railway routing Slovakia
Figure 14: Recommended Routing RFC 9 RHD in Slovakia

37/158
2.3.1.5 Detailed railway routing Hungary
Figure 15: Recommended Routing RFC 9 RHD in Hungary
2.3.1.6 Detailed railway routing Romania
Figure 16: Recommended Routing RFC 9 RHD in Romania

38/158
2.3.1.7 Detailed railway routing per section RFC 9 RHD
From From Country To To Country Type IM
Strasbourg France Kehl Germany Principal SNCF Réseau/DB Netz
Kehl Germany Appenweier Germany Principal DB Netz
Appenweier Germany Rastatt Germany Principal DB Netz
Rastatt Germany Durmersheim Germany Principal DB Netz
Durmersheim Germany Karlsruhe Germany Principal DB Netz
Rastatt Germany Ettlingen West Germany diversionary DB Netz
Ettlingen West Germany Karlsruhe Germany diversionary DB Netz
Karlsruhe Germany Bruchsal Germany diversionary DB Netz
Bruchsal Germany Heidelberg Germany diversionary DB Netz
Heidelberg Germany Mannheim Germany diversionary DB Netz
Karlsruhe Germany Hockenheim Germany Principal DB Netz
Hockenheim Germany Mannheim Germany Principal DB Netz
Mannheim Germany Darmstadt Germany Principal DB Netz
Darmstadt Germany Aschaffenburg Germany Principal DB Netz
Aschaffenburg Germany Gemünden Germany Principal DB Netz
Mannheim Germany Groß Gerau Germany diversionary DB Netz
Groß Gerau Germany Frankfurt am Main Germany diversionary DB Netz
Frankfurt am Main Germany Hanau Germany diversionary DB Netz
Hanau Germany Aschaffenburg Germany diversionary DB Netz
Gemünden Germany Schweinfurt Germany Principal DB Netz
Schweinfurt Germany Bamberg Germany Principal DB Netz
Bamberg Germany Nürnberg Germany Principal DB Netz
Gmünden Germany Würzburg Germany diversionary DB Netz
Würzburg Germany Nürnberg Germany diversionary DB Netz
Nürnberg Germany Regensburg Germany Principal DB Netz
Regensburg Germany München Germany Principal DB Netz
Regensburg Germany Passau Germany Principal DB Netz
Karlsruhe Germany Pforzheim Germany Principal DB Netz
Pforzheim Germany Mühlacker Germany Principal DB Netz
Bruchsal Germany Mühlacker Germany diversionary DB Netz
Mühlacker Germany Ludwigsburg Germany Principal DB Netz
Ludwigsburg Germany Stuttgart Germany Principal DB Netz
Stuttgart Germany Ulm Germany Principal DB Netz
Ulm Germany Augsburg Germany Principal DB Netz
Augsburg Germany München Germany Principal DB Netz
München Germany Rosenheim Germany Principal DB Netz
Rosenheim Germany Freilassing Germany Principal DB Netz
München Germany Mühldorf am Inn Germany diversionary DB Netz
Mühldorf am Inn Germany Freilassing Germany diversionary DB Netz

39/158
From From Country To To Country Type IM
Freilassing Germany Salzburg Austria Principal DB Netz/ÖBB
Nürnberg Germany Schirnding Germany Principal DB Netz
Schirnding Germany Cheb Czech Republic Principal DB Netz/ Správa železnic
Regensburg Germany Schwandorf Germany Principal DB Netz
Schwandorf Germany Furth im Wald Germany Principal DB Netz
Furth im Wald Germany Domažlice Czech Republic Principal DB Netz/ Správa železnic
Cheb Czech Republic Plzeň Czech Republic Principal Správa železnic
Domažlice Czech Republic Plzeň Czech Republic Principal Správa železnic
Plzeň Czech Republic Praha Czech Republic Principal Správa železnic
Praha Czech Republic Poříčany Czech Republic Principal Správa železnic
Poříčany Czech Republic Nymburk Czech Republic diversionary Správa železnic
Poříčany Czech Republic Kolín Czech Republic Principal Správa železnic
Kolín Czech Republic Pardubice Czech Republic Principal Správa železnic
Praha Czech Republic Lysá nad Labem Czech Republic diversionary Správa železnic
Lysá nad Labem Czech Republic Nymburk Czech Republic diversionary Správa železnic
Nymburk Czech Republic Velký Osek Czech Republic diversionary Správa železnic
Kolín Czech Republic Velký Osek Czech Republic diversionary Správa železnic
Velký Osek Czech Republic Hradec Králové Czech Republic diversionary Správa železnic
Hradec Králové Czech Republic Choceň Czech Republic diversionary Správa železnic
Pardubice Czech Republic Choceň Czech Republic Principal Správa železnic
Choceň Czech Republic Česká Třebová Czech Republic Principal Správa železnic
Česká Třebová Czech Republic Olomouc Czech Republic Principal Správa železnic
Olomouc Czech Republic Prosenice Czech Republic Principal Správa železnic
Prosenice Czech Republic Hranice na Moravě Czech Republic Principal Správa železnic
Hranice na Moravě Czech Republic Horní Lideč Czech Republic Principal Správa železnic
Horní Lideč Czech Republic Lúky pod Makytou Slovakia Principal Správa železnic /ZSR
Hranice na Moravě Czech Republic Ostrava Czech Republic Principal Správa železnic
Ostrava Czech Republic Dětmarovice Czech Republic Principal Správa železnic
Dětmarovice Czech Republic Český Těšín Czech Republic Principal Správa železnic
Český Těšín Czech Republic Mosty u Jablunkova Czech Republic Principal Správa železnic
Mosty u Jablunkova Czech Republic Čadca Slovakia Principal Správa železnic
/ZSR
Ostrava Czech Republic Český Těšín Czech Republic Principal Správa železnic
Čadca Slovakia Žilina Slovakia Principal ZSR
Lúky pod Makytou Slovakia Púchov Slovakia Principal ZSR
Púchov Slovakia Žilina Slovakia Principal ZSR
Žilina Slovakia Vrútky Slovakia Principal ZSR
Vrútky Slovakia Liptovský Mikuláš Slovakia Principal ZSR
Liptovský Mikuláš Slovakia Poprad Slovakia Principal ZSR
Poprad Slovakia Spišská Nová Ves Slovakia Principal ZSR
40/158
From From Country To To Country Type IM
Spišská Nová Ves Slovakia Kysak Slovakia Principal ZSR
Kysak Slovakia Košice Slovakia Principal ZSR
Košice Slovakia Výh. Slivník Slovakia Principal ZSR
Výh. Slivník Slovakia Čierna nad Tisou Slovakia Principal ZSR
Čierna nad Tisou Slovakia Chop Ukraine Connecting line ZSR/UZ
Barca Slovakia Košice Slovakia Principal ZSR
Barca Slovakia Haniska pri Košiciach Slovakia Principal ZSR
Výh. Slivník Slovakia Maťovce Slovakia diversionary ZSR
Salzburg Austria Steindorf bei Straßwalchen Austria Principal ÖBB
Steindorf bei Straßwalchen Austria Vöcklabruck Austria Principal ÖBB
Vöcklabruck Austria Wels Austria Principal ÖBB
Passau Germany Grieskirchen Austria Principal ÖBB
Grieskirchen Austria Wels Austria Principal ÖBB/ZSR
Wels Austria Linz Austria Principal ÖBB
Wels Austria Traun Austria diversionary ÖBB
Traun Austria Linz Austria diversionary ÖBB
Linz Austria Enns Austria Principal ÖBB
Enns Austria Amstetten Austria Principal ÖBB
Amstetten Austria St. Pölten Austria Principal ÖBB
St. Pölten Austria Wien Austria Principal ÖBB
Wien Austria Bruck a. d. Leitha Austria Principal ÖBB
Bruck a. d. Leitha Austria Parndorf Austria Principal ÖBB
Parndorf Austria Kittsee Austria Principal ÖBB
Kittsee Austria Bratislava Slovakia Slovakia Principal ZSR/GYSEV
Parndorf Austria Nickelsdorf Austria Principal ÖBB
Wien Austria Ebenfurth Austria Principal ÖBB
Ebenfurth Austria Sopron Hungary Principal GYSEV
Sopron Hungary Győr Hungary Principal GYSEV
Nickelsdorf Austria Hegyeshalom Hungary Principal ÖBB/MÁV
Bratislava Slovakia Rajka Hungary Principal ZSR/GYSEV
Rajka Hungary Hegyeshalom Hungary Principal GYSEV
Hegyeshalom Hungary Győr Hungary Principal MÁV
Győr Hungary Tata Hungary Principal MÁV
Tata Hungary Budapest Hungary Principal MÁV
Budapest Hungary Újszász Hungary Principal MÁV
Újszász Hungary Szolnok Hungary Principal MÁV
Budapest Hungary Cegléd Hungary diversionary MÁV
Cegléd Hungary Szolnok Hungary diversionary MÁV
Szolnok Hungary Szajol Hungary Principal MÁV
Szajol Hungary Békéscsaba Hungary Principal MÁV

41/158
From From Country To To Country Type IM
Békéscsaba Hungary Lőkösháza Hungary Principal MÁV
Lőkösháza Hungary Curtici Romania Principal MÁV /CFR
Szajol Hungary Püspökladány Hungary diversionary MÁV
Püspökladány Hungary Biharkeresztes Hungary diversionary MÁV
Biharkeresztes Hungary Episcopia Bihor Romania diversionary MÁV /CFR
Curtici Romania Arad Romania Principal CFR
Arad Romania Deva Romania Principal CFR
Deva Romania Simeria Romania Principal CFR
Simeria Romania Coslariu Romania Principal CFR
Coslariu Romania Sighisoara Romania Principal CFR
Sighisoara Romania Brasov Romania Principal CFR
Brasov Romania Ploiesti vest Romania Principal CFR
Ploiesti vest Romania Bucuresti Romania Principal CFR
Arad Romania Timisoara Romania Principal CFR
Timisoara Romania Caransebes Romania Principal CFR
Caransebes Romania Filiasi Romania Principal CFR
Filiasi Romania Craiova Romania Principal CFR
Craiova Romania Videle Romania Principal CFR
Videle Romania Bucuresti Romania Principal CFR
Bucuresti Romania Lehliu Romania Principal CFR
Lehliu Romania Fetesti Romania Principal CFR
Fetesti Romania Constanta Romania Principal CFR
Ploiești triaj Romania Buzău Romania diversionary CFR
Buzău Romania Făurei Romania diversionary CFR
Făurei Romania Fetești Romania diversionary CFR
Simeria Romania Târgu Jiu Romania diversionary CFR
Târgu Jiu Romania Filiasi Romania diversionary CFR
Coslariu Romania Cluj-Napoca Romania diversionary CFR
Cluj-Napoca Romania Episcopia Bihor Romania diversionary CFR
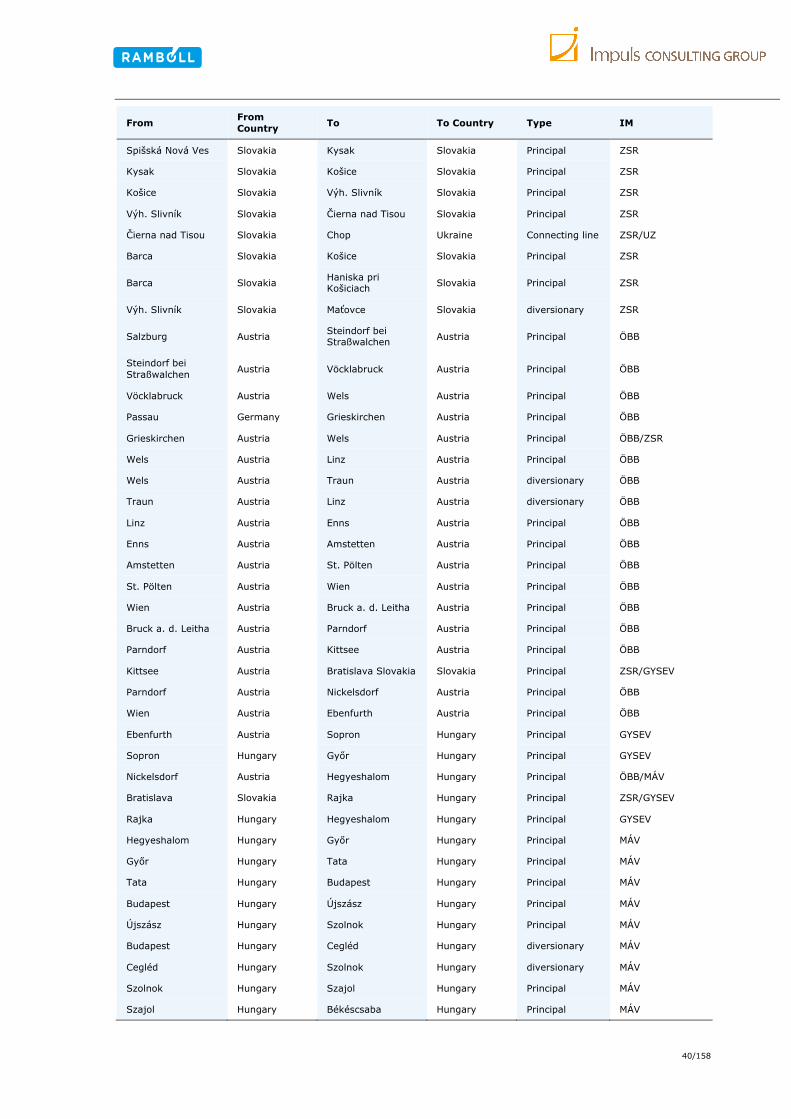
Table 5: Recommended corridor routing per section within RFC 9 RHD2F
3
2.3.2 Detailed road route overview
The road running in parallel to the RFC 9 RHD crosses all corridor EU member countries, starting from Strasburg crossing all countries ending directly at the port of Constanta. The total length is 4,488 km.
3 The recommended routing has to be approved by MaBo and ExBo
42/158
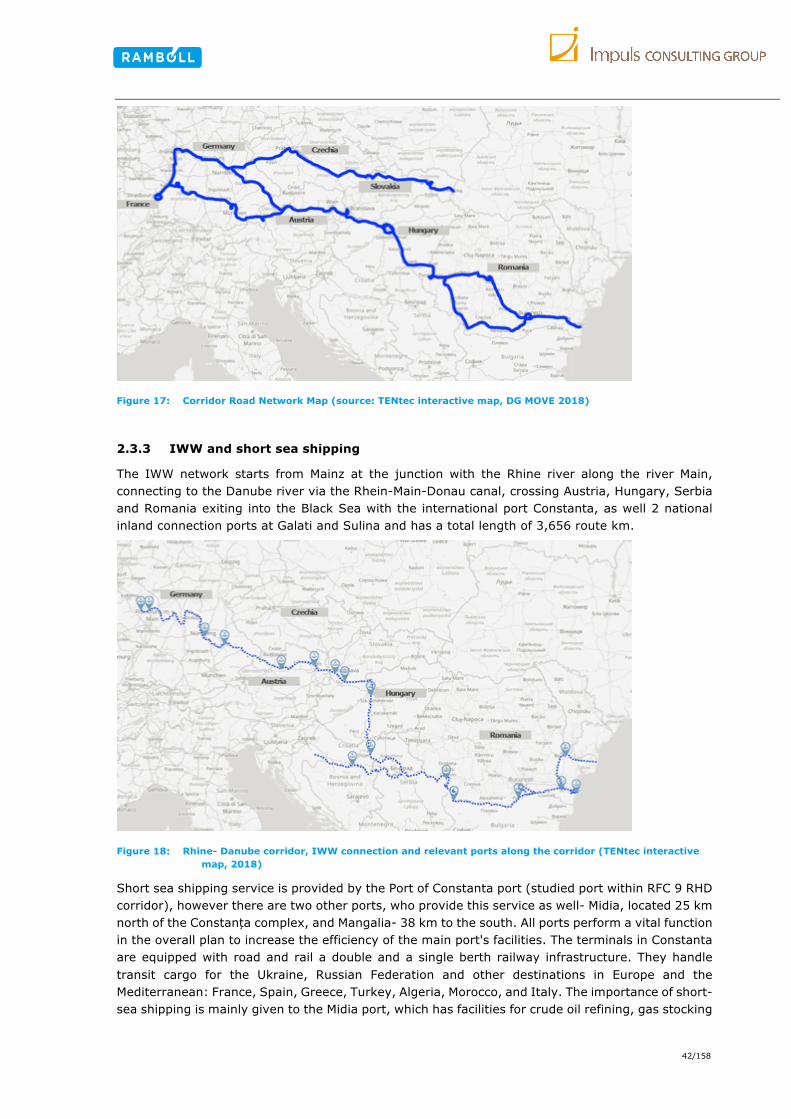
Figure 17: Corridor Road Network Map (source: TENtec interactive map, DG MOVE 2018)
2.3.3 IWW and short sea shipping
The IWW network starts from Mainz at the junction with the Rhine river along the river Main, connecting to the Danube river via the Rhein-Main-Donau canal, crossing Austria, Hungary, Serbia and Romania exiting into the Black Sea with the international port Constanta, as well 2 national inland connection ports at Galati and Sulina and has a total length of 3,656 route km.
Figure 18: Rhine- Danube corridor, IWW connection and relevant ports along the corridor (TENtec interactive map, 2018)
Short sea shipping service is provided by the Port of Constanta port (studied port within RFC 9 RHD corridor), however there are two other ports, who provide this service as well- Midia, located 25 km north of the Constanța complex, and Mangalia- 38 km to the south. All ports perform a vital function in the overall plan to increase the efficiency of the main port's facilities. The terminals in Constanta are equipped with road and rail a double and a single berth railway infrastructure. They handle transit cargo for the Ukraine, Russian Federation and other destinations in Europe and the Mediterranean: France, Spain, Greece, Turkey, Algeria, Morocco, and Italy. The importance of short-sea shipping is mainly given to the Midia port, which has facilities for crude oil refining, gas stocking

43/158
capacity, and the oil pipeline from Constanța to Ploiesti (the most important refining area in Romania)3F
4.
The Port of Constanta has around 294F
5 short sea connection where cargo could be transported between ports in Romania (Midia, Basarabi, Sulina, etc), as well as between Black sea countries (Ukraine, Turkey, Bulgaria, possibly Georgia and Russian Federation).
From/ to Constanta short sea shipping operates with Ro-Ro transport and Containers (see the figure below). The studied Galati port is a part of RFC 9 RHD corridor, but it is not as developed as Constanta port and is located on the Danube river (an IWW port), therefore it makes no sense to review a short sea shipping service. Nevertheless, it offers a short connection to the Black sea though Sulina ports. The cargo could be transhipped direct to Sulina or/and or Constanta and/ or even directly to Ukraine or other seaports in Romania and Bulgaria.
Figure 19: Overview of short sea shipping types in Constanta and Galati ports (Source: Consultant map and analysis of maritime links of Romania ports – R-D 2017)5F
6
2.3.4 Interconnections with other corridors
The studied RFC 9 RHD interconnects with the following international multimodal corridors:
1. Rhine - Alpine corridor (links the seaports of Rotterdam, Zeebrugge, Antwerp, Amsterdam and Vlissingen with the port of Genoa. The corridor concentrates on modal shift from road to rail connecting heavily industrialised North-South route and Europe's prime economic regions such as: Rotterdam, Amsterdam, Antwerp, Ghent, Liège, Duisburg, Cologne, Frankfurt, Mannheim, Basel, Zurich, Milan and Genoa. Transport modes: rail, road, IWW).
2. Baltic - Adriatic corridor (runs from the Baltic seaports of Gdansk, Gdynia, Szczecin and Świnoujście in the north part of Europe, to the Adriatic ports of Koper, Trieste, Venice and Ravenna in the south, taking in the industrial regions of Central and Southern Poland. The corridor strongly concentrates on railway service development. Transport modes: rail, road).
3. Orient/East-Med corridor (very similar to the RFC 9 RHD corridor. It connects large parts of Central Europe with strong connection to ports along Elbe river (key IWW transport) to the
4 EU Report and overview of maritime transport in Romania, REPORT 1 - ANNEX 2.10, 2014 5 MOVE/B1/2015-201 STUDY ON THE TEN-T MOTORWAYS OF THE SEA HORIZONTAL PRIORITY of the EUROPEAN COMMISSION DIRECTORATE-
GENERAL FOR MOBILITY AND TRANSPORT Directorate B – European mobility network, 2017 6 Conventional transport - cargo handling is lifted over the vessel's rail either by a crane on land or by a crane on board the vessel. Means of
transport is a means of transport used is land transport such as a truck, train or other corresponding vehicle.

44/158
North, Baltic, Black and Mediterranean Seas. The corridor provided mainly multimodal connections to Motorways of the Sea. Transport modes: rail, road, IWW).
4. Mediterranean corridor (runs from the south-western region of Spain, following the coastlines of France, crossing the Alps towards the east through Italy, Slovenia and Croatia and continuing to Hungary up to its eastern Ukrainian border. The corridor provides multimodal connection from the Central Europe to the ports. Transport modes: rail, road, IWW (the Po River, several canals in Northern Italy and the Rhone River from Lyon to Marseille)).
5. Scandinavian - Mediterranean corridor (starts from Finland, Sweden going to Denmark, Northern, Central and Southern Germany and ending in the island of Malta in the South. The corridor crosses the industrial heartlands of Northern Italy and the southern Italian ports. It strongly concentrates on freight rail service development. Transport modes: rail, road, IWW).
6. Amber Rail Freight corridor (starts from Poland (Terespol, Warsaw) and passing through Slovakia, Hungary and Slovenia. The corridor strongly concentrates on rail transport offering Corridor-One Stop Shop, which facilitates train path management for international rail freight along the corridor6F
7)).
Reviewing the mentioned multimodal corridors sections by each transport mode the RFC 9 RHD intersects with the corridors at the following locations marked on the map:
7 It is single contact point allowing customers to request and receive answers regarding infrastructure capacity for international freight trains along
this corridor.

45/158
Figure 20: Overview of the RFC 9 RHD corridor and its interaction with other TEN-T railway routes

46/158
2.3.5 Corridor border crossing points
The border crossing points for each country were identified7F
8. The information on railway was received from Infrastructure Managers. The border crossings on road and IWW were obtained from official online-sources. The table below only shows border crossings with relevance to RFC 9 RHD.
Country Transport Mode
From To Rail Road IWW
France Germany Strasbourg - Kehl
Straßburg (E52) -Kehl (B28)
Rhine River Illkirch- Graffenstaden (N83) -
Offenburg (L98)
Germany Austria
Passau - Wernstein/Inn Passau (A3) - Linz (A8)
Passau - Melk Freilassing - Salzburg-
Liefering Traunstein (A8) - Salzburg (A1)
Germany Czech
Republic
Schirnding - Cheb Waidhaus (A6) - Rozvadov (D5)
- Furth im Wald - Česká Kubice
Furth im Wald (B20) - Česká
Kubice (S26)
Czech
Republic Slovakia
Mosty u Jablunkova – Čadca
Horní Lideč – Kúty pod
Makytou
Mosty u Jablunkova – Svrčinovec,
Střelná – Lysá pod Makytou -
Austria Slovakia Kittsee - Petržalka Kittsee (D2) - Jarovce (M10) Hainburg -
Bratislava
Slovakia Hungary Rusovce - Rajka Jarovce/ Kittsee (D2) - Cunovo/
Rajka (M15) Szap - Szob
Slovakia Ukraine Cierna nad Tisoy - Chop Vysne Nemecke - Uzhgorod
(E50/58) -
Austria Hungary Nickelsdorf - Hegyeshalom Nickelsdorf (A4) - Hegyeshalom
(M1) -
Baumgarten - Sopron
Hungary Romania
Lőkösháza - Curtici
Szeged (M43) - Arad (A1) - Biharkeresztes - Episcopia
Bihor
Hungary Serbia - - Mohács port -
Novi Sad
Table 6: List of border crossings for RFC 9 RHD
8 Rail, Road, IWW- checked with TENT interaction map, TENT railway network, Intermodal map, Border crossing authorities of each country

47/158
2.4 EU border crossing procedures and trusted hand-over
2.4.1 Overall status
The border crossing procedures have a huge impact on transport interoperability and service quality of all modes within the corridor. The countries of RFC 9 RHD are EU member states, which means that the border crossing procedures do not require visa entrance and have set procedures for freight transport control. Operational cooperation for border crossing procedures between EU States is coordinated by the European Agency for the Management of Operational Cooperation at the External Borders ("FRONTEX").
The railway border crossing rules identified under Directive 2012/3426/EU allow Member States to negotiate cross-border agreements in order to facilitate the provision of cross-border rail services. These agreements are subject to compliance checks by the European Commission (transposed by Directive 2015/413/EU facilitating cross-border exchange of information on road-safety-related traffic offences ("Cross-Border Enforcement Directive"- CBE)).
The TEN-T Regulation8F
9 establishes guidelines for the development of the Trans-European transport network, which includes the infrastructure for IWW transport. The regulation describes priorities as well for setting information and communication technology, such as implementing telematics applications (including RIS), while others deal with multimodality, such as connecting inland port infrastructure to rail freight and road transport infrastructure.
Electronic freight transport documents are used to different extents for various modes of transport. Nevertheless, there are still issues applied to all transport modes: limited acceptance by Member States and limited interoperability between the various IT-solutions/systems that currently support electronic transport documents9F
10. This limits the efficiency of, in particular, multimodal and cross-border transport and, hence, that of the functioning of the EU single market. On 17 May 2018, the Commission therefore adopted a legislative proposal10F
11 aimed at supporting the use of freight transport documents in electronic format across all modes of transport. The proposal also reviews needed developments for data information protection and electronic identification for electronic transactions11F
12. In addition, it requires measures to be taken to ensure the protection of sensitive commercial data, which is a specific concern for actors in the inland waterways sector.
In relation to market opening, cooperation between DG MOVE and DG COMP in the rail sector12F
13, as well as the launch of infringement procedures regarding the transposition of Directive 2012/34/EU may lead to a better functioning of the market for cross-border services.
9Regulation (EU) No 1315/2013 of the European Parliament and of the Council of 11 December 2013 on Union guidelines for the development of
the trans-European transport network. 10 COM (2018) 279 final 11 SWD(2018) 183 final 12 Regulation (EU) No 910/2014 of the European Parliament and of the Council of 23 July 2014 on electronic identification and trust services for
electronic transactions in the internal market and repealing Directive 1999/93/EC (the eIDAS Regulation) (OJ L 257, 28.8.2014, p. 73–114). 13 “The European Commission’s (EC) Directorates-General for competition and transport have jointly carried out a screening of the bloc’s railway sector, an exercise that may lead to new antitrust as well as state aid investigations, PaRR has learned”, PaRR competition news and analysis, 30/08/2017; As a concrete output, on 23 January, the Commission opened in-depth investigation into restructuring aid for Polish Regional Railways: http://europa.eu/rapid/press-release_IP-18-394_en.htm

48/158
Figure 21: Spatial inventory of all identified cross-border rail connections (prepared by EU, 2018)14F
14
2.4.2 Border crossing measures
The border crossing operation and effectivity measures include:
1. Indicators of time on a border: information concerning the average, maximum and minimum (waiting and procedural) times required for the completion of all transactions for imports and exports individually (and not the maximum time stipulated by customs codes or other laws), disaggregated to various procedural steps on peak and off-peak periods.
2. Indicators of facilitation: this information could be provided only from the BCPs concerning the working conditions and performance of administration staff. Also, the user’s opinion (operators, importers, exporters, commercial chambers) should be taken into consideration, in order to identify the level of satisfaction of the private sector concerning transactions with customs and the experience of using the various BCPs.
3. Indicators of procedures: provision of the estimated number of commercial vehicles cleared in less than the threshold of 15 or 30 minutes. According to UNECE, the TTFSE method, requires as input for the evaluation of performance indicators the number of commercial vehicles that complete import clearance (time between entry into the terminal and departure after release of goods) in less than 15 minutes compared to the total number of import clearances. Description, by the BCPs authorities, and observation, during the check, of all the steps for passengers and commercial vehicles/ trains since their arrival at the station until their departure, in both directions (entering and exiting the country). Description, by the BCPs Authorities, of the tools (techniques and technologies) used step by step for all the necessary checks and transactions. Also, according to the World Bank, another crucial element for the performance of the BCPs (used for each country’s ranking in the “Doing Business” annual report) is the number of documents required by the Customs for importing and exporting goods, and therefore such a request was addressed to the National Customs Agencies as well.
4. Indicators of effectiveness: information concerning its performance and achievement of target collections. This could also include the number of mandatory technical wagon checks at border crossing points as well as other requirements like the number of two loco drivers, buffer wagons or police controls.
14 Comprehensive analysis of the existing cross-border rail transport connections and missing links on the internal EU borders, Final report 2018

49/158
The existing gaps and needs were discussed at the Management Board meeting in October 2019. The received feedbacks on freight rail connection and traffic clearly identified issues between Hungary and Romania due to the problem of Schengen/Non-Schengen border crossing.
On the basis of the comprehensive analysis, the hampering factors for a smooth transit at cross borders were identified; the are caused by different actors in the process: some issues relate to IMs, others to RUs or other stakeholders (e.g. police/interior affairs, national authority etc.).
The main problems at the borders directly connect with non-harmonized policies between countries, lack of suitable IT-solutions and available facilities. A detailed analysis of bottlenecks and capacity improvements will be necessary and separately conducted in 2020.
Summarising the most common barriers in freight rail transport to cross-border will remain in the medium term and they could be classified under the following categories:
1. Administrative and legal: different authorisation, concession and procurement rules in Member States which are applied to facilities;
2. Political: non-aligned policy priorities; 3. Technical: implementation of harmonised technical rules still lacking, leading to different
standards applicable to rail lines and rolling stock; 4. Operational: heterogeneous procedures at borders, languages barriers, different national
rules, different regime of border authorities;
This lack of interoperability leads to detrimental effects on an operational level:
1. Waiting times at the border reduce commercial speed which lowers the attractiveness for customers and increases the operational cost for the railway companies;
2. Problems with reliability and punctuality due to frequent delays;
3. Additional cost for supplementary equipment: multi-system locomotives are 10-15% more expensive than single-system locomotives15F
15;
The main immediate and direct effect of interoperability in terms of border obstacles is the reduction of transit times since no change of locomotives is required and hence drivers do not need to switch. On the microeconomic side, the quantifiable impact consists of additional cost for the railway undertakings and consequently for the shippers and final customers.
Longer transit times increase the variable costs of railways, especially staff cost (about 10 % of total cost) and capital cost for rolling material (20-50 % of total cost). The cost per train-kilometer can be estimated at 6 EUR for regional passenger transport in GER and 10-20 EUR for container block trains in AT/GER16F
16.
One of the options for easing the border obstacles caused by different national railway systems is the accelerated implementation of EU legislation on harmonized standards and harmonized homologation procedures (in particular TSI, ETCS) as well as the corridor approach.
The implementation of measures requires coordination between the countries along the rail corridors since the required measures are usually interconnected closely, be it the introduction of common standards or infrastructure upgrading measures on either side of the border. Clear incentives are needed to overcome the sometimes low inclination of national railway infrastructure managers to invest in the upgrade of cross-border links.
A real gap-analysis on border crossing should be carried in detail against above-mentioned common difficulties on a political level.
15 p. 20.in: GYSEV et al., (2013), – South East Transport Axis - Report on development potentials and obstacles based on the assessment of
organizational and technical constraints, Version 0.1., 10.01.2013, www.southeast-europe.net/document.cmt?id=686 16 See Landesnahverkehrsgesellschaft Niedersachsen – official website, SPNV Finanzierung, Kostenzusammensetzung:
http://www.lnvg.de/spnv/finanzierung-spnv/kostenzusammensetzung-imspnv/?L=0, and: Hagenlocher, St. - Wittenbrink, P. (2015);

50/158
2.4.3 Trusted handover – ATTI
One possibility to mitigate the above-mentioned challenges is the implementation of the trusted handover procedure ATTI - Agreement on freight Train Transfer Inspections. ATTI is implemented between 2 or more RUs. It serves the aim of handing over the trains in trust –meaning that if such an agreement is in place no further technical checks should be done at the border. Nevertheless, some countries reserve the right to examine also trains running under this regime 17F
17.Trusted
handover is an important measure to increase the smooth transit at cross borders. Therefore this business solution should be promoted more intensively along the corridor. Support from the related National Safety Authority is also important in this regard.
2.4. Proposed Terminals and Ports
The following major ports within the corridor area are proposed to be included in the corridor (pending approval):
17 Description taken from official ATTI document dated 2017-08-29
ATTI ATTI is a way of ensuring interoperability in the rail freight sector. The ATTI agreement lays down rules for the transfer of freight trains between participating RUs; these are based on the GCU (General Contract of Use for Wagons). In order to facilitate international freight transport, the participating RUs undertake to comply with the agreement, including its appendices. The purpose of ATTI is to accelerate international freight traffic between ATTI RUs, and to harmonise and continuously improve the associated rules in order to enable better forward planning and increase the quality and safety of ATTI trains. Any RU can become a signatory to ATTI (UIC membership is not a prerequisite). ATTI is managed by UIC and has its own Extranet workspace. ATTI's core tasks include:
• enhancing the Agreement on freight Train Transfer Inspections, • running the shared quality management system • ensuring traceability in the ATTI quality database.
The work items determined by the ATTI General Assembly are carried out by an elected Executive Committee. Advantages of participating in ATTI:
• Agreement is a single, harmonised text • Single quality management system • All quality indicators are documented in the ATTI quality database • ATTI quality database can be used for RUs' own quality documentation • Improved forward-planning for new trains between ATTI RUs • Simplified procedure for the inclusion of trains in the agreement using ATTI
quality database indicators (where quality indicators from partners RUs are known and good enough)
• Acceptance sampling and transfer inspection at the handover location replaced by quality spot-checks
• Some 100 RUs are currently ATTI signatories.

51/158
Figure 22: General overview of available ports along the railway network corridor

52/158
There are 21 core ports along the RFC 9 RHD (see on the map above). The following table provides an overview an all terminals, yards and container depots (including all objects which 10-15 km from the RFC 9 RHD corridor) identified18F
18 for inclusion for the RFC 9 RHD (pending approval).
Country NUTS 2 City Name Access to19F
19: Multi-modal Terminal
Yard20F
20 Depot21F
21 Bulk Combined traffic IWW Rail Road
France Grand Est Strasburg Contargo SARL (Nord) X X X
X X
Grand Est Strasburg Contargo SARL (Süd) X X
Germany Karlsruhe Karlsruhe Contargo Karlsruhe Rheinhafen X x X X
Freiburg Kehl Klumpp + Müller GmbH & Co. KG X X X X
Freiburg Kehl ETK Euro Terminal Kehl GmbH X X X X
Karlsruhe Karlsruhe DUSS-Terminal Karlsruhe by DB X X X X* X
Karlsruhe Karlsruhe Fruchtcargo Container-Depot Wörth X X*
Karlsruhe Karlsruhe Container Yard Speyer Contargo X X
Karlsruhe Karlsruhe Contargo Wörth X X* X* X*
Karlsruhe Mannheim DP World Germersheim X X* X* X
Karlsruhe Mannheim DUSS-Terminal Mannheim-Handelshafen X X X X X* X
Karlsruhe Mannheim RoRo-Terminal Mannheim X* X* X* X*
Karlsruhe Mannheim Kobler Container Depot X X X X
Karlsruhe Mannheim Contargo Rhein-Neckar Mannheim X X X X
Karlsruhe Ludwigshafen Kombi-Terminal Ludwigshafen KTL X X X X* X
Karlsruhe Mannheim Mannheimer Tankwagenreinigung Container Depot X X X X*
Karlsruhe Mannheim Cotac Depot Mannheim X X X* X*
Karlsruhe Mannheim Terminal Worms, Rhenania Worms AG X X X*
Karlsruhe Mannheim Hempt Container-Depot Worms X X X
18 The terminals and yards are predefined and has to be approved by MaBo and ExBo 19 The identified transport modes within the RFC 9 which could connect directly with the terminal or pass it within an area of 10 - 15 km. 20 Provides storages for empty containers. 21 Warehousing facilities for LcL and consolidation of freight.

53/158
Country NUTS 2 City Name Access to19F
19: Multi-modal Terminal
Yard20F
20 Depot21F
21 Bulk Combined traffic IWW Rail Road
Karlsruhe GUT Gernsheimer Umschlags-und Terminalbetriebsgesellschaft mbH & Co. KG
X X* X X
Darmstadt Frankfurt am Main DUSS-Terminal Frankfurt/Main-Ost X X X* X
Darmstadt Frankfurt am Main Trimodal Container terminal Aschaffenburg -TCA X X X X X
Darmstadt Frankfurt am Main Contargo Rhein-Main GmbH, Contargo Frankfurt-Ost X X X X X
Darmstadt Frankfurt am Main Contargo Industriepark Frankfurt-Höchst GmbH X X* X* X
Rheinhessen-Pfalz Mainz Frankenbach Container Terminals GmbH X X* X
Schwaben Nurnberg TriCon Container Terminal Nürnberg X X X X X
Schwaben Nurnberg DB Cargo AG X X X* X*
Schwaben Nurnberg CDN Container Depot Nürnberg GmbH X X X* X*
Stuttgart
Stuttgart
DUSS-Terminal Stuttgart Hafen X X X X
Stuttgart SCT Stuttgarter Container Terminal GmbH X X X*
Stuttgart Kornwestweim (Stuttgart region) DUSS-Terminal Kornwestheim X X* X
Schwaben Augsburg DUSS-Terminal Augsburg-Oberhausen X X X X
Schwaben Augsburg Kloiber Container Depot Augsburg X X X X*
Tübingen Ulm DUSS-Terminal Ulm X X X X X X
Oberbayern München CDM Container Depot München GmbH & Co. Service KG X X X X
Oberbayern München DUSS-Terminal München-Riem X X X X
Oberbayern München Parsdorfer Tankwagenreinigung Container Depot X X X*
Oberpfalz Regensburg Not applicable X X X
Austria Upper Austria Wels Wels Vbf CCT/ROLA, ÖBB-Infrastruktur AG X X X X
Upper Austria Linz LINZ AG für Energie, Telekommunikation, Verkehr und Kommunale Dienste
X X X X X X
Upper Austria Linz (Mauthausen) Container Terminal Enns GmbH X X X X X X

54/158
Country NUTS 2 City Name Access to19F
19: Multi-modal Terminal
Yard20F
20 Depot21F
21 Bulk Combined traffic IWW Rail Road
Upper Austria Linz (Ybbs der Donau) Ybbs by Schaufler GmbH X X X* X
Upper Austria Linz (St. Pölten)
St. Pölten Alpenbahnhof CCT by Johann Dorner GmbH X X X*
Salzburg Salzburg CTS Container Terminal Salzburg GmbH X X X X X
Salzburg Salzburg Salzburg Hbf RoLa,
ÖBB-Infrastruktur AG X X X* X
Vienna Vienna Wiencont Container Terminal GmbH X X X X X X
Vienna Vienna Terminal Wien Inzersdorf -Süd, ÖBB Infrastruktur AG X X X* X X
Vienna Vienna Terminal Wiener Neudorf by CONTAINEX Container Handelsgesellschaft m.b.H.
X X X* X X
Czech Republic Jihozápad Plzeň PCP Intermodal Logistics s.r.o. X X X* X
Jihozápad Nýřany Terminal Plzeň - Nýřany by METRANS, a.s. X X X X
Praha Praha Terminal Praha - Uhříněves by METRANS, a.s. X X X X
Severovýchod Pardubice Terminal Pardubice – České přístavy, a.s. X X X* X* X X
Severovýchod Pardubice Rail Hub - Terminal Česká Třebová, METRANS, a.s. X X X
Jihovýchod Brno Terminal Brno, a.s. X X X
Střední Morava Přerov Rail Cargo Operator - CSKD s.r.o. X X X
Střední Morava Zlín Terminal Zlín - Želechovice/Lípa, METRANS, a.s. X X X X
Moravskoslezsko Kopřivnice Terminál Argo Bohemia Kopřivnice X X X X X
Moravskoslezsko Ostrava Terminál Ostrava-Šenov, METRANS X X X* X
Moravskoslezsko Ostrava Ostrava-Paskov terminal (PKP X X X X X
Slovakia Stredné Slovensko Zilina Intermodal Transport Terminal Žilina -ITT ZA X X X X
Stredné Slovensko Zilina Rail Cargo Operator - CSKD s.r.o. (2 Terminals) X X X
Východné Slovensko Košice CSKD Terminal Košice, CSKD Intrans s.r.o. X X X X X
Východné Slovensko Dobra TransContainer Slovakia, a.s., TKD Dobra X X X X* X

55/158
Country NUTS 2 City Name Access to19F
19: Multi-modal Terminal
Yard20F
20 Depot21F
21 Bulk Combined traffic IWW Rail Road
Bratislavský kraj Bratislava Bratislava Palenisko by Slovenská plavba a prístavy (SPaP) a.s. X X X X X
Bratislavský kraj Bratislava UKV Terminal Bratislava ÚNS X X X X* X
Bratislavský kraj Bratislava Dunajská Streda by Metrans (Danubia) a.s. X X X* X
Západné Slovensko Komarno Komárno by SPaP a.s. (Slovak Shipping and Ports JSC) X X X X* X
Hungary Western Transdanubia Győr (Győr-Moson-Sopron)
Terminal ÁTI Győr by ÁTI DEPO ZRt. X X X X* X*
Western Transdanubia Sopron Sopron container terminal by GYSEV CARGO Zrt. X X X X X X
Budapest Budapest Metrans Terminal Budapest by METRANS, a.s. X X X X* X*
Budapest Budapest Mahart Container Center X X X X X X
Budapest Budapest Törökbálint Container Terminal by IntegRail Ltd. X X X X X
Budapest Budapest Rail Cargo Terminal BILK Budapest by BILK Kombiterminal Co. Ltd. X X X X X X
Southern Great Plain (Dél-Alföld) Baja Ro-Ro Terminal Baja X X*
Southern Great Plain (Dél-Alföld) Szeged (Csongrád) MÁV Kombiterminál Szeged by
MÁV Kombiterminál Kft. X X X
Northern Great Plain (Észak- Alföld)
Szolnok (Jász-Nagykun-Szolnok) MÁV Kombiterminál Szolnok X X X
Romania Vest Timisoara (Arad county) Semenic, CFR Marfa S.A. X X X* X*
Vest Curtici (Arad county) Railport Arad Terminal by Railport Arad S.r.l. X X* X* X*
Nord-Vest Sibiu Sibiu by CFR Marfa S.A. X X* X*
Nord-Vest Turnu Turda by Rofersped S.A. x X X* X*
Nord-Vest Vidin Not applicable X X
Centru Brasov Brasov by Rofersped S.A. X X*
Sud-Vest Oltenia Craiova (Doli) Craiova by CFR Marfa S.A. X X X* X*
București-Ilfov București, Ilfov Bucureşti Noi by SNTFM “CFR Marfă” SA X X X X X*
București-Ilfov București, Ilfov Bucharest Intermodal Terminal by Yusen Logistics Co., Ltd. X X X X* X*

56/158
Country NUTS 2 City Name Access to19F
19: Multi-modal Terminal
Yard20F
20 Depot21F
21 Bulk Combined traffic IWW Rail Road
București-Ilfov București, Ilfov Bucuresti Sud by Rocombi SA X X X X* X
Sud-Est Galati Galaţi Marfuri by CFR Marfa S.A. X X* X
Sud-Est Cernawoda Not applicable
Sud-Est Constanta Container Terminal SOCEP (2) X X*
Sud-Est Constanta DP World Constanta X X X X X X
Sud-Est Constanta APM Terminals Romania X X X X* X
Sud-Est Constanta UMEX Terminal Constanta X X X X X
Table 7: List of multimodal terminals, yards and depots along the RFC 9 RHD area
* no direct information available all highlighted information means access to RFC 9 RHD ports.

57/158
3. GENERAL SOCIO-ECONOMIC DEVELOPMENT ON THE CORRIDOR
3.1 Introduction
This section of the report covers socio-economic, political and technological developments that are relevant for the market potential of RFC 9 RHD.
The demand for freight transport generally depends on the demand for the transport of physical goods. It tends to be strongly correlated to macro-economic indicators such as GDP growth. A growing economy is usually associated with higher levels of production and consumption, increasing both local and longer-distance transport demand. For longer-distance transport, which is more relevant for rail freight transport than local transport, transport demand might, however, not always be generated by a local increase in economic output or demand for goods. Instead, external developments may be crucial. For instance, an increase in trade between major economies such as China and Germany are likely to increase freight transport in those countries that are located along the corresponding trade routes.
Focusing on freight rail transport, specific types of economic sectors are more relevant, such as mining, metallurgy, chemical industries, forestry, and petroleum refineries. Their products tend to have a higher propensity of being transported by rail, compared to other good groups, which tend to be transported by trucks, for instance due to constrained delivery windows or perishability (e.g., food products).
Mode choice decisions are usually determined by differentials in the so-called generalized costs of transport between transport modes. The generalized costs of transport do not only include the monetary costs of transporting a good on a specific transport mode (or combination of transport modes), but also include other components, which can be monetarized for better comparison (e.g., De Jong et al., 2014; Halse et al., 2010). The most relevant ones are listed here:
- Price: what is the overall price for the transport service?
- Door-to-door travel times: what is the expected time that it takes for the freight to get from its origin to the planned destination?
- Reliability/punctuality: how reliable and punctual is the provided service?
- Service provision: how time-consuming is it to book the service (e.g. does it require negotiations, multiple booking processes?)
- Flexibility: how flexible is the service provision (e.g. can the booked service still be changed at short notice?)
The extent to which these variables influence a specific mode choice decision varies widely. Some variables that exert an influence are customer requirements, product characteristics, and organizational aspects (including path-dependencies and (the self-perception of) the decision-maker) (e.g., Jeffs & Hills, 1990). Governmental and policy aspects (e.g. environmental issues) may also be considered. However, unless they have been translated into regulations or other types of policy instruments (e.g. tolls), they tend to be ignored in the decision-making process. This is often referred to as a lack of internalization of the external costs (air pollution, noise, accidents, etc.) that arise to society but are not considered by decision makers.

58/158
3.2 Country overviews
3.2.1 France
France has a population of 65 million (WPR, 2019). The corridor’s Western starting point is Strasbourg, which is in the region Alsace at the border towards Germany and has a population of 274,000; it is France’s 7th largest city in terms of the number of inhabitants. According to the human development index, which is a compound measure of life expectancy, education level, and standard of living, France ranks 24th country worldwide (UNDP, 2017). The industrial sector accounts for 19.5% of France’s GDP (78.8% services and 1.7% agriculture) (CIA Factbook). Strasbourg is an important transport hub, and manufacturing as well as engineering are important parts of the local economy. Strasbourg’s port is the second-largest port along the Rhine river (after Duisburg, Germany). As the following figure (data availability constrained to 2015-2017) shows, the region of Alsace performs only somewhat lower than the national average.
Figure 23: France: GDP/capita (in ‘000 EUR, Source: Eurostat)
A fairly high share of French trade takes place with countries outside the European Union, in terms of exports (more than 40%). Trade with Asia amounts to roughly one tenth of imports as well as exports, with slight increases between 2013 and 2017.
Figure 24: France: import statistics 2017 (in % of overall imports, Source: Eurostat)
Figure 25: France: export statistics 2017 (in % of overall exports, Source: Eurostat)

59/158
The below figures show that French imports and exports have grown mostly 2016-2017, whereas they stayed stable in the years before (except for an increase in exports from 2014-2015). Likely due to the tendency for the average value of goods to increase and services becoming more dominant, transport volumes on the road have declined between 2010 and 2016 despite stable imports and exports. Only 2016-2017, an increase in freight transported on the road (measured in ton km) becomes evident again. While overall freight transport via rail remains stable at very low level, container transport via rail has increased steadily between 2010 and 2017. Given the low level of freight transported via rail, the investments in the rail sector, which have been close to those for the road sector in recent years, seem relatively high. However, it should be noted that these investments do not differentiate between infrastructure oriented towards freight vs. passengers.
Figure 26: France: imports and exports 2013-2017 (in MIO EUR, Source: Eurostat)
Figure 27: France: freight transport development (in MIO TKM, Source OECD)
Figure 28: France: container transports for rail and sea (in Thousand Tons, Source: OECD)
Figure 29: France: infrastructure investments (in Billion EUR, Source: OECD)
The following figure shows that a large share of goods transported via rail in France have not been classified, and that the amount of unclassified goods has strongly increased between 2012 and 2017. Among those goods that have been registered according to the available categories, metal products, agriculture & forestry, and chemical products exhibit the highest ton km transported via rail. However, Figure 31 shows that even in these categories in which rail transport plays a big role, the corresponding ton km tend to be even higher for road transport (with the exception of unidentified goods).

60/158
Figure 30: France: Types of goods transported by rail in 2012 and 2017 (in TKM, Source: Eurostat)
Figure 31: France: Types of goods transported by road and rail in 2017 (in TKM, Source: Eurostat)
3.2.2 Germany
With 83.5 million inhabitants (WPR, 2019), the Federal Republic of Germany is the country with the highest population that the RFC 9 RHD passes through. The corridor goes, among others, through Munich (3rd largest city), Frankfurt (5th largest city), and Stuttgart (6th largest city) (WPR, 2019).
Germany is also the most highly developed country (5th worldwide) among those located along the corridor according to the human development indicator (HDI), which is a compound measure of life expectancy, education level, and standard of living (UNDP, 2017).
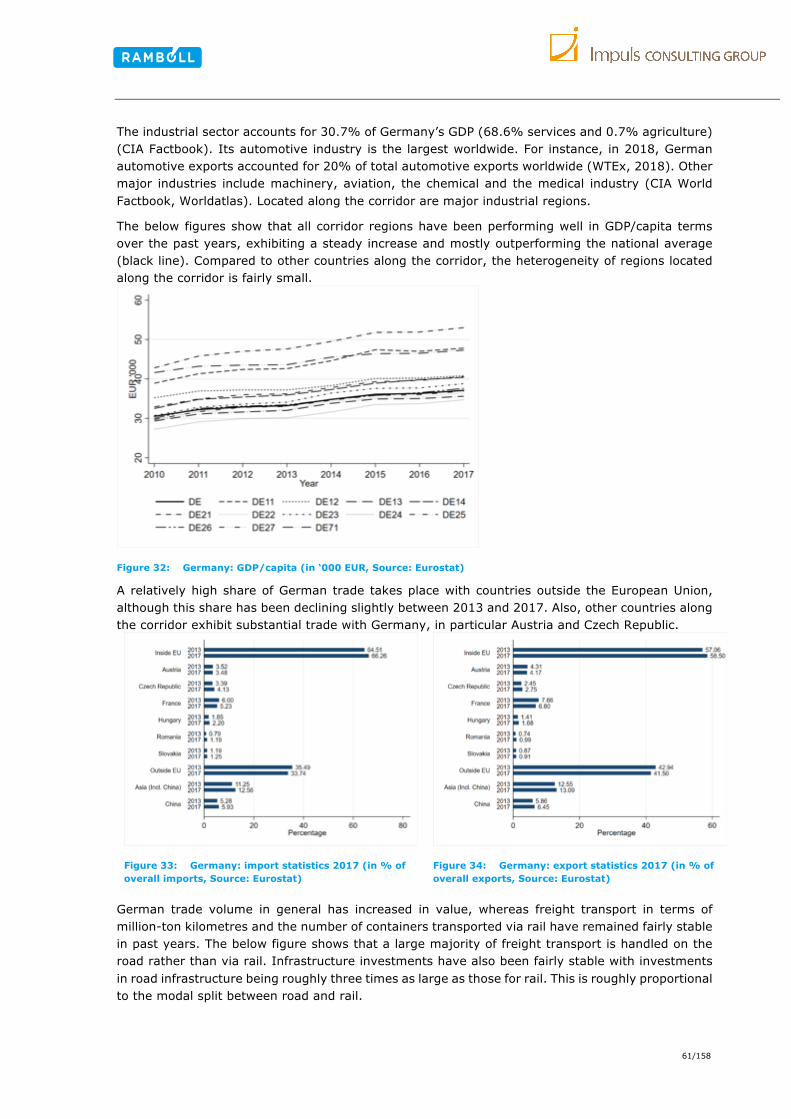
61/158
The industrial sector accounts for 30.7% of Germany’s GDP (68.6% services and 0.7% agriculture) (CIA Factbook). Its automotive industry is the largest worldwide. For instance, in 2018, German automotive exports accounted for 20% of total automotive exports worldwide (WTEx, 2018). Other major industries include machinery, aviation, the chemical and the medical industry (CIA World Factbook, Worldatlas). Located along the corridor are major industrial regions.
The below figures show that all corridor regions have been performing well in GDP/capita terms over the past years, exhibiting a steady increase and mostly outperforming the national average (black line). Compared to other countries along the corridor, the heterogeneity of regions located along the corridor is fairly small.
Figure 32: Germany: GDP/capita (in ‘000 EUR, Source: Eurostat)
A relatively high share of German trade takes place with countries outside the European Union, although this share has been declining slightly between 2013 and 2017. Also, other countries along the corridor exhibit substantial trade with Germany, in particular Austria and Czech Republic.
Figure 33: Germany: import statistics 2017 (in % of overall imports, Source: Eurostat)
Figure 34: Germany: export statistics 2017 (in % of overall exports, Source: Eurostat)
German trade volume in general has increased in value, whereas freight transport in terms of million-ton kilometres and the number of containers transported via rail have remained fairly stable in past years. The below figure shows that a large majority of freight transport is handled on the road rather than via rail. Infrastructure investments have also been fairly stable with investments in road infrastructure being roughly three times as large as those for rail. This is roughly proportional to the modal split between road and rail.
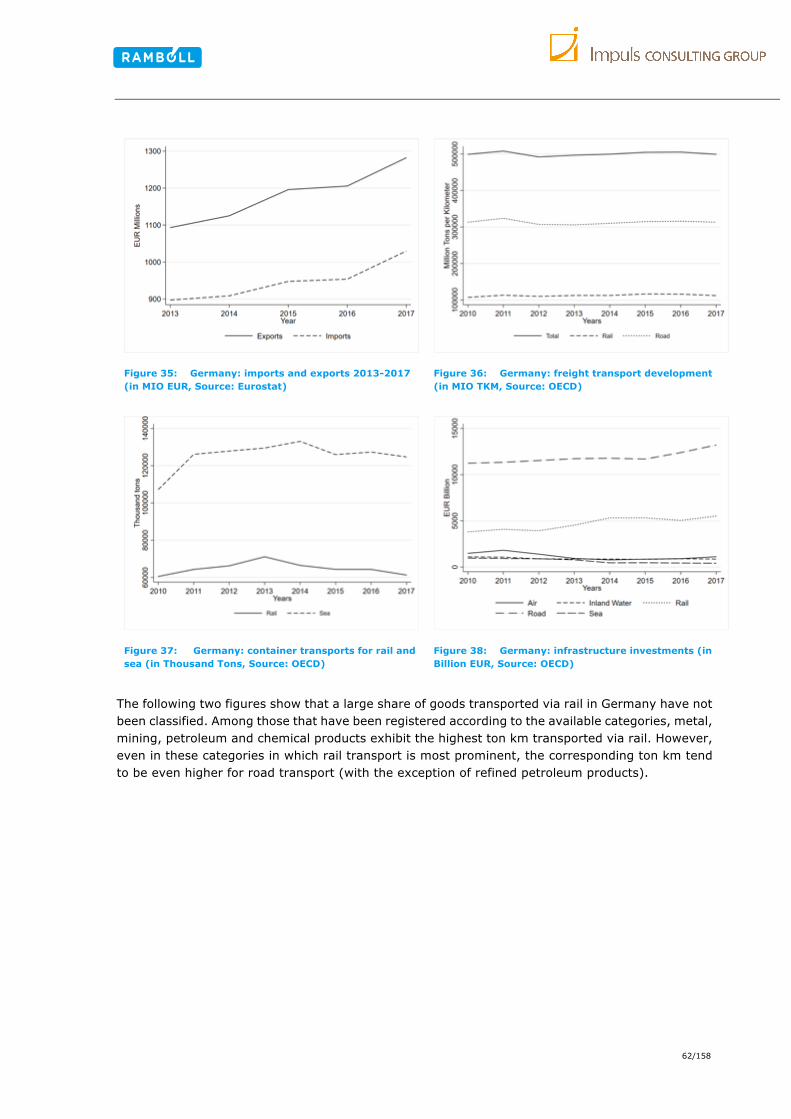
62/158
Figure 35: Germany: imports and exports 2013-2017 (in MIO EUR, Source: Eurostat)
Figure 36: Germany: freight transport development (in MIO TKM, Source: OECD)
Figure 37: Germany: container transports for rail and sea (in Thousand Tons, Source: OECD)
Figure 38: Germany: infrastructure investments (in Billion EUR, Source: OECD)
The following two figures show that a large share of goods transported via rail in Germany have not been classified. Among those that have been registered according to the available categories, metal, mining, petroleum and chemical products exhibit the highest ton km transported via rail. However, even in these categories in which rail transport is most prominent, the corresponding ton km tend to be even higher for road transport (with the exception of refined petroleum products).

63/158
Figure 39: Germany: Types of goods transported by rail in 2012 and 2017 (in TKM, Source: Eurostat)
Figure 40: Germany: Types of goods transported by road and rail in 2017 (in TKM, Source: Eurostat)
3.2.3 Austria
Austria, a landlocked country with capital city Vienna, has 8.96 million inhabitants (WPR, 2019). The RFC 9 RHD corridor passes, among others, through the capital and by-far-largest city Vienna (1.69 million inhabitants) as well as the 3rd largest city Linz (205.000 inhabitants) and the 4th largest city Salzburg (153.000 inhabitants) (WPR, 2019). According to the human development ranking, Austria ranks 20th country worldwide (UNDP, 2017).
The industrial sector accounts for 28.4% of the Austrian GDP (70.3% services and 1.3% agriculture). The most significant industries in Austria include construction and building, electronics and electrics, food processing, logistics and transportation, automotive and chemical industries, as well as steel and mechanical engineering (CIA World Factbook, Worldatlas).

64/158
The following figure shows that all regions adjacent to the corridor have developed positively over the past years in terms of GDP/capita. The dispersion in levels across regions is fairly high, with Vienna ranking highest during most years but being overtaken by Salzburg in 2017, and Burgenland ranking lowest.
Figure 41: Austria: GDP/capita (in ‘000 EUR, Source: Eurostat)
Austria’s trading patterns have remained fairly stable over the past years. Austria’s main trading partner is Germany, accounting for more than 38% of imports and more than 28% of exports. Imports and exports from and to Asia constitute around 9% and 6%, respectively.
Figure 42: Austria: import statistics 2017 (in % of overall imports, Source: Eurostat)
Figure 43: Austria: export statistics 2017 (in % of overall exports, Source: Eurostat)
The below figures show that the Austrian trade volume has increased substantially in past years, which is also reflected by an increase in transport volume for both road and rail transport. The modal split for rail freight transport is higher than for road transport. Both have increased somewhat over past years, with the modal split staying roughly stable. Infrastructure investments mirror the higher modal share of rail freight transport; they are roughly three times as large for rail than for road. Generally, over the past years investments in rail have decreased and those in road have increased.

65/158
Figure 44: Austria: imports and exports 2013-2017 (in MIO EUR, Source: Eurostat)
Figure 45: Austria: freight transport development (in MIO TKM, Source OECD)
Figure 46: Austria: container transports for rail and sea (in Thousand Tons, Source: OECD)
Figure 47: Austria: infrastructure investments (in Billion EUR, Source: OECD)
The following two figures show that similarly to Germany, also in Austria a large share of goods transported via rail has not been classified (the amount of unclassified goods being transported via rail has moreover doubled between 2012 and 2017). Among those that have been registered according to the available categories, metal, mining, agricultural, petroleum and forestry products exhibit the highest ton km transported via rail. However, even in these categories in which rail transport is most prominent, the corresponding ton km are mostly higher for road transport. Exceptions are metal products and refined petroleum products.

66/158
Figure 48: Austria: Types of goods transported by rail in 2012 and 2017 (in TKM, Source: Eurostat)
Figure 49: Austria: Types of goods transported by road and rail in 2017 (in TKM, Source: Eurostat)
3.2.4 Czech Republic
The Czech Republic is a landlocked country with capital city Praha. In 2019, it has 10.7 million inhabitants (WPR, 2019). The corridor passes through Praha but not through the second largest city Brno. It does pass the 3rd (Ostrava), 4th (Plzeň), and 5th largest city (Olomouc) though (WPR, 2019). According to the human development ranking, the Czech Republic ranks 27th country worldwide (UNDP, 2017).
The industrial production sector accounts for 36.9% of the Czech economy (60.8% services and 2.3% agriculture). More than 40% of the employed population works in the industrial production sector. Among the main industries are engineering, mining, chemistry, food production, energy, and consumer industry (CIA World Factbook, Worldatlas).

67/158
The automotive industry accounts for a large part of the engineering industry, making the Czech Republic is the 11th largest car exporter worldwide (WTEx, 2018). The mining industry, which provides inputs to the engineering industry (in particular black coal and limestone), is mainly concentrated around Ostrava. The RFC 9 RHD corridor is foreseen to pass through this region.
The following figure shows that all Czech regions located along the corridor have had positive GDP/capita growth rates in the past years. It, however, also shows provides an impressive indication of the dominant role of the region comprising the capital city Praha. Its GDP/capita outperforms the country average by more than 100%. All other regions along the corridor are below the country average.
Figure 50: Czech Republic: GDP/capita (in ‘000 EUR, Source: Eurostat)
Germany is the Czech Republic’s main trading partner, both in term of imports and exports, although its role in terms of relative shares has decreased slightly between 2013 and 2017. Asia’s role in terms of exports is minor (2.3% in 2017). Imports from Asia, in contrast, have accounted for 8.2% of imports in 2017.
Figure 51: Czech Republic: import statistics 2017 (in % of overall imports, Source: Eurostat)
Figure 52: Czech Republic: export statistics 2017 (in % of overall exports, Source: Eurostat)
Czech trade volume has increased substantially over the past years. Freight transport, in contrast, has been constant up till 2015 but has decreased after. Container transport via rail has increased gradually, except for 2016-2017. For a short period of time (2015), infrastructure investments in

68/158
rail have been higher than those for roads. Before and after that period, the pattern has been reversed. Nevertheless, given that the modal split of rail is substantially lower than that of road, the investments in rail are relatively high.
Figure 53: Czech Republic: imports and exports 2013-2017 (in MIO EUR, Source: Eurostat)
Figure 54: Czech Republic: freight transport development (in MIO TKM, Source OECD)
Figure 55: Czech Republic: container transports for rail and sea (in Thousand Tons, Source: OECD)
Figure 56: Czech Republic: infrastructure investments (in Billion EUR, Source: OECD)
The following two figures show that petroleum, agricultural, forestry and metal products exhibit the highest ton km transported via rail, together with “unidentified” and “grouped” goods. However, with the exception of few categories (“coal, petroleum, natural gas”, “unidentified goods”, “coke, refined petroleum products”), the corresponding ton km are still higher for road transport. Between 2012 and 2017, the share of goods attributed to “coal, petroleum, natural gas” has decreased substantially, and those attributed to “grouped goods” have increased.

69/158
Figure 57: Czech Republic: Types of goods transported by rail in 2012 and 2017 (in TKM, Source: Eurostat)
Figure 58: Czech Republic: Types of goods transported by road and rail in 2017 (in TKM, Source: Eurostat)
3.2.5 Slovakia
Slovakia is a landlocked country with 5.46 million inhabitants (WPR, 2019). The RFC 9 RHD corridor goes through its capital (and largest) city Bratislava (423.000 inhabitants) as well as through the 2nd largest city Košice (237.000 inhabitants) (WPR, 2019). According to the human development index, Slovakia ranks 38th country worldwide (UNDP, 2017).
The industrial production sector accounts for 35.0% of the Slovakian GDP (61.2% services and 3.8% agriculture). Slovakia has attracted substantial foreign direct investment (FDI) in past years, partially due to its skilled, but fairly low-wage labour force, and its central geographic location. Its main industries include automobile production (e.g. Volkswagen in Bratislava, Kia Motors in Zilina, PSA Peugeot in Trnava and Jaguar-Land Rover in Nitra), metal products, energy production (electricity, gas, coke, oil, nuclear), chemical products, wood and paper-based products, machinery,

70/158
textiles, electrical products as well as food and pharmaceutical products. 44% of all industry exports are due to the automotive industry. (CIA World Factbook, Worldatlas).
GDP/capita has increased slightly in the regions located along the rail corridor. Also, for Slovakia, we find that the capital city, Bratislava, strongly outperforms the remaining regions.
Figure 59: Slovakia: GDP/capita (in ‘000 EUR, Source: Eurostat)
Slovakia’s main trading partners among the countries located along the corridor are Germany, Czech Republic (especially in terms of imports), and to a somewhat lesser extent Austria and Hungary. Its trade with countries outside the EU has decreased from 2013 to 2017 in relative terms, for both imports and exports. The share of imports from Asia is fairly high (above 11%), whereas the export share to Asia amounts to only 2.1% in 2017.
Figure 60: Slovakia: import statistics 2017 (in % of overall imports, Source: Eurostat)
Figure 61: Slovakia: export statistics 2017 (in % of overall exports, Source: Eurostat)
Overall, the trade volume has increased substantially in past years, with imports growing faster than exports. This has led to increases in freight transport and a pronounced increase in container transport via rail, both of which however have slowed down since 2016. The modal split is clearly dominated by road transport, which also showed substantial increases up till 2016, whereas rail transport has remained fairly stable at a low level. Infrastructure investments have increased substantially for the road sector and has declined slightly for the rail sector. This has led to road infrastructure investments being roughly triple the size of rail infrastructure investments in recent years, while they were quite close in size up till 2013.

71/158
Figure 62: Slovakia: imports and exports 2013-2017 (in MIO EUR, Source: Eurostat)
Figure 63: Slovakia: freight transport development (in MIO TKM, Source OECD)
Figure 64: Slovakia: container transports for rail and sea (in Thousand Tons, Source: OECD)
Figure 65: Slovakia: infrastructure investments (in Billion EUR, Source: OECD)
The following two figures show that metal ores and products, mining products, coke and petroleum products exhibit the highest ton km transported via rail. For most of these goods, rail has also the higher modal share when compared to road (exception: “basic metals, metal products”). Since 2012, rail transport of goods classified as “other goods” has more than doubled, whereas a substantial decrease can be observed in the rail transport of goods classified as “coal, petroleum, natural gas”.

72/158
Figure 66: Slovakia: Types of goods transported by rail in 2012 and 2017 (in TKM, Source: Eurostat)
Figure 67: Slovakia: Types of goods transported by road and rail in 2017 (in TKM, Source: Eurostat)
3.2.6 Hungary
Hungary is a landlocked country with 9.68 million inhabitants (WPR, 2019). The RFC goes through the capital, and largest Hungarian city, Budapest (1.7 million inhabitants). All further cities are considerably smaller. The next largest city passed by the corridor is Győr (128.000 inhabitants) (WPR, 2019). According to the human development index, Hungary ranks 45th country worldwide (UNDP, 2017).
The industrial production sector accounts for 31.3% of Hungarian GDP (64.8% services and 3.9% agriculture). Its main industries include mining, metallurgy, construction, foods, textiles, chemicals, electronics, and automotive (e.g. Audi in Győr). (CIA World Factbook, Worldatlas).

73/158
The regions located along the corridor have all exhibited positive GDP/capita growth over the past years, although growth rates have slowed down since 2015. Budapest (HU10) clearly outperforms the other regions, as indicated by the GPD/capita being more than double the size compared to the country average.
Figure 68: Hungary: GDP/capita (in ‘000 EUR, Source: Eurostat)
Hungary’s main trading partner among the countries located along the corridor is Germany (share of above 25% in imports and exports in 2017). A substantial share of trade also takes place with countries outside the EU, accounting for almost 24% in terms of exports and 19% of imports in 2017. As for most countries along the corridor, Asia has a substantially bigger role as trading partner in terms of imports than exports.
Figure 69: Hungary: import statistics 2017 (in % of overall imports, Source: Eurostat)
Figure 70: Hungary: export statistics 2017 (in % of overall exports, Source: Eurostat)
In recent years, the trade volume has increased substantially, inducing also more freight transport via road and to a lesser extent via rail. Container transport via rail fluctuates strongly across years, indicating a potential reporting issue. Rail transport is clearly lagging behind road transport, with the latter accounting for almost 4 times more ton km in 2017. This is mirrored by investments but not in a proportional way: investments in the road sector are more than two times as high as investments in the rail sector (in 2017).

74/158
Figure 71: Hungary: imports and exports 2013-2017 (in MIO EUR, Source: Eurostat)
Figure 72: Hungary: freight transport development (in MIO TKM, Source OECD)
Figure 73: Hungary: container transports for rail and sea (in Thousand Tons, Source: OECD)
Figure 74: Hungary: infrastructure investments (in Billion EUR, Source: OECD)
The following two figures show that metal ores and products, mining products, agricultural and forestry goods, chemical products as well as coke and petroleum products exhibit the highest ton km transported via rail. Only for some of these goods, however, rail has also the higher modal share when compared to road. These include metal ores and mining products as well as coke and refined petroleum products. Since 2012, in particular the rail transport of metal ores, mining products, agriculture and forestry has increased.

75/158
Figure 75: Hungary: Types of goods transported by rail in 2012 and 2017 (in TKM, Source: Eurostat)
Figure 76: Hungary: Types of goods transported by road and rail in 2017 (in TKM, Source: Eurostat)
3.2.7 Romania
Romania, which joined the EU in 2007, is the second most populous country (after Germany) along the RFC 9 RHD corridor, with a population of 19.3 million (WPR, 2019). It has access to the Black Sea, with Constanta being the largest port of the Black Sea. The capital and largest city is Bucharest with 1.8 million inhabitants. The corridor passes not only through Bucharest but also other major cities, including Timisoara (2nd largest), Constanta (5th largest), Craiova (6th largest) and Brasov (7th largest). According to the human development index, Romania ranks 52nd country worldwide (UNDP, 2017).
The industrial production sector accounts for 33.2% of Romanian GDP (62.6% services and 4.2% agriculture). Among the main sectors are chemical industries, automotive industries, metal processing, machine and tool manufacturing, industrial and transport equipment, manufactured

76/158
consumer goods (in particular textiles and footwear), lumbering and furniture, as well as mining. All sectors experienced substantial growth rates in the past years, in particular the industrial production sector and trade contributed to this growth. The country is now the 6th largest manufacturer of cars in Europe, including large plants in Mioveni (Dacia) and Craiova (Ford), with the latter being located along the corridor. (CIA World Factbook, Worldatlas).
All Romanian regions located along the corridor have shown positive growth rates (in annual GDP/capita) over the past years. The region around Bucharest has an economically dominant position, with annual GPD/capita being more than twice as high compared to the second-ranked region Vest (which includes Arad and Timis).
Figure 77 Romania: GDP/capita (in ‘000 EUR, Source: Eurostat)
Approximately one quarter of Romanian imports comes from outside the EU, with Asia amounting to slightly less than 9% of overall imports. In terms of exports, the role of Asia is much more limited, amounting to less than 3% in 2017. Among the countries located along the corridor, Germany is the main trading partner both in terms of imports as well as exports.
Figure 78: Romania: import statistics 2017 (in % of overall imports, Source: Eurostat)
Figure 79: Romania: export statistics 2017 (in % of overall exports, Source: Eurostat)
Trade volume has increased substantially over the past years in Romania, resulting also in an increase in freight transport overall. Container transport via rail has remained fairly stable since 2010 but is only half of the tonnage generated by container transport via water. The modal share of road is substantially higher than that of rail, and the gap has widened in recent years, with road transport increasing substantially, while rail transport remained fairly constant at a low level. This

77/158
modal split is mirrored by infrastructure investments, which are substantially higher for road than rail, however with a decreasing trend.
Figure 80: Romania: imports and exports 2013-2017 (in MIO EUR, Source: Eurostat)
Figure 81: Romania: freight transport development (in MIO TKM, Source OECD)
Figure 82: Romania: container transports for rail and sea (in Thousand Tons, Source: OECD)
Figure 83: Romania: infrastructure investments (in Billion EUR, Source: OECD)
The following two figures show that the goods most frequently transported via rail in Romania include petroleum products including coke and coal, agriculture and forestry goods, chemical and metal products. For petroleum products, the modal share of rail is higher than for road, whereas the opposite is true for the other good types. For coal and petroleum, we can observe a substantial reduction in transport via rail from 2012 to 2017, while the opposite is true for agriculture and forestry goods including wood and other paper products.

78/158
Figure 84: Romania: Types of goods transported by rail in 2012 and 2017 (in TKM, Source: Eurostat)
Figure 85: Romania: Types of goods transported by road and rail in 2017 (in TKM, Source: Eurostat)
3.3 Economic development
3.3.1 Macroeconomic development inside the corridor region
For most variables related to economic development, we see a gradient from the Western end of the corridor towards the Eastern end of the corridor, with regions located towards the East performing on average significantly worse. The following figures on the GDP per capita and its change between 2010 and 2017 illustrate this.

79/158
Figure 86: GDP per capita in purchasing power parity standards (2017, in EUR, Source: Eurostat)
Figure 87: GDP/capita change 2010-2017 (in %, Source: Eurostat)
Nevertheless, the above figure shows that there has been some convergence in GDP per capita over the past years. In particular, Romania has exhibited substantial growth in GDP/capita after the economic crisis of 2008/09, but also other regions with a strong industry sector such as the North of Czech Republic and the South of Hungary achieved considerable growth rates.
The below figures indicate that positive growth rates are expected to be present for all countries along the corridor also in forecasting time frame of 2018 to 2024. Convergence is expected to progress further as the lowest growth rates are predicted for the more advanced economies of Austria, France and Germany.
Figure 88: Past and predicted change in real GPD/capita (in %, Source: IMF)
Figure 89: Past and predicted real GDP/capita (in $, Source IMF)
The economic structure also shows an East-West gradient with the share of agriculture being higher in the more Eastern countries, while the opposite is true for the service sector. The industrial sector, which is most relevant for freight transport (rail transport in particular), tends to be higher in the Eastern countries.
(All in %) France Germany Austria Czechia Slovakia Hungary Romania
Agriculture 1.7 0.7 1.3 2.3 3.8 3.9 4.2
Industry 19.5 30.7 28.4 36.9 35.0 31.3 33.2
Services 78.8 68.6 70.3 60.8 61.2 64.8 62.6
Table 8: Sector statistics in terms of contribution to GDP (CIA World Factbook)

80/158
Investments in the industrial production sector (including both public and private investments) are still substantially higher in the Western part of the corridor (Southern Germany, Austria, Czech Republic). Some regions in the Eastern part of the corridor have, however, exhibited large growth rates in industry investments over past years (in particular the Western parts of Hungary and Slovakia as well as Central Romania).
Figure 90: Investment in the industrial production sector (in MIO EUR, Source: Eurostat)
Figure 91: Change in investments in the industrial production sector 2010- 2017 (in %, Source: Eurostat)
Another indicator of economic development are import and export statistics. The below figures focus on goods and exclude services, as the latter have less relevance for freight transport. They show that in almost all countries along the corridor imports as well as exports have increased between 2012 and 2017 and are expected to exhibit also positive growth rates in the forecasting time frame of 2018 to 2024.
Figure 92: Past and predicted annual changes in imports of goods (in %, Source: IMF)
Figure 93: Past and predicted annual changes in exports of goods (in %, Source: IMF)
3.3.2 Economic development outside the corridor region
The fact that the corridor represents part of a potential trade route between Asia and Europe warrants a closer look at the exports to Asia and imports from Asia. The following figures highlight the exceptional role of Germany, which clearly dominates both exports and imports. For exports, this is not only true in absolute terms but also in relative terms (share of overall exports that goes to Asia), where Germany has consistently exhibited figures above 10%, while most other countries (with the exception of Austria and France) are below 5%. Also, for imports, Germany tends to have the highest relative share (share of overall imports that originates from Asia), but closely followed by Slovakia and Hungary.

81/158
Exports to Asia and imports from Asia have been fairly stable for the past years in absolute terms, with the exception of Germany and France where a substantial increase has been evident for imports as well as exports in the most recent reporting period (2016-2017). As Germany and France generate the largest annual value of exports and imports to and from Asia, this implies that overall trade between the countries along the corridor and Asia have increased substantially.
Figure 94: Annual value of exports to Asia (in MIO EUR, Source: Eurostat)
Figure 95: Relative share of exports to Asia (in %, Source: Eurostat)
Figure 96: Annual value of imports from Asia (in MIO Euro, Source: Eurostat)
Figure 97: Relative share of imports from Asia (in %, Source: Eurostat)
Overall, most Asian economies exhibit high growth rates rendering a further increase in trade likely (e.g. China: 6.9% GPD growth in 2017 (CIA World Factbook)). Although the current share of trade between Europe and Asia that goes via rail is minor (around 1-2%), the rail freight flows between East Asia and Europe have increased substantially over the past years, increasing from 25,000 TEU in 2014 to 145,000 TEU in 2016. This is in spite of the transport via rail being approximately 5 times more expensive (but 1.7 times faster). These rail freight flows between Europe and Asia are expected to grow further in future years, with an annual expected growth rate of 14%. (ITF, 2019)
3.3.3 Summary and conclusions
Overall, the economic indicators suggest a fairly positive outlook regarding freight transport overall (all modes) with economic development expected to remain positive in the entire corridor region. Particularly relevant for rail freight transport is the development of the industrial production sector, as it generates goods that typically have a relatively high propensity of being transported via rail. With few exceptions, investments in industries have grown along the corridor over the past years. Given the positive macro-economic forecast, we can also expect further industrial growth. Investments in industries have grown particularly strongly in Germany, which at the same time also

82/158
has the highest GDP/capita and has a dominant position in terms of trade (both imports and exports) with Asia among the countries located along the corridor. Even if only a minor share of this trade can be directed via RFC 9 RHD, it will be substantial, as illustrated in the previous sub-section.
3.4 Social and demographic development
3.4.1 Demographic development
The population density is significantly higher in the Western parts of the corridor and declines significantly when moving along the corridor towards Romania, where it is consistently low except for the capital city Bucharest. This difference has increased further in past years, with population growth being evident mainly in the Western parts of the corridor region, while population decline is evident in most of the Hungarian and Romanian regions located along the corridor.
Figure 98: Population density (persons/square km, Source: Eurostat)
Figure 99: Change in population 2010-2017 (in %, Source: Eurostat)
These population trends are expected to continue in future years as shown below, however, with some indication of convergence as both the population decline in the Eastern parts of the corridor and the population increase in the Western parts of the corridor are expected to slow down. This can at least partially be explained by some convergence in the underlying economic differentials as discussed below.

83/158
Figure 100: Past and predicted population development (in MIO inhabitants, Source: IMF)
Figure 101: Past and predicted annual population change rates (in %, Source: IMF)
3.4.2 Social development
Reasons for the outmigration especially from Hungary and Romania are the relatively low disposable income, the relatively high risk of poverty and the relatively high unemployment rate (Fries-Tersch et al., 2018). A relatively high GDP per capita tends to induce immigration, while a relatively high unemployment rates tend to cause outmigration (Windzio, Teney & Lenkewitz, 2019). There is some indication though that these differences across corridor regions will decline in future years. Figure 103 shows that disposable income per capita has increased over-proportionally in the Eastern parts of the corridor region in past years. Also, unemployment rates are expected to stabilize at fairly low levels (in particular compared to the base year 2010) in all countries situated along the corridor.
Figure 102: Household disposable income/capita in 2017 (in EUR, Source: Eurostat)
Figure 103: Household disposable change between 2010 and 2017 (in %, Source: Eurostat)

84/158
Figure 104: Share of population living with risk of poverty (in %, Source: Eurostat)
Figure 105: Past and predicted unemployment rates (in %, Source: IMF)
3.4.3 Summary and conclusions
Substantial demographic shifts have been happening along the corridor region over the past decade. While the population has grown strongly in Austria and Germany, substantial population decline could be observed especially in Hungary and Romania. These shifts have been driven by differentials in income levels and employment. Especially young, high-skilled workers have left the regions located in the Eastern part of the corridor. The population decline is expected to continue, however, to a lesser extent than it has been happening over past years. The same is true for population growth: especially Austria’s population is expected to continue growing.
The population decline in the Eastern parts of the corridor region may lead to a lower local demand for goods in these regions. Local productivity is also likely to be negatively affected. However, due to the composition of the migrating population high-skilled professions are probably affected more; these in turn tend to produce goods with low rail-affinity (or services that do not require transport at all). Sectors that typically use require low-skilled labour (e.g., mining) as input, and at the same time produce goods with high rail-affinity, are likely to be less affected by the population decline. This seems to be in particular true for the car manufacturing sector: major car manufacturers, including German brands, have moved their production to lower-wage countries in Eastern Europe, in particular to Hungary and Slovakia (e.g. Audi in Győr, Volkswagen Slovakia in Bratislava).
The fact that within the corridor region migration is directed towards more productive areas with a substantial share of industry (e.g. Southern Germany), in turn is expected to increase imports and exports in those areas (e.g. trade between Germany and China), overall benefitting potential trade flow prospects on RFC 9 RHD.
3.5 Transport market development
3.5.1 Freight transport by mode and modal split
The following two figures show that overall freight transport (measured in ton kilometres) on the rail as well as on the road has not been subject to substantial changes over the past years. Please note that these data have also been analysed and discussed in the country-specific sections.
Especially rail transport seems stable at a fairly low level in most countries located along the corridor. Germany and France have higher levels, but as the following modal split analysis will show, this is due to the size of these two economies rather than a high modal split for rail. Road transport has visibly decreased in absolute terms in France, although a slight increase is again visible for

85/158
2015-2017. An increase in road transport can also be observed for Romania, while a decrease is evident for the Czech Republic.
Figure 106: Freight transported via rail (in MIO TKM, Source: OECD)
Figure 107: Freight transported via road (in MIO TKM, Source: OECD)
The below figures show the development of the modal split for both passenger and freight transport between 2010 and 2017, differentiating between train, car and bus for the former, and rail, road and inland waterways for the latter. In passenger transport, the train has a minor modal share (below 12%) in all countries. It has further decreased in past years in Hungary and Romania. Noticeable increases can be observed for Czech Republic and Slovakia, and less pronounced ones for Austria, France, and Germany.
In the freight sector, the modal share of rail varies substantially. It is lowest in France (just above 10% in 2017), followed by Germany (17.8% in 2017), while it is highest in Slovakia (32.9% in 2017). Between 2010 and 2017, we observe a decline in rail modal share in Austria, Czech Republic, Slovakia. In the remaining countries, the rail modal share is fairly stable.

86/158
Figure 108: Modal split freight rail (in %, Source: Eurostat)
Figure 109: Modal split passenger train (in %, Source: Eurostat)
Figure 110: Modal split freight road (in %, Source: Eurostat)
Figure 111: Modal split passenger car (in %, Source: Eurostat)
Figure 112: Modal split freight inland waterways (in %, Source: Eurostat)
Figure 113: Modal split passenger bus (in %, Source: Eurostat)
3.5.2 Share of international freight transport and infrastructure investments
Figures Figure 114, Figure 116, and Figure 118 show the relative share of international freight in overall freight transport for rail, road and inland waterways, respectively. The international share of rail transport in overall rail transport in Romania and France has been steadily increasing (at least till 2015) but starting at low levels (10-15%). An increase can also be observed in Czech

87/158
Republic, though from a higher starting point (above 40%). The remaining countries are either stable at a fairly high level (Slovakia: 40%), or decreasing from a high starting point (Germany, Austria, Hungary: 50-60%). For road transport, the international share of transport has been decreasing in most countries with the exception of Romania and (to a lesser extent) Hungary. The international share transport on inland waterways is also fairly stable in most countries. Here, Czech Republic acts as an exception, which, generally, however, has low levels of transport on inland waterways.
Figures Figure 115, Figure 117, and Figure 119 show per-capita investments in rail, road and inland waterway infrastructure, respectively. For rail, they are by far highest in Austria, though with a declining tendency, while for road infrastructure they tend to vary across years, with Romania, Germany and Slovakia ranking highest in most years. Per-capita investments in inland waterways are highest for Germany and Romania.
Only in few cases, the investments are closely associated with changes in the corresponding transport performance and modal split (as introduced in the previous section). One example are the fairly high road investments in Romania, which may have contributed to the observed increase in road transport; also, the fairly high rail investments in Czech Republic may have contributed to the increase in Czech rail transport. In contrast, the per-capita investment in rail infrastructure in Austria is by far the highest among the countries located along the corridor, nevertheless, the modal share of rail has declined.

88/158
Figure 114: Share of international transport in total rail freight transport (in %, Source: Eurostat)
Figure 115: Per-capita investments rail (in EUR/capita, Source: OECD)
Figure 116: Share of international transport in total road freight transport (in %, Source: Eurostat)
Figure 117: Per-capita investments road (in EUR/capita, Source: OECD)
Figure 118: Share of international transport in total inland waterway freight transport (in %, Source: Eurostat)
Figure 119: Per-capita investments inland waterways (in EUR/capita, Source: OECD)
3.5.3 Types of goods transported via rail
The figure below gives an overview of which goods are typically transported via rail, comparing 2012 to 2017. Note, that the share of unclassified goods is very high for rail transport, and hence the other categories may be biased downwards due to goods not being attributed to the appropriate

89/158
category. The type of goods most commonly transported by rail are metal products, metal ores and mining products, followed by coke, petroleum, and chemical products. But, as Figure 121 shows, even for most of these categories the corresponding amounts (in ton-km) are higher for road than for rail transport (with the exception of the category “coke and refined petroleum products").
Figure 120: Types of goods transported by rail in all corridor countries in 2012 and 2017 (in MIO TKM, Source: Eurostat)
Figure 121: Types of goods transported by road and rail in all corridor countries in 2017 (in MIO TKM, Source: Eurostat)
3.5.4 RFC 9 RHD infrastructure compliance
The infrastructure along the RFC 9 RHD corridor should be made compliant with specific pre-defined indicators till 2030. For both rail links as well as terminals, significant progress is expected until 2030, however, full compliance is unlikely to be reached.

90/158
3.5.4.1 Railway links
According to the CNC Workplan, 2018 the compliance prospects for 2030 for the railway links are as follows:
• Electrification: 97% • Line speed >= 100 km/h: 96% • Axle load >=22.5 t: 92% • Train length >=740m: 68% • ERTMS: n.a. (6% in 2016)22F
22
Also, along other parameters (e.g., line capacity, single track sections, strong inclines) significant progress is expected. An overview, along with the most projects that will provide long compliant infrastructure stretches is provided by the following figure.
Figure 122: Rail link compliance (from CNC Workplan, 2018)
However, compliance gaps that are not yet subject to a specific, reliable finalization date, can be observed on large parts of the corridor and create difficulties and barriers for the railway undertakings (mainly in electrification, ensuring 22,5 t axle load and also in relation to running 740 m long trains). The main ones are the following (CNC Workplan, 2018; updated by VPE Network Statement 2019/2020):
• DE/CZ border – Domažlice (speed) • Schwandorf – DE/CZ border (electrification) • large parts of Slovakia and Czech Republic (train length) • München- Freilassing (axle load) • Rajka – Hegyeshalom (axle load) • Sections between Budapest and Lőkösháza (axle load) • Predeal – Bucures ̦ti (axle load, train length)
22 Some progress has been achieved in past years, including: Přerov -Ostrava (CZ), Ferencváros-Gyoma (HU), Rajka – Hegyeshalom (HU),
Simeria-Sighisoara (RO)

91/158
• Craiova – Bucures ̦ti (axle load) • Bucures ̦ti – Constanta - existing line (train length). Here a new high-speed line is
planned, which should also be part of the TEN-T Core Network (Rail Passenger) and the Rhine-Danube Core Network Corridor (CNC). It will, however, likely not be realized before 2030.
Moreover, in the face of the envisaged increase in freight rail transport by 2030, some links that currently do not suffer from capacity problems (in particular single-track lines), may approach their capacity limits. These include (CNC Workplan, 2018):
• Germany: Marktredwitz – border DE/CZ, Regensburg - DE/CZ border, Mühldorf - Freilassing • Czech Republic: DE/CZ border – Plzen ̌ (both lines from Nürnberg and Regensburg) • Slovakia: border-crossing sections between Bratislava and Austria/ Hungary • Hungary: Békéscsaba – Lőkösháza.
3.5.4.2 Railway terminals
Only few terminals are expected to be fully compliant in terms of their ability regarding intermodal unit handling, accessibility by longer trains and accessibility by electrified trains by 2030, but substantial progress is expected between 2020 and 2030 (see below Figure):
Figure 123: Terminal compliance (from CNC Workplan (2018))
According to CNC Workplan, 2018, the compliance prospects for 2030 are as follows: • Intermodal unit handling: 49% • Accessible by trains with >=740m: 23% • Accessible by electrified trains: 32%
3.5.5 Summary and Conclusions
Overall, we observe that in absolute terms freight rail transport is fairly stable in most countries located along the corridor. The modal split developments are less clear, with rail modal share increasing in some and decreasing in other countries.
With improved infrastructure that is in line with the standards, travel times are expected to decrease, and reliability and punctuality are expected to improve. Also, possibilities for multimodal transport are expected to improve, leading to shorter door-to-door travel times. This will lead to decreases in the inconvenience that the rail has compared to road in terms of travel times and

92/158
reliability, although it should be noted that the latter is valued surprisingly low in freight transport (especially compared to passenger transport) (de Jong et al., 2014).
However, besides the infrastructural factors, improvements are also necessary regarding operational procedures, for instance aiming at yielding reductions in waiting times at borders (which are often highly uncertain in duration) and offering more integrated and flexible logistics solutions (providing flexible door-to-door solutions).
3.6 Political developments
3.6.1 Overview
In 2010, the EU had initially mapped out 9 freight corridors with the objective to make rail freight transport more competitive, with RFC 9 RHD being one of them (Regulation (EU) No 913/2010; changes in Regulation (EU) No 1316/2013). The political framework is therefore largely determined by EU-regulations. The overall goal of establishing a single European Transport Area has been mapped out in the 2011 white paper entitled ‘Roadmap to a Single European Transport Area — Towards a competitive and resource efficient transport system’. (EC; Coito, 2019)
Multiple directives and four railway packages on the interoperability of the trans-European rail system have been issued in the past decade. A set of common infrastructure requirements, as well as increased harmonization of operating, planning and authorization rules have been put in place. These include uniform railway signalling (ERMTS), rules for maintenance, standardized gauge, lower weight limits, and facilitation of longer trains.
Moreover, national and international freight transport have been opened to competition (starting already in 2007). The European Railway Agency was set up in 2004 with the goal of improving the interoperability and safety of the European rail network. It can issue vehicle authorizations as well as safety certificates for cross-border operations. The most recent (4th) Railway Package (2016) was adopted with the aim to complete the Single European Railway Area and further improve interoperability. (EC; Coito, 2019)
3.6.1.1 External costs of freight transport
Rail freight transport is currently not competitive with road transport along various dimensions, which is a main reason for the low modal split of freight rail in most EU countries. Even with improvements in infrastructure, rail freight transport will still be subject to longer travel times and less flexibility than road transport along most routes, although the relative disadvantages are expected to become substantially smaller.
From a societal point of view, however, rail transport tends to have an advantage as it creates lower negative externalities compared to road transport, which is also the main reason why national governments and the EU aim at achieving a higher rail modal split. External costs are not reflected in the costs of transport (i.e., are not “internalized”), and hence typically do not play a role in mode choice decisions (Van Essen, 2019):
• Local air pollution • Greenhouse gases • Noise • Congestion • Accidents • Well-to-tank emissions
– These includes the production of energy sources which leads to emissions and other externalities during the production process.
• Habitat damage

93/158
– Includes costs of habitat loss and habitat fragmentation
The following table shows how these external costs differ (on average) between transport modes, differentiating between heavy goods vehicles, rail, and inland waterways for the countries located along the corridor. The external costs associated with heavy goods trucks are higher in all countries than for rail, often by a factor exceeding 3. The difference would have been even more pronounced if congestion costs (which is mostly absent on the rail due to fixed timetables that already take into account capacity constraints) had been included.
Country Heavy goods trucks Rail Inland Waterways
France 3.7 1.5 2.1
Germany 4.4 1.9 2.2
Austria 4.3 3.2 2.5
Czech Republic 4.4 1.2 11.7
Slovakia 3.2 1.1 1.3
Hungary 3.5 0.9 2.0
Romania 3.3 1.1 1.3
Table 9: Average external costs 2016 by country and transport mode (excluding congestion) in Euro-Cent/TKM (Van Essen et al., 2019)
The following figure gives an overview of the composition of external costs for the different transport modes (EU28 average). It shows that only noise costs23F
23 are considerably higher for rail than for road transport (also habitat damage costs are slightly higher). The remaining cost categories are substantially larger for road transport than for rail transport. This is particularly true for accidents, air pollution, and climate effects.
Figure 124: Average external costs 2016 for EU28: freight transport (excluding congestion) (Van Essen et al., 2019)
23 Specific directives on noise regulation have been issued, aiming at encouraging the use of low-noise brakes by implementing noise-
differentiated infrastructure charges.

94/158
Local air pollution is an important issue, especially in the Eastern part of the corridor, where air pollution affects the majority of the population, as the following figure shows.
Figure 125: Pollution indicators across Europe for 2015 as share of population above WHO thresholds (includes PM 10, PM 2.5, N2O, O3; Source: Environment Agency Austria)
These pollution patterns are also mirrored by the public opinion on air quality changes, as the figure below shows.
Figure 126: Air quality perceptions (Eurobarometer, 2017)
Climate change is a global issue affecting all countries located along the corridor both in terms of direct consequences (average temperature increase, higher likelihood of extreme weather events, etc.), but also through the regulatory framework, recently imposed by Paris Climate Agreement. The EU’s contribution under this agreement is to reduce greenhouse gas emissions by at least 40% by 2030 compared to 1990. The necessary legislation has been adopted in 2018. More ambitious

95/158
targets, such as aiming at net-zero greenhouse gas emissions by 2050, have however, been refused by some EU member countries, including the Czech Republic and Hungary (along with Poland).
However, even in the absence of more ambitious goals, the Paris Agreement, which has the target to keep global warming well below 2°C, will require strong adaptations in the transport sector, as currently global freight transport accounts for 36% of total greenhouse gas emissions from transport; in turn, the transport sector contributes almost 30% to greenhouse gas emissions in the EU.
3.6.1.2 Level playing field between transport modes
In the face of environmental and climate concerns being increasingly prominent in the public discourse, and citizens increasingly expecting policy makers to act upon their concerns, policy makers at the EU level, but also at the national, regional and local level are expected to increasingly support regulations and policies that benefit the environment.
Regulations regarding local pollutants (in particular from Diesel vehicles) and greenhouse gas emissions are expected to become increasingly strict, even though partially toned down by influential interest groups. The following figure on environmental policy stringency gives an indication of that. It shows that all countries along the corridor24F
24 have increasingly put policies in place that put an explicit or implicit price on polluting or environmentally harmful behaviour.
Figure 127: OECD Environmental Policy Stringency Index (EPS)25F
25
The EU has increasingly shown support for market-based instruments that lead to an internalization of the external costs. Internalization of external costs has already been mentioned in the Commission’s White paper (2011) (see point 58). In its strategy for the internalization of external costs it has mapped out a common method to charge infrastructure users for the external costs according to “user-pays”/” polluter-pays” principles.26F
26
So far, most of the countries located along the corridor have implemented distance-based tolls for road transport. The only exception is Romania which has a vignette-based system, where the price of the vignette depends on the length of the stay in Romania. Only in few countries the tolls are differentiated between emission class and axle numbers (Germany, Austria). Germany is the only country in which tolls only apply for trucks above 7.5t weight. All other countries along the corridor
24 No data are available for Romania. 25 The index ranges from 0 (not stringent) to 6 (highest degree of stringency) and is based on the degree of stringency of 14 environmental policy
instruments, primarily related to climate and air pollution (Botta & Kozluk, 2014) 26 https://ec.europa.eu/transport/themes/sustainable-transport/internalisation-transport-external-costs_en

96/158
levy charges for trucks above 3.5t. All these tolls tend not to cover the external costs caused by road transport (including congestion).
On average, the total cost coverage ratio in Europe for heavy goods vehicles is 26%, including fixed infrastructure costs; excluding fixed infrastructure costs it amounts to 37%. However, note that the cost coverage ratios for rail tend to be even lower: the average total cost coverage ratio is 12% for electric freight trains, and 26% for Diesel freight trains; the corresponding cost coverage ratios excluding fixed infrastructure costs amount to 30% and 50%, respectively. Variable infrastructure costs (i.e. wear and tear costs) are covered only to an extent of 44% for trucks, but 86% for electric and 138% for Diesel freight trains. The latter is due to the higher tax revenues from diesel trains (compared to electric trains) as a result of fuel taxes. (Van Essen et al., 2019; Schroten et al., 2019).
3.6.2 Geopolitical factors
Trade relations with most Asian economies are stable, and for the main Asian trading partner, China, mostly governed by the WTO framework. New tariffs or other forms of trade barriers are rather unlikely to be established soon. On the contrary, negotiations for an investment Agreement between the European Union and China have been ongoing since 2013, as part of the EU-China 2020 Strategic Agenda for Cooperation. Nevertheless, there are specific policies that may affect trade between Europe and Asia, such as China regulating the sale of fossil-fuel vehicles by imposing quota for electric vehicles. Another one is the current subsidies provided by the Chinese government for Eurasian rail services (approximately 2000-5000 USD/TEU), which at some point might be phased out, leading to a yet higher price differential between rail and sea freight rates (ITF, 2019).
In 2012, China has established the so-called “16+1 format”, which includes 16 countries from Central and Eastern Europe and China (Brinza, 2019). Among the countries located along RFC 9 RHD, these are: the Czech Republic, Slovakia, Hungary, and Romania. The initiative aims at increasing the cooperation between China and these other countries along various lines, including transport and trade, within the framework of China’s so-called Belt & Road initiative. However, so far the cooperation has barely delivered on its early promises. For instance, the envisioned high-speed railway connection between Budapest and Belgrade is still missing. Among the countries located along the corridor, major investments by China have so far only been undertaken in Romania, but almost exclusively focusing on energy infrastructure.
3.7 Technical factors
This section focusses on the technical and infrastructural factors influencing rail freight in Corridor 9. Inherently, with a rail freight corridor spanning relevant European countries, all with their unique national history of rail development and management, the current state and operational infrastructure systems differ and vary across RFC 9 RHD.
With regards to the technical and infrastructural standards, the following two regulatory documents are crucial:
• Technical Specifications for Interoperability (TSIs), referring to the specifications by which each subsystem or part of a subsystem is covered in order to meet the essential requirements and to ensure the interoperability of trans-European rail systems by ERA.
• Regulation (EU) No 913/2010 which makes demands on member states and infrastructure companies, as uniform requirements, are needed across all corridors in order to promote interoperability. The aim is to create harmonised technical standards, as non-harmonisation – still widely occurring in cross-border freight transport – limits traffic flows and is detrimental to efficiency and productivity.

97/158
It also elaborates how, and to what degree, the individual corridor countries have adhered to these specifications and regulations.
The ERTMS constitutes an initiative backed by the EU and aims to enhance cross-border interoperability and the procurement of signalling equipment by creating a single Europe-wide standard for train control and command systems. ERTMS consists of the three components:
• European Train Control System (ETCS), • Global System for Mobile Communications – Railway (GSM-R), • European Train Management Layer (ETML).
In July 2009, the EC announced that ETCS is now mandatory for all EU funded projects, so new or upgraded signalling and GSM-R is required when radio communications are upgraded.
However, as the above table shows, the diversity in current signalling systems constitutes a widely recognised challenge. Therefore, the harmonisation of signalling systems is also mentioned in the 4th Railway Package, which strives to realise a uniform and standardised signalling system on all European corridors.
The implementation of one European signalling system – ERTMS – presents an opportunity to unify the signalling systems along Rail Freight Corridor 9 (and Europe in general). On the one hand, this opportunity should result in easier cross-border operation of locomotives equipped with ETCS. On the other hand, the relatively high costs for equipping rolling stock with ETCS pose a significant burden on rail freight and, thus, constitute a barrier as well as an opportunity. This is the case in Lithuania where, despite the existence of an ERTMS implementation plan, the high financial cost have led to demands for postponing the introduction of ERTMS.
Germany is also faced with the reality of high implementation costs leading to slower than planned implementation.
3.7.1 Rail sector
Most technological innovations in the rail sector can be considered incremental, as they build upon already existing technologies and are not disruptive in their nature. Many of them have a digital component. Recent innovations (based on Turner, 2019 and Rail Freight Forward, 2018) have focused on:
• Interoperability improvements: - E.g., flexible/intelligent freight wagons, that can be used for any type of load
• Hardware efficiency improvements, including: - Sliding pallets, removing the need for a crane when removing containers - Components that are lighter in weight, noise-reduced, energy-saving and/or lifecycle-
cost saving • Reliability improvements:
- On-train monitoring recorder - Preventative and predictive maintenance information
• Digitization - Digital modules to optimize wagon operation - Mobile/hand-held, ‘cloud’ based applications, reducing train preparation times and
need to for paper processes and storage - Improved information management and decision support (e.g. for path amendment)
§ Cloud based applications that combine information from the timetable and geolocation
§ Digital assistance for loading and unloading § Software for wagon management
• Move from ‘rail freight’ to ‘integrated logistics’

98/158
In general, innovation cycles in the rail freight markets tend to be long, due to the relatively small market size and the long asset replacement cycles (10 times longer in rail than in road; see Rail Freight Forward, 2018), which further slows down innovation processes and the market uptake of innovations.
3.7.2 Road sector
Compared to the rail sector, technological innovation is expected to play a bigger, potentially disruptive role for the road sector, substantially improving the relative cost competitiveness of rail transport compared to road transport. The most relevant technologies are the following:
• Mega-trucks (gigaliners, high-capacity vehicles). These typically allow for a 50% increase in truck load, leading to potential cost savings of about 20% per ton kilometre, but also to lower emissions, lower congestion and higher safety (ITF, 2019).
• Autonomous driving abilities: A fully autonomous truck is expected to reduce costs of operating a truck by 40 to 45%, due to large share of operating costs being due to wage costs for the truck driver (Madrigal, 2018). But even with partial automation features, trucks may become more cost-efficient and flexible, as drivers may spend part of their obligatory rest time during the drive.
• Platooning: Trucks that drive only a few meters apart can save up to 20% of fuel costs due to the reduction in air resistance (Adler et al, 2016). Platooning and autonomous driving are closely related; even with limited autonomous driving capability (keeping a constant distance), it is potentially feasible to forego drivers in all trucks of the convey except the very first one.
Hence, all of these technologies are expected to decrease the costs for road transport substantially. Taken together, Rail Freight Forward (2018) estimates that the cost reductions will be “substantial double-digit”.
Another technology, which becomes especially relevant if environmental regulations become stricter and/or internalization of environmental costs takes place, is electrification (together with charging-related innovations such as overhead facilities or induction). With electrified road transport the environmental advantages of rail transport would widely disappear. Currently, number of truck manufacturers are investing heavily in the development of such electric trucks (e.g., Volkswagen; see Rauwald, 2019). While electric trucks (or other low/zero emission alternatives) are unlikely to become widespread in the short and medium run, they would have to be in general use if carbon emissions neutrality is to be achieved in the European Union by 2050 (ITF, 2019).
3.7.3 Logistics and supply-chain developments
Current logistics trends including digitization and fast innovation cycles suggest a further increase in just-in-time deliveries and on-demand shipping (ITF, 2019). These trends are likely to be detrimental to rail transport within Europe due to high flexibility and low door-to-door travel time requirements that rail traffic can typically not fulfil. However, rail transport between Asia and Europe may benefit from these trends, in particular due to lower travel times compared to sea shipping (transport by rail between East Asia and Europe is currently about 1.7 times faster; see ITF, 2019).
Also demand for commodities that are often transported by rail (e.g. heavy bulk materials such as coal) is expected to decrease, while demand for goods that have low rail affinity is increasing, among others because of e-commerce, which typically goes hand in hand with smaller shipment sizes. Rail Freight Forward (2018) estimates the former to decrease by 0.5-1.1% annually, and the latter to increase by 2.2% annually (for the time span between 2014 and 2025).
While overall freight demand is still expected to increase strongly, some technological developments may dampen the increase, most importantly 3D-printing. 3D-printing of physical goods allows for a decentralisation in production locations, hence leading to a decrease in the distance between

99/158
production and consumption and a reduced need for complex supply chains and (longer-distance) freight transport in general.
3.7.4 Summary and conclusions
Overall, in line with past developments, we expect freight transport demand to increase further due to more globalized supply chains and realignment towards emerging markets. This is in spite of some developments that may flatten freight transport volumes to some extent such as digitization and 3D-printing. The extent to which the freight volume increase can be captured by the rail sector depends, among other factors, on technological developments.
Currently, rail freight transport suffers from limited competitiveness compared to road transport: long travel times, unreliability, inflexibility. These are to a substantial extent caused by technological and infrastructure-related factors such as bottlenecks, border waiting times, limited technical and organizational compatibility and coordination, too national perspective of IMs Ministries/Authorities, no awareness of the international character of rail freight. If in the process of unification of the transport market substantial improvements and compliance with EU standard can be seen, a substantial increase in demand can be expected.
While the rail sector exhibits comparatively limited technological developments, the road sector may face several disruptive technologies in future years, among which are large-capacity vehicles (through mega-trucks and/or platooning), (at least partially) self-driving trucks and electrification. Especially the larger size vehicles and self-driving capabilities are expected to improve cost efficiency of road transport even further. Even if stricter environmental regulations, for instance in the form of marginal cost pricing, are implemented, the cost advantage of road transport would therefore likely prevail, rendering the outlook for rail traffic negative. However, it is currently uncertain when these technologies will be introduced on the market and to which extent, they are accommodated by adaptations in the legal framework as well as in the infrastructure.

100/158
4. ANALYSIS OF THE RFC 9 RHD CURRENT TRANSPORT MARKET 4.1 Methodology
In order to get a complete picture of the current freight transport demand along the RFC 9 RHD, all transport modes were analysed. This includes also short-sea shipping connections between the major ports. The analysis focuses on important trade relations in the study area, the commodity split of freight transport demand and the modal split of transport services. International rail freight flows were analysed in more detail, including factors like train type (block trains, single wagon traffic, combined traffic), technical parameters like train weight and length, requirements regarding ad-hoc / timetable traffic.
The results regarding the competitive situation of the rail freight services in the corridor are mainly based on research and internal Consultant analysis.
4.1.1 Data collection
A comprehensive base of data and information is considered crucial for the success of the Transport Market Study for the RFC 9 RHD. For the general freight market analysis official national and international statistics, as well as existing studies and materials were used, whereas for the more detailed analysis of international rail freight traffic, data provided by the infrastructure managers was used.
The base year used is 2017 with a five-year forecast period.
On the one hand it is important to have a common base of data for proper comparison. On the other hand, the data will have to be cross-checked with the existing data – even on a qualitative level. Nevertheless, a remaining challenge is, that there is no really detailed and consistent data set available, unless directly measured at its respective point within the transport chain. This is neither cost efficient nor in line with the business models of the different stakeholders involved. If e.g. exact capacity utilization of a railway company or the trans-shipment utilization of a terminal would be publicly available, the customer would automatically claim a better price, if the capacity utilization is low. Therefore, all data are to some extent biased within both data collection and aggregation. Accepting this bias, the relative comparison in total is more reliable than absolute figures. Here, the advantage of bias is to be used in both directions.
4.1.2 Official transport statistic and existing studies
For the general analysis of corridor-related freight traffic the Eurostat data base has been used. Thus, a common and consistent basis of data and information is guaranteed. For further specific issues also national transport statistics, including seaport statistics were used.
As presented in the following Origin-Destination-Matrix based on the EUROSTAT Nuts 2 data (based on latest available data from 2015), existing statistics can only give superficial insights into the transport market itself. This is based on the assembly and provision of statistical data itself. Based on the graphical analysis in Figure 128, it is clearly visible that data for certain relations is not available on a consistent level. This is the case regarding the transport from Austria to Hungary and further to Romania – and vice versa. Therefore, official transport statistics can only be used to commit cross checks, e.g. regarding the net weight of freight for trains.

101/158
from / to Austria Czech Republic France Germany Hungary Romania Slovakia
Austria 377.900 4.735.500 177.000
Czech Republic 2.128.700 55.700 11.149.900 889.000 63.000 4.051.900
France 35.300 432.400 97.700 14.400
Germany 6.411.800 11.247.100 232.000 980.000 471.600
Hungary 244.900 819.800 352.100
Romania 54.800 247.300 151.500
Slovakia 1.731.300 11.955.000 96.000 1.832.600 645.500 203.400
Table 10: Origin-Destination-Matrix of transported tons via mode rail (EUROSTAT 2015)
The position of the connecting points is indicating the respective country without any additional geographical context. Within these points, the share of the different Origin-Destination figures is graphically indicated. The tonnage is indicated by turquoise and red colour regarding a span between 10 thousand and 10 million tons. The graphs connecting both normal and mirrored origins and destinations are overlaid. Thus, the maximum of county connections is shown.
Figure 128: Origin to Destination of transported tons via mode rail (EUROSTAT 2015
4.1.3 Data provision by Infrastructure Managers
The analysis of the current situation in international rail freight traffic in the corridor is based on train data provided by the Infrastructure Managers (IM). Detailed train data was provided for the so called ‘corridor trains’, if available. These data included the following information:
§ Origin/destination of train in the corridor area, border crossing point(s)
§ train type (block train, single wagon train, container/combined traffic train)
§ Ad-hoc / timetable traffic
§ Technical parameters (train length, train weight)
§ Type of cargo (for block trains)

102/158
Where data was not complete according to the structure above, differences and inconsistencies were settled within the traffic model. Train data were assigned to the traffic model starting with data from ÖBB Infrastructure and DB Netz AG. Data from these IMs comprised all the above-mentioned information. A doubling of information (number of trains) received from different IMs was excluded. Train data were provided for the year 2017.
4.2 Transport volumes per O/D trade lane and mode
4.2.1 Methodology and Data Assessment
In general, there is no absolute/uniform or even similar structure of train data available from the different countries. The reasons for that are manifold and are not to be further discussed here.
This heterogeneous data has to be handled in a structured way. To do so, the data received was transferred into a database to unify the data step by step – original data has not been changed but adjusted in steps. Graphical Information Systems (GIS) will be used to support the native understanding of data by using graphical representation and flows. Due to complexity a Business Intelligence (BI)-tool was used for these graphical solutions and the O-D-Matrix.
Looking at the corridor routing and allocations of terminals the hubs and spokes of a network can be shown. This provides an insight, weather
• the route alignment (spokes) is in line with the train data, or • allocation of terminals (hubs) are covering relevant economic areas.
The methodology used allows conversion of data to be supported by qualitative and quantitative assessment of terminals connecting economic areas to the corridor. The data conversion focusses on the following steps:
• Basic data is supported by additional advanced tables for geo-referencing and point-mapping especially for technical names of loading points and borders. This allows for separation of domestic and international traffic. In addition, borders can now be shifted to the correct country for relevant der traffic as well as corridor related international trains.
• At no point in time the received data by the IMs has been changed manually. All changes are fully transparent by using SQL statements.
• Finally, the improved data is connected to the Power BI Desktop tool for setting up dashboards. These dashboards are allowing data drill down, both tabular and graphical.
• The data received did not include both directions. Assumptions had to be made to split the data into directions, here ‘From’ source ‘To’ destination. Therefore, tables with matrix e.g. including origins and destinations will not cover all possible combinations of directions. As the data source can be used for drill downs, different figures for the same direction can be differentiated properly. In total 838 different points could be identified. 306 of these points were aggregated or reassigned to 140 main points, e.g. in the larger area of Budapest as an example.
4.2.2 Received Data
The data-sets received from the IMs for freight traffic were heterogeneous with regard to disaggregation and content. In general, these heterogeneous data prevented a direct tabular analysis. Thus, a database-driven approach including a BI tool was chosen to deal with the data in a homogenous way (see above). An overview on data received is documented in Annex 4.
4.2.3 Harmonization of Data
The harmonisation of data to receive homogenous data can be separated in two steps covering three activities. Within step one the files including heterogeneous data-sets were merged in an Access database without being changed. Different queries using SQL were used as a step-wise

103/158
approach for harmonisation without change of the basic data. The data received finally allowed a graphical representation using a BI-Tool. This allowed a swift check up on plausibility, and especially better coordination of drill-down data processes for fully understanding the received data. Here, especially grouping and filtering of data is a state-of-the-art approach, fostering mutual understanding.
Figure 129: Data harmonisation process – Step 1
4.2.4 Qualitative Assessment of Data
After the data-sets had been integrated into a database and transformed using queries, data were analysed and verified in a graphical way including direct drill-downs within a BI-Tool.
Figure 130: Data harmonisation process – Step 2
4.3 Corridor Assessment
4.3.1 Origin-Destination-Matrix
In the following chapter the focus is put on corridor trains, defined as international trains passing at least one of the border crossing points defined along the RFC 9 RHD. This filter allows to concentrate on the relevant train numbers within the TMS, as e.g. transports within one and the same country will not be considered. Furthermore, the corridor trains will be reduced to border
Preparation and Unification of Data – without changing the Basic Data Interconnected drill Down of Data and Graphical Cross Check
Country selection
Automatic Data Drill Down

104/158
crossings relevant within the corridor. Thus, transports not directly crossing such a border are automatically filtered and not shown in the overall results.
As proper and consistent data information for the RFC 9 RHD is important, it is recommended for the future to build a dashboard including topic train data from railway undertakings and other actors, e.g. terminals. A dashboard would allow a topic view on the whole corridor with more recent data. The conversion of data does not need to be done by the actors, but by the dashboard. Nevertheless, required train information still has to be provided - either aggregated or disaggregated. A deeper look into the disaggregated data showed that the use of the train number as a common denominator was not feasible as there was no consistent match possible. For future use (see dashboard) it is recommended to review the international train number or identification for the RFC 9 RHD in order to establish a better data exchange protocol - one of the prerequisites to measure estimated time of arrival (ETA) for those trains in the future.
Due to e.g. delays in rail transport and different handling of changing train numbers, this approach includes a high bias. Thus, the understanding of corridor trains will focus on border crossings relating to the relevant amount of trains. For deeper analysis drill-downs by source (e.g. by IM) has been used for plausibility checks. Identified 'grey areas' due to already mentioned change in train numbers and/or a mix of real and planned train data then allow further data reduction and drill down. The lowest given figure in one direction at border crossings is then being used the common denominator.
To enable a full Origin-Destination-Matrix (O-D-Matrix) from country to country, relevant border crossings in one country have been assigned to the opposite border site and vice versa to allow to connect the different data-sets accordingly. When shifting the location of a border point to the corresponding border point, passing the border is virtually modelled. This 'shifting' was enabled by using a translation table assigning a border point to the corresponding border point, where suitable and required. Again, this approach did not change any basic data. The approach was presented to and approved by the relevant actors during meetings in Vienna and Bucharest in Q4, 2019.
The following table gives an overview with regard to the O-D Matrix of corridor trains along RFC 9 RHD in 2017 based on the existing data.
from / to Austria Czech Republic France Germany Hungary Romania Slovakia Ukraine
Austria 16.500 7.100 100 3.800
Czech Republic 2.200 6.600
France 200
Germany 14.600 2.000 200 600 200 10
Hungary 7.800 800 5.100
Romania 100 200 5.100
Slovakia 4.000 7.100 10 300
Ukraine 300
Table 11: O-D-Matrix for corridor trains on the RFC 9 RHD in 2017

105/158
from / to Austria Czech Republic France Germany Hungary Romania Slovakia Ukraine
Austria 45.7000 8.000 6.000
Czech Republic 33.400 34.700
France 2.300
Germany 44.900 23.800 2.400
Hungary 8.400
Romania
Slovakia 6.000 31.600 23.500
Ukraine 23.500
Table 12: O-D-Matrix for passenger trains on the RFC 9 RHD in 2017 (indication)
The O-D Matrix for passenger trains is based on the information received from the IMs. It has to be noted that this was partly extrapolated where only figures were available from one country. There the same number for the other direction was assumed. Again, the same recommendation applies here with regard to data-exchange as for the Freight trains.
4.3.2 Economic Areas
The following figure shows a graphical match of the proposed routing, all train data with 200 and more corridor trains per year – nearly one train per day – with the economic areas close to the corridor, mining, industrial, and service industry and the so-called ‘blue banana’ with more than 110 million inhabitants. In the Eastern part the Port of Constanta is both the gate to the Black Sea for import-export for the corridor, but even more important also the entry point to the world market for Eastern Countries. Finally, the terminals as hubs within this network are shown including a 50km (red circles) and 100 km (dotted circles) catchment area.
It can be clearly seen, that the RFC 9 RHD is connecting all relevant economic areas; the terminals are giving access to these areas within a suitable catchment area per terminal. Thus again showing that the proposed routing of the corridor align with the economic hubs of the regions in a sensible way.

106/158
Figure 121: Main routing RFC 9 RHD and economical areas

107/158
4.4 Railway freight and passenger analysis between Slovakia and Ukraine
4.4.1 General overview of existing studies and international programs
Slovakia shares a border with Ukraine in the East with access to a historically developed road and rail network leading to Asian countries. The cooperation between Eastern Slovakia and western Ukraine was established in 1993 creating a partnership to develop a bridge between Europe & Asia.
The countries have established freight and passenger transport connections, as well as border cooperation procedure improvements supported by various international programmes or projects financed by numerous IFIs. The most relevant are:
§ Trans-European corridor development though the Slovakian rail network. § TRACECA corridor freight traffic flow improvement (Ukrainian border side, railway network
though Chop to Slovakia). § The Trans-Eurasian corridor by rail routes crossing Chop and Slovakian border. § Transcarpathian railway corridor network going to Slovakia. § Establishing a legal framework for cooperation within the Carpathian Euro-Region in 1993.
The results of the mentioned programmes are and were usually directed to build or improve the relevant cross-border issues between Slovakia and Ukraine from a social, economic, infrastructural and operational point of view.
4.4.2 Analysis of passenger traffic by rail
In June 2019, national passenger operator ZSSK launched the first passenger train connecting Košice and Mukachevo. The service is provided twice a day in each direction by ZSSK Class 813/913 composed of two Diesel multiple-unit cars, using the 1 435 mm gauge track with stops at the border stations of Čierna nad Tisou and Chop.
In Ukraine the connections by rail from Chop continues to Mukachevo Lviv, Kyiv, Kharkiv and Odessa, while in Slovakia rail connections goes from Košice to Žilina, Bratislava and the Czech Republic.
Details on historical and current passenger traffic flows, as well as route efficiency was not available (no online studies results both from Ukrainian Railway and ZSSK).
Since 2018 there have been discussions between countries to extend the passenger border crossing point in destinations Maťovce-Pavlovo and Košice-Uzhhorod with possible extensions to Bratislava/Praha. Two options are under review27F
27:
1. Possible constructions of a special infrastructure in Maťovce to allow for a gauge-charge for the rolling stock (from broad to standard gauge and vice-versa) carriages to narrower rail tracks are under review (project to be launched).
2. Building 11 km of standard gauge to Uzhhorod.
In December 2018, the Hungarian State Railways (MÁV) opened a daily connection between Mukachevo and Budapest. The route has further connection to the following stations: Vienna – Budapest, crossing Chop, Kyiv and Košice.
Moreover, Czech open-access rail operators Leo Express and RegioJet are providing bus feeder service between Mukachevo and Košice to link the Transcarpathian region with their trains to Praha.
Launching these services Ukraine has improved its position to the EU.
Any additional historical data on rail connections, as well as passenger traffic flow between two countries (crossing Chop and Košice) are difficult to obtain. No surveys by neither of the countries
27 Publication from 02.2018, “Ongoing negotiation between Slovak Rail and Ukrzaliznitsay that concern the construction of new infrastructure
sections and the status of Maťovce – Pavlovo crossing point”

108/158
were undertaken. Nevertheless, ongoing developments show stable and slow traffic growing. Taking into consideration the free EU touristic visa in Ukraine since 2017 will lead to additional connections with other EU countries and/or cities. Besides, further EU support will establish appropriate Ukrainian border crossing procedures and development of UZ railway standards.
4.4.3 Analysis of freight traffic by rail
In Ukraine railway network organisation and management is divided into regions. The traffic from/to Slovakia is being managed by the region “Lviv Railways”.
To obtain data for freight flow analysis between the countries the Consultant used studies (to obtain data from Ukraine), official publications, data from previous projects and gathered data from Slovakian railway.
The data on freight traffic between two countries shows that there are typical traffic and transit flows. Total railway freight between Slovakia and Ukraine shows around 10 million tonnes per year, which amounts to about 35 %28F
28 of the entire railway freight transport in Slovakia. The most frequently transported goods are iron, coal and metal – mainly on the broad -gauge connection to Košice.
In April 2018, Rail Cargo Group (RCG) launched a regular service Vienna-Chengdu via Slovakia and Ukraine. It was the fourth connection launched by the ÖBB-subsidiary, which already run weekly services between Changsha and Budapest and Chongqing and Duisburg.
A new regular freight rail service was launched by Metrans29F
29. From October 2019 Cargo Train started its service from the Chinese city of Xi’an via Dobra to Dunajska Streda, near Bratislava in the west of Slovakia. The train runs once a week in one direction. Ukraine, as the best strategic transit route for end destinations in eastern Europe, and Slovakia in this case are a perfect transit country using the Silk Route connecting EU and China. The total transit time of the journey from Xian to Dobra in Slovakia was fourteen days and the train consisted of 44 40ft containers for different clients, and with different cargo.
The year 2018 shows 6 operating international container train destinations in Ukraine. The directions were mainly to China- Kazakhstan (Dostik/ Altinskoy- Kanisay)- Russian Federation (Iletsk- Suzemka) Ukraine (Zernovo/ Chop) – Slovakia (Čierna nad Tisou - Dobra terminal). Besides, 8 national container trains connecting Black sea ports and big east logistic hubs (including Chop) and Industrial cities were organised.
During the period of January – July 2018 Ukrainian Railways showed a 40% increase of container traffic which resulted in about 57,688 TEUs of cargo. The share of freight traffic within this route from China to Slovakia is about 2,952 TEUs 30F
30.
Following the data received for 2017 from Slovakian railways, the number of international trains on the standard gauge were 162 (157.434 tonnes) going from Ukraine to Slovakia, as well as 114 trains (105,242 tonnes) in the opposite direction.
28 Organisation of railway freight transport: case study CIM/SMGS between Slovakia and Ukraine, European Transport Research Review, 8 (2016),
4; 27-27 doi:10.1007/s12544-016-0215-7 29 Publication by Railfreight.com „Slovakia connects to China with new route via Ukraine“ 30 Railfreight.com Publication about “5 new Ukrainian railway routes 2018”

109/158
Figure 131: General overview of cargo traffic to the east 31F
31
In addition, the railway infrastructure of Transcarpathian region including line electrification and cargo stations foster a positive connection.
Most of the freight traffic is going to/from EU countries through CIS, Caspian and some of Mediterranean countries from/to China. This connection is also a part of EU Silk Route.
The procedures of freight transport organisation from both countries are completely different, that means manual procedures on the borders are required. Any transport documentations are rewritten from SMGS to COTIF, or vice versa. Compared to EU standards the UA processes are very labour- intensive and time-consuming. Nevertheless, in 2018 Ukraine defined its priorities within the National Transport Strategy for railway development as follows:
• Cross Border connectivity: improve border crossing procedures, alignment with EU standards, automation of procedures.
31 Source: Study by Roland Berger for the UIC, container traffic from China to Europe; Case- Study CIM/SMGS between Slovakia & Ukraine 2016
Figure 132: Overview of UA rail infrastructure and freight station on the border crossing points

110/158
• TEN-T corridors development: connect local/regional networks to TEN-T, increase capacity of the corridors, eliminate bottlenecks in accessing TEN-T, improving safety, etc.
• Traffic improvements: increase export, import, as well as international transit access. • Infrastructure bottlenecks: infrastructure electrification and modernisation
Figure 133: Selected railway projects from Ukrainian National Transport Strategy
In addition, following important political and administrative improvements in Ukraine, the following issues are expected to be optimised in the near future (until 12/2019):
• Adoption of draft Law “On Railway Transport of Ukraine”- developing road map of necessary secondary legislation and institutional and organizational actions according to draft law to meet EU standards and requirements (compliant with the EU acquis part of the Association Agreement). Expected outputs- sufficient procedures and transport organisation.
• Establishment of the Railway Administration - Assisting in analysing the orders of the Ministry of Infrastructure on rail transport in the period of 1994-2004, internal acts of Ukrzaliznytsia for creating the legal base of functions of Railway Administration. Expected outputs – traffic coordination, efficient management.
• Revising railway tariff system and tariff base calculation – review of the railway tariff system and in preparation of the new model for base tariff calculation (freight and passenger) by key components (infrastructure, traction, wagon). Expected outputs – liberalisation of railway tariffs and more compatible tariff. Assistance in approving of the new railway tariff methodology compliant with EU Directive 2001/14/EU.
• Improvement of railway processes and services, attraction of investment to railway sector- attraction of investments to railway infrastructure (railway stations, HSR project etc). Analysing and preparing propositions for improvement of railway governance, processes and services. Expected outputs – efficient and developed railway infrastructure. Railway processes and services improvements.

111/158
4.5 Review of Constanta Port international connection
Constanta port is one of the main European ports providing access to the Back Sea and the shortest connection by maritime transport to Black Sea, Mediterranean and Asian countries in the region. It is the deepest, and one of the biggest ports (3.926 ha - land & water) on Black Sea having 140 operational berths. The port is fully complying with the ISPS Code and the EU security regulation in force.
The Port has a quite well-developed railway network which has a strong connection with the national and European railway network system. The total length of railways in the port amounts to 300 km. Each port terminal has direct access to the railway system as well.
The port infrastructure includes a broad range of near-by facilities and terminals:
• Container hub; • Cereal hub; • Dry bulk cargo operation (the largest in Sought East Europe); • Oil and LPG Terminals; • Ro-Ro/Ferry Terminals; • Passenger facilities and terminals; • Logistic centre (currently under discussion, available land use 700 ha).
Figure 134: Traffic flow by types of products, 2017
The 2017 statistical data published by Constanta Port Authority, shows a total freight traffic of 58,379,154 tonnes, where international traffic (including short sea shipping) was about 43 mio tonnes32F
32.
• Export - 20,912 mio tonnes; • Import - 19,167 mio tonnes; • Transit - 12,386 mio tonnes.
The share of freight traffic includes river and maritime transport: river - 12,756 tonnes, maritime - 45,622 tonnes.
Based on the report 2016, freight traffic of the Black-Sea ports and container terminals (Ukraine, Romania, Russian Federation, Georgia and Bulgaria) handled a total of 2,460,028 TEU, where total volume increase was up to 9.63% against 2015. Whereas, Romania increased its container market share for 4.7 % , but decreased export volumes by 0.1 %33F
33. Handling load containers by Constanta Port during the analysed period is 24.99%. The total share for Romania is about 18.14 % (446.275 TEU).
32 Annual Statistic and report 2017, Constanta Port Authority 33 Black Sea - the geopolitical, economic, social and military importance report

112/158
Figure 135: Comparable analysis of the Black Sea counties container traffic and relevant grow against 2015
Based on the data received from CFR the number of freight trains going to/from Constanta Port were 20,199 in 2017. However more detailed information about further direction and international connection was not possible to obtain.
Constanta participates in a number of international EU programmes and is part of TEN-T corridors:
• EU TRACECA- Trans-Caspian corridor; • LOGMOS EU programme; • Rhine-Danube Corridor; • Pan-European Transport Corridor IV; • International North–South Transport Corridor (from October 2019).
The TRACECA Trans-Caspian corridor Dostyk – Tashkent –Ashgabad – Turkmenbashi – Baku – Tbilisi – Poti connects with Constanta Port as well as with sea ferry connections to Odessa, Varna, Constanta and Istanbul. The countries signed also an agreement on 50% discount on rail freight and ferry transportation of empty wagons34F
34. This makes the route attractive to use. In addition, taxes and fees on transit cargoes were abolished, and measures were taken at national level to enhance the safety of passengers, cargoes, carriers and vehicles along the corridor. However, the rates on the competing corridor through Russia are currently still 1,7 times lower (for cotton, container, grain) and therefore more attractive.
Pan-European Transport Corridor IV links the countries of Central Europe with Turkey, the Near East and Asia. The corridor is the shortest land-bridge connection. It bypasses the former Yugoslavia and the former Brotherhood and Unity Highway (now part of Pan-European Corridor X). The Vidin–Calafat Bridge across the Danube river is one important part of the route. It is one of only two bridges connecting Romania and Bulgaria.
The International North–South Transport Corridor (INSTC) is a 7,200 km long multi-modal network of ship, rail, and road routes for transport of freight between India, Iran, Afghanistan, Armenia, Azerbaijan, Russia, Central Asia and Europe. The objective of the corridor is to increase trade connectivity between major cities such as Mumbai, Moscow, Baku, Astrakhan, Tehran, Bandar Abbas and Bandar Anzali. The foreign ministers of Romania, Azerbaijan, Georgia, and Turkmenistan have signed a declaration for the promotion of a multimodal corridor for the transport of goods between the Black Sea and the Caspian Sea (Caspian Sea – Black Sea International Transport Corridor project – ITC-CSBS). It will link the ports of Constanta (Romania), Poti (Georgia), Baku (Azerbaijan) and Turkmenbashi (Turkmenistan)35F
35. But, so far there is no strategy for promoting freight traffic.
34 Optimization of Central Asian and Eurasian Inter-Continental Land Transport Corridors, 2019 35 Post Europe Publication, 2019 „Expansion of the International North-South Transport Corridor capacity“

113/158
Figure 136: Overview of international directions and connections to other ports in Black sea and Asian countries
The objective is to foster cooperation between members, improve border crossing procedures (alignment), identify traffic flow with relevant gaps analysis, as well as provide recommendations on further development to improve the competitiveness of Constanta Port: NUMBERS OF ADVANTAGES COMPARE TO OTHER EU PORTS:
• Providing modern facilities and sufficient depth for accommodating largest vessels passing through the Suez Canal;
• Located on crossroads of commercial routes connecting the markets of the Central and Eastern European countries;
• Short and cheaper access (compared with routes with Nord Europe ports access) to the Pan-European Corridor VII;
• Strong connection to all available transport modes (as well as within 2 corridors): railway, road, river, airway;
• The new Container Terminal on Pier II South gives additional operating capacity; • Ro-Ro and Ferry-boat terminals suitable for the development of short sea shipping serving
the Black Sea and the Danube riparian countries; • Future expansion for possible multimodal terminals development/planned.
Nevertheless, it is also important to consider some of the existing issues (shortcomings) which might have an effect on corridor inefficiency36F
36:
• Inefficient border crossing procedures (political level). The problems were identified on Curtici station. Harmonisation procedure is highly required.
• There are 2 rail tracks which connect the port with RFC 9 RHD network. Out of 2 lines only 1 is currently in operation.
• Road quality is poor. The connection to harbours is sometimes limited. Modernisation and rehabilitation are required.
4.5.1 Constanta Port development projects 2019
The Constanta Port Authority currently implements EU-financed projects (“POIM –LARGE INFRASTRUCTURE OPERATIONAL PROGRAMME 2014 –2020”) for port infrastructure modernisation and extension purposes.
36 Management Board Meeting in Bucharest 8-9 Oct 2019 / Constanta Port Presentation provided by PMO

114/158
These are: • Modernization of port infrastructure by providing deeper depths of the basins and channels
and higher navigation safety within Constanta Port (49 MIO EUR). Current implementation status - 33%;
• Implementation of Deep-Water Specialized Berth (5,5 MIO EUR). Current implementation status – 100%;
• The upgrade of infrastructure and environmental protection in the Port of Constanta (15 MIO EUR). Current implementation status – 100%;
• Island Development - berthing quay on the Northern side of the artificial island, including the arrangement of the link area between port side and Island, to serve the future industrial platform (74 MIO EUR).
Additionally, during the period of 2021- 2027 the following investments are expected:
Figure 137: Constanta investment projects, 2021-202737F
37
4.6 Review of IWW ports along the river Rhine
With the Port of Constanta being the anchor in the east for the RFC 9 RHD, the IWW ports along the river Rhine in the west are the counterpart with their connection to the IWW network there. This relates mainly to the ports of Karlsruhe, Mannheim and Ludwigshafen.
37 The Constanta Port Authority presentation: „Ongoing projects under POIM“

115/158
4.6.1 Karlsruhe Inland Port
Rheinhafen Karlsruhe consists of six harbor basins with a water surface of 71 ha; a usable shoreline of 14 km; 6,670 m of quayside for transhipment purposes with crane-handling possible on 4,480 m. One large container terminal is located here which can handle single vessels of up to 135 meters in length and towboats with barges of up to 180 meters in length connecting the harbor with the major seaports on the Rhine-Maas-Delta. Coal is being handled here as well as oil at the nearby oil port (one harbor basin) and the harbor itself. Both commodities forming the majority of freight handled here with nearly 6.0 Mio tonnes per year. In addition, three concrete plants are served, which receive their raw materials by ship. The port provides the following infrastructure38F
38:
• 19 loading bridges and gantry cranes 4 to 25 t • 2 container cranes 50 t • 1 ro-ro ramp • 2 grain silos with loading devices for trucks, rail and ship • Various mobile cranes 20 to 250 t • 1 coal belt loading plant for rail • 1 calcine silo plant with truck, train and ship loading • 7 loading facilities for mineral oil
The volume handled at quayside was 6.7 Mio. tonnes in 2016 and 7.3 Mio tonnes in 2017. By rail 1.4 Mio tonnes were handled in 2016 and 1.7 Mio tonnes in 2017.
4.6.2 Mannheim Inland Port
The Rhein-Neckar-Hafen Mannheim at the confluence of the Rhine and the Neckar in Baden-Wurttemberg consists of four port areas (Handelshafen, Rheinauhafen, Altrheinhafen and Industriehafen) with 14 harbor basins and 3 river docks. With a total area of 1,113 hectares, the port of Mannheim is the largest inland port in Germany in terms of area. As a trimodal transport hub at the intersection of road, rail and two federal waterways, the port of Mannheim has various transshipment facilities such as three container terminals, a roll-on roll-off facility in the Rheinauhafen and a KLV terminal in the trading port. The port provides the following infrastructure39F
39:
• 78 loading and crane gantries (24 on the quayside) • 37 portal cranes (25 on the quayside) • 14 heavy duty cranes up to 150 tonnes (10 on the quayside) • 4 special transhipment systems for containers • 52 mobile cranes • 210 other lifting systems • 24 marine loaders • 226 hectares of outside storage and handling area • 119 hectares of roofed storage area. • 1,527 storage silos and bunkers for grain, coal, gravel, cement, fruit, feed and other bulk
goods with a capacity of over 385,000 tonnes • 1,078 tanks for liquid based products like mineral and edible oils with a capacity of almost
1.5 million tonnes
The volume handled at quayside was 9.6 Mio. tonnes in 2017 and 7.4 Mio tonnes in 2018.
4.6.3 Ludwigshafen Inland Port
The Ludwigshafen Rheinhafen is the fifth-largest inland port in Germany with a port area of 120 hectares and more than 14 km quayside. Together with the neighbouring inland port of Mannheim 38 http://www.rheinhafen.de/rheinhaefen-karlsruhe/der-rheinhafen/die-hafenanlagen/ 39 https://www.hafenmannheim.de/de/wissenswertes/infrastruktur-des-hafens.html

116/158
(with a close corporation since 2001), it forms the second largest inland port in Germany. With BASF located next to it, it serves one of the largest chemical locations in Germany. The port provides the following infrastructure40F
40:
• 2 container loading bridges with 62 t capacity • 1 container crane for railway handling with 52 t capacity • 9 cranes with a capacity up to 25 t • 1 mobile Harbour Crane Capacity 104 t • 1 hydraulic excavator • 3 belt conveyors loading systems • 1 bulk and suction pipe system • 19 Liquid loading/unloading facilities • 390,000 m² outdoor storage • 38,200 m² warehouse storage • 31,000 tons of grain storage • 140,000 m³ tank storage
The volume handled at quayside was 5.7 Mio. tonnes in 2017 and 6.3 Mio tonnes in 2018. With 800,000 tonnes handled by rail in 2018.
4.7 Description of factors influencing the choice of transport mode
As the marketplaces change and shift, customers expect greater service flexibility and efficient (fast) operational speed from freight operators. Variance elimination constitutes a further major customer requirement as this increase’s reliability levels.
Price and timing reliability are the most paramount criteria for customers’ choice of mode. If road offers a more cost-effective service compared to rail, customers would switch to road transport. This is in line with the consultants’ findings and experience from similar studies as well as from other available studies including reports from freight forwarders offering rail freight services confirming this as well.
Next to price other criteria influencing the choice of mode include: transport time, transport quality (where several factors can be identified and include reliability, punctuality, safety & security and travel information).
It is important to mention, that political issues have a strong influence as well on service quality and reliability. This relates very much to the established border crossing procedures, legal compliance and using same electronic (digital) interfaces. Different standards and non-harmonized procedures lead to long waiting times at the border, which results in a lower attractiveness compared to other modes of transport due to its inefficiency.
Choice of mode is also depending on other variable factors, like:
• characteristics of the goods to be transported (direct influence in relation to mass, unitary value, time-sensitivity and the frequency of transports. Transportation of bulk goods has different requirements to transport modes than high-value chemical or pharmaceutical goods, for instance, or individually packaged goods);
• needs and necessities of the shipping company (size/turnover, possession of or access to a railway interchange or truck fleet, will influence heavily the convenience of one mode versus another);
• characteristics of the transport network of each transport mode (availability of terminals and shunting yards, travel costs, travel time, reliability, security as well as possible technical and infrastructural bottlenecks);
40 https://hafenludwigshafen.info/?page_id=16

117/158
Each transport mode offers various services and capacity, which can have positive or negative effects on qualitative factors. It is almost impossible to forecast what kind of transport offer would be the most suitable for customers, because it depends only on their requirements, demands, budget availability, type of goods transported, as well as distance. In some transportation models the best solution would be an integrated approach of using rail and road transport (intermodal door-to-door transport) in pre-, main- and on-carriage.
Prices for passenger transport is usually set by each private company clearly identifying it by distance and service quality required.
Prices for freight transportation are variable. A set of official rates for rail, road or IWW does not exist. Each actor involved has its own approach to identify a price based on the respective business model. This might be based on connections offered, operational cost and distance of goods to be transported. The price could also vary between countries.
To generalise, the variation of cost strongly depends on distance and transportation modes. Thus, these modes should be compared within main-carriage. Standard variation could be drafted using a line, as a cost variation of each mode which will grow base on distance. The figure shown below includes C1- road, C2- rail and C3 – maritime (or IWW) transport costs. The typical distances applied for each mode were set. As we can see road transport has a lower cost for shorter distances below 500 km, and probably better flexible service, but its cost increases faster than rail and maritime costs when it comes to distances of more than 500 to 750 km. At a distance D1, it becomes more profitable to use rail transport than road while from a distance D2 maritime transport becomes more advantageous.
Figure 138: Costs variation per mode and distance41F
41
D1 and D2 are referred as break-even distances. Although the above relation is rather straightforward, in reality there is a bias towards road due to the interchangeability of transport modes. For many origins and destinations, as well as short domestic connection modal options such as rail or maritime/ IWW may currently not be available and thus cannot be considered as an option. Therefore, a modal option with a higher cost will be used. For any international corridors, which connect Europe and Asian countries maritime/ IWW - rail are mostly chosen. In this case it is the most efficient mode combination and more competitive to costs offer. Since rail and maritime transportation are discrete networks only accessible through terminals, most locations might involve a road transportation segment, which changes the cost structure.
The transport price varies not only per transport mode, but also per cargo type and transport service unit42F
42.
41 The Geography of Transport Systems, FOURTH EDITION, Jean-Paul Rodrigue (2017), New York: Routledge, 440 pages. ISBN 978-1138669574 42 Transport service unit- means suitable to the cargo type service (see the Figure of modal split options below)

118/158
Figure 139: Modal split options overview and possible complementary options
• Road transport (trucks) – highly flexible mode which is capable to carry almost every type of cargo over short to medium distances. Trucks services are commonly used in urban freight distribution since they carry a variety of cargo (in boxes or pallets) servicing a fluctuating demand. Less than truckload carriers usually consolidate and deconsolidate loads coming from different customers, which is common in the courier, express, and parcel business. Service truckload transportation carries large volumes that have been broken down into the largest possible truck load units, where to fulfil an order several truckloads are required. The variety of modal options is related to the technical requirements to carry specific cargos such as bulk, liquids, containers, swap-bodies, and trailers. Trucks using chassis are capable to carry domestic containers. For the short distance this mode of transportation could not only be a cheaper option, but also time efficient. Nevertheless, high infrastructure quality and well-set connection between roads are required
• Rail transport – carries the same cargo between origin and destination, within block trains, single wagon traffic, or combined (intermodal) traffic. There can be trains for e.g. coal, grain, cars or containers, swap-bodies, and trailers. Trains can also be assembled with different loads servicing different customers, origins and destinations. This is however more costly, time consuming, and requires a suitable network structure. Containerization had significant impacts on rail transportation and spurred the development of intermodal rail services.
• Maritime and IWW. This mode uses the principle of carrying mostly break bulk, dry bulk, liquids, vehicles (RoRo) and even liquid natural gas by specialized ships. Container shipping has also become a maritime modal option supporting. (Global) maritime transport is the cheapest option for long distance transportation per loading unit.
As mentioned above, depending on the circumstances transport modes could be competing or complementary over the transport market and thus in transport chains. Competition depends on

119/158
the type of transport mode suitable for cargo, transhipment, distance (domestic or international connection), performance and market development.
Figure 140: Overview of mode competitiveness and mode complementary factors
1. Transport mode: For passenger or freight transport all modes could be complementary to each other since they are designed to carry both flows. However, when it comes to infrastructure availability (time and quality) both passenger and freight would prefer the most suitable/competitive offer. For freight transportation the usage of infrastructure such as terminals and routes (availability, quality, safety) could be very important. In this case a road transport (car, bus, etc.) will compete with train, particularly in situations of congestion where each vehicle will impair the mobility of others.
2. Geographical market: Domestic transport modes are not designed to service international markets and vice versa. There is no significant example of competition between domestic and international markets. Domestic transport often uses road transportation since it is the cheaper and more flexible option. Intermodal transportation improves the geographic complementarity by enabling a higher level of interaction between systems within an international transport chain.
3. Performance: Criteria include a time and cost perspective which is difficult to reconcile. For long distances, complementarity prevails, particularly for freight as perishable (time sensitive) shipments are usually routed through air transport (some instances of long- distance trucking) while cost sensitive shipments are routed through maritime or rail transport using economies of scale. For passengers, there is neither competition or complementarity for long distances as the only practical mode remains air transport (it becomes a matter of integrating international and domestic segments). For shorter distances, competition prevails as different modes are possible for the concerned passenger and freight traffic.
Reviewing pricing, as well as service offered approach in Europe, the most competitive transport modes are rail and road. In Europe both infrastructures are well developed and maintained. The last improvements of road infrastructure have resulted in decreasing transport costs though years. Therefore, road transport service provides cheaper and flexible door-to-door service. National road pricing schemes (Germany, Austria, Czech Republic, and Slovakia), on the other hand result in higher costs of road transport. Policy proposals (e.g. changing the Euro-vignette directive, changes

120/158
in permitted vehicle dimensions) have the potential to modify road transport costs43F
43. There are elastic and sensitive prices for each transport mode. The price variates depending on:
1. Tonne kilometres: • Change in mode; substitution to and from rail, inland shipping and maritime shipping. • Changes in transport demand; due to the changes in tonne-kilometre prices shippers may
choose other supplier/receivers or other production locations. These decisions may lead to changes in total transport demand (without changes in tonnes shipped).
• Changes in commodity demand; if the shippers cannot ‘internalise’ the transport price changes by themselves, they must increase the price of the goods they offer. As a consequence, consumer demand will fall and thereby total transport demand.
2. Modal change: the variance in the estimates of tonne-kilometre price elasticities with regard to mode change can largely be explained by differences in geographical regions considered. This also includes better availability of preferred transport mode. When railway transport is not well developed, road transport will offer cheaper price set.
3. Changes in commodity demand. 4. Fuel price (for road and shipping): The price variation influence on:
• Total fuel demand is influenced by changes in fuel efficiency, transport efficiency and transport volumes.
• Vehicle kilometres are influenced by changes in both changes in transport volumes and transport efficiency.
• Tonnes-kilometres are only influenced by changes in transport volumes
Based on the online research and available statistics, international studies are showing that road transport is still competitive and preferable mode, offering cheaper price and good quality service. In Europe international cargo flow by road is increasing, as per available statistic the mode usage is up to 6,4% more between 2016 to 201744F
44. Per corridor country the growth rate of international cargo per road transport is45F
45:
• France: 3,6% • Germany: -0,1% • Austria: -0,7% • Czech Republic: -3,4% • Slovakia: -9,9% • Hungary: 1% • Romania -0,1%
In 2017, international rail freight transport in the EU was estimated at 416 billion tonne-kilometres, up 3.2 % from the previous year46F
46. Summing up the outcomes, each mode used for international cargo traffic was judged based on the given criteria (+ advantage, - disadvantage, 0 medium).
Criteria Rail Road IWW
Time 0 + --
Price 0 + ++
Quality: Punctuality + 0 -
Quality: Flexibility - 0 ++
Table 13: Analysis of transport modes per given criteria
43 Price sensitive analysis on road and rail transport. Report 9012-1 44 EU statistic report, Average vehicle loads for total road freight transport, 2017 (in tons) 45 Average vehicle load for total road freight transport in EU countries compare to 2016. Eurostat statistic
https://ec.europa.eu/eurostat/statistics-explained/images/9/9e/Average_vehicle_loads_for_total_road_freight_transport%2C_2013-2017_%28tonnes%29-upd.png
46 Eurostat railway international freight traffic, 2016- 2017

121/158
• Rail scores medium on time and cost but has an advantage in terms of predictability/punctuality and a disadvantage in terms of adaptation/flexibility. Rails have an average level of physical limitations (which directly depend on infrastructure availability and accessibility in terms of capacity compared to road transport) and a low gradient is required, particularly for freight (thus saving the operational costs for transport provider and insuring steady speed). Heavy industries are traditionally linked with rail transport systems, although containerization has improved the flexibility of rail transportation by linking it with road and maritime modes. Rail is by far the most efficient land transportation mode with regard to load capacity with a 23,000 tons fully loaded coal unit train being the heaviest load ever carried in a single train.
• Road transport quality can be efficient in time and quite cheaper as rail. Besides, it encompasses some more components, such as predictability (Will goods arrive at the scheduled time, based on the border crossing procedure and infrastructure quality?) and adaptation (Are alternative routes available? Can varying transhipment volumes be accommodated? Are several departure times available?). Road transportation has an average operational flexibility as vehicles can serve several purposes but are rarely able to operate outside roads. Road transport systems have high maintenance costs, both for the vehicles and infrastructures. They are mainly linked to light industries and freight distribution where rapid movements of freight in small batches are the norm.
• IWWs’ high score in terms of flexibility can be explained by this mode’s advantage to offer varying shipment sizes, variable available capacities and frequent departures. For short-sea shipping it depends largely on the ship type. Furthermore, where IWW can rely on a modern terminal infrastructure (high degree of automation and long opening hours), flexibility of this mode is further enhanced. Maritime transportation has high terminal costs, since port infrastructures are among the most expensive to build, maintain and operate. These high costs also relate to maritime shipping where the construction, operation and maintenance of ships is capital intensive. More than any other mode, maritime transportation is linked to heavy industries, such as steel and petrochemical facilities adjacent to port sites. Maritime transport is used for global purposes mostly, allowing trading a wide range of goods and commodities.
Infrastructural bottlenecks along the corridor are also playing a key role in the attractiveness of any available transport service and therefore need to be addressed to change modal split from road to rail. Generalising mode specification the Consultant could propose:
Figure 141: Specification of transport mode in relation with good size and distance47F
47
• In general, intervention on infrastructure and services in a currently well-connected network, aims at reducing travel costs and increasing service quality in terms of pre-trip and on-trip information, security & safety, reduction of delays and time-to-market reliability. These measures will induce small and medium companies to choose more often railway services instead of other alternatives.
• In a well-connected network time and cost reduction can be achieved in a higher efficiency of intermodal nodes, the reduction of bureaucracy as well as in an increased use of harmonised core tools for international path allocation and for information regarding train delays.
47 Consultants’ summary analysis and obtained experience, including gaps from previous TEN-T study

122/158
• Harmonisation of procedures and standards, tariffs improvements and business model planning of the corridor development and service offered,
• Improvement of important railway sections with the removal of existing bottlenecks will allow for more numerous, longer and heavier trains (both passengers and freight).
• Qualitative infrastructure improvement should be executed as well48F
48.
4.7.1 Description of quality parameters per transport mode
Transport logistics quality can be defined as the degree to which the performance of the freight transport operations, across modes in the supply chains, meets stated service criteria, and should incorporate the elements of reasonable price, transit time, punctuality, reliability and sustainability.
The quality parameters of transport service are also an important determinant for demand. The transport infrastructure, transport technology, transport and transportation processes, information systems and human resources are the factors that affect the quality of transport services. Most of quality parameters for rail, road or IWW should be set by the company which offers transport service.
For quality parameters of freight railway transport EU proposes a regulation of compensation, in case of non-compliance with contractual quality requirement for railway freight service (2003, to the industry-led UIC/CER/CIT Freight Quality Charter).
To determine the competitive role of the different transport modes available to freight transport, charges for infrastructure use should be taken into consideration too. This includes access charges for rail infrastructure, road tolls, port and terminal charges etc. In transportation research this is referred to as internal costs. Furthermore, external costs caused by damage to goods, congestion, noise and traffic accidents affect the final transport price as well.
The importance attributed to transport time also strongly depends on the industrial sector and type of goods that require transportation. Factors such as supply chain management and just-in-time delivery are of major importance in this respect. Modal choice, as outlined in the previous sections, is clearly influenced by transit time requirements.
There is often a close interconnection between transport time and certain quality factors such as flexibility, reliability, and availability. With regards to reliability it is sometimes not so important how much transport time a cargo will take, as long as it arrives at the time it needs to, as one stakeholder stressed.
Following the Consultant’s deep insight knowledge, and outputs from similar projects the most important parameters for customer are:
1. Transportation price. 2. Transport time – usually time constitutes one of the important priorities. In railways,
transport time is defined based on the transport law (national or international) as a delivery time (or time period for consignment). On roads and IWW, transport time is determined based on the agreement between carrier and customer.
3. Transport safety and security – it means protection of goods against damage and loss. For road transport this connects to: transport safety – expressed
(i) on the number of accidents. In this case railway transport has a better position compared to road transport.
(ii) as damage of goods during transportation. In this case railway transport is in the worst position among all transport modes.
48 Qualitative infrastructure means maintaining the existing infrastructure alignment including track position and geometry with engineering-level
accuracy throughout the corridor, as well as implementing suitable IT system (for border crossing procedures).

123/158
4. Reliability of carrier – it means fulfilment of delivery times and contractual conditions. Reliability in railway transport is conditional based on timely notice of loading in station with relevant authorisation for transport. In the road transport reliability depends on the vehicle fleet of the carrier.
5. Information availability – it means common designation about the location and condition of the consignment. It also includes the information about the carrier via their internet portal or other marketing tools. This includes possibility to obtain the relevant information about consignment in real time. In road transport, this is already a basic standard. In railway transport, this kind of service is more complex and not all railway undertakings offer this service for their customers.
6. Flexibility – understood as adaptation to customer’s needs. Accommodating negotiation of carrier, with a view to satisfy a customer’s needs, is very important. Carriers are aware that offering such flexibility gives them a higher profit margin in transport market. Based on this fact, carriers may offer to satisfy customer’s requirements with quality services.
7. Additional services – these services include activities as loading and unloading of goods, determination of weight of goods, writing the consignments note, cleaning the wagons, etc. These activities, based on the questionnaire survey, taken from the customers of transport services, have led to additional services in railway transport. However, these services are also charged.
As each freight transport mode (e.g. rail, road, inland waterways) differs in its unique selling points, their ratings of these criteria will differ too. The following table rates these major criteria for the study’s main transport modes for freight. (+ advantage, - disadvantage, 0 medium)49F
49.
Criteria Rail Road IWW
Transit time 0 + -
Punctuality + 0 -
Reliability + 0 0
Flexibility - + 0
Information and communication (Tracking systems) + 0
Safety and Security + 0 +
Table 14: Analysis of transport modes per given criteria - II
In the end it is up to the customer to decide which transport mode to choose based on the above-mentioned criteria. This decision process includes several steps (highlighted in the following figure). Final decision depends on parties involved and if third-party logistic providers are involved a direct choice will not necessarily be made by the end customer. Decision will be based on overall principles on time, price and quality.
49 Evaluation is based on the Consultant experience, and outcomes from similar projects

124/158
Figure 142: Decision making process from a customer perspective

125/158
4.7.2 Analysis of quality service offered
4.7.2.1 Current service quality offered based on CSS 2018
The Customer Satisfaction Survey (CSS) for Czech- Slovak corridor (Praha – Horní Lideč / Ostrava – Žilina – Košice –– Čierna nad Tisou / Maťovce (Slovak/Ukrainian border part) is available for 2018. The missing information on the rest of the corridor countries was filled with the results of CSS50F
50 RFC 7 (2018) where possible.
The objective of both surveys was to provide a detailed overview, as well as a gap analysis, on corridor function, offered service quality, potential users and possible products based on the customers feedback (through harmonised questionnaires). Overall with regard to RFC 9 RHD the following points were mentioned:
• No strong advantage or priority of RFC trains • Each country has its specific rules and legislation, hence it is not possible to control it
from one central place • Customer unfriendly layout of PCS • Different traction systems • Some RUs don't use PaPs at all • TCRs sometimes affect PaPs • PaPs don't meet the customer's needs • Current offer of reserve capacity is on satisfying level
4.7.2.2 Customer expectations and needs
The needs of the customers can be summed as follows: • Insufficient schedule and deadline for responding application on reserve capacity does not
meet current needs • There is a high interest for developing Corridor One-Stop Shop (C-OSS) to allocate
capacity for all cross-border freight transport on the corridor • Current needs of customers do not meet the current offer well (not many benefits so far) • Wide support (72 %) for future (3 to 10 years) centralization of Corridor One-Stop Shops. • Most of RFC 9 RHD customers (83 %) clearly prefer a short survey rather than long
sophisticated common surveys. • Top 3 needed facilities that were mentioned are freight terminals, storage sidings and
intermodal terminals The expectations of the customers can be summed as follows:
• RFCs harmonization and centralization • Improving products offer • Improving TCR coordination • Clear definition of priority rules for planning and implementation of corridor trains. • Providing more advantages for corridor trains.
50 Customer Satisfaction survey 2018, published by rfc7.eu

126/158
4.7.3 Summary of advantages and disadvantage of available transport modes
In addition to the above factor’s analysis, detailed table with advantages and disadvantages of each reviewed transport mode is presented:
Mode Advantages Disadvantages
Rail
• Lower costs (on a weight basis) compared to road traffic compared to road
• Strong in the transportation of mass goods, such as steel, ore, construction goods
• Long-distance haulage possible
• Punctuality and reliability due to scheduled traffic (if no unexpected delays due to weather, construction works occur)
• High levels of safety & security
• No restrictions for Sundays or holidays
• Direct links to the cities, avoiding city traffic
• Energy efficient, especially when
• carrying capacity is fully utilised over long distances
• Possible stable average operational speed, therefor time planning efficient.
• Sustainability
• Mainly used by night due to competition with passenger traffic
• Dependence on marshalling yards, stations, terminals
• Different traction systems and electrification impede cross-border traffic
• Necessity for minimum loading
• Lower possibility for door-to-door handling, less flexibility
• Batch-production (does not allow for smaller loads)
• Infrastructure bottlenecks
• Various certification processes
• Strong cooperation with foreign rail freight companies necessary
Road
• Dense road network
• Utilization by day and night
• Last-mile connectivity
• Fairly homogenous road quality and network in Europe
• High service frequency
• Prompt delivery
• Cost-effectiveness (although as a result of its reliability and door-to-door service, it is more expensive than rail transport)
• Adaptation to production processes possible
• Many medium-sized companies; also expanding from Eastern Europe (= high customer choice)
• Difficulty to meet high quality expectations
• Many road carriers are sub-companies
• Decreasing value of mere transport services
• No traffic on Sundays and holidays
• Not everywhere well-maintained or rapidly improving infrastructure
• Difficulties on border crossing (in case of non- harmonised procedures)
• Limited carrying capacity
• Possible road accidents
• High energy consumption which may be expensive
Inland
Waterways
• Sustainability of mode
• Low traffic jam risks
• Less competition for space with passenger traffic
• Good hinterland connection and connection to seaports
• Has high capacity reserves regarding infrastructure
• Suitable for transportation of dangerous goods (30% are handled via IWW)
• Traffic increase from and to Rotterdam
• Ro-Ro Transportation
• Opportunities lie in the development of IWW terminals towards intermodal connections and hubs
• Growth potential for combined traffic with short-sea shipping
• Easily affected by natural disasters, such as flooding
• Need for docks and docking stations
• Less networking
• Affected by seasonal differences
Table 15: Advantages & Disadvantages per transport mode

127/158
4.8 Train path allocation
4.8.1 Current situation
Railway undertakings (RUs) can order infrastructure capacity for their trains at the Infrastructure Manager (IM). This infrastructure capacity is called the legal basis as train paths. Train paths can be ordered either for a full year or at short notice during a running annual timetable. The latter happens on the basis of residual capacity. This is the track capacity remaining after the allocation of train paths for an annual timetable. In order not to be dependent on residual capacity, all RUs endeavour to deposit their orders as far as possible in an annual timetable.
An annual timetable starts in mid-December and lasts 12 months. If a RU wants to order train paths for an annual timetable, this must be done at least eight months before the timetable change. RUs therefore order train paths eight to 20 months before the train actually departs. This basically works in passenger transport, because the RUs bring offers to the market, that usually are clearly responding to a market demand. In freight transport, however, it is highly problematic to order train paths eight to 20 months before the train journey, unless the RU has fixed and reliable contracts with the end customers.
In practice, freight RUs do order train paths speculatively and usually more than they need. In fact, only 25% of train path orders in freight transport are stable. 75% of the orders are changed several times before one third of these train paths are then cancelled in the end.
The European IMs suffer repeatedly under this ‘speculative’ ordering behaviour of freight RUs. It leads to overbooking in large parts of the route network, to high and useless resource expenditure through the constant change of orders and it prevents an efficient and flexible use of the infrastructure capacity in the end. All in all, this ordering behaviour leads to blocked and thus wasted infrastructure capacity along the corridor.
4.8.2 Timetable Redesign Project (TTR)
The European IMs therefore decided in 2017 to implement the TTR project and run it under the umbrella of RailNetEurope (RNE) together with the RUs and their organizations Forum Train Europe (FTE) and the European Rail Freight Association (ERFA). The key findings from the customer surveys at the beginning of the project were:
• the passenger RUs wish to have their train paths assigned earlier, six months before the timetable change (currently three months); they are also prepared to place their route orders earlier than today (currently, eight months before the timetable change).
• For the freight RU, the current order time is too early, eight months before the timetable change; they wish for later order times, preferably at any time.
Both wishes of the market are satisfied with TTR. However, this presupposes that the IM reserves sufficient infrastructure capacity for goods traffic before commencing the ordering process and then also protects these capacities. The capacity for passenger transport is not restricted - but not extended. By reserving their capacity for freight, IMs (and not RUs) are regaining blocked capacity that they can use flexibly and efficiently at any given time
The three current TTR pilots in Europe (including Munich-Innsbruck-Verona) have shown that the order behaviour of the freight RU has changed only insignificantly. And this despite the fact that the IMs in the pilot boards have worked with the RUs to develop a capacity model that defines the capacities for the respective transport segments (freight, passenger traffic) and construction work. In order to achieve the desired effect, the IMs will have to create incentives, i.e. cancellation and modification fees, which are also noticeable.
In order to achieve the climate goals in the European Union, the market share of rail freight transport must be increased from the current 18% to 30% in the next 10 years (30 by 2030). To achieve this, there is a need for additional short-term capacity for freight transport by rail, which

128/158
cannot be achieved with investment projects, but primarily through organizational measures. TTR ensures these additional capacities and is therefore the main contribution of European railway infrastructure managers to achieving the climate goals. The latest time to implement TTR is December 2024, according to the project schedule. Earlier implementation is possible and is targeted by the ÖBB for 2022.
4.9 Main bottlenecks and missing links
4.9.1 General operational and administrative bottlenecks
In general, it can be stated that – similar to other corridors – investments’ implementing (as described in chapter 3.5.4.1., page 91), general operational and administrative bottlenecks exist, which limits the competitiveness of rail transport. This relates to the harmonisation of national regulation, the timely exchange of information and planning coordination and the implementation of the C-OSS. This is reflected in the available CSS and comments from the first RAG/TAG-meeting in Bucharest.
In addition, reference is being made to the Rail Technical and Operational Issues affecting Interoperability – Logbook51F
51. This Logbook project was initiated in March 2017 by the EU Commission with the objective to identify interoperability barriers hampering international rail freight traffic, especially along the Rail Freight Corridors. The Issues Logbook has been set up as a tool for signalling information on technical and operational issues.
It lists the key technical operational issues encountered by rail freight. This compilation of issues allows the assignment of tasks to the most relevant and competent actors, and it will avoid duplication of work on the same problems through several channels. It will also enable the prioritisation of issues according to their impact and scale, as well as monitoring the progress achieved.
The logbook is mainly "fed" by on-the-ground experience of the RFCs, with further inputs from the other rail actors, ERA and the Commission. This Logbook only deals with technical operational issues. Language barriers, train driver licenses and market related issues are not part of this logbook. Nonetheless the logbook is a good institutional instrument to work out feasible EU-wide solutions for bottlenecks identified under the Priorities No.1, No.2 and No.3. RFC 9 RHD should make use of this initiative.
4.9.2 Infrastructure bottlenecks
The main challenge with regard to infrastructure bottlenecks is the overall rehabilitation and upgrade of existing infrastructure in line with TEN-T requirements in terms of electrification, allowed axle load, line speed and admissibility of 740 m-long trains. Currently 3.61 % of the total rail network of the Corridor achieve this standard52F
52. Overall, according to the CEF Report, the main obstacles have been covered through the on-going CEF-Actions. Further details can be found in chapter 3.5.4.1. Railway links with regard to the needed investments in the infrastructure to remove these bottlenecks. The border crossing between Hungary (Lőkösháza) and Romania (Curtici) is a Schengen to Non-Schengen border and one of the main current “operational” bottlenecks along the RFC 9 RHD. According to the results of our survey, other “capacity” bottlenecks exist in Germany, e.g. between Frankfurt and Würzburg or between Nürnberg and Regensburg.
A profound analysis of bottlenecks along RFC 9 RHD will be undertaken in a separate study to provide an in-depth insight into existing bottlenecks and mitigating measures. taking into consideration the outcome of the already available studies, work plans, such as the CNC Workplan (2018)
51Rail Technical Operational Issues Logbook https://ec.europa.eu/transport/modes/rail/interoperability/interoperability/ope-tsi_en 52 Report: CEF support to Rhine - Danube Corridor March 2019

129/158
5. EVALUATION OF THE FUTURE TRANSPORT MARKET DEVELOPMENT ON THE CORRIDOR 5.1 Methodology
The traffic forecast is based on findings of the analysis of current situation and the PEST analysis. The results of the comprehensive PEST analysis were described in detail in chapter 3 above. The major socio-economic factors, having a special influence on the transport development in the corridor for the short-term forecast is the overall GDP development.
The forecast is based on the amount of trains running from country to country, crossing an international border. Here, the share of trains is split into the three categories:
• BT – Block Trains • CT – Combined Transport Trains • SW – Single Wagon Load Trains
In a next step the average gross and net tons, as well as wagons per train will be combined with the amount of trains. The individual multiplication of trains and average tons transforms the basic data from trains into tonnage transported in 2017 per rail. This approach was chosen as forecasts using a Compound Annual Growth Rates (CAGR) for the time span between 2017 and 2022 can only be made on tons and later be transformed back into number of trains.
The utilization of trains has to be considered here as well. Additional tons gained (through growth) will first be covered by increasing the utilization of existing trains before establishing additional services.
The following figure gives an overview on the approach used.
Figure 143: Forecasting process used

130/158
5.2 Transport volumes per O/D trade lane and train type per 2017
The following table shows the train numbers from one country to another within the corridor. The international trains are separated into the three train types Block Trains, Combined Trains, and Single Wagons.
from / to Austria Czech Republic France Germany Hungary Romania Slovakia
Austria
BT 6,900 4,500 2,100
CT 5,300 1,700 100 800
SW 4,300 900 900
Czech Republic
BT 1,300 5,000
CT 100 100
SW 800 1,500
France
BT 100
CT 100
SW
Germany
BT 6,100 1,200 100
CT 4,900 100 100 600 200 10
SW 3,600 700
Hungary
BT 5,500 4,900
CT 1,600 800 200
SW 700
Romania
BT 4,800
CT 100 200 300
SW
Slovakia
BT 2,300 5,900
CT 900 500 10
SW 800 700
Table 16: Trains regarding BT, CT, and SW in 2017
Following the amount of trains separated by train type, the following table shows the amount of trains including the average net tons of freight.

131/158
from / to Austria Czech Republic France Germany Hungary Romania Slovakia
Austria
BT 6,542,617 4,266,924 1,991,231
CT 5,182,324 1,662,255 97,780 782,238
SW 2,934,399 614,176 614,176
Czech Republic
BT 1,232,667 4,741,027
CT 97,780 97,780
SW 545,935 1,023,627
France
BT 121,370
CT 70,401
SW
Germany
BT 5,784,053 1,137,846 94,821
CT 4,791,205 97,780 97,780 586,678 195,559 9,778
SW 2,456,706 477,693
Hungary
BT 5,215,130 4,646,206
CT 1,564,475 782,238 195,559
SW 477,693
Romania
BT 4,551,386
CT 97,780 195,559 293,339
SW
Slovakia
BT 2,180,872 5,594,412
CT 880,017 488,898 9,778
SW 545,935 477,693
Table 17: Tons regarding BT, CT, and SW in 2017
5.3 Transport volumes per O/D trade lane and train type per 2022
The following basic assumptions for the forecast have been made for the period from 2017 to 2022:
• CAGR: Average European Union GDP Annual Growth Rate (Eurostat) within the last 2 years (8 quarters within 2018/2019), which equals round about 1,90 percent
• CAGR period: from 2017 to 2022, which equals a growth of 9.87 percent within 5 years
• CT trains are the main driver for further international growth (additional +6 percent on the demand)
• BT trains will have to face a declining demand, as ores, coal, and oil demand will decrease (additional -2 percent on the demand)

132/158
• SW trains will face larger cost pressure and thus have a slower growth (additional +2 percent on the demand)
from / to Austria Czech Republic France Germany Hungary Romania Slovakia
Austria
BT 7,174,845 4,679,246 2,183,648
CT 5,725,632 1,836,523 864,246
SW 3,229,979 676,042 676,042
Czech Republic
BT 1,351,782 5,199,163
CT 108,031 108,031
SW 600,926 1,126,737
France
BT 133,099
CT 77,782
SW
Germany
BT 6,342,979 1,247,799 103,983
CT 5,293,509 108,031 108,031
SW 2,704,168 525,810
Hungary
BT 5,719,079 5,095,180
CT 1,728,493 216,062
SW 525,810
Romania
BT 4,991,196
CT 324,092
SW
Slovakia
BT 2,391,615 6,135,012
CT 972,277 540,154
SW 600,926 525,810
Table 18: Freight volume in tons regarding BT, CT, and SW – forecast for 2022
With the forecasted amounts of tons per direction, the resulting amount of corridor trains handled in 2022 are derived. Within this approach the utilization of trains will be increased first, before additional tons will be used for extra trains. A utilization increase on the train side of 3% has been assumed (improvement of efficiency).

133/158
from / to Austria Czech Republic France Germany Hungary Romania Slovakia
Austria
BT 7,300 4,700 2,200
CT 5,600 1,800 800
SW 4,600 1,000 1,000
Czech Republic
BT 1,400 5,300
CT 100 100
SW 800 1,600
France
BT 100
CT 100
SW
Germany
BT 6,400 1,300 100
CT 5,200 100 100
SW 3,800 700
Hungary
BT 5,800 5,200
CT 1,700 200
SW 700
Romania
BT 5,100
CT 300
SW
Slovakia
BT 2,400 6,200
CT 1,000 500
SW 800 700
Table 19: Derived trains regarding BT, CT, and SW – forecast for 2022
5.4 Amount of trains Country to Country
As already shown in the O-D-Matrix within section 5.2 and 5.3, the filtered corridor trains from country to country can be visualized in the BI-Tool. This allows to include feedbacks and quality checks by the relevant actors. The following figure shows the destinations on a country level for 2022 and the changes from 2017. The thickness of the connecting line indicates the amount of corridor trains between the countries.

134/158
Figure 144: O-D-Graph for corridor trains on RFC 9 RHD in 2022 incl. growth rates from 2017
The following tables are showing the comparison of additional tons and trains for the forecast period. The growth with 7,5 million additional tons will result in 4,500 extra corridor trains along the corridor. Relatively speaking, an overall growth of about 9% in freight per ton will result in a 5% growth on corridor trains overall. Reflecting the increase of efficiency (better load ratio for existing trains) as well.
Category 2017 2022 Absolute growth Relative growth
BT 48,100,600 52.748.600 4.648.000 8,81%
CT 17,084,100 18.875.100 1.791.000 9,49%
SW 10,168,000 11.192.300 1.024.300 9,15%
Total Tons 75,352,700 82,816,000 7,463,300 9,01%
Table 20: Comparison tons regarding BT, CT, and SW – 2017 and 2022
Category 2017 2022 Absolute growth Relative growth
BT 50,700 53,500 2,800 5.23%
CT 17,500 18,420 920 4.99%
SW 14,900 15,700 800 5.10%
Total Trains 83,100 87,620 4,520 5.16%
Table 21: Comparison trains regarding BT, CT, and SW – 2017 and 2022
5.5 Conclusions on the forecast
Based on the results and the overall finding the following conclusions regarding the growth of corridor trains can be drawn from the point of view of the consultant:
• The share of combined transport (CT) and single wagon load train (SW) is decreasing from the Western part to the Eastern part of the corridor.

135/158
• The increase of block trains to the east is also partly due to the fact that single wagon load trains cannot be clearly separated from this block trains within part of the data sets received.
• Taking into account the estimations of potential declining demands on BT and lower growth on SW plus its complex production system, the CT should be the main focus on corridor train development along the corridor (especially regarding the development of access points, i.e. terminals) – but not necessarily the only one.
• The potential for higher growth regarding CT is based on the following facts:
1. The production system itself is a viable solution for future transport requirements and development due to its flexibility.
2. Shuttle-Systems with standardized transport equipment can be introduced.
3. There is potential for increasing the utilization of trains with non-cranable semi-trailer (for instance using the Nikrasa technology).
4. If the CT terminals are upgraded / promoted, then they also directly attract cargo from the road and thus increase the amount of cargo and thus the modal split in favour of rail.

136/158
6. RESULTS OF SURVEY A short stakeholder survey was undertaken to validate the results of the analysis from a practical market-related perspective. Due to the tight deadlines, the original foreseen six interviews were replaced by a standardized questionnaire, sent out to stakeholder representatives (see Annex 5). The return rate was about 55%. The standardized survey was then completed by a personal interview with the speaker of the RAG/TAG-Group.
6.1 Proportion ad-hoc traffic compared to timetable traffic
Currently, the proportion of ad-hoc traffic compared to timetable traffic today is rated between 25-50% by 2/3 of the respondents. 1/6 rated it as 10-25% and 1/6 as 50-75%. Within the years to come (i.e. 2022) the development of this proportion is estimated by half of the respondents at 25-50% and 1/3 estimates it at 50-75%. The remainder couldn’t give any estimates on this.
The respondents’ companies are mainly involved with the transport of mineral products (83,3%), followed by metals and chemical (66,7% each), agricultural products/food and wood/wooden products and buildings materials or others (50% each).
6.2 Criteria for choice of transport mode
Assessing the criteria for choosing the transport mode, for more than 50% of the respondents, transport quality has a very high relevance, followed by transit time (42,9%) and price and environmental issues (14,3% each). For 50% of the respondents the environmental issues are of medium relevance. However, currently approximately 1/3 of the respondents judge environmental issues still of low relevance.
Ranking of criteria for the choice of transport mode in general
Rank Criteria (Very) High Relevance (rounded)
1 Transport Quality 57.1%
2 Transit Time 42.9%
3 Transport Price 14.3%
3 Environmental issues 14.3%
Table 22: Survey: Ranking of criteria for the choice of transport mode in general
Ranking of market-related criteria for the choice of rail as major transport mode for goods.
Rank Criteria (Very) High Relevance (rounded)
1 Flexibility 100.0%
2 Transit Time, Reliability, Transport Price, Availability 85,7%
3 Punctuality, Safety & Security 71,6%
Table 23: Survey: Ranking of market-related criteria

137/158
Ranking of technical criteria for the choice of major transport mode for goods:
Rank Criteria (Very) High Relevance (rounded)
1 Long freight trains 100.0%
2 Fast freight trains 71,4%
3 Interoperability 71,4%
4 Several types of wagons 57,1%
5 High axle load 57,1%
6 Loading Gauge 42,9%
7 Automatic gauge-changing boogies 42,9%
8 Theft prevention 42,9%
Table 24: Survey: Ranking of technical criteria
Ranking of infrastructural criteria for the choice of major transport mode for goods:
Rank Criteria (Very) High Relevance (rounded)
1 Cooperation with IMs 100.0%
2 Network access and Railway network usage costs 100.0%
3 Line capacity and Capacity Terminals 85,7%
4 Opening Hours “Terminals” 71,4%
5 Opening Hours “Route” 71,4%
6 Line speed (Vmax) 57,1%
7 Storage Sidings 42,9%
Table 25: Survey: Ranking of infrastructural criteria
Most important measures to be taken to improve and enhance rail freight traffic:
Rank Criteria (Very) High Relevance (rounded)
1 Longer trains 100,0%
2 Better overall availability and Heavier trains (each) 100,0%
3 Better price and Intermodality (each) 85,8%
4 Higher speed 57,6%
5 Longer opening hours 42,9%
6 Flexible opening hours 28,6%
Table 26: Survey: Ranking of important measure

138/158
6.3 Future development of freight traffic volumes until 2022
More than 2/3 see either a strong increase (33.3%) or an increase of freight traffic (50%). 66.7% see an increase of rail freight traffic, 16.7% even a strong increase of rail freight traffic, but an equal proportion (16.7%) sees rail freight traffic in the coming years to decrease.
strong decrease decrease maintain status quo increase strong increase Not known
Overall Freight Traffic 50.0% 33.3% 16.7%
Rail Freight Traffic 16.7% 66.7% 16.7%
Road Freight Traffic 33.3% 33.3% 16.7% 16.7%
Short-Sea-Shipping 50.0% 33.3% 16.7%
Other 16.7% 50.0%
Table 27: Survey: growth expectations for Europe in general
However, 2/3 of the respondents foresee also an increase of road freight traffic for the East-West-Traffic along Corridor 9 until 2022.
strong decrease decrease maintain status quo increase strong increase Not known
Overall Freight Traffic 16.7% 50.0% 16.7% 16.7%
Rail Freight Traffic 16.7% 16.7% 50.0% 16.7%
Road Freight Traffic 16.7% 66.7% 16.7%
Short-Sea-Shipping 50.0% 16.7% 33.3%
Other 16.7% 50.0%
Table 28: Survey: growth expectations for Corridor 9
In terms of transport volumina in tons the expected growth rates are 5-11% in tons, and 7-15% in turnover (TEU). (Only 1/3 of the respondents came up with concrete figures for Q6 of the questionnaire).
6.4 Additional comments of respondents
• Massive bottleneck investments needed; • Path fees in Romania are on a very high level in comparison to other IM´s; • Stop overtime at border crossing point are too long because of different national
regulations; • Catenary network not completed.

139/158
7. SWOT-ANALYSIS Concerning the short-term forecast period from 2017-2022 a SWOT analysis has been carried out covering the institutional, economic, organisational and technical parameters with relevance for the development RFC 9 RHD.
For the means of this study, four categories have been identified and assessed by SWOT analysis technique:
• Institutional elements are understood to be external factors, such as EU regulations, safety standards, and organizational frameworks in the RFC 9 RHD countries.
• Economic elements refer to overall economic developments in the EU as well as per RFC 9 RHD country, per transport mode and per type of good.
• Organisational elements represent the internal dimension that can be influenced by the IMs themselves (while the institutional elements influence the overall market development and its functions). These include cross-country cooperation, information policies and other general factors.
• Infrastructural, technical and logistical elements include issues such as ERTMS deployment status along RFC 9 RHD as well as bottlenecks and integration into to logistic supply chains.

140/158
7.1 Institutional
Strengths Weaknesses
• High safety standards and safety record (compared to road transport). (Single European Safety Certificate)
• Establishment of RFC corridors
• Slow process of an EU-wide implementation of homogenous technical and safety regulations and rules in all member states.
• Non-harmonised border crossing procedures.
• Restrictive, inflexible and incompatible national train path allocation mechanisms
• Slow process of harmonisation of national legislation based on requirements by EU-Legislation. This is due to general time-consuming decision-making and bargaining processes on national political level
Opportunities Threats
• Market impact through ongoing harmonization of national legislation based on EU requirements
• Implementation of RFC 9 RHD as well as the establishment of an RFC Network
• Environment-oriented development policies of road pricing systems as well as rising fuel costs might contribute to competitive advantage of rail
• EU policy makers prefer rail above road freight for future freight transport policy and try to facilitate better intermodal logistics solutions
• Tightening regulations on noise and pollution affect movement of hazardous goods in urban areas
• Preferential treatment of national RUs by National Railway Authorities
• Stricter regulations on noise and pollution may lead to additional requirements on rolling stock and longer transport times (speed restrictions, night-time closures of certain sections or terminals)
• Promotion of longer trucks and supporting zero-emission trucks in the future could contribute to higher attractiveness and cost reduction of road transport
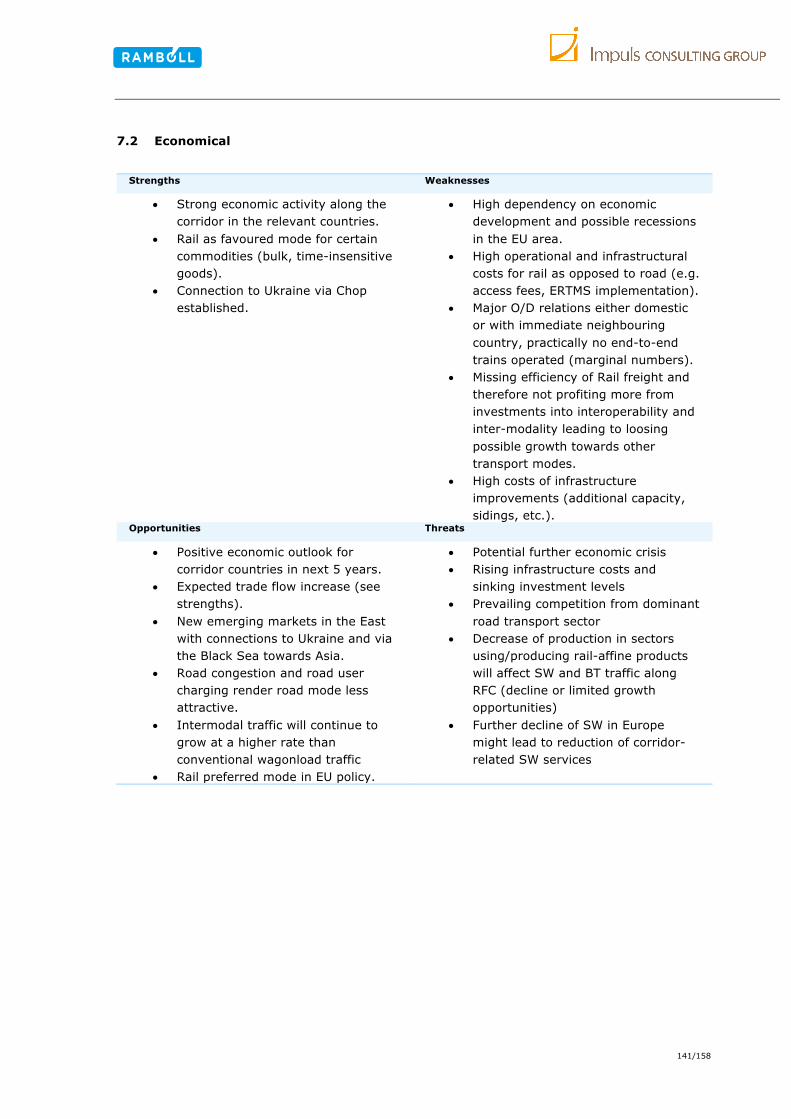
141/158
7.2 Economical
Strengths Weaknesses
• Strong economic activity along the corridor in the relevant countries.
• Rail as favoured mode for certain commodities (bulk, time-insensitive goods).
• Connection to Ukraine via Chop established.
• High dependency on economic development and possible recessions in the EU area.
• High operational and infrastructural costs for rail as opposed to road (e.g. access fees, ERTMS implementation).
• Major O/D relations either domestic or with immediate neighbouring country, practically no end-to-end trains operated (marginal numbers).
• Missing efficiency of Rail freight and therefore not profiting more from investments into interoperability and inter-modality leading to loosing possible growth towards other transport modes.
• High costs of infrastructure improvements (additional capacity, sidings, etc.).
Opportunities Threats
• Positive economic outlook for corridor countries in next 5 years.
• Expected trade flow increase (see strengths).
• New emerging markets in the East with connections to Ukraine and via the Black Sea towards Asia.
• Road congestion and road user charging render road mode less attractive.
• Intermodal traffic will continue to grow at a higher rate than conventional wagonload traffic
• Rail preferred mode in EU policy.
• Potential further economic crisis • Rising infrastructure costs and
sinking investment levels • Prevailing competition from dominant
road transport sector • Decrease of production in sectors
using/producing rail-affine products will affect SW and BT traffic along RFC (decline or limited growth opportunities)
• Further decline of SW in Europe might lead to reduction of corridor-related SW services

142/158
7.3 Organisational
Strengths Weaknesses
• Working organization for RFC 9 RHD established (e.g. efforts on defining multiple corridor priority rules, close cooperation between the C-OSS of different RFCs) contributing to RFC services ensuring sufficient coverage of all market segments of international rail freight transport along RFC 9 RHD.
• RUs currently already operating cross-border along the corridor.
• Yearly evaluation of the corridor performance and yearly survey with the stakeholders supporting short and long term development of customer oriented infrastructural and operational measures by the IM’s contributing to freight train and terminal service quality
• Process of trusted handover (ATTI) under implementation
• Differing access fee schemes, performance regimes and infrastructure improvement focus between the countries.
• Lack of information exchange on corridor trains between IMs (harmonised approach and data integrity).
• Insufficient information flows and communication processes between RUs and IMs (language diversity, often time-lag in terms of information exchange).
• Currently achievable quality of service (i.e. train punctuality and path availability) hampering development of attractive transport solutions.
• Prevailing language barriers. • Data interfaces
Opportunities Threats
• Better framework conditions for cooperation along the corridor for all stakeholders involved ( e.g. RUs, logistic providers, etc.) with the establishment of corridor organisation and C-OSS.
• Improvement of information processes for customers mirroring the development in the road sector (e.g. train position and delay (real time information), construction works along the RFC as well as coordinated information on allocated paths).
• Improvements in network access for Railway Undertakings (e.g. C-OSS as one stop shop).
• Establishing C-OSS, improving network access for RUs
• Developing priority scheme for high/low priority freight services along the corridor
• Extending terminal and line operating hours to 24/7
• Train driver shortages experienced at current transport levels.
• Unpredictability of capacity requirements for rail freight, depending on economic developments.
• Low investment in rail. • Non-harmonization of border
crossing procedures. • Lack of knowledge about
characteristics and specific advantages of rail transport along RFC 9 RHD among Logistics service providers and rail freight customers leading to strategic decisions in favour of road

143/158
7.4 Infrastructural, technical and logistical
Strengths Weaknesses
• Improvement of technical network conditions on the corridor are generally already ongoing along the corridor, incl. intermodal transport
• Ongoing major projects increasing the capacity of the corridor and support future traffic growth
• Establishment of Rail Technical and Operational Issues affecting Interoperability - Logbook
• Limited line capacity on heavily utilised sections, priority given to passenger transport especially at the bigger nodes.
• Missing time synchronization and long time horizon of ETCS implementation schemes in RFC countries will limit benefit for RU’s, at least in the short term until 2022.
• National train protection systems still needed in many cases to reach the destination terminal without locomotive change
• Further harmonisation necessary regarding train lengths.
• Missing synchronisation of planning and dispatching of train paths and terminal slots. This may lead to additional capacity bottlenecks, delays and increased transport times.
• Transport time increases due to locomotive and driver changes at border crossings.
Opportunities Threats
• Establishment of strategic development plans to increase the capacities of intermodal terminals along the corridor thus supporting the further growth of intermodal transport.
• Strengthening of the competitive position of Romanian ports to support additional hinterland traffic by rail by developing sufficient operational concepts for the integration of the Romanian ports in the current intermodal rail transport network connecting to the black sea and beyond.
• Improvement of terminal and train operation concepts for integration of single wagonload and intermodal transport would allow introduction of new services (e. g. establishment of additional O/D relations)
• Insufficient terminal investment and operational strategies combined with lack of funds might limit introduction of new services due to lack of terminal capacity
• Limited capacity of intermodal terminals, especially in the east of the corridor
• Inability to generate economical utilisation of trains due to scattered terminal investment strategies and lack of cooperation between the involved stakeholders (especially terminal and train operators).
• Continuing decline of private railway sidings due to high costs and lack of funds might induce further decline of classical single wagonload production and block train operation

144/158
8. CONCLUSIONS
Based on the results of the SWOT-Analysis the following conclusions have been developed on how to take advantage of the strengths and opportunities, by minimizing the threats and weaknesses (risks) from an IM point of view (taking into account where the IMs will be able to change or influence the parameters identified above).
8.1 Institutional
A coordinated implementation process concerning the institutional reform steps across all RFC 9 RHD countries in order to maximise the strengths, which the liberalisation brings to freight traffic growth, should be the goal of all stakeholders involved. A harmonised approach will help to overcome the different levels of implementation and harmonisation on the corridor concerning the EU-wide implementation of homogenous technical and safety regulations and rules in all member states of the RFC 9 RHD.
8.2 Economical
The future economic developments and the effects on RFC 9 RHD should be closely monitored. And the coherent (i.e. due to the economic development) needs for investments in order to fulfil EU-wide and national policies on moving freight from road to rail communicated. An efficient infrastructure pricing regime keeping rail freight competitive is also of high importance.
8.3 Organisational
This study provides the number of corridor trains on the major O/D relations and for specific line sections of the preliminary route for the current situation as well as a forecast for 2022. These numbers are based in data provided by the IMs and may be used as one input for the development of the PaP offer. Nonetheless it has to be noted, that the current information available on corridor trains is hampered by the different data interfaces and information available in the IMs databases on corridor trains.
The current distribution of corridor trains clearly shows that the majority of corridor trains are not crossing more than 2 corridor borders. And this information is also not fully consistent due to lack of additional information attached to the trains itself in the database.
This is contrary to the overall distribution of transport volumes along the corridor. This is likely to have its origins in the existing production system, where SW traffic at the border stations/yards is being consolidated into international trains, but also in the change of national to international train numbers (and vice versa) at these stations as well as with trains delayed more than 24hrs receiving new train numbers. This can be easily remedied within the current organisation and should help improve operations and monitoring the effect on the corridor trains in the future.
The establishment of a C-OSS along the whole RFC should be accompanied by the establishment of a transparent pricing and billing regime along RFC 9 RHD for corridor trains (including the national access fee regimes).
Cross-border harmonisation of path information management supporting the complete path management process chain including feasibility study, path request, capacity allocation, train operation monitoring and train performance management, billing and statistical reporting is clearly necessary. Following the standards set by RailNetEurope the related interfaces for information exchange with RU’s and IM’s should be further implemented adapting them to specific needs of the RFC 9 RHD.
A continuous conduction of regular stakeholder interviews or stakeholder conferences along the corridor, using the information to enhance the services of the C-OSS and to ensure the

145/158
attractiveness and utilisation of the offered PaPs will clearly benefit the RFC 9 RHD and its commercial success.
8.4 Infrastructural, technical and logistical
To allow a higher train utilisation and hence support lowering of operational costs as well as higher transport volumes without additional train path capacity the (gradual) standardisation of technical parameters of network / terminals (depending on traffic demand), following the TEN-T standards for new and upgraded lines (train length 740m train, 22,5 t axle load) should be given priority.
To support further growth of intermodal transport, terminals should be developed according to customer requirements.
The harmonisation of signalling and train control systems with the establishment of ERTMS is also essential for the future success of the corridor.
Within the terminals the extension of storage capacity in coordination/cooperation with the terminal operators should be focused on together with the enhancement of terminal capacities, including a 7 days/24 hours operation, where necessary.
8.5 Summary of main Conclusions
Overall the RFC 9 RHD has a potential to attract continental freight load and to connect large Western European Markets with a maritime gate to the East – the Port of Constanta. Aim should be to foster the understanding of the RFC 9 RHD as a backbone, integrating different stakeholders (e.g. ministries, authorities,…) and forming a robust and attractive transport chain – for pre-, main-, and on-carriage. A focus should be made regarding the following points:
• To gain a higher share of the market growth increase availability of suitable (intermodal) transport loading units and (bulk) goods with access points (terminals) including enough storage and transhipment capabilities.
• Harmonized infrastructure approach regarding signalling (ERTMS) and train parameters (train length) and removal of bottleneck (infrastructural, administrative and operational)
• Short-term efficiency to be realized by so-called “soft-measures”, e.g. harmonized administrative processes and handling at borders, coordination of ongoing and planned works resulting in unexpected re-routings in connection with longer running times (see also Rail Technical and Operational Issues affecting Interoperability - Logbook)
• Harmonized processes at borders and enforcing interoperability • A harmonization of train data along RFC 9 RHD to allow for an automated data integration,
an efficient traffic management (including performance supervision) and a precise definition of ETA in the future is also strongly recommended.
• Implementation of TTR along RFC 9 RHD • Implementation of language knowledge in Train Control Centres (English) • Implementation of an efficient “border–regime” including the use of trusted hand-over (ATTI)
among RUs.
The almost “historical” window of opportunity for environmental issues can be used to increase political pressure to create a level-playing field among transport modes.

146/158
ANNEX 1: LIST OF REFERENCES (PEST ANALYSIS) Adler, A., Miculescu, D., & Karaman, S. (2016). Optimal policies for platooning and ride sharing in autonomy-enabled transportation. In Workshop on Algorithmic Foundations of Robotics (WAFR). Botta, E. and T. Kozluk (2014), "Measuring Environmental Policy Stringency in OECD Countries: A Composite Index Approach", OECD Economics Department Working Papers, No. 1177, OECD Publishing, Paris. http://dx.doi.org/10.1787/5jxrjnc45gvg-en Brinza, A. (2019). Foreign Policy (FP). https://foreignpolicy.com/2019/04/11/how-china-blew-its-chance-in-eastern-europe/. Published on April 11, 2019 CIA World Factbook. : https://www.cia.gov/library/publications/resources/the-world-factbook/fields/214.html (Retrieved September 5, 2019) Coito, E. (2019). Rail transport. Fact Sheets of the European Union. European Parliament. http://www.europarl.europa.eu/factsheets/en/sheet/130/rail-transport (Retrieved on 9 July, 2019) De Jong, Gerard, et al. "New SP-values of time and reliability for freight transport in the Netherlands." Transportation Research Part E: Logistics and Transportation Review 64 (2014): 71-87. Eurobarometer (2017). Attitudes of European citizens towards the environment. European Commission, 468 European Commission (EC). Rail - Railway packages. https://ec.europa.eu/transport/modes/rail/packages_en (Retrieved on 9 July, 2019) European Environment Agency (EEA). Emissions of air pollutants from transport https://www.eea.europa.eu/data-and-maps/indicators/transport-emissions-of-air-pollutants-8/transport-emissions-of-air-pollutants-6 (Retrieved on September 10, 2019) Fries-Tersch, E. et al. (2018). 2018 Annual Report on intra-EU Labour Mobility. European Commission. Available at: https://ec.europa.eu/futurium/en/employment/2018-annual-report-intra-eu-labour-mobility Halse, A., Samstad, H., Killi, M., Flügel, S., Ramjerdi, F., 2010. Valuation of Freight Transport Time and Reliability. TØI Report 1083/2010, Oslo (in Norwegian) http://hdr.undp.org/en/content/human-development-index-hdi (Retrieved September 9, 2019) ITF (2019), ITF Transport Outlook 2019, OECD Publishing, Paris, https://doi.org/10.1787/transp_outlook-en-2019-en (Retrieved August 18, 2019) Jeffs, V. P., & Hills, P. J. (1990). Determinants of modal choice in freight transport. Transportation, 17(1), 29-47. Madrigal, A. C. (2018). Could Self-Driving Trucks Be Good for Truckers? The Atlantic. https://www.theatlantic.com/technology/archive/2018/02/uber-says-its-self-driving-trucks-will-be-good-for-truckers/551879/ (Retrieved October 5, 2019) Peijs, K. (2018) Rhine Danube. Third Work Plan of the European Coordinator. February 2018

147/158
Rail Freight Forward (2018). 30 by 2030. Rail Freight strategy to boost modal shift. White paper. https://www.railfreightforward.eu/sites/default/files/usercontent/white_paper-30by2030-150dpi6.pdf (Retrieved October 1, 2019) Rauwald, C. (2019). Bloomberg. Volkswagen’s Truck Unit to Pour $2.2 Billion Into Electric Vehicles, Software. Published on 2 October, 2019. Published on 2 October, 2019 https://www.bloomberg.com/news/articles/2019-10-02/traton-to-pour-2-2-billion-into-electric-trucks-software Schroten, A. et al. (2019). Sustainable Transport Infrastructure Charging and Internalisation of Transport Externalities: Main Findings. Report prepared for the European Commission, Directorate- General for Mobility and Transport. https://ec.europa.eu/transport/sites/transport/files/studies/internalisation-study-summary-isbn_978-92-76-03076-8.pdf Turner, J. (2018). Changing tracks: the freight rail wagons of the future. Railway Technology. https://www.railway-technology.com/features/freight-innovations/ (Retrieved October 1, 2019) United Nations Development Programme (UNDP, 2017): Van Essen et al. (2019). Handbook on the external costs of transport. Version 2019. Prepared for the European Commission. https://ec.europa.eu/transport/sites/transport/files/studies/internalisation-handbook-isbn-978-92-79-96917-1.pdf White paper (2011). Roadmap to a Single European Transport Area — Towards a competitive and resource efficient transport system’. https://eur-lex.europa.eu/legal-content/EN/TXT/PDF/?uri=CELEX:52011DC0144&from=EN Windzio, M., Teney, C., & Lenkewitz, S. (2019). A network analysis of intra-EU migration flows: how regulatory policies, economic inequalities and the network-topology shape the intra-EU migration space. Journal of Ethnic and Migration Studies, 1-19. World Population Review (WPR): http://worldpopulationreview.com/countries/ (Retrieved on September 12, 2019) Worldatlas: https://www.worldatlas.com (Retrieved October 11, 2019) Worlds top exports (WTEx, 2018) http://www.worldstopexports.com/car-exports-country/ (Retrieved September 12, 2019)

148/158
ANNEX 2: NUTS 2 AND 3 REGIONS ALONG THE CORRIDOR GERMANY DE11 Stuttgart
DE111 Stuttgart, Stadtkreis DE113 Esslingen DE114 Göppingen DE115 Ludwigsburg
DE12 Karlsruhe DE121 Baden-Baden, Stadtkreis DE122 Karlsruhe, Stadtkreis DE123 Karlsruhe, Landkreis DE124 Rastatt DE125 Heidelberg, Stadtkreis DE126 Mannheim, Stadtkreis DE128 Rhein-Neckar-Kreis DE129 Pforzheim, Stadtkreis DE12B Enzkreis
DE13 Freiburg DE134 Ortenaukreis DE14 Tübingen
DE144 Ulm, Stadtkreis DE145 Alb-Donau-Kreis
DE21 Oberbayern DE212 München, Kreisfreie Stadt DE213 Rosenheim, Kreisfreie Stadt DE215 Berchtesgadener Land DE218 Ebersberg DE21B Freising DE21C Fürstenfeldbruck DE21H München, Landkreis DE21K Rosenheim, Landkreis DE21M Traunstein
DE22 Niederbayern DE221 Landshut, Kreisfreie Stadt DE222 Passau, Kreisfreie Stadt DE223 Straubing, Kreisfreie Stadt DE224 Deggendorf DE227 Landshut, Landkreis DE228 Passau, Landkreis DE22B Straubing-Bogen
DE23 Oberpfalz DE232 Regensburg, Kreisfreie Stadt DE234 Amberg-Sulzbach DE235 Cham DE236 Neumarkt i. d. OPf. DE237 Neustadt a. d. Waldnaab DE238 Regensburg, Landkreis DE239 Schwandorf DE23A Tirschenreuth
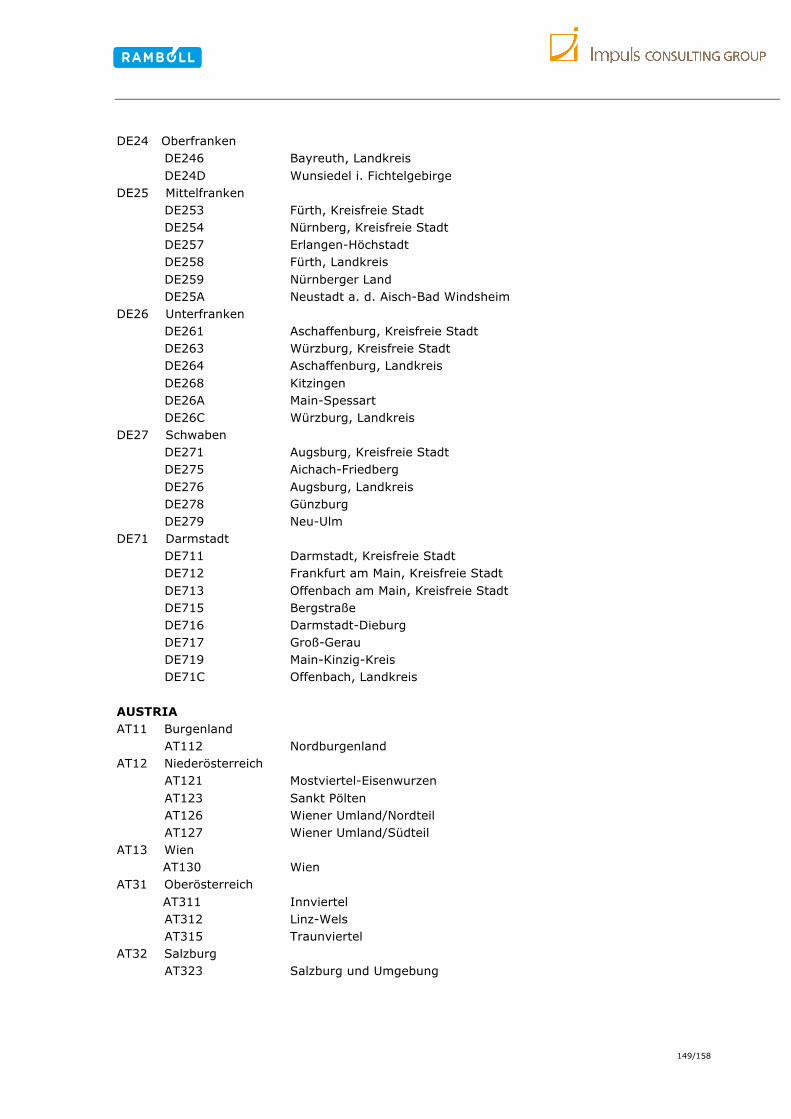
149/158
DE24 Oberfranken DE246 Bayreuth, Landkreis DE24D Wunsiedel i. Fichtelgebirge
DE25 Mittelfranken DE253 Fürth, Kreisfreie Stadt DE254 Nürnberg, Kreisfreie Stadt DE257 Erlangen-Höchstadt DE258 Fürth, Landkreis DE259 Nürnberger Land DE25A Neustadt a. d. Aisch-Bad Windsheim
DE26 Unterfranken DE261 Aschaffenburg, Kreisfreie Stadt DE263 Würzburg, Kreisfreie Stadt DE264 Aschaffenburg, Landkreis DE268 Kitzingen DE26A Main-Spessart DE26C Würzburg, Landkreis
DE27 Schwaben DE271 Augsburg, Kreisfreie Stadt DE275 Aichach-Friedberg DE276 Augsburg, Landkreis DE278 Günzburg DE279 Neu-Ulm
DE71 Darmstadt DE711 Darmstadt, Kreisfreie Stadt DE712 Frankfurt am Main, Kreisfreie Stadt DE713 Offenbach am Main, Kreisfreie Stadt DE715 Bergstraße DE716 Darmstadt-Dieburg DE717 Groß-Gerau DE719 Main-Kinzig-Kreis DE71C Offenbach, Landkreis
AUSTRIA AT11 Burgenland
AT112 Nordburgenland AT12 Niederösterreich
AT121 Mostviertel-Eisenwurzen AT123 Sankt Pölten AT126 Wiener Umland/Nordteil AT127 Wiener Umland/Südteil
AT13 Wien AT130 Wien AT31 Oberösterreich AT311 Innviertel
AT312 Linz-Wels AT315 Traunviertel
AT32 Salzburg AT323 Salzburg und Umgebung

150/158
CZECH REPUBLIC CZ01 Praha CZ010 Hlavní město Praha CZ02 Střední Čechy
CZ020 Středočeský kraj CZ03 Jihozápad
CZ032 Plzeňský kraj CZ04 Severozápad
CZ041 Karlovarský kraj CZ05 Severovýchod
CZ053 Pardubický kraj CZ07 Střední Morava
CZ071 Olomoucký kraj CZ072 Zlínský kraj
CZ08 Moravskoslezsko CZ080 Moravskoslezský kraj
SLOVAKIA SK01 Bratislavský kraj
SK010 Bratislavský kraj SK02 Západné Slovensko
SK022 Trenčiansky kraj SK03 Stredné Slovensko
SK031 Žilinský kraj SK04 Východné Slovensko SK041 Prešovský kraj
SK042 Košický kraj HUNGARY HU11 Budapest
HU110 Budapest HU12 Pest
HU120 Pest HU21 Közép-Dunántúl
HU211 Fejér HU212 Komárom-Esztergom
HU22 Nyugat-Dunántúl HU221 Győr-Moson-Sopron
HU32 Észak-Alföld HU322 Jász-Nagykun-Szolnok
HU33 Dél-Alföld HU332 Békés ROMANIA RO12 Centru
RO121 Alba RO122 Braşov

151/158
RO123 Covasna RO124 Harghita RO125 Mureş RO126 Sibiu
RO22 Sud-Est RO223 Constanţa
RO31 Sud – Muntenia RO312 Călăraşi RO313 Dâmboviţa RO314 Giurgiu RO315 Ialomiţa RO316 Prahova RO317 Teleorman
RO32 Bucureşti - Ilfov RO321 Bucureşti RO322 Ilfov
RO41 Sud-Vest Oltenia RO411 Dolj RO412 Gorj RO413 Mehedinţi RO414 Olt
RO42 Vest RO421 Arad RO422 Caraş-Severin RO423 Hunedoara RO424 Timiş

152/158
ANNEX 3: MODAL SPLIT FIGURES

153/158
ANNEX 4: DATA RECEIVED The data-sets received from the IMs for freight traffic were heterogeneous. The following table shows the number of data-sets received for each country represented by one or two IMs.
Country IM No. Of data-sets received Status
Austria OEBB 24 aggregated data per year
Czech Republic Správa železnic 1,161 disaggregated data per day and train
Slovakia ZSR 788 aggregated data per year
France SNCF 2 aggregated data per year
Germany DB 59,729 disaggregated data per day and train
Hungary GYSEV 17,257 disaggregated data per day and train
MÁV 108,433 disaggregated data per day and train
Romania CFR 25 aggregated data per year

154/158
ANNEX 5: QUESTIONNAIRE

155/158

156/158

157/158

158/158
Copyright © 2022 FDOKUMEN