An Open Trial of In-Home CBT for Depressed Mothers in Home Visitation

A
OdMwvRgtpctCswp©
K
1
is
Pf
0d
Neurobiology of Aging 32 (2011) 1857–1867
Effect of temporal lobe structure volume on memoryin elderly depressed patients
Renata Avila a,∗, Salma Ribeiz a, Fábio L.S. Duran c, Jony P.J. Arrais d, Marco A.A. Moscoso a,Diana M. Bezerra a, Omar Jaluul b, Claudio C. Castro e,
Geraldo F. Busatto c, Cássio M.C. Bottino a
a Projeto Terceira Idade (PROTER, Old Age Research Group), Institute and Department of Psychiatry, University of São Paulo, São Paulo 05403-010, Brazilb Department of Internal Medicine, University of São Paulo School of Medicine, São Paulo, Brazil
c Laboratory of Psychiatric Neuroimaging (LIM 21), Institute and Department of Psychiatry, University of São Paulo, São Paulo, Brazild Department of Statistics, Universidade Federal Fluminense, Brazil
e Department of Diagnostic Imaging, Heart Institute (InCor), Hospital das Clínicas da Universidade de São Paulo, São Paulo, Brazil
Received 29 May 2009; received in revised form 29 October 2009; accepted 9 November 2009Available online 23 December 2009
bstract
bjective: To compare the volume of the hippocampus and parahippocampal gyrus in elderly individuals with and without depressiveisorders, and to determine whether the volumes of these regions correlate with scores on memory tests.ethod: Clinical and demographic differences, as well as differences in regional gray matter volumes, were assessed in 48 elderly patientsith depressive disorders and 31 control subjects. Brain (structural MRI) scans were processed using statistical parametric mapping andoxel-based morphometry. Cognitive tests were administered to subjects in both groups.esults: There were no between-group gray matter volume differences in the hippocampus or parahippocampal gyrus. In the elderly depressedroup only, the volume of the left parahippocampal gyrus correlated with scores on the delayed naming portion of the visual–verbal learningest. There were also significant direct correlations in depressed subjects between the volumes of the left hippocampus, right and left parahip-ocampal gyrus and immediate recall scores on verbal episodic memory tests and visual learning tests. In the control group, there were directorrelations only between overall cognitive performance (as assessed with the MMSE) and the volume of right hippocampus, and betweenhe total score on the visual–verbal learning test and the volume of the right and left parahippocampal gyrus.onclusions: These findings highlight different patterns of relationship between cognitive performance and volumes of medial temporal
tructures in depressed individuals and healthy elderly subjects. The direct correlation between delayed visual–verbal memory recall scores
ith left parahippocampal volumes specifically in elderly depressed individuals provides support to the view that depression in elderlyopulations may be a risk factor for dementia.2009 Elsevier Inc. All rights reserved.
ag
eywords: Depression; Elderly; Memory; Hippocampus; Gyrus
. Introduction
There is mounting evidence of structural abnormalitiesn the brains of subjects with depression. Many studies ofuch individuals have demonstrated generalized and localized
∗ Corresponding author. Rua Antonio de Gouveia Giudice 1406, Alto deinheiros - São Paulo, SP, Brazil 05460-001. Tel.: +55 11 3023 6438;ax: +55 11 3023 6438.
E-mail address: [email protected] (R. Avila).
ear(
ath
197-4580/$ – see front matter © 2009 Elsevier Inc. All rights reserved.oi:10.1016/j.neurobiolaging.2009.11.004
trophy in regions such as the prefrontal cortex, cingulateyrus, caudate nucleus, cerebellum and hippocampus (Takit al., 2005; Schweitzer et al., 2001). This atrophy is oftenssociated with cognitive deficits, limited pharmacologicalesponse to treatment and high rates of disease recurrenceAlexopoulos et al., 1997).
Medial temporal structures, including the hippocampusnd parahippocampal gyrus, play a key role in the regula-ion of mood and cognition. Therefore, these brain regionsave been widely investigated in depressed patients, in

1 gy of Ag
nibincePrpaid
sbipBrdectcpisduiairs(itTvrc
muvigstmpmtwd
2
2
o(nstcdwClafdi
43wttdetpe
wddeeIpseSm(pam
a
2
858 R. Avila et al. / Neurobiolo
euroimaging studies as well as in neuropsychological stud-es. Since 1993, magnetic resonance imaging (MRI) haseen used as a means of studying the hippocampal regionn detail. Some volumetric MRI studies have shown a sig-ificant degree of atrophy in subjects with major depressionompared to healthy controls (Janssen et al., 2007; Lloydt al., 2004), whereas others have not (Taki et al., 2005;osener et al., 2003; Sheline, 2003). In part, this interest iselated to the fact that the hippocampus and parahippocam-al gyrus are linked to memory and learning (Hartley etl., 2007), cognitive functions that are frequently alteredn depressed patients as well as in patients with earlyementia.
To better understand depressive syndromes in the elderly,tudies have focused not only on alterations in brain structureut also on cognitive deficits, as assessed by neuropsycholog-cal tests, as well as on the correlation between the two, in suchatients (Kramer-Ginsberg et al., 1999; Almeida et al., 2003;allmaier et al., 2008). Greater knowledge regarding this cor-
elation might shed light on a possible relationship betweenepression and Alzheimer’s disease (AD). Some authors havemployed neuropsychological batteries of memory tests inonjunction with voxel-based morphometry (VBM) and sta-istical parametric mapping (SPM) to evaluate volumetrichanges of medial temporal lobe regions in depressive sam-les compared to healthy controls. However, voxel-basedmage analysis methods have very rarely been applied in MRItudies evaluating specifically elderly depressed patients. Toate, MRI studies of such patients have been limited by these of global, less specific measures of cognitive function-ng (Almeida et al., 2003; Greenwald et al., 1997; Steffens etl., 2000; Ashtari et al., 1999; Bell-McGinty et al., 2002), ormage analysis methods involving the use of manually drawnegions-of-interest (ROIs) (Greenwald et al., 1997). Sometudies have even evaluated clinically heterogeneous samplesFrodl et al., 2006; Hickie et al., 2005). Only two MRI stud-es of elderly depressed patients to date have applied VBMechniques (Almeida et al., 2003; Bell-McGinty et al., 2002).he VBM method is less laborious than is manual, ROI-basedolumetry, and can be replicated at different facilities, sinceesearcher characteristics do not influence the results as in thease of manual ROI drawing (Ashburner and Friston, 2000).
In the present study, we applied an optimized VBMethod (Good et al., 2001) in order to compared brain vol-
mes between elderly depressed subjects and age-matchedolunteers without depression. We primarily focused ournvestigation on the hippocampus and parahippocampalyrus. We intended to test the following hypotheses: thatubjects with depression present volumetric abnormalities inhese brain regions, as well as whole-brain gray and white
atter volume alterations; and that the volume of the hip-ocampus and parahippocampal gyrus are correlated with
emory test scores. Our principal objective was to correlatehe volume of the hippocampus and parahippocampal gyrusith the memory test performance of elderly individuals withepressive disorders.
t
•
ing 32 (2011) 1857–1867
. Methods
.1. Subjects
We initially evaluated 62 elderly patients (≥60 yearsf age) who met the Diagnostic and Statistical Manual-IVDSM-IV) criteria for depressive disorders, based on a diag-ostic interview administered by trained psychiatrists. Thetudy subjects were selected from the pool of outpatientsreated by the Old Age Research Group at the Institute of Psy-hiatry, University of Sao Paulo School of Medicine Hospitalas Clínicas. As controls, 41 age-matched elderly subjectsithout depression were recruited from the Hospital daslínicas Department of Geriatrics. Due to MRI artifacts or
ow quality images, 14 of the individuals with depressionnd 10 of the controls were excluded from the study. There-ore, the final sample consisted of 48 elderly individuals withepressive disorders (elderly depressed group) and 31 elderlyndividuals without depressive disorders (control group).
From the 48 individuals in the elderly depressed group,5 (93.75%) met DSM-IV criteria for major depression and(6.25%) met criteria for dysthymia. In addition, 28 (58.3%)ere classified as having late-onset depression (LOD) (with
he onset of major depressive symptoms occurring laterhan 65 years of age) and 20 (41.6%) as having early-onsetepression (EOD). The mean number of previous depressivepisodes was 1.48 (SD: 2.26). Regarding the pharmacologicalreatment, only 8 (16.7%) of the patients were taking antide-ressants and 10 (20.8%) were taking benzodiazepines whenvaluated.
The exclusion criteria for the elderly depressed groupere: diagnoses of dementia or other organic mental disor-ers; and DSM-IV criteria-based diagnoses of any psychiatricisorder other than depression (although patients with anxi-ty disorders comorbid to depression were not excluded). Thexclusion criteria for the control group were: current DSM-V criteria-based diagnoses of any psychiatric disorders; andrevious history of depressive disorders. To ensure that anyubjects with incipient dementia would be excluded from thelderly depressed group, the Bayer Activities of Daily Livingcale (B-ADL) (Lehfeld et al., 1997) was applied to infor-ants. According to a previous study with Brazilian patients
Folquitto et al., 2007), the cutoff point of B-ADL ≥ 3.12rovides adequate sensitivity, specificity, positive and neg-tive predictive values to discriminate patients with mild tooderate dementia from non-demented elderly subjects.The study was approved by the local ethics committee,
nd all participants gave written informed consent.
.2. Clinical, cognitive and functional assessment
The following instruments were applied to all of the par-
icipants:Mini Mental Status Examination (MMSE) (Folstein et al.,1975).

gy of Ag
•
•
•
•
•
•
2
mtva
•
•
•
•
•
2
nWPvwa
2
mh
smfb2sbNroSgttpseaFkwm
ewtgt1ftitstmsrfns
2
gbaSota
R. Avila et al. / Neurobiolo
The Cambridge Examination for Mental Disorders of theElderly (Roth et al., 1986).The Cambridge Cognitive Examination (CAMCOG)(Bottino et al., 1999).Bayer Activities of Daily Living Scale (B-ADL) (Lehfeldet al., 1997; Folquitto et al., 2007).Montgomery–Asberg Depression Rating Scale (MADRS)(Montgomery and Asberg, 1979).Hamilton Rating Scale for Depression (HAM-D)(Hamilton, 1960).Cumulative Illness Rating Scale (CIRS) (Linn et al., 1968).
.3. Neuropsychological assessment
After the psychiatric evaluation, all participants were sub-itted to a comprehensive battery of neuropsychological tests
o assess multiple cognitive domains. Portuguese-languageersions of the following instruments were administered bytrained neuropsychologist:
Intellectual efficiency (intelligence quotient): WechslerAbbreviated Scale for Intelligence Vocabulary and Matri-ces subtests (Wechsler, 1999).Episodic memory – verbal: Fuld Object Memory Evalu-ation (FOME) (Fuld, 1980; Bustamante, 2003); WechslerMemory Scale-Revised Logical Memory I and II subtests(Wechsler, 1987).Episodic memory – visual: Wechsler Memory Scale-Revised Visual Reproduction I and II subtests (Wechsler,1987).Executive function: verbal fluency, semantic category –animal (Spreen and Strauss, 1998); verbal fluency, phono-logical category – FAS test (Spreen and Benton, 1977);digits (Wechsler, 1987); Stroop Test – part C – Victoriaversion (Spreen and Strauss, 1998); Trail Making Test –part B (Army Individual Test Battery, 1944).Processing speed: Cancellation test (Mesulam, 1985);Stroop Test – parts A and B (Spreen and Benton, 1977);Trail Making Test – part A (Army Individual Test Battery,1944).
.4. MRI acquisition
All MRI scans were acquired using a 1.5-Tesla scan-er (GE Signa Horizon LX; General Electric, Milwaukee,I, USA) at the Heart Institute of the University of Sao
aulo School of Medicine Hospital das Clínicas. Cerebralolumes (1.2-mm contiguous slices) were acquired with a T1-eighted axial sequence (FSGPR) using a 256 × 256 matrix
nd a field of view of 24 mm.
.5. Image processing
Image processing was performed using an opti-ized VBM protocol with SPM (SPM2 package;
ttp://www.fil.ion.ucl.ac.uk/spm). First, a standard template
gmvt
ing 32 (2011) 1857–1867 1859
et was created specifically for the study, consisting of aean T1-weighted image, together with a priori templates
or gray matter, white matter and cerebrospinal fluid (CSF),ased on the images of 31 elderly depressed patients and1 controls. In order to build the templates, images werepatially normalized to the standard SPM T1 MRI template,ased on 152 healthy controls evaluated at the Montrealeurological Institute. This spatial normalization was
estricted to 12-parameter linear affine transformations inrder to minimize deformations of our original images.patially normalized images were then segmented intoray matter, white matter and CSF compartments, usinghe probability maps in the SPM2 package, overlaid ontohe images in order to classify voxels in terms of theirrobability of belonging to a particular tissue class. Theegmentation method also included an automated brainxtraction procedure to remove non-brain tissue and anlgorithm to correct for non-uniformity of image intensity.inally, images were smoothed using an isotropic Gaussianernel (8 mm full width at half maximum), after which theyere averaged in order to produce the gray matter, whiteatter and CSF templates.Subsequently, the original images obtained from all of the
lderly subjects in both groups were processed, beginningith image segmentation using the study-specific, a priori
emplates for gray matter, white matter and CSF. Extractedray and white matter images were then spatially normalizedo the customized gray and white matter templates, using2-parameter linear as well as non-linear (7 × 9 × 7 basisunctions) transformations. The parameters resulting fromhis spatial normalization step were then reapplied to the orig-nal structural images. These fully normalized images werehen re-sliced using trilinear interpolation to a final voxelize of 2 mm × 2 mm × 2 mm and segmented into gray mat-er, white matter and CSF compartments. Voxel values were
odulated using the Jacobian determinants derived from thepatial normalization, thus allowing the total counts to beeduced proportionally to the degree of volume shrinkageor brain structures presenting volume reduction after spatialormalization (Good et al., 2001). Finally, all images weremoothed using a 12-mm Gaussian kernel.
.6. Statistical analysis
Differences between the two groups in terms of regionalray matter volumes were investigated on a voxel-by-voxelasis using the general linear model. The resulting statisticst each voxel were transformed to Z-scores and displayed asPM maps normalized into standard anatomical space, at thene-tailed p < 0.001 level of significance (corresponding to ahreshold of Z = 3.09). In each analysis, a measure of the totalmount of gray matter was entered as a confounding factor,
iven by the sum of voxels within the corresponding grayatter compartment of each participant. Only voxels withalues above an absolute threshold of 0.05 were included inhe analyses, resulting in a total search volume of approxi-

1 gy of Ag
m(tasasmwSptpnrmSfr
bvrunmwvc
vtla
aa(iTtt
wSCgwpc
nc
3
3
abiwc
TD
V
G
ASEMCMHBCC
VoMC
860 R. Avila et al. / Neurobiolo
ately 250,000 voxels. We used the small volume correctionSVC) tool in the SPM2 package to investigate whetherhere were significant findings in areas where gray matterbnormalities had been predicted a priori, thus restrictingtatistical comparisons to specific voxels in the hippocampusnd parahippocampal gyrus. These regions were circum-cribed by applying spatially normalized volumes to the SPMaps, based on the anatomical volumes of interest availableithin the Automatic Anatomical Labeling SPM toolbox.earch volumes were 946 voxels for the right hippocam-us, 932 voxels for the left hippocampus, 1132 voxels forhe right parahippocampal gyrus and 956 voxels for the leftarahippocampal gyrus. Any clusters of voxels showing sig-ificant findings within each of those volumes of interest wereeported only if surviving family-wise error correction forultiple comparisons (p < 0.05) regarding that region. TheVC approach permits hypothesis-driven analyses to be per-ormed with correction for the specified region of interestather than for the whole brain.
Also, the SPM maps were inspected on an exploratoryasis in order to identify significant regional gray matterolume deficits in depressed patients involving other brainegions where such findings had not been expected. Suchnpredicted findings would be reported as statistically sig-ificant only if surviving family-wise error correction forultiple comparisons throughout the brain. In all analyses,e converted the Montreal Neurological Institute maximaoxel coordinates (those of the highest statistical signifi-ance) to the Talairach and Tournoux system.
We also generated statistical parametric maps showing theoxel-wise correlations between gray matter volumes within
he hippocampus and parahippocampal gyrus and the fol-owing variables: scores on the cognitive tests specificallyimed at evaluating memory (vocabulary; logical memory Ilott
able 1emographic and clinical characteristics of participants with and without depressio
ariable Depressed patients (n = 48)
enderF 34 (70.8%)M 14 (29.2%)
ge (years) 70.04 ± 6.67chooling (years) 6.42 ± 5.61stimated IQ 78.88 ± 16.21MSE 25.19 ± 3.77AMCOG 82.83 ± 13.91ADRS 23.58 ± 1.23AM-D 18.58 ± 5.93-ADL 2.28 ± 1.00IRS comorbidity 1.76 ± 1.23IRS severity 0.64 ± 0.91
alues in boldface are statistically significant. n = number of patients; F = female; M =f age); EOD = early-onset depression; IQ = intelligence quotient; MMSE = Mini MADRS = Montgomery-Asberg Depression Rating Scale; HAM-D = Hamilton RatIRS = Cumulative Illness Rating Scale.a Student’s t-test, Chi-square test.b Analysis of covariance.c Mann–Whitney U test.
ing 32 (2011) 1857–1867
nd II; visual reproduction I and II; and the FOME - totalnd delayed); scores on the overall cognitive screening testsMMSE and CAMCOG); and scores on the symptom sever-ty and daily functioning scales (B-ADL; HAM-D; MADRS).he correlations between regional gray matter volumes and
est score variables were calculated using Pearson’s correla-ion coefficient (r).
The statistical analysis of demographic and clinical dataas carried out using the Statistical Package for the Socialciences software, version 14.01 for Windows (SPSS Inc.,hicago, IL, USA). Continuous data were compared betweenroups using Student’s t-test or the Mann–Whitney U test,hen appropriate. The frequencies of categories were com-ared between groups using Pearson’s Chi-square test withontinuity correction or Fisher’s exact test when appropriate.
As the two groups differed significantly in terms of meanumber of years of schooling, this variable was entered as aovariate in all comparisons, including the VBM analyses.
. Results
.1. Subjects
Demographic and clinical characteristics of the samplere presented in Table 1. There were significant differencesetween the elderly depressed group and healthy controlsn terms of the mean number of years of schooling, whichas higher in the control group. In comparison with the
ontrol group, the elderly depressed group had significantly
ower scores on the MMSE, and significantly higher scoresn the B-ADL, MADRS and HAM-D (Table 1). However,he CAMCOG and CIRS scores were comparable betweenhe two groups. Cumulatively, the most common illnesses inn.
Control patients (n = 31) Statistical test and p-value
23 (74.2%) χ2 = 0.106, p = 0.745a
8 (25.8%)
70.29 ± 7.24 t = −0.156, p = 0.8769.39 ± 4.58 t = −2.462, p = 0.016
86.90 ± 11.14 F = 1.004, p = 0.320b
28.10 ± 1.95 F = 8.830, p = 0.004b
90.65 ± 9.22 F = 2.465, p = 0.121b
8.78 ± 1.23 t = 17.374, p < 0.0012.55 ± 1.67 t = 17.666, p < 0.0011.31 ± 0.59 MW = 202.50, p < 0.001c
1.25 ± 0.23 MW = 716.00, p = 0.777c
0.54 ± 0.99 MW = 668.50, p = 0.384c
male; MD = major depression; LOD = late-onset depression (after 60 yearsental State Examination; CAMCOG = Cambridge Cognitive Examination;
ing Scale for Depression; B-ADL = Bayer Activities of Daily Living Scale;

R. Avila et al. / Neurobiology of Aging 32 (2011) 1857–1867 1861
Table 2Neuropsychological test scores of elderly subjects with and without depression.
Variables Patients (n = 48) Controls (n = 31) Statistical test and p-value
Memory testsVocabulary 37.83 ± 13.41 43.03 ± 10.88 F = 0.063, p = 0.803FOME–total 39.42 ± 5.79 42.62 ± 5.33 F = 3.350, p = 0.071FOME–delay 8.54 ± 1.30 9.19 ± 0.87 F = 3.572, p = 0.063Logical memory I 16.53 ± 8.35 18.00 ± 6.35 F = 0.289, p = 0.592Logical memory II 11.68 ± 8.48 12.94 ± 7.90 F = 0.323, p = 0.571Visual reproduction I 23.96 ± 10.45 32.74 ± 6.83 F = 10.517, p = 0.002Visual reproduction II 15.85 ± 11.80 25.61 ± 10.04 F = 8.032, p = 0.006
Executive function testsMatrices 6.67 ± 5.47 14 ± 7.33 F = 1.761, p = 0.189Digit span forward 6.29 ± 1.90 6.71 ± 1.86 F = 0.051, p = 0.822Digit span backward 3.71 ± 1.59 4.81 ± 1.85 F = 2.915, p = 0.092TMTB–timea 285.75 ± 185.85 184.23 ± 97.69 F = 7.065, p = 0.010TMTB–errorsb 2.59 ± 2.55 2.10 ± 2.77 F = 0.200, p = 0.657Stroop Test – part C–timea 49.59 ± 23.01 40.16 ± 13.72 F = 2.641Stroop Test – part C–errorsb 2.87 ± 5.32 2.52 ± 5.97 F = 0.012Animals 13.58 ± 4.68 15.42 ± 3.51 F = 0.119FAS 27.19 ± 12.79 29.87 ± 9.94 F = 0.003, p = 0.957
Processing speed testsTMTA–timea 95.27 ± 60.32 58.55 ± 25.42 F = 6.011, p = 0.017TMTA–errorsb 0.68 ± 1.23 0.35 ± 0.60 F = 0.599, p = 0.441Stroop Test – part A–timea 29.09 ± 13.22 25.06 ± 8.59 F = 0.318, p = 0.574Stroop Test – part B–timea 30.82 ± 11.80 28.77 ± 10.22 F = 0.061, p = 0.805Cancellation–timea 49.71 ± 24.77 31.17 ± 13.66 F = 8.106, p = 0.006Cancellation–timeb 0.23 ± 0.69 0.03 ± 0.18 F = 1.560, p = 0.216
FOME = Fuld Object Memory Evaluation; TMTB = Trail Making Test – part B; TMTA = Trail Making Test – part A; p-value = ANCOVA test.
NCOVA
tt
Hid(
3
gddBter
3
igpbr
st
cps
o(tTluaatmwrht0ta
a On these variables, values are expressed in seconds.b On these variables, higher value means worse performance. p-value = A
he two groups were hypertension, disorders of the gastroin-estinal tract, musculoskeletal diseases and skin disorders.
According to previously published cut-off values for theAM-D scores (Del Porto, 1989), the majority of patients
n the elderly depressed group presented mild or moderateepression; depressive symptoms were severe in 7 patients14.6%), moderate in 20 (41.7%) and mild in 21 (43.8%).
.2. Neuropsychological test results
Scores on the neuropsychological tests for the tworoups are presented in Table 2. Significant between-groupifferences were observed in the following tests: Visual repro-uction I; Visual reproduction II, Trail Making Test, part, completion time, Trail Making Test, part A, completion
ime and Cancellation test, completion time. Although thelderly depressed patients scored lower than controls on theemaining tests, the differences were not significant (Table 2).
.3. MRI findings
The total number of gray matter voxels in the segmentedmages was 58,094.65 ± 8,752.00 in the elderly depressed
roup and 5,777.96 ± 6,019.35 in the control group (t[0.176],= 0.861). For white matter voxels, total values in therain were 55,120.17 ± 6,051.05 and 53,913.08 ± 6,269.92,espectively (t[0.854], p = 0.396). Therefore, there were no(
u
test.
ignificant differences between the two groups in terms ofhe overall volume of gray or white matter in the brain.
The SPM maps displaying the voxelwise between-groupomparisons of gray matter volumes in the hippocampus andarahippocampal gyrus (using the SVC approach) showed noignificant findings.
Also, using the SVC masks applied to each subject, webtained individual values of relative gray matter volumescorrected for the total number of gray matter voxels inhe brain) for the hippocampus and parahippocampal gyrus.he mean relative volumes of gray matter in the right and
eft hippocampus (relative to the overall gray matter vol-me in the brain) were respectively 0.005335 ± 0.0005598nd 0.005921 ± 0.0004631 in the elderly depressed group;nd 0.005365 ± 0.0004513 and 0.005965 ± 0.0005553 inhe control group. Comparisons using such relative gray
atter volumes of the hippocampus confirmed that thereere no significant between-group differences either in the
ight (t[−0.243], p = 0.809) or left (t[−0.378], p = 0.706)emispheres. The mean relative volumes of gray mat-er in the right and left parahippocampal gyrus were.007694 ± 0.0005105 and 0.005425 ± 0.0004185 respec-ively in the elderly depressed group; 0.007748 ± 0.0005870nd 0.005419 ± 0.0004246 respectively in the control group
t[−0.438], p = 0.663) and (t[0.058], p = 0.954).Table 3 shows the degree to which gray matter volumes,sing SVC masks in the hippocampus and parahippocampal
1862 R. Avila et al. / Neurobiology of Aging 32 (2011) 1857–1867
Table 3Correlation between the volume of the hippocampus and the parahippocampal gyrus and cognitive tests scores in depressed subjects.
Test Right hippocampus Left hippocampus
Coordinatesa Z-scoreb Voxelsc pd re Coordinatesa Z-scoreb Voxelsc pd re
x y z peak N x y z peak n
Logical memory I * * * * * * −18 −35 0 3.38 7 0.023 0.327
Right parahippocampal gyrus Left parahippocampal gyrus
Coordinatesa Z-scoreb Voxelsc pd re Coordinatesa Z-scoreb Voxelsc pd re
x y z peak n x y z peak n
Logical memory I 20 −35 −8 3.22 2 0.044 0.292 −16 −37 −3 3.78 37 0.007 0.382Visual reproduction I * * * * * * −16 −37 −2 3.21 3 0.039
0.299FOME – delay * * * * * * −22 −39 −6 3.20 7 0.040 0.297
FOME = Fuld Object Memory Evaluation.a Coordinates of voxels presenting greater significance, according to Talairach and Tornoux (1998).b Z-score of voxels presenting greater significance; voxels in the table are significant, with a threshold of p < 0.001, corrected.c Total number of voxels in the region that passed the initial cut-off value of p < 0.05.
s
oxels w
gdft
F(tti
d Level of significance for voxel, after correction for multiple comparisone Value of Pearson correlation.* In these situations, maps were not generated, since the p-values of the v
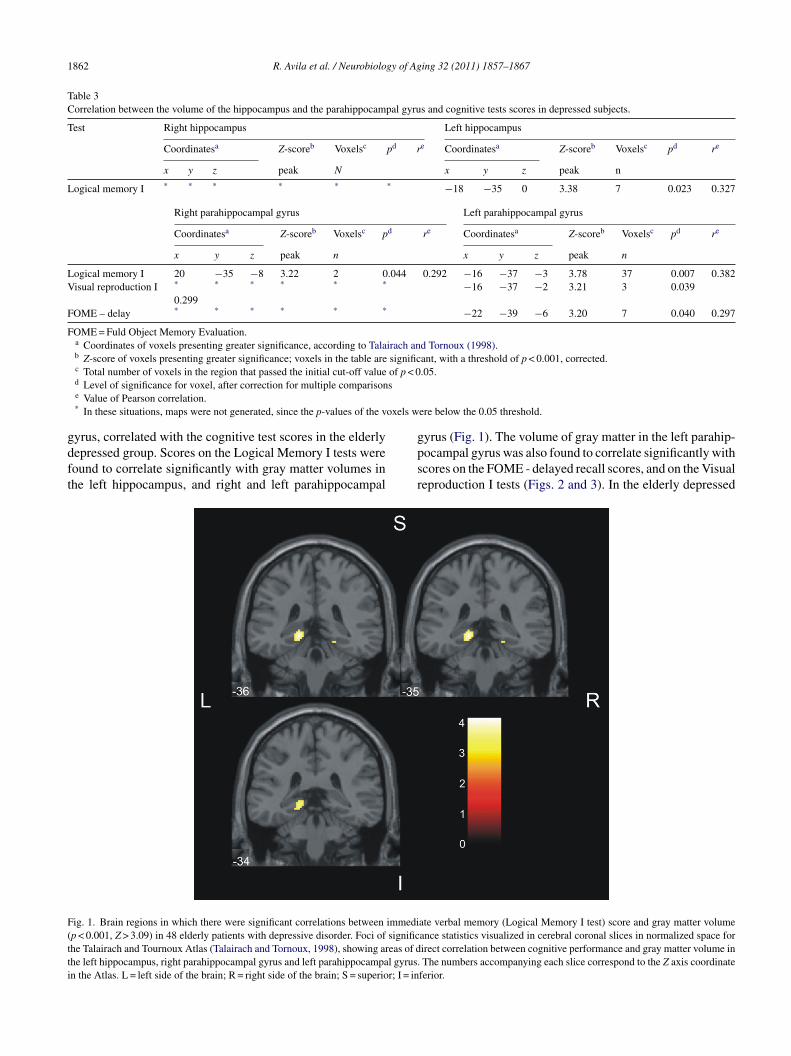
yrus, correlated with the cognitive test scores in the elderlyepressed group. Scores on the Logical Memory I tests wereound to correlate significantly with gray matter volumes inhe left hippocampus, and right and left parahippocampal
gpsr
ig. 1. Brain regions in which there were significant correlations between immedip < 0.001, Z > 3.09) in 48 elderly patients with depressive disorder. Foci of significhe Talairach and Tournoux Atlas (Talairach and Tornoux, 1998), showing areas of dhe left hippocampus, right parahippocampal gyrus and left parahippocampal gyrus.n the Atlas. L = left side of the brain; R = right side of the brain; S = superior; I = in
ere below the 0.05 threshold.
yrus (Fig. 1). The volume of gray matter in the left parahip-ocampal gyrus was also found to correlate significantly withcores on the FOME - delayed recall scores, and on the Visualeproduction I tests (Figs. 2 and 3). In the elderly depressed
ate verbal memory (Logical Memory I test) score and gray matter volumeance statistics visualized in cerebral coronal slices in normalized space forirect correlation between cognitive performance and gray matter volume inThe numbers accompanying each slice correspond to the Z axis coordinate
ferior.

R. Avila et al. / Neurobiology of Aging 32 (2011) 1857–1867 1863
Fig. 2. Brain regions in which there were significant correlations between immediate visual memory (Visual reproduction I test) score and gray matter volume(p < 0.001, Z > 3.09) in 48 elderly patients with depressive disorder. Foci of significance statistics visualized in cerebral coronal slices in normalized space fort reas ofi orrespos
gmpsa
u
TC
T
M
F
F
he Talairach and Tournoux Atlas (Talairach and Tornoux, 1998), showing an the left parahippocampal gyrus. The numbers accompanying each slice cide of the brain; S = superior; I = inferior.
roup, there were no significant correlations between grayatter volumes within the hippocampus and parahippocam-
al gyrus and any of the variables evaluating overall cognitivetatus (MMSE and CAMCOG), symptom severity (HAM-D;nd MADRS) or daily functioning (B-ADL).
pgi
able 4orrelation between the volume of the hippocampus and the parahippocampal gyru
est Right hippocampus
Coordinatesa Z-scoreb Voxelsc pd re
x y z peak n
MSE 38 −10 −11 3.73 23 0.010 0.4
Right parahippocampal gyrus
Coordinatesa Z-scoreb Voxelsc pd re
x y z peak n
OME-total 18 −41 −1 3.77 15 0.010 0.45
OME = Fuld Object Memory Evaluation. MMEE = Mini-Mental State Examinatioa Coordinates of voxels presenting greater significance, according to Talairach anb Z-score of voxels presenting greater significance; voxels in the table are significc Total number of voxels in the region that passed the initial cut-off value of p < 0d Level of significance for voxel, after correction for multiple comparisons.e Value of Pearson correlation.* In these situations, maps were not generated, since the p-values of the voxels w
direct correlation between cognitive performance and gray matter volumend to the Z axis coordinate in the Atlas. L = left side of the brain; R = right
Table 4 shows the degree to which gray matter volumes,sing SVC masks in the hippocampus and parahippocam-
al gyrus, correlated with cognitive test scores in the controlroup. Scores on the MMSE were found to correlate signif-cantly with gray matter volumes in the right hippocampus,s and cognitive tests scores in control subjects.
Left hippocampus
Coordinatesa Z-scoreb Voxelsc pd re
x y z peak N
52 * * * * * *
Left parahippocampal gyrus
Coordinatesa Z-scoreb Voxelsc pd re
x y z Peak n
2 −20 −41 −1 3.60 23 0.015 0.430
n.d Tornoux (1998).ant, with a threshold of p < 0.001, corrected..05.
ere below the 0.05 threshold.

1864 R. Avila et al. / Neurobiology of Aging 32 (2011) 1857–1867
Fig. 3. Brain regions in which there were significant correlations between verbal–visual learning (Fuld Object Memory Evaluation test – delay) score andgray matter volume (p < 0.001, Z > 3.09) in 48 elderly patients with depressive disorder. Foci of significance statistics visualized in cerebral coronal slices innormalized space for the Talairach and Tournoux Atlas (Talairach and Tornoux, 1998), showing areas of direct correlation between cognitive performance andgray matter volume in left parahippocampal gyrus. The numbers accompanying each slice of the brain scan correspond to the Z axis coordinate in the Atlas.L .
wpt
4
sianaotgmvbtm
ua
doAo2agwtpvdscgtbp1vb
= left side of the brain; D = right side of the brain; S = superior; I = inferior
hile gray matter volumes in the left and right parahippocam-al gyrus were found to correlate significantly with scores onhe FOME – total score.
. Discussion
Using VBM, we compared elderly patients with depres-ive disorders and elderly patients without such disordersn terms of the volumes of gray matter in the hippocampusnd parahippocampal gyrus, and investigated patterns of sig-ificant correlations between such regional brain volumesnd scores on cognitive screening tests and specific mem-ry tasks in both groups. The main finding of the study ishat the volumes of the hippocampus and parahippocampalyrus in depressive patients were correlated with scores onemory tests, including measures of delayed retrieval of pre-
iously learned information. This association was found toe independent of the severity of depressive symptoms, ashere were no significant correlations between regional gray
atter volumes and HAM or MADRS scores.Before discussing the correlations between brain vol-
mes and cognitive performance indices, it is important toddress the findings of no significant differences between
vte
epressive patients and controls in regard to the volumesf medial temporal structures or of the brain as a whole.lthough these results corroborate the findings of some previ-us studies (Ashtari et al., 1999; Posener et al., 2003; Sheline,003), they are divergent from those of others (Sheline etl., 1996; Campbell et al., 2004). The lack of between-roup differences in terms of the total volumes of gray andhite matter in the brain might be attributable to the fact
hat the elderly depressed group was largely composed ofatients with mild to moderate depressive symptoms. Pre-ious studies have found a direct relationship between theegree of cerebral atrophy and the current severity of depres-ive symptoms (Kumar et al., 1993). Another aspect thatould partially explain the negative results of our between-roup brain volume comparisons is the fact that patients inhe elderly depressed group had experienced a modest num-er of previous depressive episodes; 19 (39.6%) of the 48atients were presenting their first episode of depression and5 (31.3%) presented their second depressive episode. Pre-ious studies have shown that there is a direct relationshipetween the degree of brain atrophy and the number of pre-
ious depressive episodes (Janssen et al., 2007). Regardinghe volume of white matter in particular, one other possiblexplanation for the lack of differences between the groups
gy of Ag
iotgspsth2
cbtimswHstaptrdhasti(e
autbrtscsplipdawt2icot
morcsthsmscm(o
ipvvitrwl(raswmorioa
ppisgsmwatfMmnd
R. Avila et al. / Neurobiolo
n our study is the fact that they presented similar profilesf clinical comorbidities. Finally, in regard specifically tohe hippocampus and parahippocampal gyrus, the lack ofray matter volume deficits in our depressive sample withymptoms of predominantly mild to moderate severity sup-orts the hypothesis that elderly individuals who have moreevere depressive symptoms and who have experienced mul-iple episodes of depression are those who present greaterippocampal atrophy (Kumar et al., 1993; Janssen et al.,007).
Despite the above negative findings for between-groupomparisons, we detected significant direct correlationsetween visual and verbal memory performance indices andhe volumes of the hippocampus and parahippocampal gyrusn the depressive group. The possible relationship between
emory deficits and volumetric changes in medial temporaltructures has been scarcely investigated in elderly patientsith depressive disorders to date. In a study conducted byickie et al. (2005), hippocampal volumes were found to be
maller in elderly individuals with depressive disorders (par-icularly in those with LOD), and these volume deficits weressociated with verbal and visual memory impairments. Thisattern of results was taken as supportive of the hypothesishat depression is a risk factor for dementia. Although theesults of Hickie et al.’s study (2005) suggest that memoryeficit might be a consequence of structural changes in theippocampus, the authors questioned whether hippocampaltrophy would be a risk factor for or a consequence of depres-ion (Hickie et al., 2005). Limitations of that study, in additiono the manual measurements of the hippocampal region ofnterest, were the heterogeneity of the sample regarding agerange, 28–82 years) and diagnosis (including patients withither major depressive disorder or bipolar depression).
Ballmaier et al. (2008) recently identified regional alter-tions of the hippocampus in elderly depressed individualssing both manual ROI-based volumetric measurements andhree-dimensional radial atrophy mapping. They detectedilateral atrophy of the hippocampus in the depressed groupelative to an elderly healthy control group, especially inhe CA1–CA3 subregions and in the subiculum. When theubgroups of depressed patients with LOD or EOD wereompared against each other, atrophy was greater in the LODubgroup than in the EOD subgroup in the left hippocampus,articularly in the posterior CA1 subregion and the subicu-um. In a subsample of the depressive group, the authors alsonvestigated correlations between hippocampal volumes anderformance on tests of verbal and visual memory. The three-imensional radial atrophy mapping approach revealed thattrophy of the CA1 or the subiculum correlated significantlyith delayed verbal recall in the LOD subgroup, but not in
he EOD subgroup or in the control group (Ballmaier et al.,008). The specific hippocampal location of the latter find-
ng is similar to the hippocampal subportions where atrophichanges have been found to significantly predict conversionf mild cognitive impairment to AD in previous investiga-ions using similar automated, 3-dimensional hippocampalrare
ing 32 (2011) 1857–1867 1865
apping techniques. The authors emphasized the relevancef studying atrophic changes in specific hippocampal sub-egions, adding that their findings suggest that such atrophyould be used as a neurobiological marker to define depres-ion as a risk factor for dementia, a hypothesis to be furtherested in longitudinal studies. Other MRI studies, however,ave produced conflicting findings, either showing a lack ofignificant correlations between memory performance andedial temporal volumes in elderly individuals with depres-
ive disorders (Bell-McGinty et al., 2002) or investigatingorrelations between cognitive deficits and volume measure-ents of other areas of the brain, such as the frontal lobe
Almeida et al., 2003), thereby precluding direct comparisonf the results.
The correlations observed in depressed elderly patientsn the present study suggest that the volumes of hippocam-al/parahippocampal structures influence performance onerbal episodic memory tests, visual learning tests andisual–verbal learning tests, involving measures of bothmmediate and delayed recall. The direct correlation betweenhe volume of the left parahippocampal gyrus and delayedecall measures (as assessed with the FOME) is consistentith the notion that medial temporal structures are particu-
arly relevant to delayed recall/recognition aspects of memorySquire and Knowlton, 1995). Also, this pattern of results iselevant given the evidence that measures of delayed retrievalre the most sensitive to assess memory deficits in mildtages of AD (Welsh et al., 1991). Unexpectedly, however,e detected significant correlations between the volume ofedial temporal structures and patient performance not only
n measures of delayed recall, but also on tests of immediateecall. The latter findings suggest that in elderly life, changesn hippocampal volumes may have broader impacts on mem-ry performance, involving both immediate and delayedspects of information retrieval.
One relevant issue in the present study regards to theossible contamination of the depressed group with patientsresenting with mild symptoms of AD. This is particularlymportant in light of the high frequency of cases with depres-ive symptoms emerging late in life in our depressed group,iven the previous evidence that LOD may be a prodomaltage of AD (Schweitzer et al., 2002). However, we mini-ized the risk of such contamination by excluding subjectsith scores greater than 3.12 in the B-ADL scale that was
pplied to informants; this cutoff has been previously showno discriminate patients with mild to moderate dementiarom non-demented elderly subjects (Folquitto et al., 2007).
oreover, the scores on key memory indices (and volu-etric hippocampal measures in the depressed group) were
ot excessively wide or dissimilar from those in the non-epressed control group.
Although the main goal of our study was to investigate the
elationship between medial temporal gray matter volumesnd memory deficits in elderly depressed patients, it is alsoelevant to discuss the patterns of correlations identified in thelderly control group selected for the study. There have been
1 gy of Ag
poaacowste(ahdurnosvtdrdvd
oittaa
ipwovcwtrmitmsvfsiodaa
C
A
td0
pb
R
A
A
A
A
A
B
B
B
B
C
D
F
F
866 R. Avila et al. / Neurobiolo
revious reports of significant positive correlations betweenverall cognitive performance (as assessed by the CAMCOG)nd brain volumes in elderly healthy individuals (Almeida etl., 2003). Although in the present study there were no signifi-ant correlations between total CAMCOG scores and volumef medial temporal lobe regions in the healthy elderly group,e did observe significant correlations with total MMSE
cores, which is one other screening index of overall cogni-ive performance. However, it should be noted that Ballmaiert al. (2008), Greenwald et al. (1997) and Steffens et al.2000) did not find any significant correlations between over-ll cognitive performance and hippocampal volume in elderlyealthy subjects. Our control group also displayed significantirect correlations between bilateral parahippocampal vol-mes and total FOME scores. However, in contrast with theesults obtained in the depressive group, there were no sig-ificant correlations in the control group between volumesf the hippocampus/parahippocampal gyrus and specificcores on memory subtests evaluating delayed recall of pre-iously learned information. The latter negative finding inhe control group indicates that the relationship betweenelayed memory retrieval performance and medial tempo-al volumes is specific for elderly individuals suffering fromepressive symptoms. This difference further supports theiew that depression in the elderly may be a risk factor forementia.
Limitations of the present study include the heterogeneityf our sample in terms of level of education, the reductionn the sample size due to the artifacts found on MRI scans,he lack of consistent data regarding the duration of illness inhe patients with a history of previous depressive episodes,nd the absence of information regarding the duration ofntidepressant use prior to inclusion in the study.
In conclusion, the results of the present VBM studyndicate that the volumes of the hippocampus and parahip-ocampal gyrus do not differentiate between elderly patientsith mild to moderate depressive disorders and those with-ut depression. This suggests that mechanisms other thanolume reductions in such specific areas of the brain are asso-iated with the cognitive performance of elderly individualsith depressive disorders, a hypothesis that should be inves-
igated in greater detail in future studies. Nevertheless, ouresults highlighted different patterns of correlations betweenemory scores and volumes of medial temporal structures
n depressed individuals and healthy elderly subjects. In par-icular, the direct correlation between delayed visual–verbal
emory recall scores with left parahippocampal volumespecifically in the depressive group provides support to theiew that depression in elderly populations may be a riskactor for dementia. Future MRI studies involving largeramples, and taking into consideration genetic markers, clin-cal comorbidities and the age of the depressive symptoms
nset, will likely shed further light on the pathophysiology ofepression and its associated cognitive deficits in the elderly,s well as on the relationship between this clinical conditionnd AD.ing 32 (2011) 1857–1867
onflict of interest
There is no conflict of interest affecting this manuscript.
cknowledgments
Sponsors: Conselho Nacional de Desenvolvimento Cien-ífico e Tecnológico (CNPQ) no. 141700/2005-0, Fundacãoe Amparo à Pesquisa do Estado de Sao Paulo (FAPESP) no.4/09586-9.
We thank Luciana C. Santos for assistance in the pre-rocessing of MRI data. Geraldo F. Busatto is partially fundedy CNPq (Brazil).
eferences
lexopoulos, G.S., Meyer, B., Young, R.C., Campbell, S., Silbersweig, D.,Charlson, M., 1997. “Vascular depression” hypothesis. Arch. Gen. Psy-chiatry 54, 915–922.
lmeida, O.P., Burton, E.J., Ferrier, N., McKeith, I.G., O’Brien, J.T., 2003.Depression with late onset is associated with right frontal lobe atrophy.Psychol. Med. 33, 675–681.
shburner, J., Friston, K.J., 2000. Voxel-based morphometry—the methods.Neuroimage 11, 805–821.
rmy Individual Test Battery, 1944. Manual of Directions and Scoring. WarDepartment, Adjutant General’s Office, Washington, DC.
shtari, M., Greenwald, B.S., Kramer-Ginsberg, E., Hu, J., Wu, H., Patel,M., Aupperle, P., Pollack, S., 1999. Hippocampal/amygdale volume ingeriatric depression. Psychol. Med. 29, 629–638.
allmaier, M., Narr, K.L., Toga, A.W., Elderkin-Thompson, V., Thomp-son, P.M., Hamilton, L., Haroon, E., Pham, D., Heinz, A., Kumar,A., 2008. Hippocampal morphology and distinguishing late-onset fromearly-onset elderly depression. Am. J. Psychiatry 65 (2), 229–237.
ell-McGinty, S., Butters, M.A., Meltzer, C.C., Greer, P.J., Reynolds III,C.F., Becker, J.T., 2002. Brain morphometric abnormalities in geriatricdepression: long-term neurobiological effects of illness duration. Am. J.Psychiatry 159, 1424–1427.
ottino, C.M.C., Almeida, O.P., Tamai, S., Forlenza, O.V., Scalco, M.Z.,Carvalho, I.A.M., 1999. Entrevista estruturada para diagnóstico detranstornos mentais em idosos –CAMDEX – The Cambridge exami-nation for mental disorders of the elderly. Versão Brasileira (traduzida eadaptada com autorizacão dos autores), São Paulo.
ustamante, S.E.Z., 2003. Testes combinados no rastreamento de demênciaem idosos [dissertation]. Faculdade de Medicina, Universidade de SãoPaulo, São Paulo.
ampbell, S., Marriott, M., Nahmias, C., McQueen, G.M., 2004. Lower hip-pocampal volume in patients suffering from depression: a meta-analysis.Am. J. Psychiatry 161, 598–607.
el Porto, J.A., 1989. Aspectos gerais das escalas para avaliacão e depressão.In: Escalas de avaliacão para Monitorizacão de Tratamento com Psicofár-macos. Centro de Pesquisa em Psicobiologia Clínica do Departamentode Psicobiologia da Escola Paulista de Medicina, São Paulo, pp. 93–100.
olstein, M.F., Folstein, S.E., McHugh, P.R., 1975. “Mini-mental state”.A practical method for grading the cognitive state of patients for theclinician. J. Psychiatr. Res. 12, 189–198.
rodl, T., Schaub, A., Banac, S., Charypar, M., Jäger, M., Kümmler, P., Bot-
tlender, R., Zetzsche, T., Born, C., Leinsinger, G., Reiser, M., Möller,H.J., Meisenzahl, E.M., 2006. Reduced hippocampal volume correlateswith executive dysfunctioning in major depression. J. Psychiatry Neu-rosci. 31 (5), 316–323.
gy of Ag
F
F
G
G
H
H
H
J
K
K
L
L
L
M
M
P
R
S
S
S
S
S
S
S
S
T
T
W
W
R. Avila et al. / Neurobiolo
olquitto, J.C., Bustamante, S.E.Z., Barros, S.B., Azevedo, D., Lopes, M.A.,Hototian, S.R., Jacob Filho, W., Litvoc, J., Bottino, C.M.C., 2007.The Bayer-Activities of Daily Living Scale (B-ADL) in the differen-tiation between mild to moderate dementia and normal aging. Rev. Bras.Psiquiatr. 29, 350–353.
uld, P.A., 1980. Guaranteed stimulus-processing in the evaluation of mem-ory and learning. Cortex 16, 255–272.
ood, C.D., Johnsrude, I.S., Ashburner, J., Henson, R.N.A., Friston, K.J.,Frackwiak, R.S.J., 2001. Voxel-based morphometry study of ageing in466 normal adults human brains. Neuroimage 14, 21–36.
reenwald, B.S., Kramer-Ginsberg, E., Bogerts, B., Ashtari, M., Aupperle,P., Wu, H., Allen, L., Zeman, D., Patel, M., 1997. Qualitative mag-netic resonance imaging findings in geriatric depression. Possible linkbetween later-onset depression and Alzheimer’s disease? Psychol. Med.27, 421–431.
amilton, M., 1960. A rating scale for depression. J. Neurol. Neurosurg.Psychiatry 23, 56–62.
artley, T., Bird, C.M., Chan, D., Cipolotti, L., Husain, M., Vargha-Khadem,F., Burgess, N., 2007. The hippocampus is required for short-term topo-graphical memory in humans. Hippocampus 17 (1), 34–48.
ickie, I., Naismith, S., Ward, P.B., Turner, K., Scott, E., Mitchell, P., Wil-helm, K., Parker, G., 2005. Reduced hippocampal volumes and memoryloss in patients with early and late-onset depression. Br. J. Psychiatry186, 197–202.
anssen, J., Hulshoff Pol, H.E., de Leeuw, F.E., Schnack, H.G., Lampe, I.K.,Kok, R.M., Kahn, R.S., Heeren, T.J., 2007. Hippocampal volume andsubcortical white matter lesions in late life depression: comparison ofearly and late onset depression. J. Neurol. Neurosurg. Psychiatry 78 (6),638–640.
ramer-Ginsberg, E., Greenwald, B.S., Krishnan, K.R., Christiansen, B.,Hu, J., Ashtari, M., Patel, M., Pollack, S., 1999. Neuropsychologicalfunctioning and MRI signal hyperintensities in geriatric depression. Am.J. Psychiatry 156 (3), 438–444.
umar, A., Newberg, A., Alavi, A., Berlin, J., Smith, R., Reivich, M.,1993. Regional cerebral glucose metabolism in late-life depression andAlzheimer disease: a preliminary positron emission tomography study.Proc. Natl. Acad. Sci. U.S.A. 90, 7019–7023.
ehfeld, H., Reisberg, B., Finkel, S., Kanowski, S., Wied, V., Pittas, J.,Tsolaki, M., Robert, P.H., Hulla, F., Heininger, K., Erzigkeit, H., 1997.Informant-rated activities of daily living (ADL) assessments: results ofa study of 141 items in the USA, Germany. Russia and Greece from theInternational ADL Scale Development Project. Alzheimer Dis. Assoc.Disord. 11 (Suppl. 4), 39–44.
inn, B.S., Linn, M.W., Gurell, L., 1968. Cumulative illness rating scale. J.
Am. Geriatr. Soc. 16, 622–625.loyd, A., Ferrier, N.I., Barber, R., Gholkar, A., Young, A.H., O’Brien, J.T.,2004. Hippocampal volume change in depression: late-and-early-onsetillness compared. Br. J. Psychiatry 184, 488–495.
W
ing 32 (2011) 1857–1867 1867
esulam, M.M., 1985. Principle of Behavior Neurology. F.A. Davies,Philadelphia.
ontgomery, S.A., Asberg, M., 1979. A new depression scale designed tobe sensitive to change. Br. J. Psychiatry 134, 382–389.
osener, J.A., Wang, L., Price, J.L., Gado, M.H., Province, M.A., Miller,M.I., Babb, C.M., Csernansky, J.G., 2003. High-dimensional mappingof the hippocampus in depression. Am. J. Psychiatry 160, 83–89.
oth, M., Tym, E., Mountjoy, C.Q., Huppert, F.A., Hendrie, H., Verma,S., Goddard, R., 1986. CAMDEX - A standardized instrument for thediagnosis of mental disorder in the elderly with special reference to theearly detection of dementia. Br. J. Psichiatry 149, 698–709.
chweitzer, I., Tickwell, V., O’Brien, J., Ames, D., 2002. Is late onset depres-sion a prodrome of dementia? Int. J. Geriatr. Psychiatry 17, 997–1005.
chweitzer, I., Tickwell, V., Ames, D., O’Brien, J., 2001. Structural neu-roimaging studies in late-life depression: a review. World J. Biol.Psychiatry 2 (2), 83–88.
heline, Y.I., 2003. Neuroimaging studies of mood disorder effects on thebrain. Biol. Psychiatry 54, 338–352.
heline, Y.I., Wang, P.W., Gado, M.H., Csernansky, J.G., Vannier, M.W.,1996. Hippocampal atrophy in recurrent major depression. Proc. Natl.Acad. Sci. U.S.A. 93, 3908–3913.
preen, O., Benton, A.L., 1977. Neurosensory Center ComprehensiveExamination for Aphasia. University of Neuropsychology Laboratory,Victoria.
preen, O., Strauss, E., 1998. A Compendium of Neuropsychological Tests-administration, Norms and Commentary, 2nd ed. Oxford University,New York.
quire, L.R., Knowlton, B.J., 1995. Hippocampus, and brain sytems. In:Gazzaniga, M.S. (Ed.), The Cognitive Neuroscience. Bradford, Cam-bridge.
teffens, D.C., Byrum, C.E., McQuoid, D.R., Greenberg, D.l., Payne, M.E.,Blitchington, T.F., MacFall, J.R., Krishnan, K.R., 2000. Hippocampalvolume in geriatric depression. Biol. Psychiatry 48, 301–309.
aki, Y., Kinomura, S., Awata, S., Inoue, K., Sato, K., Ito, H., Goto,R., Uchida, S., Tsuji, I., Arai, H., Kawashima, R., Fukuda, H., 2005.Male elderly subthreshold depression patients have smaller volume ofmedial part of prefrontal cortex and precentral gyrus compared with age-matched normal subjects: a voxel-based morphometry. J. Affect Disord.88, 313–320.
alairach, J., Tornoux, P., 1998. Co-planar stereotaxic atlas of the humanbrain. Thieme Medical Publishers Inc., New York.
echsler, D., 1987. Wechsler Memory Scale-revised (WMS-R). The Psy-chological Corporation, New York.
echsler, D., 1999. Wechsler Abbreviated Scale of Intelligence (WASI).
The Psychological Corporation, New York.elsh, K., Butters, N., Hughes, J., Mohs, R., Heyman, A., 1991. Detectionof abnormal memory decline in mild cases of Alzheimer’s disease usingCERAD neuropsychological measures. Arch. Neurol. 48, 278–281.
Copyright © 2022 FDOKUMEN