Voxel-wise Weighted MR Image Enhancement using an Extended Neighborhood Filter
A
mbirrdfrsntwV©
Kc
1
cts
sT
0d
Neurobiology of Aging 30 (2009) 1657–1676
Age-related differences in regional brain volumes: A comparisonof optimized voxel-based morphometry to manual volumetry
Kristen M. Kennedy a, Kirk I. Erickson b, Karen M. Rodrigue a, Michelle W. Voss b,Stan J. Colcombe c, Arthur F. Kramer b, James D. Acker d, Naftali Raz a,∗
a Institute of Gerontology, Department of Psychology, Wayne State University, Detroit, MI, United Statesb Beckman Institute for Advanced Sciences and Technology and Department of Psychology,
University of Illinois at Urbana-Champaign, Champaign, IL, United Statesc School of Psychology, University of Wales, Bangor, United Kingdom
d Mid-South Diagnostic Imaging/Therapeutics, Memphis, TN, United States
Received 31 October 2007; received in revised form 17 December 2007; accepted 19 December 2007Available online 13 February 2008
bstract
Regional manual volumetry is the gold standard of in vivo neuroanatomy, but is labor-intensive, can be imperfectly reliable, and allows foreasuring limited number of regions. Voxel-based morphometry (VBM) has perfect repeatability and assesses local structure across the whole
rain. However, its anatomic validity is unclear, and with its increasing popularity, a systematic comparison of VBM to manual volumetrys necessary. The few existing comparison studies are limited by small samples, qualitative comparisons, and limited selection and modesteliability of manual measures. Our goal was to overcome those limitations by quantitatively comparing optimized VBM findings with highlyeliable multiple regional measures in a large sample (N = 200) across a wide agespan (18–81). We report a complex pattern of similarities andifferences. Peak values of VBM volume estimates (modulated density) produced stronger age differences and a different spatial distributionrom manual measures. However, when we aggregated VBM-derived information across voxels contained in specific anatomically definedegions (masks), the patterns of age differences became more similar, although important discrepancies emerged. Notably, VBM revealedtronger age differences in the regions bordering CSF and white matter areas prone to leukoaraiosis, and VBM was more likely to reportonlinearities in age–volume relationships. In the white matter regions, manual measures showed stronger negative associations with age thanhe corresponding VBM-based masks. We conclude that VBM provides realistic estimates of age differences in the regional gray matter only
hen applied to anatomically defined regions, but overestimates effects when individual peaks are interpreted. It may be beneficial to useBM as a first-pass strategy, followed by manual measurement of anatomically defined regions.2008 Elsevier Inc. All rights reserved.eywords: Voxel-based morphometry; Manual morphometry; Aging; Gray matter; White matter; Regional brain volume; MRI; Nonlinear age trends; Method
oot
omparison; ICV correction
. Introduction
A complex pattern of behavioral and cognitive changes
haracterizes adult development and aging. Understanding ofhe biological roots of these changes is predicated on under-tanding age-related transformations of the brain. The advent∗ Corresponding author at: Institute of Gerontology, Wayne State Univer-ity, 87 East Ferry Street, 226 Knapp Building, Detroit, MI, United States.el.: +1 313 577 2297; fax: +1 508 256 5689.
E-mail address: [email protected] (N. Raz).
Ddaistai
197-4580/$ – see front matter © 2008 Elsevier Inc. All rights reserved.oi:10.1016/j.neurobiolaging.2007.12.020
f magnetic resonance imaging (MRI) facilitated assessmentf the effects of age on brain structure and made it rou-ine (for reviews see Raz, 2000; Raz and Rodrigue, 2006).uring the first decade of widespread use of MRI, the tra-itional neuroanatomical and anthropometric methods werepplied to quantification of human brain structures observedn vivo. In manual methods of brain demarcation and mea-
urement, the MR image, though originated in digital data, isreated as a faithful analog of brain anatomy and its regionsnd structures are traced by human operators directly on themages. Manual volumetry has considerable face validity but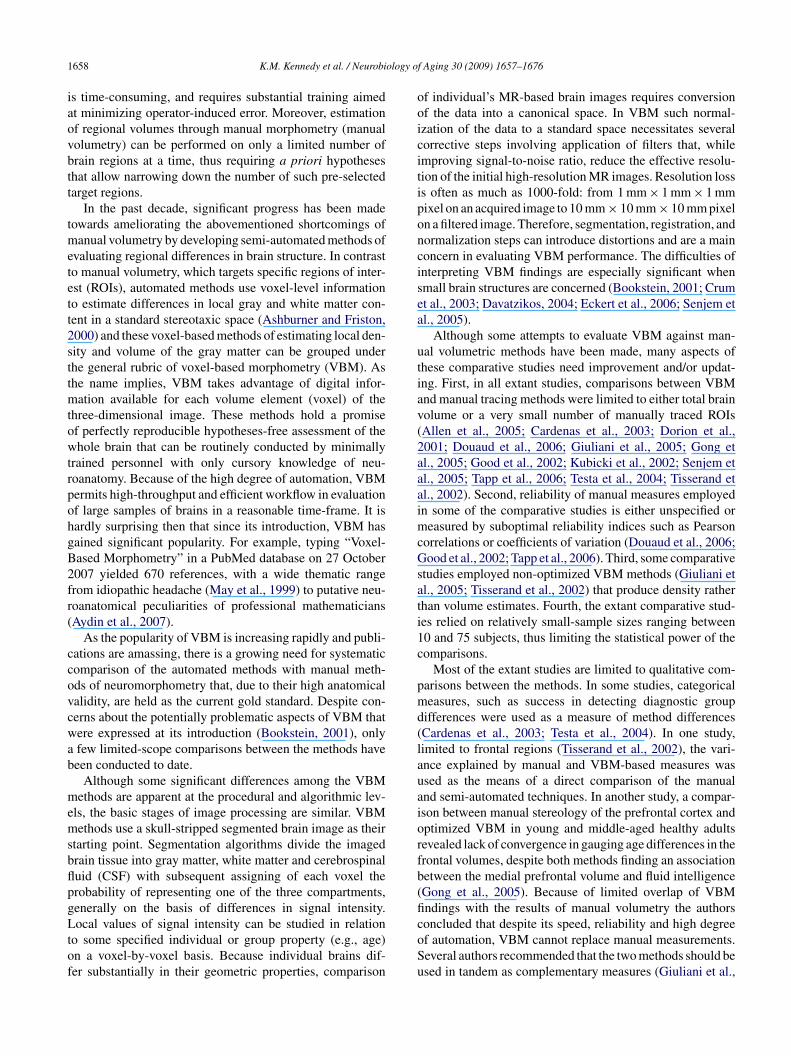
1 ology o
iaovbtt
tmetett2sttmtowtrpohgB2fr(
ccovcwab
memsbflpgLtof
ooicitiponcisea
utiav(2aaaimcGsati1c
pmd(lauaiorfb(fi
658 K.M. Kennedy et al. / Neurobi
s time-consuming, and requires substantial training aimedt minimizing operator-induced error. Moreover, estimationf regional volumes through manual morphometry (manualolumetry) can be performed on only a limited number ofrain regions at a time, thus requiring a priori hypotheseshat allow narrowing down the number of such pre-selectedarget regions.
In the past decade, significant progress has been madeowards ameliorating the abovementioned shortcomings of
anual volumetry by developing semi-automated methods ofvaluating regional differences in brain structure. In contrasto manual volumetry, which targets specific regions of inter-st (ROIs), automated methods use voxel-level informationo estimate differences in local gray and white matter con-ent in a standard stereotaxic space (Ashburner and Friston,000) and these voxel-based methods of estimating local den-ity and volume of the gray matter can be grouped underhe general rubric of voxel-based morphometry (VBM). Ashe name implies, VBM takes advantage of digital infor-
ation available for each volume element (voxel) of thehree-dimensional image. These methods hold a promisef perfectly reproducible hypotheses-free assessment of thehole brain that can be routinely conducted by minimally
rained personnel with only cursory knowledge of neu-oanatomy. Because of the high degree of automation, VBMermits high-throughput and efficient workflow in evaluationf large samples of brains in a reasonable time-frame. It isardly surprising then that since its introduction, VBM hasained significant popularity. For example, typing “Voxel-ased Morphometry” in a PubMed database on 27 October007 yielded 670 references, with a wide thematic rangerom idiopathic headache (May et al., 1999) to putative neu-oanatomical peculiarities of professional mathematiciansAydin et al., 2007).
As the popularity of VBM is increasing rapidly and publi-ations are amassing, there is a growing need for systematicomparison of the automated methods with manual meth-ds of neuromorphometry that, due to their high anatomicalalidity, are held as the current gold standard. Despite con-erns about the potentially problematic aspects of VBM thatere expressed at its introduction (Bookstein, 2001), onlyfew limited-scope comparisons between the methods haveeen conducted to date.
Although some significant differences among the VBMethods are apparent at the procedural and algorithmic lev-
ls, the basic stages of image processing are similar. VBMethods use a skull-stripped segmented brain image as their
tarting point. Segmentation algorithms divide the imagedrain tissue into gray matter, white matter and cerebrospinaluid (CSF) with subsequent assigning of each voxel therobability of representing one of the three compartments,enerally on the basis of differences in signal intensity.
ocal values of signal intensity can be studied in relationo some specified individual or group property (e.g., age)n a voxel-by-voxel basis. Because individual brains dif-er substantially in their geometric properties, comparison
coSu
f Aging 30 (2009) 1657–1676
f individual’s MR-based brain images requires conversionf the data into a canonical space. In VBM such normal-zation of the data to a standard space necessitates severalorrective steps involving application of filters that, whilemproving signal-to-noise ratio, reduce the effective resolu-ion of the initial high-resolution MR images. Resolution losss often as much as 1000-fold: from 1 mm × 1 mm × 1 mmixel on an acquired image to 10 mm × 10 mm × 10 mm pixeln a filtered image. Therefore, segmentation, registration, andormalization steps can introduce distortions and are a mainoncern in evaluating VBM performance. The difficulties ofnterpreting VBM findings are especially significant whenmall brain structures are concerned (Bookstein, 2001; Crumt al., 2003; Davatzikos, 2004; Eckert et al., 2006; Senjem etl., 2005).
Although some attempts to evaluate VBM against man-al volumetric methods have been made, many aspects ofhese comparative studies need improvement and/or updat-ng. First, in all extant studies, comparisons between VBMnd manual tracing methods were limited to either total brainolume or a very small number of manually traced ROIsAllen et al., 2005; Cardenas et al., 2003; Dorion et al.,001; Douaud et al., 2006; Giuliani et al., 2005; Gong etl., 2005; Good et al., 2002; Kubicki et al., 2002; Senjem etl., 2005; Tapp et al., 2006; Testa et al., 2004; Tisserand etl., 2002). Second, reliability of manual measures employedn some of the comparative studies is either unspecified or
easured by suboptimal reliability indices such as Pearsonorrelations or coefficients of variation (Douaud et al., 2006;ood et al., 2002; Tapp et al., 2006). Third, some comparative
tudies employed non-optimized VBM methods (Giuliani etl., 2005; Tisserand et al., 2002) that produce density ratherhan volume estimates. Fourth, the extant comparative stud-es relied on relatively small-sample sizes ranging between0 and 75 subjects, thus limiting the statistical power of theomparisons.
Most of the extant studies are limited to qualitative com-arisons between the methods. In some studies, categoricaleasures, such as success in detecting diagnostic group
ifferences were used as a measure of method differencesCardenas et al., 2003; Testa et al., 2004). In one study,imited to frontal regions (Tisserand et al., 2002), the vari-nce explained by manual and VBM-based measures wassed as the means of a direct comparison of the manualnd semi-automated techniques. In another study, a compar-son between manual stereology of the prefrontal cortex andptimized VBM in young and middle-aged healthy adultsevealed lack of convergence in gauging age differences in therontal volumes, despite both methods finding an associationetween the medial prefrontal volume and fluid intelligenceGong et al., 2005). Because of limited overlap of VBMndings with the results of manual volumetry the authors
oncluded that despite its speed, reliability and high degreef automation, VBM cannot replace manual measurements.everal authors recommended that the two methods should besed in tandem as complementary measures (Giuliani et al.,
ology o
22a[arsfmcs2n
ttorcith
paT(asstwtRrpt1uItmMa(
doics
2
2
(nalsi
lpcmaiwBatnop7(
2
(s3
TS
A
134567
N
K.M. Kennedy et al. / Neurobi
005; Kubicki et al., 2002; Testa et al., 2004; Tisserand et al.,002) without specifying the exact roles for either method,nd recommended “studying correlation between techniquesto] bring quantitative information of their degree of vari-tion” (Dorion et al., 2001). However, such comparisonsequire sufficient statistical power. For example, a small-ample study aimed at predicting conversion to dementiaound no difference among automated, semi-automated, andanual methods (Cardenas et al., 2003). Finally, although
omparisons of VBM and manual measures are certainlyparse, even fewer of the comparison studies (Tapp et al.,006 in canine model; Tisserand et al., 2002) focused onormal aging.
The purpose of the present study was, therefore, to addresshe limitations identified in the current literature and to quan-itatively compare the manual measures of multiple ROIsbtained from unmanipulated MR images to the full-brainegional volume estimates derived from optimized VBM pro-edures. In addition to correspondence between the methodsn measuring regional volumes, we evaluated the methods inheir ability to detect age-related differences in the brains ofealthy adults.
For this comparison study, we used a cross-sectional sam-le of 200 largely healthy non-demented adults that includedsmall subsample of persons with controlled hypertension.he age of the participants covered most of the adult lifespan
18–80 years). Manual measures of thirteen ROIs (11 in graynd 2 in white matter) and their correlations with age in thisample were published in Raz et al. (2004). To expand thecope of regional measures and to provide additional oppor-unities to compare performance of the two methods in thehite matter, we included two additional white matter regions
o this comparison study. Thus, we had 15 manually definedOIs available for a more extensive comparison than ever
eported. Further, the regions selected as the standard of com-arison are highly reliable. The reliability index employed inhis study (intraclass correlation, ICC(2), Shrout and Fleiss,979) is more stringent and comprehensive than frequentlysed product-moment correlations or coefficient of variation.ntraclass correlation takes into account information abouthe order of observations, the distance among them, and the
ean differences in the observations produced by two raters.oreover, in the specific ICC formula, ICC(2), the error vari-
nce is computed under an assumption of random observersShrout and Fleiss, 1979). This assumption makes it more
ctaa
able 1ample description by age decades
ge decades (years) N N men N women
8–30 41 18 231–40 35 14 211–50 42 18 241–60 30 8 221–70 35 15 201–80 17 8 9
ote: N, number; S.D., standard deviation.
f Aging 30 (2009) 1657–1676 1659
ifficult to attain high reliability, but ensures generalizabilityf the measures. Lastly, we performed quantitative compar-sons between the two techniques in addition to the qualitativeomparisons that have been reported in previous comparisontudies.
. Materials and methods
.1. Participants
The data for this study came from a published sampleRaz et al., 2004) that consisted of 200 healthy right-handed,ative English speaking participants (119 women, 81 men)cross a wide age span (18–81 years, mean 46.93) with ateast high school education (mean number of years of formalchooling was 15.76 years). Sample composition by decadess provided in Table 1.
The participants reported no history of cardiovascu-ar disease (except treated hypertension), diabetes, thyroidroblems, drug/alcohol abuse, neurological or psychiatriconditions, or head trauma with loss of consciousness forore than 5 min. They denied using anti-seizure, anxiolytics,
ntidepressants, or recreational drugs or a habit of consum-ng more than three alcoholic drinks per day. All participantsere screened for dementia and depression using a modifiedlessed information-memory-concentration test (Blessed etl., 1968) with a cut-off of 30 and geriatric depression ques-ionnaire (Radloff, 1977) with a cut-off of 15. An experiencedeuroradiologist (JDA) examined the MR scans for spaceccupying lesions and neurodegenerative disease. Partici-ants were strongly right-handed, indicated by a score of5% and higher on the Edinburgh handedness questionnaireOldfield, 1971).
.2. MRI protocol
The images were obtained on a 1.5 T GE Signa scannerGeneral Electric Co., Milwaukee, WI). Volumes were mea-ured on the full-brain images acquired with T1-weightedD spoiled gradient recalled (SPGR) sequence with 124
ontiguous transaxial slices, echo time (TE) = 5 ms, repeti-ion time (TR) = 24 ms, field of view (FOV) = 22 cm × 22 cm,cquisition matrix 256 × 192, slice thickness = 1.3 mm,nd flip angle = 30◦. Thus, the acquired voxel size wasN hypertensives Education, years (mean ± S.D.)
0 16.37 ± 1.713 16.34 ± 2.705 16.09 ± 2.312 15.17 ± 2.896 14.83 ± 2.294 15.23 ± 2.68

1660 K.M. Kennedy et al. / Neurobiology of Aging 30 (2009) 1657–1676
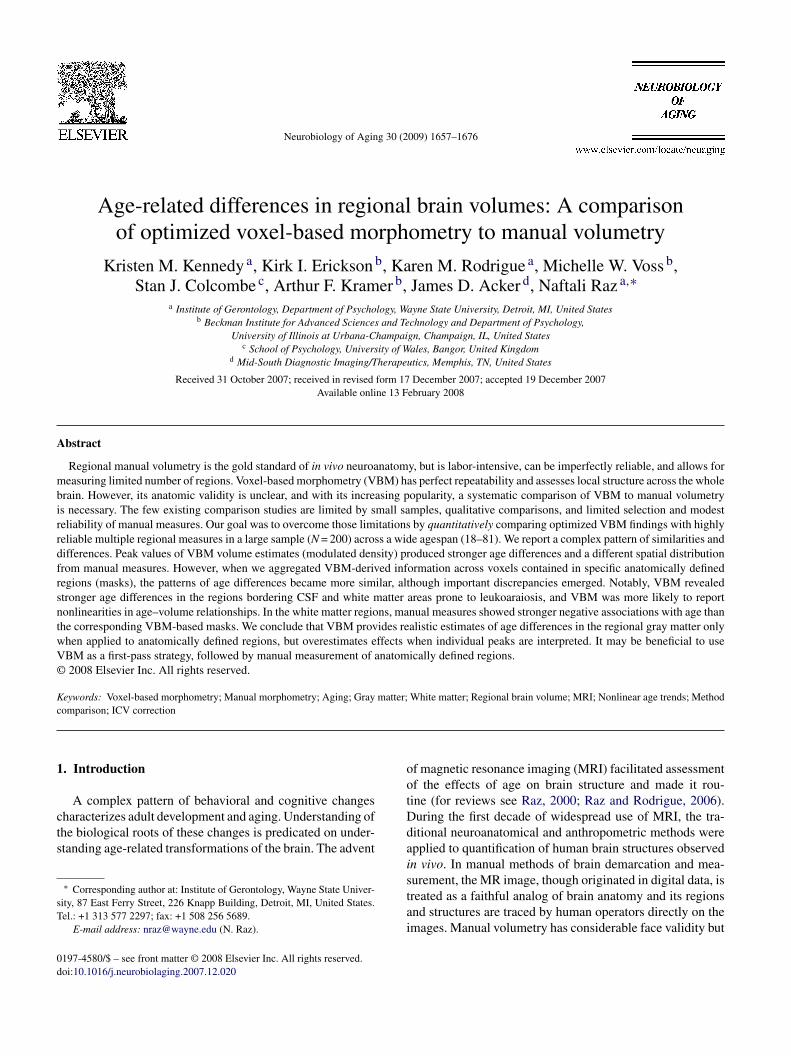
F essing.t n (A). Ft lting im
.stp
2
fpprttvcceowuicfcsv(ip
2
te3
2vsVhtn
rrbased correction (Ashburner and Friston, 2001; Good et al.,2001). We chose to apply the most typical, robust and well-researched VBM technique to ensure the generalizability of
Table 2Manual volumetry: regional volumes, reliabilities, and correlations with age
Region of interest Volume (cm3) rAge ICC(2)
L R
Anterior cingulate gyrus (ACG) 1.14 1.14 −.14 .90Dorsolateral prefrontal cortex (DLPFC) 8.81 8.88 −.63 .96Fusiform gyrus (FG) 9.16 9.43 −.44 .93Prefrontal white matter (FW) 19.17 19.26 −.39 .95Hippocampus (HC) 3.36 3.33 −.46 .97Inferior parietal lobule (IP) 6.72 6.94 .04 .96Inferior parietal white matter (IPW) 5.81 5.80 .11 .96Inferior temporal gyrus (IT) 5.63 5.45 −.33 .95Pre-central gyrus (MC) 9.40 9.44 −.47 .90Pre-central gyrus white (MCW) 7.77 7.79 −.24 .96Orbitofrontal cortex (OFC) 4.35 4.31 −.49 .93Parahippocampal gyrus (PHG) 3.61 3.39 −.33 .97Post-central gyrus (SSC) 6.68 7.08 −.47 .96Post-central gyrus white (SSCW) 5.47 5.78 −.22 .96Visual (pericalcarine) cortex (VC) 2.78 2.81 −.21 .94
ig. 1. Examples of MRI images prepared for manual (A) and VBM (B) procilt, pitch, and rotation was performed on each subject’s high-resolution scao standard space, and smoothing. Note the observable difference in the resu
86 mm × .86 mm × 1.30 mm. The imaging site was fullytaffed by medical physicists and MRI technologists, andhe scanners were routinely calibrated using a standard GEhantom.
.2.1. Manual volumetric morphometryMost of the volumes of the individual ROIs were taken
rom our previously published study (two white matter ROIs,re- and post-central white matter, were added for this com-arison) and detailed descriptions of demarcation and tracingules are available therein (Raz et al., 2004). Briefly, we repar-itioned the SPGR data set into .86-mm × .86-mm × 1.5-mmhick slices and manually aligned each participant’s 3Dolume using BrainImage v2.3.3 (Reiss et al., 1995) toorrect for tilt (interhemispheric fissure), pitch (anteriorommissure–posterior commissure), and rotation (orbits sizequality) of the head (see Fig. 1A). Hippocampus was tracedn the scans after alignment along its long axis. The ROIsere manually traced on each 1.5 mm slice on each brainsing NIH Image v1.62 software (http://rsb.info.nih.gov/nih-mage/) by reliable expert raters with conservative ICC(2)oefficients (Shrout and Fleiss, 1979) of .90–.97 (see Table 2or the list of regional reliabilities). The volumes (cm3) wereomputed and adjusted for body size differences via regres-ion/ANCOVA equations using manually traced intracranialolume (ICV). We examined the 15 ROIs in each hemisphereRaz et al., 2004), as listed in Table 2 and illustrated in Fig. 2,ncluding the two additional white matter regions adjacent tore- and post-central gyri.
.2.2. Voxel-based morphometry
To process the SPGR scans in the voxel-based morphome-ry framework (Ashburner and Friston, 2000, 2001; Mechellit al., 2005) we used the FMRIB Software Library (FSL.2) package (http://www.fmrib.ox.ac.uk/fsl/; Smith et al.,
NRoi
Manual alignment involving rotation of the brain volume to correct for heador VBM (B), segmentation map produced after skull stripping, stretchingage resolution quality between the two methods.
004). Our decision was based on considerations of con-enience and does not imply endorsement of that specificoftware or assertion of its advantages over other popularBM software (e.g., SPM, statistical parametric mapping,ttp://www.fil.ion.ucl.ac.uk/spm/). The goal of this study waso compare the VBM approach with manual volumetry andot to evaluate relative merits of specific software packages.
We applied the optimized VBM method, which has beeneported to significantly reduce registration error and toeconstruct voxel volumes from density values via Jacobian-
ote: L, volume (cm3) of left ROI after adjustment for intracranial volume;, volume (cm3) of right ROI after adjustment for ICV; rAge, correlationf brain volume with age after adjustment for intracranial volume; ICC,ntraclass correlation coefficient, a measure of reliability of tracing.

K.M. Kennedy et al. / Neurobiology of Aging 30 (2009) 1657–1676 1661
Fig. 2. Examples of manually traced regions of interest (ROI) in radiologic orientation: (a) dorsolateral prefrontal cortex (left), orbito-frontal cortex (right), anda ocampg cortex(
oo2wirt
(r
Eeibmc
nterior cingulate gyrus (middle); (b) hippocampus; (c) clockwise: parahippyrus: cortex (left), pre-central white matter (right); (e) post-central gyrus:right), white matter (left); (g) visual (calcarine) cortex.
ur comparison analyses. We have used this method in severalther studies (Colcombe et al., 2003, 2005; Erickson et al.,005, 2007). This method consists of a “two-level” approach,here the first level refers to the initial processing of the
mages, followed by a “second-level” of processing whichefers to re-running these similar steps on the study-specific
emplate.To begin, all brains were stripped of extracranial tissuee.g., skull, para-orbital tissue, dura) using an accurate andobust deformable model algorithm (BET; Smith, 2002).
c
ga
al gyrus (P), fusiform (F) and inferior temporal (I) cortices; (d) pre-central(left), post-central white matter (right); (f) inferior parietal lobule; cortex
ach brain was then visually inspected and any excessxtracranial matter was manually removed. It is crucial thatmage histograms of voxel intensity values represent onlyrain matter as the presence of skull or fat in an image sub-itted to segmentation will alter the range of intensity values
lassified as white matter and result in increased tissue mis-
lassifications.The skull-stripped images were segmented into 3Dray, white and CSF probability density maps via a semi-utomated algorithm (FAST; Zhang et al., 2001) that uses
1 ology o
atavwtStbpmssacpks
lnapvtatfBftmmTvra
tttfi
pbPtwvmT(utZsvwp
2
tbmbgwmir
Fr
662 K.M. Kennedy et al. / Neurobi
hidden Markov random fields model which, in additiono mixture histogram, takes into account spatial informationnd allows an improved estimate of tissue distribution in eachoxel. The segmented probability maps in stereotaxic spaceere used as tissue priors to seed the tissue histogram dis-
ribution for the second-level (study-specific) segmentation.kull-stripped brains were registered to MNI standard stereo-
axic space using a robust 12-parameter affine transformased on a correlation ratio cost function with sinc inter-olation (FLIRT; Jenkinson et al., 2002). The transformationatrices resulting from registration were then applied to the
egmented gray and white matter images, which producedegmented tissue images in standard space. We then createdstudy-specific template by averaging these images into a
omposite image that represents the average brain of our sam-le and then smoothed with a 4-mm HWHM 3D Gaussianernel (∼8 mm FWHM). The smoothed image became thetudy-specific template used for later registrations.
To complete the optimized VBM process, the “second-evel” of processing, the original skull-stripped brains (inative space) were registered to the study-specific templatend segmented using the study-specific gray, white, and CSFrobability maps (priors) (Good et al., 2001). These partialolume maps were inspected and corrected for misclassifica-ion of tissue segmentation at edge voxels at the gray/whitend white/CSF borders. These maps were then registered tohe study-specific template via a 12-parameter affine trans-orm and spatially smoothed with a 4-mm HWHM kernel.ecause significant stretching may occur during spatial trans-
ormation from native to study-specific space we computedhe determinant of this second-level transformation Jacobian
atrix and multiplied the gray, white, and CSF probabilityaps of the individual brains by the Jacobian determinant.
his step attempts to preserve information about changes inoxel volume that were induced by spatial registration. Theesulting modulated probability maps (illustrated in Fig. 1Bnd hereafter referred to as the modulated data) are usedsfsw
ig. 3. Example of manually drawn ROI masks for VBM analysis. The same ROIsegistered to standard space to create the masks for a quantitative comparison of VB
f Aging 30 (2009) 1657–1676
hroughout this report. One participant was not included inhe VBM analysis due to an unrecoverable artifact in the scanhat negatively affected the segmentation algorithm. Thus, thenal comparative sample consisted of 199 brains.
The gray matter, white matter, and CSF maps for eacharticipant yield a partial volume estimate (PVE) of eachrain tissue type for each voxel in stereotaxic space. ThoseVEs were used as the primary-dependent measures in statis-
ical analyses. Specifically, age, sex, and hypertensive statusere entered into a general linear model as independentariables of interest, with the gray and white matter PVEap voxel-wise values as the dependent variables of interest.hus, a separate model was run for each voxel using FEAT
FMRI Expert Analysis Tool; Smith et al., 2004), with man-ally traced ICV as a covariate. A set of linear contrasts washen used to test the regression parameters, from which a-statistic was generated for each voxel. The resulting analy-is yielded statistical parametric maps (SPMs) for regressedariables for each tissue type. Statistical parametric mapsere thresholded at an uncorrected voxel-wise threshold of< .001 (Z = 3.10).
.2.3. Manually drawn ROI masks for VBMTo directly compare the manually measured volumes with
he volumes estimated from VBM, we used hand-drawninary ROI masks. The masks were drawn using the FSLviewodule on T1-weighted coronal images of a skull-stripped
rain of a representative participant. For the purpose of maskeneration, the representative subject was defined as the oneith the least root mean squared difference (RMSD) from theean sample-specific template image. We created the masks
n native space of the subject with the lowest RMSD (98.1,ange 98–153) and then registered each mask into study-
pecific standard space. The list of mask regions (see Fig. 3or an example) was identical to that of the manual volumetrytudy (Raz et al., 2004), with an addition of two peri-Rolandichite matter ROIs. Note that NIH Image software used forwere manually drawn on a representative subject in native space and thenM and manual volumetry.

ology of Aging 30 (2009) 1657–1676 1663
ots
meTbuvmOacswvmm
3
3
sTtmdcs(ibaS.wdefo
taafd
3
oi
Fig. 4. VBM gray matter results: statistical parametric maps for age differ-ences in gray matter revealed significant age-related reduction in modulateddensity in all lobes. The strongest effects were limited to the regions ofparenchyma–CSF interface such as Sylvian and interhemispheric fissures,especially the superior temporal gyrus. The SPM is a map of significant Z-statistic values that correspond in color to the magnitude legend to the right,waw
pi(mwsstwp(aosgZm
bmieetmpl
K.M. Kennedy et al. / Neurobi
riginal measures did not allow us to save ROI objects, hencehe need to create the masks in FSLview for this comparisontudy.
The correlation between the volumes estimated from theanually demarcated ROIs and the volume (number of vox-
ls × 8 mm3) encompassed by the ROI masks was r = .98.hus, we demonstrated excellent reliability correspondenceetween the manually drawn ROI masks and original man-al tracing. Each ROI mask was applied to the group (ageariable Z-statistic map) and individual (partial volume esti-ation, PVE) image data, yielding two separate data sets.ne contained average Z-score values for each region/mask
nd the values for each factor in the VBM model and the otheronsisted of regional data for each subject. Thus, the peak Z-cores obtained from the VBM analysis could be identifiedithin the manually traced ROIs for both the group and indi-idual data. Finally, we computed summary statistics (min,ax, and mean intensity, #voxels, and volume) within theasked areas to directly compare with manual volumes.
. Results
.1. Manual volumetric morphometry
First, we summarize the results of manual measures analy-es as reported in our previous publication (Raz et al., 2004).o examine the differential effects of age on the manually
raced regional brain volumes, we used the general linearodel, in which regional volume adjusted for ICV was a
ependent variable, age was continuous predictor, sex was aategorical predictor, and hemisphere was a repeated mea-ures factor. Although men still had larger regional volumeswith the exception of IPL), a sex × ROI interaction furtherndicated the magnitude of sex effects differed across therain regions from moderate (d = .66 for VC, .51 for PHG,nd .48 for ACG, .41 for HC, .38 for FW) to low (d < .3 forSC, MS, IT, OFC) to negligible (d = .17 for DLPFC and
16 for parietal white). The observed pattern of sex effectsas not consistent with that observed in our previous samplerawn from the same population (Raz et al., 1997). How-ver, a sex × age interaction was observed in HC, FG, androntal white matter, where sex differences were observednly among the young participants.
We found neither significant effect of diagnosis of hyper-ension or hormone replacement therapy nor interactionsmong them. Correlations between age and regional volumesdjusted for ICV varied throughout the brain ranging widelyrom r = .04 in the inferior parietal lobule to r = −.63 in theorsolateral prefrontal cortex (see Table 2 for details).
.2. Voxel-based morphometry
The optimized VBM analysis yielded widespread effectf age on brain modulated density (see Fig. 4 for visualnspection of the age effect magnitude and Table 3 for
rpa(
ith the yellow voxels having an effect of up to 10.5. Note that because thesere Z-values, they can be directly compared to the magnitude of effects forhite matter in Fig. 5.
eak coordinates). Inspection of peak coordinates and visualnspection of the gray matter statistical parametric mapsSPM; see Fig. 4) revealed significant age-related reduction inodulated density in all lobes. However, the strongest effectsere limited to the regions of parenchyma–CSF interface
uch as Sylvian and interhemispheric fissures, especially theuperior temporal gyrus (see Table 3). Age differences inhe white matter modulated density were considerably lessidespread and concentrated in the anterior and middle cor-us callosum, periventricular areas and cerebellar pedunclessee Fig. 5 and Table 3). Note that in the whole-brain VBMnalysis, the age effect on gray matter was stronger thann white matter. Specifically, as illustrated in Figs. 4 and 5,ignificant gray matter voxels associated with age occupiedreater space than white matter voxels. Furthermore, the peak-statistics were higher in the gray matter compared to whiteatter (max Z = 10.5 vs. max Z = 7.2).We observed several circumscribed regional differences
etween hypertensive participants (n = 19) and their nor-otensive peers as well as a significant hypertension × age
nteraction. Hypertension exacerbated the age-related differ-nces. However, the extent of spatial distribution of thoseffects was limited. Specifically, the main effects of hyper-ension (reduced modulated density) were limited to gray
atter in the left medial frontal and right and left inferiorarietal regions. Peaks for the age × hypertension effect wereimited to white matter in the left and right medial frontal,
ight superior temporal gyrus, right inferior parietal, and leftosterior parietal regions. A right medial frontal cluster waslso observed in gray matter, but contained only three voxelsmax Z = 3.16), and overlapped with the right medial frontal
1664 K.M. Kennedy et al. / Neurobiology of Aging 30 (2009) 1657–1676
Table 3Location and coordinates of voxels demonstrating the highest age-association (adjusted for intracranial volume) for both gray and white matter and mean andstandard deviation partial volume estimates (PVEs) from those peak voxels and relation to age
Peak location MNI x, y, z max Z PVE mean ± S.D. PVE rAge PVE-age R2
Gray matterL superior temporal gyrus/insula −46, −4, −8 10.5 .58 (.080) −.77 0.59R superior temporal gyrus 46, −10, −2 10.2 .57 (.080) −.70 0.49L superior frontal gyrus −2, 62, 0 9.88 .59 (.088) −.78 0.60R medial frontal gyrus 6, 62, 6 9.76 .59 (.069) −.74 0.55R superior temporal gyrus/insula 54, 0, 2 9.35 .64 (.073) −.79 0.62L pre-central/inferior frontal gyrus −48, 8, 30 9.33 .60 (.088) −.73 0.53
White matterL midbrain −2, −4, −2 7.15 .52 (.104) −.66 0.43Lateral ventricle −24, −36, 8 6.67 .63 (.114) −.46 0.21L sublobar caudate tail −16, −24, 20 6.53 .63 (.120) −.55 0.31L thalamus −8, −16, 18 6.45 .59 (.120) −.51 0.26L dorsal midbrain −4, −12, 16 6.27 .77 (.091) −.50 0.25L corpus callosum, anterior −14, 30, 6 6.17 .62 (.108) −.56 0.33R post-central gyrus 38, −30, 44 4.11 .58 (.080) −.26 0.07
Note. All reported results use modulated data. L, left hemisphere; R, right hemisphere; MNI x, y, z, coordinates in Montreal Neurological Institute space; rAge,c age R2,a lidity fof
wmbggfabvr
Fewtpve
ewotti
orrelation of PVE with age after adjustment for intracranial volume; PVE-ge. The strongest peak locations are provided regardless of anatomical varom the white matter maps).
hite matter cluster. Specific coordinates, cluster size, andax Z-scores (peaks) for the age × hypertension effect can
e found in Table 4. It is notable that overlapping peaks inray and white matter SPMs oftentimes occurred near theray and white matter borders. As mentioned in Section 2,or VBM analyses, probability maps are the dependent vari-bles of interest. Thus, even voxels with low probability of
eing gray or white matter (e.g., .2–.5) are still continuousariables that may show statistical relations, albeit within aestricted range of intensities.ig. 5. VBM white matter results: statistical parametric maps for age differ-nces in white matter revealed age-related differences in modulated densityere considerably less widespread than in gray matter and concentrated in
he anterior and middle corpus callosum, periventricular areas and cerebellareduncles. Note that the largest effects for white matter were in the yellowoxels, with values of up to 7.15, substantially smaller than the gray matterffects (of up to 10.5) shown in Fig. 4.
ptamctca
iptw(swavepa
3
t(
squared multiple correlation, i.e. the portion of variance accounted for byr illustration purposes (e.g., lateral ventricle and thalamus listed as effects
In several small clusters of voxels, we noted sex differ-nces across the age span such that greater modulated densityas observed in women compared to men. Specific regionsf sex differences in gray matter included the right superioremporal gyrus, right cingulate gyrus, left medial frontal, andhe left inferior temporal regions. Regions of sex differencesn the white matter included the left pre-central gyrus, rightost-central gyrus, right inferior parietal, and right medialemporal regions. In addition, there was an age × sex inter-ction: men showed increasingly reduced modulated whiteatter density with age in the cingulate gyrus, right post-
entral gyrus, left and right pre-central gyrus, right superioremporal gyrus, and the right medial frontal region. Specificoordinates, cluster size, and peak Z-scores for the sex effectsre presented in Table 5.
Note that the sex and hypertension effects were very smalln both spatial extent and magnitude. Moreover, they disap-eared after a cluster-wise threshold of p < .01 and voxel-wisehreshold of Z = 2.33 were applied. The sex differences thatere observed when total brain voxels served as a covariate
as seems to be a convention in many VBM studies) wereubstantially attenuated when an extra-cerebral index, ICV,as used as a covariate instead. For example, without ICV ascovariate there were 4138 significant (Z > 3.1) gray matteroxels and 4096 significant white matter voxels. With ICVntered in the model, however, the size of sexually dimor-hic clusters dropped to 253 significant gray matter voxelsnd 289 significant white matter voxels.
.3. Comparison of VBM to manual volumetry
Age differences in multiple cortical and white mat-er regions were apparent on VBM significance mapsFigs. 4 and 5). In addition to the prefrontal regions that

K.M. Kennedy et al. / Neurobiology of Aging 30 (2009) 1657–1676 1665
Table 4Location and coordinates of voxels demonstrating the strongest association with diagnosis of hypertension
Peak location Gray MNI x, y, z #voxels max Z White MNI x, y, z #voxels max Z
Main effect: hypertensionR inferior parietal 56, −38,26 69 4.41 – – –L frontal medial −10, 26, 44 35 4.09 – – –L frontal medial −10, 40, 36 24 3.81 – – –L frontal medial −12, 18, 58 15 3.52 – – –L inferior parietal −54, −38, 26 7 3.47 – – –
Interaction: age × hypertensionL frontal medial – – – −12, 24, 44 44 4.13R superior temporal gyrus – – – 48, −10, 8 32 4.11R frontal medial – – – 18, 12, 56 85 3.93R inferior parietal – – – 58, −38, 26 23 3.97L posterior parietal – – – −22, −64, 56 36 3.91L frontal medial – – – −6, 50, 28 83 3.72L frontal medial – – – −8, 42, 36 83 3.65
N er of cor
eutloadtaa
smm
twadaatsta
TL
P
M
A
N
L frontal medial – –
ote. All reported results are from the modulated data. #voxels is the numbight hemisphere.
videnced the highest correlations with age in manual vol-metry, the VBM peak analysis placed the insula and superioremporal gyrus at the top of the most age-sensitive regionsist. Notably, the highest peak Z-values for age effects werebserved in the regions bordering the major fissures: Sylviannd interhemispheric. In the white matter compartment, ageifferences were limited almost exclusively to the periven-ricular regions and cerebellar peduncles. The top six graynd white regional peaks ranked by the age-effect Z-valuesre presented in Table 3.
Although visual inspection of age-related differences (Z-cores) may be informative, the results obtained by the twoethods need to be compared quantitatively. With that goal inind we conducted several comparisons. First, we extracted
tTsa
able 5ocation and coordinates of voxels demonstrating the strongest sex differences
eak location Gray MNI x, y, z #voxels
ain effect of sex (F > M)L pre-central gyrus – –R superior temporal gyrus 42, −20, −2 81R post-central gyrus/inferior – –R post-central gyrus – –R cingulate gyrus 14, 16, 24 34R cingulate gyrus 14, 30, 22 34L frontal medial −14, 32, 32 12L inferior temporal −34, −4, −46 30R cingulate gyrus 14, 12, 26 34R superior temporal gyrus 40, 0, −22 67R inferior parietal – –R medial temporal – –
ge × sex interactionCingulate Gyrus/Posterior 0, −28, 38 29R post-central Gyrus 42, −26, 44 78R frontal medial 4, 34, 26 52L pre-central gyrus −24, −22, 54 16R pre-central gyrus 42, −8, 38 27R superior temporal gyrus – –R cingulate gyrus – –
ote. All reported results use modulated data. #voxels is a number of contiguous vox
– −10, 60, −2 29 3.60
ntiguous voxels (cluster size) surrounding the peaks. L, left hemisphere, R,
he partial volume estimate (PVE, or proportion of gray orhite matter) for each peak voxel from the list of the highest
ge-associated Z-scores for each subject (see Table 3 for coor-inates and statistics). Those peak PVEs were correlated withge (see correlations in Table 3). The correlations betweenge and VBM-derived peak PVE ranged from r = −.26 forhe right post-central gyrus white matter to r = −.79 for rightuperior temporal gyrus/insula gray matter. By comparison,he correlations between manually measured volumes andge ranged from r = .04 for inferior parietal lobule gray matter
o r = −.63 for dorsolateral prefrontal cortex gray matter (seeables 2 and 3 for all regions). However, voxel-based mea-ures obtained from the peaks that already showed the largestge-related differences would be biased towards finding largemax Z White MNI x, y, z #voxels max Z
– −24, −22, 56 107 4.363.74 – – –– 56, −14, 26 50 3.72– 46, −26, 46 52 3.713.68 – – –3.65 – – –3.65 – – –3.62 – – –3.60 – – –3.80 – – –– 46, −22, 28 50 3.32– 28, −30, −4 39 3.27
3.64 – – –3.62 – – –3.61 – – –3.53 – – –3.41 – – –– 44, 2, −18 67 3.41– 12, 22, 22 26 3.4
els (cluster size) surrounding peaks. L, left hemisphere, R, right hemisphere.

1 ology o
aprm
tTavvaoaVR(
3
i
icZais
emfptgrid
TA
R
G
W
NZ
666 K.M. Kennedy et al. / Neurobi
ge effects. Therefore, the second step was to examine theeak values within the anatomically defined ROIs compa-able to those from which regional volumes were obtainedanually.The maximum voxel-wise age differences for the ROIs
hat correspond to manually traced regions are reported inable 6. This comparison shows that every gray matter ROInd all but three white matter ROIs contained at least someoxels with significant age-differences. However, a single-oxel peak located in a specific region does not have a clearnatomical meaning and cannot serve as a representativef the region. For a quantitative comparison of the manualnd VBM results, we conducted the third analysis, in whichBM-derived density estimates were aggregated across theOIs demarcated according to the manual volumetry rules
Raz et al., 2004).
.3.1. VBM regional mask analysesWe re-ran the same FSL model as before, but restricted
t to the voxels within the binary masked ROIs. For each
ptlw
able 6ge differences (Z-score for age effect) in ICV-adjusted ROI masks
OI Max Z-score Peak coordinates
x y z
ray matterACGL 8.89 −4 36 22ACGR 8.49 4 38 16DLPFCL 8.93 −6 56 28DLPFCR 7.28 30 44 32FGL 7.14 −46 −60 −22FGR 6.20 40 −48 −28HCL 6.37 −24 −24 −18HCR 5.59 18 −12 −22IPL 8.65 −40 −24 16IPR 8.02 52 −16 48ITL 6.58 −46 −54 −26ITR 7.98 64 −32 −4MCL 10.03 −46 −4 −2MCR 9.35 54 0 2OFCL 7.62 −34 30 −14OFCR 7.64 28 32 −16PHGL 6.07 −14 −40 −18PHGR 5.50 20 −22 20SSCL 9.78 −46 −6 0SSCR 8.77 48 −4 2VCL 6.30 −8 −76 12VCR 7.55 8 −60 12
hite matterFWL 5.97 −14 32 4FWR 4.84 16 32 4IPWL 3.15 −54 −18 36IPWR 4.15 38 −30 42MCWL 2.01a −24 2 32MCWR 3.26 24 −6 30SSCWL 2.33a −58 −16 32SSCWR 3.10a 60 −16 24
ote. L, left hemisphere; R, right hemisphere; volume = #voxels multiplied by 8-scores.a max peak Z-score did not reach significance, indicating no significant effect of
f Aging 30 (2009) 1657–1676
th subject, within each of jth ROIs and each kth voxel, weomputed the PVEijk, and compared ROI-specific age-related-values and partial volume estimates to manual volume andge effects. The descriptive statistics for the age differencesn regional peaks are presented in Table 6, whereas the PVEample means for all ROIs are listed in Table 7.
Correlations between the ICV-adjusted partial volumestimates from the masked regions and the volume from theanually traced ROIs were quite low, ranging from r = .56
or the dorsolateral prefrontal area to r = −.01 for the inferiorarietal white matter (see Table 7 for all region’s correla-ions between the two methods). Age effects in all corticalray matter ROIs were negative (see Table 7), indicatingeduced local modulated density in older brains. Althoughn eight out of 11 cortical regions the magnitude of ageifferences was greater for VBM-based estimates, the pro-
ortion was not significantly different from chance: signest p = .23. For three out of four white matter ROIs simi-ar, though smaller, negative age differences were observedith the manual measures, but not with the VBM estimates.#voxels Volume (mm3) Mean Z S.D.
363 2,904 5.51 2.30449 3,592 4.97 2.10
2966 23,728 4.36 1.833063 24,504 4.11 1.493105 24,840 2.42 1.503381 27,048 2.56 1.551143 9,144 1.89 2.701181 9,448 1.73 2.361743 13,944 4.36 1.652033 16,264 4.09 2.301721 13,768 2.43 1.341905 15,240 2.52 1.663195 25,560 5.31 1.923313 26,504 4.99 2.121420 11,360 4.17 1.801375 11,000 4.24 1.531424 11,392 3.30 1.571587 12,696 2.87 1.332451 19,608 5.13 2.072038 16,304 4.68 2.101236 9,888 4.41 1.431187 9,496 3.92 1.58
4190 33,520 0.34 1.464198 33,584 0.00 1.381320 10,560 0.03 1.331567 12,536 0.65 1.682360 18,880 −1.29 1.272662 21,296 −0.55 1.281882 15,056 −1.23 1.451523 12,184 −0.45 1.19
mm3. See Table 2 for ROI abbreviations. The mean and S.D. are for the
age within this ROI. All results are based on modulated data.

K.M. Kennedy et al. / Neurobiology of Aging 30 (2009) 1657–1676 1667
Table 7Summary statistics of VBM partial volume estimates (PVEs) from manually drawn ROI masks and their age effects compared to manual volume, all adjustedfor ICV (N = 199)
ROI Partial volume estimates rAge r PVE Manual Z* for �r
Min Max Mean S.D. C.V. PVE Manual
ACG 0.47 0.81 0.65 0.06 0.10 −0.66 −0.16 0.15 6.47***
DLPFC 0.29 0.56 0.44 0.04 0.11 −0.73 −0.63 0.56 2.27*
FG 0.48 0.72 0.60 0.06 0.08 −0.57 −0.43 0.29 2.03*
FW 0.36 0.54 0.45 −0.01 0.08 −0.21 −0.39 0.35 2.37*
HC 0.50 0.69 0.59 0.14 0.06 −0.56 −0.46 0.42 1.6IP 0.28 0.55 0.43 0.42 0.13 −0.77 −0.04 0.06 9.61***
IPW 0.41 0.63 0.51 0.21 0.09 −0.14 0.11 −0.01 2.48*
IT 0.31 0.57 0.45 0.40 0.11 −0.45 −0.33 0.14 1.45MC 0.21 0.51 0.40 0.26 0.14 −0.81 −0.47 0.42 6.90***
MCW 0.37 0.61 0.50 0.43 0.09 0.24 −0.25 0.21 5.57***
OFC 0.27 0.53 0.40 0.22 0.11 −0.65 −0.49 0.39 2.70**
PHG 0.37 0.66 0.52 0.32 0.11 −0.55 −0.33 0.26 2.98**
SSC 0.25 0.54 0.44 0.06 0.13 −0.79 −0.47 0.43 6.34***
SSCW 0.42 0.63 0.51 0.04 0.09 0.23 −0.22 0.22 5.13***
VC 0.31 0.66 0.47 0.06 0.13 −0.64 −0.21 0.32 6.16***
Note. ICV = intracranial volume; PVE = partial volume estimate (the proportion of gray matter within a voxel across voxels included in the mask); Z* = Steiger’sZ for the change in correlation. Modulated data were used for all indices. See Table 2 for ROI abbreviations.
*
*
NmOtatpsgt(tWd(ooT
rcsrmypatcfta
csosF
efsnepfoacRiwdwo
wotst
p < .05.** p < .01.** p < .001.
o significant differences were noted in IPw. For all whiteatter ROIs, manual measures produced larger age effects.verall, there was a weak association between the magni-
ude of age differences in white matter obtained with manualnd VBM-derived measures: Spearman ρ = .40, p < .05, one-ailed. However, when the most discrepant region, inferiorarietal lobule, was removed from the set, the associationtrengthened to ρ = .58, p < .05. Notably, across all ROIs,reater PVE variability (as indexed by the coefficient of varia-ion, CV) was associated with greater age-related differencesSpearman ρ = .59, p < .05) and greater negative correla-ions between PVE and age: Spearman ρ = −.69, p < .01.
e used Steiger’s Z* statistic, which takes into account theependence between the members of bivariate correlationsSteiger, 1980), to quantitatively compare the correlationsf age and regional volumes obtained by the two meth-ds for significant departure. These differences are listed inable 7.
We conducted a general linear model analysis withegional PVEs as multivariate-dependent variables, age (re-entered at its sample mean) as a continuous predictor, andex as a categorical-independent variable. For the gray matteregions, the ROI and the hemisphere served as two repeatedeasure factors with 11 and 2 levels, respectively. The anal-
ses revealed the main effect of age: F(1,196) = 306.67,< .001, η2 = .61. However, as indicated by a significantge × ROI interaction (F(10,196) = 19.56, p < .001, η2 = .01),he magnitude of age differences varied across ROIs. The
orrelations between age and PVE ranged between r = −.40or the IT to r = −.80 for the MC. Within ROIs, correla-ions with age were sometimes larger for the left hemispherend sometimes for the right. In all cases these differences inDiac
orrelation magnitude were trivial and were confined to theecond digit after the floating point. Nonetheless, becausef strong dependence between the hemispheric PVEs, amall but significant age × ROI × hemisphere effect ensued:(10,196) = 2.38, p < .05, η2 = .01.
In a similar model for the white matter, ROI (four lev-ls), and hemisphere (two levels) were repeated measureactors. This analyses revealed a significant effect of Hemi-phere: F(1,196) = 255.57, p < .001, η2 = .39. Neither ageor sex showed significant main effects (both F < 1). How-ver, a significant ROI × age interaction (F(3,588) = 32.26,< .001, η2 = .06) indicated that some ROIs showed age dif-
erences. Indeed, the correlation with age was significantnly for the prefrontal and primary motor (pre-central gyrus)rea white matter, but not for the inferior parietal or post-entral gyrus. Furthermore, the significant triple interactionOI × age × hemisphere (F(3,588) = 10.56, p < .01, η2 = .03)
ndicated that age effects varied not only across ROIs but alsoithin ROI. Whereas left IPw and right SSw showed no ageifferences, among the ROIs that exhibited smaller volumesith age, the left hemisphere effects were larger than thosen the right.
To illustrate the differences in the observed age effects,e provide side-by-side scatterplots depicting the regressionf each ROI (adjusted for intracranial volume) on age for thewo methods (see Figs. 6–9). Visual inspection of the plotsuggests several method-related differences in the distribu-ions of volume estimates and age. For some regions (e.g.
LPFC, OFC and PHG), the VBM-based estimates producedsolated outliers that appear to enhance the association withge. Removal of the outliers, however, had no effect on theorrelations between ROI PVEs beyond the third decimal

1668 K.M. Kennedy et al. / Neurobiology of Aging 30 (2009) 1657–1676
F M-derip ions we
pa
a(
P
F(
ig. 6. Scatterplots of bivariate relations between age manual volumes or VBrefrontal cortex, orbitofrontal cortex, anterior cingulate gyrus). All regress
lace, and therefore, all the observations were retained in the
nalyses.For some ROIs, we observed nonlinear effects, i.e.,ge-related differences in PVE became greater with ageFigs. 6–9). We formally tested each of the regressions of
wift
ig. 7. Scatterplots of bivariate relations between age manual volumes or VBMhippocampus, parahippocampal gyrus, fusiform gyrus, inferior temporal gyrus). A
ved partial volume estimates for prefrontal gray matter regions (dorsolateralre conducted using intracranial volume adjustment.
VE or volume on age for a quadratic fit (in no instance
as a cubic polynomial a better fit). The results (tabulatedn Table 8) indicated that the magnitude of nonlinear effectsound by PVE and by manual findings correlated, althoughhe agreement was far from perfect: ρ = .55, p < .05. The PVE
-derived partial volume estimates for temporal lobe gray matter regionsll regressions were conducted using intracranial volume adjustment.

K.M. Kennedy et al. / Neurobiology of Aging 30 (2009) 1657–1676 1669

1670 K.M. Kennedy et al. / Neurobiology of Aging 30 (2009) 1657–1676
K.M. Kennedy et al. / Neurobiology of Aging 30 (2009) 1657–1676 1671
Table 8Test of nonlinearity of effects of age on regional ROIs across the age span for manual ROIs and PVEs from binary masks
ROI Slope R2 F(1,196)
Linear (cm3/year) Quadratic (cm3/year2) Linear Quadratic Manual PVE
Manual PVE Manual PVE Manual PVE Man PVE
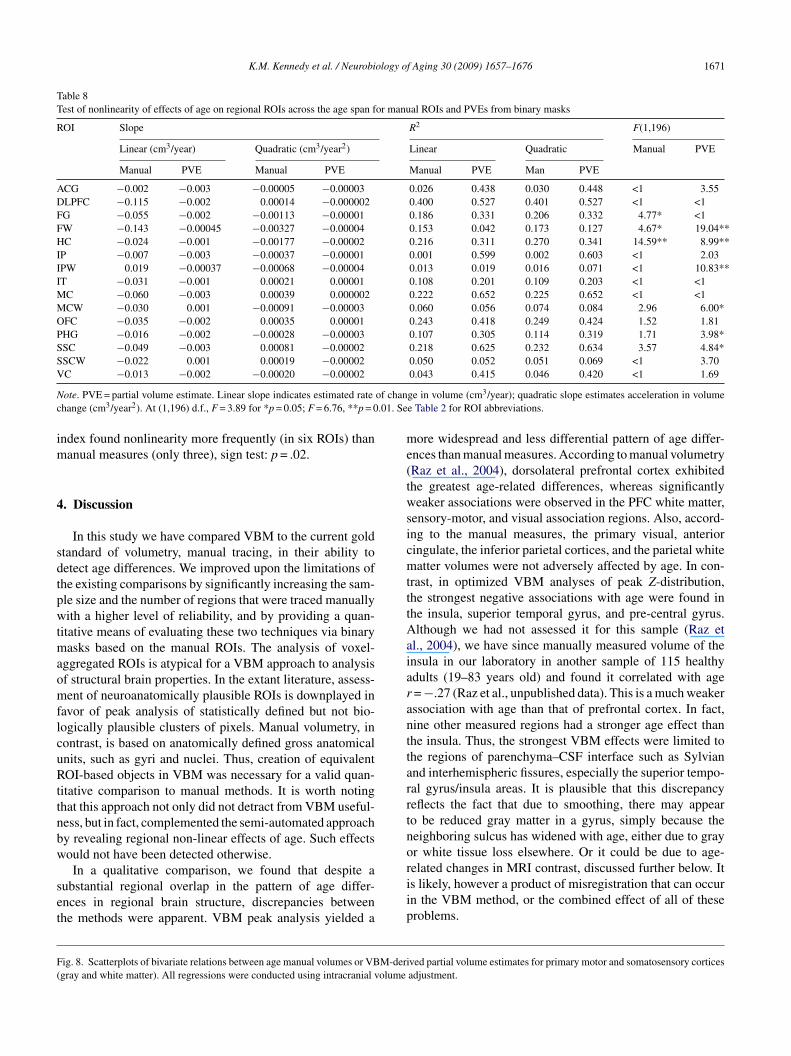
ACG −0.002 −0.003 −0.00005 −0.00003 0.026 0.438 0.030 0.448 <1 3.55DLPFC −0.115 −0.002 0.00014 −0.000002 0.400 0.527 0.401 0.527 <1 <1FG −0.055 −0.002 −0.00113 −0.00001 0.186 0.331 0.206 0.332 4.77* <1FW −0.143 −0.00045 −0.00327 −0.00004 0.153 0.042 0.173 0.127 4.67* 19.04**HC −0.024 −0.001 −0.00177 −0.00002 0.216 0.311 0.270 0.341 14.59** 8.99**IP −0.007 −0.003 −0.00037 −0.00001 0.001 0.599 0.002 0.603 <1 2.03IPW 0.019 −0.00037 −0.00068 −0.00004 0.013 0.019 0.016 0.071 <1 10.83**IT −0.031 −0.001 0.00021 0.00001 0.108 0.201 0.109 0.203 <1 <1MC −0.060 −0.003 0.00039 0.000002 0.222 0.652 0.225 0.652 <1 <1MCW −0.030 0.001 −0.00091 −0.00003 0.060 0.056 0.074 0.084 2.96 6.00*OFC −0.035 −0.002 0.00035 0.00001 0.243 0.418 0.249 0.424 1.52 1.81PHG −0.016 −0.002 −0.00028 −0.00003 0.107 0.305 0.114 0.319 1.71 3.98*SSC −0.049 −0.003 0.00081 −0.00002 0.218 0.625 0.232 0.634 3.57 4.84*SSCW −0.022 0.001 0.00019 −0.00002 0.050 0.052 0.051 0.069 <1 3.70V
N of chanc .01. Se
im
4
sdtpwtmaomflcuRttnbw
set
me(twsicmtttAaiaranttarrtno
F(
C −0.013 −0.002 −0.00020 −0.00002
ote. PVE = partial volume estimate. Linear slope indicates estimated ratehange (cm3/year2). At (1,196) d.f., F = 3.89 for *p = 0.05; F = 6.76, **p = 0
ndex found nonlinearity more frequently (in six ROIs) thananual measures (only three), sign test: p = .02.
. Discussion
In this study we have compared VBM to the current goldtandard of volumetry, manual tracing, in their ability toetect age differences. We improved upon the limitations ofhe existing comparisons by significantly increasing the sam-le size and the number of regions that were traced manuallyith a higher level of reliability, and by providing a quan-
itative means of evaluating these two techniques via binaryasks based on the manual ROIs. The analysis of voxel-
ggregated ROIs is atypical for a VBM approach to analysisf structural brain properties. In the extant literature, assess-ent of neuroanatomically plausible ROIs is downplayed in
avor of peak analysis of statistically defined but not bio-ogically plausible clusters of pixels. Manual volumetry, inontrast, is based on anatomically defined gross anatomicalnits, such as gyri and nuclei. Thus, creation of equivalentOI-based objects in VBM was necessary for a valid quan-
itative comparison to manual methods. It is worth notinghat this approach not only did not detract from VBM useful-ess, but in fact, complemented the semi-automated approachy revealing regional non-linear effects of age. Such effectsould not have been detected otherwise.
In a qualitative comparison, we found that despite aubstantial regional overlap in the pattern of age differ-nces in regional brain structure, discrepancies betweenhe methods were apparent. VBM peak analysis yielded a
riip
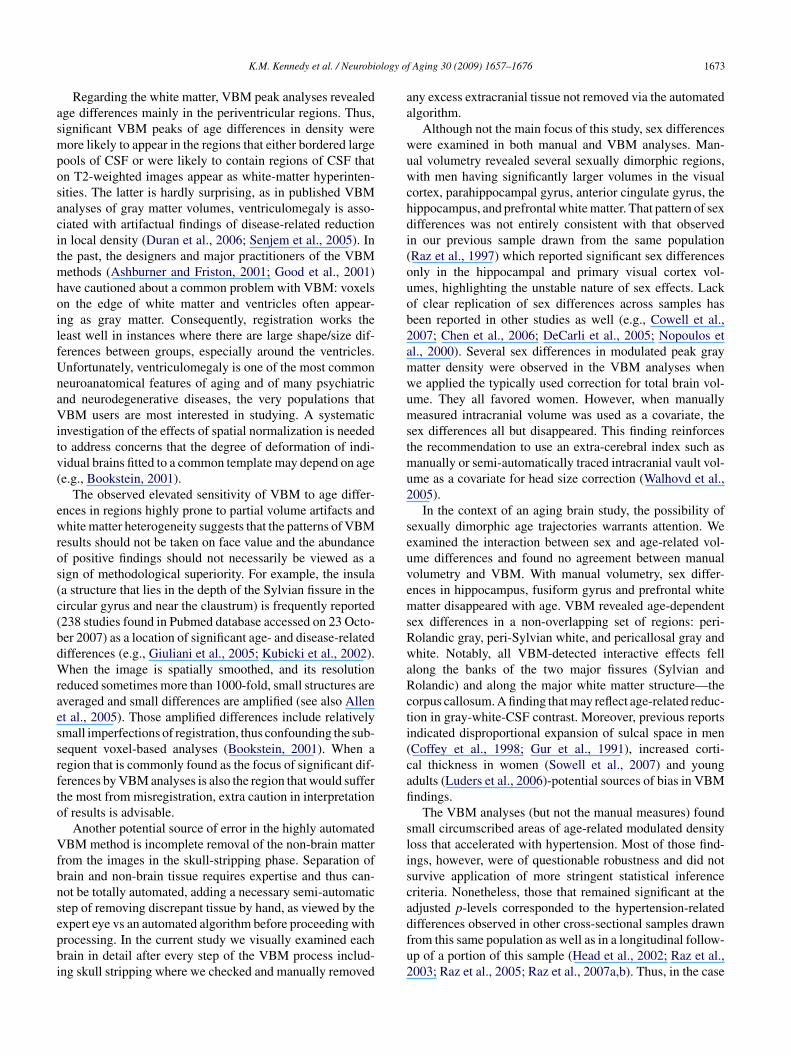
ig. 8. Scatterplots of bivariate relations between age manual volumes or VBM-derigray and white matter). All regressions were conducted using intracranial volume
0.043 0.415 0.046 0.420 <1 1.69
ge in volume (cm3/year); quadratic slope estimates acceleration in volumee Table 2 for ROI abbreviations.
ore widespread and less differential pattern of age differ-nces than manual measures. According to manual volumetryRaz et al., 2004), dorsolateral prefrontal cortex exhibitedhe greatest age-related differences, whereas significantlyeaker associations were observed in the PFC white matter,
ensory-motor, and visual association regions. Also, accord-ng to the manual measures, the primary visual, anterioringulate, the inferior parietal cortices, and the parietal whiteatter volumes were not adversely affected by age. In con-
rast, in optimized VBM analyses of peak Z-distribution,he strongest negative associations with age were found inhe insula, superior temporal gyrus, and pre-central gyrus.lthough we had not assessed it for this sample (Raz et
l., 2004), we have since manually measured volume of thensula in our laboratory in another sample of 115 healthydults (19–83 years old) and found it correlated with age= −.27 (Raz et al., unpublished data). This is a much weakerssociation with age than that of prefrontal cortex. In fact,ine other measured regions had a stronger age effect thanhe insula. Thus, the strongest VBM effects were limited tohe regions of parenchyma–CSF interface such as Sylviannd interhemispheric fissures, especially the superior tempo-al gyrus/insula areas. It is plausible that this discrepancyeflects the fact that due to smoothing, there may appearo be reduced gray matter in a gyrus, simply because theeighboring sulcus has widened with age, either due to grayr white tissue loss elsewhere. Or it could be due to age-
elated changes in MRI contrast, discussed further below. Its likely, however a product of misregistration that can occurn the VBM method, or the combined effect of all of theseroblems.ved partial volume estimates for primary motor and somatosensory corticesadjustment.

1672 K.M. Kennedy et al. / Neurobiology of Aging 30 (2009) 1657–1676
Fig. 9. Scatterplots of bivariate relations between age manual volumes or VBM-derived partial volume estimates for prefrontal cortex white matter, inferiorparietal lobule (gray and white matter), primary visual (calcarine) cortex. All regressions were conducted using intracranial volume adjustment.
ology o
asmposacitmhoilfUnaVitv(
ewros(c(bdWraessrfto
Vfbnsepbi
aa
wuwchdi(ouob2amwumstmu2
seuvemsRwaRcti(cafi
slisca
K.M. Kennedy et al. / Neurobi
Regarding the white matter, VBM peak analyses revealedge differences mainly in the periventricular regions. Thus,ignificant VBM peaks of age differences in density wereore likely to appear in the regions that either bordered large
ools of CSF or were likely to contain regions of CSF thatn T2-weighted images appear as white-matter hyperinten-ities. The latter is hardly surprising, as in published VBMnalyses of gray matter volumes, ventriculomegaly is asso-iated with artifactual findings of disease-related reductionn local density (Duran et al., 2006; Senjem et al., 2005). Inhe past, the designers and major practitioners of the VBM
ethods (Ashburner and Friston, 2001; Good et al., 2001)ave cautioned about a common problem with VBM: voxelsn the edge of white matter and ventricles often appear-ng as gray matter. Consequently, registration works theeast well in instances where there are large shape/size dif-erences between groups, especially around the ventricles.nfortunately, ventriculomegaly is one of the most commoneuroanatomical features of aging and of many psychiatricnd neurodegenerative diseases, the very populations thatBM users are most interested in studying. A systematic
nvestigation of the effects of spatial normalization is neededo address concerns that the degree of deformation of indi-idual brains fitted to a common template may depend on agee.g., Bookstein, 2001).
The observed elevated sensitivity of VBM to age differ-nces in regions highly prone to partial volume artifacts andhite matter heterogeneity suggests that the patterns of VBM
esults should not be taken on face value and the abundancef positive findings should not necessarily be viewed as aign of methodological superiority. For example, the insulaa structure that lies in the depth of the Sylvian fissure in theircular gyrus and near the claustrum) is frequently reported238 studies found in Pubmed database accessed on 23 Octo-er 2007) as a location of significant age- and disease-relatedifferences (e.g., Giuliani et al., 2005; Kubicki et al., 2002).hen the image is spatially smoothed, and its resolution
educed sometimes more than 1000-fold, small structures areveraged and small differences are amplified (see also Allent al., 2005). Those amplified differences include relativelymall imperfections of registration, thus confounding the sub-equent voxel-based analyses (Bookstein, 2001). When aegion that is commonly found as the focus of significant dif-erences by VBM analyses is also the region that would sufferhe most from misregistration, extra caution in interpretationf results is advisable.
Another potential source of error in the highly automatedBM method is incomplete removal of the non-brain matter
rom the images in the skull-stripping phase. Separation ofrain and non-brain tissue requires expertise and thus can-ot be totally automated, adding a necessary semi-automatictep of removing discrepant tissue by hand, as viewed by the
xpert eye vs an automated algorithm before proceeding withrocessing. In the current study we visually examined eachrain in detail after every step of the VBM process includ-ng skull stripping where we checked and manually removeddfu2
f Aging 30 (2009) 1657–1676 1673
ny excess extracranial tissue not removed via the automatedlgorithm.
Although not the main focus of this study, sex differencesere examined in both manual and VBM analyses. Man-al volumetry revealed several sexually dimorphic regions,ith men having significantly larger volumes in the visual
ortex, parahippocampal gyrus, anterior cingulate gyrus, theippocampus, and prefrontal white matter. That pattern of sexifferences was not entirely consistent with that observedn our previous sample drawn from the same populationRaz et al., 1997) which reported significant sex differencesnly in the hippocampal and primary visual cortex vol-mes, highlighting the unstable nature of sex effects. Lackf clear replication of sex differences across samples haseen reported in other studies as well (e.g., Cowell et al.,007; Chen et al., 2006; DeCarli et al., 2005; Nopoulos etl., 2000). Several sex differences in modulated peak grayatter density were observed in the VBM analyses whene applied the typically used correction for total brain vol-me. They all favored women. However, when manuallyeasured intracranial volume was used as a covariate, the
ex differences all but disappeared. This finding reinforceshe recommendation to use an extra-cerebral index such as
anually or semi-automatically traced intracranial vault vol-me as a covariate for head size correction (Walhovd et al.,005).
In the context of an aging brain study, the possibility ofexually dimorphic age trajectories warrants attention. Wexamined the interaction between sex and age-related vol-me differences and found no agreement between manualolumetry and VBM. With manual volumetry, sex differ-nces in hippocampus, fusiform gyrus and prefrontal whiteatter disappeared with age. VBM revealed age-dependent
ex differences in a non-overlapping set of regions: peri-olandic gray, peri-Sylvian white, and pericallosal gray andhite. Notably, all VBM-detected interactive effects fell
long the banks of the two major fissures (Sylvian andolandic) and along the major white matter structure—theorpus callosum. A finding that may reflect age-related reduc-ion in gray-white-CSF contrast. Moreover, previous reportsndicated disproportional expansion of sulcal space in menCoffey et al., 1998; Gur et al., 1991), increased corti-al thickness in women (Sowell et al., 2007) and youngdults (Luders et al., 2006)-potential sources of bias in VBMndings.
The VBM analyses (but not the manual measures) foundmall circumscribed areas of age-related modulated densityoss that accelerated with hypertension. Most of those find-ngs, however, were of questionable robustness and did noturvive application of more stringent statistical inferenceriteria. Nonetheless, those that remained significant at thedjusted p-levels corresponded to the hypertension-related
ifferences observed in other cross-sectional samples drawnrom this same population as well as in a longitudinal follow-p of a portion of this sample (Head et al., 2002; Raz et al.,003; Raz et al., 2005; Raz et al., 2007a,b). Thus, in the case
1 ology o
ot
rnvmdibtPPsavp
aaldcgniawaRbvVroapa
ittacigiocbatag“s
apbt
5
bfsvgsbeiw(tBitvactTtdiia
osrissm(mrmaea
ences in brain structure, VBM as it is utilized now shouldbe used judicially as a hypothesis-generating device. The
674 K.M. Kennedy et al. / Neurobi
f hypertension, VBM was more likely to detect what appearso be a replicable difference in regional brain structure.
When analyses of statistically derived isolated peaks wereeplaced by biologically more plausible analyses of homoge-ous anatomically defined regions via aggregation of PVEalues (in masks), the patterns of findings obtained by eitherethod became more similar. However, VBM failed to
etect age differences in white matter regions, showing slightncreases in modulated density for some of them, which maye due to errors in segmentation and/or registration. Notably,he magnitude of age differences detected by the regionalVE approach was greater in the regions of elevated pixelVE variability. Thus, in future applications of VBM to thetudy of individual and age-related differences, it may bedvisable to pay at least as much attention to within-regionariability as to between-region differences in parenchymalroperties.
The shapes of estimated trajectories of regional brainging differed between the methods. In some regions, suchs the hippocampus and the prefrontal white matter, non-inearity (age-related acceleration of estimated declines) wasetected by both methods. In other regions, inter-method dis-repancies were observed. Except for one region (fusiformyrus), VBM analyses were significantly more likely to detectonlinearity than did the manual measures. In this study, its impossible to declare which of these effects are “true”nd which are spurious. We infer, however, that the observedhite matter nonlinearities reflect the reality of brain aging
s they are in accord with multiple converging findings (seeaz and Rodrigue, 2006 for a review). Thus, VBM maye more sensitive to nonlinear trends in the white matterolumes. However, nonlinearities in at least some of theBM gray matter regions may be artifactual. They may
eflect disproportionately significant distortion in the regionsf high individual variability and high proneness to MRIrtifacts, such as increased flow in the vicinity of the parahip-ocampal gyrus, or as a result of smoothing in these smallreas.
Dependence on high image quality and homogeneitys an inherent limitation of the VBM methods. In VBM,issue classification is based on calculated voxel intensi-ies, which changes as a decelerating quadratic function ofge (Cho et al., 1997). The result of these T1-weightedhanges is age-related alterations of image contrast. Thus,n the brains of older participants, age-related reduction ofray matter T1 may result in gray matter pixels appear-ng more similar to the white ones than on the imagesf younger brains. In addition, flow and motion artifactsreate contrast situations that are problematic for intensity-ased approaches and can be resolved only by imposingnatomical constraints. The human eye is likely betterhan an algorithm in taking these contrast differences into
ccount, and correctly assessing the likelihood of the white-ray distinction. Trained human operators guided by thetop-down” influence of their knowledge of anatomy haveeveral advantages over digital algorithmic approaches. Them
i
f Aging 30 (2009) 1657–1676
ttempts to incorporate “training-like” information in com-uter decision making (e.g., Fischl et al., 2002) seem to worketter for simple rather than anatomically complex struc-ures.
. Conclusions
The results of this study reveal significant discrepancyetween manual volumetry and VBM analysis of age dif-erences when the latter is confined to identification oftatistically significant peak Z-values (i.e., the current con-entional use). However, when compared on a commonround (i.e. with regards to anatomically definable regions),emi-automated and manual methods of evaluating regionalrain structure yield similar pattern of results, some notablexceptions notwithstanding. The discrepancies tend to occurn the regions of increased inter-voxel variability. However,hen highly circumscribed isolated differences in density
the peaks) are taken as indicators of structural integrity,he correspondence between the two approaches is low.ecause isolated clusters of voxels have no clear biolog-
cal meaning and because VBM algorithms are sensitiveo localized artifactual differences in intensity, voxel-by-oxel analyses of the whole brain can be interpreted onlys an exploratory hypotheses-generating preamble to aareful analysis of potential artifacts and examination ofhe structural properties in anatomically definable regions.here is a danger of amassing VBM studies to collec-
ively reify potentially spurious findings. For example, whenifferent VBM studies produce the same results (i.e., thensula), this might be more likely to be taken as “val-dation” of a finding rather than as perpetuation of anrtifact.1
Variability within given regions may be informativef age-related processes compromising brain integrity andhould be examined with no lesser attention than the between-egion mean differences. A similar point was recently maden regards to interpretation of fMRI experiments on purelytatistical grounds: there is no evidence that “red” pixels aretatistically different from “orange” pixels nearby, yet the for-er are accepted as more meaningful findings than the latter
Jernigan et al., 2003). Unfortunately, that important argu-ent somehow did not exert due influence on the current
esearch practices in the field of neuroimaging. Lastly, VBMethods may be better suited for detection of nonlinearities in
ge trends but this matter needs careful investigation consid-ring a possibility that nonlinearities may reflect registrationrtifacts.
In sum, for an optimal evaluation of age-related differ-
aps of group or individual differences generated by VBM
1 We are grateful to an anonymous reviewer for pointing out this importantmplication.

ology o
saia
C
A
0pFhs
R
A
A
A
A
B
B
C
C
C
C
C
C
C
C
D
D
D
D
D
E
E
E
F
G
G
G
G
G
G
K.M. Kennedy et al. / Neurobi
hould be used in conjunction with regional volumetry aimedt testing specific hypotheses about plausible neuroanatom-cal units. In this way, each technique will accentuate thedvantages and ameliorate the limitations of the other.
onflicts of interest
None.
cknowledgments
This study was supported in part by grants NIH R37 AG-11230 and NIH R37 AG-025667. Portions of this paper wereresented at the 12th Human Brain Mapping conference inlorence, Italy in June 2006. All appropriate university andospital guidelines were followed in the treatment of humanubjects.
eferences
llen, J.S., Bruss, J., Brown, C.K., Damasio, H., 2005. Methods for study-ing the aging brain: volumetric analyses versus VBM (Commentary).Neurobiol. Aging 26, 1275–1278.
shburner, J.A., Friston, K.J., 2000. Voxel-based morphometry—the meth-ods. Neuroimage 11, 805–821.
shburner, J.A., Friston, K.J., 2001. Why voxel-based morphometry shouldbe used. Neuroimage 14, 1238–1241.
ydin, K., Ucar, A., Oguz, K.K., Okur, O.O., Agayev, A., Unal, Z., Yilmaz,S., Ozturk, C., October 5, 2007. Increased gray matter density in theparietal cortex of mathematicians: a voxel-based morphometry study.Am. J. Neuroradiol. (Epub ahead of print).
lessed, G., Tomlinson, B.E., Roth, M., 1968. The association between quan-titative measures of dementia and senile change in the cerebral graymatter of elderly subjects. Br. J. Psychiatry 114, 797–811.
ookstein, F.L., 2001. Voxel-based morphometry should not be used withimperfectly registered images. Neuroimage 14, 1454–1462.
ardenas, V.A., Du, A.T., Hardin, D., Ezekiel, F., Weber, P., Jagust, W.F.,Chui, H.C., Schuff, N., Weiner, M.W., 2003. Comparison of methodsfor measuring longitudinal brain change in cognitive impairment anddementia. Neurobiol. Aging 24, 537–544.
hen, X., Wen, W., Anstey, K.J., Sachdev, P.S., 2006. Effects of cerebrovas-cular risk factors on gray matter volume in adults aged 60–64 years: avoxel-based morphometric study. Psychiatry Res. 147, 105–114.
ho, S., Jones, D., Reddick, W.E., Ogg, R.J., Steen, R.G., 1997. Establishingnorms for age-related changes in proton T1 of human brain tissue in vivo.Magn. Reson. Imaging 15, 1133–1143.
offey, C.E., Lucke, J.F., Saxton, J.A., Ratcliff, G., Unitas, L.J., Billig,B., Bryan, R.N., 1998. Sex differences in brain aging: a quantitativemagnetic resonance imaging study. Arch. Neurol. 55, 169–179.
olcombe, S.J., Erickson, K.I., Raz, N., Webb, A.G., Cohen, N.J., McAuley,E., Kramer, A.F., 2003. Aerobic fitness reduces brain tissue loss in aginghumans. J. Gerontol. Biol. Sci. Med. Sci. 58, 176–180.
olcombe, S.J., Kramer, A.F., Erickson, K.I., Scalf, P., 2005. The impli-cations of cortical recruitment and brain morphology for individualdifferences in inhibitory function in aging humans. Psychol. Aging 20,
363–375.owell, P.E., Sluming, V.A., Wilkinson, I.D., Cezayirli, E., Romanowski,C.A., Webb, J.A., Keller, S.S., Mayes, A., Roberts, N., 2007. Effects ofsex and age on regional prefrontal brain volume in two human cohorts.Eur. J. Neurosci. 25, 307–318.
H
f Aging 30 (2009) 1657–1676 1675
rum, W.R., Griffin, L.D., Hill, D.L.G., Hawkes, D.J., 2003. Zen and the artof medical image registration: correspondence, homology, and quality.Neuroimage 20, 1425–1437.
avatzikos, C., 2004. Why voxel-based morphometric analysis should beused with great caution when characterizing group differences. Neu-roimage 23, 17–20.
eCarli, C., Massaro, J., Harvey, D., Hald, J., Tullberg, M., Au, R., Beiser,A., D’Agostino, R., Wolf, P.A., 2005. Measures of brain morphology andinfarction in the framingham heart study: establishing what is normal.Neurobiol. Aging 26, 491–510.
orion, A.A., Salomon, O., Zanca, M., Duyme, M., Capron, C., 2001. Mag-netic resonance imaging and cerebral volumic evaluation: comparisonof four post-processing techniques. Comput. Biol. Med. 31, 215–227.
ouaud, G., Gaura, V., Ribeiro, M.J., Lethimonnier, F., Maroy, R., Verny, C.,Krystkowiak, P., Damier, P., Bachoud-Levi, A.-C., Hantraye, P., Remy,P., 2006. Distribution of gray matter in Huntington’s disease patients: acombined ROI-based and voxel-based morphometric study. Neuroimage32, 1562–1575.
uran, F.S.L., Valente, A.A., Miguel, E.C., Castro, C.C., Busatto, G.F., June,2006. Risk of artifacts due to enlarged ventricles using voxel-based mor-phometry studies. Poster presented at Organization for Human BrainMapping conference, Florence, IT. Neuroimage (Suppl.), 31.
ckert, M.A., Tenforde, A., Galaburda, A.M., Bellugi, U., Korenberg, J.R.,Mills, D., Reiss, A.L., 2006. To modulate or not to modulate: differingresults in uniquely shaped Williams syndrome brains. Neuroimage 32,1001–1007.
rickson, K.I., Colcombe, S.J., Raz, N., Korol, D.L., Scalf, P., Webb, A.,Cohen, N.J., McAuley, E., Kramer, A.F., 2005. Selective sparing ofbrain tissue in postmenopausal women receiving hormone replacementtherapy. Neurobiol. Aging 26, 1205–1213.
rickson, K.I., Colcombe, S.J., Elavsky, S., McAuley, E., Korol, D.L., Scalf,P.E., Kramer, A.F., 2007. Interactive effects of fitness and hormone treat-ment on brain health in postmenopausal women. Neurobiol. Aging 28,179–185.
ischl, B., Salat, D.H., Busa, E., Albert, M., Dieterich, M., Haselgrove, C.,van der Kouwe, A., Killiany, R., Kennedy, D., Klaveness, S., Montillo,A., Makris, N., Rosen, B., Dale, A.M., 2002. Whole brain segmentation:automated labeling of neuroanatomical structures in the human brain.Neuron 33, 41–55.
iuliani, N.R., Calhoun, V.D., Pearlson, G.D., Francis, A., Buchanan, R.W.,2005. Voxel-based morphometry versus region of interest: a comparisonof two methods for analyzing gray matter differences in schizophrenia.Schizophr. Res. 74, 135–147.
ong, Q.-Y., Sluming, V., Mayes, A., Keller, S., Barrick, T., Cezayirli, E.,Roberts, N., 2005. Voxel-based morphometry and stereology provideconvergent evidence of the importance of medial prefrontal cortex forfluid intelligence in healthy adults. Neuroimage 25, 1175–1186.
ood, C.D., Johnsrude, I.S., Ashburner, J., Henson, R.N., Friston, K.J.,Frackowiak, R.S.J., 2001a. Cerebral asymmetry and the effects of sexand handedness on brain structure: a voxel-based morphometric analysisof 465 normal adult human brains. Neuroimage 14, 685–700.
ood, C.D., Johnsrude, I.S., Ashburner, J., Henson, R.N., Friston, K.J.,Frackowiak, R.S.J., 2001b. A voxel-based morphometric study of ageingin 465 normal adult human brains. Neuroimage 14, 21–36.
ood, C.D., Scahill, R.I., Fox, N.C., Ashburner, J., Friston, K.J., Chan,D., Crum, W.R., Rossor, M.N., Frackowiak, R.S.J., 2002. Automaticdifferentiation of anatomical patterns in the human brain: Validationwith studies of degenerative dementias. Neuroimage 17, 29–46.
ur, R.C., Mozley, P.D., Resnick, S.M., Gottlieb, G.L., Kohn, M., Zimmer-man, R., Herman, G., Atlas, S., Grossman, R., Berretta, D., Erwin, R.,Gur, R.E., 1991. Gender differences in age effect on brain atrophy mea-sured by magnetic resonance imaging. Proc. Natl. Acad. Sci. U.S.A. 88,
2845–2849.ead, D., Raz, N., Gunning-Dixon, F., Williamson, A., Acker, J.D., 2002.Age-related differences in the course of cognitive skill acquisition: therole of regional cortical shrinkage and cognitive resources. Psychol.Aging 17, 72–84.

1 ology o
J
J
K
L
M
M
N
O
R
R
R
R
R
R
R
R
R
R
S
S
S
S
S
S
T
T
T
W
676 K.M. Kennedy et al. / Neurobi
enkinson, M., Bannister, P., Brady, M., Smith, S., 2002. Improved optimiza-tion for the robust and accurate linear registration and motion correctionof brain images. Neuroimage 17, 825–841.
ernigan, T.L., Gamst, A.C., Fennema-Notestine, C., Ostergaard, A.L., 2003.More “mapping” in brain mapping: statistical comparison of effects.Hum. Brain Mapp. 19, 90–95.
ubicki, M., Shenton, M.E., Salisbury, D.F., Hirayasu, Y., Kasai, K., Kiki-nis, R., Jolesz, F.A., McCarley, R.W., 2002. Voxel-based morphometricanalysis of gray matter in first episode schizophrenia. Neuroimage 17,1711–1719.
uders, E., Narr, K.L., Thompson, P.M., Rex, D.E., Woods, R.P., Deluca,H., Jancke, L., Toga, A.W., 2006. Gender effects on cortical thicknessand the influence of scaling. Hum. Brain Mapp. 27, 314–324.
ay, A., Ashburner, J., Buchel, C., McGonigle, D.J., Friston, K.J., Frack-owiak, R.S., Goadsby, P.J., 1999. Correlation between structural andfunctional changes in brain in an idiopathic headache syndrome. Nat.Med. 57, 836–838.
echelli, A., Price, C.J., Friston, K.J., Ashburner, J., 2005. Voxel-basedmorphometry of the human brain: methods and applications. Curr. Med.Imaging Rev. 11, 1–9.
opoulos, P., Flaum, M., O’Leary, D., Andreasen, N.C., 2000. Sexualdimorphism in the human brain: evaluation of tissue volume, tissuecomposition and surface anatomy using magnetic resonance imaging.Psychiatry Res. 98, 1–13.
ldfield, R.C., 1971. The assessment and analysis of handedness. Neuropsy-chologia 9, 97–113.
adloff, L.S., 1977. The CES-D scale: a self-report depression scale forresearch in the general population. Appl. Psych. Meas. 1, 385–401.
az, N., 2000. Aging of the brain and its impact on cognitive performance:Integration of structural and functional findings. In: Craik, F.I.M., Salt-house, T.A. (Eds.), Handbook of Aging and Cognition-II. Erlbaum,Mahwah, NJ, pp. 1–90.
az, N., Rodrigue, K.M., 2006. Differential aging of the brain: pat-terns, cognitive correlates and modifiers. Neurosci. Biobehav. Rev. 30,730–748.
az, N., Gunning, F.M., Head, D., Dupuis, J.H., McQuain, J.D., Briggs,S.D., Loken, W.J., Thornton, A.E., Acker, J.D., 1997. Selective aging ofthe human cerebral cortex observed in vivo: differential vulnerability ofthe prefrontal gray matter. Cereb. Cortex 7, 268–282.
az, N., Rodrigue, K., Acker, J., 2003. Hypertension and the brain: vulnera-bility of the prefrontal regions and executive functions. Behav. Neurosci.17, 1169–1180.
az, N., Gunning-Dixon, F., Head, D., Rodrigue, K.M., Williamson, A.,Acker, J.D., 2004. Aging, sexual dimorphism, and hemispheric asymme-try of the cerebral cortex: replicability of regional differences in volume.
Neurobiol. Aging 25, 377–396.az, N., Lindenberger, U., Rodrigue, K.M., Kennedy, K.M., Head, D.,Williamson, A., Dahle, C., Gerstorf, D., Acker, J.D., 2005. Regionalbrain changes in aging healthy adults: General trends, individual differ-ences, and modifiers. Cereb Cortex 15, 1676–1689.
Z
f Aging 30 (2009) 1657–1676
az, N., Rodrigue, K.M., Kennedy, K.M., Acker, J.D., 2007a. Vascular healthand longitudinal changes in brain and cognition in middle-aged and olderadults. Neuropsychology 21, 149–157.
az, N., Lindenberger, U., Ghisletta, P., Rodrigue, K.M., Kennedy, K.M.,Acker, J.D., 2007b. Neuroanatomical correlates of fluid intelligence inhealthy adults and persons with vascular risk factors. Cereb. Cortex.doi:10.1093/cercor/bhm108.
eiss, A., Hennessey, J., Rubin, M., Beach, L., Subramaniam, B., 1995.BrainImage, v. 2.3.3. Behavioral Neurogenetics and NeuroimagingResearch Center. Division of the Kennedy Krieger Institute, Baltimore,MD.
enjem, M.L., Gunter, J.L., Shiung, M.M., Petersen, R.C., Jack, C.R., 2005.Comparison of different methodological implementations of voxel-based morphometry in neurodegenerative disease. Neuroimage 26,600–608.
hrout, P.E., Fleiss, J.L., 1979. Intraclass correlations: uses in assessingraters reliability. Psychol. Bull. 86, 420–428.
mith, S., 2002. Fast robust automated brain extraction. Hum. Brain Mapp.17, 143–155.
mith, S.M., Jenkinson, M., Woolrich, M.W., Beckmann, C.F., Behrens,T.E.J., Johansen-Berg, H., Bannister, P.R., De Luca, M., Drobnjak, I.,Flitney, D.E., Niazy, R., Saunders, J., Vickers, J., Zhang, Y., De Ste-fano, N., Brady, J.M., Matthews, P.M., 2004. Advances in functional andstructural MR image analysis and implementation as FSL. Neuroimage23 (S1), 208–219.
owell, E.R., Peterson, B.S., Kan, E., Woods, R.P., Yoshii, J., Bansal, R.,Xu, D., Zhu, H., Thompson, P.M., Toga, A.W., 2007. Sex differences incortical thickness mapped in 176 healthy individuals between 7 and 87years of age. Cereb. Cortex 17, 1550–1560.
teiger, J.H., 1980. Tests for comparing elements of a correlation matrix.Psychol. Bull. 87, 245–251.
app, P.D., Head, K., Head, E., Milgram, N.W., Muggenburg, B.A., Su,M.-Y., 2006. Application of an automated voxel-based morphometrytechnique to assess regional gray and white matter brain atrophy in acanine model of aging. Neuroimage 29, 234–244.
esta, C., Laakso, M.P., Sabattoli, F., Rossi, R., Beltramello, A., Soininen,H., Frisoni, G.B., 2004. A comparison between the accuracy of voxel-based morphometry and hippocampal volumetry in Alzheimer’s disease.JMRI 19, 274–282.
isserand, D.J., Pruessner, J.C., Arigita, E.J.S., van Boxtel, M.J., Evans,A.C., Jolles, J., Uylings, H.B.M., 2002. Regional frontal cortical vol-umes decrease differentially in aging: an MRI study to comparevolumetric approaches and voxel-based morphometry. Neuroimage 17,657–669.
alhovd, K.B., Fjell, A.M., Reinvang, I., Lundervold, A., Dale, A., Quinn,
B.T., Salat, D., Makris, N., Fischl, B., 2005. Neuroanatomical aging:universal but not uniform. Neurobiol. Aging 26, 1279–1282.hang, Y., Brady, M., Smith, S., 2001. Segmentation of brain MR imagesthrough a hidden Markov random field model and the expectation max-imization algorithm. IEEE Trans. Med. Imaging 20, 45–57.
Copyright © 2022 FDOKUMEN