Role of CT Volumetry In Evaluation of Gastric Plication
20
Kernel for Word to PDF Demo Kernel for Word to PDF Demo Kernel for Word to PDF Demo Kernel for Word to PDF Demo Kernel for Word to PDF Demo Kernel for Word to PDF Demo Kernel for Word to PDF Demo Kernel for Word to PDF Demo Kernel for Word to PDF Demo Kernel for Word to PDF Demo Kernel for Word to PDF Demo Kernel for Word to PDF Demo Kernel for Word to PDF Demo Kernel for Word to PDF Demo Kernel for Word to PDF Demo Kernel for Word to PDF Demo Kernel for Word to PDF Demo Kernel for Word to PDF Demo Role of CT Volumetry In Evaluation of Gastric Plication M. Hassan*MD and A.Bravo**MD *General Surgery Department, Kasr El Aini, Cairo University. ** General Surgery Department, Badr Hospital, Helwan University. ABSTRACT Laparoscopic greater curve plication (LGCP) is a relatively new bariatric restrictive procedure. To our knowledge this is the first study which used Computed tomography (CT) volumetry, for quantitative as well as qualitative assessment of LGCP. CT volumetry, was used to assess the gastric pouch volume 1, 6, and 12 months following LGCP, We compared the gastric pouch volume for 30 cases performed at Cairo University, Egypt and observed the relation of the volume changes to the patients' weight loss. Keywords Gastric plication, pleat, imbrication, Laparoscopic greater curve plication, GCP, LGCP, Computed tomography (CT) volumetry, pouch volume, virtual Gastroscopy, anatomical abnormalities, quantitative and qualitative assessment of LGCP INTRODUCTION LGP is an emerging procedure that requires additional studies to assess long-term efficacy. Initial studies suggest that LGP may provide effective surgical weight loss with a potentially lower risk profile than other bariatric procedures (1). CT volumetry has proven its efficacy in evaluation of the volume of other organs, such as the liver, but has not been widely used in assessing the stomach. More research is needed in order to prove its accuracy with this particular organ, which, if done, should provide a true evolution in the prediction of the outcome of the restrictive bariatric procedures (2) PATIENTS AND METHODS The present study included 30 randomly selected morbidly obese patients who underwent LGCP in kasr el Aini hospital, Cairo University after the approval of the ethical committee between May 2010 & October 2012. The patients' ages ranged from 18 to 48 years old with a mean of 32.7 years. Out of 30 patients 21 were females and 9 were males. Preoperative BMI ranged from 40 to 62 kg/m2 with a mean BMI of 50.6 kg/m2. Patients were informed about the nature of the research, and each patient understood and agreed to the procedure. Kernel for Word to PDF Demo Kernel for Word to PDF Demo Kernel for Word to PDF Demo Kernel for Word to PDF Demo Kernel for Word to PDF Demo Kernel for Word to PDF Demo Kernel for Word to PDF Demo Kernel for Word to PDF Demo Kernel for Word to PDF Demo
Transcript of Role of CT Volumetry In Evaluation of Gastric Plication
Kernel for Word to PDF Demo
Kernel for Word to PDF Demo
Kernel for Word to PDF Demo
Kernel for Word to PDF Demo
Kernel for Word to PDF Demo
Kernel for Word to PDF Demo
Kernel for Word to PDF Demo
Kernel for Word to PDF Demo
Kernel for Word to PDF Demo
Kernel for Word to PDF Demo
Kernel for Word to PDF Demo
Kernel for Word to PDF Demo
Kernel for Word to PDF Demo
Kernel for Word to PDF Demo
Kernel for Word to PDF Demo
Kernel for Word to PDF Demo
Kernel for Word to PDF Demo
Kernel for Word to PDF Demo
Kernel for Word to PDF DemoRole of CT Volumetry In Evaluation of Gastric Plication
M. Hassan*MD and A.Bravo**MD
*General Surgery Department, Kasr El Aini, Cairo University.
** General Surgery Department, Badr Hospital, Helwan University.
ABSTRACT
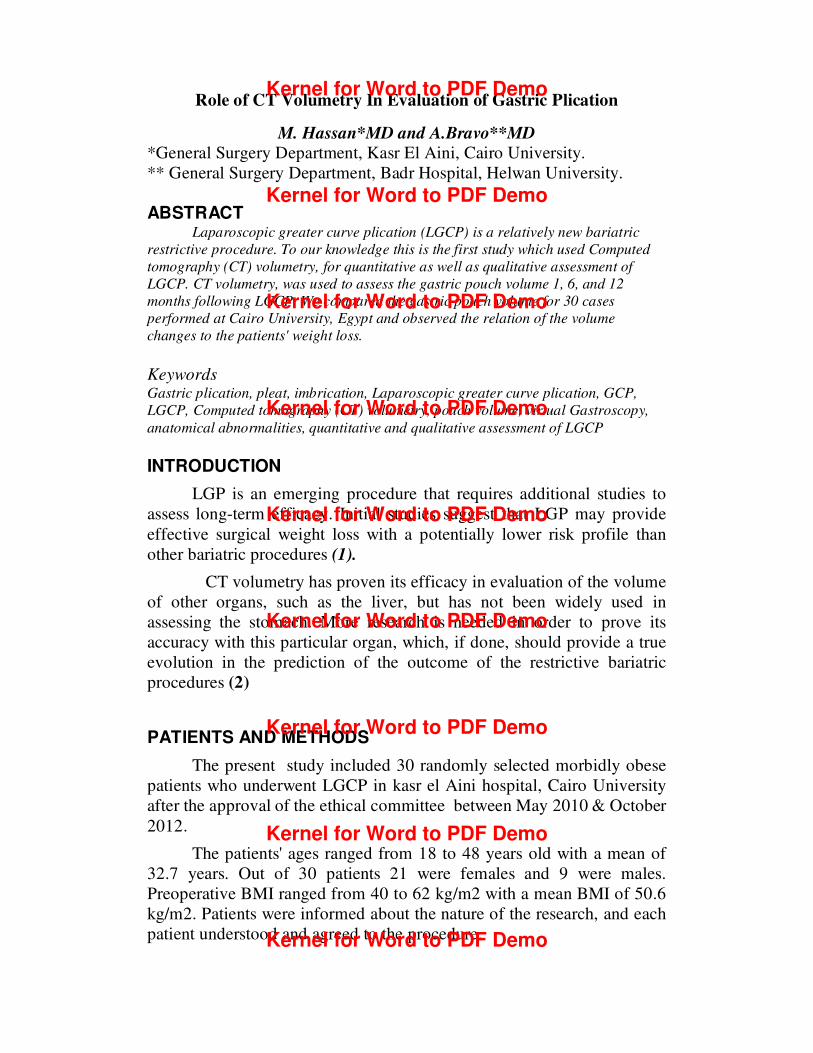
Laparoscopic greater curve plication (LGCP) is a relatively new bariatric
restrictive procedure. To our knowledge this is the first study which used Computed
tomography (CT) volumetry, for quantitative as well as qualitative assessment of
LGCP. CT volumetry, was used to assess the gastric pouch volume 1, 6, and 12
months following LGCP, We compared the gastric pouch volume for 30 cases
performed at Cairo University, Egypt and observed the relation of the volume
changes to the patients' weight loss.
Keywords Gastric plication, pleat, imbrication, Laparoscopic greater curve plication, GCP,
LGCP, Computed tomography (CT) volumetry, pouch volume, virtual Gastroscopy,
anatomical abnormalities, quantitative and qualitative assessment of LGCP
INTRODUCTION
LGP is an emerging procedure that requires additional studies to
assess long-term efficacy. Initial studies suggest that LGP may provide
effective surgical weight loss with a potentially lower risk profile than
other bariatric procedures (1).
CT volumetry has proven its efficacy in evaluation of the volume
of other organs, such as the liver, but has not been widely used in
assessing the stomach. More research is needed in order to prove its
accuracy with this particular organ, which, if done, should provide a true
evolution in the prediction of the outcome of the restrictive bariatric
procedures (2)
PATIENTS AND METHODS
The present study included 30 randomly selected morbidly obese
patients who underwent LGCP in kasr el Aini hospital, Cairo University
after the approval of the ethical committee between May 2010 & October
2012.
The patients' ages ranged from 18 to 48 years old with a mean of
32.7 years. Out of 30 patients 21 were females and 9 were males.
Preoperative BMI ranged from 40 to 62 kg/m2 with a mean BMI of 50.6
kg/m2. Patients were informed about the nature of the research, and each
patient understood and agreed to the procedure. Kernel for Word to PDF Demo
Kernel for Word to PDF Demo
Kernel for Word to PDF Demo
Kernel for Word to PDF Demo
Kernel for Word to PDF Demo
Kernel for Word to PDF Demo
Kernel for Word to PDF Demo
Kernel for Word to PDF Demo
Kernel for Word to PDF Demo

All patients underwent a standard evaluation preoperatively as
required.
Surgical Procedures
All surgical procedures took place under general anesthesia with
the patient in supine position with 30 degrees reverse trendlenberg and
legs open. Closed pneumoperitoneum was achieved then a five-trocar
port technique similar to that used in laparoscopic sleeve gastrectomy was
used. Trocar placement was as follows: one 10-mm trocar above and
slightly to the right of the umbilicus for the 45° laparoscope; one 10-mm
trocar in the upper right quadrant (URQ) for passing the needle, for
suturing, and for the surgeon’s right hand; one 5-mm trocar also in the
URQ below the 10-mm trocar at the axillary line for the surgeon’s
assistant; one 10-mm trocar below the xiphoid process for liver retraction;
and one 5-mm trocar in the upper left quadrant (ULQ) for the surgeon’s
left hand (Fig. 1). The procedure began with dissection of the Greater
curvature from attached omentum using Ligasure (Covedien) or
Harmonic scalpel (Ethicon Endo-Surgery) and opening the greater
omentum at the transition between the gastric antrum and gastric body.
Once access to the posterior wall was achieved, the greater curvature
vessels were dissected proximally up to the Angle of His and distally
until 4cm from the pylorus. Posterior gastric adhesions were also
dissected to allow optimal freedom for creating and sizing the
invagination properly.
Fig. (1): Trocar position: A) 10mm above the umbilicus slightly to the right; B) 10mm in
URQ; C) 10mm below xiphoid process; D) 5mm in the ULQ; E) 5mm on the URQ at the
axilary line
Kernel for Word to PDF Demo
Kernel for Word to PDF Demo
Kernel for Word to PDF Demo
Kernel for Word to PDF Demo
Kernel for Word to PDF Demo
Kernel for Word to PDF Demo
Kernel for Word to PDF Demo
Kernel for Word to PDF Demo
Kernel for Word to PDF Demo

After release of the greater curvature Plication was started at the
angle of Hiss and continued to 4cm from the pylorus over a 36 Fr. Bougie
using an extra-mucosal running suture line of 0-0 Prolene™ (Ethicon,
Inc., Somerville, NJ, USA). The suture material was then knotted and a
second running suture line applied ending at the angle of Hiss. The
distance between each stitch and lesser curvature was 2cm anteriorly as
well as posteriorly. The distance between each stitch and the following
stitch was 2cm as well. Care was taken to keep the stitches extramucosal.
The reduction resulted in a stomach shaped like a large sleeve
gastrectomy. Leak tests were performed with methylene blue and then
repeated with air in all cases. One drain was left in place and ports closed.
All intra-operative videos were digitally recorded.
In the postoperative period, patients were discharged as soon as
they accepted a liquid diet without vomiting. The postoperative diet was
prescribed with a progressive return to solid foods in a stepwise fashion.
The primary study objective was to assess relation between CT
volumetric results and the weight loss after gastric plication. The weight
loss assessments included the absolute change in weight, the change in
BMI, and the percentage of excess Body weight loss (%EBWL). The
weight was measured at the initial screening visit, 1 month, 6 months, and
12 months after surgery. CT volumetric and Virtual gastroscopic
evaluations were scheduled for 1, 6, and 12 months.
All available data was placed in Excel spreadsheet software and the
data analyzed.
RESULTS
The absolute weight decreased at 1 month postoperative by a mean
of 16.1 kg with a range of 3.6 kilograms (kg) to 27.5 kg. The absolute
weight decreased at 6 months postoperative by a mean of 29.3 kg with a
total weight loss range of 12 kg to 51 kg. The absolute weight decreased
at 12 months postoperative by a mean of 36 kg with a total weight loss
range of 4 kg to 71 kg as shown in figure (2).
Kernel for Word to PDF Demo
Kernel for Word to PDF Demo
Kernel for Word to PDF Demo
Kernel for Word to PDF Demo
Kernel for Word to PDF Demo
Kernel for Word to PDF Demo
Kernel for Word to PDF Demo
Kernel for Word to PDF Demo
Kernel for Word to PDF Demo

Fig. (2): The mean absolute weight preoperative, 1 month, 6 months, and 12 months
postoperative.
The mean BMI decreased at 1 month to 44.7 kg/m2 (34.7 – 56.1
kg/m2). At 6 months the mean BMI was 39.9 kg/m2 (28.5 – 52.8 kg/m2),
and after 1 year the mean BMI was 37.5 kg/m2 (25.1 – 51.9 kg/m2). The
BMI of all patients over a 12 months period is shown in figure (3). While
the mean BMI over 12 months is shown in figure (4).
The BMI decreased at 1 month postoperative by a mean of 5.9
kg/m2 with a range of 1.4 kg/m2 to 10.8 kg/m2. The BMI decreased at 6
months postoperative by a mean of 10.7 kg/m2 with a range of 4.6 kg/m2
to 17.4 kg/m2. The BMI decreased at 12 months postoperative by a mean
of 13.2 kg/m2 with a range of 1.5 kg/m2 to 26 kg/m2.
0
20
40
60
80
100
120
140
160
Preoperative 1 month 6 months 12 months
Mean weight
Kernel for Word to PDF Demo
Kernel for Word to PDF Demo
Kernel for Word to PDF Demo
Kernel for Word to PDF Demo
Kernel for Word to PDF Demo
Kernel for Word to PDF Demo
Kernel for Word to PDF Demo
Kernel for Word to PDF Demo
Kernel for Word to PDF Demo

Fig. (3): The BMI of all patients preoperative, 1 month, 6 months, and 12 months
postoperative.
Fig. (4): The mean BMI preoperative, 1 month, 6 months, and 12 months postoperative.
The % excess body weight loss ranged from 9.1 % to 47.7 %
with a mean of 23.5 % after 1 month. After 6 months, the % excess body
weight loss ranged from 21.1 % to 80.9 % with a mean of 43.5 %. While
After 12 months, the excess body weight loss ranged from 10.2 % to 99.6
% with a mean of 52.4 %.
0.0
1.0
2.0
3.0
4.0
5.0
6.0
7.0
1 3 5 7 9 11 13 15 17 19 21 23 25 27 29
12 months BMI
6 months BMI
1 month BMI
Preoperative BMI
0
10
20
30
40
50
60
Preoperative 1m. 6m. 12m.
Mean BMI
Kernel for Word to PDF Demo
Kernel for Word to PDF Demo
Kernel for Word to PDF Demo
Kernel for Word to PDF Demo
Kernel for Word to PDF Demo
Kernel for Word to PDF Demo
Kernel for Word to PDF Demo
Kernel for Word to PDF Demo
Kernel for Word to PDF Demo

Fig. (5): The mean % EBWL at 1 month, 6 months, and 12 months postoperative.
The pouch volume ranged 1 month postoperative from 128 cm3 to
446 cm3 with a mean of 248 cm3. This volume ranged 6 months
postoperative from 168 cm3 to 573 cm3 with a mean of 356.5 cm3. The
volume at 12 months postoperative ranged from 277 cm3 to 822.2 cm3
with a mean of 458.1 cm3.
The pouch volume increased at 6 months postoperative by a mean
of 108.6 cm3 with a range of 28 cm3 to 307 cm3. The volume increased
at 12 months postoperative by a mean of 210.2 cm3 with a range of -35.1
cm3 to 499.2 cm3 from the pouch volume at 1 month postoperative as
shown in figure (6)
0
10
20
30
40
50
60
1m. 6m. 12m.
% EBWL
Kernel for Word to PDF Demo
Kernel for Word to PDF Demo
Kernel for Word to PDF Demo
Kernel for Word to PDF Demo
Kernel for Word to PDF Demo
Kernel for Word to PDF Demo
Kernel for Word to PDF Demo
Kernel for Word to PDF Demo
Kernel for Word to PDF Demo

Fig. (6): The mean pouch volume at 1 month, 6 months, and 12 months postoperative.
Qualitatively CT volumetry suggested that the initial greater
curvature fold was smaller at 6 months when compared with the initial
fold size at 1 month but appears unchanged at 12 months.
The mean operative time was 154 min (100 to 210 min). Operative
time was shown to decrease by time. The mean operative time was 163.6
min. (120 – 210 min.) in the first 22 cases who underwent surgery in
2010, while it decreased to 130 min. (100 – 150 min.) in the last 8 cases
who underwent surgery in 2011.
The Patients’ data is shown below in table (1):
No Age (y) Sex Date of Operation Operative time (min)
1 27 F 12/05/10 120
2 44 F 15/06/10 180
3 23 F 31/6/10 200
4 28 F 04/07/10 180
5 29 F 06/07/10 210
6 28 F 10/07/10 160
7 35 M 20/07/10 160
8 25 M 05/08/10 130
9 19 M 07/08/10 180
10 47 F 09/08/10 160
11 30 F 23/08/10 180
0
50
100
150
200
250
300
350
400
450
500
1 month 6 months 12 months
Mean pouch volume
Mean pouch volume
Kernel for Word to PDF Demo
Kernel for Word to PDF Demo
Kernel for Word to PDF Demo
Kernel for Word to PDF Demo
Kernel for Word to PDF Demo
Kernel for Word to PDF Demo
Kernel for Word to PDF Demo
Kernel for Word to PDF Demo
Kernel for Word to PDF Demo

12 31 M 29/08/10 180
13 30 F 03/09/10 140
14 27 F 06/09/10 200
15 30 M 07/09/10 180
16 46 F 13/09/10 140
17 38 F 14/09/10 135
18 26 F 20/09/10 120
19 48 F 07/10/10 130
20 42 M 08/10/10 120
21 27 F 18/10/10 195
22 38 M 20/12/10 180
23 35 F 23/01/11 130
24 30 M 05/03/11 140
25 32 F 13/4/11 130
26 18 F 04/05/11 130
27 31 F 17/05/11 150
28 38 F 30/5/11 100
29 48 M 03/06/11 140
30 33 F 30/10/11 120
*The following abbreviations were used in the table to easily display the data: number (No.),
Female (F), Male (M)
The Preoperative Biometric measurements are shown below in
table (2):
No.
Preoperative measurements
Weight Height BMI Ideal Weight Excess body weight
1 140 1.67 50.2 69.7 70.3
2 139 1.64 51.7 67.2 71.8
3 115 1.67 41.2 69.7 45.3
4 141.5 1.6 55.3 64.0 77.5
5 113 1.61 43.6 64.8 48.2
6 105 1.62 40.0 65.6 39.4
7 148 1.62 56.4 65.6 82.4
8 195 1.8 60.2 81.0 114.0
9 180 1.79 56.2 80.1 99.9
10 147 1.59 58.1 63.2 83.8
11 138 1.64 51.3 67.2 70.8
12 122 1.71 41.7 73.1 48.9
13 140 1.68 49.6 70.6 69.4
14 110 1.47 50.9 54.0 56.0
15 150 1.64 55.8 67.2 82.8
16 101 1.55 42.0 60.1 40.9
17 144 1.59 57.0 63.2 80.8
18 158 1.7 54.7 72.3 85.8
19 105.4 1.59 41.7 63.2 42.2
20 152 1.84 44.9 84.6 67.4 Kernel for Word to PDF Demo
Kernel for Word to PDF Demo
Kernel for Word to PDF Demo
Kernel for Word to PDF Demo
Kernel for Word to PDF Demo
Kernel for Word to PDF Demo
Kernel for Word to PDF Demo
Kernel for Word to PDF Demo
Kernel for Word to PDF Demo

21 150 1.64 55.8 67.2 82.8
22 157 1.87 44.9 87.4 69.6
23 125 1.58 50.1 62.4 62.6
24 157 1.72 53.1 74.0 83.0
25 157.5 1.63 59.3 66.4 91.1
26 117 1.68 41.5 70.6 46.4
27 120 1.68 42.5 70.6 49.4
28 147 1.54 62.0 59.3 87.7
29 136 1.64 50.6 67.2 68.8
30 147 1.62 56.0 65.6 81.4
The results after 1 month are shown below in table (3):
No. 1 Month Postoperative
BMI Weight Weight Loss % Excess Weight Loss CT volumetry (Pouch volume)
1 45.5 127.0 13.0 18.5 231
2 41.6 112.0 27.0 37.6 176
3 39.0 108.9 6.1 13.5 246
4 50.4 129.0 12.5 16.1 229
5 34.7 90.0 23.0 47.7 139
6 38.6 101.4 3.6 9.1 395
7 49.5 130.0 18.0 21.8 323
8 54.0 175.0 20.0 17.5 340
9 51.4 164.7 15.3 15.3 224
10 51.8 131.0 16.0 19.1 225
11 42.0 113.0 25.0 35.3 303
12 37.9 110.9 11.1 22.7 208
13 46.1 130.0 10.0 14.4 140
14 47.2 102.0 8.0 14.3 280
15 50.6 136.0 14.0 16.9 280
16 38.3 92.0 9.0 22.0 333
17 46.1 116.6 27.4 33.9 194
18 48.4 140.0 18.0 21.0 290
19 36.8 93.0 12.4 29.4 205
20 39.9 135.0 17.0 25.2 250
21 48.3 130.0 20.0 24.2 169
22 42.4 148.3 8.7 12.5 214
23 46.7 116.6 8.4 13.4 197
24 46.3 137.0 20.0 24.1 213
25 48.9 130.0 27.5 30.2 227
26 35.4 100.0 17.0 36.6 199
27 35.4 100.0 20.0 40.5 340
28 56.1 133.0 14.0 16.0 295
29 42.0 113 23.0 33.4 446
30 48.8 128 19.0 23.3 128
Kernel for Word to PDF Demo
Kernel for Word to PDF Demo
Kernel for Word to PDF Demo
Kernel for Word to PDF Demo
Kernel for Word to PDF Demo
Kernel for Word to PDF Demo
Kernel for Word to PDF Demo
Kernel for Word to PDF Demo
Kernel for Word to PDF Demo

The results after 6 months are shown below in table (4):
No. BMI Weight Weight Loss % Excess
Weight Loss
CT volumetry
Pouch
volume cc
Volume
increase cc
% volume
increase 1 41.2 115 25 35.6 359.0 128.0 55.4
2 36.1 97 42 58.5 284.0 108.0 61.4
3 34.0 94.8 20.2 44.6 317.0 71.0 28.9
4 45.7 117 24.5 31.6 307.0 78.0 34.1
5 28.5 74 39 80.9 233.0 94.0 67.6
6 35.4 93 12 30.5 573.0 178.0 45.1
7 46.5 122 26 31.6 462.0 139.0 43.0
8 52.8 171 24 21.1 450.0 110.0 32.4
9 40.3 129 51 51.1 347.0 123.5 55.3
10 46.7 118 29 34.6 532.0 307.0 136.4
11 39.0 105 33 46.6 384.0 81.0 26.7
12 29.1 85 37 75.7 321.0 113.0 54.3
13 42.2 119 21 30.2 168.0 28.0 20.0
14 42.6 92 18 32.2 363.0 83.0 29.6
15 47.2 127 23 27.8 375.0 95.0 33.9
16 33.3 80 21 51.3 450.0 117.0 35.1
17 39.6 100 44 54.5 302.0 108.0 55.7
18 44.3 128 30 35.0 362.5 72.5 25.0
19 34.0 86 19.4 46.0 314.0 109.0 53.2
20 37.2 126 26 38.6 331.0 81.0 32.4
21 39.0 105 45 54.4 262.0 93.0 55.0
22 36.6 128 29 41.7 331.0 117.0 54.7
23 38.9 97 28 44.7 289.0 92.0 46.7
24 41.9 124 33 39.7 339.0 126.0 59.2
25 42.5 113 44.5 48.9 270.0 43.0 18.9
26 31.5 89 28 60.3 312.0 113.0 56.8
27 32.2 91 29 58.7 407.8 67.8 19.9
28 52.7 125 22 25.1 368.0 73.0 24.7
29 40.2 108 28 40.7 568 122.0 27.4
30 45.3 119 28 34.4 314 186.0 145.3
The results after 12 months are shown below in table (5):
No. BMI Weight Weight Loss % Excess
Weight Loss
CT volumetry
Pouch
volume cc
Volume
increase cc
% pouch
volume 1 36.2 101 39.0 55.5 401.9 170.9 74.0
2 32.7 88 51.0 71.1 388 212 120.5
3 34.1 95 20.0 44.2 460 214 87.0
4 41.0 105 36.5 47.1 483 254 110.9
5 25.1 65 48.0 99.6 377 238 171.2
6 38.5 101 4.0 10.2 813 418 105.8
7 41.9 110 38.0 46.1 822.24 499.24 154.6
8 51.9 168 27.0 23.7 577.6 237.6 69.9 Kernel for Word to PDF Demo
Kernel for Word to PDF Demo
Kernel for Word to PDF Demo
Kernel for Word to PDF Demo
Kernel for Word to PDF Demo
Kernel for Word to PDF Demo
Kernel for Word to PDF Demo
Kernel for Word to PDF Demo
Kernel for Word to PDF Demo

9 37.1 119 61.0 61.1 412 188.5 84.3
10 43.1 109 38.0 45.3 470 245 108.9
11 39.0 105 33.0 46.6 327.4 24.4 8.1
12 32.1 94 28.0 57.3 542 334 160.6
13 40.7 115 25.0 36.0 323 183 130.7
14 44.0 95 15.0 26.8 512 232 82.9
15 42.4 114 36.0 43.5 476 196 70.0
16 31.2 75 26.0 63.5 604 271 81.4
17 36.4 92 52.0 64.4 436 242 124.7
18 42.2 122 36.0 42.0 586 296 102.1
19 32.4 82 23.4 55.5 467 262 127.8
20 33.1 112 40.0 59.4 364 114 45.6
21 29.7 80 70.0 84.6 284 115 68.0
22 34.3 120 37.0 53.2 307 93 43.5
23 37.3 93 32.0 51.1 277 80 40.6
24 39.5 117 40.0 48.2 299.9 86.9 40.8
25 41.4 110 47.5 52.2 493 266 117.2
26 30.1 85 32.0 68.9 543.5 344.5 173.1
27 28.3 80 40.0 80.9 483.2 143.2 42.1
28 48.5 115 32.0 36.5 502.6 207.6 70.4
29 37.9 102 34.0 49.4 410.9 -35.1 -7.9
30 41.2 108 39.0 47.9 299.9 171.9 134.3
DISCUSSION
The mean BMI decreased at 1 month to 44.7 kg/m2 (34.7 – 56.1
kg/m2). At 6 months the mean BMI was 39.9 kg/m2 (28.5 – 52.8 kg/m2),
and after 1 year the mean BMI was 37.5 kg/m2 (25.1 – 51.9 kg/m2).
The BMI decreased after 12 months postoperative by a mean of
13.2 kg/m2 with a range of 1.5 kg/m2 to 26 kg/m2. In the study by
Brethauer S. et. al. The mean BMI decreased by 24.4 Kg/m2 (3). The
difference could possibly be due the smaller preoperative BMI in the
study by Brethauer S. et. al. 43.3 Kg/m2 (range 36.9 – 49 Kg/m2)
compared to our study with a mean BMI of 50.6 kg/m2 (range 40 - 62
kg/m2 ). The results are shown in figure (7)
Kernel for Word to PDF Demo
Kernel for Word to PDF Demo
Kernel for Word to PDF Demo
Kernel for Word to PDF Demo
Kernel for Word to PDF Demo
Kernel for Word to PDF Demo
Kernel for Word to PDF Demo
Kernel for Word to PDF Demo
Kernel for Word to PDF Demo

Fig. (7): The mean decrease in BMI after 12 months postoperative.
All the patients have lost weight significantly after 1 month, 6
months and 12 months with a mean % Excess Body Weight Loss of 23.5,
43.5% and 52.4% respectively. This was compared to other studies as
follows:
0
5
10
15
20
25
30
Our study Brethauer S. et. al., 2010
Mean decrease in BMI after 12 months
Kernel for Word to PDF Demo
Kernel for Word to PDF Demo
Kernel for Word to PDF Demo
Kernel for Word to PDF Demo
Kernel for Word to PDF Demo
Kernel for Word to PDF Demo
Kernel for Word to PDF Demo
Kernel for Word to PDF Demo
Kernel for Word to PDF Demo

Fig. (8): The mean % EBWL at 1 month, 6 months, and 12 months postoperative (3)(4)(5).
In our study, we measured the pouch volume after 1 month which
showed a mean volume of 248 cm3 which increased after 6 months to
356.5 cm3 and after 12 months to 458.1 cm3. The pouch volume in all
patients at 1 month, 6 months, and 12 months is shown in figure (9). The
pouch volume increased in most but not all patients which suggests that
patient factors of gradual overstretching of the pouch may play a role.
Therefore gradual eating beyond satiety and thus gradual stretching of the
pouch should be avoided. The mean pouch volume at 1 month, 6 months,
and 12 months postoperative is shown in figure (10).
0
10
20
30
40
50
60
70
1m. 6m. 12m.
Our study Ramos et. al., 2010
Brethauer S. et. al., 2010 Talebpour 2007
Talebpour 2010
Kernel for Word to PDF Demo
Kernel for Word to PDF Demo
Kernel for Word to PDF Demo
Kernel for Word to PDF Demo
Kernel for Word to PDF Demo
Kernel for Word to PDF Demo
Kernel for Word to PDF Demo
Kernel for Word to PDF Demo
Kernel for Word to PDF Demo

Fig. (10): The mean pouch volume at 1 month, 6 months, and 12 months postoperative.
The percentage pouch volume increase was compared at 6 months
and 12 months postoperative. The mean gastric pouch increased in
patients after 6 months by 47.8% (108.6 cm3) and after 12 months the
pouch further increased by a mean of 43.6 % (101.6 cm3) of the mean
volume at 1 month. The % pouch volume increase in all patients at 6
months and 12 months is shown in figure (11)
0
100
200
300
400
500
1 month 6 months 12 months
Mean pouch volume
Mean pouch volume
Fig. (9): The pouch volume at 1 month, 6 months, and 12 months postoperative.
0
200
400
600
800
1000
1 2 3 4 5 6 7 8 9 10 11 12 13 14 15 16 17 18 19 20 21 22 23 24 25 26 27 28 29 30
Pouch volume 1 month Pouch volume 6 months Pouch volume 12 months
Kernel for Word to PDF Demo
Kernel for Word to PDF Demo
Kernel for Word to PDF Demo
Kernel for Word to PDF Demo
Kernel for Word to PDF Demo
Kernel for Word to PDF Demo
Kernel for Word to PDF Demo
Kernel for Word to PDF Demo
Kernel for Word to PDF Demo

Fig. (11): The % pouch volume increase at 6 months, and 12 months postoperative.
The mean % pouch volume increase in patients was compared to %
EBWL at 6 months and 12 months and it was found that a mean % pouch
volume increase of 47.8% was associated with a mean %EBWL of
43.5%. Over the next 6 months. The mean % pouch volume increased by
a further 43.6%. This was associated with a mean % EBWL of 52.4
(8.9% more than the mean %EBWL at 6 months). Therefore if the mean
% EBWL at 6 months is considered theoretically constant in the next 6
months, an increase of mean % pouch volume by 43.6 decreased the
potential weight loss by 34.7%. Therefore it can be deduced that an
increase in pouch volume strongly correlates with a decrease in %EBWL
This is shown in figure (12, 13)
-2.0
0.0
2.0
4.0
6.0
8.0
10.0
12.0
14.0
16.0
18.0
20.0
1 2 3 4 5 6 7 8 9 10 11 12 13 14 15 16 17 18 19 20 21 22 23 24 25 26 27 28 29 30
% Pouch volume increase at 6 months % Pouch volume increase at 12 months
Kernel for Word to PDF Demo
Kernel for Word to PDF Demo
Kernel for Word to PDF Demo
Kernel for Word to PDF Demo
Kernel for Word to PDF Demo
Kernel for Word to PDF Demo
Kernel for Word to PDF Demo
Kernel for Word to PDF Demo
Kernel for Word to PDF Demo

Fig. (12): The % pouch volume increase at 6 months, and 12 months postoperative compared to
mean % EBWL.
Fig. (13): (a) The % pouch volume increase at 1, 6, 12 months (b) The mean % EBWL a1, 6, and 12
months postoperative with linear projected % EBWL.
0
10
20
30
40
50
60
70
80
90
100
6 months 12 months
Mean % pouch volume
increase
Mean % EBWL
0
10
20
30
40
50
60
70
1 6 12
Mean % EBWL
Projected % EBWL
Linear (Projected % EBWL)
Kernel for Word to PDF Demo
Kernel for Word to PDF Demo
Kernel for Word to PDF Demo
Kernel for Word to PDF Demo
Kernel for Word to PDF Demo
Kernel for Word to PDF Demo
Kernel for Word to PDF Demo
Kernel for Word to PDF Demo
Kernel for Word to PDF Demo
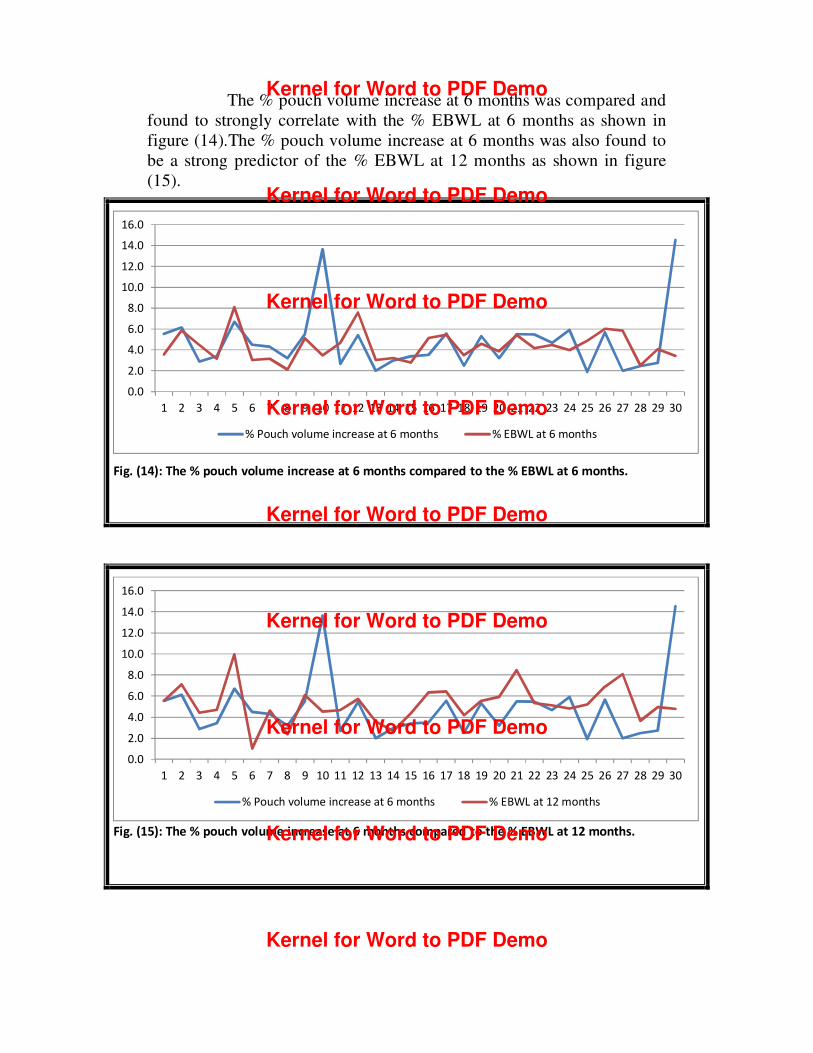
The % pouch volume increase at 6 months was compared and
found to strongly correlate with the % EBWL at 6 months as shown in
figure (14).The % pouch volume increase at 6 months was also found to
be a strong predictor of the % EBWL at 12 months as shown in figure
(15).
Fig. (14): The % pouch volume increase at 6 months compared to the % EBWL at 6 months.
Fig. (15): The % pouch volume increase at 6 months compared to the % EBWL at 12 months.
0.0
2.0
4.0
6.0
8.0
10.0
12.0
14.0
16.0
1 2 3 4 5 6 7 8 9 10 11 12 13 14 15 16 17 18 19 20 21 22 23 24 25 26 27 28 29 30
% Pouch volume increase at 6 months % EBWL at 6 months
0.0
2.0
4.0
6.0
8.0
10.0
12.0
14.0
16.0
1 2 3 4 5 6 7 8 9 10 11 12 13 14 15 16 17 18 19 20 21 22 23 24 25 26 27 28 29 30
% Pouch volume increase at 6 months % EBWL at 12 months
Kernel for Word to PDF Demo
Kernel for Word to PDF Demo
Kernel for Word to PDF Demo
Kernel for Word to PDF Demo
Kernel for Word to PDF Demo
Kernel for Word to PDF Demo
Kernel for Word to PDF Demo
Kernel for Word to PDF Demo
Kernel for Word to PDF Demo

The % pouch volume increase at 12 months was also compared and
found to strongly correlate with the % EBWL at 12 months and will also
probably be a strong predictor of the % EBWL in the following period.
Fig. (16): The % pouch volume increase at 12 months compared to the % EBWL at 12 months.
Analyzing this data, we observed that 13/15(86.6%) who had
significant weight loss (>50% of EBWL), had a smaller pouch volume
(<250cm3) following LGCP. Moreover, 9/15 (60%) of the patients who
had significant weight loss (>50% of EBWL) had a lower percentage of
increased gastric pouch volume in the first 6 months (≤ 55% increase in
the pouch volume) i.e. the lesser the increase of the pouch volume, the
more the weight loss of the patients. This is shown in figure (17)
-2.0
0.0
2.0
4.0
6.0
8.0
10.0
12.0
14.0
16.0
18.0
20.0
1 2 3 4 5 6 7 8 9 10 11 12 13 14 15 16 17 18 19 20 21 22 23 24 25 26 27 28 29 30
% Pouch volume increase at 12 months % EBWL at 12 months
Kernel for Word to PDF Demo
Kernel for Word to PDF Demo
Kernel for Word to PDF Demo
Kernel for Word to PDF Demo
Kernel for Word to PDF Demo
Kernel for Word to PDF Demo
Kernel for Word to PDF Demo
Kernel for Word to PDF Demo
Kernel for Word to PDF Demo

Fig. (17): Relation between %EBWL and % increased Pouch Volume.
CONCLUSIONS
Therefore it can be concluded that the pouch volume following
LGCP and the percentage of volume increase of this pouch are two
important factors in determining the weight loss of the patients. However
this relation was not proven in 100% of the patients which highlights the
possible effect of other factors such as hormonal factor or the increased
rate of pouch evacuation.
These results emphasize the fact that CT volumetry is mandatory in
evaluation of EBWL in relation to the dilated gastric pouch and further
study to determine the exact end point for predictability of outcome in
relation to pouch volume must be studied.
Patients with > 50% EBWL
Increased pouch volume ≤ 55% Increased pouch volume > 55%
Kernel for Word to PDF Demo
Kernel for Word to PDF Demo
Kernel for Word to PDF Demo
Kernel for Word to PDF Demo
Kernel for Word to PDF Demo
Kernel for Word to PDF Demo
Kernel for Word to PDF Demo
Kernel for Word to PDF Demo
Kernel for Word to PDF Demo

REFERENCES
1 ASMBS guideline on the prevention and detection of
gastrointestinal leak after gastric bypass including the role of
imaging and surgical exploration. Surg Obes Relat Dis 2009;
5:293-6.
2 Kim WW, Gagner M, Kini S, Inabnet WB, Quinn T, Herron D,
Laparoscopic vs. open biliopancreatic diversion with duodenal
switch: a comparative study. J Gastrointest Surg ;2003 7:552-7
3 Brethauer SA, Harris JL, Kroh M Laparoscopic gastric plication
for the treatment of severe obesity. Surgery for Obesity and
Related Diseases May 2010; 6(3):S16.
4 Ramos A.C., Manoel Galvão Neto, Josemberg Marins Campos,
and Claudio Cora Mottin, Laparoscopic Greater Curvature
Plication: An alternative restrictive bariatric procedure Bariatric
Times. 2010; 7(5):8–10
5 Talebpour M, Amoli BS. Laparoscopic total gastric vertical
plication in morbid obesity. J Laparoendosc Adv Surg Tech A.
2007; 17(6):793–8.
6 Talebpour M., Hamed Vahidi, Ten Years’ Experience about the
New Technique “laparoscopic vertical gastric plication” in morbid
obesity introduced the first time in the world http://www.
Laparoscopic
gastricplication.com/en/PUBLICATIONS_ABOUT_TVGP/ last
accessed 7/4/2012
Kernel for Word to PDF Demo
Kernel for Word to PDF Demo
Kernel for Word to PDF Demo
Kernel for Word to PDF Demo
Kernel for Word to PDF Demo
Kernel for Word to PDF Demo
Kernel for Word to PDF Demo
Kernel for Word to PDF Demo
Kernel for Word to PDF Demo