DNA demethylation increases sensitivity of neuroblastoma cells to chemotherapeutic drugs
Upload
khangminh22Category
view
0download
0
HAL Id: tel-01806333https://tel.archives-ouvertes.fr/tel-01806333
Submitted on 2 Jun 2018
HAL is a multi-disciplinary open accessarchive for the deposit and dissemination of sci-entific research documents, whether they are pub-lished or not. The documents may come fromteaching and research institutions in France orabroad, or from public or private research centers.
L’archive ouverte pluridisciplinaire HAL, estdestinée au dépôt et à la diffusion de documentsscientifiques de niveau recherche, publiés ou non,émanant des établissements d’enseignement et derecherche français ou étrangers, des laboratoirespublics ou privés.
Functional analysis of active DNA demethylation intomatoRuie Liu
To cite this version:Ruie Liu. Functional analysis of active DNA demethylation in tomato. Vegetal Biology. Universitéde Bordeaux, 2016. English. �NNT : 2016BORD0273�. �tel-01806333�

Mlle Ruie LIU POUR OBTENIR LE GRADE DE
DOCTEUR DE
L’UNIVERSITÉ DE BORDEAUX
Ecole doctorale des Sciences de la Vie et de la Santé
Spécialité : Biologie Végétale
FUNCTIONAL ANALYSIS OF ACTIVE DNA
DEMETHYLATION IN TOMATO
Sous la direction de : Philippe Gallusci
Présentée publiquement le 29 November 2016
Membres du jury :
M Etienne Bucher : Chercheur INRA, HDR, INRA Anger, Rapporteur
M Mohamed Zouine : Maitre de conférences, HDR, INP ENSAT
Université de Toulouse, Rapporteur
M Philippe Gallusci : Professeur, Université de Bordeaux, Directeur de thèse
Mme Rossitza Atanassova : Professeure, Université de Poitier, Examinatrice
M Mark Hooks : Professeur, Université de Bordeaux, Examinateur
M Serge Delrot : Professeur, Université de Bordeaux, Président

Titre: ANALYSE FONCTIONNELLE DE LA DEMETHYLATION D'ADN ACTIF EN
TOMATE
Résumé La méthylation de l'ADN génomique est l'un des principaux mécanismes épigénétiques
qui conduisent à des changements stables et héréditaires de l'expression des gènes sans que cela
s’accompagne de la modification de la séquence d'ADN sous-jacente. Elle fait référence à
l'addition d'un groupement méthyl sur le carbone 5 des cytosines (5meC). Ces dernières années,
l’étude des mécanismes régulant la mise en place et le maintien de de cette méthylation est
devenu un thème de recherche importante, en raison de son rôle essentiel dans la régulation du
fonctionnement du génome des plantes et des mammifères. La distribution des 5meC sur
l’ensemble du génome d’un organisme, encore appelé méthylome, peut être déterminée par
différentes méthodes dont le séquençage de l’ADN génomique après traitement au bisulfite de
sodium (WGBS ou méthyl C séq).
Chez les végétaux, la méthylation de l’ADN peut se produire dans tous les contextes de
séquence incluant les motifs symétriques CG et CHG et le contexte dissymétrique CHH (H
pouvant être A, T ou C). En fonction du contexte de séquence, la méthylation des cytosines est
mise en place et maintenue par trois types différents d'ADN méthyltransférase. Le maintien de
la méthylation aux sites CG et CHG est assurée par l’ADN Méthyltransférase 1 (MET1)
et par la Chromomométhylase, CMT3, respectivement. La chromomométhylase 2 (CMT2)
est-elle impliquée dans le maintien des méthylation de type CHH, de même que les Domain
Rearanged Methyltransferases (DRM). Ces dernières sont sont responsables de la mise en place
de la méthylation de novo et sont guidées jusqu’à leur cible par des petits ARNs selon le
mécanisme de «RNA directed DNA Methylation » (RdDM). Enfin la méthylation de l'ADN
peut également être éliminée par les ADN glycosylase-lyases bifonctionnelle, également
appelée les DEMETER-like DNA demethylases (DML). Chez la plante-modèle Arabidopsis,
la déméthylation active de l'ADN joue un rôle essentiel dans l'empreinte maternelle et la
déméthylation l’ADN génomique lors du développement de l’albumen, mais elles ne semblent
pas jouer de rôle essentiel pendant le développement de la plante chez cette espèce. La
méthylation de l’ADN génomique peut aussi être perdue après la réplication de l’ADN, lorsque
les mécanismes devant assurer son maintien ne sont pas actifs. On parle alors de déméthylation
passive de l’ADN génomique.

La tomate (Solanum lycopersicum) est une plante ayant une forte importance agronomique.
Elle est aussi utilisée comme principal modèle pour l’étude du développement et du
murissement des fruits charnus climatériques. Des études récentes ont maintenant montré que
le développement et la maturation de ces fruits reposent sur la mise en place et le maintien de
patrons de transcription différentielle, dont la régulation est assurée par un ensemble de
processus complexes impliquant à la fois des contrôles génétiques et des régulations
hormonales. Cependant, il semble que la régulation du développement et de la maturation des
fruits charnus ne reposent pas basant uniquement sur les modèles génétiques, mais impliquent
aussi es régulations épigénétiques. En effet, des travaux récents suggèrent que la méthylation
de l'ADN pourrait également être impliquée En particulier, une diminution importante de
l’abondance des 5 meC à l'échelle du génome entier et la déméthylation à certains promoteurs
observés lors de la maturation des fruits de tomate.
A fin d'analyser les mécanismes moléculaires responsables de la perte de méthylation
survenant lors de la maturation des fruits de tomate, le projet présenté se concentre sur l'analyse
fonctionnelle des enzymes de tomate impliquées dans la déméthylation active de l'ADN
génomique. Nous avons identifié 4 ADN déméthylases putatives (SlDML 1 à 4) qui contiennent
toutes trois domaines hautement conservés comprenant le domaine Glycosylases qui est porteur
de l’activité enzymatique et deux domaines supplémentaires A et B nécessaires à la liaison de
ces enzymes à l'ADN. Dans une tentative d'étude de l'activité des protéines SlDML, les ADNcs
complets codant pour les enzymes SlDML1 et 2 et ainsi que fragments de ces ADNcs codant
pour des versions tronquées de la portéine SlDML2 tronquées a été clonés. La production des
protéines recombinantes correspondantes dans la bactérie E Coli, n’a pas permis de démontrer
leur activité biochimique.
Pour analyser les fonctions biologiques des ADN déméthylases de Tomate, des plants de
tomates transgéniques altérés dans l'expression des gènes SlDML ont été générés. Ces plantes
présentent de nombreuses altérations du développement, parmi lesquelles des modifications de
l’organisation florale des fruits et de la forme des feuilles ainsi qu’une inhibition marquée de la
maturation des fruits. En utilisant ces plantes, nous avons démontré que la déméthylation active
de l'ADN est une exigence absolue pour que la maturation des fruits de tomate puisse avoir lieu.
En particulier nous avons mis en évidence un lien de cause à effet direct entre la déméthylation
active de l'ADN principalement médiée par une des quatres DML de tomate, SlDML 2 et la
maturation des fruits. Les plantes dont l’expression du gène SlDML2 est réduite présente une
inhibition de la maturation consécutive à l’hyperméthylation et la répression de l'expression des
gènes codant pour les facteurs de transcription contrôlant la maturation des fruits (Ripening

Inhibitor, RIN ; Non Ripening NOR ; Colourless Non Ripening, CNR) et pour des enzymes
impliquées dans des processus biochimiques clefs se produisant lors du murissement tels que
l’accumulation des caroténoïdes (Phytoène Synthase 1, PSY1).
A fin de déterminer si les phénotypes des plantes transgéniques (développement affectant
les fruits, les fleurs ainsi que le développement des feuilles) sont héréditaires après la perte du
transgène par ségrégation, leur stabilité a été étudiée sur plusieurs générations. Dans tous les
cas, les phénotypes sont perdus et les plantes après perte du transgène semblent en tout point
identique à des plants de tomate sauvage, ce qui suggère une absence d'héritabilité des
modifications induites par la réduction d’expression des gènes SlDML1 et 2. Cependant, nous
ne pouvons exclure que certains patrons anormaux de méthylation, liés ou non aux phénotypes
observés, sont néanmoins hérités. Il est possible que la perte des phénotypes ne soit pas due à
une non-héritabilité d’empreintes de méthylation inappropriées à certains loci spécifiques. Cela
pourrait plutôt refléter que la combinaison des états de méthylation à l’ensemble les loci
nécessaire au phénotype n'est pas obtenue dans les plantes obtenues après croisement.
L’analyse d’un plus grand nombre de plan, sur plusieurs générations et associé à l’analyse de
la distribution des cytosines méthylées sera nécessaire pour répondre à cette question.
Pour déterminer, les processus contrôlés par SlDML2 dans les fruits de tomate, nous avons
effectué une analyse comparative du transcriptome et du métabolome des fruits des plantes
sauvages et des plantes transgéniques RNAi DML à huit étapes de développement du fruit. Ces
analyses ont ensuite été corrélées aux données du méthylome de tomate déterminé à partir de
fruits de tomate de la variété Ailsa craig. Ces analyses révèlent qu'en plus des gènes RIN, NOR,
CNR, PSY1 un nombre important de métabolites primaires et secondaires, et de nombreux gènes
présentent une accumulation différentielle et des patrons d'expression distincts respectivement
chez les fruits transgéniques DML RNAi et chez les fruits sauvages. Par exemple,
l'accumulation de caroténoïdes, la biosynthèse et la signalisation de l'éthylène, la synthèse puis
la dégradation de la paroi cellulaire, mais aussi l’expression des gènes codant pour divers
facteurs de transcription, et pour certains régulateurs épigénétiques, incluant une DRM, des
histones dé-acétylases et différents histones déméthylases sont extrêmement affectés dans les
fruits transgéniques. Ces résultats suggèrent que de nombreux gènes, y parmi lesquels ceux qui
jouent des rôles essentiels pour le développement et la maturation des fruits, nécessitent d’être
déméthylés pour leur expression. En conséquence, ces travaux apportent la démonstration, pour
la première fois, que la déméthylation active d'ADN a des effets très globaux sur le
développement et la maturation des fruits. Il est maintenant nécessaire de valider ce travail en
déterminant le méthylome des lignées transgéniques altérées dans la déméthylation active de
l'ADN.
En conclusion, les observations présentées dans ce travail fournissent un cadre de travail
permettant d’analyser les mécanismes moléculaire responsable de la déméthylation de l'ADN
se produisant pendant la maturation des fruits de tomate. Ici, nous présentons une analyse
complète des conséquences d’une réduction de l’expression du gène de SlDML2 sur le
trancriptome et le métabolome des fruits, tout au long de leur développement. La corrélation
entre les profils d’expression de gènes réalisées lors de ce travail ( variété WVA106) et les
changements de la distribution de la méthylation de l’ADN telles que décrites chez la variété
Ailsa craig montre qu’en plus d'un rôle général dans la régulation des gènes directement
impliqués dans plusieurs voies métaboliques, plusieurs gènes codant pour des facteurs de
transcription ainsi que des régulateurs épigénétiques sont également susceptibles d'être
directement contrôlés par la méthylation de leur région promotrice. Cependant, nous ne
pouvions pas établir une relation stricte entre la diminution de la méthylation de l'ADN et
l'induction de l'expression des gènes, car de nombreux gènes présentant une diminution du
niveau de méthylation de l'ADN dans leur région promotrice pendant la maturation des fruits
sauvages correspondent à des gènes normalement réprimés. Ceci suggère que la méthylation
active de l'ADN serait nécessaire àleur répression pendant le processus de maturation. Ainsi la
relation entre la déméthylation de l'ADN et l'expression des gènes pourrait être plus complexe
et ne se limiterait pas à la simple hypothèse de départ de ce travail: la déméthylation de l'ADN
est nécessaire à l'expression de gènes induits au cours de la maturation. La déméthylation de
active de l'ADN pourrait également être nécessaire à la répression de gènes exrimés uniquement
lors des phases précoces du développement des fruits et réprimés lors du murissement.
Mots clés :
Tomate ; Déméthylation d'ADN; Mûrissement des fruits; Régions différentiellement
méthylées; l'expression du gène

Title : FUNCTIONAL ANALYSIS OF ACTIVE DNA
DEMETHYLATION IN TOMATO
Abstract
DNA methylation is one of the epigenetic mechanisms that lead to stable and heritable
changes in gene expression without alteration on DNA sequence. DNA methylation refers to
the addition of a methyl group to the fifth position of the cytosine ring. In recent years, DNA
methylation is becoming more and more widely studied, because of its importance in mammals
and plants. Methylated cytosines distribution can be determined across the genome at single-
nucleotide resolution, that is methylome, using whole genome bisulfite-sequencing (BS-seq)
approaches. The methylomes of an increasing number of plant species has been well described,
revealing that these large-scale patterns of methylation first described for Arabidopsis are
shared among flowering plants, although differences exist between plant species. In plants,
cytosine methylation which occurs in all sequence context (CG, CHG, CHH, H being A, T or
C) is set up and maintained by three different types of DNA methyltransferase. Methylation of
symmetric CG and CHG sites can be maintained by METHYLTRANSFERASE1 (MET1) and
CHROMOMETHYLASE2 (CMT2/CMT3), respectively. While maintenance of asymmetric
CHH methylation relies on RNA directed DNA methylation (RdDM) or CMT2. DNA
methylation can also be removed by the bifunctional DNA glycosylase-lyases, also called the
DEMETER-like DNA demethylases. In the model plant Arabidopsis, active DNA
demethylation plays a critical role in maternal imprinting and endosperm demethylation, but
none of these functions appear to be essential for the development in this species.
Solanum lycopersicum (tomato) is an important agronomic crop and the main model to
study the development and ripening process of climacteric fleshy fruit. Recent studies have now
shown that the development and ripening of fleshy fruits relies on the establishment and
maintenance of differential transcription patterns and complex regulatory pathways that involve
both genetic and hormonal controls are operating at these developmental phases. However, it
appears that a full understanding of fruit development and ripening will not be achieved based
only on genetic models as suggested by recent studies, which showing an important decrease
in global methylation level and demethylation at specific promoters during fruit ripening.
In order to analyze the molecular mechanisms responsible for the loss of methylation
observed during tomato fruit ripening, the present project focuses on the functional analysis the
tomato enzymes involved in the active demethylation of genomic DNA. As it was suggested

that DNA demethylases is DNA glycosylase-lyases, which is normally associated with removal
of methylated cytosine, nicking the DNA backbone and leaving a single nucleotide gap and
filled with an unmethylated cytosine through base excision pathway. As in Arabidopsis, three
highly conserved domains were observed including a glycosylases domain as well as two
additional domains A and B. These three domains is necessary for DNA binding and catalysis.
In an attempt to study the SlDML protein activity, the tomato full length DNA glycosylase-
lyases as well as different truncated recombinant proteins have been produced. Unfournatelly,
none of the protein show activity in this study, a further expressional condition should be
optimized. In addition, to investigate whether hypermethylated epialleles generated in the
transgenic plants can be inherited after the transgene has been lost by segregation, the stability
across generations of the developmental alterations affecting flower as well as leaf development
was studied. As a result, T4 plants show us that the phenotypes reversed to WT phenotype once
the transgene was out segregated, suggesting an absence of heritability of the modifications
induced by SlDML2 knock down. However, we cannot rule out that some abnormal
methylation patterns linked or not to these apparent phenotypes have been inherited. In addition,
it is not known how many loci are involved in generating the flower and leaf abnormalities.
Hence, it is possible that lack of phenotypes is not due to the non-heritability of the improper
methylation state at specific loci. It may reflect that the correct combination of homozygous
methylation state at all required loci was not obtained. Further generation and screening of more
important plant population will be necessary to answer this point.
After characterizing the gene family encoding the tomato DNA demethylases, transgenic
tomato plants impaired in the expression of SlDML genes have been generated. These plants
present several developmental alterations, including inhibition of fruit ripening, modifications
of flower, fruit and leaf shape. Using these plants, we have demonstrated that active DNA
demethylation is an absolute requirement for tomato fruit ripening to occur. We show a direct
cause and effect relationship between active DNA demethylation mainly mediated by one
tomato DML, SlDML2, and fruit ripening. RNAi SlDML2 knockdown results in ripening
inhibition via hypermethylation and repression of the expression of genes encoding ripening
transcription factors (RIN, NOR, CNR) and rate-limiting enzymes of key biochemical processes
(PSY1).
In recent years, the coordinated changes during tomato development and ripening was
analyzed using combined transcriptome, metabolism and proteome characterization. However,
it appears that a full understanding of tomato fruit development and ripening will not be
achieved based only on genetic models. In addition epigenetic regulation, mainly genomic

DNA methylation may play a key role in this process. Indeed, several evidence point out the
importance of DNA methylation and chromatin regulation on fleshy fruit development and
ripening ripening. The fruit ripening defect of Cnr mutant is caused by hypermethylation of an
upstream region of the CNR promoter. Zhong et al (2013) also detected that, the promoter
region of several genes are demethylated during tomato fruit ripening, suggesting that DNA
demethylation may play critical role during this phase of development. However, the pathways
under the regulation of SlDML2 have not been comprehensively identified. With the aim to
obtain a more comprehensive view of the roles of active DNA demethylation on tomato fruit
development and ripening, we have performed a comparative analysis of the transcriptome and
metabolome of WT and DML RNAi fruits at eight fruit development and ripening stages. These
analyses was integrated with tomato epigenome determined in WT Ailsa craig plants. These
analyses reveal that in addition to the four genes (RIN, NOR, CNR, PSY1) previously
characterized a large number of metabolites and genes present differential accumulation and
expression patterns respectively in DML RNAi transgenic fruits. Such as carotenoid, ethylene
biosynthesis and signaling, cell wall synthesis and dissembling, transcription factors, and many
others are extremely affected in transgenic fruits. These finding suggests that plenty of genes,
including those playing essential roles for fruit development and ripening might require
demethylation for their expression. Here, we present evidence for the first time that active DNA
demethylation has very global effects on fruit development and ripening. Validation of this
analysis will now require determining the fruit methylome of the plants impaired in active DNA
demethylation.
In conclusion, the observations presented in this work provide a framework for analysis of
the molecular mechanism of DNA demethylation during fruit ripening of tomato. Here, we
provide a comprehensive analysis of the knock down SlDML2 on the trancriptome, metaoblom
and DNA methylation in the promoter analysis. The large transcriptional reprogramming that
occured in mutant during fruit ripeing was correlated alterations in DNA methylation. Here we
highlight the central role of active DNA demethylation during tomato fruit ripening. In addition
to a general role in the regulation of genes directly involved in several metabolic pathways, we
also found that several transcription factors as well as epigenetic regulators are also likely under
direct methylation control. However, we could not establish a district relationship between
DNA reduction of DNA methylation and induction of gene expression, as not all DEGs
containing a type-a DMRs (decreased DNA methylation during fruit ripening) do not
correspond to genes normally induced in WT and repressed in transgenic plants. Some were
corresponding to an opposite situation and in a few cases more complex methylation pattern

(several DMRs) were also found. Indeed these conclusions are based on methylation analysis
obtained in another variety. They might however reflect the situation of WVA106 fruits,
although some variations are expectable when the methylome of DML RNAi fruits will be
analyzed. Hence the relationship between DNA demethylation and gene expression might be
more complex than expected, and not limited to the starting hypothesis of this work: DNA
demethylation is an absolute requirement for the expression of critical ripening induced genes.
This is indeed clearly in this study, but the analysis presented here also suggest that DNA
demethylation might also be necessary for the repression of several genes as well.
In addition, from the rencent study in Arabidopsis, ROS1 were found preferentially targets
transposable elements (TEs) which are closer to protein coding genes and intergenic regions,
which suggesting that ROS1 may prevent DNA methylation spreading from TEs to nearby
genes. While in tomato, as our analysis, we found the methylation level of promoter of a number
of genes was altered during fruit ripening, therefore, through methylome analysis, we will also
get the preference of DNA methylation on TE, this analysis will give us idea that demethylation
in fleshy fruit may has other distinct function as it is in Arabidopsis.
Keywords :
Tomato ; DNA demethylation ; fruit ripeing ; differently methylated regions ; gene
expression
Unité de recherche
INRA-Bordeaux Aquitaine
UMR Ecophysiologie et Génomique Fonctionnelle de la Vigne
Batiment Institut des Sciences de la Vigne et du Vin (ISVV)
210, chemin de Leysotte, CS 50008
33882 Villenave d'Ornon Cedex


Acknowledgements
I
Acknowledgements
This work was performed in the Ecophysiology and Functional Genomics of Vine as well as
Fruit Pathology and Biology Group at INRA, University of Bordeaux from Sep.2013 to
Nov.2016. The project was funded by Fulbring grant, Agence National de Recherche. I was
funded by Chinese Scholorship Councile.
I would like to thank my supervisor Philippe Gallusci. I appreciate for his guidance,
responsibility and positivity over these three years. He spent much time to disscuss on all the
expriments I performed. His knowledge on epigenetic has been most invaluable, professional and
inspiring. I also want to thank Emeline Teyssi specifically, for her discussion and guide for most
experiments, as well as her particular correction in the introduction of this thesis. Both of them
gave me great help on work and life. Many thanks to my group members, Linda Stammitti, Anne
Bertrand, Junhua Kong, especially Linda gave me lots of useful suggestions and great help. I
have been fortunate to become a member of this group.
I also can’t thank my collaborators enough, James Gavannoi for performing RNA seq and
bisulifite sequencing, Alisdair Fernie and Takayuki Tohge for wide-scale metabolism analysis,
Dominique Rolin for primary metabolism analysis. Yiguo Hong for VIGS silencing, Gram
symour for DML expression in tomato mutants measurement. Meanwhile, I’d like to specifically
thank Jame to allow me visit his lab. My eyes are widely opened on building BS-librariy during
these precious three months. I also want to thanks Tohge and Alis F, who gave me idea how to do
metabolism analysis and very useful guidance. Thanks to Mohamed Zouine and Elie Maza to
allow me visit their lab and gaudiness on RNA seq analysis. These are precious communication.
At same time, I would like to thank members in their lab, who gave me lots of suggestions and
discussion. It has been a great pleasure to working with them.
My thanks to people in Ecophysiology and Functional Genomics of Vine as well as Fruit
Pathology and Biology Group members, in particular to Cecil Cabassion, Michel Hernould,
Pierre Baldet, for outstanding questions discussion, Esabaelle who took care my tomato plants in
the last two years. Zhanwu Dai taught me network analysis and guides discussion. Classmates in
these two labs were always generously sharing their knowledge and for all the stimulating and
fun meetings we have had.
I can not thank enough of the members of my thesis jury, Etienne Bucher, Mohamed Zouine,
Serge Delrot, Mark Hooks and Rossitza Atanassova, they gave me valuable comments and
proofreading this thesis.
Mostly, I want to thank my family and friends who always support me in my life, this
support is so important for me! It’s a great pleasure to have spent my time in France. Work and
people here have all enriched my life and made my stay here unforgettable.
Summary
I
Summary
DNA methylation is one of the epigenetic mechanisms that lead to stable and heritable
changes in gene expression without alteration on DNA sequence. DNA methylation refers to the
addition of a methyl group to the fifth position of the cytosine ring. In recent years, DNA
methylation is becoming more and more widely studied, because of its importance in mammals
and plants. Methylated cytosines distribution can be determined across the genome at single-
nucleotide resolution, the so-called methylome, using whole genome bisulfite-sequencing (BS-
seq) approaches. The methylomes of an increasing number of plant species has been well
described, revealing that these large-scale patterns of methylation first described for Arabidopsis
are shared among flowering plants, although differences exist between plant species. In plants,
cytosine methylation which occurs in all sequence context (CG, CHG, CHH, H being A, T or C)
is set up and maintained by three different types of DNA methyltransferase. It can also be
removed by the bifunctional DNA glycosylase-lyases, also called the DEMETER-like DNA
demethylases. In Arabidopsis, active DNA demethylation plays a critical role in maternal
imprinting and endosperm demethylation, but none of these functions appear to be essential for
the development in this species.
Tomato is the main model to study the development and ripening process of climacteric
fleshy fruit. Recent studies have now shown that the development and ripening of fleshy fruits
relies on the establishment and maintenance of differential transcription patterns and complex
regulatory pathways that involve both genetic and hormonal controls are operating at these
developmental phases. However, it appears that a full understanding of fruit development and
ripening will not be achieved based only on genetic models as suggested by recent studies,
showing an important decrease in global methylation level and demethylation at specific
pormoters during fruit ripening.
In order to analyze the molecular mechanisms responsible for the loss of methylation
observed during tomato fruit ripening, the present project focuses on the functional analysis the
tomato enzymes involved in the active demethylation of genomic DNA. To achieve this goal,
after characterizing the gene family encoding the tomato DNA demethylases, transgenic tomato
plants impaired in the expression of SlDML genes have been generated. These plants present
several developmental alterations, including inhibition of fruit ripening, modifications of flower,
fruit and leaf shape. Using these plants, we have demonstrated that active DNA demethylation is
an absolute requirement for tomato fruit ripening to occur. We show a direct cause and effect
relationship between active DNA demethylation mainly mediated by one tomato DML, SlDML2,
and fruit ripening. RNAi SlDML2 knockdown results in ripening inhibition via hypermethylation
and repression of the expression of genes encoding ripening transcription factors and rate-
limiting enzymes of key biochemical processes. In an attempt to study the SlDML protein
activity a recombinant tomato DNA glycosylase-lyases have been produced. In addition, to
investigate whether hypermethylated epialleles generated in the transgenic plants can be inherited
after the transgene has been lost by segregation, the stability across generations of the
developmental alterations affecting flower as well as leaf development was studied.
To identify the global effect of active DNA demethylation on fruit ripening, we have
compared the transcriptome and metabolome of RNAi DML plants and WT controls. This
demonstrated that multiple aspects of the fruit ripening processes are affected when DNA

Summary
II
demethylation was impaired. Furthermore, we combined differentially methylation regions
determined in Ailsa Craig which allow us identify a number of potential targets for active DNA
demethylation. Validation of this analysis will now require determining the fruit methylome of
the plants impaired in active DNA demethylation.

Appendix
I
Acknowledgement ......................................................................................................................... I
Summary .......................................................................................................................................II
List of Figure ............................................................................................................................... VI
Chapter 1 ....................................................................................................................................... 1
Introduction ................................................................................................................................... 1
I. Background: Definition of epigenetics. ................................................................................... 1
1.1 Epigenetic marks ............................................................................................................ 2
1.1.1 DNA methylation................................................................................................ 2
1.2 Histone posttranslational modifications........................................................................ 4
2. Genome-wide distribution of methylcytosines ....................................................................... 5
II. Mechanism of DNA methylation ............................................................................................ 8
2.1 Enzymes involved in DNA methylation in mammals. ................................................ 8
2.2 Enzymes involved in DNA methylation in plants........................................................ 8
2.2.1 Maintenance of DNA methylation in plants ..................................................... 9
2.2.2 De novo DNA methylation in plants ................................................................. 9
2.3 Functions of DNA methylation in plants .................................................................... 11
2.3.1 Cytosine DNA methylation plays different roles during plant development 11
2.3.2 DNA methylation under environmental stress ................................................ 14
III. DNA demethylation in plants .............................................................................................. 16
3.1 Passive DNA demethylation in plants ........................................................................ 16
3.2 Active DNA demethylation in plants .......................................................................... 16
3.2.1 Enzymes involved in DNA demethylation in plants ...................................... 16
3.2.2 Machinery of active DNA demethylation in plants ........................................ 16
3.3 Function of active DNA demethylation in plants....................................................... 19
3.3.1 Active DNA demethylation controls gene imprinting in the endosperm ...... 19
3.3.2 Other functions of active DNA demethylation in plant ................................. 20
IV. The importance to screen epialleles in plants ..................................................................... 23
V. Physiological changes during tomato fruit ripening........................................................... 24
5.1 Tomato fruit softening ................................................................................................. 25
5.2 Ethylene production ..................................................................................................... 26

Appendix
II
5.3 Color change: chlorophyll degradation and carotenoid synthesis ............................. 28
5.4 Primary metabolites changes during tomato fruit ripening ....................................... 29
VI. Role of DNA methylation / demethylation during fruit development and ripening ........ 30
VII. Objectives of the work.……………..…………………........………………………….32
Chapter 2 ..................................................................................................................................... 34
Introduction ................................................................................................................................. 34
Part II. Activity test for tomato SlDMLs protein ..................................................................... 60
Part III Study of the inheritance of epialleles in tomato plants after transgene segregation.. 64
Conclusion................................................................................................................................... 67
Chapter 3 ..................................................................................................................................... 69
Introduction ................................................................................................................................. 69
I-Fruit Physiology and four DMLs Repression levels in transgenic fruits ............................. 71
II- Metabolic composition of WT and transgenic fruit ............................................................ 74
2.1 PCA analysis of metabolic compositions allows the separation of WT and transgenic
fruits during ripening ....................................................................................................................... ...76
2.2 Sugars, organic acids and amino acids, pigments show different accumulation pattern
in WT and transgenic fruits ........................................................................................................ 78
2.2.1 Accumulation of sugars .................................................................................... 81
2.2.2 Accumulation of amino acids .......................................................................... 81
2.2.3 Accumulation of organic acids ........................................................................ 81
2.2.4 Accumulation of pigments ............................................................................... 82
2.3 Network analysis indicates that RNAi DML transgenic fruits display higher
network density than WT ........................................................................................................... 82
III. RNA seq analysis WT and RNAi Transgenic Lines .......................................................... 85
3.1. Summary of RNA seq data ......................................................................................... 85
3.2. Differential Gene Expression between WT and transgenic fruits ............................ 85
3.3. Comparative analysis of transgenic and WT fruits. .................................................. 91
3.4. DEGs distribution within in each cluster ................................................................... 94
IV. Analysis of differentially methylated region, in relation to DEGs patterns. .................... 98
4.1. DEGs associated with DMR are distributed among all clusters and groups ........... 98

Appendix
III
4.2 Expression pattern of genes of the carotenoid biosynthesis pathway and association
with differentially methylated regions. ................................................................................... 103
4.3 A number of Transcriptional factors from different families are associated with
Differentially methylated regions ............................................................................................ 106
4.4 Genes Encoding Cell Wall–Biosynthesis and Modifying Protein are potentially
regulated by demethylation ...................................................................................................... 110
4.5 Genes involved in Ethylene biosynthesis, Perception and response ....................... 113
4.6 Other Hormone Biosynthesis and Responses in DML RNAi transgenic fruits ..... 116
4.7 DMLs may interact with other Epigenetic regulators in tomato fruits ................... 120
V. Conclusion and discussion ................................................................................................. 122
5.1 Metabolomic and RNA seq data show that DNA methylation affect multiple aspects
of fruit ripening ......................................................................................................................... 122
5.1.1-Mainly fruit ripening is affected .................................................................... 122
5.1.2-Effects on primary metabolites are complex ................................................ 123
5.1.3-Inhibition of carotenoid results from the repression of genes of the
carotenoid pathway........................................................................................................... 124
5.1.4 Cell wall .......................................................................................................... 124
5.2 Many genes with impaired regulation in transgenic fruits are not associated with
specific DMRs .......................................................................................................................... 125
5.3 Demethylation might not be strictly associated with gene induction during fruit
ripening. ..................................................................................................................................... 126
5.4 Some DEGs are associated with an increase in DNA methylation during fruit
ripening.……………………………………………………...…………………………….128
5.5 Active DNA methylation: a more general model………………………………...128
Conclusion................................................................................................................................. 130
Chapter 4 ................................................................................................................................... 141
Discussion ................................................................................................................................. 141
Materials and methods.............................................................................................................. 149
Chapter1_ Reference ................................................................................................................ 156
Chapter 2_ Reference ............................................................................................................... 164
Chapter 3_Reference ................................................................................................................ 165

Appendix
IV
List of Figures
Fig 1. 1 Genome-wide methylation levels for different cytosine context (CG, CHG, and
CHH) in different planant species. ...................................................................................... 3
Fig 1. 2 Structure of a nucleosome. ............................................................................................. 4
Fig 1.3 N termini and C termini of the core histones and their residue-specific epigenetic
modifications at four-nucleosome core histones. ............................................................... 5
Fig 1. 4 Epigenome organization in Arabidopsis and maize. ................................................... 7
Fig 1. 5 Association of DNA cytosine methylation, TE density, small RNA and gene
expression in tomato............................................................................................................. 7
Fig 1. 6 Mechanism of RdDM in plant. .................................................................................... 10
Fig 1. 7 Genes with DNA methylation variations during Arabidopsis floral development. .. 13
Fig 1. 8 Active DNA demethylation through direct base excision repair pathway in plants 17
Fig 1. 9 Working model for the IDM1-IDM2-IDL1-MBD7 complex functioning in ROS1
mediated active ................................................................................................................... 19
Fig 1. 10 Phenotypic of epidermal patterning in the ros1 and rdd mutants and and promoter
DNA methylation of EPF2 in Arabidopsis. ...................................................................... 22
Fig 1. 11 Natural epimutant of Linaria vulgaris fowers and tomato CNR. ............................. 24
Fig 1. 12 Overview of ripening regulation in tomato fruits. ................................................... 25
Fig 1. 13 Simplified scheme showing ethylene biosynthesis and response ........................... 27
Fig 1. 14 Different types of fruit peel pigment patterns in ‘Honeycrisp’ apple and
Methylation levels in ‘Honeycrisp’ evaluated using bisulfite sequencing...................... 31
Fig 2. 1 Structures of SlDML protein and its Arabidopsis homologous proteins.. ................ 60
Fig 2. 2 Structures of SlDML2 proteins along with their truncated versions used in this study
............................................................................................................................................. 61
Fig 2. 3 Cloning vector and expression vector used in this study .......................................... 61
Fig 2. 4 SlDML2- full leng, SlDML3-full length and SlDML2-845 expression and purify
test........................................................................................................................................ 62
Fig 2. 5 Mechanism of DNA demethylase incision assays (ref) and the acitivity test on
SlDML2-845, SlDML2-962 and MspI. ............................................................................ 63
Fig 2. 6 Fruit phenotype of azygous and other defects on line 1 and line 2 as well as process
of screening T4 generation of line 2 and line 1 ................................................................ 65
Fig 2. 7 Phenotype of RNAi DML transgenic plants lose transgenic .................................... 66
Appendix
V
Fig 3. 1 Phenotypes of tomato DML RNAi fruits and DML expression patterns .................. 73
Fig 3. 2 Characterization of metabolite content in WT1 and in transgenic RNAi fruits... .... 75
Fig 3. 3 Principal component analysis of metabolic profiles of WT1 and line 2 fruits during
development and ripening. ................................................................................................. 77
Fig 3. 4 Clustering of metabolic profiles in WT1 and line 2Y fruits during fruit development,
ripening and later stages. .................................................................................................... 79
Fig 3. 5 Significant metabolite changes in WT1 and line2 tomato fruits (A) and other
metabolites that were measured in this study(B). ............................................................. 80
Fig 3. 6 Metabolite network of correlations in WT fruit and DML2 fruit. ............................. 84
Fig 3. 7 Relationship of tomato fruit pericarp related transcript expression profiles and
differentially expressed genes............................................................................................ 87
Fig 3. 8 Difference of DEGs numbers at different stages and venne diagramm of commone
DEGs between Line 2Y, Line2X and Line 8. ................................................................... 90
Fig 3. 9 Principal component analysis of RNA seq data and DEGs profiles of WT1 and line
2 fruits during development, ripening and later stages. ................................................... 92
Fig 3. 10 clusters of DEGs between WT1 and line 2Y ............................................................ 93
Fig 3. 11 Enrichment of DEGs in each group. Gene numbers in each category were
overrepresented. .................................................................................................................. 95
Fig 3. 12 PCA of all DE genes in three groups onto the 1/2 subspace with Log2FC of
Line2Y/WT. ...................................................................................................................... 102
Fig 3. 13 Expression of genes of the Carotenoid pathway in RNAi DML transgenic fruit
compared to WT. .............................................................................................................. 105
Fig 3. 14 DEG with DMR encoding Transcription factor that were repressed at least at one
stage in transgenic fruit. ................................................................................................... 108
Fig 3. 15 Profile of DEGs involved in cell wall metabolism and fruit firmess .................... 112
Fig 3. 16. Profile of Ethylene-related DEGs. .......................................................................... 115
Fig 3. 17 Profile of hormone related DE genes.. .................................................................... 118
Fig 3. 18 DEGs corresponding to genes involved in DNA demethylation, DNA methylation,
histone modification.. ....................................................................................................... 121
Fig3. 19. Proposed model of fruit ripening regulation. .. ....................................................... 129
Fig 3.S 1 Characterization of metabolite content in WT1 and in transgenic RNAi fruits Line
2Y/2X ................................................................................................................................ 131
Fig 3.S 2 Characterization of metabolite content in WT2 and in transgenic RNAi fruits
Line 8................................................................................................................................. 132

Appendix
VI
Fig 3.S 3 Principal component analysis of metabolic profiles of WT2 and line 8 fruits
during development and ripening. ................................................................................... 133
Fig 3.S 4 Metabolite network of correlations in WT fruit and DML2 fruit. ........................ 134
Fig 3.S 5 Row counts control in each tissue. ........................................................................ 135
Fig 3.S 6 Relationship of tomato fruit pericarp related transcript expression profiles and
differentially expressed genes .......................................................................................... 136
Fig 3.S 7 Principal component analysis of RNA seq data and DEGs profiles of WT2 and
line 8 fruits during development, ripening and later stages. .......................................... 137
Fig 3.S 8 Expression of genes of the Carotenoid pathway in RNAi DML transgenic fruit
compared to WT. .............................................................................................................. 138
Fig 3.S 9 Profile of DEGs involved in cell wall metabolism and fruit firmess .................... 139
Fig 3.S 10 Profile of Ethylene-related DEGs in line 8. ......................................................... 140
List of Tables
Table 1. DEGs distribuation and DMRs type in each cluster and group. ................... ............95
Table 2. Enrichment of MapMan functional categories (BINs) in the DEGs associated with
type-a DMR in group 1, 2 and 3 ...................................................................................... 101
Table 3. DEGs with DMR that labeled with selected genes in Line 2Y ............................... 102
Table 4 Transcription factor with DMR as top expressed genes and RIN target genes with
DMR. ................................................................................................................................. 109
List of Supplementary Tables (provided as additional excel file online)
Table S1. Significent correlations in different WT and lines…………………………….......
TabeS2. Reads obtained by RNA seq after clean and mapped percentage for all the genotype
and three replicates…………………………………………………………………………………..
TableS3. Differentially expressed genes that only found in Line 2 (TableS3_1) or Line 8
(TableS3_2 ) and DEGs that specific differentially expressed at 46dpa (TableS3_3)……………..
TableS4. Enrichment of MapMan functional categories (BINs) in the common DEGs………
TableS5. All differentially expressed Transcription Factors of common DEG……………….
TableS6. All differentially expressed cell wall related genes in group 1 and group 2 and 3….
TableS7. All differentially expressed genes of other hormones……………………………….

Appendix
VII
TableS8. All differentially expressed genes involved in amino acids and Nitrite metabolism...
TableS9. The ratio of all differentially expressed genes with DNA methylation level……......

Chapter 1
Chapter1_General Introduction
DNA methylation in plants

Chapter 1
1
Chapter 1
Introduction
The introduction part of this manuscript is a review of the current state of the art concerning
epigenetic in plant. All epigenetic mechanisms are not detailed, and the following text mainly
focuses on DNA methylation and demethylation. Histone post-translational modifications (HPTMs)
are also briefly considered, because cross-talks have been described between DNA methylation
and HPMTs, leading to specific combinations of epigenetic marks along the genome, as revealed
by genome-wide studies (Roudier et al., 2011). The introduction part is organized into six sections.
Part I of chapter I presents general notions about epigenetic marks and how they are distributed
along plant genomes. Part II and III ofchapter I focus on DNA methylation and demethylation,
including the description of the various components controlling these epigenetic modifications, as
well as their biological functions; (II: Mechanism of DNA methylation; III: DNA demethylation
in plants); PartIV of chapter I is a brief summary of the importance of epialleles in plants; Part V
of Chapter I introduces tomato fruit development nd ripening and related physiological changes;
Part VI summarizes the current knowledge of the role of DNA methylation / demethylation during
fruit development and ripening when the work presented here was started.
I. Background: Definition of epigenetics
The definition of the term "epigenetics" has evolved over time. In the early 1940s, epigenetics
was first defined by Conard Waddington as “the branch of biology which studies the causal
interactions between genes and their products which bring the phenotype into being” (Waddintton,
1942; 1968). In other words, here epigenetics designs all molecular processes controlling “the
expression of a genotype into a particular phenotype” (Dupont et al., 2009). Obviously, this
definition is broad and not precise. It includes many different mechanisms that can modulate
phenotype such as post transcriptional regulation, non-coding RNA regulation, (Holoch and
Moazed 2015). Since that time, epigenetics has been redefined several times, becoming more and
more specific and precise. By the middle 1990s, it has turned from causal interactions between
genes and their products to chromosomal modifications that had the potential to modify gene
expression during development. But today epigenetics is commonly used to precisely mean “the
study of mitotically and/or meiotically heritable changes in patterns of gene expression that occur
without alterations in DNA sequence” (Iwasaki and Paszkowski 2014). This definition is still
evolving and was recently suggested to also include stable marks that although not heritable may
lead to stable alteration of the transcriptional programing of specific cells (Avramova 2015) as
indicated by the roadmap consortium of epigenomics
(http://www.roadmapepigenomics.org/overview).
At present, it is widely accepted that posttranslational histone modifications, DNA
methylation and certain non-coding RNA-mediated epigenetic regulations (Holoch and Moazed
2015) constitute epigenetic mechanisms which are critically important in modulating the structure

Chapter 1
2
of chromatin. Chromatin, which is only found in eukaryotic cells, designs a complex and organized
structure made of proteins, DNA and RNA. The structural unit of chromatin, the nucleosome,
consists of 146 bp of DNA wrapped around a protein core made of 4 histones dimers. The
chromatin allows the organization and compaction of the genetic material into the nucleus. Along
each chromosome, chromatin is organized into transcriptionally active less condensed euchromatin,
and transcriptionally inactive highly condensed heterochromatin. But chromatin structure is highly
dynamic, and may undergo changes during development or in response to environmental signals.
Because epigenetic mechanisms govern these modifications in chromatin structure, they impact
DNA accessibility for all DNA-template processes including gene transcription (Lauria and Rossi
2011), DNA recombination (Choi and Henderson 2015) and transposition (Mirouze and Vitte
2014). In the following text, only the role of epigenetic regulations in gene expression is described,
the other processes using DNA as a template are not discussed.
The epigenetic regulation of the genome activity relies on different mechanisms. Some of
these mechanisms involve chromatin modifiers, which are responsible for covalent modifications
in chromatin, including DNA methylation, and histone post-translational modifications (HPTMs),
the so-called epigenetic marks. Other epigenetic mechanisms involve chromatin remodelers, which
non-covalently modify chromatin structure by changing the nucleosome position, destabilizing
nucleosomes, or substituting histone variants to the canonical histones. Both chromatin modifiers
and chromatin remodelers usually function in concert, to modify chromatin structure.
1.1 Epigenetic marks
Two types of epigenetic marks have been described, DNA methylation and histone post-
translational modifications corresponding both to covalent modifications, affecting respectively the
DNA molecules, and the different histone proteins.
1.1.1 DNA methylation
Although DNA covalent modifications have been described since 1948, it was first suggested
that these modifications may modulate gene expression much later in 1969 (Hotchkiss
1948;Griffith and Mahler 1969). DNA methylation refers to the addition of a methyl group to the
fifth position of the cytosine ring. This covalent modification is found in procaryotes (Adhikari and
Curtis 2016) and initially existed in most of the eukaryotic including plants, fungi, protists and
animals (Zemach et al., 2013). But it appears that the ability to methylate DNA was lost in some
organisms. For example, the genomes of the budding yeast Saccharomyces cerevisiae and of the
nematode worm Caenorhabditis elegans do not contain methylated cytosine (Colot and Rossignol
1999). DNA methylation is considered as a very stable mark that is maintained by well described
mechanisms (Law and Jacobsen 2010; Matzke and Mosher 2014;) and which can be removed by a
variety of mechanisms depending on the organism considered (Piccolo and Fisher ;Chinnusamy
and Zhu 2009;Kohli and Zhang 2013). Recently, another pattern of DNA modification, DNA
hydroxymethylation was only found in mammals and was shown to be an intermediate to DNA
demethylation. In addition, 5-hydroxymethylcytidine (5hmC) is also though to play regulatory
roles in gene expression (Song and Pfeifer, 2016). More recently, DNA N6-adenine methylation
(6mA) was also proposed to become a new epigenetic mark in eukaryotes although it is detected
Chapter 1
3
at very low amount. The possible regulatory function of 6mA mark was reviewed by Luo et al
(2015) (Luo et al., 2015).
In mammals, DNA methylation mainly happens in the symmetrical CpG context, which
occupies approximate 70-80% of CG throughout the genome (Law and Jacobsen 2010). However,
recent publications have described that DNA methylation in non CG context (mCH) was also
observed in embryonic stem cells, and adult mammalian somatic cells, such as mammalian brain
cells. Genome wide methylomes show that the content of mCH in fetal brain cells is very low, but
abundant in human adult brain tissue. This increase in mCH is correlated with tissue-specific
functions (Pinney 2014;Schultz et al., 2015). This suggests that, in addition to mCG that plays
major roles in mammals development, mCH appears to have important functions during the
formation of specific tissues. In plants, the cytosine methylation patterns are distinct: cytosine
methylation can occur in all sequence contexts, in CG, CHG symmetrical contexts, and in non-
symmetrical CHH context (where H=A, T or C). The distribution of mC between the different
sequence contexts varies between plants. For example, in Arabidopsis methylation occurs
predominantly at the CG context (CG:55%; CHG:23%; CHH:22%) (Zhang et al., 2006;Lister et
al., 2008), whereas Zhong et al (2013) found that in tomato, CHH is the major context for mC
(CG:28%; CHG:23%; CHH:49%) (Zhong et al., 2013). However in most plants, the methylation
level in CG context is always higher than in CHG and CHH contexts (calculated as the number of
methylated sites over the total number of sites in a genome, i.e., mCG/total CG sites). This indicates
that methylation predominantly occurs in CG context compared with other contexts. For example,
Niederhuth et al (2016) found that mCG is always the highest among the three cytosine contexts
by comparing 34 different angiosperm species, although there is a large variation in methylation
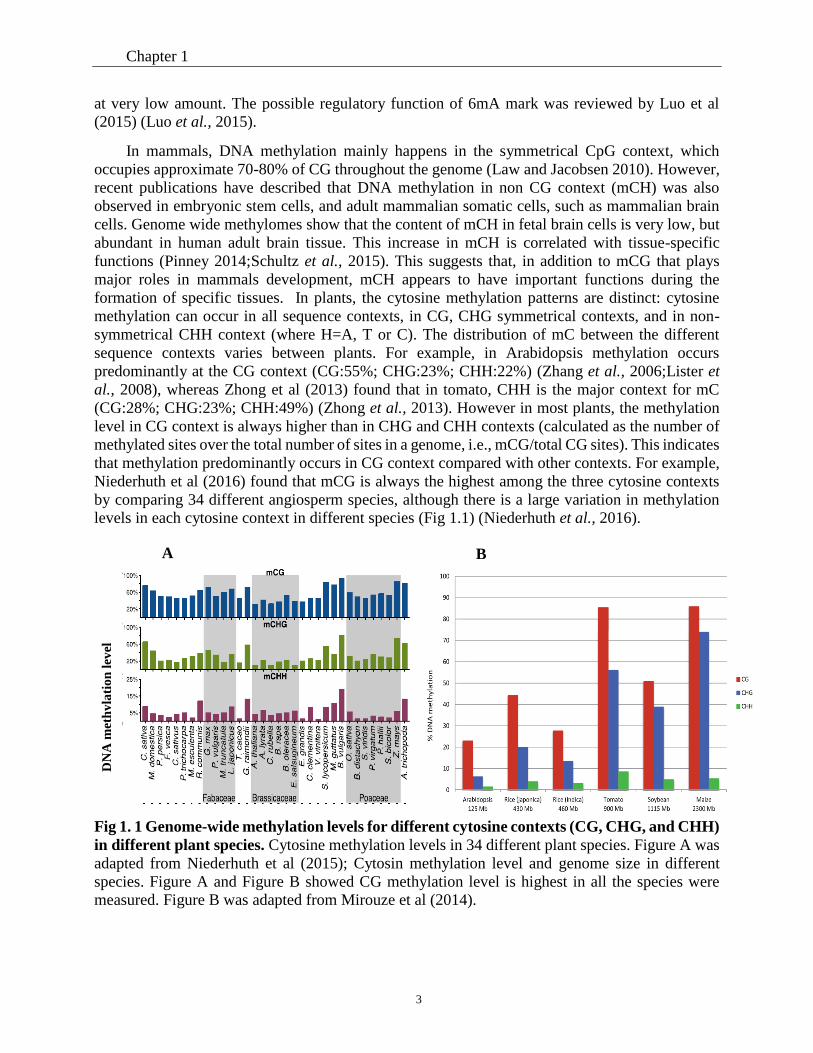
levels in each cytosine context in different species (Fig 1.1) (Niederhuth et al., 2016).
Fig 1. 1 Genome-wide methylation levels for different cytosine contexts (CG, CHG, and CHH)
in different plant species. Cytosine methylation levels in 34 different plant species. Figure A was
adapted from Niederhuth et al (2015); Cytosin methylation level and genome size in different
species. Figure A and Figure B showed CG methylation level is highest in all the species were
measured. Figure B was adapted from Mirouze et al (2014).
B
DN
A m
eth
yla
tio
n l
evel
A

Chapter 1
4
1.2 Histone posttranslational modifications
Histones are basic proteins that are essential for the packaging of DNA into chromatin. The
nucleosome, which is the structural chromatin unit, consists of 146 bp of DNA wrapped around an
octameric histone core made of 4 histones dimers. Among the five major families of histones that
have been described H2A, H2B, H3 and H4 are the core histone proteins, while H1 is known as
the linker histone (Fig 1.2) (Luger et al., 1997;Georgopoulos 2002).
Fig 1. 2 Structure of a nucleosome. The assembly of DNA into a compact structure termed
chromatin is essential for packaging the genome into the cell nucleus. Å: angstroms. Figure was
adapted from Georgopoulos (2002).
Histone posttranslational modifications (HPTMs) include acetylation, methylation,
phosphorylation, sumoylation as well as ubiquitination and occur at amino acid residues (lysines,
histidine, etc) located mainly in the amino terminal tail of histone that protrudes from the
nucleosome (Fig 1.3). The Histone PTM’s diversity is multiplied by the fact that different amino
acid residues can be modified in each single histone, and that some modifications occur at various
levels. For example, the lysine K4 of histone H3 may be mono-, di-, or tri-methylated. Histone
marks are associated with either activation or repression of gene transcription. For example
histones H3 and H4 acetylation, and histone H3 methylation of lysine K4 are associated with gene
activation(for a review, see (Lauria and Rossi 2011)). HPTM can affect chromatin structure in two
different ways (Bowman and Poirier 2015). First all marks except methylation modify the net
charge of the histones, and might alter the interactions between nucleosomes or between DNA and
histones within a single nucleosome. For example … Second, HPTMs constitute signals that are
read by other proteins, often organized as protein complexes, able to influence chromatin structure,
or to directly regulate gene expression. Indeed the signal recognized by these regulatory proteins
may correspond to individual marks, or to a combination of different HPTMs. The information

Chapter 1
5
provided by the HPTMs constitutes the so-called histone code whose existence was first postulated
by Jenuwein and Allis (Jenuwein and Allis 2001).
Fig 1.3 N termini and C termini of the core histones and their residue-specific epigenetic
modifications at four nucleosome core histones. H2A, H2B, H3 and H4 represent four-
nucleosome histones. Different shapes with letters represent different histone marks as indicated.
Figure referenced from Graff et al (2008)
2. Genome-wide distribution of methylcytosines
Whole genome bisulfite-sequencing (WGBS) approaches enable determination of
methylcytosines distribution across the genome at single-nucleotide resolution, revealing the so-
called methylomes (Laird PW 2010).
In mammals, DNA methylation is spread over the entire genome, with the exception of dense
clusters known as CpG islands often found near gene promoters (Pinney 2014)).
In plants, a majority of DNA methylation occurs at transposable elements (TE) and repetitive
sequences that are clustered in heterochromatin in centromeric, and pericentromeric regions, but
that may also be found in euchromatin (Chan et al., 2005). TEs and other repeats are methylated in
all possible contexts (CG, CHG and CHH), and this methylation has been shown to be essential for
the repression of transposons transcription and mobility. The genome wide profiling of the
Arabidopsis methylome has also shown that the methylation pattern of genes is complex and can
be located in various part of genes (Zhang et al., 2006). Hence, in Arabidopsis, 61.5% of the genes
were entirely unmethylated. When present DNA methylation can occur either in the promoter
region (5.2% of the Arabidopsis genes) and/or gene bodies (33.3% of the genes). Promoter
methylation was associated with genes presenting differential expression pattern, whereas gene
body methylation, which is mainly restricted to CGs, is prevalent in constitutively expressed genes
with moderate to high transcription level. Hence unlike methylation at transposons, CG

Chapter 1
6
methylation in gene bodies does not seem to cause silencing (Lister et al., 2008). Furthermore in
met1 mutants, which lack virtually all CGs methylation (see below), the expression of body-
methylated genes did not appear to be systematically increased when compared to unmethylated
genes (Zhang et al., 2006; Law and Jacobsen 2010). Indeed the function of body methylation in
plants remains to be further investigated (For a review, see Bewick et al (2017)).
The methylomes of an increasing number of plant species are now being described, revealing
that these large-scale patterns of methylation first described for Arabidopsis are shared among
flowering plants, but some differences also exist (Springer et al., 2016). For example, whereas in
Arabidopsis intergenic regions are mostly short and devoid of methylation, this is not true for rice
or maize where these regions are dominated by transposons and methylated (Fig 1.4 ) (Springer et
al., 2016). Other differences are related to the repartition of the methylation in the 3 different
sequence contexts. For example, in Arabidopis CHG and CHH methylation often occur together
and are mostly located at transposons together with CG methylation, but this is not the case in
species such as rice, maize or tomato. In maize, where the genome-wide CHH methylation levels
are quite low, most transposons lack elevated CHH methylation (West 2014). The analysis of the
maize methylome furthermore revealed limited regions often located close to genes, characterized
with high CHH methylation and low level of CG and CHG methylation (Gent et al., 2013). Li et
al (2015) raised the hypothesis that these so-called CHH islands may act as epigenetic insulators,
preserving the silencing of transposons from activity of nearby genes (Gent et al., 2013;Li et al.,
2015a). In rice, CHH methylation is mainly located in euchromatic regions where it essentially
targets small TE such as miniature inverted transposable elements (MITEs), which are located with
high frequency at the 5’ and 3’ end of protein-coding genes (Zemach et al., 2010). The analysis of
tomato methylomes also revealed such enrichment in CHH methylation in the 5’ regions of genes,
associated with MITEs (Zhong et al., 2013), although in tomato there is also a substantial level of
CG and CHG methylation in the same regions (Fig 1.5). Interestingly two recent studies in maize
have shown the association between the insertion of a MITE in the promoter region of the
Vegetative to generative transition 1 (Vgt1), a specific regulatory gene and a characteristic trait,
early flowering time (Castelletti et al., 2014) or drought tolerance (Mao et al., 2015). In both case
a correlation has been established between the presence of the MITE in the promoter, an increase
in promoter CHH methylation, and a decrease in gene expression, suggesting that TE insertion can
influence neighboring genes expression via an effect on the chromatin state of their promoter
regions. Another difference concerns gene body methylation, whereas rice and Arabidopsis
correspond only to CG methylation, however, in maize, it also contains CHG methylation .
Chapter 1
7
Fig 1. 4 Epigenome organization in Arabidopsis and maize. The organization of genes (green)
and TEs (pink), the relative abundance of three chromatin modifications, CHG DNA methylation
(red), CHH DNA methylation (black), and H3K9me2 methylation (blue). Figure is adapted from
Springer et al (2016).
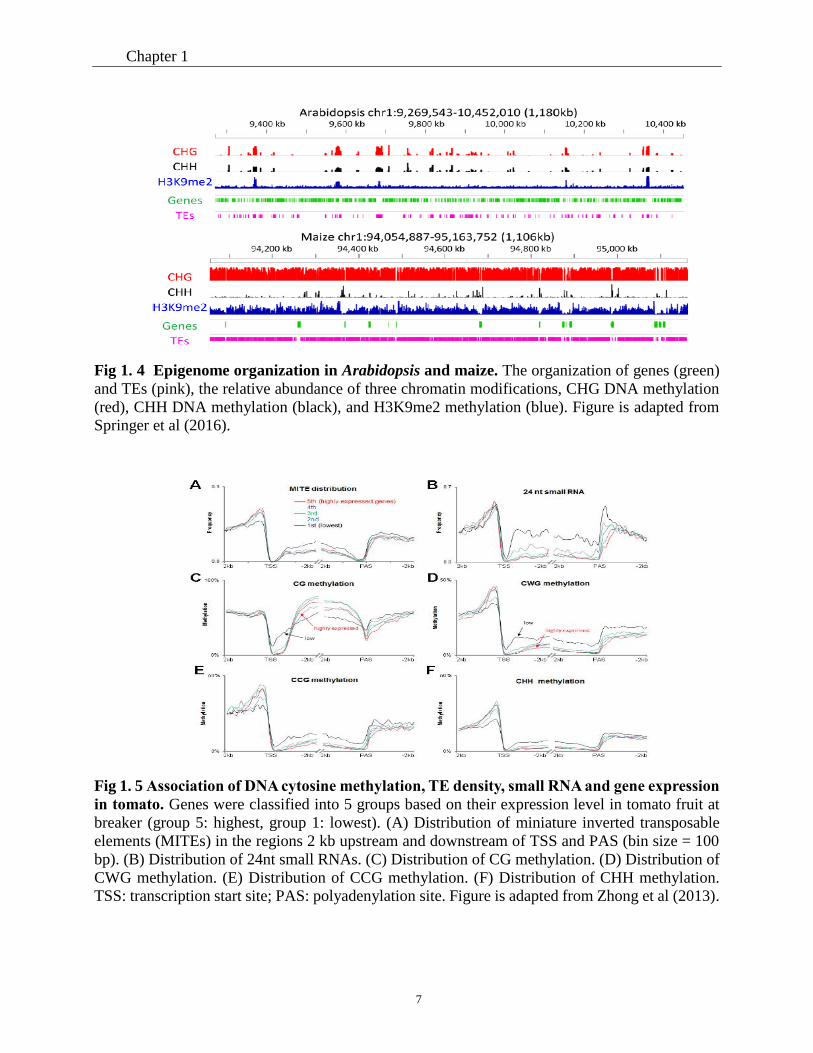
Fig 1. 5 Association of DNA cytosine methylation, TE density, small RNA and gene expression
in tomato. Genes were classified into 5 groups based on their expression level in tomato fruit at
breaker (group 5: highest, group 1: lowest). (A) Distribution of miniature inverted transposable
elements (MITEs) in the regions 2 kb upstream and downstream of TSS and PAS (bin size = 100
bp). (B) Distribution of 24nt small RNAs. (C) Distribution of CG methylation. (D) Distribution of
CWG methylation. (E) Distribution of CCG methylation. (F) Distribution of CHH methylation.
TSS: transcription start site; PAS: polyadenylation site. Figure is adapted from Zhong et al (2013).

Chapter 1
8
II. Mechanism of DNA methylation
DNA methylation is catalyzed by enzymes called DNA methyltransferases (DMTs). Different
DMTs have been characterized in both mammals and plants, which are involved, either in
maintenance of DNA methylation during cell divisions, or in the establishment of new DNA
methylation patterns (the so called de novo methylation)
2.1 Enzymes involved in DNA methylation in mammals.
Maintenance of DNA methylation in mammals
In mammals four DNA methyltransferases (DNMTs) have been characterized that are highly
conserved. DNMT1 maintains DNA methylation at hemi-methylated DNA after DNA replication
during cell division. It is the most abundant DNMTs in adult cells. DNMT3A and NNMT3B are
involved in establishing de novo DNA methylation, as they don’t require hemi-methylated DNA
to bind. DNMT3-like (DNMT3L) is another member of the DNMT3 family, but it has no
enzymatic activity by itself. This enzyme binds to DNMT3A or DNMT3B and enhances their
catalytic activity (Pinney 2014). In mammals, DNMT1 is the principal enzyme that can mediate
the maintenance of CG methylation. This enzyme is required for embryonic development and
survival of somatic cells in mice. It has been well summarized that DNMT1 doesn’t work alone,
but work with some accessory proteins. For example, ubiquitin like PHD and RING finger 1
(UHRF1) were recently shown to be key regulators for maintenance of DNA methylation. The
uhrf1 mutant is indeed characterized by a severe decrease in DNA methylation. The current model
for UHFR1 action is as follows: UHRF1 recognizes hemi-methylated DNA via its SET and RING-
associated (SRA) domains and H3K9me3 via its TUDOR and PHD domains; UHFR1 ubiquitylates
H3K23/H3K18 to facilitate the environment for DNMT1 binding. Then DNMT1 binds
ubiquitylated H3K23 inducing a conformational change in DNMT1 which promotes its activation
(Nishiyama et al., 2016). In addition, UHRF1 interacts with DNMT3A and DNMT3B, which
suggests a role for UHRF1 in de novo methylation. Maintenance of DNA methylation also requires
the chromatin remodeling factor Lymphoid Specific Helicase1, but the precise role of LSH1 in
DNA methylation remains unknown (Nishiyama et al., 2016).
2.2 Enzymes involved in DNA methylation in plants.
In plants, four DNA methyltransferase classes have been characterized. DNA
methyltransferase 1 (MET1) which is the homologue of DNMT1 maintains methylation at CG sites.
CHROMOMETHYLASE3 (CMT3) is a plant specific enzyme that maintains CHG methylation
and requires histone H3 methylation at the lysine K9 to be recruited at its target sites (Yang et al.,
2016). De novo DNA methylation in the different sequence contexts is mediated by two enzymes,
one is the homologue of the DNMT3 methyltransferases, DOMAINS REARRANGED
METHYLTRANSFERASE 2 (DRM2) and another one is CMT2 (Matzke, M. A. and R. A. Mosher,
2014).

Chapter 1
9
2.2.1 Maintenance of DNA methylation in plants
It has been well documented that, in plants, MET1 is responsible for CG methylation
maintenance (Kankel, M. W., et al. 2003). The mechanism of maintenance of CG methylation is
highly conserved between plants and mammals. MET1 can’t work alone but requires additional
proteins; recruitment of MET1 at target sites requires two different SRA proteins, VARIANT IN
METHYLATION (VIM) and Decrease in DNA Methylation 1 (DDM1). However, in plants
whether these proteins behave in a similar way as in mammals, needs further validation (Kankel,
M. W., et al. 2003).
CHG methylation is maintained by the plant specific enzyme, CMT3 (chromomethylase 3),
and requires the H3K9 methyltransferases KRYPTONITE (KYP/SUVH4), SUVH5 and SUVH6
(Lindroth et al., 2001). Genome-wide profiling of H3K9Me2 and DNA methylation showed that
these marks are highly correlated (West et al., 2014). CMT3 mutant displayed a dramatic loss of
DNA methylation as also observed in a suvh4 mutant, SUPPRESSOR OF VARIEGATION 3-9
HOMOLOGUE 4 a histone methyltransferase that is largely responsible for H3K9 dimethylation
(Cedar and Bergman 2009;Du et al., 2014). Furthermore, two other H3K9 histone
methyltransferases, SUVH5 and SUVH6 also contribute to global levels of CHG methylation
(Ebbs and Bender 2006). Hence, in Arabidopsis CMT3 is recruited to specific sites by binding
dimethyl K9 histone H3 (H3K9Me2) (Du et al., 2015). Reciprocally, KYP binds CHG methylated
motives through its SRA domain (Johnson et al., 2007) thereby establishing a self-reinforcement
loop between CHG methylation and H3K9 dimethylation.
2.2.2 De novo DNA methylation in plants
In plants, de novo methylation is mediated by RNA directed DNA methylation, a process also
called RdDM (Law and Jacobsen 2010), which is also responsible of maintenance of CHH
methylation. RdDM is mainly dependent on the methyltransferases, DOMAINS REARRANGED
METHYLTRANSFERASE1 (DRM1) and DRM2, and it is always associated with 24nt siRNA,
which direct DNA methylation at their homologous regions (For a review, see(Matzke and Mosher
2014)). Alternatively de novo methylation may rely on the chromatin remodeler DDM1
(DECREASE IN DNA METHYLATION 1), together with the CHROMOMETHYLASE 2
(Zemach et al., 2013;Stroud et al., 2014).
A number of components of the RdDM pathway have been recently identified in Arabidopsis
leading to the proposal of a model for this complex epigenetic mechanism (Fig 1.6) (Gallusci et al.,
2016). RdDM depends on specialized transcriptional machinery and involves at least two steps:
24-nt siRNA biogenesis and siRNA-guided de novo methylation (for a review, see (Matzke and
Mosher 2014;Zhou and Law 2015).

Chapter 1
10
Fig 1. 6 Mechanism of RdDM in plants. RNA transcripts are generated from repetitive sequences
(transposons and others) by an RNA polymerase known as PolI V. RNA-DEPENDENT
RNAPOLYMERASE (RDR) then converts the RNA to double stranded transcripts. These are
processed into 24-nucleotide small RNAs (siRNAs) by DICER-LIKE3 (DCL3). These are
methylated at their ends by HUAENHANCER1 (HEN1) and the guide strand complementary to
the genomic DNA, that will be the target of the RdDM, is incorporated into ARGONAUTE
(AGO4). AGO4 is recruited through interactions with PolV and KOWDOMAIN-CONTAINING
TRANSCRIPTION FACTOR1 (KTF1). RNA-DIRECTEDDNA METHYLATION1 (RDM1)
links AGO4 and DOMAINS REARRANGED METHYLTRANSFERASE2 (DRM2), which
catalyzes de novo methylation of DNA. Figure is adapted from Gallusci et al (2016).
The classic RdDM pathway is initiated by recruitment of Polymerase IV (Pol IV), a plant
specific DNA dependent RNA polymerase to the appropriate regions of the genome, including TEs
and intergenic regions to transcribe a single strand RNA. The recruitment of Pol IV to target
sequences is not fully understood. For a large subset of the RdDM targets, Pol IV recruitment
necessitates a homeodomain protein, SAWADEE HOMEODOMAIN HOMOLOG 1 (SHH1)
which recognizes chromatin enriched with unmethylated H3K4 and H3K9me2 and interacts with
Pol IV (Law et al., 2013;Zhang et al., 2013b). The long single strand RNAs produced by Pol IV
are rapidly converted into double strand RNAs (dsRNAs) by RNA DEPENDENT RNA
POLYMERASE 2 (RDR2). The generation of dsRNAs also involves the putative chromatin
remodeling protein CLASSY 1 (CLSY1), but the role of this factor remains unknown. The dsRNAs
are then processed into 24-nt siRNAs by Dicer-like 3 ribonuclease III enzyme (DCL3). The double-
stranded 24-nt siRNAs are transferred to the cytoplasm and loaded into the Argonaute (AGO)
protein AGO4 to form a silencing complex. The silencing complex is transferred back to the
nucleus with the help of AGO4, and siRNAs are targeted back to DNA repeats through sequence
homology.

Chapter 1
11
The siRNA-guided de novo methylation requires then another plant-specific DNA-dependent
RNA polymerase, Pol V, and some associated factors. Pol V generates long intergenic non coding
RNAs from target loci. The AGO-loaded siRNAs pair with this Pol V scaffold RNAs, and recruit
the de novo DNA methyltransferase DOMAINS REARRANGED METHYLTRANSFERASE 2
(DRM2) which catalyzes de novo DNA methylation at the target locus. Pol V transcription and
association with chromatin are facilitated by the DDR complex. This complex comprises the
putative chromatin remodeler DEFECTIVE IN RNA-DIRECTED DNA METHYLATION 1
(DRD1), DEFECTIVE IN MERISTEM SILENCING 3 (DMS3), and RNA-DIRECTED DNA
METHYLATION 1 (RDM1), which has been shown to interact with both AGO4 and DRM2, and
to bind to methylated single-stranded DNA. Some other RdDM components may also be needed
to complete this process, including some histone-modifying enzymes that remove active marks.
Recently, alternative RdDM pathways have been suggested. For example Yang et al (2016)
found that the majority of the RdDM loci don’t require DCL proteins and 24nt siRNA, but rather
25-50 nt RNAs Pol IV-dependent small RNAs (P4 RNAs,) that may act as trigger RNAs to initiate
DNA methylation following the RdDM pathway (Yang et al., 2016).
RdDM has been shown to be inhibited by heterochromatin, which is enriched in larger
transposons. Furthermore lack of DRM2 causes a relatively modest decrease in CHH methylation,
demonstrating that the majority of CHH methylation does not depend on RdDM. Indeed most CHH
methylation at heterochromatic sequences is mediated by another pathway, requiring the
chromomethylase CMT2 and DDM1 and depending on linker histone H1 (Zemach et al., 2013).
In Arabidopsis both the DDM1/CMT2 and the RdDM/DRD1 pathways mediate nearly all
transposon CHH methylation. Hence both pathways act together to inhibit transposon mobility.
But this scheme may not be valid in all plant species. For example in rice, the Osdrm2 mutation
was shown to lead to a near complete loss of CHH methylation (Tan et al., 2016). Hence, in rice,
almost all CHH methylation seems to be established by OsDRM2. Furthermore OsDDM1 is
required for the facilitation of OsDRM2-mediated CHH methylation. These results suggest that de
novo DNA methylation though mediated by similar pathways, can vary between plant species (Tan
et al., 2016).
2.3 Functions of DNA methylation in plants
In eukaryotes, cytosine DNA methylation is a conserved and stable epigenetic mark that plays
essential roles in the silencing of transposable elements (TEs) and genes (Law and Jacobsen 2010).
A number of articles have reviewed that cytosine methylation is critical for diverse biological
process, including the establishment and maintenance of tissue specific gene expression patterns,
genomic imprinting and X chromosome inactivation (Laird PW, 2003; Duymich et al., 2016).
2.3.1 Cytosine DNA methylation plays different roles during plant development
The genome-wide distribution of methylcytosines is subjected to dynamic changes during
development
The distribution of methylcytosines has been analyzed at a genome-wide level in different
plants and developmental contexts, including endosperm development (Hsieh et al., 2009; Zemach

Chapter 1
12
et al., 2010; Lu et al., 2015), male gametophyte development (Slotkin et al., 2009; Borg and Berger
2015), fruit ripening (Zhong et al., 2013), and flower development (Yang et al., 2015) .
These studies show that DNA methylation patterns are modified during plant development.
More precisely, the variations in DNA methylation affect specific regions which are referred to as
differentially methylated regions (DMRs).
Correlations could be established between some DMRs and changes in gene expression, .
However, not all gene-associated DMRs were associated with to variations in gene expression.
This is illustrated for example by the study of Yang et al (2015), who compared different samples
along flower development (meristems, flowers at early and late development stages). Their results
show that methylation variations during flower development are correlated with expression
changes of more than 3000 genes, many of which are important for flower development (Yang et
al., 2015). But many more gene-related DMRs were identified, which were not associated with
differentially expressed genes. For example, from the comparison of meristems with early flowers,
Yang et al (2015) identified 2503 genes associated with changes in promoter methylation. But only
141 among these 2503 genes were differentially expressed (Fig 1.7), clearly revealing that changes
in DNA methylation at gene promoters are not systematically associated with changes in gene
expression (Yang et al., 2015). This analysis also revealed that DMRs were more abundant in gene
body than in promoter, and it seems that part of the DMR localized in gene-body was associated
with differential expression, indicating that the role of gene body methylation in transcription
regulation maybe more important than initially thought.
These results suggest that specific changes in DNA methylation could be important for the
regulation of gene expression in relation to developmental phase change. This hypothesis is further
demonstrated by the analysis of mutants impaired in DNA methylation function. As illustrated in
the following part, through a few examples.
Fig 1. 7 Genes with DNA methylation variations during Arabidopsis floral development.
Comparison of genes differentially methylated at one or more sequence contexts and differentially
expressed between meristem and early flower. ‘Gene Body’ and ‘Promoter’ represent the
transcribed region and the 1 kb upstream region of genes, respectively; ‘Transcription’ represents
genes that are differentially expressed. Figure is taken from Yang et al (2015)
Chapter 1
13
Some mutants impaired in DNA methylation show defects in their development
a- mutants affected in CG methylation
In Arabidopsis, mutations affecting maintenance of CG methylation (met1-1, met1-2, and
met1-3) are recessive (Kankel et al., 2003;Saze et al., 2003). As expected, the plants impaired in
MET1 function (mutants or antisens plants) are characterized by a decrease in CG methylation. The
more affected plants show pleiotropic developmental defects including reduced apical dominance,
smaller plant size, altered leaf size and shape, decreased fertility and altered flowering time
(Finnegan et al., 1996;Jacobsen et al., 2000). The late-flowering phenotype is present in met1
heterozygous Arabidopsis plants, and is even more severe in a met1 homozygote background. This
phenotype is caused by the hypomethylation of the FWA gene, which controls Arabidopsis
flowering time and contains direct-repeats in its promoter (Kankel et al., 2003;Saze et al., 2003) .
The knock out of the gene responsible for CG maintenance has a much more severe impact
on plant development in rice. Mutation affecting the major CG methyltransferase gene, OsMET1-2,
leads to severe defects in seed development and vegetative growth leading to seedlings swift
necrotic death (Hu et al., 2014). This suggests that although DNA methylation in a CG context is
conserved in plants its role during plant development may vary among different plant species.
b- mutants affected in non CG methylation
In Arabidopsis drm1 drm2 double mutants show no morphological defects (Cao and Jacobsen
2002;Kankel et al., 2003), although DRM2 was shown to have an essential function in the
establishment of DNA methylation at genes such as FWA and SUPERMAN (SUP) (Cao and
Jacobsen 2002). Cmt3 mutants also display a wild-type morphology, even though it was found that
CMT3 plays an important role in hypermethylation of the promoter of SUP gene in the CHG
context, in met1 mutants (Lindroth et al., 2001).
On the other hand, drm1drm2cmt3 (ddc) triple mutant plants show pleiotropic effects on plant
development. Interestingly, some of the developmental alterations observed in met1 mutants were
not seen in ddc mutants, as for example, the late flowering phenotype, suggesting that CG and non
CG methylation may control different aspects of plant development (Cao and Jacobsen 2002).
The analysis of rice and maize mutants showed that alteration of DNA methylation in crop
species may have stronger deleterious effects than in Arabidopsis. For example, in rice, knockdown
of OsDRM2 (Moritoh et al., 2012), OsDCL3a (Wei et al., 2014), or OsCMT3 (Cheng et al., 2015)
causes pleiotropic developmental defects, unlike mutation of their respective homologous gene in
Arabidopsis. This suggests DNA methylation in crop plants with complex genome components
may play more important role than in Arabidopsis.
2.3.2 DNA methylation under environmental stress
Environmental stress such as salt, drought and other biotic and abiotic factors represent serious
challenges for plant breeding as they may impact plant growth, as well as yield and product quality.
Recent studies have highlighted the importance of DNA methylation in the regulation of gene

Chapter 1
14
expression under biotic and abiotic responses, and also have suggested that DNA methylation may
play a role in stress memory.
a- Role of DNA methylation in abiotic stress response
Several studies have described changes in DNA methylation patterns in responses to abiotic
stresses. For example, using a methylation-sensitive amplification polymorphism (MSAP)
approach, Gayacharan and Joel (2013) found that under drought stress, drought-susceptible and
drought-tolerant rice genotypes were characterized by different evolutions in DNA methylation
level, which was evaluated as a methylation percentage. Furthermore, they showed that the yield
and panicle weight were negatively correlated with methylation percentage in rice under drought
stress, these changes in DNA methylation correspond to the activation of stress-related
genes(Gayacharan and Joel 2013).
You have other recent articles showing changes in the methylome in response to stress. Other
articles show that rice plants that represent different tolerance to stress have different methylome
consistent with a role of DNA methylation in the adaptation to stress.
b- Role of DNA methylation in stress memory (abiotic stress)
Plants that have experienced a stress become more tolerant to future stressful conditions,
through the acquisition of stress memory. In some cases, this memory is transmitted to the next
generations. The molecular mechanisms underlying the memory of stress and its transgenerational
inheritance are not well understood but some reports suggest that epigenetic mechanisms may be
involved (for reviews, see: (Iwasaki and Paszkowski 2014;Bilichak and Kovalchuk 2016).
Most of the studies arguing for a role of DNA methylation in stress memory are based on the
demonstration of a correlation between changes in DNA methylation and stress tolerance.
In some reports, this correlation was based on the comparison of different generations of
plants submitted or not to stress. As an illustration two studies using rice could be mentioned:
nitrogen deficiency and heavy metal stress were shown to induce modifications in DNA
methylation patterns, which were partly inherited in the following generations. The inheritance of
the modifications was correlated with an enhanced stress tolerance (Kou et al., 2011) (Ou et al.,
2012).
As an alternative, the correlation between changes in DNA methylation and stress tolerance
was demonstrated through the comparison of different genotypes characterized by contrasted levels
of stress tolerance. For example, using an integrated approach combining BS-SEQ and RNA-SEQ,
Garg et al (2015) compared the methylomes of different rice cultivars with contrasted sensitivity
to drought and salinity stress. They identified a high number of differentially methylated regions
(DMR) among the different cultivars and found that the distribution of many of these DMR was
associated with differential expression of genes important for abiotic stress response. Moreover,
smRNA abundance was positively correlated with hypermethylated regions (Garg et al., 2015).
This analysis suggests that long term adaptation of plant to abiotic stress involves modifications in
DNA methylation patterns responsible for the regulation of the expression of a specific set of stress-
responsive genes.
Using a completely different experimental approach, Shen et al (2014) also obtained results
suggesting a role for DNA methylation in long term adaptation. Using a large collection of

Chapter 1
15
Arabidopsis thaliana accessions adapted to a wide range of climactic conditions, they performed a
genome-wide association analysis, in order to identify loci where the alleles tolerate different
climate ranges. Their study revealed that the temperature seasonality is correlated with a specific
allele of the CMT2 gene. The reference WT CMT2 allele is mainly found in species growing in
areas with less seasonal variability in temperatures, whereas the alternative CMT2 allele exists in
both stable and variable regions. Shen et al also demonstrated that Arabidopsis cmt2 mutants
display an increased tolerance to heat-stress. Altogether their results suggest that genetic
modifications responsible for changes in DNA methylation mechanisms (CMT2-related functions)
may participate in natural adaptation to variable temperatures (Shen et al., 2014).
c- Role of DNA methylation in biotic stress response
The modulation of DNA methylation not only appears to be important for abiotic stress
response, but also for biotic stress response. For example, Akimoto et al (2007) found that
experimentally hypomethylated rice was less susceptible to the infection with the pathogen
Xantomonas oryzae pv. oryzae. This enhanced tolerance was correlated with an increase in the
expression of Xa21G coding for the Xa21-like protein, known to confer resistance to X. oryzae pv.
oryzae. The difference in gene expression was associated with a difference in Xa21G promoter
methylation: whereas Xa21G promoter was heavily methylated in the control plants, it was almost
devoid of methylcytosine in the hypomethylated plants. Acquisition of disease resistance, and
promoter hypomethylation were stably inherited, indicating that reprogramming DNA methylation
at some loci is an important mechanism for plant defense (Akimoto et al., 2007).
This hypothesis was confirmed by Dowen et al (2012) in Arabidopsis. Mutants globally
defective in maintenance of CG methylation (met1-3) or non-CG methylation (ddc = drm1-2 drm2-
2 cmt3-11) were exposed to a bacterial pathogen (P. syringae). All mutants showed global DNA
demethylation and an increased resistance to P. syringae. Methylomes were obtained from non-
infected and infected plants, revealing many different DMRs, corresponding both to increase or
decrease in DNA methylation mainly in CG and CHH contexts. Many infection-related DMRs
were associated with differentially expressed genes (DEGs), which were characterized by a strong
enrichment for genes involved in plant defense. Moreover, the DEGs associated with
hypomethylated DMR tended to be constitutively mis-expressed in met1-3 and ddc mutants,
consistent with the increased tolerance of these mutants to P. syringae (Dowen et al., 2012).
III. DNA demethylation in plants
Cytosine methylation of genomic DNA is reversible through DNA demethylation. In plants,
DNA demethylation can be achieved passively, when maintenance of methylation after DNA
replication is not operating, or actively, by replication-independent processes.
3.1 Passive DNA demethylation in plants
Passive demethylation occurs for newly synthesized DNA during replication if the new DNA
is not targeted by DNA methyltransferase (Agius et al., 2006).

Chapter 1
16
Is there any situation where this has been described before in animals and plants. If yes you
should add a couple of sentence to explain that
3.2 Active DNA demethylation in plants
3.2.1 Enzymes involved in DNA demethylation in plants
The first DNA demethylases to be characterized, AtROS1 and DEMETER, were identified in
2002 in Arabidopsis (Choi et al., 2002;Gong et al., 2002). AtROS1 was isolated during a screening
for Repressor of Silencing (ROS): ros1 mutants were shown to cause the silencing of a transgene
and of a homologous endogenous gene that were originally active. This silencing was correlated
with DNA hypermethylation at the affected loci (Gong et al., 2002). Demeter mutants were isolated
in the frame of a screen for genes controlling seed viability by their maternal allele (Choi et al.,
2002). DEMETER was shown to be expressed exclusively in the central cell of the female
gametophyte and in seeds, and to be required for the activation of MEDEA expression in the central
cell and in the endosperm. Since 2002, two additional DNA demethylases were described in
Arabidopsis, DEMETER-LIKE 2 (AtDML2), DEMETER-LIKE 3 (AtDML3) (Penterman et al.,
2007b;Ortega-Galisteo et al., 2008), whereas very few functional studies were performed in other
plant species (La et al., 2011).
3.2.2 Machinery of active DNA demethylation in plants
Strong evidence supports that DNA glycosylases-lyases, also called DEMETER-like DNA
demethylases, can catalyze the removal of methylated cytosine efficiently through a Base Excision
Repair pathway (BER process) (Gong et al., 2002;Gehring et al., 2005). DNA demethylases are
bifunctional enzymes, which possess both DNA glycosylase and apurinic/apyrimidinic (AP) lyase
activities. Four steps were shown to be involved in the BER process: (I) DNA demethylase with
DNA glycosylase activity cleaves the phosphodiester backbone at the 5-meC site, generating an
abasic site. (II) DNA demethylase with AP lyase activity subsequently nicks the DNA to generate
a primary 5Mc excision product, 3’-PUA, as intermediate by β-elimination, or go directly δ-
elimination to generate 3’-phosphate. (III) An AP endonuclease converts the intermediate to 3’-
OH to generate a single nucleotide gap. (IV) The gap is repaired by a DNA polymerase and a DNA
ligase by adding an unmethylated cytosine. (V) Finally, this biochemical process results in a net
loss of cytosine methylation (Fig 1.8) (Penterman et al., 2007b;Law and Jacobsen 2010;Wu and
Zhang 2010) .
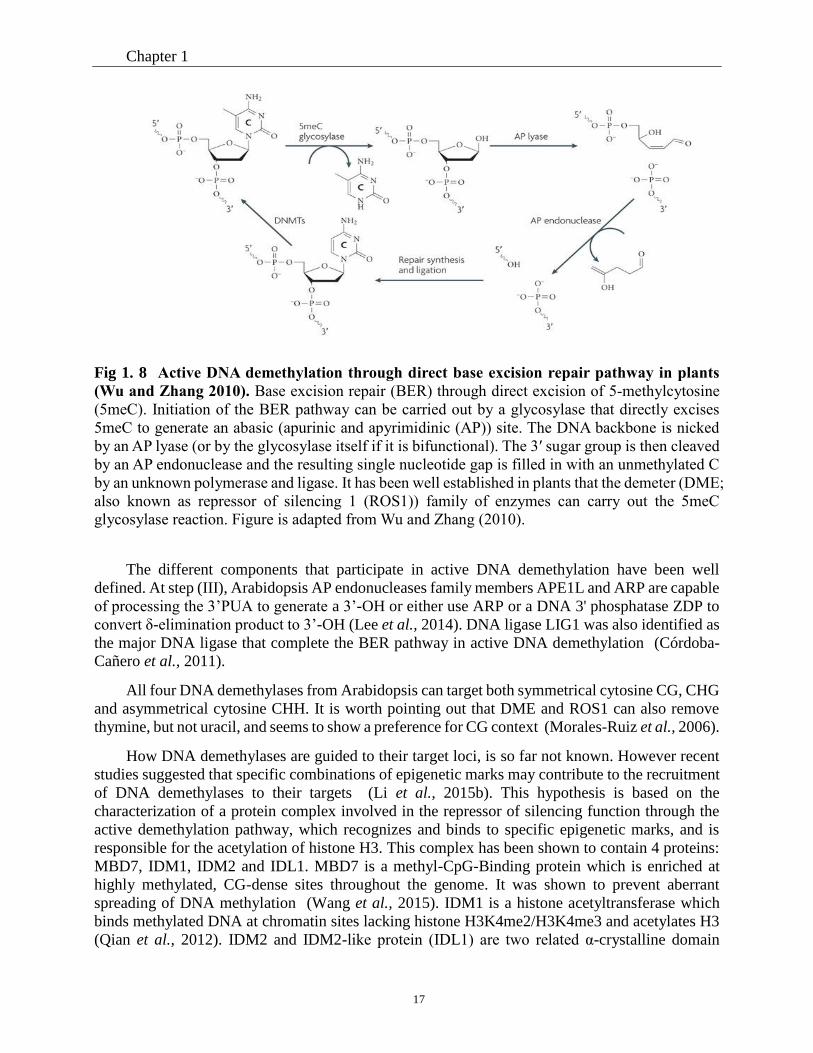
Chapter 1
17
Fig 1. 8 Active DNA demethylation through direct base excision repair pathway in plants
(Wu and Zhang 2010). Base excision repair (BER) through direct excision of 5-methylcytosine
(5meC). Initiation of the BER pathway can be carried out by a glycosylase that directly excises
5meC to generate an abasic (apurinic and apyrimidinic (AP)) site. The DNA backbone is nicked
by an AP lyase (or by the glycosylase itself if it is bifunctional). The 3′ sugar group is then cleaved
by an AP endonuclease and the resulting single nucleotide gap is filled in with an unmethylated C
by an unknown polymerase and ligase. It has been well established in plants that the demeter (DME;
also known as repressor of silencing 1 (ROS1)) family of enzymes can carry out the 5meC
glycosylase reaction. Figure is adapted from Wu and Zhang (2010).
The different components that participate in active DNA demethylation have been well
defined. At step (III), Arabidopsis AP endonucleases family members APE1L and ARP are capable
of processing the 3’PUA to generate a 3’-OH or either use ARP or a DNA 3' phosphatase ZDP to
convert δ-elimination product to 3’-OH (Lee et al., 2014). DNA ligase LIG1 was also identified as
the major DNA ligase that complete the BER pathway in active DNA demethylation (Córdoba-
Cañero et al., 2011).
All four DNA demethylases from Arabidopsis can target both symmetrical cytosine CG, CHG
and asymmetrical cytosine CHH. It is worth pointing out that DME and ROS1 can also remove
thymine, but not uracil, and seems to show a preference for CG context (Morales-Ruiz et al., 2006).
How DNA demethylases are guided to their target loci, is so far not known. However recent
studies suggested that specific combinations of epigenetic marks may contribute to the recruitment
of DNA demethylases to their targets (Li et al., 2015b). This hypothesis is based on the
characterization of a protein complex involved in the repressor of silencing function through the
active demethylation pathway, which recognizes and binds to specific epigenetic marks, and is
responsible for the acetylation of histone H3. This complex has been shown to contain 4 proteins:
MBD7, IDM1, IDM2 and IDL1. MBD7 is a methyl-CpG-Binding protein which is enriched at
highly methylated, CG-dense sites throughout the genome. It was shown to prevent aberrant
spreading of DNA methylation (Wang et al., 2015). IDM1 is a histone acetyltransferase which
binds methylated DNA at chromatin sites lacking histone H3K4me2/H3K4me3 and acetylates H3
(Qian et al., 2012). IDM2 and IDM2-like protein (IDL1) are two related α-crystalline domain

Chapter 1
18
proteins; IDM2 was shown to be required for the full activity of IDM1 in vivo. ROS5 is a small
heat shock protein (Zhao et al., 2014), which interacts with MBD7 (Wang et al., 2015) and with
IDM1. According to Li et al (2015), the histone acetyltransferase complex creates a feasible
chromatin environment to recruit DNA demethylases, which then starts the active DNA
demethylation process (Fig 1.9).
In addition to these essential protein factors, a component of the cytosolic iron-sulfur cluster
assembly (CIA) pathway, MET18, an anti-silencing factor was shown to interact with ROS1. This
suggests that the CIA pathway may play a role in active demethylation, but how MET18 is linked
to ROS1 is still unclear (Duan et al., 2015). Another study also identified that, ROS3, a RNA-
binding protein, may function in a pathway similar to ROS1, but the link between ROS3 and DNA
demethylation needs to be further verified (Zheng et al., 2008).
Fig 1. 9 Working model for the IDM1-IDM2-IDL1-MBD7 complex functioning in ROS1
mediated active DNA demethylation at some locus in Arabidopsis. MBD7 forms a complex
with IDM1, IDM2 and IDL1, and recognizes methylated DNA through methyl-CpG-binding
domains. Then IDM1 is recruited to specific loci and acetylates histone H3 at K18 and K23,
facilitating active DNA demethylation by ROS1. Figure referenced from Li et al (2015)
Chapter 1
19
3.3 Function of active DNA demethylation in plants
3.3.1 Active DNA demethylation is involved in parental imprinting during endosperm
development
The first DNA demethylase identified, DEMETER is expressed in a very restricted manner in
the female gametophyte central cell, and plays a role in gene imprinting.
Parental imprinting occurs in the endosperm in plants, and is essential for embryo and seed
development. Parental imprinting at specific loci means that only one allele is expressed, which is
either of maternal or of paternal origin. Bauer and Fischer (2011) have reviewed imprinted genes
in Arabidopsis. Recent work indicate that between 75 and 200 genes are imprinted in the
endosperm depending on the species analyzed and sequencing depth and potential co,ntaminations
with seed coat or embryo tissues ( For a review, see Ghering et Satyaki 2017) Well characterized
imprinted genes in Arabidopsis include FWA, MEA, FIS2, and PHERES1, which are specifically
expressed from the maternal genome in the endosperm while the alleles from the paternal genome
are silenced. Imprinted genes are regulated on an epigenetic level, involving DNA methylation,
DNA demethylation and/or histone modification particularly the trimethylation of lysine 27 of
histone H3 which is mediated by the PRC2 complex (Bauer and Fischer 2011). It was suggested
that passive DNA demethylation could also have a function in gene imprinting (Bauer and Fischer
2011). In most cases the epigenetic mechanisms responsible for gene imprinting are implemented
during the formation of the gametophytes, leading to different epigenetic status of the parental
alleles in each gamete. The epigenetic status of each allele persists beyond fertilization, resulting
in differential expression of the parental alleles in the endosperm.
In Arabidopsis, DEMETER (DME) has been shown to play an important role for imprinting
of specific genes as for example MEDEA (MEA). MEA is a maternally expressed gene that controls
seed development, and is specifically expressed in the female gametophyte central cells and in
seeds (Xiao et al., 2003). The current model suggests that MEA is constitutively repressed in
vegetative tissue through MET1-dependent methylation. During the formation of the female
gametophyte, DEMETER removes the methylation marks at the maternal allele in the central cell,
which results in its expression (Choi et al., 2002;Xiao et al., 2003). During male gametogenesis
the repression of the paternal allele is maintained owing to the lack of DME, and to the Polycomb
complex PRC2 activity which is responsible for the addition of repressive H3K27me3 marks at
MEA promoter (Gehring et al., 2005). Additional DNA methylation-independent mechanisms may
also be involved as suggested by the identification of a sequence in MEA promoter which is
necessary and sufficient to mediate MEA imprinting in a DME and MET1-independent way
(Wöhrmann et al., 2012). Another imprinted gene, FWA, which is only expressed in the female
gametophyte and in the endosperm, plays key functions in the control of flowering time. The
imprinting of this maternally expressed gene is also regulated by DME (Soppe et al., 2000;Choi et
al., 2002;Gehring et al., 2005;Wöhrmann et al., 2012).
Comparison of endosperm and embryo methylomes in Arabidopsis, rice and maize have
revealed that imprinting may affect more than 100 genes in each of these species (for a review,
(Zhang et al., 2013a).

Chapter 1
20
Genome-wide analyses have also shown that DNA hypomethylation in the endosperm was
not restricted to loci near imprinted genes, but rather occurred in TE and repeat sequences
throughout the genome of Arabidopsis (Gehring et al., 2009;Hsieh et al., 2009), rice (Zemach et
al., 2010), maize (Lu et al., 2015) and Castor Bean (Xu et al., 2016). In Arabidopsis DNA global
hypomethylation was also shown to occur in the gametophyte central cell and to be DEMETER-
dependent (Ibarra et al., 2012). Altogether these results suggest that gene imprinting may arise in
central cell when demethylation events targeting repeats or transposon also affect the expression
of neighboring genes.
Two functions were suggested for the decrease in DNA methylation in the central cell and in
the endosperm: (1) it may play a role in endosperm biogenesis. Indeed Zemach et al (2010) have
shown that genes coding for major storage proteins and starch synthesizing enzymes are
hypomethylated in rice endosperm (Zemach et al., 2010). (2) The decrease in DNA methylation
may favor siRNA biogenesis, which would diffuse to neighboring cells, egg cell in the gametophyte,
and embryo cells in the seed. There siRNAs would enhance TE and repeat silencing through RdDM,
providing an efficient protection against the deleterious effects of TE mobilization (review: (Zhang
et al., 2013a)).
3.3.2 Other functions of active DNA demethylation in plant
AtROS1, AtDML2 and AtDML3 function as genome wide DNA demethylases that remove
5mC marks at sites located at the 3’ and 5’ end of genes, in order to protect genes from potentially
deleterious methylation. Indeed nearby TE or repeat sequences are common features of DML gene
targets (Penterman et al., 2007a). But ros1, dml2, dml3 single, double or triple mutants showed
little or no developmental alterations, suggesting that the functions of DNA demethylases are not
essential for development in this species Yu (Yu et al., 2013).
Only recently, Yamamuro found that ros1 mutant and ros1 dml2 dml3 (rdd) triple mutant
show overproduction of stomatal lineage cells leading to a small-cell-cluster phenotype (Fig 1.10)
(Yamamuro et al., 2014). Yamamuro et al (2014) suggested that ROS1 negatively regulates the
bHLH protein SPCH to prevent establishing the stomatal lineage cells through a control of EPF2
expression. EPF2 is known to negatively regulate SPCH function and ros1 phenotype is very
similar to EPF2 loss-of-function phenotype (Yamamuro et al., 2014). Indeed EPF2 was shown to
be repressed in ros1 and rdd mutants due to an increase in the methylation status of its promoter.
The reduction in EPF2 expression was shown to be responsible for the small-cell-cluster phenotype
in ros1 and rdd mutants. Yamamuro et al (2014) proposed a model where EPF2 expression in the
WT is regulated through the antagonist actions of RdDM and active demethylation, because of the
presence of a TE in the upstream region of its promoter, approximately 1.5 kb 5’ from its
transcriptional start site. The TE is targeted by RdDM and thus methylated, this methylation tends
to spread from the TE into EPF2 promoter but ROS1 ensures EPF2 expression by erasing the
spreading DNA methylation. It is unknown how the balance between DNA methylation and
demethylation activities is achieved.
Interestingly ROS1 is also located in the vicinity of a TE, and was shown to be regulated
through the double action of DNA methylation and demethylation. But each activity has the
opposite outcome on ROS1 expression, compared to typical targets of these processes: ROS1
expression is promoted by DNA methylation and inhibited by DNA demethylation (Williams et

Chapter 1
21
al., 2015). Williams et al (2015) propose that owing to this specific regulation, ROS1 may play a
role in DNA methylation homeostasis at the genome wide scale scale.
A B
Fig 1. 10 Phenotypic analysis of epidermal patterning in the ros1 and rdd mutants and
promoter DNA methylation of EPF2 in Arabidopsis. A. (a–d) Microscopic image of cotyledon
adaxial epidermal cells from 3-day-old Col (a), epf2-1 (b), ros1-4 (c) and rdd (d). Small-cell-
clusters are indicated by brackets. B. Snapshot in the Integrated Genome Browser showing DNA
methylation levels of the EPF2 promoter and upstream region in Col, ros1-4 and rdd. Figure is
adapted from Yamamuro et al (2014).
Another study suggests that AtROS1 may be involved in stress response. Bharti et al (2015)
produced transgenic tobacco plants over-expressing AtROS1 and submitted them to salt stress.
AtROS1 overexpression was correlated to an increase in the expression of genes encoding enzymes
involved in flavonoid biosynthesis and antioxidant pathways and these upregulations were linked
to a decrease in the methylation status of their promoters. This suggests that active DNA
demethylation may participate in the induction of secondary metabolites synthesis in response to
salt stress. However the gene expression levels were only 5-6 times higher in transgenics compared
to WT. Furthermore, the secondary metabolites (flavonoids) were not measured, therefore further
experiments are necessary to confirm this conclusion (Bharti et al., 2015).
AtROS1 was shown to have a function in plant defense against pathogens, through the
regulation of some TEs related genes. Yu et al (2013) found that AtROS1 can restrict the
multiplication and vascular propagation of Pseudomonas syringae in leaves through the induction
of some immune related genes that have repetitive sequence in their promoters. This process is
tightly linked with the RdDM pathway (Yu et al., 2013).
Chapter 1
22
IV. The importance of epialleles in plants
Heritable epigenetic variants of genes, termed epialleles, are associated with heritable changes
in DNA expression without any alteration of the DNA sequence. Epialleles can broaden genetic
diversity and may provide a new source of beneficial traits for crop breeding. Assessing the
importance of methylated epialleles in plant population require the following determination: (i) the
extent of variation in methylation patterns among individuals within a population; (ii) the extent
to which natural methylation variants are stably inherited. However, only very few epialleles have
been identified until now.
Different epimutants were isolated and characterized in Arabidopsis. The phenotype of the clk
epimutant (clark kent) is similar to the phenotype of the superman (sup) mutant, characterized by
an increased number of stamens and abnormal fused carpels. Indeed SUP was shown to be modified
by an epimutation in the clk epimutant: its promoter is hypermethylated compared to the WT
(Jacobsen and Meyerowitz 1997). Another well-known epimutant in Arabidopsis is fwa, which
shows late flowering. This phenotype is due to hypomethylation at two direct repeat elements
upstream of the FWA locus (Kinoshita et al., 2004).
However, the first natural epimutant was found in Linaria vulgaris. The lcyc epimutant shows
an hypermethylated region in the promoter of lCYC (Linaria cyloidea-like), which encodes a
transcription factor that controls the floral development process. The lcyc phenotype can
spontaneously reverse, which corresponds to a change in the methylation status of the promoter
(Cubas et al., 1999)(Fig 1.11).
Currently, three natural epialleles were found in rice, Epi-d1, Epi-df and Epi-rav6 (Zhang
(Miura et al., 2009;Zhang et al., 2012;Zhang et al., 2015). All of them are associated with defects
in important agronomic trait. Epi-d1 is a natural mutant, which shows a metastable dwarf
phenotype, although this phenotype is chimeric. This is caused by an hypermethylation in the
promoter of DWARF1 (Miura et al., 2009). Epi-df mutant shows a dwarf phenotype together with
various floral defects. In this case, the phenotype is caused by an hypomethylation in the promoter
of FIE1 (Fertilization-independent endosperm1), coding for one of the component of the Polycomb
Repressive complex 2. As expected for a plant affected in the expression of a PcG gene, it was
found that H3K27me3 levels were altered in Epi-df mutant (Zhang et al., 2012). More recently,
Zhang et al (2015) isolated a spontaneously occurring epimutant, Epi-rav6, with large leaf angle
and small seed size. These defects were caused by the ectopic expression of RAV6, coding for a B3
DNA-binding domain containing protein involved in brassinosteroid homeostasis. The alteration
in RAV6 expression was furthermore linked to the hypomethylation of its promoter (Zhang et al.,
2015).
In tomato, an epimutant has also been isolated and studied, the well-known cnr epimutant
which produces fruits that never ripe (Fig 1.11). This non-ripening phenotype was correlated with
the hypermethylation of the promoter of CNR, which codes for a major regulator of fruit ripening.
Interestingly, this epi-phenotype is very strong and stable (Manning et al., 2006) .
Altogether, these findings show that epialleles may have a substantial effect on plant
phenotype. Some epialleles may be associated with critically important agricultural traits. So
epimutants screening represents an interesting and powerful tool for plant breeding.

Chapter 1
23
Fig 1. 11 Natural epimutants of Linaria vulgaris fowers and tomato CNR. A. View of a wild-
type Linaria fower compared to a peloric mutant. Floral diagrams of wild-type (top) and peloric
(bottom) fowers showing the relative positions of different organs, with identities indicated by
colours: blue (dorsal) brown (lateral) yellow (ventral). The WT fower has an axis of dorsoventral
asymmetry orientated such that the dorsal (upper or adaxial) part is nearer the stem whereas the
ventral (lower or abaxial) part is nearer to the subtending leaf. The peloric fower is radially
symmetrical, with all petals resembling the ventral petal of the wild type. The epigenetic change is
at the Lcyc locus. B. Revertant sectors occasionally seen on mature CNR fruits. The epigenetic
change is at the CNR locus. Figures were adapted from Cubas et al (1999) and Manning et al (2006).
V. Physiological changes during tomato fruit ripening
Tomato (Solanum lycopersicum) is an important crop and a model plant for fleshy fruits
development and ripening. After fertilization, tomato fruit development proceeds in two main
phases that precede fruit ripening. Early fruit development events correspond to fruit growth
mediated by an active cell division phase followed by an important increase in cell size associated
to the endoreduplication process. Fruit growth essentially ends at the so-called “mature-green
stage”, when the fruit has acquired its final size, but is still hard, green and acid-tasting. The fruit
ripening process then takes place. Several dramatic physiological and metabolic changes occur at
the fruit development to ripening transition and during ripening: (i) transition from a partly
photosynthetic metabolism to a completely heterotrophic metabolism; (ii) differentiation of
chloroplasts into chromoplasts; (iii) changes in cell wall composition, and in sugar and organic
acids accumulation, and the dramatic accumulation of carotenoids mainly lycopene (for a review
see (Tohge, T., et al. 2014)). Altogether these modifications determines nutrient accumulation in
the fruits, hence the fruit nutritional quality, motivating intense research efforts to decipher the
regulation mechanisms underlying ripening. The availability of extensive genetic, molecular and
genomic resources for tomato has contributed to a better understanding of the ripening control.
Ripening was shown to be under a strict genetic control in relation with hormonal regulations,
CNR mutant WT A
B

Chapter 1
24
involving especially ethylene (Giovannoni, 2007). Three transcription factors have been identified
as central regulators for fruit ripening: RIN (ripening inhibitor), NOR (non-ripening) and CNR
(colorless non-ripening) (Giovannoni 2004; Manning, et al. 2006; Vrebalov, et al. 2002) (Fig 1.12).
Fig 1. 12 Overview of ripening regulation in tomato fruits. Transcriptional regulation involved
during the ripening process. Figure is adapted from Osorio et al (2013).
Below, I will describe some of the major physiological events associated with tomato fruit ripening
5.1 Tomato fruit softening
Decrease in firmness during ripening involves a coordinated series of modifications of the
primary cell wall and middle lamella, resulting in a weaken structure. Since fruit softening is the
major determinant of shelf life, understanding the mechanisms responsible for cell wall
modifications during ripening is of economic importance.
In tomato, a number of cell wall structure-related genes are expressed during fruit ripening,
including more than 50 structural genes encoding cell wall modifying proteins are expressed during
fruit development and ripening process (Uluisik et al., 2016). A few studies have investigated the
role of individual cell wall structure-related gene in fruit ripening (Smith et al., 2002;Brummell
2006;Godoy et al., 2013), many of them have focused on genes related to pectin biosynthesis, such
as PG (POLYGALACTURONASE), whose expression shows a sharp increase during ripening and
results in substantial cell wall pectinase activity, during fruit softening (DellaPenna et al., 1989).
However specific repression or induction of PG in fruit does not alter fruit softening, indicating
that the polygalacturonase activity is not sufficient for fruit softening. It may associate with some
other factors to control fruit softening (Giovannoni 2004). The role of another enzyme, the
galacturonosyltransferase (GAUT) also involved in pectin biosynthesis, was analyzed. GAUT4
RNAi mutant showed altered pectin composition coincided with an increase in firmness. This
indicates that GAUT4 plays a role in fruit softening during fruit ripening, although it was also
shown to interfere with carbon metabolism, partitioning and allocation and globally affect plant
development (Godoy et al., 2013). More recently, Uluisik et al (2016) found that silencing PI
Fruit ripening

Chapter 1
25
encoding pectate lyase, also increased fruit firmness but without altering other aspects (Uluisik et
al., 2016). Indeed, fruit ripening is also characterized by significant changes in changes in the β-
galactose content of cell walls. At least seven tomato β-galactosidases (TBG1-7) are thought to
play important roles during fruit development and maturation, but only suppression of TBG4 was
associated with alteration of fruit firmness, which is associated to a reduced galactose loss.
Downregulation of TBG1, 3 and 6 didn’t lead to obvious phenotype on fruit ripening (Eda et al.,
2016). The expression of TBG4 was shown to be related with the galactose content (Eda et al.,
2016). Furthermore mutants impaired for expansion function, show delayed fruit ripening and
softening, coincident with a modification of hemicellulose structure (Minoia et al., 2016). However,
repression of the ripening-related endo-β-1,4-glucanases CEL1 or CEL2 did not change fruit
softening. Impaired Exp1 show delayed fruit ripening and softening, which caused by the
modification of hemicellulose structure.
These studies suggest that several genes encoding cell wall modifying enzymes contribute to
cell wall changes during fruit development and ripening. Fruit softening would thus be the result
of the concerted action of numerous cell wall-modifying enzymes. The sum of each enzymatic
activity could lead to extensive softening and, eventually, tissue disintegration. However, this
process is still poorly understood, and requires more investigations.
5.2 Ethylene production
Basically, fruits can be categorized into two families depending on their ability to undergo a
burst of ethylene production and an associated increase in respiration rate at the onset of ripening.
Fleshy fruits such as, strawberry, grape and citrus don’t go through this program for ripening: they
are categorized as non-climacteric fruits. Contrarily, for tomato, which is as a typical example of
climacteric fruit, the ripening process is linked to a dramatic increase of ethylene production and
rises in respiration. Some other fruits, such as apple, peach and banana belong to this family, too
Osorio et al (2013).
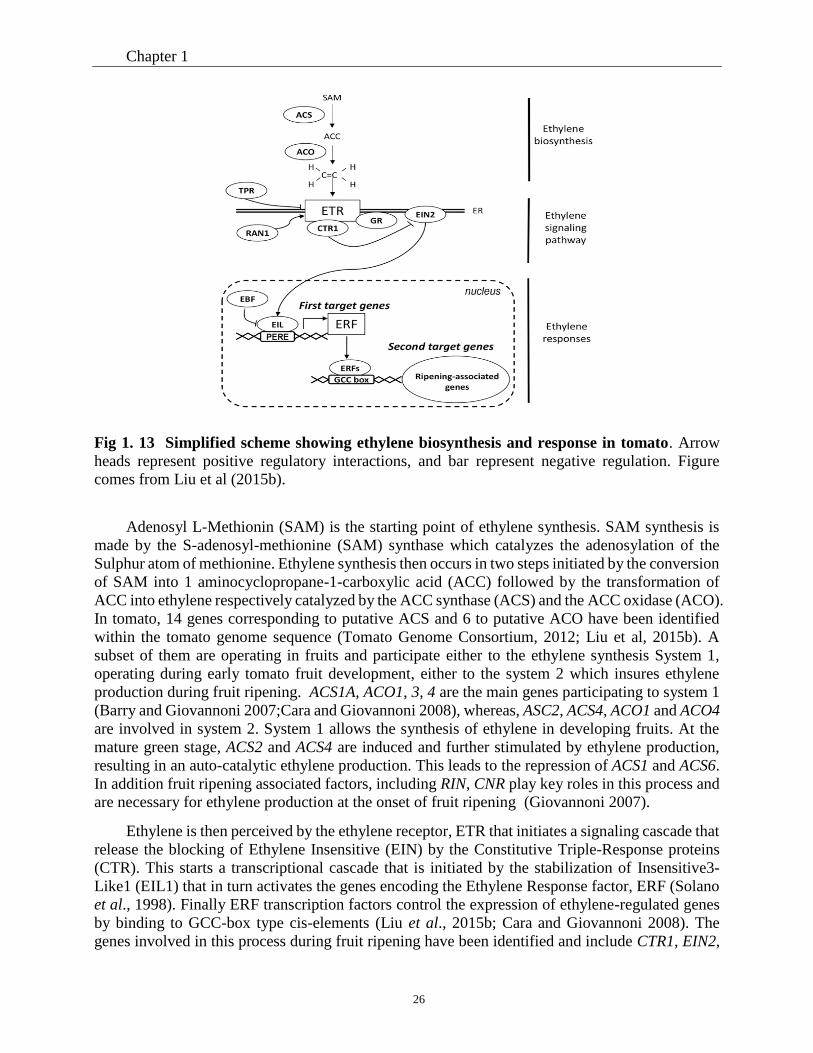
Chapter 1
26
Fig 1. 13 Simplified scheme showing ethylene biosynthesis and response in tomato. Arrow
heads represent positive regulatory interactions, and bar represent negative regulation. Figure
comes from Liu et al (2015b).
Adenosyl L-Methionin (SAM) is the starting point of ethylene synthesis. SAM synthesis is
made by the S-adenosyl-methionine (SAM) synthase which catalyzes the adenosylation of the
Sulphur atom of methionine. Ethylene synthesis then occurs in two steps initiated by the conversion
of SAM into 1 aminocyclopropane-1-carboxylic acid (ACC) followed by the transformation of
ACC into ethylene respectively catalyzed by the ACC synthase (ACS) and the ACC oxidase (ACO).
In tomato, 14 genes corresponding to putative ACS and 6 to putative ACO have been identified
within the tomato genome sequence (Tomato Genome Consortium, 2012; Liu et al, 2015b). A
subset of them are operating in fruits and participate either to the ethylene synthesis System 1,
operating during early tomato fruit development, either to the system 2 which insures ethylene
production during fruit ripening. ACS1A, ACO1, 3, 4 are the main genes participating to system 1
(Barry and Giovannoni 2007;Cara and Giovannoni 2008), whereas, ASC2, ACS4, ACO1 and ACO4
are involved in system 2. System 1 allows the synthesis of ethylene in developing fruits. At the
mature green stage, ACS2 and ACS4 are induced and further stimulated by ethylene production,
resulting in an auto-catalytic ethylene production. This leads to the repression of ACS1 and ACS6.
In addition fruit ripening associated factors, including RIN, CNR play key roles in this process and
are necessary for ethylene production at the onset of fruit ripening (Giovannoni 2007).
Ethylene is then perceived by the ethylene receptor, ETR that initiates a signaling cascade that
release the blocking of Ethylene Insensitive (EIN) by the Constitutive Triple-Response proteins
(CTR). This starts a transcriptional cascade that is initiated by the stabilization of Insensitive3-
Like1 (EIL1) that in turn activates the genes encoding the Ethylene Response factor, ERF (Solano
et al., 1998). Finally ERF transcription factors control the expression of ethylene-regulated genes
by binding to GCC-box type cis-elements (Liu et al., 2015b; Cara and Giovannoni 2008). The
genes involved in this process during fruit ripening have been identified and include CTR1, EIN2,

Chapter 1
27
EIN3/EIL1 and then the ERF family, which in turn control several genes determining various
ripening-related traits, including color, firmness, aroma, taste and shelf life.
5.3 Color change: chlorophyll degradation and carotenoid synthesis
Tomato color change from green to red is the visible sign indicating the transition from
development to ripening. The color change is associated with the degradation of chlorophylls and
the shift of the carotenoid composition from lutein and neoxanthin to carotenes, mainly to lycopene
and to a lower extend β-carotene.
Chlorophyll is responsible for the green color in the early stages of fruit ripening. The
chlorophylls biosynthesis and degradation pathways have been well reviewed (Tanaka and Tanaka
2006). The chlorophyll a biosynthetic pathway starts from glutamate. In this phase, the synthesis
of 5-aminolevulinic acid (ALA) by glutamyl-tRNA reductase (GluTR) and glutamate 1-
semialdehyde aminotransferase is a key control point. The interconversion of chlorophyll a to
chlorophyll b, the so-called chlorophyll cycle, is catalyzed by the chlorophyllide a oxygenase
(CAO). The degradation of chlorophyll a and chlorophyll b is a slow and important process, which
corresponds to the transition of green fruit to ripening (Tanaka et al., 1998;Tanaka and Tanaka
2006). It was suggested that chlorophyll degradation is initiated by the reduction of chlorophyll b
into chlorophyll a. This reduction step is catalyzed by non-yellow coloring 1 (NYC1), a chlorophyll
b reductase. Mutation on NYC1 or NOL gene (NYC1-like) leads to non-ripening fruit, which always
stays green (Tanaka et al., 1998;Kusaba et al., 2007;Horie et al., 2009;Sato et al., 2009). Then
chlorophyll a is degraded by sequential elimination of phytol and magnesium, respectively by a
chlorophyllase (Chlase), and a Mg dechelatase, producing pheophorbide a (pheide a). Under the
activity of pheide a oxygenase (PAO) and red chl catabolite (RCC) reductase, pheophorbide a is
converted to primary fluorescent chl catabolite-1 (pFCC-1), which are finally transformed to non-
fluorescent chl catabolites (NCCs) (Pružinská et al., 2005).
Carotenoids are terpenoid derivatives that are synthesized in fruit tissue during fruit ripening.
There are two major classes of carotenoids: (i) xanthophylls, as for example, violaxanthin and
nexanthin, and, (ii) carotenes, such as lycopene and β-carotene (See review: Tohge et al., 2014).
In tomato fruits, there is a substantial accumulation of certain carotenoid pigments during the
ripening process. Among thosehe dramatic accumulation of lycopene causes the color change from
green to orange and red. Transcriptional regulation of the genes involved in carotenoid biosynthesis
pathway has been well characterized and 22 genes were demonstrated to play a role in this process
in tomato (Fraser et al., 2009; Nogueira et al., 2013). Lycopene biosynthesis from two
geranylgeranyl diphosphate molecules has been shown to proceed through the production of
phytoene by the phytoene synthase (PSY1). This enzyme plays a key role in lycopene biosynthesis
and it is highly induced during fruit ripening at the transcriptional level. Furthermore psy1 mutants
show serious defects in carotenoid accumulation (Bartley et al., 1992; Fray and Grierson, 1993,
and Fraser et al 2000). Several genes coding for enzymes acting upstream of lycopene are also
induced during fruit ripening, concomitantly with the accumulation of lycopene (Bartley et al.,
1992). On the contrary, genes coding for enzymes acting downstream of lycopene are mainly
turned off during fruit ripening to allow the accumulation of lycopene. Lycopene accumulation in

Chapter 1
28
tomato fruits has been shown to be regulated by ethylene signaling and by the developmental
regulators RIN, NOR and CNR (Klee and Giovannoni 2011;Seymour et al., 2013).
5.4 Primary metabolites changes during tomato fruit ripening
The combined analysis of tomato fruit transcriptome and metabolome shows that
transcriptomic changes are less dramatically than variations in metabolites abundance, suggesting
that posttranslational mechanisms dominate metabolic regulation (Carrari et al 2006). However,
some strong relationships between ripening-associated transcripts and specific metabolite groups
were found too, such as TCA-cycle organic acids and sugar phosphates.
The acid taste of tomato fruits is attributed mainly to organic acids, including citrate and
malate. The levels of organic acid in TCA cycle tend to decrease along fruit development. These
changes are largely caused by the changes in activity of TCA-cycle enzymes, most of which decline
during the chloroplast-chromoplast transition in tomato fruit (Bartley et al., 1992;Schauer et al.,
2005;Carrari et al., 2006). As the precursor of aspartate, malate is an important metabolite for
ethylene feedback regulation during tomato fruit ripening and is also an important contributor to
starch accumulation. Earlier work showed that starch degradation is also one of the major changes
for fruit transition from development to ripening. Starch metabolism has been well demonstrated
to have a tense relation with AGPase activity, which is also controlled at the transcriptional level
(Osorio et al., 2013a). Moreover, Centeno et al (2011) found that in tomato, malate is a key
component in the redox regulation of AGPase. Inhibiting fruit-specific gene of mitochondrial MDH,
major tomato fumarase, or cytosolic phosphoenolpyruvate carboxykinase (PEPCK), leads to a
decrease in the content of transitory starch in the transgenic plants with the higher malate content.
These findings suggested that malate may have an important regulatory function for starch
biosynthesis (Centeno et al., 2011;Osorio et al., 2013b).
The balance and content between organic acids and sugars are important for high quality fruit
(Bastías et al., 2011). Glucose, fructose and sucrose are the major sugars after fruit ripening. The
levels of fructose and glucose increase during fruit development and ripening, whereas the
concentration of sucrose decreases during fruit development. The decrease of sucrose is caused by
the activity of invertases, enzymes that hydrolyze sucrose to hexose and thus play a fundamental
role in the energy requirements for plant growth and maintenance (Dnfna Mirona et al., 2002).
Knock down of a specific gene encoding a sucrose invertase, Line5, induces an increase in the level
of sucrose and a decrease in hexose content, resulting in smaller fruits (Klann et al., 1996).
Transcription factors can also affect key primary metabolites. For example, in SlAREB1
overexpressors, citrate, malate, glutamate, glucose and fructose show higher accumulation levels
in red mature fruit pericarp compared with those observed in antisense suppression lines. This
suggests that an AREB-mediated ABA signal affects the metabolism of these compounds during
the fruit developmental program, even if the fruit ripening wasn’t affected in these transgenic plants
(Bastías et al., 2011;Tohge et al., 2014).
The transition from tomato fruit development to ripening involves a huge amount of protein
degradation. (Carrari et al., 2006;Kahlau and Bock 2008). Therefore, most of the free amino acid
contents tend to increase during fruit transition, such as glutamate, aspartate, although their
contents are variable in different species. In particular, free glutamate of ripe tomato fruit occupies

Chapter 1
29
a central role in the metabolism of amino acid in plants (Sorrequieta et al., 2010). However, GABA
was found to be one of the most abundant free amino acid in the pericarp of mature fruit and to
show a rapidly decrease during ripening (Takayama and Ezura 2015).
VI. Role of DNA methylation / demethylation during fruit development
and ripening
As mentionned above, DNA methylation participates in the control of plant development.
Several lines of evidence further suggest that DNA methylation plays a role during fruit
development and ripening.
The importance of epigenetic regulations in fruit was first suggested by the identification of
the tomato epi-mutant Colorless non-ripening (Cnr) (Manning et al. 2006). More recently, several
reports have described situations where a differential methylation pattern in fruits was associated
with a change in fruit phenotype. For example, Telias et al (2011) have analyzed apple cultivars,
such as ‘Honeycrisp’ or ‘royal gala’, that produce fruits characterized by striped color patterns.
These patterns correspond to the presence of sectors of different colors, green or red, in the peel.
The molecular analysis of the two types of sectors has revealed that the color difference is
associated with different anthocyanin contents and with the differential expression of MYB10,
which codes for a transcription factor that has a key role in anthocyanin accumulation (Telias et al.,
2011). The difference in MYB10 expression was shown to depend on the methylation level in the
promoter of MYB10, MYB10 promoter is more or less methylated depending on the peel areas
(Fig 1.14). The origin of this methylation mosaic is not known. Similar results were obtained by
comparing different pear fruits from the cultivar Max Red Bartlett producing both red- and green-
skin fruits on the same tree (Wang et al., 2013), or by comparing yellow fruits from an apple
somatic mutant, ‘Blondee’, with red-skin apples from its parent ‘Kidd’s-D8’ (El-Sharkawy et al.,
2015). Working on tomato, Quadrana et al (2014) found that the vitamin E content in fruit is
correlated with the methylation level in the promoter of VTE3, which encodes a protein involved
in vitamin E biosynthesis. Accordingly VTE3 expression is linked to its promoter DNA methylation
status. Interestingly, in some species, as for example, the cultivated species solanum lycopersicum,
VTE3 5’ regulatory region contains a TE and is highly methylated, whereas in some other species,
as for example the wild species, S. pennellii, the TE is absent and VTE3 promoter is not methylated
(Quadrana et al., 2014).
These different findings show that modification of the DNA methylation level at some specific
loci can impact fruit development and ripening, but they don’t demonstrate that the regulation of
gene expression through DNA-methylation plays a role during fruit development or ripening.

Chapter 1
30
Fig 1. 14 Different types of fruit peel pigment patterns in ‘Honeycrisp’ apple and
Methylation levels in ‘Honeycrisp’ evaluated using bisulfite sequencing. Distribution of
anthocyanin in apple peels of blushed (A) and striped (B) fruits of ‘Honeycrisp’, indicating regions
classified as red or green stripes; (C). Comparison of percent methylation in two regions (-1007 to
-684 and -534 to -184) of the MYB10 promoter (GenBank accession EU518249) between red and
green stripes. Figures referenced from Telias et al (2011) (Telias et al., 2011)
Messeguer et al (1991) first suggested that DNA methylation undergo changes during tomato
fruit development and ripening. Teyssier et al (2008) then showed that there is a 30% decrease of
the global DNA methylation level in pericarp during fruit maturation. The comparison of tomato
fruit methylomes at 4 developmental stages further demonstrated that there is a widespread
epigenome reprogramming during fruit ripening (Zhong et al., 2013). Zhong et al (2013) found
that around 1% of the tomato genome is differentially methylated during tomato fruit ripening, and
that DNA demethylation occurs at promoters of fruit ripening-related genes such as NOR and CNR.
The global and locus specific loss of DNA methylation during ripening is unlikely to be due to
passive DNA demethylation because there is no more cell division and little endoreduplication
during this process (Teyssier et al., 2008). This suggested that active DNA demethylation might
play an important role during tomato fruit ripening. Because the treatment of immature fruits with
a DNA methylation inhibitor induces early ripening before seed maturation, Zhong et al (2013)
proposed the following model: (i) methylation inhibits ripening before seed maturation, the
promoter of key ripening genes being hypermethylated. (ii) In maturing fruits, these promoters
become demethylated, which would induce their expression through the recruitment of specific
ripening-related transcription factors like RIN. Indeed RIN binding sites are typically adjacent to
DMR and they become demethylated during ripening. This suggests that the binding of RIN to its
targets sites occurs in concert with their demethylation (Chen et al., 2015).
A B C
Chapter 1
31
VII. Objectives of the work
Cytosine methylation (5MeC) of genomic DNA is a crucial reversible epigenetic mark that
impacts several biological processes. Most notably, DNA methylation is involved in the control of
gene expression and provides an epigenetic layer to the genetic information. As introduced above,
DNA methylation is a revisable marker. DNA methylation is set up and maintained by three types
of DNA methyltransferases, MET1, Chromomethylases (CMT), and small RNA mediated de novel
methylation companied with Domain Rearranged Methyltransferase (DRM) in three different
contexts, CG, CNG and CHH (H being C, T or A) and can be actively eased by DNA demethylases
(DML). DMLs are essential enzymes that protect the genome against extensive methylation, hence
removing DNA methylation in the 5’ and 3’ part of genes and limiting the formation of silenced
hyper‐methylated epialleles.
As introduced above, over the last 10 years, DNA methylation/demethylation has been shown
to be critically important for plant development in the model plant Arabidopsis. Tomato is a model
plant of fleshy fruits development and ripening. Indeed, we have shown that tomato plants treated
with zebularine, an inhibitor of DNA methylation present pleiotropic phenotypes affecting the
vegetative parts of plants, flowers and fruits, therefore highlighting the important function of DNA
methylation in this plant as well. Zhong et al (2013) found that more than 4000 genes happens
DNA demethylation during fruit ripening, which suggest active DNA demethylation works during
fruit ripening process. Therefore, the objective of this project is to address the question of the
functions of this class of enzyme during tomato fruit ripening and more generally during tomato
plant development and quality.
To achieve this goal, plants modified in their methylation level needs to be generated and
analyzed. Therefore, RNAi was used to knockdown genes involved in the control of DNA
demethylation. Selected lines were characterized using combined analyses of fruit metabolic
composition, transcriptome, small RNA populations and if relevant the genome-wide description
of DNA methylation pattern (McrBC‐Seq and /or Bisulfite [BS] sequencing) (The strategy used
in this project is as following, Fig1.15).
This aims at determining which genes/loci targeted by DMLs in tomato fruits impact their
phenotype. Identified loci with differential methylation and expression profile were validated using
McrBC-PCR or targeted BS sequencing approaches and their expression level from RNA seq data
were controlled by quantitative RT‐PCR.
This project is divided into two parts:
(I: Chapter-2) focuses on the characterization of the functions of active DNA demethylation
during tomato fruit ripening and more globally in tomato plants. To achieve this goal, RNAi plants
with reduced DNA demethylase gene expression have been generated. This part aims at
demonstrating that specific fruit ripening phenotypes observed in these plants are due to the
hypermethylation of genes critical for fruit ripening. It also include attempts to characterize the
biochemical function of tomato DML proteins. An additional question is to analyze to which extend
phenotypes that are induced when DML genes are knocked down can be stably inherited during
subsequent generations and therefore questions the stability of demethylation induced changes in
methylation patterns.
(II: Chapter-3) presents comprehensive analyses of the impact of active DNA demethylation
on the transcriptomes and metabolomes of fruits that have a reduced DML2 gene expression. The

Chapter 1
32
aim is to determine amongst the numerous physiological disorder affecting these fruits, those that
are directly controlled by methylation. To answer this question RNA seq was combined with the
metabolic analysis of fruits. Results were used to determine what genes are both differentially
expressed and methylated in the transgenic lines as compared to WT fruits.
Fig 1. 15 Strategy used for this PhD project to study functional analysis of active DNA
demethylation in tomato.
Characterization of DML functions in
tomato
DMLs knock down
DM
L R
NA
i tr
ansg
enic
lin
es p
hen
oty
pin
g
Characterization of
developmental modifications
Metabolome
of fruits
Transcriptome
of fruits
DNA methylation analysis
Of fruitd
Links between promoter methylation and
gene expression Impacted processes
Identification of genes regulated via
DNA methylation

Chapter 2
Chapter 2
A DEMETER-like DNA demethylase
governs tomato fruit ripening

Chapter 2
34
Chapter 2
Introduction
In plants, genomic DNA methylation at cytosines is a reversible epigenetic mark regulating
various aspects of genome functioning, such as transposon mobility and gene expression.
Methylation of cytosines can be actively removed by bifunctional DNA glycosylase-lyases, the so-
called DEMETER-like DNA demethylases (Choi et al., 2002). In Arabidopsis, active DNA
demethylation plays a critical role in the maternal imprinting and endosperm demethylation.
However impairing DNA demethylase activities has no major impact on Arabidopsis plants
suggesting that these enzymes are not essential for development in this species. However, the
functions of this class of enzymes are not known in tomato (Yamamuro et al., 2014,).
It has previously been shown in the laboratory that the genomic DNA of tomato fruit pericarp
is massively demethylated during ripening, at a time when cell division and DNA replication are
reduced (Teyssier et al., 2008). This makes unlikely that lost of DNA methylation is due to dilution
following DNA replication and the inability to maintain DNA. It rather suggests that DNA
methylation is actively removed. It was also recently demonstrated that demethylation occurs at
specific gene promoters (Zhong et al., 2013). The objective of my project is to study the role of
tomato SlDMLs, using transgenic tomato plants impaired in the expression of SlDML genes.
In the first part in this chapter, I will present the functional analysis of SlDML genes, mainly
focusing on one of the genes SlDML2, during fruit ripening. Firstly, the four tomato SlDML genes
were characterized in details and DML RNAi transgenic plants were generated with the aim to
knock down all SlDML genes at once. T0 plants were phenotyped and many of them presented a
strong inhibition of fruit ripening. To investigate the consequences of DNA demethylation on the
ripening process, we have analyzed the primary metabolites as well as carotenoids and ethylene
content, and found that many the aspects of fruit ripening were inhibited and limited in DML RNAi
transgenic fruits. To demonstrate a causal relationship between fruit ripening defects of transgenic
lines and the impairment of active DNA demethylation, four essential genes (RIPENING
INHIBITOR (RIN), NON RIPENING (NOR), COLORLESS NON RIPENING (CNR) and
PHYTOENE SYNTHASE 1 (PSY1)) playing important roles in fruit ripening were analyzed to
determine their expression level and the methylation level at their promoter.
In a second part of this chapter, I will present the strategy used to characterize tomato SlDML
protein activity. Among the four DEMETER-like DNA demethylase genes, SlDML2 was chosen
to demonstrate the DNA glycosylase-lyases activity in vitro because it is the most highly expressed
of the four SlDML genes in ripening fruits. Attempt to produce the recombinant protein and the use
of an in vitro activity test will be described.
The third part in this chapter will present the potential role of active DNA demethylation on
other aspects of tomato plant development, namely, flower formation and early leaf development.
We found that in some DML RNAi transgenic plants, flower and fruit pericarp were altered, in
addition to fruit ripening. This is allowed to investigate the heritability of these phenotypes in the
absence of the transgene. We have therefore developed a strategy to segregate out the transgene in
order to analyze the eventual transgenerational stability of the flower and fruit phenotypes.

Chapter 2
35
A DEMETER-like DNA demethylase governs tomatofruit ripeningRuie Liua,1, Alexandre How-Kitb,1, Linda Stammittia,1, Emeline Teyssiera, Dominique Rolina, Anne Mortain-Bertranda,Stefanie Hallea, Mingchun Liuc,d, Junhua Konge, Chaoqun Wue, Charlotte Degraeve-Guibaulta, Natalie H. Chapmanf,Mickael Maucourta, T. Charlie Hodgmanf, Jörg Tostb,g, Mondher Bouzayenc,d, Yiguo Honge,h, Graham B. Seymourf,James J. Giovannonii, and Philippe Galluscia,2
aLaboratory of Fruit Biology and Pathology, University of Bordeaux, Institut National de la Recherche Agronomique, CS20032 Villenave d’Ornon, France;bLaboratory for Functional Genomics, Fondation Jean Dausset–Centre d’Études du Polymorphisme Humain, F-75010 Paris, France; cLaboratoire deGénomique et Biotechnologie des Fruits, Université de Toulouse, Institut National Polytechnique-École Nationale Supérieure d’Agronomie de Toulouse,F-31326 Castanet-Tolosan, France; dLaboratoire de Génomique et Biotechnologie des Fruits, Institut National de la Recherche Agronomique, F-31326Castanet-Tolosan, France; eResearch Center for Plant RNA Signaling, College of Life and Environmental Sciences, Hangzhou Normal University, Hangzhou310036, China; fSchool of Biosciences, University of Nottingham, Loughborough, Leics LE12 5RD, United Kingdom; gLaboratory for Epigenetics andEnvironment, Centre National de Génotypage, Commissariat à l’Energie Atomique–Institut de Génomique, 91000 Evry, France; hSchool of Life Science,University of Warwick, Coventry CV4 7AL, United Kingdom; and iUnited States Department of Agriculture, Robert W. Holley Center and Boyce ThompsonInstitute for Plant Research, Cornell University, Ithaca, NY 14853
Edited by Robert L. Fischer, University of California, Berkeley, CA, and approved July 8, 2015 (received for review March 3, 2015)
In plants, genomic DNA methylation which contributes to develop-ment and stress responses can be actively removed by DEMETER-likeDNA demethylases (DMLs). Indeed, in Arabidopsis DMLs are impor-tant for maternal imprinting and endosperm demethylation, but onlya few studies demonstrate the developmental roles of active DNAdemethylation conclusively in this plant. Here, we show a directcause and effect relationship between active DNA demethylationmainly mediated by the tomato DML, SlDML2, and fruit ripening—an important developmental process unique to plants. RNAi SlDML2knockdown results in ripening inhibition via hypermethylation andrepression of the expression of genes encoding ripening transcrip-tion factors and rate-limiting enzymes of key biochemical processessuch as carotenoid synthesis. Our data demonstrate that active DNAdemethylation is central to the control of ripening in tomato.
active DNA demethylation | DNA glycosylase lyase | epigenetic | tomato |fruit ripening
Genomic DNA methylation is a major epigenetic mark that isinstrumental to many aspects of chromatin function, including
gene expression, transposon silencing, or DNA recombination (1–4).In plants, DNA methylation can occur at cytosine both in sym-metrical (CG or CHG) and nonsymmetrical (CHH) contexts and iscontrolled by three classes of DNA methyltransferases, namely, theDNA Methyltransferase 1, Chromomethylases, and the DomainRearranged Methyltransferases (5–7). Indeed, in all organisms, cy-tosine methylation can be passively lost after DNA replication inthe absence of methyltransferase activity (1). However, plants canalso actively demethylate DNA via the action of DNA Glycosylase-Lyases, the so-called DEMETER-Like DNA demethylases (DMLs),that remove methylated cytosine, which is then replaced by a non-methylated cytosine (8–11). Initially identified as enzymes nec-essary for maternal imprinting in Arabidopsis thaliana (12), the roleof DMLs has since been established in various processes such aslimiting extensive DNA methylation at gene promoters (13), de-termining the global demethylation of seed endosperm (8, 14) andpromoting plant responses to pathogens (15). Of note, Arabidopsisros1, dml2, and dml3 single, double, or triple mutants showed little orno developmental alterations (9, 16, 17), suggesting that active DNAdemethylation is not critical for development in this species. How-ever, as mentioned above, genomic DNA methylation is an impor-tant mechanism that influences gene expression, and methylation atpromoters is known to inhibit gene transcription (5, 18). Hence, it islikely that the active removal of methylation marks is an importantmechanism during plant development and plant cell fate reprog-ramming, leading to the hypomethylation of sites important for
DNA–protein interaction and gene expression, as already observedin human cells (19).Indeed, accumulating evidence suggests that active DNA deme-
thylation might play a greater role in controlling gene expression intomato. In support of this idea, recent work describing the meth-ylome dynamics in tomato fruit pericarp revealed substantialchanges in the distribution of DNA methylation over the tomatogenome during fruit development, and demethylation during rip-ening at specific promoters such as the NON RIPENING (NOR)and COLORLESS NON RIPENING (CNR) promoters (20, 21).This observation is consistent with previous studies indicating thatgenome cytosine methylation levels decrease by 30% in pericarp offruits during ripening, although DNA replication is very limited atthis stage (22).
Significance
This work shows that active DNA demethylation governs ripen-ing, an important plant developmental process. Our work definesa molecular mechanism, which has until now been missing, toexplain the correlation between genomic DNA demethylationand fruit ripening. It demonstrates a direct cause-and-effect re-lationship between active DNA demethylation and induction ofgene expression in fruits. The importance of these findings goesfar beyond understanding the developmental biology of ripeningand provides an innovative strategy for its fine control throughfine modulation of epimarks in the promoters of ripening relatedgenes. Our results have significant application for plant breedingespecially in species with limited available genetic variation.
Author contributions: T.C.H., Y.H., and P.G. designed research; R.L., A.H.-K., L.S., E.T., D.R.,A.M.-B., S.H., M.L., J.K., C.W., C.D.-G., N.H.C., M.M., T.C.H., and P.G. performed research;A.H.-K. targeted bisulfite pyrosequencing; R.L., A.H.-K., E.T., D.R., A.M.-B., S.H., T.C.H., J.T.,M.B., Y.H., G.B.S., J.J.G., and P.G. analyzed data; and E.T., G.B.S., J.J.G., and P.G. wrotethe paper.
The authors declare no conflict of interest.
This article is a PNAS Direct Submission.
Freely available online through the PNAS open access option.
Data deposition: Full array datasets of WT (Ailsa craig) and of the rin, nor, and Cnrmutants have been deposited with the Sol Genomics Network and are accessible underthe following link: ftp://ftp.solgenomics.net/microarray/, file name rinnorcnr microarraysLiuetal PNAS2015. These array datasets have been used to analyze the expression of thefour DML genes in the tomato rin, nor, and Cnr mutants and in WT fruits. The results areshown in Fig. 6B and Dataset S1.1R.L., A.H.K., and L.S. contributed equally to this work.2To whom correspondence should be addressed. Email: [email protected].
This article contains supporting information online at www.pnas.org/lookup/suppl/doi:10.1073/pnas.1503362112/-/DCSupplemental.
www.pnas.org/cgi/doi/10.1073/pnas.1503362112 PNAS Early Edition | 1 of 6
PLANTBIOLO
GY

Here, we investigated active DNA demethylation as a possiblemechanism governing the reprogramming of gene expression infruit pericarp cells at the onset of fruit ripening.
ResultsThe Tomato Genome Contains Four DNA Glycosylase Genes withSpecific Expression Patterns. The tomato genome contains fourputative DML genes encoding proteins with characteristic do-mains of functional DNA glycosylase-lyases (23) (SI Appendix,Fig. S1 A and C and Table S1). SlDML1 and -2 are orthologousto the Arabidopsis AtROS1 (Repressor of Silencing 1) gene andSlDML3 to AtDME (DEMETER), whereas SlDML4 has noclosely related Arabidopsis ortholog (SI Appendix, Fig. S1B). Allfour SlDML genes are ubiquitously expressed in tomato plants,although SlDML4 is expressed at a very low level in all organsanalyzed. In leaves, flowers, and young developing fruits, thefour genes present coordinated expression patterns character-ized by high expression levels in young organs that decreasewhen organs develop. However, unlike SlDML1, SlDML3, andSlDML4, which are barely expressed during fruit ripening,SlDML2 mRNA abundance increases dramatically in ripeningfruits, suggesting an important function at this developmentalphase (Fig. 1).
Transgenic Plants with Reduced DML Gene Expression Present VariousFruit and Plant Phenotypes. The physiological significance of to-mato DMLs was addressed through RNAi-mediated gene re-pression using the highly conserved Helix–hairpin–Helix-Gly/Prorich domain (HhH-GPD) specific to DML proteins as a targetsequence (SI Appendix, Fig. S2A). Our goal was to repress si-multaneously all tomato SlDML genes, anticipating potentialfunctional redundancy among these four genes; 23 independentT0 transgenic lines were generated and 22 showed alterations offruit development, including delayed ripening, modified fruitshape, altered color, shiny appearance, parthenocarpy, or com-binations of these phenotypes (Fig. 2A).Lines 2 and 8, which showed delayed and inhibited ripening
phenotypes, were chosen to investigate the possible link betweenripening and DNA demethylation. In both cases, 10–25 T1 andT2 plants were grown that showed maintenance and strength-ening of the nonripening phenotypes in subsequent generationscoincident with the presence of the transgene. The loss of theRNAi transgene in segregating lines led to reversion to a wild-
type (WT) phenotype, indicating a lack of memory effect acrossgenerations when fruit ripening is considered (Fig. 2 A and B andSI Appendix, Fig. S3A). In plants of both RNAi lines, analysis ofSlDML gene residual expression in 20 days postanthesis (dpa)fruits indicates that only SlDML1 and SlDML2 are repressed to40–60% of the WT level, whereas SlDML3 and SlDML4 areeither unaffected or induced compared with WT (Fig. 3A). Thisis most likely attributable to the lower homology level of thesetwo genes, with SlDML1 in the part of the gene used for theRNAi construct (SI Appendix, Fig. S2A). During ripening,SlDML2 expression is reduced to 10% of WT at the Breaker (Br)stage and remains low at 55 dpa (Br + 16) but increases slightlyat 70 dpa (Br + 31) (Fig. 3B and SI Appendix, Fig. S2B), co-incident with the partial ripening observed in transgenic RNAifruits (Fig. 2C and SI Appendix, Fig. S3B). Whether the increasein SlDML2 expression at late ripening stages is attributable to aweaker effect of the RNAi remains unclear. None of the threeremaining genes, SlDML1, SlDML3, and SlDML4, which areweakly expressed during ripening, displayed significantly reduced
Fig. 1. Differential expression of SlDML genes in tomato organs. Absolutequantification of SlDML1, SlDML2, SlDML3, and SlDML4mRNA; SlDML4 geneexpression is presented in a separate diagram because of its very low ex-pression level. Fruit pericarp is at 5, 10, 20 dpa and at Breaker (BR, 39 dpa),orange (O), and red ripe (RR). Asterisks indicate significant difference [Stu-dent’s t test (n = 3)] between SlDML2 and all other SlDML genes: *P < 0.05;**P < 0.01; ***P < 0.001. Error bars indicate means ± SD. Ap, stem apex; CF,closed flowers; L, leaves at positions 3, 4, 5, 8, 10, 16, and 20 from apex; OP,open flowers 5, 10, and 20; R, roots; S, stem from whole seedlings.
WT 1 2 3 4 5 6 7 8
WT 2A 2B 8A 8B Az
WT
8A
2A
35 39 55 70 85 dpa 30 dpa(Br) (Br+16) (Br+31) (Br+ 46)
(1) (2) (3) (4)
D
A
B
C
E
Fig. 2. Phenotypes of tomato DML RNAi fruits. (A) Fruits (70 dpa) (upperlane) or fruit sections (lower lane) from eight independent representative T0RNAi plants. (B) Fruits (85 dpa) from T2 plants (left to right); WT plants, line 2plants (DML2A and DML2B), line 8 plants (DML8A and DML8B), and anazygous plant (AZ). (C) Ripening kinetics of WT (Top), DML8A (Middle), andDML2A (Bottom). (D) WT bicarpel (Upper) DML2B multicarpel fruits (Lower).(E) VIGS experiment on 47-dpa (Br + 5) fruits injected with PVX/SlDML2[fruits (1) and (3)] or PVX [fruits (2) and (4)] at 12 dpa [fruits (3) and (4)] insideof fruits (1) and (2), respectively. (Scale bars: 1 cm.)
2 of 6 | www.pnas.org/cgi/doi/10.1073/pnas.1503362112 Liu et al.

expression compared with WT fruits of the same age, indicatingthat observed ripening phenotypes are likely attributable toSlDML2 gene repression. This hypothesis was further confirmedusing virus induced gene silencing (VIGS) to specifically repressthe SlDML2 gene; 17.5% of the fruits injected with a PVX/SlDML2 vector presented non ripening sectors contrary to thoseinjected with a control PVX virus that all ripened normally (Fig.2E and SI Appendix, Fig. S4B). Indeed, SlDML2 was down-reg-ulated in nonripening sectors of fruits injected with the PVX/SlDML2 vector, whereas none of the three other SlDML geneswas repressed (SI Appendix, Fig. S4C), demonstrating that thespecific knock down of SlDML2 is sufficient to inhibit ripening.It was noteworthy that some plants from line 2 developed ad-
ditional phenotypes affecting plant growth, leaf shape, flowerdevelopment, and fruit carpel number that were not observed inT0 and T1 generations (Fig. 2D and SI Appendix, Fig. S3 B and C).The screening of additional lines revealed other independenttransgenic lines that presented flower, fruit, and plant phenotypessimilar to line 2 (SI Appendix, Fig. S3D). These observations in-dicate that the severity of the phenotypes increases over genera-tions and suggest that DMLs may also be involved in other aspectsof tomato plant development beyond fruit ripening.
All Aspects of Fruit Ripening Are Delayed and Limited in RNAiTransgenic Lines. Fruits of transgenic lines 2 and 8 were furtheranalyzed to investigate the consequences of DNA demethylationon the ripening process. Indeed, in fruits of both transgenic lines,the onset of fruit ripening was delayed from 10 to 20 d comparedwith WT or Azygous revertant fruits, and ripening of transgenicfruits was never completed even after 45 d or longer maturationtimes (Fig. 2 B and C and SI Appendix, Fig. S3B). The ripeningdefect is further demonstrated by the late and extremely reducedtotal carotenoids and lycopene accumulation and the delayed
chlorophyll degradation (Fig. 4A). Primary metabolite compo-sition was also modified, as visualized by principal componentanalysis (PCA) using the absolute concentration of 31 primarymetabolites issued from 1H-NMR analysis (Fig. 4B and SI Ap-pendix, Fig. S5A). The first two principal components (PCs),explain more than 54% of total variability. During early devel-opment (20, 35, and 39 dpa), WT and transgenic samples followparallel trajectories as highlighted by the PCA in which the0
0,5
1
1,5
2
2,5
***
*
*
*** ****** ******
*****
***
WT1 DML2A DML2B WT2 DML8A DML8B AZ
SlDML1SlDML2SlDML3SlDML4
Rel
ativ
e ex
pres
sion
SlDML1 SlDML3
SlDML2
*** ***
**
*
20 35 39(Br) 55 70 85 110
0
1
2
3
4
***
**
WT DML8A
0
0,5
1
1,5
*
***
SlDML4
0
0,5
1
1,5
*
*
20 35 39 55 70 85 110 dpa 0
5
10
15
20
Rel
ativ
e ex
pres
sion
Rel
ativ
e ex
pres
sion
Rel
ativ
e ex
pres
sion
Rel
ativ
e ex
pres
sion
20 35 39 55 70 85 110 dpa
A
B
Fig. 3. Residual expression of SlDML genes in fruits of transgenic DML RNAiplants. Normalized expression of the SlDML genes (A) in 20-dpa transgenicfruits of plants from line 2 (DML2A and -2B), line 8 (DML8A and -8B), anazygous plant (AZ), and the respective WT1 and WT2 controls (B) in WT2 andDML8A fruits at seven developmental stages. Expression of the SlDML geneswas normalized to EF1α and to the corresponding WT fruits at 20 dpa.For each SlDML gene, asterisks indicate significant difference [Student’st test (n = 3)] between transgenic plants and WT controls, respectively, at20 dpa (A) or at the same age during fruit development (B). *P < 0.05; **P <0.01; ***P < 0.001). Error bars indicate mean ± SD.
Chlorophylls
Total carotenoids
Lycopene
**
**
0
20
40
60
80
10035 dpa55 dpa85 dpa
0
100
200
300
400
500
600
0
50
100
150
200
250
300
WT1 DML2A DML2B WT2 AZ DML8A DML8B
**
**
**
**
** ******
**
**
**
** **** ** ****** **
ng/ m
g dr
y w
eigh
tng
/ mg
dry
wei
ght
ng/ m
g dr
y w
eigh
t
A
B
Fig. 4. Metabolic profiling of carotenoids and primary metabolites intransgenic DML RNAi fruits. (A) Chlorophylls (Top), total carotenoids (Mid-dle), and lycopene (Bottom) content. Asterisks indicate significant difference[Student’s t test (n = 3)] between DML2A and -2B, DML8A and -8B, and WT1and WT2, respectively, at the same age: *P < 0.05; **P < 0.01; ***P < 0.001.Error bars indicate means ± SD. (B) PCA using primary metabolites in WT2(△) and DML8A (○) fruits at seven developmental stages. Color indicates thefruit developmental stages: white is 20 dpa and from light gray to black are35, 39 (Br), 55, 70, 85, and 110 dpa.
Liu et al. PNAS Early Edition | 3 of 6
PLANTBIOLO
GY

second PC (PC2) explains 21% of the total variability. However,at 55-dpa and later ripening stages, PC1, which accounts for33.67% of the global variability, separates WT fruits from allother samples. Hence, WT fruit samples harvested at 55-dpa andolder stages are clearly distinct from transgenic fruit samples ofthe same age. Metabolic differences between ripening WT andtransgenic fruits are mainly attributable to overaccumulation ofmalate and reduction or delayed accumulation of compoundstypical of ripening fruits, including glucose, fructose, glutamate,rhamnose, and galactose (SI Appendix, Fig. S5 B–D). Climactericrise of ethylene production was also dramatically reduced infruits of both DML RNAi lines, although low ethylene accu-mulation occurred to a degree and timing consistent with thelate and limited ripening process of RNAi fruits (SI Appendix,Fig. S6).
Fruit-Ripening Defects Are Correlated with the Repression andHypermethylation of Genes Necessary for This Developmental Process.To demonstrate a causal relationship between fruit ripening defectsof transgenic lines and the impairment of active DNA demethyla-tion, the expression of CNR (21), RIPENING INHIBITOR (RIN)(24), NOR (25), and PHYTOENE SYNTHASE 1 (PSY1) (26, 27)genes was assessed in RNAi transgenic plants. These genes were
selected among others because they are necessary for the overallripening process (CNR, RIN, NOR), or specifically govern carot-enoid accumulation (PSY1), an important quality trait of maturetomato fruit. Moreover, the promoter regions of these genesshowed reduced methylation levels during fruit ripening in WTtomato (20, 21). It is noteworthy that CNR gene induction wasdelayed 15 d in transgenic fruits, and all three other genes showed adramatic reduction in expression level consistent with the ripeningdefect of the transgenic lines (Fig. 5A and SI Appendix, Fig. S7). Toassess whether repression of CNR, RIN, NOR, and PSY1 gene ex-pression in ripening fruits results from the maintenance of a highcytosine methylation status of their promoter upon down-regulationof SlDML2, methylsensitive-PCR (McrBC-PCR) analysis of thecorresponding promoters was performed. This approach revealed aripening-associated demethylation of the RIN, NOR, and PSY1promoters in WT and Azygous revertant fruits but not in SlDMLRNAi fruits (Fig. 5B). No detectable variations of methylation inthe CNR promoter during ripening of WT fruits were revealed withthis method. The putative differentially methylated regions (DMRs)in theNOR and PSY1 promoter regions were subsequently analyzedby gene specific bisulfite pyrosequencing (28). Methylation analysisof the CNR promoter was targeted to a region known to bemethylated at all stages (CNR1) (SI Appendix, Fig. S9C), used hereas a control for methylation and to a previously identified DMR(CNR2) (SI Appendix, Fig. S9C) (20, 21). For all three promoters,cytosines that became demethylated in ripeningWT fruits but not intransgenic fruits of the same age were identified (Fig. 6A and SIAppendix, Fig. S9). Two distinct situations were observed: (i) se-quences corresponding to putative RIN binding sites (RIN BS) inthe CNR and NOR promoters (20), where methylation is high at 20and 35 dpa in all plants analyzed and drops to very low levels duringripening of WT fruits but is maintained to high levels in RNAi fruitsof the same age; and (ii) sequences that are hypermethylated intransgenic fruits at all stages analyzed compared with WT fruits.These latter sequences include a newly identified DMR in the PSY1promoter and cytosines upstream and downstream to the RIN BS inthe NOR and CNR promoters. These data demonstrate the ab-solute requirement of promoter demethylation in critical genesfor ripening to occur. The data also suggest multiple patterns ofcytosine demethylation occurring either specifically during rip-ening or at earlier stages.
DiscussionPreviously reported analysis of DNA cytosine methylation andRIN binding during fruit development in WT and in the rin andCnr tomato-ripening mutants suggested a significant role forDNA methylation during ripening and a feedback loop betweenmethylation and ripening transcription factors (20, 21, 29). Here,we demonstrate for the first time to our knowledge that activeDNA demethylation is an absolute requirement for fruit ripeningto occur and show a direct cause and effect relationship betweenhypermethylation at specific promoters and repression of geneexpression. In this context, SlDML2 appears to be the mainregulator of the ripening associated DNA demethylation pro-cess. (i) SlDML2 is the only SlDML gene induced concomitantlyto the demethylation and induction of genes that control fruitripening; (ii) the specific knockdown of SlDML2 in VIGS-treated fruits leads to inhibition of fruit ripening similar to DML-RNAi fruits; and (iii) the hypermethylated phenotype describedin the Cnr and rin mutants (20) is associated with the specificrepression of SlDML2, with none of the other SlDML genes beingdown-regulated (Fig. 6B and Dataset S1).Indeed, we cannot formally rule out that SlDML1, which is
repressed in the transgenic RNAi lines, also participates in thegenomic DNA demethylation in fruits. However, SlDML1 ismainly expressed at early stages of fruit development and only atvery low levels during fruit ripening. Hence, this protein may also
WT DML8A
0
1000
2000 NOR
***
******
* *
0246 CNR
***
**
***
**
050
100150 PSY1
****
05000
1000015000 RIN
*** *** **** **
20 35 39 55 70 85 110
Rel
ativ
e ex
pres
sion
Rel
ativ
e ex
pres
sion
20 35 39 55 70 85 110
20 35 39 55 70 85 110 20 35 39 55 70 85 110
+ - + - + - + - + - + -
WT Azy DML8A
35 55
pNOR
Fruit phenotypeat 55 dpa
pRIN
pPSY1
pPME
pCNR
35 55 35 55 dpa
A
B
Fig. 5. Expression and demethylation at key genes controlling ripening areinhibited in DML RNAi plants. (A) Expression of the RIN, NOR, CNR, and PSY1genes in transgenic DML8A and WT fruits normalized to EF1α and to WTfruits at 20 dpa. Asterisks indicate significant difference [Student’s t test (n =3)] between WT and DML8A samples at a given stage: *P < 0.05; **P < 0.01;***P < 0.001. Error bars indicate means ± SD. (B) McrBC-PCR analysis of se-lected promoter fragments in fruits of WT, azygous (Azy), and DML8Aplants; 1 μg of genomic DNA was digested with McrBC (NEB) during 5h (+);(–) indicates negative control for the digestion reaction that was performedwithout GTP. In the WT and azygous plants, the part of NOR, RIN, and PSY1promoter regions analyzed are methylated at 35 dpa (no amplification) butare demethylated at 55 dpa (amplification). In DML8A plants, the threepromoter regions behave similarly to WT at 35 dpa but remained methyl-ated at 55 dpa (no amplification in both cases). The pectin-methyl esterase(PME ) promoter is used as an unmethylated control, and the CNR promoterfragment used here was found to be sufficiently methylated at all stages forcomplete digestion by McrBC.
4 of 6 | www.pnas.org/cgi/doi/10.1073/pnas.1503362112 Liu et al.

be involved in demethylation events but mainly those occurringat the early stages of fruit development.In addition to genes encoding major fruit ripening regulators,
those encoding enzymes involved in various aspects of fruit rip-ening are also likely to be demethylated, as suggested by the ob-servation that PSY1 gene expression also requires demethylation.Combined transcriptomic, methylomic, and metabolomic analysisof the transgenic lines described here will now be required todetermine the network of genes and metabolic processes primarilytargeted by demethylation in tomato fruit.SlDML2 is the likely focal point of a feedback regulation
on ripening-associated DNA demethylation, because this gene is
clearly down-regulated in fruits of the rin, nor, and Cnr mutants,contrary to the other SlDML genes that are normally expressed(Fig. 6 B and C and Dataset S1). It is plausible that timing andextent of demethylation may represent an important source ofvariation in the diversity of kinetics and intensity of ripeningfound among tomato varieties, thus presenting a frontier forfurther investigation. Controlling the timing and kinetics of ac-tive DNA demethylation in fruits may therefore provide newstrategies to enhance fruit shelf life. In addition, engineeringDNA demethylation in tomato fruits would be an innovative andnovel strategy for the improvement of traits of agronomicalrelevance in a species with little genetic diversity (30). Finally,
AB
C
Fig. 6. Bisulfite-sequencing analysis at the NOR, CNR, and PSY1 promoter fragments in WT and transgenic DML RNAi plants. (A) Heat-map representation ofDNA methylation at selected NOR, CNR, and PSY1 promoter regions (SI Appendix, Fig. S8) in fruits of control (WT1 and WT2) and transgenic (DML2A, -2B, -8A,and -8B) plants at five (WT and line 8) or four (line 2) developmental stages. For each promoter, two fragments have been analyzed (fragment 1, gray box;fragment 2, black box), the positions of which are shown in SI Appendix, Fig. S8 and Fig. S9. The position of the Cs within each promoter fragment is alsoshown (number in the columns on the right side), as defined in SI Appendix, Fig. S8. For each promoter, Cs have been clustered considering the two PCRfragments analyzed together. (B) Changes in expression of SlDML genes in fruits of Ailsa Craig (WT) and near-isogenic mutant lines rin, Cnr, and nor, asdetermined by microarrays analysis. For fruit development, days postanthesis are shown. Mature green is 40 dpa in Ailsa Craig and then Br is 49 dpa. Fornonripening mutants, Br onward are 49 dpa + 1–7 d. Asterisks indicate significant difference (variance ratio, F tests) between WT and mutant lines for theSlDML2 gene only to avoid overloading the figure: *P < 0.05; **P < 0.01; ***P < 0.001). Details of expression results and statistical analyses for all four genesare provided in Dataset S1. Error bars indicate means ± SD. (C) Proposed function of DNA demethylation in the control of fruit ripening; SlDML2 is necessary forthe active demethylation of the NOR, CNR, RIN, and PSY1 promoter region, thereby allowing these gene expressions. SlDML2 gene expression is reduced in therin, nor, and Cnr background, suggesting a regulatory loop. There is at this time no evidence of direct regulation of the SlDML2 gene by the RIN, NOR, or CNRprotein. SlDML2may control the expression of additional ripening induced gene, as shown in this study for the PSY1 gene and suggested by the demethylation ofseveral promoters during fruit ripening (20). Arrows indicate activation. Lines indicate repression: black, direct effects; gray, direct or indirect effects.
Liu et al. PNAS Early Edition | 5 of 6
PLANTBIOLO
GY

the recent demonstration that hypermethylation of a Myb pro-moter blocks anthocyanin accumulation during pear and appleripening (31, 32) supports the notion of a more general role fordemethylation in fruits. However, whether this mechanism oc-curs similarly during the ripening of all fleshy fruit species nowrequires further investigation.
Materials MethodsPlant Material and Experimental Plan.All experiments were performed using acherry tomato variety (Solanum lycopsersicum, cv WVA106) that was grownin greenhouse conditions, except for VIGS experiments, which were per-formed on Solanum lycopsersicum, cv Ailsa Craig grown in growth chambersas described (21). For the array experiments, fruit pericarp of Ailsa Craig andnear-isogenic mutants rin, nor, and Cnr were collected at 13 stages of fruitdevelopment and ripening with three independent biological replicates perline and immediately frozen in liquid nitrogen for RNA extraction and arrayanalysis. Details of tomato transformation, selection of line 2 and 8 used inthis study, and of VIGS experiments are provided in SI Appendix, Materialsand Methods.
For all analysis, two independent transgenic T2 plants (DML2A and -B andDML8A and -B for lines 2 and 8, respectively) and an azygous plant obtainedfrom line 8 were used. Additional T2 plants were eventually used as controlsfor the phenotypes of these four plants. T2 plants from line 2 presenteddramatic alterations of flower development, not visible in previous gener-ations, and were backcrossed to allow fruit development. This resulted in alimited number of fruits (see below). For this reason, not all developmentalstages could be analyzed for this line.
The experimental plan was designed to span tomato fruit developmentand ripening in cv West Virginia 106 (WVA106) and transgenic DML RNAiplants over a period of 85 d from fruit set to account for the strongly delayedripening phenotype of the transgenic fruits. At stages following maturegreen, the DML RNAi fruits diverge from the WT, because they are signifi-cantly delayed in ripening induction and almost completely ripeninginhibited. Because it was not possible to select stages equivalent to the Br (39dpa) or red ripe stages in the transgenic lines, we have chosen to analyzefruits identically staged, which allows comparing changes in the context of adevelopmental parameter (days postanthesis) that can be precisely mea-
sured. Two independent cultures were performed. (i) Plants from line 2 andthe relevant WT control (WT1), fruits were harvested at 20, 35, 55 (Br + 16),70 (Br + 31), and 85 (Br + 46) dpa. Because the fruit yield was reduced in line2, a sufficient number of fruits at the Br stage could not be harvested andolder fruits were preferentially selected to allow the analysis of late effectsof demethylation inhibition. (ii) Line 8 was grown together with its ownWT control (WT2) and an azygous plant. Because there were more fruitsavailable for this line, the Br stage (39 dpa) was harvested in addition of thestages used for line 2.
For all fruit samples, two individual T2 plants were used, and for eachsample, a minimum of six fruits separated in three biological replicates wereprocessed and stored at −80 °C until used.
Molecular and Metabolite Analysis. Details of molecular (gene expression,microarrays, McrBC-PCR analysis of gene DNA methylation, and gene-targetedbisulfite sequencing) and metabolite (Carotenoid, ethylene, and 1H-NMR)analysis are provided in SI Appendix, Materials and Methods.
ACKNOWLEDGMENTS. We thank Marie Mirouze for critical reading of themanuscript and Antoine Daunay and Nicolas Mazaleyrat for technicalsupport in bisulfite pyrosequencing analysis. We acknowledge Syngentaand specifically Dr. Charles Baxter for help with the tomato GeneChipstudies and Alex Marshall for help with the array analysis, as well as CécileCabasson and Jim Craigon for help in statistical analysis. Metabolomicprofiling was performed on the Metabolome Facility of Bordeaux Func-tional Genomics Center and supported by the French National Infrastructurefor Metabolomics and Fluxomics (MetaboHUB) funded by the Agence Natio-nale de Recherche (ANR, Project ANR-11-INBS-0010). R.L. was the recipient ofa grant from the Chinese Scholarship Council and P.G. of a Fulbright grant.G.B.S., T.C.H., and N.H.C. acknowledge financial support from the Biotechnologyand Biological Sciences Research Council, UK (Grants BB/F005458/1 andBB/J015598/1), and G.B.S. acknowledges support from the European Coop-eration in Science and Technology (COST) Action FA1106. Y.H., J.K., and C.W.were supported by Hangzhou Normal University and the National NaturalScience Foundation of China (NFSC, Grant 31370180). M.B. and M.L. re-ceived support from the Laboratoire d’Excellence (LABEX) entitled “Towardsa Unified theory of biotic Interactions; the roLe of environmental Per-turbations” (TULIP, ANR-10-LABX-41) and from the networking activitieswithin the European COST Action FA1106. J.J.G. was supported by NationalScience Foundation Grant IOS-1322714.
1. Law JA, Jacobsen SE (2010) Establishing, maintaining and modifying DNAmethylationpatterns in plants and animals. Nat Rev Genet 11(3):204–220.
2. Saze H, Tsugane K, Kanno T, Nishimura T (2012) DNA methylation in plants: Re-lationship to small RNAs and histone modifications, and functions in transposon in-activation. Plant Cell Physiol 53(5):766–784.
3. Chan SW, Henderson IR, Jacobsen SE (2005) Gardening the genome: DNA methylationin Arabidopsis thaliana. Nat Rev Genet 6(5):351–360.
4. Mirouze M, et al. (2012) Loss of DNA methylation affects the recombination land-scape in Arabidopsis. Proc Natl Acad Sci USA 109(15):5880–5885.
5. Zhang M, Kimatu JN, Xu K, Liu B (2010) DNA cytosine methylation in plant devel-opment. J Genet Genomics 37(1):1–12.
6. Bender J (2004) DNA methylation and epigenetics. Annu Rev Plant Biol 55(1):41–68.7. Finnegan EJ, Kovac KA (2000) Plant DNA methyltransferases. Plant Mol Biol 43(2-3):
189–201.8. Hsieh T-F, et al. (2009) Genome-wide demethylation of Arabidopsis endosperm.
Science 324(5933):1451–1454.9. Gong Z, et al. (2002) ROS1, a repressor of transcriptional gene silencing in Arabi-
dopsis, encodes a DNA glycosylase/lyase. Cell 111(6):803–814.10. Zhu J-K (2009) Active DNA demethylation mediated by DNA glycosylases. Annu Rev
Genet 43(1):143–166.11. Wu SC, Zhang Y (2010) Active DNA demethylation: Many roads lead to Rome. Nat Rev
Mol Cell Biol 11(9):607–620.12. Choi Y, et al. (2002) DEMETER, a DNA glycosylase domain protein, is required for
endosperm gene imprinting and seed viability in arabidopsis. Cell 110(1):33–42.13. Zhu J, Kapoor A, Sridhar VV, Agius F, Zhu J-K (2007) The DNA glycosylase/lyase ROS1
functions in pruning DNA methylation patterns in Arabidopsis. Curr Biol 17(1):54–59.14. Gehring M, Bubb KL, Henikoff S (2009) Extensive demethylation of repetitive ele-
ments during seed development underlies gene imprinting. Science 324(5933):1447–1451.
15. Yu A, et al. (2013) Dynamics and biological relevance of DNA demethylation inArabidopsis antibacterial defense. Proc Natl Acad Sci USA 110(6):2389–2394.
16. Yamamuro C, et al. (2014) Overproduction of stomatal lineage cells in Arabidopsismutants defective in active DNA demethylation. Nat Commun 5:4062.
17. Penterman J, et al. (2007) DNA demethylation in the Arabidopsis genome. Proc NatlAcad Sci USA 104(16):6752–6757.
18. Gehring M, Henikoff S (2007) DNA methylation dynamics in plant genomes. BiochimBiophys Acta 1769(5-6):276–286.
19. Bhutani N, Burns DM, Blau HM (2011) DNA Demethylation Dynamics. Cell 146(6):866–872.
20. Zhong S, et al. (2013) Single-base resolution methylomes of tomato fruit develop-ment reveal epigenome modifications associated with ripening. Nat Biotechnol 31(2):154–159.
21. Manning K, et al. (2006) A naturally occurring epigenetic mutation in a gene en-coding an SBP-box transcription factor inhibits tomato fruit ripening. Nat Genet 38(8):948–952.
22. Teyssier E, et al. (2008) Tissue dependent variations of DNA methylation and endor-eduplication levels during tomato fruit development and ripening. Planta 228(3):391–399.
23. Mok YG, et al. (2010) Domain structure of the DEMETER 5-methylcytosine DNA gly-cosylase. Proc Natl Acad Sci USA 107(45):19225–19230.
24. Vrebalov J, et al. (2002) A MADS-box gene necessary for fruit ripening at the tomatoripening-inhibitor (rin) locus. Science 296(5566):343–346.
25. Giovannoni JJ (2004) Genetic regulation of fruit development and ripening. Plant Cell16(Suppl):S170–S180.
26. Bartley GE, Viitanen PV, Bacot KO, Scolnik PA (1992) A tomato gene expressed duringfruit ripening encodes an enzyme of the carotenoid biosynthesis pathway. J BiolChem 267(8):5036–5039.
27. Ray J, et al. (1992) Cloning and characterization of a gene involved in phytoenesynthesis from tomato. Plant Mol Biol 19(3):401–404.
28. How-Kit A, et al. (2015) Accurate CpG and non-CpG cytosine methylation analysis byhigh-throughput locus-specific pyrosequencing in plants. Plant Mol Biol 88(4-5):471–485.
29. Chen W, et al. (2015) Requirement of CHROMOMETHYLASE3 for somatic inheritanceof the spontaneous tomato epimutation Colourless non-ripening. Sci Rep 5:9192.
30. Lin T, et al. (2014) Genomic analyses provide insights into the history of tomatobreeding. Nat Genet 46(11):1220–1226.
31. Telias A, et al. (2011) Apple skin patterning is associated with differential expressionof MYB10. BMC Plant Biol 11(1):93.
32. Wang Z, et al. (2013) The methylation of the PcMYB10 promoter is associated withgreen-skinned sport in Max Red Bartlett pear. Plant Physiol 162(2):885–896.
6 of 6 | www.pnas.org/cgi/doi/10.1073/pnas.1503362112 Liu et al.

1
SI Appendix
SI Materials and methods
Tomato transformation
Tomato transformation
For tomato transformation, a 223bp fragment (Fig. S2A) corresponding to part of the
highly conserved HhH-GPD domain of DNA glycosylase Lyase was amplified from the
SlDML1 cDNA and cloned in sense and antisense orientation in pK7GWIWG2 (I)
plasmid to form a hairpin structure necessary for to RNA silencing. The recombinant
plasmid named pK7GWSlDML was introduced in the A. tumefaciens strain GV3101.
Subsequently, tomato cotyledon transformation was done as described in Gonzalez et
al. (S1). Twenty five regenerated shoots were selected from independent calli and
cultured as described in How Kit et al. (S2). Twenty five kanamycin resistant T0 plants
were transferred to the greenhouse and grown to obtain T1 seeds.
Among the 25 independent T0 transgenic plants obtained, 8 including plants 2 and 8,
presented delayed and limited ripening phenotypes. Plants 2 and 8 were selected for
further studies and self-pollinated and backcrossed, respectively, to generate lines 2 and
8. Backcrossing of the T0 plant 8 was necessary due to flower abnormality. Twenty five
T1 plants were grown in each case and were classified based on the level of SlDML
expression as determined by semi quantitative RT–PCR on 20 dpa fruits and used for
preliminary phenotype characterization. No flower abnormality was observed on T1
plants that were therefore self-pollinated. Complete phenotypic and molecular analyses
were performed on T2 plant population obtained after selfing of a single homozygote
(line 2) or hemizygote (line 8) T1 plant.
VIGS experiments
For VIGS experiments a 480 bp PCR amplified fragment corresponding to the 5’ coding
sequence of SlDML2 was inserted into the PVX vector (21). This part of the gene has no
significant homology with any of the other tomato SlDML genes. VIGS and analysis of
VIGS experiments were as described (21), using 80 independent fruits injected at 12
days post anthesis.
Molecular Analysis
Gene expression analysis
Absolute quantification of transcript was performed as described (S3). For each gene,
PCR fragments were cloned and controlled by sequencing and a calibration curve was
done. For comparative RT-QPCR, experiments were performed as described (S2).
Normalization of data was done according to Pfaffl et al. (S4) using EF1 alpha as a
reference gene and a reference sample. An ANOVA two ways was performed and
difference in gene expression levels between Wild Type and transgenic plants were

2
assessed using a student t test (n=3; *: p<0.05; **: p<0.01; ***p<0.001). All primers
used for RT PCR analysis are listed in Table S2.
For microarrays analysis, total RNA was isolated from rin, nor Cnr and wild type Ailsa
Craig pericarp samples according to methods as described in (21). The concentration of
RNA was determined using an Agilent Bioanalyser 2100 (Agilent Technologies). Total
RNA was treated with DNA-free (Ambion) as per the manufacturer’s instructions. RNA
was then hybridized to the Syngenta Tomato Affymetrix GeneChip.™ The microarrays
were normalized using the Robust Multichip Average (RMA) method with the
Bioconductor Affymetrix package (S5), which both accounts for the background
correction using the perfect match (PM) features for quantile normalization of all the
arrays (S6) and for condensing probes into probe regions (hereafter referred to as genes)
(S7). The expression values are arbitrary units of fluorescence intensity.
A linear mixed model was fitted to the logarithm of the DML data with genotype,
developmental stage and gene considered as fixed effects and plant and fruit-within-
plant as random terms in the model. The significance of the fixed effects and their
interactions were tested using the Variance ratio F- tests output by the mixed model
fitting routines within the Genstat 17 statistical package
McrBC-PCR Analysis
For methylation analysis, genomic DNA were purified from fruit pericarp using the
illustra DNA extraction kit Phytopure (GE Healthcare, UK), quantified at 260nm and
quality control was performed after electrophoresis on a 1% agarose gel. For McrBC-
PCR methylation analysis, 1µg of genomic DNA was digested with McrBC (NEB) for
5h according to manufacturer instructions with or without GTP as a negative control.
PCR amplification was performed with 50 ng of genomic DNA with the relevant
primers shown in Table S2.
Bisulfite sequencing
Gene specific BS sequencing was performed essentially as described in (28). Briefly,
PCR primers for bisulfite treated DNA amplification were designed with Primer3
(http://bioinfo.ut.ee/primer3-0.4.0/) using the unconverted genomic DNA sequence as
input sequence. As every C nucleotide can be potentially methylated in plants and in
order to avoid any sequence selection bias during PCR amplification, “C” and “G”
nucleotides were replaced by “Y” and “R” nucleotides in forward and reverse primers
respectively. All primers are listed in Table S2.
One microgram of genomic DNA was used for bisulfite treatment conversion using the
EpiTect 96 Bisulfite Kit (Qiagen, Courtaboeuf/France) according to manufacturer’s

3
instructions. The absence of unconverted genomic DNA was assessed processing a
whole-genome amplified sample (Whole Genome Amplification (WGA) kit, Sigma-
Aldrich) simultaneously with the bisulfite conversion of all samples, which presented a
DNA methylation value of 0% for every C position of each amplicon after
pyrosequencing. PCR amplification of the selected promoter fragments, purification of
PCR products and pyrosequencing experiments were performed as described (S8). DNA
methylation patterns were analyzed with the PyroMArk CpG software (Qiagen) and by
an in-house developed Microsoft Excel Visual Basic Application for Cytosines outside
CpG sites. For each sample, average DNA methylation value of each cytosine or
cytosine group (CC, CCC) obtained by pyrosequencing of the three regions of interest
(CNR, NOR and PSY1) were pooled to generate a matrix. Heatmap representation of
the data was then performed using “heatmap2” function of “gplots” package of the R
software. Hierarchical unsupervised clustering between columns and rows were
computed using Euclidean distance and complete linkage method as agglomerative
method.
Metabolite analysis
Ethylene production analysis
Ethylene production was assayed on individual fruit after 2 h by withdrawing 1-ml gas
samples from sealed jars. Gas samples were analyzed via gas chromatography (7820A
GC system Agilent Technologies, Santa Clara, CA, USA, http://
www.chem.agilent.com/en-US/products-services/Instruments-Systems/Gas-
Chromatography/7820A-GC/Pages/default.aspx). Ethylene was identified via co-
migration with an ethylene standard and quantified with reference to a standard curve
for ethylene concentration.
Carotenoid analysis
Carotenoid analysis was done as described (S3). Samples from transgenic plants
DML2A, B and DML8A, B were compared to those of WT1 and WT2 respectively.
Differences between samples were evaluated using an ANOVA and Tukey’s test ( n=3,
*: p<0.05; **: p<0.01; ***p<0.001).
1H-NMR Metabolite analysis
For 1H-NMR analysis, polar metabolites were extracted from ground Solanum
lycopersicum L., cv WVA106 pericarp fruit. Briefly, the frozen powdered samples were
lyophilised and polar metabolites were extracted from 15 to 30 mg of lyophilised

4
powder samples with an ethanol–water series at 80°C. The supernatants were combined,
dried under vacuum and lyophilized. Each lyophilized extract was solubilized in 500 µL
of 300 mM potassium phosphate buffer pH 6.0, in D2O. Ethylene diamine tetraacetic
acid disodium salt (EDTA) was added at a final concentration of 3 mM. Each extract
was titrated with KOD solution to pH 6 and lyophilized again. The lyophilized titrated
extracts were stored in darkness under vacuum at room temperature, before 1H-NMR
analysis was completed within one week.
1H-NMR analysis was performed using 500 µL of D2O with sodium trimethylsilyl
[2,2,3,3-2H4] propionate (TSP, 0.01% final concentration for chemical shift calibration)
added to the lyophilized titrated extracts. The mixture was centrifuged at 17,700 g for 5
min at room temperature. The supernatant was then transferred into a 5 mm NMR tube
for acquisition. Quantitative 1H-NMR spectra were recorded at 500.162 MHz and 300 K
on a Bruker Avance III spectrometer (Wissembourg, FR) using a 5-mm broadband
inverse probe, a 90° pulse angle and an electronic reference for quantification The
assignments of metabolites in the NMR spectra were made by comparing the proton
chemical shifts with literature or database values (S9), by comparison with spectra of
authentic compounds and by spiking the samples. For assignment purposes, 1H-
1H
COSY, spectra were acquired for selected samples. For absolute quantification three
calibration curves (glucose and fructose: 2.5 to 100 mM, glutamate and glutamine: 0 to
30 mM) were prepared and analysed under the same conditions. The glucose calibration
was used for the quantification of all amino-acids, as a function of the number of
protons of selected resonances except fructose, glutamate and glutamine that were
quantified using their own calibration curve. The metabolite concentrations were
calculated using AMIX (version 3.9.10, Bruker) and Excel (Microsoft, Redmond, WA,
USA) softwares.
To explore the metabolite multidimensional data set, one unsupervised multivariate
statistical method was used on mean-centered data scaled to unit variance: Principal
Component Analysis (PCA). PCA was used to visualize the grouping of the different
samples without any knowledge of their group. PCA was performed of absolute
concentration of 31 metabolites issued from 1H-NMR analysis of transgenic and
corresponding WT controls tomato pericarp fruit harvested at 20, 35, 40, 55, 70, 85 and
110 days post pollination (dpa), using SAS software version 8.01 (SAS Institute 1990).
For individual metabolites, means ± standard deviations (sd) were calculated from three
biological replicates. For all biochemical analyses two extractions were completed to
measure the concentration of each biological replicate, then the mean of three biological
replicates was calculated. Mean comparisons were conducted using an ANOVA
followed by Tukey’s t –test.

SlDML1
SlDML2
AtROS1
SlDML3
AtDME
AtDML2
SlDML4
AtDML3
100
81
98
87
91
0.2Domain A Glycosylase Domain Domain B
SlDML2 (1824)
SlDML4 (1538)
SlDML3 (1869)
SlDML1 (1702)
AtDME (1729)
AtROS1 (1393)
AtDML2 (1332)
AtDML3 (1044)
SI Supplementary Figures
Fig. S1
Figure S1: Comparison of DNA Glycosylase Lyase sequences from tomato and from Arabidopsis
thaliana. (A) Schematic diagram of domain structures of tomato and Arabidopsis thaliana DNA
Glycosylase Lyase proteins. Numbers on the right indicate the number of amino acids in each protein. The
positions of the domains are indicated in Table S1. (B) Phylogenetic analysis. An unrooted dendogram was
generated using the Maximum Likelihood method in MEGA v.6 based on the JTT model (S 10). Sequences
of DNA glycosylase proteins were aligned using Muscle. The numbers at the branching points indicate the
percentage of times that each branch topology was found during bootstrap analysis (n=1000). (C) The Helix-
hairpin-helix -Gly/Pro rich domain (HhH-GPD) domain of tomato DNA Demethylase was aligned with
those of Arabidopsis. Red dot indicates the highly conserved Lysine residue necessary for catalytic activity,
blue dot shows the conserved aspartic acid residue present in the active site and green dots show the cysteine
residues that constitute a [4Fe–4S] cluster (23). Accession numbers are indicated in Table S1.
90AtDemeter
89AtROS1
90AtDML2
87AtDML3
90SlDML1
90SlDML2
90SlDML3
89SlDML4
M
.
S
K
A
A
R
M
K
G
K
N
K
K
K
S
G
K
E
E
K
N
R
R
T
K
S
K
E
G
K
E
L
V
A
T
G
Q
V
K
A
L
K
G
P
L
E
N
D
K
S
I
G
G
E
K
G
E
T
I
K
K
G
L
K
E
Q
E
E
E
D
P
K
K
K
D
K
K
K
K
P
K
K
E
Q
E
K
R
T
A
S
I
N
N
A
E
S
F
V
V
V
I
F
F
Q
D
D
D
D
D
D
D
W
W
W
W
W
W
W
W
D
D
D
N
D
D
D
D
S
C
S
N
S
S
S
R
L
L
L
L
L
L
L
L
R
R
R
R
R
R
R
R
K
R
K
.
L
L
K
.
D
E
E
R
Q
Q
E
K
V
A
A
M
A
A
V
A
E
Q
E
Y
E
Q
Q
Y
G
A
S
T
S
A
S
S
N
R
G
K
N
N
K
T
E
A
G
E
G
G
S
G
G
G
R
G
K
K
G
T
R
I
K
.
K
K
K
Y
Q
R
R
.
R
R
K
T
E
E
E
S
E
E
E
G
R
K
R
R
K
R
R
S
N
T
T
P
T
T
S
T
K
R
E
E
A
A
K
E
N
S
R
M
N
N
D
S
N
T
T
H
T
T
A
N
M
M
M
M
M
M
M
R
D
D
D
D
D
D
D
D
S
T
T
S
S
S
S
S
I
V
V
V
L
L
L
V
D
D
D
N
D
D
N
N
Y
W
W
W
W
Y
Y
W
E
K
D
S
D
E
E
E
A
A
A
D
A
A
A
A
I
I
L
V
V
V
V
V
R
R
R
R
R
R
R
R
R
A
C
L
C
C
S
H
A
A
T
S
A
A
A
A
S
D
D
G
D
N
A
D
I
V
V
Q
V
V
V
V
S
K
H
N
N
N
K
K
E
E
K
V
E
E
E
M
I
V
I
L
I
I
I
I
S
A
A
E
S
A
S
F
E
E
N
T
H
H
D
E
A
T
I
T
T
T
A
Q
I
I
I
I
I
I
I
I
K
K
I
K
R
R
K
K
E
S
K
K
E
E
E
C
R
R
R
R
R
R
R
R
G
G
G
G
G
G
G
G
M
M
M
Q
M
M
M
Q
N
N
N
F
N
N
N
G
N
H
N
R
N
N
N
N
M
K
M
I
M
K
M
V
L
L
L
L
L
L
L
L
A
A
A
S
A
A
A
A
V
E
E
E
E
E
E
A
R
R
R
R
R
R
R
K
I
I
I
I
I
I
I
I
K
Q
K
L
K
Q
K
K
D
G
A
K
D
A
D
N
F
F
F
F
F
F
F
F
L
L
L
L
L
L
L
L
E
D
N
N
N
N
D
N
R
R
R
D
R
R
R
R
I
L
L
E
I
I
L
S
V
V
V
V
F
V
V
F
K
N
K
N
R
S
R
E
D
D
K
Q
E
D
D
H
H
H
H
N
H
H
H
H
G
G
G
G
G
G
G
G
G
S
S
N
S
S
S
S
I
I
I
I
I
I
I
V
D
D
D
D
D
D
D
D
L
L
L
L
L
L
L
L
E
E
E
E
E
E
E
E
W
W
W
W
W
W
W
W
L
L
L
L
L
L
L
L
R
R
R
R
R
R
R
R
E
D
D
N
D
D
D
D
180AtDemeter
179AtROS1
180AtDML2
177AtDML3
180SlDML1
180SlDML2
180SlDML3
179SlDML4
S
V
V
A
V
V
V
V
P
P
P
P
P
P
A
P
P
P
P
S
P
P
P
K
D
D
D
H
D
D
D
E
K
K
K
L
K
K
K
D
A
A
A
V
A
A
A
V
K
K
K
K
K
K
K
K
D
E
E
R
E
E
E
E
Y
Y
Y
Y
Y
Y
Y
Y
L
L
L
L
L
L
L
L
L
L
L
L
L
L
L
L
S
S
S
E
S
S
S
S
I
F
I
I
I
I
I
I
R
N
N
E
R
R
R
Y
G
G
G
G
G
G
G
G
L
L
L
I
L
L
L
L
G
G
G
G
G
G
G
G
L
L
L
L
L
L
L
P
K
K
K
K
K
K
K
K
S
S
S
S
S
S
S
S
V
V
V
A
V
V
V
T
E
E
E
E
E
E
E
D
C
C
C
C
C
C
C
C
V
V
V
V
V
V
V
I
R
R
R
R
R
R
R
R
L
L
L
L
L
L
L
L
L
L
L
L
L
L
L
L
T
T
S
G
T
T
T
S
L
L
L
L
L
L
L
L
H
H
H
K
H
H
H
R
N
H
Q
H
N
H
N
H
L
L
I
H
L
L
L
H
A
A
A
A
A
A
A
S
F
F
F
F
F
F
F
F
P
P
P
P
P
P
P
P
V
V
V
V
V
V
V
V
D
D
D
D
D
D
D
D
T
T
T
T
T
V
T
I
N
N
N
N
N
N
N
N
V
V
V
V
V
V
V
V
G
G
G
G
G
G
G
A
R
R
R
R
R
R
R
R
I
I
I
I
I
I
I
I
A
A
A
A
A
A
A
V
V
V
V
V
V
V
V
V
R
R
R
R
R
R
R
R
M
L
L
L
L
L
L
L
G
G
G
G
G
G
G
G
W
W
W
L
W
W
W
W
V
V
V
V
V
V
V
V
P
P
P
P
P
P
P
P
L
L
L
L
L
L
L
L
Q
Q
Q
E
Q
Q
Q
Q
P
P
P
P
P
P
P
P
L
L
L
L
L
L
L
L
P
P
P
P
P
P
P
P
E
E
D
N
E
E
E
D
S
S
E
G
S
S
S
G
L
L
L
V
L
L
L
L
Q
Q
Q
Q
Q
Q
Q
Q
L
L
M
M
L
L
L
M
H
H
H
H
H
H
H
H
L
L
L
Q
L
L
L
L
L
L
L
L
L
L
L
L
E
E
E
F
E
E
E
E
L
M
L
E
L
L
L
K
Y
Y
Y
Y
Y
Y
Y
F
P
P
P
P
P
P
P
P
V
M
V
S
V
I
I
L
L
L
L
M
L
L
L
E
E
E
E
D
E
E
E
S
S
S
S
S
S
S
S
S
I
I
V
I
I
I
I
I
Q
Q
Q
Q
Q
Q
Q
Q
K
K
K
K
K
Q
K
K
F
Y
Y
Y
Y
Y
Y
Y
L
L
L
L
L
L
L
L
W
W
W
W
W
W
W
W
P
P
P
P
P
P
P
P
R
R
R
R
R
R
R
R
L
L
L
L
L
L
L
L
C
C
C
C
C
C
C
C
K
K
K
K
K
K
K
E
L
L
L
L
L
L
L
L
D
D
D
P
D
D
D
D
Q
Q
Q
Q
Q
Q
Q
V
R
K
K
E
R
R
R
S
T
T
T
T
T
T
T
T
L
L
L
L
L
L
L
L
Y
Y
Y
Y
Y
Y
Y
Y
236AtDemeter
229AtROS1
236AtDML2
233AtDML3
236SlDML1
236SlDML2
236SlDML3
235SlDML4
E
E
E
E
E
E
E
E
L
L
L
L
L
L
L
L
H
H
H
H
H
H
H
H
Y
Y
Y
Y
Y
Y
Y
Y
Q
Q
H
Q
H
H
H
H
L
M
M
M
M
M
M
M
I
I
I
I
I
I
I
I
T
T
T
T
T
T
T
T
F
F
F
F
F
F
F
F
G
G
G
G
G
G
G
G
K
K
K
K
K
K
K
K
V
V
V
V
V
V
V
V
F
F
F
F
F
F
F
F
C
C
C
C
C
C
C
C
T
T
T
T
S
T
T
T
K
K
K
K
K
K
K
K
S
S
V
T
S
S
S
K
R
K
K
I
K
K
K
K
P
P
P
P
P
P
P
P
N
N
N
N
N
N
N
N
C
C
C
C
C
C
C
C
N
N
N
N
N
N
N
D
A
A
A
A
A
A
A
A
C
C
C
C
C
C
C
C
P
P
P
P
P
P
P
P
M
M
M
M
M
L
L
L
R
K
K
K
R
R
R
R
G
G
A
S
G
G
A
T
E
E
E
E
E
E
E
E
C
C
C
C
C
C
C
C
R
R
R
K
R
R
R
R
H
H
H
Y
H
H
H
H
F
F
Y
F
F
F
F
F
A
A
S
A
A
A
A
A
S
S
S
S
S
S
S
S
A
A
A
A
A
A
A
A
Y
F
R
Y
F
F
Y
F
A
A
A
V
A
A
A
A
S
S
S
S
S
S
S
S
A
A
A
S
A
A
A
T
R
R
R
K
R
R
R
R
L
L
L
V
L
L
L
L
A
A
A
L
A
A
A
R
L
L
L
L
L
L
L
L
P
P
P
E
P
P
P
P
A
S
E
S
A
A
G
G
P
T
P
P
P
P
P
P
E
E
E
E
E
E
E
Q
E
K
E
E
E
E
E
Q
R
G
S
K
K
K
K
K
S
.
D
M
S
S
S
G
L
.
R
H
I
I
I
E
T
.
T
E
V
V
V
A
S
.
S
P
S
S
S
D
A
.
V
N
A
A
S
S
T
.
M
T
T
T
A
K
AtDemeter 1178
AtROS1 846
AtDML2 777
AtDML3 488
SlDML1 1139
SlDML2 1255
SlDML3 1267
SlDML4 980
1413
1074
1012
720
1374
1490
1502
1214
A B
C
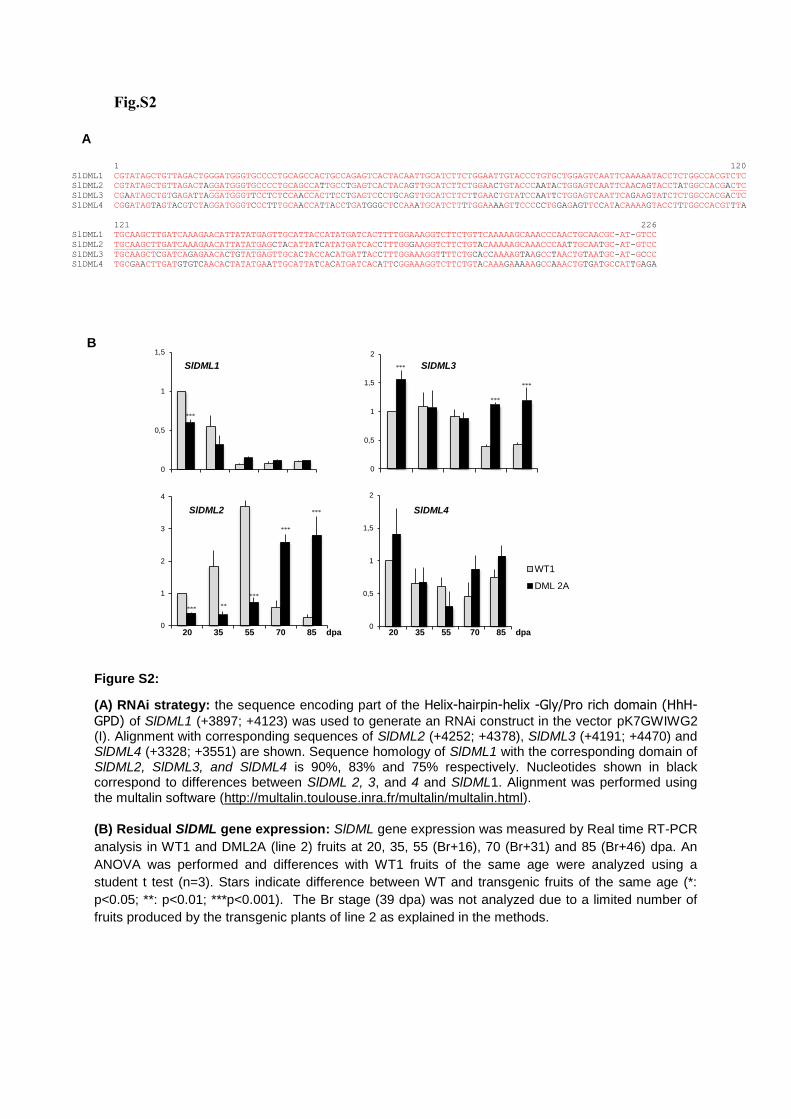
1 120
SlDML1 CGTATAGCTGTTAGACTGGGATGGGTGCCCCTGCAGCCACTGCCAGAGTCACTACAATTGCATCTTCTGGAATTGTACCCTGTGCTGGAGTCAATTCAAAAATACCTCTGGCCACGTCTC
SlDML2 CGTATAGCTGTTAGACTAGGATGGGTGCCCCTGCAGCCATTGCCTGAGTCACTACAGTTGCATCTTCTGGAACTGTACCCAATACTGGAGTCAATTCAACAGTACCTATGGCCACGACTC
SlDML3 CGAATAGCTGTGAGATTAGGATGGGTTCCTCTCCAACCACTTCCTGAGTCCCTGCAGTTGCATCTTCTTGAACTGTATCCAATTCTGGAGTCAATTCAGAAGTATCTCTGGCCACGACTC
SlDML4 CGGATAGTAGTACGTCTAGGATGGGTCCCTTTGCAACCATTACCTGATGGGCTCCAAATGCATCTTTTGGAAAAGTTCCCCCTGGAGAGTTCCATACAAAAGTACCTTTGGCCACGTTTA
121 226
SlDML1 TGCAAGCTTGATCAAAGAACATTATATGAGTTGCATTACCATATGATCACTTTTGGAAAGGTCTTCTGTTCAAAAAGCAAACCCAACTGCAACGC-AT-GTCC
SlDML2 TGCAAGCTTGATCAAAGAACATTATATGAGCTACATTATCATATGATCACCTTTGGGAAGGTCTTCTGTACAAAAAGCAAACCCAATTGCAATGC-AT-GTCC
SlDML3 TGCAAGCTCGATCAGAGAACACTGTATGAGTTGCACTACCACATGATTACCTTTGGAAAGGTTTTCTGCACCAAAAGTAAGCCTAACTGTAATGC-AT-GCCC
SlDML4 TGCGAACTTGATGTGTCAACACTATATGAATTGCATTATCACATGATCACATTCGGAAAGGTCTTCTGTACAAAGAAAAAGCCAAACTGTGATGCCATTGAGA
0
0,5
1
1,5
20DPA
35DPA
55DPA 70DPA
85DPA
SlDML1
***
0
0,5
1
1,5
2
20 DPA35 DPA 55DPA 70 DPA85 DPA
SlDML3
***
***
***
0
1
2
3
4
20 DPA35 DPA55DPA70 DPA85 DPA
*** **
***
***
***
20 35 55 70 85 dpa
SlDML2
0
0,5
1
1,5
2
WT1
DML 2A
SlDML4
20 35 55 70 85 dpa
Fig.S2
Figure S2:
(A) RNAi strategy: the sequence encoding part of the Helix-hairpin-helix -Gly/Pro rich domain (HhH-
GPD) of SlDML1 (+3897; +4123) was used to generate an RNAi construct in the vector pK7GWIWG2 (I). Alignment with corresponding sequences of SlDML2 (+4252; +4378), SlDML3 (+4191; +4470) and SlDML4 (+3328; +3551) are shown. Sequence homology of SlDML1 with the corresponding domain of SlDML2, SlDML3, and SlDML4 is 90%, 83% and 75% respectively. Nucleotides shown in black correspond to differences between SlDML 2, 3, and 4 and SlDML1. Alignment was performed using the multalin software (http://multalin.toulouse.inra.fr/multalin/multalin.html).
(B) Residual SlDML gene expression: SlDML gene expression was measured by Real time RT-PCR
analysis in WT1 and DML2A (line 2) fruits at 20, 35, 55 (Br+16), 70 (Br+31) and 85 (Br+46) dpa. An
ANOVA was performed and differences with WT1 fruits of the same age were analyzed using a
student t test (n=3). Stars indicate difference between WT and transgenic fruits of the same age (*:
p<0.05; **: p<0.01; ***p<0.001). The Br stage (39 dpa) was not analyzed due to a limited number of
fruits produced by the transgenic plants of line 2 as explained in the methods.
A
B
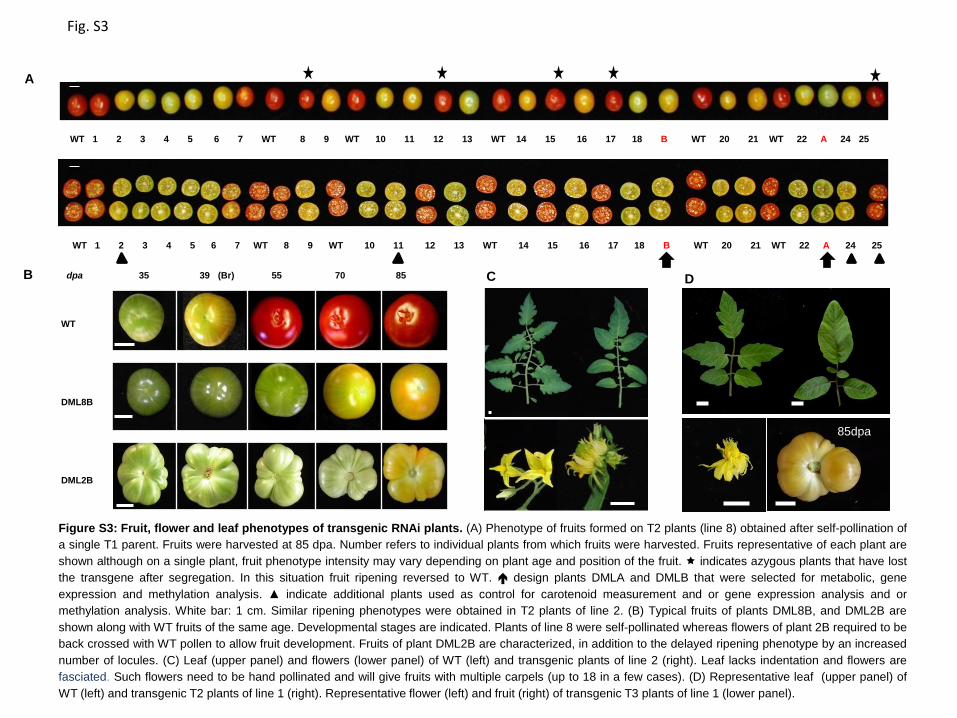
WT 1 2 3 4 5 6 7 WT 8 9 WT 10 11 12 13 WT 14 15 16 17 18 B WT 20 21 WT 22 A 24 25
A
B
WT
DML8B
DML2B
dpa 35 39 (Br) 55 70 85 C
WT 1 2 3 4 5 6 7 WT 8 9 WT 10 11 12 13 WT 14 15 16 17 18 B WT 20 21 WT 22 A 24 25
Figure S3: Fruit, flower and leaf phenotypes of transgenic RNAi plants. (A) Phenotype of fruits formed on T2 plants (line 8) obtained after self-pollination of
a single T1 parent. Fruits were harvested at 85 dpa. Number refers to individual plants from which fruits were harvested. Fruits representative of each plant are
shown although on a single plant, fruit phenotype intensity may vary depending on plant age and position of the fruit. indicates azygous plants that have lost
the transgene after segregation. In this situation fruit ripening reversed to WT. design plants DMLA and DMLB that were selected for metabolic, gene
expression and methylation analysis. ▲ indicate additional plants used as control for carotenoid measurement and or gene expression analysis and or
methylation analysis. White bar: 1 cm. Similar ripening phenotypes were obtained in T2 plants of line 2. (B) Typical fruits of plants DML8B, and DML2B are
shown along with WT fruits of the same age. Developmental stages are indicated. Plants of line 8 were self-pollinated whereas flowers of plant 2B required to be
back crossed with WT pollen to allow fruit development. Fruits of plant DML2B are characterized, in addition to the delayed ripening phenotype by an increased
number of locules. (C) Leaf (upper panel) and flowers (lower panel) of WT (left) and transgenic plants of line 2 (right). Leaf lacks indentation and flowers are
fasciated. Such flowers need to be hand pollinated and will give fruits with multiple carpels (up to 18 in a few cases). (D) Representative leaf (upper panel) of
WT (left) and transgenic T2 plants of line 1 (right). Representative flower (left) and fruit (right) of transgenic T3 plants of line 1 (lower panel).
D
85dpa
Fig. S3
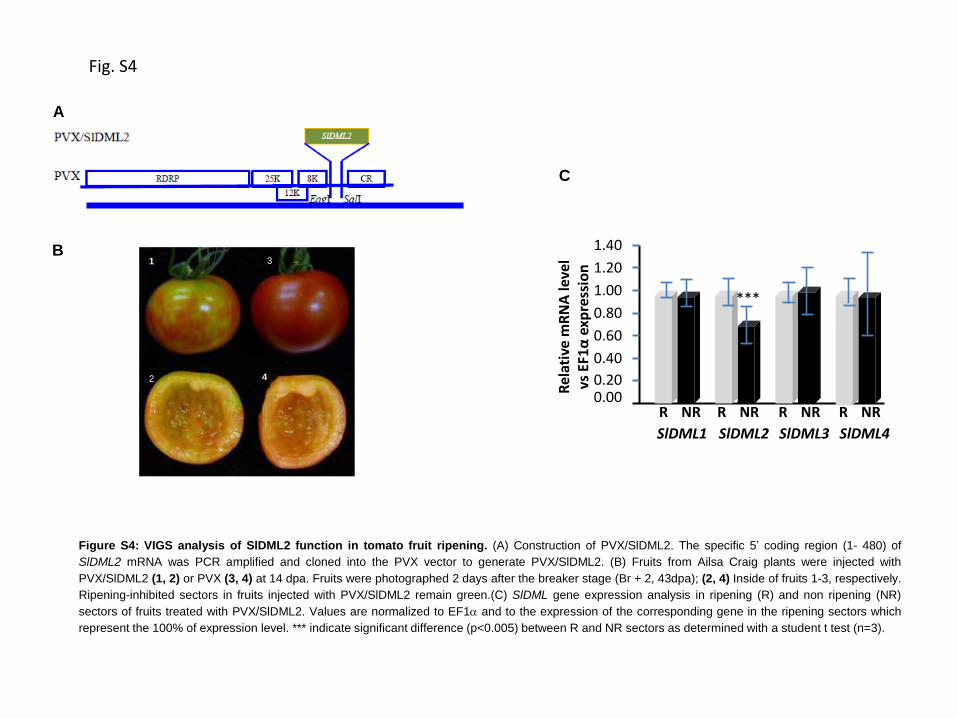
Figure S4: VIGS analysis of SlDML2 function in tomato fruit ripening. (A) Construction of PVX/SlDML2. The specific 5’ coding region (1- 480) of
SlDML2 mRNA was PCR amplified and cloned into the PVX vector to generate PVX/SlDML2. (B) Fruits from Ailsa Craig plants were injected with
PVX/SlDML2 (1, 2) or PVX (3, 4) at 14 dpa. Fruits were photographed 2 days after the breaker stage (Br + 2, 43dpa); (2, 4) Inside of fruits 1-3, respectively.
Ripening-inhibited sectors in fruits injected with PVX/SlDML2 remain green.(C) SlDML gene expression analysis in ripening (R) and non ripening (NR)
sectors of fruits treated with PVX/SlDML2. Values are normalized to EF1a and to the expression of the corresponding gene in the ripening sectors which
represent the 100% of expression level. *** indicate significant difference (p<0.005) between R and NR sectors as determined with a student t test (n=3).
A
B 1
2
3
4
0.20
0.40
0.60
0.80 ***
1.20
1.40
0.00 NR R NR R NR R NR R
SlDML2 SlDML3 SlDML4 SlDML1
1.00
Rel
ativ
e m
RN
A le
vel
vs E
F1α
exp
ress
ion
C
Fig. S4

Figure S5: characterization of the metabolites content of the transgenic RNAi fruits. (A) PCA was performed with MatLab
Software (version 7.4.0) to evaluate the grouping of samples without any knowledge of their group, using the absolute
concentration of 31 metabolites determined from 1H-NMR analysis of WT2 (△) and DML8B (o) [upper panel] and WT1 (△) and
DML2A (o) and DML2B (□) [lower panel] tomato pericarp fruit harvested at 20, 35, 39, 55, 70, 85 and 110 dpa. PC1, (33.88% of the
global variability) separates WT fruits at 55, 70, 85 [upper and lower panels] and 110 dpa, [upper panel] from all other samples.
PC2 (19.15% of the total variability) separates fruit samples of WT1, WT2 and transgenic (DML8B and DML2A, 2B) at 20 dpa from
35dpa and 39dpa, irrespective to their genotype. (B) Sugar (sucrose, glucose, fructose, galactose and rhamnose), (C) organic
acids (malic and citric acids) and (D) amino acids (aspartate, asparagine, glutamate, glutamine and GABA) content was determined
by quantitative 1H NMR spectroscopy as previously described (Sup ref S11) using for each stage and plant a minimum of 6 fruits in
3 biological replicates. An ANOVA one way was performed and difference between samples were evaluated using a t student test
(n=3). Stars indicate difference between WT and transgenic fruits of the same age (*: p<0.05; **: p<0.01; ***: p<0.001).
A
B
C
D
A
Fig. S5

0
5
10
15
20
25
30
35
40
45
50
30 Br/39 Br +6 Br+ 16 Br+26 Br+36 Br+46
WT
DML 2
DML 8
***
***
nd
*
nl o
f C
2H
4/ g
FW
/h
30 39 (Br) 45 55 65 75 85 dap
Figure S6: Ethylene production in WT and transgenic fruits
Fruits were harvested from 2 (line 2) or 4 (line 8) independent T2 plants at the developmental stages indicated and analyzed individually for
ethylene production. Values represent the average of a minimum of 4 to 10 independent fruits for each line and time point. An Anova was
performed and differences between samples were evaluated using a turkey’s test. Stars indicate difference between WT and transgenic
fruits of the same age (*: p<0.05; **: p<0.01; ***: p<0.001). The Breaker stage (Br) for WT fruits corresponds to 39 +/-1 dpa.
Fig. S6

PSY1
RIN
NOR
CNR
*
*
0
1000
2000
20 35 55 70 85
*
0
1
2
3
4
20 35 55 70 85
WT1
DML 2A
dpa
**
**
*
**
** 0
20
40
60
20 35 55 70 85
0
10000
20000
30000
20 35 55 70 85
**
**
Figure S7: Candidate gene expression during the ripening of RNAi transgenic fruits of line 2 plants
RIN, NOR, CNR and PSY1 gene expression was analyzed in the transgenic plant DML2A during fruit ripening using real time RT-PCR.
Primers are listed in Table S2. Values are normalized to EF1α and to the WT fruits at 20dpa. Stars (*: p<0.05; **: p<0.01; ***: :p<0.001)
indicate significant difference between WT and DML2A plants at a given stage using a student t test (n=3).
WT1
DML2A
Fig S7

Figure S8 RIN (Solyc05g012020). -2132 ATCTGGTACATAAACTATTGTGCTTATGTAGAATTTGGGGAAGAAACGTCAAGGAATATAATGTAAAGTATAGTAGACAATTTATTTTATCGTATACATATTAATAATTATTTTCACGATTCGAATATATATAACCGATAGATCACACAATAATAAATATTAGTGTTGCTCATCGAAAACTCCGATGCACTAATGTTTGCCACTAATTCTTAAGATAGATAACAAACACATCTAAACATTATTAATTAAGTGTATATATACAACATATTTTAAACTTATTCTATAACTGGATTTCAATTTAAAAAAAATAATGATGTGTCATGTCCCAAAGTTAGTTGCACTCTAAAAAAAGTTAAAAGGTTTTTAACCAAAAATAACTTCTTGACTATAACAAATTAGAGTTGGAATTAATAATCAAAACATATAAAAATTGATATTTTTAAACAAGTTTTACACCATAATGTAGCAATCCATCCTGTTAGTGATATTGTCTGCTTTAAATCTAGGAATGTACGTCTTTAAAATGCGTCATTAGTGGGTAAGACATGCTTACTTAAAACACGTCATTAATGAATAAGATTTGTTTACTTATATACTCAACATCTCTCATATATTTTACTGATGTGAAATTAGTTATCTTAAACCGGAATGTCAGTACACTTCATTTGTATCTTTTTTTATATGAGCCATTATCATTTACATGTAAAAGTGCACCTTAAAGCTGGTTAAGCTTATAAACTATAAATTGTTCATTTTTTCTCGTTTAATAATCAATATCTACTTAACAAGGCCTGTTTAATAGATGATAATAGTTTAAGTAGAAAAATGAAATTGTAACTTTTTTACGACTTTTAACATTTCAACTATCAGTTAGTAATATGCTCATCCATTACATATTTTAAAGAGAACAAAGAACCATTAAAAGGTTAAAAACTTATTATAAAGTTAAATATTTTTTCAGTATATATGAAAGGACCTTACAAGTTACAACTAAATCTTTTGAAAGAAAAGTATCGGTCACTACTAAGTTTTCCAAGAAAAACAACAACAAAGGAACAATCTTTTTCTACCACAAGGGGATGTGACTATTGATAGAATCCATTCATTTTAATGGGAGGGCAATTTTTTTTTAAGCGGATTCAAAATATAAAAAAGTAAATATACGGACAAAAAAAAATAAGAAAATTTATCAACGTATACATAAGAAAAGTTGCATACTTCCAAATAGACATGATACATAAACATGATCTTTAACTTGACGTCAGTTGGCAACTATATGTGCACAAGTAGGCACTTAAACTTGTATAAGATTGAACAATTGACACATTCATCCTACAGGCACCCTACATGAAAATTTTGTGTCCTGCGTGGCGTCCTACGTGTATCATGTCATGCATGACATGTGTGGCTACTTGTTCAATTTTATACAAGAGTAAGTGCCTACTTGTGCGCATCCAAAGTTGAGGGTCATAGTTACCGACTGACGTCAAGTTAAGAGTCATGTTTATGTATTATGCCCTCCAGGTAACATAGATTTGAAGAAGCATGGAATGCATGTAGATCTTACTTCTCGTGAAAATGGTTTTCAAATACGAATAGATTAGTCTCGGCTCAAGTAAAACATTTTAAAAGTAAGTACTTAAGACAAAATAATACAATAATAAAAAAGTTATGATAATATTAAATAATAAAAACTATAGCAAAATATAATATATTATCGAAGCAAACATAAATGTCTAATTCAAGCCTCGATAAATGAAAAAAATAATCTAATTTGAACACCGCAACTTTCTTTTAAATGGGCCCTCCACGACACTAATCTAGATTAATCGAAATAATAAATTCTGAAATACCTCATGATATATAGTAAAACAAAAAAGTCTTTATTCTCTTTTCTTCTTGACTAGGGAACCATTAGATTTTAAAGACATTAAATCTATTACCCTTACCCTAAGAATAAGAAGATGTAAAGTAGAAGAGAAAACAACCAAAACCATATATATACATATATATAATTACATTATATTGTCTTATAACATATAGTCTTTTAAGGAAAAACAAATTTAGAAAAAAATAATATTATTTTACATTTTTTTTCTTCATACAATATG NOR (Solyc10g006880). -2568 TAATTCAAAAGCAAATGAAGGACCATTCAAAAATTGTCCAAGTTAGGGCTACTAATTTTGAAATAGATTCCACTTGCTTTTTTCTTTAATTAGGTAAGTGCAACATCCATAAATATTTTTCAAGATATTTTTCCGTAATTCATTCACAATTTTTTTTAAAAGAATTATTTAGTGTTTACCTGTTTACATTTATATTGAAATTAATTAAATTTAAAATCATAATTAAGAGTGGAGAAATTTCATTTATCAATAACCTAAATACTTAATTCTCCAATGAAACTAACTATAAGATTTTTCTCCCTAATAATAGGTTCATTTATTTTAGATTGGTCATGTGAAGGATATGTGTTGAAAC1AAATCCC2TAAATTTC3TTATTC4TTGTTAAGTTTAAAAATAAAAATGC5TAAAAAAATTTTTTAC6AATGAAAGAATATTATAAAAC7TAATTAAATCC8GTCC9AAATTATATC10ATAC11GTATC12GC13GAGGATTC1
4ATC15ATAAATTGAC16TAC17TAGTC18GTCGTATTTGTTGTCTCTATCCGAGTTCAAGATCAACGATACTATATATAAATACATCGATAGAGACAAGTTGTTGTAAAAAAATTCC1AAGTGTGAC2AC3TAGGCC4AAATTTGTCC5AAAGAGTAGCC6TAGAAATGCTTTC7TTATC8TTATTATC9TGTC10TGTCG11AGTC12ATGTC13AAACTTC14TGTTGTAAAATTTAATC15ACTCC16TAATTCG17ATATTTC18AAAATCG19AGTTTTGC20AAATTAAGAAAATTTC21ATTGTAGGACG22AGT

TTCCTC23TTTAATTAAATGATTC24ATATGAGCG25CC26ACG27AATTC28AAC29TGAATATC30
AAATAAAATAC31TGAATGATTGATATAGATCTC32TTTATATATC33TTGTGCAGGATAAAGTAGTTCTGCGTATATGCCCCTTTTACTCGATTGTCCACGTGTTGGTACCAACTTGCATGCGTATCGATTAATTATATTGCCTAATTTTCAGTTATCAAGCTCTAATTACATCATTGTCATGTATTAATCTAATCACCTCTTCAATTTATGCTAATGACGACCTCCACTTCTAATTTAATATTAACATATACACTATTTATTTTTCCACTAACGACTAATTTTTTTAATTTTTTTTTGACAATATTTATATAGTAATTTCTGCTAAGGTTAATTCTTAGTTTTTATCAACTCATTTTTACTATATATAATTAATGTCCTTCTCAAAGCCTAATAACGCCCATTTTACGTTAAGTTAAACTGTTAGAATTGACGAAATTAGGATTAAATTTTAAAAAGAATCTTGAAATATGATTTAAATATATTCACAAAATTATATCAGAAAAATAAATAAAAAATTTAAAATAAAATTGTGTAAGAAAAAAAGAATTGTTATCGATTTTAAATAAAAAAGAAAAAATAACATATATAAAACGAAAAAAAATATATTTTTCTTAGTGAGTAGATTTATCCACACTAGTAATTGTGTGATTATTGTAACATATTATTCATTAGTCTAGGTACGAATTAATTGACTCGAATATTATCGTCCTAATAAAAAAAATATTCTTAATTTTGTTCTATTTTTTAATTAGCTTATTCCAAAGTAAAAAAAATCAAAGACATGTTCTTATATTTATGAACTTCTTAATTAAACATTTATAATTACCACAAGAATCTCAAGACATGTTTATAATTAATAAATTTAGATGTCTGTTTTTCTTTCTAATTAAATTAATATAATTTTACCTTTGATAGCATATATTTATAATTACCATAGAATTCAAAGCATGTTTACTGTTAGATAAATTTAAATATCTTCTATATTTTCTAAAACCTTTGGCGTCCAATTCGATCAAAGTATGTCCACACAATTCAATACTACAAAAACTTTCTATATAAAGAGAGATAATAGTCAAAATACATCTGAAATGTTACGTTTTTTGTAAAATTTCTATTTAAATTATCACGTGCTCAATTTTTTTTACCTAAATCATTATCAACTATTTAACAATACACATCTCAATTATCAGTTATTTTCTTTTTCTACTTGAATACAGTAATATTTCAGATAAAAAAAGAAAAAGAGAAACAATTGATAATTATATTAACGCGTGATTTGATAAATAATTAATGAGTTTATGTATAAAAAATGAACACCTCATGGTTCAAAAAAAAATCTTGCAAAAATATAATACTCTAGATACTATTTTTTACCATTAAAGTATATATTTCAATATATATATATATATATATATATATATATAAACAAAAATATATGTAATGGCATTACTGTAAATTCAGTGTTGCCTTATACCATATATAAGTAAGTGTGGGGGCTAAATTAACCAACTAAATTCCTTCTTGTTTATCATTTTCTCTCTTCCCAAAAAAAAATCCCAAAATTTAATCATAATACAATTCGAATTTATCAACCTCGTACTACGTACATATTTTTGTTGGTACGTAAAATACTGAATTCAGGTCAACTCAAACATCGTAAATTGTGATTTCTTTATG PSY1 (Solyc03g031860). -2345
GTTCACAATGTCAAAATCTAAACAACTAAAAACGACGAGGAGTAAGGTTTGCAACGACGATAACAAGGATTAGGCAACAATTAGAGTTGTGAATTGTGAGTATTAACTATACTTTTACTATATTAGGCAGAATTTTTGCACTCAATGAGTAACTTGATTTATTTATTTTTTATTTCGCCCTAAATTATTGGACAAGTCATATATTTGTTTTGAAAACATTCTTTTATTGGCTAAATCGAAAATTGAATCGTTAAAGATCAAAAATCAATAACAAATATCTTATTGGTTTAACATATTTAAAAATAAAAAACCAATAAATCTAACTAATAATATTTAATACGAAAACGAAATGGACTGACACACATTCCTAAATTTTTGGTCAAAATTTTTTCATAATTTCCCTAAAATCTAAAATATTAAATATTTGACGGAAACAAAAAATTCACTTTTAATAAATTATTTGAAGGACTAAAACAGTGGAAGAATATATTTAAGAAGCTAATTTGAACCTAGTGCCAAATATAAAGGGACCATTTTTGTCATTTTTCAACTTGAAAATCTACGTGTCTTAATATAACACCAAAGAATTAATATTTACTGAAAAAATGTAAAAATGAGGATATGGATTCTGAATCACTCAATTCCAATCAGCAAAAATAAAATAAAATAAAATAAAATAAAATTTAAAAAATAATAATAAATGCTATAAAATGACCAAAATGTGTGGAGCAAAAAGTGCAGAAAAAACCAACAAATTGCATTCTCCATTCTTGGAAGTGGCCATTCTTGATTTCTTGAAACAAAGGTTTGTTTCCCTTCACTTCTTGATATGTAAAGTTGCAATCTTTATAACTTTCTATTGCTTTGCTAGTGTTTTTGTTATATACAGGGGGTGGAGTTAGAGGGTAAGTTACGCATTTAGTCGTAACTTAGTCAAACTTCGTAATAATTTAGTAAGTTAAAATATATTAGAAATTTTCAGAATTCATAAACTTTAAATTTTAAATTTTG
ACTTCGCTTTGTGTGACTATACAATTACAGAAATTCAGAGTGGCCATTGTTGAAAGAGAGGGTGGAATTTGTGTAAGTTTTGTTTCCTTTC1AGTTC2TTGATATATAAAGTTGC3AATC4TTTAAC5ATTC6TTTGTTCAC7TTTC8TATAGGTTTGC9TAGGTTC10GGTTAAATTC11AGTAGC1
2TTTAGTTTAAACCC13TATGC14GGAATAGAGAATGTGTAAAC15TTTAAACTTC16AAATTTTGGCTCC17GC18ATACG19AC20TAGC21GAC22TATATAATAATAGGAATTGAGCACTTGGCTTTTGTATATAGCTTCTATGTGTACCAAAATTAGAAAATCAGGCGATTATTATAATCTTGTTGACTAAATATAGAATGCATCCATTACCCCCAAAAAGTGTGATTCCACTGTCATAGGAGGTTTTTTTTATTTCATTTTATTTGTGCTTTCAATAATGTAGAGTAGTTTTACAAAGATCCTTTCTTTGTGACACATGGTAGGTAATATTGCTGATTTTGTTGTAGTTTTGGGGTTATAAAGTTTCAAATTATTTATACTGGAGGGTAGGGGTGGGGGTTGTCTATAATGCAGGTTATGGTTTTAC1
GTGAACTC2AATAATTATTGTAGATAC3TAAGAAATCC4ACTC5AGTGTTC6TTGC7GGTGTC8
TTGC9TTTTGATTTC10AGC11ATC12AC13TTGTAGTTGATTGTGTTTAGATTATC14AC15ATTATTC16TGTGGC17TGTAAC18TGTATCC19TTGTTAGTTGC20TTTGTTTC21TAC22AC23TGTTGTTTTCCCTC24TTTTATACC25TATTTTGATATGTTGTACTCGAACGAGGGTCATCGGGGAACAACCTCTTTACCTCCGTGAGGTAGAGCTATGGTCTGTGTCCACTCTACCCTCCCCAGATC
CCTCTTGTAGGATTTCACTATATTGTAATATTAACTTGAGGTCACTATAGGAGCTCAAAAACTTCTAATTTTGAATCAATGTCTGGTTATACTTTTTTTGTCATAACTGTATCTCAAATGTGGTGTTTGGTTTATCTCATTTTGCAGAAGTCAAGAAACAGGTTACTCCTGTTTGAGTGAGGAAAAGTTGGTTTGCCTGTCTGTGGTCTTTTTATAATCTTTTTCTACAGAAGAGAAAGTGGGTAATTTTGTTTGAGAGTGGAAATATTCTCTAGTGGGAATCTACTAGGAGTAATTTATTTTCTATAAACTAAGTAAAGTTTGGAAGGTGACAAAAAGAAAGACAAAAATCTTGGAATTGTTTTAGACAACCAAGGTTTTCTTGCTCAGAATG
CNR (Solyc02g077920). -3526 TCACAATCACAAGCAGGCAGTGAAACAATTACATCAAGCTCGTTTCATAGATTCTTCATTTTGGAATAATAGCTTGTCACAGAGTCTGTTCCTTGTTTCAAATTAGCAATTTCTGCGCACAAATAATAAATCCTCGTCAAATTCGATCTATCAAAACGCTCCTTGTATTCATCCCATACCTTCTTCGCAATTGAAGCATAAACTATGCTTGGCATCAAATCAGCTGTAACAGTACTTCCTATCCATGATAACACAATTGCATTAAATTTTTCCCATTACGCTTCTAGGTCTCCTTTAAACTTACTCTTTGTGCAGTTTCCATCCACAAATCCAAGTTTTACTTTGCCTCGCAGTGCTAGTTTCATCGATTTGCTCCATAGAGAGTAGTTCTCTGGTCCTGTGAGTTTGATCGGAGTTATTACTAAGTCTGGAGAATCAGAAGCTTAAAGATAGAGAGGATGATGATGATTAATTTTTGTTGC1AGC2TGGAACTTCC3ATC4TGTAGC5AC6ATTGTTCTCC7TGTC8ATTTCC9TAAAC10TAATTGATTGC11GATTAACTC12AAATTCC13TAAGCTC14AGC15TGAAGGTGAGATC16GCC17GCTC1
8TGATACC19ATGTTAATTTGTAGTTATGTATGTAGAATTTATGGTGAATAAGTTC20ACC21ATTGATGAATTTTC22TAAGCTGCTACAGAGATATTGGAAGAGAAAAAGAGGATCACTATTTCATTGAATCTAAATTGAATTATCTTTTTTTAATCATAATTGATGGCTAGTACTGTTATAGGTCCAGCTAACCTACTTCTAGAAAGTTCCATTTTAACTGACCTCATAACAAATTGTAACTAATTTTGTTAGCTACATCACAAATGACACTTACAAGAATAACAGTAATAAGAAACAAGTTATTTCAACAGCTATCATTTATTATGTTACCTCATCTTGTATCGTGTTAATCCGTACAGACATAATTAAAATACAAAATAAGAAAATTAGAACTAGAGGCTCTAAACAGGAAATTTCAGGAAGTTCCACCTCTGCCTAGCTATATTACATGATTTAAAAGGTATAATACAAGATGAACTCCTTAAAATTATCAGAATACTTTTGTTTAAAAACTCGAATTACCCGTTGTTTCAATTGATGAAGTGTTTTAATCTGACACTTCCGGTTCGTTGTTATTCCTATACTAGATTGTTAAGTTAACCACATATTTTTTTAATCACACATTTACCTCAATAAGATATAAAACTTTAAATATTTTCTTCTTGAGGTTGATACATATTATTATGAGATGACATATTTATGTGGTTAACTTAATTATGCGATAGACAAATAAAAACACGTGCAAAAGTTCATTCAAAATTTAAAATTTAACGTGACTACTTGGAACATTTTATTAGAAATTTAGGTGTTCAGTTAAAATAAGACTTATTGAAGTATCTAACCAGAATATCCTGACAAATTAAGGGACTTATCATGTATTATGCCCTTCAAAAAGATTACTTCTTTATTAATGATGATTAGTTATACTCATAAGTAATAACCTCACTTCTTTTTCAGCCCATGTCCTAACCTTGTTTTGTTTTCTTCCAATCATGGAGTCCCTTTGTCATTTGTCTATCAGTTTGTTAGCCTCCCTTCACTAATAATTATCCATAACCGGCTAATAAAGTACATTCCATTTAAGTGTAAAAGAAAAATTGAAGAGTTTGCCTATTCTTTCTCACCACGTCCTCCCTAGAAAGTTCTCGTCACGCTTCATTGTCAATTGTCATTCCTTCGACAACAAGGGAATATATAGTTGGAATACTTCTGTCCCATCCATCCTGCCTACACACAAGTTATTCATTCTAACCTGTCTTTGCCTACTAAGATACGTCT

AGTTCTTCCTCTACTTGCCTATCTCGATAGAAAAATTTTTGATAGGAAAGAAAAAAACTGATCGAAGCGAGAGAGGGAGCAGTAATGAGGAATATACAAATAAGGTCATTTTGGGGAACCATTAAGCTATAAAACAATAATACACACTTATGAATTACCGATATATAATTTAATTTGGAATTTCATTCATATGGTTAATAGCAACAGAGTTGTCTTTGTATTAGTGCACTATCAATTTAATACCTAGCTGTGACACTAAAAAGCTAGGTGCCCACAATTATTAAAACAAAAGTGTATCCACCTCAAGAAGAAGAAAAAAGGCAAATATGATATAAAACCATTTAACAAAGTCCATATCACAAAAATTAGACGGCAAAATCATACACGACTAATTTATAGATTCACTGAACCATGCAATTCTATACCGTTCACTTCCAATAAATAAAACATAATACACTATGTTTAGAGTACAAGACTCTCCTTGCTTGAAAAGGACTACCAAGTAGGGGTTACTGCAGTGACTACCAAGTAGGGGTTACTGCAGTCATTTGTTAATTCATTTTGAGTAATGTAACTGTGCAAGATAATGATGTTTTTTTTCCTTTTTGGTTAACTAAGATAATGATGGATTTAGGTAGATGAATTAGAC1ATC2TAGTGATAATGGAGAGCC3AGTGC4AAC5AATTGAGC6ACTC7TAC8TGGACC9GAC10ATGGAC11AAC12TGAGAGACC13AAC14TTGC15AGTATTATAATAGTGC16AAATTATAGTTTAGTC17GACTCCCTTC18GGAATC19TAC20TAC21ATAAAGAAC22TACC23ATAAAC24TATGTTAGATGGC25TATTAC26GGAGTTTAAATTAAACTC27GAAAATATC28AGAAAAAGAAGTAACTTC29AACC30AATTAC31AATGC32ATACCC33TTATC34AC35AAGTGAAAAAGAGTAAAC36GTGCC37AAACTC38TTTTGATCCCTCC39AAAGCTAGAGGAAAAGAGTGAGCAATTCACTACAAACCACTGGCTTTGGTCTATGGTTGACACAACTCCTCGGCTAATTGGTCAAAATATCTTGTGACCACCAACCAGCAAGCACTAAATTGGATGTTCTATCAGCTTCTTTACATCATAAAACAGTGAATACTGAACGCTGAGAGGCTAACTGACTGCCCAAAAAAACCTTGACAAAAAGTTAGTGGAGTAACTACCTAGGAGTAAATTCAATAGTAGACCTTGAAAAGAACTTTAGCAAAGTCATCATAAATGCTCTTCACGTCTCATGTACTATGTTAAGGAATGGTCACATTTCTCTCTGCATTAAAGCTAGTTCATGTTAAAAGTTGAGGCCGGTAGTAGTTTCAACTTTCAATTTAATTCCACCTTTCCTGGCCCACTTCTGTACGGAACACCAATCAGAATCTTTAGTTCATCTTAACACCAAAGCATCTCCACTTAGACACTTACTAGACTTCACATAGGAGGAAAAATATGGAACTGGTGGTCCTCACACGTACTTACCTTTCTTTTTTTACCTTTGTTCAAGTTTCATACTCTTTTATCTGGCTTCCTCACTCTATTTTGGCCCAATAGGTTCTCCTCACAGGGATG Figure S8: Promoter sequences analyzed using MCR-BC PCR and bisulfite Pyrosequencing
Promoter sequences of RIN, NOR, PSY1 and CNR genes. Bases are numbered from the ATG.
Fragment analyzed using McrBC-PCR (Fig. 5) are shown in italic. For the NOR, CNR and PSY1
promoter fragments, sequences analyzed by Bisulfite-pyro-sequencing are underlined and limited
either by red primers (PCR fragment 1) or by blue primers (PCR fragment 2). For each fragment
analyzed by BS pyro-sequencing cytosines or group of cytosines for which the methylation level has
been determined, have been numbered starting from the 5’ part of the amplified sequence. ATG is
shown.

NOR 1 NOR 2
0
0,5
1
C5
C6
C7
CC
8
CC
9
C1
0
C1
1
C1
2
C1
3
C1
4
C1
5
C1
6
C1
7
C1
8
0
0,5
1
C5
C6
C7
CC
8
CC
9
C1
0
C1
1
C1
2
C1
3
C1
4
C1
5
C1
6
C1
7
C1
8
0
0,5
1
CC
1C
2C
3C
C4
CC
5C
C6
CC
7C
8C
9C
10
C1
1C
12
C1
3C
C1
4C
15
CC
C1
6C
17
C1
8C
19
C2
0C
21
C2
2C
CC
23
C2
4C
25
C2
6C
27
C2
8C
29
C3
0C
31
C3
2
0
0,5
1
CC
1
C2
C3
CC
4
CC
5
CC
6
CC
7
C8
C9
C1
0
C1
1
C1
2
C1
3
CC
14
C1
5
CC
C1
6
C1
7
C1
8
C1
9
C2
0
C2
1
C2
2
CC
C2
3
C2
4
C2
5
C2
6
C2
7
C2
8
C2
9
C3
0
C3
1
C3
2
35
39
55
20
85
35
39
55
20
85
RIN ChIP-Seq
DMR
McrBC
WT
DML8A
RIN ChIP-Seq
PSY1 1 PSY1 2
0
0,5
1
CC
C1
C2
C3
C4
C5
C6
C7
CC
8C
9C
10
C1
1C
12
CC
C13
C1
5C
C1
6C
CC
17
C1
8C
19
C2
0C
21
C2
2
0
0,5
1
CC
C1
C2
C3
C4
C5
C6
C7
CC
8C
9C
10
C1
1C
12
CC
C13
C1
5C
C1
6C
CC
17
C1
8C
19
C2
0C
21
C2
2
0
0,5
1C
1
CC
2
C3
CC
4
CC
5
C6
C8
C9
C1
0
C1
1
C1
2
C1
3
C1
4
C1
5
C1
6
C1
7
C1
8
C1
9
C2
0
C2
1
C2
2
C2
3
CC
CC
24
CC
25
0
0,5
1
C1
CC
2
C3
CC
4
CC
5
C6
C8
C9
C1
0
C1
1
C1
2
C1
3
C1
4
C1
5
C1
6
C1
7
C1
8
C1
9
C2
0
C2
1
C2
2
C2
3
CC
CC
24
CC
25
DMR
McrBC
0
0,5
1
1,5C
1
C2
CC
3
C4
C5
C6
CC
7
C8
CC
9
C1
0
C1
1
C1
2
CC
13
C1
4
C1
5
C1
6
C1
7
CC
CC
C1
8
C1
9
C2
0
C2
1
C2
2
CC
23
C2
4
C2
5
C2
6
CC
27
C2
8
CC
29
CC
30
C3
1
C3
2
CC
C3
3
C3
4
C3
5
C3
6
CC
37
CC
38
CC
CC
C3
9
RIN ChIP-Seq
CNR 1 CNR 2
0
0,5
1
1,5
C1
C2
CC…
C4
C5
C6
CC…
C8
CC
9
C1
0
C1
1
CC
12
CC
13
CC
14
C1
5
C1
6
C1
7
C1
8
C1
9
C2
0
C2
1
0
0,5
1
1,5
C1
C2
CC
C3
C4
C5
C6
CC
C7
C8
CC
9
C1
0
C1
1
CC
12
CC
13
CC
14
C1
5
C1
6
C1
7
C1
8
C1
9
C2
0
C2
1
0
0,5
1
1,5
C1
C2
CC
3
C4
C5
C6
CC
7
C8
CC
9
C1
0
C1
1
C1
2
CC
13
C1
4
C1
5
C1
6
C1
7
CC
CC
C1
8
C1
9
C2
0
C2
1
C2
2
CC
23
C2
4
C2
5
C2
6
CC
27
C2
8
CC
29
CC
30
C3
1
C3
2
CC
C3
3
C3
4
C3
5
C3
6
CC
37
CC
38
CC
CC
C3
9
WT
35
39
55
20
85
DML8A
35
39
55
20
85
DMR
Figure S9: Gene targeted Bisulfite Pyrosequencing Analysis: Methylation levels of the PSY1 (A), NOR (B), and CNR (C) promoters at the two PCR fragments shown in Fig. S8.
Methylation level at 20, 35, 39 (Br), 55 and 85 dpa is shown in WT fruits (upper panels) and in the transgenic RNAi line DML8A (lower panels) at the same stages. Fruit phenotypes are
indicated on the right. DNA sequence is depicted as a black line on which are shown the differentially methylated regions (DMR) as determined using McrBC-PCR (red lines, this study),
DMRs identified in (20) (black lines) and the position of the RIN BS identified by RIN-ChIP sequencing (20). Note the higher methylation level of PSY1 fragment 1 (A; CC8 to C22) at all
stages observed in plant DML8A as compared to WT as well as the reduction in methylation at the NOR (B) and CNR (C) fragment 2 during WT fruit ripening but not in fruits of the
DML8A plant .
A B
C
Fig S9

SI Supplementary Tables
Supplementary Table S1:
Database and Accession Name Domain A Glycosylase domain Domain B Total size
numbers Position size(aa) Position size(aa) Position size(aa) (aa)
Solyc09g009080.2.1 SlDML1 691-811 121 1151-1366 216 1498-1702 205 1702
SGN Solyc10g083630.1.1 SlDML2 846-966 121 1267-1482 216 1615-1824 210 1824
Solyc11g007580.1.1 SlDML3 836-955 120 1279-1494 216 1645-1869 225 1869
Solyc03g123440.2.1 SlDML4 786-900 115 992-1206 215 1346-1538 193 1538
NP_196076.2 AtDME 678-796 119 1190-1405 216 1530-1729 200 1729
NCBI NP_181190.3 AtROS1 508-626 119 857-1072 216 1191-1393 203 1393
NP_187612.5 AtDML2 477-595 119 789-1004 216 1129-1332 204 1332
NP_195132.3 AtDML3 331-445 115 500-712 213 841-1044 204 1044
Supplementary Table 1: Tomato and Arabidopsis DML genes Accession number of the
tomato and Arabidopsis Demeter like cDNA is indicated together with the size of the
corresponding proteins, and the position of the three conserved domains characteristic of the
DNA Glysosylase-Lyase23.
Supplementary Table S2: list of primers
Supplementary Table 2
Primers for qRT-PCR
NCBI Accession
AK326269.1 EF1alpha F GCTGTCGGTGTTGTCAAGAAT
EF1 alpha R CATCACACTGCACAGTTCACT
XP_006341256.1 SIDML1 F GGGCTGAACAAGCTAACAACA
SIDML1 R TGACCACCCTAAGTATCAGCTACA
XP_004249459.1 SIDML2 F AGTACTCATGCCAAAGCCAAA
SIDML2 R CCTATCTTCTTTTTACCGACTGGA
XP_004250000.1 SIDML3 F GCAGAATTGAAGTCACCCTTG
SIDML3 R GATGGCTCAGTTTGTGAGCA
XP_004236376.1 SIDML4 F GAGCGAGTGTGGGAACAAC
SIDML4 R ATGCGGGCAATGAATGAGTC
NM_001247741.1 Rin F AACATCATGGCATTGTGGTG
Rin R GTGTTGATGGTGCTGCATTT
Psy1 F ATCTTTGGTCTTGTACCGCAAA
KC767847.1 Psy1 R GGCAGTTTTTGTAGGAGGCACA
NM_001247249.1 NOR F AGAGAACGATGCATGGAGGTTTGT
NOR R ACTGGCTCAGGAAATTGGCAATGG
XM_004232854.1 CNR F GCCAAATCAAGCAATGATGA
CNR R TCGCAACCATACAGACCATT
Primers for RNAi construction
DMLENTRS CACCGTATAGCTGTTAGAC
DMLENTRAS GAACATGCGTTGCAGTTG
Primers for McrBC analysis of promoter fragments

Solgene accession
Solyc02g077920 CNR F TGAGCATCAACCACTCCTAATA
CNR R CAGACTTAGTAATAACTCCGAT
Solyc03g123630.2.1 PM F AAACTAGACCATGAGTGTTGAGA
PM R TTTTAGAGTGAATTACAGAGAAGC
Solyc03g031860 PSY1 F TTGTTATATACAGGGGGTGGAGTT
PSY1 R TAGAGTGGACACAGACCATAGCTC
Solyc10g006880 NOR F CAAAAATTGTCCAAGTTAGGGCTAC
NOR R GTGGAGGTCGTCATTAGCATAAAT
Solyc05g012020 RIN F GTAGAATTTGGGGAAGAAACGTC
RIN R TATCAATAGTCACATCCCCTTGTG
Primers for bisulfite sequencing analysis
PCR primers Sl_NOR_F1 GATTGGTYATGTGAAGGATATGTG
Sl_NOR_R1 Biotin-CTCRRATARARACAACAAATACRAC
Sl_NOR_F2 ATYGATAGAGAYAAGTTGTTGTAAA
Sl_NOR_R2 Biotin-ACRCARAACTACTTTATCCTRCACA
Sl_PSY1_F1 ATTGTTGAAAGAGAGGGTGGAA
Sl_PSY1_R1 Biotin-CAAAARCCAARTRCTCAATTCCTA
Sl_PSY1_F2 GGGTTGTYTATAATGYAGGTTATGG
Sl_PSY1_R2 Biotin-CCTCRTTCRARTACAACATATCAAA
Sl_CNR_F1 AAGATAGAGAGGATGATGATGATTAA
Sl_CNR_R1 Biotin-TCTTCCAATATCTCTRTARCARCTT
Sl_CNR_F2 TGATGGATTTAGGTAGATGAATTAG
Sl_CNR_R2 Biotin-TTRCTCACTCTTTTCCTCTARCTT
Sl_NOR_pyro1F1 TGAAGGATATGTGTTGAAA
Pyrosequencing primers
Sl_NOR_pyro1F3 YAATGAAAGAATATTATAAA
Sl_NOR_pyro2F1 GAGAYAAGTTGTTGTAAAAA
Sl_NOR_pyro2F2 TYAAAYTTYTGTTGTAAAAT
Sl_NOR_pyro2F3 GTTTYYTYTTTAATTAAATG
Sl_PSY1_pyro1F1 AATTTGTGTAAGTTTTGTTT
Sl_PSY1_pyro1F2 GCGGAATAGAGAATGTG
Sl_PSY1_pyro2F1 AATGYAGGTTATGGTTTT
Sl_PSY1_pyro2F2 GTTGATTGTGTTTAGATTAT
Sl_CNR_pyro1F1 GATGATTAATTTTTGTTG
Sl_CNR_pyro1F2 AGYTGAAGGTGAGAT
Sl_CNR_pyro2F1 ATTTAGGTAGATGAATTAGA
Sl_CNR_pyro2F3 AGTGYAAATTATAGTTTAGT
Sl_CNR_pyro2F4 ATYAYAAGTGAAAAAGAGTA
References Supplementary Information
S1. Gonzalez N, Gévaudant F, Hernould M, Chevalier C, Mouras A (2007) The cell
cycle-associated protein kinase WEE1 regulates cell size in relation to
endoreduplication in developing tomato fruit. Plant J 51(4):642-655.
S2. How Kit A et al. (2010) Functional analysis of SlEZ1 a tomato enhancer of zeste
(E(z)) gene demonstrates a role in flower development. Plant Mol Biol 74(3):201-
213.
S3. Télef N et al. (2006) Sucrose deficiency delays lycopene accumulation in tomato
fruit pericarp discs. Plant Mol Biol 62(3):453-469.
S4. Pfaffl MW (2001) A new mathematical model for relative quantification in real-
time RT-PCR. Nucl Acids Res 29(9):e45-.
S5. Gentleman et al. Bioconductor: open software development for computational
biology and bioinformatics. Genome Biology 2004, 5:R80 doi:10.1186/gb-2004-
5-10-r80
S6. Bolstad, B.M, Irizarry R.A, Astrand, M and Speed T.P. A comparison of
normalization methods for high density oligonucleotide array data based on
variance and bias. Bioinformatics. 2003 Jan 22;19(2):185-93.
S7. Irizarry R.A., Hobbs, B., Collin, F., Beazer-Barclay, Y.D., Antonellis, K.J.,
Scherf U and Speed, T.P. Exploration, normalization, and summaries of high
density oligonucleotide array probe level data. Biostatistics (2003), 4, 2, pp. 249–
264
S8. Tost J, Gut IG (2007) DNA methylation analysis by pyrosequencing. Nat
Protocols 2(9):2265-2275.
S9. Mounet F et al. (2009) Gene and metabolite regulatory network analysis of early
developing fruit tissues highlights new candidate genes for the control of tomato
fruit composition and development. Plant Physiol 149(3):1505-1528.
S10. Tamura K, Stecher G, Peterson D, Filipski A, Kumar S (2013) MEGA6:
Molecular Evolutionary Genetics Analysis Version 6.0. Mol Biol Evol
30(12):2725-2729.
S11. Deborde C et al. (2009) Proton NMR quantitative profiling for quality
assessment of greenhouse-grown tomato fruit. Metabolomics 5(2):183-198.

Chapter 2
Chapter2_Part II and Part III
SlDML2 controls tomato fruit
ripening and affects reproductive
development
Chapter 2
60
Part II. Activity test for tomato SlDMLs protein
As reviewed in chapter 1, in plants, active DNA demethylation is catalyzed by bifunctional
enzymes, the DNA Glysosylase-lyases, which possess both DNA glycosylase and
apurinic/apyrimidinic (AP) lyase activities. DNA glycosylase cleaves the phosphodiester backbone
at the 5-meC removal site by β, δ-elimination, AP lyase subsequently nicks the DNA, and an AP
endonuclease generates a 3-hydroxyl to which a DNA repair polymerase adds an unmethylated
cytosine. DNA ligase completes the repair process by sealing the nick (Penterman et al., 2007).
Finally this biochemical process results in a net loss of cytosine methylation (Chapter 1, Fig 1.8).
In Arabidopsis, four DEMETER-like DNA demethylases were indentified, including
Repressor Of Silencing (ROS1), DEMETER, DEMETER-LIKE 2 (AtDML2) and DEMETER-
LIKE 3 (AtDML3) (Choi et al., 2002;Gong et al., 2002;Penterman et al., 2007;Ortega-Galisteo et
al., 2008). All these four Arabidopsis DEMETER-like DNA demethylases protein are DNA
Glycosylase-lyases, characterized by a highly conserved Glycosylase domain present in both
prokaryotic and eukaryotic DNA glycosylases, an iron-sulfur cluster motif, which is suggested
critical for DNA glycosylase-lyases activity is located in this domain. Another two additional
conserved domains A and B flanks in the central glycosylase domain, these three conserved domain
are necessary and sufficient for DNA demethylation activity (Agius et al., 2006;Mok et al.,
2010;La et al., 2011).
The tomato genome contains four DEMETER-like (DML) genes with three characteristic
domains of DNA demethylases, suggesting that these proteins are functional DNA Glycosylase-
lyases. They code for putative proteins of 1702aa, 1824aa, 1869aa and 1538aa (aa = amino acids).
SlDML1 (Solyc09g009080) and SlDML2 (Solyc10g083630) are orthologous to AtROS1, SlDML3
(Solyc11g007580) to AtDME, whereas SlDML4 (Solyc03g123440) is distinct from the three other
proteins (Fig 2.1, p58) as have been reported before (Liu et al., 2015).
Fig 2. 1 Structures of SlDML protein and Phlogenetic analysis with Arabidopsis homologous
proteins. (A) Schematic diagram of domain structures of SlDML in tomato and its four AtDML
paralogs in arabidopsis. (B) Phylogenetic analysis of SlDML and AtDML ( Liu et al., 2015).
To assess the biochemical activity of SlDML protein using in vitro assays, three full length
cDNA, including SlDML1, SlDML2 and SlDML3 were selected to develop a protein activity test.
A B
Chapter 2
61
To address whether the three conserved domains are also necessary and sufficient for SlDML2
DNA demethylases activity, three different truncated cDNA forms (SlDML2-962, SlDML2-845,
SlDML2-694) were designed in addition to the reference full length of SlDML2 protein (Fig 2.2).
We hypothesized that SlDML2-694 and SlDML2-845 will be active proteins because they still
contain the complete three conserved domains. In contrast SlDML2-962 has a truncated domain A,
which may result in a loss of activity.
Together, all of the six cDNAs were cloned into the cloning vector (pENTR) and subsequently
subcloned into the expression vector (pET300/NT-DEST) and introduced in E.coli cells (Rosetta2
strain, DE3) with modified codon usage (Fig 2.3).
Fig 2. 2 Structures of SlDML2 proteins along with their truncated versions used in this study
Fig 2. 3 Cloning vector and expression vector used in this study
To purify recombinant proteins, proteins expression and solubility were first tested.
Unfortunately, full length SlDML1 and SlDML2 could not be successfully produced, and the

Chapter 2
62
truncated forms SlDML2-962 and SlDML2-694 were not continued after the construction of the
recombinant vectors. Only SlDML3 and the truncated SlDML2-845 were successfully expressed
although the production remained very low irrespective to the conditions used. Several different
conditions were tested, including different incubation temperatures (16°C, 23°C, 26°C) as well as
different sonication buffers but the production of SlDML2-845, SlDML2-962 remained very low.
Fig 2. 4 SlDML2- full leng, SlDML3-full length and SlDML2-845 expression and purify test.
Crude protein of full length SlDML2 and SlDML3 (A), DML2-845 and DML2-962 (B), purified
protein DML2-845(C). Wash: pureed protein during protein purification; - : No IPTG induction
Finally, only SlDML2-845, DML2-962 could be purified, and the concentration is still low
(Fig 2.4). Protein purification was performed using the following method which referenced as
Ponferrada-Marín et al., 2009.
(1) DNA substrates: Oligonucleotides used as DNA substrates were synthesized and were purified
by PAGE from company. Double-stranded DNA substrates were prepared by mixing a 5 mM
solution of a 50 -fluorescein-labelled oligonucleotide (upper-strand) with a 10 mM solution of an
unlabelled oligomer (lowerstrand), heating to 95℃ for 5 min and slowly cooling to room
temperature; (2) Expression and purification of DML2 and DML3 : The full-length cDNA was
inserted into the pET300 /NT-DEST expression vector to add a polyhistidine (His6) Tag at the N-
terminus of DML2 and DML3 protein. Expression of recombinant genes was carried out in E. coli
(Rosetta2 strain, DE3) (Stratagene). A fresh transformant colony was transfereded into 10 mL of
LB medium containing kanamycin (50 mg/ml) and chloramphenicol (34 mg/ml), then the culture
was incubated for overnight with shaking. A 2.5 ml aliquot of the overnight culture was added into
1L of fresh LB medium with kanamycin (50 mg/ml) and chloramphenicol (34 mg/ml), and
incubated at 37℃, 250 rpm, until the A600 was 0.1. The culture was then transfered at 23℃, and
DML2-full length: No expression
DML3-full length: Low expression
300
250
180 130
95
72
52
43
Wash Elution
DML2-845 Purified process
DML2-845: Low expression
DML2-962: Low expression
130
845
962
A B C
180
DML3 - DML2 962
962
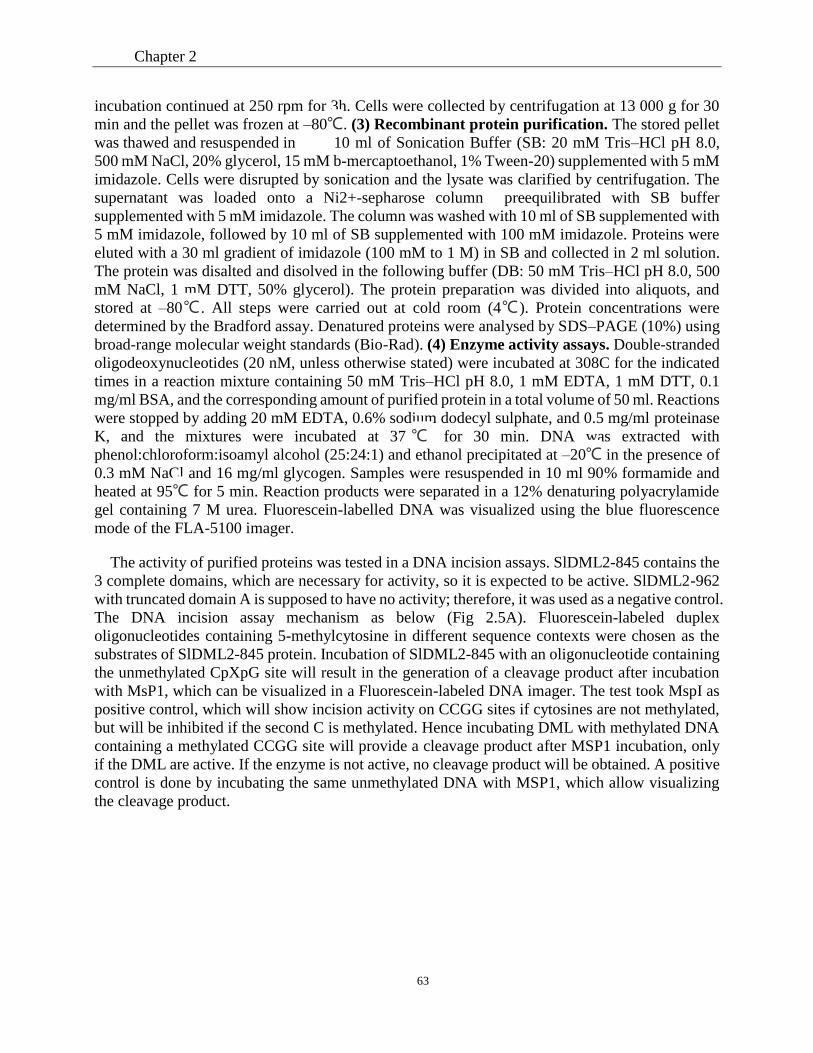
Chapter 2
63
incubation continued at 250 rpm for 3h. Cells were collected by centrifugation at 13 000 g for 30
min and the pellet was frozen at –80℃. (3) Recombinant protein purification. The stored pellet
was thawed and resuspended in 10 ml of Sonication Buffer (SB: 20 mM Tris–HCl pH 8.0,
500 mM NaCl, 20% glycerol, 15 mM b-mercaptoethanol, 1% Tween-20) supplemented with 5 mM
imidazole. Cells were disrupted by sonication and the lysate was clarified by centrifugation. The
supernatant was loaded onto a Ni2+-sepharose column preequilibrated with SB buffer
supplemented with 5 mM imidazole. The column was washed with 10 ml of SB supplemented with
5 mM imidazole, followed by 10 ml of SB supplemented with 100 mM imidazole. Proteins were
eluted with a 30 ml gradient of imidazole (100 mM to 1 M) in SB and collected in 2 ml solution.
The protein was disalted and disolved in the following buffer (DB: 50 mM Tris–HCl pH 8.0, 500
mM NaCl, 1 mM DTT, 50% glycerol). The protein preparation was divided into aliquots, and
stored at –80℃. All steps were carried out at cold room (4℃). Protein concentrations were
determined by the Bradford assay. Denatured proteins were analysed by SDS–PAGE (10%) using
broad-range molecular weight standards (Bio-Rad). (4) Enzyme activity assays. Double-stranded
oligodeoxynucleotides (20 nM, unless otherwise stated) were incubated at 308C for the indicated
times in a reaction mixture containing 50 mM Tris–HCl pH 8.0, 1 mM EDTA, 1 mM DTT, 0.1
mg/ml BSA, and the corresponding amount of purified protein in a total volume of 50 ml. Reactions
were stopped by adding 20 mM EDTA, 0.6% sodium dodecyl sulphate, and 0.5 mg/ml proteinase
K, and the mixtures were incubated at 37 ℃ for 30 min. DNA was extracted with
phenol:chloroform:isoamyl alcohol (25:24:1) and ethanol precipitated at –20℃ in the presence of
0.3 mM NaCl and 16 mg/ml glycogen. Samples were resuspended in 10 ml 90% formamide and
heated at 95℃ for 5 min. Reaction products were separated in a 12% denaturing polyacrylamide
gel containing 7 M urea. Fluorescein-labelled DNA was visualized using the blue fluorescence
mode of the FLA-5100 imager.
The activity of purified proteins was tested in a DNA incision assays. SlDML2-845 contains the
3 complete domains, which are necessary for activity, so it is expected to be active. SlDML2-962
with truncated domain A is supposed to have no activity; therefore, it was used as a negative control.
The DNA incision assay mechanism as below (Fig 2.5A). Fluorescein-labeled duplex
oligonucleotides containing 5-methylcytosine in different sequence contexts were chosen as the
substrates of SlDML2-845 protein. Incubation of SlDML2-845 with an oligonucleotide containing
the unmethylated CpXpG site will result in the generation of a cleavage product after incubation
with MsP1, which can be visualized in a Fluorescein-labeled DNA imager. The test took MspI as
positive control, which will show incision activity on CCGG sites if cytosines are not methylated,
but will be inhibited if the second C is methylated. Hence incubating DML with methylated DNA
containing a methylated CCGG site will provide a cleavage product after MSP1 incubation, only
if the DML are active. If the enzyme is not active, no cleavage product will be obtained. A positive
control is done by incubating the same unmethylated DNA with MSP1, which allow visualizing
the cleavage product.
B

Chapter 2
64
Fig 2. 5 Mechanism of DNA demethylase incision assays (figure comes from Gehring et al
(2005)) and the acitivity test of SlDML2-845, SlDML2-962 and MspI. No signal was dected on
DML2-845 or DML2-962, but signal was found on MSPI (B).
As a conclusion, we coud not detect any significant activity using either SlDM2-845, or
SlDML2-962, although MspI could cleave the substrate very efficiently (Fig 2.5B). The reasons
are unclear and could be due to a lost of activity during the protein purification process associated
to the low protein yield.
Part III Analysis of the inheritance of phenotypes generated in DML
RNAi plants after transgene out-segregation
The Cnr mutant was the first epimutant identified in tomato. In this epimutant, fruit ripening
was inhibited due to an increased methylation at the CNR promoter region, and this phenotype is
stably heritable (Manning et al, 2006). We have now shown that repression of SlDML2 expression
results in hypermethylation at specific loci that blocks fruit ripening. It is unclear whether these
hypermethylated loci are stable through generation and will maintain the phenotypes observed in
the transgenic lines.
Preliminary observation have already shown that segregation of the transgene after selfing
plants of line 8 heterozygous for the transgene resulted in reversion of ripening phenotype to a WT
Lyase
Products were analyzed on polyacrylamide gel
A
DML2-
845
MSPI DML2-
962
Cleavage
product
A B

Chapter 2
65
phenotype (Fig 2.6A). This suggests that hypermethylation of genes controlling fruit ripening is
not transmitted to the next generation in the absence of the transgene. However fruit ripening
phenotypes are late developmental events. Hypermethylation at these ripening genes occur at the
onset of fruit ripening in the pericarp of fruit and therefore cannot be transmitted to the gamete.
The demethylation at these pormoters requires to be newly made in each plant during fruit ripening
and is therefore unlikely to be stably transmitted to the next generation. .
We have also noticed that other lines present additional phenotypes affecting leaves and
flowers. Such phenotypes are likely to be due to early developmental events that may take place in
meristems and therefore could be transmitted to the next generation of plants. In order to test the
possible transmission of these phenotypes, we have investigated their heritability in Line 2 and
Line 1 that present modified floral shape and development that result in fruits with multiple carpel,
and alteration of leaf shapet. The experimental plan used for this study was applied to lines 2 and
1 ((Fig 2.6B). Hemizygotes of T3 plants from these two lines were generated by crossing
homozygotes T2 parents with WT plants. T3 hemizygous plants were selected and selfed. T4 plants
were screened for the presence of the transgene (Fig 2.6).
A. Loss of the transgene
loss of the ripening defect !
Azygous
W
Line 8
WT
B. other developmental defects
Line 2
WT

Chapter 2
66
C
Fig 2. 6 Fruit phenotype of azygous and other defects on line 1 and line 2 as well as process
of screening T4 generation of line 2 and line 1. A. Fruits phenotype of azygous phenotype; B.
Other developmental defects of line 1 and line 2; C. Screening T4 generation of line 1 and line 2
with multi-carpels and abnormal flowers.
Table 1. T4 Plants culture in greenhouse
Plants Azygous plants % azygous plants Germinated seeds
Line2-AC11 1 8% 13
Line2-T6 2 6% 36
Line1-B7 10 22% 45
Line 1-D8 3 7% 46
Epialleles ?
T2 Homozygous
T3 Hemizygous
X WTX
½Hemi-
½Azygous
x WT
¼ Azygous
½Hemi-
¼Homo-
T4T4
Screening T4 generation of Line 2

Chapter 2
67
Fig 2. 7 All phenotypes of RNAi DML transgenic plants reversed to WT after transgenic
segregation. Leaf, flower and fruit (Br+7/46dpa) of WT (A) and transgenic plants of Line 1 after
lose transgene on T4 generation (B).
The phenotype of all T4 plants was analyzed irrespective to the presence of the transgene.
Finally we found that for both line 2, and line 1 plants that had lost the transgene by segregation
(table 1) have reversed to WT phenotype (Fig 2.7), suggesting an absence of heritability of the
modifications induced by SlDML2 knock down. However, we cannot rule out that some abnormal
methylation pattern, not linked to these apparent phenotypes are inherited. In addition, it is unclear
whether the plants obtained present an homozygous epigenetic state. Additional generations
obtained after selfing these plants should be analyzed.
A B

Chapter 2
68
Conclusion
In this chapter, we demonstrated that among the four SlDML genes, SlDML2 knockdown
results in fruit ripening inhibition via hypermethylation and repression of the expression of ripening
related genes. Four essential genes that related to fruit ripening were identified as the potential
primary targets of SlDML2, including three fruit ripening transcription factors, RIN, NOR, CNR
and a key enzyme of carotenoid biosynthesis PSY1. Our data demonstrate first time that active
DNA demethylation is critically important for tomato fruit ripening to occur.
To characterize the SlDML protein activity, SlDML1, 2, 3 full length and three truncated
SlDML2 (SlDML2-694, SlDML2-845, SlDML2-962) were successfully cloned into an expression
vector and destination vector. The recombinant constructions were expressed in vitro (E.coli),
unfortunately, the full length SlDML1, SlDML2 could not be successfully expressed in E.coli.
Only a full length SlDML3 and a truncated versions of SlDML2, SlDML2-845 containing the three
complete domains) and SlDML2-962 containing a truncated domain A) could be synthesized at
low levels in E coli. Unfortunately, SlDML3 full length wasn’t successfully purified. SlDML2-845
and SlDML2-962 were obtained, that were subsequently used for an activity test. We could not
demonstrate any activity for these two proteins which may be caused by the low production of
recombinant protein purification.
To study the potential stability of the phenotypes affecting plant development after transgene
segregation, T4 plants of line 1 and line 2 with abnormal flower and pericarp phenotype were
analyzed. As a result, T4 plants show us that the phenotypes reversed to WT phenotype once the
transgene was out segregated, suggesting an absence of heritability of the modifications induced
by SlDML2 knock down. However, we cannot rule out that some abnormal methylation patterns
linked or not to these apparent phenotypes have been inherited. Indeed, due to flower abnormalities,
hemizygous T2 plants have been back crossed to WT plants generating a heterozygous epigenetic
state. Indeed these plants have been selfed for one generation before their analysis as a first step to
generate homozygous epigenetic states. In addition, it is not known how many loci are involved in
generating the flower and leaf abnormalities. Hence, it is possible that lack of phenotypes is not
due to the non-heritability of the improper methylation state at specific loci. It may reflect that the
correct combination of homozygous methylation state at all required loci was not obtained. Further
generation and screening of more important plant population will be necessary to answer this point.
In this chapter, we have shown that the inhibition of fruit ripening in RNAi SlDML lines is
correlated with the hypermethylation of ripening related genes. Four genes (RIN, NOR, CNR and
PSY1) were identified to have a direct causal and effect relationship between active DNA
demethylation and gene expression. However, in addition to these four genes, how many genes
expressed during tomato fruit development and ripening have been impacted in plants knocked
down for SlDML2? What is the global impact of impaired active DNA demethylation on tomato
fruit ripening? To answer these questions, our next objective is to establish a global regulatory
network associated with active DNA demethylation during fruit ripening. For this purpose,
metabolome and transcriptome analyses were combined with the analysis of the genome wide
distribution of DNA methylation.

Chapter3
Chapter 3
Integrated network analysis reveals
that active DNA demethylation has
global effects on tomato fruit
development and ripening

Chapter3

Chapter3
69
Introduction
DNA methylation is a reversible epigenetic modification that plays important roles in transposon
silencing, genomic imprinting and regulation of gene expression (Bender 2004). Unlike in
mammals which genomic DNA methylation mainly occurs in the CG context; in plants,
methylation of cytosine occurs in three sequence contexts: the symmetrical contexts, CG and CHG
and in the non-symmetrical context CHH (H=A, C, T). A majority of DNA methylation in plants
occurs at transposable elements and repetitive sequence that are clustered in heterochromatin
(Zhang et al., 2006). In Arabidopsis, DNA methylation can also occurs in promoters and in the
bodies of expressed genes. In this later case DNA methylation ishighly correlated with gene
transcription. Indeed 61.5% of Arabidopsis expressed genes of Arabidopsis are entirely devoid of
methylation where 5.2% are methylated within their promoters and 33.3% are methylated within
their transcribed regions also called gene body (Zhang et al., 2006;Lister et al., 2008). Although
DNA methylation is essential for Arabidopsis, its impact on plant development may vary between
plant species.. For example, DNA methyltransferases 1 (MET1) mutant in Arabidopsis, late-
flowering plants were frequently observed among plants heterozygous, and this phenotype is more
sever in met1 homozygotes. This is caused by the hypomethylation of the FWA gene, which is
specifically controlling Arabidopsis flowering time (Soppe et al., 2000;Kankel et al., 2003;Saze
and Kakutani 2011). In rice, knocking out the major CG methyltransferase, OsMET1, impaired
seed development and vegetative growth and all seedlings underwent swift necrotic death(Hu et
al., 2014).
In plants, DNA methylation of cytosine can be removed by DNA demethylase (DMLs). DNA
demethylases are bifunctional 5-methylcytosine DNA glycosylase/lyase, which are critical for
preventing DNA hypermethylation at hundreds of genomic regions in Arabidopsis. More recently,
ros1 mutant was discovered 6902 hypermethylated differentially methylated regions with whole genome bisulfate
sequencing (Penterman et al., 2007; Tang et al., 2016). Four genes encoding DNA demethylase have
been identified in this species, DEMETER, DEMETER-LIKE 2 (AtDML2), DEMETER-LIKE 3
(AtDML3), and REPRESSOR OF SILENCING1 (AtROS1) (Cao and Jacobsen 2002;Choi et al.,
2002;Gong et al., 2002;Penterman et al., 2007;Ortega-Galisteo et al., 2008). The function of
Arabidopsis DNA demethylase family members have been well studied in recent years. In addition,
all of these four DNA demethylases can target both symmetrical cytosine CG, CHG and
asymmetrical cytosine CHH. It is worth pointing out that, DME and ROS1 can also remove methyl
from thymine, but not uracil, and show a preference for CG context (Morales-Ruiz et al., 2006).
DEMETER is known to be critical for active DNA demethylation in the central cell and thereby
for gene imprinting and endosperm development. Heterozygous DME/dme-1 mutant produced 1:1
seeds with normal embryos and enlarged endosperm with aborted embryos (Choi et al., 2002;Xiao
et al., 2003). AtROS1 is required for release of transcriptional silencing of an hypermethylated
transgene, and was shown protect the genome against unwanted methylation (Gong et al.,
2002;Agius et al., 2006). Yamamuro et al (2014) found that AtROS1 can influence the initiation of
stomatal lineage cell by regulating EPF2 expression(Yamamuro et al., 2014). AtROS1 may also
associate with RdDM pathway to participate to pathogen defense through regulating some defense
genes linked to TEs/repeats (Yu et al., 2013).XXXX here you have a put a sentence on thos article
in nature plant cocnering ros1!! AtDML2 and AtDML3 function as genome wide DNA
demethylases that remove 5mC marks at sites 3’ and 5’ of genes in adult cells, but there was no
obvious phenotype in the corresponding mutants and gene expression was not significantly affected.
Chapter3
70
In addition, ros1, dml2 or dml3 double or triple Arabidopsis mutants showed little or no
developmental alterations, suggesting that DNA demethylases do not have essential functions for
development in this species (Penterman et al., 2007;Yu et al., 2013).
Tomato is an important model to study fleshy fruit development and ripening. Some obvious
characters associated with fruit development and ripening have been well characterized such as
pigment synthesis and degradation, cell wall biosynthesis and disassembling, sugar and organic
acids metabolism, hormone biosynthesis and regulation, more specifically ethylene accumulation.
Recent studies have shown that the development and ripening of tomato fruit relies on the
establishment and maintenance of differential transcription patterns (Alba et al., 2005;Osorio et al.,
2011) and complex regulatory pathways that involve both genetic and hormonal controls are
operating at these developmental phases (Osorio et al., 2013). Several mutants affecting tomato
fruit ripening process or specific fruit characteristic of ripening fruits such as their color have now
been characterized. These include the ripening-inhibitor (RIN), non-ripening (NOR), colorless non
ripening (CNR) but also never-ripe (Nr), high pigment1 (hp1), high pirment2 (hp2), fruitfull (FUL1
and FUL2), agamous-like1 (AGL1) or the phytoene synthase 1 (PSY1) (Lanahan et al., 1994;
Vrebalov et al., 2002; Manning et al., 2006; Giovannoni 2007; Vrebalov et al., 2009; Bemer et al.,
2012). Other mutants include cell wall mutants, such as expansion (Exp1), pg2, Pectin
methylesterase (PME), cellulose (Cle1), tomato β-galactosidase (TBG1 and TBG4) (Brummell
2006), Sugar and organic acids mutants, such as 2-oxoglutarate dehydrogenase complex (OGDH)
as well as fumarase and malate dehydrogenase (MDH) mutants were also generated (Centeno et
al., 2011; Araújo et al., 2012). Another tomato mutant, GOLDEN2-LIKE (GLK) shows gradient
expression of GLK can influence the uneven coloration of green and ripe in fruit. In addition, GLK
expression may under regulation of histone modification, suggesting potential function of
epigenetic on the fruit ripening process(Nogueira et al., 2013).
In recent years, the coordinated changes during tomato development and ripening was analyzed
using combined transcriptome, metabolism and proteome characterization(Osorio et al., 2012).
However, it appears that a full understanding of tomato fruit development and ripening will not be
achieved based only on genetic models. In addition epigenetic regulation, mainly genomic DNA
methylation may play a key role in this process (Teyssier et al., 2008; Zhong et al., 2013). However,
the study of how fruit development and ripening process is controlled at the epigenetic level is still
at its early beginning. Indeed several evidence point out the importance of DNA methylation and
chromatin regulation on fleshy fruit development and ripening ripening (reviewed inGallusci et al.,
2016). For example, the fruit ripening defect of Cnr mutant is caused by hypermethylation of an
upstream region of the CNR promoter (Manning et al., 2006). Zhong et al (2013) also detected that,
the promoter region of several genes are demethylated during tomato fruit ripening, suggesting
that DNA demethylation may play critical role during this phase of development (Zhong et al.,
2013).
Indeed we have now shown that active DNA demethylation is critically important for fruit ripening
to occur. Phylogenic analysis of DNA demethylases in Arabidopsis and tomato has pointed out that
among the four tomato DML genes, SlDML1 and SlDML2 are orthologous to AtROS1, SlDML3 to
AtDME (DEMETER), while SlDML4 has no closely related Arabidopsis orthologue (Liu et al.,
2015). Tomato DML RNAi plants present fruit ripening defect, likely mediated by inhibition of
the expression of key ripening regulator genes RIN, NOR, CNR and carotenoid biosynthesis
enzyme PSY1 (Liu et al., 2015). Based on this finding, SlDML2 is considered to be a master

Chapter3
71
epigenetic regulator that governs tomato fruit ripening by controlling the DNA methylation level
at least at these four genes.
However, the pathways under the regulation of SlDML2 have not been comprehensively identified.
With the aim to obtain a more comprehensive view of the roles of active DNA demethylation on
tomato fruit development and ripening, we have performed a comparative analysis of the
transcriptome and metabolome of WT and DML RNAi fruits at eight fruit development and
ripening stages. These analyses was integrated with tomato epigenome determined in WT Ailsa
craig plants ( Zhong et al 2013). These analyses reveal that in addition to the four genes (RIN, NOR,
CNR, PSY1) previously characterized a large number of metabolites and genes present differential
accumulation and expression patterns respectively in DML RNAi transgenic fruits. For example,
carotenoid, ethylene biosynthesis and signaling, cell wall synthesis and dissembling, transcription
factors, and manu y others are extremely affected in transgenic fruits. These results suggest that
several genes, including those playing essential roles for fruit development and ripening might
require demethylation for their expression. Here, we present evidence for the first time that active
DNA demethylation has very global effects on fruit development and ripening.
I-Fruit Physiology and four DMLs Repression levels in transgenic fruits
To analyze at the molecular and biochemical level the fruits formed by RNAi DML transgenic
plants, two independent cultures were performed. For line 8, we used the culture already analyzed
in Liu et al (2015). For line 2, a new culture was performed in order to increase the number
developmental stages harvested. Interestingly, Line 2 plants from T2 generation showed two
distinct phenotypes. Sixteen plants out of the 23 used in this experiment showed fruits with an
increased carpel number that will be subsequently referred to “fruits with multiple carpels”,
whereas 7 plants showed no change in fruit shape or developed fruits smaller than WT (Small fruit).
To distinguish between these two fruit phenotypes observed in line 2, fruits with multiple carpels,
named line 2Y, were sampled separately from small fruits that were named line 2 X. The same
relevant WT control (WT1) was used for both line2Y and line2X. Fruits were harvested at 7
different developmental stages: 20, 30, 35, 39 (equivalent to the WT1 Breaker stage), 46
(equivalent to the WT Red Ripe stage), 55, 70, 85dpa. The samples for line 8 and the relevant WT
control (WT2) are described in Liu et al (2015), including an azygous sample at 20 dpa. In this
case, fruits were harvested at 5 developmental stages: 20, 35, 39 (equivalent to the WT1 Breaker
stage), 55, 70, 85dpa. In total, two independent T2 lines, lines 2 and 8, were used in this study, and
for line 2 plants two sublines that differed on fruit size and shape were sampled separately. For
each line and subline three individual plants were used as biological replicates for the production
of RNA-seq libraries and for GC-MS and NMR analysis.
Fruits from both Line 2Y and Line 2X showed a strong inhibition of the ripening process (Fig 3.1
A) similar to those previously described for Line 8 and Line 2 (Liu et al., 2015). Indeed, some
variations were consistently observed between plants of the same line and subline, as previously
documented (Liu et al., 2015)
RNA seq data obtained from WT1, WT2, line 2X and Y and line 8 were used to determine the
expression level of the 4 tomato SlDMLs gene (Fig 3.1B, p73). Expression patterns in WT were
essentially as described in Liu et al (2015). In particular, SlDML2 was the more highly expressed
SlDML gene in fruits and is characterized by a sharp increase at the breaker (Br) stage in WT,
before decreasing to half of its maximum expression level at 46 dpa, and to almost undetectable

Chapter3
72
levels in fruits at 70 and 85 dpa. In contrast, in transgenic fruits of lines 2 and 8, SlDML2 is knocked
down to 50% of WT level during early fruit development and severally repressed at the Br stage.
However, SlDML2 mRNA levels increase in overripe fruits to levels higher than WT fruits of the
same age. SlDML1 is also repressed by 50% of WT level at 20 and 30 dpa but increased at later
stages to levels higher than WT fruits. No major effects were observed on SlDML3 and SlDML4
genes. Similar results are observed in both transgenic lines, consistent with previous conclusion
obtained by Q RT-PCR using these transgenic lines. Hence, ripening defects are correlated with
the strong repression of SlDML2 during fruit ripening (Liu et al., 2015).

Chapter3
73
Fig 3. 1 Phenotypes of tomato DML RNAi fruits and DML expression patterns. (A) Fruits
from T2 plants (left to right); WT plants, line 2 plants (Line2Y and Line2X). Fruits of Line 2Y have
multiple carpels, those for Line 2X are small and have a normal carpel phenotype. (B) Expression
level of four DML genes in WT1, WT2 and line 2Y, line 2X, line 8 as determined by RNA seq.
Asterisks indicates significant difference between WT and transgenic samples at a given stage:
*p<0.05; **p<0.01; ***p<0.001. Error bars indicate biological repetitions of means ±SD.
A
B

Chapter3
74
II- Metabolic composition of WT and transgenic fruit
Previous results have shown that metabolic composition of DML RNAi fruits is clearly modified
as compared to WT (Liu et al., 2015, Chapter 2). In order to determine possible correlation between
the RNA patterns described later (see Chapter 3, part III) and metabolite accumulation both in WT
and DML RNAi plants, we further investigated the metabolic composition of WT and transgenic
fruits. To achieve this goal, metabolite composition was determined in exactly the same biological
samples as those used for transcriptomic analyses (see Chapter 3, part 3) as follows: (1) primary
metabolites, including a few secondary metabolites were measured by broad targeted method GC-
MS (quantification of 58 identified metabolites in Line 2Y/2X, 64 metabolites in line 8) as the
method in (Carrari et al., 2006)and NMR (34 metabolites in line2Y/2X) as described in Liu et al
(2015); (2) in Line 2X and 2Y isoprenoids including chlorophylls, carotenoids were analyzed by
HPLC (Télef et al., 2006) and starch using an enzymatic approach (Hendriks et al., 2003).
Tukey’s pairs test was performed on all identified metabolites. The evolution profiles of
metabolites are presented in Fig3.2 and FigS3.1 (p75, p131, Line 2) and FigS2 (p126, Line 8). For
GC-MS data on line 2, 47 compounds showed significant changes in Line 2Y, 49 in Line 2X and
17 in line 8 as compared to their respective WT controls. For NMR data, 26 in Line 2Y and Line
2X, showed significant differences with WT controls.

Chapter3
75
Fig 3. 2 Characterization of metabolite content in WT1 and in transgenic RNAi fruits.
Absolute concentration of (A) Amino acids, (B) Soluble sugars, (C) organic acids, (D) pigments
and starch, and (E) Other compounds. For each compound a Turkey test was performed between
WT and transgenic fruits. Stars indicate significant difference between WT and transgenic fruits of
the same age (*: p<0.05; **: p<0.01; ***: p<0.001). Compounds shown in A, B, C, E were
analyzed using H1-NMR as described in Liu et al (2015).
µm
ole
.g-1D
W
Days post anthesis

Chapter3
76
2.1 PCA analysis of metabolic compositions allows the separation of WT and transgenic fruits
during ripening
To visualize the modifications of WT and DML RNAi fruits metabolic composition through
development and ripening, PCA were performed on line 2 and line 8 separately and their respective
WT controls. For Line 2, all data including primary metabolites determined by GC-MS and NMR,
as well as chlorophylls, carotenoids, lycopene and starch were integrated together. When similar
compounds have been analyzed by GC-MS and NMR, only GC-MS result were considered.
Altogether, 58 metabolites from GC-MS, 15 from NMR, and chlorophylls, total isoprenoids
(including beta-carotene and lycopene) and starch, in total 74 metabolites were considered for line
2 and WT1. For line 8 and WT2 the 64 metabolites obtained by GCMS were used for the PCA
analysis.
For WT1 and Line 2, PC1 and PC2 represent 37.1%, 16%, respectively of the total differences in
metabolite composition. Similarly for Line 8 and WT2, PC1 represents 30.7% and PC2 19% of the
total differences (Fig 3.3, figS3.3, p77, p133). In both cases, a clear separation is observed between
early and late developmental stages for both WT and transgenic fruits, which are mainly separated
along PC1. WT1 and WT2 from 20dpa to the Br stage were clustered together with transgenic
fruits of line 2 and 8 respectively, from 20dpa to 46 dpa (corresponding to Br+7 in WT), indicating
that at these stages the changes of metabolites of fruits is very similar in both type of genotypes.
At later developmental stages (starting after 46dpa for DML lines, and at Br stage in WT) and older
stages up to 85dpa, WT1 and WT2 fruits were all clustered and clearly separated from fruits of line
2 or line 8 respectively of the same age that also clustered together.
When analyzing the compounds responsible for the separation between samples, major differences
between Line 2 and WT1 are due to dehydroascorbate, galactose, glucose, Gln, fumarate.
Adenosine-like, galactinol, glycerate, carotenoids, xylose as well as malate. Similar results are
found for line 8, with the exception of isoprenoids and starches that were not considered for this
line. In addition, galactose, raffinose were quite different in line 8 as compared to line 2.

Chapter3
77
Fig 3. 1 Principal component analysis of metabolic profiles of WT1 and line 2 fruits during development and ripening. (A) PCA using primary
metabolites determined by H1-NMT, chlorophylls, carotenoids and starch of WT1 (red square), line 2 X (green circle) and line 2Y (blue triangle) at
8developmental stages. Note the clear separation of WT and transgenic fruits from Br (39 dpa) to 85 dpa. (B) Variables plot of metabolites for the
first two principal components (PC1 and PC2). Compounds that give large contribution either to PC1, PC2 or both are labeled with red color.
A B

Chapter3
78
2.2 Sugars, organic acids, amino acids, pigments show different accumulation pattern in WT
and transgenic fruits
To determine the differences in accumulation patterns between WT and transgenic fruits, K-means
clustering was performed using metabolites showing significant differences between WT1 and
Line 2Y. A total of 64 compounds were used here (see method). Six clusters were obtained for WT
and transgenic fruits that could be ranged in four major accumulation patterns. (i) the abundance
of most metabolites in WT1, increased at Br, but almost all these metabolites showed a delayed
increase (cluster 5 at 46 dpa) or a delayed and reduced accumulation pattern (cluster 6 at 70dpa) in
transgenic line; (ii) the abundance of metabolites in clusters 1 and 2 decreased from Br onward in
WT. A similar pattern is also found in the transgenic lines but at later stages at 55dpa or later at
70dpa in transgenic fruits (Fig3.4, p79); (iii) metabolites in Cluster 3 dramatically increased at very
late stages (70 and 85 dpa) in WT fruits but the increase does not occur in transgenic fruits; (iv)
cluster 4 showed stage specific accumulation pattern, while in transgenic plants almost keep stable
level. Compound in each group is indicated in table (Fig 3.4B, p79). The pathway map that shows
significantly changed metabolites between WT and transgenic fruits indicates that major
differences are observed at ages corresponding to WT fruit ripening (Fig3.5, p80), consistent with
the results of the PCA and cluster analyses (Liu et al., 2015). As a conclusion, the general trend is
that soluble sugars, amino acids, organic acids and also secondary metabolites, accumulation or
degradation is delayed and for some of them remains limited at low levels in transgenic fruits as
compared to WT fruit of the same age during the ripening phase (Fig3.4, Fig 3.5).

Chapter3
79
Fig 3. 4 Clustering of metabolic profiles in WT1 and line 2Y fruits during fruit development,
ripening and later stages. (A) Clusters were obtained based on all 64 metabolites measured by
LC-MS as described in the methods. The pink line represents the median value in each cluster.
Grey lines represent independent metabolites WT is on the left, and Line 2Y on the right. (B)
Compounds in each cluster.
Clusters pigment, starch
sugar, sugar- related
amino acids TCA organic acids fatty acids others
Cluster 1 starch, chlorophylls
sucrose, raffinose, rhamnose, raffinose, myoinositol
Leu,Pro, Ser, Val,Thr,bAla, Ile,GABA,Phe
citrate, malate
unkS5.4, UDP_like, unkS2,97
Cluster 2 ribulose-5-p Asn,Gln,His, pryo-Glu
fumarate, succinate
nicotinate trigonelline, choline, urea
Cluster 3 galactinol Gly,Tyr,Ala,
Cluster 4 glycerol puterscine 2oxglutarate
Cluster 5 xylose Asp,Glu ethanolamine, threonate, galacturonate
palmitate, octadecan- oate
Calystegine A3,uracil, urate, unkD5,15
Cluster 6 lycopene, carotenoids
fructose, galactose, glucose, threitol, guanosine
Trp
ascorbate, d-ascorbate, adenosine_ like
uridine_like, 3CGA, trans

Chapter3
80
Fig 3. 5 Metabolite changes in WT1 and line2 tomato fruits. The color legend indicates normalized fold changes relative to the mean
of WT and line2. 3PGA, 3-phosphoglyceric acid; PEP, phosphoenolpyruvate. Amino acids, sugars, TCA-cycle intermediates, pigments
and metabolites without measured with GC-MS or NMR are displayed in blue, green, purple, red, and grey colored font, respectively.
Glc-6P
Fru-6P
3PGA
PEP
Pyruvate
Acetyl CoA
TCA Cycle
Oxaloacetate
Homoserine
Alanine
Shikimate
Threonine
Methionine
β-Alanine Asparate
Asparagine Uracil
Isoleucine
Proline
Chlorophylls
Histidine
Glutamine
2-Oxglutarate
Citrate
Palmitate
3-CGA,trans
Galactose
Glucose Sucrose Raffinose Threonate Ascorbtae
Fructose
Ethanolamine
Glycine Serine
Glycerate Glycerol
Rhamnose Galacturonate
Tryptophan
Phenyalaine
Tyrosine
GABA Glutamate
Fumarate
Malate
Valine Leucine
Myo-inositol Galactinol
Lycopene Carotenoids
Starch unkD5,16
Nicotinate Trigonelline
Phosphorate Octadecanoate
Pyroglutamate Ribulose-5-p
Urea Urate
UDP_like
unkS5,5 Threitol
Guanosine unkS2,98
Choline Uridine_like
Adenosine-like
Succinate
Xylose
Arginine Putrescine

Chapter3
81
2.2.1 Accumulation of sugars
Accumulation kinetics of major soluble sugars were measured using H1 NMR in WT1 and WT2
WVA106 fruits during fruit development and ripening were quite similar to those previously
described in Ailsa craig (Carrari et al., 2006)and in WVA106 (Fig 3.2, p 75 and Liu et al, 2015 ).
Glucose and fructose accumulated in a linear manner from 20 to 39 dpa and peaked at the red ripe
stage 46dpa, before a slight decline in overripe fruits (55 dpa onward). Cell wall related sugars,
such as galactose, guanosine show an accumulation pattern similar to glucose and fructose, in
contrast to raffinose, another cell wall related sugar, which showed an opposite trend.
In contrast to what observed in WT1 and WT2 fruits, glucose, fructose and galactose accumulation
remains very limited at all stages in DML RNAi fruits of lines 2 (Fig 3.4, Fig S3.1 p79, p131).
Consequently, whereas sucrose, declined in WT 1 (cluster 1), it remained abundant even at late
stages indicating that this sugar was not efficiently metabolized in transgenic fruits, but this is not
the case for sucrose in WT2 and line 8. The accumulation profile of glucose and fructose in DML
fruits is similar to the one observed in fruits of the rin, nor and Nr mutants. However, sucrose
behaved in the different way as compared to these three mutants that are all characterized by a
significant decrease in sucrose content (Osorio et al., 2011).
2.2.2 Accumulation of amino acids
When considering the amino-acids, 21 and 14 were analyzed with GC-MS and NMR respectively,
a subset of which presented clearly distinct accumulation patterns in transgenic fruits of both lines
as compared to fruits of WT1 and WT2 controls. In WTs, the changes in amino acid content
followed essentially two major patterns (1)Glu, Asp,Trp, Ala, Tyr, Gly amount increased during
fruit ripening, which located in clustering patterns (i) and (iii).(2) the abundance of GABA, Ser,
Thr, Val, Phe, Ile, β-Ala, Leu decreased from 46 dpa to 85 , although not exactly with the same
profile consistent with clustering pattern (ii). In transgenic fruits, these accumulation profiles were
changed; with the major differences being observed at fruit ages corresponding to ripe and over
ripe WT.
Among the main effects observed, the content in a few amino acids displayed a delayed and limited
reduction in transgenic as compared to ripening WT fruits. Thus, Asn, pyroglutamate and Gln
remained at high levels in transgenic plants from 55dpa onward, although their content decreased
at later developmental stages (70 and 85 dpa). A similar trend was observed for GABA and Val,
although in these cases, the differences were transient and occurred between 39 and 55 dpa (Fig
3.5).
In contrast, other amino acid showed a reduced accumulation level in transgenic fruits as compared
to WT fruits of the same age. This was observed for Leu, Ile and Ala from 39dpa to 85 dpa (Leu)
or later from 46 dpa onward (Ala and Ile). Asp and Glu as two major amino acids, which were also
clustered in cluster 5 showed delayed and even higher accumulation in transgenic fruits.
2.2.3 Accumulation of organic acids
B

Chapter3
82
When considering Organic acids, they show specific behaviors during WT fruit development and
ripening. Hence malate, a major TCA intermediates, accumulates to reach the highest level in
immature fruits, and starts decreasing at 46 dpa and later stages. Citrate followed an U shaped
accumulation kinetics whereas, fumarate remains at rather low level all through fruit development.
Succinate accumulated at very low levels and followed a wave like accumulation kinetic. Finally,
2-oxglutarate peaked at Br+7 in WT. In transgenic fruits, all of these intermediates behaved
differently as compared to WT. For example, malate amounts are similar to WT up to the breaker
stage, although slightly more abundant in a few plants. In contrast to WT fruits characterized by a
sharp decrease in malate content after 46 dpa (6 fold decrease), malate content remains high at 46
dpa before a very progressive decrease from 55 dpa onward. It reached a level similar to WT fruits
only after 85 dpa. Considering fumarate, in contrast to WT fruits this compound accumulate in
transgenic fruits with the highest content observed at 39 and 46 dpa, before a slight decrease at
later developmental stages. Citrate, although the kinetic of accumulation detected using GC-MS
and NMR were different, behaved with both methods similarly in transgenic and in WT fruits as
previously described (Liu et al., 2015, Sup data Fig S5, p48). Fumarate was slightly more abundant
at certain stages in the transgenic lines.
Additional compounds also showed significant differences between line 2 and WT1 at specific fruit
developmental stages. For example, organic acids that do not belong to the TCA cycle, including
phosphorate, threonate, ethanolamine, nicotinate, galactinol, but also sugar alcohol and sugar
phosphate, and octadecanoate, myo-inositol, didn’t display clear peaks at the onset of fruit ripening
although some of them increased gradually (ethanomamine, galacturonate, threonate,
adenosine_like, threitol, guanosine) or inversely decreased (glycerol, myo-insositol).
2.2.4 Accumulation of pigments
Pigments, including chlorophylls, lycopene and total carotenoids were dramatically affected in
transgenic fruits. In WT fruits, Chlorophylls showed gradual degradation during development, to
reach undetectable levels in red ripe fruit. In transgenic fruits of both line 2 (Fig 3.5 and 8 (fig
S3.1), chlorophyll degradation is delayed and chlorophylls were still detected even at 55 dpa. This
pattern is similar to the one observed for starch and malate (cluster 1).
Lycopene and total carotenoids are known to accumulation at very high level during tomato fruit
rienng (Liu et al., 2015). In WT fruits lycopene was first detected at the breaker stage and reach a
maximum level accumulation level at Br+7 (46dpa) and remained highly abundant at later stages
in WT fruits. In transgenic fruits, the lycopene accumulation is delayed and dramatically limited.
It could hardly be detected at 39 dpa in line 2 plants and 39 in line 8 and its accumulation remainded
very limited in both caseq. A similar behaviorwas observed for major sugars (fructose and glucose),
and also for galactose which all clustered together (cluster 6).
2.3 Network analysis indicates that RNAi DML transgenic fruits display higher network
density than WT
To compare the metabolites network in WT and RNAi DML transgenic fruits, we evaluated
pairwise correlations of metabolites in each genotype, separately. The same metabolites as those
used for clustering analyses in line 2 were also used for pairwise correlation analysis, but only
using five developmental stages (35, Br, 55, 70, 85dpa) in order to focus on on fruit ripening.

Chapter3
83
Similarly 50 compounds obtained by GC-MS for WT2 and line 8 were analyzed at the same
developmental stages.
Results indicate that 254, 466, 185 pairwise correlations between metabolites could be identified
that were unique in WT or in transgenic fruits, and common to both type of fruits, respectively.
Similar results were obtained with line 8 (130, 222, 87, pair wise correlation with WT2, in line 8,
and both, respectively) (tableS1, provided as additional excel file online).
We subsequently extracted these two types of correlation to determine the corresponding
metabolite connections (Fig3.6, p84; figS3.4, p34, table S1). Obvious examples are pigments and
starch that showed more correlated pairs than in WT1. Sugars related to cell wall metabolism,
including rhamnose and xylose also had more correlated pairs than in WT (similar to line8/ WT2
analysis). Another cell wall compounds, galactose, behaved in a distinct way. Only 2 common pairs
of significant correlation were found in WT and line 2Y (Gln and glucose), but 15 unique pairs
were found in WT. This is consistent with the specific accumulation pattern of galactose that do
not change along the fruit ripening process in transgenic fruits (FigS3.1, p131). Another striking
example is malate, a major intermediate of the TCA cycle. Malate show 9 pairs of significant
correlation with other compounds, including positive correlation with citrate, pyroglutamate,
galactose in WT1 consistent with the observation that these compounds accumulate in a
coordinated way. In contrast, these correlations are not maintained in RNAi DML transgenic fruits,
but 28 more pairs were found, for example positive correlation with rhamnose, sucrose. This
indicates that primary metabolism as well as carotenoid pathway was affected during fruit ripening
in transgenic fruits and suggests that the repression of demethylation affects differentially the
accumulation of the different metabolites detected in this study.
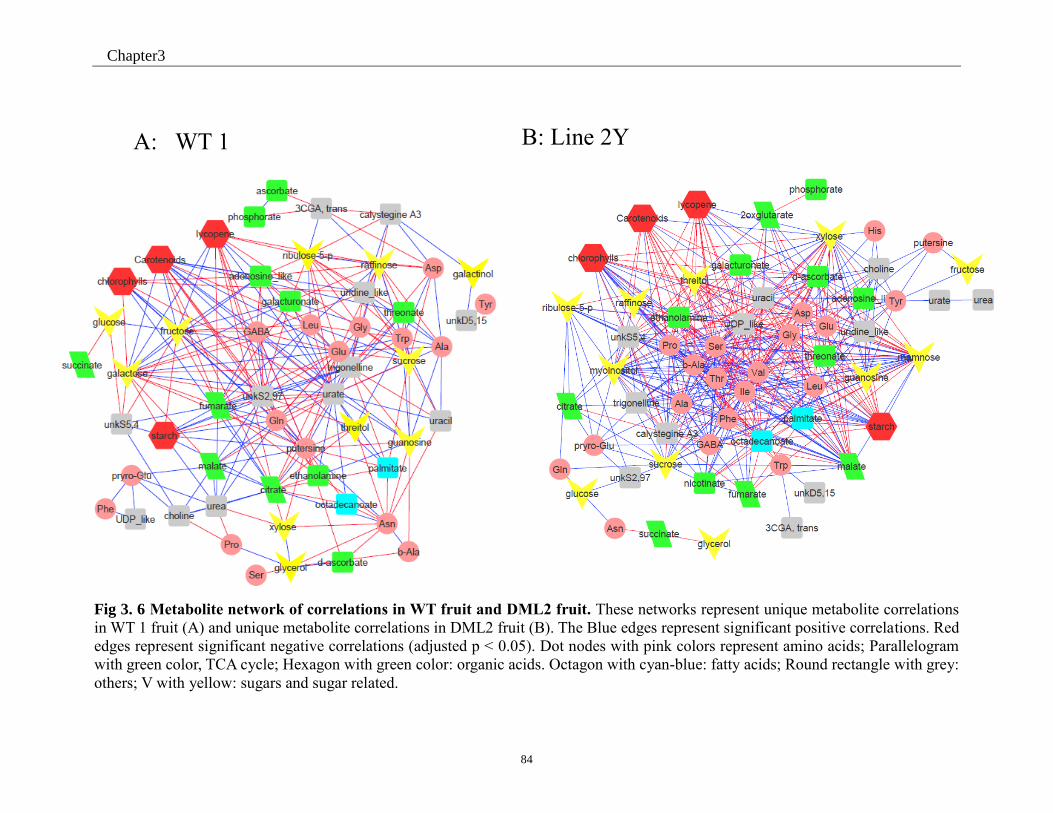
Chapter3
84
Fig 3. 6 Metabolite network of correlations in WT fruit and DML2 fruit. These networks represent unique metabolite correlations
in WT 1 fruit (A) and unique metabolite correlations in DML2 fruit (B). The Blue edges represent significant positive correlations. Red
edges represent significant negative correlations (adjusted p < 0.05). Dot nodes with pink colors represent amino acids; Parallelogram
with green color, TCA cycle; Hexagon with green color: organic acids. Octagon with cyan-blue: fatty acids; Round rectangle with grey:
others; V with yellow: sugars and sugar related.
A: WT 1 B: Line 2Y

Chapter3
85
III. RNA seq analysis WT and RNAi Transgenic Lines
Previous results have shown that three key fruit ripening regulators (RIN, NOR, CNR)
and lycopene biosynthesis gene PSY1 were extremely repressed (RIN, NOR, PSY1) or
delayed (CNR) in transgenic fruits (Liu et al., 2015b, Chapter 2). Moreover, the promoter
regions of these genes were hypermethylated in RNAi transgenic fruits as compared to WT
fruits. In addition, metabolic analyses showed significant differences during fruit ripening
between WT and DML RNAi transgenic plants. In order to complete the networks of genes
that were differentially expressed in WT and DML transgenic lines and to label out the
potential DMLs primary targets, we have characterized transcriptomes using the same
tissues as those used for metabolic analysis.
3.1. Summary of RNA seq data
RNA seq analysis was performed as described in Zhong et al, (2013). A total of 72
(line 2) and 36 (line 8) samples were analyzed by RNA seq which generated between 3.27
to 14.12 million reads per sample (sampling method see materials and methods). Given the
high number of samples, and the quality of the tomato genome assembly, the targeted
number of counts was 10 million for all samples. This was shown to be sufficient to
determine the main differences between samples but will not allow identifying differences
in weakly expressed genes. After filtering 2.57 to 12.25 million reads were obtained
between 77.63% and 93.36 %, which could be mapped to the tomato reference genome
(Table S2). These analyses were performed in the laboratory of J Giovannoni, using the
protocols and bioinformatics pipelines described in Zhong et al (2013).
3.2. Differential Gene Expression between WT and transgenic fruits
To identify the differentially expressed genes between WT and transgenic fruits, all
DEGs were analyzed by DESeq2. A total of 15,556 genes in WT1 and Line 2Y, 15,556
genes in WT1 and line2X, 14,274 genes in WT2 and line 8, approximately 44.8%, 44.8%
and 41.1% respectively of the annotated genes in the tomato genome (Tomato Genome
Consortium, 2012), were expressed in at least one sample, The size of the different libraries
is shown in FigS3.5 (p135). There was little variation in the total number of genes
represented at each stage, similar to other fruit transcriptomic studies (Pattison et al., 2015).
Normalized read counts from independent biological replicates within one line was
highly correlated at each stage (R2>0.98) (line2Y compared with line2X), whereas the
correlation between line2Y and line8 was lower (for example, R2=0.892 at 55dpa). This
suggests variations between lines at the stages analyzed. A higher correlation between
adjacent stages was also detected in transgenic lines than in WT meaning that the

Chapter3
86
expression pattern of adjacent stages is more similar in transgenic plants as compared to
WT fruits (fig3.7A, figS3.6, p87 and p136).

Chapter3
87
Fig 3. 7 Relationship of tomato fruit pericarp related transcript expression profiles
and differentially expressed genes. A. Correlation analysis of RNA seq data between line
2Xand Y at 39 dpa., line 8 and line 2Y at 39dpa, line 2Y at 35 and 39 dpa, and WT1 at 35
and Br stage (39dpa) B. Number of DEGs at each stage between Line 2Y and Line 8 and
their respective controls, WT1 and WT2.
B
A

Chapter3
88
Differentially expressed genes (DEGs, Fig3.7, figS3.6, p87 and p136) were identified
by pairwise sample comparisons, and those differentially expressed in at least one stage
were recorded as DEGs (Method is described as materials and methods). In total, 9,975;
10,095 and 8,390 genes were identified as DEGs in Lines 2Y and 2X versus WT1 and line
8 versus WT2, respectively.
The numbers of up- and down-regulated genes according to fruit stages are shown in
Fig.7B and FigS6B (p83, p130). When comparing the distribution of DEGs at each stage
between the different lines, a similar pattern was observed in line 2X, 2Y and line 8,
although line 2Y is closer to line 2X as expected. At early stages, from 20 days post-
anthesis (dpa) until before Breaker (Br) stage, the number of DEGs remained low ranging
from 301 to 617 in line2Y, 238 to 486 in line 2X and 38 to 201 in line 8. This indicates that
there is little difference between WT and DML RNAi fruits during tomato fruit
development. Obviously, there is a sharp increase in DEG number from Br stage and during
ripening and later. DEG numbers varies from 3404 to 6759 in line 2Y, 3268 to 7045 in line
2X and 4327 to 5047 in line 8. This clearly indicates that the effect of DML knock down
mainly affect the fruit ripening process and has very little impact on early stages of fruit
development. Increase in DEG number observed at Br of fruit ripening could be linked to
the induction of genes observed in WT fruits at the Br stage (Fig 3.8A, p90). This massive
gene induction is not observed in transgenic plants of line 2 and 8. Additionally, many
genes are also down regulated in WT fruit at this stage, a phenomenon also not observed
with the same intensity in transgenic fruits (see below). It should be noted the number of
DEGs is higher when comparing line 8 to WT2 than lines 2 (X and Y) to WT1 at the Br
stage. However, as explained above, both cultures were performed independently at two
different seasons (line 2 is mainly in spring, while line 8 is in winter). Hence, WT fruits of
the same age were more advanced in the line 2 culture than in the line 8. For line 8, WT
fruits were at the late Br stage but Line 2 is at early the breaker stage. Comparatively, fewer
genes are likely induced at the early breaker stage in WT1 fruits as compared to WT2 fruits
at the late breaker stage, the number of DEGs at this stage might be reduced in line 8 versus
WT2, as compared to line 2 versus WT2.
For further analysis, DEGs that are common between all lines at selected time points
(20, 35, 39, 46, 55, 70 and 85dpa) in all lines (Line 2Y/2X and line 8) were selected. In
total, 6212 DEGs satisfied this condition. Additional DEGs that were found in only one line,
the list of which is shown in table S3, will not be included in the analysis presented below
(Fig3.8B, p90).
To determine the reliability of RNA seq data, five of the DEGs (RIN, NOR, PSY1,
ACS4, ZISO) in Line 2Y; eight DEGs (RIN, NOR, CNR, PSY1, ACS2, ACS4, PG2a, ZISO)
in line 8 were analyzed at the 8 and 6 stages respectively were checked using QRT-PCR.
As shown in Supplemental Figures S3.6C, S3.6D (p136). The RNA seq data were
confirmed for the downregulated genes in line 2Y, in line 8. RNA seq data is consistent
with qRT-PCR (R2>0.8 in each genotype). In a conclusion, all of these checked DEGs
show consistent changes, which confirming the reliability of RNA seq data.
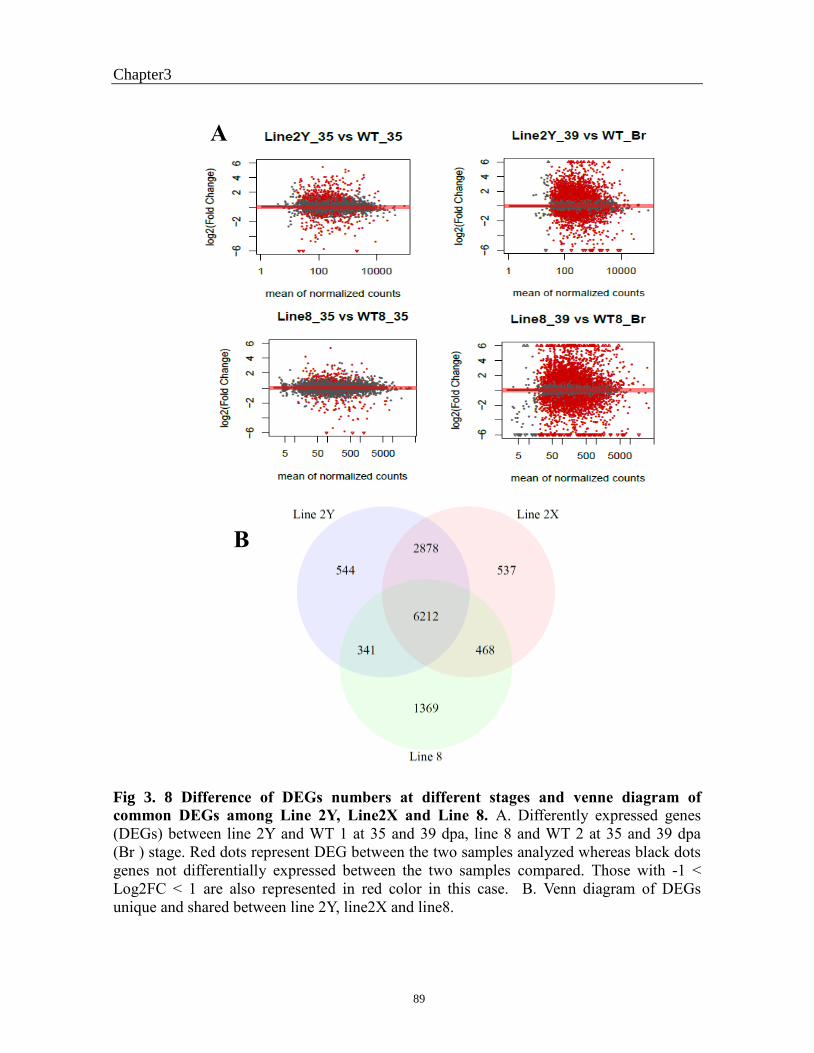
Chapter3
89
Fig 3. 8 Difference of DEGs numbers at different stages and venne diagram of
common DEGs among Line 2Y, Line2X and Line 8. A. Differently expressed genes
(DEGs) between line 2Y and WT 1 at 35 and 39 dpa, line 8 and WT 2 at 35 and 39 dpa
(Br ) stage. Red dots represent DEG between the two samples analyzed whereas black dots
genes not differentially expressed between the two samples compared. Those with -1 <
Log2FC < 1 are also represented in red color in this case. B. Venn diagram of DEGs
unique and shared between line 2Y, line2X and line8.
B
A

Chapter3
90
3.3. Comparative analysis of transgenic and WT fruits
To assess the dynamics of transcriptional patterns among samples, principal
component analysis (PCA) and hierarchical clustering were performed on all the DEGs
selected above (Fig 3.9, Fig S3.7, p92 and p137). Both analyses confirmed that most
differences in gene expression profiles occurred during the fruit ripening process. The first
two principle components explain approximately 68% of the variation at the global
transcriptomic level for WT1 and line 2Y/2X (70% for WT2 and line 8, including an
azygote line at 20dpa). Before fruit ripening from 20dpa to the Br stage, WT and transgenic
fruits were plotted together. The first principal component, which explains 49.3%, separates
WT at 46dpa and later ripening stages (55dpa~85dpa) from all other samples; whereas the
second principal component (17.7%) (19.8% for WT2 and Line 8) separate WT and
transgenic fruits from 20 to 39dpa; from the transgenic fruits at 46dpa and more.
Obviously, most of the transcriptomic variance is detected during fruit ripening, as
previously described (Liu et al, 2015b).
To discriminate between DEGs, all DEGs were first separated based on the log2FC
ratio (Line2Y versus WT1) at each stage (To be clear, here the separation of all DEGs is
based on common DEGs were defined above). Once those showed Log2FC<-1 at any stage
(among 8 stages that were detected), were considered as downregulated DEGs genes. Those
with a Log2FC ration above 1 were considered as upregulated genes in transgenic as
compared to WT. This implies that DEGs belonging to the upregulated class are never
repressed in transgenic fruit compared with WT. Thus downregulated and upregulated
genes were clustered separately.
All DEGs fall into 9 clusters that can be organized in three distinct groups: (i) group 1
corresponding to Clusters 1, 2, 3, represents a total of 3499 genes which show absence or
delayed down regulation in transgenic fruits as compared to their repression during WT
fruit ripening (ii) group 2 corresponding to clusters 4, 5, represents 1345 genes that show
no or delayed induction in contrast to their strong induction observed during WT fruit
ripening (iii) group 3 corresponding to clusters 6, 7, 8, 9 represents 1368 genes that show
stage specific down regulation during fruit development and ripening in transgenic fruits as
compared to WT fruits of the same age (Fig3.10, p93). Number of DEGs in each cluster
was listed in table1.
In order to analyze how the global difference of DEGs in three groups, we used
Log2FC (2Y/WT1) of all DEGs to plot in PCA again, as in clusters, we found that most
genes were overlapped in their own group, indicating the fold change of these genes
between WT transgenic fruits occurs on the similar stages. Genes in group 1 and group 2
were separated by those of group 3, which is widely overlapped with group 1 and group2,
since the expression of genes in group 3 is either similar to group 1 or group 2, except
39dpa to 55dpa were different with group 1 or group 3, this is the reason why group 3 is
overlapped with group 1 and group 2. This result is consistent with the grouping of clusters
that show distinct transcript accumulation patterns among the three groups. However as
genes in group3 present stage specific repression they might appear similar with those of

Chapter3
91
group2 or group3 at other stages, thus explaining the partial overlap between group 3 and
groups 1 and 2 (Fig 3.12A, p102).
Fig 3. 9 Principal component analysis of RNA seq data and DEGs profiles of WT1 and
line 2 fruits during development, ripening and later stages. A. Distributions of
genotypes and development stages. Color indicates the different genotypes: red square, WT;
blue triangle line2Y and green circle line 2X. For Each stage has been performed in
triplicate. B. Heatmap of all common DEGs between WT1 and Line 2Y. Hierarchical
Clusters are shown on the left and were obtained by Spearman method.
A B
WT 1 Line 2Y

Chapter3
92
Fig 3.10 Nine clusters of DEGs were classified between WT1 and line 2Y. Nine clusters
have been obtained using Spearman method and grouped based on their expression pattern
as shown. (A) group 1 correspond to clusters with genes being less expressed in WT than in
transgenic at all stages of fruit development (cluster 1-3) (B) group 2 corresponds to DEGs
induced at the Br stage in WT and expressed during fruit ripening and at later stages,
whereas they are not expressed or lately expressed in transgenic fruits and (cluster 4-5) (C)
group 3 correspond to clusters with stage specific differences between WT and transgenic
fruits, with clusters 6-9 corresponding to genes induced at Br and expressed during fruit
ripening but not at late sages in WT, and induced at very late stages ( after 55 dpa)n cluster
8 to genes induced at late stages ( after 55 dpa) in WT but not in transgenic fruits and Pink,
transgenic fruits; Green: WT, black and blue lines are the mean value of calculated using
the normalized counts.
A B C
Cluster 5_441 genes

Chapter3
93
3.4. DEGs distribution within in each cluster
To investigate the distribution of DEGs in biological process, we performed gene
enrichment analysis for each group and each cluster, using mefisto software that has ranked
genes in 35 MapMan functional categories termed BINs (TableS4, provied as additional
excel file online), as indicated in the material and methods (Usadel et al., 2005).
DEGs belonging to group 1 (clusters 1, 2, 3 including 920, 2441, 138 DEGs
respectively), are in general repressed in WT fruits either during all the ripening process
(clusters 1 and 2) or more specifically at the Br stage (cluster 3). However, in transgenic
fruits, group 1 DEGs showed distinct expression profiles as compared to WT. DEGs from
cluster 1, are induced instead of repressed during fruit ripening. For cluster 2 and 3, DEGs
are also down regulated during the ripening of DML RNAi fruit, but their repression level
remains limited as compared to WT. Transgenic fruits in cluster 2 showed a slight decrease
all along fruit development and ripening, unlike cluster 3, WT presented specific drop at Br
stage, causing the separation of cluster 2 and cluster 3 (Fig3.10A, p93).
Gene enrichment shows that Group1 over-represented genes belong to 15 categories
(Fig3.11, p95, see table S4). Indeed many genes are unknown, and misc belong to misc.
However, the main functional categories correspond to RNA (including RNA processing,
transcription and transcription factor), signaling (including sugar and nutrient physiology,
receptor kinases) and many cell wall genes.
More interesting, when over-representation were performed on each cluster separately,
genes involved in photosystem and cell wall were only enriched in cluster 2. In hormone
category, 8 genes responsible for brassinosteroid synthesis and degradation were also found
in this cluster. Only histone genes (DNA functional category) were over-represented in
cluster3 (Table S4, provided as additional excel file online).
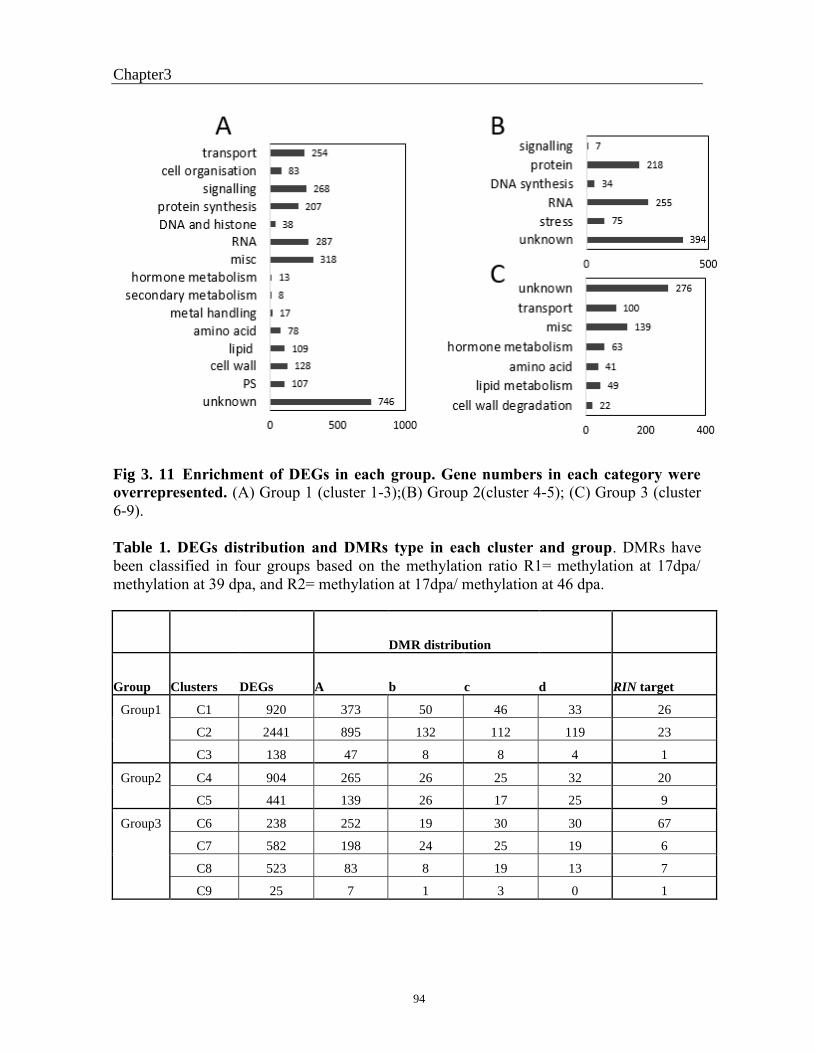
Chapter3
94
Fig 3. 11 Enrichment of DEGs in each group. Gene numbers in each category were
overrepresented. (A) Group 1 (cluster 1-3);(B) Group 2(cluster 4-5); (C) Group 3 (cluster
6-9).
Table 1. DEGs distribution and DMRs type in each cluster and group. DMRs have
been classified in four groups based on the methylation ratio R1= methylation at 17dpa/
methylation at 39 dpa, and R2= methylation at 17dpa/ methylation at 46 dpa.
DMR distribution
Group Clusters DEGs A b c d RIN target
Group1 C1 920 373 50 46 33 26
C2 2441 895 132 112 119 23
C3 138 47 8 8 4 1
Group2 C4 904 265 26 25 32 20
C5 441 139 26 17 25 9
Group3 C6 238 252 19 30 30 67
C7 582 198 24 25 19 6
C8 523 83 8 19 13 7
C9 25 7 1 3 0 1

Chapter3
95
Group 2 includes 904, 441 genes in cluster 4 and 5, respectively. In WT fruits the
expression of cluster 4 and 5 genes peaked at the Br stage (39dpa), or even later at 46 or
55dpa. In contrast, in transgenic fruits, DEGs from cluster 4 are characterized by a delayed
increase in expression that occurs at 70dpa or later, whereas most DEGs in cluster 5 are not
induced and remain at the same level throughout fruit development and ripening. In
addition, most group2 DEGs are expressed at very low levels in transgenic fruits of both
lines 2 and 8. Only 6 functional categories were over-represented in this group (Fig 3.10B,
p93). The most abundant subcategory (394 genes) corresponds to genes with unknown
function. In addition, 140 genes are related to protein degradation, 48 genes to heat stress,
255 genes to RNA metabolism, including a number of transcription factors, among which
the key ripening associated gene RIN (cluster 4) and 7 genes encode receptor kinases. This
is consistent with the fruit ripening defect phenotype (see Fig 3.11, p95, and liu et al.,
2015b), as genes like RIN are major regulators of fruit ripening. Therefore, huge amount of
genes in category of protein degradation, especial ubiquitin was also overrepresented in this
group, indicating the normally degradation of proteins during fruit ripening, while the
degradation is delayed in transgenic fruits, this is consistent to fruit ripening inhibited fruit
phenotype.
When considering clusters enrichment in group 2 separately, we found that all the
categories in group 2 (Fig3.11, p95) except signaling were found in cluster 4 and cluster 5,
although stress category was not significantly enriched in cluster 5, indicating at least 4
major functional categories in this group, including protein degradation, DNA, RNA and
unknown were mainly affected in DML RNAi transgenic fruits (TableS4, provided as
additional excel file online).
Group3 which correspond to clusters 6 to 9 is characterized by genes overexpressed in
transgenic fruits as compared to WT at specific stages of fruits ripening. In cluster 6 most
genes peaked at ripening induction (Br, 39dpa) or at the fully ripe stage(46dpa) of WT
fruits, dropped at later stages when fruits were over-ripe, but in transgenic plants, almost all
the induction is very limited. Therefore, in transgenic fruits, most genes in this cluster were
extremely repressed at 39 to 55dpa, but not at 70-85dpa. This cluster also include some
genes were slightly repressed at early stages. DEGs belonging to cluster 7 lately induced in
the transgenic fruits (after 70dpa), whereas these genes are highly expressed in WT
between 39 (Br) and 55 dpa and drop at later stages when fruits were over-ripe. Therefore,
most genes in this cluster appear extremely repressed between 39 to 55dpa, but are more
expressed in transgenic than in WT fruits at 70-85dpa. In clusters 8 and 9, gene expression
in WT peaked at Br or Br+7dpa and Br+7 or 55dpa respectively. Then their expression
level dropped down, however, in transgenic fruits, the induction were delayed even until
55-85dpa.
Most WT genes in cluster 8 were dropped at Br or B7, but induced at later stages,
from 55-85dpa. However, in transgenic fruits, these genes kept slightly declined trend from
early stages.

Chapter3
96
Seven categories were over-represented in this group, including genes related to
specific pathway, hormone metabolism, amino acid, lipid metabolism and cell wall.
In cluster 6, genes were over-represented with eight categories. Six DEGs that are
considered as hallmarks of the ripening process are found in this cluster. They correspond
to the NOR, a NAC transcription factor necessary for ripening induction (Giovannoni 2004),
the PSY1 gene that governs carotenoid accumulation(Bartley et al., 1992), the
polygalacturonase gene PG2a involved in cell wall softening(Zhong et al., 2013), the ACC
oxidase gene ACO3(E8), involved in ethylene synthesis during fruit ripening (Kneissl and
Deikman 1996), E4 (Lincoln et al., 1987), and the Zeta-carotene desaturase ZDS gene
encoding another critical enzymes of the carotenoid pathway (Fantini et al., 2013). Genes
involved in ethylene biosynthesis and signaling are particularly enriched in cluster 6,
including ACS2, ACS4 (ACC synthase) and various ETR (ethylene receptors) genes. As
well as genes encoding proteins involved in jasmonate synthesis and degradation. This is
consistent with the idea that many genes of cluster 6 are tightly related to the fruit ripening
process.
Only 3 functional categories are overrepresented in Cluster 7 genes with 95 genes
related to RNA metabolisms, including 11 homeobox (HB) transcription factors, 31 to cell
whereas 111 DEGS were not assigned. Four functional categories were over-represented in
Cluster 8 , in addition to 45 not assigned genes, 10 genes in amino acid metabolism (3
genes involved in glutamate family), 7 genes in ethylene synthesis and degradation
(TableS4, provided as additional file on line). Among the 25 DEGs of cluster 9, 7 DEGs are
related with ethylene synthesis, degradation and ETR genes were found in this cluster.

Chapter3
97
IV Analysis of differentially methylated region, in relation to DEGs
patterns.
4.1. DEGs associated with DMR are distributed among all clusters and
groups
Among the DEGs we have identified, it is very likely that only part of them will be
directly regulated by their DNA methylation level. In order to determine these direct targets,
Whole Genome Bisulfite Sequencing has been initiated in collaboration with Pr J
Giovannoni’s laboratory. However due to technical difficulties, the results are not yet
available. For this reason, we have decided to use previous results obtained in Pr J
Giovannoni’s laboratory that have shown that many genes are demethylated during the
ripening of tomato fruits (Zhong et al., 2013). To determine what genes, among the DEGs
contain differentially methylated regions (DMRs), DEGs were compared to a list of genes
that were shown to contain DMRs within the first 2kb of their promoter region (personal
communication from Dr Fei, Boyce Thompson Institute, Cornel NY). These DMRs lists
were determined by calculating the average methylation levels on a sliding window of
100bp with 50 bp iteration as described in Zhong et al (2013). It should be noted that this
list of genes was obtained by analyzing the development of Ailsa Craig tomato fruits, and
we cannot formally rule out that some differences may exist with the WVA106 variety used
in our study and Ailsa Craig. However, genes that were shown to contain DMRs in this
previous study- RIN, NOR, CNR, PSY1- were also identified has differentially methylated
in WVA106 (Liu et al., 2015b), consistent with the idea that DMRs are conserved between
both varieties. To identify the DEGs containing DMRs in their promoter regions, the list of
common DEGs identified in line 2Y, line 2X, and line 8 and its corresponding WT was
crossed with the list of DMRs containing genes (Zhong et al., 2013, Dr Fei, personal
communication).
A total of 3,113 DEGs containing one or more DMRs in their promoter region were
identified (see Table S9, provided as additional excel file online). DMRs were classified
based on two ratios calculated using the DNA methylation percentage. R1 is the ratio
between the methylation at 17dpa and breaker stage (42dpa) and R2 at 17 dpa versus
breaker+10 (52 dpa). Four main types of situations were found (table 1): (type-a) DEGs
with a unique or more DMRs that have both R1 and R2 above 1, this indicates that DNA
demethylation occurs at all DMRs during fruit ripening. 2,259 DEGs correspond to this
situation; (type-b) DEGs with a unique or more DMRs that have R1 and R2 ratios below 1,
consistent with an increase in methylation during fruit ripening at all DMRs. 294 DEGs
belong to this class; (type-c) 285 DEGs with more than one DMR but have opposite
behaviors, in addition at least one has a type -a behavior and another one with a type-b;
(type-d) 294 DEGs with DMR that have the opposite ratios between R1 and R2 at lease in
one DMR (See FigS11).
Chapter3
98
Surprisingly, DEGs that contain DMRs are found in all three expression groups and
almost all clusters. In addition each type of DMR was distributed among the different DEG
expression groups (table 1, p91).
In this study, SlDML1 and SlDML2 were suppressed in RNAi DML transgenic plants,
especially only SlDML2 was extremely suppressed at breaker stage. Normally, only this
gene has the dominant expression during fruit ripening in WT. However, as only DMRs
corresponding to a decrease in methylation level during fruit ripening are potential targets
for SlDML2 and might therefore be the most relevant in this study (Fig10B, 10C, p89,
table1, p95), therefore, further work was focused on genes containing type-a DMRs
corresponding to their clusters. Thus, to have the global overview on DEGs with type-a
DMRs, gene enrichment were analyzed with over-representation (table 2, p101). DEGs
with type-a DMR in group 1 are abundant, involving 12 functional categories:
photosynthesis (34 genes), cell wall (52 genes), lipid metabolism (44 genes), amino acid
metabolism (11 genes), brassinosteroid (7 genes), C1-metabolism (7 genes), misc (140
genes), RNA (100 genes), kinase (32 genes), signaling (119 genes), transport (97 genes)
and 266 no assigned genes.
Those belonging to the expression group 2 range in 4 main functional categories:
glycolysis (3 genes), abiotic stresses (22 genes), more specifically heat stress including
heat-shock transcription factors, protein degradation (43 genes) and a number of unknown
genes (107genes). Concerning group 3, DEGs with type-a DMRs correspond to cell wall
degradation (11 genes), lipid metabolism (22 genes), ethylene (14 genes) and UDP glucosyl
and glucuronyl transferases (17 genes in misc group) and 112 genes correspond to
unknown proteins.
To visualize the distribution of DEGs with DMR among the different DEGs, similar
PCA were performed on all DEGs as fig 11A, but this time all DEGs with DMR were
labeled with red color (Fig3.12B, p102). Six genes with DMR that were selected (these six
genes were far from other genes with DMR, indicating specific difference compare with
other DEGs as we can see from table 3 (Fig3.12B, p102; table3, p102). All these six genes
contain type-a DMR, except loxC with type-c DMR. Three of these six genes are already
known: LOXC, encodes a chloroplast-targeted lipoxygenase isoform responsible for the
generation of volatile C6 flavor compounds (Chen et al., 2004). LOXC mRNA amount
increases sharply at Br stage in WT. However, this increase is delayed in transgenic fruits.
The second gene is LTGP1 encoding a nonspecific lipid transfer protein, a tomato allergen
(Le et al., 2006). This gene is highly expressed in WT fruits at early stages until the Br
stage, and extremely repressed during fruit ripening. In transgenic fruits, the expression of
this gene was extremely repressed at all stages, suggesting that DNA demethylation is
necessary for the early expression of LTGP1. AL encodes an acid beta-fructofuranosidase,
which is involved in carbohydrate metabolism. AL is highly expressed in style but weakly
at stem end of tomato fruit (fruit close the sepal part) during ripening (Nguyen et al.,
2014;Zouari et al., 2014).
In this study, this gene is repressed all through the development and ripening process of
DML RNAi fruits, while it is strongly induced in WT fruits at the Br stages and further
Chapter3
99
increases at Br+7. This indicates that AL may need DNA demethylation for its expression
during fruit ripening, as already demonstrated for the NOR or the PSY1 gene (Liu et al.,
2015b).
The three other outliners correspond to the uncharacterized genes Solyc01g081250,
Solyc06g060410, Solyc09g066150, encoding Glutathione-S-transferase, MORN
(Membrane Occupation and Recognition Nexus Domain) repeat protein, Cytochrome P450,
respectively. The expression of these three genes peaked at Br+7 or 55dpa in WT, but they
are almost totally not expressed at all fruit development and ripening stages in transgenic
fruits. This suggests that the expression of these three genes also requires active DNA
demethylation during fruit development and ripening.
As a conclusion, all of these six analyzed genes, except loxC containing type-c DMRs,
and belong to group 3 or 2, indicating they are potential primarily target of SlDML2.
In the following parts I will detail different metabolic pathway and physiological
processes that are critical for fruit ripening and analyze what DEGs between WT and
transgenic present potential DMRs.
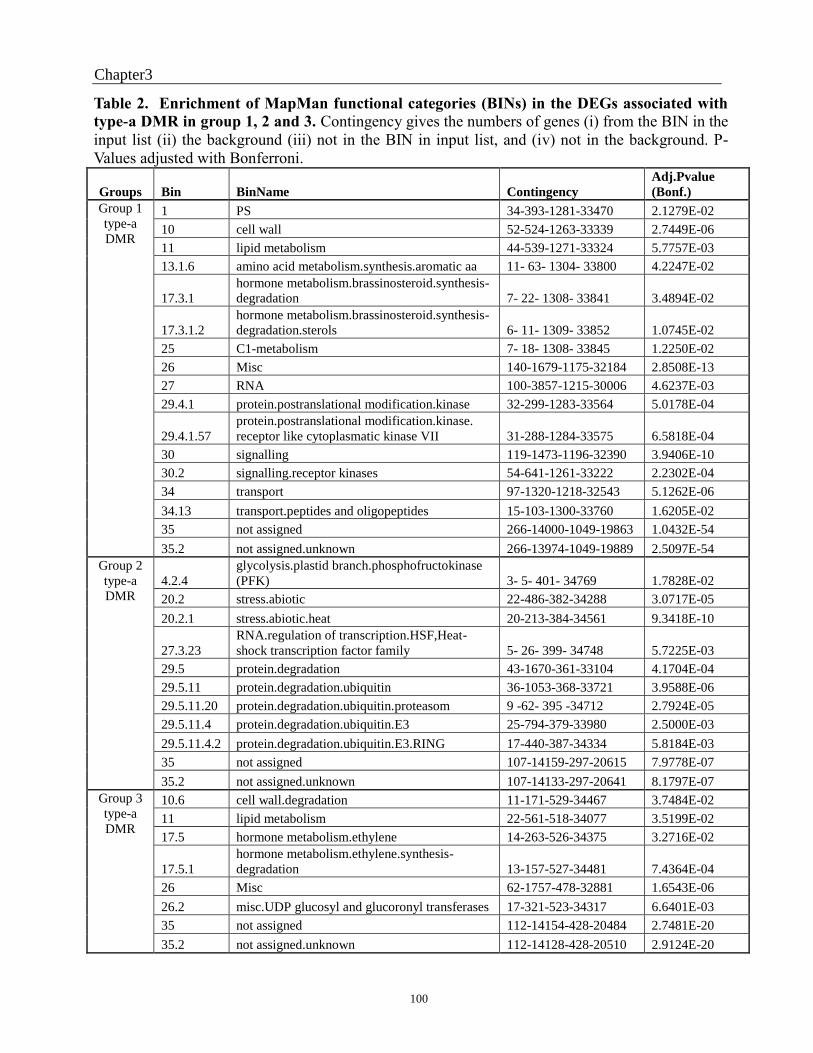
Chapter3
100
Groups Bin BinName Contingency
Adj.Pvalue
(Bonf.)
Group 1
type-a
DMR
1 PS 34-393-1281-33470 2.1279E-02
10 cell wall 52-524-1263-33339 2.7449E-06
11 lipid metabolism 44-539-1271-33324 5.7757E-03
13.1.6 amino acid metabolism.synthesis.aromatic aa 11- 63- 1304- 33800 4.2247E-02
17.3.1
hormone metabolism.brassinosteroid.synthesis-
degradation 7- 22- 1308- 33841 3.4894E-02
17.3.1.2
hormone metabolism.brassinosteroid.synthesis-
degradation.sterols 6- 11- 1309- 33852 1.0745E-02
25 C1-metabolism 7- 18- 1308- 33845 1.2250E-02
26 Misc 140-1679-1175-32184 2.8508E-13
27 RNA 100-3857-1215-30006 4.6237E-03
29.4.1 protein.postranslational modification.kinase 32-299-1283-33564 5.0178E-04
29.4.1.57
protein.postranslational modification.kinase.
receptor like cytoplasmatic kinase VII 31-288-1284-33575 6.5818E-04
30 signalling 119-1473-1196-32390 3.9406E-10
30.2 signalling.receptor kinases 54-641-1261-33222 2.2302E-04
34 transport 97-1320-1218-32543 5.1262E-06
34.13 transport.peptides and oligopeptides 15-103-1300-33760 1.6205E-02
35 not assigned 266-14000-1049-19863 1.0432E-54
35.2 not assigned.unknown 266-13974-1049-19889 2.5097E-54
Group 2
type-a
DMR
4.2.4
glycolysis.plastid branch.phosphofructokinase
(PFK) 3- 5- 401- 34769 1.7828E-02
20.2 stress.abiotic 22-486-382-34288 3.0717E-05
20.2.1 stress.abiotic.heat 20-213-384-34561 9.3418E-10
27.3.23
RNA.regulation of transcription.HSF,Heat-
shock transcription factor family 5- 26- 399- 34748 5.7225E-03
29.5 protein.degradation 43-1670-361-33104 4.1704E-04
29.5.11 protein.degradation.ubiquitin 36-1053-368-33721 3.9588E-06
29.5.11.20 protein.degradation.ubiquitin.proteasom 9 -62- 395 -34712 2.7924E-05
29.5.11.4 protein.degradation.ubiquitin.E3 25-794-379-33980 2.5000E-03
29.5.11.4.2 protein.degradation.ubiquitin.E3.RING 17-440-387-34334 5.8184E-03
35 not assigned 107-14159-297-20615 7.9778E-07
35.2 not assigned.unknown 107-14133-297-20641 8.1797E-07
Group 3
type-a
DMR
10.6 cell wall.degradation 11-171-529-34467 3.7484E-02
11 lipid metabolism 22-561-518-34077 3.5199E-02
17.5 hormone metabolism.ethylene 14-263-526-34375 3.2716E-02
17.5.1
hormone metabolism.ethylene.synthesis-
degradation 13-157-527-34481 7.4364E-04
26 Misc 62-1757-478-32881 1.6543E-06
26.2 misc.UDP glucosyl and glucoronyl transferases 17-321-523-34317 6.6401E-03
35 not assigned 112-14154-428-20484 2.7481E-20
35.2 not assigned.unknown 112-14128-428-20510 2.9124E-20
Table 2. Enrichment of MapMan functional categories (BINs) in the DEGs associated with
type-a DMR in group 1, 2 and 3. Contingency gives the numbers of genes (i) from the BIN in the
input list (ii) the background (iii) not in the BIN in input list, and (iv) not in the background. P-
Values adjusted with Bonferroni.

Chapter4
102
Groups Clusters
DMR
type Solyc Name
39_Log2
FC
46_Log2F
C Pathway Reference
3 7
c
Solyc01g006540 loxC -6,12 1,69
jasmonate.synthesis-
degradation
lipoxygenase Chen et al., 2004
3 6
a
Solyc10g075100 Itpg1 -7,56 -2,29 lipid transfer proteins Le et al., 2006
2 5
a
Solyc03g083910 AI -6,47 -8,23
major CHO
metabolism.vacuolar
Nguyen et al., 2014;
Zouari et al., 2014
2 5
a
Solyc01g081250 Unknown1 -3,95 -8,92
misc.glutathione
transferases
2 5
a
Solyc06g060410 Unknown2 -4,23 -6,06
signalling.
phosphinositides
2 4
a
Solyc09g066150 P450 -4,98 -7,9 misc.P450
Fig 3. 12 PCA of all DE genes in three groups onto the 1/2 subspace with Log2FC of Line2Y/WT. A.
Distribution of all common DEGs in three groups (groups were classified in Fig 3.10) B. PCA of DEGs
associated with DMRs in three groups. Pink: genes in group1; Blue: genes in group2; Green: genes in
group3. Grey: all DE genes. Red: genes with DMR. C. Summary of all DEGs with DMRs in each group.
Table 3. Characterization of six DEGs with DMR which were selected in Fig 12B

Chapter4
103
4.2 Expression pattern of genes of the carotenoid biosynthesis pathway and
association with differentially methylated regions.
The biosynthesis of the linear C40 lycopene from Geranyl Geranyl Pyrophosphate (GGPP)
is one of the most extensively studied metabolic pathways in tomato (Lois et al., 2000;Liu et al.,
2015a). Accumulation of lycopene typically occurs during fruit ripening concomitantly to
chlorophyll breakdown which result in the typical green to red color change of tomato fruits. All
the carotenoid biosynthetic enzymes are located in the plastid, even though the genes are encoded
by the nuclear genome. The bottlenecks in carotenoid biosynthesis have been explored by
analyzing the transcript level in carotenoid biosynthetic genes and their potential correlation with
changes in carotenoid content (for a review see reference (Liu et al., 2015a)). It is well known
that a subset of these genes are induced or upregulated at the onset of fruit ripening in WT fruits.
They include the genes encoding the 1-deoxy-D-xylulose 5-phosphate synthase (DXS),
geranylgeranyl pyrophosphate synthase (GGPPS), phytoene synthase (PSY1), phytoene
desaturase (PDS), 15-cis-zeta-carotene isomerase (ZISO), £-carotene desaturase (ZDS), carotene
isomerase (CrtlSO). On the contrary, the expression of genes encoding the lycopene ε-cyclase
(LCY-E) gene and lycopene ε-cyclase is dramatically repressed at the Br stage of fruit ripening
(Lois et al., 2000;Liu et al., 2015a). All these genes (Fig 3.13, FigS3.8, p105, p138) behaved in
WVA106 WT1 and WT2 fruits as described in these studies and similarly to previous results
obtained on the same variety (Télef et al., 2006).
An important aspect of the transgenic fruit phenotype is either the absence or the reduced
and delayed accumulation of carotenoid during fruit ripening in RNAi DML transgenic fruits
(Fig3.2, p75; Fig2.4A in chapter2 p37); (Liu et al., 2015b). We therefore examined the
expression profiles of all known genes of the carotenoid pathway as well as those of the genes
involved in the 2-C-methyl-erythritol-4-phosphate/1-deoxy-D-xylulose 5-phosphate
(MEP/DOXP pathway) that leads to the synthesis of Isopentenyl pyrophosphate, the precursor of
all isoprenoids. Plastidic carotenoid synthesis during fruit ripening was shown to initiate from
this pathway (Rodrı́guez-Concepción and Gruissem 1999).
Eight genes of the MEP/DOXP pathways are differentially regulated between WT and
transgenic RNAi DML lines, and one of them, GGPS3 contain putative type-c DMRs in its
promoter region (Fig3.13A, 3.13C, FigS3.8, p105, p138). Indeed GGPS3 (cluster 7) is not
induced in transgenic fruits (log2FC (Line2Y/WT 1) = -1.06; log2FC (Line 8 / WT 2) = -1.60 at
39 dpa) consistent with the idea that demethylation is necessary for the induction of this gene.
However, as it promoter region contains two DMRs with opposite behaviors their potential role
in the regulation of this genes is unclear. IPI2 is clustered in cluster 2, indicating that this gene is
more expressed in transgenic fruits as compared to WT fruits during ripening. However IPI2
contains a type-a DMR in its promoter, also questioning the function of DNA demethylation in
this case.
The expression of DXS1 and GGPS2 also increases during WT fruit ripening, but not in
DML RNAi transgenic fruits of the same age. As the promoter region of these genes do not
contain any DMRs it seems unlikely that they depend on the activity of the DML2 protein for
their expression. Thus there is no evidence that genes of the MEP/DOX pathway are directly
regulated by methylation.

Chapter4
104
Thirteen of the 29 known genes of the carotenoid biosynthesis pathway are differentially
expressed in DML RNAi fruits compared to WT fruits of the same age. Among these genes PSY1,
CrtlSO, ZISO and ZDS are clustered in group2. They are induced at the Br (39dpa) and remain
expressed at the Br+7 (46dpa) stages in WT, but are not expressed or lately and weakly in all
transgenic lines (Fig3.13B, 3.13C, FigS3.8A, 3.8C, p105, p138). We have already shown that the
PSY1 promoter region contain a Type-a DMR and undergo DNA demethylation during WT fruit
ripening but not in transgenic fruits, which correlates with the absence of gene induction (Liu et
al., 2015b). Three additional genes, namely, CrtlSO, ZISO, and ZDS also contain a type-a DMR
in their promoter, indicating that their expression correlates with demethylation in WT fruits.
Thus it is very likely that the DMRs present in the CrtlSO, ZISO, and ZDS promoter region will
not be demethylated in the DML RNAi lines thereby impairing their expression.
As previously observed for IPI2, CCD4B and NCED although clustered in group 1 (delayed
degradation in transgenic lines) contain a type-a DMR. Two other genes of this pathway do not
contain any DMR in their promoter although their regulation is affected in transgenic lines, yet
not in a consistent way. CHY1 is repressed at 46dpa in line 2 (log2FC=-2.07), but not in line 8,
whereas CHY2 is repressed at 39dpa in line 8 (log2FC=-1.49) but not in line 2.

Chapter4
105
D-Gycelaldehyde 3-P
Pyruvate DXS1
ISPE
Isopentenyl-PP Dimethylallyl-PP
IPI2a
Farnesyl-PP
Geranylgeranyl-PP GGPS3
c
GGPP
ζ-Carotene
PSY1a
ZISOa
15-cisPhytoene
CrtlSOa
ZDSa
Lycopene
β-Cartotene
Zeaxanthin
VDE
CHY1
Violaxanthin
Neoxanthin
δ-Cartotene
α -Cartotene
Lutein
CRTR-B,E
NCEDa
LCY-B1
Prolycopene
HMBPP
HDS
2-C-methyl-D-erythritol 2,
4-cyclodiphosphate
DXS2
GGPS2 GGPS5
A
CYP97C1
CYP97C2
B C
Fig 3. 13 Expression of genes of the Carotenoid pathway in RNAi DML transgenic fruit compared to WT. A. DEGs of the MEP/DOPX
pathway (A) and DEGs of Carotenoid pathway (B) C. Heatmap of gene expression in A and B. DEGs from groups 2 (cluster 4 and 5) and 3
(cluster 6- 9) with DMRs in their promoter are highlighted in red color (repression in RNAi lines). Black arrows represent a route rather than
a single metabolic reaction and thus may be composed of multiple reactions.
CCD4Ba
NCED2c
CHY2
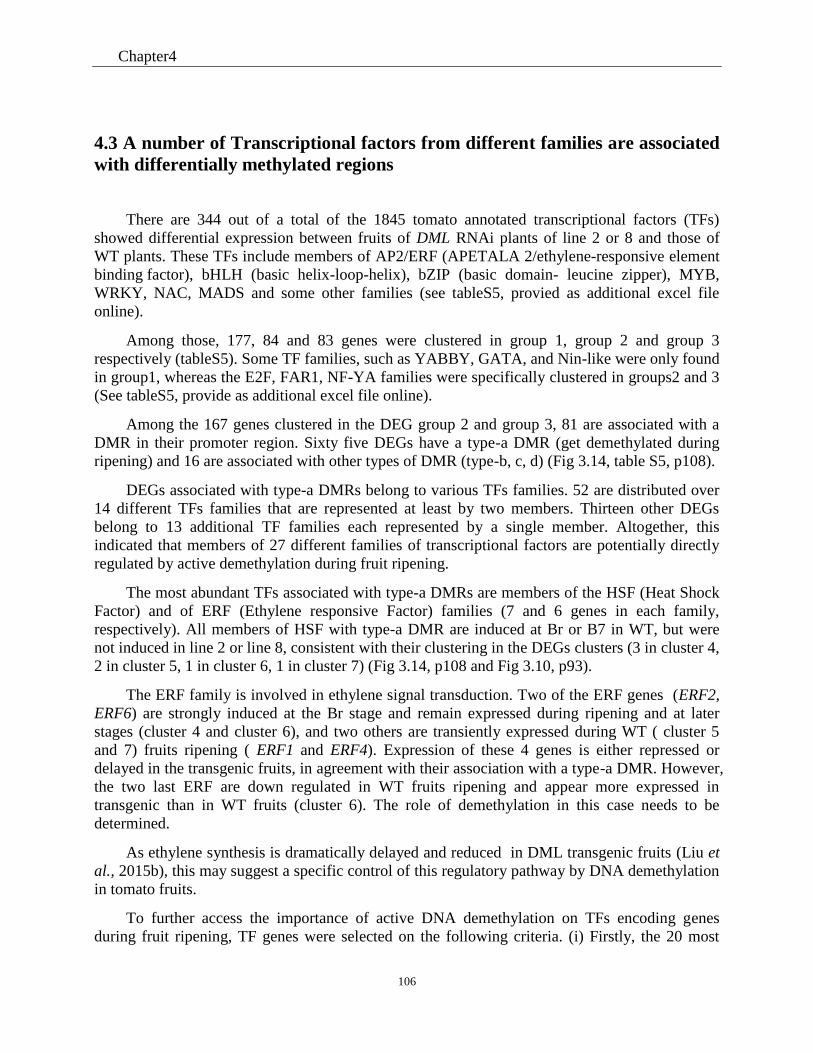
Chapter4
106
4.3 A number of Transcriptional factors from different families are associated
with differentially methylated regions
There are 344 out of a total of the 1845 tomato annotated transcriptional factors (TFs)
showed differential expression between fruits of DML RNAi plants of line 2 or 8 and those of
WT plants. These TFs include members of AP2/ERF (APETALA 2/ethylene-responsive element
binding factor), bHLH (basic helix-loop-helix), bZIP (basic domain- leucine zipper), MYB,
WRKY, NAC, MADS and some other families (see tableS5, provied as additional excel file
online).
Among those, 177, 84 and 83 genes were clustered in group 1, group 2 and group 3
respectively (tableS5). Some TF families, such as YABBY, GATA, and Nin-like were only found
in group1, whereas the E2F, FAR1, NF-YA families were specifically clustered in groups2 and 3
(See tableS5, provide as additional excel file online).
Among the 167 genes clustered in the DEG group 2 and group 3, 81 are associated with a
DMR in their promoter region. Sixty five DEGs have a type-a DMR (get demethylated during
ripening) and 16 are associated with other types of DMR (type-b, c, d) (Fig 3.14, table S5, p108).
DEGs associated with type-a DMRs belong to various TFs families. 52 are distributed over
14 different TFs families that are represented at least by two members. Thirteen other DEGs
belong to 13 additional TF families each represented by a single member. Altogether, this
indicated that members of 27 different families of transcriptional factors are potentially directly
regulated by active demethylation during fruit ripening.
The most abundant TFs associated with type-a DMRs are members of the HSF (Heat Shock
Factor) and of ERF (Ethylene responsive Factor) families (7 and 6 genes in each family,
respectively). All members of HSF with type-a DMR are induced at Br or B7 in WT, but were
not induced in line 2 or line 8, consistent with their clustering in the DEGs clusters (3 in cluster 4,
2 in cluster 5, 1 in cluster 6, 1 in cluster 7) (Fig 3.14, p108 and Fig 3.10, p93).
The ERF family is involved in ethylene signal transduction. Two of the ERF genes (ERF2,
ERF6) are strongly induced at the Br stage and remain expressed during ripening and at later
stages (cluster 4 and cluster 6), and two others are transiently expressed during WT ( cluster 5
and 7) fruits ripening ( ERF1 and ERF4). Expression of these 4 genes is either repressed or
delayed in the transgenic fruits, in agreement with their association with a type-a DMR. However,
the two last ERF are down regulated in WT fruits ripening and appear more expressed in
transgenic than in WT fruits (cluster 6). The role of demethylation in this case needs to be
determined.
As ethylene synthesis is dramatically delayed and reduced in DML transgenic fruits (Liu et
al., 2015b), this may suggest a specific control of this regulatory pathway by DNA demethylation
in tomato fruits.
To further access the importance of active DNA demethylation on TFs encoding genes
during fruit ripening, TF genes were selected on the following criteria. (i) Firstly, the 20 most

Chapter4
107
repressed TF genes at 39 dpa in DML RNAi fruits compared to WT were identified; (ii) among
these genes, TF genes with the highest counts number at Br stage in WT were further selected.
Six genes were primarily identified under these criteria (Table 4A). Five of these six genes
are well-known ripening regulators, including AP2a (APETALA2a), FUL1 (FRUITFULL), RIN
(RIPENING INHIBITOR), NOR (NON-RIPENING) and an uncharacterized gene
(Solyc06g053960, HSA6b) from HSF family. RIN, NOR, that are both associated with a type-a
DMR have been reported to be targeted by active demethylation through SlDML2 (Liu et al.,
2015b). Other four novel genes are also associated with a type-a DMR (see table 4A, p109),
suggesting that these genes might also be under direct DNA demethylation control during fruit
ripening.
Zhong et al (2013) have shown that RIN binding sites are preferentially demethylated
during fruit ripening (Zhong, et al., 2013). We therefore analyzed all differentially expressed TF
genes, those associated both with RIN binding sites and with DMRs. As a result, twenty
differentially expressed TFs with different type of DMR were identified (table4, p109), four of
them corresponding to genes of known function (table4A, p109), while another 7 genes also
associated with type-a DMR belong to group 2 (cluste 4 and 5) and 3 (cluster 6 and 7) suggesting
that they are regulated by both the RIN protein and by active demethylation.
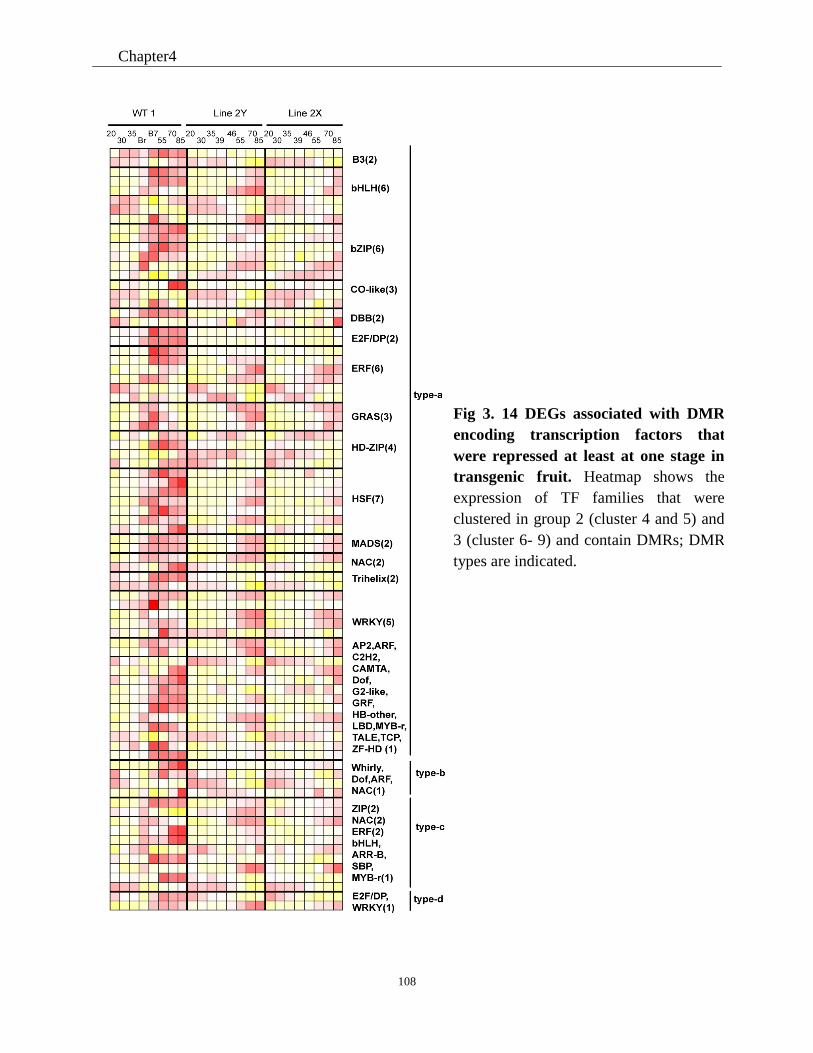
Chapter4
108
Fig 3. 14 DEGs associated with DMR
encoding transcription factors that
were repressed at least at one stage in
transgenic fruit. Heatmap shows the
expression of TF families that were
clustered in group 2 (cluster 4 and 5) and
3 (cluster 6- 9) and contain DMRs; DMR
types are indicated.
Fig 3.7 DEGs associated with DMR
encoding transcription factors that
were repressed at least at one stage in
transgenic fruit. Heatmap shows the
expression of TF families that were
clustered in group 2 (cluster 4 and 5) and
3 (cluster 6- 9) and contain DMRs; DMR
types are indicated
Chapter4
109
Table 1. Transcription factor with DMR as top expressed genes and RIN targets with DMR.
A. Genes selected based (i) the 20 most repressed at Br stage in line2Y and line 8; (ii) the 20 most highly
expressed in WT fruits at Br stage in group 2 and 3 in both line2 and line8, except Solyc06g069430 that is
outside the top 20 in Line 2Y.B. All DE TFs found in transgenic fruits with a RIN Binding Site and DMRs. 1
RIN target genes
A Log2FC(Line 2Y/WT)
Solyc. ID Group cluster
DMR
type Description 39dpa 46dpa
Solyc05g012020 2 4 a
RIN -5,65 -5,11
Solyc10g0068801
3 6 a NOR -5,20 -1,48
Solyc12g0892401
2 4 a
Zinc finger protein CONSTANS-LIKE
3 -2,71 -3,13
Solyc06g053960 3 6 a
Heat stress transcription factor A3
(HSA6b) -2,18 -1,16
Solyc03g0443001
3 6 a
AP2-like ethylene-responsive
TF( AP2a) -2,07 -1,36
Solyc06g0694301
2 4 a
MADS box transcription
factor(TDR4/FUL1) -1,39 -2,96
B Log2FC(Line 2Y/WT)
Solyc. ID Group cluster
DMR
type Description 39dpa 46dpa
Solyc01g0098601
1 1 a NAC 0,89 1,46
Solyc02g0826701
1 1 a WUSCHEL-related homeobox 14 -0,63 1,29
Solyc04g0779801
1 1 a Zinc-finger protein (C2H2) -0,11 1,61
Solyc05g0520401
1 1 a
Ethylene responsive TF 1a (AP2-
EREBP) -0,47 0,11
Solyc06g0730501
1 1 a NAC -0,11 0,28
Solyc10g0557601
1 2 a NAC 1,76 1,56
Solyc04g0785501
1 1 c WRKY transcription factor 2 -0,61 -0,14
Solyc06g0684601
1 2 c WRKY transcription factor 1 -0,55 0,39
Solyc02g0216801
2 4 a WRKY transcription factor 37 -2,78 -2,08
Solyc09g0754201
2 4 a Ethylene responsive TF 2b (Sl-ERF.E.1) 0,21 -3,48
Solyc10g0790501
2 4 a bHLH -2,01 -5,39
Solyc12g0070701
2 5 a Heat stress transcription factor A3(HSF) -2,28 -2,16
Solyc03g1241101
3 6 a CRT binding factor 2 (CBF2) -1,00 0,10
Solyc07g0529601
3 6 a GRAS family transcription factor -2,09 -0,12
Solyc12g0965001
3 7 a CONSTANS-like protein(COL1) 2,24 2,87
Solyc02g0375301
3 7 b Auxin response factor 8(ARF8B) 1,49 0,146

Chapter3
110
4.4 Genes Encoding Cell Wall–Biosynthesis and Modifying Protein are
potentially regulated by demethylation
Fruit texture is tensely associated with fruit shelf life and transportability. During fruit
ripening, the structure and composition of cell wall polymers are markedly changed, as a result of
the expression of genes encoding polygalacturonases, pectin methylesterases and other enzymes
involved in cell wall degradation, expansion and extensions (Seymour et al., 2013).
We have analyzed the fruit firmness using line 8, as fruits from line 8 have a shape which is
similar to the one of WT this allowing a more accurate comparison between the two types of fruits.
Results shown in Fig 15D (p108) clearly indicate that transgenic fruits remain firm much longer
than WT fruits, suggesting that cell wall metabolism could be affected when DNA demethylation
is impaired.
We therefore examined the association between DEGs involved in cell wall metabolism and
DMRs. Two hundred fourteen DEGs were identified that are annotated as cell wall related genes
according to Mapman categories and reviewed in Seymour et al (Seymour et al., 2013;Pattison et
al., 2015). Among these cell wall related genes, 157 belong to group1 (30 in cluster 1, 125 in cluster
2 and 2 in cluster 3) and 94 of them contain DMRs of various type in their promoter region (Fig
3.15A). Many of these genes are expressed during fruit development and their expression declines
during WT fruit ripening (Fig3.15B, p112). Therefore their expression is higher in transgenic fruits
at stages corresponding to WT fruit ripening and senescence. However, 71 of them are associated
with type-a DMRs (table S6, provided as additional excel file online).
Fifty-six additional cell wall related DEGs are in group 2 and 3. 23 of these DEGs are in
clusters 6 and correspond to genes down regulated during WT fruit ripening but that do not present
significant expression variations in transgenic fruits. All others are in clusters 3, 4 (group 2) and 7
and 9 (group 3) and are not induced in transgenic fruits 39 and 46 dpa, in contrast to their induction
during WT fruit ripening or later (Fig3.14B, 3.14C). Twenty-five of these DEGs are associated
with type-a DMRs characterized by a decrease in DNA methylation during ripening whereas one
has a type-b DMR that become hypermethylated. The remaining 5 genes are associated with type-
b, c or d DMRs (Fig3.14A, 3.14C).
As previously noted (see part 2 and 3) for isoprenoid synthesis and Transcription Factors,
type-a DMRs are not necessarily associated with genes specifically induced during WT fruit
ripening. We found that 9 DEGs from cluster 6 that are normally repressed during WT fruit ripening
contain type-a DMRs. In addition, 71 group1 DEGs that are down-regulated during the
development and ripening of WT fruits, whereas their expression is maintained or enhanced
(cluster 1) are also associated with type-a DMRs.
In contrast, genes from group 2 and 3 (clusters 7 and 9) are characterized by a high expression
level at the Br stage and 46 dpa in WT fruits, at a stage when their methylation level is low (table
S6). These genes are not induced in the transgenic fruits. As they are associated with type-a DMRs
this is most likely due to the lack of demethylation at the DMRs in the transgenic lines, as already
shown for PSY1, RIN, NOR and CNR (Liu et al., 2015b; Fig7C). They include known genes
encoding the Polygalacturonase A (PG2a), the Beta-xylosidase 4 (XYL1), an Expansin (LeEXP1),
the Endoglucanase 1 (Cel2), and the Mannan endo-1 4-beta-mannosidase (MAN4). Additional cell
Chapter3
111
wall related genes contain a type-a DMR but their function has not yet been determined (Fig 3.15C,
p112)
Among these genes, the expression of the major fruit polygalacturonase gene, PG2a which
normally occurs at the Br and Br+7in WT fruits, was severally delayed and reduced in transgenic
fruits (log2 fold difference = -4.53 in line 2Y, log2 fold difference=-7.54 in line 8) (Fig 3.15D).
XYL1 which encodes a β-xylosidase is the most highly affected DEGs the highest repression level
being observed at 46 dpa in line 2 (log2 fold difference= -7.71 in line 2Y, log2fold difference= -
7.95 in line 8) and 55dpa in line 8 (log2 fold difference= -8.15). This gene is not expressed at early
stages of WT fruit development (20-39dpa), but shows a sharp increase in expression level during
fruit ripening, which contrast with its reduced expression in the transgenic fruits. A similar
observation can be done for the CEL 2 gene which encodes the Endoglucanase 1 and for the EXP1
gene. CEL 2 is also extremely repressed in the transgenic fruits (log2 fold difference = -4.62 at
39dpa in line 2Y, log2 fold difference = -6,58 at 39dpa in line 8). EXP1 present a sharp increase at
Br and 46 dpa in WT, whereas the EXP1 mRNA accumulation is delayed and reduced in transgenic
fruits (log2 fold difference = -3.05 in line 2Y, log2 fold difference = -3.45).
In addition, six other genes including the CEL1 (Endoglucanase) and the TBG4 (β-
galactosidases), genes which are down regulated in the transgenic fruits are associated with other
types of DMRs, making unclear the link between active DNA demethylation and their expression.
Finally, some differences were found between line 2 and line 8. Eight DEGs associated with
type-a DMR were not consistently found in line 8 and line 2 when compared to WT plants. For
example, the PME2.1, PME1.9 genes encoding pectinesterases and GP2 encoding a BURP
domain-containing protein (BURP domain is named by four typical members, BNM2, USP, RD22,
and PG1β ((Van Son et al., 2009)) were not normally induced in young fruits of line 2 only, but
not in line8 (FigS9, p133). A similar situation is observed for the genes encoding the Xyloglucan
endotransglucosylase/hydrolase 2 (LeXET2) and the Xyloglucan endotransglucosylase/hydrolase 7
(tXET-B). But interestingly, among these genes with variation, all of them are induced at early
developmental stages, except for tXET-B.
As a conclusion there is a clear association between genes important for fruit softening and
typ-a DMRs, suggesting that DNA methylation directly control certain aspects of fruit cell wall
metabolim.
Chapter3
112
Fig 3. 15 Profile of DEGs involved in cell wall metabolism and fruit firmness. A. Distribution of DEGs with DMR related to cell wall metabolism
in the three groups DEGs defined in Fig 10; B. Boxplot of average gene expression in both WT and line 2 in groups1, 2 and 3; C. Heatmap showing
the expression of genes related to cell wall in group 2 and 3. DE Genes in group 2 and group 3 with different types were labeled; D. Fruit firmness
measured on WT 2, azygous and three replicates of line 8.
25
12
3
25
type-a
type-b
type-c
type-d
no DMR
Group2,3-DEGs
C
0
0.4
0.8
1.2
1.6
2
32 55 70 85 110
WT Az
Line 8-rep1 Line 8_rep2
Line 8_rep3
A
Group1-DEGs
71
6
7
10
63
B
D
Chapter3
113
4.5 Genes involved in Ethylene biosynthesis, perception and response
We have shown in Chapter 2 that ethylene synthesis is extremely repressed and delayed in
RNAi DML transgenic fruits. Ethylene is only detected after 70 dpa at very low levels both in lines
2 and 8 (Liu et al.; 2015b, sup data Fig S6, chapter 2). We therefore examined the expression of
all genes involved in ethylene biosynthesis, ethylene perception and response.
SAM1 in cluster 7 and SAM3 in cluster 3 have a high expression during early development,
while decrease during fruit ripening. In line 2Y (not in line 8), the expression of SAM1 is slightly
lower than in WT at later stages (70, 85dpa), while SAM3 is higher than WT with fruit development
and ripening in all genotypes. Among all DEGs in ethylene pathway, only ACS6 in cluster 7
encodes a protein directly involved in ethylene biosynthesis. ACS6 gene expression normally
declines during fruit ripening, while in transgenic fruit the decrease is delayed. Differences can be
seen between lines because in line 8, ACS6 is not repressed at all stages in contrast to line 2 (Fig
3.16, Fig S10, p115, p140). Three other DEGs encode proteins involved in both ethylene
biosynthesis system 1 and system 2. They correspond to ACO1, 3 (cluster 6, group 3) and are not
significantly affected during early fruit development although they show a delayed induction in
transgenic as compare to WT ripening fruits (Fig 3.16A, FigS 3.10A, p115, p40). ACO4, another
gene participating to the ethylene biosynthesis systems 1 and 2, has a very low expression level in
WT compared with other ACO genes. It is expressed at higher levels in in transgenic fruits. System
2 specific gene, ACS2 and ACS4, ACO5 (cluster 6, 6, 5, group 2 and 3, respectively) are strongly
induced or up-regulated in WT fruits at the breaker stage, reaching a maximum level of expression
at 46 dpa (RR stage), before decreasing to a very low level at 55 dpa. Expression of these genes
was in general delayed and reduced in transgenic fruits: ACO5 was the most affected gene and was
barely expressed in transgenic fruit after 55 dpa, whereas, ACS 2 and 4 were expressed at low
levels from 46 or 55 dpa until 85 dpa (Fig 3.16A, FigS 3.10A, p115, p140). These expression
patterns are well correlated with the accumulation of ethylene described in these lines (Liu et al.,
2015b, FigS6).
We then determined what genes were associated with DMRs. ACO1, 5 and ACS2 contain an
identified DMR in their promoter regions, whereas ACS4 does not. However, only ACO1 is
associated with a type-a DMR, suggesting that this gene requires demethylation for its expression.
Two other genes, ACO5 and ACS2 are associated with type-c DMR and in this case the link
between DNA methylation level of the DMRs and gene expression is unknown. Finally the lack of
DMRs in the ACS4 and ACO3 promoter region, suggest that these genes are not regulated by
demethylation, although they are not or lately induced in the transgenic plants.
Type-a DMR are also found in ACO4 that participate to the ethylene both system 1 and system
2 (Fig 3.16, p115).
Among the genes involved in ethylene perception, only 6 DEGs, ETR2, ETR3, ETR4, ETR5,
EBF2 and EIL2, out of the 17 genes that were differentially expressed in fruits in our conditions
could be identified. All six genes are induced during the ripening of WT fruits or in overripe fruits
(EIL2). The expression pattern of ETR4 was however ambiguous because variable between lines.
In line 2Y ETR4 was clustered in cluster 1 (group1) because this gene was not extremely repressed
(log2FC=-0.81 at 39dpa and -0.93 at 46dpa). This was not the case in Line 2X (log2FC=-0.85 at
39dpa, Log2FC=-2.14 at 46dpa) and Line 8 (log2FC=-3.07) where ETR4 was extremely repressed.
So, considering all lines ETR4 should also be considered as a gene wasn’t normally induced in the

Chapter3
114
transgenic fruits during fruit ripening. All other genes were clustered in clusters 3 and 4 and are
therefore not induced in transgenic fruit.
Among these different DEGsonly ETR4 and EBF2 were associated with type-a DMRs. In
contrast, ETR2 has a type-b DMR, and ETR5 a type-c in its promoter region, whereas ETR3 and
EIL2 lack any DMR.
Forty seven DEGs were detected among the genes encoding the ERF and AP2-EREBP (ERF-
like) family which are the transcription factors responsible for ethylene response (Fig 3.16B, fig
S3.10, p115 and p140). Most of them were consistently clustered in group1 and only 16 DEGs
belonged to group 2 and 3, and were strongly induced during fruit ripening. Among DEGs in group
2 and 3, 6 DEGs were associated with type-a DMR and 2 with type-c DMRs.
It is also worth pointing out, that neither CTR as the downstream of negative regulators of
EIN2 involved in ethylene signaling and response, were affected in RNAi DML transgenic fruits.
As a conclusion, even though the expression of several genes in the ethylene pathway but also
in ethylene perception and response was impacted in transgenic lines, only a few of them are likely
directly regulated by DNA demethylation. In particular, for ethylene biosynthesis, only genes of
system 2 seem to be under direct methylation regulation. This suggests both direct and indirect
effects of DNA demethylation on the regulation of genes involved in ethylene production and
response in tomato fruits.

Chapter3
115
C2H2 System1 System2
A
Cytosol
ER
C
EIN2
EILs ERF Nucleus Ethylene Response
C2H4 GRL
EBF
B
0
10000
20000
30000ACO1
0
5000
10000
20 30 35 39 46 55 70 85
ACO3
0
500
1000
1500
2000
2500
20 30 35 39 46 55 70 85
ACO5
Norm
alized co
unts
C
0
2000
4000
6000
WTLine 2Y
ACS2
Fig 3. 16 Profile of ethylene-related DEGs. Heat maps showing the DEGs in DML RNAi transgenic fruits related to ethylene biosynthesis (A),
ethylene perception and signaling (B). Red color represent DEGs in group 2 (cluster 4 and 5) and 3 (cluster 6- 9). a, b, c, d represent DMR types
as explained in table 1. C. Expression of DEGs involved in ethylene biosynthesis, ACS2, ACO1, 5 were associated with DMRs, no DMR on ACO3
(Fig adapted from Cara and Giovannoni, 2008; Liu et al., 2015a)

116
4.6 Other Hormone Biosynthesis and Responses in DML RNAi transgenic fruits
We also analyzed the impact of SlDML2 knock down on hormones other than ethylene. DEGs
encoding proteins linked to auxin, brassinosteroid, cytokinin, gibberellin, jasmonate and ABA
metabolism and signaling were examined and their association with DMR determined (Fig 3.17,
p118 and Sup data Table S7, provided as additional excel file online). In all cases an important
number of DEGs were identified although only a few of them were associated with DMRs. Most
of the identified DEGs were in group 1 and therefore are more expressed in transgenic than in WT
fruits at all stages of fruit development and ripening. Indeed, DEGs from group 2 and group 3
(clusters 7 and 9) were also identified. However most of them were related to ethylene (see Fig
3.16, chapter3, p115) and ABA (Fig 3.17E, p118) synthesis and signal transduction. Hence, most
DEGs related to auxin, jasmonate, brassinosteroid are upregulated in transgenic fruits.
Many of the auxin related DEGs are highly expressed at early stages of WT fruit development
and decrease during ripening (27 genes in cluster 2 and 3). However, 13 DEGs were upregulated
at the Breaker stage or later in WT fruits and repressed in transgenic fruits (group 2 (cluster 4, 5)
and 3 (clusters 6, 7, 8)). These include the SAUR3 gene (Solyc09g008170, cluster 6) which is the
most highly repressed auxin related DEGs at the Br stage (log2FC=-7.57 of line 2X, log2FC=-6.86
of line 2Y, log2FC=-6.72 of line 8 at 39dpa) and the SlARF18 gene (Solyc01g096070, group 3
cluster 6). Both genes were associated with type-a DMRs, consistent with demethylation being
necessary for their expression. Other genes, SAUR5 (Solyc01g096340), SAUR6 (Solyc06g072650),
SAUR7 (Solyc07g042490) are in group2 and 3, but were not associated to any DMR.
As previously observed, type-a DMRs were not specifically associated with genes normally
induced during WT fruit ripening. Fourteen DEGs belonging to group 1 also contain a type-a DMR
(Fig 3.17A).
Genes involved in jasmonate (JA) biosynthesis and signaling were also affected in transgenic
fruits, although their general fold changes weren’t as large as those observed for ethylene. Many
of the DEGs (15) are expressed at early stages of fruit development and repressed during ripening
in WT fruits but their down regulation is delayed in transgenic fruits (group 1). Type-a, but also
types –b and c DMRs were associated with these DEGs. In addition a few DEGs from group 2
contained type DMRs, whereas others that are induced in overripe WT fruits, but not expressed in
WT were associated either with type-a or type –b DMRs.
ABA is produced from the carotenoid pathway. ABA content peaks at the transition to fruit
ripening, before the synthesis of ethylene, and then decreases after fruit ripening. Therefore, ABA
is also considered as an important factor controlling fleshy fruit ripening (Leng et al., 2014).
Consistent with this view, 26 genes out of 55 DEGs involved in ABA pathway are clustered in
group 2 (5 in cluster 4, 4 in cluster 5) and 3 (9 in cluster 6, 6 in cluster 7, and 1 in cluster 8),
indicating relatively high expression during fruit ripening in WT, while in transgenic fruits, the
expression pattern was various. In RNAi DML transgenic fruits, we found that ABA biosynthesis
wasn’t affected, as 50 DEGs identified are associated with ABA signaling and five in ABA
perception. Among ABA perception, only three (Solyc03g007310, Solyc06g050500,
Solyc08g082180) are repressed in both line 2 and line 8, while Solyc06g050500, Solyc08g082180
were associated with type-a DMRS, Solyc03g007310 with type-d DMR. In ABA response, we
found 15 DEGs were associated with type-a DMRs in group 2 and 3, while 12 DEGs in group 1
117
were also associated with type-a DMR. This suggests that active DNA demethylation may also
regulate the ABA pathway, but excluding ABA biosynthesis.

118
Fig 3. 17 Profile of hormone related DE genes. A to G, Heat maps showing the DE genes in RNAi DML transgenic fruits that related to Auxin
(A), Brassinosteroid (B), Cytokinin (C), Gibberellin (D), ABA (E), Jasmonate (F). Red color represent genes were clustered in group2 and 3. a,b,c,d
DEGs with DMR type.
B.Brassinosteroid E. ABA
A. Auxin
D. Gibberellin
C. Cytokinin
F. Jasmonate

119
It is well known that brassinosteroids (BRs) are steroid plant hormones essential for
plant growth and development. Among all DEGs involved in this pathway only CYP85
(Solyc02g089160) and CYP90C1 (Solyc02g084740) found in cluster 6 and cluster 7 were
significantly different in WT and in both line 2 and line 8. These two genes encode
cytochrome P450. For some other DEGs in group 2 and 3, the differences between WT and
transgenic fruits were not consistently detected. We analyzed the gene encoding CYP85 also
known as the Dwarf gene because of its central role in catalyzing multiple C-6 oxydation
during BRs biosynthesis (Shimada et al., 2001;Castle et al., 2005). Although this gene was
only induced at the fruit ripening transition and ripening stages in WT fruits but not in
transgenic one (log2FC=-2.30 in line2X, log2FC=-1.87 in line2Y, log2FC=-3.30 in line8), it
was not associated with any DMR. Inversely, nine of the 21 upregulated DEGs belonging to
group1, are associated with type-a DMRs (fig 3.17B, p118).
Only 8 DEGs involved in gibberellin (GA) and 8 in cytokine (CK) synthesis and
signaling were detected: (Fig 3.17C, 3.17D, p118). In the GA pathway, as previously
observed type-a DMRs were either associated with genes of group 2 and 3 (cluster 6 and 7)
(Solyc12g0070430, Solyc07g056670 and Solyc11g072310) but also to DEGs from group 1
(Solyc12g006460) mainly expressed during fruit development, and dramatically dropped
during fruit ripening, in transgenic fruits, the decline is slower.
In CK pathway, four DEGs (Solyc12g014190, Solyc08g062820, Solyc04g081290,
Solyc01g098400) were found in group 2 and 3, although not always in all transgenic lines
(Solyc04g081290, Solyc04g008110 are not affected in line 8). Type-a DMR were found in
four of these DEGs, also indicating the possible function of active DNA demethylation
during tomato fruit development and ripening.
As a conclusion we have observed that many of the genes involved in various hormone
metabolism and signaling are differentially regulated between WT and transgenic fruits.
However, contrary to our expectation, type-a DMRs corresponding to region loosing
demethylation during fruit ripening, are not systematically associated with the genes induced
during WT fruit ripening and repressed in the transgenic fruits of the same age. DMRs were
found associated with all patterns of DEGs. Inversely all types of DMRs were also associated
with genes of groups 2 and 3.

120
4.7 DMLs may interact with other Epigenetic regulators in tomato fruits
To assess eventual interactions between SlDML2 and genes involved in DNA methylation
and histones posttranslational modifications, we selected within the DEGs those related to these
processes. DNA methyltransferase were identified based on their homology with the Arabidopsis
orthologues and a list of 124 genes involved in histone modifications was used (Aiese Cigliano et
al., 2013;Gallusci et al., 2016)
Three genes, SlMET1, SlCMT4 and SlDRM6 encoding DNA methyltransferases were
differentially expressed in transgenic fruits. SlMET1 is expressed in a rather constant way at
developmental stages in WT fruits with a drop at the Br stage. In transgenic fruits almost no
expression is detected after 46 dpa. This gene is associated with a type-c DMR indicating it has at
least two DMRs with opposite behaviors. The expression of SlDRM6 is similar to SlMET1 in WT,
but its expression is almost not detectable in transgenic fruits. However, no DMR was found in the
promoter of this gene.
DEGs encoding histone acetyltransferase (HAT), histone deacetylases (HDAC), histone
methyltransferases (HMT) and histone demethylases (HMT) were mostly associated with type-a
DMRs although in a few cases type-b and c were also found. Thus the three HATs genes, HAG7,
HAG10 and HAG13 which are induced at the Br stage and highly expressed during WT fruit
ripening, but that present a delayed and reduced expression transgenic fruits are all associated with
a type-a DMR (Fig 3.18, p121). Indeed, all genes presenting this expression pattern are not
associated with a type a-DMR. Only three of the 7 DEGs encoding HDM have one, one DEG of
the 6 encoding HMTs and two of the 4 DEGs encoding HDACs. Inversely type-a DMRs were also
associated with genes repressed during WT fruit ripening, as previously described for all the
pathways analyzed above (Fig 3.18, p121).
It should be also noted, that seven members of JMJ gene family encoding histone demethylase
were identified as DEGs. Almost all of them, except JMJ15 and JMJ13, showed increased
expression levels after 46 dpa in WT, at stages corresponding to highly overripe fruits. This may
indicate an important function role for this gene when fruits are maintained for a very long time on
the plant. These genes were not induced in transgenic fruits. Only JMJ10 (cluster 4) in group 2 was
found associated with type-a DMR (decreased DNA methylation during fruit ripening).
Finally considering all DML demethylases, both SlDML1 and SlDML2 was repressed in RNAi
DML plants at early stage of fruit development, while only SlDML2 was extremely repressed at
the Br stage (Liu et al., 2015b). SlDML3 was also slightly repressed in line 8, but not in line 2, and
was not considered as common DEGs here. Interestingly, when we screened these genes for the
presence of DMRs the promoter of SlDML2 was associated with two type-a DMRs). Lei et al (2014)
have shown that ROS1 can regulate its own DNA methylation levels via an TE (helitron family) in
its promoter region. This region can sense DNA methylation levels in Arabidopsis (Lei et al.,
2015). In our case, SlDML2 as one of the two ROS1 orthologous gene, may also be self-regulated
by sensing its own DNA methylation level in WT generally.
From this study, it was suggested DMLs not only can regulate TF or other genes expression,
perhaps it can also regulate genes through these histone modifiers.

121
Fig 3. 18 DEGs corresponding to genes involved in DNA demethylation, DNA methylation, histone
modification. Heat maps showing the DEGs between the DML RNAi transgenic fruits of line 2 and the WT1
control that are related to DNA demethylation (DMLs: DNA demethylases) DNA methylation (DMTs: DNA
methytransferase) and histone modifications -HAT: histone acetyltransferases; HDACs: histone deacetylases;
HDMs: histonedemethylases; HMTs: histone methytransferases). DEGs with DMRs were labeled a, b, c, d
depending on the DMR type. Red color represents DEGs in group 2 (cluster 4 and 5) or 3 (cluster 6- 9).

122
Chapter3
122
V. Conclusion and discussion
In chapter 2 active DNA demethylation was shown to be a necessary trigger for tomato fruit
ripening by regulating the expression of genes encoding ripening transcription factors (RIN, CNR
and NOR) and rate-limiting enzymes of key biochemical processes (PSY1). We have
demonstrated a direct cause and effect relationship between active DNA demethylation and fruit
ripening, mediated primarily by the SlDML2 protein. SLDML2 RNAi fruits were unable to ripen
following the hyper methylation of the 4 genes cited above. This first study highlighted the
importance of active DNA demethylation on tomato fruit ripening (Liu et al., 2015b).
In chapter 3, we wanted to characterize the global consequences of active DNA
demethylation inhibition on the fruit ripening process and beyond in overripe stages. To achieve
this goal, two independent transgenic lines (line 2 and line 8) and their corresponding WT
controls were used for transcriptomic and metabolic analysis. As methylome data from our lines
are not yet available at this time, we have used, as a preliminary approach to identify genes that
are likely to be under direct methylation control previous data from Zhong et al. (2013), who has
analyzed the distribution of DMRs in tomato genes during the tomato fruit ripening process.
These DMRs have been identified by analyzing the variations of methylation levels at promoter
regions (2kb) during the ripening Ailsa craig in WT fruit.
5.1 Genes likely to undergo demethylation participate to a wide range of
physiological processes.
5.1.1-Majour effects are observed during fruit ripening
Analysis of primary metabolites using both H1NMR and LC MS showed that the
accumulation patterns of many detected metabolites, including most of primary metabolites, a
few secondary metabolites (carotenoids, chlorophylls) were significantly different in transgenic
fruits from those observed in WT fruits. Indeed some variability was observed between plants
and lines, but in all cases ripening WT fruits (46 dpa) and older fruits (up to 85 dpa) were clearly
separated from the transgenic fruits of the same age by PCA analysis. In contrast no separation
between WT and transgenic fruits was observed during early phases of fruit development (up to
39dpa). Similar results were obtained when performing PCA analysis using the RNA seq data.
This indicates that most of the differences induced by knocking down SlDML2 occur during fruit
ripening, and impact both gene expression and metabolites accumulation.
When network analysis was performed on all the metabolites altered during fruit ripening
process (35, 39, 55, 70, 85dpa), we found that in both transgenic lines, the density is higher than
WT, again verified the difference between WT and transgenic fruits, indicating the potential
function of active DNA demethylation on metabolic scale.
Indeed multiple aspects of fruit ripening were altered. Phenotypic characterization indicated
that fruits did not ripen properly. Among the strongest effects, fruits presented reduced softening
(Fig 3.1A, p73), reduced and delayed carotenoid accumulation together with delayed chlorophyll
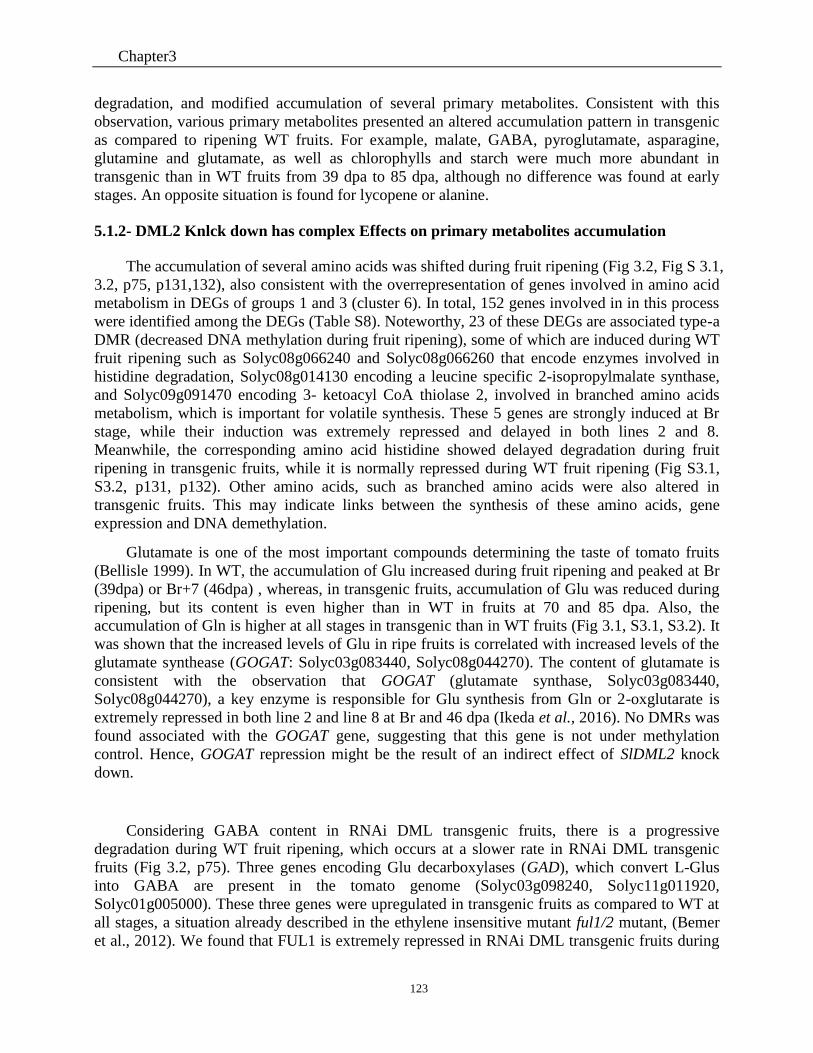
Chapter3
123
degradation, and modified accumulation of several primary metabolites. Consistent with this
observation, various primary metabolites presented an altered accumulation pattern in transgenic
as compared to ripening WT fruits. For example, malate, GABA, pyroglutamate, asparagine,
glutamine and glutamate, as well as chlorophylls and starch were much more abundant in
transgenic than in WT fruits from 39 dpa to 85 dpa, although no difference was found at early
stages. An opposite situation is found for lycopene or alanine.
5.1.2- DML2 Knlck down has complex Effects on primary metabolites accumulation
The accumulation of several amino acids was shifted during fruit ripening (Fig 3.2, Fig S 3.1,
3.2, p75, p131,132), also consistent with the overrepresentation of genes involved in amino acid
metabolism in DEGs of groups 1 and 3 (cluster 6). In total, 152 genes involved in in this process
were identified among the DEGs (Table S8). Noteworthy, 23 of these DEGs are associated type-a
DMR (decreased DNA methylation during fruit ripening), some of which are induced during WT
fruit ripening such as Solyc08g066240 and Solyc08g066260 that encode enzymes involved in
histidine degradation, Solyc08g014130 encoding a leucine specific 2-isopropylmalate synthase,
and Solyc09g091470 encoding 3- ketoacyl CoA thiolase 2, involved in branched amino acids
metabolism, which is important for volatile synthesis. These 5 genes are strongly induced at Br
stage, while their induction was extremely repressed and delayed in both lines 2 and 8.
Meanwhile, the corresponding amino acid histidine showed delayed degradation during fruit
ripening in transgenic fruits, while it is normally repressed during WT fruit ripening (Fig S3.1,
S3.2, p131, p132). Other amino acids, such as branched amino acids were also altered in
transgenic fruits. This may indicate links between the synthesis of these amino acids, gene
expression and DNA demethylation.
Glutamate is one of the most important compounds determining the taste of tomato fruits
(Bellisle 1999). In WT, the accumulation of Glu increased during fruit ripening and peaked at Br
(39dpa) or Br+7 (46dpa) , whereas, in transgenic fruits, accumulation of Glu was reduced during
ripening, but its content is even higher than in WT in fruits at 70 and 85 dpa. Also, the
accumulation of Gln is higher at all stages in transgenic than in WT fruits (Fig 3.1, S3.1, S3.2). It
was shown that the increased levels of Glu in ripe fruits is correlated with increased levels of the
glutamate synthease (GOGAT: Solyc03g083440, Solyc08g044270). The content of glutamate is
consistent with the observation that GOGAT (glutamate synthase, Solyc03g083440,
Solyc08g044270), a key enzyme is responsible for Glu synthesis from Gln or 2-oxglutarate is
extremely repressed in both line 2 and line 8 at Br and 46 dpa (Ikeda et al., 2016). No DMRs was
found associated with the GOGAT gene, suggesting that this gene is not under methylation
control. Hence, GOGAT repression might be the result of an indirect effect of SlDML2 knock
down.
Considering GABA content in RNAi DML transgenic fruits, there is a progressive
degradation during WT fruit ripening, which occurs at a slower rate in RNAi DML transgenic
fruits (Fig 3.2, p75). Three genes encoding Glu decarboxylases (GAD), which convert L-Glus
into GABA are present in the tomato genome (Solyc03g098240, Solyc11g011920,
Solyc01g005000). These three genes were upregulated in transgenic fruits as compared to WT at
all stages, a situation already described in the ethylene insensitive mutant ful1/2 mutant, (Bemer
et al., 2012). We found that FUL1 is extremely repressed in RNAi DML transgenic fruits during

Chapter3
124
fruit ripening and may therefore cause the repression of the GAD genes. Interestingly, FUL1 was
associated with type-a DMR (decreased DNA methylation during fruit ripening), and it seems
under RIN control (Bemer et al., 2012;Zhong et al., 2013) which is also controlled by
demethylation (Liu et al., 2015b). This suggests that the pathway from Glu and GABA may be
indirectly affected by demethylation through a subset of genes, including transcription factors.
Thus, modifications of these amino acids content could be an indirect consequence of the absence
of demethylation. However, whether the hypermethylation level of these genes in DML RNAi
transgenic fruit is directly responsible for the gradual delayed degradation or synthesis of amino
acids during fruit ripening would be an interesting issue for further studies.
5.1.3-Inhibition of carotenoid results from the repression of genes of the carotenoid
pathway
When carotenoids content was considered, we found that the accumulation of lycopene was
extremely inhibited and limited in transgenic fruits, as seen from fruit phenotypes (Fig 3.1A, Fig
3.2, liu et al., 2015b). This finding is consistent with previous study (chapter 2). RNA seq data
revealed that four key genes involved in lycopene biosynthesis are potential primarily targets of
SlDML2 (Fig 3.13, p105). Indeed we have previously shown that the PSY1 promoter region is
hypermethylated in plants knocked down for SlDML2, and establishing a causal relationship
between hypermethylation of PSY1, reduced PSY1 gene expression and limited carotenoid
accumulation (Liu et al., 2015b). The results here indicate that three other genes ZISO, ZDS and
CrtlSO are also associated with type-a DMRs indicating that they might require demethylation
for their expression.
5.1.4- Cell wall
As mentioned previously, transgenic fruits were significantly harder than WT fruits of the
same age. Consistent with this phenotype, galactose did not accumulate in transgenic fruits,
although this compound is very abundant in ripening WT fruits (Eda et al., 2016). The function
of several genes involved in cell wall metabolism has been determined in tomato fruits. For
example, EXP1 was found to have important role on polyuronide depolymerization during fruit
ripening. Suppression of this gene expression leads to enhanced fruit firmness and delayed fruit
ripening, although the breakdown of structurally hemicelluloses was not altered in this mutant
(Brummell et al., 1999;Minoia et al., 2016). CEL2 mutant was shown to be associated with fruit
abscission but without alteration of fruit softening (Flors et al., 2007). Loss of function of TBG4
which encodes a β-galactosidase (TBG1-7) was associated with alteration of fruit firmness and to
a reduced galactose loss.
As explained in part IV, these genes were significantly down regulated in transgenic fruits as
compared to ripening WT fruits. This is very likely contributing to the phenotype observed :
delayed softening and lack of galactose accumulation. Furthermore, their promoter is associated
with type-a DMRs that are demethylated during fruit ripening except for TBG4 associated to
type-d DMR. As a conclusion cell wall metabolism might be at least for some genes under direct
demethylation control.
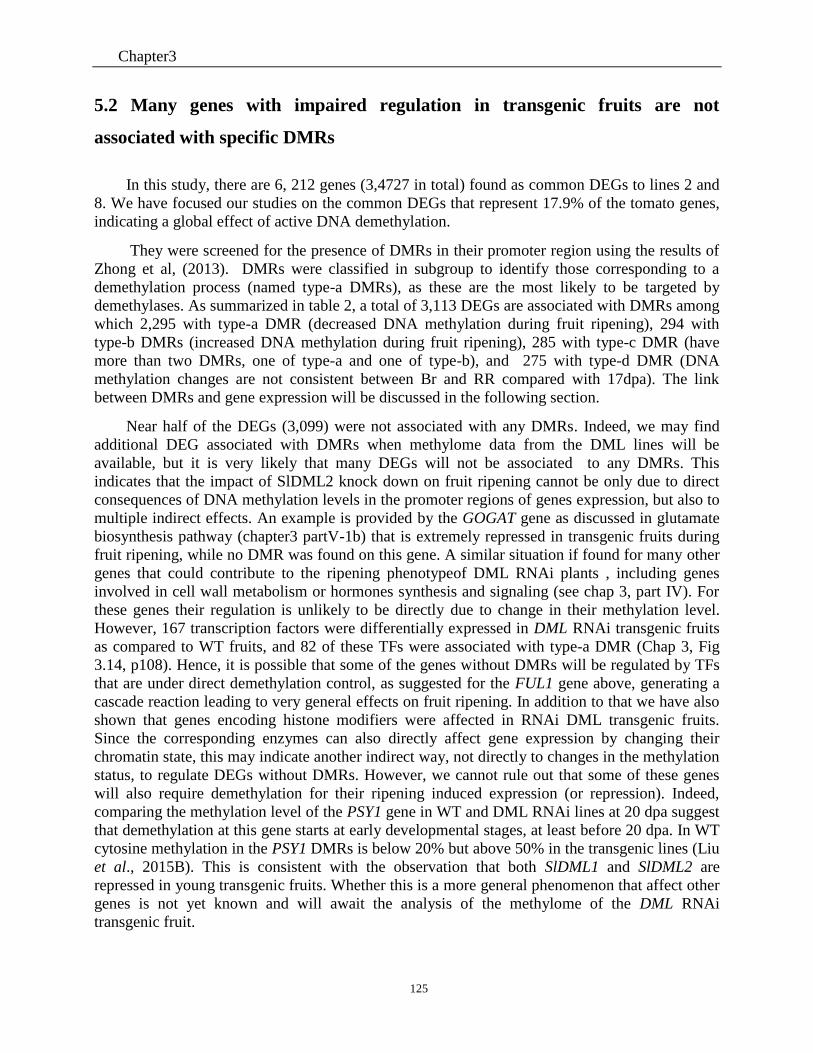
Chapter3
125
5.2 Many genes with impaired regulation in transgenic fruits are not
associated with specific DMRs
In this study, there are 6, 212 genes (3,4727 in total) found as common DEGs to lines 2 and
8. We have focused our studies on the common DEGs that represent 17.9% of the tomato genes,
indicating a global effect of active DNA demethylation.
They were screened for the presence of DMRs in their promoter region using the results of
Zhong et al, (2013). DMRs were classified in subgroup to identify those corresponding to a
demethylation process (named type-a DMRs), as these are the most likely to be targeted by
demethylases. As summarized in table 2, a total of 3,113 DEGs are associated with DMRs among
which 2,295 with type-a DMR (decreased DNA methylation during fruit ripening), 294 with
type-b DMRs (increased DNA methylation during fruit ripening), 285 with type-c DMR (have
more than two DMRs, one of type-a and one of type-b), and 275 with type-d DMR (DNA
methylation changes are not consistent between Br and RR compared with 17dpa). The link
between DMRs and gene expression will be discussed in the following section.
Near half of the DEGs (3,099) were not associated with any DMRs. Indeed, we may find
additional DEG associated with DMRs when methylome data from the DML lines will be
available, but it is very likely that many DEGs will not be associated to any DMRs. This
indicates that the impact of SlDML2 knock down on fruit ripening cannot be only due to direct
consequences of DNA methylation levels in the promoter regions of genes expression, but also to
multiple indirect effects. An example is provided by the GOGAT gene as discussed in glutamate
biosynthesis pathway (chapter3 partV-1b) that is extremely repressed in transgenic fruits during
fruit ripening, while no DMR was found on this gene. A similar situation if found for many other
genes that could contribute to the ripening phenotypeof DML RNAi plants , including genes
involved in cell wall metabolism or hormones synthesis and signaling (see chap 3, part IV). For
these genes their regulation is unlikely to be directly due to change in their methylation level.
However, 167 transcription factors were differentially expressed in DML RNAi transgenic fruits
as compared to WT fruits, and 82 of these TFs were associated with type-a DMR (Chap 3, Fig
3.14, p108). Hence, it is possible that some of the genes without DMRs will be regulated by TFs
that are under direct demethylation control, as suggested for the FUL1 gene above, generating a
cascade reaction leading to very general effects on fruit ripening. In addition to that we have also
shown that genes encoding histone modifiers were affected in RNAi DML transgenic fruits.
Since the corresponding enzymes can also directly affect gene expression by changing their
chromatin state, this may indicate another indirect way, not directly to changes in the methylation
status, to regulate DEGs without DMRs. However, we cannot rule out that some of these genes
will also require demethylation for their ripening induced expression (or repression). Indeed,
comparing the methylation level of the PSY1 gene in WT and DML RNAi lines at 20 dpa suggest
that demethylation at this gene starts at early developmental stages, at least before 20 dpa. In WT
cytosine methylation in the PSY1 DMRs is below 20% but above 50% in the transgenic lines (Liu
et al., 2015B). This is consistent with the observation that both SlDML1 and SlDML2 are
repressed in young transgenic fruits. Whether this is a more general phenomenon that affect other
genes is not yet known and will await the analysis of the methylome of the DML RNAi
transgenic fruit.
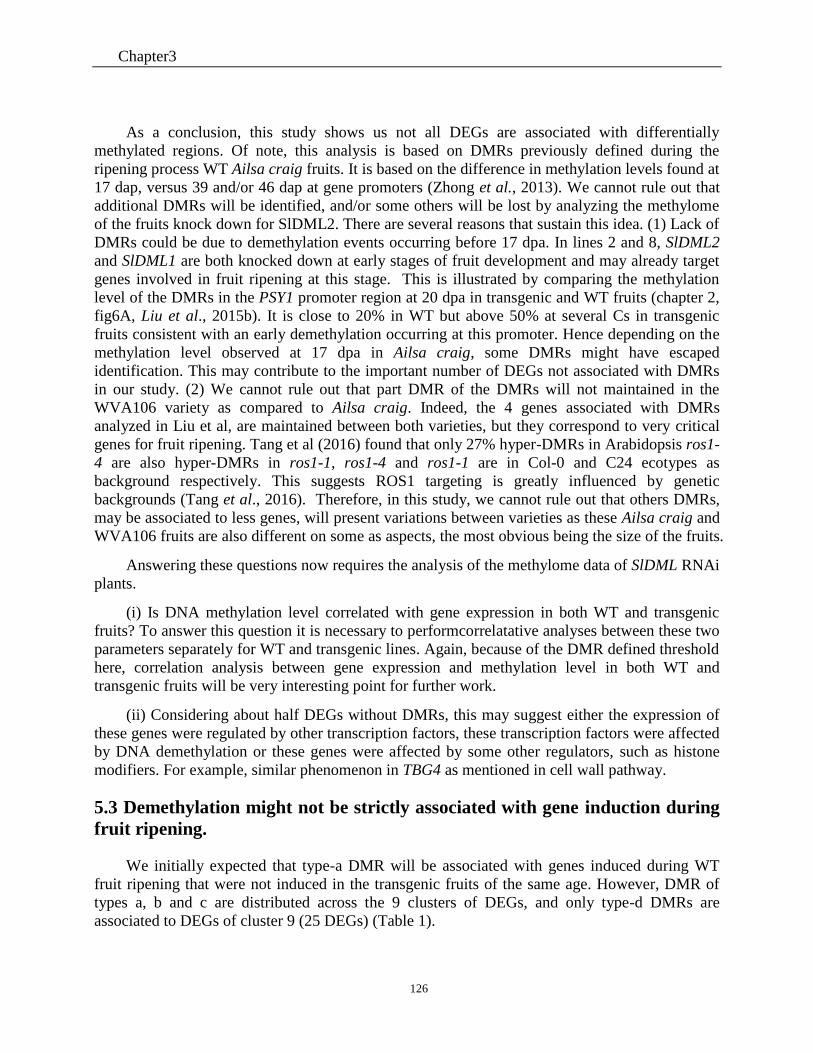
Chapter3
126
As a conclusion, this study shows us not all DEGs are associated with differentially
methylated regions. Of note, this analysis is based on DMRs previously defined during the
ripening process WT Ailsa craig fruits. It is based on the difference in methylation levels found at
17 dap, versus 39 and/or 46 dap at gene promoters (Zhong et al., 2013). We cannot rule out that
additional DMRs will be identified, and/or some others will be lost by analyzing the methylome
of the fruits knock down for SlDML2. There are several reasons that sustain this idea. (1) Lack of
DMRs could be due to demethylation events occurring before 17 dpa. In lines 2 and 8, SlDML2
and SlDML1 are both knocked down at early stages of fruit development and may already target
genes involved in fruit ripening at this stage. This is illustrated by comparing the methylation
level of the DMRs in the PSY1 promoter region at 20 dpa in transgenic and WT fruits (chapter 2,
fig6A, Liu et al., 2015b). It is close to 20% in WT but above 50% at several Cs in transgenic
fruits consistent with an early demethylation occurring at this promoter. Hence depending on the
methylation level observed at 17 dpa in Ailsa craig, some DMRs might have escaped
identification. This may contribute to the important number of DEGs not associated with DMRs
in our study. (2) We cannot rule out that part DMR of the DMRs will not maintained in the
WVA106 variety as compared to Ailsa craig. Indeed, the 4 genes associated with DMRs
analyzed in Liu et al, are maintained between both varieties, but they correspond to very critical
genes for fruit ripening. Tang et al (2016) found that only 27% hyper-DMRs in Arabidopsis ros1-
4 are also hyper-DMRs in ros1-1, ros1-4 and ros1-1 are in Col-0 and C24 ecotypes as
background respectively. This suggests ROS1 targeting is greatly influenced by genetic
backgrounds (Tang et al., 2016). Therefore, in this study, we cannot rule out that others DMRs,
may be associated to less genes, will present variations between varieties as these Ailsa craig and
WVA106 fruits are also different on some as aspects, the most obvious being the size of the fruits.
Answering these questions now requires the analysis of the methylome data of SlDML RNAi
plants.
(i) Is DNA methylation level correlated with gene expression in both WT and transgenic
fruits? To answer this question it is necessary to performcorrelatative analyses between these two
parameters separately for WT and transgenic lines. Again, because of the DMR defined threshold
here, correlation analysis between gene expression and methylation level in both WT and
transgenic fruits will be very interesting point for further work.
(ii) Considering about half DEGs without DMRs, this may suggest either the expression of
these genes were regulated by other transcription factors, these transcription factors were affected
by DNA demethylation or these genes were affected by some other regulators, such as histone
modifiers. For example, similar phenomenon in TBG4 as mentioned in cell wall pathway.
5.3 Demethylation might not be strictly associated with gene induction during
fruit ripening.
We initially expected that type-a DMR will be associated with genes induced during WT
fruit ripening that were not induced in the transgenic fruits of the same age. However, DMR of
types a, b and c are distributed across the 9 clusters of DEGs, and only type-d DMRs are
associated to DEGs of cluster 9 (25 DEGs) (Table 1).

Chapter3
127
DEGs containing type-a DMRs are the most abundant DEGs in each expression group,
consistent with results of Zhong et al (2013) indicating that many genes undergo demethylation
during fruit ripening. However, whether demethylation at these DMRs is always associated with
induction of gene expression remains to be clarified. This is likely the case for DEGs containing
type-a DMR and belonging to the group 2 (clusters 3 and 4) and to the clusters 6-9 of group 3.
These DEGs correspond to genes induced during fruit ripening or later stages in WT fruits that
are not induced or present a delayed and reduced expression in transgenic fruits. They encode
enzymes involved in glycolysis, stress responses, transcription regulation, including transcription
factors, protein degradation, cell wall degradation, lipid metabolism, hormone metabolism, misc
group, including UDP glucosyl and glucoronyltransferases and a number of unknown genes,
indicating that active DNA demethylation may indeed be involved in multiple processes during
fruit ripening. Subsequently, we focused on specific pathways, including carotenoid biosynthesis,
ethylene pathway, cell wall modification and degradation, ripening factors as well as other
transcription factors related to biotic and abiotic stress, and analyzed DEGs involved in other
hormones and epigenetic modifiers.
In most pathways analyzed, the expression of some specific genes is likely depending on
theDNA methylation level in their promoter region. An example is provided by the carotenoid
pathway as discussed above, three genes (ZISO, CrtlSO, ZDS), in addition to PSY1 that may also
need active DNA demethylation for their expression. As a conclusion, active DNA demethylation
is likely necessary for the expression of selected genes involved in several different pathways
during tomato fruit ripening.
However, 1315 DEGs with type-a DMR were also abundant in group 1, especially cluster 2
(895 DEGs, table 1). When gene enrichment was performed in cluster 2, we found genes mainly
involved photosynthesis, cell wall degradation, lipid metabolism, C1-metabolism, RNA process,
signaling, transport and misc group, as well as some unknown genes. These genes are however
not induced during WT fruit ripening, but down regulated at the onset of fruit ripening. In
transgenic fruits, repression of these genes was generally slown down (Fig 3.10, table 2, p93,
p101). Hence, in this case, decreased DNA demethylation at the DMRs located in the promoter
region is not associated with induction but rather to repression of gene expression. The
underlying molecular mechanisms are so far unknown. A tempting hypothesis could be that
hypermethylation at this sites in transgenic fruits might prevent the binding of proteins necessary
to repress these gene expression.
Therefore, it indicates that active DNA demethylation might not be strictly associated with
induction of gene expression during fruit ripening. In addition, genes with declined expression
pattern may also the direct target of active DNA demethylation. In addition, there are 845 DEGs
with other types DMRs (type-b, type-c and type-d), indicating more complex methylation
patterns, as some of these DEGs contain more than one DMRs that eventually present opposite
behaviors during fruit ripening. In these cases the relation-ship between methylation levels and
gene expression remains to be established. Of particular interest are the DMRs corresponding to
gain in DNA methylation (type-b and c). As DRM6; that is normally upregulated in WT fruits is
downregulated in transgenic lines, these DMRs could correspond to DRM6 targets. The role of
increase methylation at these DMRs remains to be determined.
Chapter3
128
5.4 Some DEGs are associated with an increase in DNA methylation during
fruit ripening.
In addition to loss of methylation, some DEGs are associated with DMRs that were shown
to gain methylation during fruit ripening (Zhong et al, 2013). The function of these DMRs is so
far unknown because these DEGs were found in all clusters and were not associated with a
specific expression pattern. It is also unclear what mechanisms are responsible for such locus
specific increase in DNA methylation. Interestingly the DRM6 gene that was previously shown to
be upregulated during tomato fruit ripening is down regulated in the DML RNAi lines. DRM6
encode a DNA methyltransferase a protein family involved in de novo DNA methylation that
could therefore contribute to locus specific gain of methylation. Whether active DNA
demethylation also controls de novo methylation during fruit ripening will now require further
investigation. Similarly the functional analysis of DRM6 in tomato fruits is now required to
understand the role of de novo methylation during fruit ripening.
5.5 Active DNA methylation: a more general model
Based on these results, active DNA methylation appears as a central point controlling
several aspects of the fruit ripening process. In addition, we have shown in chapter 2 that the
SlDML2 gene is repressed in nor, Cnr and rin mutant backgrounds although the expression level
observed in the pericarp of rin mutant fruitswas significantly higher than in the nor mutant and in
the Cnr epimutant. It is therefore possible that the ripening defects observed in the rin, nor and
Cnr genetic background is in part mediated by a limited active DNA demethylation, which is
consistent with the observation that both the rin and Cnr plants and fruits are hypermethylated
(Gallusci et al., 2016). Integrating this idea with the results presented in chapter3 lead to a more
general model of the role of active DNA demethylation during tomato fruit ripening, which is
presented in Fig 19.
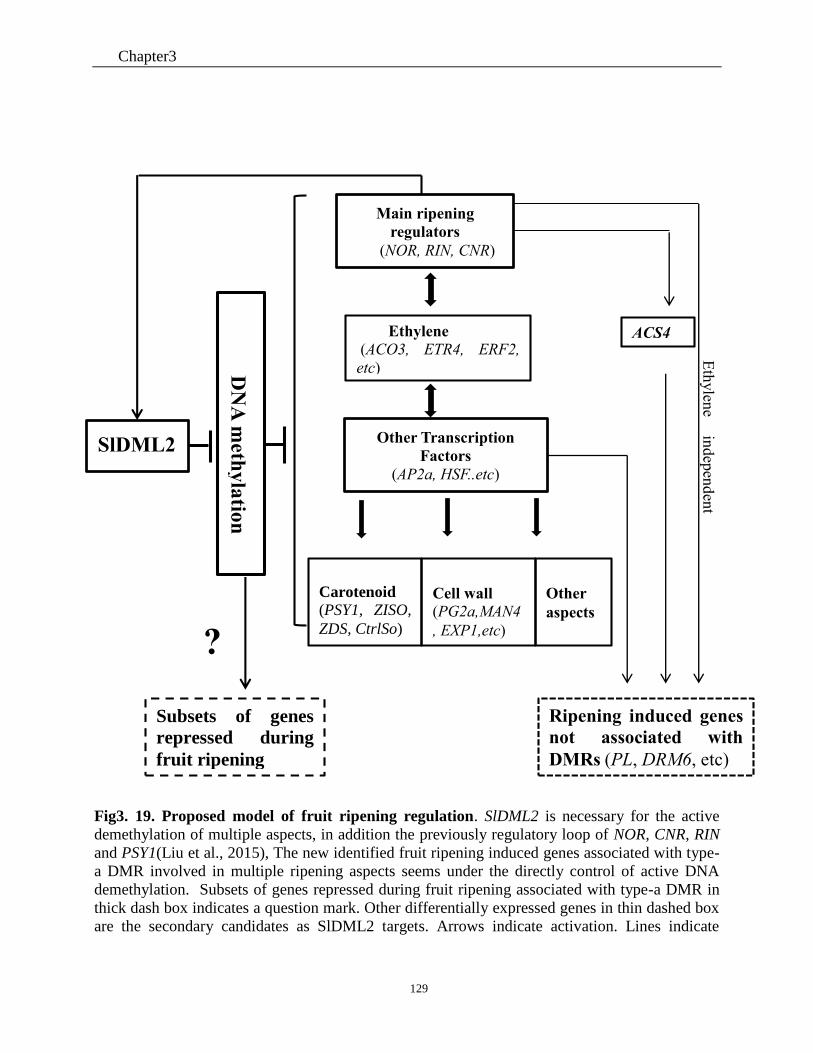
Chapter3
129
Fig3. 19. Proposed model of fruit ripening regulation. SlDML2 is necessary for the active
demethylation of multiple aspects, in addition the previously regulatory loop of NOR, CNR, RIN
and PSY1(Liu et al., 2015), The new identified fruit ripening induced genes associated with type-
a DMR involved in multiple ripening aspects seems under the directly control of active DNA
demethylation. Subsets of genes repressed during fruit ripening associated with type-a DMR in
thick dash box indicates a question mark. Other differentially expressed genes in thin dashed box
are the secondary candidates as SlDML2 targets. Arrows indicate activation. Lines indicate
Ethylene (ACO3, ETR4, ERF2,
etc)
Ripening induced genes
not associated with
DMRs (PL, DRM6, etc)
Main ripening
regulators
(NOR, RIN, CNR)
Other Transcription
Factors
(AP2a, HSF..etc)
DN
A m
eth
yla
tion
SlDML2
Carotenoid
(PSY1, ZISO,
ZDS, CtrlSo)
Cell wall (PG2a,MAN4
, EXP1,etc)
Other
aspects
ACS4
Subsets of genes
repressed during
fruit ripening
Eth
ylen
e in
dep
end
ent
regulatio
n
?

Chapter3
130
repression. Only a fraction of the candidate regulatory genes identified in this study are shown
here.
Conclusion
Based on previous study by Liu et al (2015b), the results presented here highlight the central
role of active DNA demethylation during tomato fruit ripening. In addition to a general role in the
regulation of genes directly involved in several metabolic pathways, it is likely that several
transcription factors as well as epigenetic regulators are under direct methylation control.
However, we could not establish a district relationship between DNA reduction of DNA
methylation and induction of gene expression, as not all DEGs containing a type-a DMRs do not
correspond to genes normally induced in WT and repressed in transgenic plants. Some were
corresponding to an opposite situation and in a few cases more complex methylation pattern
(several DMRs) were also found. Indeed these conclusions are based on methylation analysis
obtained in another variety. They might however reflect the situation of WVA106 fruits, although
some variations are expectable when the methylome of DML RNAi fruits will be analyzed.
Hence the relationship between DNA demethylation and gene expression might be more complex
than expected, and not limited to the starting hypothesis of this work: DNA demethylation is an
absolute requirement for the expression of critical ripening induced genes. This is indeed clearly
the case (Liu et al., 2015b), but the analysis presented here also suggest that DNA demethylation
might also be necessary for the repression of several genes as well.

Chapter3
131
Chapter 3_ supplementary figures

Chapter 3
131
Fig 3.S 1 Characterization of metabolite content in WT1 and in transgenic RNAi fruits Line 2Y/2X. Relative metabolite contents of
(A) Soluble sugars,(B) sugar alcohols and sugar phosphates, (C) TCA-cycle intermediates, (D) organic acids , and (E) amino acids, (F) fatty
acids (G) Other compounds. For each compound a Turkey test was performed between WT and transgenic fruits. Stars indicate significant
difference between WT and transgenic fruits of the same age (*: p<0.05; **: p<0.01; ***: p<0.001). Compounds shown in A, B, C, E were
analyzed using GC-MS as in Carrari et al (2006).

Chapter 3
132
Fig 3.S 2 Characterization of metabolite content in WT2 and in transgenic RNAi fruits of Line 8. Relative metabolite contents of (A) amino
acids, (B) Soluble sugars, (C) TCA-cycle intermediates, (D) organic acids and (E) sugar alcohols and sugar phosphates, (F) fatty acids (G) Other
compounds. For each compound a Turkey test was performed between WT and transgenic fruits. Stars indicate significant difference between WT
and transgenic fruits of the same age (*: p<0.05; **: p<0.01; ***: p<0.001). Compounds shown in A, B, C, E were analyzed using GC-MS as in
Carrari et al (2006)

Chapter 3
133
A B
Fig 3.S 3 Principal component analysis of metabolic profiles of WT2 and line 8 fruits during development and ripening. (A) PCA
using metabolites determined by GC-MS at 6 developmental stages. Note the clear separation of WT 2 and transgenic fruits from Br (39
dpa) to 85 dpa. (B) Variables plot of metabolites for the first two principal components (PC1 and PC2). Compounds that give large
contribution either to PC1, PC2 or both are labeled with red color.
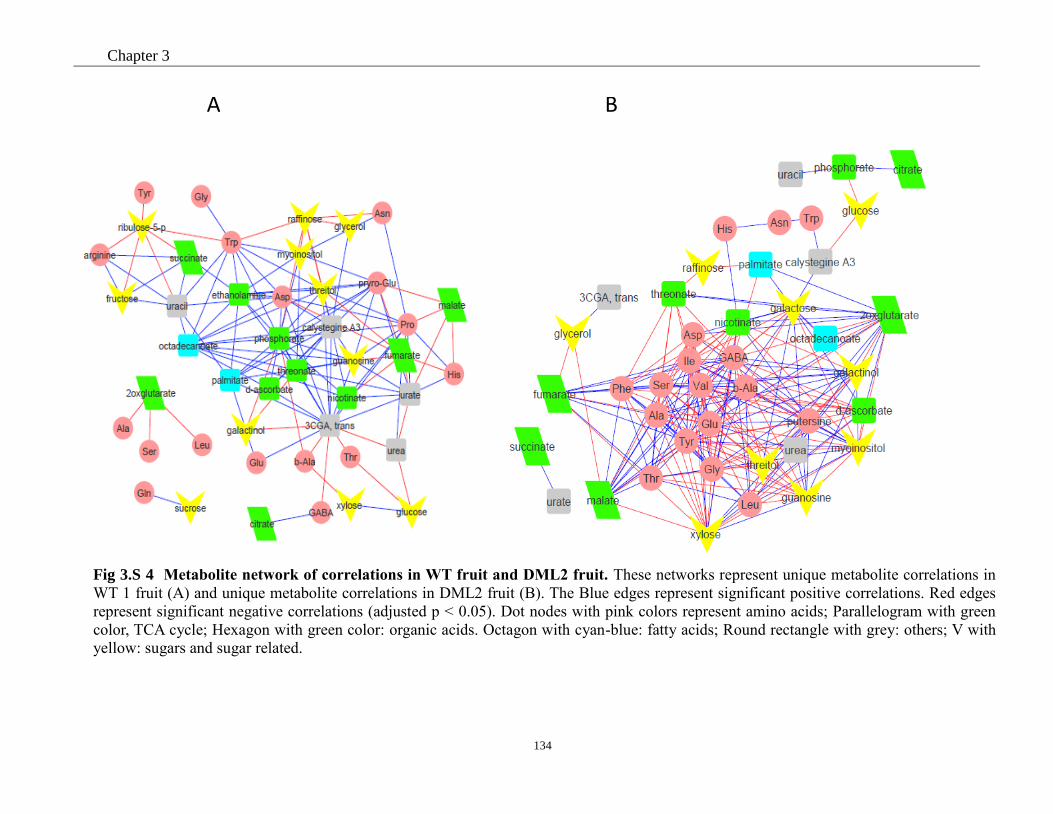
Chapter 3
134
A B
Fig 3.S 4 Metabolite network of correlations in WT fruit and DML2 fruit. These networks represent unique metabolite correlations in
WT 1 fruit (A) and unique metabolite correlations in DML2 fruit (B). The Blue edges represent significant positive correlations. Red edges
represent significant negative correlations (adjusted p < 0.05). Dot nodes with pink colors represent amino acids; Parallelogram with green
color, TCA cycle; Hexagon with green color: organic acids. Octagon with cyan-blue: fatty acids; Round rectangle with grey: others; V with
yellow: sugars and sugar related.

Chapter 3
135
A B
CD
Fig 3.S 5 Boxplot of raw counts in each tissue. Boxplot and bar plot present the library size in each tissue and each line (A, B: WT1
and Line 2Y/2X; C, D: WT2 and Line 8, including an azygous).

Chapter 3
136
170 135 210
1012
2151 22111842 2085
134 103 276
2256
4789 4834 4613 4531
0
1000
2000
3000
4000
5000
6000
7000
8000
Up_regulated
Line 2X_DE y = 1,4303x - 0,1396R² = 0,8196
-12
-8
-4
0
4
8
-10 -5 0 5
log2FCRNA
log2FCQPCR
C D
y = 1,1803x - 0,1297R² = 0,897
-15
-10
-5
0
5
10
-10 -5 0 5 10
A
Fig 3.S 6 Relationship of tomato fruit pericarp related transcript expression profiles and differentially expressed genes. A.
Correlation analysis of RNA-seq data between line 2X and Y at 55 dpa, line 8 and line 2Y at 55dpa, Line 8 at 35 and 39 dpa, and WT2 at
35 and Br stage ( 39dpa) B. Number of DE genes at each stage between Line 2X and its respective controls, WT1. C. Expression levels
of DE genes as determined by RNA-seq and qPCR are closely correlated. The logarithm of fold change values in the RNA-seq and the
qPCR data were plotted along with the linear fit line to examine the correlation relationship between the two methods. Five genes (RIN,
NOR, PSY1, ACS4, ZISO) were detected at eight developmental stages, log2FC represent the ratio of Line 2Y and WT 1; D. Eight genes
(RIN, NOR, CNR, PSY1, ACS2, ACS4, Pg2a, ZISO) were detected at six developmental stages, log2FC represent the ration of line 8 and
WT2
B
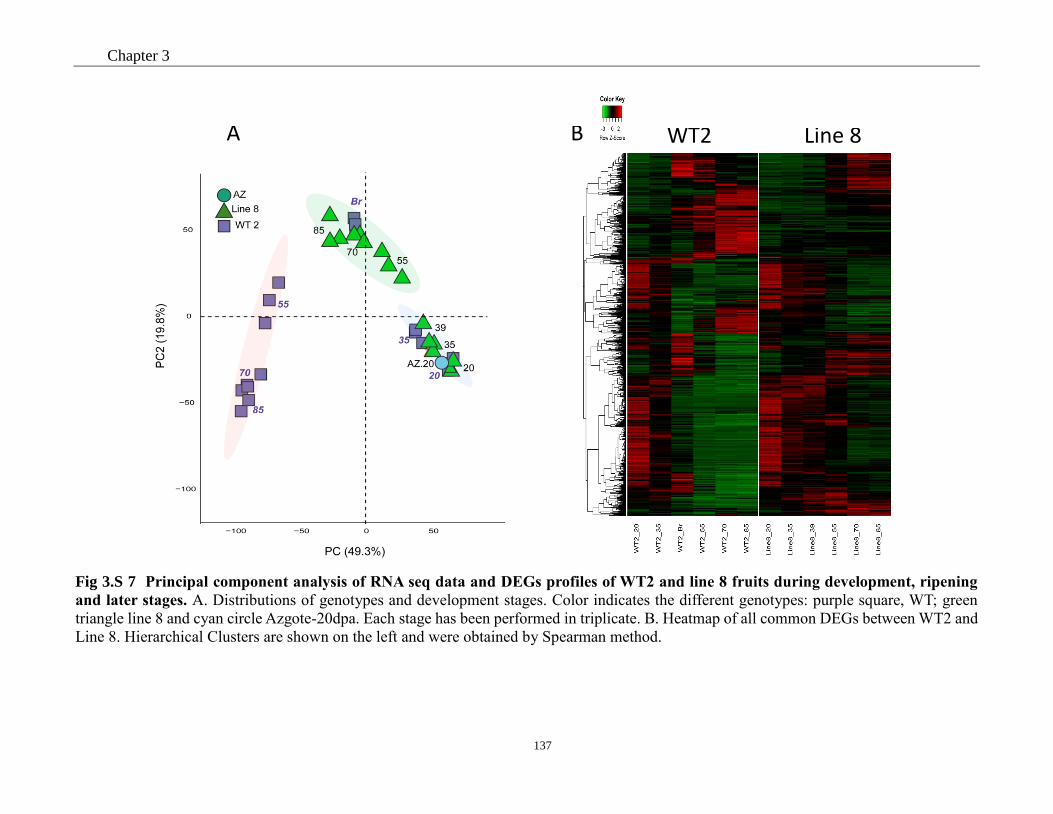
Chapter 3
137
Fig 3.S 7 Principal component analysis of RNA seq data and DEGs profiles of WT2 and line 8 fruits during development, ripening
and later stages. A. Distributions of genotypes and development stages. Color indicates the different genotypes: purple square, WT; green
triangle line 8 and cyan circle Azgote-20dpa. Each stage has been performed in triplicate. B. Heatmap of all common DEGs between WT2 and
Line 8. Hierarchical Clusters are shown on the left and were obtained by Spearman method.
A B WT2 Line 8

Chapter 3
138
Fig 3.S 8 Expression of genes of the Carotenoid pathway in RNAi DML transgenic fruit compared to WT. DEGs of the MEP/DOPX
pathway (A) and DEGs of Carotenoid pathway (B), (C): Heatmap of gene expression in A and B. DEGs from groups 2 (cluster 4 and 5) and 3
(cluster 6- 9) with DMRs in their promoter are highlighted in red (repression in RNAI lines). Black arrows represent a route rather than a single
metabolic reaction and thus may be composed of multiple reactions.
D-Gycelaldehyde 3-P
Pyruvate
1-Deoxy-D-xylulose 5-P(DXP)
DXS1
ISPE
Isopentenyl-PP Dimethylallyl-PP
IPI2a
Farnesyl-PP
Geranylgeranyl-PP
GGPS3c
GGPP
ζ-Carotene
PSY1a
ZISOa
15-cis-Phytoene
CrtlSOa
ZDSa
Lycopene
β-Cartotene
Zeaxanthin
VDE
CHY1
Violaxanthin
Neoxanthin
δ-Cartotene
α -Cartotene
Lutein
CRTR-B,E
NCED
LCY-B1
Prolycopen
e
HMB
PP
HDS
2-C-methyl-D-erythritol
2,4-cyclodiphosphate
DXS2
GGPS2
GGPS5
A
CYP97A3
CYP97C2
B C
CCD4Ba
NCED
2c
CHY2

Chapter 3
139
Fig 3.S 9 Profile of DEGs involved in cell wall metabolism and
fruit firmness. Heatmap showing the expression of genes related to
cell wall in group 2 and 3. DE Genes in group 2 and group 3 with
different types were labeled; blue color indicates gene was not
repressed in Line 8 compared with WT 2

Chapter 3
140
Fig 3.S 10 Profile of ethylene-related DEGs in line 8. Heat maps showing the DEGs in Line 8 related to ethylene biosynthesis (A), ethylene
perception and signaling (B). Red color represent DEGs that repressed in at least one stage in line 8 compared with WT2. a, b, c, d represent
DMR types as explained in table 2. (Fig is adapted from Cara and Giovannoni, 2008)
C2H2
System1 System2
A Ethylene Biosynthesis
Cytosol
ETR
CTR
EIN2
EILs ERF
Nucleus
Ethylene
Response
C2H4 GRL
EBF
B Ethylene Perception and Response

Chapter 4
Chapter 4_ General Discussion
and Further Work

Chapter 4
141
Part I Discussion
In the work presented here, we have demonstrated that active DNA demethylation is the
mechanism responsible for the loss in 5mC at the onset of fruit ripening. In DML RNAi transgenic
fruits, the induction of four key genes (RIN, NOR, CNR, PSY1) associated with fruit ripening were
extremely delayed and limited because of the hypermethylation in their promoter region. It is
known that in Arabidopsis DMLs can target genes throughout the genome, although in this case
this was not associated to specific phenotypes but rather to the protection of genes against
potentially deleterious methylation (Penterman et al., 2007). Here (Chapter 3) we have identified
a number of genes involved in several different metabolic and regulatory pathways that are
differentially expressed between WT and DML RNAi lines. In addition a subset of these DEGs
was associated with regions that were shown to be differentially methylated in the Ailsa Craig
variety during the ripening process (Zhong et al, 2013). This also suggests that SlDML2 is targeted
to several different genes during fruit ripening that require demethylation for their expression.
General Discussion
1- Active demethylation may have additional functions beyond gene induction
Surprisingly, we did not find that type-a DMRs are solely associated with genes normally
induced during fruit ripening. In addition type-a DMRs were found at genes that are repressed
during fruit ripening. In this case, the function of active DNA demethylation remains to be
determined, but a tempting hypothesis would be that active DNA demethylation is necessary for
the repression of these genes, for example, demethylation on this gene may facilitate the binding
of the repressors, which repress this gene expression during fruit ripening. This would be consistent
with the observation that all these genes presented a delayed repression during fruit ripening that
are associated with specific aspects of the transgenic fruit phenotypes, such as delayed catabolism
of chlorophylls or starch. Whether this hypothesis is true will at least require showing that these
genes are hypermethylated in the transgenic fruits and that this hypermethylation prevent the
binding of factors necessary for repression of these genes. However, this new potential function of
active DNA demethylation in fruit ripening has also been integrated in the new model proposed fig
19.
It should also be noted that so far we have not been able to analyze the methylation level at
other genome sites in the transgenic lines. In Teyssier et al (2008) it is shown that the global
methylation level fruit pericarp decreases by 30% during tomato fruit ripening. This is unlikely to
be solely due to demethylation at specific promoters but also will require the active demethylation
of highly methylated genome region such as transposons. Consistent with this idea, Zhong et al
(2013) have shown that in addition to promoter demethylation transposons are also demethylated
during fruit ripening although only in the CG context. It is so far unknown whether this process is
also due to active DNA demethylation mediated by SlDM2, or by dilution of methylation that could
be due to endoreduplication associated to a loss of MET1 activity. As explained before, DNA
endoreduplication is very limited during fruit ripening, but could still be sufficient to lead to a
moderate reduction in DNA methylation in the absence of efficient maintenance methylation
Chapter 4
142
mechanisms. The specific loss of CG type of methylation would be consistent with this idea,
although it was also shown that Demethylases have a bias toward CG sites.
2- Active DNA demethylation may play a more important role in tomato than
in Arabidopsis
As reviewed in chapter 1, Arabidopsis ros1 mutant or triple mutant rdd didn’t show obvious
phenotype except for abnormal stomatal lineage cell numbers, however, in DML RNAi transgenic
tomato, fruit ripening was affected as well as other additional phenotypes were observed in some
transgenic lines. These mutant phenotypes indicate that active DNA demethylation may have a
more important role in tomato than in Arabidopsis.
On the other side, when considering DEGs percentage in each case, Arabidopsis ros1 mutant
was shown that a very limited number of genes are under the control of DMLs (Penterman et al.,
2007, Lister et al., 2008), even in triple mutant rdd, only 0.53% genes were differentially expressed
(Lister et al., 2008). Whereas, tomato SlDMLs are likely to have a major role in the regulation of
gene expression, and may affect several aspects of tomato plant development. DEGs occupy 41.24%
of total genes that were detected reads in DML RNAi transgenic plants. Considering 0.53% DEGs
for Arabidopsis only use the average value of floral tissue (Lister et al., 2008), therefore, when we
only consider DEGs at breaker stage, DEGs is still occupy 18.47%, which indicates that DEGs
number is still larger in tomato than in Arabidopsis, suggesting the stronger effect of active DNA
demethylation in tomato compared with Arabidopsis.
When considering the difference of DNA methylation during fruit development and ripening
in tomato, 52,095 DMRs were identified, and most of these DMRs are concentrated in regions 5′
upstream of genes (Zhong et al, 2013). This was also the case in Arabidopsis, but this phenomenon
appears much more limited as only 179 genes were found differentially methylated in their
promoter region and this was not associated with changes in gene expression. This may explain
why in tomato, active DNA demethylation can affect gene expression on a large scale, as compared
with Arabidopsis. In addition, in Arabidopsis, only 5% of methylated cytosines in the genome and
very few transposable elements (TEs), but in tomato and other species, such as maize, there is
striking difference as reviewed in chapter 1. In tomato, the overall genome methylation level
occupies more than 22% of whole genome, moreover, more than 60% of its genome consists of
heavily methylated TEs (Zhong et al., 2013). Similar phenomenon was found in maize and rice
(reviewed in Gallusci, et al., 2016). It has been proved the major targets of ROS1 is intergenic
regions and transposons, especially transposons are those TEs close to protein coding genes,
suggesting the important function of ROS1 to gene expression (Tang et al., 2016). In this case,
active DNA demethylation was considered to be more important in tomato than in Arabidopsis via
regulating TEs which is related to gene expression.
In addition, the proportion of cytosine context varies also between these species and
Arabidopsis, such as CHH context, which is associated with the directly influence of nearby genes
expression. Therefore, from this study, we can see active DNA methylation may play more
important role in tomato than in Arabidopsis. Our work supports this idea and highlights the critical
function of active DNA demethylation in fleshy fruit.

Chapter 4
143
3- Active demethylation maybe also important in other fruits
As we demonstrated in this study, active DNA demethylation is absolutely necessary for tomato
fruit ripening via controlling numerous genes expression. Since tomato is the model plant of
climacteric fruit, therefore whether demethylation is also necessary in other climacteric fruit as
well as other non-climacteric fruit is also interesting question. Interestingly, as reviewed in
chapter1, anthocyanin synthesis in apple, pear skin is associated with DNA methylation levels in
the promoter of MYB10. In addition, in oil palm, hypomethylation in a TE Karma is associated
with the origin of mantled trait (Ong-Abdullah et al., 2015). These studies suggest DNA
methylation negatively correlate with gene expression in other fruits and also the methylation status
on TE is also correlated with important fruit phenotype (Telias et al., BMC Plant Biology, 2011;
Wang et al., 2013). Although there is no any direct evidence of causal and effects about
demethylation on other fruits until now, outside of tomato, DNA demethylation may also play
essential role in other fruits.
Part II Perspectives
1-Active DNA demethylation may regulate other aspects of tomato plant
development
We have shown that the inhibition of fruit ripening in SlDML RNAi lines is correlated with
the hypermethylation of key genes controlling fruit ripening (Liu et al., 2015), and most likely of
many additional genes that contribute to the fruit ripening process. However, we have also observed
in some of the transgenic lines that developmental defects were not limited to fruit ripening. In line
2 and line 1 but also in additional lines (not shown) fruits presented an increased number of carpels
that was determined at very early stages during flower formation. Similarly we also observed leaves
of modified shapes that had lost the typical indentation of tomato leaves (lines 1, 2 and others). The
questions remains so far whether these developmental alterations affecting flowers and leaves
observed in the SlDML RNAi lines are also linked to the hypermethylation of specific genes? As a
first step, to answer this question, a transcriptomic analysis has been performed by RNA-SEQ on
leaves and flower, in order to identify genes which are differentially expressed in WT and
transgenic samples (data not shown). Unfortunately, very few genes were found that are
differentially regulated in transgenic plants compared to WT tissues, and most were related to stress.
Indeed this work has to be further developed. However, it will be necessary to analyze very specific
tissues of the meristems, as these developmental defects most likely occur very early. Using stem
apices and entire flowers might not allow to identify genes regulated by their methylation events
that are involved in these phenotypes as several different tissues with specific epigenetic states
were mixed. Tissue dissection will be necessary for that, and collaboration has been initiated with
Dr Z Lipman in order to achieve this. Recently, Satgé et al (2016) found that DEMETER
plays critical role for Medicago nodule development, there are around 400 DEGs were identified
and 474 regions were hypermethylated in MtDME mutant. These suggest the possible wide range
functions of demethylation in plants (Satgé et al., 2016).

Chapter 4
144
2- Characterization of the tomato SlDML2 protein
Arabidopsis DMLs proteins have been shown to function as DNA glycosylase-lyases, but the
activity of SlDML2 has not been successfully demonstrated yet. However, as pointed out in
chapter 2, the full length SlDML2 and its truncated forms are difficult to produce in bacteria. Both
the expression and the solubility of these proteins are low in E.coli. It will be very interesting to
figure out the optimized condition for this gene expression. To date, only in Arabidopsis was
developed a model which help DMLs recognize their targeted size (methylated CGs). DML
targeting seems to require additional protein, such as Methyl-CpG-binding domain (MBD) proteins,
histone acetyltransferase IDM1 and the alpha-crystallin domain proteins IDM2 and IDM3 (Lang
et al., 2015). However, how DMLs recognize their targets in still unknown. The tomato system
may provide the tools necessary to decipher the mechanisms of DML targeting. Potential
demethylase targets have been identified by comparing gene expression patterns and the
association of genes with DMRs. This will be confirmed when the methylome data of the DML
RNAi lines will be available. In addition, we have generated lines that overexpress a tagged
SlDML2 protein which may now be used for ChIP experiments, aiming at the identification of
SlDML2 binding sites in the genomic DNA. In addition, these lines could also be used to identify
possible partners for SlDML proteins in tomato fruits.
3- Analyses referring to more global, long-term perspectives
a. Increase DNA demethylation may enhance plant stress response
Firstly, the tomato SlDML RNAi plants could be used to study the function of SlDML in pathogens
response in tomato. It has been shown that under stress condition, DNA methylation status will
change. Moreover, Arabidopsis ros1 or triple mutant rdd increase susceptibility to pathogens due
to lack of RdDM-induced DNA demethylation at corresponding defense genes, suggesting the
primary function of demethylation under stress (Yu et al., 2013; Le et al., 2014). More recently,
Zhang et al (2016) found the loss of flavor and volatiles of tomato under chilling stress are
associated with the hypermethylation at the promoter of major ripening factor, such as RIN, NOR
and some volatile synthesis related genes were hypermethylated, suggesting an additional role for
DNA demethylation under stress (Zhang et al., 2016). In this study, we found a number of genes
related to biotic or abiotic stress were differentially expressed, such as genes in group 2 were
enriched with heat shock protein response to heat stress, this is consistent to the potential function
of DNA demethylation under stress condition. Therefore, we question, if overexpress SlDML2,
whether it is possible to enhance response to pathogens or other stress? In this condition, DML
RNAi mutant will be used as negative control. This study will give the hint of active DNA
demethylation on stress response in tomato under different stress conditions.
As has been proved in this report, the importance of repressing DNA demethylation genes
expression in plants is an efficient method to assess the functions of epigenetic marks in specific
developmental process, such as fruit ripening and vegetative development. Furthermore, the
research on epigenetic might break out the traditional bottlenecks to prove especially useful for
Chapter 4
145
quality improvement in plants such as the domesticated soybean, wheat, etc (Ecker, 2013). In a
word, the main outcome of this study is the realization that the identification of epigenetic variation
in genes that encode economically important plant traits that might provide an important new
resource for creating improved crop varieties. Indeed using tomato DMLs as a way to target
specific epigenetic modifications in the tomato genomes (epigenome editing) could provide an
innovative way to breeders to create new characteristics following the formation of chosen epialles.

Materials and Methods
Materials and methods
147
Chapter 2
Vector construction and protein purification
1) The construct was inserted into the PET300 expression vector to add a polyhistindine (His6)
Tag at the N-terminus of recombinant protein;
2) Expression of recombinant proteins was carried out in E.coli (Rosetta2 strain, DE3) cells;
3) A fresh single transformant colony was inoculated into 10ml of LB medium containing
ampicillin 100ug/ml and chloramphenicol (34ug/ml), and incubated at 37°C, overnight;
4) A 2.5ml aliquot of the overnight culture was incubated into 250ml of LB medium containing
containing ampicillin 100ug/ml and chloramphenicol (34ug/ml), and incubated at 37°C, 250rpm,
until OD600 was 0.1;
5) The culture was placed at 23°C and incubated until OD600 was 0.7, expression was induced by
adding isopropyl-1-thio-b-D galactopyranoside (IPTG) to 1mM and incubating for 3h;
6) After induction, cells were collected by centrifugation at 13000g for 30min and the pellet frozen
at -80°C;
7) The stored pellet was thawed and resuspended in 3.5ml sonication buffer (SB: 20mM Tris-HCl
PH8.0, 500mM NaCl, 20% glycerol, 15mM b-mercaptoethanol, 1% Tween-20) supplemented with
5Mm imidazole. Cells were disrupted by sonication and lysate was clarified by centrifugation.
8) The supernatant was loaded onto a Ni2+- sepharose column (Qiagen) prequilibrated with SB
buffer supplemented with 5mM imidazole, followed by 10ml of SB supplemented with 100mM
imidazole. Proteins were eluted with a 30ml gradient of imidazole (100mM to 1M) in SB and
collected in 0.5ml fractions. An aliquot of each fraction was analyzed by SDS-PAGE and those
containing a single band of the overexpressed protein were polled.
9) Protein desalting and concentrated. To clean up the purified recombinant protein, PD-10
desalting kit (GE Healthcare) was used, after that protein was concentrated with centrifugal filter
devise (Amicon). Experiments were performed as protocols offered in kit.
Proceed to protein quantification using Bradford assay
10) In microplate using 200ul as a final volume;
11) For the standard curve: Use BSA (Promega 10mg/ml diluted to 1mg/ml), prepare 5 points: 0;
1; 2; 3; 5ug BSA (corresponding to 0, 1, 2, 3, 5 ul 1mg/ml solution), add 100ul Bradford;
12) For the samples: dilute 1/10th: 4ul + 96ul water + 100ul Bradford;
13) Read the absorbance and calculate the proteins concentrations.
14) To test solubility, analyzing 10ug sonication solution with soluble protein and also pellet on
SDS PAGE gel.
Enzyme activity test
15) Double strands preparation (substrates) and reaction

Materials and methods
148
5uM fluorescein-labelled strand 10ul and 10 uM unlabeled 10ul, put 95°C for 5min, then put in
room temperature to slowly cool down. The concentration of double substrates is 250fmol/ul.
Enzyme reaction, in a total reaction volume of 50ul , containing 20Nm substrates (1pmol), 22.5nM
purified protein (7ug/ul), 50mMTris-Hcl (1M), 1mMEDTA, 1mMDT, 0.1mg/ml BSA (10mg/ml),
these reaction mixture were incubated at 30°C for 2h. (MSPI was also incubated with reaction
mixture instead of recombinant protein as a positive control)
16) Reactions were stopped by adding 20mMEDTA, 0.6% sodium ddecylsulphate (SDS), and
0.5mg/ml proteinase K, and the mixtures were incubated at 37°C for 30min.
17) DNA was extracted with phenol: chloroform: isoamyl alcohol (25:24:1) and ethanol
precipitated at -20°C in the presence of 0.3mM Nacl and 16mg/ml glycogen;
18) Samples were resuspendend in 10ml 90% formamide and heated at 95°C for 5min;
19) Reaction products were separated in a 12% denaturing polyacrylamide gel containing 7M urea;
20) Fluorescein-labelled DNA was visualized using the blue fluorescence mode of the FLA-5100
imager.
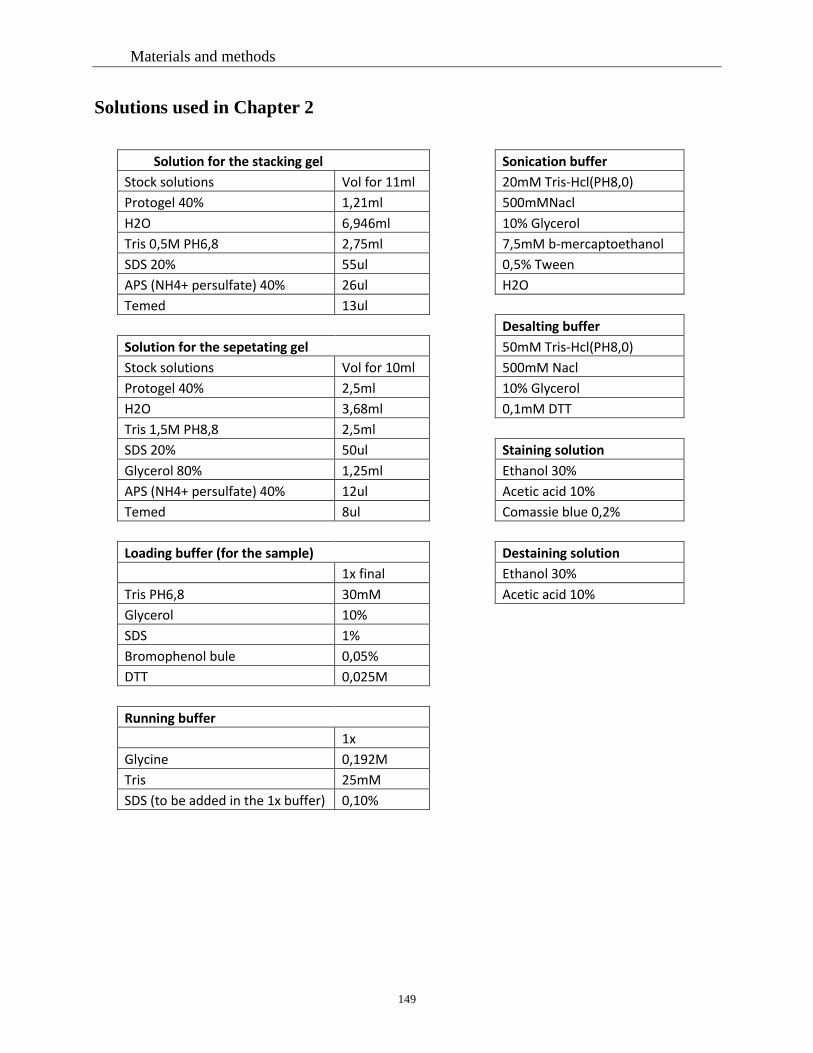
Materials and methods
149
Solutions used in Chapter 2
Solution for the stacking gel Sonication buffer
Stock solutions Vol for 11ml 20mM Tris-Hcl(PH8,0)
Protogel 40% 1,21ml 500mMNacl
H2O 6,946ml 10% Glycerol
Tris 0,5M PH6,8 2,75ml 7,5mM b-mercaptoethanol
SDS 20% 55ul 0,5% Tween
APS (NH4+ persulfate) 40% 26ul H2O
Temed 13ul
Desalting buffer
Solution for the sepetating gel 50mM Tris-Hcl(PH8,0)
Stock solutions Vol for 10ml 500mM Nacl
Protogel 40% 2,5ml 10% Glycerol
H2O 3,68ml 0,1mM DTT
Tris 1,5M PH8,8 2,5ml
SDS 20% 50ul Staining solution
Glycerol 80% 1,25ml Ethanol 30%
APS (NH4+ persulfate) 40% 12ul Acetic acid 10%
Temed 8ul Comassie blue 0,2%
Loading buffer (for the sample) Destaining solution
1x final Ethanol 30%
Tris PH6,8 30mM Acetic acid 10%
Glycerol 10%
SDS 1%
Bromophenol bule 0,05%
DTT 0,025M
Running buffer
1x
Glycine 0,192M
Tris 25mM
SDS (to be added in the 1x buffer) 0,10%
Materials and methods
150
Chapter 3
Plant material and Samples collection
All experiments were performed using a cherry tomato variety, Solanum lycopsersicum cv.
West Virginia 106 (cv WVA106) that was grown in greenhouse conditions as described on Liu et
al (2015).
For line 8, plant samples are those harvested in Liu et al (2015). For line 2 a new culture has
been performed in order to obtain a complete developmental series. The experimental plan was
designed as explained in chaper 1 (Liu et al., 2015b) to span tomato fruit development and ripening
in cv West Virginia 106 (WVA106) and transgenic DML RNAi plants over a period of 85 d from
fruit set to account for the strongly delayed ripening phenotype of the transgenic fruits. At stages
following mature green, the DML RNAi fruits diverge from the WT, because they are significantly
delayed in ripening induction and almost completely ripening. For all analysis, six plants, 3 for line
2X and 3 for line 2Y were used to harvest all fruit samples for metabolomics, transcriptomic and
WGBS analysis. Due to dramatic differences of the kinetic of fruit ripening, fruit s from WT and
line 2 plants identically staged, which allows comparing changes in the context of a developmental
parameter (days postanthesis) that can be precisely measured were manually harvested, dissected
and the pericarp was stored at -80°C following . Plants from line 2 and the relevant WT control
(WT1), fruits were harvested at 20, 35, 39 (Br), Br+7 (Red Ripe), 55 (Br + 16), 70 (Br + 31), and
85 (Br + 46) dpa. For all fruit samples, three individual T2 plants were used each being considered
as a biological replicate, and for each plant and time point, a minimum of six fruits were processed
and stored at −80 °C until used.
Metabolism data analysis
GC-MS Metabolite Analysis
The relative levels of metabolites of (58 identified metabolites in Line 2Y/2X, 64 metabolites
in line 8) were determined exactly as described in (Carrari et al., 2006). Each measurement was
performed in triplicate using one plant as a biological replicate using 50mg of lyoplylized powder.
1H-NMR Metabolite analysis
Absolute concentration of 34 metabolites for (Line 2Y, 2X and WT1) were performed as
described in chapter 2 (Liu et al., 2015). For line 8, results are those described in Chapter 1 (Liu et
al., 2015).
Carotenoid analysis and Starch analysis
Carotenoid analysis was done as described in chapter 2 (Liu et al., 2015) ; Starch was
determine in line 2 samples and relevant WT control using the enzymatic approach described in
(Hendriks et al., 2003). Experiments were performed in triplicates.

Materials and methods
151
Statistical test:
Tukey’s pairs test was performed on all identified metabolites. Differences between samples
were evaluated using an ANOVA and Tukey’s test (n=3, *: p<0.05.**: p<0.01; .***: p<0.001 );
PCA analysis of metabolites
All the data used for PCA and heatmap were normalized using the following formula: log2
[(value of each sample+1)/the average of all the samples in transgenic fruits and WT)], they were
performed using R software;
Clustering on metabolites
Metabolite clustering were use Multiple Experiment Viewer (MeV 4.9.0), clustering used
pearson with median value.
Visual Network Creation
Networks were constructed using Cytoscape software (Cline et al., 2007). Nodes are genes,
metabolites, and edges are the significant correlation between the nodes. The layout of the nodes
color is based on the positive or negative correlation between two metabolites.
RNA sequencing and Reads mapping
Strand-specific RNA sequencing libraries were prepared as previously described (Zhong et
al., 2011). All sequencing reactions were performed on GAIIx or HiSeq2000 according to the
manufacturer's instructions in the core facility of Cornell Weill Medical College.
Strand-specific RNA-Seq reads were first aligned to adaptor, ribosomal RNA and tRNA
sequences using Bowtie and allowing two mismatches (Langmead et al., 2009). The resulting
filtered reads were aligned to the tomato genome using Tophat and allowing one segment mismatch
(Trapnell et al., 2009). Methods are as described in Zhong et al., (2013). Experiments were
performed in collaboration with Dr N Gapper.
Identification of differentially expressed genes
To clean raw counts (filtered counts), one threshold was set before raw counts were
normalized. For each gene at each stage (including 3 biological replicates for each genotype), if
one sample row counts was ≤ 50 sample at each stage among all corresponding lines and replicates
(eg, 9 samples total of Line 2Y, 2X and WT1 at 20dpa, 6 samples total of Line8 and WT2 at 20dpa),
all counts number of this gene was considered as 0 at this stage.
To identify differentially expression genes during fruit development and ripening, the
expression data were first normalized by DESeq2 package in R (Love et al., 2014). Differentially
expressed genes were identified by pairwise sample comparisons, and the majority of genes were

Materials and methods
152
identified as differentially expressed when significantly different in at in at least one case. It worth
pointed out is, all the genes were considered as differentially expressed genes (DE genes) here only
if they fulfill the following croterai: (i) Padj ≤ 0.05 in at least one comparison; (ii) log2FC≥ |±1|
(FC= fold change of transgenic and WT) in at least one comparison.
Expression data analysis
Data for linear regression of independent cDNA libraries from the same or different time point
was based on genes that were expressed at least one sample, then the normalized data was
transformed by log10 (normalized counts+1).
Data for both Principal component analysis and hierarchical clustering was performed using
the differentially expressed genes (6212 DEGs) that were common between line 2 and line 8.
Normalized data were transformed using log2 (normalized counts+1). Expression Data for all
heatmaps and clustering were performed using the spearman method. All data analyses were
conducted with software R.
Gene Enrichment
Genes were functionally categorized based on previously defined Mapman bins (35
Categories). Overrepresentation was determined using software mefisto, and P values were
adjusted for multiple testing using Berfino correlation, therefore, only the over-representation
Padj<0.05 were considered as significant over-represented. (BINs; (Usadel et al., 2005)).
Primers used for qRT-PCR in Chapter 3
Solyc Name Primer Sequence 5'-3'
Solyc12g098710.1 ZISO ZISO-Q-FW ACTCATTGGAGAGCGTGCTT
ZISO-Q-RV AGTTCGTGAATCCCAGCAAC
Solyc05g050010.2 ACS4 ACS4-Q-FW AGCAATGCAGGGGTTTATTG
ACS4-Q-RV CCGAGCAATTGAACGAAGAT
Solyc10g080210.1 PG2a PG2a-Q-FW ACAAGTGCAACAAAGGTGGC
PG2a-Q-RV TTGCACGTAGCCTCTGATGG
Solyc01g095080.2 ACS2 ACS2-Q-FW TGGATGGATTTGCGTCCACT
ACS2-Q-RV CCACCCTGGCTCTTGACATT
Solyc05g012020.2 RIN RIN-Q-FW AACATCATGGCATTGTGGTG
RIN-Q-RV GTGTTGATGGTGCTGCATTT
Solyc10g006880.2 NOR NOR-Q-FW AGAGAACGATGCATGGAGGTTTGT
NOR-Q-RV ACTGGCTCAGGAAATTGGCAATGG
Solyc02g077920.2 CNR CNR-Q-FW GCCAAATCAAGCAATGATGA
CNR-Q-RV TCGCAACCATACAGACCATT
Solyc10g080210.1 PSY1 PSY1-Q-FW ATCTTTGGTCTTGTACCGCAAA
PSY1-Q-RV GGCAGTTTTTGTAGGAGGCACA
References
153
Chapter1_ References
Adhikari, S. and P. D. Curtis (2016). "DNA methyltransferases and epigenetic regulation in
bacteria." FEMS Microbiology Reviews.
Agius, F., et al. (2006). "Role of the Arabidopsis DNA glycosylase/lyase ROS1 in active DNA demethylation." Proceedings of the National Academy of Sciences 103(31): 11796-11801. Akimoto, K., et al. (2007). "Epigenetic Inheritance in Rice Plants." Annals of Botany 100(2):
205-217.
Avramova, Z. (2015). "Transcriptional 'memory' of a stress: transient chromatin and memory
(epigenetic) marks at stress-response genes." Plant J 83(1): 149-159.
Barry, C. S. and J. J. Giovannoni (2007). "Ethylene and Fruit Ripening." Journal of Plant
Growth Regulation 26(2): 143-159.
Bartley, G. E., et al. (1992). "A tomato gene expressed during fruit ripening encodes an
enzyme of the carotenoid biosynthesis pathway." Journal of Biological Chemistry 267(8): 5036-
5039.
Bastías, A., et al. (2011). "Modulation of organic acids and sugar content in tomato fruits by
an abscisic acid-regulated transcription factor." Physiologia Plantarum 141(3): 215-226.
Bauer, M. J. and R. L. Fischer (2011). "Genome demethylation and imprinting in the
endosperm." Current Opinion in Plant Biology 14(2): 162-167.
Bewick AJ, Schmitz RJ (2017). "Gene body DNA methylation in plants." Current Opinion
in Plant Biology 36:103-110.
Bharti, P., et al. (2015). "AtROS1 overexpression provides evidence for epigenetic regulation
of genes encoding enzymes of flavonoid biosynthesis and antioxidant pathways during salt stress
in transgenic tobacco." Journal of Experimental Botany 66(19): 5959-5969.
Bilichak, A. and I. Kovalchuk (2016). "Transgenerational response to stress in plants and its
application for breeding." Journal of Experimental Botany.
Borg, M. and F. Berger (2015). "Chromatin remodelling during male gametophyte
development." The Plant Journal 83(1): 177-188.
Bowman, G. D. and M. G. Poirier (2015). "Post-Translational Modifications of Histones That
Influence Nucleosome Dynamics." Chemical Reviews 115(6): 2274-2295.
Brummell, D. A. (2006). "PRIMARY CELL WALL METABOLISM DURING FRUIT
RIPENING." New Zealand Journal of Forestry Science 36(1): 99–111
Cao, X. and S. E. Jacobsen (2002). "Role of the Arabidopsis DRM Methyltransferases in De
Novo DNA Methylation and Gene Silencing." Current Biology 12(13): 1138-1144.
Cara, B. and J. J. Giovannoni (2008). "Molecular biology of ethylene during tomato fruit
development and maturation." Plant Science 175(1–2): 106-113.
Carrari, F., et al. (2006). "Integrated Analysis of Metabolite and Transcript Levels Reveals
the Metabolic Shifts That Underlie Tomato Fruit Development and Highlight Regulatory Aspects
of Metabolic Network Behavior." Plant Physiology 142(4): 1380-1396.

References
154
Castelletti, S., et al. (2014). "A MITE Transposon Insertion Is Associated with Differential
Methylation at the Maize Flowering Time QTL Vgt1." G3: Genes Genomes Genetics 4(5): 805-
812.
Cedar, H. and Y. Bergman (2009). "Linking DNA methylation and histone modification:
patterns and paradigms." Nat Rev Genet 10(5): 295-304.
Centeno, D. C., et al. (2011). "Malate Plays a Crucial Role in Starch Metabolism, Ripening,
and Soluble Solid Content of Tomato Fruit and Affects Postharvest Softening." The Plant Cell
23(1): 162-184.
Chan, S. W. L., et al. (2005). "Gardening the genome: DNA methylation in Arabidopsis
thaliana." Nat Rev Genet 6(5): 351-360.
Chen, W., et al. (2015). "Requirement of CHROMOMETHYLASE3 for somatic inheritance
of the spontaneous tomato epimutation Colourless non-ripening." Scientific Reports 5: 9192.
Cheng, C., et al. (2015). "Loss of function mutations in the rice chromomethylase OsCMT3a
cause a burst of transposition." The Plant Journal 83(6): 1069-1081.
Chinnusamy, V. and J.-K. Zhu (2009). "Epigenetic regulation of stress responses in plants."
Current Opinion in Plant Biology 12(2): 133-139.
Choi, K. and I. R. Henderson (2015). "Meiotic recombination hotspots – a comparative view."
The Plant Journal 83(1): 52-61.
Choi, Y., et al. (2002). "DEMETER, a DNA Glycosylase Domain Protein, Is Required for
Endosperm Gene Imprinting and Seed Viability in Arabidopsis." Cell 110(1): 33-42.
Colot, V. and J.-L. Rossignol (1999). "Eukaryotic DNA methylation as an evolutionary
device." BioEssays 21(5): 402-411.
Córdoba-Cañero, D., et al. (2011). "Arabidopsis ARP endonuclease functions in a branched
base excision DNA repair pathway completed by LIG1." The Plant Journal 68(4): 693-702.
Cubas, P., et al. (1999). "An epigenetic mutation responsible for natural variation in floral
symmetry." Nature 401(6749): 157-161.
DellaPenna, D., et al. (1989). "Transcriptional Analysis of Polygalacturonase and Other
Ripening Associated Genes in Rutgers, rin, nor, and Nr Tomato Fruit." Plant Physiology 90(4):
1372-1377.
Dnfna Mirona, M. P., et al. (2002). "Sucrose uptake, invertase localization and gene
expression in developing fruit of Lycopersicon esculentum and the sucrose-accumulating
Lycopersicon hirsutum." Plant Physiol 115(1):35-47.
Dowen, R. H., et al. (2012). "Widespread dynamic DNA methylation in response to biotic
stress." Proceedings of the National Academy of Sciences 109(32): E2183–E2191.
Du, J., et al. (2014). "Mechanism of DNA Methylation-Directed Histone Methylation by
KRYPTONITE." Molecular Cell 55(3): 495-504.
Du, J., et al. (2015). "DNA methylation pathways and their crosstalk with histone
methylation." Nat Rev Mol Cell Biol 16(9): 519-532.
Duan, C.-G., et al. (2015). "MET18 Connects the Cytosolic Iron-Sulfur Cluster Assembly
Pathway to Active DNA Demethylation in Arabidopsis." PLoS Genet 11(10): e1005559.

References
155
Dupont, C., et al. (2009). "Epigenetics: definition, mechanisms and clinical perspective."
Semin Reprod Med 27(5): 351-357.
Duymich, C. E., et al. (2016). "DNMT3B isoforms without catalytic activity stimulate gene
body methylation as accessory proteins in somatic cells." Nat Commun 7.
Ebbs, M. L. and J. Bender (2006). "Locus-Specific Control of DNA Methylation by the
Arabidopsis SUVH5 Histone Methyltransferase." The Plant Cell 18(5): 1166-1176.
Eda, M., et al. (2016). "Structural and functional analysis of tomato β-galactosidase 4: insight
into the substrate specificity of the fruit softening-related enzyme." The Plant Journal 86(4): 300-
307.
El-Sharkawy, I., et al. (2015). "Transcriptome analysis of an apple (Malus × domestica)
yellow fruit somatic mutation identifies a gene network module highly associated with anthocyanin
and epigenetic regulation." Journal of Experimental Botany 66(22): 7359-7376.
Finnegan, E. J., et al. (1996). "Reduced DNA methylation in Arabidopsis thaliana results in
abnormal plant development." Proceedings of the National Academy of Sciences of the United
States of America 93(16): 8449-8454.
Fraser, P. D., et al. (2009). "Genetic engineering of carotenoid formation in tomato fruit and
the potential application of systems and synthetic biology approaches." Archives of Biochemistry
and Biophysics 483(2): 196-204.
Gallusci, P., et al. (2016). "DNA methylation and chromatin regulation during fleshy fruit
development and ripening." Frontiers in Plant Science 7.
Garg, R., et al. (2015). "Divergent DNA methylation patterns associated with gene expression
in rice cultivars with contrasting drought and salinity stress response." Scientific Reports 5: 14922.
Gayacharan and A. J. Joel (2013). "Epigenetic responses to drought stress in rice (Oryza sativa
L.)." Physiology and Molecular Biology of Plants 19(3): 379-387.
Gehring, M., et al. (2009). "Extensive Demethylation of Repetitive Elements During Seed
Development Underlies Gene Imprinting." Science (New York, N.Y.) 324(5933): 1447-1451.
Gehring, M., et al. (2005). "DEMETER DNA Glycosylase Establishes MEDEA Polycomb
Gene Self-Imprinting by Allele-Specific Demethylation." Cell 124(3): 495-506.
Gent, J. I., et al. (2013). "CHH islands: de novo DNA methylation in near-gene chromatin
regulation in maize." Genome Research 23(4): 628-637.
Georgopoulos, K. (2002). "Haematopoietic cell-fate decisions, chromatin regulation and
ikaros." Nat Rev Immunol 2(3): 162-174.
Giovannoni, J. J. (2004). "Genetic Regulation of Fruit Development and Ripening." The Plant
Cell 16(suppl 1): S170-S180.
Giovannoni, J. J. (2007). "Fruit ripening mutants yield insights into ripening control." Current
Opinion in Plant Biology 10(3): 283-289.
Godoy, F., et al. (2013). "Galacturonosyltransferase 4 silencing alters pectin composition and
carbon partitioning in tomato." Journal of Experimental Botany 64(8): 2449-2466.
Gong, Z., et al. (2002). "ROS1, a Repressor of Transcriptional Gene Silencing in Arabidopsis,
Encodes a DNA Glycosylase/Lyase." Cell 111(6): 803-814.
References
156
Griffith, J. S. and H. R. Mahler (1969). "DNA ticketing theory of memory." Nature 223(5206):
580-582.
Holoch, D. and D. Moazed (2015). "RNA-mediated epigenetic regulation of gene expression."
Nat Rev Genet 16(2): 71-84.
Horie, Y., et al. (2009). "Participation of Chlorophyll b Reductase in the Initial Step of the
Degradation of Light-harvesting Chlorophyll a/b-Protein Complexes in Arabidopsis." The Journal
of Biological Chemistry 284(26): 17449-17456.
Hotchkiss, R. D. (1948). "THE QUANTITATIVE SEPARATION OF PURINES,
PYRIMIDINES, AND NUCLEOSIDES BY PAPER CHROMATOGRAPHY." Journal of
Biological Chemistry 175(1): 315-332.
Hsieh, T. F., et al. (2009). "Genome-wide demethylation of Arabidopsis endosperm." Science
324(5933): 1451-1454.
Hu, L., et al. (2014). "Mutation of a major CG methylase in rice causes genome-wide
hypomethylation, dysregulated genome expression, and seedling lethality." Proceedings of the
National Academy of Sciences 111(29): 10642-10647.
Ibarra, C. A., et al. (2012). "Active DNA Demethylation in Plant Companion Cells Reinforces
Transposon Methylation in Gametes." Science 337(6100): 1360-1364.
Iwasaki, M. and J. Paszkowski (2014). "Epigenetic memory in plants." The EMBO Journal
33(18): 1987-1998.
Jacobsen, S. E. and E. M. Meyerowitz (1997). "Hypermethylated SUPERMAN Epigenetic
Alleles in Arabidopsis." Science 277(5329): 1100-1103.
Jacobsen, S. E., et al. (2000). "Ectopic hypermethylation of flower-specific genes in
Arabidopsis." Current Biology 10(4): 179-186.
Jenuwein, T. and C. D. Allis (2001). "Translating the Histone Code." Science 293(5532):
1074-1080.
Johnson, L. M., et al. (2007). "The SRA methyl-cytosine-binding domain links DNA and
histone methylation." Current biology: CB 17(4): 379-384.
Kahlau, S. and R. Bock (2008). "Plastid Transcriptomics and Translatomics of Tomato Fruit
Development and Chloroplast-to-Chromoplast Differentiation: Chromoplast Gene Expression
Largely Serves the Production of a Single Protein." The Plant Cell 20(4): 856-874.
Kankel, M. W., et al. (2003). "Arabidopsis MET1 Cytosine Methyltransferase Mutants."
Genetics 163(3): 1109-1122.
Karlova, R., et al. (2014). "Transcriptional control of fleshy fruit development and ripening."
Journal of Experimental Botany 65(16): 4527-4541.
Kinoshita, T., et al. (2004). "One-Way Control of FWA Imprinting in Arabidopsis Endosperm
by DNA Methylation." Science 303(5657): 521-523.
Klann, E. M., et al. (1996). "Antisense acid invertase (TIV1) gene alters soluble sugar
composition and size in transgenic tomato fruit." Plant Physiology 112(3): 1321-1330.
Klee, H. J. and J. J. Giovannoni (2011). "Genetics and Control of Tomato Fruit Ripening and
Quality Attributes." Annual Review of Genetics 45(1): 41-59.

References
157
Kohli, R. M. and Y. Zhang (2013). "TET enzymes, TDG and the dynamics of DNA
demethylation." Nature 502(7472): 472-479.
Kou, H. P., et al. (2011). "Heritable alteration in DNA methylation induced by nitrogen-
deficiency stress accompanies enhanced tolerance by progenies to the stress in rice (Oryza sativa
L.)." Journal of Plant Physiology 168(14): 1685-1693.
Kusaba, M., et al. (2007). "Rice NON-YELLOW COLORING1 Is Involved in Light-
Harvesting Complex II and Grana Degradation during Leaf Senescence." The Plant Cell 19(4):
1362-1375.
La, H., et al. (2011). "A 5-methylcytosine DNA glycosylase/lyase demethylates the
retrotransposon Tos17 and promotes its transposition in rice. Proceedings of the National Academy
of Sciences 108(37): 15498-15503.
Laird PW (2010). "Principles and challenges of genome-wide DNA methylation analysis."
Nat Rev Genet. 11: 191-203.
Lauria, M. and V. Rossi (2011). "Epigenetic control of gene regulation in plants." Biochimica
et Biophysica Acta (BBA) - Gene Regulatory Mechanisms 1809(8): 369-378.
Law, J. A., et al. (2013). "Polymerase-IV occupancy at RNA-directed DNA methylation sites
requires SHH1." Nature 498(7454): 385-389.
Law, J. A. and S. E. Jacobsen (2010). "Establishing, maintaining and modifying DNA
methylation patterns in plants and animals." Nat Rev Genet 11(3): 204-220.
Lee, J., et al. (2014). "AP endonucleases process 5-methylcytosine excision intermediates
during active DNA demethylation in Arabidopsis." Nucleic Acids Research 42(18): 11408-11418.
Li, Q., et al. (2015a). "RNA-directed DNA methylation enforces boundaries between
heterochromatin and euchromatin in the maize genome." Proceedings of the National Academy of
Sciences 112(47): 14728-14733.
Li, Y., et al. (2015b). "A DNA ligase required for active DNA demethylation and genomic
imprinting in Arabidopsis." Cell Res 25(6): 757-760.
Lindroth, A. M., et al. (2001). "Requirement of CHROMOMETHYLASE3 for Maintenance
of CpXpG Methylation." Science 292(5524): 2077-2080.
Lister, R., et al. (2008). "Highly Integrated Single-Base Resolution Maps of the Epigenome
in Arabidopsis." Cell 133(3): 523-536.
Liu, R., et al. (2015). "A DEMETER-like DNA demethylase governs tomato fruit ripening."
Proceedings of the National Academy of Sciences of the United States of America 112(34): 10804-
10809.
Liu, M., et al. (2015)b. "Ethylene Control of Fruit Ripening: Revisiting the Complex Network
of Transcriptional Regulation." Plant Physiology 169(4): 2380-2390.
Lu, X., et al. (2015). "Genome-Wide Epigenetic Regulation of Gene Transcription in Maize
Seeds." PLoS ONE 10(10): e0139582.
Luger, K., et al. (1997). "Crystal structure of the nucleosome core particle at 2.8 A resolution."
Nature 389(6648): 251-260.

References
158
Luo, G.-Z., et al. (2015). "DNA N6-methyladenine: a new epigenetic mark in eukaryotes?"
Nat Rev Mol Cell Biol 16(12): 705-710.
Manning, K., et al. (2006). "A naturally occurring epigenetic mutation in a gene encoding an
SBP-box transcription factor inhibits tomato fruit ripening." Nat Genet 38(8): 948-952.
Mao, H., et al. (2015). "A transposable element in a NAC gene is associated with drought
tolerance in maize seedlings." Nature Communications 6: 8326.
Matzke, M. A. and R. A. Mosher (2014). "RNA-directed DNA methylation: an epigenetic
pathway of increasing complexity." Nat Rev Genet 15(6): 394-408.
Minoia, S., et al. (2016). "Induced mutations in tomato SlExp1 alter cell wall metabolism and
delay fruit softening." Plant Science 242: 195-202.
Mirouze, M. and C. Vitte (2014). "Transposable elements, a treasure trove to decipher
epigenetic variation: insights from Arabidopsis and crop epigenomes." Journal of Experimental
Botany. doi: 10.1093/jxb/eru120.
Miura, K., et al. (2009). "A metastable DWARF1 epigenetic mutant affecting plant stature in
rice." Proceedings of the National Academy of Sciences 106(27): 11218-11223.
Morales-Ruiz, T., et al. (2006). "DEMETER and REPRESSOR OF SILENCING 1 encode 5-
methylcytosine DNA glycosylases." Proceedings of the National Academy of Sciences 103(18):
6853-6858.
Moritoh, S., et al. (2012). "Targeted disruption of an orthologue of DOMAINS
REARRANGED METHYLASE 2, OsDRM2, impairs the growth of rice plants by abnormal DNA
methylation." The Plant Journal 71(1): 85-98.
Niederhuth, C. E., et al. (2016). "Widespread natural variation of DNA methylation within
angiosperms." Genome Biology 17(1): 1-19.
Nishiyama, A., et al. (2016). "Regulation of maintenance DNA methylation via histone
ubiquitylation." Journal of Biochemistry 159(1): 9-15.
Nogueira, M., et al. (2013). "Subchromoplast Sequestration of Carotenoids Affects
Regulatory Mechanisms in Tomato Lines Expressing Different Carotenoid Gene Combinations."
The Plant Cell 25(11): 4560-4579.
Ortega-Galisteo, A. P., et al. (2008). "Arabidopsis DEMETER-LIKE proteins DML2 and
DML3 are required for appropriate distribution of DNA methylation marks." Plant Molecular
Biology 67(6): 671-681.
Osorio, S., et al. (2013a). "Molecular Regulation of Fruit Ripening." Frontiers in Plant Science
4.
Osorio, S., et al. (2013b). "Alteration of the Interconversion of Pyruvate and Malate in the
Plastid or Cytosol of Ripening Tomato Fruit Invokes Diverse Consequences on Sugar But Similar
Effects on Cellular Organic Acid, Metabolism, and Transitory Starch Accumulation." Plant
Physiology 161(2): 628-643.
Ou, X., et al. (2012). "Transgenerational Inheritance of Modified DNA Methylation Patterns
and Enhanced Tolerance Induced by Heavy Metal Stress in Rice " PLoS ONE 7(9): e41143.
Penterman, J., et al. (2007a). "Genetic Interactions between DNA Demethylation and
Methylation in Arabidopsis." Plant Physiology 145(4): 1549-1557.

References
159
Penterman, J., et al. (2007b). "DNA demethylation in the Arabidopsis genome." Proceedings
of the National Academy of Sciences 104(16): 6752-6757.
Piccolo, F. M. and A. G. Fisher "Getting rid of DNA methylation." Trends in Cell Biology
24(2): 136-143.
Pinney, S. E. (2014). "Mammalian Non-CpG Methylation: Stem Cells and Beyond." Biology
3(4): 739-751.
Ponferrada-Marín MI., et al (2009). "ROS1 5-methylcytosine DNA glycosylase is a slow-
turnover catalyst that initiates DNAdemethylation in a distributive fashion." Nucleic Acids Res.
37(13):4264-74
Pružinská, A., et al. (2005). "Chlorophyll Breakdown in Senescent Arabidopsis Leaves.
Characterization of Chlorophyll Catabolites and of Chlorophyll Catabolic Enzymes Involved in the
Degreening Reaction." Plant Physiology 139(1): 52-63.
Qian, W., et al. (2012). "A Histone Acetyltransferase Regulates Active DNA Demethylation
in Arabidopsis." Science 336(6087): 1445-1448.
Roudier, F., et al. (2011). "Integrative epigenomic mapping defines four main chromatin states
in Arabidopsis." The EMBO Journal 30(10): 1928-1938.
Sato, Y., et al. (2009). "Two short-chain dehydrogenase/reductases, NON-YELLOW
COLORING 1 and NYC1-LIKE, are required for chlorophyll b and light-harvesting complex II
degradation during senescence in rice." The Plant Journal 57(1): 120-131.
Saze, H., et al. (2003). "Maintenance of CpG methylation is essential for epigenetic
inheritance during plant gametogenesis." Nat Genet 34(1): 65-69.
Schauer, N., et al. (2005). "Metabolic profiling of leaves and fruit of wild species tomato: a
survey of the Solanum lycopersicum complex." Journal of Experimental Botany 56(410): 297-307.
Schultz, M. D., et al. (2015). "Human Body Epigenome Maps Reveal Noncanonical DNA
Methylation Variation." Nature 523(7559): 212-216.
Seymour, G. B., et al. (2013). "Regulation of ripening and opportunities for control in tomato
and other fruits." Plant Biotechnology Journal 11(3): 269-278.
Shen, X., et al. (2014). "Natural CMT2 Variation Is Associated With Genome-Wide
Methylation Changes and Temperature Seasonality." PLoS Genet 10(12): e1004842.
Slotkin, R. K., et al. (2009). "Epigenetic reprogramming and small RNA silencing of
transposable elements in pollen." Cell 136(3): 461-472.
Smith, D. L., et al. (2002). "Down-Regulation of Tomato β-Galactosidase 4 Results in
Decreased Fruit Softening." Plant Physiology 129(4): 1755-1762.
Soppe, W. J. J., et al. (2000). "The Late Flowering Phenotype of fwa Mutants Is Caused by
Gain-of-Function Epigenetic Alleles of a Homeodomain Gene." Molecular Cell 6(4): 791-802.
Sorrequieta, A., et al. (2010). "Free amino acid production during tomato fruit ripening: a
focus on l-glutamate." Amino Acids 38(5): 1523-1532.
Springer, N. M., et al. (2016). "Creating Order from Chaos: Epigenome Dynamics in Plants
with Complex Genomes." The Plant Cell 28(2): 314-325.

References
160
Stroud, H., et al. (2014). "Non-CG methylation patterns shape the epigenetic landscape in
Arabidopsis." Nat Struct Mol Biol 21(1): 64-72.
Takayama, M. and H. Ezura (2015). "How and why does tomato accumulate a large amount
of GABA in the fruit?" Frontiers in Plant Science 6. http://dx.doi.org/10.3389/fpls.2015.00612.
Tan, F., et al. (2016). "The ortholog of DDM1 is mainly required for CHG and CG
methylation of heterochromatin and is involved in DRM2-mediated CHH methylation that targets
mostly genic regions of the rice genome." Plant Physiology. doi: http://dx.doi.org/10.1104/pp.16.
00393.
Tanaka, A., et al. (1998). "Chlorophyll a oxygenase (CAO) is involved in chlorophyll b
formation from chlorophyll a." Proceedings of the National Academy of Sciences of the United
States of America 95(21): 12719-12723.
Tanaka, A. and R. Tanaka (2006). "Chlorophyll metabolism." Current Opinion in Plant
Biology 9(3): 248-255.
Telias, A., et al. (2011). "Apple skin patterning is associated with differential expression of
MYB10." BMC Plant Biology 11(1): 1-15.
Teyssier, E., et al. (2008). "Tissue dependent variations of DNA methylation and
endoreduplication levels during tomato fruit development and ripening." Planta 228(3): 391.
Tohge, T., et al. (2014). "On the regulation and function of secondary metabolism during fruit
development and ripening." Journal of Experimental Botany 65(16): 4599-4611.
Uluisik, S., et al. (2016). "Genetic improvement of tomato by targeted control of fruit
softening." Nat Biotech 34(9): 950-952.
Waddington C.H. (1942). Endeavour, 1: 18-20.
Waddington C.H. (1968). “Towards a Theoretical Biology.” Nature ,218 :525-527.
Wang, C., et al. (2015). "Methyl-CpG-Binding Domain Protein MBD7 Is Required for Active
DNA Demethylation in Arabidopsis." Plant Physiology 167(3): 905-914.
Wei, L., et al. (2014). "Dicer-like 3 produces transposable element-associated 24-nt siRNAs
that control agricultural traits in rice." Proceedings of the National Academy of Sciences 111(10):
3877-3882.
West, P. T., et al. (2014). "Genomic Distribution of H3K9me2 and DNA Methylation in a
Maize Genome." PLoS ONE 9(8): e105267.
Williams, B. P., et al. (2015). "Methylation-Sensitive Expression of a DNA Demethylase
Gene Serves As an Epigenetic Rheostat." PLoS Genet 11(3): e1005142.
Wöhrmann, H. J. P., et al. (2012). "Identification of a DNA methylation-independent
imprinting control region at the Arabidopsis MEDEA locus." Genes & Development 26(16): 1837-
1850.
Wu, S. C. and Y. Zhang (2010). "Active DNA demethylation: many roads lead to Rome."
Nature reviews. Molecular cell biology 11(9): 607-620.
Xiao, W., et al. (2003). "Imprinting of the MEAPolycomb Gene Is Controlled by Antagonism
between MET1 Methyltransferase and DME Glycosylase." Developmental Cell 5(6): 891-901.

References
161
Xu, W., et al. (2016). "Genomic DNA Methylation Analyses Reveal the Distinct Profiles in
Castor Bean Seeds with Persistent Endosperms." Plant Physiology 171(2): 1242-1258.
Yamamuro, C., et al. (2014). "Overproduction of stomatal lineage cells in Arabidopsis
mutants defective in active DNA demethylation." Nat Commun 5.
Yang, D.-L., et al. (2016). "Dicer-independent RNA-directed DNA methylation in
Arabidopsis." Cell Res 26(1): 66-82.
Yang, H., et al. (2015). "Whole-genome DNA methylation patterns and complex associations
with gene structure and expression during flower development in Arabidopsis." The Plant Journal
81(2): 268-281.
Yu, A., et al. (2013). "Dynamics and biological relevance of DNA demethylation in
Arabidopsis antibacterial defense." Proceedings of the National Academy of Sciences 110(6):
2389-2394.
Zemach, A., et al. (2013). "The Arabidopsis Nucleosome Remodeler DDM1 Allows DNA
Methyltransferases to Access H1-Containing Heterochromatin." Cell 153(1): 193-205.
Zemach, A., et al. (2010). "Local DNA hypomethylation activates genes in rice endosperm."
Proceedings of the National Academy of Sciences 107(43): 18729-18734.
Zhang, H., et al. (2013a). "Imprinting in Plants and Its Underlying Mechanisms." Journal of
Genetics and Genomics 40(5): 239-247.
Zhang, H., et al. (2013b). "DTF1 is a core component of RNA-directed DNA methylation and
may assist in the recruitment of Pol IV." Proceedings of the National Academy of Sciences 110(20):
8290-8295.
Zhang, L., et al. (2012). "Identification and Characterization of an Epi-Allele of FIE1 Reveals
a Regulatory Linkage between Two Epigenetic Marks in Rice." The Plant Cell 24(11): 4407-4421.
Zhang, X., et al. (2015). "Epigenetic Mutation of RAV6 Affects Leaf Angle and Seed Size in
Rice." Plant Physiology 169(3): 2118-2128.
Zhang, X., et al. (2006). "Genome-wide High-Resolution Mapping and Functional Analysis
of DNA Methylation in Arabidopsis." Cell 126(6): 1189-1201.
Zhao, Y., et al. (2014). "REPRESSOR OF SILENCING5 Encodes a Member of the Small
Heat Shock Protein Family and Is Required for DNA Demethylation in Arabidopsis." The Plant
Cell 26(6): 2660-2675.
Zheng, X., et al. (2008). "ROS3 is an RNA-binding protein required for DNA demethylation
in Arabidopsis." Nature 455(7217): 1259-1262.
Zhong, S., et al. (2013). "Single-base resolution methylomes of tomato fruit development
reveal epigenome modifications associated with ripening." Nat Biotech 31(2): 154-159.
Zhou, M. and J. A. Law (2015). "RNA Pol IV and V in Gene Silencing: Rebel Polymerases
Evolving Away From Pol II’s Rules." Current Opinion in Plant Biology 27: 154-164.

References
162
Chapter 2_ References
Bellisle, F. (1999). "Glutamate and the UMAMI taste: sensory, metabolic, nutritional and
behavioural considerations. A review of the literature published in the last 10 years." Neuroscience
& Biobehavioral Reviews 23(3): 423-438.
Bemer, M., et al. (2012). "The Tomato FRUITFULL Homologs TDR4/FUL1 and
MBP7/FUL2 Regulate Ethylene-Independent Aspects of Fruit Ripening." The Plant Cell 24(11):
4437-4451.
Brummell, D. A., et al. (1999). "Modification of Expansin Protein Abundance in Tomato Fruit
Alters Softening and Cell Wall Polymer Metabolism during Ripening." The Plant Cell 11(11):
2203-2216.
Flors, V., et al. (2007). "Absence of the endo-β-1,4-glucanases Cel1 and Cel2 reduces
susceptibility to Botrytis cinerea in tomato." The Plant Journal 52(6): 1027-1040.
Ikeda, H., et al. (2016). "Dynamic Metabolic Regulation by a Chromosome Segment from a
Wild Relative During Fruit Development in a Tomato Introgression Line, IL8-3." Plant and Cell
Physiology 57(6): 1257-1270.
Minoia, S., et al. (2016). "Induced mutations in tomato SlExp1 alter cell wall metabolism and
delay fruit softening." Plant Science 242: 195-202.
Zhong, S., et al. (2013). "Single-base resolution methylomes of tomato fruit development
reveal epigenome modifications associated with ripening." Nat Biotech 31(2): 154-159.
Chapter 3_References
Carrari, F., et al. (2006). "Integrated Analysis of Metabolite and Transcript Levels Reveals
the Metabolic Shifts That Underlie Tomato Fruit Development and Highlight Regulatory Aspects
of Metabolic Network Behavior." Plant Physiology 142(4): 1380-1396.
Hendriks, J. H. M., et al. (2003). "ADP-Glucose Pyrophosphorylase Is Activated by
Posttranslational Redox-Modification in Response to Light and to Sugars in Leaves of Arabidopsis
and Other Plant Species." Plant Physiology 133(2): 838-849.
Lang, Z., et al. (2015). "The Methyl-CpG-Binding Protein MBD7 Facilitates Active DNA
Demethylation to Limit DNA Hyper-Methylation and Transcriptional Gene Silencing." Molecular
Cell 57(6): 971-983.

References
163
Langmead, B., et al. (2009). "Ultrafast and memory-efficient alignment of short DNA
sequences to the human genome." Genome Biology 10(3): 1-10.
Love, M. I., et al. (2014). "Moderated estimation of fold change and dispersion for RNA-seq
data with DESeq2." Genome Biology 15(12): 1-21.
Ong-Abdullah, M., et al. (2015). "Loss of Karma transposon methylation underlies the mantled somaclonal variant of oil palm." Nature 525(7570): 533-537.
Penterman, J., et al. (2007). "DNA demethylation in the Arabidopsis genome." Proceedings
of the National Academy of Sciences 104(16): 6752-6757.
Tang K., et al. (2016). '' The DNA demethylase ROS1 targets genomic regions with distinct
chromatin modifications.'' Nat Plants 2(11):16169.
Tang, X., et al. (2016). "Ubiquitin-conjugated degradation of golden 2-like transcription factor
is mediated by CUL4-DDB1-based E3 ligase complex in tomato." New Phytologist 209(3): 1028-
1039.
Trapnell, C., et al. (2009). "TopHat: discovering splice junctions with RNA-Seq."
Bioinformatics 25(9): 1105-1111.
Usadel, B., et al. (2005). "Extension of the Visualization Tool MapMan to Allow Statistical
Analysis of Arrays, Display of Coresponding Genes, and Comparison with Known Responses."
Plant Physiology 138(3): 1195-1204.
Zhang, B., et al. (2016). "Chilling-induced tomato flavor loss is associated with altered
volatile synthesis and transient changes in DNA methylation." Proceedings of the National
Academy of Sciences.
Zhong, S., et al. (2011). "High-Throughput Illumina Strand-Specific RNA Sequencing
Library Preparation." Cold Spring Harbor Protocols 2011(8): pdb.prot5652.
Copyright © 2022 FDOKUMEN