Active for Life
12
Active for Life Final Results from the Translation of Two Physical Activity Programs Sara Wilcox, PhD, Marsha Dowda, DrPH, Laura C. Leviton, PhD, Jenny Bartlett-Prescott, MS, Terry Bazzarre, PhD, Kimberly Campbell-Voytal, PhD, Ruth Ann Carpenter, MS, RD, Cynthia M. Castro, PhD, Diane Dowdy, PhD, Andrea L. Dunn, PhD, Sarah F. Griffin, PhD, Michele Guerra, MS, Abby C. King, PhD, Marcia G. Ory, PhD, Carol Rheaume, MSPH, Jocelyn Tobnick, MPH, Stacy Wegley, MS Background: Most evidence-based programs are never translated into community settings and thus never make a public health impact. Design: Active for Life (AFL) was a 4-year translational initiative using a pre–post, quasi- experimental design. Data were collected from 2003 to 2007. Analyses were conducted in 2005 and 2008. Setting/ participants: Nine lead organizations at 12 sites participated. Active Choices participants (n2503) averaged 65.8 years (80% women, 41% non-Hispanic white). Active Living Every Day (ALED) partici- pants (n3388) averaged 70.6 years (83% women, 64% non-Hispanic white). Intervention: In AFL, Active Choices was a 6-month telephone-based and ALED a 20-week group-based lifestyle behavior change program designed to increase physical activity, and both were grounded in social cognitive theory and the transtheoretical model. The interventions were evaluated in Years 1, 3, and 4. An adapted shortened ALED program was evaluated in Year 4. Main outcome measure: Moderate- to vigorous-intensity physical activity, assessed with the CHAMPS self-reported measure. Results: Posttest survey response rates were 61% for Active Choices and 70% for ALED. Significant increases in moderate- to vigorous-intensity physical activity, total physical activity, and satisfaction with body appearance and function, and decreases in BMI were seen for both programs. Depressive symptoms and perceived stress, both low at pretest, also decreased over time in ALED. Results were generally consistent across years and sites. Conclusions: Active Choices and ALED were successfully translated across a range of real-world settings. Study samples were substantially larger, more ethnically and economically diverse, and more representative of older adult’s health conditions than in efficacy studies, yet the magnitude of effect sizes were comparable. (Am J Prev Med 2008;35(4):340 –351) © 2008 American Journal of Preventive Medicine Introduction T ranslational studies focus on whether effective interventions work in real-world settings. 1–6 Their purpose is not only to examine whether evidence-based programs improve outcomes but also to understand how organizations implement these pro- grams to reach greater numbers of people, to examine the social and environmental influences on program delivery, and even to study how practitioners may adapt these programs to better suit their needs and the needs of their constituents. Translational studies are critical in understanding key issues related to the adoption and dissemination of effective programs. 7,8 From the University of South Carolina (USC), Department of Exercise Science (Wilcox, Dowda) and the USC Prevention Research Center (Rheaume), Columbia, South Carolina; the Robert Wood Johnson Foundation (Leviton, Bazzarre), Princeton, New Jersey; Church Health Center (Bartlett-Prescott), Memphis, Tennessee; the Department of Family Medicine and Public Health Sciences, Wayne State University (Campbell-Voytal), Detroit, Michigan; The Cooper Institute (Carpen- ter), Dallas, Texas; the Stanford University School of Medicine, Stanford Prevention Research Center (Castro), and the Department of Health Research & Policy (King), Stanford, California; Texas A&M Health Science Center, Department of Social and Behavioral Health (Dowdy, Ory), College Station, Texas; Klein-Buendel, Inc. (Dunn), Golden, Colorado; Clemson University (Griffin), Clemson, South Carolina; the University of Illinois at Urbana-Champaign, The Center on Health, Aging, and Disability (Guerra), Champaign, Illinois; The OASIS Institute (Tobnick), St. Louis, Missouri; and the Council on Aging of Southwestern Ohio (Wegley), Cincinnati, Ohio Address correspondence and reprint requests to: Sara Wilcox, PhD, Department of Exercise Science, Arnold School of Public Health, University of South Carolina, 921 Assembly Street, PHRC 3rd Floor, Columbia SC 29208. E-mail: [email protected]. The full text of this article is available via AJPM Online at www.ajpm-online.net; 1 unit of Category-1 CME credit is also avail- able, with details on the website. 340 Am J Prev Med 2008;35(4) 0749-3797/08/$–see front matter © 2008 American Journal of Preventive Medicine • Published by Elsevier Inc. doi:10.1016/j.amepre.2008.07.001
-
Upload
independent -
Category
Documents
-
view
1 -
download
0
Transcript of Active for Life
AFSTDM
B
D
Sp
I
Mom
R
C
I
Teu
FS(FCF(tSoH(
3
ctive for Lifeinal Results from the Translation of Two Physical Activity Programs
ara Wilcox, PhD, Marsha Dowda, DrPH, Laura C. Leviton, PhD, Jenny Bartlett-Prescott, MS,erry Bazzarre, PhD, Kimberly Campbell-Voytal, PhD, Ruth Ann Carpenter, MS, RD, Cynthia M. Castro, PhD,iane Dowdy, PhD, Andrea L. Dunn, PhD, Sarah F. Griffin, PhD, Michele Guerra, MS, Abby C. King, PhD,arcia G. Ory, PhD, Carol Rheaume, MSPH, Jocelyn Tobnick, MPH, Stacy Wegley, MS
ackground: Most evidence-based programs are never translated into community settings and thus nevermake a public health impact.
esign: Active for Life (AFL) was a 4-year translational initiative using a pre–post, quasi-experimental design. Data were collected from 2003 to 2007. Analyses were conducted in2005 and 2008.
etting/articipants:
Nine lead organizations at 12 sites participated. Active Choices participants (n�2503) averaged65.8 years (80% women, 41% non-Hispanic white). Active Living Every Day (ALED) partici-pants (n�3388) averaged 70.6 years (83% women, 64% non-Hispanic white).
ntervention: In AFL, Active Choices was a 6-month telephone-based and ALED a 20-week group-basedlifestyle behavior change program designed to increase physical activity, and both weregrounded in social cognitive theory and the transtheoretical model. The interventions wereevaluated in Years 1, 3, and 4. An adapted shortened ALED program was evaluated in Year 4.
ainutcomeeasure:
Moderate- to vigorous-intensity physical activity, assessed with the CHAMPS self-reportedmeasure.
esults: Posttest survey response rates were 61% for Active Choices and 70% for ALED. Significantincreases in moderate- to vigorous-intensity physical activity, total physical activity, andsatisfaction with body appearance and function, and decreases in BMI were seen for bothprograms. Depressive symptoms and perceived stress, both low at pretest, also decreasedover time in ALED. Results were generally consistent across years and sites.
onclusions: Active Choices and ALED were successfully translated across a range of real-world settings.Study samples were substantially larger, more ethnically and economically diverse, andmore representative of older adult’s health conditions than in efficacy studies, yet themagnitude of effect sizes were comparable.(Am J Prev Med 2008;35(4):340–351) © 2008 American Journal of Preventive Medicine
gtdtoid
GCoOA
PHF
ntroduction
ranslational studies focus on whether effectiveinterventions work in real-world settings.1–6
Their purpose is not only to examine whethervidence-based programs improve outcomes but also tonderstand how organizations implement these pro-
rom the University of South Carolina (USC), Department of Exercisecience (Wilcox, Dowda) and the USC Prevention Research CenterRheaume), Columbia, South Carolina; the Robert Wood Johnsonoundation (Leviton, Bazzarre), Princeton, New Jersey; Church Healthenter (Bartlett-Prescott), Memphis, Tennessee; the Department ofamily Medicine and Public Health Sciences, Wayne State UniversityCampbell-Voytal), Detroit, Michigan; The Cooper Institute (Carpen-er), Dallas, Texas; the Stanford University School of Medicine,tanford Prevention Research Center (Castro), and the Departmentf Health Research & Policy (King), Stanford, California; Texas A&M
ealth Science Center, Department of Social and Behavioral HealthDowdy, Ory), College Station, Texas; Klein-Buendel, Inc. (Dunn),wa
40 Am J Prev Med 2008;35(4)© 2008 American Journal of Preventive Medicine • Publish
rams to reach greater numbers of people, to examinehe social and environmental influences on programelivery, and even to study how practitioners may adapthese programs to better suit their needs and the needsf their constituents. Translational studies are critical
n understanding key issues related to the adoption andissemination of effective programs.7,8
olden, Colorado; Clemson University (Griffin), Clemson, Southarolina; the University of Illinois at Urbana-Champaign, The Centern Health, Aging, and Disability (Guerra), Champaign, Illinois; TheASIS Institute (Tobnick), St. Louis, Missouri; and the Council onging of Southwestern Ohio (Wegley), Cincinnati, OhioAddress correspondence and reprint requests to: Sara Wilcox,
hD, Department of Exercise Science, Arnold School of Publicealth, University of South Carolina, 921 Assembly Street, PHRC 3rd
loor, Columbia SC 29208. E-mail: [email protected] full text of this article is available via AJPM Online at
ww.ajpm-online.net; 1 unit of Category-1 CME credit is also avail-ble, with details on the website.
0749-3797/08/$–see front mattered by Elsevier Inc. doi:10.1016/j.amepre.2008.07.001
cpbmctsmrttemso
WtiaeetatDpp
oywlst
1
2
3
4
M
P
Idot
tcampprs
fimpstrtcfcbhmb
vactiifipaseui(iram
L
OaCtoiAfwAatswAf
O
The Task Force on Community Preventive Servicesoncluded that individually adapted behavior changerograms (which can include telephone-delivered, group-ased, and other program formats) are a strongly recom-ended approach for promoting physical activity in
ommunities.9 The essential components of these in-erventions include strategies such as realistic goaletting, identification of barriers, problem solving, self-onitoring (tracking), and provision of feedback and
einforcement.9,10 Furthermore, a recent review ofelephone-based interventions for promoting physical ac-ivity and dietary change concluded that there is a solidvidence base to support the efficacy of this deliveryethod; however, the authors recommended that more
tudies be conducted to examine broader disseminationf this approach into population health practice.11
Active for Life (AFL), an initiative of the Robertood Johnson Foundation, was one of the first na-
ional studies to examine whether evidence-based phys-cal activity programs could reach large numbers ofdults aged �50 years, have similar impacts to earlierfficacy studies, and be sustained over time withinxisting community or clinical settings.5,12 Results fromhe first year of the study found that the two physicalctivity programs tested—Active Choices, a 6-monthelephone-delivered program; and Active Living Everyay (ALED), a 20-week group-based program—increasedhysical activity with effects comparable to results re-orted in the initial efficacy studies.13
The AFL initiative has accrued three additional yearsf experience (outcome data collected in two of theseears). The purpose of this paper is to expand priorork by examining results over multiple years. The
arger sample permits a more rigorous examination ofeveral questions about the programs that are vital forranslational research:
. How do the characteristics of program participantsdiffer across study years?
. How effective are the programs in increasing phys-ical activity and improving related outcomes forolder adults?
. How consistent are effect sizes over time and set-tings as different cohorts of study participants un-dergo the same intervention?
. What is the impact of making a substantial site-initiated modification of one of the programs (i.e.,shortening ALED from a 20-week to a 12-weekprogram)?
ethods
rogram Overviews
n the AFL initiative, Active Choices was a 6-month programelivered through one face-to-face meeting and up to eightne-on-one telephone counseling calls.14–17 During the face-
o-face meeting, the health educator established rapport with sctober 2008
he participant and covered key programmatic material in-luding a review of program expectations; the formulation ofphysical activity plan and goals; a discussion of interests,otivation, perceived benefits, and perceived barriers to
hysical activity; and a discussion of exercise safety. Partici-ants were given an exercise log, a pedometer, and a localesource guide of physical activity programs. Finally, a callchedule was established.
Participants then received biweekly telephone calls for therst 2 months and monthly telephone calls for the next 4onths. Counseling was tailored to the person’s readiness for
hysical activity change18 and emphasized key constructs inocial cognitive theory.19 During each call, the health educa-or inquired about potential changes in health and exercise-elated injuries. Next, the participant’s physical activity sincehe last call was discussed (focusing on days, minutes, and stepounts) as well as the participant’s current stage of readinessor change. Based on this information, the health educatorhose cognitive and behavioral topics for discussion (e.g.,arriers/benefits, goal-setting, self-monitoring). Finally, theealth educator assessed whether the participant wished toodify activity goals. Health educators could send tip sheets
ased on call content.Active Living Every Day is a 20-week physical activity inter-
ention delivered in a small-group setting. The curriculum isdissemination version of Project Active,20,21 a randomized
linical trial that incorporated constructs from social cogni-ive theory19 and the transtheoretical model18 to help partic-pants accumulate a minimum of 30 minutes of moderate-ntensity physical activity on most days of the week. After therst 3 years, the lead organizations requested that therogram be shortened to 12 weeks to enhance recruitmentnd foster partnerships with organizations that offeredhorter programs. The shortened program maintained itsssential elements by: (1) eliminating elements not beingsed, (2) eliminating or making optional material and activ-
ties not directly related to the program essential elements,3) combining related topics that were previously addressedn separate sessions, (4) decreasing the amount of review andeinforcement of lifestyle skills covered in multiple sessions,nd (5) extending the length of each session from 60 to 90inutes.
ead Organizations and Intervention Staff
rganizations responded to a competitive request for propos-ls. Prior to being selected, they chose the program (Activehoices or ALED) that they thought best suited the needs of
heir organization and community. Of the nine funded leadrganizations, four selected the Active Choices program and
mplemented it at five distinct sites, and five selected theLED program and implemented it at seven distinct sites
rom 2003 through 2007. Organizations are reported else-here13 and are listed at the end of this article. Initially,ctive Choices staff at lead organizations was trained andpproved by program developers. These staff became train-he-trainers and trained and approved their own staff. ALEDtaff was trained via online modules and a face-to-face orebcast workshop and certified by Human Kinetics. At severalLED sites, former participants became paid or volunteer
acilitators.Program developers provided programmatic technical as-
istance as needed. The AFL National Program Office also
Am J Prev Med 2008;35(4) 341

pmdtNpaitrUtMimrof
P
Psmttdicdu(pmsTsrtdnSar
D
Tcwesctspgps
ppd
cdv
itpSatasrct
eapapp
ptYstA1ppcawdyc
M
Srghr
P4Srooamaislchp
3
rovided technical assistance for program marketing, recruit-ent, budget management, and sustainability planning. A
etailed process evaluation tracked intervention fidelity andhe use of technical assistance. Program developers, theational Program Office, and the organizations receivedrocess evaluation feedback to help ensure that programdaptations were appropriate and did not compromise fidel-ty to essential elements of the programs. A paper describinghe process evaluation and major findings is currently undereview (SF Griffin, University of South Carolina & Clemsonniversity, unpublished findings, 2008). Each lead organiza-
ion aimed to recruit 100 participants in Year 1 (beginningarch 2003); 200 participants in Year 2; and 300 participants
n both Years 3 and 4. The lead organization tailored recruit-ent strategies to the communities it targeted (strategies
eported elsewhere13). Over the 4 years, organizations reliedn a similar set of recruitment strategies but became moreocused and targeted.
articipants
articipants had to be aged �50 years (no upper limit);edentary or under-active (i.e., �2 days/week and �120inutes/week); and free of medical conditions or disabilities
hat required higher levels of supervision, as determined byhe lead organization. Each lead organization was required toesign and implement a risk management strategy that
ncluded risk assessment, participant education, and health-are provider involvement as appropriate (prior to anduring the program). All organizations were encouraged tose the revised Physical Activity Readiness QuestionnairePAR-Q)22 for risk assessment. All organizations educatedarticipants on risks of physical activity and methods toinimize risks (e.g., start low and go slow) and included
afety tips and information on warning signs and symptoms.his approach is associated with few adverse events.23 At two
ites, participants with risks based on PAR-Q items wereequired to obtain written medical approval before startinghe program. At the other sites, participants were advised toiscuss these risks with their healthcare provider, but wereot routinely required to obtain written medical approval.ite directors had the discretion to require medical approvalnd were responsible for approving and overseeing theisk-management procedures.
esign and Procedure
he evidence supporting the efficacy of Active Choi-es14–16,24–26 and ALED20,21 comes from rigorous RCTs. AFLas designed to study research to practice translation byxamining whether the magnitude of effects in communityettings were comparable to what has been reported inontrolled research settings and to examine the representa-iveness (or reach) of the sample (see Estabrooks and Gyurc-ik27 for a discussion of the evaluation of translationalrojects). The study was not designed to compare the pro-rams. Thus, a pre–post design was used, and the study wasowered to examine change over time in each programeparately.
Study data were collected from 2003 to 2007. All partici-ants completed an informed consent form that was ap-roved by the two university IRBs and review boards or legal
epartments of the lead organizations. Participants then i42 American Journal of Preventive Medicine, Volume 35, Num
ompleted a brief questionnaire that collected personal andemographic information followed by a comprehensive sur-ey in Year 1.
Although sites recruited participants and delivered thentervention in Year 2, outcome data were not collected sohat the evaluation team could analyze Year-1 findings andlan for modifications to the evaluation in the final 2 years.ample size calculations indicated that it was not necessary forll participants to complete primary outcome measures. Athe same time, we wanted to know how participants comparedcross time. Thus, a short survey was developed to collecteveral key outcomes more efficiently. In Years 3 and 4 weequested a priori that the first 100 participants per siteomplete the comprehensive survey and the remaining par-icipants complete the short survey.
In Year 4 of the study, the 12-week adaptation to ALED wasvaluated. ALED participants completed a pretest and a 12-nd 20-week posttest survey. The length and format of theretest and the 20-week posttest surveys were as describedbove; however, to reduce burden for the sites and partici-ants, the 12-week survey was a short survey for allarticipants.At Active Choices sites posttest surveys were sent directly to
articipants, along with postage paid envelopes, 2 weeks prioro the scheduled program end date. The same was true forear 1 of ALED except that one site administered the posttesturvey in sessions 19 or 20. In Year 3, ALED sites administeredhe posttest survey in sessions 19 or 20. In Year 4, the 12-weekLED posttest survey was administered by all sites in sessions1 or 12 and the 20-week posttest survey was sent directly toarticipants with a postage-paid envelope. Participants notresent during ALED sessions were sent the posttest survey toomplete and return. For both programs, postcard remindersnd a second survey were sent to nonresponders. Participantsho returned their pretest and/or posttest survey entered arawing for $20 gift cards to a local retail store. After the firstear of the study, one site elected not to participate in the giftard drawing.
easures
ociodemograhics and health-related variables. Participantseported their date of birth; race; ethnicity; marital status;ender; years of formal education; income (long survey only);eight and weight (to compute BMI28 in kg/m2); healthating; and presence of chronic health conditions.29
hysical activity. The comprehensive survey contained the1-item Community Healthy Activities Model Program foreniors (CHAMPS) physical activity measure.30 This self-eport measure includes activities typically undertaken bylder adults for exercise, activities undertaken in the coursef their day that are physical in nature, and recreationalctivities that provide physical activity. Minutes/week spent inoderate- and vigorous-intensity physical activity (MVPA)
nd in light-, moderate-, and vigorous-intensity physical activ-ty (total physical activity) were derived. The CHAMPS hastrong psychometric properties, including demonstrated va-idity,31 test–retest reliability,31 and sensitivity tohange.16,17,30,32,33 MVPA and total physical activity wereighly positively skewed at pretest and somewhat skewed atosttest. A square root transformation successfully normal-
zed these variables. A secondary three-item measure29 as-
ber 4 www.ajpm-online.net
spmaa
DtDqd
P4sds
Bt(7st
S
A2(idaMsBMrmsaaBa
AfcrFadmcs
spcEa
ao
R
Ai
D
Awtas(
wbmtytY
fa4esyhaw41h
AP
A1rbIptprmsAm$rsdw
O
essed participation, frequency, and duration of MVPA in allarticipants in order to classify participants as sedentary (�10in/wk); regularly active (�30 min/d, �5 d/wk); or under-
ctive (not meeting criteria for sedentary or regularlyctive).34
epressive symptoms. The comprehensive survey includedhe widely used 10-item Center for Epidemiological Studiesepression Scale (CES-D).35–37 Participants rated the fre-uency with which they experienced symptoms of depressionuring the past week.
erceived stress. The comprehensive survey included a-item version of the Perceived Stress Scale,38,39 an exten-ively used questionnaire that was designed to measure theegree to which situations in one’s life are appraised astressful.
ody satisfaction. Participants rated their satisfaction overhe past 4 weeks with nine aspects of body appearancecomprehensive survey) and function (both surveys) on a-point scale. Two subscales were derived from factor analy-is40: satisfaction with body appearance (3 items) and satisfac-ion with body function (6 items).
tatistical Analyses
ll analyses that refer to a bi-directional distribution used-sided p values. Statistical analyses were conducted in 2005Year-1 data) and 2008. Chi-square analyses tested differencesn categoric baseline variables across years. ANOVAs testedifferences in continuous baseline variables across years. Toddress changes from pretest to posttest in hours/week ofVPA, total physical activity, depressive symptoms, perceived
tress, satisfaction with body function and appearance, andMI, repeated measures ANCOVAs (using SAS PROCIXED) were conducted that controlled for site clustering;
ace (non-Hispanic white, black, Latino, or other ethnicinority); gender; BMI; health rating; and education (high
chool or fewer years versus some college or college gradu-te). SAS PROC GLIMMIX, controlling for the same covari-tes, assessed change in the dichotomous outcome variable.oth types of analyses use a likelihood-based approach toccommodate data missing at random.
Participants were recruited from five geographic sites forctive Choices and seven geographic sites for ALED; there-
ore, all change analyses took into account this site-levellustering and had 4 and 6 degrees of freedom (N – 1),espectively. Two types of change analyses were conducted.irst, changes among participants were examined using allvailable data (i.e., no imputations were made for missingata). Second, because there is no control group in AFL,ore conservative analyses were conducted and assumed no
hange in outcomes among those who did not return posttesturveys by carrying forward baseline values.
An effect size (d�[posttest mean – pretest mean] / pretesttandard deviation) was computed for each continuous de-endent variable using means that were adjusted for sitelustering, race, gender, BMI, health rating, and education.41
ffect sizes of d�0.2 were considered small, d�0.5 medium,nd d�0.8 large.42
In order to examine consistency in outcomes across sites,nalyses were also conducted for each site separately if the
verall effect was significant for continuous variables. tctober 2008
esults
ll Year-1 results were published elsewhere13 but arencluded in this manuscript to show data across years.
escription of the Sample
cross years (not including Year 2), 2503 and 3388ere enrolled into Active Choices and ALED, respec-
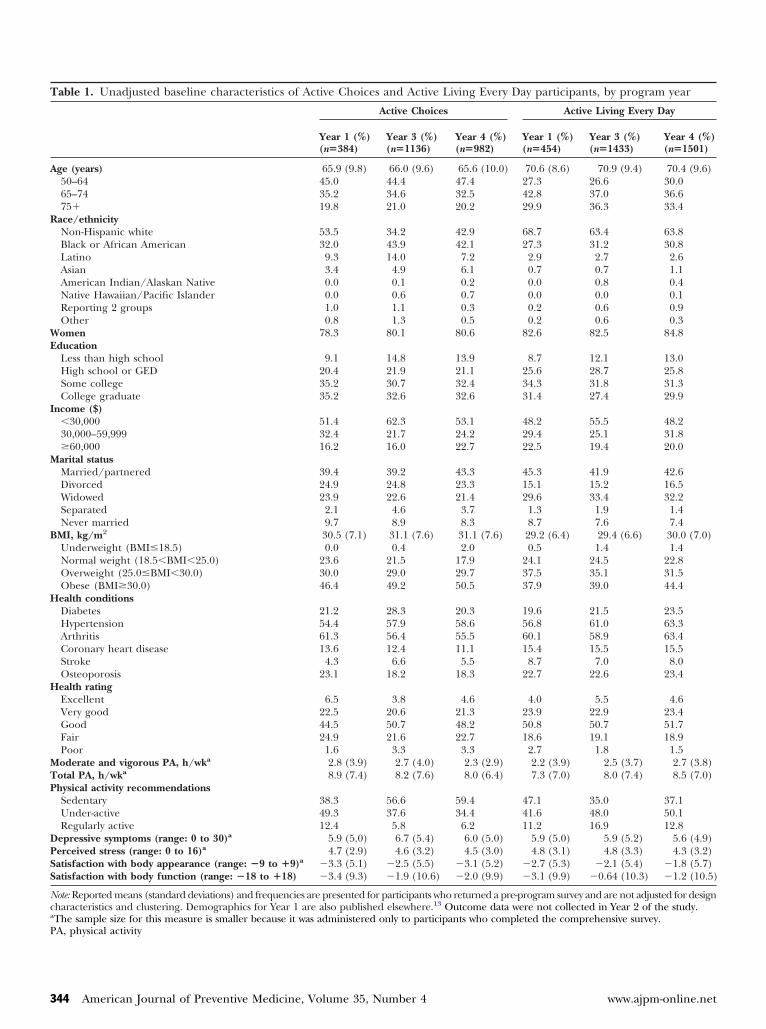
ively, and completed a pretest survey. Participant char-cteristics for each year, separately by program, arehown in Table 1. Variables that differed significantlyp�0.05) by year, for each program, are described.
For Active Choices, significant differences by yearere found for race/ethnicity, education, income, dia-etes, and physical activity. The percentage of ethnicinorities, those with less than a high school educa-
ion, and those who were sedentary increased acrossears. The percentage with a household income lesshan $30,000 was highest in Year 3. More participants inear 3 had diabetes.For ALED, significant differences by year were found
or a greater number of variables. Compared to Year 1,larger percentage of ALED participants in Years 3 andwere aged �75 years, had less than a high school
ducation, had hypertension, and had arthritis. Amaller percentage of ALED participants in these 2ears, however, were completely sedentary. BMI wasigher in Year 4 than Year 3. MVPA and total physicalctivity were higher in Year 4 than in Year 1. Satisfactionith body appearance was lower in Year 1 than in Year, and satisfaction with body function was lower in Yearthan in Years 3 and 4. Finally, perceived stress was
igher in Year 3 than in Year 4.
nalysis of Survey Nonresponders andarticipant Withdrawals
total of 275 (72%) Active Choices participants in Year, 687 (60%) in Year 3, and 558 (57%) in Year 4eturned their posttest surveys. For ALED these num-ers were 333 (73%) and 1095 (76%) for Years 1 and 3.n Year 4, 1169 (78%) participants returned theirosttest survey at 12 weeks, and 925 (62%) returnedheir follow-up survey at 20 weeks (i.e., 8 weeks after therogram ended). For both programs, participants whoeturned posttest surveys were significantly (p�0.01)ore likely than those who did not to be white, high
chool or college educated, and healthier (self-rated).dditionally, for Active Choices these participants wereore likely to have a household income of $30,000–
59,000, report higher baseline physical activity, andeport lower levels of baseline stress and depressiveymptoms. For ALED, those free from coronary heartisease were more likely to return the 20-week survey,hereas women were more likely than men to return
he 12-week survey.
Am J Prev Med 2008;35(4) 343
T
A
R
WE
I
M
B
H
H
MTP
DPSS
Nca
P
3
able 1. Unadjusted baseline characteristics of Active Choices and Active Living Every Day participants, by program year
Active Choices Active Living Every Day
Year 1 (%)(n�384)
Year 3 (%)(n�1136)
Year 4 (%)(n�982)
Year 1 (%)(n�454)
Year 3 (%)(n�1433)
Year 4 (%)(n�1501)
ge (years) 65.9 (9.8) 66.0 (9.6) 65.6 (10.0) 70.6 (8.6) 70.9 (9.4) 70.4 (9.6)50–64 45.0 44.4 47.4 27.3 26.6 30.065–74 35.2 34.6 32.5 42.8 37.0 36.675� 19.8 21.0 20.2 29.9 36.3 33.4
ace/ethnicityNon-Hispanic white 53.5 34.2 42.9 68.7 63.4 63.8Black or African American 32.0 43.9 42.1 27.3 31.2 30.8Latino 9.3 14.0 7.2 2.9 2.7 2.6Asian 3.4 4.9 6.1 0.7 0.7 1.1American Indian/Alaskan Native 0.0 0.1 0.2 0.0 0.8 0.4Native Hawaiian/Pacific Islander 0.0 0.6 0.7 0.0 0.0 0.1Reporting 2 groups 1.0 1.1 0.3 0.2 0.6 0.9Other 0.8 1.3 0.5 0.2 0.6 0.3omen 78.3 80.1 80.6 82.6 82.5 84.8
ducationLess than high school 9.1 14.8 13.9 8.7 12.1 13.0High school or GED 20.4 21.9 21.1 25.6 28.7 25.8Some college 35.2 30.7 32.4 34.3 31.8 31.3College graduate 35.2 32.6 32.6 31.4 27.4 29.9
ncome ($)�30,000 51.4 62.3 53.1 48.2 55.5 48.230,000–59,999 32.4 21.7 24.2 29.4 25.1 31.8�60,000 16.2 16.0 22.7 22.5 19.4 20.0arital statusMarried/partnered 39.4 39.2 43.3 45.3 41.9 42.6Divorced 24.9 24.8 23.3 15.1 15.2 16.5Widowed 23.9 22.6 21.4 29.6 33.4 32.2Separated 2.1 4.6 3.7 1.3 1.9 1.4Never married 9.7 8.9 8.3 8.7 7.6 7.4
MI, kg/m2 30.5 (7.1) 31.1 (7.6) 31.1 (7.6) 29.2 (6.4) 29.4 (6.6) 30.0 (7.0)Underweight (BMI�18.5) 0.0 0.4 2.0 0.5 1.4 1.4Normal weight (18.5�BMI�25.0) 23.6 21.5 17.9 24.1 24.5 22.8Overweight (25.0�BMI�30.0) 30.0 29.0 29.7 37.5 35.1 31.5Obese (BMI�30.0) 46.4 49.2 50.5 37.9 39.0 44.4ealth conditionsDiabetes 21.2 28.3 20.3 19.6 21.5 23.5Hypertension 54.4 57.9 58.6 56.8 61.0 63.3Arthritis 61.3 56.4 55.5 60.1 58.9 63.4Coronary heart disease 13.6 12.4 11.1 15.4 15.5 15.5Stroke 4.3 6.6 5.5 8.7 7.0 8.0Osteoporosis 23.1 18.2 18.3 22.7 22.6 23.4ealth ratingExcellent 6.5 3.8 4.6 4.0 5.5 4.6Very good 22.5 20.6 21.3 23.9 22.9 23.4Good 44.5 50.7 48.2 50.8 50.7 51.7Fair 24.9 21.6 22.7 18.6 19.1 18.9Poor 1.6 3.3 3.3 2.7 1.8 1.5oderate and vigorous PA, h/wka 2.8 (3.9) 2.7 (4.0) 2.3 (2.9) 2.2 (3.9) 2.5 (3.7) 2.7 (3.8)otal PA, h/wka 8.9 (7.4) 8.2 (7.6) 8.0 (6.4) 7.3 (7.0) 8.0 (7.4) 8.5 (7.0)hysical activity recommendationsSedentary 38.3 56.6 59.4 47.1 35.0 37.1Under-active 49.3 37.6 34.4 41.6 48.0 50.1Regularly active 12.4 5.8 6.2 11.2 16.9 12.8
epressive symptoms (range: 0 to 30)a 5.9 (5.0) 6.7 (5.4) 6.0 (5.0) 5.9 (5.0) 5.9 (5.2) 5.6 (4.9)erceived stress (range: 0 to 16)a 4.7 (2.9) 4.6 (3.2) 4.5 (3.0) 4.8 (3.1) 4.8 (3.3) 4.3 (3.2)atisfaction with body appearance (range: �9 to �9)a �3.3 (5.1) �2.5 (5.5) �3.1 (5.2) �2.7 (5.3) �2.1 (5.4) �1.8 (5.7)atisfaction with body function (range: �18 to �18) �3.4 (9.3) �1.9 (10.6) �2.0 (9.9) �3.1 (9.9) �0.64 (10.3) �1.2 (10.5)
ote: Reported means (standard deviations) and frequencies are presented for participants who returned a pre-program survey and are not adjusted for designharacteristics and clustering. Demographics for Year 1 are also published elsewhere.13 Outcome data were not collected in Year 2 of the study.The sample size for this measure is smaller because it was administered only to participants who completed the comprehensive survey.
A, physical activity44 American Journal of Preventive Medicine, Volume 35, Number 4 www.ajpm-online.net
(f(tlllww
C
Apa(feACsdo(Aifaw
Amttiar
S
TtTfAscaewficBp
D
Tpiracotspaftp
S
Spgbiot
rCmposSdsesl
nlstiap
tdtnmskt
O
For Active Choices, 25 (7%) participants in Year 1, 837%) in Year 3, and 79 (8%) in Year 4 actively withdrewrom the program. For ALED, these numbers were 4410%), 233 (16%), and 127 (9%). For both programs,hose who withdrew were significantly (p�0.01) moreikely than those who did not to be white, older, andeaner. Additionally, for Active Choices, those withower educational levels were more likely to withdraw,hereas for ALED those with coronary heart diseaseere more likely to withdraw.
hange Analyses
djusted mean scores on the outcome variables forretest and posttest and effect sizes for these changesre summarized in Tables 2 (Active Choices) and 3ALED). As reported elsewhere,13 all of the changesrom pretest to posttest in Year 1 were significantxcept depressive symptoms and perceived stress forctive Choices. The pattern was the same for Activehoices in Years 3 and 4. For ALED, all changes were
ignificant in Years 3 and 4 except that the reduction inepressive symptoms approached statistical significancenly in Year-3 carry-forward analyses. The effect sizesanalyses with available data) were somewhat larger forctive Choices in Years 3 and 4 than Year 1, but largest
n Year 1 for ALED. The effect sizes based on carry-orward analyses were similar in magnitude across yearsnd expectedly smaller than the analyses conductedith available data.The percentages of participants meeting CDC–
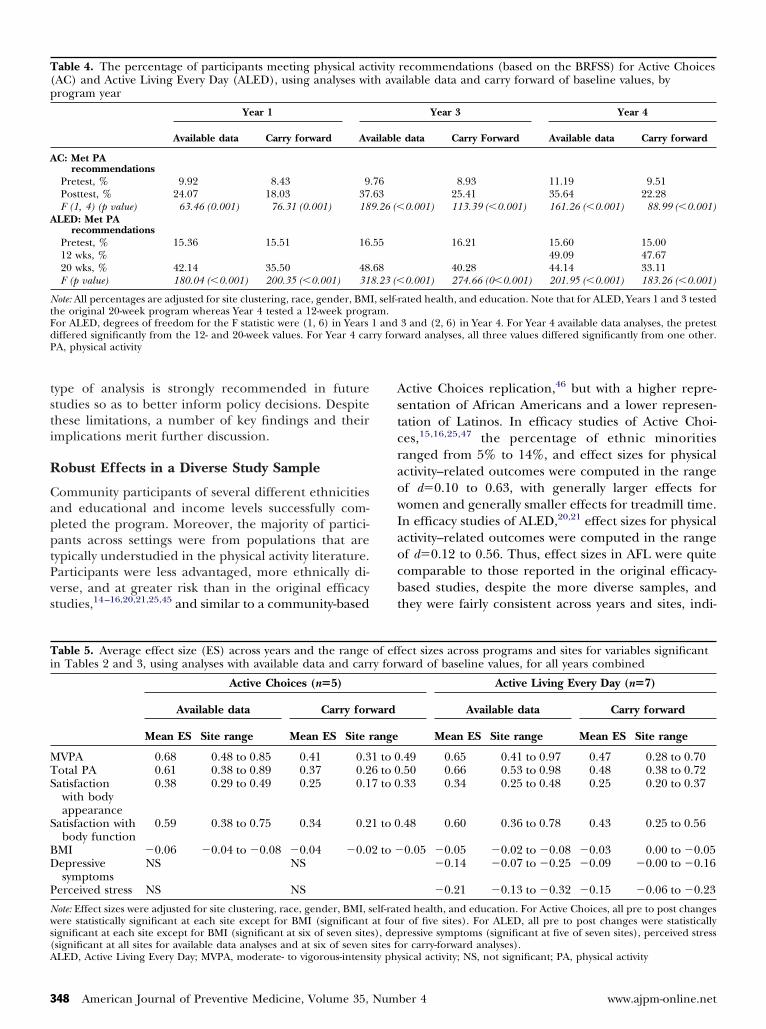
merican College of Sports Medicine (ACSM) recom-endations are shown in Table 4. For both programs,
hese percentages increased significantly from pretesto posttest in all years. For ALED Year-4 analyses,ncreases were maintained from 12 weeks to 20 weeks innalyses with available data, but there was a significanteduction in carry-forward analyses.
ite-Specific Analyses
he average effect sizes across all years combined andhe range in effect sizes across sites are summarized inable 5. Posttest response rates, which affect carry-
orward analyses, ranged from 49% to 69% acrossctive Choices sites and from 65% to 76% across ALED
ites. All changes from pretest to posttest were signifi-ant at all Active Choices sites (depressive symptomsnd perceived stress were not tested because the overallffect was not significant) except that BMI changesere not significant at one Active Choices site. Similarndings were seen for ALED. At several ALED sites,hanges in depressive symptoms, perceived stress, andMI were not significant. For depressive symptoms and
erceived stress, these sites had lower pretest means. actober 2008
iscussion
ranslational studies of evidence-based physical activityrograms are needed to determine the feasibility of
mplementing physical activity programs in a variety ofeal-world settings with diverse populations over time,nd once implemented, to determine if they produceomparable results.1,3,43,44 AFL is an excellent examplef a translational study and demonstrated the successfulranslation of two programs into a variety of real-worldettings with a diverse older adult population. AFL alsorovided an opportunity to examine program effectsfter an adaptation reducing the ALED program lengthrom 20 to 12 weeks. AFL represents a marked depar-ure from the usual prevention research settings andopulations.3,7
tudy Limitations
everal study limitations should be considered. Therimary study limitation is the absence of a controlroup. Although it is likely that effect sizes would haveeen somewhat attenuated if a control group had been
ncluded, we believe the potential for bias is more thanffset by the advantages of studying the translation ofhese programs to community settings.
There are several other limitations. To minimizeesponse burden self-reported data were used.HAMPS, the primary outcome measure, correlatesoderately with objective measures of physical activity,
hysical functioning, and quality of life.30,31 One of theriginal efficacy studies showed similar increases inubjective and objective physical activity measures.14
elf-reported behaviors may be influenced by socialesirability; however, if social desirability were respon-ible for these outcomes, one might expect similarffect sizes across all the self-reported outcomes. Effectizes varied by outcome and were consistent with theiterature.
An additional limitation is the problem of highonresponse among participants at posttest, particu-
arly for Active Choices, and the fact that the nonre-ponders were arguably at greater risk and higher needhan responders. However, the carry-forward analysesndicated that even if these participants did not changet all, the public health and clinical benefits of therograms would still be substantial.Additionally, maintenance of behavior change over
he long term has not been reported. Collecting Year-4ata at 12 weeks (immediately post) and 20 weeks afterhe shortened ALED program provided some prelimi-ary indications of the maintenance of behavior. Six-onth follow-up data are being collected at selected
ites, but these data are not yet available. It is also notnown whether smaller community-based organiza-ions could successfully implement the models. Finally,
cost-effectiveness analysis was not conducted. This
Am J Prev Med 2008;35(4) 345

Table 2. Active Choices effect sizes (d) based on adjusted pretest and posttest scores (standard errors) for the primary outcomes of interest, using analyses with availabledata and carry forward of baseline values, by program year
Year 1 Year 3 Year 4
Available data Carry forward Available data Carry forward Available data Carry forward
Moderate and vigorous PA, d 0.62 0.43 0.66 0.36 0.75 0.43Pretest h/wk 2.89 (0.77) 2.96 (0.42) 2.89 (0.44) 2.73 (0.44) 2.31 (0.38) 2.20 (0.35)Posttest h/wk 5.33 (0.77) 4.69 (0.42) 5.65 (0.48) 4.22 (0.44) 5.13 (0.42) 3.90 (0.35)t with 4 df (p value) 8.83 (�0.001) 5.87 (0.004) 6.20 (0.003) 8.77 (�0.001) 7.22 (0.002) 6.37 (0.003)
All PA, d 0.55 0.41 0.60 0.32 0.63 0.37Pretest h/wk 7.97 (1.45) 7.73 (0.75) 8.16 (0.93) 8.09 (1.01) 7.43 (0.80) 7.14 (0.73)Posttest h/wk 12.13 (1.45) 10.75 (0.75) 12.98 (0.99) 10.70 (1.01) 12.14 (0.87) 9.99 (0.73)t with 4 df (p value) 7.93 (0.001) 7.87 (0.001) 5.52 (0.005) 7.95 (0.001) 5.70 (0.005) 5.05 (0.007)
Depressive symptoms, d �0.04 �0.03 �0.08 �0.03 0.02 0.02Pretest score (range: 0 to 30) 7.69 (0.85) 6.82 (0.48) 6.74 (0.49) 6.89 (0.51) 6.15 (0.50) 6.13 (0.49)Posttest score (range: 0 to 30) 7.52 (0.85) 6.69 (0.48) 6.33 (0.51) 6.74 (0.51) 6.26 (0.53) 6.23 (0.49)t with 4 df (p value) �0.73 (0.51) �0.79 (0.47) 1.63 (0.18) 0.97 (0.39) 0.40 (0.71) 0.62 (0.57)
Perceived stress, d �0.01 0.00 �0.07 �0.03 0.00 0.03Pretest score (range: 0 to 16) 4.93 (0.56) 4.72 (0.33) 4.80 (0.32) 4.76 (0.32) 4.20 (0.35) 4.16 (0.33)Posttest score (range: 0 to 16) 4.91 (0.56) 4.72 (0.33) 4.56 (0.34) 4.68 (0.32) 4.19 (0.37) 4.25 (0.33)t with 4 df (p value) �0.10 (0.93) 0.00 (0.997) 1.14 (0.32) 0.72 (0.51) 0.01 (0.99) 0.50 (0.64)
Satisfaction with body appearance, d 0.34 0.23 0.44 0.27 0.38 0.21Pretest score (range: �9 to �9) �2.76 (0.87) �2.76 (0.51) �2.75 (0.46) �2.92 (0.46) �2.90 (0.58) �3.00 (0.59)Posttest score (range: �9 to �9) �1.04 (0.87) �1.60 (0.51) �0.23 (0.49) �1.45 (0.46) �0.93 (0.61) �1.92 (0.59)t with 4 df (p value) 5.37 (0.006) 3.67 (0.02) 8.27 (0.001) 7.67 (0.001) 4.55 (0.01) 3.67 (0.02)
Satisfaction with body function, d 0.49 0.36 0.56 0.33 0.55 0.29Pretest score (range: �18 to �18) �1.90 (1.64) �1.03 (0.95) �1.41 (0.86) �1.64 (0.84) �1.24 (0.88) �1.60 (0.83)Posttest score (range: �18 to �18) 2.74 (1.64) 2.32 (0.95) 4.48 (0.91) 1.81 (0.84) 4.17 (0.93) 1.28 (0.83)t with 4 df (p value) 5.49 (0.005) 5.38 (0.006) 5.69 (0.005) 4.22 (0.01) 6.18 (0.004) 5.45 (0.006)
BMI, d �0.05 �0.03 �0.07 �0.04 �0.06 �0.03Pretest kg/m2 32.74 (1.61) 31.27 (1.27) 29.90 (0.67) 29.96 (0.68) 30.44 (0.69) 30.46 (0.68)Posttest kg/m2 32.41 (1.61) 31.05 (1.27) 29.39 (0.68) 29.66 (0.68) 30.00 (0.69) 30.22 (0.68)t with 4 df (p value) �2.85 (0.046) �2.78 (0.0498) 3.70 (0.02) 3.33 (0.03) 4.71 (0.009) 4.33 (0.01)
Note: All means and standard errors are adjusted for site clustering, race, gender, BMI (except for the analysis predicting BMI), self–rated health, and education. Effect sizes (d) are computed usingpretest unadjusted standard deviations. All change scores were significant except for change in depressive symptoms and stress (all years). Both physical activity (PA) measures were skewed andsquare root transformations were conducted and used in all change analyses and in the effect size calculations. The untransformed means and standard errors, however, are presented using theoriginal scales of measurement and are adjusted for variables listed above. Data from Year 1 are also published elsewhere.13
346A
merican
Journal
ofPreven
tiveM
edicine,
Volum
e35,
Num
ber4
ww
w.ajpm
-onlin
e.net

Table 3. Active Living Every Day effect sizes (d) based on adjusted pretest and posttest scores (standard errors) for the primary outcomes of interest, using analyses withavailable data and carry forward of baseline values, by program year
Year 1 (20-week program) Year 3 (20-week program) Year 4 (12-week program)
Available data Carry forward Available data Carry forward Available data Carry forward
Moderate and vigorous PA, d 0.74 0.56 0.66 0.46 0.58 0.42Pretest h/wk 2.27 (0.57) 2.46 (0.48) 3.40 (0.71) 3.33 (0.65) 3.91 (0.55) 3.70 (0.53)20 wks – hrs/wk 4.92 (0.57) 4.55 (0.48) 6.20 (0.72) 5.26 (0.65) 6.28 (0.56) 5.41 (0.53)t with 6 df (p value) 8.05 (�0.001) 6.37 (�0.001) 8.36 (�0.001) 9.87 (�0.001) 6.25 (�0.001) 5.34 (0.002)
All PA, d 0.79 0.60 0.56 0.39 0.63 0.46Pretest h/wk 5.77 (1.06) 6.69 (0.96) 8.46 (1.45) 8.40 (1.38) 9.94 (1.11) 9.54 (1.08)20 wks – h/wk 11.72 (1.06) 11.38 (0.96) 13.28 (1.46) 11.79 (1.38) 14.74 (1.13) 13.03 (1.08)t with 6 df (p value) 14.70 (�0.001) 10.66 (�0.001) 8.20 (�0.001) 7.58 (�0.001) 5.28 (0.002) 4.82 (0.003)
Depressive symptoms, d �0.17 �0.12 �0.15 �0.09 �0.11 �0.07Pretest score (range: 0 to 30) 6.10 (0.48) 6.17 (0.41) 5.60 (0.50) 5.60 (0.51) 7.11 (0.61) 7.13 (0.62)20 wks score (range: 0 to 30) 5.30 (0.48) 5.56 (0.41) 4.82 (0.51) 5.10 (0.51) 6.55 (0.62) 6.78 (0.62)t with 6 df (p value) �3.58 (0.01) �3.57 (0.01) 3.29 (0.02) 2.27 (0.06) 3.18 (0.02) 2.86 (0.03)
Perceived stress, d �0.29 �0.21 �0.23 �0.15 �0.16 �0.10Pretest score (range: 0 to 16) 5.53 (0.33) 5.20 (0.29) 4.33 (0.33) 4.33 (0.34) 4.67 (0.39) 4.74 (0.40)20 wks score (range: 0 to 16) 4.63 (0.33) 4.53 (0.29) 3.56 (0.34) 3.82 (0.34) 4.17 (0.40) 4.43 (0.40)t with 6 df (p value) �4.71 (0.003) �4.73 (0.003) 5.40 (0.002) 4.76 (0.003) 3.53 (0.01) 2.77 (0.03)
Satisfaction with body appearance, d 0.43 0.32 0.34 0.25 0.29 0.22Pretest score (range: �9 to �9) �2.28 (0.52) �2.12 (0.49) �2.21 (0.54) �2.20 (0.54) �1.62 (0.58) �1.66 (0.58)20 wks score (range: �9 to �9) �0.05 (0.52) �0.42 (0.49) �0.35 (0.55) �0.83 (0.54) 0.03 (0.59) �0.43 (0.58)t with 6 df (p value) 9.55 (�0.001) 8.69 (�0001) 6.21 (�0.001) 5.13 (0.002) 8.09 (�0.001) 8.24 (�0.001)
Satisfaction with body function, d 0.70 0.52 0.60 0.44 a0.69/0.53 a0.67/0.36Pretest score (range: �18 to �18) �2.56 (0.95) �2.43 (1.03) �0.75 (0.74) �0.95 (0.75) �0.14 (0.82) �0.35 (0.80)12 wks score 7.11 (0.83) 6.61 (0.81)t with 6 df (p value) – 12 wks 12.78 (�0.0001) 14.55 (�0.0001)20 wks score (range: �18 to �18) 4.01 (0.95) 2.60 (1.03) 5.47 (0.75) 3.59 (0.75) 5.40 (0.84) 3.37 (0.80)t with 6 df (p value) – 20 wks 10.33 (�0.001) 8.46 (�0.001) 17.69 (�0.001) 11.12 (�0.001) 9.57 (�0.001) 8.03 (�0.001)
BMI, d �0.06 �0.05 �0.03 �0.02 a�0.04/�0.06 a�0.03/�0.04Pretest kg/m2 29.17 (0.97) 28.69 (0.84) 30.57 (0.64) 30.57 (0.63) 29.50 (0.62) 29.51 (0.62)12 wks kg/m2 29.24 (0.62) 29.27 (0.62)t with 6 df (p value) – 12 wks 4.42 (0.005) 4.61 (0.004)20 wks kg/m2 28.76 (0.97) 28.37 (0.84) 30.35 (0.64) 30.41 (0.63) 29.10 (0.62) 29.25 (0.62)t with 6 df (p value) – 20 wks �4.54 (0.004) �3.83 (0.009) 3.08 (0.02) 3.19 (0.02) 6.63 (�0.001) 5.18 (0.002)
Note: All means and standard errors are adjusted for site clustering, race, gender, BMI (except for the analysis predicting BMI), self-rated health, and education. Effect sizes (d) are computed usingpretest unadjusted standard deviations. Both physical activity measures were skewed and square root transformations were conducted and used in all change analyses and in the effect sizecalculations. The untransformed means and standard errors, however, are presented using the original scales of measurement and are adjusted for variables listed above. Data from Year 1 are alsopublished elsewhere.13
aFirst effect size represents change from pretest to 12 weeks (posttest). Second effect size represents change from pretest to 20 weeks (8 weeks after program ended).PA, physical activity
October
2008A
mJ
PrevM
ed2008;35(4)
347
tsti
R
CapptPvs
AstcraowIaocbt
T(p
A
A
NtFdP
Ti
MTS
S
BD
P
Nws(A
3
ype of analysis is strongly recommended in futuretudies so as to better inform policy decisions. Despitehese limitations, a number of key findings and theirmplications merit further discussion.
obust Effects in a Diverse Study Sample
ommunity participants of several different ethnicitiesnd educational and income levels successfully com-leted the program. Moreover, the majority of partici-ants across settings were from populations that areypically understudied in the physical activity literature.articipants were less advantaged, more ethnically di-erse, and at greater risk than in the original efficacytudies,14–16,20,21,25,45 and similar to a community-based
able 4. The percentage of participants meeting physical acAC) and Active Living Every Day (ALED), using analyses wirogram year
Year 1
Available data Carry forward Av
C: Met PArecommendations
Pretest, % 9.92 8.43 9Posttest, % 24.07 18.03 37F (1, 4) (p value) 63.46 (0.001) 76.31 (0.001) 18
LED: Met PArecommendations
Pretest, % 15.36 15.51 1612 wks, %20 wks, % 42.14 35.50 48F (p value) 180.04 (�0.001) 200.35 (�0.001) 31
ote: All percentages are adjusted for site clustering, race, gender, BMhe original 20-week program whereas Year 4 tested a 12-week progror ALED, degrees of freedom for the F statistic were (1, 6) in Yearsiffered significantly from the 12- and 20-week values. For Year 4 carA, physical activity
able 5. Average effect size (ES) across years and the rangen Tables 2 and 3, using analyses with available data and carr
Active Choices (n�5)
Available data Carry for
Mean ES Site range Mean ES Site r
VPA 0.68 0.48 to 0.85 0.41 0.3otal PA 0.61 0.38 to 0.89 0.37 0.2atisfactionwith bodyappearance
0.38 0.29 to 0.49 0.25 0.1
atisfaction withbody function
0.59 0.38 to 0.75 0.34 0.2
MI �0.06 �0.04 to �0.08 �0.04 �0.0epressivesymptoms
NS NS
erceived stress NS NS
ote: Effect sizes were adjusted for site clustering, race, gender, BMI, sere statistically significant at each site except for BMI (significant
ignificant at each site except for BMI (significant at six of seven site
significant at all sites for available data analyses and at six of seven sites foLED, Active Living Every Day; MVPA, moderate- to vigorous-intensity phy48 American Journal of Preventive Medicine, Volume 35, Num
ctive Choices replication,46 but with a higher repre-entation of African Americans and a lower represen-ation of Latinos. In efficacy studies of Active Choi-es,15,16,25,47 the percentage of ethnic minoritiesanged from 5% to 14%, and effect sizes for physicalctivity–related outcomes were computed in the rangef d�0.10 to 0.63, with generally larger effects foromen and generally smaller effects for treadmill time.
n efficacy studies of ALED,20,21 effect sizes for physicalctivity–related outcomes were computed in the rangef d�0.12 to 0.56. Thus, effect sizes in AFL were quiteomparable to those reported in the original efficacy-ased studies, despite the more diverse samples, andhey were fairly consistent across years and sites, indi-
recommendations (based on the BRFSS) for Active Choicesilable data and carry forward of baseline values, by
Year 3 Year 4
data Carry Forward Available data Carry forward
8.93 11.19 9.5125.41 35.64 22.28
0.001) 113.39 (�0.001) 161.26 (�0.001) 88.99 (�0.001)
16.21 15.60 15.0049.09 47.67
40.28 44.14 33.110.001) 274.66 (0�0.001) 201.95 (�0.001) 183.26 (�0.001)
ated health, and education. Note that for ALED, Years 1 and 3 tested
3 and (2, 6) in Year 4. For Year 4 available data analyses, the pretestward analyses, all three values differed significantly from one other.
ect sizes across programs and sites for variables significantward of baseline values, for all years combined
Active Living Every Day (n�7)
Available data Carry forward
Mean ES Site range Mean ES Site range
.49 0.65 0.41 to 0.97 0.47 0.28 to 0.70
.50 0.66 0.53 to 0.98 0.48 0.38 to 0.72
.33 0.34 0.25 to 0.48 0.25 0.20 to 0.37
.48 0.60 0.36 to 0.78 0.43 0.25 to 0.56
0.05 �0.05 �0.02 to �0.08 �0.03 0.00 to �0.05�0.14 �0.07 to �0.25 �0.09 �0.00 to �0.16
�0.21 �0.13 to �0.32 �0.15 �0.06 to �0.23
ed health, and education. For Active Choices, all pre to post changesr of five sites). For ALED, all pre to post changes were statisticallyressive symptoms (significant at five of seven sites), perceived stress
tivityth ava
ailable
.76
.639.26 (�
.55
.688.23 (�
I, self-ram.1 andry for
of effy for
ward
ange
1 to 06 to 07 to 0
1 to 0
2 to �
elf-ratat fous), dep
r carry-forward analyses).sical activity; NS, not significant; PA, physical activity
ber 4 www.ajpm-online.net

cppa
flfcnmaca4sacemtsdmwleismi
I
TpCcmttcdi
amqmlfsTosnl
btatpiatadFlrr
C
Baeotgab
TJrro
ptch(btKBKTMOSoAFCAJHfBQKB
O
ating robust and clinically meaningful changes. Alsoarallel to AFL findings, effect sizes for BMI andsychosocial measures were more variable and gener-lly smaller in the efficacy studies.
An interesting divergence in the programs was thator Active Choices, effects were typically larger in theater 2 years (for analyses with available data) whereasor ALED, the pattern was just the opposite. Several keyhanges in the participant population over time wereoted for ALED. Participants in later years were older,ore active, and less educated with lower income levels
nd higher rates of diabetes and hypertension. Thishange in population characteristics, as well as thedaptation of the program from 20 to 12 weeks in Year, may account for the smaller physical activity effectizes in later years. Because the population was morective initially, there may have been less room forhange. It is important to underscore, however, that theffect sizes remained medium in size and clinicallyeaningful. Another difference between programs was
hat reductions in depressive symptoms and perceivedtress were found for ALED but not Active Choices. Theiffering populations enrolled in the two programsakes it difficult to speculate on why these differencesere observed, and it is important to note that baseline
evels of these symptoms were very low and pre–postffect sizes very small. Nonetheless, the possibility thatndividuals with higher levels of stress and depressiveymptoms may respond favorably to group-based for-ats is an interesting finding that merits further study
n more carefully controlled RCTs.
mplications for Practice
he robust outcomes seen in this study give communityrograms some confidence that if they adopt Activehoices or ALED they can achieve comparable results. Ofourse, external validity relies on inductive, not deductive,ethods and tests of generalization can never cover all
he potential combinations of populations, settings andreatment adaptations.44 When a wide variety of theseombinations are tested, however, practitioners can re-uce uncertainty about the likely benefits of the programs
n their own settings and populations.The AFL initiative provided an infrastructure that
llowed the lead organizations to strategize for recruit-ent, train staff in the program approaches, maintain
uality control through attention to the essential ele-ents of the interventions, share information about
egitimate adaptations within the overall models, obtaineedback from the process and outcome evaluation tohare with stakeholders, and plan for sustainability.his context and approach, which included a great dealf interaction and communication between communityites and researchers, is consistent with core compo-ents of effective knowledge translation.48–50 We be-
ieve that the success of AFL was promoted, in part, M
ctober 2008
ecause research activities were tailored to the needs ofhe sites, and the sites helped to guide the researchctivities and define needed adaptations in an interac-ive manner.48,50 These and other related issues will beresented in forthcoming papers that focus on the high
mplementation fidelity in AFL along with challengesnd adaptations. By partnering with trusted organiza-ions that were embedded in the communities, AFLlso succeeded in recruiting and retaining groups thato not ordinarily consent to participate in research.urthermore, the profiles of participants who were less
ikely to complete the program allow for efforts toetain participants by targeting those most at greatestisk.
onclusion
etter studies of the translation of research to practicere required in order to assess the external validity ofvidence-based interventions.43 The AFL initiative dem-nstrates that a range of community-based organiza-ions can not only implement evidence-based pro-rams, but that substantial numbers of diverse olderdults can receive physical and mental health benefitsy participating in them.
he Active for Life initiative is funded by the Robert Woodohnson Foundation. The findings and conclusions in thiseport are those of the authors and do not necessarilyepresent the views of the Robert Wood Johnson Foundationr other institutions affiliated with the authors.We gratefully acknowledge the many participants who took
art in the Active Choices and ALED programs and evalua-ion. We also acknowledge the involvement and significantontribution of the following program managers, facilitators/ealth educators, and staff at each of the lead organizationslisted alphabetically by organization name and alphabeticallyy person). Berkeley Public Health Department: Kate Clay-on, Jennifer Divers, Erica Frechman, Maria Guerrero, Justineaplan, Elise Krumholz, Madhuri Sudan, Kristin Tehrani;lue Shield of California: Deborah Kosmont, Carrierutzner, Mindy Morgen, Juan Rivas; Church Health Center:eresa Cutts, Mia Earl-Clemmons, Doris Grider, SterlingcNeal, Michelle D. Rice; Council on Aging of Southwesternhio: Susan Binkert, Kelly Lake, Alisa Phillips, Karen
chwamberger, Roberta Wickerham; FirstHealth of the Car-linas: Lisa G. Hartsock, Melissa Watford; Greater Detroitrea Health Council: Vernice Davis Anthony, Esther Bishop-iles, Paul Bridgewater, Karen Calhoun, Marvin Cato, Maryocanougher, Maude Freeman, Pastor Michael C. Nabors,lberta Smith-Plump, Debbie Stefanides, Theresa Taylor,
ohn B. Waller, Jr., Shirley Williams, Carolyn Wilson-Hall;uman Kinetics, Inc.: H. Michelle Maloney; Jewish Council
or the Aging of Greater Washington: Carol Ames, Christineruchac, Beverly Bryant, Sharlene P. Hirsch, Dorothy Morgan-uelch; The OASIS Institute: Fabiana Cheistwer, Marciaerz, Cindy Merrins, Cheryl Roberts Oliver, Shirley Pogue,renda Schmachtenberger, Tracy Slate, Gail Weisberg; San
ateo County Health Department: Edith Cabuslay, Doris Y.Am J Prev Med 2008;35(4) 349
EGbCSSBJPTCM
JLMtctac
t
n
R
1
1
1
1
1
1
1
1
1
1
2
2
2
2
2
2
2
2
2
2
3
3
3
3
3
3
3
3
3
3
3
stremera-Rohleder, Isabel R. Guerrero, Katya Henriquez,abriela Lemus, Martha Milk, Scharlette Parker, Sam Steb-ins, Cristina Ugaitafa, Jaslin Yu; Texas A&M Health Scienceenter: Vanessa Batt, Lisa Groce, Amanda Laughlin, Brigidanner, Amber Schickedanz, William Smith, University ofouth Carolina: Barbara E. Ainsworth, Corrie Barnett, Peterense, Julie Freelove-Charton, Nancy Chase, Shanikwha
ones, Samira Khan, Diana Lattimore, Angela Merlo, Russellate, Patricia A. Sharpe, Dennis Shepard, Winifred W.hompson, M. Renée Umstattd; and YMCA of Metropolitanhicago: Jan Arnold, Martha Beard, Annemarie DeFazio,ary Ganzel, Karen Keenley, Jassen Lanfair, Fran Lewickyj.We recognize Robin Mockenhaupt from the Robert Wood
ohnson Foundation for her pioneering role in Active forife. We also thank Peter Hannan from the University ofinnesota for his statistical consultation on this project. We
hank the National Advisory Committee for their valuableontributions to Active for Life. Finally, we thank the coali-ions, partnering organizations, and advisory boards associ-ted with each of the lead organizations for their meaningfulontributions and support of the program.
No financial disclosures were reported by the authors ofhis paper.
Author order beyond the first 3 is alphabetical and doesot reflect contribution.
eferences1. Glasgow RE, Lichtenstein E, Marcus AC. Why don’t we see more translation
of health promotion research to practice? Rethinking the efficacy-to-effectiveness transition. Am J Public Health 2003;93:1261–7.
2. Dunn AL, Bettinghaus EP. Diffusion and dissemination for increasingphysical activity in world populations. Am J Prev Med 2006;31(4S):S94–6.
3. Glasgow RE, Emmons KM. How can we increase translation of research intopractice? Types of evidence needed. Annu Rev Public Health 2007;28:413–33.
4. Brownson RC, Kreuter MW, Arrington BA, True WR. Translating scientificdiscoveries into public health action: how can schools of public healthmove us forward? Public Health Rep 2006;121:97–103.
5. Ory MG, Evashwick CJ, Glasgow RE, Sharkey JR. Pushing the boundaries ofevidence-based research: enhancing the application and sustainability ofhealth promotion programs in diverse populations. In: Browning CJ,Thomas SA, eds. Behavioral change: an evidence-based handbook for socialand public health. Edinburgh: Elsevier Churchill, 2005:267–93.
6. Brownson RC, Ballew P, Dieffenderfer B, et al. Evidence-based interven-tions to promote physical activity: what contributes to dissemination bystate health departments. Am J Prev Med 2007;33(1S):S66–S73.
7. Green LW. From research to “best practices” in other settings andpopulations. Am J Health Behav 2001;25:165–78.
8. Estabrooks PA, Glasgow RE. Translating effective clinic-based physicalactivity interventions into practice. Am J Prev Med 2006;31(4S):S45–S56.
9. Task Force on Community Preventive Services. Recommendations toincrease physical activity in communities. Am J Prev Med 2002;22(4S):S67–S72.
0. Ory MG, Jordan PJ, Bazzarre T. The Behavior Change Consortium: settingthe stage for a new century of health behavior-change research. HealthEduc Res 2002;17:500–11.
1. Eakin EG, Lawler SP, Vandelanotte C, Owen N. Telephone interventionsfor physical activity and dietary behavior change: a systematic review. Am JPrev Med 2007;32:419–34.
2. Yancey AK, Ory MG, Davis SM. Dissemination of physical activity promotioninterventions in underserved populations. Am J Prev Med 2006;31(4S):S82–S91.
3. Wilcox S, Dowda M, Griffin SF, et al. Results of the first year of Active forLife: translation of 2 evidence-based physical activity programs for olderadults into community settings. Am J Public Health 2006;96:1201–9.
4. King AC, Haskell WL, Young DR, Oka RK, Stefanick ML. Long-term effectsof varying intensities and formats of physical activity on participation rates,
4
50 American Journal of Preventive Medicine, Volume 35, Num
fitness, and lipoproteins in men and women aged 50 to 65 years.Circulation 1995;91:2596–604.
5. King AC, Baumann K, O’Sullivan P, Wilcox S, Castro C. Effects ofmoderate-intensity exercise on physiological, behavioral, and emotionalresponses to family caregiving: a randomized controlled trial. J Gerontol2002;57:M26–36.
6. King AC, Pruitt LA, Phillips W, Oka R, Rodenburg A, Haskell WL.Comparative effects of two physical activity programs on measured andperceived physical functioning and other health-related quality of lifeoutcomes in older adults. J Gerontol 2000;55:M74–83.
7. Stewart AL, Mills KM, Sepsis PG, et al. Evaluation of CHAMPS, a physicalactivity promotion program for older adults. Ann Behav Med 1997;19:353–61.
8. Prochaska JO, DiClemente CC, Norcross JC. In search of how peoplechange. Applications to addictive behaviors. Am Psychol 1992;47:1102–14.
9. Bandura A. Social foundations of thought and action: a social cognitivetheory. Englewood Cliffs NJ: Prentice-Hall, 1986.
0. Dunn AL, Marcus BH, Kampert JB, Garcia ME, Kohl HW 3rd, Blair SN.Reduction in cardiovascular disease risk factors: 6-month results fromProject Active. Prev Med 1997;26:883–92.
1. Dunn AL, Marcus BH, Kampert JB, Garcia ME, Kohl HW 3rd, Blair SN.Comparison of lifestyle and structured interventions to increase physicalactivity and cardiorespiratory fitness: a randomized trial. JAMA 1999;281:327–34.
2. Thomas S, Reading J, Shephard RJ. Revision of the Physical ActivityReadiness Questionnaire (PAR-Q). Can J Sport Sci 1992;17:338–45.
3. Ory M, Resnick B, Jordan PJ, et al. Screening, safety, and adverse events inphysical activity interventions: collaborative experiences from the behaviorchange consortium. Ann Behav Med 2005;29 Suppl:20–8.
4. King AC, Haskell WL, Taylor CB, Kraemer HC, DeBusk RF. Group- vshome-based exercise training in healthy older men and women. A com-munity-based clinical trial. JAMA 1991;266:1535–42.
5. King AC, Oman RF, Brassington GS, Bliwise DL, Haskell WL. Moderate-intensity exercise and self-rated quality of sleep in older adults. A random-ized controlled trial. JAMA 1997;277:32–7.
6. King AC, Friedman R, Marcus B, et al. Ongoing physical activity advice byhumans versus computers: the Community Health Advice by Telephone(CHAT) trial. Health Psychol 2007;26:718–27.
7. Estabrooks P, Gyurcsik NC. Evaluating the impact of behavioral interven-tions that target physical activity: issues of generalizability and publichealth. Psychol Sport Exerc 2003;4:41–55.
8. Expert Panel. Executive summary of the clinical guidelines on the identi-fication, evaluation, and treatment of overweight and obesity in adults.Arch Intern Med 1998;158:1855–67.
9. CDC. Behavioral Risk Factor Surveillance System, 2005 Survey Questions.www.cdc.gov/brfss/questionnaires/english.htm.
0. Stewart AL, Mills KM, Kingz AC, Haskell WL, Gillis, Ritter PL. CHAMPSPhysical Activity Questionnaire for Older Adults: outcomes for interven-tions. Med Sci Sports Exerc 2001;33:1126–41.
1. Harada ND, Chiu V, King AC, Stewart AL. An evaluation of three self-reportphysical activity instruments for older adults. Med Sci Sports Exerc2001;33:962–70.
2. Stewart AL. Community-based physical activity programs for adults age 50and older. J Aging Phys Act 2001;9(Suppl):S71–91.
3. Stewart AL, Verboncoeur CJ, McLellan BY, et al. Physical activity outcomesof CHAMPS II: a physical activity promotion program for older adults.J Gerontol 2001;56:M465–70.
4. Pate RR, Pratt M, Blair SN, et al. Physical activity and public health. Arecommendation from the Centers for Disease Control and Prevention andthe American College of Sports Medicine. JAMA 1995;273:402–7.
5. Kohout FJ, Berkman LF, Evans DA, Cornoni-Huntley J. Two shorter formsof the CES-D (Center for Epidemiological Studies Depression) depressionsymptoms index. J Aging Health 1993;5:179–93.
6. Irwin M, Artin KH, Oxman MN. Screening for depression in the olderadult: criterion validity of the 10-item Center for Epidemiological StudiesDepression Scale (CES-D). Arch Intern Med 1999;159:1701–4.
7. Radloff LS. The CES-D scale: a self-report depression scale for research inthe general population. App Psych Measure 1977;1:385–401.
8. Cohen S, Kamarck T, Mermelstein R. A global measure of perceived stress.J Health Soc Behav 1983;24:385–96.
9. Pbert L, Doerfler LA, DeCosimo D. An evaluation of the perceived stressscale in two clinical populations. J Psychopathol Behav Assess 1992;14:363–75.
0. Reboussin BA, Rejeski WJ, Martin KA, et al. Correlates of satisfactionwith body function and body appearance in middle- and older aged
ber 4 www.ajpm-online.net

4
4
4
4
4
4
4
4
4
5
O
adults: The Activity Counseling Trial (ACT). Psychol Health 2000;15:239 –54.
1. Wolf FM. Meta-analysis. Quantitative methods for research synthesis. New-bury Park CA: Sage, 1986.
2. Cohen J. Statistical power analysis for the behavioral sciences. 2nd ed.Hillsdale NJ: Lawrence Erlbaum, 1988.
3. Steckler A, McLeroy KR. The importance of external validity. Am J PublicHealth 2008;98:9–10.
4. Leviton LC. External validity. In: Smelser NJ, Baltes PB, eds. The interna-tional encyclopedia of the social and behavioral sciences. Vol 8, Logic ofinquiry and research design. Elsevier, 2001:5195–200.
5. Smolander J, Blair SN, Kohl HW 3rd. Work ability, physical activity, and
cardiorespiraron Med 200ctober 2008
6. Hooker SP, Seavey W, Weidmer CE, et al. The California Active AgingCommunity Grant Program: translating science into practice to pro-mote physical activity in older adults. Ann Behav Med 2005;29:155– 65.
7. King AC, Taylor CB, Haskell WL. Effects of differing intensities and formatsof 12 months of exercise training on psychological outcomes in olderadults. Health Psychol 1993;12:292–300.
8. Bowen S, Martens P. Demystifying knowledge translation: learning fromthe community. J Health Serv Res Policy 2005;10:203–11.
9. Graham ID, Logan J, Harrison MB, et al. Lost in knowledge translation:time for a map? J Contin Educ Health Prof 2006;26:13–24.
0. Jacobson N, Butterill D, Goering P. Development of a framework for
Health Serv Res tory fitness: 2-year results from Project Active. J Occup Envi-0;42:906–10.knowledge translation: understanding user context. JPolicy 2003;8:94–9.
What’s new online?Visit www.ajpm-online.net today to find out how you can save your online searches andget the results by e-mail!
Am J Prev Med 2008;35(4) 351