Mathematical Modelling of Active Packaging Systems for ...
363
Copyright is owned by the Author of the thesis. Permission is given for a copy to be downloaded by an individual for the purpose of research and private study only. The thesis may not be reproduced elsewhere without the permission of the Author.
-
Upload
khangminh22 -
Category
Documents
-
view
1 -
download
0
Transcript of Mathematical Modelling of Active Packaging Systems for ...

Copyright is owned by the Author of the thesis. Permission is given for a copy to be downloaded by an individual for the purpose of research and private study only. The thesis may not be reproduced elsewhere without the permission of the Author.
Mathematical Modelling of Active Packaging
Systems for Horticultural Products
A thesis presented in partial fulfilment of the requirements for the degree of
Doctor of Philosophy in Packaging Technology
at Massey University, New Zealand
Weerawate Utto
2008

Abstract
i
ABSTRACT
Active packaging systems can offer significant advantages in preventing quality loss in
horticultural products through control of microbial and/or physiological activity. By
delivering and sustaining volatile active agents at effective levels in a package atmosphere,
significant shelf life extension can thus be achieved. Design of these systems is
complicated by the number of possible package, product, active agent and carrier
combinations that can be employed and the significant interactions that may occur between
these components. Mathematical modelling can be used to simplify system design and
reduce the number of experimental trials required to achieve optimal active packaging
systems. In this study a generalised modelling methodology was developed and validated
to facilitate the design of active controlled volatile release packaging systems for
horticultural products.
The modelling methodology was developed using an example system which comprised
tomatoes packed under a modified atmosphere (MA; 5 % (v/v) CO2 and 10 % (v/v) O2) in
a LDPE bag with a polymer film sealed sachet containing silica gel pre-saturated with the
antifungal agent hexanal. Experimental trials showed that for this system a target sustained
hexanal concentration of 40-70 ppm was required. This was shown to be (i) the minimum
inhibitory concentration (MIC) for controlling Botrytis cinerea growing on tomatoes stored
at 20°C and ~99%RH, (ii) to have only a relatively minor influence on the postharvest
quality of tomatoes under these active MA conditions, and (iii) to promote only a small
apparent uptake of hexanal from the atmosphere by the tomatoes.
The effective hexanal permeabilities of Tyvek, LDPE and OPP sachet films were
characterised using the isostatic method and shown to exhibit a dependence on both
temperature (10 and 20°C) and concentration (over a range of 0.01-0.22 mol⋅m-3). Average
permeabilities decreased in the order of Tyvek > LDPE > OPP, respectively, at all
temperatures at comparable hexanal partial pressures.
Hexanal sorption isotherms for silica gel at both 10 and 20ºC were determined using the
gravimetric method and were reasonably well described by the Langmuir equation. The
equilibrium amount adsorbed was significantly reduced at the higher temperature but the
ii Mathematical Modelling of Active Packaging Systems for Horticultural Products
pre-adsorption of water vapour on hexanal uptake on silica gel showed no uniform trend on
the sorption characteristics suggesting that multicomponent sorption is complex.
A generalised modelling methodology was developed through conceptualising key mass
transfer processes involved in these active MA packaging systems. Quantitative methods
for deciding the relative importance of each process were established together with
guidelines for when simplifying assumptions could be made. This information was
formalised into a decision tree to allow appropriate assumptions to be made in model
formulation without unacceptable loss of model accuracy. Methods to develop generalised
equations from these assumptions to describe changes in the sachet, package headspace
and outer bag film with respect to an active agent and MA gases were then identified.
The mathematical modelling methodology was applied to the example hexanal release
active MAP tomato packaging system. For these systems there was a high initial peak in
package headspace concentration during the first 24 h which declined to a quasi steady-
state concentration over a period of days. The quasi steady-state headspace concentrations
were generally in the MIC range and were well predicted by the model. Interactions
between water vapour and silica gel may have been responsible for the relatively higher
hexanal concentration at the onset of release from the Tyvek sachet (a highly porous
material). However the influence of water vapour (>95% RH in the MA bag containing
tomatoes) during the quasi steady-state period appeared to be insignificant for all sachet
films.
The model was successfully applied to a range of packaging configurations and storage
temperatures. A lack of fit was evident between model predictions and experimental trials
during the initial (unsteady-state) stages of the release pattern for both headspace vapour
concentrations and adsorbed mass on the silica gel. These differences were attributed to (i)
model input uncertainties, chiefly with regard to the estimated coefficients of both the
Langmuir isotherm equation and film permeability, and (ii) overestimated effective
permeability values predicted by extrapolation of the concentration dependence of film
permeability beyond the conditions for which the permeability was measured. These
results suggest improved models for the effective permeabilities of the films, quantified
under a range of vapour concentrations and concentration gradients, are required for better
describing fluxes across the sachet film.
Abstract
iii
Despite these limitations, the model did describe the general release pattern. The model
was then used to pose a range of ‘what-if’ scenarios investigating the release patterns
predicted for different active packaging designs. This analysis gave useful insights into
how sorption isotherm shape and package/sachet design parameters can be manipulated to
achieve different volatile release platforms.
The work clearly demonstrated the importance of accurate data for permeability of volatile
compounds through polymer films and for sorption of the active agent on the carrier phase.
More work on characterising these systems is recommended to further improve model-
based design methods for active MAP systems.
Overall the generalised methodology developed can be confidently adopted for
constructing a mathematical model that provides sufficient accuracy and simplicity to be
implemented for designing active packaging systems for horticultural and food products.

iv Mathematical Modelling of Active Packaging Systems for Horticultural Products

Acknowledgement
v
ACKNOWLEDGEMENTS
I wish to express my appreciation to the following who supported me and were involved in
this thesis:
Associate Professor John Mawson (Chief), Associate Professor John Bronlund, and Dr.
Ken Wong, for your supervison, inspiring wisdom, professional attitudes, solid
confidences and allocating the financial support for experimental work on active packaging
technology as part of contract no. CO4X0401 from the Foundation for Research Science &
Technology (FRST), which assisted greatly in completion of this project.
Lex Dillon and Peter Wilson, NZ Hothouse Ltd. (Auckland, New Zealand) for supplying
fresh tomatoes and commercial information necessary for experimental planning and for
other discussions. Also staff at MG Palmerston North Ltd. for their assistance in
transporting and stocking tomatoes.
Sue Nicholson, Peter Jeffery, Byron McKillop, John Edwards, John Syke, Ann-Marie
Jackson, John Pedley and Garry Radford for assistance and guidance in making and/or
maintaining experimental equipment. Dr. Lian-Heng Cheah (Crop and Food Research Ltd.,
Palmerston North , New Zealand), Dr. Narumol Matan (Walailuk University, Na Khorn Sri
Thammarat, Thailand) and Jon Palmer for guidance and assistance in microbiological
work. Dr. Bruce Mackay for his professional skill in statistics, and discussing statistical
analyses. Yvonne Parkes, and Dianne Reilly for administrative details throughout the
study.
Postgraduates at Fresh Technologies, IFNHH, Massey University, including Andrew
Nevins, Usha Gaddam, Pittiporn Ounsuvan, Thammarat Pranamornkit, Jantana
Suntudprom, Rattanawan Jansasithorn, and in particular Wattana Pongjaruwat, for
discussing and challenging knowledge and details of postharvest and packaging
technologies. Former Fresh Technologies associates including Dr. David Tanner, Mr. Tom
Robertson, Dr. Maarten Hertog, Dr. Henry Sabarez, and Dr. Kate Maguire for inspiring me
to studying further at the doctorate level.

vi Mathematical Modelling of Active Packaging Systems for Horticultural Products
Ms. Gabrielle J. Eustace (or ‘mum Gay’ my host kiwi mother; 7 Moerangi St. Palmerston
North) for providing food, shelter, love and care for me and my family.Your kindness and
patience are also so wonderful. Thai friends (especially Duljira, Angkana, Chanapa,
Wattana, Suppanikar and Piyawan) for being kind, caring and helpful and endorsing
greatness of friendship.
Professor Ian and Mrs. Blondie Warrington for love, care and assistance for all study needs
and family settlement, and particularly Blondie for providing invaluable and tireless
midwifery care.
The Royal Thai government for proving a full doctoral scholarship. The Faculty of
Agriculture, Ubon Ratachathani University for official grant support for me to be
successful as a scholarship recipient and to complete this study.
Finally, I would like to thank my wife (Grittaya) for your understanding and supports on
contributions required for this project and your exceptionally good motherhood in looking
after and raising our beloved daughter (Norakamol). Thanks also for my family (both the
Uttos and the Chaisiwamongkols) for their support and encouragement.
Weerawate Utto September, 2008
Table of Contents
vii
Table of contents
Abstract..................................................................................................................................i
Acknowledgements ..............................................................................................................v
List of Nomenclatures........................................................................................................xv
List of Figures..................................................................................................................xxiii
List of Tables .................................................................................................................xxxiii
Chapter 1 ...........................................................................................................................1-1
Introduction.......................................................................................................................1-1
1.1 Background...............................................................................................................1-1
1.2 Research aim.............................................................................................................1-3
1.3 Research objectives...................................................................................................1-3
1.4 Structure of thesis .....................................................................................................1-4
Chapter 2 ...........................................................................................................................2-1
Literature review ..............................................................................................................2-1
2.1 Introduction...............................................................................................................2-1
2.2 Overview of active packaging technologies for horticultural products ....................2-1
2.2.1 Active packaging requirements for horticultural products ................................2-1
2.2.2 Oxygen-scavengers............................................................................................2-2
2.2.3 Carbon dioxide-scavengers or emitters, and dual-active systems .....................2-2
2.2.4 Atmospheric control via temperature compensating films ................................2-3
2.2.5 Water vapour regulators.....................................................................................2-4
2.2.6 Ethylene regulators ............................................................................................2-5
2.2.7 Antimicrobial packaging....................................................................................2-6
2.2.8 Other interesting trends and developments........................................................2-8
2.3 Modelling active modified atmosphere packaging (Active MAP) for horticultural
products...........................................................................................................................2-9
2.4 Sorption isotherms of active agents ........................................................................2-11
2.5 Controlled release of active agents to the package atmosphere..............................2-18
2.5.1 Desorption........................................................................................................2-19

viii Mathematical Modelling of Active Packaging Systems for Horticultural Products
2.5.1.1 Models based on diffusion resistance ...................................................... 2-20
2.5.1.2 Models based on instantaneous mass transfer.......................................... 2-20
2.5.2 Diffusion through mass transfer controlling polymeric film structures.......... 2-22
2.6 Permeation through packaging materials............................................................... 2-27
2.6.1 Polymer film materials: non-perforated and perforated films ........................ 2-27
2.6.2 Paper-based packaging materials .................................................................... 2-29
2.7 Interactions of active agents and horticultural products ........................................ 2-30
2.8 Summary ................................................................................................................ 2-32
Chapter 3 .......................................................................................................................... 3-1
The effects of active agents on postharvest quality: Hexanal vapour and tomato model
system ................................................................................................................................ 3-1
3.1 Introduction.............................................................................................................. 3-1
3.2 Antifungal activity of hexanal vapour and its effects on tomato physiology and
quality............................................................................................................................. 3-3
3.2.1 Materials and methods ...................................................................................... 3-3
3.2.2 Results and discussion ...................................................................................... 3-7
3.3 Apparent rate of uptake of hexanal vapour by tomatoes ....................................... 3-14
3.3.1 Materials and methods .................................................................................... 3-15
3.3.2 Results and discussion .................................................................................... 3-16
3.4 Effects of modified atmosphere conditions on apparent rate of hexanal uptake by
tomatoes ....................................................................................................................... 3-21
3.4.1 Experimental settings...................................................................................... 3-21
3.4.2 Results and discussion .................................................................................... 3-23
3.5 Summary ................................................................................................................ 3-26
Chapter 4 .......................................................................................................................... 4-1
Evaluating the physico-chemical properties of hexanal vapour and silica gel
adsorbents for active packaging applications................................................................ 4-1
4.1 Introduction.............................................................................................................. 4-1
4.2 Determination of effective film permeability to hexanal vapour............................. 4-1
4.2.1 Experimental procedures .................................................................................. 4-3
4.2.2 Results and discussion, part I : Overall effective permeability and concentration
dependent characteristics ........................................................................................... 4-7
Table of Contents
ix
4.2.3 Results and discussion, part II: Comparison of experimentally measured
permeabilities with published data ...........................................................................4-14
4.2.3.1 Tyvek film ..............................................................................................4-14
4.2.3.2 OPP film ...................................................................................................4-15
4.2.3.3 LDPE film.................................................................................................4-19
4.2.3.4 Concluding remarks from the comparison of experimental and literature
data........................................................................................................................4-24
4.3 Determination of hexanal sorption isotherms for silica gel adsorbents..................4-24
4.3.1 Approaches for determining sorption isotherms..............................................4-25
4.3.2 Experimental procedures .................................................................................4-26
4.3.3 Preliminary validation of the gravimetric sorption method.............................4-27
4.3.4 Hexanal sorption isotherms for silica gel adsorbents ......................................4-29
4.3.5 Determinations of the effects of relative humidity on hexanal sorption..........4-34
4.4 Summary.................................................................................................................4-37
Chapter 5 ...........................................................................................................................5-1
Development of conceptual and mathematical models for active MAP of horticultural
products .............................................................................................................................5-1
5.1 Introduction...............................................................................................................5-1
5.2 Conceptual model of an active MAP system for horticultural products...................5-2
5.3 Assumptions for conceptual model development .....................................................5-4
5.4 Primary (P) level assumptions ..................................................................................5-4
5.4.1 Assumption P1: The gas phase of the active packaging system can be considered
as ideal ........................................................................................................................5-4
5.4.2 Assumption P2: All model compartments are in local thermal equilibrium .....5-4
5.4.3 Assumption P3: Mass transfer of the active agent from the sachet can be
modelled in 1-dimension ............................................................................................5-5
5.4.4 Assumption P4: Uniform concentrations of active agents in the package
headspace ....................................................................................................................5-5
5.4.5 Assumption P5: Negligible contribution of active agent accumulation to changes
in package volume and total pressure .........................................................................5-7
5.5 Secondary level assumptions ....................................................................................5-8
5.5.1 Modelling of controlled release sachet systems ( iscflr ).......................................5-9
5.5.1.1 Modelling mass transfer within the active agent carrier.............................5-9
x Mathematical Modelling of Active Packaging Systems for Horticultural Products
5.5.1.2 Modelling mass transfer across the sachet film material ......................... 5-11
5.5.2 Modelling packaging film material ( ipkflr ) ...................................................... 5-17
5.5.3 Modelling the active agent interaction with the product ( ifrr )........................ 5-20
5.5.4 Modelling accumulation in the package headspace ( ipkhsr ) ............................. 5-22
5.6 A comprehensive decision tree for the design of active packaging system for
horticultural products ................................................................................................... 5-24
5.7 Mathematical model formulation for the Hexanal/Silica gel/Tomato active MAP
system........................................................................................................................... 5-27
5.7.1 Rate of hexanal release from sachet................................................................ 5-27
5.7.2 Rate of hexanal transfer across the packaging film material .......................... 5-28
5.7.3 Apparent rate of hexanal uptake by tomatoes................................................. 5-30
5.7.4 Rate of accumulation of CO2 and O2 in package headspace (passive MAP) . 5-30
5.8 Numerical solution of overall transport model ...................................................... 5-31
5.8.1 MATLAB solver for numerical solutions....................................................... 5-31
5.8.2 Finite difference solutions for PDE models.................................................... 5-32
5.8.2.1 Explicit finite different scheme................................................................ 5-32
5.8.2.2 The grid and finite difference approximations......................................... 5-33
5.8.2.3 ODE equations for film nodes ................................................................. 5-33
5.8.2.3.1 For surfaces of the film (nodes j = 1 and j = J +1) ....................... 5-33
5.8.2.3.2 For internal film (nodes j = 2 : J) ..................................................... 5-34
5.8.3 The global mathematical model...................................................................... 5-35
5.8.4 MATLAB® language codes ............................................................................ 5-36
5.8.5 Model checking: Checks against analytical solutions and numerical error
checking ................................................................................................................... 5-36
5.9 Summary ................................................................................................................ 5-37
Chapter 6 .......................................................................................................................... 6-1
Mathematical model validation ...................................................................................... 6-1
6.1 Introduction.............................................................................................................. 6-1
6.2 Experiments used in validating the mathematical models ....................................... 6-1
6.3 Model input data and sensitivity analysis ................................................................ 6-4
6.4 Experimental results and discussion of model performance.................................... 6-6
6.4.1 Effects of sachet loading on the package headspace hexanal concentration .... 6-6
Table of Contents
xi
6.4.1.1 Model predictions for packages containing sealed glass jars .....................6-6
6.4.1.2 Model predictions for packages containing tomatoes...............................6-16
6.4.2 Effects of the ratio of sachet to package surface area ( Aω ) on the package
headspace hexanal concentrations ............................................................................6-22
6.4.3 Effects of the type of sachet film on the package headspace hexanal
concentration.............................................................................................................6-23
6.4.3.1 OPP sachet film ........................................................................................6-24
6.4.3.2 Tyvek sachet film ...................................................................................6-26
6.4.4 Effects of storage temperature on the package headspace hexanal concentrations
..................................................................................................................................6-30
6.4.5 Changes of hexanal adsorbed amount on silica gel .........................................6-37
6.4.5.1 Materials and methods ..............................................................................6-37
6.4.5.2 Results and discussion ..............................................................................6-38
6.5 Summary.................................................................................................................6-46
Chapter 7 ...........................................................................................................................7-1
Mathematical model applications....................................................................................7-1
7.1 Introduction...............................................................................................................7-1
7.2 Effects of isotherm types on hexanal release patterns ..............................................7-1
7.3 Effects of isotherm shape on flux of hexanal across the sachet boundary .............7-14
7.3.1 Changes of flux as a function of isotherm shape .............................................7-14
7.3.2 Changes of flux as a function of time with regard to sorption isotherm shapes..7-
16
7.4 Conceptual designs of ethanol vapour active MAP systems ..................................7-19
7.5 Summary.................................................................................................................7-25
Chapter 8 ...........................................................................................................................8-1
General discussion and conclusions ................................................................................8-1
8.1 General discussion ....................................................................................................8-1
8.2 Conclusions...............................................................................................................8-9
8.3 Suggestions for future research...............................................................................8-10
References..........................................................................................................................9-1
Appendix A.......................................................................................................................A-1
xii Mathematical Modelling of Active Packaging Systems for Horticultural Products
Active packaging technologies for horticultural produce ........................................... A-1
Appendix B .......................................................................................................................B-1
Hexanal reduces infection of tomatoes by Botrytis cinerea whilst maintaining quality
............................................................................................................................................B-1
Appendix C ...................................................................................................................... C-1
Gas chromatographic analysis procedures................................................................... C-1
Appendix D ...................................................................................................................... D-1
Modelling mass transfer across film.............................................................................. D-1
D.1 Derivations of mathematical models describing rate of hexanal release from sachet to
package headspace ............................................................................................................ D-1
D.2 Modelling concentration gradients and fluxes across experimentally utilised films . D-4
D.2.1 Modelling concentration gradients.......................................................................... D-4
D.2.2 Modelling fluxes ..................................................................................................... D-4
D.3 Alternative model describing the rate of hexanal release from sachet to package
headspace (based on an assumption of the Langmuir relationship between hexanal vapour
and LDPE film sorption)................................................................................................... D-5
Appendix E .......................................................................................................................E-1
Comparison of hexanal sorption isotherm for silica gel adsorbents estimated by
different methods .............................................................................................................E-1
E.1 Verification using IGC techniques ..............................................................................E-1
E.2 Isotherm determination by pulse IGC method ............................................................E-1
E.2.1 Experimental procedures of pulse IGC ....................................................................E-1
E.2.2 Results and discussion of pulse IGC ........................................................................E-2
E.3 Isotherm determination by frontal IGC method ..........................................................E-3
E.3.1 Experimental procedures ..........................................................................................E-3
E.3.2 Results and discussion of FIGC................................................................................E-4
E.4 Isotherm determinations by the volumetric sorption method......................................E-6
E.4.1 Experimental procedures ..........................................................................................E-6
E.4.2 Results and discussion ..............................................................................................E-6
E.5 Linearisation of Langmuir model (following (Ratkowsky 1990)) ............................E-11

Table of Contents
xiii
E.6 Sorption isotherms of hexanal vapour for silica gel at 10 and 20ºC (presented in molar
units) ................................................................................................................................ E-12
Appendix F ....................................................................................................................... F-1
Formulation of global mathematical models................................................................. F-1
F.1 Calculations of Bi values for hexanal mass transfer in sachet and package headspace F-
1
F.2 Scaling analyses........................................................................................................... F-1
F.2.1 Scaling considered at sachet film material ............................................................... F-2
F.2.2 Scaling considered at packaging film..................................................................... F-10
F.3 Derivations of mathematical models for exploring the effects of capacity ratios
( scflpkhsCR and pkflpkhsCR ; Chapter 5) on modelling 1-MCP accumulation in package
headspace ......................................................................................................................... F-16
F.3.1 Modelling 1-MCP accumulation in package headspace based on ‘Modes of mass
transfer across sachet film material’ ................................................................................ F-16
F.3.2 Modelling 1-MCP accumulations in package headspace based on ‘Modes of mass
transfer across packaging film material’.......................................................................... F-18
F.3.3 Numerical solutions for 1-MCP accumulation in package headspace investigations…
......................................................................................................................................... F-19
F.4 Calculation of scflbedCR , scflpkhsCR , and pkflpkhsCR for hexanal-active MAP system
.................................................................................................................................... ….F-19
Appendix G...................................................................................................................... G-1
Numerical solutions ........................................................................................................ G-1
G.1 Numerical solution for the global model describing hexanal concentration
accumulation in the package headspace ............................................................................G-1
G.1.1 Function file (Hexanal_ActivePkgSim.m)...............................................................G-1
G.1.2 Script file (Hexanal_ActivePkgSimrun.m)..............................................................G-2
G.2 MATLAB language for the global model for predicting accumulations of O2 and CO2
in active MAP for tomatoes ...............................................................................................G-5
G.2.1 Function file (PassiveMAP.m).................................................................................G-5
G.2.2 Script file (PassiveMAPrun.m)................................................................................G-6
G.2.3 Model inputs for simulations of O2 and CO2 ...........................................................G-7
xiv Mathematical Modelling of Active Packaging Systems for Horticultural Products
G.3 Analytical solution for mean hexanal vapour concentration in the packaging film (PDE
modelling approach) ......................................................................................................... G-7
G.4 Analytical solution for hexanal permeation across the sachet film (steady-state
modelling approach) ....................................................................................................... G-10
Appendix H...................................................................................................................... H-1
Model validations ............................................................................................................ H-1
H.1 Controlled release sachet preparations....................................................................... H-1
H.2 Summary of sensitivity analyses of model validations .............................................. H-2

List of Nomenclatures
xv
LIST OF NOMENCLATURES
filmA = Film area (m2)
scflA = Sachet film surface area (m2)
pkflA = Packaging film surface area (m2)
frA = Fruit surface area (m2)
Hxlexpa = Coefficient of the hexanal exponential isotherm equation (g·g-1)
iGCA = Area of gas chromatogram peak from the injected volume of sample (area)
iLgmb = Langmuir constant (m3·mol-1)
filmb = Fitted exponential coefficient of effective permeability to hexanal of the
film (m3·mol-1)
Tyvekb ,
LDPEb ,
OPPb
= Fitted exponential coefficient of effective permeability to hexanal of
Tyvek, LDPE and OPP films, respectively (m3·mol-1)
Hxl
C10,Lgmb
o,
Hxl
C20,Lgmb
o
= Langmuir coefficients at 10 and 20ºC (dimensionless), respectively
Bi = Biot number for mass transfer (dimensionless)
scflb = Fitted exponential model coefficient of effective permeability to hexanal
vapour of sachet film material (m3·mol-1)
HxlLgmb = Langmuir constant of hexanal sorption (m3·mol-1)
pkflb = Fitted exponential model coefficient for effective permeability to hexanal
vapour of packaging film material (m3·mol-1)
Hxlexpb = Coefficient of the hexanal exponential isotherm equation (dimensionless)
phasegasC = Equilibrium concentration in gas phase (mol·m-3)
ifilmC = Concentration of the diffusant i in film (mol·m-3)
ifilmC∆ = Concentration difference of diffusant i between the two sides of the film
(mol·m-3)
igC = Equilibrium vapour concentration (or pressure) of adsorbate i with
adsorbents (gas phase, mol·m-3)

xvi Mathematical Modelling of Active Packaging Systems for Horticultural Products
isC = Equilibrium adsorbed amount of adsorbate i on adsorbents (solid phase,
mol·g-1)
imax,sC = Maximum adsorbed amount of adsorbate i on adsorbent estimated by
Langmuir sorption isotherm (mol·g-1)
Hxlinlet
C = Inlet hexanal concentration (mol·m-3)
Hxloutlet
C = Outlet hexanal concentration (mol·m-3)
Hxlconc,h
C,
Hxlconc,l
C
= Hexanal concentration at the high and low concentration side of the film,
respectively (mol·m-3)
HxlavgC = Effective mean of hexanal concentrations measured in both chambers of
the permeability cell at steady-state (mol⋅m-3)
Hxl
filmx,gC = Hexanal concentration in the gas phase which is equilibrium with film at
position x in film material ( filmx ) (mol⋅m-3)
phasepaperC = Equilibrium concentration in paper phase (mol·g-1)
i0,scflC = Concentration of active agent i in sachet film at x = 0, facing the carrier
bed (mol⋅m-3)
i
scflL,scflC = Concentration of active agent i in the sachet film at x = scflL , facing the
package headspace (mol⋅m-3)
i0,pkflC = Concentration of active agent i in the film at x = 0, facing the package
headspace (mol⋅m-3)
i
pkflL,pkflC
= Concentration of active agent i in the film at x = pkflL , facing the
surrounding environment (mol⋅m-3)
2O
ext,frC ,
2O
int,frC
= Concentration of gas O2 in external and internal fruit, respectively
(mol·m-3)
2SO
frC = Concentration of SO2 dissolved in fruit (mol·m
-3)
2SO
e,frC
= Equilibrium concentration representing the maximum SO2 concentration
attained in the corn (mol·m-3)
iair,frC = Concentration of active agent i surrounding fruit (mol·m-3)
ipkhs
C = Concentration of active agent i in package headspace (mol·m-3)
Hxlbed,gC = Equilibrium hexanal vapour concentration above the carrier bed
(mol·m-3)

List of Nomenclatures
xvii
HxlpkhsC = Hexanal vapour concentration in the package headspace (mol·m-3)
HxlsatC = Saturated hexanal vapour concentration at a given temperature
(mol·m-3)
Hxlbed,sC = Equilibrium adsorbed amount of hexanal on the carrier bed
(mol·g-1)
Hxlmax,sC = Maximum amount of hexanal adsorbed on the carrier estimated by the
Langmuir sorption isotherm (mol·g-1)
HxlenvC = Hexanal concentration in the bulk environment surrounding the outer bag
(mol⋅m-3)
Hxl1,g
C ,
Hxl1J,g
C +
= Equilibrium hexanal vapour concentration in the packaging film, at the
discrete nodes 1j = and 1Jj += , respectively (mol⋅m-3)
Hxlj,gC = Equilibrium hexanal vapour concentration in the packaging film at
discrete node J:2j = (mol⋅m-3)
Hxli,bed,sC = Initial hexanal adsorbed amount of the carrier bed (mol⋅g-1)
iC = Concentration of VOC i (mol·m-3)
HxlscflC = Hexanal concentration in sachet film (mol·m-3)
Hxl
scflx,gC = Hexanal concentration in gas phase which is in equilibrium with the sachet
film material at a position x ( scflx ) (mol·m-3)
ipkhsC = Concentration of active agent i in package headspace (mol·m-3)
iscflC = Concentration of active agent i in sachet film (mol·m-3)
ibed,gC = Equilibrium concentration of active agent i above the carrier bed
(mol·m-3)
ibed,sC = Equilibrium adsorbed amount of active agent i on the carrier bed
(mol·g-1)
iini,bed,sC = Initial value of equilibrium adsorbed amount of active agent i on the
carrier bed (mol·g-1)
iini,pkhsC = Initial value of concentration of active agent i in package headspace
(mol·m-3)
ipkflC = Concentration of active agent i in packaging film (mol·m-3)
i0,pkflC = Concentration of active agent i in packaging film at 0x pkfl =

xviii Mathematical Modelling of Active Packaging Systems for Horticultural Products
i
pkflL,pkflC = Concentration of active agent i in packaging film at pkflpkfl Lx =
ienvC = Concentration of active agent i in surrounding environment (mol·m-3)
MCPsatC = 1-MCP saturated vapour concentration (mol·m-3)
MCPscflC = 1-MCP concentration in sachet film (mol·m-3)
MCPpkflC = 1-MCP concentration in packaging film (mol·m-3)
MCPenvC = 1-MCP concentration in environment (mol·m-3)
Hxl
0,scflC = Hexanal concentration in sachet film at position 0x scfl = (mol·m-3)
HxlsatC = Saturated hexanal vapour concentration (mol·m-3) (i.e. 0.46 mol·m-3, at
20ºC)
Hxlini,pkfl,gC = Initial equilibrium concentration of hexanal vapour in packaging film
(mol·m-3)
Hxlavg,pkfl,gC = Mean equilibrium concentration of hexanal vapour in film (mol·m
-3)
D = Mass diffusivity (m2·s-1)
HxlscflD = Hexanal mass diffusivity in the sachet film (m2·s-1)
d = Integration constant (mol⋅m-1⋅s-1)
ifilmD
= Diffusivity of diffusant i in film (m2·s-1)
iscflD = Mass diffusivity of active agent i in sachet film (m2·s-1)
ipkflD = Mass diffusivity of active agent i in packaging film (m2·s-1)
2SO
frD
= Effective mass diffusivity of SO2 dissolved in fruit (m
2·s-1)
MCPscflD = Mass diffusivity of 1-MCP in sachet film (m2·s-1)
MCPpkflD = Mass diffusivity of 1-MCP in packaging film (m2·s-1)
Ea = Energy of activation (J⋅mol-1)
0F = Fourier number (dimensionless)
oG∆ = Free energy (J⋅mol-1)
sH∆ = Heat of solution for the permeant gas (J·mol-1)
oH∆ = Apparent enthalpy change (J⋅mol-1)
filmJ
= Steady-state flux across film (mol·s-1· m-2)
ifilmJ
= Steady-state diffusion flux of diffusant i in film (mol·m-2·s-1)
List of Nomenclatures
xix
scflJ = Steady-state flux at sachet boundary (mol·s-1·m-2)
iLinK = Linear isotherm constant or partition coefficient of adsorbate i (m3·g-1)
iFrdK = Freundlich constant (mol Frdn1 − ⋅m Frdn3 ·g-1)
airpaperK = Partition coefficient (m3·g-1)
Hxlreac,tomk = Coefficient of reaction rate of hexanal and tomatoes (µmol·s-1·kg-1·
( m3·mol-1) reacn )
k = Surface mass transfer coefficient (m·s-1)
ibedK = Coefficient of the linear desorption isotherm of active agent i for the
carrier (adsorbent) bed (m3⋅g-1)
MCPbedK = Coefficient of linear sorption isotherm of 1-MCP for silica gel as
reported by Lee (2003) (m3⋅g-1)
2O
frk = Fruit skin permeance to gas O2 (m·s
-1)
ireac,frk = Rate coefficient for the reaction of the active agent i and fruit
(mol·s-1·kg-1 (m3·mol-1) reacn )
2mOk = Michaelis-Menten constant for O2 consumption (kPa)
HxlLinK = Coefficient of the hexanal linear isotherm equation (g·g-1)
iGCK = Detector response or slope (mol·area-1) of standard curve of VOC i as
shown in Figure C-1
Hxl1,Lgmflk = Coefficient of Langmuir relationship between hexanal vapour and
LDPE film sorption (m3·mol-1)
Hxl2,Lgmflk = Coefficient of Langmuir relationship between hexanal vapour and
LDPE film sorption (dimensionless)
scflk = Constant in simplified ODE (s-1)
filmL
= Film thickness (m)
scflL = Sachet film material thickness (m)
pkflL = Packaging film material thickness (m)
L = Characteristic dimension of bag (m)
li = Log integral function
tomM = Mass of tomatoes (kg)
bedM = Mass of the carrier bed (free of the mass of active agent i) (g)
m = Term in series solution (given as 5 terms)
xx Mathematical Modelling of Active Packaging Systems for Horticultural Products
ifilmN = Steady-state rate of transfer of gas i across the film (mol⋅s-1)
Frdn = Exponential factor ( 1n0 Frd << ) in Freundlich equation (dimensionless)
reacn = Order of reaction rate (dimensionless)
2O
frN = Steady-state rate of transfer of gas O2 across fruit skin (mol·s
-1)
2O
pkhsn = Number of oxygen moles in package headspace (mol)
2CO
pkhsn = Number of carbon dioxide moles in package headspace (mol)
ifilmp∆ = Partial pressure differential of gas i at both sides of film surfaces (Pa)
ifilmP = Permeability to permeant i of the film (mol⋅m⋅s-1⋅m-2⋅Pa-1)
i0,filmP = Fitted pre-exponential factor for permeability to permeant i of the film
(mol·m·m-2·s-1·Pa-1)
Hxlfilm
P = Effective film permeability to hexanal (mol·m·m-2·s-1·Pa-1)
Hxl0,film
P = Fitted pre-exponential factor for effective permeability to hexanal of the
film (pmol·m·m-2·s-1·Pa-1)
Hxl0,TyvekP ,
Hxl0,LDPEP ,
Hxl0,OPPP
= Fitted pre-exponential factor for effective permeability to hexanal of
Tyvek, LDPE and OPP films, respectively (pmol·m·m-2·s-1·Pa-1)
Hxl0,scfl
P = Pre-exponential factor of effective permeability to hexanal vapour of sachet
film material (mol·m·m-2·s-1·Pa-1)
Hxl0,pkflP = Fitted pre-exponential factor for effective permeability to hexanal vapour of
packaging film material (mol·m·m-2·s-1·Pa-1)
2O
pkflP = Film permeability to O2 (mol·m·m
-2·s-1·Pa-1)
2CO
pkflP = Film permeability to CO2 (mol·m·m
-2·s-1·Pa-1)
2O
pkhsp = O2 partial pressure in the package headspace (kPa)
2O
envp = O2 partial pressure in the bulk environment (kPa)
2COenvp = CO2 partial pressure in the bulk environment (kPa)
2CO
pkhsp = CO2 partial pressure in the package headspace (kPa)
iscflP = Permeability to active agent i of sachet film material
(mol·m·m-2·s-1·Pa-1)

List of Nomenclatures
xxi
ipkflP = Permeability to active agent i of packaging film material (mol·m·m-2·
s-1·Pa-1)
MCPscflP = Sachet film permeability to 1-MCP vapour (mol·m·m-2·s-1·Pa-1)
MCPpkflP = Packaging film permeability to 1-MCP vapour (mol·m·m-2·s-1·Pa-1)
HxlpkflP = Permeability to hexanal vapour of the packaging film (m2·s-1)
outletQ = Outgoing flowrate (m3·s-1)
outconc,l
Q = Outlet gas flowrate from the low hexanal concentration side of the film
(m3·s-1)
R = Gas constant (8.314 J⋅mol-1⋅ K-1)
Hxltomr = Apparent rates of uptakes of hexanal vapour by tomatoes (mol·s-1·kg-1)
scflr = Rate of changes of active agent concentration in the sachet film
(dimensionless)
bedr = Rate of changes of active agent concentration in carrier bed
(dimensionless)
pkhsr = Rate of changes of active agent concentration in package headspace
(dimensionless)
pkflr = Rate of changes of active agent concentration in the packaging film
(dimensionless)
2SO
frr = Reaction rate of SO2 and corn (mol·m
-3·s-1) which Haros et al. (2005)
assumed to follow first order kinetics
frR = Radius of fruit (assumed to be spherical) (m)
ifrr = Reaction rate of between active agent i and fruit (mol·s-1·kg-1)
ipkhsr = Rate of accumulation of active agent i in package headspace (mol·s-1)
Hxlscflr = Rate of hexanal permeation through the sachet film material
(mol·s-1)
Hxlpkflr = Rate of hexanal permeation through the packaging film material
(mol·s-1)
2Or = Rate of O2 consumption by respiration (mol·s-1·kg-1)
max
O2r = Maximum O2 consumption rate (mol·kg
-1·s-1)
2COr = Rate of respiratory CO2 production (mol·s-1·kg-1)
pkflR = Half thickness of film (m)

xxii Mathematical Modelling of Active Packaging Systems for Horticultural Products
ifilmS
= Solubility coefficient of gas i into film (mol⋅m-3⋅Pa-1)
i0,film
S = Fitted pre-exponential factor for solubility to permeant i of the film
(mol·m-3·Pa-1)
oS∆ = Entropy (J⋅mol-1⋅K-1)
iscflS = Sachet film solubility to active agent i (mol·m-3·Pa-1)
MCPscflS = Sachet film solubility to1-MCP as reported by Lee (2003)
(mol·m-3·Pa-1)
ipkflS = Packaging film solubility to active agent i (mol⋅m-3⋅Pa-1)
HxlscflS = Sachet film solubility to hexanal (mol·m-3·Pa-1)
MCPscflS = Sachet film solubility to 1-MCP (mol·m-3·Pa-1)
MCP
pkflS = Packaging film solubility to 1-MCP (mol·m-3·Pa-1)
HxlpkflS = Packaging film solubility to hexanal vapour (mol·m-3·Pa-1)
filmT
= Measured film temperatures (K)
C10T
o ,
C20T
o
= Temperature (K) for 10 and 20ºC, respectively
pkgT = Temperature of package (K)
t = Time (s)
pkgV = Volume of package (m3)
injVol = Injected volume of sample (m3)
filmx = Position in film (m)
frx = Position in fruit (m)
pkflx = Position in packaging film material (m)
scflx = Position in sachet film (m)
avgY = Fraction unaccomplished change of concentration (dimensionless)
Hxl
LgmflZ = Fitted coefficient of Langmuir relationship for hexanal vapour sorption
on LDPE film (mol·s-1·m-2)
List of Figures
xxiii
LIST OF FIGURES
Figure 2-1 Brunauer’s five types of adsorption isotherm of which adsV , p , 0p and B
representing sorption extents (volume), pressure, saturated pressure, and a knee of the
curve indicating a completion of a monolayer (reprinted from Adamson 1990).........2-14
Figure 2-2 Adsorption isotherm of 1-MCP on silica gel at 50, 60, 70, and 80°°°°C (digitally
redrawn from Lee 2003); lines representing the Linear adsorption isotherm model (Eq.
2-2). ..............................................................................................................................2-15
Figure 2-3 Mass transport steps during adsorption by a porous adsorbent (redrawn after
Weber 1985).................................................................................................................2-19
Figure 3-1 Hexanal exposure system comprising with 2 key compartments: an exposure
chamber (a 5 L glass desiccators) and the 250 ml glass bubbling tubes........................3-4
Figure 3-2 Hexanal concentrations during the continuous exposure period (3 replicates
shown for each sampling time) ......................................................................................3-8
Figure 3-3 Tomatoes kept under different gas compositions: 40-70 ppm, at day 7 (A), 5-15
ppm on day 2 and day 4, respectively (B and C), and day 2 after leaving 40-160 ppm
treated tomatoes in the ambient condition (D)...............................................................3-9
Figure 3-4 Respiration (RR), ethylene production (EP), and hue angle (Hue) of tomatoes
exposed to hexanal vapour through continuous (40-70 ppm) (A) or single dose (200-270
ppm) (B) delivery systems. The symbols ( ◊ ), (οοοο), and (■) represent average results (10
replicates) obtained from day 0, hexanal-treated tomatoes, and control treatments,
respectively. Error bars at day 0 represent standard deviation from the mean. Hexanal
concentrations in the exposure chamber during the storage period were represented by
the symbol (+) in the RR-A graph (3 replicates shown for each sampling time) ........3-11
Figure 3-5 Comparison of skin colours after 7 days storage of tomatoes kept in hexanal-
free air (top row) or continuously exposed to hexanal (bottom row) ..........................3-13
Figure 3-6 Effects of temperature and concentration on apparent uptake rates of hexanal by
tomatoes at 10 and 20ºC (3 replicates for individual treatments shown for each sampling
time). Solid lines were fitted by nonlinear regression using Eq. 3-2; referred to Table
3-4 for model coefficients. ...........................................................................................3-16
Figure 3-7 Hexanal consumption rates by sliced ‘Golden Delicious’ apples, at 5-23ºC
(redrawn from Wolford 1998), and their comparisons to apparent uptake rates by
tomatoes measured in the present work .......................................................................3-19
xxiv Mathematical Modelling of Active Packaging Systems for Horticultural Products
Figure 3-8 Effects of modified atmosphere conditions on apparent hexanal uptake rates of
tomatoes (3 replicates for individual treatments shown for each sampling time)....... 3-23
Figure 3-9 Inlet and outlet hexanal concentrations measured during experiments on the
effects of modified atmosphere (MA) conditions on apparent hexanal uptake rates of
tomatoes (3 replicates for individual treatments shown for each sampling time)....... 3-24
Figure 3-10 Respiration rates of tomatoes at 20ºC measured at different treatments (3
replicates of individual treatments shown for each sampling time)............................ 3-25
Figure 4-1 Experimental set-up for measurement of film permeability to hexanal vapour
(A) and cross section of stainless steel permeability cell (B) (modified from Merts 1996)
....................................................................................................................................... 4-4
Figure 4-2 Effective permeability to hexanal of Tyvek (A), LDPE (B) and OPP (C)
measured at 10 and 20°°°°C. (Three replicates are shown for each concentration difference
tested). The solid lines were fitted using nonlinear regression (Eq. 4-3). Note a different
y-axis scale was chosen for each graph to better represent the data. ............................ 4-8
Figure 4-3 Steady-state concentration gradients predicted using Eq. 4-4 for conditions
when large (as a case of OPP film; dashed and dashed-dotted line) and small and
moderate (as a case of LDPE film; solid and dotted lines, respectively) concentration
gradients. On the x-axis, x= 0 represents the film surface facing the high hexanal
concentration ( Hxlconc,h
C ) and x = 1 the film surface facing against the low concentration
( Hxlconc,l
C ). ....................................................................................................................... 4-12
Figure 4-4 Comparison of sorption isotherms for ethanol and acetaldehyde measured using
the gravimetric sorption method used for silica gel adsorbents for experimental (■) and
literature data (o) reported for ethanol by Madeley & Sing (1959) (A) and acetaldehyde
by Ghosh & Hines (1990) (B). Experimental data were collected at the same
temperatures as the reported data, namely 25°°°°C for ethanol and 14°°°°C for acetaldehyde.
..................................................................................................................................... 4-28
Figure 4-5 Hexanal sorption isotherms for silica gel grade 40 at 10 and 20ºC measured
using a gravimetric sorption approach. Solid lines were fitted using the Langmuir
isotherm model Eq. 2-3. .............................................................................................. 4-29
Figure 5-1 Mass transfer processes for release of volatiles gaseous components in an active
MAP system with enclosed sachet and a horticultural product (subscripts: pkhs , pkfl ,
scfl env and fr represent package headspace, packaging film, sachet film, environment

List of Figures
xxv
and fruit, respectively; superscript i represents active agent i ; MA and RH represent
modified atmosphere and relative humidity, respectively) ............................................5-2
Figure 5-2 Conceptualisations of internal and external resistances of an entire bed of
porous particles encasing in the sachet (A) and individual particles (B; modified from
Weber 1985; Do 1998a where ‘λλλλ’ and ‘d’ symbols represent active agent in the gas
phase and diameter of pore inside the particle, respectively). .......................................5-9
Figure 5-3 Conceptualisation of diffusional modes within the bed (given negligible
concentration gradient within particles): Particle surface diffusion, where the magenta
rings represent thin films through which diffusion occur (A), and gas phase diffusion
within voids available between particle (B).................................................................5-10
Figure 5-4 Simulations of 1-MCP accumulation in the package headspace as predicted by
steady-state and PDE (with the 1st kind of boundary condition) models, represented by
solid and dotted lines, respectively. scflpkhsCR was varied by changing MCPscfl
S values.
.................................................................................................................................….5-16
Figure 5-5 Simulations of 1-MCP accumulation in the package headspace as predicted by
steady-state and PDE (with the 1st kind of boundary condition) models, represented by
solid and dotted lines, respectively. pkflpkhsCR was varied by changing MCPpkflS values.
.................................................................................................................................….5-19
Figure 5-6 A comprehensive decision tree for design of active packaging systems for
horticultural products. The modelling options employed for hexanal based active MAP
for tomatoes are identified by red lines (see over for nomenclatures). ........................5-25
Figure 5-7 Finite difference grid for packaging film........................................................5-33
Figure 6-1 Examples of active MA package containing tomatoes (A) or a sealed glass
container (B)...................................................................................................................6-2
Figure 6-2 Effects of sachet gel loading on hexanal concentration in the headspace of
package ( HxlpkhsC ) containing an inert sealed glass jar, stored at 20°°°°C. Experimental data
(at least 3 replicates shown for each sampling time) of 1.5, 3.0 and 4.5 g loadings are
represented by οοοο, ◊◊◊◊ and ++++ symbols, respectively, for a storage period of 7 days (A), and
for the same data expanded to look at the first 24 h (B). Model predictions for each gel
mass are shown through solid, dotted and dashed lines, respectively. ..........................6-7
Figure 6-3 Model predictions of hexanal partial relative pressures ( spp ) in the package
headspace (dashed line) and sachet headspace (dotted line), and the hexanal mass
xxvi Mathematical Modelling of Active Packaging Systems for Horticultural Products
remaining on the silica gel (solid line) for the LD1 system (1.5 g dried silica gel; Table
6-1). ............................................................................................................................... 6-8
Figure 6-4 Sachet headspace concentration ( Hxlbed,gC ) predicted for hexanal saturated initial
dried silica gel masses of 1.5, 3.0 and 4.5 g (represented by solid, dotted and dashed
lines, respectively)......................................................................................................... 6-9
Figure 6-5 Changes in ethanol concentration in the atmosphere of perforated polyethylene
bags packed with broccoli branchets (digitally redrawn from Suzuki et al. 2004) (A), or
above aw-adjusted PDA plates, packaged with Ethicap type E1 and E4 in high ethanol
barrier pouch (digitally redrawn from Smith et al. 1987; note data on day 7th of E4 + aw
0.85 was not reported) (B)........................................................................................... 6-11
Figure 6-6 Effects of sachet loading on hexanal accumulation in the headspace of package
containing tomatoes kept at 20°°°°C. Experimental data (at least 3 replicates shown for
each sampling time) for loadings of 1.5, 3.0 and 4.5 g are shown in (A), (B) and (C),
respectively, where headspace hexanal concentrations of packages containing either a
sealed jar (οοοο; as previously reported) or and tomatoes (◊◊◊◊) are compared, for which
prediction results were represented by solid and dotted lines, respectively................ 6-17
Figure 6-7 Simulations of hexanal mass remaining on silica gel due to hexanal release from
the sachet to the package headspace (LHS y-axis) and the hexanal mass transferred
through the packaging film or taken up by tomatoes (RHS y-axis). All simulations were
based on LD1 active packaging system containing tomatoes and 1.5g dried silica gel as
the hexanal carrier (Table 6-1). ................................................................................... 6-19
Figure 6-8 Measured and predicted headspace gas at 20ºC (2 replicates shown for each
sampling time) measured in active (οοοο and ••••, for O2 and CO2, respectively) and passive
(◊◊◊◊ and ♦♦♦♦, for O2 and CO2, respectively) MA packages. The dotted and dashed lines are
the MA model predictions........................................................................................... 6-20
Figure 6-9 Measured and predicted hexanal concentration in the active package (at least 3
replicates shown for each sampling time), for different ratios of sachet to bag area ( Aω ):
0.024 (οοοο; LD1), 0.012 (◊◊◊◊; LD5), and 0.048 (++++; LD6), for storage period of 7 days at
20°°°°C (A) and the same data expanded to look at the first 24 h (B). Model predictions are
shown through solid, dotted and dashed lines, respectively. ...................................... 6-23
Figure 6-10 Effects of OPP sachet film on package headspace hexanal concentration (at
least 3 replicates shown for each sampling time) in a LDPE package containing either a
List of Figures
xxvii
sealed glass jar (οοοο) or tomatoes (◊◊◊◊) of which prediction results are represented by solid
and dotted lines, respectively. ......................................................................................6-24
Figure 6-11 Effects of Tyvek sachet film on hexanal accumulation in the headspace of an
LDPE package (at least 3 replicates shown for each sampling time) containing either a
sealed glass jar (οοοο) or tomatoes (◊◊◊◊) of which model prediction results are represented by
solid and dotted lines, respectively. .............................................................................6-26
Figure 6-12 Results of sensitivity analyses of Tyvek-sachet model package containing a
sealed glass jar, by simultaneously varying values of HxlLgmb and a combination of pkflL
and Hxl
LDPEP to change equilibrium sorption characteristics and film permeance,
respectively. Experimental results are represented by black symbols (at least 3 replicates
shown for each sampling time). The solid line represents model predictions using the
original model inputs (A). Model inputs were varied to either minimise (by increasing
sorption affinity and outer film permeance) (B) or maximise (by lowering sorption
affinity and outer film permeance) (C) accumulation of hexanal vapour and these model
predictions are represented by the dotted and dashed lines, respectively. ...................6-29
Figure 6-13 Hexanal concentrations in model packages (at least 3 replicates of individual
treatments shown for each sampling time) with LDPE, OPP and Tyvek as the sachet
film material, at variable 10°°°°C and 20°°°°C storage conditions. Experimentally collected
data for packages containing either a sealed jar (οοοο), or tomatoes (◊◊◊◊) is presented in the
first column (A; suffix ‘all’). Individual sets (B, and C; suffix ‘jar’ and ‘tom’
representing sealed jars and tomatoes, respectively) are presented with model
predictions, where solid and dotted lines describe the predicted results at 10°°°°C and
20°°°°C, respectively. The transitions between 10 and 20ºC occurred at day 7 (10 to 20ºC)
and day 12 (20 to 10ºC) as shown in A (top). ..............................................................6-30
Figure 6-14 Sorption isotherm at 10 and 20ºC (calculated using the Langmuir Equation;
(Eq. 2-3) and coefficients reported in Table 4-9). The letters A, B (and B′′′′), C, and D
represent those points discussed in the text regarding changes to the sorption
equilibrium during temperature transitions..................................................................6-32
Figure 6-15 Experimental and predicted values of hexanal concentration in an LDPE-
sachet package containing a sealed glass jar (at least 3 replicates shown for each
sampling time) during varied storage temperature regimes. Solid and dotted lines
represent model predictions on 10 and 20 ºC (A). Hexanal sorption isotherms at 10 and
20°°°°C were calculated using the Langmuir equation (Eq. 2-3 and coefficients reported in
xxviii Mathematical Modelling of Active Packaging Systems for Horticultural Products
Table 4-9) (labelled as ‘original’), and the isotherm at 20°°°°C when Hxlmax,sC value was
arbitrarily assumed to be the value at 10ºC, with the HxlLgmb value as at 20°°°°C (B). ....... 6-35
Figure 6-16 Results of sensitivity analyses of model package at 10°°°°C containing a sealed
glass jar (at least 3 replicates shown for each sampling time), by simultaneously
lowering outer film permeance (by decreasing Hxl
LDPEP and increasing pkflL ) and sorption
affinity (by lowering HxlLgmb ). ......................................................................................... 6-37
Figure 6-17 Experimental data on changes of adsorbed hexanal mass on silica gel (οοοο) and
model prediction (solid line) with an adjusted model prediction to correct for initial free
liquid mass................................................................................................................... 6-39
Figure 6-18 Comparisons of fluxes measured in experiments on LDPE film permeability
(section 4.2.2) and hexanal mass loss (this section) to fluxes predicted by (i) Eq. 4-5
(section 4.2.2; ) or Eq. 6-3 (∆∆∆∆), and flux calculated from results of hexanal mass loss
(οοοο). The dotted line represents y = x line. ................................................................... 6-42
Figure 6-19 Experimental data on changes of adsorbed hexanal mass on silica gel (οοοο) and
model prediction (solid line) using Eq. 6-3................................................................. 6-44
Figure 6-20 Experimental data (οοοο; at least 3 replicates shown for each sampling time) on
hexanal vapour concentrations in package headspace of LD1 active packaging system
(with no tomatoes; Table 6-1) and model prediction results of original (solid line) and
modified (dotted line) global mathematical model, during 7-day (A) and 24-hour
storage period (B; the same data expanded to better present)..................................... 6-45
Figure 7-1 Conceptualised release patterns to extend shelf life ( 0SL and APSL represent the
shelf life without and with active controlled release, respectively) and delay changes of
postharvest qualities (dotted lines). Solid lines represent long (I) and short (II) sustained
release period prior to concentration decreasing, while the solid line III represents the
fumigation with a high concentration following by an attainment of a low concentration.
....................................................................................................................................... 7-2
Figure 7-2 Alternative sorption isotherm shapes for simulating hexanal release patterns.
Coefficients associated with the isotherm equations are those shown in Table 7-1. .... 7-4
Figure 7-3 Simulated hexanal release patterns for alternative hexanal sorption isotherms:
Exponential (Exp.1-3, represented by solid, dotted and dashed lines, respectively),
Linear (Lin.), and Langmuir (Lgm.1-3, represented by solid, dotted and dashed lines,
respectively). Graphs on the left- and right-hand-side columns refer to active MA

List of Figures
xxix
packages having LDPE and OPP respectively as outer film materials, with the same
sorption isotherm systems shown on the same row. Legends shown in these graphs (on
the left-hand-side (LHS) column) refer to the parameter sets as provided in Table 7-1.
........................................................................................................................................7-6
Figure 7-4 Simulated hexanal release patterns for alternative hexanal sorption isotherms
with 10-fold lower outer bag permeability: Exponential (Exp.1-3 represented by solid,
dotted and dashed lines, respectively), Linear (Lin.), and Langmuir (Lgm.1-3
represented by solid, dotted and dashed lines, respectively) and legends shown in these
graphs (on LHS column) refer to variations as provided in Table 7-1. Graphs on the
right-hand-side (RHS) column show sachet headspace concentrations and lines refer to
sorption isotherm systems as provided in the same row of the LHS column. ...............7-8
Figure 7-5 Simulation results demonstrating the influences of PAR values on package
headspace quasi steady-state concentrations of hexanal vapour (on day 7; at 20ºC) in
LD1 active MAP systems (without tomatoes) for Exponential (Exp.1) Linear (Lin.), and
Langmuir (Lgm.1) isotherms (represented by dashed dotted and solid lines,
respectively; refer to Table 7-1) (A) and release profiles considered at PAR = 0.8 (B).
......................................................................................................................................7-10
Figure 7-6 Mathematical model simulations of MA conditions at 20ºC in hexanal active
MA package containing 6 medium tomatoes (~600g) having either LDPE or OPP films
as outer packaging films. See text for conditions. .......................................................7-13
Figure 7-7 Simulated fluxes across the sachet boundary as a function of Hxlbed,s
C , according
to selected Exponential (Exp.1), Linear (Lin.) and Langmuir (Lgm.1) isotherm models
(represented by dashed dotted and solid lines, respectively; refer to Table 7-1). ........7-16
Figure 7-8 Simulated fluxes across the sachet boundary for the exponential (Exp.1), linear
(Lin.) and Langmuir (Lgm.1) sorption isotherms, respectively. The coefficients of the
isotherm models are those shown in Table 7-1. ...........................................................7-18
Figure 7-9 Ethanol sorption isotherms for Ajax activated carbon at 25ºC (Prasetyo et al.
2002) (A), silica gel at 25ºC (Madeley & Sing 1959) (B), and Amorphous Teflon
AF2400 at 30ºC (Tokarev et al. 2006) (C). All isotherm data were digitally redrawn
using the TechDig software. Dotted, solid and dashed lines represent ethanol
equilibrium sorptions predicted by the Freundlich (Eq. 2-4), Langmuir (Eq. 2-3) and
exponential (Eq. 7-3) models, respectively..................................................................7-20
Figure 7-10 Ethanol vapour concentrations released from 4 mlEtOH/kgfruit (οοοο) and 8
mlEtOH/kgfruit (◊◊◊◊) loading ratios of liquid ethanol saturated paper (RHS y-axis) as
xxx Mathematical Modelling of Active Packaging Systems for Horticultural Products
reported by Lurie et al. (2006) and data were digitally redrawn using the TechDig
software. Solid and dotted lines represent model predictions of the Langmuir ethanol
sorption isotherm for silica gel, provided model in puts in Table 7-4. See text for
simulation conditions (for Sim.1 and Sim.2). ............................................................. 7-22
Figure 7-11 Simulated results of influences of PAR values on package headspace quasi
steady-state concentrations of ethanol vapour (on day 7) in LD1 active MAP systems
having different sorption isotherms which are Freundlich, Langmuir and exponential
isotherms for activated carbon (A), silica gel (B) and Teflon (C) systems, respectively.
..................................................................................................................................... 7-24
Figure C-1 Standard curves of hexanal, acetaldehyde, and ethanol ( in = number of moles)
.......................................................................................................................................C-2
Figure E-1 Hexanal sorption isotherm for silica gel at 20ºC (3 replicates shown for each
uptake) quantified by the Pulse IGC technique.............................................................E-3
Figure E-2 Comparison of hexanal uptake by silica gel grade 40 at 20ºC, quantified by
FIGC method (οοοο) and gravimetric method (■; reported in Chapter 4) .........................E-4
Figure E-3 Comparison of acetaldehyde uptake by silica gel grade 40 at 14ºC, quantified
by the FIGC method (οοοο) and gravimetric method (■; as reported by Ghosh & Hines
1990)..............................................................................................................................E-6
Figure E-4 Comparison of hexanal uptake by silica gel grade 40 at 20ºC quantified by the
gravimetric method (as reported in Chapter 4) and by the volumetric method at 10 and
20ºC ...............................................................................................................................E-7
Figure E-5 Predictions of hexanal concentration in package headspace (A) and equilibrium
hexanal vapour in sachet headspace (B) in a model active package (without packaged
tomatoes), kept at 20ºC during 7 days, using Langmuir model coefficients which were
obtained from gravimetric (solid line) and the volumetric (Autosorb-1 instrument;
dotted line) sorption isotherms. ...................................................................................E-10
Figure E-6 Plots of ( ) Hxlbed,ss Cpp against spp for hexanal sorption isotherm data at 10
and 20°C for estimating Langmuir equation coefficients according to the
reparameterisation approach proposed by Ratkowsky (1990) ....................................E-12
Figure E-7 Hexanal sorption isotherms for silica gel grade 40 at 10 and 20ºC, measured
using a gravimetric sorption approach and presented in molar units. Solid lines were
fitted using Langmuir isotherm model (Eq. 2-3).........................................................E-13
Figure F-1 Conceptual model of one-dimensional mass transfer across a sachet film...... F-2
List of Figures
xxxi
Figure F-2 Conceptual model of the concentration gradient of volatile across the sachet
film ................................................................................................................................ F-5
Figure F-3 Conceptual model of mass transfer across packaging film in an active
packaging system ........................................................................................................ F-11
Figure F-4 Conceptual model of the initial concentration gradient of 1-MCP across the
packaging film............................................................................................................. F-12
Figure G-1 Comparison of mean concentrations of equilibrium hexanal vapour in the
packaging film from analytical (m = 5) and numerical solutions for diffusion mass
transfer with the first kind of boundary condition. .......................................................G-9
Figure G-2 Comparison of the numerical and analytical solutions for package headspace
hexanal concentration, of which hexanal mass transfer across sachet film was modelled
using steady-state approach.........................................................................................G-11

xxxii Mathematical Modelling of Active Packaging Systems for Horticultural Products
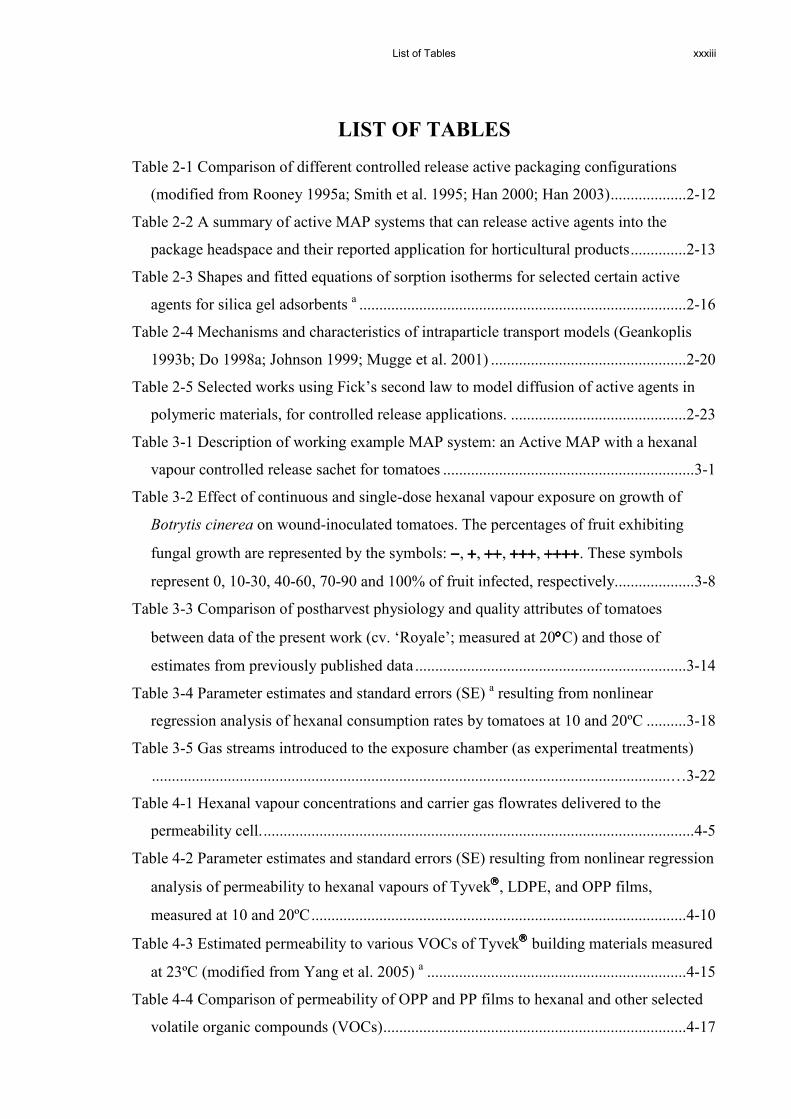
List of Tables
xxxiii
LIST OF TABLES
Table 2-1 Comparison of different controlled release active packaging configurations
(modified from Rooney 1995a; Smith et al. 1995; Han 2000; Han 2003)...................2-12
Table 2-2 A summary of active MAP systems that can release active agents into the
package headspace and their reported application for horticultural products..............2-13
Table 2-3 Shapes and fitted equations of sorption isotherms for selected certain active
agents for silica gel adsorbents a ..................................................................................2-16
Table 2-4 Mechanisms and characteristics of intraparticle transport models (Geankoplis
1993b; Do 1998a; Johnson 1999; Mugge et al. 2001) .................................................2-20
Table 2-5 Selected works using Fick’s second law to model diffusion of active agents in
polymeric materials, for controlled release applications. ............................................2-23
Table 3-1 Description of working example MAP system: an Active MAP with a hexanal
vapour controlled release sachet for tomatoes ...............................................................3-1
Table 3-2 Effect of continuous and single-dose hexanal vapour exposure on growth of
Botrytis cinerea on wound-inoculated tomatoes. The percentages of fruit exhibiting
fungal growth are represented by the symbols: −−−−, ++++, ++++++++, ++++++++++++, ++++++++++++++++. These symbols
represent 0, 10-30, 40-60, 70-90 and 100% of fruit infected, respectively....................3-8
Table 3-3 Comparison of postharvest physiology and quality attributes of tomatoes
between data of the present work (cv. ‘Royale’; measured at 20°°°°C) and those of
estimates from previously published data ....................................................................3-14
Table 3-4 Parameter estimates and standard errors (SE) a resulting from nonlinear
regression analysis of hexanal consumption rates by tomatoes at 10 and 20ºC ..........3-18
Table 3-5 Gas streams introduced to the exposure chamber (as experimental treatments)
..................................................................................................................................…3-22
Table 4-1 Hexanal vapour concentrations and carrier gas flowrates delivered to the
permeability cell.............................................................................................................4-5
Table 4-2 Parameter estimates and standard errors (SE) resulting from nonlinear regression
analysis of permeability to hexanal vapours of Tyvek, LDPE, and OPP films,
measured at 10 and 20ºC..............................................................................................4-10
Table 4-3 Estimated permeability to various VOCs of Tyvek building materials measured
at 23ºC (modified from Yang et al. 2005) a .................................................................4-15
Table 4-4 Comparison of permeability of OPP and PP films to hexanal and other selected
volatile organic compounds (VOCs)............................................................................4-17
xxxiv Mathematical Modelling of Active Packaging Systems for Horticultural Products
Table 4-5 Summary of gT values of a range of polymer films for food packaging
applications (modified from Brandsch & Piringer 2000; Willige et al. 2002; Selke et al.
2004)............................................................................................................................ 4-19
Table 4-6 Comparison of permeability of LDPE and other polyethylene family films to
hexanal and other selected volatile organic compounds (VOCs) ............................... 4-21
Table 4-7 General properties of silica gel grade 40 ......................................................... 4-26
Table 4-8 Parameter estimates and standard errors (SE) from nonlinear regression analysis
of hexanal sorption isotherm data for silica gel grade 40 at 10 and 20ºC................... 4-31
Table 4-9 Parameters of the Langmuir model equation estimated using nonlinear
regression for literature data on sorption of a range of VOCs for silica gel adsorbents
................................................................................................................................. …4-32
Table 4-10 Apparent thermodynamic parameters for hexanal sorption onto silica gel
adsorbents at 10 and 20°°°°C........................................................................................... 4-34
Table 4-11 Experimental results on the effects of RH on hexanal sorption isotherm for
silica gel adsorbents .................................................................................................... 4-35
Table 5-1 Estimated Bi values for diffusion of certain active agents in the package
headspace ...................................................................................................................... 5-6
Table 5-2 Internal and external resistances according to bed and particles in sachet systems
....................................................................................................................................... 5-9
Table 5-3 Input data of 1-MCP active packaging system (at 23°°°°C; following Lee 2003) for
illustrating scaling analyses......................................................................................... 5-14
Table 6-1 Details of the active MA packages employed in the validation trials (all used a
LDPE outer bag)............................................................................................................ 6-2
Table 6-2 Summary of system inputs used for mathematical model validation................ 6-4
Table 6-3 Range of key model inputs and the justification of their use in sensitivity
analyses ......................................................................................................................... 6-5
Table 6-4 Examples of model sensitivity to input variables for the system having a LDPE
sachet with 4.5 g loading (LD3; Table 6-1). Experimental data are shown as οοοο symbols.
..................................................................................................................................... 6-13
Table 7-1 Coefficients associated with alternative isotherm equations............................. 7-4
Table 7-2 Model inputs for simulating the effects of PAR on quasi steady-state
concentrations of LD1 active MAP systems (without tomatoes) for Exponential (Exp.1)
Linear (Lin.), and Langmuir (Lgm.1) isotherms (Table 7-1)...................................... 7-11
List of Tables
xxxv
Table 7-3 Parameters of the Freundlich, and exponential model equations estimated using
nonlinear regression for literature data on ethanol sorption for activated carbon and
Teflon. ..........................................................................................................................7-21
Table 7-4 Key model inputs used for simulations of ethanol vapour releases .................7-23
Table C-1 Gas chromatography conditions for identifying acetaldehyde and ethanol......C-1
Table E-1 Parameter estimates and standard errors (SE) from nonlinear regression analysis
of the hexanal sorption isotherm data at 20ºC as measured by the volumetric-methodE-8
Table E-2 Langmuir coefficients estimated using the reparameterisation proposed by
Ratkowsky (1990) ....................................................................................................... E-12
Table E-3 Parameter estimates and standard errors (SE) from nonlinear regression analysis
of hexanal sorption isotherm data for silica gel grade 40 at 10 and 20ºC (presented in
molar units as illustrated in Figure E-7)...................................................................... E-13
Table F-1 Estimated Bi values for diffusion of hexanal in sachet and package atmosphere
....................................................................................................................................... F-1
Table F-2 MATLAB filenames for simulations of 1-MCP accumulation in package
headspace .................................................................................................................... F-19
Table F-3 Estimated values of scflbedCR , scflpkhsCR and pkflpkhsCR for hexanal mass transfer
in active packaging systems........................................................................................ F-20
Table H-1 Examples of model sensitivity to input variables: 4.5 g LDPE sachet loading
experiment of active packages containing tomatoes (experimental data shown as ◊◊◊◊
symbols), with discussion made in section 6.4.1.2. ......................................................H-2
Table H-2 Examples of model sensitivity to input variables: MA condition of active
packages containing tomatoes is the same as that employed in Table H-1 (experimental
data of O2 and CO2 shown as οοοο and ◊◊◊◊ symbols, respectively), with discussion made in
section 6.4.1.2. Variations employed for varying values of max
2Or ,
2Omk , and
permeability values (both 2O
pkflP and 2CO
pkflP ) are 10%, 20%, and 10%, respectively (as
utilised by in Merts 1996; Tanner 1998). Variation of package volume is as shown in
Table 6-3. ......................................................................................................................H-4
Table H-3 Examples of model sensitivity to input variables: model package LD6
(experimental data shown as οοοο symbols), with discussion made in section 6.4.2. .......H-5
Table H-4 Examples of model sensitivity to input variables: model package containing
tomatoes and OPP film as a sachet film material (experimental data shown as ◊◊◊◊
symbols), with discussion made in section 6.4.3.1. ......................................................H-6
xxxvi Mathematical Modelling of Active Packaging Systems for Horticultural Products
Table H-5 Examples of model sensitivity to input variables: model package containing
tomatoes and Tyvek film as a sachet film material (experimental data shown as ◊◊◊◊
symbols), with discussion made in section 6.4.3.2. ..................................................... H-7
Table H-6 Examples of model sensitivity to input variables: model package containing
tomatoes kept at 10°°°°C, sachet materials were LDPE, OPP, and Tyvek (experimental
data shown as ◊◊◊◊ symbol) 1, with discussion made in section 6.4.4............................... H-8
Table H-7 Examples of model sensitivity to input variables: changes of hexanal amount on
silica gel (empirical data shown as οοοο symbols). Initial hexanal adsorbed amount used in
the modified global model was referred to as the effective amount. Results for
discussion are made in section 6.4.5. ........................................................................... H-9
Chapter 1: Introduction
1-1
Chapter 1
INTRODUCTION
1.1 Background
The horticultural industry is very important to the New Zealand economy. Over recent
years (2003-2007), exports of fresh (e.g. kiwifruit, pipfruit, asparagus, squash, onion and
tomato) and processed (e.g. processed sweet corn, pea, carrot, and tomato) horticultural
products increased in value from approximately $1.97 to 2.53 billion (MAF 2007). To
maintain international markets and prices to sustain growers, the key focus of horticultural
producers is to maintain and improve already high product quality (MAF 2007). Packaging
is considered one key aspect of postharvest technology to both maintain quality and extend
shelf life of horticultural products. This can be achieved through improved protection from
environment conditions (e.g. light, oxygen, moisture, and contaminations) or enhancing
cooling rates to minimise heat accumulation (Merts 1996; Tanner 1998), providing
information through labels, and providing improved convenience (e.g. easy opening, and
reclosable package) (Ahvenainen 2003). In recent years, packaging technology offers
interactive management (e.g. real-time traceability) throughout the supply chain using
radio frequency identification (RFID) and global positioning (GPS) tracking (Järvi-
Kääriäinen 2003; Han et al. 2005).
Horticultural products, either intact or minimally processed (fresh-cut), are living tissues
that continue their metabolic activities after harvest and during storage (Gil et al. 2002;
Kader 2002; Lanciotti et al. 2004). Once the optimum storage temperature and relative
humidity to minimise the rate of ripening and senescence are established (Thompson &
Mitchell 2002), modification of the atmosphere surrounding the products is a common
practice to further reduce postharvest quality changes and extend shelf life (Kader et al.
1989). However, optimal packaging atmospheres can be adversely affected by dynamic
changes in temperature and relative humidity through the cool chain (Day 1989). This in
turn may pose a significant risk to preservation of the product’s quality because modified
atmosphere packaging (MAP) relies on the interactions between the gas atmosphere,
metabolic activity of the packaged produce and the properties of the packaging to achieve
the desired outcomes (Zagory 1995).
1-2 Mathematical Modelling of Active Packaging Systems for Horticultural Products
For a given permeability of the packaging material, the packaged product adjusts its
metabolic activity according to the concentrations of the main respiratory gases (CO2 and
O2). If the metabolic activity increases, this will increase CO2 production and lower O2
availability (Kader et al. 1989). The respiration rate of horticultural products is more
strongly affected by temperature than the permeability of most existing packaging films
utilised in MAP. Thus even a small temperature increase can cause rapid accumulation of
CO2 and depletion of O2 in the package (Cameron et al. 1995). Continuous decreases in
the O2 level can initiate anaerobic respiration or fermentation, which generally results in
poor quality, such as off-flavour development and increased pathogenic susceptibility
(Labuza & Breene 1989; Yam & Lee 1995).
To improve the efficacy of MAP, active packaging technologies have been incorporated to
provide alternative interactive controls between the packaged food, package, packaging
atmosphere and the environmental conditions to better achieve and retain optimal modified
atmospheric conditions inside the package (Rooney 1995b; Brody 2002). In the context of
horticultural products, “active” may refer to systems for control of environmental
parameters such as moisture content or gas atmosphere composition, to the control of
microbial growth, or the control of the physiology of the product. According to Rooney
(1995b), this is mainly achieved by scavenging mechanisms, which remove one or more
components from the internal environment, or desorption mechanisms, which allow the
controlled release of one or more active components.
Whilst the scavenging systems are commercially available, desorption systems are less
well studied and yet offer interesting possibilities for extending shelf life and quality of
perishable product (Utto et al. 2005). Although a number of the desorption-based active
packaging systems have been commercialised (for example sachet releasing ethanol vapour
commercially sold under the trade names of Antimold Mild and Negamold Freund
Industrial Co., Japan), generic approaches to design and optimise packages are mainly
empirical or rely on proprietary information from companies.
Fundamental knowledge needed to better implement their new technology relating to
packaging design of desorption-based active packaging systems is valuable. To maximise
application of this knowledge it should be incorporated into a framework that would permit
engineers and/or technical users to predict outcomes of a new package design for ‘what-if’

Chapter 1: Introduction
1-3
scenarios for given products in typical horticultural postharvest handling systems. To
simulate and understand ‘what-if’ scenarios relevant to specific new package designs, one
may perform many experiments by “trial and error” testing. However this approach has the
disadvantages of being costly in experimental development and time consuming, and it is
difficult to transfer results obtained from one product-package-storage system to others.
Alternatively, the development of predictive tools based on mathematical models, in which
the key variables relevant to the new package as well as the handling system can be
specified or estimated, will allow new packaging systems to be designed and screened
prior to prototype testing. Development of such predictive tools will formalise the
understanding of the underlying phenomena occurring in these systems, and in so doing
will contribute significantly to food packaging research.
At the start of this project, the fundamental knowledge needed to construct mathematical
models for the design of the such active packaging systems, were limited in availability
and scope, and this research to fill these knowledge and technical gaps was justified.
1.2 Research aim
The aim of this research project was to formalise the fundamental knowledge of desorption
controlled release active packaging in the form of mathematical models. These models will
allow the design of systems that can dynamically deliver and sustain one or more active
components at effective levels in a package atmosphere, incorporating the postharvest
responses of the product and the storage conditions.
1.3 Research objectives
To achieve the research aim, the following specific objectives were set as the research
milestones:
(1) To develop a conceptual model which accommodates all relevant aspect(s) of the
design of active packaging systems, where the active agents can be delivered and
sustained at the required level to regulate quality changes through influencing
product physiology and inhibiting growth of spoilage or pathogenic microorganisms,
or a combination of both.

1-4 Mathematical Modelling of Active Packaging Systems for Horticultural Products
(2) For a representative specific application (i.e. a given horticultural product and active
control system), to:
(a) Develop a model active packaging system for experimental investigation of
the postharvest behaviour of the selected product
(b) Determine the effective concentrations of the chosen active agent and their
effects on postharvest attributes of the selected horticultural products,
including microbial suppression, respiration rate and ethylene production
under simulated storage condition.
(c) Identify the equilibrium and kinetic mechanisms which govern the sorption
of the active agent by, and its release from, the chosen carrier material, and
how key packaging and environmental factors affect the equilibrium
concentration through storage.
(d) Mathematically model and experimentally validate (including assessing the
limitations of the model) the distribution of the active agent within the
model active packaging system, under a known storage condition.
(3) To use the developed modelling tools to investigate what-if scenarios to gain further
insights into release patterns of the active agent for different active packaging
systems.
(4) Summarise model methodology and associated input data requirements for design of
packaging systems for other food and horticultural products
1.4 Structure of thesis
In Chapter 2, a review of relevant literature is presented, covering the current trends and
opportunities in the development of the active packaging systems with an emphasis on
horticultural products, and the basic physical phenomena from which mathematical models
of active packaging system will be developed.
Chapter 1: Introduction
1-5
In Chapter 3, the active MAP system of interest, a hexanal controlled release sachet for
tomatoes was experimentally studied. Effects of hexanal vapour on postharvest qualities of
tomatoes such as antimicrobial activity, rates of respiratory O2 consumption and ethylene
generation, and apparent rates of hexanal uptake by tomatoes were studied.
Chapter 4 presents studies of the effective hexanal permeability of films (used as sachet
materials and outer bag) and sorption isotherms for hexanal on silica gel.
Chapter 5 presents the conceptual model developed for active MAP systems. A decision
tree for facilitating the selection among modelling options was also developed and utilised
for modelling the hexanal-based active MAP for tomatoes. The formulations of
mathematical model and its MATLAB language codes to predict dynamic hexanal
concentration in the package headspace are presented.
Chapter 6 presents results of model validations against experimentally collected data of a
range of active MAP systems and discusses the model performance through sensitivity
analyses considering uncertainties associated with model inputs.
Chapter 7 subsequently presents applications of the mathematical model to predict ‘what-
if’ scenarios of hexanal releases which were not experimentally measured and to be utilised
as means to understand key mass transfer processes involving in the simulated scenarios.
Lastly, Chapter 8 presents the general discussion on the findings from the present work
along with recommendations for future work to provide further insights for better
understanding and optimisation of active packaging systems for horticultural products.

1-6 Mathematical Modelling of Active Packaging Systems for Horticultural Products
Chapter 2: Literature Review
2-1
Chapter 2
LITERATURE REVIEW
2.1 Introduction
This review is presented in two sections. The first summarises the principles of, and recent
technological advances in, active packaging systems applied to horticultural products. The
second section reviews the development of mathematical models for the design of such
active packaging systems.
2.2 Overview of active packaging technologies for horticultural products1
2.2.1 Active packaging requirements for horticultural products
Packaging can be designed to supplement other postharvest control technologies (chiefly
the management of temperature and relative humidity) to maintain product quality and
extend the storage shelf life (Thompson & Mitchell 2002). One widely used approach is to
modify the normal atmosphere surrounding the packaged product by selectively adding or
removing gaseous species. This is known as modified atmosphere packaging (MAP) and
its key objective is to reduce the availability of O2 and increase CO2 levels to retard the
respiration and related metabolic changes of fresh produce. Applications of MAP for
postharvest storage of selected fresh fruits and vegetables, and the optimum levels of O2
and CO2 for these, are well documented (Kader et al. 1989; Thompson & Mitchell 2002;
Kader & Saltveit 2003a).
In spite of it being widely commercialised, there is much evidence to show that MAP alone
is unlikely to be completely effective for controlling changes in postharvest quality,
particularly when these are in response to temperature and relative humidity fluctuations in
the storage environment. To overcome this problem, consideration has been given to active
packaging systems, which have successfully been utilised with meat, fishery and bakery
products (Day 1989), to actively control the desired modified atmosphere composition with
1 This is a summary of the comprehensive review published as Utto W, Mawson A J, Bronlund J E, & Wong
K K Y (2005). Active packaging technologies for horticultural produce. Food New Zealand 5 21-32. (see
Appendix A)

2-2 Mathematical Modelling of Active Packaging Systems for Horticultural Products
packages of food products and/or introduce further hurdles to deterioration. One example
is a system for enriching ethanol vapour in the package headspace to inhibit
microorganism growth on bakery products (Smith et al. 1995). Examples of application of
active packaging with an emphasis on postharvest practice are discussed in the following
sections.
2.2.2 Oxygen-scavengers
Near-ambient concentration of oxygen (O2) in the atmosphere can markedly reduce the
shelf life and marketability of horticultural products (Kader & Saltveit 2003a). The use of a
scavenger for absorbing part of the residual O2 in sealed packages and the O2 that
continuously permeates through the packaging material from the external environment
could potentially improve MAP of some fruit. O2-scavengers are principally based on
metallic iron powder contained within sachets and are commercially available under trade
names such as Ageless (Mitsubishi Gas Chemical Co., Ltd. Japan) and Freshilizer
(Toppan Printing, Co., Ltd. Japan). These have been used to maintain the quality and shelf
life of several horticultural commodities (Hurme et al. 2002) including sliced carrots
(Pospisil et al. 2001), tomato (Charles et al. 2003) and endive (Charles et al. 2005; Charles
et al. 2008). However, O2-scavengers could potentially lower the O2 concentration inside
the package to a level at which anaerobic respiration or fermentation is initiated. This will
result in rapid loss of stored product quality, commonly evidenced through a loss of texture
and the development of off flavours (Yearsley et al. 1996). In addition, anaerobic
pathogens and spoilage organisms may thrive (Labuza & Breene 1989). This example
demonstrates how a balance between O2 transport, O2 scavenging and O2 consumption by
the fruit must be designed into the active packaging system to achieve an optimal outcome.
2.2.3 Carbon dioxide-scavengers or emitters, and dual-active systems
Carbon dioxide (CO2) is formed inside many food packages owing to the metabolism of
the product and that of microbial contaminants. Although increasing the CO2 level around
some commodities reduces respiration, delays senescence and retards fungal growth,
excessively high CO2 levels may induce fermentative metabolism or cause physiological
disorders (Kader & Saltveit 2003a). For example, whilst CO2 enriched atmospheres (at
partial pressures higher than 20 kPa) reduced the incidence of Botrytis cinerea on
“Redglobe” table grapes, they also accelerated stem browning (Crisosto et al. 2002). Thus
Chapter 2: Literature Review
2-3
both CO2-scavengers (e.g. Ageless E, and Fresh Lock, Mitsubishi, Japan; also
functioning as O2 scavengers) and CO2-emitters (e.g. Ageless G and Vitalon GMA,
Mitsubishi, Japan; also functioning as O2 scavenger) could be beneficial to shelf life
extension for fresh fruit and vegetables, depending on the situation (Smith et al. 1995;
Vermeiren et al. 2003). The so-called dual-action active packaging systems consist of
either an O2-scavenger plus a CO2-scavenger or an O2-scavenger and a CO2-emitter. In one
specific application of the latter, the O2-scavenger was designed to release roughly the
same amount of CO2 as that of scavenged O2. Iron-based powder and ascorbic acid were
used as the O2-scavenger and CO2-emitter, respectively, however technical information
such as the nature of the interaction of scavenged O2 and ascorbic acid to release CO2 was
not published (Harima 1990). Calcium-based materials such as calcium hydroxide
(Ca(OH)2) are commonly utilised together with iron-based powder to scavenge both CO2
and O2, respectively (Smith et al. 1995). For CO2-scavenging purposes, the use of soda
lime, magnesium oxide and activated charcoal has been documented for pears (Ning et al.
1997), mushroom (Jayathunge & Illeperuma 2001), mangoes (Illeperuma & Jayasuriya
2002) and endives (Charles et al. 2005). The favoured approaches for incorporating these
ingredients into an active packaging system are coatings on the packaging material surface
or the inclusion of the active material in sachets.
2.2.4 Atmospheric control via temperature compensating films
One main disadvantage of conventional plastic films (e.g. low density polyethylene
(LDPE)) commonly used in the horticultural industry is the mismatch between gas
evolution or uptake by metabolism and gas exchange with the environment by permeation
(Mannapperuma & Singh 1994; Kader & Saltveit 2003a). As respiration and fermentation
rates of horticultural products are more strongly affected by temperature than is the
permeability of most existing packaging films, even a small temperature increase can cause
rapid accumulation of CO2 and depletion of O2 in the package. Research to overcome this
problem has therefore focused on developing new classes of polymer films with activation
energies of permeation more closely matching activation energies for respiration in order
to maintain a suitable gas composition inside the modified atmosphere package (Yam &
Lee 1995). Probably the most widely known temperature-responsive package materials are
those using Landec’s IntellipacTM membrane technology. Permeabilities to gases (chiefly
O2 and CO2) of this polymer film are increased by structural rearrangement as the
2-4 Mathematical Modelling of Active Packaging Systems for Horticultural Products
temperature surrounding the packaged products is increased above a pre-determined
temperature. By such alterations the rapid accumulation of CO2 and depletion of O2 in the
package caused by high respiration rate in response to elevated temperatures can therefore
be minimised (Clarke 2001; Paul & Clarke 2002).
2.2.5 Water vapour regulators
Accumulation of water inside packages can occur owing to continuous transpiration from
and respiration of the product, and drip loss from cut tissues, as well as by condensation
arising from temperature fluctuations when the equilibrium relative humidity is high.
Excessive moisture may increase the risk of microbial decay since high humidity and/or
the presences of droplets favour the growth of spoilage organisms (Wills et al. 1989).
Adsorbent pads, for example Toppan SheetTM, (Toppan Printing Co.Ltd, Japan), Fresh-R-
PaxTM (Maxwell Chase Inc., GA, USA) and DriMop (Multisorb Technologies Inc., USA),
are used commercially for products such as sliced tomato or melon, and for frozen
strawberries or similar products, where drip losses on thawing detracts from market appeal
(Rooney 1995a; Brody et al. 2001b). Anti-fogging films have also been utilised to
cosmetically minimise the presence of droplets on the inside surface of film bags, though
this does not change the amount of liquid water in the package (Rooney 1995a). Another
approach to scavenging excess moisture in food packages is to intercept the moisture in the
vapour phase, reducing the relative humidity in the headspace and thereby the surface-
water content and water activity (aw) of the food. This can be done by incorporating
humectants (e.g. sorbitol, xylitol, sodium chloride) or desiccants (e.g. silica gel) in the
packaging system within either a sachet or the film (Labuza & Breene 1989; Shirazi &
Cameron 1992).
Although the reduction of excessive moisture in the package atmosphere can delay
deterioration of fresh fruits and vegetables, excessively low relative humidity will cause
high water loss from the commodity. Thus, a package that is able to (i) take up water
vapour when the temperature drops and the relative humidity rises, and (ii) release water
vapour back into the package headspace in response to low relative humidity levels, like
the active fibreboard carton developed by Patterson & Joyce (1993), could be beneficial for
products exposed to fluctuating conditions during storage and handling.

Chapter 2: Literature Review
2-5
2.2.6 Ethylene regulators
Although many of the effects of ethylene on plants are economically positive, such as de-
greening of citrus and ripening of bananas, ethylene can be detrimental to quality and
marketability, in particular by stimulating postharvest softening (Zagory 1995) for a range
of products such as apple (Johnston et al. 2002), plum (Menniti et al. 2004), kiwifruit (Kim
et al. 2001) and avocado (Jeong et al. 2002). Active packaging systems for ethylene control
can be designed for ethylene-removal and ethylene-antagonism.
The active ethylene-removal systems generally employ oxidising agents such as KMnO4,
titanium dioxide catalyst, or dicarboxyoctyl ester of tetrazine which are captured on
adsorbent materials such as activated carbon, silica gel, alumina, and zeolite (Zagory
1995). As the surrounding ethylene is adsorbed by the adsorbent, the oxidising agents
chemically oxidised the ethylene to ethylene glycol (Brody et al. 2001a) or acetaldehyde,
which is further oxidised to CO2 and water through the intermediate oxidation of acetic
acid (Vermeiren et al. 2003). These active systems are currently used in sachet form, which
can conveniently be placed inside the product package (Brody et al. 2001a; Day 2003;
Vermeiren et al. 2003; Choehom et al. 2004). In addition, ethylene removal active systems
have been developed in the form of films into which oxidising-agent adsorbents (as
discussed above) or adsorbents with an affinity for ethylene such as activated carbon and
zeolites, are impregnated. Trade names of ethylene scavenging films include ‘Profresh’ (E-
I-A Warenhandels GmbH, Austria), BO film (Odja Shoji C., Japan), and ‘PEAKfresh’
(PEAKfresh Products Ltd., Australia) (Zagory 1995; Brody et al. 2001a; Day 2003;
Vermeiren et al. 2003).
Recently Terry (2007) reported the higher ethylene scavenging capacity of a palladium
(Pd)-based material (Pd-impregnated zeolite with a Pd loading of 2.5% (m/m) [sic]),
compared to the capacities of a well-known commercial ethylene scavenger, Ethysorb
(KMnO4-impregnated alumina; 5% m/m [sic]; Stay Fresh Ltd, London, UK). The Pd-based
material advantageously maintained its scavenging capacity under a high humidity
condition (tested at ~100% RH), at which the capacity of the Ethysorb become rapidly
diminished due to the water-stimulated conversion of KMnO4 to manganese oxide (this
being visually observed through the colour change of the scavenger from purple to brown).
Terry (2007) incorporated the Pd-based materials (in a loose configuration) in containers of
pre-climacteric bananas, avocadoes, and strawberries, and reported that ethylene was
2-6 Mathematical Modelling of Active Packaging Systems for Horticultural Products
effectively removed while each product’s postharvest quality (i.e. skin colour and
firmness) was reasonably well maintained. The ethylene removal rates appeared to depend
on the amounts of the scavenging materials added. Abe & Watada (1991) utilised a Pd-
chloride impregnated activated carbon to effectively remove ethylene and reduce the rate
of softening of minimally processed kiwifruits and banana, and for decreasing chlorophyll
loss in lightly processed spinach leaves (at 20ºC for 3 days). However its performance
relative to other scavengers was not reported.
For ethylene-antagonism based control, active agents such as 1-methylcyclopropene (1-
MCP) (Blankenship & Dole 2003), nitric oxide (NO) or nitrous oxide (N2O) (Leshem &
Wills 1998) have been utilised. These gases are believed to bind to ethylene receptors,
thereby minimising and/or blocking subsequent binding of ethylene. This slows or delays
most of ethylene accelerated metabolic processes and reduces the incidence of
physiological disorders associated with ethylene (Leshem & Wills 1998; Blankenship &
Dole 2003). Among these ethylene antagonists, only 1-MCP is used commercially. It is
currently marketed as SmartFreshTM by AgroFresh Inc. for use on fruits, vegetables and
flowers such as apple, kiwifruit, avocado, tomato and roses (Blankenship & Dole 2003).
There have been recent several research reports on the controlled release of 1-MCP from
carriers including porous materials (Daly & Kourelis 2001; Kostansek 2003; Lee 2003;
Lee et al. 2006) and polymeric films (Macnish et al. 2004; Hotchkiss et al. 2007).
2.2.7 Antimicrobial packaging
Horticultural products are rich in moisture and nutrients and can therefore serve as suitable
substrates for the development of microorganisms that may be agents of foodborne illness
or cause spoilage. Fresh produce may rapidly become rotten and unfit for sale and this
ubiquitous problem can be encountered during harvest or postharvest operations. Active
packaging is one of several approaches, which include chemical treatment, heat treatment,
the use of biological antagonists and ionising radiation, that have been implemented for
controlling decay and pathogen proliferation in fresh horticultural products such as
strawberries, apples (Conway & Sams 1983; Conway et al. 1999; Sholberg et al. 2000;
Conway et al. 2005), bell pepper (Miller et al. 1984), soy bean (Lee et al. 1998), lettuce
(Moore et al. 2007), broccoli (Suzuki et al. 2004), table grapes (Kou et al. 2007), and
pineapple (Wijeratnam et al. 2005).
Chapter 2: Literature Review
2-7
In recent times there has been increasing public concern about the carcinogenic risks posed
by several kinds of synthetic fungicide (e.g. captan and benomyl) in agricultural products
and the environment (Wisniewski & Wilson 1992; Utama et al. 2002). This has stimulated
increasing interest in the possible use of natural substances such as chitosan, plant extracts,
essential oils and plant aroma volatiles as antimicrobial agents (Lanciotti et al. 2004;
Tripathi & Dubey 2004). Natural plant aroma volatiles such as hexanal, tran-2-hexenal,
ethanol, and 2-nonanone have all shown promise owing to their effective antimicrobial
activities (Wilson & Wisniewski 1989), their GRAS (generally recognised as safe) status,
and their degree of volatility (Mari & Guizzardi 1998). Volatility is particularly important
for active packaging systems designed to promote controlled release and/or fumigation
during storage and transport of food products. Among plant aroma volatiles, ethanol has
been extensively used to reduce microbial decay of a range of horticultural products
including table grapes (Chervin et al. 2005; Lurie et al. 2006; Romanazzi et al. 2007),
fresh-cut mangoes (Plotto et al. 2006), and Chinese bayberry (Zhang et al. 2007).
Applications of ethanol are increasingly reported among grapes for replacing SO2 (as an
antimicrobial agent) to avoid fruit skin bleaching. Controlled release systems emitting
ethanol vapour have been commercialised through several brand names (e.g. Ethicap and
Antimold 102; Freund Industrial Co., Ltd. Smith et al. 1995) and these are also widely
used in active packaging systems for food products as diverse as bakery products (Smith et
al. 1987; Daifas et al. 2000; Franke et al. 2002; Daifas et al. 2003) and broccoli (Suzuki et
al. 2004).
There is also increasing research into the utilisation of other volatiles, especially aldehydes,
esters and ketones such as hexanal, trans-2-hexenal, hexylacetate, nonanal and 2-nonanone,
to control postharvest pathogens such as Botrytis cinerea, Pencillium expansum, and
Pichia subpelliculosa. Products tested included raspberry (Vaughn et al. 1993), strawberry
and blackberry (Archbold et al. 1997), grape (Archbold et al. 1997; Archbold et al. 1999),
and apple (Song et al. 1996; Wolford 1998; Lanciotti et al. 1999; Corbo et al. 2000; Song
et al. 2007). However exposure of the product to these volatile compounds has commonly
been limited to fumigation scenarios and there is limited evidence of the development of
active controlled release systems.

2-8 Mathematical Modelling of Active Packaging Systems for Horticultural Products
Active agents derived from plant essential oils, for example eugenol, cinnamaldehyde and
thymol which are the key antimicrobial compounds in clove oil, cinnamon oil, and oregano
and thymol, respectively (Davidson 2001) have also been increasingly studied and utilised
in active packaging systems for horticultural products. These components have reasonable
volatility (Burt 2004; Ayala-Zavala et al. 2008) and have been trialled with products such
as tamarillo (Pongjaruwat 2007), sweet cherries (Serrano et al. 2005), table grapes
(Valverde et al. 2005), tomatoes (Matan 2008), and Swiss chard leaves (Ponce et al. 2004).
Extensive research on the applications of antimicrobial essential oils has also been reported
in other food products such as bakery products (Matan et al. 2006), pasteurised milk
(Gaysinsky et al. 2007), and apple juice (Friedman et al. 2004). Similarly to the plant
aroma volatiles, the development of controlled release systems for these essential oil
vapours are limited and generally the carriers are filter papers and/or gauzes saturated with
the oil. Recently Pongjaruwat (2007) utilised polymeric film sachets containing clove-oil
saturated silica gel adsorbents as the carrier to delivery eugenol vapour to the package
headspace for delaying de-greening of tamarillo stems. However in this use, the active
agent appeared to promote decolourisation of the skin. Thus both the positive effects on
mould growth and possible detrimental effects on other quality attributes must be carefully
studied and controlled to achieve the desired outcomes.
2.2.8 Other interesting trends and developments
There is a recent trend of research to investigate the synergistic effects of combinations of
active agents on postharvest qualities. For example, fumigations using a mixture of 1-MCP
and hexanal vapour was beneficial in delaying ethylene-induced softening and to minimise
B. cinerea decay of the stem ends of pears during long term cold temperature storage (at -
1°C for 2 to 8 months) (Spotts et al. 2007). Similarly the use of calcium chloride dip (1%
w/v chlorinated water) and controlled atmosphere storage (3% O2 and 10% CO2) with 1-
MCP treatment delayed changes of fresh-cut strawberries (firmness, skin colour, sensory
perception and microbial growth), during 12 days storage period at 5°C (Aguayo et al.
2006).
Incorporation of phase change materials (PCMs) in food packaging systems has also been
evaluated for providing thermal buffering to delay temperature changes of packaged
horticultural product and the package headspace composition. This research has chiefly

Chapter 2: Literature Review
2-9
focused on these short periods of temperature increase that may occur during shipping,
especially for air transport. The PCM employed in this regard must be a material having an
appropriate latent heat property by which heat energy can be stored or released. Examples
of PCM are paraffin wax and butyl stearate and their latent heats are reportedly ~160-190
J·g-1 (Johnston et al. 2008), and ~123-200 J·g-1 (Feldman et al. 1986), respectively.
Recently Johnston (2008) reported the development of a PCM composite material
comprising (i) a paraffin wax-based PCM commercially sold under the trade name of
Rubitherm RT6 (Rubitherm Technologies GmbH, Berlin Germany), and (ii) a nano-
structured calcium silicate (NCS; this is a porous and very high surface area carrier
developed by Johnston et al. 2006). Those were incorporated into ‘Post-It’ bubble
polymeric wraps and used as liners in corrugated boxes containing asparagus. Plain wraps
(those not containing the PCM) and box materials (corrugated board) were reported by
Johnston (2008) as providing minimal effective insulation and thermal buffering capacity.
Johnston (2008) reported that the temperature of asparagus packaged in the treatment
containing the PCM was maintained at 10ºC for a further ~ 5 h prior to slowly reaching
equilibrium with the storage temperature which had been sharply increased from 1-2ºC to
23ºC.
2.3 Modelling active modified atmosphere packaging (Active MAP) for horticultural
products
The incorporation of active packaging components such as oxygen scavengers and ethanol
vapour emitters within equilibrium (or passive) modified atmosphere packaging for
horticultural products can be designated as ‘active’ MAP, following Charles et al. (2003).
To date, while the modelling of passive MAP is well developed and reported elsewhere
(see Cameron et al. 1989; Mannapperuma & Singh 1994; Cameron et al. 1995; Yam & Lee
1995; Merts 1996; Talasila & Cameron 1997; Charles et al. 2003; Charles et al. 2005),
studies on modelling of active MAP are limited to those of Charles et al. (2003; 2005) in
which the active systems utilised were oxygen and carbon dioxide scavengers. Charles et
al. (2003; 2005) utilised the principle of mass balances (of either O2 or CO2) applied to the
packaging film (for describing the permeation process), the packaged products (utilisation
or production by respiration) and the scavengers (removal).

2-10 Mathematical Modelling of Active Packaging Systems for Horticultural Products
Although controlled release active MAP systems to deliver several active agents, for
example 1-MCP (Daly & Kourelis 2001; Kostansek 2003; Lee 2003; Macnish et al. 2004;
Lee et al. 2006; Hotchkiss et al. 2007), ethanol (Smith et al. 1987; Suzuki et al. 2004;
Chervin et al. 2005; Lurie et al. 2006; Plotto et al. 2006; Zhang et al. 2007), sulphur
dioxide (Ahvenainen 2003), eugenol (Pongjaruwat 2007), and chlorine dioxide (ClO2)
(Mahovic et al. 2007), have been developed and reported, the application of mathematical
models to these active MAP systems have not been investigated or analysed
The concentrations of active agents in the package atmosphere may be predicted by using a
similar approach to that employed by Charles et al. (2003; 2005) as summarised above. In
certain cases, paper-based packaging materials such as corrugated boxes and trays are also
components of the packaging systems and the interaction of active agents with these
materials also needs to be taken into account.
A detailed knowledge of the relevant transport processes is therefore essential to develop
mathematical models, and includes understanding of:
1. Sorption equilibrium (relationships) between the active agent and the carrier
(matrix) such as a porous adsorbent (Lee 2003; Lee et al. 2006; Mahovic et al.
2007; Pongjaruwat 2007), filter paper (Lurie et al. 2006; Plotto et al. 2006; Zhang
et al. 2007), or polymeric film (Macnish et al. 2004; Hotchkiss et al. 2007). The
adsorption equilibrium isotherm will influence the initial load of the agent on the
carrier and so will affect the availability of the agent during the course of its
release. Meanwhile, the desorption isotherm will affect the dynamics of the
components release into the headspace during the storage.
2. Permeation through packaging film materials of the active agents from the carriers
to the packaging headspace and from there into the surrounding environment.
These processes have a major influence on the accumulation of active agent in the
headspace (Song et al. 1996). The required understanding in this aspect may also
extend to paper-based packaging materials, when these are components of the
packaging system of interest.
3. Interactions of the active agents with each horticultural product of interest. This
interaction can contribute to (i) the rate of change of postharvest quality of the
Chapter 2: Literature Review
2-11
product and (ii) changes of concentrations of the active agent in the package
headspace.
General principles and examples of the key mass transport processes identified above are
provided in the following review sections.
2.4 Sorption isotherms of active agents
Incorporation of the controlled release systems within the passive MA package can be
achieved by several techniques including surface coating of packaging films or boards,
impregnating them by blending or mixing into polymeric structures of films, and enclosing
them on carriers within sachets (Rooney 1995a; Han 2003; Ozdemir & Floros 2004; De
Jong et al. 2005; Utto et al. 2005). Table 2-1 summarises the relative advantages and
disadvantages of these various techniques and their application depends on the packaging
requirements of the particular product. For example the film surface coating or
impregnation method is considered suitable for films that will be used to wrap individual
items e.g. individually shrink-film wrapped papaya (Singh & Rao 2005) or avocado (Yahia
& Gonzalez-Aguilar 1998). Also impregnation could be suitable when a product is
presented on a tray covered with a plastic film such as fresh-cut tomatoes (Artés et al.
1999). Meanwhile sachets are considered convenient to insert into current packages
containing multiple items as for example, adding sachets containing O2 scavengers into
passive MAP bags for tomatoes (Charles et al. 2003) and endives (Charles et al. 2008).
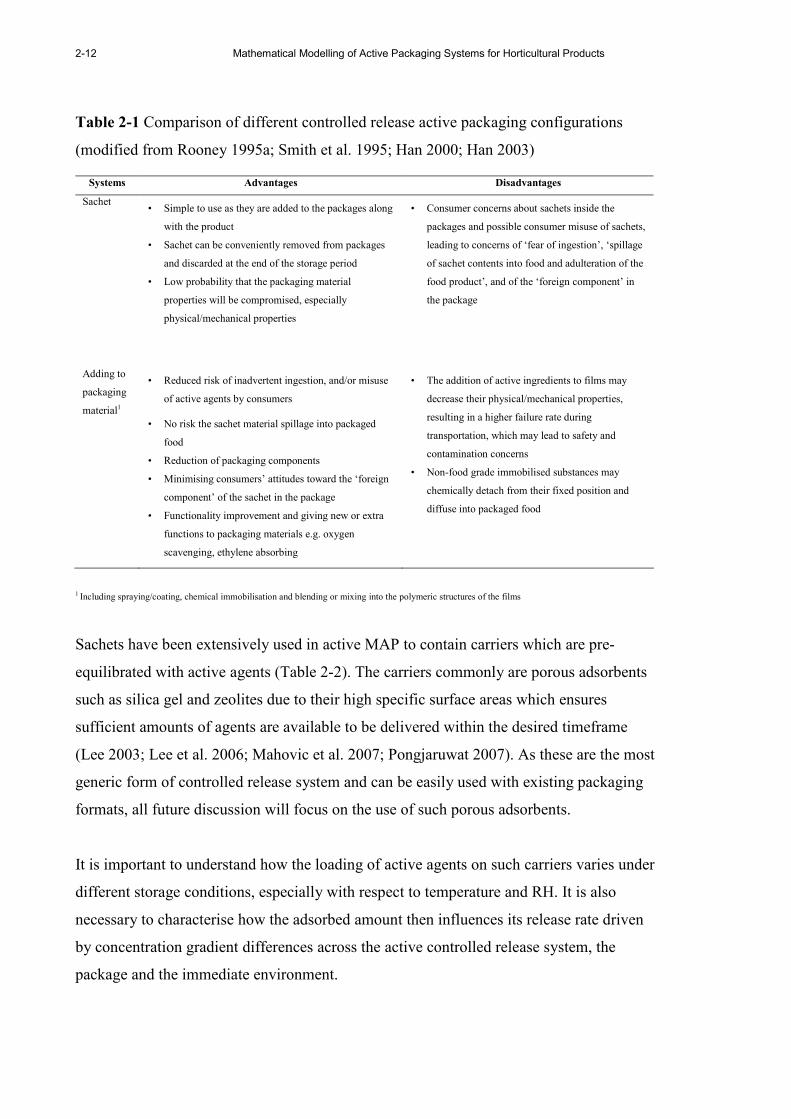
2-12 Mathematical Modelling of Active Packaging Systems for Horticultural Products
Table 2-1 Comparison of different controlled release active packaging configurations
(modified from Rooney 1995a; Smith et al. 1995; Han 2000; Han 2003)
Systems Advantages Disadvantages
Sachet • Simple to use as they are added to the packages along
with the product
• Sachet can be conveniently removed from packages
and discarded at the end of the storage period
• Low probability that the packaging material
properties will be compromised, especially
physical/mechanical properties
• Consumer concerns about sachets inside the
packages and possible consumer misuse of sachets,
leading to concerns of ‘fear of ingestion’, ‘spillage
of sachet contents into food and adulteration of the
food product’, and of the ‘foreign component’ in
the package
Adding to
packaging
material1
• Reduced risk of inadvertent ingestion, and/or misuse
of active agents by consumers
• No risk the sachet material spillage into packaged
food
• Reduction of packaging components
• Minimising consumers’ attitudes toward the ‘foreign
component’ of the sachet in the package
• Functionality improvement and giving new or extra
functions to packaging materials e.g. oxygen
scavenging, ethylene absorbing
• The addition of active ingredients to films may
decrease their physical/mechanical properties,
resulting in a higher failure rate during
transportation, which may lead to safety and
contamination concerns
• Non-food grade immobilised substances may
chemically detach from their fixed position and
diffuse into packaged food
1 Including spraying/coating, chemical immobilisation and blending or mixing into the polymeric structures of the films
Sachets have been extensively used in active MAP to contain carriers which are pre-
equilibrated with active agents (Table 2-2). The carriers commonly are porous adsorbents
such as silica gel and zeolites due to their high specific surface areas which ensures
sufficient amounts of agents are available to be delivered within the desired timeframe
(Lee 2003; Lee et al. 2006; Mahovic et al. 2007; Pongjaruwat 2007). As these are the most
generic form of controlled release system and can be easily used with existing packaging
formats, all future discussion will focus on the use of such porous adsorbents.
It is important to understand how the loading of active agents on such carriers varies under
different storage conditions, especially with respect to temperature and RH. It is also
necessary to characterise how the adsorbed amount then influences its release rate driven
by concentration gradient differences across the active controlled release system, the
package and the immediate environment.

Chapter 2: Literature Review
2-13
Table 2-2 A summary of active MAP systems that can release active agents into the
package headspace and their reported application for horticultural products
Active systems
Active agent Carrier Configurations
Horticultural
products References
1-MCP Silica gel Sachet Tomato Lee (2003)
Ethanol Proprietary silica gel Sachet a Broccoli Suzuki et al. (2004)
2-nonanone Modified cornstarch Sachet Raspberry,
strawberry
Vaughn et al. (1993)
Eugenol Silica gel Sachet Tamarillo Pongjaruwat (2007)
Eugenol, Thymol,
Menthol and
Eucalyptol
Sterilised gauzes b Loose Sweet cherry Serrano et al. (2005)
SO2 Proprietary silica gel Pad c Grape Mustonen (1992)
Hexanal Paper Wet paper pad Sliced apple Corbo et al. (2000)
Chlorine dioxide Zeolite Sachet Tomato Mahovic et al. (2007)
a Sold under the trade name Antimold Mild (Freund Industrial Co., Ltd., Japan)
b Similar to those are used for first aid purposes; one agent for one gauze
c Sold under trade names such as UVAGAS SO2 pad (Grapetek (Pty) Ltd., Epping, South Africa)
Sorption isotherms relate the composition of the solid phase to the equilibrium gaseous
concentration surrounding the solid (Do 1998b), thus providing a method of estimating the
equilibrium loading of active agent on a spcified carrier for a given temperature. The
generic sorption isotherm function is given by Eq. 2-1.
( )igis CfC = (Eq. 2-1)
where
isC = Equilibrium adsorbed amount of adsorbate i on adsorbents (solid phase,
mol·g-1)
igC = Equilibrium vapour concentration (or pressure) of adsorbate i with
adsorbents (gas phase, mol·m-3)
There are several types of sorption isotherms each with a characteristic curve (Adamson
1990) such as those shown in Figure 2-1. The type of isotherm depends on the natures of
both the adsorbate and adsorbent. For example, whilst moisture sorption isotherms of many

2-14 Mathematical Modelling of Active Packaging Systems for Horticultural Products
biological materials, including food products and paper-based materials, are often reported
to follow the sigmoid shape (the Type II isotherm as shown in Figure 2-1; also see
Blahovec 2004), those of silica gel adsorbents (Type 3A and RD, Fuji Silysia Chemical
Ltd., Japan) are most commonly found to be linear (Ng et al. 2001). Furthermore, although
similar types of adsorbents (e.g. activated carbon, BPL, Pittsburg Chemical Co. USA) were
used, different isotherm shapes were observed for different adsorbates. N2 adsorption
yielded a linear shape for the nitrogen adsorption but a Type I shape (Figure 2-1) was
observed for carbon dioxide (Valenzuela 1989).
Figure 2-1 Brunauer’s five types of adsorption isotherm of which adsV , p , 0p and B
representing sorption extents (volume), pressure, saturated pressure, and a knee of the
curve indicating a completion of a monolayer (reprinted from Adamson 1990)
Whilst isotherm data of many compounds such as ethanol and sulphur dioxide are
available in the separation science literature for a range of adsorbents (see e.g. Valenzuela
1989 and Do 1998b), sorption isotherm data appropriate to other active packaging systems
is relatively limited. With respect to the active release packaging systems for horticultural
products, at present only sorption isotherms for 1-MCP and silica gel2 are available. These
were reported by Lee (2003), with the data collected in the pressure range of 0.1-0.8 Pa,
and a temperature range of 50-80ºC (Figure 2-2).
2 Other adsorbents tested were Tenax-TA and activated clay. However their adsorptive capacities were less
than those of silica gel (Lee 2003).

Chapter 2: Literature Review
2-15
0.0 0.1 0.2 0.3 0.4 0.5 0.6 0.7 0.8 0.9
0
5
10
15
20
25
30
35
40
45
80ºC
70ºC60ºC50ºC
Cs (x 10-9 mol/g)
Partial pressure (Pa)
Figure 2-2 Adsorption isotherm of 1-MCP on silica gel at 50, 60, 70, and 80°C (digitally
redrawn3 from Lee 2003); lines representing the Linear adsorption isotherm model (Eq.
2-2).
1-MCP sorption isotherm for silica gel adsorbents (Lee 2003) fitted the linear isotherm
model very well (Figure 2-2; Eq. 2-2). This model is referred to as Henry’s law for gas
adsorption and generally provides a good approximation only for systems operating at low
concentration (Adamson 1990; Lee 2003).
ig
iLin
is CKC = (Eq. 2-2)
where
iLinK = Linear isotherm constant or partition coefficient of adsorbate i (m
3·g-1)
Given that silica gel adsorbents are important carriers in active MAP systems (refer to
Table 2-2), the characteristics of sorption isotherms on silica gel of a range of compounds
that could potentially be used as active agents are summarised in Table 2-3. Isotherms for
N2, CO2, O2 and water vapour are summarised in Valenzuela (1989).
3 Using TechDig software (a Microsoft Windows tool for digitising data from a graphical image).
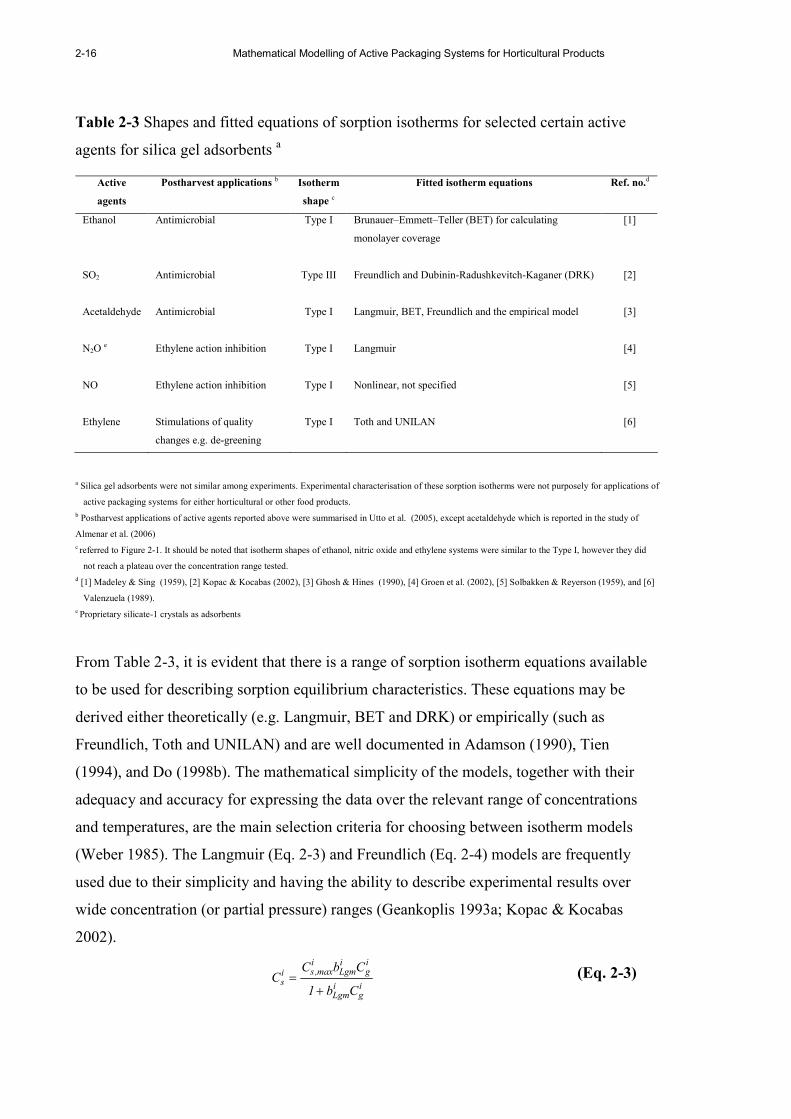
2-16 Mathematical Modelling of Active Packaging Systems for Horticultural Products
Table 2-3 Shapes and fitted equations of sorption isotherms for selected certain active
agents for silica gel adsorbents a
Active
agents
Postharvest applications b Isotherm
shape c
Fitted isotherm equations Ref. no.d
Ethanol Antimicrobial Type I Brunauer–Emmett–Teller (BET) for calculating
monolayer coverage
[1]
SO2 Antimicrobial Type III Freundlich and Dubinin-Radushkevitch-Kaganer (DRK) [2]
Acetaldehyde Antimicrobial Type I Langmuir, BET, Freundlich and the empirical model [3]
N2O e Ethylene action inhibition Type I Langmuir [4]
NO Ethylene action inhibition Type I Nonlinear, not specified [5]
Ethylene Stimulations of quality
changes e.g. de-greening
Type I Toth and UNILAN [6]
a Silica gel adsorbents were not similar among experiments. Experimental characterisation of these sorption isotherms were not purposely for applications of
active packaging systems for either horticultural or other food products.
b Postharvest applications of active agents reported above were summarised in Utto et al. (2005), except acetaldehyde which is reported in the study of
Almenar et al. (2006)
c referred to Figure 2-1. It should be noted that isotherm shapes of ethanol, nitric oxide and ethylene systems were similar to the Type I, however they did
not reach a plateau over the concentration range tested.
d [1] Madeley & Sing (1959), [2] Kopac & Kocabas (2002), [3] Ghosh & Hines (1990), [4] Groen et al. (2002), [5] Solbakken & Reyerson (1959), and [6]
Valenzuela (1989).
e Proprietary silicate-1 crystals as adsorbents
From Table 2-3, it is evident that there is a range of sorption isotherm equations available
to be used for describing sorption equilibrium characteristics. These equations may be
derived either theoretically (e.g. Langmuir, BET and DRK) or empirically (such as
Freundlich, Toth and UNILAN) and are well documented in Adamson (1990), Tien
(1994), and Do (1998b). The mathematical simplicity of the models, together with their
adequacy and accuracy for expressing the data over the relevant range of concentrations
and temperatures, are the main selection criteria for choosing between isotherm models
(Weber 1985). The Langmuir (Eq. 2-3) and Freundlich (Eq. 2-4) models are frequently
used due to their simplicity and having the ability to describe experimental results over
wide concentration (or partial pressure) ranges (Geankoplis 1993a; Kopac & Kocabas
2002).
ig
iLgm
ig
iLgm
imax,si
sCb1
CbCC
+= (Eq. 2-3)

Chapter 2: Literature Review
2-17
( ) Frdnig
iFrd
is CKC =
(Eq. 2-4)
where
imax,sC = Maximum adsorbed amount of adsorbate i on adsorbent estimated by
Langmuir sorption isotherm (mol·g-1)
iLgmb = Langmuir constant (m3·mol-1)
iFrdK = Freundlich constant (mol Frdn1 − ⋅m Frdn3 ·g-1)
Frdn = Exponential factor ( 1n0 Frd << ) in Freundlich equation (dimensionless)
The Langmuir isotherm model was developed by assuming monolayer adsorption of the
adsorbate onto a finite number of identical active sites on the adsorbent (Geankoplis
1993a). It is used to describe the Type I isotherm shape (Figure 2-1), typical of
microporous adsorbents (with a pore diameter < 2nm) with adsorbates having molecular
diameters slightly smaller than the adsorbent pore size (Gregg & Sing 1982). In contrast,
the Freundlich isotherm model is an empirically derived isotherm for expressing sorption
on heterogeneous surface adsorbents (Geankoplis 1993a) that offers benefits in describing
a wider range of sorption systems (Weber 1985). The Freundlich model is often used to
describe sorption on activated carbon adsorbents (Do 1998c, page 51).
In addition to the properties of adsorbates and adsorbents, environmental conditions can
affect equilibrium sorption characteristics. Temperature and relative humidity are the key
factors to consider for horticultural product storage and handling.
� Storage temperature
Elevated temperatures can either increase or lower the adsorption of adsorbates by
adsorbents, depending on the thermodynamic properties of the system. For an exothermic
system, the extent of adsorption becomes less as the temperature increases, while the
converse applies for endothermic systems (Adamson 1990; Chen et al. 2007). Lee (2003)
reported a lowering of 1-MCP uptake by silica gel as storage temperatures increased (see
Figure 2-2).
� Relative humidity
Other compounds present in the gaseous phase may interact with either the adsorbate or
adsorbent, or both, and may affect the equilibrium condition compared to the pure
adsorbate-adsorbent system. Evidence shows that a high relative humidity can affect the

2-18 Mathematical Modelling of Active Packaging Systems for Horticultural Products
equilibrium condition by stimulating the release (desorption) of an active agent from the
controlled release system. Such examples include ethanol-silica gel (Smith et al. 1995),
and 1-MCP- silica gel or 1-MCP-cyclodextrin (Daly & Kourelis 2001; Kostansek 2003;
Lee 2003). Weber (1985) warns that the effects of other components on the sorption
isotherms of individual components may be inconclusive because the components of a
mixture may (i) mutually enhance adsorption, (ii) act relatively independently, or (iii)
interfere with one another. For example, Steffan & Akgerman (2001) reported
noncompetitive adsorption on silica gel adsorbents (Davisil, grade 645, Aldrich Chemical
Co., US) for binary adsorbate systems such as water/hexane and water/benzene because the
water adsorbed onto polar sites whilst the nonpolar sites were preferred by the organic
compounds.
2.5 Controlled release of active agents to the package atmosphere
Dynamic release of active agents from adsorbents occurs by desorption. Continuous
uninhibited desorption might negatively affect the efficacy of the active MAP system if the
active agent is rapidly depleted through its release into and transport out of the packaging
system. Controlled release systems are therefore required to provide the required release
pattern into the package headspace, such as ‘fumigation’ (release providing a high
concentration for a limited period), ‘sustaining’ (maintaining the vapour concentration at
an effective level for a required storage period), or a balance between these patterns when
each might be appropriate at different times (e.g. initial release at a high concentration and
then sustained release to maintain the lower concentration level). Following Han (2000),
minimising the transfer of active agents from carriers using polymeric film materials is one
of key approach utilised for such purposes. Examples include sachet systems or controlled
release systems utilising chitosan, alginate, or soy protein films, and cyclodextrin (Han
2000).
Polymeric films are common sachet materials (Lee 2003; Mahovic et al. 2007;
Pongjaruwat 2007) and the release of the active agent involves at least two mass transfer
processes: (i) desorption of the agent from the adsorbent, and (ii) sorption into and
diffusion through the controlling polymeric film structure (including transfer through
associated boundary layers). Alternatively, carriers of the active agents and/or the active
agents themselves may be directly incorporated into polymeric films. Release mechanisms

Chapter 2: Literature Review
2-19
for these configurations, including desorption from the carriers into and diffusion within
the film matrix, can be considered analogous to those identified above for the sachet
configuration.
Knowledge and modelling principles of desorption processes and mass transfer within
polymeric film will now be considered:
2.5.1 Desorption
Fundamentally the desorption process is a reversal of the adsorption process. According to
Weber (1985), adsorption processes are complex and involve three main consecutive mass
transport steps (Figure 2-3) including (i) bulk transport of adsorbate(s) in the fluid phase
(or bulk solution), (ii) diffusion of adsorbate(s) through a boundary layer surrounding the
adsorbent, and (iii) diffusion within the adsorbent to active adsorption sites (intraparticle
transport). The relative importance of each step determines the sorption rate and is
dependent on both the adsorbate’s (e.g. chemical properties) and the adsorbent’s (e.g.
porosity or pore size distribution) properties.
Solution
state
Bulk Boundary layer
TransportTransport
Intraparticle
Transport
Adsorbed
state
Bulk
solution
Boundary
layer
Adsorbent
particle
Figure 2-3 Mass transport steps during adsorption by a porous adsorbent (redrawn after
Weber 1985)
Different mathematical models are cited in the separation science literature with varying
degrees of complexity for describing the kinetics of sorption (and hence desorption)
processes. The models can be generally classified into two groups according to the
assumptions made regarding the importance of diffusion resistances within the porous
adsorbents:
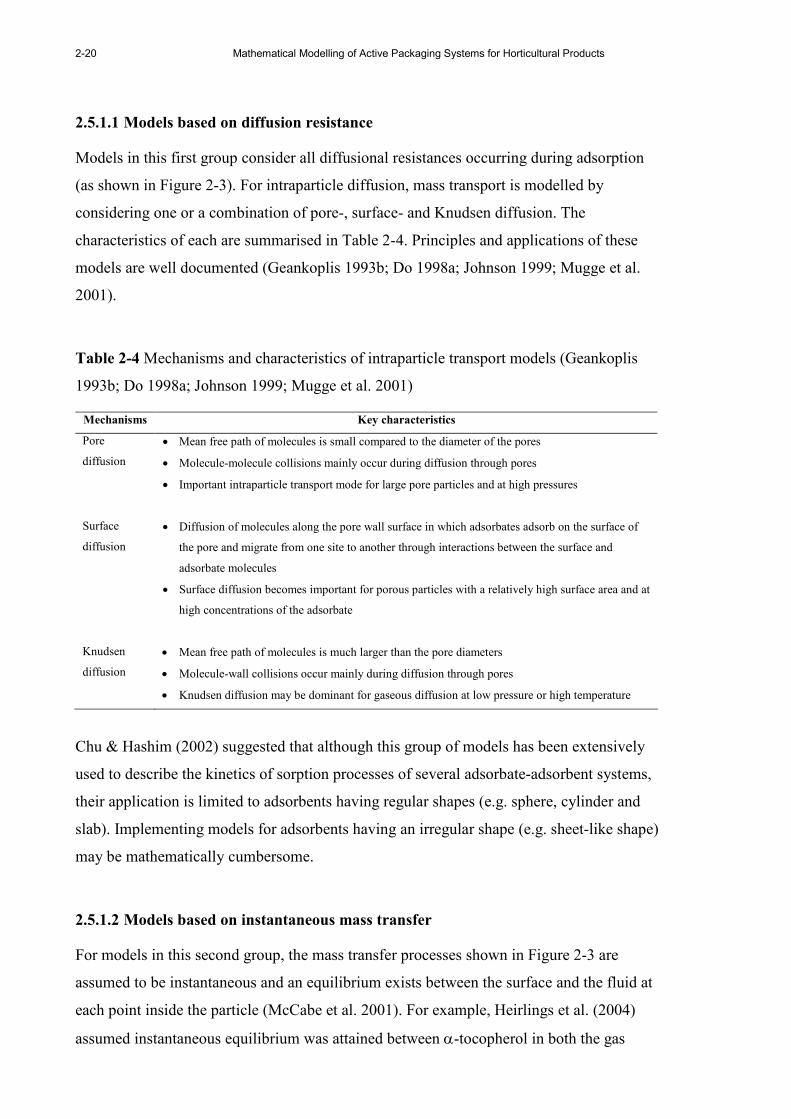
2-20 Mathematical Modelling of Active Packaging Systems for Horticultural Products
2.5.1.1 Models based on diffusion resistance
Models in this first group consider all diffusional resistances occurring during adsorption
(as shown in Figure 2-3). For intraparticle diffusion, mass transport is modelled by
considering one or a combination of pore-, surface- and Knudsen diffusion. The
characteristics of each are summarised in Table 2-4. Principles and applications of these
models are well documented (Geankoplis 1993b; Do 1998a; Johnson 1999; Mugge et al.
2001).
Table 2-4 Mechanisms and characteristics of intraparticle transport models (Geankoplis
1993b; Do 1998a; Johnson 1999; Mugge et al. 2001)
Mechanisms Key characteristics
Pore
diffusion
• Mean free path of molecules is small compared to the diameter of the pores
• Molecule-molecule collisions mainly occur during diffusion through pores
• Important intraparticle transport mode for large pore particles and at high pressures
Surface
diffusion
• Diffusion of molecules along the pore wall surface in which adsorbates adsorb on the surface of
the pore and migrate from one site to another through interactions between the surface and
adsorbate molecules
• Surface diffusion becomes important for porous particles with a relatively high surface area and at
high concentrations of the adsorbate
Knudsen
diffusion
• Mean free path of molecules is much larger than the pore diameters
• Molecule-wall collisions occur mainly during diffusion through pores
• Knudsen diffusion may be dominant for gaseous diffusion at low pressure or high temperature
Chu & Hashim (2002) suggested that although this group of models has been extensively
used to describe the kinetics of sorption processes of several adsorbate-adsorbent systems,
their application is limited to adsorbents having regular shapes (e.g. sphere, cylinder and
slab). Implementing models for adsorbents having an irregular shape (e.g. sheet-like shape)
may be mathematically cumbersome.
2.5.1.2 Models based on instantaneous mass transfer
For models in this second group, the mass transfer processes shown in Figure 2-3 are
assumed to be instantaneous and an equilibrium exists between the surface and the fluid at
each point inside the particle (McCabe et al. 2001). For example, Heirlings et al. (2004)
assumed instantaneous equilibrium was attained between α-tocopherol in both the gas
Chapter 2: Literature Review
2-21
phase and adsorbed phase on solid silica materials (α-tocopherol carriers impregnated in
the film) during the release of α-tocopherol from LDPE film. However sorption isotherms
of α-tocopherol in the silica materials were not reported. This second group of models are
of lower complexity in comparison to the diffusional resistance type and their application
is easily extended to irregularly shaped particles. However this group of models may be
not suitable for systems in which kinetic processes are crucially dependent on pore mass
transport, for example, some catalysis processes (Mills 1995a).
Several factors can affect the desorption process. The key factors and their effects are
summarised as follows:
• Adsorbate molecular weight
Adsorbates with high molecular weight (MW) tend to diffuse more slowly within the
adsorbent than those having lower MW. Thus, for example, methane (MW, 16 g/mol)
diffuses within activated carbon adsorbents at a faster rate than carbon dioxide (MW, 44
g/mol): the gas phase diffusivities (at 20ºC) of methane and carbon dioxide are
6.98 × 10⁻⁷ and 1.26 × 10⁻⁷ m2·s-1, respectively (Prasetyo & Do 1998).
• Affinity with adsorbents
Adsorbates having stronger affinities with the adsorbent are less likely to desorb. Lee
(2003) reported that desorption of 1-MCP from activated carbon adsorbents is essentially
minimal. The activated carbons generally have high adsorptive capacity for organic
compounds and high temperature or low pressure is technically employed to desorb the
adsorbate. The further discussions on this aspect is provided by Do (1998b) and Thomas &
Crittenden (1998b).
• Storage environment
As discussed earlier, the desorption process can be influenced by changes in storage
temperature and relative humidity. The dependence of mass diffusivity on temperature is
well known (e.g. see Geankoplis 1993b; Johnson 1999), while the effect of relative
humidity is assumed to be due to the competition for active adsorption sites through
displacement of adsorbed molecules by water vapour (Smith et al. 1987; Lee 2003). Ayala-
Zavala et al. (2008) recently reviewed the potential of utilising the high relative humidity
(up to 100%RH) developed in passive MA packages containing fresh-cut horticultural
products as the trigger to release antimicrobial essential oils, 1-MCP and other volatile
2-22 Mathematical Modelling of Active Packaging Systems for Horticultural Products
compounds from microencapsulated cyclodextrin. However desorption caused by water
vapour displacement might not occur in certain systems due to non-competitive adsorption
of water vapour and other compounds on adsorbents (as discussed in section 2.4) or a
strong affinity of the adsorbents for water vapour. Lee (2003) reported very low 1-MCP
desorption from activated carbon adsorbents pre-saturated with 1-MCP even though the
adsorbents were exposed to a high relative humidity condition (~90% RH).
2.5.2 Diffusion through mass transfer controlling polymeric film structures
Diffusion through non-perforated polymer film can be modelled using Fick’s second law
of diffusion (Eq. 2-5), simplified to a one-dimensional diffusion, where the local
concentration within the film changes with time and position along the diffusion path in the
film. Crank (1975) introduced various solutions for Eq. 2-5 with different dimensions for
the diffusion matrix and boundary conditions.
2film
ifilm
2
ifilm
ifilm
x
CD
t
C
∂
∂=
∂
∂
(Eq. 2-5)
where
ifilmC = Concentration of the diffusant i in film (mol·m
-3)
ifilmD = Diffusivity of diffusant i in film (m2·s-1)
filmx = Position in film (m)
Eq. 2-5 has been extensively used to model diffusion mass transfer within polymer film
matrices into which active agents have been impregnated (mostly by direct mixing into the
medium without using carriers). A summary of selected research work is provided in Table
2-5.
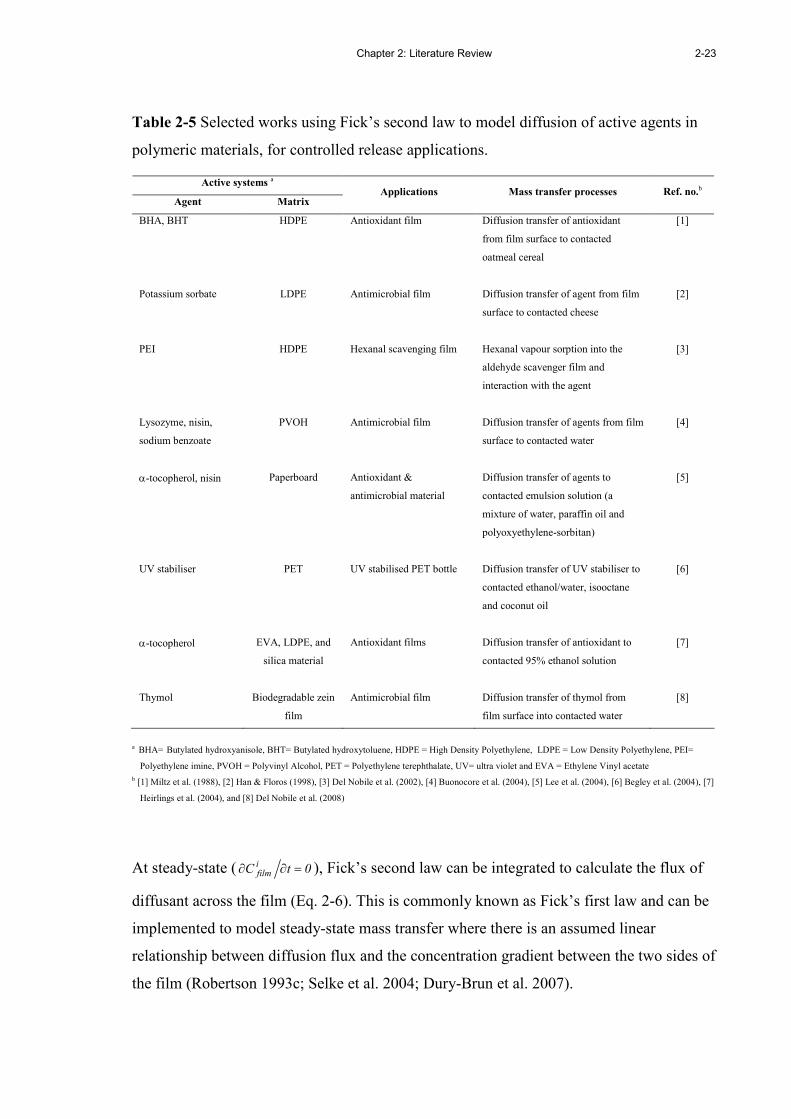
Chapter 2: Literature Review
2-23
Table 2-5 Selected works using Fick’s second law to model diffusion of active agents in
polymeric materials, for controlled release applications.
Active systems a
Agent Matrix Applications Mass transfer processes Ref. no.b
BHA, BHT HDPE Antioxidant film Diffusion transfer of antioxidant
from film surface to contacted
oatmeal cereal
[1]
Potassium sorbate LDPE Antimicrobial film Diffusion transfer of agent from film
surface to contacted cheese
[2]
PEI HDPE Hexanal scavenging film Hexanal vapour sorption into the
aldehyde scavenger film and
interaction with the agent
[3]
Lysozyme, nisin,
sodium benzoate
PVOH Antimicrobial film Diffusion transfer of agents from film
surface to contacted water
[4]
α-tocopherol, nisin Paperboard Antioxidant &
antimicrobial material
Diffusion transfer of agents to
contacted emulsion solution (a
mixture of water, paraffin oil and
polyoxyethylene-sorbitan)
[5]
UV stabiliser PET UV stabilised PET bottle Diffusion transfer of UV stabiliser to
contacted ethanol/water, isooctane
and coconut oil
[6]
α-tocopherol EVA, LDPE, and
silica material
Antioxidant films Diffusion transfer of antioxidant to
contacted 95% ethanol solution
[7]
Thymol Biodegradable zein
film
Antimicrobial film Diffusion transfer of thymol from
film surface into contacted water
[8]
a BHA= Butylated hydroxyanisole, BHT= Butylated hydroxytoluene, HDPE = High Density Polyethylene, LDPE = Low Density Polyethylene, PEI=
Polyethylene imine, PVOH = Polyvinyl Alcohol, PET = Polyethylene terephthalate, UV= ultra violet and EVA = Ethylene Vinyl acetate
b [1] Miltz et al. (1988), [2] Han & Floros (1998), [3] Del Nobile et al. (2002), [4] Buonocore et al. (2004), [5] Lee et al. (2004), [6] Begley et al. (2004), [7]
Heirlings et al. (2004), and [8] Del Nobile et al. (2008)
At steady-state ( 0tCifilm =∂∂ ), Fick’s second law can be integrated to calculate the flux of
diffusant across the film (Eq. 2-6). This is commonly known as Fick’s first law and can be
implemented to model steady-state mass transfer where there is an assumed linear
relationship between diffusion flux and the concentration gradient between the two sides of
the film (Robertson 1993c; Selke et al. 2004; Dury-Brun et al. 2007).
2-24 Mathematical Modelling of Active Packaging Systems for Horticultural Products
film
ifilm
ifilm
ifilm
L
C
DJ
∆=
(Eq. 2-6)
where
ifilmJ = Steady-state diffusion flux of diffusant i in film (mol·m-2·s-1)
filmL = Film thickness (m)
ifilmC∆ = Concentration difference of diffusant i between the two sides of the film
(mol·m-3)
When the diffusant or permeant is a gaseous compound at sufficiently low concentrations,
the concentration gradients due to concentration differences between two sides of the
surface of the film can be linked to partial pressure gradients using Henry’s law (similar to
Eq. 2-2), by using the solubility coefficient ( ifilmS ) to represent the equilibrium uptake of
the permeant by the packaging film (Robertson 1993c; Selke et al. 2004; Dury-Brun et al.
2007). The relationship between concentration and pressure gradient is then expressed in
Eq. 2-7;
ifilm
ifilm
ifilm pSC ∆∆ = (Eq. 2-7)
where
ifilmS = Solubility coefficient of gas i into film (mol⋅m-3⋅Pa-1)
ifilmp∆ = Partial pressure differential of gas i at both sides of film surfaces (Pa)
The generic form of steady-state gaseous permeation through a polymer film is shown in
Eq. 2-8 and Eq. 2-9 as a result from combining Eq. 2-6 and Eq. 2-7. Eq. 2-9 demonstrates
that the permeability is a product of diffusivity and solubility:
film
ifilmfilm
ifilm
ifilm
L
pAP
N
∆=
(Eq. 2-8)
where
ifilm
ifilm
ifilm SDP = (Eq. 2-9)
where
ifilmN = Steady-state rate of transfer of gas i across the film (mol⋅s-1)
filmA = Film area (m2)
Chapter 2: Literature Review
2-25
ifilmP = Permeability to permeant i of the film (mol⋅m⋅s-1⋅m-2⋅Pa-1)
Because of its explicit solution Eq. 2-8 has been extensively used in modelling steady-state
gas permeation of O2, CO2, N2 and water vapour in passive MAP systems (Merts 1996;
Chen et al. 2000; Charles et al. 2003; Charles et al. 2005) and in modelling shelf life of
food products, e.g. in predicting the profile of accumulation of moisture within dried food
packages (Robertson 1993d; Selke et al. 2004). The permeabilities of polymeric films to
individual gases (i.e. O2, CO2, and N2) and VOCs can be found elsewhere including Pauly
(1999) who extensively documented permeability values (as well as individual value of
diffusivity and solubility) for a wide range of permeant-polymer film systems.
In most cases permeability is a constant for a polymer-permeant system at a given
temperature and it is common to characterise the effect of temperature on ifilmP by
Arrhenius or power law relationship. In addition to temperature, there are other factors that
potentially affect permeability. These may be broadly categorised as (i) the nature of the
polymer film including crystallinity, glass transition ( gT ), and polymeric structural
arrangement, (ii) concentration and molecular size of the permeant, and (iii) the storage
environment (temperature and relative humidity). The effects of these factors have been
well documented in literature (see Zobel 1982; Robertson 1993c; Piringer 2000; Selke et
al. 2004), including the recent comprehensive reviews by Dury-Brun et al. (2007) and
Sajilata et al. (2007) which consider the mass transfer of flavours and volatile organic
compounds (VOCs) through food packaging polymer films. The effects of those factors on
permeability of specific films in active packaging systems are further discussed in Chapter
4.
Song et al. (1996) studied LDPE film permeability to hexanal and hexylacetate vapour (as
potential antimicrobial vapours for controlling Penicillium expansum and Botrytis cinerea
inoculated on sliced apples) at 0 to 30ºC and reported their strong temperature dependence
was well described by the Arrhenius relationship (Eq. 2-10).
−=
film
i
0,film
i
filmRT
Ea
expPP (Eq. 2-10)
2-26 Mathematical Modelling of Active Packaging Systems for Horticultural Products
where:
i0,filmP = Fitted pre-exponential factor for permeability to permeant i of the film
(mol·m·m-2·s-1·Pa-1)
R = Gas constant (8.314 J⋅mol-1⋅ K-1)
Ea = Energy of activation (J⋅mol-1)
filmT = Measured film temperatures (K)
The values of Ea for hexanal and hexylacetate were reported to be 44.6 and 23.6 kJ·mol-1,
respectively, indicating that LDPE permeability to hexanal vapour is more sensitive to
changes in temperature than is hexylacetate. Likewise, Wolford (1998) studied
permeability to hexanal vapour of a metallocene-catalysed ethylene-hexene copolymer
film (ExactTM 4151) at 5 and 23ºC and reported a positive correlation between temperature
and permeability. There is much literature providing information on the Arrhenius
relationship for polymer films with respect to permeation by gases and vapours. For
example Pauly (1999) reported LDPE permeabilities to various gases (including O2, CO2
and N2) and organic vapours (e.g. acetaldehyde) across the temperature range from 0 to
74ºC.
The effects of relative humidity on permeability are relevant in active packaging systems
where the polymer film will play a role in regulating the release of active agent. RH effects
on film permeability depend firstly on whether the film is hydrophobic or hydrophilic in
nature. Hydrophobic films such as LDPE and PP have a low affinity for water vapour,
while the hydrophilic films, such as EVOH and PVOH, have a strong affinity for water
vapour (Robertson 1993c; Selke et al. 2004). Lee (2003) and Lee et al. (2006) reported
minimal effects of a high humidity level (90%RH) on 1-MCP release from pouches made
with LDPE. In hydrophobic films, the polarity of the film may have to be taken into
account when considering the effects of RH. Hydrophobic polar films, such as PET, could
adsorb or interact with water vapour (another polar compound) and permeability can be
affected by RH level of the surrounding environment (Nielsen et al. 1992; Sajilata et al.
2007). The permeability of hydrophilic films can be altered by water vapour and are likely
to increase in high RH environments (DeLassus et al. 1988; Robertson 1993c). The
utilisation of hydrophilic film materials as the controlled release layer may provide a
benefit in enhancing the release of active agents in response to generation of high humidity
conditions.
Chapter 2: Literature Review
2-27
Several VOCs have potential to be utilised as active agents for antimicrobial control (Utto
et al. 2005) and the effects of their concentration on film permeability must be taken into
account in the design of active packaging systems. Film permeability to VOCs is generally
concentration dependent due to the concentration dependence of both diffusivity and
solubility, resulting from the plasticising action of the absorbed molecules. Plasticisation
facilitates diffusion of the permeant through the polymeric structures by increasing the
mobility of polymers and/or the void volume for diffusion (Zobel 1982; Robertson 1993c;
Selke et al. 2004). Knowledge of the concentration dependence of VOC film permeability
are extensively discussed elsewhere (Zobel 1982; Zobel 1985; DeLassus et al. 1988;
Mulder 1991; Piringer 2000). However, studies of this aspect of active MAP systems for
horticultural or food products are limited. In addition, DeLassus (1997) suggested that
utilising VOCs with polymer film materials may require understanding the importance of
the time taken to establish steady-state concentration gradients through the film. The
diffusion of large molecules or those where there is a strong affinity of permeants for the
polymer may slow the development of the concentration gradient and the achievement of
steady-state. This delay period may even be longer than the anticipated shelf life of
packaged products. The relatively slow permeation of the active agent through the polymer
film layer could thus affect the level of active agent in the packaging system, such as
vapour concentration in the headspace or on the outer film surface directly contacting the
packaged product.
2.6 Permeation through packaging materials
2.6.1 Polymer film materials: non-perforated and perforated films
In practice, polymer films used in the horticultural industry are applied in several forms,
such as bags, box liners, cling films, and pallet shrouding (Thompson & Mitchell 2002)
and these can be either non-perforated or perforated. Generic approaches to modelling
permeation in non-perforated packaging films were discussed in section 2.5.2.
Perforated film materials are increasingly being used as packaging for horticultural
products because they provide improved gaseous permeability, particularly for oxygen thus
better assuring aerobic conditions in the package (Utto 2001). A number of mathematical
models are used to model mass transfer through perforated channels, where the continuous
2-28 Mathematical Modelling of Active Packaging Systems for Horticultural Products
section of the film material is assumed to be only a supportive structure for the pores and
to contribute minimally to overall mass transfer (Renault et al. 1994b; Hernandez 1997;
Del-Valle et al. 2004).
Several models were developed based on assumptions around the size of the pore ( d ) and
the mean free-path of the gas molecules ( λ ) and the ratio of λd is adopted as a criterion
for justifying the approach to model diffusion through the pore. Knudsen diffusion is used
where λd <0.2, Fickian molecular diffusion is used for λd >20 and transitional flow for
λd in the range of 0.2 to 20 (Hernandez 1997). Given 10-7-10-9 m as a generic magnitude
of λ (Hernandez 1997), Knudsen diffusion might be negligible in practice because pore
diameters of perforated film used for horticultural products vary from 10µm
(microperforation) to 17 mm (macroperforation) (Emond et al. 1991; Fishman et al. 1996;
Utto 2001; Del-Valle et al. 2003; Del-Valle et al. 2004) and these typically yield λd
values > 20. Hernandez (1997) suggested that Knudsen diffusion might become significant
in regard to leakage from and integrity of packaging seals, where helium ( λ ≈ 25µm) is
used as the leak detecting gas and the leaking pore diameter might be about 5µm or less.
Hernandez (1997) also observed that there might be a total pressure gradient along the
diffusional path of the pore. In this case, the flow can be modelled by using Poiseuille’s
law rather than diffusive mass transfer. In practice, the steady-state diffusion mass transfer
approach is mostly commonly used for modelling perforated film, in which the package
atmosphere pressure is considered to remain equal to atmospheric pressure. This approach
was utilised to model permeation of O2, CO2 and water vapour (Merts 1996; Del-Valle et
al. 2003), and organic vapours such as methanol, ethanol, n-propanol, ethyl acetate and
acetaldehyde (Del-Valle et al. 2004). In most cases model predictions were reported to
agree with experimentally collected data, after adjusting the model by incorporating an
empirical factor to minimise variations attributed to, for example diffusive path length
(Fishman et al. 1996; Del-Valle et al. 2003; Del-Valle et al. 2004) and resistance of air to
diffusion of gases (Merts 1996).
Renault et al. (1994a; 1994b) pointed out that applying Fick’s law to model gas transport in
air through perforations (as summarised above) may not be appropriate because its key
assumptions are made with regard to permeation through the film, not the air. The Stephan-

Chapter 2: Literature Review
2-29
Maxwell law, which well describes the relationships existing between fluxes and
concentration gradients of gases in air, was used as an alternative modelling approach and
its application was demonstrated for O2 and CO2 transport in a MAP system for
strawberries enclosed by a microperforated film. The key assumptions of this approach
were simultaneous gas diffusion and convection with negligible air resistance around the
perforations. However, the model predictions only agreed with experimental data after
incorporating an empirical factor to correct the reduction of diffusional area due to the
resistance to gaseous diffusion in the pore volumes (Renault et al. 1994a; Renault et al.
1994b).
2.6.2 Paper-based packaging materials
In the horticultural industry, paper-based packaging materials are generally used in the
format of boxes (either cardboard or corrugated) or moulded-pulp trays. Paper materials
are reportedly a sink for VOCs (Triantafyllou et al. 2005), consequently knowledge of the
sorption isotherms and/or partition coefficients between paper materials and specific VOCs
is necessary for modelling VOC transfer to paper, and vice versa. The principles governing
the sorption isotherm are the same as those discussed in section 2.4, where the partition
coefficient ( airpaperK ) Eq. 2-11 represents the partitioning of organic compounds between
the paper sample and the gas atmosphere (Triantafyllou et al. 2005). It should be noted that
the partition coefficient is similar to the iLnrK of the linear isotherm (Eq. 2-2).
phase gas
phase paper
airpaper
C
CK = (Eq. 2-11)
where
airpaperK = Partition coefficient (m3·g-1)
phasepaperC = Equilibrium concentration in paper phase (mol·g-1)
phasegasC = Equilibrium concentration in gas phase (mol·m-3)
Lee (2003) reported extremely low airpaperK values (≈0 [sic]) at 23°C for 1-MCP with
filter paper, Tyvek, and LDPE films utilised as sachet materials in a 1-MCP controlled
release system. This indicated that 1-MCP effectively only resided in the gas phase and not
in the solid phase.
2-30 Mathematical Modelling of Active Packaging Systems for Horticultural Products
Paper-based packaging materials can naturally release various VOCs (e.g. due to oxidative
reactions of cellulose-based compounds) and the release of these into the package
headspace may alter the sensory quality of packaged products (Wenzl & Lankmayr 2001).
This suggests the importance of considering release of VOCs from paper materials
(including sheet, cardboard or corrugated board) as a secondary ‘source’ for certain active
agents and particularly hexanal, which is a common VOC released from paper materials
(Wenzl & Lankmayr 2001).
As paper materials are porous and hydrophilic materials, moisture sorption is likely and
will result in (i) increased water loss from fruit due to increasing water vapour gradients
between fruit and air (Kays 1991), and (ii) reduced mechanical properties as the damp
material will have inferior properties such as edge crush test strength or bending stiffness
(Soroka 1995; Nevins et al. 2004; Parker et al. 2006). The equilibrium water vapour
sorption of paper material can be modelled using sorption isotherms representing the
equilibrium relationship between moisture content and water activity ( wa ). Parker et al.
(2006) extensively reviewed moisture sorption isotherms for paper and paperboard in food
chain conditions (typically characterised by high relative humidities and low storage
temperatures). Guggenheim-Anderson-de Boer (GAB) and the Brunauer-Emmett-Teller
(BET) are the common moisture isotherm models and their application for modelling water
vapour sorption in corrugated boxes and moulded pulp tray used with horticultural
products are well documented (Eagleton & Marcondes 1994; Merts 1996; Tanner 1998).
2.7 Interactions of active agents and horticultural products
Active agents are designed to be delivered from the controlled release system and to
interact with packaged horticultural products to achieve desired quality outcomes.
Examples include 1-MCP release for inhibiting ethylene responsiveness of tomatoes (Lee
2003), eugenol for maintaining the colour of tamarillo stem (Pongjaruwat 2007) and sweet
cherry (Serrano et al. 2005), SO2 or ethanol for controlling grey mould in grapes
(Mustonen 1992; Lurie et al. 2006), and ClO2 for controlling bacterial soft rot in tomato
(Mahovic et al. 2007). These interactions can however affect the activities or
concentrations of active agents during the desired storage period. For example Hamilton-
Kemp et al. (1996) reported metabolism of antimicrobial volatile compounds (hexanal,
nonanal and hexylacetate) by strawberries which reduced their concentration in the
Chapter 2: Literature Review
2-31
headspace. Nanthachai et al. (2007) recently reported 1-MCP absorption characteristics of
several plants such as apple, cantaloupe, leaf lettuce and mango, where 1-MCP
concentrations were exponentially reduced to different extents among the tested products.
This literature highlights the importance of considering the product as a possible ‘sink’ for
the active agents within the system.
The interactions of volatile active agent with fruit might be modelled as a gas exchange
due to a concentration gradient across the skin between the internal and external
atmospheres of fruit. Models based on Fick’s first law (see Solomos 1987; Ben-Yehoshua
& Cameron 1989) have been extensively used in this regard where, as summarised by
Merts (1996), key assumptions are (i) a relatively small skin thickness compared to the
radius of the organ, and (ii) the fruit internal atmosphere composition beneath the skin is
considered uniform. However the assumption of uniform internal concentration may not be
always accurate because metabolic consumption of O2 may lead to an internal
concentration gradient. Justifications for the assumptions therefore may be required. To do
so, Merts (1996) utilised the dimensionless Biot number ( Bi ), which is the ratio of external
to internal resistances to mass transfer across the fruit skin contributed by the surface (i.e.
the effective skin permeance to O2 and CO2 ) and internal fruit properties (i.e. effective
diffusivity of O2 and CO2 in flesh), respectively, to justify the uniformity of internal fruit
concentration. Merts (1996) reported values of Bi were generally less than 0.1 where this
value was suggested by Geankoplis (1993c) as a reasonable criteria to neglect (not
significant if neglected) the internal mass transfer resistance.
In the same manner as modelling diffusion through film materials, Fick’s second law
modelling approach can be utilised where internal concentrations are likely to vary with
time and position in the fruit. Several researchers have utilised this approach to model
unsteady-state internal atmosphere concentrationsof , for example, O2 and CO2 in apple
(Mannapperuma et al. 1991), sulfur dioxide in dent corns (Haros et al. 2005), and toluene
and p-xylene in grapefruits (Gorna-Binkul et al. 2001). However the implementation of the
unsteady-state modelling approach might be complicated in term of antimicrobial active
agents because microorganisms could be an additional sink for these (Archbold et al. 1997;
Corbo et al. 2000).
2-32 Mathematical Modelling of Active Packaging Systems for Horticultural Products
Alternatively, kinetic models based on nth-order rates of chemical reaction could be utilised
to model the interaction as a function of concentrations (and temperature). This approach is
similar to those utilised to model quality changes of food products during either processing
and storage (see Labuza 1982; Robertson 1993a; Earle & Earle 2003). An example of this
approach is the study of Wolford (1998) of rates of hexanal consumption by sliced apples
within the range of 0 to ~0.02 mol⋅m-3, at 5-23ºC. Compared to Fick’s law modelling
approaches, the use of a rate equation requires a smaller number of parameters or mass
transfer coefficients and provides benefits where experimental equipment or procedures for
measuring effective diffusivity within fruit flesh or the skin permeances have not been
fully developed or verified.
In addition to understanding the removal of active agents through interactions with
packaged products, the effects of active agents on key postharvest physiological processes
(in particular respiration and ethylene production) and other quality attributes (such as
colour and texture) are of importance. For example ethanol was reported to stimulate the
respiration rates of tomato (Saltveit & Sharaf 1992) and potato (Rychter et al. 1979).
Understanding changes in physiological properties and quality attributes in response to
active agent exposure are essential as their consequences might alter the equilibrium gas
compositions (especially of O2 and CO2) of passive MAP systems or cause loss of
economic value. For example there are reports of skin discolouration of strawberries
(Hamilton-Kemp et al. 1996) and sliced apples (Wolford 1998) under high concentrations
of volatile compounds such as hexanal, hexylacetate and nonanal, and such exposures were
reportedly phytotoxic.
2.8 Summary
This review provides an overview of active packaging systems with an emphasis on
applications for horticultural products (so-called active MAP). There is a developing body
of literature on active systems for delivering 1-MCP and antimicrobial plant volatiles. This
is particularly true for the latter which may be more acceptable to many consumers in place
of synthetic fungicides which potentially pose health risks and are viewed negatively.
Extensive studies have been conducted to improve exposure and delivery techniques,
chiefly for fumigation, (e.g. using mixtures of active agents to achieve additional effects),
and for controlled release systems (e.g. utilising humidity or heat to trigger the release of
Chapter 2: Literature Review
2-33
the active agent) for both groups of active compounds. The most technically advanced
systems are those are for 1-MCP and ethanol release, however only the ethanol release
systems have been commercialised.
There is very limited evidence of the use of mathematical models to generalise and design
active MAP systems, even though principles of the modelling of passive MAP have been
well developed and practically verified. The review has accordingly outlined principles and
approaches for modelling the key mass transfer phenomena expected to occur in active
MAP systems with an emphasis on controlled release systems for a volatile active agent.
The implications for design of active MAP systems drawn from the review can be
summarised:
1. Knowledge of interactions between the active agents (e.g. antimicrobial VOCs) and
carriers (e.g. adsorbents) are required and these can be understood through
characterising the sorption isotherms. Quantifying the effects of temperature and
relative humidity on these isotherms will be important.
2. If polymeric films form part of the controlled release mechanism, film permeability
to the active agents must be understood. Knowledge of effects of storage conditions
(temperature and/or relative humidity) and concentrations of active agents on
permeabilities is essential. Paper-based packaging materials may be sources of
VOCs that are used as active agents due to natural release of VOCs from e.g.
cellulose-based reactions.
3. The enclosed horticultural product may be a sink for the volatile compound agents
and so may influence its the package headspace concentration; such interaction
must therefore be modelled.
4. The active agent may affect the product’s postharvest physiological response which
may subsequently affect the overall MAP designs with regard to achievement of
optimal O2 and CO2 levels for extending the product’s shelf life. These effects must
also be studied and quantified.

2-34 Mathematical Modelling of Active Packaging Systems for Horticultural Products
The following chapters present experimentally collected data with regard to the
implications identified above, to allow development of mathematical models for design of
active MAP system for horticultural products.

Chapter 3: Effects of Active Agents on Postharvest Quality
3-1
Chapter 3
THE EFFECTS OF ACTIVE AGENTS ON POSTHARVEST
QUALITY: HEXANAL VAPOUR AND TOMATO MODEL
SYSTEM
3.1 Introduction
Specific product-package systems are useful to demonstrate how appropriate conceptual
models can be developed for active MAP systems. In Chapter 2, Table 2-2 summarised the
common aspects of active MAP systems for horticultural products. These include (i)
sachets containing active agents pre-adsorbed onto a carrier (for which silica gel
adsorbents enclosed in polymer films have been commonly used), (ii) a plastic bag as the
primary package enclosing the product and sachet, and (iii) an active agent which is
delivered from the sachet into package headspace in such a way that its concentration is
maintained at a targeted level for the duration of a pre-determined storage period. In the
present work, hexanal vapour and fresh tomatoes were used as the example active MAP
system to demonstrate all these aspects. The features of this system are summarised in
Table 3-1.
Table 3-1 Description of working example MAP system: an Active MAP with a hexanal
vapour controlled release sachet for tomatoes
Active MAP components Description
Active agent � Hexanal (antimicrobial agent) (97% G.C. grade, Sigma
Chemical Co., USA)
Postharvest target � Botrytis cinerea (a key postharvest pathogen)
Horticultural product � Tomato (Lycopersicon esculentum Mill., cv. ‘Royale’)
Carrier particles � Silica gel (6-12 mesh, Grade 40, Davison Chemical,
Maryland, US.)
Sachet material � Polymer film materials (e.g. LDPE, Oriented Polypropylene
(OPP), Tyvek and film thicknesses are 30, 20 and 173 µm,
respectively)
Packaging material � LDPE film material (30 µm film thickness; in heated sealed
bag configuration)
Storage temperature � 10 and 20°C ± 1ºC.
3-2 Mathematical Modelling of Active Packaging Systems for Horticultural Products
The application of hexanal vapour as an antimicrobial agent against a range of key
postharvest pathogen such as Botrytis cinerea, Monilinia fructicola, Alternaria alternata,
and Colletotrichum gloeosporioides has been tested either in vitro or in vivo for apples,
strawberries, and grapes (Hamilton-Kemp et al. 1992; Song et al. 1996; Archbold et al.
1997; Archbold et al. 1999; Fan et al. 2006; Song et al. 2007). Fumigation for 6 - 48 h
using hexanal (C6H12O) vapour has been demonstrated to successfully control growth of
these postharvest pathogens (Song et al. 1996; Song et al. 2007). However there could be
benefits in incorporating hexanal in active packaging systems within which spoilage
control is achieved by the release of hexanal vapour at a low concentration over a long
time. No studies on the effects of continuous exposure to hexanal vapour with regard to
antifungal activity and postharvest physiology have been reported in the literature.
Tomato is a major horticultural product in New Zealand and worldwide. As tomatoes are
available all year round in New Zealand, their use minimised experimental difficulties due
to seasonal availability. Storage temperatures were controlled at 10 and 20ºC. The former
represents the optimal temperature commonly utilised for long term tomato storage
(Robinson et al. 1975), while the latter was selected to provide a challenging temperature
for testing the in vivo antifungal activity of hexanal vapour and is typical of the
temperature during uncontrolled (ambient) storage (B. cinerea is a key postharvest
pathogen causing undesirable appearance and economic loss in the form of grey mould).
To date there has been no information published on the antifungal effects of hexanal
vapour on the pathogen-product model of B. cinerea and tomatoes.
The key objectives of work reported in this chapter were therefore: (1) to identify hexanal
vapour concentrations that provide effective fungal control through continuous exposure;
(2) to evaluate the inhibitory effects of these hexanal vapour concentrations when delivered
in a single-dose system; (3) to quantify the effects of these hexanal concentrations on the
physiology and quality parameters of tomatoes; and (4) to determine the rate of hexanal
vapour uptake or conversion (if any) by tomatoes under ambient and modified atmosphere
(MA) conditions. These factors characterise the requirements for design of active MAP
systems.
Chapter 3: Effects of Active Agents on Postharvest Quality
3-3
The first three objectives provide insight into the antifungal activity and effects of hexanal
vapours on postharvest attributes of tomatoes. The minimum inhibitory concentration
(MIC) of hexanal to restrict growth of the model pathogen (B. cinerea) was then used as
the targeted concentration level at which hexanal vapour released from the sachet into the
package headspace was to be maintained and sustained throughout the desired storage
period. Information on physiology and quality responses to continuous exposure to hexanal
vapour is also important for packaging design and overall feasibility. For example, if the
respiration rate changes due to hexanal exposure, this could modify equilibrium O2 and
CO2 levels within the MA package. The last objective concerns packaging design, as
hexanal concentration changes caused by packaged tomatoes is an important input to a
mathematical model (developed in Chapter 6) that describes hexanal headspace dynamics.
In this chapter, two main sets of experiments are described. The first set was conducted to
achieve objectives 1-3, while the second was designed for objective 4. It should be noted
that a summary of the first set of experiments has been published in Postharvest Biology
and Technology4.
3.2 Antifungal activity of hexanal vapour and its effects on tomato physiology and
quality
3.2.1 Materials and methods
Orange-red tomatoes (Lycopersicon esculentum Mill., cv. ‘Royale’; hue angle (h°) = 50.9 ±
1.3) were harvested and delivered by NZ Hothouse Ltd. (Auckland, New Zealand) to
Massey University, Palmerston North, New Zealand. Defect-free tomatoes of uniform size
and colour were selected and equilibrated (20ºC, 24 h) before being randomly assigned to
different experimental treatments. A split plot design with two replications was utilised,
with types of air inside the exposure chambers (either hexanal-laden or hexanal-free) as
main plots and storage times as subplots. Four consecutive experiments were performed
during 2004-2005.
4 Utto W, Mawson A J, & Bronlund J E (2008). Hexanal reduces infection of tomatoes by Botrytis cinerea
whilst maintaining quality. Postharvest Biology and Technology 47 434-437. (see Appendix B)
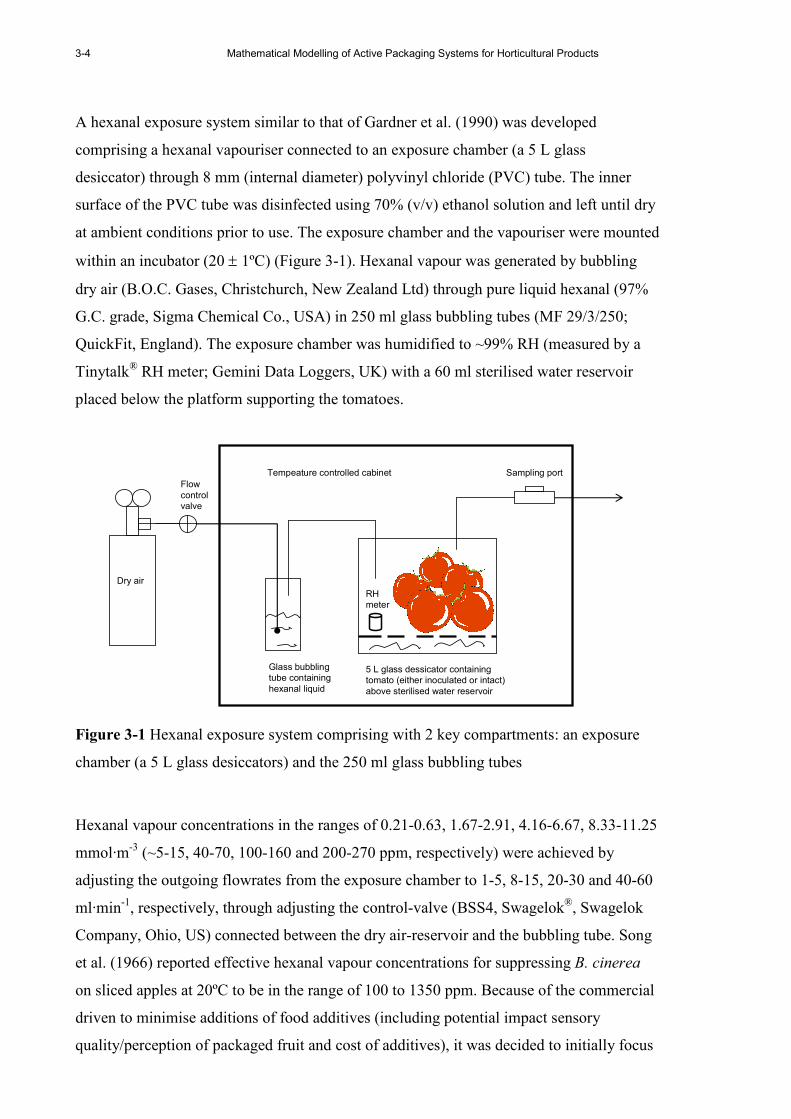
3-4 Mathematical Modelling of Active Packaging Systems for Horticultural Products
A hexanal exposure system similar to that of Gardner et al. (1990) was developed
comprising a hexanal vapouriser connected to an exposure chamber (a 5 L glass
desiccator) through 8 mm (internal diameter) polyvinyl chloride (PVC) tube. The inner
surface of the PVC tube was disinfected using 70% (v/v) ethanol solution and left until dry
at ambient conditions prior to use. The exposure chamber and the vapouriser were mounted
within an incubator (20 ± 1ºC) (Figure 3-1). Hexanal vapour was generated by bubbling
dry air (B.O.C. Gases, Christchurch, New Zealand Ltd) through pure liquid hexanal (97%
G.C. grade, Sigma Chemical Co., USA) in 250 ml glass bubbling tubes (MF 29/3/250;
QuickFit, England). The exposure chamber was humidified to ~99% RH (measured by a
Tinytalk® RH meter; Gemini Data Loggers, UK) with a 60 ml sterilised water reservoir
placed below the platform supporting the tomatoes.
Dry air
Glass bubbling
tube containing
hexanal liquid
5 L glass dessicator containing
tomato (either inoculated or intact)
above sterilised water reservoir
Flow
control
valve
Sampling port
RH
meter
Tempeature controlled cabinet
Figure 3-1 Hexanal exposure system comprising with 2 key compartments: an exposure
chamber (a 5 L glass desiccators) and the 250 ml glass bubbling tubes
Hexanal vapour concentrations in the ranges of 0.21-0.63, 1.67-2.91, 4.16-6.67, 8.33-11.25
mmol·m-3 (~5-15, 40-70, 100-160 and 200-270 ppm, respectively) were achieved by
adjusting the outgoing flowrates from the exposure chamber to 1-5, 8-15, 20-30 and 40-60
ml·min-1, respectively, through adjusting the control-valve (BSS4, Swagelok®, Swagelok
Company, Ohio, US) connected between the dry air-reservoir and the bubbling tube. Song
et al. (1966) reported effective hexanal vapour concentrations for suppressing B. cinerea
on sliced apples at 20ºC to be in the range of 100 to 1350 ppm. Because of the commercial
driven to minimise additions of food additives (including potential impact sensory
quality/perception of packaged fruit and cost of additives), it was decided to initially focus
Chapter 3: Effects of Active Agents on Postharvest Quality
3-5
on testing low concentrations between 0 to 250 ppm. The same gas flowrates (measured
using an Agilent ADM 1000 flow meter; J&W Scientific, USA) were used in the control
treatments. The measured concentrations represent the effective exit (and hence headspace)
values which may include any contribution of hexanal production or uptake by the
tomatoes.
Two hexanal delivery systems were studied: continuous, and single-dose. The former
represented an active packaging system designed to maintain a desired hexanal
concentration throughout the storage period (e.g. by controlled release), while the latter
represented a ‘fumigation’ system. Single-dose exposure was for a 2 h period at the start of
the experiment, thereafter the gas flow was replaced with hexanal-free air at the same
flowrate. Hexanal concentrations in the gas phase were measured by taking 0.1 ml samples
using a gas-tight syringe (Hamilton Gastight®, Hamilton Co., US) through a port fitted
with a Teflon-lined septum at the outlet of the exposure chamber. These samples were
injected onto a gas chromatograph (GC6000 VEGA Series 2, Carlo Erba Instruments,
Italy) equipped with a flame ionisation detector (FID) and a 30 m × 0.25 mm (I.D.), 0.52
µm film thickness, ZB-5 capillary column (Zebron; Phenomenex NZ Ltd). Operational
conditions were: detector, 260ºC; inlet, 250ºC, and the column temperature was maintained
at 100ºC for 30 s and then programmed to increase at 2ºC min-1 to 105ºC. Oxygen-free
nitrogen (B.O.C. Gases New Zealand Ltd) was used as a carrier gas at a flowrate of 2
ml·min-1. The optimal spilt flow ratio was determined to be 200:1. Peak areas and retention
times were recorded on an integrator (C-R6A Chromatopac Shimadzu, Japan) and
compared with the response of injected standards comprising hexanal dissolved in ethyl
acetate (99.5% BDH Laboratory Supplies, England). The retention time of hexanal was
2.38 ± 0.02 min. The calibration curves are presented in Appendix C. Hexanal
concentrations in the exposure chamber were measured daily. For Day 0, gas samplings
were performed initially after hexanal was introduced into the chamber for 30 minutes, and
then every hour for 3 hours.
For each experiment, two groups of ten fruit were assigned to two different exposure
chambers. One group was exposed to hexanal while the second group was flushed with air
only (the ‘control’ group). To study the antifungal activity of hexanal vapour, each tomato
was wiped with cotton pads soaked with 70% (v/v) ethanol solution to disinfect its surface
and left at ambient conditions until the surface was dry. B. cinerea spores, which were
3-6 Mathematical Modelling of Active Packaging Systems for Horticultural Products
harvested from fungi grown on potato-dextrose agar (PDA) from spores isolated from a
diseased tomato fruit, were added through the wound inoculation technique. The fruit
surface was punctured in two positions to a depth of 4 mm using a glass rod of 3 mm
diameter; 30 µL of a 1 × 10⁵ spore⋅ml-1 suspension (determined using a haemocytometer;
0.1 mm, 1/400 mm2 BS.78; Weber, England) was dropped into these holes using a pre-
sterilised dropper and excess moisture was removed with a clean paper towel. The
inoculated areas of the tomatoes were observed daily from outside the exposure chambers
and the number of tomatoes showing fungal infection was noted and reported as a
percentage of total fruit.
To study the effects of hexanal exposure on postharvest physiology and quality attributes
of tomatoes, intact fresh tomatoes (i.e. fruit that were neither wounded nor ethanol- wiped)
were used. Physiological and quality parameters were measured after the first day of
treatment and every 3 days thereafter. For the measurement, the gas flows to the exposure
chambers were stopped, the tomatoes were removed and the appropriate parameters were
immediately measured.
Respiration rate and ethylene production rate of 10 individual fruit for each treatment were
determined first by measuring the accumulation of CO2 and C2H4 within 1 hour following
Johnston et al. (2002). Skin colour was measured as hue angle (hº) using a Minolta CR200
Chromameter (Minolta Camera Co., Japan), after calibration with a standard green tile
(D/0 Differential illumination, 0º viewing; light source C, Y 29.9 x 0.273 y 0.369). Three
locations around the surface of individual fruit, selected at random, were measured. Fruit
mass (g) was determined using a balance (0.001 g; Mettler Toledo PR1203, Switzerland)
and mass loss was expressed as a percentage of the initial fresh mass. Tomato stiffness (106
Hz2g2/3) was assessed using a commercial acoustic firmness tester (AWETA, Nootdorp,
The Netherlands) following Hertog et al. (2004a). The stiffness was measured three times
around the flower end of each fruit.
The measured physiological and quality attributes were presumed to be representative of
fruit inside the exposure chambers due to the short measuring period (~75-80 minutes)
compared to the exposure interval. The tomatoes were returned to the chambers
immediately after measurement and the gas flow was resumed.

Chapter 3: Effects of Active Agents on Postharvest Quality
3-7
All collected data were expressed according to the units proposed by Banks et al. (1995)
and were subjected to an analysis of variance (ANOVA) using the General Linear Model
(GLM). The least significant difference (LSD, p = 0.05) between means for multiple
comparisons was calculated. Statistical Analysis Systems (SAS) software (version 8; SAS
Institute, USA) was used for all statistical analyses. It should be noted that the ‘Day 0’ data
(of 10 replicates randomly selected) appearing in the figures were not used to determine
LSD values.
3.2.2 Results and discussion
Active packaging systems may be beneficial for extending the shelf life of fresh products.
For example, an O2 scavenger has been used to lower O2 level and thus reduce the
respiration rate of tomatoes (Charles et al. 2003) and ethylene absorbers have been utilised
to control ethylene within the headspace of strawberry packages (Picón et al. 1993).
Hexanal vapour is a natural component of tomato aroma (Stone et al. 1975) and so could
be a practical tool for controlling B. cinerea infection on tomatoes.
Several ranges of hexanal vapour concentrations were continuously applied to tomatoes at
20ºC throughout the 7-day trial period. The concentrations were reasonably stable within
1-1.5 h after introducing hexanal vapour into the exposure chamber (Figure 3-2). The
continuous application of 40-270 ppm hexanal vapour was demonstrated to be an effective
antifungal treatment (Table 3-2 and Figure 3-3). This inhibition of in vivo growth of B.
cinerea on tomatoes is consistent with observations for hexanal fumigation of sliced apple
(Song et al. 1996), strawberries (Archbold et al. 1997), raspberries and pears (Song et al.
2007), and confirms the potential use of hexanal in active packaging systems.
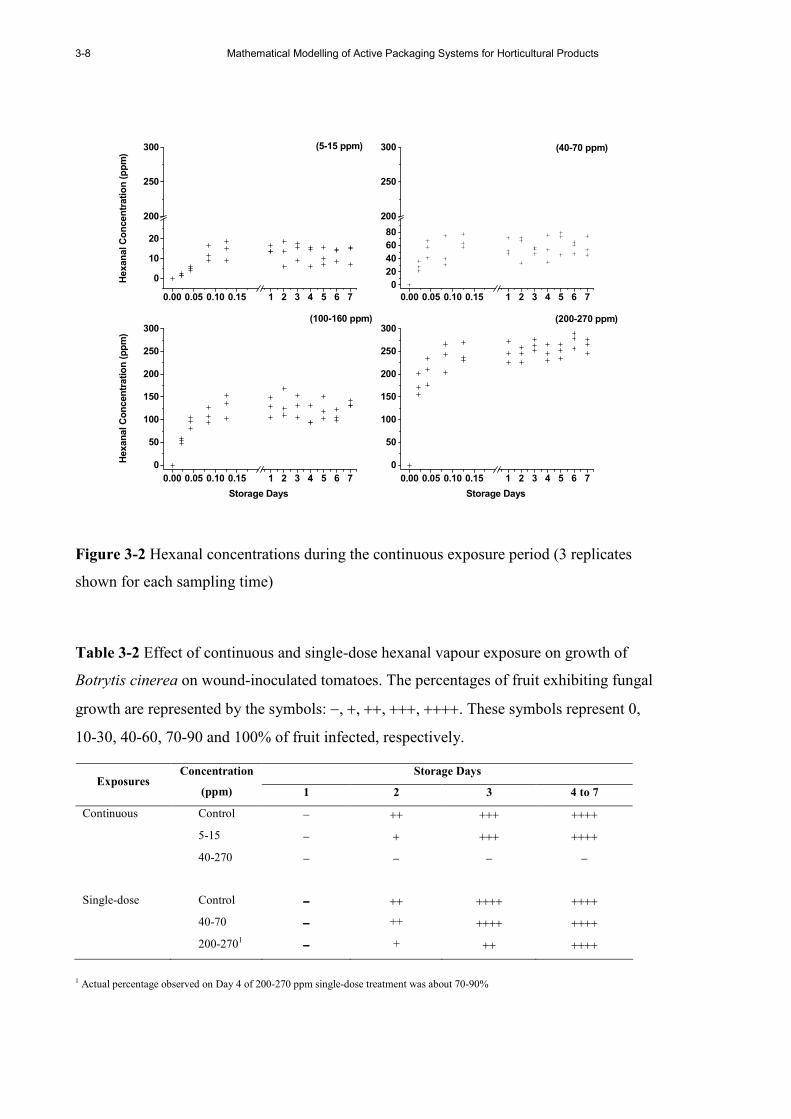
3-8 Mathematical Modelling of Active Packaging Systems for Horticultural Products
0.00 0.05 0.10 0.15 1 2 3 4 5 6 7
0
10
20
200
250
300
Hexanal Concentration (ppm)
0.00 0.05 0.10 0.15 1 2 3 4 5 6 7
0
20
40
60
80
200
250
300 (40-70 ppm)
0.00 0.05 0.10 0.15 1 2 3 4 5 6 7
0
50
100
150
200
250
300(200-270 ppm)(100-160 ppm)
Hexanal Concentration (ppm)
Storage Days
0.00 0.05 0.10 0.15 1 2 3 4 5 6 7
0
50
100
150
200
250
300
(5-15 ppm)
Storage Days
Figure 3-2 Hexanal concentrations during the continuous exposure period (3 replicates
shown for each sampling time)
Table 3-2 Effect of continuous and single-dose hexanal vapour exposure on growth of
Botrytis cinerea on wound-inoculated tomatoes. The percentages of fruit exhibiting fungal
growth are represented by the symbols: −, +, ++, +++, ++++. These symbols represent 0,
10-30, 40-60, 70-90 and 100% of fruit infected, respectively.
Storage Days Exposures
Concentration
(ppm) 1 2 3 4 to 7
Continuous Control − ++ +++ ++++
5-15 − + +++ ++++
40-270 − − − −
Single-dose Control −−−− ++ ++++ ++++
40-70 −−−− ++ ++++ ++++
200-2701 −−−− + ++ ++++
1 Actual percentage observed on Day 4 of 200-270 ppm single-dose treatment was about 70-90%

Chapter 3: Effects of Active Agents on Postharvest Quality
3-9
(A) (B)
(C ) (D)
Figure 3-3 Tomatoes kept under different gas compositions: 40-70 ppm, at day 7 (A), 5-15
ppm on day 2 and day 4, respectively (B and C), and day 2 after leaving 40-160 ppm
treated tomatoes in the ambient condition (D).
Continuous exposure provided effective inhibition under highly challenging conditions
(20°C, ~99% RH) at significantly lower hexanal concentrations than required for
fumigation for 12 – 48 hours (Song et al. 1996; Song et al. 2007). Single-dose treatment of
tomatoes at 40-70 and 200-270 ppm for 2 h showed only limited antifungal activity. The
latter treatment suppressed fungal appearance by only one day (Table 3-2), confirming a
period of sustained exposure is required unless more elevated hexanal concentrations are
employed.
Hexanal vapour could be either fungistatic (inhibitory) or fungicidal (lethal) to B. cinerea.
In the present work, when hexanal vapour was replaced with hexanal-free air after the 7th
day of continuous treatment, grey mould appeared within 2 days on all inoculated fruits
treated with 40-160 ppm hexanal vapour (e.g. Figure 3-3D); no subsequent mould growth
was found among tomatoes treated at 200-270 ppm. That higher hexanal concentrations in
the air headspace appear to promote greater antifungal action is consistent with the
previous reports by Song et al. (1996), Archbold et al. (1997) and Gardini et al. (1997).
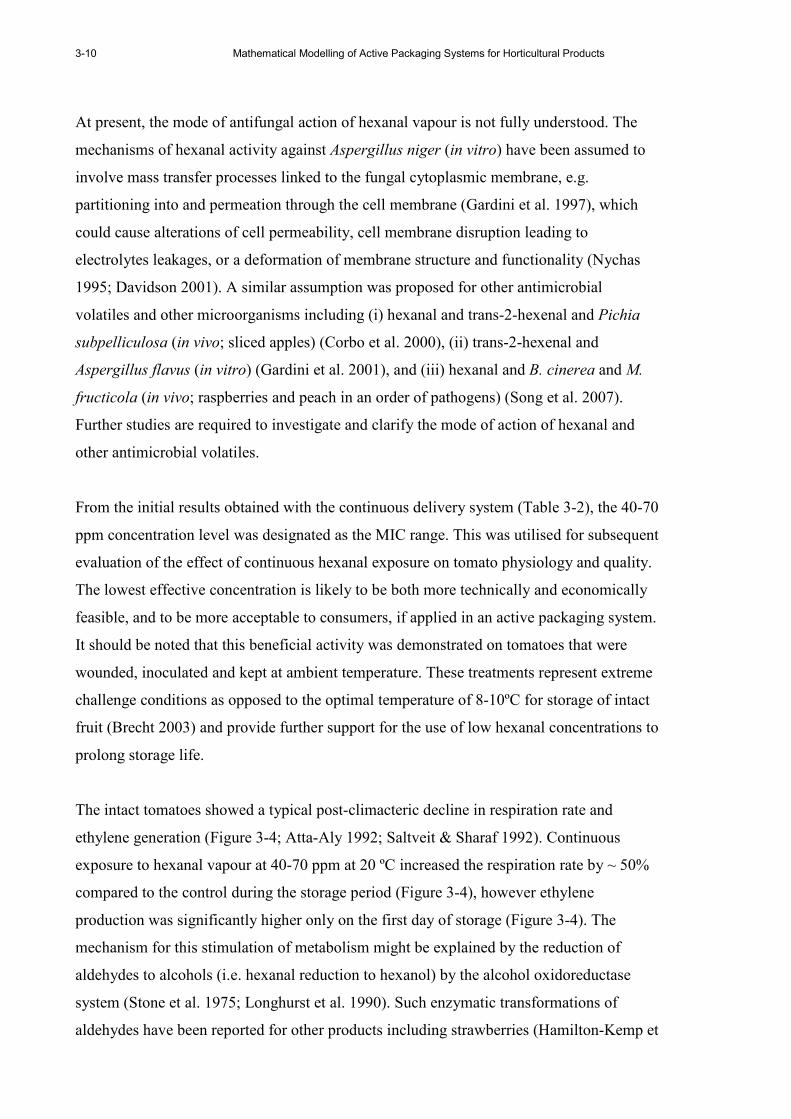
3-10 Mathematical Modelling of Active Packaging Systems for Horticultural Products
At present, the mode of antifungal action of hexanal vapour is not fully understood. The
mechanisms of hexanal activity against Aspergillus niger (in vitro) have been assumed to
involve mass transfer processes linked to the fungal cytoplasmic membrane, e.g.
partitioning into and permeation through the cell membrane (Gardini et al. 1997), which
could cause alterations of cell permeability, cell membrane disruption leading to
electrolytes leakages, or a deformation of membrane structure and functionality (Nychas
1995; Davidson 2001). A similar assumption was proposed for other antimicrobial
volatiles and other microorganisms including (i) hexanal and trans-2-hexenal and Pichia
subpelliculosa (in vivo; sliced apples) (Corbo et al. 2000), (ii) trans-2-hexenal and
Aspergillus flavus (in vitro) (Gardini et al. 2001), and (iii) hexanal and B. cinerea and M.
fructicola (in vivo; raspberries and peach in an order of pathogens) (Song et al. 2007).
Further studies are required to investigate and clarify the mode of action of hexanal and
other antimicrobial volatiles.
From the initial results obtained with the continuous delivery system (Table 3-2), the 40-70
ppm concentration level was designated as the MIC range. This was utilised for subsequent
evaluation of the effect of continuous hexanal exposure on tomato physiology and quality.
The lowest effective concentration is likely to be both more technically and economically
feasible, and to be more acceptable to consumers, if applied in an active packaging system.
It should be noted that this beneficial activity was demonstrated on tomatoes that were
wounded, inoculated and kept at ambient temperature. These treatments represent extreme
challenge conditions as opposed to the optimal temperature of 8-10ºC for storage of intact
fruit (Brecht 2003) and provide further support for the use of low hexanal concentrations to
prolong storage life.
The intact tomatoes showed a typical post-climacteric decline in respiration rate and
ethylene generation (Figure 3-4; Atta-Aly 1992; Saltveit & Sharaf 1992). Continuous
exposure to hexanal vapour at 40-70 ppm at 20 ºC increased the respiration rate by ~ 50%
compared to the control during the storage period (Figure 3-4), however ethylene
production was significantly higher only on the first day of storage (Figure 3-4). The
mechanism for this stimulation of metabolism might be explained by the reduction of
aldehydes to alcohols (i.e. hexanal reduction to hexanol) by the alcohol oxidoreductase
system (Stone et al. 1975; Longhurst et al. 1990). Such enzymatic transformations of
aldehydes have been reported for other products including strawberries (Hamilton-Kemp et
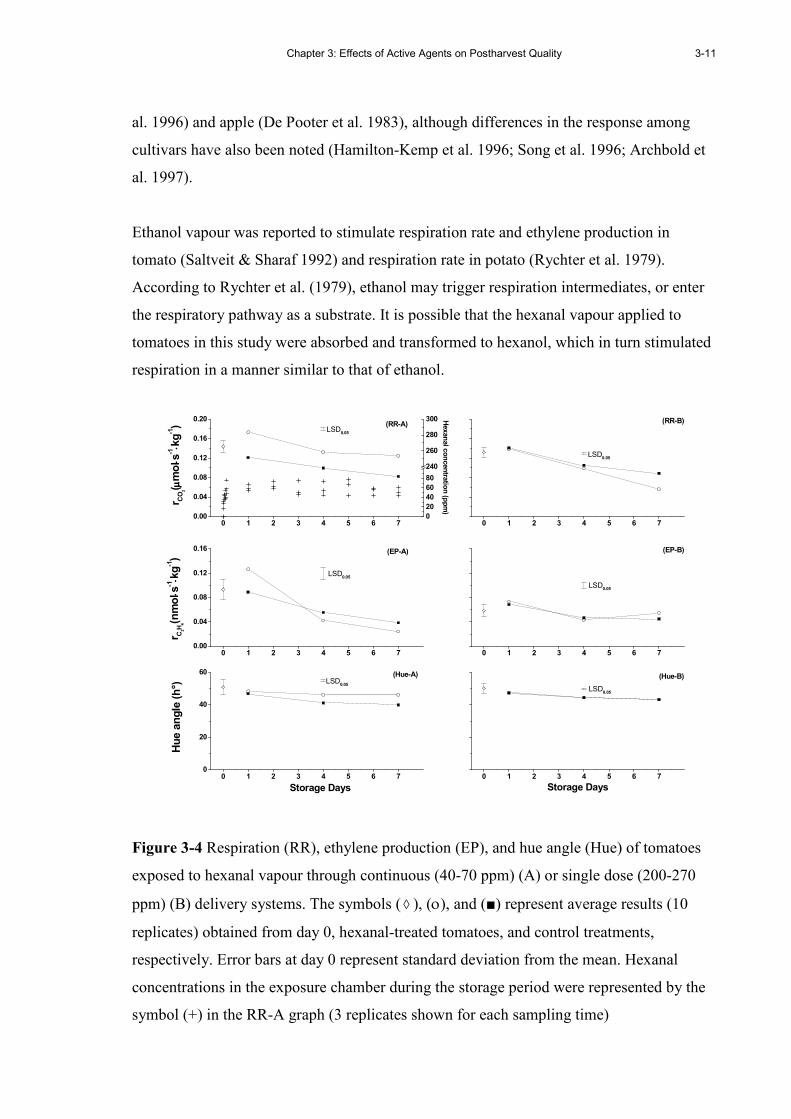
Chapter 3: Effects of Active Agents on Postharvest Quality
3-11
al. 1996) and apple (De Pooter et al. 1983), although differences in the response among
cultivars have also been noted (Hamilton-Kemp et al. 1996; Song et al. 1996; Archbold et
al. 1997).
Ethanol vapour was reported to stimulate respiration rate and ethylene production in
tomato (Saltveit & Sharaf 1992) and respiration rate in potato (Rychter et al. 1979).
According to Rychter et al. (1979), ethanol may trigger respiration intermediates, or enter
the respiratory pathway as a substrate. It is possible that the hexanal vapour applied to
tomatoes in this study were absorbed and transformed to hexanol, which in turn stimulated
respiration in a manner similar to that of ethanol.
0 1 2 3 4 5 6 7
LSD0.05
0 1 2 3 4 5 6 7
(RR-B)
LSD0.05
0 1 2 3 4 5 6 7
(Hue-B)
LSD0.05
Storage Days0 1 2 3 4 5 6 7
0
20
40
60
LSD0.05
Hue angle (h°)
Storage Days
0 1 2 3 4 5 6 70.00
0.04
0.08
0.12
0.16
(Hue-A)
(EP-B)(EP-A)
LSD0.05
r C2H
4(nmol ⋅⋅ ⋅⋅ s
-1⋅⋅ ⋅⋅ kg-1)
0 1 2 3 4 5 6 70.00
0.04
0.08
0.12
0.16
0.20 Hexanal concentration (ppm)
(RR-A)LSD
0.05
r CO2( µµ µµmol ⋅⋅ ⋅⋅ s
-1⋅⋅ ⋅⋅ kg-1)
0
20
40
60
80
240
260
280
300
Figure 3-4 Respiration (RR), ethylene production (EP), and hue angle (Hue) of tomatoes
exposed to hexanal vapour through continuous (40-70 ppm) (A) or single dose (200-270
ppm) (B) delivery systems. The symbols ( ◊ ), (ο), and (■) represent average results (10
replicates) obtained from day 0, hexanal-treated tomatoes, and control treatments,
respectively. Error bars at day 0 represent standard deviation from the mean. Hexanal
concentrations in the exposure chamber during the storage period were represented by the
symbol (+) in the RR-A graph (3 replicates shown for each sampling time)
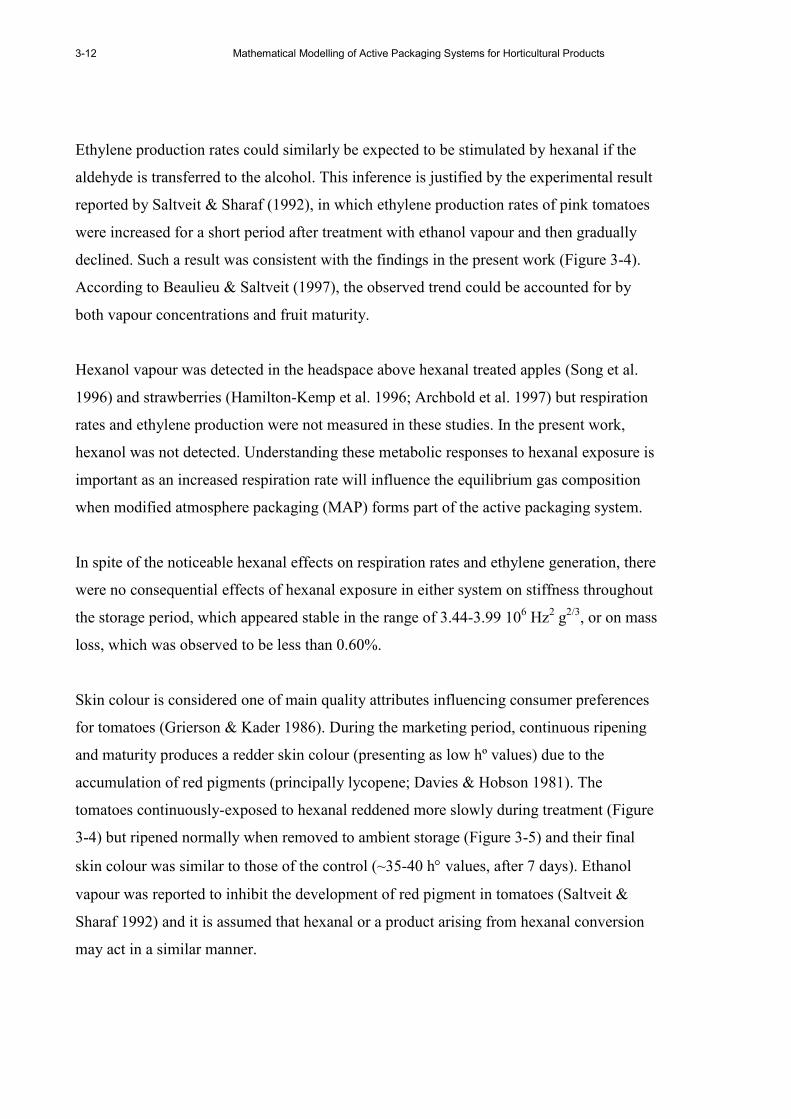
3-12 Mathematical Modelling of Active Packaging Systems for Horticultural Products
Ethylene production rates could similarly be expected to be stimulated by hexanal if the
aldehyde is transferred to the alcohol. This inference is justified by the experimental result
reported by Saltveit & Sharaf (1992), in which ethylene production rates of pink tomatoes
were increased for a short period after treatment with ethanol vapour and then gradually
declined. Such a result was consistent with the findings in the present work (Figure 3-4).
According to Beaulieu & Saltveit (1997), the observed trend could be accounted for by
both vapour concentrations and fruit maturity.
Hexanol vapour was detected in the headspace above hexanal treated apples (Song et al.
1996) and strawberries (Hamilton-Kemp et al. 1996; Archbold et al. 1997) but respiration
rates and ethylene production were not measured in these studies. In the present work,
hexanol was not detected. Understanding these metabolic responses to hexanal exposure is
important as an increased respiration rate will influence the equilibrium gas composition
when modified atmosphere packaging (MAP) forms part of the active packaging system.
In spite of the noticeable hexanal effects on respiration rates and ethylene generation, there
were no consequential effects of hexanal exposure in either system on stiffness throughout
the storage period, which appeared stable in the range of 3.44-3.99 106 Hz2 g2/3, or on mass
loss, which was observed to be less than 0.60%.
Skin colour is considered one of main quality attributes influencing consumer preferences
for tomatoes (Grierson & Kader 1986). During the marketing period, continuous ripening
and maturity produces a redder skin colour (presenting as low hº values) due to the
accumulation of red pigments (principally lycopene; Davies & Hobson 1981). The
tomatoes continuously-exposed to hexanal reddened more slowly during treatment (Figure
3-4) but ripened normally when removed to ambient storage (Figure 3-5) and their final
skin colour was similar to those of the control (~35-40 h° values, after 7 days). Ethanol
vapour was reported to inhibit the development of red pigment in tomatoes (Saltveit &
Sharaf 1992) and it is assumed that hexanal or a product arising from hexanal conversion
may act in a similar manner.

Chapter 3: Effects of Active Agents on Postharvest Quality
3-13
Control
Hexanal
Figure 3-5 Comparison of skin colours after 7 days storage of tomatoes kept in hexanal-
free air (top row) or continuously exposed to hexanal (bottom row)
In contrast to the continuous exposure technique, no significant effects of the hexanal
single-dose treatment on physiology and quality attributes were apparent (Figure 3-4).
Despite the effects of hexanal noted above, the quality parameter values obtained from this
study were all similar to typical values reported in the literature for untreated tomatoes
stored in air under comparable temperatures (18-20ºC) (Table 3-3). It may be concluded
that hexanal treated tomatoes behave similarly to those not treated with hexanal and that
the inclusion of hexanal in an active packaging system potentially offers the benefit of
greater shelf life through reduction of postharvest rots without other detrimental effects.
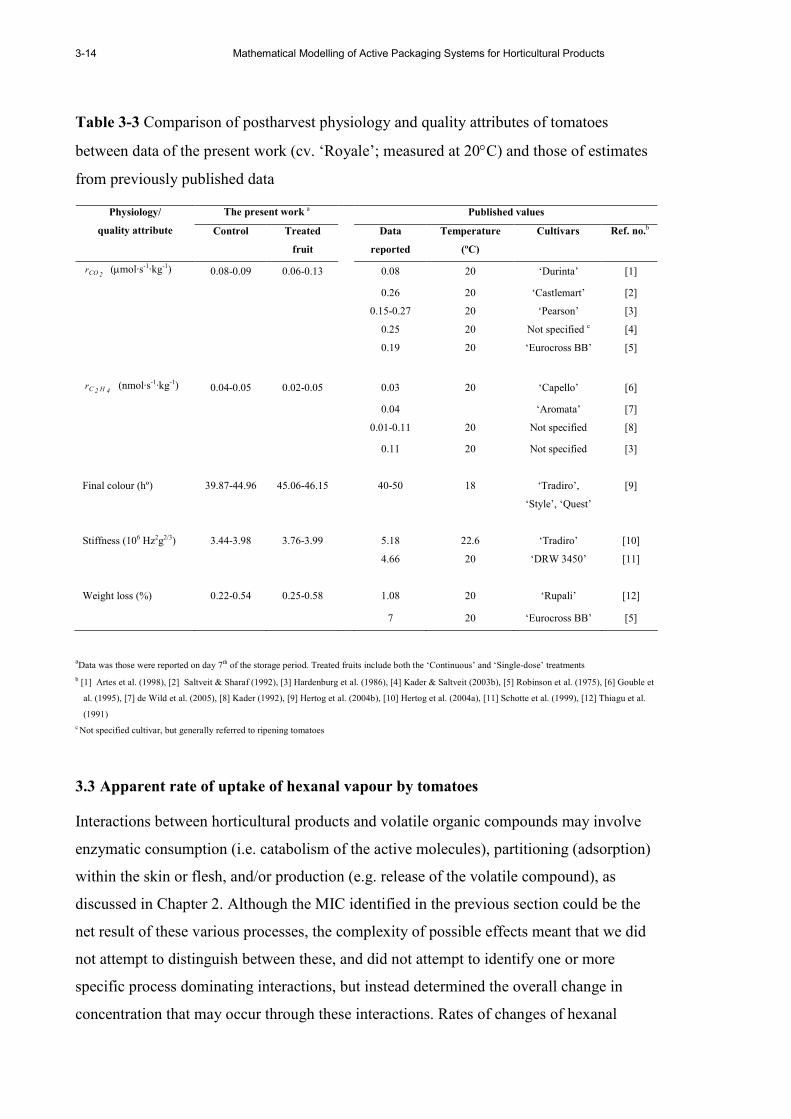
3-14 Mathematical Modelling of Active Packaging Systems for Horticultural Products
Table 3-3 Comparison of postharvest physiology and quality attributes of tomatoes
between data of the present work (cv. ‘Royale’; measured at 20°C) and those of estimates
from previously published data
The present work a Published values Physiology/
quality attribute Control Treated
fruit
Data
reported
Temperature
(ºC)
Cultivars Ref. no.b
2COr (µmol·s-1·kg-1) 0.08-0.09 0.06-0.13 0.08 20 ‘Durinta’ [1]
0.26 20 ‘Castlemart’ [2]
0.15-0.27 20 ‘Pearson’ [3]
0.25 20 Not specified c [4]
0.19 20 ‘Eurocross BB’ [5]
4H2Cr (nmol·s-1·kg-1) 0.04-0.05 0.02-0.05 0.03 20 ‘Capello’ [6]
0.04 ‘Aromata’ [7]
0.01-0.11 20 Not specified [8]
0.11 20 Not specified [3]
Final colour (hº) 39.87-44.96 45.06-46.15 40-50 18 ‘Tradiro’,
‘Style’, ‘Quest’
[9]
Stiffness (106 Hz2g2/3) 3.44-3.98 3.76-3.99 5.18 22.6 ‘Tradiro’ [10]
4.66 20 ‘DRW 3450’ [11]
Weight loss (%) 0.22-0.54 0.25-0.58 1.08 20 ‘Rupali’ [12]
7 20 ‘Eurocross BB’ [5]
aData was those were reported on day 7th of the storage period. Treated fruits include both the ‘Continuous’ and ‘Single-dose’ treatments
b [1] Artes et al. (1998), [2] Saltveit & Sharaf (1992), [3] Hardenburg et al. (1986), [4] Kader & Saltveit (2003b), [5] Robinson et al. (1975), [6] Gouble et
al. (1995), [7] de Wild et al. (2005), [8] Kader (1992), [9] Hertog et al. (2004b), [10] Hertog et al. (2004a), [11] Schotte et al. (1999), [12] Thiagu et al.
(1991)
c Not specified cultivar, but generally referred to ripening tomatoes
3.3 Apparent rate of uptake of hexanal vapour by tomatoes
Interactions between horticultural products and volatile organic compounds may involve
enzymatic consumption (i.e. catabolism of the active molecules), partitioning (adsorption)
within the skin or flesh, and/or production (e.g. release of the volatile compound), as
discussed in Chapter 2. Although the MIC identified in the previous section could be the
net result of these various processes, the complexity of possible effects meant that we did
not attempt to distinguish between these, and did not attempt to identify one or more
specific process dominating interactions, but instead determined the overall change in
concentration that may occur through these interactions. Rates of changes of hexanal
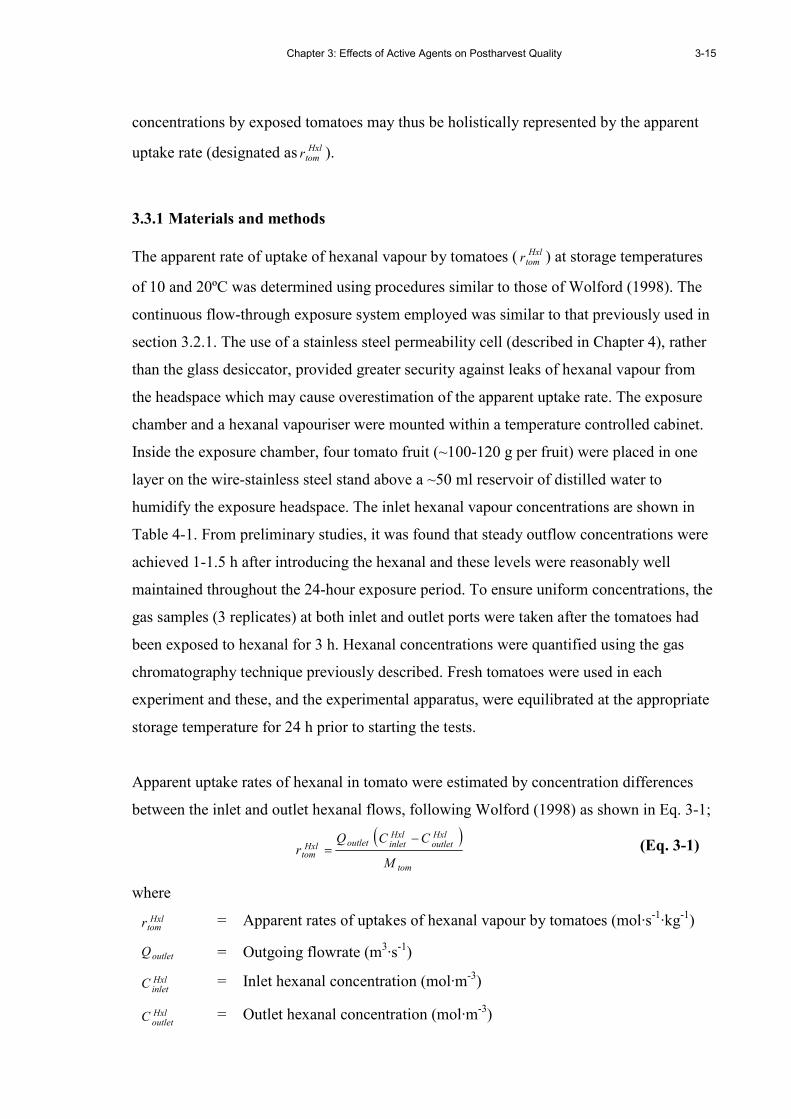
Chapter 3: Effects of Active Agents on Postharvest Quality
3-15
concentrations by exposed tomatoes may thus be holistically represented by the apparent
uptake rate (designated as Hxltomr ).
3.3.1 Materials and methods
The apparent rate of uptake of hexanal vapour by tomatoes ( Hxltomr ) at storage temperatures
of 10 and 20ºC was determined using procedures similar to those of Wolford (1998). The
continuous flow-through exposure system employed was similar to that previously used in
section 3.2.1. The use of a stainless steel permeability cell (described in Chapter 4), rather
than the glass desiccator, provided greater security against leaks of hexanal vapour from
the headspace which may cause overestimation of the apparent uptake rate. The exposure
chamber and a hexanal vapouriser were mounted within a temperature controlled cabinet.
Inside the exposure chamber, four tomato fruit (~100-120 g per fruit) were placed in one
layer on the wire-stainless steel stand above a ~50 ml reservoir of distilled water to
humidify the exposure headspace. The inlet hexanal vapour concentrations are shown in
Table 4-1. From preliminary studies, it was found that steady outflow concentrations were
achieved 1-1.5 h after introducing the hexanal and these levels were reasonably well
maintained throughout the 24-hour exposure period. To ensure uniform concentrations, the
gas samples (3 replicates) at both inlet and outlet ports were taken after the tomatoes had
been exposed to hexanal for 3 h. Hexanal concentrations were quantified using the gas
chromatography technique previously described. Fresh tomatoes were used in each
experiment and these, and the experimental apparatus, were equilibrated at the appropriate
storage temperature for 24 h prior to starting the tests.
Apparent uptake rates of hexanal in tomato were estimated by concentration differences
between the inlet and outlet hexanal flows, following Wolford (1998) as shown in Eq. 3-1;
( )tom
Hxloutlet
HxlinletoutletHxl
tomM
CCQr
−=
(Eq. 3-1)
where
Hxltomr = Apparent rates of uptakes of hexanal vapour by tomatoes (mol·s-1·kg-1)
outletQ = Outgoing flowrate (m3·s-1)
Hxlinlet
C = Inlet hexanal concentration (mol·m-3)
Hxloutlet
C = Outlet hexanal concentration (mol·m-3)

3-16 Mathematical Modelling of Active Packaging Systems for Horticultural Products
tomM = Mass of tomatoes (kg)
3.3.2 Results and discussion
Values of Hxltomr were found to depend on both storage temperature and hexanal inlet
concentration (Figure 3-6), and the variation (represented by data scattering) in Hxltomr
increased with increasing storage temperature and inlet concentrations. It can reasonably
be assumed that changes of hexanal vapour concentration by tomatoes will involve
transport of hexanal vapour across tomato cuticles. The exponential increase of Hxltomr values
with concentration (Figure 3-6) appeared similar to the response of film permeability to
hexanal (Chapter 4), and offers support to this hypothesis.
0.00 0.02 0.04 0.06 0.08 0.10 0.12 0.14 0.16 0.18 0.20
0.0
0.2
0.4
0.6
0.8
1.0
1.2 10ºC
20ºC
Uptake rate (µµ µµmol·s-1·kg-1)
Concentration (mol·m-3)
Figure 3-6 Effects of temperature and concentration on apparent uptake rates of hexanal
by tomatoes at 10 and 20ºC (3 replicates for individual treatments shown for each sampling
time). Solid lines were fitted by nonlinear regression using Eq. 3-2; referred to Table 3-4
for model coefficients.
Del-Valle et al. (2004) compared the permeance of tomato cuticle to urea (applied as a
fertiliser) and water (Knoche et al. 1994) to a range of polymer films and suggested that
skin permeance was comparable to that of an 11 µm polyethylene terepthalate (PET) film
(according to the databases of the Plastic Design Library (PDL) on permeability and other
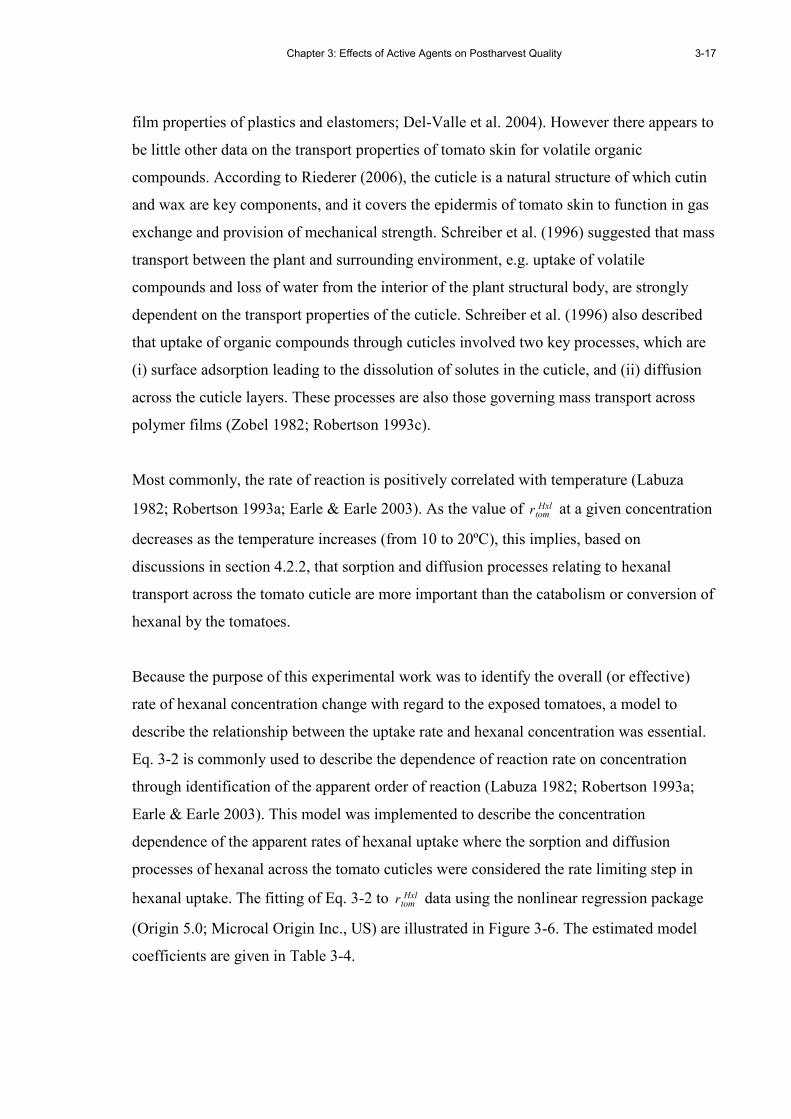
Chapter 3: Effects of Active Agents on Postharvest Quality
3-17
film properties of plastics and elastomers; Del-Valle et al. 2004). However there appears to
be little other data on the transport properties of tomato skin for volatile organic
compounds. According to Riederer (2006), the cuticle is a natural structure of which cutin
and wax are key components, and it covers the epidermis of tomato skin to function in gas
exchange and provision of mechanical strength. Schreiber et al. (1996) suggested that mass
transport between the plant and surrounding environment, e.g. uptake of volatile
compounds and loss of water from the interior of the plant structural body, are strongly
dependent on the transport properties of the cuticle. Schreiber et al. (1996) also described
that uptake of organic compounds through cuticles involved two key processes, which are
(i) surface adsorption leading to the dissolution of solutes in the cuticle, and (ii) diffusion
across the cuticle layers. These processes are also those governing mass transport across
polymer films (Zobel 1982; Robertson 1993c).
Most commonly, the rate of reaction is positively correlated with temperature (Labuza
1982; Robertson 1993a; Earle & Earle 2003). As the value of Hxltomr at a given concentration
decreases as the temperature increases (from 10 to 20ºC), this implies, based on
discussions in section 4.2.2, that sorption and diffusion processes relating to hexanal
transport across the tomato cuticle are more important than the catabolism or conversion of
hexanal by the tomatoes.
Because the purpose of this experimental work was to identify the overall (or effective)
rate of hexanal concentration change with regard to the exposed tomatoes, a model to
describe the relationship between the uptake rate and hexanal concentration was essential.
Eq. 3-2 is commonly used to describe the dependence of reaction rate on concentration
through identification of the apparent order of reaction (Labuza 1982; Robertson 1993a;
Earle & Earle 2003). This model was implemented to describe the concentration
dependence of the apparent rates of hexanal uptake where the sorption and diffusion
processes of hexanal across the tomato cuticles were considered the rate limiting step in
hexanal uptake. The fitting of Eq. 3-2 to Hxltomr data using the nonlinear regression package
(Origin 5.0; Microcal Origin Inc., US) are illustrated in Figure 3-6. The estimated model
coefficients are given in Table 3-4.
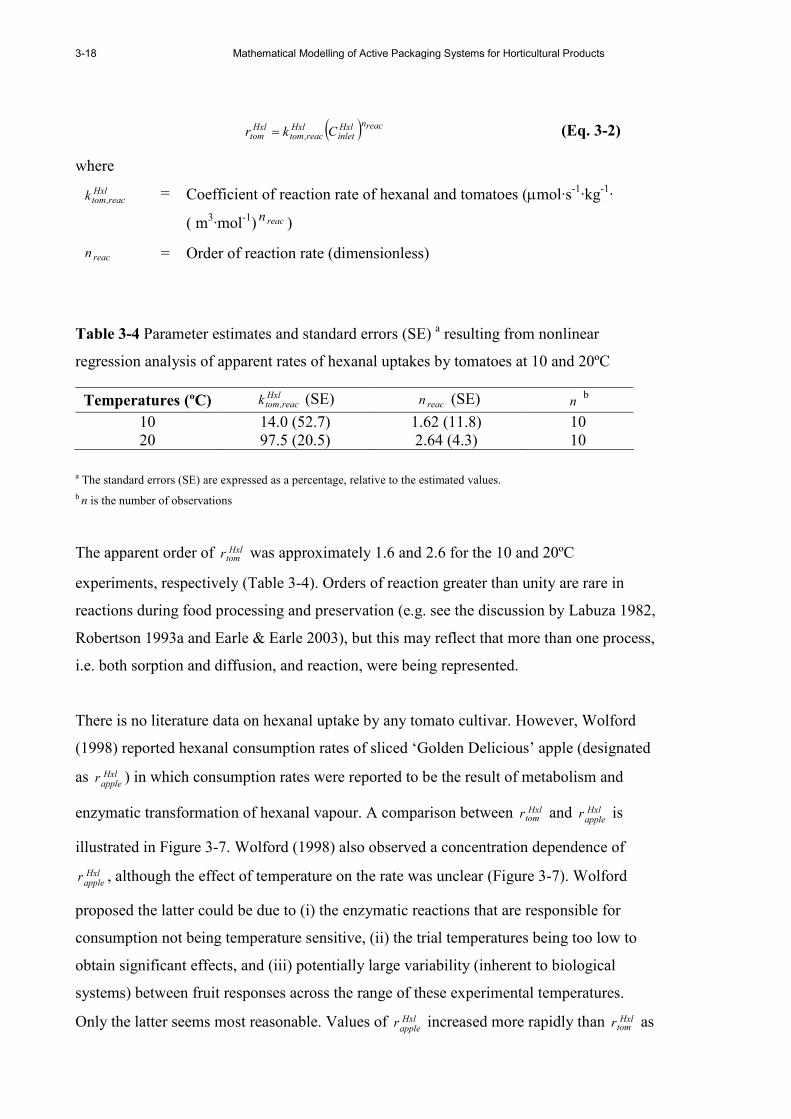
3-18 Mathematical Modelling of Active Packaging Systems for Horticultural Products
( ) reacnHxlinlet
Hxlreac,tom
Hxltom Ckr = (Eq. 3-2)
where
Hxlreac,tomk = Coefficient of reaction rate of hexanal and tomatoes (µmol·s-1·kg-1·
( m3·mol-1) reacn )
reacn = Order of reaction rate (dimensionless)
Table 3-4 Parameter estimates and standard errors (SE) a resulting from nonlinear
regression analysis of apparent rates of hexanal uptakes by tomatoes at 10 and 20ºC
Temperatures (ºC) Hxl
reac,tomk (SE) reacn (SE) n b
10 14.0 (52.7) 1.62 (11.8) 10 20 97.5 (20.5) 2.64 (4.3) 10
a The standard errors (SE) are expressed as a percentage, relative to the estimated values.
b n is the number of observations
The apparent order of Hxltomr was approximately 1.6 and 2.6 for the 10 and 20ºC
experiments, respectively (Table 3-4). Orders of reaction greater than unity are rare in
reactions during food processing and preservation (e.g. see the discussion by Labuza 1982,
Robertson 1993a and Earle & Earle 2003), but this may reflect that more than one process,
i.e. both sorption and diffusion, and reaction, were being represented.
There is no literature data on hexanal uptake by any tomato cultivar. However, Wolford
(1998) reported hexanal consumption rates of sliced ‘Golden Delicious’ apple (designated
as Hxlappler ) in which consumption rates were reported to be the result of metabolism and
enzymatic transformation of hexanal vapour. A comparison between Hxltomr and Hxl
appler is
illustrated in Figure 3-7. Wolford (1998) also observed a concentration dependence of
Hxlappler , although the effect of temperature on the rate was unclear (Figure 3-7). Wolford
proposed the latter could be due to (i) the enzymatic reactions that are responsible for
consumption not being temperature sensitive, (ii) the trial temperatures being too low to
obtain significant effects, and (iii) potentially large variability (inherent to biological
systems) between fruit responses across the range of these experimental temperatures.
Only the latter seems most reasonable. Values of Hxlappler increased more rapidly than Hxl
tomr as
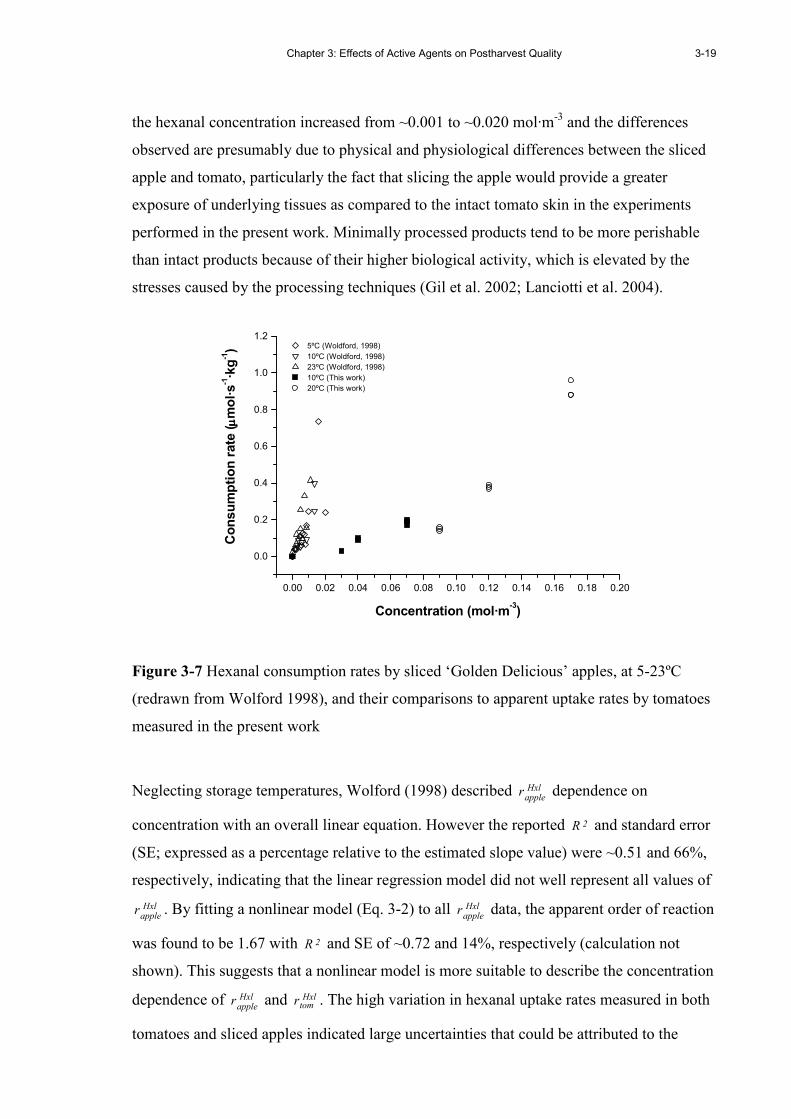
Chapter 3: Effects of Active Agents on Postharvest Quality
3-19
the hexanal concentration increased from ~0.001 to ~0.020 mol·m-3 and the differences
observed are presumably due to physical and physiological differences between the sliced
apple and tomato, particularly the fact that slicing the apple would provide a greater
exposure of underlying tissues as compared to the intact tomato skin in the experiments
performed in the present work. Minimally processed products tend to be more perishable
than intact products because of their higher biological activity, which is elevated by the
stresses caused by the processing techniques (Gil et al. 2002; Lanciotti et al. 2004).
0.00 0.02 0.04 0.06 0.08 0.10 0.12 0.14 0.16 0.18 0.20
0.0
0.2
0.4
0.6
0.8
1.0
1.2 5ºC (Woldford, 1998)
10ºC (Woldford, 1998)
23ºC (Woldford, 1998)
10ºC (This work)
20ºC (This work)
Consumption rate (µµ µµmol·s-1·kg-1)
Concentration (mol·m-3)
Figure 3-7 Hexanal consumption rates by sliced ‘Golden Delicious’ apples, at 5-23ºC
(redrawn from Wolford 1998), and their comparisons to apparent uptake rates by tomatoes
measured in the present work
Neglecting storage temperatures, Wolford (1998) described Hxlappler dependence on
concentration with an overall linear equation. However the reported 2R and standard error
(SE; expressed as a percentage relative to the estimated slope value) were ~0.51 and 66%,
respectively, indicating that the linear regression model did not well represent all values of
Hxlappler . By fitting a nonlinear model (Eq. 3-2) to all Hxl
appler data, the apparent order of reaction
was found to be 1.67 with 2R and SE of ~0.72 and 14%, respectively (calculation not
shown). This suggests that a nonlinear model is more suitable to describe the concentration
dependence of Hxlappler and Hxl
tomr . The high variation in hexanal uptake rates measured in both
tomatoes and sliced apples indicated large uncertainties that could be attributed to the
3-20 Mathematical Modelling of Active Packaging Systems for Horticultural Products
natural biological variation commonly observed in quantifying physiological parameters
for horticultural products (see the discussion by Hertog et al. 2004b). Further studies are
required to understand the hexanal interaction at a molecular level and determine how it
influences physiological and antimicrobial activities (as discussed earlier).
The C-6 volatile compounds including hexanal, cis-3-hexenal, trans-2-hexenal and
hexanol are important compounds contributing to tomato aroma (Ruiz et al. 2005) and it
was partly for this reason that hexanal was selected for this study. These compounds are
abundantly generated through the lipoxygenase oxidation of linoleic and linolenic acid
during tissue disruption (Vick & Zimmerman 1987; Ruiz et al. 2005) and are presumably
involved in the defence system in plants (Song et al. 1996). The aldehydes may also be
physiologically converted to alcohol by tomatoes through the alcohol oxidoreductase
system (Stone et al. 1975; Longhurst et al. 1990). Subsequent conversion of the alcohols to
other aroma volatiles may also occur through enzymatic systems such as the alcohol
acetyltranferase system (Stone et al. 1975; Longhurst et al. 1990).
Enzymatic conversion of hexanal to hexanol and hexylacetate was reported for apples (De
Pooter et al. 1983; Song et al. 1996; Wolford 1998; Fan et al. 2006; Song et al. 2007), and
strawberries (Hamilton-Kemp et al. 1996); similar patterns of conversions have also been
reported for other aldehydes (Hamilton-Kemp et al. 1996). These compounds could be
detected in the headspace of these previous hexanal exposure systems. In contrast, hexanal-
treated tomatoes in the present work did not yield measurable amounts of products of
enzymatic conversion of hexanal. It is uncertain why such hexanal reaction products could
not be measured in the headspace, even though these (via injection of standard liquid
solutions) could be detected by the current gas chromatography system used when injected
separately at low concentrations (Appendix C).
Hexanol and hexylacetate, among others, were measurable in several studies conducted to
identify aroma volatile compounds of tomatoes (Buttery et al. 1987; Maul et al. 2000;
Boukobza & Taylor 2002; Krumbein et al. 2004), but these were measured from macerated
or homogenate samples. Bailén et al. (2006) also noted they could not detecte hexanal and
its conversion products using the direct sampling method of the headspace surrounding
tomatoes packaged in MAP bags, while other volatiles e.g. heptane, nonanal, octana-1-ol
and cyclopentanone were detectable.
Chapter 3: Effects of Active Agents on Postharvest Quality
3-21
Phytotoxicity is also another potential issue to address in application of natural volatiles in
postharvest system. Archbold et al. (1997) reported phytotoxicity, evidenced by
discolouration, loss of tissue turgidity and shape, and the presence of exudates, among
strawberries at both 2ºC and 22ºC when exposed to volatiles generated through the
inclusion of 10-60 µl (middle range) and 100-600 µl (high range) liquid volume of, for
example, hexanal, (E)-2-hexenal (or trans-2-hexenal), hexylacetate, nonanal, 2-nonanone,
3-hexanone and ethyl butyrate. However, there were no symptoms of phytotoxicity in
strawberries exposed to vapours generated with 2-12 µl (low range) of these compounds.
Wolford (1998) reported phytotoxicity as a red tint in the apple peel when sliced apples
were exposed to saturated hexanal vapour concentration at 23ºC. These observations
support the proposition made in the present work that exposure to, and uptake of aldehyde
compounds induces a stress response in horticultural products, which was evident in our
work is an example elevated respiration rate and delayed reddening. However, if
appropriately low exposure dosages are used, this stress needs not adversely affect the
quality of the fruit.
3.4 Effects of modified atmosphere conditions on apparent rate of hexanal uptake by
tomatoes
As active packaging systems may include multiple hurdles against microbial deterioration,
such as temperature control, releases of antifungal gases and generation of a modified
atmosphere (MA), it was necessary to determine if a passive MA surrounding the tomatoes
could affect the apparent hexanal uptake rate. Additional experiments were therefore
performed to investigate such effects. From preliminary studies, the equilibrium MA
condition in the headspace of a common LDPE bag (30 µm thickness; 250 × 250 mm size)
at 20ºC, was ~5% CO2 and ~10% O2 (as reported later in Chapter 6). These MA conditions
were selected for the work described in the following subsections.
3.4.1 Experimental settings
The experimental set-up and operation were the same as those described in section 3.3.
However the gas compositions flowing into the exposure chamber were varied as
summarised in Table 3-5.
3-22 Mathematical Modelling of Active Packaging Systems for Horticultural Products
Table 3-5 Gas streams introduced to the exposure chamber (as experimental treatments)
Treatment code Description
HxlMA Flow of hexanal vapour generated by MA air (~5% CO2 and ~10% O2) HxlDA Flow of hexanal vapour generated by dry air MA Flow of MA air DA Flow of dry air
The gas atmosphere of ~5% CO2 and ~10% O2 (N2 balance) was controlled during the
storage period following Yearsley et al. (1996), where the desired atmospheric
composition was generated by mixing O2-free N2 (B.O.C. Gases New Zealand Ltd) and
CO2 (B.O.C. Gases, Christchurch, New Zealand Ltd) with dry air (B.O.C. Gases,
Christchurch, New Zealand Ltd). The gas flow was controlled by two-stage regulators and
precision needle valves (Nupro S series, Nupro Co., Willoughby, Ohio, US).
As too high a hexanal concentration could cause stress to the fruit, a moderate inlet
concentration of 0.12-0.13 mol·m-3 (~2880-3120 ppm) (reported in Table 4-1) was chosen
and the steady-state outlet concentration level (observed in experiments conducted in
section 3.3) was in the MIC range. The experiments were conducted at 20°C and hexanal
concentrations at the inlet and outlet of the exposure chamber (3 replicates) were measured
at 3, 6, 24, 32, and 48 hours. The 48 hour experimental timeframe was chosen based on the
results obtained from the mathematical models developed (refer Chapter 5 and 6). These
indicated that significant effects of hexanal uptake processes on accumulation of hexanal in
the package atmosphere could be observed within the first 48 hours of the 7 day storage
period.
In addition to hexanal concentration measurement, other postharvest quality parameters
were measured. Mass loss and colour changes (hº values) were measured as described in
section 3.2, at the beginning (t = 0 h) and end of the experimental period (t = 48 h).
Respiration rates (2COr ) were measured inside the flow-through system at 3, 6, 24, 31 and
48 h and was estimated using Eq. 3-1, which required measured values for (i) the
difference in concentration of CO2 between the inlet and outlet of the exposure chamber
(measured using the gas analyser as described in section 3.2), (ii) gas flow rate, and (iii)
fruit mass.

Chapter 3: Effects of Active Agents on Postharvest Quality
3-23
3.4.2 Results and discussion
There were no apparent effects of the MA condition on Hxltomr as shown in Figure 3-8 when
the outlet hexanal concentrations were in the MIC range (Figure 3-9). Values of Hxltomr
measured in both HxlMA and HxlDA (Table 3-5) treatments were in the range of 0.29-
0.35 µmol·s-1·kg-1 (Figure 3-8), which were consistent to those reported in Figure 3-6. The
apparent rates of hexanal uptake reached a quasi steady-state within 3 hours (Figure 3-8),
and none of the expected products of enzymatic conversion of hexanal vapour were
measurable in either the MA or dry air outflow streams.
0 4 8 12 16 20 24 28 32 36 40 44 48 52
0.00
0.04
0.08
0.12
0.16
0.20
0.24
0.28
0.32
0.36
0.40
0.44 Hexanal vapour in MA gas stream
Hexanal vapour in dried air stream
Uptake rate (µµ µµmol·s-1·kg-1)
Time (hours)
Figure 3-8 Effects of modified atmosphere conditions on apparent hexanal uptake rates of
tomatoes (3 replicates for individual treatments shown for each sampling time)

3-24 Mathematical Modelling of Active Packaging Systems for Horticultural Products
0 10 20 30 40 50
0
50
100
150
2000
2500
3000
3500
4000 Inlet_HxlDA
Inlet_HxlMA
Outlet_HxlDA
Outlet_HxlMAConcentration (ppm)
Time (hours)
Figure 3-9 Inlet and outlet hexanal concentrations measured during experiments on the
effects of modified atmosphere (MA) conditions on apparent hexanal uptake rates of
tomatoes (3 replicates for individual treatments shown for each sampling time).
It was found that the gas atmosphere had a minimal effect on hue angle (hº), which
appeared stable in the range of ~38.8- 42.6, or on mass loss, which was observed to be less
than 0.42%. The effect of continuous hexanal exposure on hº values differed from those
reported in section 3.2. This is most likely due to the tomatoes used in this experiment
being redder (and hence more mature) than those in the earlier study (hº value in this
experiment was ~44 compared to 47-56 in the earlier experiment). Possibly differences in
cultivars used may also have influenced the fruit behaviour (P. Wilson, 2007, Pers. comm.:
NZ Hothouse, New Zealand).
The 2COr values under 5% CO2 and 10% O2 MA conditions were lower than those in air as
expected (Figure 3-10) and the values obtained appear comparable to the values for
‘Maêva’ and ‘Trust’ cultivars as reported by Hertog et al. (1998) at 18 and 23°C.
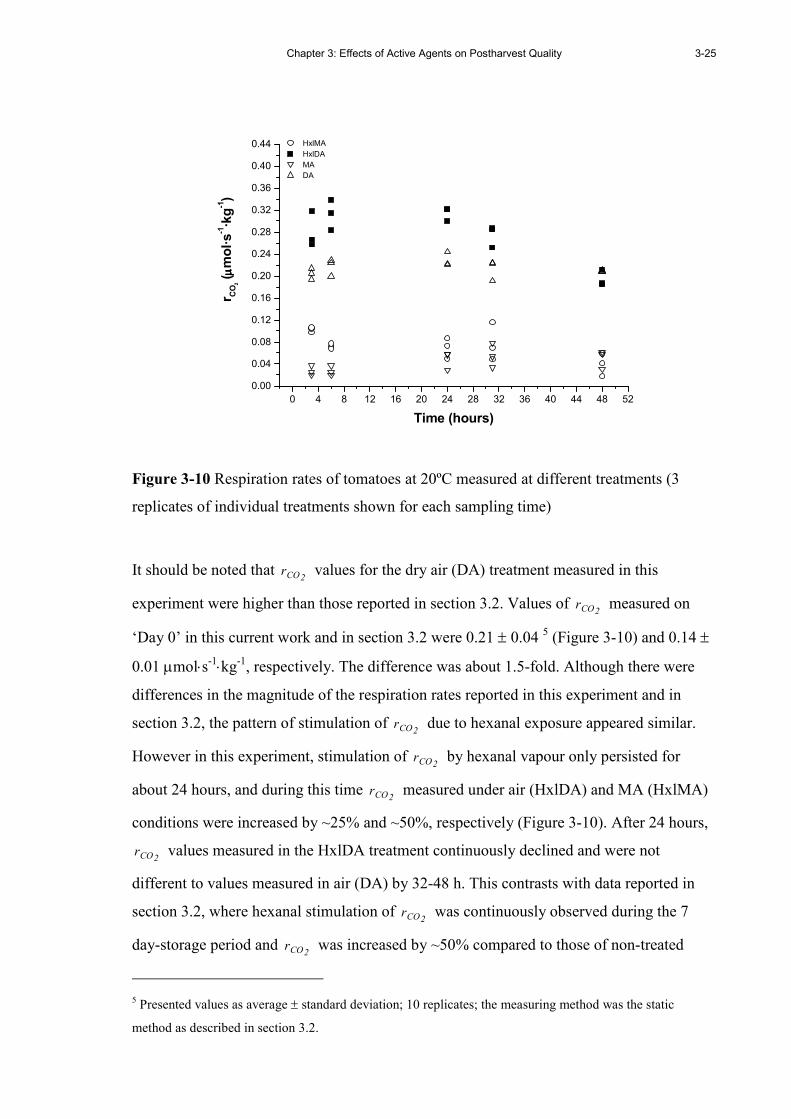
Chapter 3: Effects of Active Agents on Postharvest Quality
3-25
0 4 8 12 16 20 24 28 32 36 40 44 48 52
0.00
0.04
0.08
0.12
0.16
0.20
0.24
0.28
0.32
0.36
0.40
0.44 HxlMA
HxlDA
MA
DA
r CO
2 (µµ µµmol·s-1·kg-1)
Time (hours)
Figure 3-10 Respiration rates of tomatoes at 20ºC measured at different treatments (3
replicates of individual treatments shown for each sampling time)
It should be noted that 2COr values for the dry air (DA) treatment measured in this
experiment were higher than those reported in section 3.2. Values of 2COr measured on
‘Day 0’ in this current work and in section 3.2 were 0.21 ± 0.04 5 (Figure 3-10) and 0.14 ±
0.01 µmol⋅s-1⋅kg-1, respectively. The difference was about 1.5-fold. Although there were
differences in the magnitude of the respiration rates reported in this experiment and in
section 3.2, the pattern of stimulation of 2COr due to hexanal exposure appeared similar.
However in this experiment, stimulation of 2COr by hexanal vapour only persisted for
about 24 hours, and during this time 2COr measured under air (HxlDA) and MA (HxlMA)
conditions were increased by ~25% and ~50%, respectively (Figure 3-10). After 24 hours,
2COr values measured in the HxlDA treatment continuously declined and were not
different to values measured in air (DA) by 32-48 h. This contrasts with data reported in
section 3.2, where hexanal stimulation of 2COr was continuously observed during the 7
day-storage period and 2COr was increased by ~50% compared to those of non-treated
5 Presented values as average ± standard deviation; 10 replicates; the measuring method was the static
method as described in section 3.2.
3-26 Mathematical Modelling of Active Packaging Systems for Horticultural Products
fruit. Such differences may be due to differences in maturity and/or cultivar, as noted
above.
3.5 Summary
The results of these various trials suggest it should be possible to develop an active
packaging system to increase storage life of tomatoes or other products subjected to
Botrytis rots through sustained release of low concentration of hexanal. The MIC
concentration of hexanal vapour was 40-70 ppm for suppressing grey mould appearance on
wound-inoculated tomatoes during continuous exposure over a 7-day storage period at
20°C and ∼99% RH. When applying this MIC, respiration and ethylene production rates of
intact tomatoes were stimulated by hexanal exposure and the reddening of skin colour was
slightly retarded, but there was no change to firmness of tomatoes stored at the light red
stages. More mature tomatoes exhibited a temporary increase in respiration rates of ~25%,
but no other quality changes were noted. Under a MA condition (~5% CO2 and ~10% O2)
the respiration rates was systematically depressed and the tomatoes appeared to be less
affected by hexanal exposure.
Hexanal uptake rates exhibited an exponential relationship with hexanal vapour
concentrations. The relationship could be reasonably described by an apparent order of
reaction of ~1.6-2.6. Because the relationship between uptake rates and hexanal
concentration and storage temperature appeared to mimic those observed for polymer film
permeability to hexanal vapour (discussed in Chapter 4), this suggests hexanal sorption and
diffusion across the tomato cuticle may play an important role in hexanal concentration
changes induced by tomatoes.
Overall, these studies of the biological components of an active packaging system confirm
the antifungal activity of hexanal vapour and provide insights into its influence on
packaged tomatoes. These results, taken together with other positive results from other
crops, support the feasibility and utility of incorporating a hexanal controlled release
system into passive MA packages of horticultural products. Active MAP design to achieve
these goals requires matching the rate of uptake from the fruit with the desorption of the
hexanal vapour from the carrier particles and the transport of the vapour through the outer

Chapter 3: Effects of Active Agents on Postharvest Quality
3-27
polymer films. These properties and their incorporation in mathematical models are
considered in the following chapters.

3-28 Mathematical Modelling of Active Packaging Systems for Horticultural Products

Chapter 4: Evalulating Physico-Chemical Properties of Hexanal Vapour and Silica gel
4-1
Chapter 4
EVALUATING THE PHYSICO-CHEMICAL PROPERTIES
OF HEXANAL VAPOUR AND SILICA GEL ADSORBENTS
FOR ACTIVE PACKAGING APPLICATIONS
4.1 Introduction
This chapter describes experiments conducted to determine the key physico-chemical
properties of hexanal vapour and silica gel relevant to active packaging systems. These
include the permeability of polymer films to hexanal vapour and hexanal sorption
isotherms for the selected silica gel adsorbent. These parameters are required in order to
design novel packaging systems such as the hexanal active MAP system for tomatoes
outlined in Chapter 3 and are required inputs into comprehensive mathematical models
describing such systems.
4.2 Determination of effective film permeability to hexanal vapour
As previously discussed in Chapter 2, Fick’s first law (Eq. 2-8) is commonly applied to
model steady-state gas permeation through polymer films utilised in MAP for food
products, including fresh fruit and vegetables. The flux across the film, which is assumed
to be constant with time, is a product of film permeability and the concentration gradient of
the active compound established between the two surfaces of the film. The permeability
values are usually presumed to be concentration independent, implying the absence of
interactions between the permeant and the polymeric film (Rogers 1985; Robertson 1993c;
Selke et al. 2004). When interactions between the permeant and film are likely to occur, as
between water vapour and hydrophilic films (such as cellulose and EVOH), or between
organic vapours and polyolefin films (such as LDPE and PP) (Robertson 1993c; Sajilata et
al. 2007), the assumption of concentration independence of mass transfer coefficients may
not be valid and must be tested.
Hernandez-Munoz (1998; 1999) suggested that mass transport of vapour permeants
(including hexanal, hexanol, ethyl carproate, d-limonene, phenylethanol and n-decane)
through polymer films could reasonably be considered concentration independent at
concentrations giving a vapour activity (or relative vapour pressure) of around 0.1 or less,
4-2 Mathematical Modelling of Active Packaging Systems for Horticultural Products
as is commonly the case in flavour scalping. Because the silica gels to be used as carriers
of hexanal should (at least initially) be saturated with liquid hexanal to give a sachet
headspace in which the hexanal vapour activity is ≈1.0, the mass transport of hexanal
through the polymer sachet film can reasonably be expected to be concentration-
dependent. To date, there appears to be no literature data on the concentration-dependence
of hexanal permeability for any polymer film. The available data are generally reported as,
or assumed to be concentration-independent (Leufven & Stollman 1992; Johansson &
Leufven 1994; Song et al. 1996). Addressing this knowledge gap is therefore a key
objective of the present work.
According to Robertson (1993c), the overall mass transfer rate of a concentration-
dependent system can be defined by the Transmission Rate (TR) of the material. TR is
practically measured as the molar or mass flowrate of gaseous compound passing through
a barrier (assuming constant concentrations on each side), once the barrier has reached
equilibrium with the compound. The attainment of equilibrium is thermodynamically the
result of (i) solubilisation of the compound into the film (absorption or partitioning) and
(ii) diffusion to minimise the chemical potential (represented by the concentration)
gradient across the film (Rogers 1985). By definition, TR is the ‘effective’ value of the
steady-state flux (the so-called ‘effective permeability’) across the film, where the
processes of sorption and diffusion within the permeating medium, as well as the
interactions between permeant and the medium, are taken into account.
In most examples of passive MAP for horticultural products, the transient (unsteady-state)
period typically occurs within the first one or two days of storage (Yam & Lee 1995). For
long storage of products, steady-state mass transfer processes are therefore more important
(Yam & Lee 1995). The active MAP systems designed in the present work were intended
for products to be stored for at least 7 days and very likely much longer. As a key objective
of the present work was to maintain and sustain the hexanal headspace concentration at the
MIC level, the mass transfer processes at steady-state were the key focus. Song et al.
(1996) mentioned that LDPE used at storage temperatures of 5 to 30°C is a poor barrier to
hexanal vapour. Furthermore Leufven & Stollman (1992) reported that the average
timeframe for achieving steady-state flux of hexanal through LLDPE, HDPE and EVOH at
25°C was only about 4 hours. Hence, steady-state permeation through the polymer films
Chapter 4: Evalulating Physico-Chemical Properties of Hexanal Vapour and Silica gel
4-3
utilised in the present work was expected to be achieved within a relatively short
timeframe compared to the shelf life of the tomatoes or other horticultural products.
Based on Fick’s first law (Eq. 2-8) the permeability coefficient is calculated by dividing
the thickness-corrected steady-state flux by the difference in the partial pressure of the
permeant across the polymer film. Thus, the effective permeability can be calculated from
the TR values based on initial film thickness when the vapour partial pressure gradient
between both film surfaces is known.
4.2.1 Experimental procedures
Several techniques can be utilised for permeability measurements and these have been
extensively reviewed by Felder & Huvard (1980). In the present work, the ‘isostatic
method’ was used due to its simplicity and well developed equipment (Merts 1996; Chen
et al. 2000). According to Robertson (1993c), the isostatic method utilises a partial
pressure difference (the ‘pressure gradient’) of the test compound across the film as the
driving force for permeation. The total pressure on both sides of the film is assumed equal.
The partial pressure gradient must be kept constant during the experimental period and this
can be done by sweeping one side of the film continuously with the test vapour whilst
sweeping an inert gas on the other side into which the test gas diffuses. At selected time
intervals, concentrations of the feed and permeant streams are determined and the
transmission rate is monitored until the steady-state condition is reached.
Isostatic equipment similar to that described by Merts (1996) was utilised in the present
work. A stainless-steel circular permeability cell (I.D. 18 cm) consisting of two chambers
separated from each other by the film sample was used (Figure 4-1); the headspace
volumes of the lower and upper chambers were ~380 and ~760 ml, respectively.
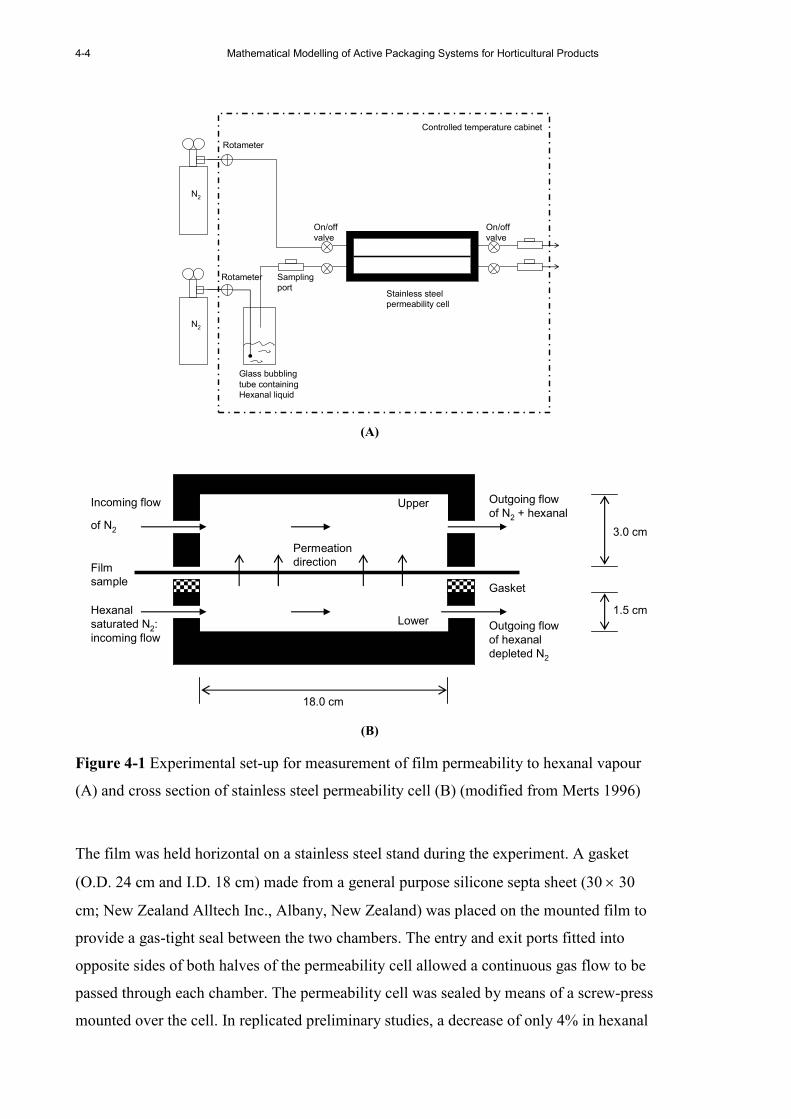
4-4 Mathematical Modelling of Active Packaging Systems for Horticultural Products
N2
Glass bubbling
tube containing
Hexanal liquid
Stainless steel
permeability cell
Rotameter
Sampling
port
On/off
valve
N2
Rotameter
On/off
valve
Controlled temperature cabinet
(A)
18.0 cm
1.5 cm
3.0 cm
Incoming flow
of N2
Outgoing flow
of N2 + hexanal
Permeation
direction
Upper
Lower
Film
sample
Hexanal
saturated N2:
incoming flowOutgoing flow
of hexanal
depleted N2
Gasket
(B)
Figure 4-1 Experimental set-up for measurement of film permeability to hexanal vapour
(A) and cross section of stainless steel permeability cell (B) (modified from Merts 1996)
The film was held horizontal on a stainless steel stand during the experiment. A gasket
(O.D. 24 cm and I.D. 18 cm) made from a general purpose silicone septa sheet (30 × 30
cm; New Zealand Alltech Inc., Albany, New Zealand) was placed on the mounted film to
provide a gas-tight seal between the two chambers. The entry and exit ports fitted into
opposite sides of both halves of the permeability cell allowed a continuous gas flow to be
passed through each chamber. The permeability cell was sealed by means of a screw-press
mounted over the cell. In replicated preliminary studies, a decrease of only 4% in hexanal
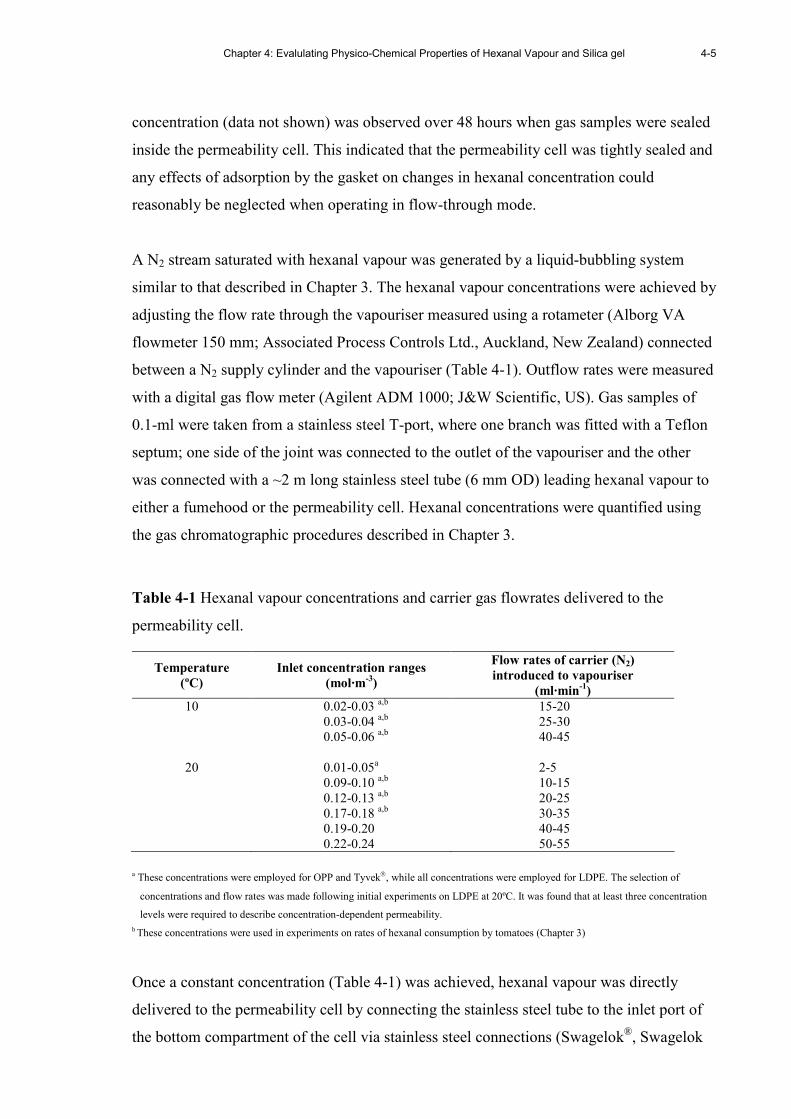
Chapter 4: Evalulating Physico-Chemical Properties of Hexanal Vapour and Silica gel
4-5
concentration (data not shown) was observed over 48 hours when gas samples were sealed
inside the permeability cell. This indicated that the permeability cell was tightly sealed and
any effects of adsorption by the gasket on changes in hexanal concentration could
reasonably be neglected when operating in flow-through mode.
A N2 stream saturated with hexanal vapour was generated by a liquid-bubbling system
similar to that described in Chapter 3. The hexanal vapour concentrations were achieved by
adjusting the flow rate through the vapouriser measured using a rotameter (Alborg VA
flowmeter 150 mm; Associated Process Controls Ltd., Auckland, New Zealand) connected
between a N2 supply cylinder and the vapouriser (Table 4-1). Outflow rates were measured
with a digital gas flow meter (Agilent ADM 1000; J&W Scientific, US). Gas samples of
0.1-ml were taken from a stainless steel T-port, where one branch was fitted with a Teflon
septum; one side of the joint was connected to the outlet of the vapouriser and the other
was connected with a ~2 m long stainless steel tube (6 mm OD) leading hexanal vapour to
either a fumehood or the permeability cell. Hexanal concentrations were quantified using
the gas chromatographic procedures described in Chapter 3.
Table 4-1 Hexanal vapour concentrations and carrier gas flowrates delivered to the
permeability cell.
Temperature
(ºC)
Inlet concentration ranges
(mol·m-3)
Flow rates of carrier (N2)
introduced to vapouriser
(ml·min-1)
10 0.02-0.03 a,b 15-20 0.03-0.04 a,b 25-30 0.05-0.06 a,b 40-45 20 0.01-0.05a 2-5 0.09-0.10 a,b 10-15 0.12-0.13 a,b 20-25 0.17-0.18 a,b 30-35 0.19-0.20 40-45 0.22-0.24 50-55
a These concentrations were employed for OPP and Tyvek, while all concentrations were employed for LDPE. The selection of
concentrations and flow rates was made following initial experiments on LDPE at 20ºC. It was found that at least three concentration
levels were required to describe concentration-dependent permeability.
b These concentrations were used in experiments on rates of hexanal consumption by tomatoes (Chapter 3)
Once a constant concentration (Table 4-1) was achieved, hexanal vapour was directly
delivered to the permeability cell by connecting the stainless steel tube to the inlet port of
the bottom compartment of the cell via stainless steel connections (Swagelok®, Swagelok

4-6 Mathematical Modelling of Active Packaging Systems for Horticultural Products
Company, Ohio, US). Meanwhile the hexanal-free N2 flow (controlled at 20-22 ml⋅min-1)
was passed through the upper chamber to maintain the partial pressure gradient across the
film material.
It should be noted that hexanal vapour was not humidified as was described by Song et al.
(1996) and Johansson & Leufven (1994). This decision was made as the hexanal saturated
gas phase within a sachet was expected to be dry for most of the period of interest. Also
the literature suggested minimal effects of water vapour on mass transfer of organic
volatiles across hydrophobic non-polar films, including LDPE, OPP and Tyvek, as well
as negligible interactions of water vapour with such films. For example DeLassus et al.
(1988) reported no effects of RH on the permeation of trans-2-hexenal vapour through
Saran film (vinylidene chloride copolymer).
The times required for achieving steady-state concentrations on both sides of the
permeability cell at 10 and 20°C were less than ~8 and ~3.5 hours, respectively6. To ensure
uniform concentrations in the chambers, the period prior to taking gaseous samples at 10
and 20ºC was set at 10 and 6 hours, respectively. At that time and afterwards, replicate gas
samples (0.1 ml) were taken through a port fitted with a Teflon-lined septum fitted to both
chambers using a gas-tight syringe (Hamilton Gastight®, Hamilton Co., US). Typically the
sampling period was approximately 25-30 minutes.
New film samples were used for each concentration and temperature. Films and all other
experimental equipment were equilibrated at the trial temperature for 24 hours before
starting the tests. The experimental apparatus was kept in a controlled temperature cabinet
(set point ± 1ºC).
The effective hexanal vapour permeabilities of three polymer films were measured. The
films used were Low Density Polyethylene (LDPE) (30 µm; Propak Supplies, Palmerston
North, New Zealand), Oriented Polypropylene (OPP) (20µm; Huhtamaki, New Lynn, New
Zealand), and Tyvek (173 µm; Type 10, Dupont, Wilmington, US). These three films are
commonly used in MAP systems for food and horticultural products. Tyvek is also
6 Preliminary experiments were performed using OPP films which have the lowest permeabilities to hexanal
vapour

Chapter 4: Evalulating Physico-Chemical Properties of Hexanal Vapour and Silica gel
4-7
commonly used for making sachets, such as those containing O2 scavengers, C2H4
absorbers and desiccants, due to its porosity and durability to both liquid water and a range
of chemicals, including ethyl acetate, formaldehyde and glycerol (Marotta 1997;
Anonymous 2004).
The effective film permeability was estimated using Eq. 4-1:
( ) filmHxlconc,l
Hxlconc,hfilm
filmHxlconc,l
outconc,lHxl
filmTRCCA
LCQP
⋅⋅−
⋅⋅= (Eq. 4-1)
where
Hxlfilm
P = Effective film permeability to hexanal (mol·m·m-2·s-1·Pa-1)
outconc,l
Q = Outlet gas flowrate from the low hexanal concentration side of the
film (m3·s-1)
Hxlconc,h
C,
Hxlconc,l
C = Hexanal concentration at the high and low concentration side of
the film, respectively (mol·m-3)
4.2.2 Results and discussion, part I : Overall effective permeability and concentration
dependent characteristics
The effective hexanal permeability of LDPE ( HxlLDPE
P ), OPP ( HxlOPP
P ) and Tyvek ( HxlTyvek
P ) are
illustrated as functions of the mean hexanal vapour concentration across the film in Figure
4-2. In all experiments both surfaces of the tested film were exposed to different
concentrations of hexanal vapour. As the differences in hexanal vapour concentration were
always relatively small in these experiments (with the feed typically ≤ 1.5-fold the
permeate side concentration), it was assumed that an arithmetic average was be a
reasonable basis on which to express the permeability. However up to 10-fold difference
was observed for in the case of OPP; the implications of this are discussed later in this
section.
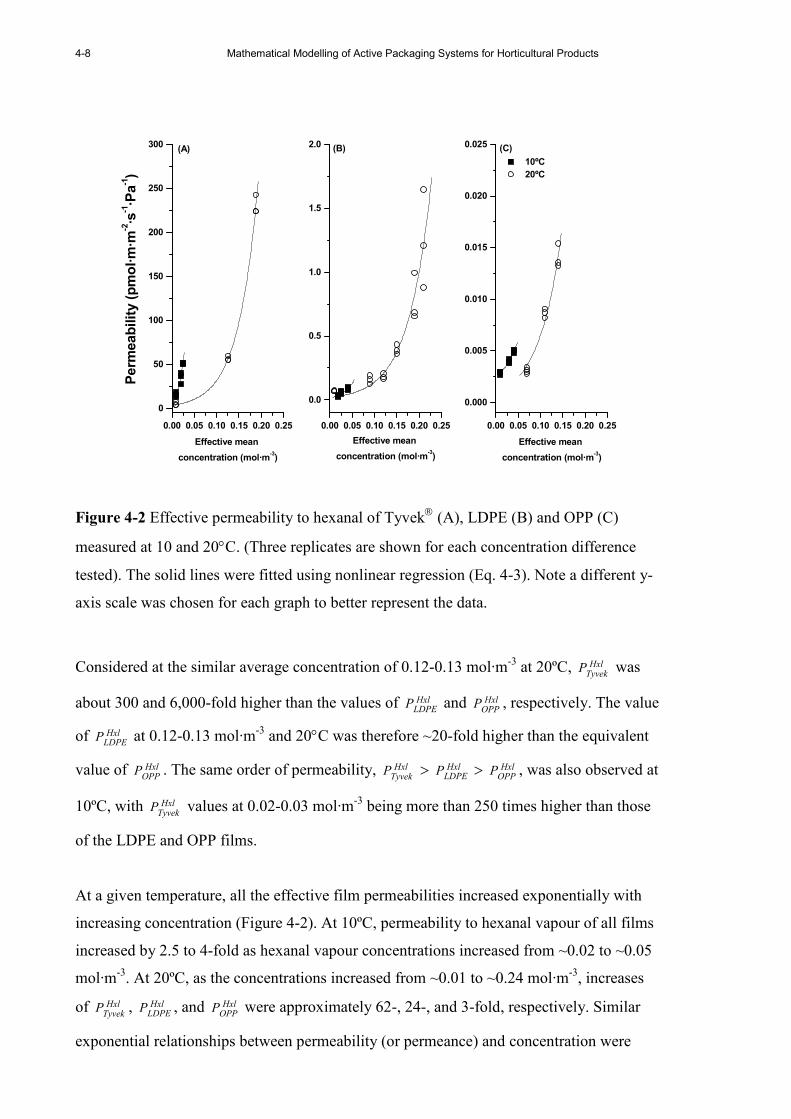
4-8 Mathematical Modelling of Active Packaging Systems for Horticultural Products
0.00 0.05 0.10 0.15 0.20 0.25
0
50
100
150
200
250
300(A)
10ºC
20ºC
Perm
eability (pmol·m·m
-2·s
-1·Pa-1)
Effective mean
concentration (mol·m-3)
0.00 0.05 0.10 0.15 0.20 0.25
0.0
0.5
1.0
1.5
2.0 (B)
Effective mean
concentration (mol·m-3)
0.00 0.05 0.10 0.15 0.20 0.25
0.000
0.005
0.010
0.015
0.020
0.025 (C)
Effective mean
concentration (mol·m-3)
Figure 4-2 Effective permeability to hexanal of Tyvek (A), LDPE (B) and OPP (C)
measured at 10 and 20°C. (Three replicates are shown for each concentration difference
tested). The solid lines were fitted using nonlinear regression (Eq. 4-3). Note a different y-
axis scale was chosen for each graph to better represent the data.
Considered at the similar average concentration of 0.12-0.13 mol·m-3 at 20ºC, HxlTyvek
P was
about 300 and 6,000-fold higher than the values of HxlLDPE
P and HxlOPP
P , respectively. The value
of HxlLDPE
P at 0.12-0.13 mol·m-3 and 20°C was therefore ~20-fold higher than the equivalent
value of HxlOPP
P . The same order of permeability, HxlTyvek
P > HxlLDPE
P > HxlOPP
P , was also observed at
10ºC, with HxlTyvek
P values at 0.02-0.03 mol·m-3 being more than 250 times higher than those
of the LDPE and OPP films.
At a given temperature, all the effective film permeabilities increased exponentially with
increasing concentration (Figure 4-2). At 10ºC, permeability to hexanal vapour of all films
increased by 2.5 to 4-fold as hexanal vapour concentrations increased from ~0.02 to ~0.05
mol·m-3. At 20ºC, as the concentrations increased from ~0.01 to ~0.24 mol·m-3, increases
of HxlTyvek
P , HxlLDPE
P , and HxlOPP
P were approximately 62-, 24-, and 3-fold, respectively. Similar
exponential relationships between permeability (or permeance) and concentration were

Chapter 4: Evalulating Physico-Chemical Properties of Hexanal Vapour and Silica gel
4-9
reported in other systems, including ethyl acetate, toluene, d-limonene, α-pinene and
methyl-ethyl-ketone in OPP films (Huang & Giacin 1998), and benzene, hexane and
cyclohexane in LDPE and polyether-block-amide (PEBA-4033PE) membranes (Friess et
al. 2004). Many further examples of the concentration dependence of mass transfer through
polymer films or membranes can be found in literature (Rogers et al. 1962; Zobel 1982;
Rogers 1985; Mulder 1991; Piringer 2000).
In Figure 4-2, it can be observed that the permeability for a given film at 10ºC appeared
higher than that at 20ºC for comparable hexanal concentrations. This could be explained by
the dominance of the sorption process in permeation of hexanal across the film. According
to Robertson (1993c), sorption of readily condensable volatiles (including hexanal) by the
polymer film tends to be thermodynamically favoured at lower temperatures and the
relationship between solubility and temperature can be described by an Arrhenius-type
equation (Eq. 4-2).
( )filmsi
0,filmifilm
RTHexpSS ∆−= (Eq. 4-2)
where
ifilm
S = Film solubility to permeant i (mol·m-3·Pa-1)
i0,film
S = Fitted pre-exponential factor for solubility to permeant i of the film
(mol·m-3·Pa-1)
sH∆ = Heat of solution for the permeant gas (J·mol-1)
At higher concentrations, the diffusion process should be facilitated by the increased
plasticisation due to sorbed hexanal molecules. Leufven & Stollman (1992) similarly
reported the dominance of sorption processes in permeation of hexanal and other
aldehydes, including butanal, pentanal, and heptanal through PP, PVC, LLDPE and
EVA/PE/EVA films. The permeability values showed a generally decreasing trend as
temperature increased from 5-75ºC.
An empirical exponential relationship (Eq. 4-3) was used to describe permeability as a
function of the concentration of hexanal vapour as shown in Figure 4-2. This exponential
modelling approach has been successfully utilised in other studies to describe
concentration dependence of diffusivity of benzyl acetate, 2-methoxyphenol and d-
limonene in OPP film (Zobel 1982) and dichloromethane in PP film (D'Aniello et al.

4-10 Mathematical Modelling of Active Packaging Systems for Horticultural Products
2000). The parameters estimated for hexanal vapour permeability (using Origin 5.0
Nonlinear regression package; Microcal Origin Inc. US) are shown in Table 4-2.
( )filmHxlavg
Hxl0,film
Hxlfilm
bCexpPP ⋅= (Eq. 4-3)
where
Hxl0,film
P = Fitted pre-exponential factor for effective permeability to hexanal of the
film (pmol·m·m-2·s-1·Pa-1)
HxlavgC = Effective mean of hexanal concentrations measured in both chambers of
the permeability cell at steady-state (mol⋅m-3)
filmb = Fitted exponential coefficient of effective permeability to hexanal of the
film (m3·mol-1)
Table 4-2 Parameter estimates and standard errors (SE) resulting from nonlinear
regression analysis of permeability to hexanal vapours of Tyvek, LDPE, and OPP films,
measured at 10 and 20ºC
Tyvek LDPE OPP
Temperature
(ºC) Hxl
0,TyvekP
(SE) a
Tyvekb
(SE) n b
Hxl0,LDPE
P
(SE)
LDPEb
(SE) n
Hxl0,OPP
P
(SE)
OPPb
(SE) n
10 7.06 (22.6)
81.6 (12.4)
9
0.02 (27.1)
38.5 (20.2)
9 0.002 (4.3)
18.7 (7.0)
9
20 3.33 (18.1)
22.5 (4.3)
9
0.02 (56.2)
19.6 (14.2)
18 0.001 (20.0)
19.7 (7.8)
9
a The standard errors (SE) are expressed as a percentage relative to the estimated values. The nonlinear regressions were performed using
the Nonlinear Regression package of Origin 5.0 (Microcal Software Inc., US).
b n is the number of observations.
where
Hxl0,TyvekP , Hxl
0,LDPEP ,
Hxl0,OPPP
= Fitted pre-exponential factor for effective permeability to
hexanal of Tyvek, LDPE and OPP films, respectively
(pmol·m·m-2·s-1·Pa-1)
Tyvekb , LDPEb , OPPb = Fitted exponential coefficient of effective permeability to
hexanal of Tyvek, LDPE and OPP films, respectively
(m3·mol-1)

Chapter 4: Evalulating Physico-Chemical Properties of Hexanal Vapour and Silica gel
4-11
Although results from the exponential model predictions show reasonable agreement with
the experimental data, high uncertainty (represented by the SE values) can be observed,
noticeably for Hxl0,LDPEP measured at 20ºC (Table 4-2). Variations observed in permeability
coefficients may be assumed to be due to interactions between hexanal vapour and
polymer films, causing concentration dependence of mass transfer processes. Robertson
(1993c) suggested that permeation of organic vapours through polymer films was
complicated by mass transfer processes due to the concentration dependence of both
solubility and diffusivity.
Because effective permeability in the present work was determined based on Fick’s first
law, it is interesting to investigate the relationship between hexanal concentration and
position within the film, which is commonly assumed to be linear (Robertson 1993c).
According to Selke et al. (2004), this assumption is suitable for a system at low permeant
concentrations, for which permeability is generally assumed to have a low (or no)
concentration dependence. To demonstrate the effects of permeant concentration on the
within-film concentration gradients, a mathematical model (Eq. 4-4) was developed to
describe the relationship of hexanal concentration with film position. Details of the
mathematical model derivation and solution are provided in Appendix D.2.1.
( )
( ) ( )filmHxlconc,lfilm
Hxlconc,h
filmHxl
filmx,gfilmHxlconc,h
film
film
bCexpbCexp
bCexpbCexp
L
x
⋅−⋅
⋅−⋅
=
(Eq. 4-4)
where
Hxl
filmx,gC = Hexanal concentration in the gas phase which is equilibrium with film at
position x in film material ( filmx ) (mol⋅m-3)
filmx = Position in film material (m)
In the experimental trials, high concentration gradients were observed between film
surfaces for the OPP film as expected due to its relatively low permeability to hexanal
vapour. The effect of high and low surface permeant concentrations ( Hxlconc,h
C and Hxlconc,l
C
selected from the experimental data at 20ºC as 0.264 and 0.025 mol⋅m-3, respectively) on
the predicted steady-state concentration gradients for OPP films are illustrated in Figure
4-3. A nonlinear concentration gradient is apparent for OPP (Figure 4-3) such that a very
rapid decrease in predicted concentration occurs in a relatively thin layer of the film
4-12 Mathematical Modelling of Active Packaging Systems for Horticultural Products
adjacent to the low concentration side. A similar nonlinear gradient in OPP film at 10ºC is
predicted for the lower feed side concentration ( Hxlconc,h
C and Hxlconc,l
C as 0.07 and 0.005
mol⋅m-3, respectively) (Figure 4-3). DeLassus & Jenkins (1986) similarly reported that the
greatest partial pressure changes during permeation of d-limonene (from orange juice)
across multilayer-films having the same thickness occurred within the layer having the
lowest permeability.
0.0 0.2 0.4 0.6 0.8 1.0
0.0
0.2
0.4
0.6
0.8
1.0
OPP at 20ºC (Ch,conc
= 0.265 mol·m-3; C
l,conc = 0.025 mol·m
-3)
OPP at 10ºC (Ch,conc
= 0.07 mol·m-3 ; C
l,conc = 0.005 mol·m
-3)
LDPE at 20ºC (Ch,conc
= 0.224 mol·m-3; C
l,conc = 0.199 mol·m
-3)
LDPE at 20ºC (Ch,conc
= 0.0.16 mol·m-3; C
l,conc = 0.09 mol·m
-3)
Norm
alised equilibrium vapour
concentration with film position
Normalised position in film
Figure 4-3 Steady-state concentration gradients predicted using Eq. 4-4 for conditions
when large (as a case of OPP film; dashed and dashed-dotted line) and small and moderate
(as a case of LDPE film; solid and dotted lines, respectively) concentration gradients. On
the x-axis, x= 0 represents the film surface facing the high hexanal concentration ( Hxlconc,h
C )
and x = 1 the film surface facing against the low concentration ( Hxlconc,l
C ).
By implementing Eq. 4-4 for LDPE film (with Hxlconc,h
C and Hxlconc,l
C equal to 0.224 and 0.199
mol⋅m-3, respectively; 20ºC), a more linear steady-state concentration gradient was
observed (Figure 4-3). When the difference between feed and downstream concentrations
becomes greater (e.g. Hxlconc,h
C and Hxlconc,l
C of 0.16 and 0.09 mol⋅m-3, respectively, at 20ºC; the
largest gradient observed in the LDPE experiments), only a slight deviation from the linear
gradient is noticeable. The high porosity and permeability properties of the Tyvek film
are confirmed by the small differences of steady-state concentrations at both sides of the
Chapter 4: Evalulating Physico-Chemical Properties of Hexanal Vapour and Silica gel
4-13
films (≤ 9%) and a nearly-horizontal and linear concentration gradient can then be
expected.
The predictions obtained using Eq. 4-4 support the assumption that a linear and small
internal (within film) concentration gradient occurs in systems with low permeant
concentrations and low concentration gradients between the chambers. This analysis
supports that the use of an arithmetic average to characterise the influence of hexanal
vapour concentration on permeability is reasonable, particularly for Tyvek and LDPE
films.
The results (Figure 4-3) also demonstrate that when large vapour concentration differences
occur across a film (such as may be expected in the first stages of volatile release from a
sachet), the assumption of a linear gradient to estimate the mass transfer rate across the
film (e.g. using Fick’s first law as shown in Eq. 2-8) may not be appropriate and the flux
may be underestimated. In this case (when the exponential dependency of permeability to
concentration applies; Eq. 4-3), Eq. 4-5 is suggested to be more suitable to predict the
hexanal flux across the film. Eq. 4-5 was derived based on the fact that the steady-state
flux at any point in the film is the same even though the local hexanal concentration and
hence permeability will vary. The derivation of this equation is given in Appendix D.2.2.
( ) ( )( )filmHxlconc,lfilm
Hxlconc,h
filmfilm
filmHxl
0,film
film bCexpbCexp
Lb
RTP
J ⋅−⋅=
(Eq. 4-5)
where
filmJ = Steady-state flux across film (mol·s-1· m-2)
Comparisons of fluxes across a LDPE film calculated using Eq. 2-8 and Eq. 4-5 are shown
in Table 4-4. It can be seen that no significant differences in predicted steady-state fluxes
occur at low hexanal concentration differences across the film such as scenarios 1 to 4.
When the concentrations difference between both sides of the film become greater (as
shown by scenarios 5 and 6), Eq. 2-8 estimates the flux to be much lower than Eq. 4-5
does. For this reason, Eq. 4-5 is expected to be more suitable equation to describe hexanal
release from a sachet.
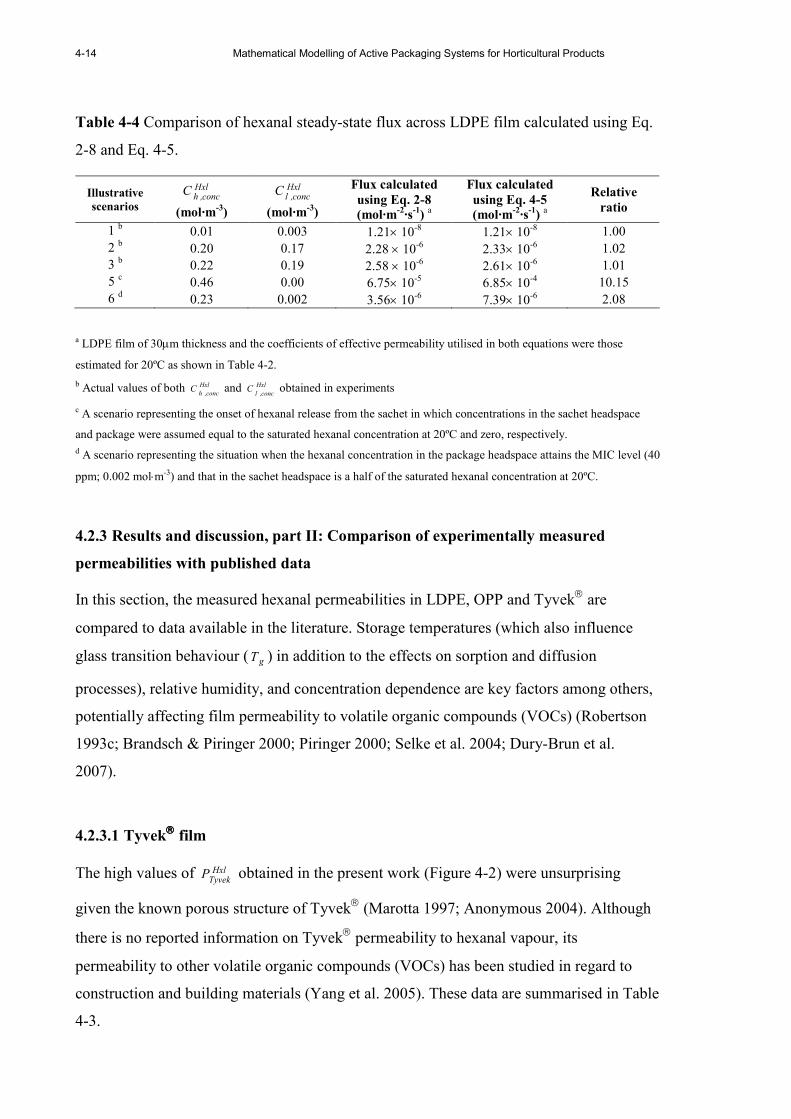
4-14 Mathematical Modelling of Active Packaging Systems for Horticultural Products
Table 4-4 Comparison of hexanal steady-state flux across LDPE film calculated using Eq.
2-8 and Eq. 4-5.
Illustrative
scenarios
Hxlconc,h
C
(mol·m-3)
Hxlconc,l
C
(mol·m-3)
Flux calculated
using Eq. 2-8
(mol·m-2·s-1) a
Flux calculated
using Eq. 4-5
(mol·m-2·s-1) a
Relative
ratio
1 b 0.01 0.003 1.21× 10⁻⁸ 1.21× 10⁻⁸ 1.00
2 b 0.20 0.17 2.28 × 10⁻⁶ 2.33× 10⁻⁶ 1.02
3 b 0.22 0.19 2.58 × 10⁻⁶ 2.61× 10⁻⁶ 1.01
5 c 0.46 0.00 6.75× 10⁻⁵ 6.85× 10⁻⁴ 10.15
6 d 0.23 0.002 3.56× 10⁻⁶ 7.39× 10⁻⁶ 2.08
a LDPE film of 30µm thickness and the coefficients of effective permeability utilised in both equations were those
estimated for 20ºC as shown in Table 4-2.
b Actual values of both Hxl
conc,hC and Hxl
conc,lC
obtained in experiments
c A scenario representing the onset of hexanal release from the sachet in which concentrations in the sachet headspace
and package were assumed equal to the saturated hexanal concentration at 20ºC and zero, respectively.
d A scenario representing the situation when the hexanal concentration in the package headspace attains the MIC level (40
ppm; 0.002 mol⋅m-3) and that in the sachet headspace is a half of the saturated hexanal concentration at 20ºC.
4.2.3 Results and discussion, part II: Comparison of experimentally measured
permeabilities with published data
In this section, the measured hexanal permeabilities in LDPE, OPP and Tyvek are
compared to data available in the literature. Storage temperatures (which also influence
glass transition behaviour ( gT ) in addition to the effects on sorption and diffusion
processes), relative humidity, and concentration dependence are key factors among others,
potentially affecting film permeability to volatile organic compounds (VOCs) (Robertson
1993c; Brandsch & Piringer 2000; Piringer 2000; Selke et al. 2004; Dury-Brun et al.
2007).
4.2.3.1 Tyvek film
The high values of HxlTyvek
P obtained in the present work (Figure 4-2) were unsurprising
given the known porous structure of Tyvek (Marotta 1997; Anonymous 2004). Although
there is no reported information on Tyvek permeability to hexanal vapour, its
permeability to other volatile organic compounds (VOCs) has been studied in regard to
construction and building materials (Yang et al. 2005). These data are summarised in Table
4-3.

Chapter 4: Evalulating Physico-Chemical Properties of Hexanal Vapour and Silica gel
4-15
Table 4-3 Estimated permeability to various VOCs of Tyvek building materials measured
at 23ºC (modified from Yang et al. 2005) a
Organic vapours Initial concentration in material
(mol·m-3)
iTyvek
P
(pmol·m·m-2·s-1·Pa
-1) b
Undecane 3.18 × 10⁻⁴ 4.98
2-pentyl-furan 2.32 × 10⁻⁴ 3.02
1-octen-3ol 2.95 × 10⁻³ 10.83
a The technique employed by Yang et al. (2005) is described as headspace analyses in which the tested sample was placed in a small
sealed chamber. Levels of the compound accumulating in the headspace were then dynamically analysed until a steady-state was
attained
b Permeability was estimated from reported partition coefficients ( iTyvek
K , dimensionless; iTyvek
S = TvyekiTyvek
RTK , mol·m-3·Pa-1), and
diffusivity ( iTyvek
D , m2·s-1) of test compounds, through the relationship: iTyvek
iTyvek
iTyvek
SDP ×= .
When considered at the same concentrations as reported in Table 4-3, the magnitudes of
permeability to hexanal vapour of Tyvek ( HxlTyvekP ) predicted by Eq. 4-3, (~3.35 pmol·m·m-
2·s-1·Pa-1) appears comparable to those of undecane and 2-pentyl-furan, but nearly 3-fold
(at ~3.56 pmol·m·m-2·s-1·Pa-1) lower than that reported for 1-octen-3ol. Tyvek has been
recently reported as a suitable material for making sachets containing active systems that
release volatile compounds, such as eugenol volatiles for maintaining colour of tamarillo
stem (Pongjaruwat 2007) and chlorine dioxide for suppressing growth of Erwinia
carotovora subsp. carotovora (the pathogen causing bacterial soft rot) inoculated on
tomato (Mahovic et al. 2007). However, the permeabilities of Tyvek to either eugenol or
chlorine dioxide were not reported by the authors.
4.2.3.2 OPP film
Whilst there is no information reported on HxlOPP
P , the permeabilities of PP film to hexanal
(designated as HxlPP
P ) and other aldehydes quantified in the range of 5-75°C were reported
by Leufven & Stollman (1992) as shown in Table 4-4. OPP film is a modification of PP
through an orientation technique (by stretching the film to cause molecular realignment)
that improves the film properties with regard to crystallinity, barrier behaviour and strength

4-16 Mathematical Modelling of Active Packaging Systems for Horticultural Products
(Selke et al. 2004). The reported values of HxlOPP
P are consistently much lower than those of
HxlPP
P (Table 4-4), indicating that OPP is a better barrier to hexanal than PP film.
The permeability of OPP films to other VOCs is also summarised in Table 4-4. The
concentration and temperature dependency of OPP film permeability found in the present
study is confirmed by results reported by Huang & Giacin (1998), Zobel (1982) and Liu et
al. (1991) for a range of VOCs. Also, the magnitude of effective OPP permeability to
hexanal vapour quantified in the present work was in line with that of OPP permeability to
other VOCs (Table 4-4).
Liu et al. (1991) reported that RH affected permeability of PVDC-coated OPP to toluene.
Significant influences of RH were reported for toluene with concentrations in the range of
0.0016-0.0024 mol·m-3, where the permeability at 21ºC increased as the RH increased from
0% (dry condition) to 86%. However the effect of varying RH was minimal at higher
toluene concentrations (0.0033 mol·m-3). Liu et al. (1991) postulated that the RH effects
resulted from water vapour interactions with unidentified hydrophilic surfactants
incorporated in the PVDC coating resin. These interactions were proposed to occur
concurrently with those between toluene and PVDC contributing to a relaxation in the
molecular structures of the PVDC coating and yielding a high toluene concentration
dependency of the permeability values. Because OPP and PVDC films have relatively low
solubility for water vapour but relatively high solubility for toluene, this could also be the
reason for there being no RH effect on permeation at high toluene concentrations, where
the effects of water vapour-surfactant interactions on structural relaxation of the OPP
polymer could be outweighed by the interactions between toluene and PVDC. At a given
relative humidity, Liu et al. (1991) reported the strong toluene concentration dependent
permeability of OPP films. Overall, at high toluene concentrations and in the absence of a
hydrophilic surfactant, RH effect appears not to be a significant factor.

Chapter 4: Evalulating Physico-Chemical Properties of Hexanal Vapour and Silica gel
4-17
Table 4-4 Comparison of permeability of OPP and PP films to hexanal and other selected
volatile organic compounds (VOCs)
Reported significant
dependence of
permeability b
Ref.
no. a Film type Compound
Temp
(ºC)
Concentration level
(Conc.; mol·m-3)
RH
level (%)
Permeability
(pmol·m·m-2·s-1·Pa-1)
Temp. Conc. RH
[1] OPP Hexanal 10 0.01, 0.03, & 0.04 No 0.003, 0.004, & 0.005 c Yes Yes n/a
OPP 20 0.07, 0.11, & 0.14 " 0.003, 0.010, & 0.014 c " " "
[2] PP Hexanal 5-75 0.001-0.20 d " 0.02-0.04 Yes n/a n/a
Butanal " 0.01-0.12 d " 0.01-0.025 " " "
Pentanal " 0.01-0.5 d " 0.005-0.04 " " "
Heptanal " 0.0004-0.06 d " 0.005-0.07 " " "
[3] OPP e Ethyl acetate 30 0.44, 0.98, & 1.91 " 0.0002, 0.0003, & 0.01 c Yes Yes n/a
40 0.43, 0.95, & 1.85 " 0.0007, 0.0008, & 0.015 c " " "
50 0.42, 0.92, & 1.79 " 0.0017, 0.0018, & 0.0195 c " " "
d-Limonene 40 0.014, 0.028, & 0.05 " 0.002, 0.008, & 0.012 c " " "
50 0.013, 0.027, & 0.053 " 0.004, 0.019, & 0.024 c " " "
60 0.013, 0.026, & 0.052 " 0.009, 0.034, & 0.042 c " " "
[4] B-OPP f Benzyl
acetate
25 0.0002, 0.0006, 0.002,
& 0.004 g
" 0.02, 0.019, 0.03, & 0.04 c n/a Yes n/a
2-methoxy-
phenol
" 0.0001, 0.0008, 0.0013,
0.0016, 0.0017, 0.003,
& 0.006 g
" 0.0128, 0.0133, 0.0128,
0.016, 0.017, 0.017, &
0.020 c
" " "
d-Limonene " 0.0014, & 0.06 g " 0.003, & 0.05 c " " "
[5] B-OPP f,h Ethanol 25 0.09 " 0.0003 n/a n/a n/a
Methanol " 0.17 " 0.0009 " " "
Menthol " 0.002 " 0.009 " " "
Propanal " 0.12 " 0.0004 " " "
[6] OPP i Toluene 21 0.0016 56 & 86 0.00001, & 0.015 j n/a Yes Yes
0.0024 0, 56 & 86 0.0004, 0.003, & 0.015 j " " "
0.0033 " 7.56, 7.24, & 7.94 j " " No
a [1] The present work, [2] Leufven & Stollman (1992), [3] Huang & Giacin (1998), [4] Zobel (1982), [5] Zobel (1985), and [6] Liu et al. (1991)
b “n/a” = not available information, ‘Temp.’ = temperature, and ‘Conc.’ = concentration.
c Permeability values were reported in the order of concentrations shown in the ‘concentration level’ column.
d Concentrations used in experiments were reported as ‘a range of concentration’, instead of specific values for individual measured permeability.
e There are also reports on OPP permeability to toluene, methyl-ethylketone, and α-pinene; the trends of these were similar to those shown in Table 4-4. f BOPP represents a biaxially-OPP with co-extruded surface layer (SCB30).
g Reported as vapour concentration gradient between two surfaces of a tested film.
h There are also reports on B-OPP permeability to a range of VOCs, such as acetic acid, decane, ethane, guaiacol, heptyl acetate and xylene.
i Two-side-PVDC-coated OPP.
j Permeability values were reported in the order of relative humidities shown in the ‘RH level (%)’ column.
Both HxlPP
P and HxlOPP
P show a positive trend of temperature dependence in the range of 5 to
25ºC (Table 4-4). However Leufven & Stollman (1992) reported that HxlPP
P values
decreased by nearly 50% as the temperature increased from 25 to 75ºC and noted a similar
4-18 Mathematical Modelling of Active Packaging Systems for Horticultural Products
temperature dependence for PP permeability to each of butanal, pentanal, and heptanal.
They suggested that this discontinuous nature of temperature dependence may be due to a
reduced sorption of the VOC as the temperature increased, which in turn reduced the
overall permeability (as earlier discussed in section 4.2.2).
In general, values of HxlOPP
P were approximately 10-fold lower than those of HxlPP
P over a
range of 5 to 25ºC (Table 4-4). As noted, this suggests that the OPP film provides a better
barrier to hexanal permeation, as could be expected from the improved barrier properties
resulting from the orientation technique. The key contributor to the superior barrier
property to hexanal transfer of OPP films is expected to be the increase in crystallinity. The
crystallinities of OPP and PP films are reportedly about 80% (Willige et al. 2002) and 39%
(Charara et al. 1992), respectively. Regions of high crystallinity are considered
impermeable, thus creating longer diffusion paths and reducing the area for permeation, so
retarding diffusion processes (Giacin 1987; Dury-Brun et al. 2007). The effects of
crystallinity on mass transfer processes across polymer film materials have been well
studied, e.g. for toluene and N-heptane in PE (Lutzow et al. 1999), dichloromethane in PP
(D'Aniello et al. 2000), and various flavour compounds in PET, polycarbonate (PC), and
polyethylene naphthalate (PEN) (Willige et al. 2002).
Willige et al. (2002) reported that OPP film (30µm film thickness; 0.916 g·cm-3 film
density) minimally absorbed hexanal (less than 0.1 mmol·m-2 [sic]) and other flavour
compounds, such as linalool, octanol, and limonene at 4ºC because this temperature is
close to OPP’s glass transition temperature ( gT ) of -5 to 0ºC. The glass transition
temperature is a measure of the mobility of the polymeric chain and is considered a key
factor among others (such as polymeric composition and surface treatments) that could
affect the rate of permeation processes (Brandsch & Piringer 2000; Selke et al. 2004). A
film kept at a temperature close to or lower than its gT is likely to have a higher proportion
of the glassy and hard structures in which free rotation of polymers is restricted and the
free volume for diffusion is subsequently reduced. Therefore, diffusion is expected to
proceed at a slower rate. As the temperature increases above gT , there is a rearrangement
of polymeric molecules toward the so-called rubbery state, where faster diffusion and
hence quicker attainment of equilibrium can occur. Table 4-5 summarises gT values of a
range of polymer films for food packaging applications.

Chapter 4: Evalulating Physico-Chemical Properties of Hexanal Vapour and Silica gel
4-19
Table 4-5 Summary of gT values of a range of polymer films for food packaging
applications (modified from Brandsch & Piringer 2000; Willige et al. 2002; Selke et al.
2004)
Polymer film a
Glass transition temperature
( gT ; ºC)
LDPE, LLDPE, HDPE b -120 to -22 Non oriented PP (PP) -22 to -12 OPP -5 to 0 PS 74 to 105 PVC 90 PVDC -17 PET 70-83 EVOH 55 to 70 PVOH 85 PEN 78 to 120 PC 120 to 150 PVAC 28-31
a LDPE = Low Density Polyethylene, LLDPE = Linear Low Density Polyethylene, HDPE = High Density Polyethylene, PP =
Polypropylene, OPP = Oriented Polypropylene, PS = Polystyrene, PVC = Polyvinyl chloride, PVDC = Polyvinylidene chloride,
EVOH = Ethylene Vinyl Alcohol, PVOH= Polyvinyl Alcohol, PEN = Polyethylene naphthalate, PC = Polycarbonate, and PVAC =
Polyvinyl Acetate.
b Data documented by Selke et al. (2004) and Brandsch & Piringer (2000) for all of these PE-based films were considered greatly
different, and these are -120 and -30 ± 5, respectively.
From Table 4-5, it can be inferred that at ambient temperature (i.e. 20°C), LDPE film has
more polymeric chains in the rubbery state than films such as PET and EVOH, suggesting
the barrier properties to gas and vapour permeation of these latter films will also be better
than those of LDPE film.
4.2.3.3 LDPE film
At present, the only literature available on HxlLDPE
P is the report by Song et al. (1996) (Table
4-6). However there are also reports of permeability to hexanal vapour of other films in the
polyethylene family, for example HDPE, LLDPE, EVOH and multi-layer films such as
EVA/PE/EVA (Table 4-6). For LDPE, Song et al. (1996) reported that the temperature
dependence of HxlLDPE
P for 0 to 30°C was well described by the Arrhenius relationship (Eq.
2-10) (also discussed in section 2.5.2). Predicted permeabilities to hexanal vapour at 10
and 20 °C using Eq. 2-10 (~0.025 and 0.047 pmol·m·m-2·s-1·Pa-1, for 10 and 20 °C,
respectively) are reasonably comparable to data identified in the present work (Table 4-6;
4-20 Mathematical Modelling of Active Packaging Systems for Horticultural Products
assuming minimal effects of concentration dependence, as also discussed later in this
section), if the coefficients of the Arrhenius model identified by the nonlinear regression of
permeability values reported by Song et al. (1996) are used (i.e. the Arrhenius model fitted
pre-exponential factor for permeability to hexanal vapour ( Hxl0,LDPEP ) and energy of
activation ( Ea ) of 5.35 × 10⁻⁶ mol·m·m-2·s-1·Pa-1and 45.20 kJ·mol-1, respectively). The
trends of temperature dependence of HxlLDPE
P in the present work were also consistent with
those reported by Song et al. (1996). The temperature dependence of other polymer films
to hexanal and other compounds reported in the literature is summarised in Table 4-6.
HxlLDPE
P values measured at 10 and 20°C in the present work were comparable to those
reported by Song et al. (1996), although concentrations 10-fold different were utilised
(Table 4-6). According to Eq. 4-3 and coefficients reported in Table 4-2, the predicted
values for HxlLDPE
P at 10 and 20°C at the concentrations of 0.002-0.003 mol⋅m-3 examined by
Song et al. (1996) were approximately 0.019 and 0.020 pmol⋅m⋅m-2⋅s-1⋅Pa-1, respectively.
These are lower but not markedly so than the values reported by Song et al. (1996) of 0.03
and 0.05 pmol·m·m-2·s-1·Pa-1, respectively. These data suggests that HxlLDPEP can reasonably
be modelled as concentration independent over the low concentration range of 0.002-0.02
mol·m-3.
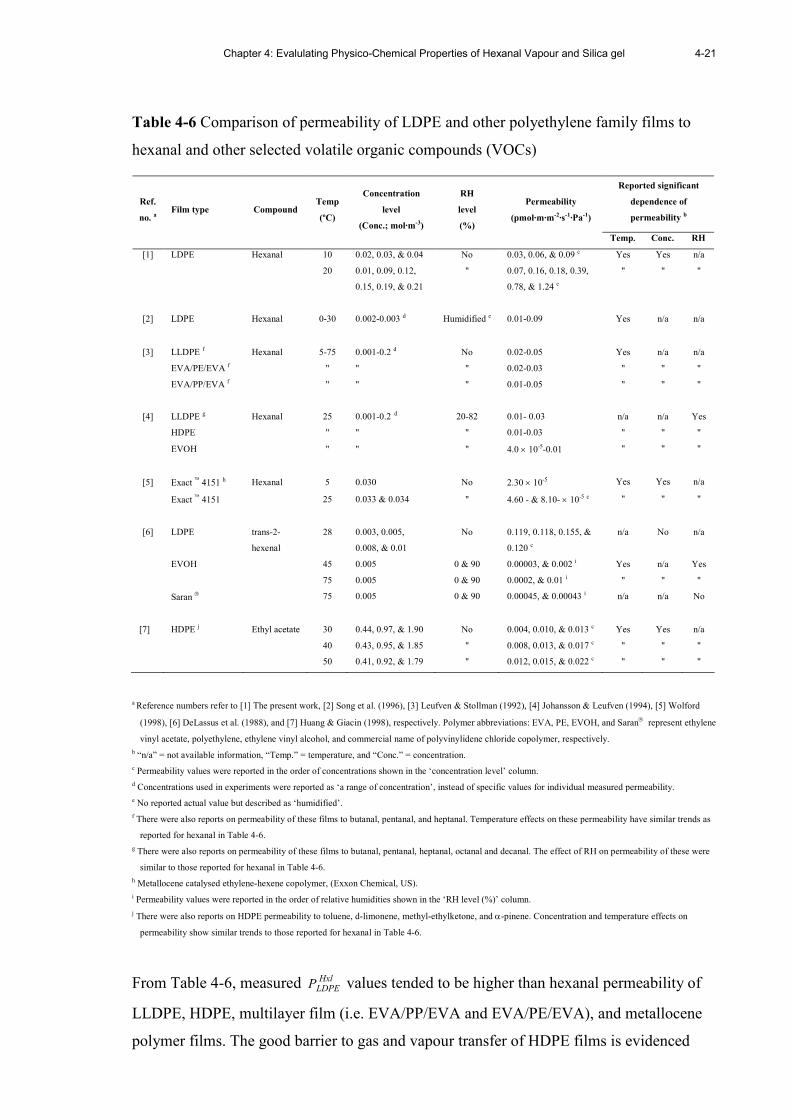
Chapter 4: Evalulating Physico-Chemical Properties of Hexanal Vapour and Silica gel
4-21
Table 4-6 Comparison of permeability of LDPE and other polyethylene family films to
hexanal and other selected volatile organic compounds (VOCs)
Reported significant
dependence of
permeability b
Ref.
no. a Film type Compound
Temp
(ºC)
Concentration
level
(Conc.; mol·m-3)
RH
level
(%)
Permeability
(pmol·m·m-2·s-1·Pa-1)
Temp. Conc. RH
[1] LDPE Hexanal 10 0.02, 0.03, & 0.04 No 0.03, 0.06, & 0.09 c Yes Yes n/a
20 0.01, 0.09, 0.12,
0.15, 0.19, & 0.21
" 0.07, 0.16, 0.18, 0.39,
0.78, & 1.24 c
" " "
[2] LDPE Hexanal 0-30 0.002-0.003 d Humidified e 0.01-0.09 Yes n/a n/a
[3] LLDPE f Hexanal 5-75 0.001-0.2 d No 0.02-0.05 Yes n/a n/a
EVA/PE/EVA f " " " 0.02-0.03 " " "
EVA/PP/EVA f " " " 0.01-0.05 " " "
[4] LLDPE g Hexanal 25 0.001-0.2 d 20-82 0.01- 0.03 n/a n/a Yes
HDPE " " " 0.01-0.03 " " "
EVOH " " " 4.0 × 10⁻⁵-0.01 " " "
[5] Exact 4151 h Hexanal 5 0.030 No 2.30 × 10⁻⁵ Yes Yes n/a
Exact 4151 25 0.033 & 0.034 " 4.60 - & 8.10- × 10-5 c " " "
[6] LDPE trans-2-
hexenal
28 0.003, 0.005,
0.008, & 0.01
No 0.119, 0.118, 0.155, &
0.120 c
n/a No n/a
EVOH 45 0.005 0 & 90 0.00003, & 0.002 i Yes n/a Yes
75 0.005 0 & 90 0.0002, & 0.01 i " " "
Saran 75 0.005 0 & 90 0.00045, & 0.00043 i n/a n/a No
[7] HDPE j Ethyl acetate 30 0.44, 0.97, & 1.90 No 0.004, 0.010, & 0.013 c Yes Yes n/a
40 0.43, 0.95, & 1.85 " 0.008, 0.013, & 0.017 c " " "
50 0.41, 0.92, & 1.79 " 0.012, 0.015, & 0.022 c " " "
a Reference numbers refer to [1] The present work, [2] Song et al. (1996), [3] Leufven & Stollman (1992), [4] Johansson & Leufven (1994), [5] Wolford
(1998), [6] DeLassus et al. (1988), and [7] Huang & Giacin (1998), respectively. Polymer abbreviations: EVA, PE, EVOH, and Saran represent ethylene
vinyl acetate, polyethylene, ethylene vinyl alcohol, and commercial name of polyvinylidene chloride copolymer, respectively.
b “n/a” = not available information, “Temp.” = temperature, and “Conc.” = concentration.
c Permeability values were reported in the order of concentrations shown in the ‘concentration level’ column.
d Concentrations used in experiments were reported as ‘a range of concentration’, instead of specific values for individual measured permeability.
e No reported actual value but described as ‘humidified’.
f There were also reports on permeability of these films to butanal, pentanal, and heptanal. Temperature effects on these permeability have similar trends as
reported for hexanal in Table 4-6.
g There were also reports on permeability of these films to butanal, pentanal, heptanal, octanal and decanal. The effect of RH on permeability of these were
similar to those reported for hexanal in Table 4-6.
h Metallocene catalysed ethylene-hexene copolymer, (Exxon Chemical, US).
i Permeability values were reported in the order of relative humidities shown in the ‘RH level (%)’ column.
j There were also reports on HDPE permeability to toluene, d-limonene, methyl-ethylketone, and α-pinene. Concentration and temperature effects on
permeability show similar trends to those reported for hexanal in Table 4-6.
From Table 4-6, measured HxlLDPEP values tended to be higher than hexanal permeability of
LLDPE, HDPE, multilayer film (i.e. EVA/PP/EVA and EVA/PE/EVA), and metallocene
polymer films. The good barrier to gas and vapour transfer of HDPE films is evidenced

4-22 Mathematical Modelling of Active Packaging Systems for Horticultural Products
through its low permeability to ethyl acetate, toluene, d-limonene, methyl-ethylketone, and
α-pinene, however the permeability to these compounds was reported to be concentration
and temperature dependent (Huang & Giacin 1998) (Table 4-6). Selke et al. (2004)
suggested that multilayer film materials commonly provide improved barrier properties
compared to single layer films and this is supported by the low permeability to hexanal of
the multilayer films reported by Leufven & Stollman (1992) (Table 4-6). According to
Selke et al. (2004), metallocene polymers generally have more uniform and controlled
molecular weight distribution, resulting in improved film properties as gas and vapour
barriers. Wolford (1998) reported metallocene-LDPE film had an excellent barrier to
hexanal vapour. These low permeability films may suit applications where a slow
controlled release of hexanal is required.
Although values of gT for LDPE, LLDPE, and HDPE are in a similar range (Table 4-5),
the better barrier properties of LLDPE and HDPE compared to those of LDPE may be
explained by differences of crystallinity and structural arrangement. LLDPE is a modified
form of LDPE having regular and linear short molecular branches (Robertson 1993c).
Although some properties of LLDPE are similar to those of LDPE, such as density (Selke
et al. 2004), LLDPE tends to have improved mechanical and barrier properties.
Crystallinity of LLDPE can vary between 45-88% (Zhu et al. 1999; Willige et al. 2002),
and is higher than that of LDPE which varies from 20 to 62% (Zhu et al. 1999). The better
hexanal barrier property of HDPE than LDPE could be the result of both (i) the higher
density of HDPE (940-965 kg·m-3 for HDPE, 915 to 939 kg·m-3 for LDPE) and (ii) the
more linear polymer structure of HDPE than LDPE (in which the molecular arrangement is
highly branched). Furthermore HDPE has up to 90% crystallinity (Robertson 1993c).
Other improved properties of HDPE include stiffness, tensile and bursting strength, and
chemical resistance (Robertson 1993c; Selke et al. 2004).
Although Song et al. (1996) humidified their hexanal vapour, the reported values of HxlLDPEP
were comparable to those quantified in the present work (Table 4-6) when considered at
0.02 mol⋅m-3, where minimal concentration dependence of HxlLDPEP was reasonably justified
(as discussed earlier). These results suggest there was insignificant influence of water
vapour on hexanal permeation through LDPE film, as was expected in line with the general
trend for organic vapour permeation through hydrophobic nonpolar films such as LDPE,
Chapter 4: Evalulating Physico-Chemical Properties of Hexanal Vapour and Silica gel
4-23
HDPE, and OPP (Rogers et al. 1962; Karel 1975; Rogers 1985; DeLassus et al. 1988). The
similarities between literature data and results obtained from the present work provide
some confidence in the information obtained on HxlLDPEP . In contrast to such general trends,
Johansson & Leufven (1994) reported the significant effects of relative humidity on
hexanal permeability of LLDPE ( HxlLLDPE
P ) and HDPE ( HxlHDPE
P ) films at 25°C (Table 4-6),
although the trend was unclear. Whilst HxlLLDPE
P and HxlHDPE
P values increased ~3.5-fold as RH
increased from 20 to 52%, these values decreased ~1.5-fold as the RH was further
increased from 52 to 82%. Johansson & Leufven (1994) also reported similar RH effects
on permeability of LLDPE and HDPE to other aldehydes including butanal, pentanal,
heptanal, octanal and decanal. They assumed that the effects of RH were due to the
plasticising effects of sorbed water vapour, even though the solubility of water vapour in
hydrophobic nonpolar films is low. As RH increased from 20 to 52%, greater amounts of
water vapour were assumed to be absorbed by LLDPE film (Johansson & Leufven 1994).
Johansson & Leufven (1994) speculated that sorbed molecules then facilitate diffusion of
organic permeant through increasing free volume within the polymeric structure, however
the plasticizing effects were presumably suppressed as the RH further increased because
more sorbed water molecules potentially competed with other permeants for the available
spaces. This could result in decreasing permeability values at higher relative humidity
levels.
At present there is limited information on RH effects on HxlLLDPE
P and HxlHDPEP to compare with
the results reported by Johansson & Leufven (1994). Information on HxlLLDPE
P was reported
by Leufven & Stollman (1992) but in this case the hexanal vapour was not humidified
(Table 4-6). HxlLLDPEP values reported by Leufven & Stollman (1992) appear ~10-fold higher
than the corresponding values reported by Johansson & Leufven (1994), even though the
LLDPE films tested and experimental methodologies were similar. However, differences
in results among these studies were not discussed or explained. Furthermore, although a
range of conditions (i.e. 0.001-0.2 mol⋅m-3; 5-75ºC) were employed in determining
permeability, neither the actual concentrations corresponding to individual values of
permeability nor the exact concentration dependence were reported. The effects of
concentration dependence may be assumed to be an important factor contributing to the
apparent differences of HxlLLDPE
P values. Further studies are therefore required to elucidate

4-24 Mathematical Modelling of Active Packaging Systems for Horticultural Products
RH effects on HxlLLDPE
P and these experiments must be made across a range of hexanal
concentrations and concentration differences.
The insignificant effect of water vapour on permeation of hexanal through hydrophobic
nonpolar polymer films is also implied from the work of DeLassus et al. (1988) on film
permeation of trans-2-hexenal (C6H10O) (Table 4-6). This compound is another important
C6-aldehyde compound from plant materials (Hamilton-Kemp et al. 1996) and chemically,
trans-2-hexenal has an aliphatic chemical structure close to hexanal. DeLassus et al. (1988)
reported no effect of an RH close to 90% at 75ºC on permeability of Vinylidene Chloride
(VDC) copolymer films to trans-2-hexenal (at fixed concentration at 0.005 mol·m-3).
However a clear influence of RH on EVOH permeability to trans-2-hexenal was reported,
where permeability increased nearly 60-fold as RH increased from 0 to 90%. In addition to
investigating RH effects, DeLassus et al. (1988) also studied the effects of concentration of
trans-2-hexenal (0.003-0.01 mol·m-3) on LDPE permeability, and reported reasonably
constant permeability values over this concentration range (Table 4-6).
For hydrophilic polar film materials such as EVOH and cellophane, RH of the surrounding
environment could affect film permeability to gaseous and volatile compounds (Robertson
1993c). Significant effects of water vapour on permeation of hexanal and other aldehyde
compounds through EVOH film were reported by Johansson & Leufven (1994) (Table
4-6), where EVOH permeability increased ~250 fold as the surrounding humidity
increased from 20 to 82%.
4.2.3.4 Concluding remarks from the comparison of experimental and literature data
Overall the permeabilities to hexanal vapour of Tyvek, OPP and LDPE films quantified
in the present work appear reasonable, and particularly, the magnitudes of OPP and LDPE
permeabilities are in a line with literature data. This provides some confidence in the
experimental data to be used in the subsequently developed mathematical models.
4.3 Determination of hexanal sorption isotherms for silica gel adsorbents
The equilibrium distribution between the adsorbed volatile agent on the carrier and the in
the vapour headspace above the adsorbent is a key parameter in the design of an active
packaging system. It is this equilibrium that controls the magnitude of the driving force for
Chapter 4: Evalulating Physico-Chemical Properties of Hexanal Vapour and Silica gel
4-25
volatile transfer out of the sachet. As discussed in the literature review, sorption isotherms
vary with the properties of the adsorbent and adsorbate comprising the system as well as
with environmental conditions such as temperature and relative humidity. There is no
reported data for the sorption isotherm of hexanal on silica gel or other major porous
adsorbents (e.g. activated carbon) making it necessary to experimentally determine the
isotherm and how this was influenced by storage conditions.
4.3.1 Approaches for determining sorption isotherms
Methods for obtaining sorption isotherms for gaseous species on porous particles have
been described by many researchers (Apostolopoulos 1985; Belmabkhout et al. 2004;
Thielmann 2004). In general the methods utilise one of three basic approaches:
� Gravimetric: direct measurement of weight changes of samples which have
been equilibrated at a constant temperature at different partial pressures of the
vapour of interest (Belmabkhout et al. 2004).
� Volumetric: an indirect measurement of the mass adsorbed, determined by a
mass balance over the gas phase, through application of the equation of state
before and after equilibrium conditions are attained (Belmabkhout et al. 2004).
� Inverse Gas Chromatography (IGC): a method which employs porous particles
packed in a column as the stationary phase (as in gas chromatography), into
which a known gaseous mobile phase (specified by composition and flow rate)
is directed. Sorption characteristics are quantified through chromatographic
responses (i.e. peak height and area) (Apostolopoulos & Gilbert 1983;
Apostolopoulos 1985; Gilbert 1993). The IGC technique provides the key
benefit of identifying equilibrium conditions at relatively low partial pressure
(known as the Henry’s law isotherm range) and the required length of the
experimental period is considerably shorter than the other two techniques
(Thielmann 2004).
Whilst attempts to conduct sorption experiments using both IGC and volumetric methods
were made, these were limited by a number of practical problems (see discussion in
Appendix E.1 to E.4). The gravimetric measurement approach was therefore principally
used in the present work.
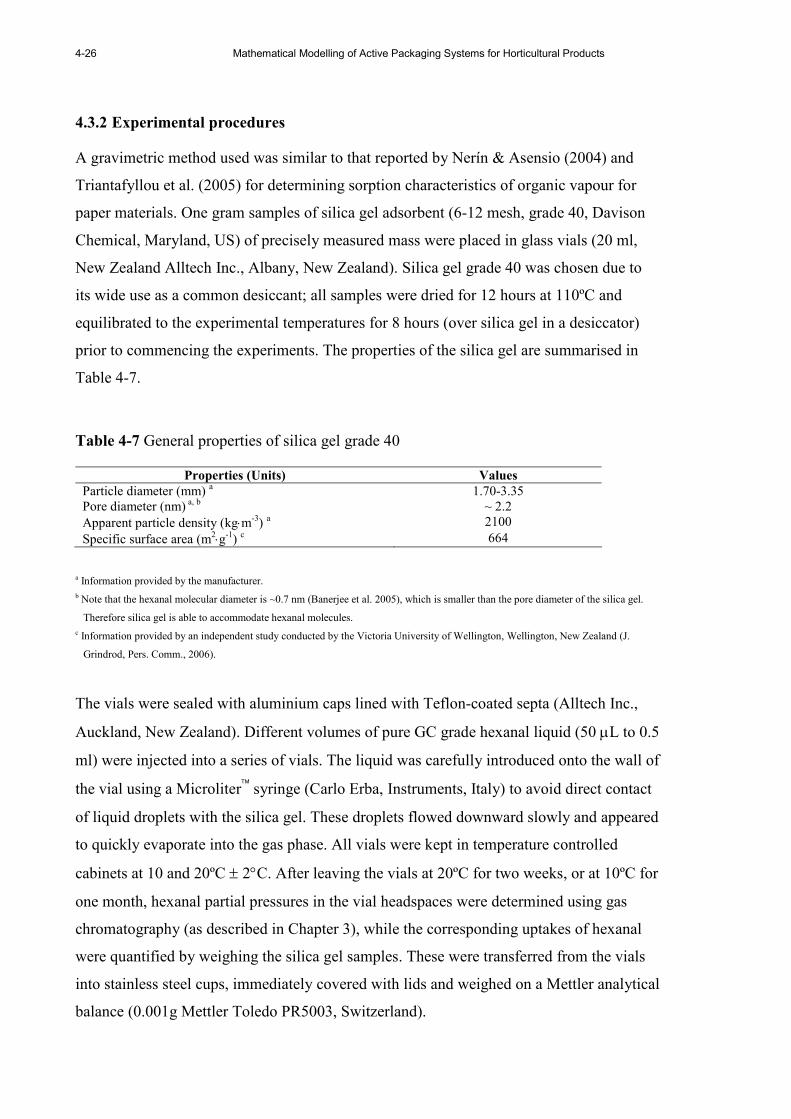
4-26 Mathematical Modelling of Active Packaging Systems for Horticultural Products
4.3.2 Experimental procedures
A gravimetric method used was similar to that reported by Nerín & Asensio (2004) and
Triantafyllou et al. (2005) for determining sorption characteristics of organic vapour for
paper materials. One gram samples of silica gel adsorbent (6-12 mesh, grade 40, Davison
Chemical, Maryland, US) of precisely measured mass were placed in glass vials (20 ml,
New Zealand Alltech Inc., Albany, New Zealand). Silica gel grade 40 was chosen due to
its wide use as a common desiccant; all samples were dried for 12 hours at 110ºC and
equilibrated to the experimental temperatures for 8 hours (over silica gel in a desiccator)
prior to commencing the experiments. The properties of the silica gel are summarised in
Table 4-7.
Table 4-7 General properties of silica gel grade 40
Properties (Units) Values
Particle diameter (mm) a 1.70-3.35 Pore diameter (nm) a, b ~ 2.2
Apparent particle density (kg⋅m-3) a 2100
Specific surface area (m2⋅g-1) c 664
a Information provided by the manufacturer.
b Note that the hexanal molecular diameter is ~0.7 nm (Banerjee et al. 2005), which is smaller than the pore diameter of the silica gel.
Therefore silica gel is able to accommodate hexanal molecules.
c Information provided by an independent study conducted by the Victoria University of Wellington, Wellington, New Zealand (J.
Grindrod, Pers. Comm., 2006).
The vials were sealed with aluminium caps lined with Teflon-coated septa (Alltech Inc.,
Auckland, New Zealand). Different volumes of pure GC grade hexanal liquid (50 µL to 0.5
ml) were injected into a series of vials. The liquid was carefully introduced onto the wall of
the vial using a Microliter syringe (Carlo Erba, Instruments, Italy) to avoid direct contact
of liquid droplets with the silica gel. These droplets flowed downward slowly and appeared
to quickly evaporate into the gas phase. All vials were kept in temperature controlled
cabinets at 10 and 20ºC ± 2°C. After leaving the vials at 20ºC for two weeks, or at 10ºC for
one month, hexanal partial pressures in the vial headspaces were determined using gas
chromatography (as described in Chapter 3), while the corresponding uptakes of hexanal
were quantified by weighing the silica gel samples. These were transferred from the vials
into stainless steel cups, immediately covered with lids and weighed on a Mettler analytical
balance (0.001g Mettler Toledo PR5003, Switzerland).

Chapter 4: Evalulating Physico-Chemical Properties of Hexanal Vapour and Silica gel
4-27
In addition to the vial testing system, air-tight glass desiccators (~1 L) containing hexanal
liquid were used for characterising sorption under saturated conditions ( spp =1) at both
10 and 20ºC. A perforated ceramic plate was used to hold the sample above the pure
hexanal liquid. Two gram samples of silica gel (in a stainless steel cup) were placed inside
the desiccators and allowed to equilibrate. The desiccators were kept in the same storage
environments as those used for vials. The samples were covered so as to be air-tight during
weighing to ensure no gains or losses of masses occurred. The samples were weighed
periodically over six weeks until a constant mass was reached. Samples were returned to
the sealed containers immediately after weighing. Sample masses were stable after either
one month or two weeks storage at 10 and 20°C, respectively.
4.3.3 Preliminary validation of the gravimetric sorption method
Since there is no report of sorption isotherms of hexanal on silica gel, verification of the
gravimetric sorption method described earlier was performed against published data for
acetaldehyde (Ghosh & Hines 1990) and ethanol (Madeley & Sing 1959). Isotherms for
these volatiles was reportedly determined by a gravimetric method using quartz-spring-
type microbalances7 and the silica gel adsorbents used were comparable to those used in
the present work (in respect of specific surface area, pore size and particle diameter).
Volumes of the acetaldehyde or ethanol injected into the vials corresponded to published
uptake data. For example, to achieve 0.19 g⋅g-1 ethanol uptake by silica gel as reported by
Madeley & Sing (1959), one gram of silica gel was put into a vial, into which 0.24 ml of
ethanol liquid (density of 0.79 g·ml-1 ; ≥99.8% GC grade, Riedel-de Haën supplied by
Sigma Aldrich, New Zealand) was then injected. This volume was allowed to totally
evaporate. The resultant uptake should correspond to spp ≅ 0.36 at 25ºC (note the mass
of ethanol vapour in the air phase will be very much smaller than that adsorbed on the
silica gel). After leaving the vials at 14ºC for 1 month (for acetaldehyde) and 25ºC for 2
weeks (for ethanol), headspace vapour partial pressure and equilibrium uptake were
quantified. The gas chromatography settings for measuring acetaldehyde and ethanol
samples are provided in Appendix C.
7 As hexanal vapour potentially causes serious damage to the weighing sensor of a microbalance, hexanal sorption
isotherms quantified in this manner have high experimental cost (P. Attwool, Pers. Comm. 2006; Surface
Measurement System, London, UK).
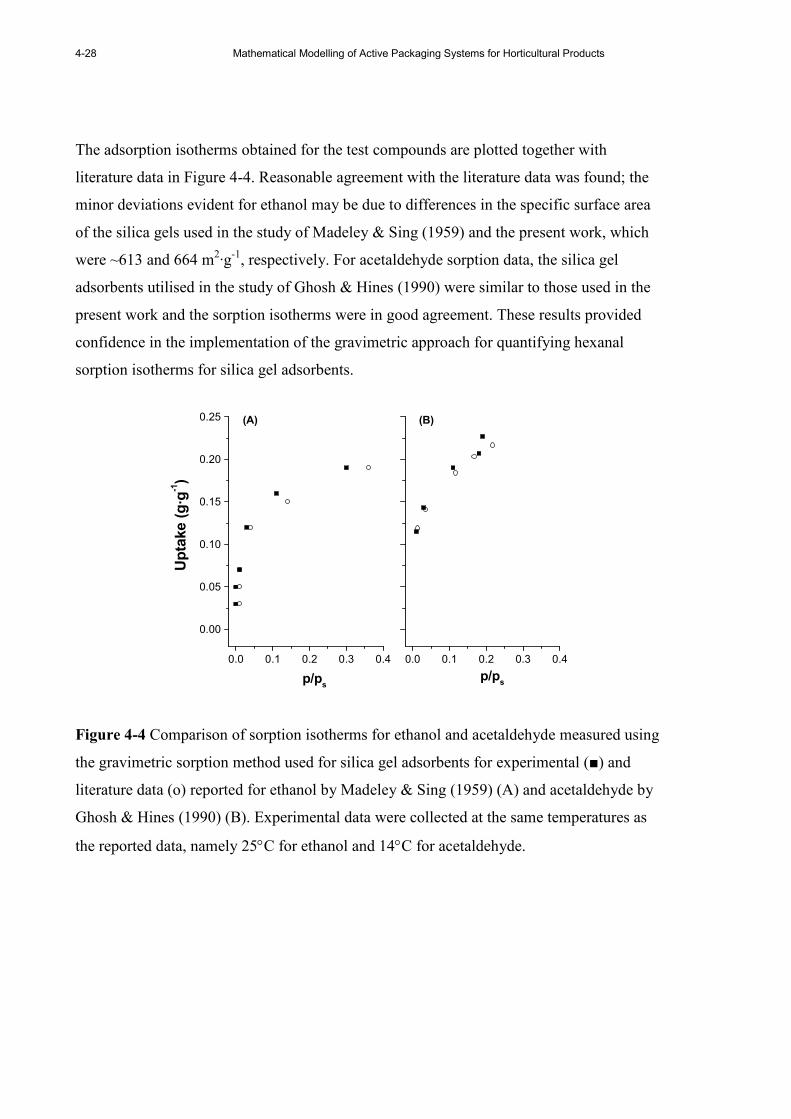
4-28 Mathematical Modelling of Active Packaging Systems for Horticultural Products
The adsorption isotherms obtained for the test compounds are plotted together with
literature data in Figure 4-4. Reasonable agreement with the literature data was found; the
minor deviations evident for ethanol may be due to differences in the specific surface area
of the silica gels used in the study of Madeley & Sing (1959) and the present work, which
were ~613 and 664 m2·g-1, respectively. For acetaldehyde sorption data, the silica gel
adsorbents utilised in the study of Ghosh & Hines (1990) were similar to those used in the
present work and the sorption isotherms were in good agreement. These results provided
confidence in the implementation of the gravimetric approach for quantifying hexanal
sorption isotherms for silica gel adsorbents.
0.0 0.1 0.2 0.3 0.4
0.00
0.05
0.10
0.15
0.20
0.25 (A)
p/ps
Uptake (g·g
-1)
p/ps
0.0 0.1 0.2 0.3 0.4
(B)
Figure 4-4 Comparison of sorption isotherms for ethanol and acetaldehyde measured using
the gravimetric sorption method used for silica gel adsorbents for experimental (■) and
literature data (o) reported for ethanol by Madeley & Sing (1959) (A) and acetaldehyde by
Ghosh & Hines (1990) (B). Experimental data were collected at the same temperatures as
the reported data, namely 25°C for ethanol and 14°C for acetaldehyde.

Chapter 4: Evalulating Physico-Chemical Properties of Hexanal Vapour and Silica gel
4-29
4.3.4 Hexanal sorption isotherms for silica gel adsorbents
Hexanal sorption isotherms for silica gel adsorbents at 10 and 20ºC are shown in Figure
4-5 8. The effect of temperature on sorption behaviour was quite marked with the
adsorption uptake measured at 10ºC being significantly higher than that at 20ºC. These
findings are consistent with the thermodynamic fundamentals of adsorption (Weber 1985),
which is an exothermic process and the spontaneity of which is expected to decrease as the
temperature of the system increases (note this is discussed further in section 6.4.4). For
example, Lee (2003) reported a continuous decline in uptake of 1-MCP by silica gel as the
temperature was raised from 50 to 80ºC. Similarly Ng et al. (2001) reported a decrease in
water vapour adsorption on silica gel when the temperature was increased from 30 to 65ºC.
0.0 0.2 0.4 0.6 0.8 1.0
0.0
0.1
0.2
0.3
0.4
0.5
0.6 10ºC
20ºC
Uptake (g·g
-1)
p/ps
Figure 4-5 Hexanal sorption isotherms for silica gel grade 40 at 10 and 20ºC measured
using a gravimetric sorption approach. Solid lines were fitted using the Langmuir isotherm
model Eq. 2-3.
The hexanal sorption isotherms showed Type I or Langmuir behaviour (Figure 4-5).
Sorption on adsorbents having similar absorbate and pore dimensions (the latter no more
than a few molecular diameters of the former) tend to give a Type I isotherm as uptake is
8 The same sorption isotherms expressed in molar terms (mol⋅g-1 and mol1⋅ m-3 as units for uptake and
hexanal vapour concentration, respectively) are shown in Appendix E.6 and the Langmuir model estimated
coefficients were for those used within the mathematical models.

4-30 Mathematical Modelling of Active Packaging Systems for Horticultural Products
limited to a monolayer on the pore walls (Gregg & Sing 1982; Thomas & Crittenden
1998b). When the pore diameters of microporous adsorbents are considerably smaller, the
adsorption potential field of neighbouring walls overlaps (Gregg & Sing 1982; Adamson
1990) and sorption occurs rapidly at low partial pressure. In Figure 4-5, hexanal sorption is
essentially completed at spp ≈ 0.3 and this confirms the Type I sorption behaviour of
hexanal sorption by silica gel for which the ratio of pore to molecular diameters (refer to
Table 4-7) was ≈ 3.
Type I adsorption isotherms generally have a limited extent of hysteresis upon desorption
because capillary condensation, which is one of main factors contributing to hysteresis, is
likely to be absent in narrow pores (Adamson 1990). Ghosh & Hines (1990) reported Type
I sorption isotherms for acetaldehyde, propionaldehyde and butyraldehyde, at 9-35ºC on
silica gel grade 40. Although hysteresis loops were reported during desorption of these
compounds, the extent of hysteresis became very small as the number of carbon atoms in
the compounds increased from 2 to 4. Based on such a finding, no significant hysteresis
was expected in the desorption of hexanal (C6) and this was confirmed using a volumetric
sorption method (Autosorb-1; Quantachrome Instruments, US) conducted by an
independent testing laboratory (Appendix E.4). For this reason, no further experiments on
hexanal desorption were performed.
The Langmuir isotherm model was fitted to both sets of sorption isotherm data, as shown in
Figure 4-5, yielding the model coefficients given in Table 4-8. The Langmuir model showed
a reasonably good fit with experimentally collected data and is the model of choice for
describing Type I sorption data because of its simplicity and practicality (Thomas &
Crittenden 1998b). However, high variation was observed in the estimation model
coefficients; in particular the HxlLgmb values have standard errors in the range of 40-52% of the
mean.

Chapter 4: Evalulating Physico-Chemical Properties of Hexanal Vapour and Silica gel
4-31
Table 4-8 Parameter estimates and standard errors (SE) from nonlinear regression analysis
of hexanal sorption isotherm data for silica gel grade 40 at 10 and 20ºC
Temperature
(ºC)
Hxlmax,sC (SE) a
(g⋅⋅⋅⋅g-1)
HxlLgm
b (SE)
(dimensionless)
n b
10 0.45 (9.6) 136 (51.9) 10 20 0.34 (7.0) 87 (40.4) 10
a The standard errors (SE) is expressed as a percentage of the estimated value. The nonlinear regressions were conducted using the
Nonlinear Regression package of Origin 5.0 (Microcal Software Inc.)
b n is the number of observations.
As discussed earlier, gas uptake could occur and approach saturation at relatively low
pressures for systems having a Type I sorption isotherm. When the condition is favourable
for adsorption (e.g. at lower temperatures), HxlLgmb , which represents the affinity between the
surface and adsorbate, is expected to be high. In such cases, estimates of HxlLgmb can be very
sensitive to the accuracy of concentration measurement at these low partial pressures. In
contrast, the variation in estimates for Hxlmax,sC was smaller because it is relatively insensitive
to partial pressure in the gas phase.
The estimated values for Hxlmax,sC and Hxl
Lgmb from the nonlinear regression method (Table 4-8)
were relatively close to those given by linear regression using the optimal
reparameterisation of the Langmuir equation as described by Ratkowsky (1990). The
maximum difference of coefficients estimated by the nonlinear and linear regression
approaches for Hxlmax,sC and Hxl
Lgmb was < 1% and < 16%, respectively. The highest difference
was observed for the estimates of HxlLgmb at 10ºC, while the difference between estimated
values of HxlLgmb at 20ºC was less than 6% (Appendix E.5).
The HxlLgmb and Hxl
max,sC values estimated in the current experiment (Table 4-8) reasonably
agree with corresponding values (Table 4-9) estimated using nonlinear regression for (i)
literature data on sorption of a range of VOCs for silica gel adsorbents (for comparable
silica gel properties such as particle size and specific surface area, and experimental
temperatures in the range of 9-30°C) and (ii) preliminary experimental data of ethanol and
acetaldehyde sorption isotherms for silica gel reported in section 4.3.3. Similar trends were
also observed in the uncertainty associated with estimates of iLgm
b and imax,sC . For all cases,
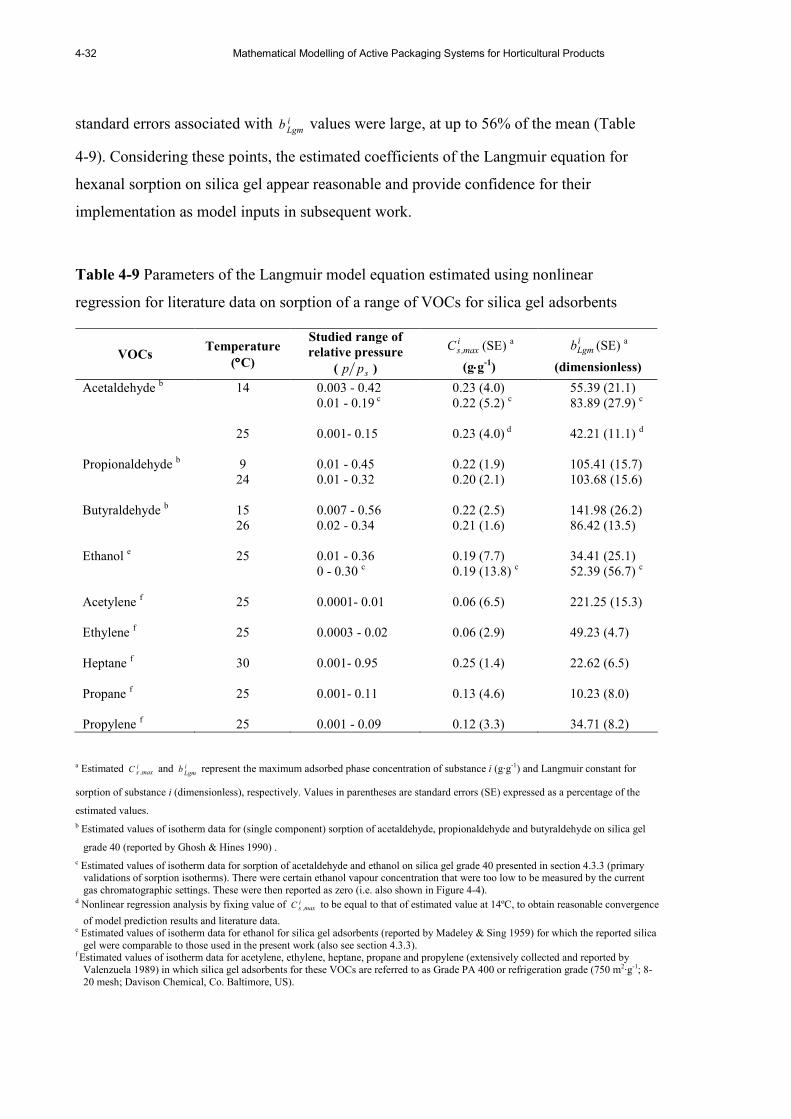
4-32 Mathematical Modelling of Active Packaging Systems for Horticultural Products
standard errors associated with iLgm
b values were large, at up to 56% of the mean (Table
4-9). Considering these points, the estimated coefficients of the Langmuir equation for
hexanal sorption on silica gel appear reasonable and provide confidence for their
implementation as model inputs in subsequent work.
Table 4-9 Parameters of the Langmuir model equation estimated using nonlinear
regression for literature data on sorption of a range of VOCs for silica gel adsorbents
VOCs Temperature
(°°°°C)
Studied range of
relative pressure
( spp )
imax,sC (SE) a
(g⋅⋅⋅⋅g-1)
iLgmb (SE) a
(dimensionless)
Acetaldehyde b 14 0.003 - 0.42 0.23 (4.0) 55.39 (21.1) 0.01 - 0.19 c 0.22 (5.2) c 83.89 (27.9) c 25 0.001- 0.15 0.23 (4.0) d 42.21 (11.1) d
Propionaldehyde b 9 0.01 - 0.45 0.22 (1.9) 105.41 (15.7) 24 0.01 - 0.32 0.20 (2.1) 103.68 (15.6) Butyraldehyde b 15 0.007 - 0.56 0.22 (2.5) 141.98 (26.2) 26 0.02 - 0.34 0.21 (1.6) 86.42 (13.5) Ethanol e 25 0.01 - 0.36 0.19 (7.7) 34.41 (25.1) 0 - 0.30 c 0.19 (13.8) c 52.39 (56.7) c Acetylene f 25 0.0001- 0.01 0.06 (6.5) 221.25 (15.3) Ethylene f 25 0.0003 - 0.02 0.06 (2.9) 49.23 (4.7) Heptane f 30 0.001- 0.95 0.25 (1.4) 22.62 (6.5) Propane f 25 0.001- 0.11 0.13 (4.6) 10.23 (8.0) Propylene f 25 0.001 - 0.09 0.12 (3.3) 34.71 (8.2)
a Estimated imax,sC and i
Lgmb represent the maximum adsorbed phase concentration of substance i (g·g-1) and Langmuir constant for
sorption of substance i (dimensionless), respectively. Values in parentheses are standard errors (SE) expressed as a percentage of the
estimated values.
b Estimated values of isotherm data for (single component) sorption of acetaldehyde, propionaldehyde and butyraldehyde on silica gel
grade 40 (reported by Ghosh & Hines 1990) .
c Estimated values of isotherm data for sorption of acetaldehyde and ethanol on silica gel grade 40 presented in section 4.3.3 (primary validations of sorption isotherms). There were certain ethanol vapour concentration that were too low to be measured by the current gas chromatographic settings. These were then reported as zero (i.e. also shown in Figure 4-4).
d Nonlinear regression analysis by fixing value of imax,sC to be equal to that of estimated value at 14ºC, to obtain reasonable convergence
of model prediction results and literature data. e Estimated values of isotherm data for ethanol for silica gel adsorbents (reported by Madeley & Sing 1959) for which the reported silica gel were comparable to those used in the present work (also see section 4.3.3).
f Estimated values of isotherm data for acetylene, ethylene, heptane, propane and propylene (extensively collected and reported by Valenzuela 1989) in which silica gel adsorbents for these VOCs are referred to as Grade PA 400 or refrigeration grade (750 m2·g-1; 8-20 mesh; Davison Chemical, Co. Baltimore, US).

Chapter 4: Evalulating Physico-Chemical Properties of Hexanal Vapour and Silica gel
4-33
To gain further insight into hexanal adsorption processes the following key thermodynamic
parameters were calculated based on the fitted isotherms for hexanal on silica gel (Figure
4-5 and Table 4-8): free energy ( oG∆ ), apparent enthalpy change ( o
H∆ ), and entropy
( oS∆ ). These parameters were calculated based on the adsorption coefficient ( Hxl
Lgmb ) and the
following thermodynamic functions (Eq. 4-6 to Eq. 4-8; Adamson 1990; Chen et al. 2007):
HxlLgmblnRTG −=o∆
(Eq. 4-6)
−
−
−=
C20C10
Hxl
C20,Lgm
Hxl
C10,Lgm
T
1
T
1
blnbln
RH
oo
ooo∆
(Eq. 4-7)
Entropy ( oS∆ ) was calculated from the relationship between o
G∆ and oH∆ , given by Eq.
4-8.
oooSTHG ∆∆∆ −= (Eq. 4-8)
where
Hxl
C10,Lgmb
o,
Hxl
C20,Lgmb
o = Langmuir coefficients at 10 and 20ºC (dimensionless),
respectively
oG∆ = Free energy (J⋅mol-1)
oH∆ = Apparent enthalpy change (J⋅mol-1)
oS∆ = Entropy (J⋅mol-1⋅K-1)
C10T
o , C20T
o = Temperature (K) for 10 and 20ºC, respectively
Derived parameters are reported in Table 4-10. The negative values of oH∆ confirm that
the adsorption process was exothermic as expected. The absolute values of oH∆ calculated
for hexanal sorption processes were in the typical range of oH∆ values for physical
adsorption (6 to 84 kJ⋅mol-1; see Adamson 1990, page 595). The exothermic property of
the adsorption process was also supported by the negative values of oG∆ , which became
less negative with increasing temperature, although the extent of change of oG∆ was small.
In contrast, values of oST∆ become more negative with increasing temperature, but the
small change suggests that increasing temperature from 10 to 20°C slightly limits hexanal
sorption on silica gel. Similar trends and magnitudes of estimated values for these

4-34 Mathematical Modelling of Active Packaging Systems for Horticultural Products
thermodynamic parameters for sorptions of other VOCs on silica gel (Table 4-9) were
observed. For example oH∆ for butyraldehyde-silica gel system when the temperature was
increased from 15 and 26 °C was ~35 kJ⋅mol-1 and oG∆ was about -12 and -11 kJ⋅mol-1.
Table 4-10 Apparent thermodynamic parameters for hexanal sorption onto silica gel
adsorbents at 10 and 20°C
Temperature
(°°°°C) o
H∆
(kJ⋅⋅⋅⋅mol-1)
oST∆
(kJ⋅⋅⋅⋅mol-1)
oG∆
(kJ⋅⋅⋅⋅mol-1) 10 -30 -19 -11 20 -30 -20 -10
4.3.5 Determinations of the effects of relative humidity on hexanal sorption
Active system to be used inside a package containing horticultural products may be
exposed to high relative humidity (> 90% RH). Water vapour may affect hexanal sorption
onto or from silica gel adsorbents, due to silica gel’s high water vapour sorption capacity.
Because of this, experiments to identify possible effects of RH on hexanal sorption
isotherm for silica gel (as used in the previous section) were undertaken.
The experimental methods employed were similar to those utilised in section 4.3.2, except
the silica gel adsorbents were first equilibrated at three different relative humidity
conditions: 60, 80 and 90% RH. Stainless steel cups containing 1 gram of dry silica gel
were placed inside sealed plastic containers containing the appropriate glycerol-water
solution to achieve the required RH and allowed to equilibrate for over a month at 20ºC.
The glycerol-water solutions were prepared according to Forney & Brandl (1992). After
equilibration, the silica gel samples were transferred into vials, then sealed, and randomly
assigned to be tested at 10 or 20ºC. Known volumes of hexanal liquid were injected into
the vials to achieve uptake in the range of 0.22-0.30 g·g-1 (2 replicates). This range was
chosen to minimise condensation of hexanal vapour (which was previously noted near the
maximum adsorption capacity). After leaving the vials for 1 month and two weeks at 10
and 20ºC, respectively, the hexanal concentrations in the headspace and the increased mass
of silica gel were quantified (using methods as described in the previous section).
Experimental results are summarised in Table 4-11.
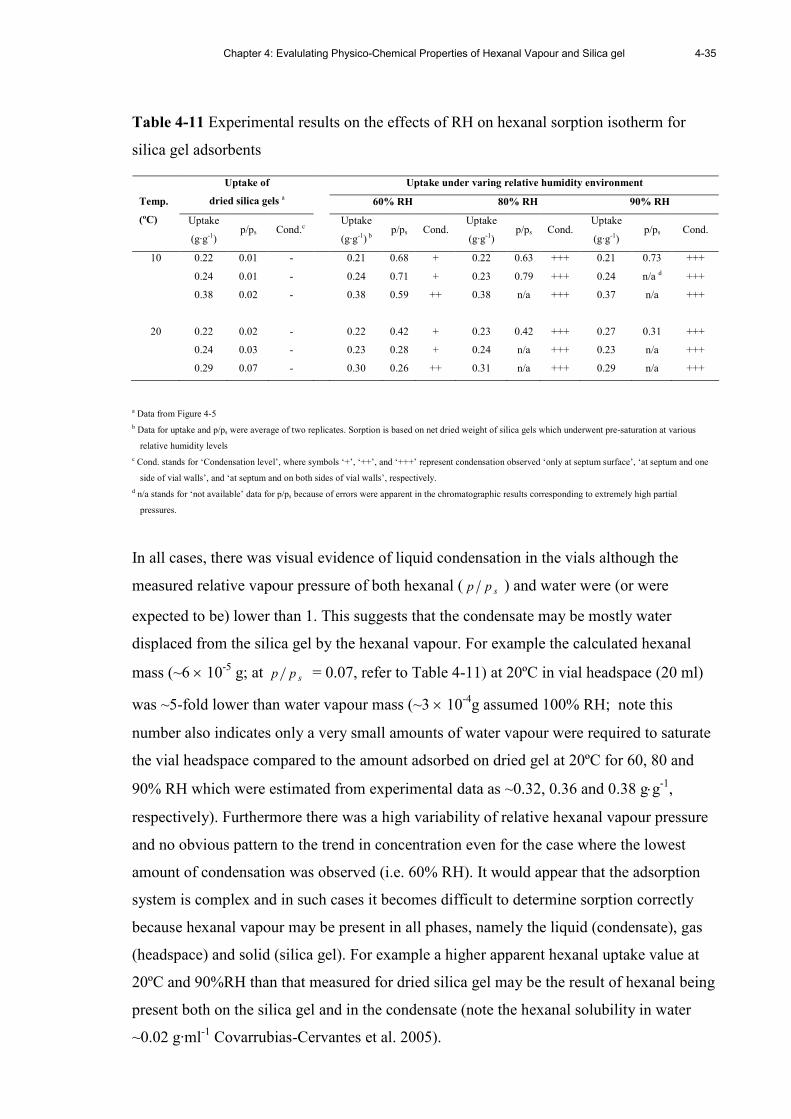
Chapter 4: Evalulating Physico-Chemical Properties of Hexanal Vapour and Silica gel
4-35
Table 4-11 Experimental results on the effects of RH on hexanal sorption isotherm for
silica gel adsorbents
Uptake under varing relative humidity environment Uptake of
dried silica gels a 60% RH 80% RH 90% RH Temp.
(ºC) Uptake
(g·g-1) p/ps Cond.c
Uptake
(g·g-1) b p/ps Cond.
Uptake
(g·g-1) p/ps Cond.
Uptake
(g·g-1) p/ps Cond.
10 0.22 0.01 - 0.21 0.68 + 0.22 0.63 +++ 0.21 0.73 +++
0.24 0.01 - 0.24 0.71 + 0.23 0.79 +++ 0.24 n/a d +++
0.38 0.02 - 0.38 0.59 ++ 0.38 n/a +++ 0.37 n/a +++
20 0.22 0.02 - 0.22 0.42 + 0.23 0.42 +++ 0.27 0.31 +++
0.24 0.03 - 0.23 0.28 + 0.24 n/a +++ 0.23 n/a +++
0.29 0.07 - 0.30 0.26 ++ 0.31 n/a +++ 0.29 n/a +++
a Data from Figure 4-5
b Data for uptake and p/ps were average of two replicates. Sorption is based on net dried weight of silica gels which underwent pre-saturation at various
relative humidity levels
c Cond. stands for ‘Condensation level’, where symbols ‘+’, ‘++’, and ‘+++’ represent condensation observed ‘only at septum surface’, ‘at septum and one
side of vial walls’, and ‘at septum and on both sides of vial walls’, respectively.
d n/a stands for ‘not available’ data for p/ps because of errors were apparent in the chromatographic results corresponding to extremely high partial
pressures.
In all cases, there was visual evidence of liquid condensation in the vials although the
measured relative vapour pressure of both hexanal ( spp ) and water were (or were
expected to be) lower than 1. This suggests that the condensate may be mostly water
displaced from the silica gel by the hexanal vapour. For example the calculated hexanal
mass (~6 × 10⁻⁵ g; at spp = 0.07, refer to Table 4-11) at 20ºC in vial headspace (20 ml)
was ~5-fold lower than water vapour mass (~3 × 10⁻⁴g assumed 100% RH; note this
number also indicates only a very small amounts of water vapour were required to saturate
the vial headspace compared to the amount adsorbed on dried gel at 20ºC for 60, 80 and
90% RH which were estimated from experimental data as ~0.32, 0.36 and 0.38 g⋅g-1,
respectively). Furthermore there was a high variability of relative hexanal vapour pressure
and no obvious pattern to the trend in concentration even for the case where the lowest
amount of condensation was observed (i.e. 60% RH). It would appear that the adsorption
system is complex and in such cases it becomes difficult to determine sorption correctly
because hexanal vapour may be present in all phases, namely the liquid (condensate), gas
(headspace) and solid (silica gel). For example a higher apparent hexanal uptake value at
20ºC and 90%RH than that measured for dried silica gel may be the result of hexanal being
present both on the silica gel and in the condensate (note the hexanal solubility in water
~0.02 g·ml-1 Covarrubias-Cervantes et al. 2005).
4-36 Mathematical Modelling of Active Packaging Systems for Horticultural Products
Zhou et al.(2006) reported complex trends in respect to influences of pre-adsorption of
water on methane sorptions for silica gel (grade 60; ~8nm pore diameter and ~316 m2·g-1
specific area) quantified using the volumetric method at 2ºC and methane partial pressure
of 0 to ~11 MPa. While methane uptakes by silica gel having intermediate water contents
(0.7 to 1.17 water ratios; the weight ratio of water to dry gel) were reportedly higher than
those by dried silica gel, especially when the partial pressure exceeded ~3 MPa, very low
sorption extents were reported among such wetted silica gels. For low and high water
contents (0.61 and 1.3 water ratios, respectively), methane uptakes by dried silica gel were
significantly higher than those of the wetted gel (for a given partial pressure). Similar
trends with regard to pre-adsorbed water were reported by Zhou et al.(2002) for methane
sorption on activated carbon adsorbents (carbonised coconut shell based) quantified under
similar experimental conditions to these mentioned above for the methane-silica gel
system. Insights or mechanisms underlying the complex isotherm characteristics reported
for methane- and silica gel and activated carbon systems have not been well developed,
however Zhou et al.(2002) and Zhou et al.(2006) postulated that these could be the results
of for example (i) partition of methane with water available on the gel (adsorbed) and/or
between adsorbent particles (free liquid), or (ii) changes of adsorbent pore structures after
exposed to water, among other mechanisms.
The general agreement of hexanal uptake values measured for both dried and humidified
silica gel (Table 4-11) could be assumed to result from small amounts of free water on the
adsorbent surface. In all samples small amounts of condensate formed on the inner surfaces
of the vial septum. It is not possible to rule out that some liquid could be picked up during
gas sampling and if so, hexanal dissolved in this condensate might significantly increase
the peak height obtained in GC measurement, thus indicating an unduly high apparent
headspace concentrations (Table 4-11). Better temperature and pressure controlled systems
may be required for further investigation of such complex systems. Possibly a quartz-
spring type microbalance could be considered for such work providing protection from
absorption by hexanal vapour could somehow be assured.
Although high relative humidity conditions are expected in MA packaging systems for
horticultural products, the utilisation of nonperforated hydrophobic polymeric films such
as OPP and LDPE as sachet materials would minimise moisture contact with the active
Chapter 4: Evalulating Physico-Chemical Properties of Hexanal Vapour and Silica gel
4-37
agent absorbent. In spite of high driving force of water vapour across the sachet (the
atmosphere around the horticultural product will approach saturation in the package
headspace while the RH will be very low in the sachet headspace), the estimated rate of
water vapour across the LDPE sachet (given the sachet surface area as 0.003 m2) is over
10-fold lower than that across LDPE film bag (given bag surface area as 0.125 m2 and RH
in bag and environment as ~95 and ~60%, respectively). In this case, water vapour
permeation across the sachet film can reasonably be presumed negligible. It should be
noted that the sizes of sachet and bag used above were later extensively used in Chapter 5
and 6. In contrast, Tyvek is highly porous material and high water vapour transmission
across the sachet may occur. Based on experimental results, while it is apparent that there
is likely to be some hexanal-water vapour interaction, these effects are unlikely to
influence hexanal uptake by silica gel. For this reason no further work on these interactions
was carried out in this work.
4.4 Summary
The permeability in polymer film and adsorption isotherms of hexanal vapour were
determined. Polymer film permeability to hexanal vapour showed a strong dependence on
hexanal vapour concentrations (at concentrations above ~0.02 mol⋅m-3) and storage
temperature. Hexanal permeability of LDPE measured in the present work (considered at
low vapour concentrations) was comparable in magnitude to the literature for hexanal and
other organic vapours and suggests that the isostatic measurement can provide reasonable
estimates of permeability.
To date, the concentration dependent permeability to hexanal vapour of films utilised in
MAP systems have not previously been reported. The findings obtained in the present
work thus contribute to knowledge of permeation of VOCs through polymer films. By
comparing results of the present work to relevant literature, it was hypothesised that
permeability to hexanal may be affected by the level of crystallinity and gT of film
polymers in addition to concentration and storage temperature. Although the effects of RH
on film permeability to certain aldehydes (including hexanal) and toluene were reported
elsewhere, mechanisms underlying such effects require further study. Permeability values
to hexanal vapour of OPP films were lowest while those of Tyvek were highest of the
films tested. Tyvek material is therefore more appropriate for active packaging systems

4-38 Mathematical Modelling of Active Packaging Systems for Horticultural Products
that require rapid transfer of the active agent between the sachet and the package
atmosphere or for CO2 and C2H4 scavenging systems. In contrast, OPP films will be more
suitable when a slow release pattern is required. The magnitude of LDPE permeability lies
between these two extremes, but is nearer to OPP.
Hexanal sorption isotherms for silica gel adsorbents show a Type I sorption pattern. The
isotherm data were fitted well by the Langmuir isotherm equation, although there was a
relatively high SE associated with estimated HxlLgmb values. The experimental variation is
considered inherent to the method, due to the rapid and large extent of hexanal adsorption
at very low vapour phase concentrations. The isotherms appear consistent with literature
data for sorption of other VOCs for silica gel, such as acetaldehyde, butryraldehyde
ethanol, and heptane. Findings obtained in the present work contribute to the limited
knowledge on equilibrium sorption data with respect to controlled release active packaging
systems.
The adsorption behaviour became complex and more difficult to measure correctly when
condensates was present when silica gel was pre-equilibrated at high RH values. However
when using nonperforated hydrophobic polymeric films such as OPP and LDPE as sachet
materials, minimal water vapour transmission into the sachet is expected. The water vapour
transfer across Tyvek in contrast may be high due to highly porous property of Tyvek.
However there was evidence of minimal effects of water vapour adsorption by silica gel on
hexanal uptake and the validity of this assumption will be further discussed in Chapter 6,
along with results of model predictions and empirical data of hexanal release in active
MAP system with LDPE, OPP and Tyvek as sachet materials.

Chapter 5: Development of Conceptual and Mathematical Models
5-1
Chapter 5
DEVELOPMENT OF CONCEPTUAL AND
MATHEMATICAL MODELS FOR ACTIVE MAP OF
HORTICULTURAL PRODUCTS
5.1 Introduction
This chapter presents a general conceptual model which can accommodate a range of
designs of active MAP systems, i.e. a model that can accommodate different active agents,
the carriers of these agents, and different packaging films, of differing physical sizes, for a
range of horticultural products. To maintain generality, the conceptual model was based on
those fundamental principles and concepts drawn from the literature review (Chapter 2)
which influence equilibrium and mass transfer behaviour in respect of these alternative
system components.
To develop the conceptual model, key mass transfer processes must be identified. Suitable
equations and assumptions can then be implemented to generate a mathematical model of
the overall system. However, modelling all of the identified processes can be a time-
consuming, difficult and (often) unnecessary task. Therefore simplifying assumptions were
sought where these could be justified based on relevant theories or literature data. It is
preferrable if this simplification is carried out using quantitative criteria, preferably based
on dimensionless numbers (e.g. the Biot number) or ratios of these. Development of such
criteria was initially conducted using relevant information reported for active packaging
systems employing, chiefly, 1-MCP (due to the extensive available information, as
discussed in Chapter 2) and other active agents such as ethanol and acetaldehyde. A full
model was then implemented for the hexanal/tomato active MAP system outlined in
Chapter 3 to demonstrate its application to a specific system.
The key objectives of the work presented in this chapter were to:
(1) Identify all physico-chemical processes and properties relevant to the design and
evaluation of active MAP systems that release the active agent into the package
headspace.
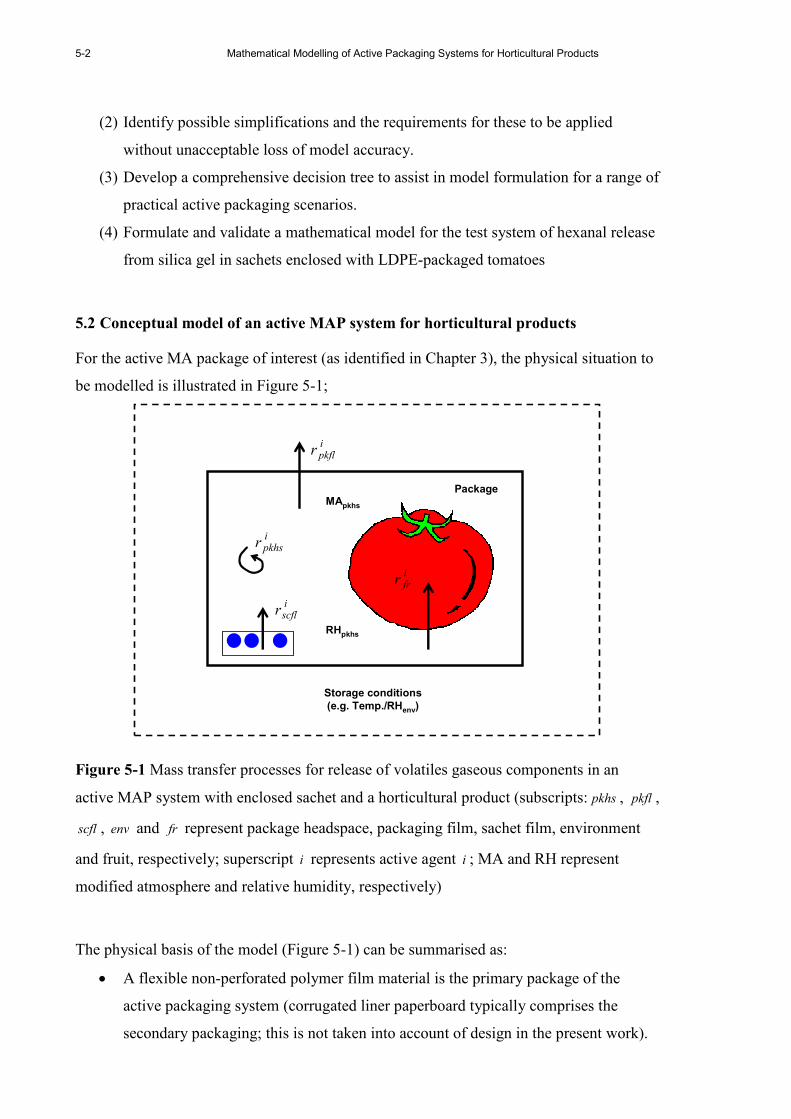
5-2 Mathematical Modelling of Active Packaging Systems for Horticultural Products
(2) Identify possible simplifications and the requirements for these to be applied
without unacceptable loss of model accuracy.
(3) Develop a comprehensive decision tree to assist in model formulation for a range of
practical active packaging scenarios.
(4) Formulate and validate a mathematical model for the test system of hexanal release
from silica gel in sachets enclosed with LDPE-packaged tomatoes
5.2 Conceptual model of an active MAP system for horticultural products
For the active MA package of interest (as identified in Chapter 3), the physical situation to
be modelled is illustrated in Figure 5-1;
ipkhsr
iscflr
ipkflr
Storage conditions
(e.g. Temp./RHenv)
Package
RHpkhs
ifrr
MApkhs
Figure 5-1 Mass transfer processes for release of volatiles gaseous components in an
active MAP system with enclosed sachet and a horticultural product (subscripts: pkhs , pkfl ,
scfl , env and fr represent package headspace, packaging film, sachet film, environment
and fruit, respectively; superscript i represents active agent i ; MA and RH represent
modified atmosphere and relative humidity, respectively)
The physical basis of the model (Figure 5-1) can be summarised as:
• A flexible non-perforated polymer film material is the primary package of the
active packaging system (corrugated liner paperboard typically comprises the
secondary packaging; this is not taken into account of design in the present work).
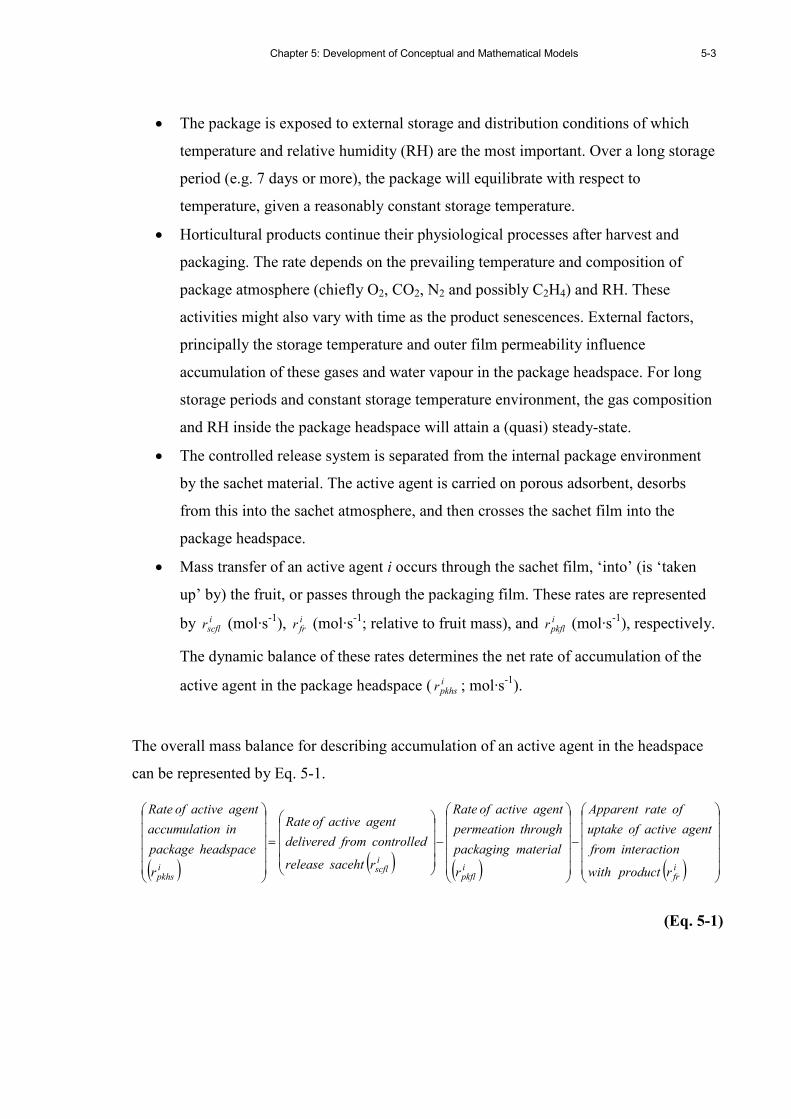
Chapter 5: Development of Conceptual and Mathematical Models
5-3
• The package is exposed to external storage and distribution conditions of which
temperature and relative humidity (RH) are the most important. Over a long storage
period (e.g. 7 days or more), the package will equilibrate with respect to
temperature, given a reasonably constant storage temperature.
• Horticultural products continue their physiological processes after harvest and
packaging. The rate depends on the prevailing temperature and composition of
package atmosphere (chiefly O2, CO2, N2 and possibly C2H4) and RH. These
activities might also vary with time as the product senescences. External factors,
principally the storage temperature and outer film permeability influence
accumulation of these gases and water vapour in the package headspace. For long
storage periods and constant storage temperature environment, the gas composition
and RH inside the package headspace will attain a (quasi) steady-state.
• The controlled release system is separated from the internal package environment
by the sachet material. The active agent is carried on porous adsorbent, desorbs
from this into the sachet atmosphere, and then crosses the sachet film into the
package headspace.
• Mass transfer of an active agent i occurs through the sachet film, ‘into’ (is ‘taken
up’ by) the fruit, or passes through the packaging film. These rates are represented
by iscflr (mol·s-1), i
frr (mol·s-1; relative to fruit mass), and i
pkflr (mol·s-1), respectively.
The dynamic balance of these rates determines the net rate of accumulation of the
active agent in the package headspace ( ipkhsr ; mol·s-1).
The overall mass balance for describing accumulation of an active agent in the headspace
can be represented by Eq. 5-1.
( ) ( ) ( ) ( )
−
−
=
ifr
ipkfl
iscfli
pkhs r product with
ninteractio from
agent active of uptake
of rate Apparent
r
material packaging
through permeation
agent active of Rate
r sacehtrelease
controlled from delivered
agent active of Rate
r
headspace package
in onaccumulati
agent active of Rate
(Eq. 5-1)
5-4 Mathematical Modelling of Active Packaging Systems for Horticultural Products
5.3 Assumptions for conceptual model development
There are two levels of assumptions made for the conceptual model: ‘primary’ and
‘secondary’. The primary assumptions are relevant to the overall characteristics of
packaging systems regardless of the nature of the mass transfer processes occurring. They
are specific to: (1) ideal gas behaviour, (2) thermal equilibrium, (3) constant package
volume, (4) one-dimensional mass transfer and (5) uniform concentrations of active agents
in package headspace. The secondary assumptions relate to the specific mass transfer
processes occurring within the packaging system. The relative importance of these
processes can be justified using either a theoretical or an empirical approach to minimise
the complexity of the subsequently developed mathematical model. The key assumptions
at both levels are discussed in the following subsections.
5.4 Primary (P) level assumptions
5.4.1 Assumption P1: The gas phase of the active packaging system can be considered
as ideal
This assumption is considered reasonable at low pressures and concentrations and is
generally adopted in modelling passive MAP for horticultural products (e.g. Yam & Lee
1995; Merts 1996; Chen et al. 2000). The ranges of effective or required concentrations of
active agents for active MAP system have generally been reported to be in the order of
parts per million (ppm; µL⋅L-1), for example 240-250 ppm (at 23ºC) for hexanal
suppression of B. cinerea growth on sliced apples (Song et al. 1996), and 1-100 ppm (at
20ºC) as an effective concentration for 1-MCP to minimise ethylene action on kiwifruit
(Kim et al. 2001). In Chapter 3, the MIC of hexanal vapour for control of B. cinerea
growth on tomatoes was determined to be 40-70 ppm. Such concentrations are very low
and it is reasonable to assume ideal gas behaviour for these compounds.
5.4.2 Assumption P2: All model compartments are in local thermal equilibrium
The assumption of thermal equilibrium is realistic for long storage and individual packages
in a constant temperature environment, however it may not be true for larger scale packs
such as pallets or containers. Because the model active packaging system developed in the
present work was a retail or individual package with a shelf life of at least 7 days, the
assumption of thermal equilibrium between the packaging environment and the packaging
Chapter 5: Development of Conceptual and Mathematical Models
5-5
system was deemed reasonable over this time frame. For situations where larger or
grouped packaging formats are utilised, the temperatures of individual packages (e.g. at the
centre of a pallet stack) can be predicted separately, e.g. by using the mathematical model
developed by Tanner (1998).
5.4.3 Assumption P3: Mass transfer of the active agent from the sachet can be
modelled in 1-dimension
This assumption was made to simplify the complexity of the mathematical model
describing mass transfer processes in the active packaging system. Several mathematical
models reported in the literature to describe cooling and drying processes (e.g. Tanner
1998; Meas 2006) were developed based on this 1-dimensional transport assumption and
were reportedly sufficient to describe the key mass transfer processes. According to
Cleland et al. (1994), to ensure 1-dimensional heat transfer, the dimension(s) for which
transport is not considered must be at least three times greater than the dimension of
interest. Pongjaruwat (2007) (Table 2-2) used sachets of 40 × 50 mm and the depth was
determined by the diameter of silica gel (1-3 mm). Sachets of comparable dimensions were
used in the present work. Given the sachet is typically only one particle layer deep, the
lengths of both sides of the sachet are substantially more than 3 times of the thickness and
1-dimensional transport of hexanal vapour from the sachet can be reasonably assumed.
5.4.4 Assumption P4: Uniform concentrations of active agents in the package
headspace
The likelihood of gaseous concentration gradients resulting from mass transfer processes is
principally identified by a quantitative comparison of external and internal resistances to
gas transfer. This is often represented by a dimensionless group known as the Biot number
( Bi ; Eq. 5-2). The assumption that the concentration is uniform within a phase is
reasonably accurate when Bi < 0.1 (Geankoplis 1993c).
D
kLBi = (Eq. 5-2)
where
Bi = Biot number for mass transfer (dimensionless)
D = Mass diffusivity (m2·s-1)
k = Surface mass transfer coefficient (m·s-1)

5-6 Mathematical Modelling of Active Packaging Systems for Horticultural Products
L = Characteristic dimension of bag (m)
The calculation of Bi numbers for selected volatile active agents contained on sachets
within a LDPE bag (e.g. as described by Charles et al. 2003) are summarised in Table 5-1.
All Bi values were substantially less than 0.1. This implies that the external resistance
(contributed by the polymer film barrier) is much larger than the diffusive resistance of
active agent(s) in the package atmosphere. A uniform concentration of active agents in the
package headspace can thus be reasonably presumed. By using a similar approach for O2,
CO2, N2 and water vapour9, Bi values for these gases were also found to be < 0.1
(calculations not shown). In practice, the assumption of uniform concentration of gaseous
compounds in the package headspace is commonly made in most MAP systems (e.g.
Emond et al. 1991; Cameron et al. 1995; Song et al. 2002; Charles et al. 2003; Charles et
al. 2005).
Table 5-1 Estimated Bi values for diffusion of certain active agents in the package
headspace
Active agents Temperature
(ºC)
D a
(m2·s-1)
k b
(m·s-1)
Bi c
1-MCP d 23 1.02 × 10⁻⁵ 5.33 × 10⁻⁷ d 7.32 × 10⁻⁴
Hexanal e 20 7.60 × 10⁻⁶ 3.90 × 10⁻⁶ e 7.19 × 10⁻³
Ethanol f 21 1.24 × 10⁻⁵ 6.88 × 10⁻⁸ f 7.77 × 10⁻⁵
Acetaldehyde f 21 1.29 × 10⁻⁵ 6.07 × 10⁻⁷ f 6.59 × 10⁻⁴
a Approximate mass diffusivity in air (package headspace) estimated using the correlation proposed by Fuller, Schettler, and Giddings
(Johnson 1999).
b Permeability to active agents of LDPE film having a thickness of 25 µm.
c The characteristic length ( L ) of a bag was ~0.015 m and identified as a ratio of volume to area (Geankoplis 1993c), where bag volume
and bag surface area were ~2 L and ~0.14 m2, respectively. These figures were estimated from those reported by Charles et al. (2003)
from the study of retail size MAP (LDPE bag) containing an oxygen absorber and tomatoes.
d Permeability reported by Lee (2003)
e Permeability reported by Song et al. (1996)
f Permeability reported by Pauly (1999)
9 Data on LDPE film permeability and mass diffusivity are presented by Pauly (1999) and Johnson (1999),
respectively.
Chapter 5: Development of Conceptual and Mathematical Models
5-7
In this work the mean hexanal vapour permeabilities for LDPE (section 4.2.2), were 4.62 ×
10-6, and 3.83 × 10⁻⁵ m·s-1 at 10 and 20ºC respectively. From these the calculated Bi values
were 9.05 × 10⁻³ and 7.06 × 10⁻², respectively. It is therefore also reasonable to assume
uniform headspace concentrations of hexanal vapour in the model active MAP systems for
tomatoes.
5.4.5 Assumption P5: Negligible contribution of active agent accumulation to changes
in package volume and total pressure
This assumption is justified considering the low effective concentrations of the active agent
required to be achieved in the package headspace, as mentioned in section 5.4.1. The
effective concentrations are significantly lower than those of other gases in the MAP
system (e.g. 2-5% CO2 and 1-10% O2 are typical), and it is reasonable to assume these low
concentrations within the package headspace will have minimal influence on the total
package volume and pressure.
Dynamic volume changes of MA packages made from the flexible polymer films are
nevertheless observed (e.g. Merts 1996; Talasila & Cameron 1997). These occur chiefly as
a result of respiration and gaseous permeation through the sealed polymer package. For
example in cases where the oxygen consumption is not balanced by mass transfer through
the packaging film, a positive N2 concentration gradient can be created resulting in N2
permeation out of the package. The net flux of gases could then cause a reduction of the
package volume until (i) the system reaches the steady-state (Mannapperuma et al. 1989;
Talasila & Cameron 1997), or (ii) no further reduction in volume is possible due to the
physical constraint provided by the packaged product (Merts 1996).
The alternative to modelling volume change is to assume a constant volume during the
storage period (e.g. Lee et al. 1991; Charles et al. 2003). Model predictions based on
constant package volume were reported to agree well with experimentally collected data,
in particular once the steady-state condition developed in the package headspace. In these
cases, the package volumes commonly reported in the literature were those measured by
either water displacement (Charles et al. 2003; Moyls 2004) or by dilution of a known inert
gas such as ethane (Lee et al. 1991). These measurements were usually conducted at the
5-8 Mathematical Modelling of Active Packaging Systems for Horticultural Products
end of the experimental period or after the attainment of the steady-state conditions. In
addition, time independence of density (i.e. for determining fruit volume) and rates of
physiological activities (e.g. respiration rate, and transpiration rate) of packaged
horticultural products are commonly assumed during storage period. For MAP for
tomatoes (e.g. Cameron et al. 1989; Tanner 1998; Charles et al. 2003), a similar
assumption has been made to simplify modelling O2 consumption by the fruit and this
simplification was reported as reasonable.
In the present work, the concentration of active agent in the package headspace is the
major focus as these are to be controlled within the MIC range to achieve the desired
quality outcomes. Assuming a constant package volume is therefore the most conservative
approach in achieving the effective level of the active agent, as any decrease in total
volume would most likely increase the actual concentration of the volatile agent. Note,
density of ‘Royale’ tomatoes was also assumed constant during the storage period (i.e. 7-
14 days) and appear reasonable given the low mass loss expected and measured (e.g. <
0.60% mass loss as reported in section 3.2.2).
5.5 Secondary level assumptions
Referring to Figure 5-1, the net accumulation of active agent in the package headspace
depends on the relative contributions of the identified individual mass transfer rates. The
key mass transfer mechanisms and how they are modelled in order to predict the package
headspace depends on the nature of each of the active agent, packaging material(s) and
product. For example, mass transfer across the sachet film material ( iscflr ) can be modelled
by assuming either steady-state mass transfer (based on Fick’s first law), where the
dynamics and capacity of uptake by the film itself are neglected, or the dynamic approach
(based on Fick’s second law) where the concentration of active agent in the film changes
with both time and position. The former approach is appropriate for transport of active
agents which have low affinities with the film, while the latter might be suitable for
compounds which interact with the film material. From an understanding of the various
modelling options and their significance, opportunities and constraints for simplifying the
mathematical models can be identified. Some of the more important aspects are discussed
in the following sections.
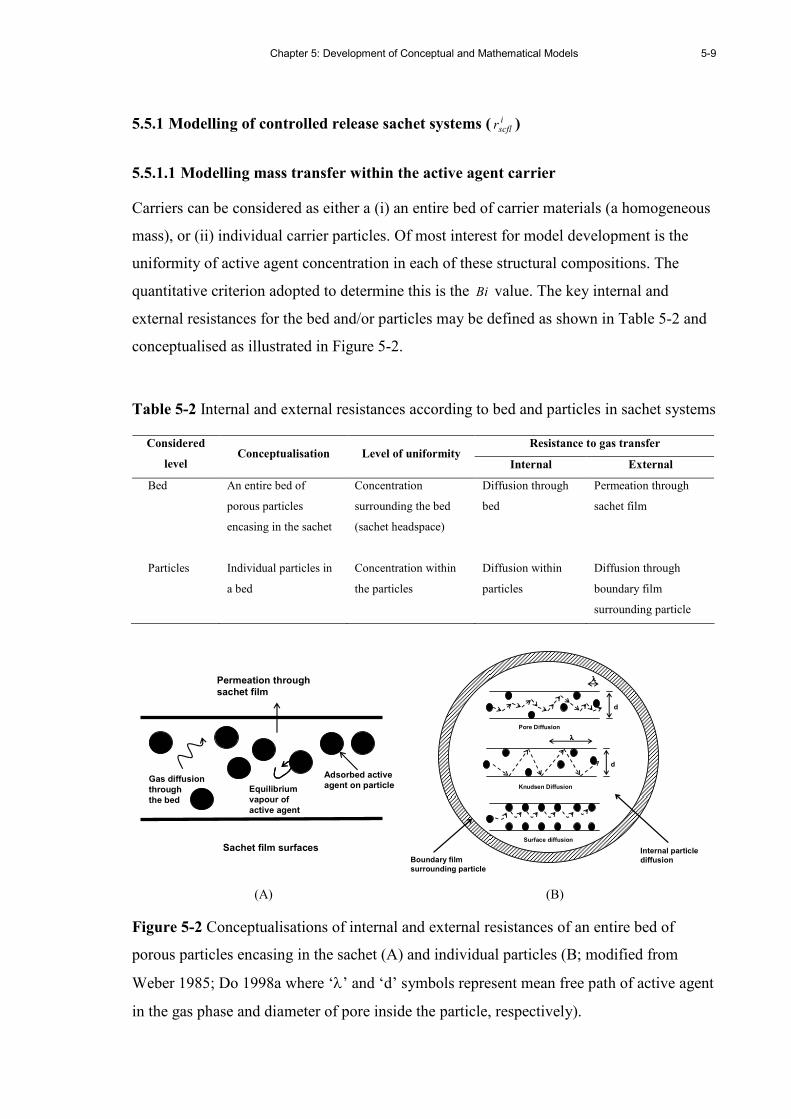
Chapter 5: Development of Conceptual and Mathematical Models
5-9
5.5.1 Modelling of controlled release sachet systems ( iscflr )
5.5.1.1 Modelling mass transfer within the active agent carrier
Carriers can be considered as either a (i) an entire bed of carrier materials (a homogeneous
mass), or (ii) individual carrier particles. Of most interest for model development is the
uniformity of active agent concentration in each of these structural compositions. The
quantitative criterion adopted to determine this is the Bi value. The key internal and
external resistances for the bed and/or particles may be defined as shown in Table 5-2 and
conceptualised as illustrated in Figure 5-2.
Table 5-2 Internal and external resistances according to bed and particles in sachet systems
Resistance to gas transfer Considered
level Conceptualisation Level of uniformity
Internal External
Bed An entire bed of
porous particles
encasing in the sachet
Concentration
surrounding the bed
(sachet headspace)
Diffusion through
bed
Permeation through
sachet film
Particles Individual particles in
a bed
Concentration within
the particles
Diffusion within
particles
Diffusion through
boundary film
surrounding particle
Permeation through
sachet film
Sachet film surfaces
Adsorbed active
agent on particleEquilibrium
vapour of
active agent
Gas diffusion
through
the bed
λλλλ
d
λλλλ
d
Pore Diffusion
Knudsen Diffusion
Surface diffusion
Boundary film
surrounding particle
Internal particle
diffusion
(A) (B)
Figure 5-2 Conceptualisations of internal and external resistances of an entire bed of
porous particles encasing in the sachet (A) and individual particles (B; modified from
Weber 1985; Do 1998a where ‘λ’ and ‘d’ symbols represent mean free path of active agent
in the gas phase and diameter of pore inside the particle, respectively).

5-10 Mathematical Modelling of Active Packaging Systems for Horticultural Products
Case 1: Bi value of carrier bed ( ibedBi ) <<<< 0.1
According to Geankoplis (1993c), at low Biot numbers, the rate of diffusion within the bed
is high in comparison with transport through the film. In this case it can reasonably be
assumed that the active agent concentration in the bed is uniform and concentration
gradients occurring through the bed or within the particles are negligible. Also, only the
equilibrium relationship between the active agent and solid adsorbent are required and this
can be described by sorption isotherms.
Case 2: ibedBi >>>> 0.1, but i
ptclBi <<<< 0.1
For ibedBi values > 0.1 the concentration gradient within the bed becomes significant and
has to be taken into account in modelling the release of the active agent from the sachet. In
addition, there could be significant concentration gradients within each particle due to
intraparticle diffusion mass transfer that may have to be quantified through the Bi values
for the particles ( iptclBi ). For i
ptclBi < 0.1, the concentration gradient within the particles can
reasonably be assumed to be negligible (Geankoplis 1993c) and only that across the bed is
therefore significant.
The modes of diffusion through the bed (Figure 5-3) may be classified into two groups
(Bronlund 1997), including: (i) particulate surface diffusion, which can occur where a thin
film (free liquid) of saturated active agent is available on the carriers or (ii) gas phase
diffusion. The latter occurs when there is minimal free liquid and the active agent diffuses
across the bed through voids available between particles. Equilibrium between the
diffusant (active agent) and solid is assumed to occur instantaneously at the surface of the
solid (following McCabe et al. 2001).
A B
Figure 5-3 Conceptualisation of diffusional modes within the bed (given negligible
concentration gradient within particles): Particle surface diffusion, where the magenta
rings represent thin films through which diffusion occur (A), and gas phase diffusion
within voids available between particle (B).

Chapter 5: Development of Conceptual and Mathematical Models
5-11
Case 3: Both values of ibedBi and i
ptclBi >>>> 0.1
In this situation the concentration gradients across the bed and within the particles are
significant. Diffusional modes across the bed could be those discussed in the previous
subsection. For the individual particles, intraparticular diffusion must be modelled and this
may occur by pore, surface, Knudsen or mixed diffusional modes (Figure 5-2 and as
discussed in section 2.5.1.1). Following Do (1998a), equilibrium conditions within the
particle are commonly assumed to occur instantaneously and all phases within the particles
are in local equilibrium with the adsorbates.
Identification of ibedBi and i
ptclBi for hexanal vapour in controlled release sachets
Calculations of ibedBi for controlled release sachets were made for LDPE, OPP and Tyvek
films for which the permeability data were the average values of those quantified in section
4.2.2; a summary of the ibedBi calculations is shown in Appendix F.1 (Table F-1). The
estimated ibedBi values of LDPE and OPP sachet systems are very much lower than 0.1 at
both 10 and 20ºC (with magnitudes of 10-2 to 10-4). However the values of Tyvek system
were ~0.2 and 0.5 at 10 and 20ºC, respectively (Table F-1). The assumption of uniform
concentration in sachet headspace (or throughout the bed) may be valid only in LDPE and
OPP systems. For the Tyvek sachet, the concentration gradient across the bed may
become significant. Because the estimates of ibedBi values (for all films) were based on the
average permeability values, the very high permeability values at high concentrations (such
as the Tyvek permeability at 20ºC of ~2.25 × 10⁻¹⁰ pmol·m·m-2·s-1·Pa-1 at ~0.22 mol·m-3)
were taken into account. In practice, such high concentrations should only occur in the
headspace of the sachet prior to it being exposed to the package headspace (t ≤ 0) (further
discussed in Chapter 6). During storage of product following the initial period (~24 h), it
can be reasonably assumed that hexanal vapour concentration in the sachet headspace will
be much lower, hence the permeability value and ibedBi will be lower (and i
bedBi << 0.1), so
the assumption of uniform hexanal concentration is then expected to be valid.
5.5.1.2 Modelling mass transfer across the sachet film material
Most active agents are organic vapours and these could potentially interact or have strong
affinities with packaging components, particularly nonpolar polymer films such as LDPE
5-12 Mathematical Modelling of Active Packaging Systems for Horticultural Products
and OPP. In this situation unsteady-state models (Fick’s second law) might be the most
practical approach to describe mass transfer because concentrations of diffusant are then
dependent on both time and position within the film (Robertson 1993c; Beu 2000; Piringer
2000).
As the sachet film separates the carrier bed and the package headspace, it is possible to
compare relative rates of concentration change in the film with those of the headspace and
carrier bed. If the rate of change within the film is much faster than that in the other
components, the sachet film is likely to be at equilibrium with the active agent and a
steady-state concentration gradient across the film should be expected. Fick’s first law can
then be employed.
To select between these scenarios, a quantitative criterion for comparing magnitudes of
rates of concentration changes in the carrier bed, sachet film and package headspace is
required. This can be achieved through scaling analysis. Scaling analysis involves
formulating dimensionless differential equations describing the rates of change of two or
more parameters of interest and then identifying dimensionless parameters that can be used
to compare them. Following Krantz (2007) (page 153-158), Eq. 5-3 and Eq. 5-4 were
developed to allow comparison of the rates of change of concentration in the sachet film,
the packaging headspace and the sachet interior (the derivations are shown in Appendix
F.2.1). These equations were developed for a system where the adsorption isotherm for the
vapour-carrier system is linear and the sachet releases adsorbent through a film into a
package headspace. While the adsorption isotherm behaviour may be more complex than
this scenario in potential systems of interest (as in the hexanal-silica gel system) it does
serve as a useful approximation to be used for assessing the importance of sachet film
adsorption rates.
−⋅=
i
scflL,scfl
i
0,scfl
i
0,scfl
pkgscfli
scflscfl
bedi
bed
bed
scfl
CC
C
RTASL
MK
r
r
(Eq. 5-3)
−⋅=
i
scflL,scfl
i0,scfl
i0,scfl
pkgscfliscflscfl
pkg
pkhs
scfl
CC
C
RTASL
V
r
r (Eq. 5-4)
Chapter 5: Development of Conceptual and Mathematical Models
5-13
where
scflr = Rate of changes of active agent concentration in the sachet film
(dimensionless)
bedr = Rate of changes of active agent concentration in carrier bed
(dimensionless)
pkhsr = Rate of changes of active agent concentration in package headspace
(dimensionless)
scflL = Sachet film material thickness (m)
iscflS = Sachet film solubility to active agent i (mol·m-3·Pa-1)
scflA = Sachet film surface area (m2)
ibedK = Coefficient of the linear desorption isotherm of active agent i for the
carrier (adsorbent) bed (m3⋅g-1)
bedM = Mass of the carrier bed (free of the mass of active agent i) (g)
i0,scflC = Concentration of active agent i in sachet film at x = 0, facing the carrier
bed (mol⋅m-3)
i
scflL,scflC = Concentration of active agent i in the sachet film at x = scflL , facing the
package headspace (mol⋅m-3)
pkgV = Volume of package (m3)
pkgT = Temperature of package (K)
On the right hand side (RHS) of Eq. 5-3 and Eq. 5-4 there are two terms. The first term of
both equations represents the ‘relative system capacity’ of the carrier bed and package
headspace, respectively, with respect to that of the sachet film. The second term in the
equations is essentially the dimensionless initial driving force between the two surfaces of
the sachet film and will vary from 0 to 1. At the onset of the release of active agent from
the sachet to the package headspace, the driving force ratio can reasonably be assumed to
be unity because the active agent should initially be absent from the package atmosphere.
The relative rate of change is subsequently dependent on the relative system capacity (Eq.
5-3 and Eq. 5-4). For future reference, the first term of Eq. 5-3 and Eq. 5-4 are referred as
the ratio of carrier bed capacity to sachet film capacity (denoted as scflbedCR ) and the ratio
of package headspace capacity to that of the sachet film (denoted as scflpkhsCR ),

5-14 Mathematical Modelling of Active Packaging Systems for Horticultural Products
respectively. If these ratios are large then it means that the rate of change in the sachet film
is fast compared with the rate of change in the bed or package headspace. It would
normally be expected that scflbedCR should have a large magnitude because the capacity of
adsorbents to retain active agents is expected to be much higher than that of the thin film.
Data chiefly based on physico-chemical properties of 1-MCP reported by Lee (2003) was
used to illustrate the application of scaling analysis. The reasons for this are two-fold:
firstly, the development of an active package to release 1-MCP for suppressing ethylene
action of tomatoes is an important milestone in the development of active packaging
systems (Utto et al. 2005; Nanthachai et al. 2007). Secondly, and most importantly,
because 1-MCP does not interact with common polymer films (e.g. LDPE) and the steady-
state approach is commonly used for modelling mass transfer across the films (Lee 2003),
it is valuable to explore when the unsteady-state modelling approach should be
implemented by increasing the LDPE film affinity with 1-MCP.
For the 1-MCP and LDPE sachet system (Lee 2003) (Table 5-3), scflbedCR is ~1900 and
scflpkhsCR ~1500. This suggests that the rates of change in the sachet film are much higher
than those in both the carrier bed and package headspace and steady-state mass transfer in
the sachet film can reasonably be assumed.
Table 5-3 Input data of 1-MCP active packaging system (at 23°C; following Lee 2003) for
illustrating scaling analyses
Input data Units Values
scflL a m 25 × 10-6
MCPscflS a mol⋅m-3⋅Pa-1 0.0043
MCPbedK a m3⋅g-1 0.0015
scflA b m2 0.003
pkhsV b m3 0.0012
bedM b g 1
a Reported by Lee (2003) where LDPE as the sachet film material and silica gel as 1-MCP carrier
b Arbitrarily chosen. These values were in the range of the retail package size, and these were used extensively in mathematical simulations and physical
model development (see Chapter 6)

Chapter 5: Development of Conceptual and Mathematical Models
5-15
where
MCPscflS = Sachet film solubility to1-MCP as reported by Lee (2003) (mol·m-3·Pa-1)
MCPbedK = Coefficient of linear sorption isotherm of 1-MCP for silica gel as
reported by Lee (2003) (m3⋅g-1)
However when the capacities of the film and other system components become
comparable, the assumption of steady-state mass transfer may not be valid and that of
dynamic mass transfer (unsteady-state) may become significant. To illustrate this,
simulations were performed to demonstrate the influences of 1-MCP transport across the
LDPE sachet film, either (i) steady-state (Fick’s first law) or (ii) dynamic (Fick’s second
law), on accumulation of 1-MCP within a completely sealed package headspace (i.e. for a
film acting as a barrier to 1-MCP, such as a foil bag). The two modelling approaches
employ ordinary differential equations (ODEs) and partial differential equations (PDEs),
respectively. Derivation of the mathematical models is provided in Appendix F.3.1.
When the PDE modelling approach is implemented, the initial and boundary conditions
must be also justified. Prior to the release of the active agent, the sachet and packaging
films may be assumed free of active agent ( 0CC MCPpkfl
MCPscfl == ; where MCP
scflC and MCPpkflC =
concentration of 1-MCP in the sachet film and packaging film, respectively). However this
assumption requires further consideration for the sachet film material. The assumption
0CMCPscfl = is probably only valid when the sachet is freshly made, i.e. if the sachet is first
formed, filled with the carrier pre-saturated with the active agent, and then immediately
sealed and placed into the outer bags. However if the sachet is pre-made and stored for
sometime prior to being added to the package, the sachet film material should be assumed
to be in equilibrium with the sachet headspace concentration of the active agent. In the
latter case, a barrier to the release of the active agent (e.g. in the form of multilayer films or
a surface coating) must be employed to prevent depletion of the active ingredient from the
sachet (see Rooney 1995a).
The 1st kind of boundary condition was used for the PDE model where the surface
concentration was assumed to be in equilibrium with the concentration of active agent
surrounding the film. Concentrations were specified for (i) the gas phase surrounding the
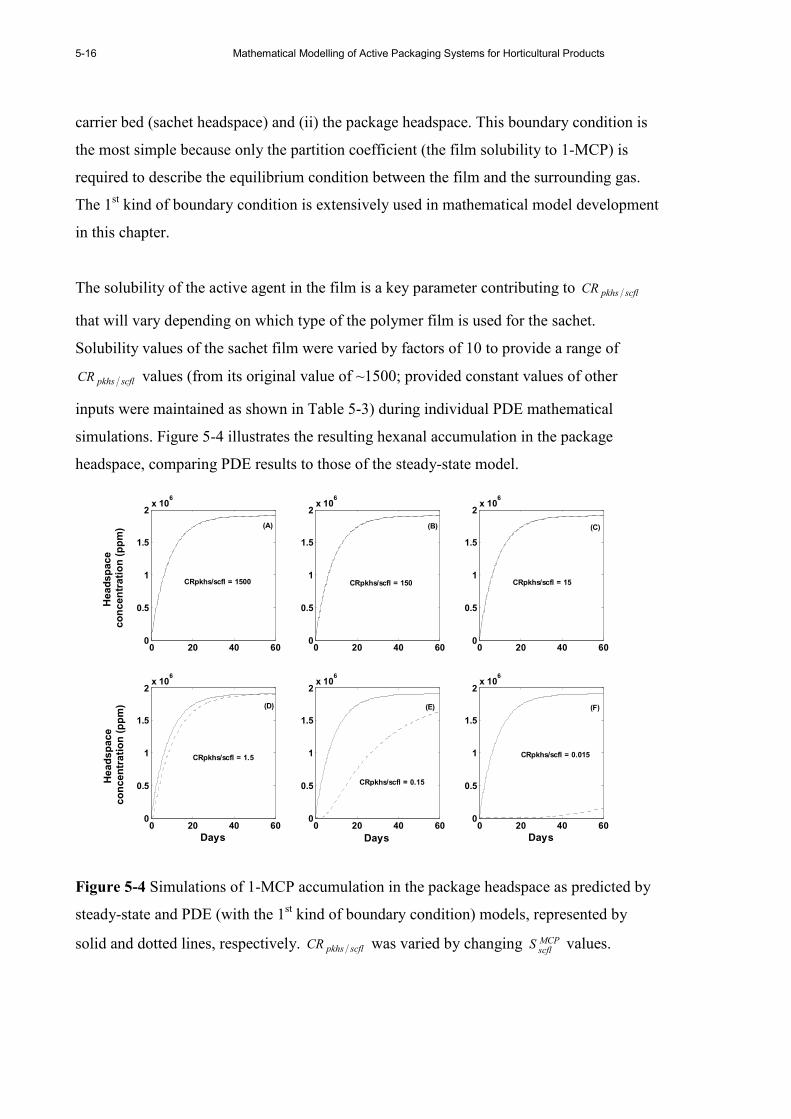
5-16 Mathematical Modelling of Active Packaging Systems for Horticultural Products
carrier bed (sachet headspace) and (ii) the package headspace. This boundary condition is
the most simple because only the partition coefficient (the film solubility to 1-MCP) is
required to describe the equilibrium condition between the film and the surrounding gas.
The 1st kind of boundary condition is extensively used in mathematical model development
in this chapter.
The solubility of the active agent in the film is a key parameter contributing to scflpkhsCR
that will vary depending on which type of the polymer film is used for the sachet.
Solubility values of the sachet film were varied by factors of 10 to provide a range of
scflpkhsCR values (from its original value of ~1500; provided constant values of other
inputs were maintained as shown in Table 5-3) during individual PDE mathematical
simulations. Figure 5-4 illustrates the resulting hexanal accumulation in the package
headspace, comparing PDE results to those of the steady-state model.
0 20 40 600
0.5
1
1.5
2x 10
6
Headspace
concentration (ppm)
0 20 40 600
0.5
1
1.5
2x 10
6
0 20 40 600
0.5
1
1.5
2x 10
6
0 20 40 600
0.5
1
1.5
2x 10
6
Days
Headspace
concentration (ppm)
0 20 40 600
0.5
1
1.5
2x 10
6
Days
0 20 40 600
0.5
1
1.5
2x 10
6
Days
CRpkhs/scfl = 1500 CRpkhs/scfl = 150 CRpkhs/scfl = 15
CRpkhs/scfl = 1.5
CRpkhs/scfl = 0.15
CRpkhs/scfl = 0.015
(A) (B) (C)
(D) (E) (F)
Figure 5-4 Simulations of 1-MCP accumulation in the package headspace as predicted by
steady-state and PDE (with the 1st kind of boundary condition) models, represented by
solid and dotted lines, respectively. scflpkhsCR was varied by changing MCPscfl
S values.
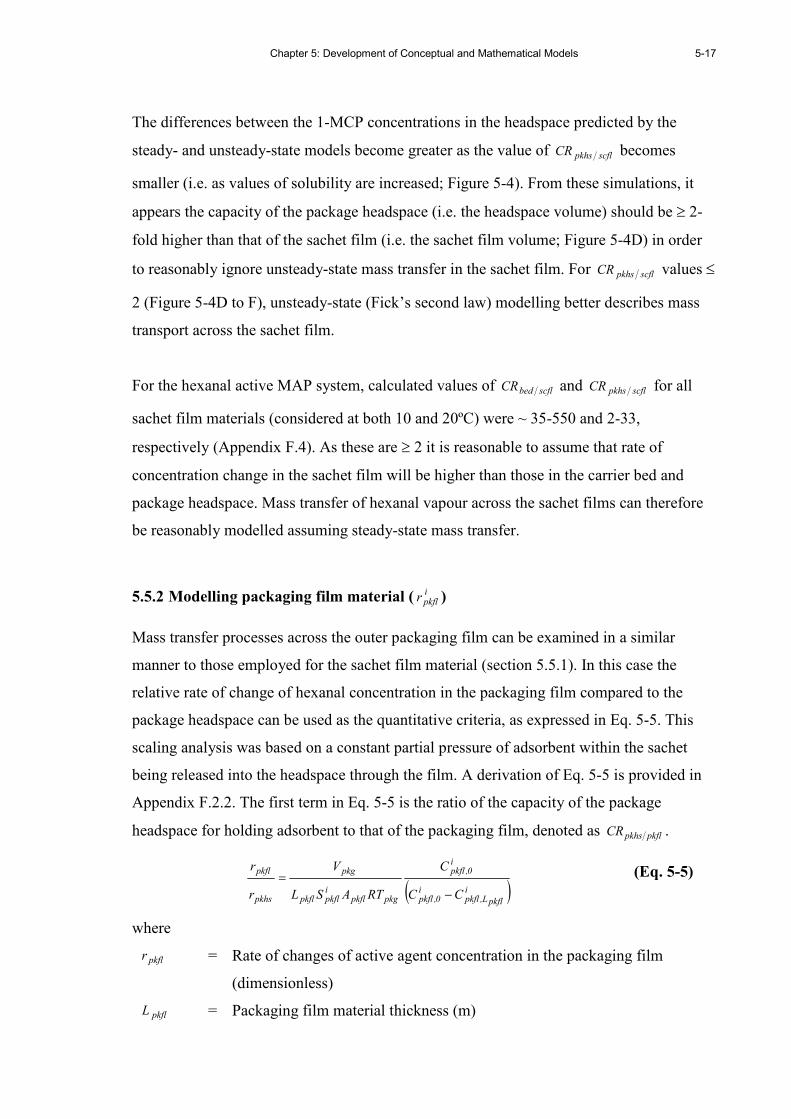
Chapter 5: Development of Conceptual and Mathematical Models
5-17
The differences between the 1-MCP concentrations in the headspace predicted by the
steady- and unsteady-state models become greater as the value of scflpkhsCR becomes
smaller (i.e. as values of solubility are increased; Figure 5-4). From these simulations, it
appears the capacity of the package headspace (i.e. the headspace volume) should be ≥ 2-
fold higher than that of the sachet film (i.e. the sachet film volume; Figure 5-4D) in order
to reasonably ignore unsteady-state mass transfer in the sachet film. For scflpkhsCR values ≤
2 (Figure 5-4D to F), unsteady-state (Fick’s second law) modelling better describes mass
transport across the sachet film.
For the hexanal active MAP system, calculated values of scflbedCR and scflpkhsCR for all
sachet film materials (considered at both 10 and 20ºC) were ~ 35-550 and 2-33,
respectively (Appendix F.4). As these are ≥ 2 it is reasonable to assume that rate of
concentration change in the sachet film will be higher than those in the carrier bed and
package headspace. Mass transfer of hexanal vapour across the sachet films can therefore
be reasonably modelled assuming steady-state mass transfer.
5.5.2 Modelling packaging film material ( ipkflr )
Mass transfer processes across the outer packaging film can be examined in a similar
manner to those employed for the sachet film material (section 5.5.1). In this case the
relative rate of change of hexanal concentration in the packaging film compared to the
package headspace can be used as the quantitative criteria, as expressed in Eq. 5-5. This
scaling analysis was based on a constant partial pressure of adsorbent within the sachet
being released into the headspace through the film. A derivation of Eq. 5-5 is provided in
Appendix F.2.2. The first term in Eq. 5-5 is the ratio of the capacity of the package
headspace for holding adsorbent to that of the packaging film, denoted as pkflpkhsCR .
( )i
pkflL,pkfli
0,pkfl
i0,pkfl
pkgpkflipkflpkfl
pkg
pkhs
pkfl
CC
C
RTASL
V
r
r
−= (Eq. 5-5)
where
pkflr = Rate of changes of active agent concentration in the packaging film
(dimensionless)
pkflL = Packaging film material thickness (m)

5-18 Mathematical Modelling of Active Packaging Systems for Horticultural Products
ipkflS = Packaging film solubility to active agent i (mol⋅m-3⋅Pa-1)
pkflA = Packaging film surface area (m2)
i0,pkflC = Concentration of active agent i in the film at x = 0, facing the package
headspace (mol⋅m-3)
i
pkflL,pkflC
= Concentration of active agent i in the film at x = pkflL , facing the
surrounding environment (mol⋅m-3)
Given pkflA = 0.125 m2 and other parameters in Eq. 5-5 as given in Table 5-3, pkflpkhsCR for
the 1-MCP system is ~36, suggesting that the rate of adsorption by the packaging film is
fast compared with the changes within the package headspace. As before a steady-state
model for the loss of 1-MCP from the package headspace is appropriate. To demonstrate
this, mathematical simulations of a PDE-based model to calculate the transients in the
packaging film (with the 1st kind of boundary condition) were compared with values from
a steady-state simulation of 1-MCP loss through the packaging film in terms of their effect
on package headspace concentration (Appendix F.3.2). The 1-MCP solubility was again
varied by factors of 10 to vary pkflpkhsCR from its initial value ~36 for each consecutive
simulation. Figure 5-5 illustrates the simulation results.
It was evident that the deviation in 1-MCP concentration between the models becomes
greater as the value of pkflpkhsCR becomes smaller due to increases in the film solubility.
From the simulation results, the value of pkflpkhsCR should be ≥ 1 (Figure 5-5C) in order to
reasonably neglect unsteady-state mass transfer in the packaging film.

Chapter 5: Development of Conceptual and Mathematical Models
5-19
0 5 10 150
1
2
3
4
5x 10
4
Headspace
concentration (ppm)
0 5 10 150
1
2
3
4
5x 10
4
0 5 10 150
1
2
3
4
5x 10
4
0 5 10 150
1
2
3
4
5x 10
4
Days
Headspace
concentration (ppm)
0 5 10 150
1
2
3
4
5x 10
4
Days
0 5 10 150
1
2
3
4
5x 10
4
Days
CRpkhs/pkfl = 36 CRpkhs/pkfl = 3.6 CRpkhs/pkfl = 0.36
CRpkhs/pkfl = 0.036 CRpkhs/pkfl = 0.0036 CRpkhs/pkfl = 0.00036
(A) (B) (C)
(D) (E) (F)
Figure 5-5 Simulations of 1-MCP accumulation in the package headspace as predicted by
steady-state and PDE (with the 1st kind of boundary condition) models, represented by
solid and dotted lines, respectively. pkflpkhsCR was varied by changing MCPpkflS values.
A range of organic compounds, such as aldehydes and esters, have been applied in active
packaging systems (see Chapter 2) and these are documented to have high solubility or
affinity with common packaging films such as LDPE (Piringer 2000; Dury-Brun et al.
2007). Therefore, approaches utilised for modelling the mass transfer across the packaging
film of the active agents must be carefully justified and the scaling quantitative criteria can
be implemented for this purpose.
For a hexanal-based active MAP system, calculated values of pkflpkhsCR for LDPE sachet
film materials at both 10 and 20ºC are 0.31 and 0.17, respectively (as shown in Appendix
F.4). As these are less than 1 (Figure 5-5C), this suggests hexanal concentration changes in
the packaging film are likely to be slower than those in the package headspace and
therefore a PDE modelling approach is more appropriate for describing hexanal mass
transport across the packaging film.

5-20 Mathematical Modelling of Active Packaging Systems for Horticultural Products
5.5.3 Modelling the active agent interaction with the product ( ifrr )
From Chapter 2, the generic approaches for modelling interactions between the active
agent and the packaged horticultural product are (i) adsorption by and diffusion within the
product and/or (ii) removal by reaction. Diffusion was modelled as the uptake of the active
agent from the surrounding environment into the product and its transfer by diffusion,
possibly to active sites where a reaction occurred. Modes of diffusion can be either steady-
or unsteady-state. The choice between these could be justified by the apparent Bi value
(designated as ifrBi ) to identify the likelihood of significant concentration gradients within
the internal product according to the relative external and internal resistances, represented
by the skin permeance to the active agent and mass diffusivity of the active agent in the
flesh of fruit, respectively (as discussed in section 2.7).
When ifrBi < 0.1, the steady-state mass transfer model can be reasonably used to describe
diffusion of the active agent. Whilst the steady-state diffusion model is reported to describe
gas exchange and, in particular, the respiration rate (Solomos 1987; Ben-Yehoshua &
Cameron 1989; Merts 1996), its application to active packaging systems is limited. The
generic equation for this approach is shown in Eq. 5-6 for the example of O2 consumption
by respiration. The respiration rate can be modelled using several approaches, either
theoretical or empirical as documented by Fonseca et al. (2002a) and Hertog et al. (1998),
among others and this is later discussed in section 5.7.4.
−= 2222 O
int,fr
O
ext,frfr
O
fr
O
frCCAkN (Eq. 5-6)
where
2O
frN = Steady-state rate of transfer of gas O2 across fruit skin (mol·s
-1)
2O
frk = Fruit skin permeance to gas O2 (m·s
-1)
frA = Fruit surface area (m2)
2O
ext,frC , 2O
int,frC = Concentration of gas O2 in external and internal fruit, respectively
(mol·m-3)
When ifrBi > 0.1, the unsteady-state model should be used to describe diffusion within the
fruit. Haros et al. (2005) modelled diffusion of sulphur dioxide (SO2) in dent corn during
steeping using an unsteady-state modelling approach in which the interaction between SO2
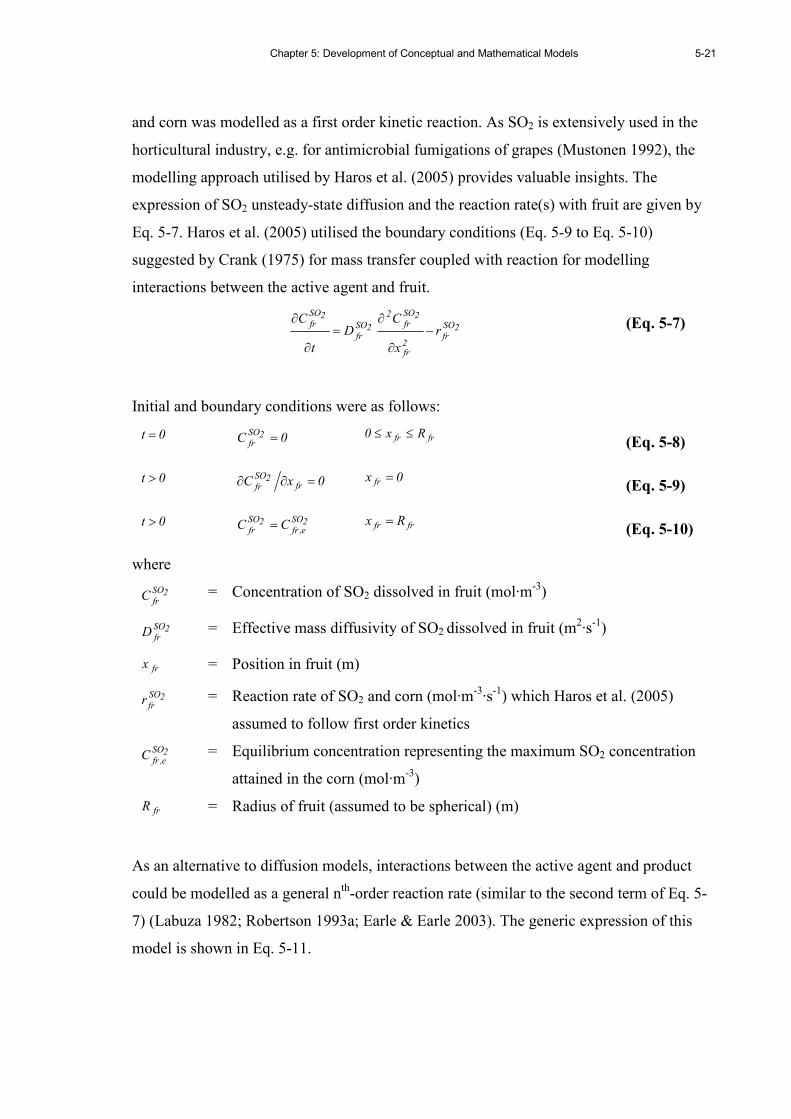
Chapter 5: Development of Conceptual and Mathematical Models
5-21
and corn was modelled as a first order kinetic reaction. As SO2 is extensively used in the
horticultural industry, e.g. for antimicrobial fumigations of grapes (Mustonen 1992), the
modelling approach utilised by Haros et al. (2005) provides valuable insights. The
expression of SO2 unsteady-state diffusion and the reaction rate(s) with fruit are given by
Eq. 5-7. Haros et al. (2005) utilised the boundary conditions (Eq. 5-9 to Eq. 5-10)
suggested by Crank (1975) for mass transfer coupled with reaction for modelling
interactions between the active agent and fruit.
2SO
fr2fr
2SO
fr2
2SO
fr
2SO
frr
x
CD
t
C−
∂
∂=
∂
∂ (Eq. 5-7)
Initial and boundary conditions were as follows:
0t = 0C 2SO
fr= frfr Rx0 ≤≤
(Eq. 5-8)
0t > 0xC fr2SO
fr=∂∂ 0x fr = (Eq. 5-9)
0t > 2SO
e,fr2SO
frCC = frfr Rx =
(Eq. 5-10)
where
2SO
frC = Concentration of SO2 dissolved in fruit (mol·m
-3)
2SO
frD = Effective mass diffusivity of SO2 dissolved in fruit (m
2·s-1)
frx = Position in fruit (m)
2SO
frr = Reaction rate of SO2 and corn (mol·m
-3·s-1) which Haros et al. (2005)
assumed to follow first order kinetics
2SO
e,frC
= Equilibrium concentration representing the maximum SO2 concentration
attained in the corn (mol·m-3)
frR = Radius of fruit (assumed to be spherical) (m)
As an alternative to diffusion models, interactions between the active agent and product
could be modelled as a general nth-order reaction rate (similar to the second term of Eq. 5-
7) (Labuza 1982; Robertson 1993a; Earle & Earle 2003). The generic expression of this
model is shown in Eq. 5-11.
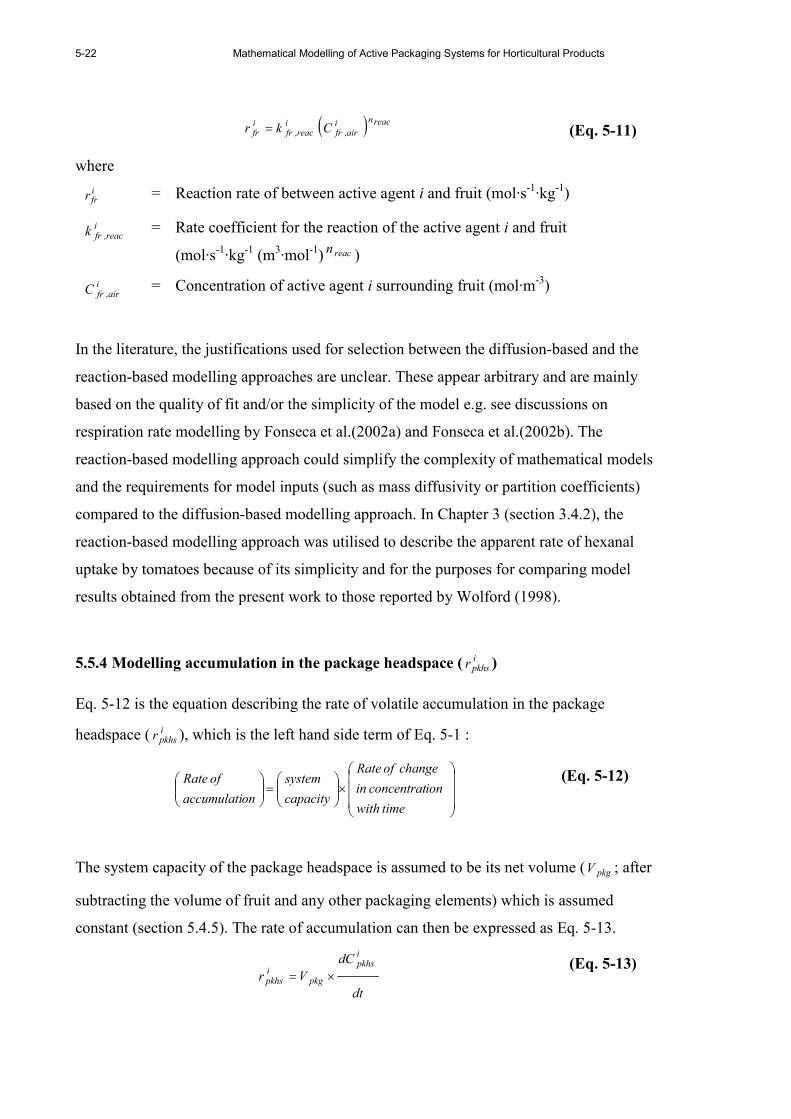
5-22 Mathematical Modelling of Active Packaging Systems for Horticultural Products
( ) reacniair,fr
ireac,fr
ifr Ckr = (Eq. 5-11)
where
ifrr = Reaction rate of between active agent i and fruit (mol·s-1·kg-1)
ireac,frk = Rate coefficient for the reaction of the active agent i and fruit
(mol·s-1·kg-1 (m3·mol-1) reacn )
iair,frC = Concentration of active agent i surrounding fruit (mol·m-3)
In the literature, the justifications used for selection between the diffusion-based and the
reaction-based modelling approaches are unclear. These appear arbitrary and are mainly
based on the quality of fit and/or the simplicity of the model e.g. see discussions on
respiration rate modelling by Fonseca et al.(2002a) and Fonseca et al.(2002b). The
reaction-based modelling approach could simplify the complexity of mathematical models
and the requirements for model inputs (such as mass diffusivity or partition coefficients)
compared to the diffusion-based modelling approach. In Chapter 3 (section 3.4.2), the
reaction-based modelling approach was utilised to describe the apparent rate of hexanal
uptake by tomatoes because of its simplicity and for the purposes for comparing model
results obtained from the present work to those reported by Wolford (1998).
5.5.4 Modelling accumulation in the package headspace ( ipkhsr )
Eq. 5-12 is the equation describing the rate of volatile accumulation in the package
headspace ( ipkhsr ), which is the left hand side term of Eq. 5-1 :
×
=
time with
ionconcentrat in
change of Rate
capacity
system
onaccumulati
of Rate
(Eq. 5-12)
The system capacity of the package headspace is assumed to be its net volume ( pkgV ; after
subtracting the volume of fruit and any other packaging elements) which is assumed
constant (section 5.4.5). The rate of accumulation can then be expressed as Eq. 5-13.
dt
dC
Vr
ipkhs
pkgipkhs ×=
(Eq. 5-13)

Chapter 5: Development of Conceptual and Mathematical Models
5-23
where
ipkhsr = Rate of accumulation of active agent i in package headspace (mol·s-1)
ipkhs
C = Concentration of active agent i in package headspace (mol·m-3)
In modelling packaging films (Figure 5-5), it was evident that lowering the pkflpkhsCR
value (by increasing the of film solubility) could affect accumulation of the active agent in
the package headspace. In this case, the higher the solubility (given the same permeability),
the greater the error in ignoring the transients due to film uptake. This is expected because
a longer timeframe is required for the system having a high solubility value to achieve
equilibrium. For such a case, the PDE model becomes appropriate for modelling mass
transfer through the packaging film.
However if the pkflpkhsCR is high, the loss of active agent from the film can be modelled
assuming steady-state conditions in the film. If this is done there is an implicit assumption
that a steady-state active agent profile is reached instantaneously through the packaging
film (i.e. the film reaches equilibrium with the permeant). In this case a factor in addition
to the package volume ( pkgV ) is required to account for system capacity of the film. This
factor may be termed the Outer Film Sorption Capacity (OFSC ). Because ambient gases
(N2, CO2, and O2) have low solubilities in common polymer films such as LDPE, the
OFSC values for these gases can reasonably be assumed negligible and only pkgV is
required in modelling the accumulations of these gases in MA packaging (as discussed in
section 5.4.5).
For the case where the OFSC becomes important (when the film has a high affinity for
active agent), then it must be included with pkgV and this will effectively slow the rate of
change in the package headspace. At low concentrations of the active agent in the package
headspace, the OFSC may be calculated as the product of packaging film volume ( pkflV )
and concentration of active agent in the film, where the latter may be estimated following
Henry’s law (as discussed in 5.5.1.2). Given a reasonably linear concentration gradient
through the film, an arithmetic average of the active agent vapour concentrations either
side of the film (i.e. an average of ipkhsC and i
envC where ienvC represents concentration of
active agent i in environment surrounding the bag) can be used to calculate the film
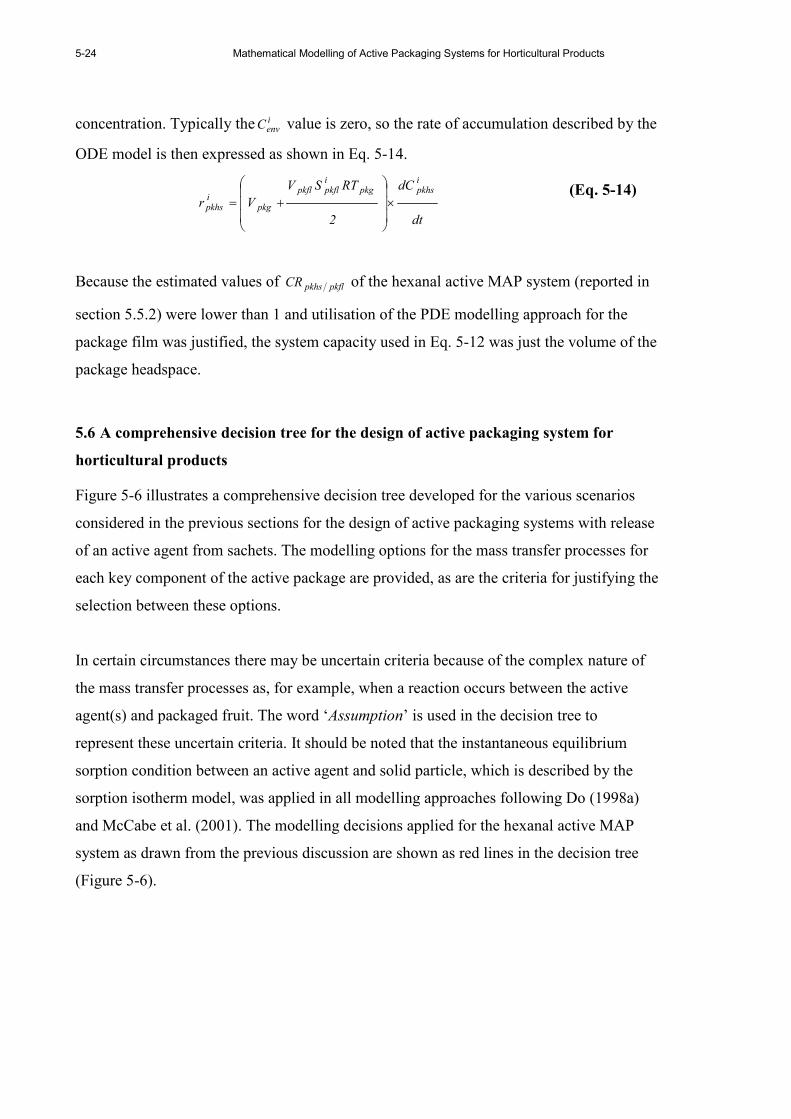
5-24 Mathematical Modelling of Active Packaging Systems for Horticultural Products
concentration. Typically the ienvC value is zero, so the rate of accumulation described by the
ODE model is then expressed as shown in Eq. 5-14.
dt
dC
2
RTSV
Vr
ipkhspkg
ipkflpkfl
pkgipkhs ×
+=
(Eq. 5-14)
Because the estimated values of pkflpkhsCR of the hexanal active MAP system (reported in
section 5.5.2) were lower than 1 and utilisation of the PDE modelling approach for the
package film was justified, the system capacity used in Eq. 5-12 was just the volume of the
package headspace.
5.6 A comprehensive decision tree for the design of active packaging system for
horticultural products
Figure 5-6 illustrates a comprehensive decision tree developed for the various scenarios
considered in the previous sections for the design of active packaging systems with release
of an active agent from sachets. The modelling options for the mass transfer processes for
each key component of the active package are provided, as are the criteria for justifying the
selection between these options.
In certain circumstances there may be uncertain criteria because of the complex nature of
the mass transfer processes as, for example, when a reaction occurs between the active
agent(s) and packaged fruit. The word ‘Assumption’ is used in the decision tree to
represent these uncertain criteria. It should be noted that the instantaneous equilibrium
sorption condition between an active agent and solid particle, which is described by the
sorption isotherm model, was applied in all modelling approaches following Do (1998a)
and McCabe et al. (2001). The modelling decisions applied for the hexanal active MAP
system as drawn from the previous discussion are shown as red lines in the decision tree
(Figure 5-6).
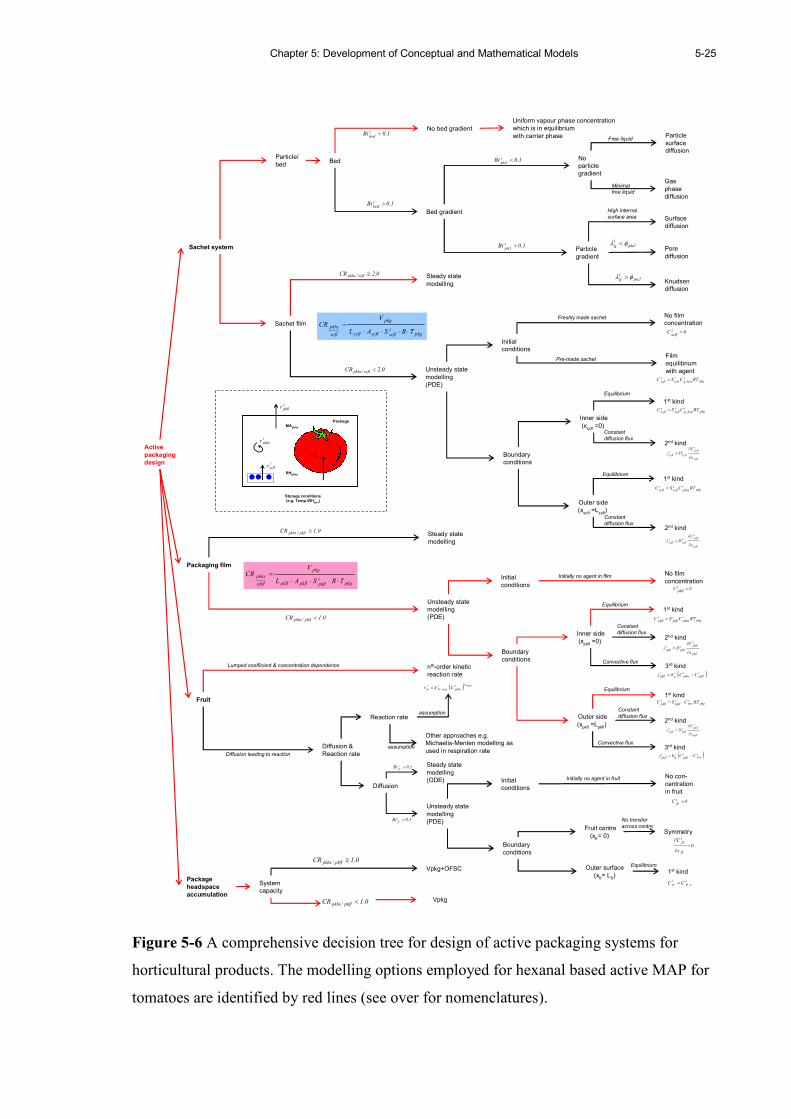
Chapter 5: Development of Conceptual and Mathematical Models
5-25
Sachet system
Particle/
bedBed
No bed gradient
Gas
phase
diffusion
Minimal
free liquid
Particle
surface
diffusion
Bed gradientSurface
diffusion
Knudsen
diffusion
Sachet film
Steady state
modelling
Unsteady state
modelling
(PDE)
Packaging film
Constant
diffusion flux
Fruit
Initial
conditions
Active
packaging
design
No
particle
gradient
Free liquid
Particle
gradient
High internal
surface area
Pore
diffusion
pkgiscflscflscfl
pkg
scfl
pkhsTRSAL
VCR
⋅⋅⋅⋅=
No film
concentrationFreshly made sachet
Film
equilibrium
with agent
pkgibed,g
iscfl
iscfl
RTCSC =
Pre-made sachet
Boundary
conditions
Inner side
(xscfl=0)
1st kind
Equilibrium
2nd kind
scfl
iscfli
scfliscfl
x
CDj
∂
∂=
Outer side
(xscfl=L
scfl)
1st kind
2nd kind
scfl
iscfli
scfliscfl
x
CDj
∂
∂=
Equilibrium
Constant
diffusion flux
Steady state
modelling
Unsteady state
modelling
(PDE)
Initial
conditions
No film
concentration0C i
pkfl=
Initially no agent in film
Boundary
conditions
Inner side
(xpkfl=0)
1st kind
2nd kind
pkfl
ipkfli
pkflipkfl
x
CDj
∂
∂=
Outer side
(xpkfl=L
pkfl)
1st kind
2nd kind
3rd kind
( )ienv
ipkfl
ig
ipkfl
CChj −=
pkgipkflpkflpkfl
pkg
pkfl
pkhsTRSAL
VCR
⋅⋅⋅⋅=
Lumped coefficient & concentration dependence
Diffusion &
Reaction rateDiffusion leading to reaction
Steady state
modelling
(ODE)
Unsteady state
modelling
(PDE)
Reaction rate
Diffusion
nth-order kinetic
reaction rate
Other approaches e.g.
Michaelis-Menten modelling as
used in respiration rate
Initial
conditions 0=i
frC
0x
C
fr
ifr
=∂
∂
ie,fr
ifr CC =
Boundary
conditions
Fruit centre
(xfr= 0)
Symmetry
Outer surface
(xfr= L
fr)
1st kind
Initially no agent in fruit
Package
headspace
accumulation
Vpkg+OFSC
Vpkg
System
capacity
No transfer
across centre
Equilibrium
Constant
diffusion flux
Equilibrium
Constant
diffusion flux
Convective flux
Equilibrium
pkgienv
ipkfl
ipkfl
RTCSC ⋅=
pkfl
ipkfli
pkflipkfl
x
CDj
∂
∂=
No con-
centration
in fruit
0C ifr=
assumption
assumption
ptclig φλ <
ptclig φλ >
0C iscfl
=
pkgibed,g
iscfl
iscfl
RTCSC =
0.2CR scflpkhs ≥
0.2CR scflpkhs <
0.1CR pkflpkhs ≥
0.1CR pkflpkhs <
0.1CR pkflpkhs ≥
0.1CR pkflpkhs <
pkgipkhs
iscfl
iscfl
RTCSC =
pkgipkhs
ipkfl
ipkfl
RTCSC =
1.0Bi ibed
<
1.0Bi ibed
>
1.0Bi iptcl
<
1.0Bi iptcl
>
( ) reacnipkhs
ireac,fr
ifr Ckr =
1.0Bi ifr<
1.0Bi ifr>
Uniform vapour phase concentration
which is in equilibrium
with carrier phase
( )ipkfl
ipkhs
ig
ipkfl CChj −=
3rd kindConvective flux
ipkhsr
iscflr
ipkflr
Storage conditions(e.g. Temp./RHenv)
Package
RHpkhs
ifrr
MApkhs
Figure 5-6 A comprehensive decision tree for design of active packaging systems for
horticultural products. The modelling options employed for hexanal based active MAP for
tomatoes are identified by red lines (see over for nomenclatures).

5-26 Mathematical Modelling of Active Packaging Systems for Horticultural Products
Abbreviations and symbols appearing in Figure 5-6 are defined as followings:
Symbols/
Abbreviations Descriptions
Symbols/
Abbreviations Descriptions
ibed
Bi = Biot value of active agent i with
respect to the sachet carrier bed
(dimensionless)
i
reac,frk
= Reaction rate coefficient of active agent i
and fruit (mol·s-1·kg-1 (m3·mol-1) reacn )
iptcl
Bi = Biot value of active agent i with
respect to particles in the sachet
(dimensionless)
scflL , pkflL ,
frL
= Describing the outer surfaces of sachet film,
packaging film and fruit, respectively
ifr
Bi = Biot value of active agent i with
respect to fruit (dimensionless)
reacn
= Order of reaction rate (dimensionless)
iscfl
C
= Concentration of active agent i in
the sachet film material (mol·m-3)
OFSC = Outer Film Sorption Capacity (mol)
ipkfl
C = Concentration of active agent i in
the packaging film material
(mol·m-3)
ODE = Ordinary Differential Equation
ibed,g
C = Equilibrium vapour concentration
of active agent i of solid bed
(mol·m-3)
PDE = Partial Differential Equation
ipkhs
C = Concentration of active agent i in
the package headspace (mol·m-3)
R = Gas constant (8.314 J·mol-1·K-1)
ifr
C = Concentration of active agent i in
the fruit (mol·m-3)
ifrr
= Reaction rate between active agent i and fruit
(mol·s-1)
i
e,frC
= Equilibrium concentration
representing the maximum
concentration of active agent i that
the fruit can attain (mol·m-3)
ipkfl
S = Packaging film solubility to active agent i
(mol·m-3·Pa-1)
ienvC
= Concentration of active agent i in
surrounding environment
(mol·m-3)
iscfl
S = Sachet film solubility to active agent i
(mol·m-3·Pa-1)
scflpkhsCR = A ratio of capacity of package
headspace to that of the sachet film
(dimensionless)
pkgT = Temperature of package (K)
pkflpkhsCR = A ratio of capacity of package
headspace to that of the packaging
film (dimensionless)
pkgV = Package volume (m3)
iscfl
D = Diffusivity of active agent i in
sachet film material (m2·s-1)
scflx = Position in the sachet film material (m)
ipkfl
D = Diffusivity of active agent i in
packaging film material (m2·s-1)
pkflx = Position in the packaging film material (m)
igh = Convective mass transfer
coefficient (m·s-1)
frx = Position in the fruit (m)
iscflj
= Constant diffusion flux of active
agent i to or from sachet film
material (mol·s-1·m-2)
igλ
= Mean free path of active agent i in the gas
phase (m)
ipkflj = Constant diffusion flux of active
agent i to or from packaging film
material (mol·s-1·m-2)
ptclφ = Diameter of pore inside the particle (m)

Chapter 5: Development of Conceptual and Mathematical Models
5-27
5.7 Mathematical model formulation for the Hexanal/Silica gel/Tomato active MAP
system
According to the overall balance equation (Eq. 5-1), individual components were
converted into the following mathematical equations.
5.7.1 Rate of hexanal release from sachet
Because scflpkhsCR ≥ 2 (section 5.5.1.2), it is appropriate to neglect the dynamics of
adsorption in the sachet film and instead model hexanal release as a steady-state one-
dimensional flux across the sachet film material. From the discussion in section 4.2.2, it is
apparent that the assumption of a linear concentration gradient through the film Eq. 2-8
may lead to an underestimation of flux where a significant difference of concentration
exists between the two sides of the film. This is likely to be the case for the initial stages of
hexanal release from a sachet into the package headspace. In such as case, the alternative
equation (Eq. 4-5) may be more appropriate and therefore this was utilised to describe the
steady-state mass transfer rate of hexanal vapour across the sachet film as shown in Eq.5-
15. The derivation of Eq. 5-15 is described in Appendix D.1.
( ) ( )( )scflHxlpkhsscfl
Hxlbed,g
scflscfl
pkgscflHxl
0,scflHxlscfl
bCexpbCexpbL
RTAPr ⋅−⋅= 0tfor > ;
and Hxlsat
Hxlbed,g
CC;0tfor ==
(Eq. 5-15)
where
Hxlscflr = Rate of hexanal permeation through the sachet film material (mol·s-1)
Hxl0,scfl
P = Pre-exponential factor of effective permeability to hexanal vapour of
sachet film material (mol·m·m-2·s-1·Pa-1)
scflb = Fitted exponential model coefficient of effective permeability to hexanal
vapour of sachet film material (m3·mol-1)
Hxlbed,gC = Equilibrium hexanal vapour concentration above the carrier bed
(mol·m-3)
HxlpkhsC = Hexanal vapour concentration in the package headspace (mol·m
-3)
HxlsatC = Saturated hexanal vapour concentration at a given temperature (mol·m
-3)

5-28 Mathematical Modelling of Active Packaging Systems for Horticultural Products
The value of Hxlbed,gC is varied according to the amount of adsorbed hexanal remaining in the
carrier bed ( Hxlbed,sC ). The relationship between these parameters is described using the
Langmuir sorption isotherm (Eq. 5-16) which was rearranged from its original form (Eq.
2-3) that described Hxlbed,sC as a function of Hxl
bed,gC . The rearrangement represents the actual
situation where the amount of hexanal adsorbed on the silica gel decreases after the onset
of release.
( )Hxlbed,s
Hxlmax,s
HxlLgm
Hxlbed,sHxl
bed,gCCb
CC
−⋅= (Eq. 5-16)
where
Hxlbed,sC = Equilibrium adsorbed amount of hexanal on the carrier bed (mol·g
-1)
Hxlmax,sC = Maximum amount of hexanal adsorbed on the carrier estimated by the
Langmuir sorption isotherm (mol·g-1)
HxlLgmb = Langmuir constant of hexanal sorption (m3·mol-1)
From Eq. 5-16, it can be inferred that changes to Hxlbed,sC will directly affect Hxl
bed,gC , which in
turn influences the concentration gradient across the sachet film. For this reason the
depletion of hexanal from the adsorbent particles was modelled where the rate of change in
the bed is equal to the loss through the sachet film. The rate of change of Hxlbed,sC could be
defined as shown in Eq. 5-17;
( ) ( )( )scflHxlpkhsscfl
Hxlbed,g
scflscfl
pkgscflHxl
0,scflHxlbed,s
bed bCexpbCexp
bL
RTAP
t
C
M ⋅−⋅−=∂
∂
0tfor > ;
and Hxlmax,s
Hxlbed,s
CC;0tfor ==
(Eq. 5-17)
5.7.2 Rate of hexanal transfer across the packaging film material
As described above, as pkflpkhsCR ≤ 1 (actually ~0.36; section 5.5.2) this means the
dynamics of the packaging film are not fast enough to assume equilibrium with the
package headspace. As such the rate of hexanal transfer from the headspace to the
surrounding environment through the packaging film material was defined using Fick’s
second law for diffusion in one-dimension (Eq. 5-18). The solubility and permeability
values were based on local hexanal concentrations in the film. The derivation of Eq. 5-18
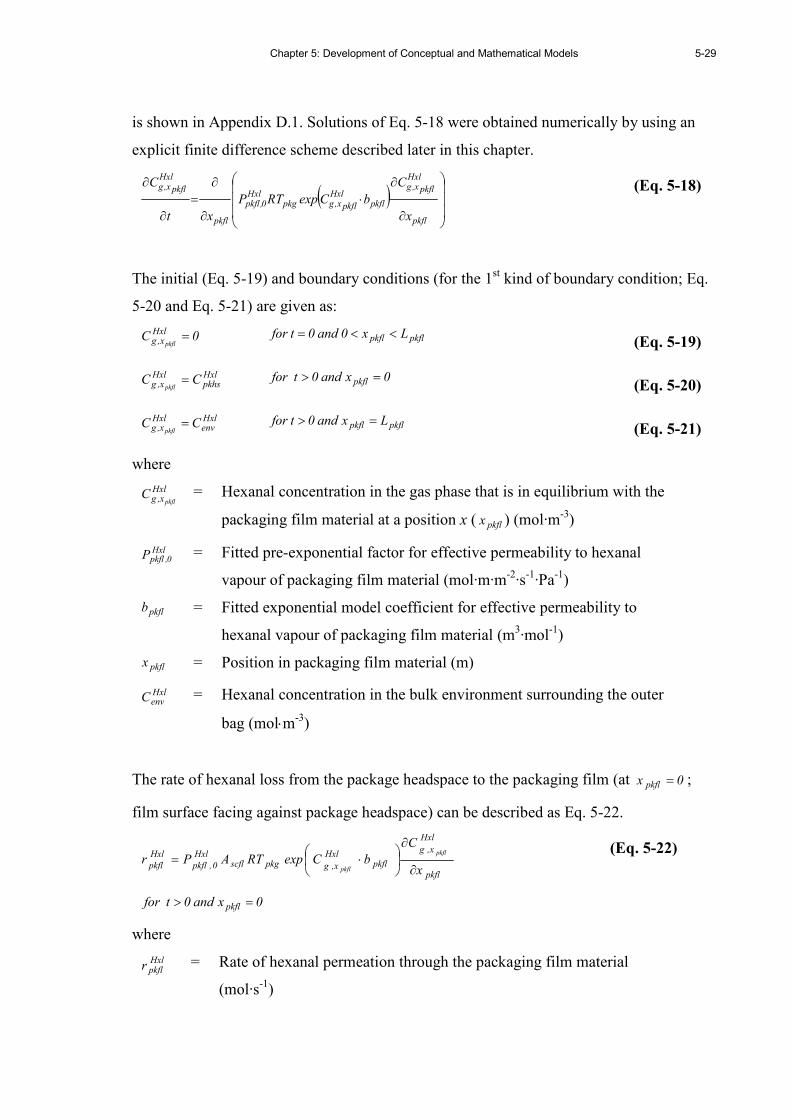
Chapter 5: Development of Conceptual and Mathematical Models
5-29
is shown in Appendix D.1. Solutions of Eq. 5-18 were obtained numerically by using an
explicit finite difference scheme described later in this chapter.
( )
∂
∂⋅
∂
∂=
∂
∂
pkfl
Hxl
pkflx,g
pkflHxl
pkflx,gpkgHxl
0,pkfl
pkfl
Hxl
pkflx,g
x
C
bCexpRTP
xt
C
(Eq. 5-18)
The initial (Eq. 5-19) and boundary conditions (for the 1st kind of boundary condition; Eq.
5-20 and Eq. 5-21) are given as:
0C Hxlx,g pkfl
= pkflpkfl Lx0 and 0t for <<= (Eq. 5-19)
Hxlpkhs
Hxlx,g CCpkfl
= 0x and 0t for pkfl => (Eq. 5-20)
Hxlenv
Hxlx,g CCpkfl
= pkflpkfl Lx and 0t for => (Eq. 5-21)
where
Hxlx,g pkfl
C = Hexanal concentration in the gas phase that is in equilibrium with the
packaging film material at a position x ( pkflx ) (mol·m-3)
Hxl0,pkflP = Fitted pre-exponential factor for effective permeability to hexanal
vapour of packaging film material (mol·m·m-2·s-1·Pa-1)
pkflb = Fitted exponential model coefficient for effective permeability to
hexanal vapour of packaging film material (m3·mol-1)
pkflx = Position in packaging film material (m)
HxlenvC = Hexanal concentration in the bulk environment surrounding the outer
bag (mol⋅m-3)
The rate of hexanal loss from the package headspace to the packaging film (at 0x pkfl = ;
film surface facing against package headspace) can be described as Eq. 5-22.
pkfl
Hxl
x,g
pkflHxl
x,gpkgscflHxl
0,pkfl
Hxl
pkfl x
C
bCexpRTAPrpkfl
pkfl ∂
∂
⋅=
0x and 0t for pkfl =>
(Eq. 5-22)
where
Hxlpkflr = Rate of hexanal permeation through the packaging film material
(mol·s-1)
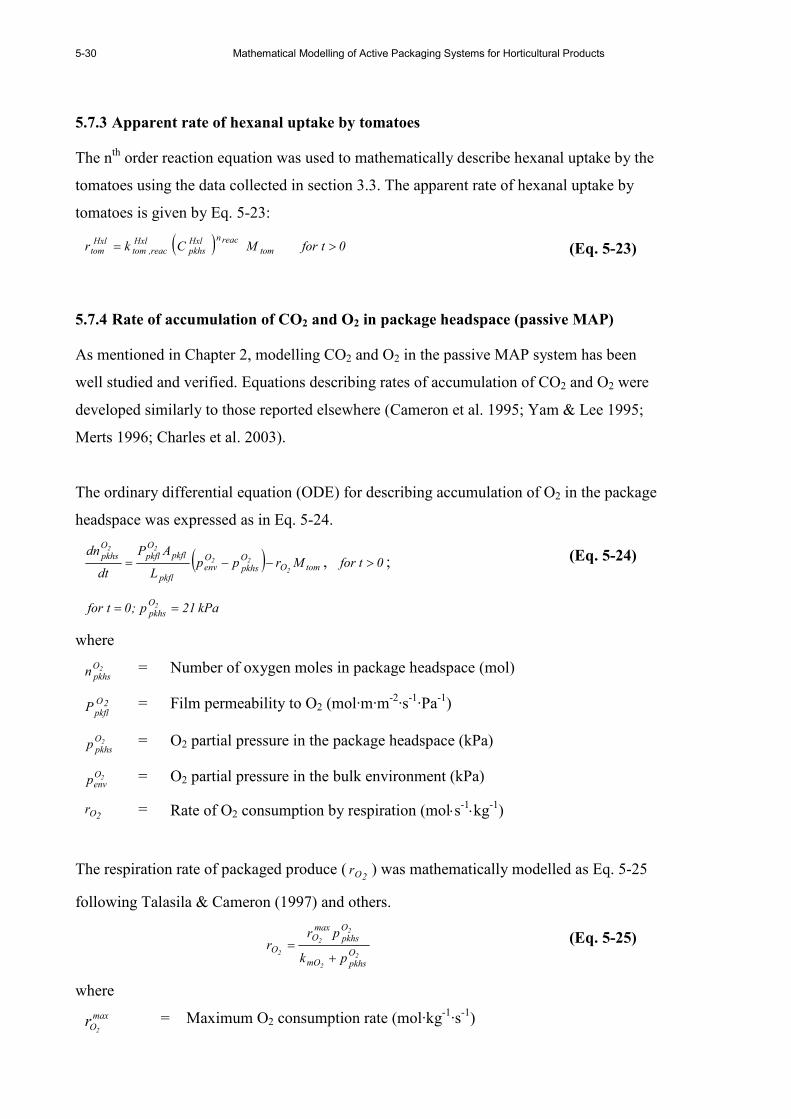
5-30 Mathematical Modelling of Active Packaging Systems for Horticultural Products
5.7.3 Apparent rate of hexanal uptake by tomatoes
The nth order reaction equation was used to mathematically describe hexanal uptake by the
tomatoes using the data collected in section 3.3. The apparent rate of hexanal uptake by
tomatoes is given by Eq. 5-23:
( ) tom
reacnHxlpkhs
Hxlreac,tom
Hxltom MCkr = 0tfor > (Eq. 5-23)
5.7.4 Rate of accumulation of CO2 and O2 in package headspace (passive MAP)
As mentioned in Chapter 2, modelling CO2 and O2 in the passive MAP system has been
well studied and verified. Equations describing rates of accumulation of CO2 and O2 were
developed similarly to those reported elsewhere (Cameron et al. 1995; Yam & Lee 1995;
Merts 1996; Charles et al. 2003).
The ordinary differential equation (ODE) for describing accumulation of O2 in the package
headspace was expressed as in Eq. 5-24.
( ) tomOO
pkhs
Oenv
pkfl
pkflO
pkfl
O
pkhsMrpp
L
AP
dt
dn
2
22
22
−−= , 0t for > ;
kPa21p;0tfor 2O
pkhs ==
(Eq. 5-24)
where
2O
pkhsn = Number of oxygen moles in package headspace (mol)
2O
pkflP = Film permeability to O2 (mol·m·m
-2·s-1·Pa-1)
2O
pkhsp = O2 partial pressure in the package headspace (kPa)
2Oenvp = O2 partial pressure in the bulk environment (kPa)
2Or = Rate of O2 consumption by respiration (mol⋅s
-1⋅kg-1)
The respiration rate of packaged produce (2Or ) was mathematically modelled as Eq. 5-25
following Talasila & Cameron (1997) and others.
2
2
2
2
2 O
pkhsmO
O
pkhs
maxO
Opk
prr
+= (Eq. 5-25)
where
max
O2r = Maximum O2 consumption rate (mol·kg
-1·s-1)
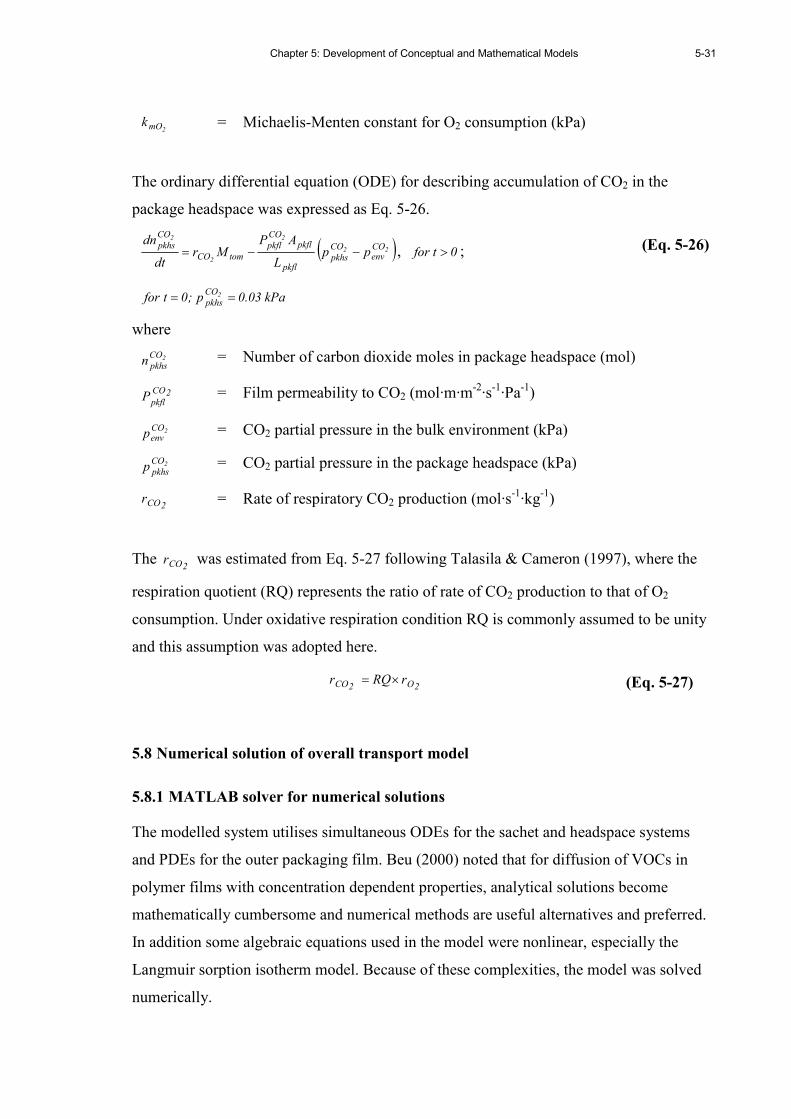
Chapter 5: Development of Conceptual and Mathematical Models
5-31
2mOk = Michaelis-Menten constant for O2 consumption (kPa)
The ordinary differential equation (ODE) for describing accumulation of CO2 in the
package headspace was expressed as Eq. 5-26.
( )22
2
2
2
COenv
CO
pkhspkfl
pkflCO
pkfl
tomCO
CO
pkhspp
L
APMr
dt
dn−−= , 0t for > ;
kPa03.0p;0tfor 2CO
pkhs ==
(Eq. 5-26)
where
2CO
pkhsn = Number of carbon dioxide moles in package headspace (mol)
2CO
pkflP = Film permeability to CO2 (mol·m·m
-2·s-1·Pa-1)
2COenvp = CO2 partial pressure in the bulk environment (kPa)
2CO
pkhsp = CO2 partial pressure in the package headspace (kPa)
2COr = Rate of respiratory CO2 production (mol·s-1·kg-1)
The 2COr was estimated from Eq. 5-27 following Talasila & Cameron (1997), where the
respiration quotient (RQ) represents the ratio of rate of CO2 production to that of O2
consumption. Under oxidative respiration condition RQ is commonly assumed to be unity
and this assumption was adopted here.
2O2CO rRQr ×= (Eq. 5-27)
5.8 Numerical solution of overall transport model
5.8.1 MATLAB solver for numerical solutions
The modelled system utilises simultaneous ODEs for the sachet and headspace systems
and PDEs for the outer packaging film. Beu (2000) noted that for diffusion of VOCs in
polymer films with concentration dependent properties, analytical solutions become
mathematically cumbersome and numerical methods are useful alternatives and preferred.
In addition some algebraic equations used in the model were nonlinear, especially the
Langmuir sorption isotherm model. Because of these complexities, the model was solved
numerically.
5-32 Mathematical Modelling of Active Packaging Systems for Horticultural Products
The PDE describing active agent transfer through the outer packaging film was converted
into a series of ODE using explicit finite difference techniques. These ODE’s, together
with the ODE’s for the sachet and package headspace, were then solved together in
MATLAB® (version 6.5 The Mathworks Inc, Natick, Mass. U.S.A) using the ode23s
solver function. A default value of 0.001 for relative tolerance of integration error (known
as ‘RelTol’) was used for the simulations. The ode23s solver was chosen due to the stiff
nature of the differential equations. Moler (2003) explain that stiff sets of differential
equations are those when the solutions being sought for some are varying slowly, while
nearby solutions are being rapidly solved. In such a case, the numerical method must take
small steps to obtain satisfactory results within the designated tolerance and a longer
computational time is required to obtain results compared to non-stiff equations. The stiff
nature of the differential equations arises here due to the relatively rapid changes of
concentration in other package components compared to those in the packaging film.
Initially the numerical method was solved using ode45, which is a general purpose and
more accurate solver used for MATLAB® applications. Although a much long
computational time was required by ode45 than ode23s, results obtained from both solvers
were found to be in good agreement. Because of this, ode23s was utilised extensively in all
subsequent mathematical simulations in the present study. It should be noted that ODEs
describing accumulation of O2 and CO2 were numerically solved with approximate initial
conditions using the ode45 solver because of the non-stiff nature of their solutions (i.e. the
permeation of O2 and CO2 across the packaging film was modelled using the steady-state
approach).
5.8.2 Finite difference solutions for PDE models
5.8.2.1 Explicit finite different scheme
To numerically solve the PDEs, the explicit finite different scheme was implemented as
this is one of the most common and simple, yet effective, numerical methods for solving
unsteady-state problems in heat conduction and diffusion mass transfer for systems having
regular geometry (Mills 1995b). In this case the packaging film material can be considered
as an infinite slab and applications of finite differences for numerical solutions of
unsteady-state diffusion mass transfer processes in polymer films are well documented by
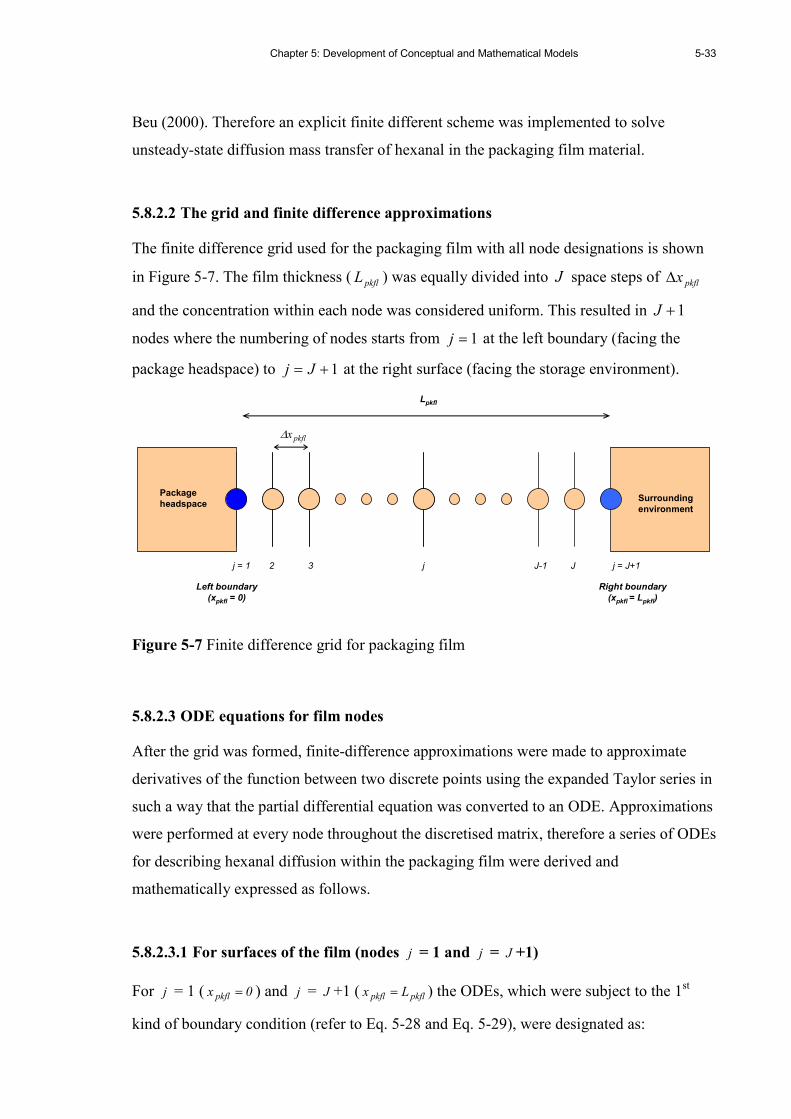
Chapter 5: Development of Conceptual and Mathematical Models
5-33
Beu (2000). Therefore an explicit finite different scheme was implemented to solve
unsteady-state diffusion mass transfer of hexanal in the packaging film material.
5.8.2.2 The grid and finite difference approximations
The finite difference grid used for the packaging film with all node designations is shown
in Figure 5-7. The film thickness ( pkflL ) was equally divided into J space steps of pkflx∆
and the concentration within each node was considered uniform. This resulted in 1+J
nodes where the numbering of nodes starts from 1=j at the left boundary (facing the
package headspace) to 1+= Jj at the right surface (facing the storage environment).
Left boundary
(xpkfl = 0)
Right boundary
(xpkfl = Lpkfl)
j = 1 2 3 j = J+1J J-1
Lpkfl
j
Package
headspaceSurrounding
environment
pkflx∆
Figure 5-7 Finite difference grid for packaging film
5.8.2.3 ODE equations for film nodes
After the grid was formed, finite-difference approximations were made to approximate
derivatives of the function between two discrete points using the expanded Taylor series in
such a way that the partial differential equation was converted to an ODE. Approximations
were performed at every node throughout the discretised matrix, therefore a series of ODEs
for describing hexanal diffusion within the packaging film were derived and
mathematically expressed as follows.
5.8.2.3.1 For surfaces of the film (nodes j = 1 and j = J +1)
For j = 1 ( 0x pkfl = ) and j = J +1 ( pkflpkfl Lx = ) the ODEs, which were subject to the 1st
kind of boundary condition (refer to Eq. 5-28 and Eq. 5-29), were designated as:
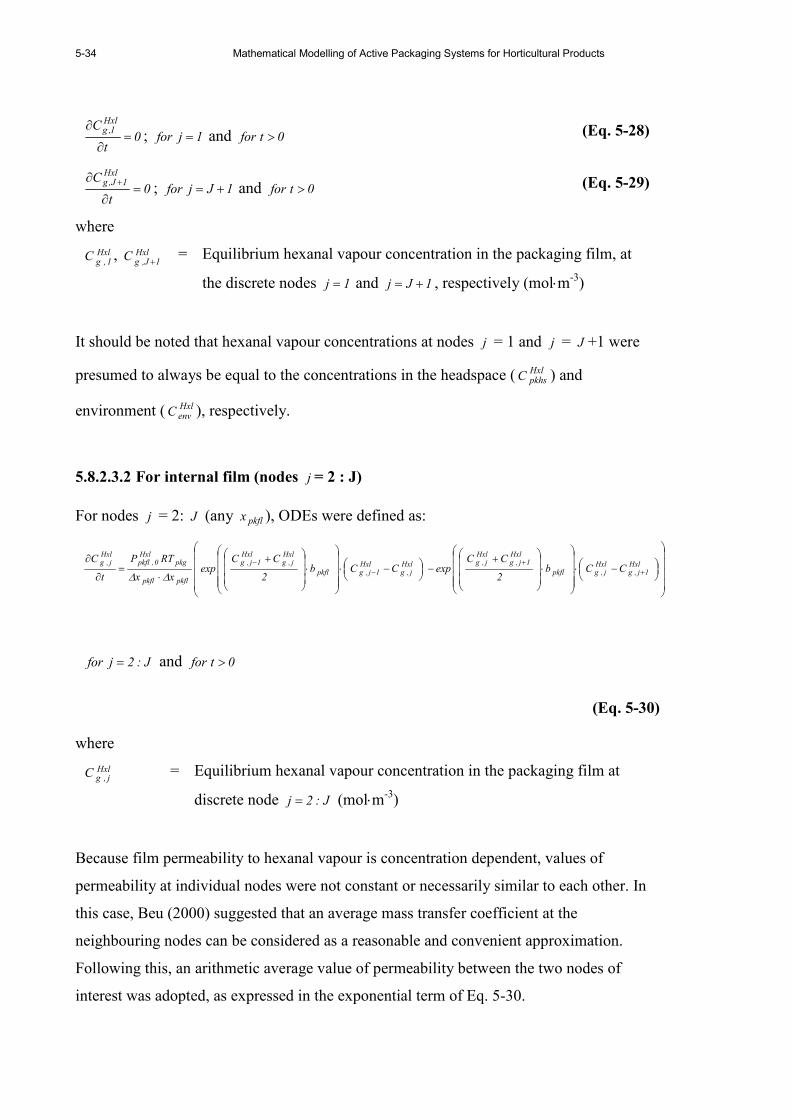
5-34 Mathematical Modelling of Active Packaging Systems for Horticultural Products
0t
C Hxl1,g=
∂
∂; 1jfor = and 0tfor > (Eq. 5-28)
0t
C Hxl1J,g=
∂
∂ +; 1Jjfor += and 0tfor > (Eq. 5-29)
where
Hxl1,g
C , Hxl1J,g
C + = Equilibrium hexanal vapour concentration in the packaging film, at
the discrete nodes 1j = and 1Jj += , respectively (mol⋅m-3)
It should be noted that hexanal vapour concentrations at nodes j = 1 and j = J +1 were
presumed to always be equal to the concentrations in the headspace ( HxlpkhsC ) and
environment ( HxlenvC ), respectively.
5.8.2.3.2 For internal film (nodes j = 2 : J)
For nodes j = 2: J (any pkflx ), ODEs were defined as:
−⋅
⋅
+−
−⋅
⋅
+
⋅=
∂
∂+
+−
− Hxl1j,g
Hxlj,gpkfl
Hxl1j,g
Hxlj,gHxl
j,gHxl
1j,gpkfl
Hxlj,g
Hxl1j,g
pkflpkfl
pkgHxl
0,pkflHxl
j,gCCb
2
CCexpCCb
2
CCexp
xx
RTP
t
C
∆∆
J:2jfor = and 0tfor >
(Eq. 5-30)
where
Hxlj,gC = Equilibrium hexanal vapour concentration in the packaging film at
discrete node J:2j = (mol⋅m-3)
Because film permeability to hexanal vapour is concentration dependent, values of
permeability at individual nodes were not constant or necessarily similar to each other. In
this case, Beu (2000) suggested that an average mass transfer coefficient at the
neighbouring nodes can be considered as a reasonable and convenient approximation.
Following this, an arithmetic average value of permeability between the two nodes of
interest was adopted, as expressed in the exponential term of Eq. 5-30.
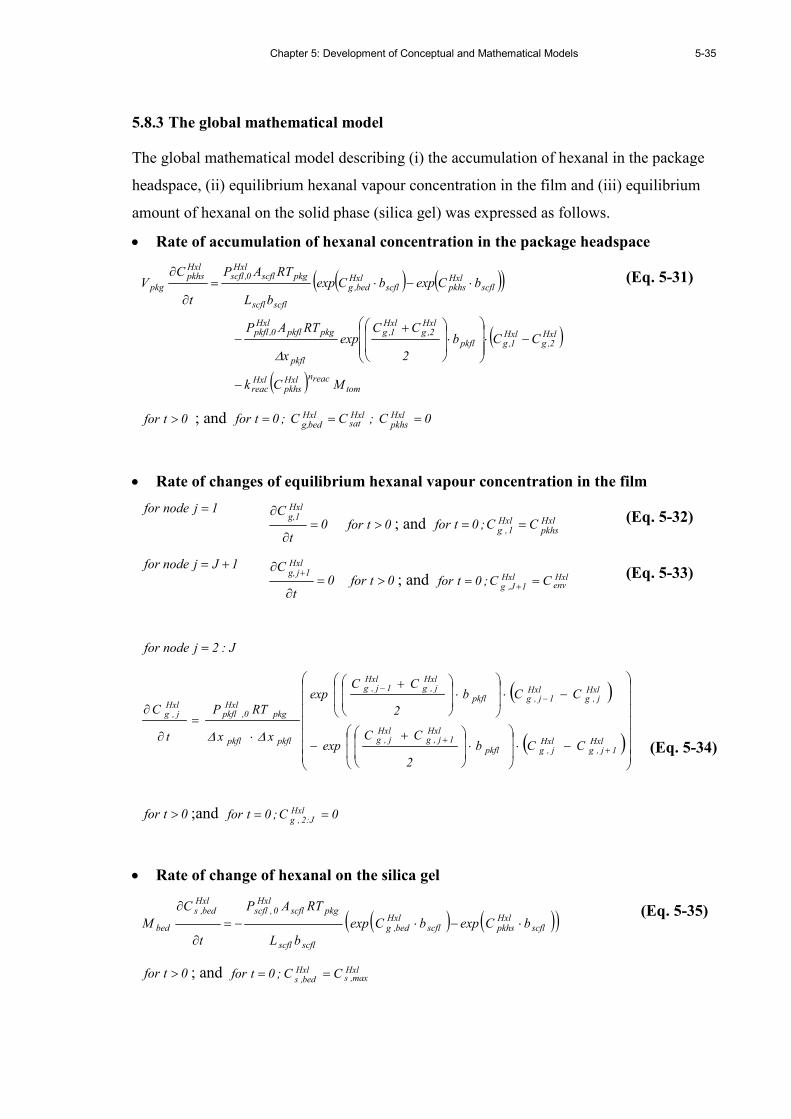
Chapter 5: Development of Conceptual and Mathematical Models
5-35
5.8.3 The global mathematical model
The global mathematical model describing (i) the accumulation of hexanal in the package
headspace, (ii) equilibrium hexanal vapour concentration in the film and (iii) equilibrium
amount of hexanal on the solid phase (silica gel) was expressed as follows.
• Rate of accumulation of hexanal concentration in the package headspace
( ) ( )( )
( )
( ) tomreacnHxl
pkhsHxlreac
Hxl2,g
Hxl1,gpkfl
Hxl2,g
Hxl1,g
pkfl
pkgpkflHxl
0,pkfl
scflHxlpkhsscfl
Hxlbed,g
scflscfl
pkgscflHxl
0,scflHxlpkhs
pkg
MCk
CCb
2
CCexp
x
RTAP
bCexpbCexp
bL
RTAP
t
CV
−
−⋅
⋅
+−
⋅−⋅=∂
∂
∆
0tfor > ; and 0C ;C C ;0tfor Hxlpkhs
Hxlsat
Hxlbedg,
===
(Eq. 5-31)
• Rate of changes of equilibrium hexanal vapour concentration in the film
1j node for = 0
t
C Hxlg,1
=∂
∂ 0tfor > ; and Hxl
pkhsHxl
1,gCC;0tfor == (Eq. 5-32)
1Jj node for += 0
t
C Hxl1jg,=
∂
∂ + 0tfor > ; and Hxl
envHxl
1J,gCC;0tfor == + (Eq. 5-33)
J:2j node for =
( )
( )
−⋅
⋅
+−
−⋅
⋅
+
⋅=
∂
∂
++
−−
Hxl1j,g
Hxlj,gpkfl
Hxl1j,g
Hxlj,g
Hxlj,g
Hxl1j,gpkfl
Hxlj,g
Hxl1j,g
pkflpkfl
pkgHxl
0,pkflHxl
j,g
CCb
2
CCexp
CCb
2
CCexp
xx
RTP
t
C
∆∆
0tfor > ;and 0C;0tfor HxlJ:2,g==
(Eq. 5-34)
• Rate of change of hexanal on the silica gel
( ) ( )( )scflHxlpkhsscfl
Hxlbed,g
scflscfl
pkgscflHxl
0,scflHxlbed,s
bed bCexpbCexp
bL
RTAP
t
C
M ⋅−⋅−=∂
∂
0tfor > ; and Hxlmax,s
Hxlbed,s
CC;0tfor ==
(Eq. 5-35)
5-36 Mathematical Modelling of Active Packaging Systems for Horticultural Products
5.8.4 MATLAB® language codes
The formulated ODEs for the finite difference grid of the packaging film together with the
ODEs for the sachet and apparent hexanal uptake by the tomatoes were transformed to
MATLAB® code to solve the model. This code is shown in Appendix G.1. The codes for
the ODEs describing CO2 and O2 accumulation were presented in MATLAB® code as
shown in Appendix G.2.
5.8.5 Model checking: Checks against analytical solutions and numerical error
checking
Prior to proceeding to validation or making other uses of the mathematical models, model
accuracy must be checked. Errors in models may be present and these could be arised
from, for example, numerical errors in the chosen solution methods or mistakes in
algebraic calculation or programming routines. To check mathematical accuracy, one may
compare results obtained from the mathematical models developed against those obtained
from existing solutions which have already been validated. As mentioned earlier, there are
complexities in the nature of mathematical models for describing mass transport in an
active packaging system, thus direct comparison to analytical solutions is difficult.
However, mathematical models can be simplified in order to compare numerical
predictions and analytical results.
Checking of numerical errors was conducted for the PDE and its explicit finite difference
solution. To form the finite difference scheme, both time and space in the film were
discretised by dividing the continua into a series of nodes (or space-steps) and time-steps.
Bronlund (1997) suggested that whilst making the size of time and space steps approach
zero could closely represent the system of interest, this will prolong computational times
and potentially cause errors associated with the calculated results. From error analyses of
discrete time and space, no significant differences in package headspace concentration of
hexanal vapour were found (maximum difference of 6 × 10⁻⁶ mol·m-3) when the number of
space steps in the film was doubled from 10 to 20. Also there were no significant errors
introduced when the default value of ‘RelTol’ (1E-3) in the ode23s solver was changed to
1E-4 (maximum difference of 1 × 10⁻⁶ mol·m-3), suggesting the ode solver was keeping the
time step controlled to minimise numerical error. For all future simulations of the
mathematical model, 10 space steps and the default value of ‘ReTol’ were used.
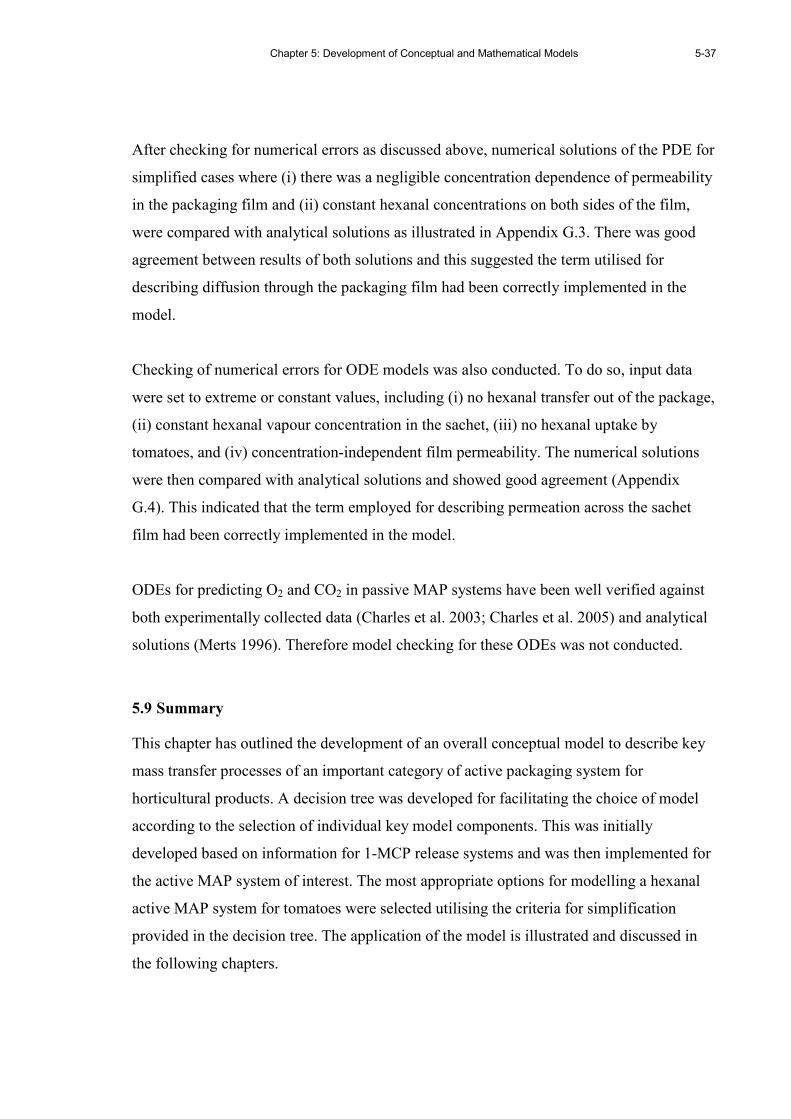
Chapter 5: Development of Conceptual and Mathematical Models
5-37
After checking for numerical errors as discussed above, numerical solutions of the PDE for
simplified cases where (i) there was a negligible concentration dependence of permeability
in the packaging film and (ii) constant hexanal concentrations on both sides of the film,
were compared with analytical solutions as illustrated in Appendix G.3. There was good
agreement between results of both solutions and this suggested the term utilised for
describing diffusion through the packaging film had been correctly implemented in the
model.
Checking of numerical errors for ODE models was also conducted. To do so, input data
were set to extreme or constant values, including (i) no hexanal transfer out of the package,
(ii) constant hexanal vapour concentration in the sachet, (iii) no hexanal uptake by
tomatoes, and (iv) concentration-independent film permeability. The numerical solutions
were then compared with analytical solutions and showed good agreement (Appendix
G.4). This indicated that the term employed for describing permeation across the sachet
film had been correctly implemented in the model.
ODEs for predicting O2 and CO2 in passive MAP systems have been well verified against
both experimentally collected data (Charles et al. 2003; Charles et al. 2005) and analytical
solutions (Merts 1996). Therefore model checking for these ODEs was not conducted.
5.9 Summary
This chapter has outlined the development of an overall conceptual model to describe key
mass transfer processes of an important category of active packaging system for
horticultural products. A decision tree was developed for facilitating the choice of model
according to the selection of individual key model components. This was initially
developed based on information for 1-MCP release systems and was then implemented for
the active MAP system of interest. The most appropriate options for modelling a hexanal
active MAP system for tomatoes were selected utilising the criteria for simplification
provided in the decision tree. The application of the model is illustrated and discussed in
the following chapters.

5-38 Mathematical Modelling of Active Packaging Systems for Horticultural Products

Chapter 6: Mathematical Model Validations
6-1
Chapter 6
MATHEMATICAL MODEL VALIDATION
6.1 Introduction
In this chapter, the mathematical models developed in Chapter 5 were validated against
experimental data collected from active MA packages (based on LDPE film bags) for
which key components, such as the characteristics of the hexanal controlled release sachet
and presence or absence of tomatoes, were varied to provide a range of packaging
scenarios. The accuracy of the model predictions and assumptions underlying the
developed model (as identified by the decision tree; Figure 5-6) were investigated and are
discussed along with the validation results.
6.2 Experiments used in validating the mathematical models
To get a better understanding of the performance of the mathematical models, validation
was performed by comparing the model output with data obtained from a series of
experiments which involved combinations of several active packaging design variables,
including the sachet loading, ratio of sachet to bag area, storage temperature, and presence
or absence of tomatoes in the package. Table 6-1 summarises the different active MA
packages developed for this work.
Experiments were carried out using varying masses (1.5 – 4.5 g) of silica gel (initially
saturated with hexanal vapour) pre-packaged in sachets. The method of preparing the pre-
saturated silica gel samples is presented in Appendix H.1. The 50 × 60 mm and 50 × 30
mm sachets (excluding the seal area) were constructed by using aluminium foil laminate
film10 (Propak Supplies, Palmerston North, New Zealand) on the bottom of the sachets,
while the top film was made of either LDPE, Tyvek or OPP film. The foil ensured that all
hexanal release occurred through the upper sachet film which was in uninhibited contact
10 This film is a composite of LDPE film and aluminium sheet. The effects of the LDPE laminate on hexanal
concentrations within the bed or permeation from the sachet were presumed to be negligible as the
aluminium layer should be a near absolute barrier to hexanal transport. Information on the high barrier
properties of aluminium or aluminium-composite film to gas and volatile compounds is provided by
Robertson (1993b).

6-2 Mathematical Modelling of Active Packaging Systems for Horticultural Products
with the package headspace. The sachets containing silica gel saturated with hexanal were
then packed into LDPE bags (as the primary package) together with either tomato fruit (6
tomatoes, with an approximate volume of 600 ml) or a sealed glass container of equivalent
volume (Figure 6-1). At least 3 replicates were tested for each individual model package.
Table 6-1 Details of the active MA packages employed in the validation trials (all used a
LDPE outer bag)
Dried silica gel
weights (g)
Sachet dimensions
(mm)
Packaged
items a
Storage
temperature
(ºC)
Storage
period
(days) ID.
Sachet
films
1.5 3.0 4.5 50 ×××× 60 50 ×××× 30 Jars Fruit 10 20 7 14
LD1 LDPE √ √ √ √ √ √
LD2 √ √ √ √ √ √
LD3 √ √ √ √ √ √
LD4 √ √ √ √ √ √
LD5 √ √ √ √ √
LD6 √ √ + 2 b √ √ √
LD7 c √ √
OP1 OPP √ √ √ √ √ √
OP2 √ √ √ √ √ √
TY1 Tyvek √ √ √ √ √ √
TY2 √ √ √ √ √ √
a The sealed glass jar was inert to hexanal and had an volume equivalent to 6 tomatoes, which was the number of fruit generally used in
the present work. RH levels in bags containing tomatoes were >95% RH as randomly measured by a Tinytalk® RH meter; Gemini Data
Loggers, UK.
b Two sachets were packaged into one bag; usually there was only one sachet per bag.
c This system comprised only the sachet containing silica gel saturated with hexanal. No package or other items were included. This
package model was used to determine the rate of release of hexanal from the silica gel in the sachet under conditions of maximum
driving force.
(A) (B)
Figure 6-1 Examples of active MA package containing tomatoes (A) or a sealed glass
container (B)
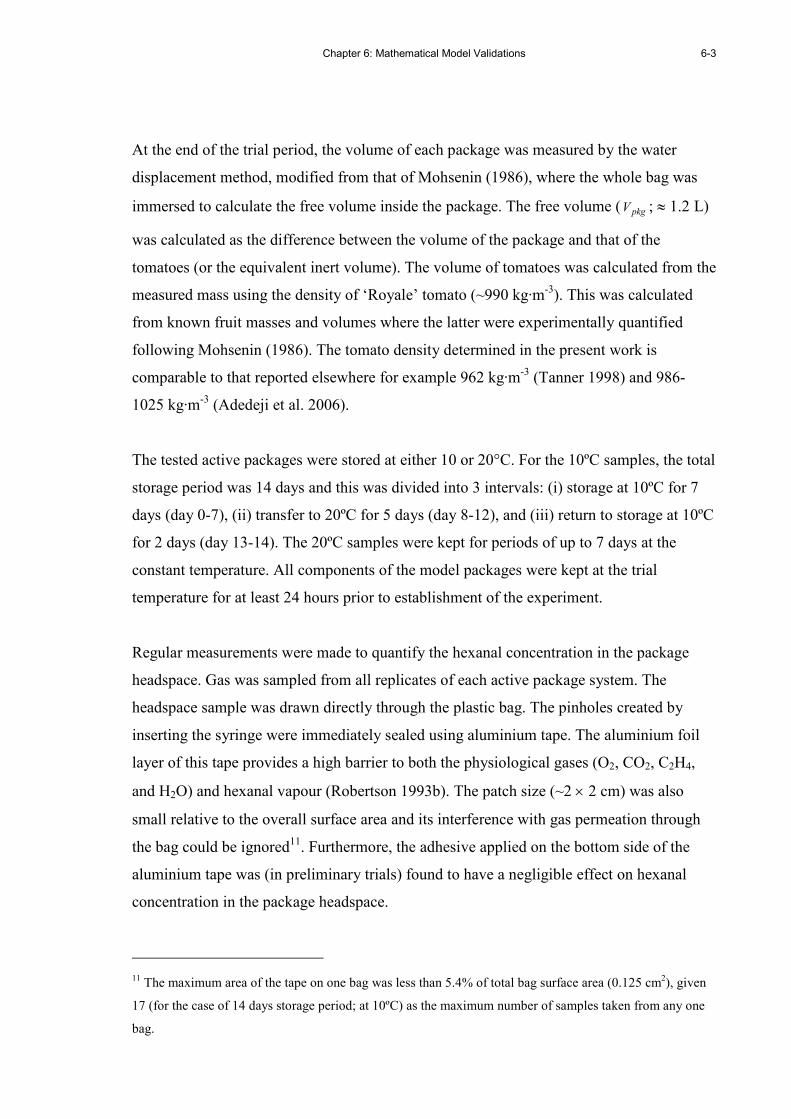
Chapter 6: Mathematical Model Validations
6-3
At the end of the trial period, the volume of each package was measured by the water
displacement method, modified from that of Mohsenin (1986), where the whole bag was
immersed to calculate the free volume inside the package. The free volume ( pkgV ; ≈ 1.2 L)
was calculated as the difference between the volume of the package and that of the
tomatoes (or the equivalent inert volume). The volume of tomatoes was calculated from the
measured mass using the density of ‘Royale’ tomato (~990 kg·m-3). This was calculated
from known fruit masses and volumes where the latter were experimentally quantified
following Mohsenin (1986). The tomato density determined in the present work is
comparable to that reported elsewhere for example 962 kg·m-3 (Tanner 1998) and 986-
1025 kg·m-3 (Adedeji et al. 2006).
The tested active packages were stored at either 10 or 20°C. For the 10ºC samples, the total
storage period was 14 days and this was divided into 3 intervals: (i) storage at 10ºC for 7
days (day 0-7), (ii) transfer to 20ºC for 5 days (day 8-12), and (iii) return to storage at 10ºC
for 2 days (day 13-14). The 20ºC samples were kept for periods of up to 7 days at the
constant temperature. All components of the model packages were kept at the trial
temperature for at least 24 hours prior to establishment of the experiment.
Regular measurements were made to quantify the hexanal concentration in the package
headspace. Gas was sampled from all replicates of each active package system. The
headspace sample was drawn directly through the plastic bag. The pinholes created by
inserting the syringe were immediately sealed using aluminium tape. The aluminium foil
layer of this tape provides a high barrier to both the physiological gases (O2, CO2, C2H4,
and H2O) and hexanal vapour (Robertson 1993b). The patch size (~2 × 2 cm) was also
small relative to the overall surface area and its interference with gas permeation through
the bag could be ignored11. Furthermore, the adhesive applied on the bottom side of the
aluminium tape was (in preliminary trials) found to have a negligible effect on hexanal
concentration in the package headspace.
11 The maximum area of the tape on one bag was less than 5.4% of total bag surface area (0.125 cm2), given
17 (for the case of 14 days storage period; at 10ºC) as the maximum number of samples taken from any one
bag.
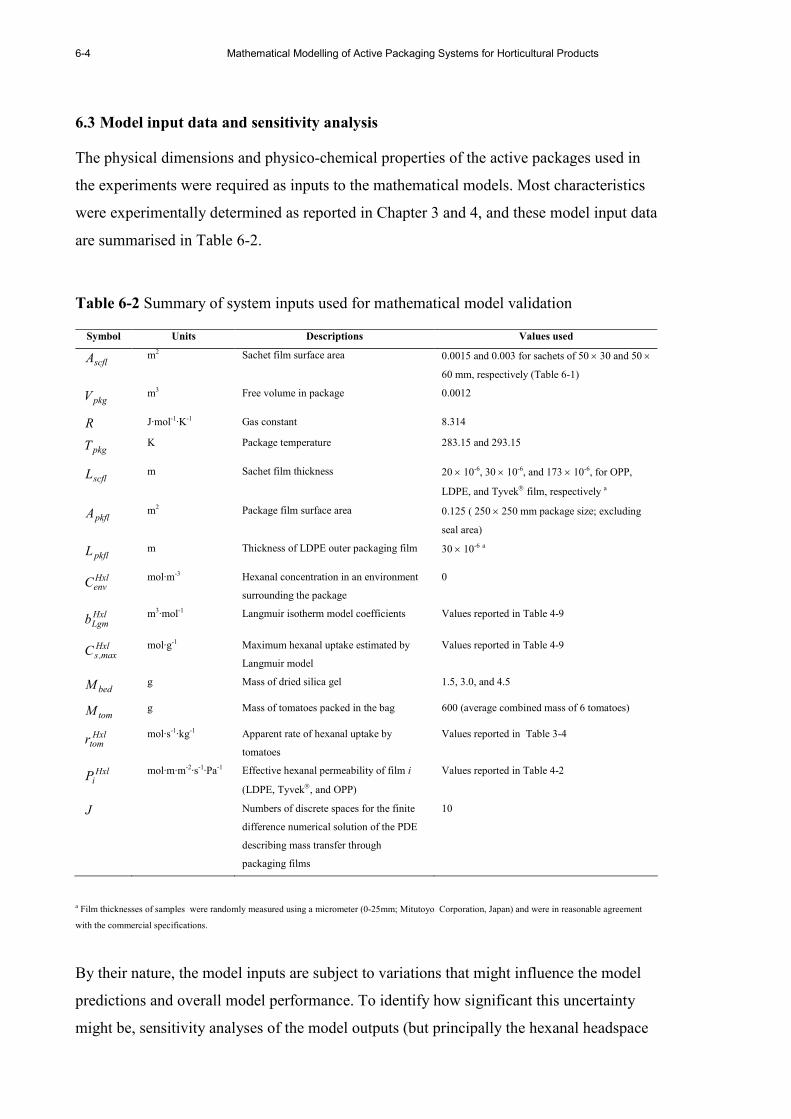
6-4 Mathematical Modelling of Active Packaging Systems for Horticultural Products
6.3 Model input data and sensitivity analysis
The physical dimensions and physico-chemical properties of the active packages used in
the experiments were required as inputs to the mathematical models. Most characteristics
were experimentally determined as reported in Chapter 3 and 4, and these model input data
are summarised in Table 6-2.
Table 6-2 Summary of system inputs used for mathematical model validation
Symbol Units Descriptions Values used
scflA m2 Sachet film surface area 0.0015 and 0.003 for sachets of 50 × 30 and 50 ×
60 mm, respectively (Table 6-1)
pkgV m3 Free volume in package 0.0012
R J·mol-1·K-1 Gas constant 8.314
pkgT K Package temperature 283.15 and 293.15
scflL m Sachet film thickness 20 × 10-6, 30 × 10-6, and 173 × 10-6, for OPP,
LDPE, and Tyvek film, respectively a
pkflA m2 Package film surface area 0.125 ( 250 × 250 mm package size; excluding
seal area)
pkflL m Thickness of LDPE outer packaging film 30 × 10-6 a
HxlenvC
mol·m-3 Hexanal concentration in an environment
surrounding the package
0
HxlLgmb
m3·mol-1 Langmuir isotherm model coefficients Values reported in Table 4-9
Hxlmax,sC
mol·g-1 Maximum hexanal uptake estimated by
Langmuir model
Values reported in Table 4-9
bedM g Mass of dried silica gel 1.5, 3.0, and 4.5
tomM g Mass of tomatoes packed in the bag 600 (average combined mass of 6 tomatoes)
Hxltomr
mol·s-1·kg-1 Apparent rate of hexanal uptake by
tomatoes
Values reported in Table 3-4
HxliP
mol·m·m-2·s-1·Pa-1 Effective hexanal permeability of film i
(LDPE, Tyvek, and OPP)
Values reported in Table 4-2
J Numbers of discrete spaces for the finite
difference numerical solution of the PDE
describing mass transfer through
packaging films
10
a Film thicknesses of samples were randomly measured using a micrometer (0-25mm; Mitutoyo Corporation, Japan) and were in reasonable agreement
with the commercial specifications.
By their nature, the model inputs are subject to variations that might influence the model
predictions and overall model performance. To identify how significant this uncertainty
might be, sensitivity analyses of the model outputs (but principally the hexanal headspace
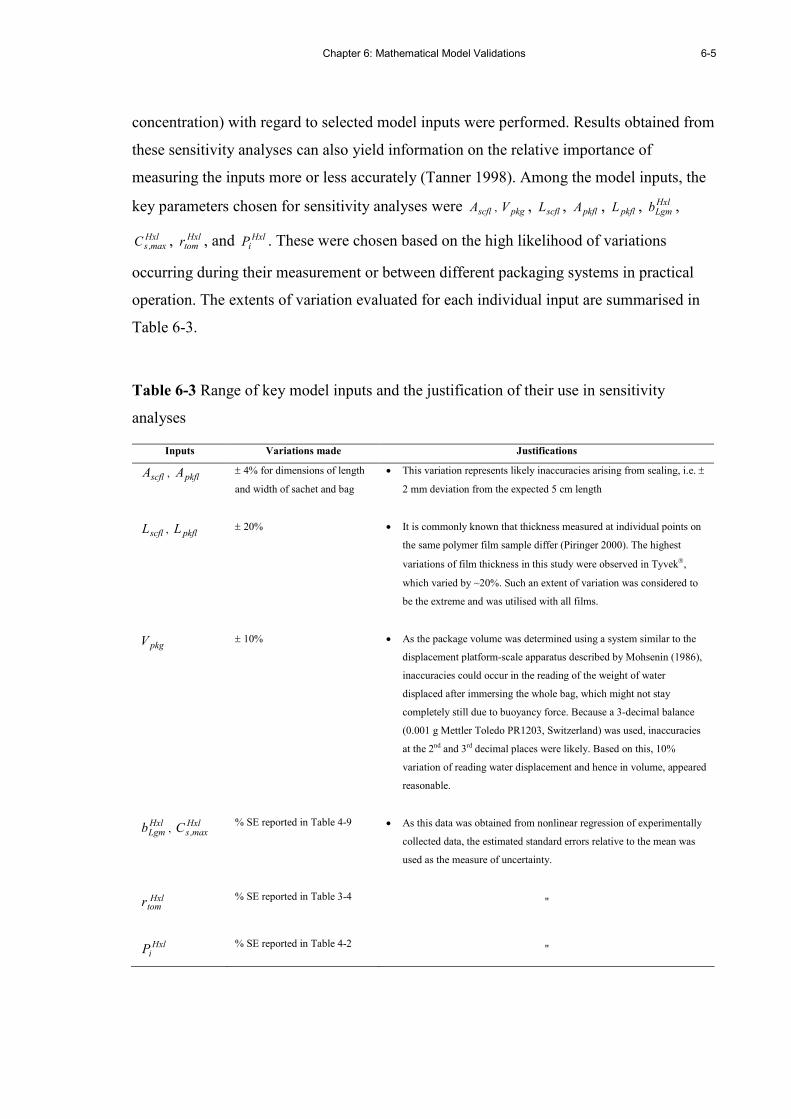
Chapter 6: Mathematical Model Validations
6-5
concentration) with regard to selected model inputs were performed. Results obtained from
these sensitivity analyses can also yield information on the relative importance of
measuring the inputs more or less accurately (Tanner 1998). Among the model inputs, the
key parameters chosen for sensitivity analyses were scflA , pkgV , scflL , pkflA , pkflL , HxlLgmb ,
Hxlmax,sC , Hxl
tomr , and HxliP . These were chosen based on the high likelihood of variations
occurring during their measurement or between different packaging systems in practical
operation. The extents of variation evaluated for each individual input are summarised in
Table 6-3.
Table 6-3 Range of key model inputs and the justification of their use in sensitivity
analyses
Inputs Variations made Justifications
scflA , pkflA ± 4% for dimensions of length
and width of sachet and bag
• This variation represents likely inaccuracies arising from sealing, i.e. ±
2 mm deviation from the expected 5 cm length
scflL , pkflL ± 20% • It is commonly known that thickness measured at individual points on
the same polymer film sample differ (Piringer 2000). The highest
variations of film thickness in this study were observed in Tyvek,
which varied by ~20%. Such an extent of variation was considered to
be the extreme and was utilised with all films.
pkgV ± 10% • As the package volume was determined using a system similar to the
displacement platform-scale apparatus described by Mohsenin (1986),
inaccuracies could occur in the reading of the weight of water
displaced after immersing the whole bag, which might not stay
completely still due to buoyancy force. Because a 3-decimal balance
(0.001 g Mettler Toledo PR1203, Switzerland) was used, inaccuracies
at the 2nd and 3rd decimal places were likely. Based on this, 10%
variation of reading water displacement and hence in volume, appeared
reasonable.
HxlLgmb ,
Hxlmax,sC
% SE reported in Table 4-9 • As this data was obtained from nonlinear regression of experimentally
collected data, the estimated standard errors relative to the mean was
used as the measure of uncertainty.
Hxltomr
% SE reported in Table 3-4 "
HxliP
% SE reported in Table 4-2 "

6-6 Mathematical Modelling of Active Packaging Systems for Horticultural Products
6.4 Experimental results and discussion of model performance
Comparisons of experimentally collected data and model predictions are presented and
discussed in the following sections, together with the sensitivity analyses.
6.4.1 Effects of sachet loading on the package headspace hexanal concentration
This discussion of model performance firstly focuses on model packages containing a
sealed glass jar; thereafter model predictions of the effects of packaged tomatoes on the
accumulation of hexanal in the package headspace are discussed. The tested active MA
packages selected for study in this section were LD1, LD2, and LD3 (Table 6-1).
6.4.1.1 Model predictions for packages containing sealed glass jars
The effect of increasing silica gel loadings on hexanal release and accumulation in the
package headspace can be seen in Figure 6-2A together with the model predictions. As
expected, these data show that including higher masses of hexanal-saturated silica gel in
the sachet produced higher initial peaks in headspace hexanal concentration. However the
quasi steady-state concentrations achieved after this initial release were similar and in the
range of the MIC (40-70 ppm; determined in Chapter 3) for all model packages.
The model predictions were in partial agreement with the experimental data and in
particular, the model predicted overall trend and the quasi steady-state concentration quite
well. A lack of fit was noticeable during the unsteady-state region (especially within the
initial 12 h of the storage period, as shown in Figure 6-2B), although the model predicted
the correct trend of hexanal release. The model predicted higher and earlier peaks than
actually observed.

Chapter 6: Mathematical Model Validations
6-7
0 1 2 3 4 5 6 7
40
250
500
750
1000
1250
1500
1750
2000
2250
2500
2750
3000
3250
Storage days
Package headspace concentration (ppm)
0 5 10 15 20 25
40
250
500
750
1000
1250
1500
1750
2000
2250
2500
2750
3000
3250
Time (hours)
(A) (B)
Figure 6-2 Effects of sachet gel loading on hexanal concentration in the headspace of
package ( HxlpkhsC ) containing an inert sealed glass jar, stored at 20°C. Experimental data (at
least 3 replicates shown for each sampling time) of 1.5, 3.0 and 4.5 g loadings are
represented by ο, ◊ and + symbols, respectively, for a storage period of 7 days (A), and for
the same data expanded to look at the first 24 h (B). Model predictions for each gel mass
are shown through solid, dotted and dashed lines, respectively.
The release pattern of hexanal from the sachet was significantly influenced by the shape of
the isotherm for hexanal adsorption on silica gel adsorbents, which was assumed identical
for the adsorption and desorption isotherms (section 4.3.2). After a sachet was placed into
the package with a negligible concentration of hexanal vapour at t = 0, there was initially a
large driving force for hexanal release through the sachet film. Because of the Type I
isotherm shape (reported in Figure 4-5), as the amount of absorbed hexanal on the silica
gel ( Hxlbed,sC ) decreased slightly (Figure 6-3), the equilibrium vapour concentration above or
within the bed ( Hxlbed,gC ; also the concentration in the sachet headspace) and hence the
driving force for transfer out of the sachet, decreased dramatically (Figure 6-3). This
resulted in a rapid initial release from the sachet, followed by a prolonged period of slow
release (Figure 6-2 and Figure 6-3). Based on these results, it can be seen that the shape of
the hexanal sorption isotherm should be highly influential on the pattern of hexanal release
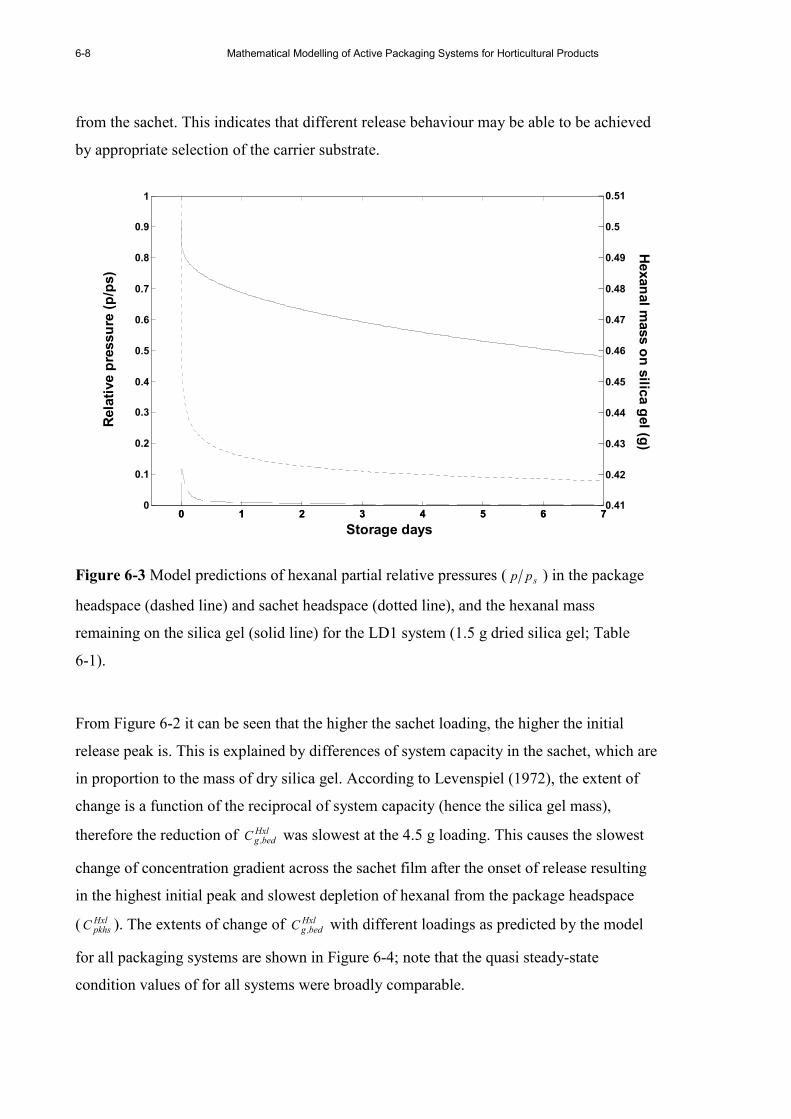
6-8 Mathematical Modelling of Active Packaging Systems for Horticultural Products
from the sachet. This indicates that different release behaviour may be able to be achieved
by appropriate selection of the carrier substrate.
0 1 2 3 4 5 6 70
0.1
0.2
0.3
0.4
0.5
0.6
0.7
0.8
0.9
1
Storage days
Relative pressure (p/ps)
0 1 2 3 4 5 6 70.41
0.42
0.43
0.44
0.45
0.46
0.47
0.48
0.49
0.5
0.51
Hexanal m
ass on silic
a gel (g
)
Figure 6-3 Model predictions of hexanal partial relative pressures ( spp ) in the package
headspace (dashed line) and sachet headspace (dotted line), and the hexanal mass
remaining on the silica gel (solid line) for the LD1 system (1.5 g dried silica gel; Table
6-1).
From Figure 6-2 it can be seen that the higher the sachet loading, the higher the initial
release peak is. This is explained by differences of system capacity in the sachet, which are
in proportion to the mass of dry silica gel. According to Levenspiel (1972), the extent of
change is a function of the reciprocal of system capacity (hence the silica gel mass),
therefore the reduction of Hxlbed,gC was slowest at the 4.5 g loading. This causes the slowest
change of concentration gradient across the sachet film after the onset of release resulting
in the highest initial peak and slowest depletion of hexanal from the package headspace
( HxlpkhsC ). The extents of change of Hxl
bed,gC with different loadings as predicted by the model
for all packaging systems are shown in Figure 6-4; note that the quasi steady-state
condition values of for all systems were broadly comparable.

Chapter 6: Mathematical Model Validations
6-9
0 1 2 3 4 5 6 70
2000
4000
6000
8000
10000
12000
Storage days
Concentration in sachet headspace (ppm)
Figure 6-4 Sachet headspace concentration ( Hxlbed,gC ) predicted for hexanal saturated initial
dried silica gel masses of 1.5, 3.0 and 4.5 g (represented by solid, dotted and dashed lines,
respectively).
The relationship between Hxlbed,gC and Hxl
pkhsC at the steady-state condition can be
mathematically represented using the generic mass balance shown in Eq. 6-1.
( ) ( ) pkgHxlpkhs
Hxlbed,g
scfl
scflHxlscfl
pkgHxlenv
Hxlpkhs
pkfl
pkflHxlpkfl
RTCCL
APRTCC
L
AP−=− (Eq. 6-1)
Given the special case where 0C Hxlenv = , Hxl
scflHxlpkfl PP = , scflpkfl LL = , constant value of pkgT , and
Apkflscfl AA ω= , (Eq. 6-1) becomes Eq. 6-2.
( )A
AHxlbed,g
Hxlpkhs
1CC
ωω+
= (Eq. 6-2)
where
Aω = Ratio of sachet to bag area
From Eq. 6-2, it can be seen that HxlpkhsC is dependent on both Hxl
bed,gC and the ratio of sachet to
bag area ( Aω ). Given slight differences in the calculated Hxlbed,gC and the same Aω value
6-10 Mathematical Modelling of Active Packaging Systems for Horticultural Products
(≈0.024), it can be inferred from Eq. 6-2 that the quasi steady-state values of HxlpkhsC for all
packages will be comparable. This behaviour is well predicted by the model (Figure 6-2A).
Suzuki et al. (2004) reported a linear relationship between the mass of active carriers (3-
12g gross mass of ethanol on a proprietary silica gel) and the peak concentrations and
accumulation patterns of ethanol vapour (Figure 6-5A) delivered from Antimold Mild
controlled release sachets (Freundlich Co. Ltd., Japan) into the headspaces of perforated
PE bags (size 18 × 28 cm; with 2 holes of 5 mm diameter on both sides of a bag)
containing broccoli branchlets (Brassica oleracea L. var. Italica), when kept at 20ºC for 5
days. The highest peak release (~3.6 ppm) and quasi steady-state ethanol concentration
was reported for the 12g-treatment. Likewise Smith et al. (1987) reported higher peaks of
ethanol vapour released from the Ethicap type E4 (representing 4g gross mass of ethanol
and proprietary silica gel; Freundlich Co. Ltd., Japan) compared to those from the type E1
(1g gross mass) (Figure 6-5B), in the headspace of a high ethanol vapour barrier pouch
(size 20 × 20 cm) containing aw-adjusted PDA agar to simulate the effects of aw (aw 0.85 to
0.99) on ethanol release and re-absorption to agar at 25ºC for 16 days. Information
reported by Suzuki et al. (2004) and Smith et al. (1987) on effects of sachet loadings on
peak releases in the package headspace support the findings reported earlier in this section.

Chapter 6: Mathematical Model Validations
6-11
0 1 2 3 4 5
0.0
0.5
1.0
1.5
2.0
2.5
3.0
3.5
4.0 3g
6g
12g
Headspace ethanol concentration (ppm)
Days
(A)
0 1 2 3 4 5 6 7 8 9 10 11 12 13 14 15 16 17
0
5000
10000
15000
20000
25000 Type E
1 + a
w 0.85
Type E1 + a
w 0.95
Type E1 + a
w 0.99
Type E4 + a
w 0.85
Type E4 + a
w 0.95
Type E4 + a
w 0.99
Headspace ethanol concentration (ppm)
Days
(B)
Figure 6-5 Changes in ethanol concentration in the atmosphere of perforated polyethylene
bags packed with broccoli branchets (digitally redrawn from Suzuki et al. 2004) (A), or
above aw-adjusted PDA plates, packaged with Ethicap type E1 and E4 in high ethanol
barrier pouch (digitally redrawn from Smith et al. 1987; note data on the 7th day of E4 + aw
0.85 was not reported) (B).
It is worth noting that the general release pattern of ethanol reported by Smith et al. (1987)
is similar to that of hexanal observed in the present work. The quasi steady-state
concentrations of ethanol were attained after the initial release peaks, suggesting a similar
Langmuir type isotherm. This is true of sorption of ethanol by silica gel as reported by
Madeley & Sing (1959) (as discussed in section 4.3.4) but there is no available information
on ethanol sorption isotherms for Ethicap (Smith et al. 1987) or Antimold Mild (Suzuki

6-12 Mathematical Modelling of Active Packaging Systems for Horticultural Products
et al. 2004). Furthermore the slower attainment of the quasi steady-state concentration
suggests different permeability behaviour of ethanol through packaging materials used by
Smith et al. (1987) and Suzuki et al. (2004) compared to that of hexanal vapour through
LDPE bag.
In Figure 6-2B, differences between the model predictions and experimental data in the
initial release phase are apparent. The model shows essentially instantaneous release
compared to ~2-3 h to attain the peak concentrations observed in the experiments. In
Figure 6-5A and B, Suzuki et al. (2004) and Smith et al. (1987) reported release peaks after
one day, however data on headspace concentrations prior to these peaks were not reported.
Because the model predictions of unsteady-state hexanal headspace concentrations are both
overestimated (especially at 1 h) and underestimated (e.g. at 4 h as in the case of the LD3
system) (Figure 6-2B), a sensitivity analysis was carried out to investigate influences of
model inputs (as shown in Table 6-3) on model predictions. The resulting predictions for
the 4.5 g sachet loading system were chosen as an example and are shown in Table 6-4.
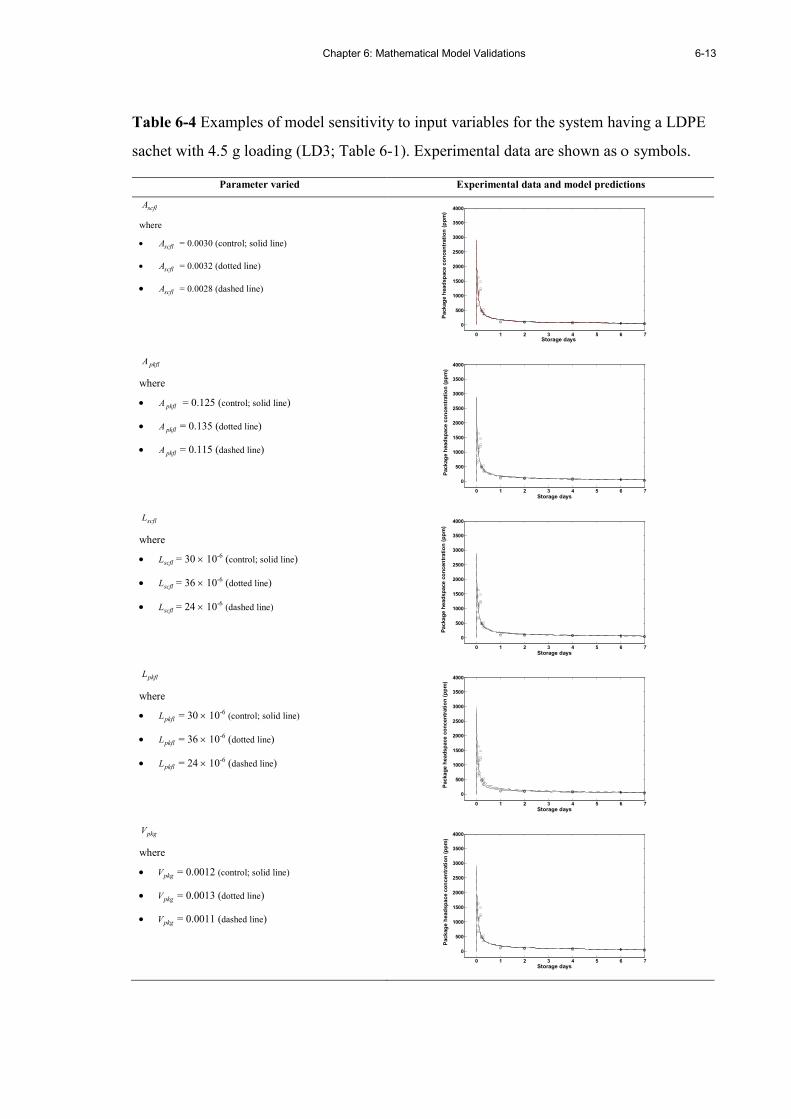
Chapter 6: Mathematical Model Validations
6-13
Table 6-4 Examples of model sensitivity to input variables for the system having a LDPE
sachet with 4.5 g loading (LD3; Table 6-1). Experimental data are shown as ο symbols.
Parameter varied Experimental data and model predictions
scflA
where
• scflA = 0.0030 (control; solid line)
• scflA = 0.0032 (dotted line)
• scflA = 0.0028 (dashed line)
0 1 2 3 4 5 6 7
0
500
1000
1500
2000
2500
3000
3500
4000
Storage days
Package headspace concentration (ppm)
pkflA
where
• pkflA = 0.125 (control; solid line)
• pkflA = 0.135 (dotted line)
• pkflA = 0.115 (dashed line)
0 1 2 3 4 5 6 7
0
500
1000
1500
2000
2500
3000
3500
4000
Storage days
Package headspace concentration (ppm)
scflL
where
• scflL = 30 × 10-6 (control; solid line)
• scflL = 36 × 10-6 (dotted line)
• scflL = 24 × 10-6 (dashed line)
0 1 2 3 4 5 6 7
0
500
1000
1500
2000
2500
3000
3500
4000
Storage days
Package headspace concentration (ppm)
pkflL
where
• pkflL = 30 × 10-6 (control; solid line)
• pkflL = 36 × 10-6 (dotted line)
• pkflL = 24 × 10-6 (dashed line)
0 1 2 3 4 5 6 7
0
500
1000
1500
2000
2500
3000
3500
4000
Storage days
Package headspace concentration (ppm)
pkgV
where
• pkgV = 0.0012 (control; solid line)
• pkgV = 0.0013 (dotted line)
• pkgV = 0.0011 (dashed line)
0 1 2 3 4 5 6 7
0
500
1000
1500
2000
2500
3000
3500
4000
Storage days
Package headspace concentration (ppm)
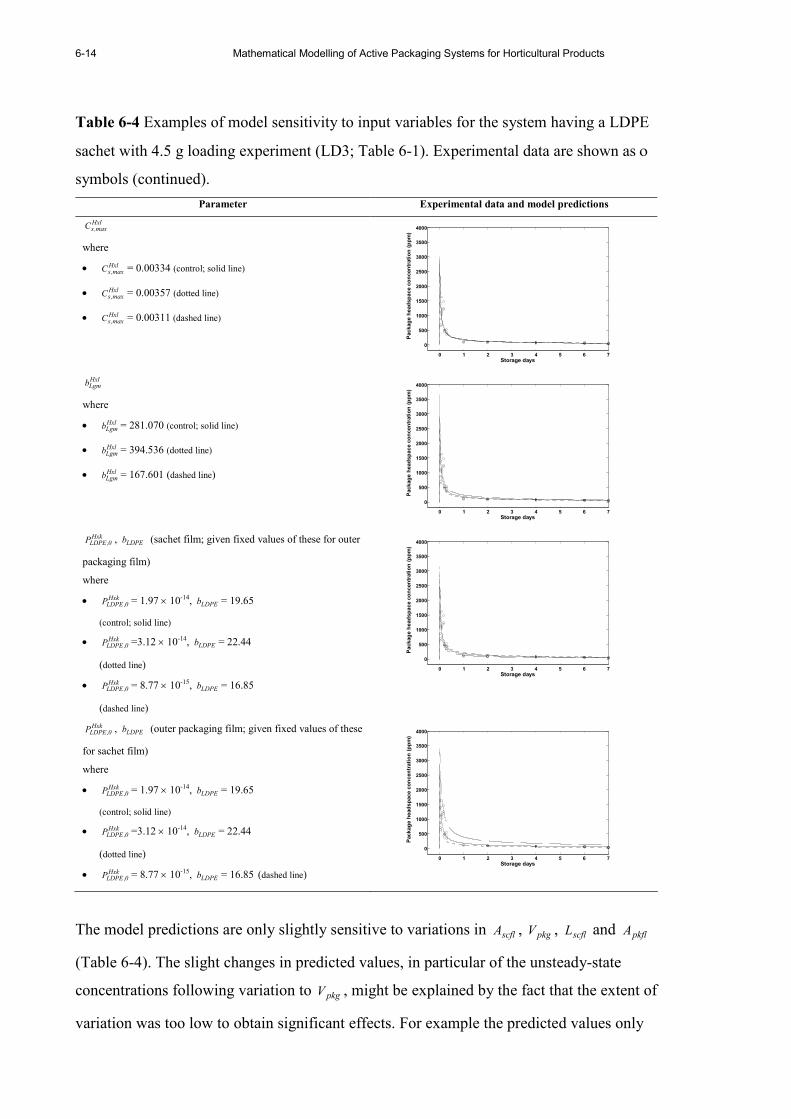
6-14 Mathematical Modelling of Active Packaging Systems for Horticultural Products
Table 6-4 Examples of model sensitivity to input variables for the system having a LDPE
sachet with 4.5 g loading experiment (LD3; Table 6-1). Experimental data are shown as ο
symbols (continued).
Parameter Experimental data and model predictions
Hxlmax,sC
where
• Hxlmax,sC = 0.00334 (control; solid line)
• Hxlmax,sC = 0.00357 (dotted line)
• Hxlmax,sC = 0.00311 (dashed line)
0 1 2 3 4 5 6 7
0
500
1000
1500
2000
2500
3000
3500
4000
Storage days
Package headspace concentration (ppm)
HxlLgmb
where
• HxlLgmb = 281.070 (control; solid line)
• HxlLgmb = 394.536 (dotted line)
• HxlLgmb = 167.601 (dashed line)
0 1 2 3 4 5 6 7
0
500
1000
1500
2000
2500
3000
3500
4000
Storage days
Package headspace concentration (ppm)
Hxk0,LDPEP , LDPEb (sachet film; given fixed values of these for outer
packaging film) where
• Hxk0,LDPEP = 1.97 × 10⁻¹⁴, LDPEb = 19.65
(control; solid line)
• Hxk0,LDPEP =3.12 × 10⁻¹⁴, LDPEb = 22.44
(dotted line)
• Hxk0,LDPEP = 8.77 × 10⁻¹⁵, LDPEb = 16.85
(dashed line)
0 1 2 3 4 5 6 7
0
500
1000
1500
2000
2500
3000
3500
4000
Storage days
Package headspace concentration (ppm)
Hxk0,LDPEP , LDPEb (outer packaging film; given fixed values of these
for sachet film) where
• Hxk0,LDPEP = 1.97 × 10⁻¹⁴, LDPEb = 19.65
(control; solid line)
• Hxk0,LDPEP =3.12 × 10⁻¹⁴, LDPEb = 22.44
(dotted line)
• Hxk0,LDPEP = 8.77 × 10⁻¹⁵, LDPEb = 16.85 (dashed line)
0 1 2 3 4 5 6 7
0
500
1000
1500
2000
2500
3000
3500
4000
Storage days
Package headspace concentration (ppm)
The model predictions are only slightly sensitive to variations in scflA , pkgV , scflL and pkflA
(Table 6-4). The slight changes in predicted values, in particular of the unsteady-state
concentrations following variation to pkgV , might be explained by the fact that the extent of
variation was too low to obtain significant effects. For example the predicted values only
Chapter 6: Mathematical Model Validations
6-15
deviate noticeably when pkgV is varied at least by 200% (data not shown). However such a
large variation is not practical in the real situation. Thus the sensitivity analysis suggests
that the effects of variations in these inputs on the model predictions can reasonably be
assumed negligible and it also indicates no further effort is required to improve existing
practices to quantify these parameters.
Moderate sensitivity of the predictions, particularly during the unsteady-state period, were
observed as a consequence of varying values of the packaging film thickness ( pkflL ) (Table
6-4). Because mass transfer of hexanal through the package film was modelled using the
PDE approach, varying the thickness would significantly affect the diffusion path of
hexanal molecules through the film. Model predictions were slightly sensitive to the
maximum hexanal adsorption on the silica gel ( Hxlmax,sC ) and quite sensitive to variations of
the Langmuir equation coefficient ( HxlLgmb )(Table 6-4) and, in particular, the permeability of
LDPE film ( HxkLDPEP ) which was used as both sachet and outer bag material. The model
prediction results were highly sensitive to HxkLDPEP variation of the outer bag, when using a
constant value of HxkLDPEP for the sachet material (Table 6-4). The intention in varying film
thickness and permeability was to demonstrate the effects of varying film permeance
(which is given by the ratio of permeability to film thickness; changing one or both
parameters could then affect the overall permeance value) which reflects changes in mass
transfer properties of the film, such as swelling (which is likely to increase film thickness
and then permeability; Piringer 2000) or other interactions that occur between VOCs and
polymers. According to Robertson (1993c), interaction between permeants and polymers
can lead to complex mass transfer behaviour.
As discussed in Chapter 4, HxlLgmb is subject to uncertainty associated with the fitting of the
isotherm by nonlinear regression. The lower sensitivity of model predictions to variation in
HxkLDPEP values for the sachet film compared to that of outer bag suggest that rate of change
of concentration at the sachet film tends to be faster than that at the outer (packaging) film.
The findings also support the discussion in Chapter 5 proposing that changes of
concentrations for the sachet film were relatively faster than to those within the package
headspace and carrier bed. Overall the high sensitivity of predicting hexanal headspace
concentrations due to HxlLgmb and Hxk
LDPEP (Table 6-4) highlights the need for improve
6-16 Mathematical Modelling of Active Packaging Systems for Horticultural Products
techniques for estimating these data. However, the results of the sensitivity analysis do
suggest that sorption isotherm data obtained from the gravimetric method and permeability
data obtained from the isostatic method were sensible and can reasonably well describe
equilibrium behaviour of hexanal for silica gel adsorbents and LDPE permeability to
hexanal vapour, respectively.
Although the sensitivity analysis illustrates the influence of input values on model
predictions, it is still uncertain why the model overestimated the headspace concentrations
measured in the first few hours, while the concentrations measured later (within the initial
24 h timeframe) were reasonably well predicted by the model when the uncertainties of
these inputs, especially those of HxlLgmb , Hxk
LDPEP and pkflL , were taken into account.
6.4.1.2 Model predictions for packages containing tomatoes
In this section, the influence of including tomatoes on the package headspace concentration
is examined because it was evident in Chapter 3 that tomatoes contribute to reducing the
hexanal concentration through their apparent hexanal uptake. Furthermore the distribution
of hexanal vapour between the various packaging components was investigated using the
model to obtain insights into the relative contribution of the different hexanal transport
processes to hexanal accumulation in the package headspace. Because tomatoes were
packaged in a non-perforated bag, MA conditions developed and the dynamics of this was
also modelled.
In Figure 6-6 it is evident that the peak height during the initial release of hexanal,
regardless of sachet loading, was attenuated to a marked degree by the presence of
tomatoes compared to when an inert equivalent volume was present. There are literature
reports of hexanal uptake by apples (Song et al. 1996; Wolford 1998) and strawberries
(Hamilton-Kemp et al. 1996) and this new data confirms hexanal uptake by tomatoes from
the headspace. Because the apparent uptake rate of hexanal by tomatoes ( Hxltomr ) had an
exponential relationship with the hexanal concentration, the attenuation of hexanal
concentration was most obvious during the establishment phase with the 4.5 g sachet
loading system.
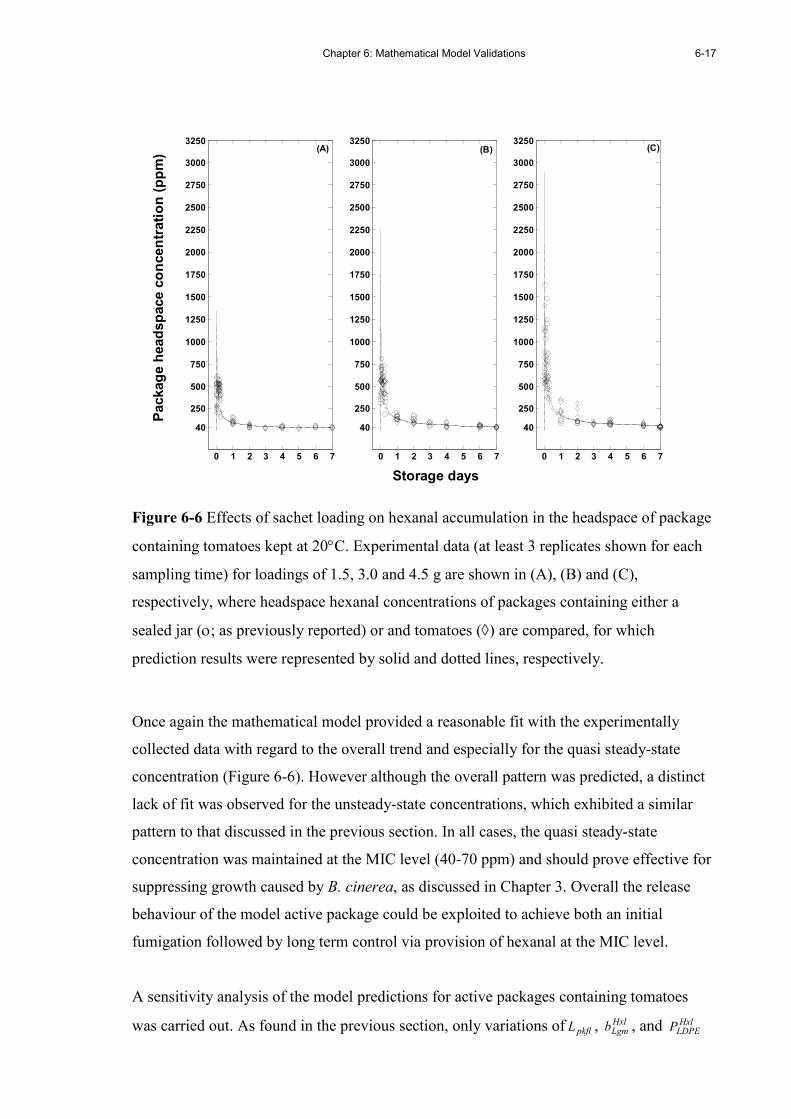
Chapter 6: Mathematical Model Validations
6-17
0 1 2 3 4 5 6 7
40
250
500
750
1000
1250
1500
1750
2000
2250
2500
2750
3000
3250
Package headspace concentration (ppm)
0 1 2 3 4 5 6 7
40
250
500
750
1000
1250
1500
1750
2000
2250
2500
2750
3000
3250
Storage days
0 1 2 3 4 5 6 7
40
250
500
750
1000
1250
1500
1750
2000
2250
2500
2750
3000
3250(A) (B) (C)
Figure 6-6 Effects of sachet loading on hexanal accumulation in the headspace of package
containing tomatoes kept at 20°C. Experimental data (at least 3 replicates shown for each
sampling time) for loadings of 1.5, 3.0 and 4.5 g are shown in (A), (B) and (C),
respectively, where headspace hexanal concentrations of packages containing either a
sealed jar (ο; as previously reported) or and tomatoes (◊) are compared, for which
prediction results were represented by solid and dotted lines, respectively.
Once again the mathematical model provided a reasonable fit with the experimentally
collected data with regard to the overall trend and especially for the quasi steady-state
concentration (Figure 6-6). However although the overall pattern was predicted, a distinct
lack of fit was observed for the unsteady-state concentrations, which exhibited a similar
pattern to that discussed in the previous section. In all cases, the quasi steady-state
concentration was maintained at the MIC level (40-70 ppm) and should prove effective for
suppressing growth caused by B. cinerea, as discussed in Chapter 3. Overall the release
behaviour of the model active package could be exploited to achieve both an initial
fumigation followed by long term control via provision of hexanal at the MIC level.
A sensitivity analysis of the model predictions for active packages containing tomatoes
was carried out. As found in the previous section, only variations of pkflL , HxlLgmb , and Hxl
LDPEP
6-18 Mathematical Modelling of Active Packaging Systems for Horticultural Products
appeared to affect model predictions. Therefore the sensitivity analysis focused on these
parameters, in addition to Hxltomr . The resulting predictions for the 4.5 g sachet loading are
shown in the Appendix H.2 (Table H-1). The model predictions were most sensitive to
variations in pkflL , HxlLgmb , and Hxl
LDPEP (of both sachet and outer packaging films), and were not
sensitive to Hxltomr . With regard to Hxl
Lgmb , and HxlLDPEP , the results of the sensitivity analysis again
confirmed the need for better techniques for estimating these values.
The similar quasi steady-state concentrations of all tested active MA packages, regardless
of the type of package contents (tomatoes or an inert seal jar), can be explained by the
relatively high rate of hexanal permeation across the package film compared to the rate of
hexanal uptake by tomatoes. Figure 6-7 illustrates the differences in the mass of hexanal
lost through the packaging film and that utilised by the tomatoes as predicted by the model
(using LD1; Table 6-1 as an example). At the end of the experimental period, the amounts
of hexanal mass permeating through the packaging film were more than 8-fold higher than
those consumed through uptake processes. The hexanal mass associated with the tomatoes
appeared constant within ~24 hours after the initial release of hexanal, while the amount of
hexanal mass crossing the film steadily increased with storage duration. The constant mass
uptake by tomatoes presumably results from the concentration dependent characteristics of
Hxltomr . As headspace hexanal concentrations rapidly decreased and stabilised at the low
quasi steady-state concentration range, Hxltomr then became very low.
The model simulations, as shown in Figure 6-7, suggest that hexanal accumulation in the
package headspace is chiefly governed by the transfer processes across the packaging film,
in addition to release of hexanal vapour from the sachet, rather than being governed by
uptake by the tomatoes ( Hxltomr ). For this simulation, the hexanal mass in the package
headspace was calculated at ~0.005 g on day 7 which is very low compared with both the
mass transferred through the outer packaging film and utilised by the tomatoes. Figure 6-7
also illustrates that only ~8.7% of the hexanal mass on silica gel was removed during the
7-day period. This is consistent with the shape of the Langmuir sorption isotherm as
discussed in the previous section (but is undesirable from economic and environmental
viewpoints).
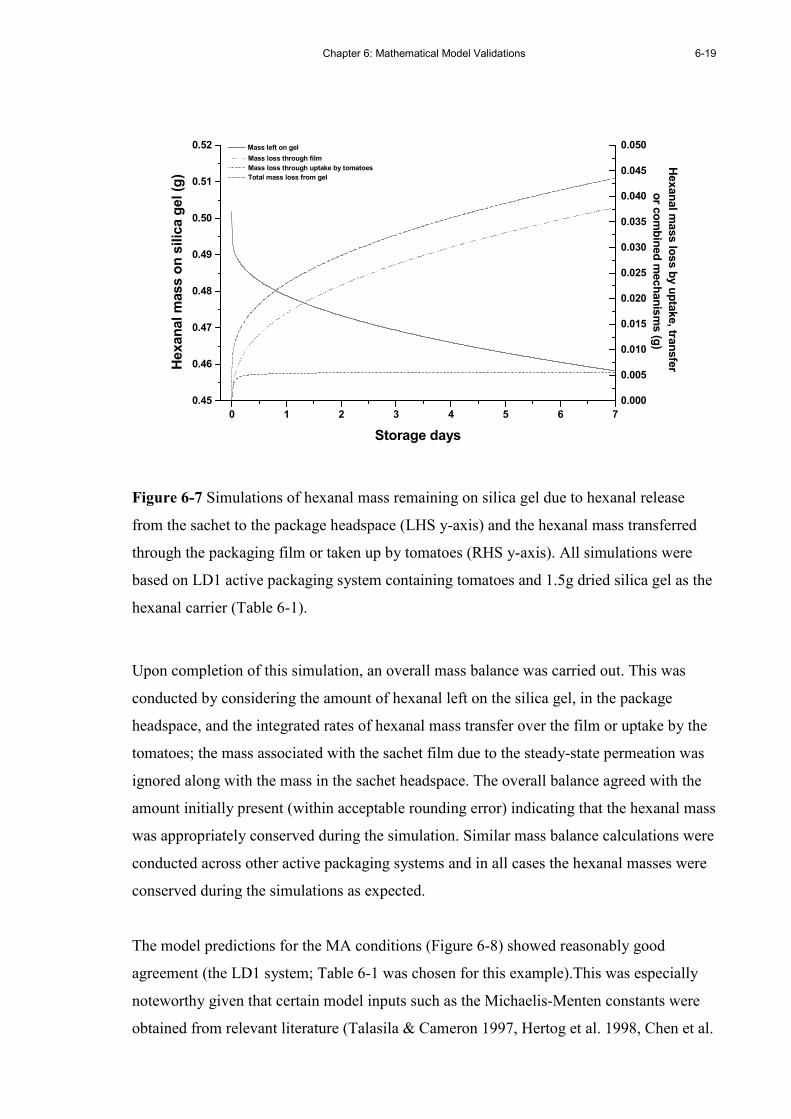
Chapter 6: Mathematical Model Validations
6-19
0 1 2 3 4 5 6 7
0.45
0.46
0.47
0.48
0.49
0.50
0.51
0.52
Hexanal m
ass loss by uptake, tra
nsfer
or combined mechanisms (g)
Mass left on gel
Hexanal mass on silica gel (g)
Storage days
0.000
0.005
0.010
0.015
0.020
0.025
0.030
0.035
0.040
0.045
0.050 Mass loss through film
Mass loss through uptake by tomatoes
Total mass loss from gel
Figure 6-7 Simulations of hexanal mass remaining on silica gel due to hexanal release
from the sachet to the package headspace (LHS y-axis) and the hexanal mass transferred
through the packaging film or taken up by tomatoes (RHS y-axis). All simulations were
based on LD1 active packaging system containing tomatoes and 1.5g dried silica gel as the
hexanal carrier (Table 6-1).
Upon completion of this simulation, an overall mass balance was carried out. This was
conducted by considering the amount of hexanal left on the silica gel, in the package
headspace, and the integrated rates of hexanal mass transfer over the film or uptake by the
tomatoes; the mass associated with the sachet film due to the steady-state permeation was
ignored along with the mass in the sachet headspace. The overall balance agreed with the
amount initially present (within acceptable rounding error) indicating that the hexanal mass
was appropriately conserved during the simulation. Similar mass balance calculations were
conducted across other active packaging systems and in all cases the hexanal masses were
conserved during the simulations as expected.
The model predictions for the MA conditions (Figure 6-8) showed reasonably good
agreement (the LD1 system; Table 6-1 was chosen for this example).This was especially
noteworthy given that certain model inputs such as the Michaelis-Menten constants were
obtained from relevant literature (Talasila & Cameron 1997, Hertog et al. 1998, Chen et al.

6-20 Mathematical Modelling of Active Packaging Systems for Horticultural Products
2000; also see Appendix G.2.3). Agreement was best for the quasi steady-state MA
conditions and the gaseous atmospheres developed in the active packaging systems in the
present study were reasonably comparable to those reported by Charles et al. (2003) for an
O2 scavenger-active MAP system for storage of tomatoes at 20ºC (~6-7% O2 and ~5% CO2
in LDPE bag containing ~840-860g intact tomatoes).
0 1 2 3 4 5 6 70
5
10
15
20
25
Storage days
MA concentration (%)
Predicted oxygen
Predicted carbon dioxide
Figure 6-8 Measured and predicted headspace gas at 20ºC (2 replicates shown for each
sampling time) measured in active (ο and •, for O2 and CO2, respectively) and passive (◊
and ♦, for O2 and CO2, respectively) MA packages. The dotted and dashed lines are the
MA model predictions.
In Chapter 3 it was shown that respiration rates were minimally affected by hexanal vapour
at the MIC concentration under MA conditions. This finding is supported by the results in
Figure 6-8 where there is little difference between experiments with and without the
hexanal release sachet. The literature also supports a minimal effect of the presence of
volatile active agents on the development of MA conditions for other horticultural
products. For example Serrano et al. (2005) reported that the presence of the essential oils
eugenol, thymol, eucalyptol and menthol in the package resulting from their release from
active systems (gauze samples individually saturated with each compound) did not
influence the equilibrium MA levels of O2 and CO2 (developed at both 1 and 20ºC) in OPP
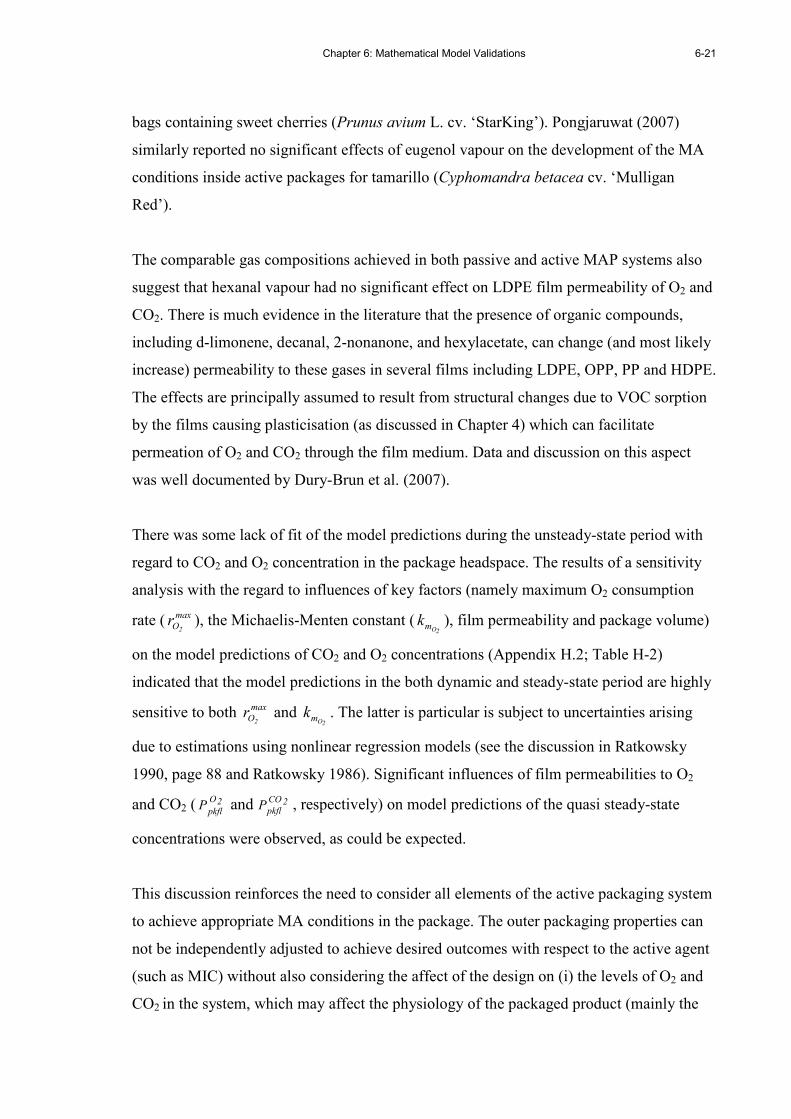
Chapter 6: Mathematical Model Validations
6-21
bags containing sweet cherries (Prunus avium L. cv. ‘StarKing’). Pongjaruwat (2007)
similarly reported no significant effects of eugenol vapour on the development of the MA
conditions inside active packages for tamarillo (Cyphomandra betacea cv. ‘Mulligan
Red’).
The comparable gas compositions achieved in both passive and active MAP systems also
suggest that hexanal vapour had no significant effect on LDPE film permeability of O2 and
CO2. There is much evidence in the literature that the presence of organic compounds,
including d-limonene, decanal, 2-nonanone, and hexylacetate, can change (and most likely
increase) permeability to these gases in several films including LDPE, OPP, PP and HDPE.
The effects are principally assumed to result from structural changes due to VOC sorption
by the films causing plasticisation (as discussed in Chapter 4) which can facilitate
permeation of O2 and CO2 through the film medium. Data and discussion on this aspect
was well documented by Dury-Brun et al. (2007).
There was some lack of fit of the model predictions during the unsteady-state period with
regard to CO2 and O2 concentration in the package headspace. The results of a sensitivity
analysis with the regard to influences of key factors (namely maximum O2 consumption
rate ( max
O2r ), the Michaelis-Menten constant (
2Omk ), film permeability and package volume)
on the model predictions of CO2 and O2 concentrations (Appendix H.2; Table H-2)
indicated that the model predictions in the both dynamic and steady-state period are highly
sensitive to both max
O2r and
2Omk . The latter is particular is subject to uncertainties arising
due to estimations using nonlinear regression models (see the discussion in Ratkowsky
1990, page 88 and Ratkowsky 1986). Significant influences of film permeabilities to O2
and CO2 ( 2O
pkflP and 2CO
pkflP , respectively) on model predictions of the quasi steady-state
concentrations were observed, as could be expected.
This discussion reinforces the need to consider all elements of the active packaging system
to achieve appropriate MA conditions in the package. The outer packaging properties can
not be independently adjusted to achieve desired outcomes with respect to the active agent
(such as MIC) without also considering the affect of the design on (i) the levels of O2 and
CO2 in the system, which may affect the physiology of the packaged product (mainly the
6-22 Mathematical Modelling of Active Packaging Systems for Horticultural Products
respiration rate), and/or (ii) on physico-chemical properties of the packaging films (such as
packaging film permeabilities to O2 and CO2) that determine the final MA condition.
6.4.2 Effects of the ratio of sachet to package surface area ( Aω ) on the package
headspace hexanal concentrations
All tested active MA packages used in the previous validation experiments had the same
ratio of sachet to bag area ( Aω ≈ 0.024, Table 6-1). In this section, how varying this ratio
affected the hexanal concentration in the package headspace is reported. To achieve
various relative area ratios the surface area of the sachets was varied whilst that of the
outer bags was kept constant. The tested packages utilised for this purpose were referred to
as LD5 and LD6 (Table 6-1) with Aω values of 0.012 and 0.048, respectively.
Experimental results and model predictions for these were compared to those of LD1 ( Aω
≈ 0.024), as this ratio was extensively used in the present study. It should be noted that
LD1 and LD5 have a same sachet gel loading (1.5g), while the loading of LD6 was higher
at 3.0g.
Figure 6-9A shows the experimental results and model predictions for LD1, LD5, and LD6
for 7 days storage at 20ºC. Initial unsteady-state concentrations measured in the LD6
system were approximately 2-fold higher than those measured in the other systems.
However differences between LD1 and LD5 were not clear, even though a few data points
of higher concentrations (at ~1-2 h) were measured in LD5 (Figure 6-9B). Model
predictions followed the usual release trend, however a lack of fit between model
predictions and experimental data was apparent and similar to that discussed in the
previous sections.
More apparent effects of surface area ratio on headspace concentration can be observed in
the quasi steady-state period (Figure 6-9A). For example by reducing the sachet area by
50%, the experimental quasi steady-steady concentrations of LD5 (i.e. 17-24 ppm) were
proportionally lower than those of LD1 (i.e. 32-40 ppm). As LD6 had a higher sachet
loading (double that of both LD1 and LD5) and sachet area (double and four times that of
LD1 and LD5, respectively), its quasi steady-state concentration level is thus the highest.
The mathematical model reasonably well predicted such observations (Figure 6-9A).
Chapter 6: Mathematical Model Validations
6-23
0 1 2 3 4 5 6 7
40
250
500
750
1000
1250
1500
1750
2000
2250
2500
2750
3000
3250
Storage days
Package headspace concentration (ppm)
0 5 10 15 20 25
40
250
500
750
1000
1250
1500
1750
2000
2250
2500
2750
3000
3250
Time (hours)
0.024 (LD1)
0.012 (LD5)
0.048 (LD6)
(A) (B)
Figure 6-9 Measured and predicted hexanal concentration in the active package (at least 3
replicates shown for each sampling time), for different ratios of sachet to bag area ( Aω ):
0.024 (ο; LD1), 0.012 (◊; LD5), and 0.048 (+; LD6), for storage period of 7 days at 20°C
(A) and the same data expanded to look at the first 24 h (B). Model predictions are shown
through solid, dotted and dashed lines, respectively.
Because of the lack of fit noted during the unsteady-state period, a sensitivity analysis was
performed using the LD6 system as an example. The results are graphically presented in
Appendix H.2 (Table H-3). Model predictions were sensitive to variations in all chosen
model inputs. The results of the sensitivity analysis are consistent with those reported in
previous sections and again confirm the need to improve estimations of HxlLDPEP and Hxl
Lgmb in
particular.
6.4.3 Effects of the type of sachet film on the package headspace hexanal
concentration
From previous sections it was evident that the model reasonably well predicted trends in
the dynamic phase and quasi steady-state headspace hexanal concentrations for a range of
design variables, including the presence or absence of tomatoes in the package and the
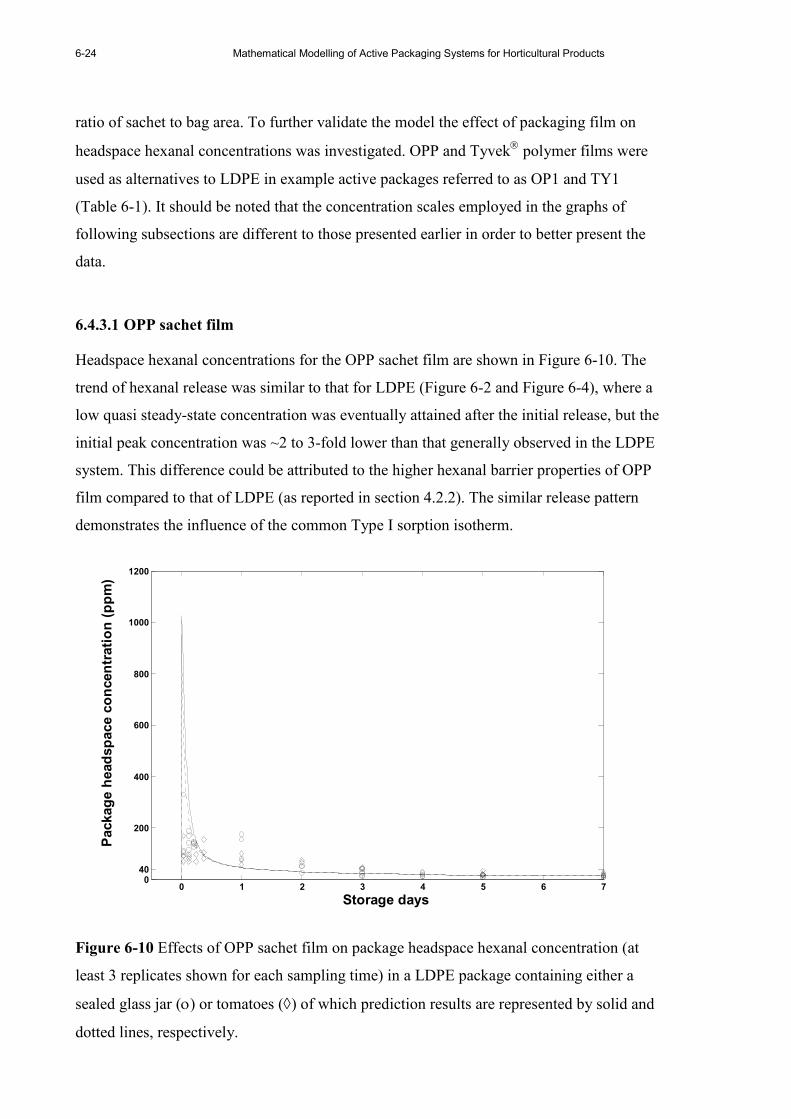
6-24 Mathematical Modelling of Active Packaging Systems for Horticultural Products
ratio of sachet to bag area. To further validate the model the effect of packaging film on
headspace hexanal concentrations was investigated. OPP and Tyvek polymer films were
used as alternatives to LDPE in example active packages referred to as OP1 and TY1
(Table 6-1). It should be noted that the concentration scales employed in the graphs of
following subsections are different to those presented earlier in order to better present the
data.
6.4.3.1 OPP sachet film
Headspace hexanal concentrations for the OPP sachet film are shown in Figure 6-10. The
trend of hexanal release was similar to that for LDPE (Figure 6-2 and Figure 6-4), where a
low quasi steady-state concentration was eventually attained after the initial release, but the
initial peak concentration was ~2 to 3-fold lower than that generally observed in the LDPE
system. This difference could be attributed to the higher hexanal barrier properties of OPP
film compared to that of LDPE (as reported in section 4.2.2). The similar release pattern
demonstrates the influence of the common Type I sorption isotherm.
0 1 2 3 4 5 6 7040
200
400
600
800
1000
1200
Storage days
Package headspace concentration (ppm)
Figure 6-10 Effects of OPP sachet film on package headspace hexanal concentration (at
least 3 replicates shown for each sampling time) in a LDPE package containing either a
sealed glass jar (ο) or tomatoes (◊) of which prediction results are represented by solid and
dotted lines, respectively.
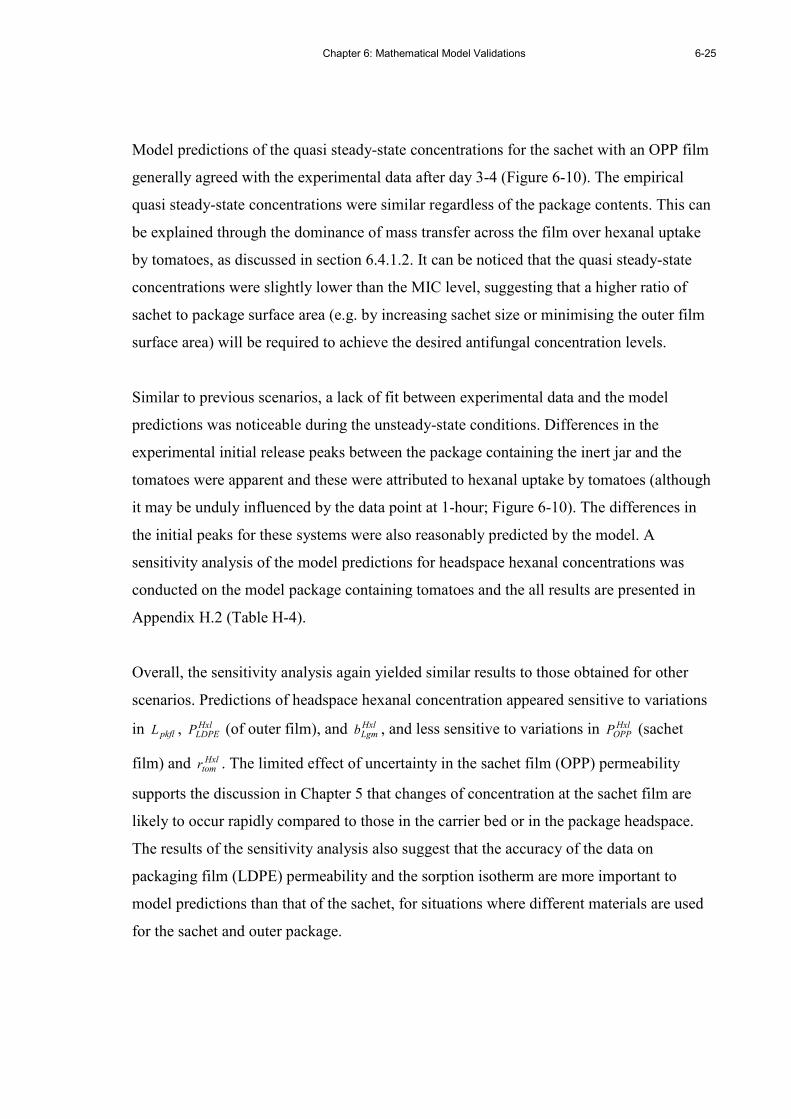
Chapter 6: Mathematical Model Validations
6-25
Model predictions of the quasi steady-state concentrations for the sachet with an OPP film
generally agreed with the experimental data after day 3-4 (Figure 6-10). The empirical
quasi steady-state concentrations were similar regardless of the package contents. This can
be explained through the dominance of mass transfer across the film over hexanal uptake
by tomatoes, as discussed in section 6.4.1.2. It can be noticed that the quasi steady-state
concentrations were slightly lower than the MIC level, suggesting that a higher ratio of
sachet to package surface area (e.g. by increasing sachet size or minimising the outer film
surface area) will be required to achieve the desired antifungal concentration levels.
Similar to previous scenarios, a lack of fit between experimental data and the model
predictions was noticeable during the unsteady-state conditions. Differences in the
experimental initial release peaks between the package containing the inert jar and the
tomatoes were apparent and these were attributed to hexanal uptake by tomatoes (although
it may be unduly influenced by the data point at 1-hour; Figure 6-10). The differences in
the initial peaks for these systems were also reasonably predicted by the model. A
sensitivity analysis of the model predictions for headspace hexanal concentrations was
conducted on the model package containing tomatoes and the all results are presented in
Appendix H.2 (Table H-4).
Overall, the sensitivity analysis again yielded similar results to those obtained for other
scenarios. Predictions of headspace hexanal concentration appeared sensitive to variations
in pkflL , HxlLDPEP (of outer film), and Hxl
Lgmb , and less sensitive to variations in HxlOPPP (sachet
film) and Hxltomr . The limited effect of uncertainty in the sachet film (OPP) permeability
supports the discussion in Chapter 5 that changes of concentration at the sachet film are
likely to occur rapidly compared to those in the carrier bed or in the package headspace.
The results of the sensitivity analysis also suggest that the accuracy of the data on
packaging film (LDPE) permeability and the sorption isotherm are more important to
model predictions than that of the sachet, for situations where different materials are used
for the sachet and outer package.
6-26 Mathematical Modelling of Active Packaging Systems for Horticultural Products
6.4.3.2 Tyvek sachet film
Experimental results for headspace hexanal concentrations from the Tyvek sachet
systems are illustrated in Figure 6-11. In this case the initial concentration peak of the
Tyvek system was higher than for the other films, as expected given the high hexanal
permeability of Tyvek material due to its highly porous nature (refer to Chapter 4). No
significant differences in the quasi steady-state concentration were observed between the
sealed glass jar or tomatoes and the quasi steady-state concentration was in the MIC range.
Thus a Tyvek-based sachet active packaging system should also be suitable for extending
the shelf life of tomatoes.
0 1 2 3 4 5 6 7
40
500
1000
1500
2000
2500
3000
3500
4000
Storage days
Package headspace concentration (ppm)
Figure 6-11 Effects of Tyvek sachet film on hexanal accumulation in the headspace of an
LDPE package (at least 3 replicates shown for each sampling time) containing either a
sealed glass jar (ο) or tomatoes (◊) of which model prediction results are represented by
solid and dotted lines, respectively.
For the initial unsteady-state period, the experimental data show that the headspace
concentration was again attenuated in the packages containing tomatoes compared to those
of the packages with only a sealed glass jar. This indicates significant effects of Hxltomr on
Chapter 6: Mathematical Model Validations
6-27
accumulation of hexanal vapour in the package headspace, which can be expected given
the high hexanal concentration that developed.
It is worth noting that quasi steady-state concentrations are broadly comparable for all
films, although the initial release peaks were quite different at comparable sachet loadings.
These data suggest the release patterns are likely to be governed by mass transfer across
the outer packaging film (LDPE for all trials outlined in this section) and its surface area,
regardless of the sachet system employed.
Based on studies conducted comparing sachet systems, it then can be inferred that provided
LDPE film is the outer packaging material, a LDPE film sachet with 1.5g loading can be
utilised as an alternative to Tyvek and OPP for delivering and sustaining hexanal vapour
in the package headspace within the MIC level for 7 days at 20ºC.
In Figure 6-11, the model predictions of Tyvek both underestimate the unsteady-state
experimental data and overestimate quasi steady-state concentrations for each of the inert
volume and tomato systems; a pattern opposite to those for OPP and LDPE sachet systems
as reported previously. The sensitivity analysis was conducted to investigate effects of
uncertainties in permeability to hexanal vapour of Tyvek ( HxlTyvekP ) and other inputs on
model predictions, and the results are summarised in Appendix H.2 (Table H-5).
The model predictions appeared less sensitive to variation in HxlTyvekP compared to those in
pkflL , HxlLDPEP (of outer film), and Hxl
Lgmb . The highest sensitivity of the model predictions was
obtained in respect to error in the permeability value and the predictions of the unsteady-
state concentrations appeared to be improved when HxlLDPEP was lowered (Table H-5). This
may imply that the uncertainty in permeability of the outer film may be chiefly responsible
for the underestimation of model prediction illustrated in Figure 6-11.
Influences of humidity in package headspace on the initial release of experimental data
(Figure 6-11) also can not be precluded because of the high porosity property of Tyvek
film. In particular this might be responsible for the opposite in experimental and model
prediction trend as mentioned above. In section 4.3.5, the influence of pre-adsorption of
water vapour on silica gel on hexanal uptake could not be discounted, even though the

6-28 Mathematical Modelling of Active Packaging Systems for Horticultural Products
trends were not apparent or uniform. If adsorption of water vapour (through permeation
into the sachet headspace, given ~0 (or at least low) and ~60-70% (typical ambient) RH
levels at t = 0 in the sachet and package headspaces, respectively) did cause displacement
of adsorbed hexanal molecules, this could increase the hexanal vapour concentration in the
sachet headspace and in turn the concentration gradient between sachet and package
headspace. The observed high initial release concentration could then result. However
there was no particular evidence of a significant influence of RH on hexanal release during
the quasi steady-state period where the effect of additional release of hexanal could be
expected to be greater (Figure 6-11). If RH had a significant effect, lower values of HxlLgmb ,
greater desorption of hexanal from the carrier, and higher levels of the quasi steady-state
concentration than measured should be expected.
For the OPP and LDPE sachet systems water vapour movement into the sachet is unlikely
to play a role because the permeabilities of these films to water vapour are very low (Liu et
al. 1991; Robertson 1993c; Selke et al. 2004). During long term storage however the
eventual increase in moisture content in the sachet may lead to the effects noted above.
However there was no evidence of this after the 7-day storage period, over the 14 days of
the variable temperature experiments (section 6.4.4). As noted elsewhere, this type of
behaviour could possibly be exploited to promote VOC release once high RH has
achieved, when the risk of fungal growth is increased. The high RH in package headspace
may be also utilised to promote release from the hydrophilic film sachet for which film
permeabilities tend to be increased under elevated humidity.
It is evident in the sensitivity analysis (Table H-5) that individually varying the values of
the key inputs did not yield better predictions. However promising improvements were
achieved when values for the three identified inputs were changed simultaneously in order
to change sorption equilibrium characteristics and film permeance (a combination of pkflL
and HxlLDPEP ), as illustrated in Figure 6-12. To achieve a better prediction of the quasi steady-
state concentration (dotted line; Figure 6-12), accumulation of hexanal vapour in the
package headspace should be minimised and this could be manipulated by (i) increasing
HxlLgmb , corresponding to increasing the affinity between hexanal (adsorbate) and the carrier
(adsorbents) (Gregg & Sing 1982; Adamson 1990), and (ii) elevating permeance of the
outer film (by increasing HxlLDPEP and decreasing pkflL ) which increases the rate of hexanal
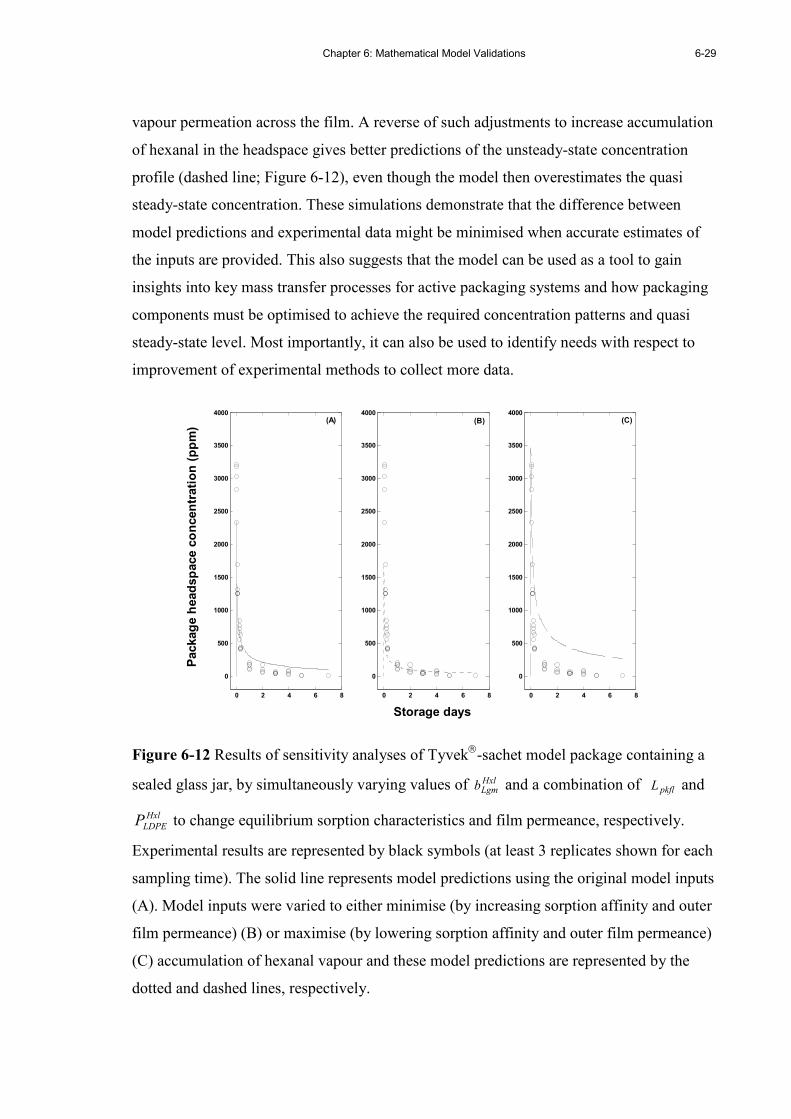
Chapter 6: Mathematical Model Validations
6-29
vapour permeation across the film. A reverse of such adjustments to increase accumulation
of hexanal in the headspace gives better predictions of the unsteady-state concentration
profile (dashed line; Figure 6-12), even though the model then overestimates the quasi
steady-state concentration. These simulations demonstrate that the difference between
model predictions and experimental data might be minimised when accurate estimates of
the inputs are provided. This also suggests that the model can be used as a tool to gain
insights into key mass transfer processes for active packaging systems and how packaging
components must be optimised to achieve the required concentration patterns and quasi
steady-state level. Most importantly, it can also be used to identify needs with respect to
improvement of experimental methods to collect more data.
0 2 4 6 8
0
500
1000
1500
2000
2500
3000
3500
4000
Package headspace concentration (ppm)
0 2 4 6 8
0
500
1000
1500
2000
2500
3000
3500
4000
Storage days
0 2 4 6 8
0
500
1000
1500
2000
2500
3000
3500
4000(A) (B) (C)
Figure 6-12 Results of sensitivity analyses of Tyvek-sachet model package containing a
sealed glass jar, by simultaneously varying values of HxlLgmb and a combination of pkflL and
Hxl
LDPEP to change equilibrium sorption characteristics and film permeance, respectively.
Experimental results are represented by black symbols (at least 3 replicates shown for each
sampling time). The solid line represents model predictions using the original model inputs
(A). Model inputs were varied to either minimise (by increasing sorption affinity and outer
film permeance) (B) or maximise (by lowering sorption affinity and outer film permeance)
(C) accumulation of hexanal vapour and these model predictions are represented by the
dotted and dashed lines, respectively.
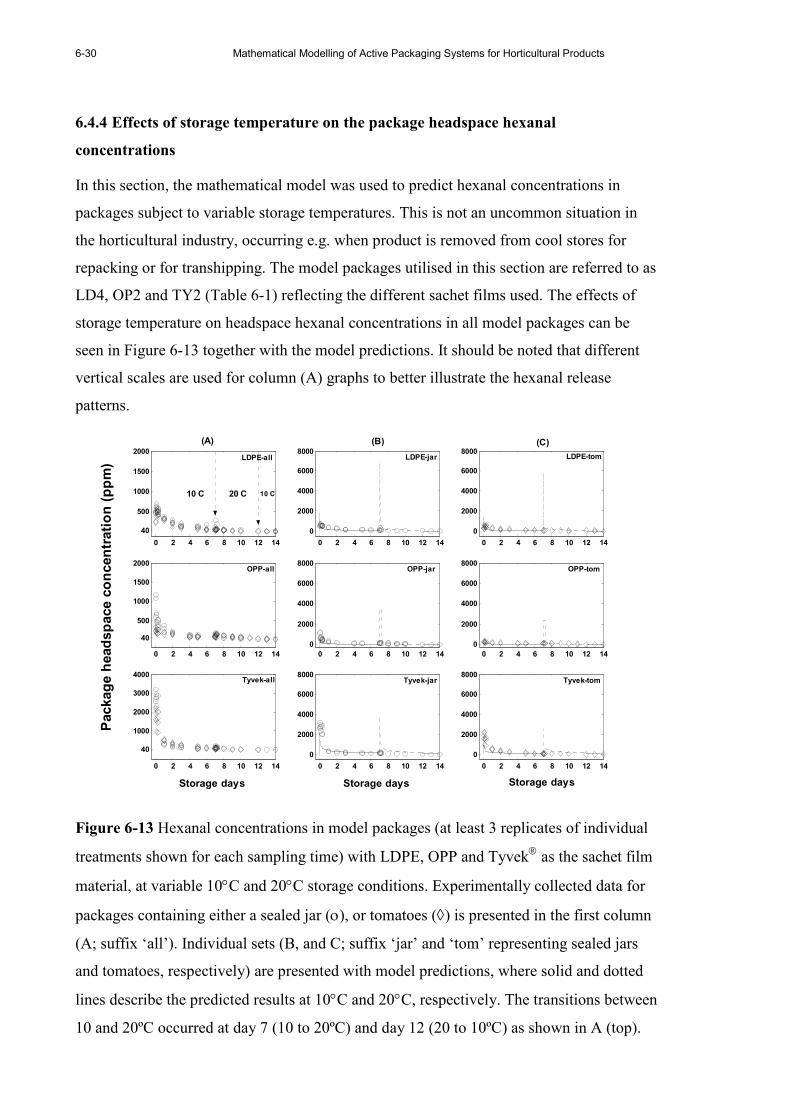
6-30 Mathematical Modelling of Active Packaging Systems for Horticultural Products
6.4.4 Effects of storage temperature on the package headspace hexanal
concentrations
In this section, the mathematical model was used to predict hexanal concentrations in
packages subject to variable storage temperatures. This is not an uncommon situation in
the horticultural industry, occurring e.g. when product is removed from cool stores for
repacking or for transhipping. The model packages utilised in this section are referred to as
LD4, OP2 and TY2 (Table 6-1) reflecting the different sachet films used. The effects of
storage temperature on headspace hexanal concentrations in all model packages can be
seen in Figure 6-13 together with the model predictions. It should be noted that different
vertical scales are used for column (A) graphs to better illustrate the hexanal release
patterns.
0 2 4 6 8 10 12 14
40
500
1000
1500
2000
0 2 4 6 8 10 12 14
0
2000
4000
6000
8000
0 2 4 6 8 10 12 14
0
2000
4000
6000
8000
0 2 4 6 8 10 12 14
40
500
1000
1500
2000
Package headspace concentration (ppm)
0 2 4 6 8 10 12 14
0
2000
4000
6000
8000
0 2 4 6 8 10 12 14
0
2000
4000
6000
8000
0 2 4 6 8 10 12 14
40
1000
2000
3000
4000
Storage days
0 2 4 6 8 10 12 14
0
2000
4000
6000
8000
Storage days
0 2 4 6 8 10 12 14
0
2000
4000
6000
8000
Storage days
LDPE-all LDPE-jar LDPE-tom
OPP-all OPP-jar OPP-tom
Tyvek-all Tyvek-jar Tyvek-tom
10 C 20 C 10 C
(A) (B) (C)
Figure 6-13 Hexanal concentrations in model packages (at least 3 replicates of individual
treatments shown for each sampling time) with LDPE, OPP and Tyvek as the sachet film
material, at variable 10°C and 20°C storage conditions. Experimentally collected data for
packages containing either a sealed jar (ο), or tomatoes (◊) is presented in the first column
(A; suffix ‘all’). Individual sets (B, and C; suffix ‘jar’ and ‘tom’ representing sealed jars
and tomatoes, respectively) are presented with model predictions, where solid and dotted
lines describe the predicted results at 10°C and 20°C, respectively. The transitions between
10 and 20ºC occurred at day 7 (10 to 20ºC) and day 12 (20 to 10ºC) as shown in A (top).
Chapter 6: Mathematical Model Validations
6-31
At 10ºC, the release pattern of hexanal from the sachet and hexanal accumulation in the
package during the first 7-day storage period was similar to that observed in the
experiments conducted solely at 20ºC, where there was an initial high concentration peak
which declined to a relatively low quasi steady-state concentration. No effect of tomatoes
on the attenuation of the initial release peaks at 10ºC was apparent. This could be
explained by the low apparent rate of hexanal uptake by tomatoes as a result of the low
hexanal concentrations in the package headspace. While there were no clear differences in
the dynamic concentrations between the OPP and LDPE systems, there were a few
unexpectedly high headspace concentrations measured in the OPP sachet active MA
package (without tomatoes; B middle). The results appear to be opposite to the known (and
measured) lower permeability of OPP compared to that of LDPE. Furthermore the
attainment of quasi steady-state concentrations after the initial release peak in the LDPE
sachet systems (Figure 6-13A, top) appeared to take longer than those observed for OPP
and Tyvek systems at 10ºC and all systems at 20ºC (as reported previously). Those
systems with Tyvek as the sachet material had the highest initial release concentration as
expected (given the high porosity of Tyvek material) and the quasi steady-state
concentrations were rapidly attained after the initial release peak (Figure 6-13A). The
mathematical model predicted the quasi steady-state concentrations well, although some
lack of fit was noticeable for the unsteady-state concentration regions (Figure 6-13B and
C).
It was evident that the quasi steady-state concentrations observed in all model packages
were maintained at the MIC or above. Although the MIC was quantified at 20ºC, this
concentration should also be effective at the lower storage temperatures because
proliferation of B. cinerea (and other spoilage microorganisms) is less likely at lower
temperatures (Adaskaveg et al. 2002). Cool storage conditions (e.g. 10ºC) have long been
utilised in transport and packaging practices for horticultural products, including tomatoes,
to minimise microbial growth and biological activities (Robinson et al. 1975; Kader &
Saltveit 2003a).
After some packages were transferred from 10ºC to 20ºC, there was a secondary release of
hexanal into the package atmosphere. Of the active MA packages investigated, the most
obvious secondary peak occurred when LDPE was the sachet material and a sealed glass
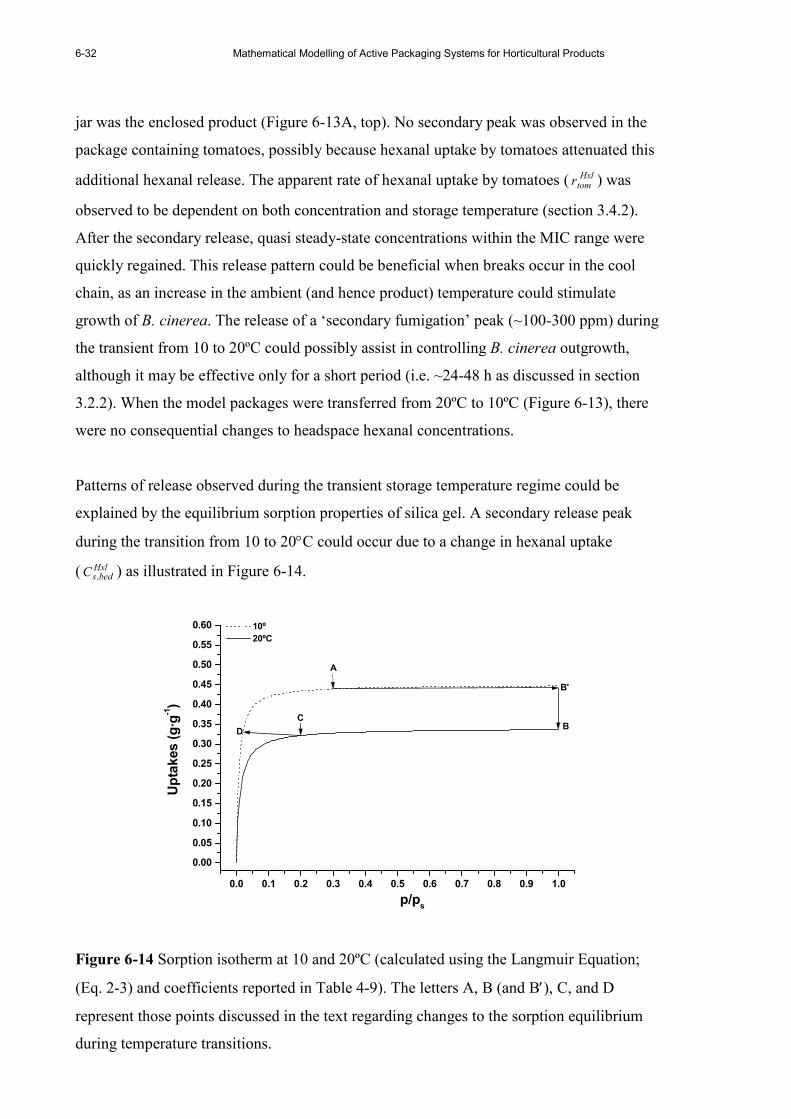
6-32 Mathematical Modelling of Active Packaging Systems for Horticultural Products
jar was the enclosed product (Figure 6-13A, top). No secondary peak was observed in the
package containing tomatoes, possibly because hexanal uptake by tomatoes attenuated this
additional hexanal release. The apparent rate of hexanal uptake by tomatoes ( Hxltomr ) was
observed to be dependent on both concentration and storage temperature (section 3.4.2).
After the secondary release, quasi steady-state concentrations within the MIC range were
quickly regained. This release pattern could be beneficial when breaks occur in the cool
chain, as an increase in the ambient (and hence product) temperature could stimulate
growth of B. cinerea. The release of a ‘secondary fumigation’ peak (~100-300 ppm) during
the transient from 10 to 20ºC could possibly assist in controlling B. cinerea outgrowth,
although it may be effective only for a short period (i.e. ~24-48 h as discussed in section
3.2.2). When the model packages were transferred from 20ºC to 10ºC (Figure 6-13), there
were no consequential changes to headspace hexanal concentrations.
Patterns of release observed during the transient storage temperature regime could be
explained by the equilibrium sorption properties of silica gel. A secondary release peak
during the transition from 10 to 20°C could occur due to a change in hexanal uptake
( Hxlbed,sC ) as illustrated in Figure 6-14.
0.0 0.1 0.2 0.3 0.4 0.5 0.6 0.7 0.8 0.9 1.0
0.00
0.05
0.10
0.15
0.20
0.25
0.30
0.35
0.40
0.45
0.50
0.55
0.60
B'
D
CB
A
10º
20ºC
Uptakes (g·g
-1)
p/ps
Figure 6-14 Sorption isotherm at 10 and 20ºC (calculated using the Langmuir Equation;
(Eq. 2-3) and coefficients reported in Table 4-9). The letters A, B (and B′), C, and D
represent those points discussed in the text regarding changes to the sorption equilibrium
during temperature transitions.
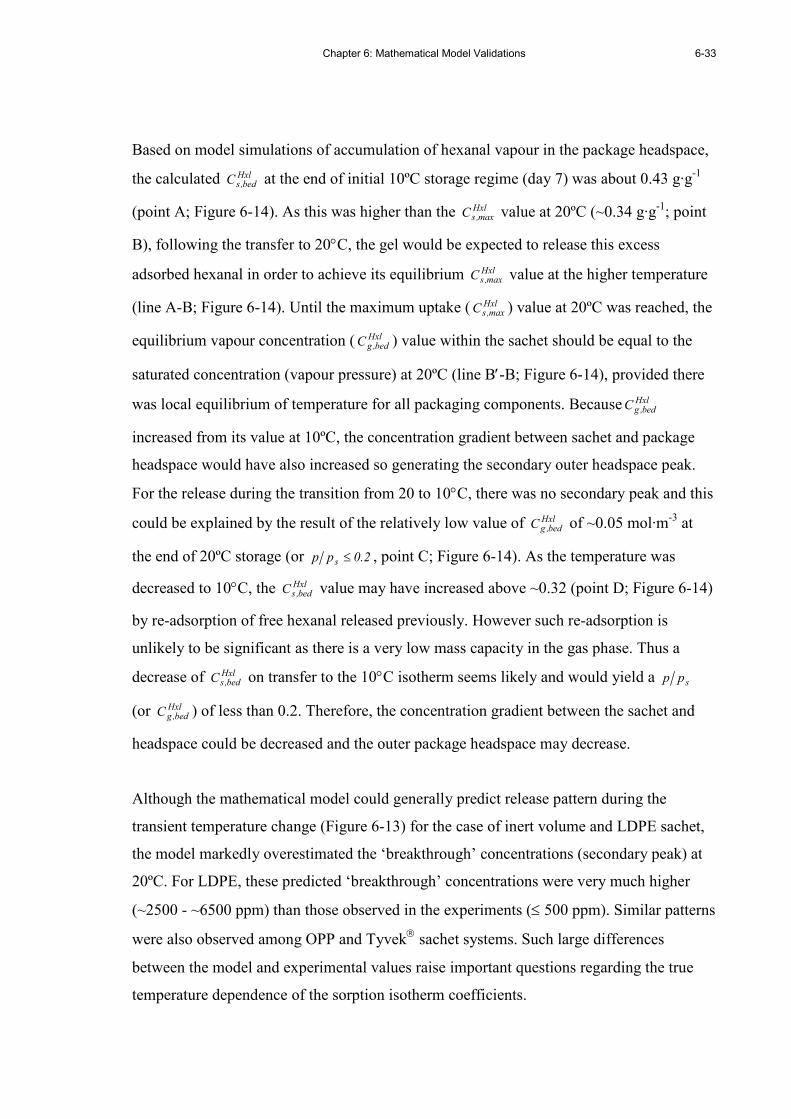
Chapter 6: Mathematical Model Validations
6-33
Based on model simulations of accumulation of hexanal vapour in the package headspace,
the calculated Hxlbed,sC at the end of initial 10ºC storage regime (day 7) was about 0.43 g·g-1
(point A; Figure 6-14). As this was higher than the Hxlmax,sC value at 20ºC (~0.34 g·g-1; point
B), following the transfer to 20°C, the gel would be expected to release this excess
adsorbed hexanal in order to achieve its equilibrium Hxlmax,sC value at the higher temperature
(line A-B; Figure 6-14). Until the maximum uptake ( Hxlmax,sC ) value at 20ºC was reached, the
equilibrium vapour concentration ( Hxlbed,gC ) value within the sachet should be equal to the
saturated concentration (vapour pressure) at 20ºC (line B′-B; Figure 6-14), provided there
was local equilibrium of temperature for all packaging components. Because Hxlbed,gC
increased from its value at 10ºC, the concentration gradient between sachet and package
headspace would have also increased so generating the secondary outer headspace peak.
For the release during the transition from 20 to 10°C, there was no secondary peak and this
could be explained by the result of the relatively low value of Hxlbed,gC of ~0.05 mol·m-3 at
the end of 20ºC storage (or 2.0pp s ≤ , point C; Figure 6-14). As the temperature was
decreased to 10°C, the Hxlbed,sC value may have increased above ~0.32 (point D; Figure 6-14)
by re-adsorption of free hexanal released previously. However such re-adsorption is
unlikely to be significant as there is a very low mass capacity in the gas phase. Thus a
decrease of Hxlbed,sC on transfer to the 10°C isotherm seems likely and would yield a spp
(or Hxlbed,gC ) of less than 0.2. Therefore, the concentration gradient between the sachet and
headspace could be decreased and the outer package headspace may decrease.
Although the mathematical model could generally predict release pattern during the
transient temperature change (Figure 6-13) for the case of inert volume and LDPE sachet,
the model markedly overestimated the ‘breakthrough’ concentrations (secondary peak) at
20ºC. For LDPE, these predicted ‘breakthrough’ concentrations were very much higher
(~2500 - ~6500 ppm) than those observed in the experiments (≤ 500 ppm). Similar patterns
were also observed among OPP and Tyvek sachet systems. Such large differences
between the model and experimental values raise important questions regarding the true
temperature dependence of the sorption isotherm coefficients.
6-34 Mathematical Modelling of Active Packaging Systems for Horticultural Products
From the literature (e.g. Adamson 1990; Chen et al. 2007), a strong temperature
dependence of the Langmuir sorption coefficient ( Lgmb ) is expected. This coefficient can
be utilised for calculating thermodynamic parameters, including free energy ( oG∆ ) and
apparent enthalpy change ( oH∆ ) as discussed in Chapter 4. In contrast to Lgmb , the
temperature dependence of the maximum uptake ( max,sC ) is unclear. Whilst Do (1998b)
(page 18) noted that max,sC is theoretically temperature independent, there is evidence of a
temperature dependency of max,sC , although the effect is less marked than for Lgmb . For
example Lgmb values for butyraldehyde adsorption for silica gel grade 40 (reportedly an
exothermic process) decreased by ~39% as temperature increased from 15ºC to 26ºC,
whereas the max,sC values only decreased by ~5% (Table 4-9). Chen et al. (2007) reported
that the Lgmb for cationic starch adsorption on kaolin (reportedly an endothermic process)
increased by 8.5-fold as the temperature increased from 15ºC to 60ºC, however, the max,sC
values increased only ~1.2-fold.
To illustrate the case of low dependency of the isotherm on temperature, model simulations
are shown in Figure 6-15A (legends refer to Figure 6-13) assuming Hxlmax,sC was constant at
the value estimated at 10ºC and the HxlLgmb value was that measured at 20°C. For these
values, the secondary release peak on transfer from 10 to 20ºC was virtually absent as
expected (Figure 6-15A). Changes of Hxlbed,gC values and hexanal mass on silica gel would
be less obvious when the package was transferred to 20ºC (Figure 6-15B). Considering
Figure 6-15A, there is however a clear secondary hexanal peak in the experimental data
even though overall predicted results (except the 2nd release peak) are similar to those
illustrated in Figure 6-13B (top). This implies there is some greater difference between the
isotherms at 10 and 20°C than that demonstrated for the selected values in Figure 6-15B.
The experimental data also show that the package headspace concentration was possibly
lower after the transfer to 20°C, as discussed above.
Chapter 6: Mathematical Model Validations
6-35
0 2 4 6 8 10 12 14
0
200
400
600
800
1000
1200
1400
1600
1800
2000
Storage days
Package headspace concentration (ppm)
(A)
0.0 0.2 0.4 0.6 0.8 1.0
0.0
0.1
0.2
0.3
0.4
0.5
0.6 10º (original)
20ºC with Cs,max of 10ºC
20ºC (original)
Uptakes (g·g
-1)
p/ps
(B)
Figure 6-15 Experimental and predicted values of hexanal concentration in an LDPE-
sachet package containing a sealed glass jar (at least 3 replicates shown for each sampling
time) during varied storage temperature regimes. Solid and dotted lines represent model
predictions on 10 and 20 ºC (A). Hexanal sorption isotherms at 10 and 20°C were
calculated using the Langmuir equation (Eq. 2-3 and coefficients reported in Table 4-9)
(labelled as ‘original’), and the isotherm at 20°C when Hxlmax,sC value was arbitrarily assumed
to be the value at 10ºC, with the HxlLgmb value as at 20°C (B).
6-36 Mathematical Modelling of Active Packaging Systems for Horticultural Products
Sensitivity analyses were conducted for headspace hexanal concentrations of model
packages containing tomatoes kept at 10ºC during the first 7 days of storage. The results of
sensitivity analyses are graphically illustrated in Appendix H.2 (Table H-6).
Model predictions of headspace hexanal concentrations were only sensitive to variations in
HxlLgmb and Hxl
tomr . As reported in Chapter 4, the uncertainty associated with HxlLgmb at 10°C is
high and the results of all sensitivity analyses confirm its influence on model predictions.
The moderate sensitivity of Hxl
tomr at 10ºC supports the high apparent rate of hexanal uptake
at 10ºC reported in Chapter 3. Mass transfer across the cuticles was assumed to be
significant and governed by hexanal sorption; this rate of sorption was likely to be higher
as temperature decreased at a given hexanal vapour concentration. The minimal sensitivity
to packaging film permeability and thickness of the model predictions is in contrast to the
sensitivity analyses conducted in previous sections. These suggest uncertainties of model
inputs will have to be differentially taken into account in active packaging systems subject
to variable storage temperature regimes.
In the sensitivity analysis the model predicts a faster decrease of headspace concentration
after the initial release peak than the experimental data. As discussed in section 6.4.3.2
(and shown in Figure 6-12), by lowering outer film permeance (by decreasing HxlLDPEP and
increasing pkflL ) and sorption affinity (by decreasing HxlLgmb ) simultaneously, the model
predictions were significantly improved for the LDPE and OPP sachet systems (Figure
6-16) as this adjustment lead to a slower decrease of hexanal vapour in the headspace. For
the Tyvek system, even though the model gave reasonably good predictions of unsteady-
state concentrations, it still tended to overestimate quasi steady-state concentrations
(Figure 6-16).

Chapter 6: Mathematical Model Validations
6-37
0 1 2 3 4 5 6 7
0
500
1000
1500
2000
2500
3000
3500
Storage days
Package headspace concentration (ppm)
0 1 2 3 4 5 6 7
0
500
1000
1500
2000
2500
3000
3500
Storage days0 1 2 3 4 5 6 7
0
500
1000
1500
2000
2500
3000
3500
Storage days
LDPE OPP Tyvek
Figure 6-16 Results of sensitivity analyses of model package at 10°C containing a sealed
glass jar (at least 3 replicates shown for each sampling time), by simultaneously lowering
outer film permeance (by decreasing Hxl
LDPEP and increasing pkflL ) and sorption affinity (by
lowering HxlLgmb ).
6.4.5 Changes of hexanal adsorbed amount on silica gel
The mathematical model was also used to evaluate changes in the mass of hexanal
adsorbed onto the silica gel ( Hxlbed,sC ). It is interesting to gain further insights into the role of
Hxlbed,sC on the system performance because this may be critical for the implementation of
these active packages. In particular it will be necessary to address economic and
environmental issues associated with the amount of silica gel and hexanal utilised and the
fate of hexanal (or any other volatiles) remaining in the sachet at the end of the storage
period (e.g. with respect to disposal, possible toxicity, and economic loss).
6.4.5.1 Materials and methods
To investigate changes in Hxlbed,sC during hexanal release, experiments were conducted with
the package referred to as LD7 (Table 6-1). This comprised only the LDPE sachet. The
sachet (LDPE) film with foil base was placed foil-side down on a Mettler (0.001 g Mettler

6-38 Mathematical Modelling of Active Packaging Systems for Horticultural Products
Toledo PR5003, Switzerland) analytical balance equipped with an RS232 interface
connected to a compatible computer and the change in mass of the sachet, which contained
hexanal saturated silica gel (of dry weight ~1 g), was followed. The sachet was surrounded
by the glass weighing chamber which comprises 3 sliding windows (2 on the sides and 1
on the top). All windows were fully opened in order to minimise accumulation of released
hexanal vapour in the chamber. The bulk hexanal concentration surrounding the sachet was
therefore assumed equal to zero ( 0C Hxlenv = ), as for all other scenarios modelled. Two
replicate experiments were performed in a controlled temperature cabinet at 20±1°C. As
the results of the two experiments were similar, one set of the results was used for model
validation. The balance reading was logged at intervals of 5 minutes for ~48 hours. The net
hexanal adsorbed on the silica gel was obtained by subtracting the known combined mass
of the sachet and dried silica gel from the gross mass logged from the balance.
The mathematical model for predicting Hxlbed,sC values was similar to that used in all
previous sections. In this case, the package area and free volume were assumed 20 times
larger than the actual values, to model a very slow rate of hexanal accumulation in the
headspace and effectively providing a zero headspace concentration during the release
period.
6.4.5.2 Results and discussion
From Figure 6-17, it was evident that the initial adsorbed amount predicted by the
mathematical model ( Hxlmax,sC at 20ºC, or ~0.34g⋅g-1 at t = 0) was about 1.2-fold lower than
that measured in the experiment (~0.43g⋅g-1). The difference was assumed to be the result
of small amounts of hexanal liquid remaining after vacuum filtering. Evidence of such
remaining liquid was also observed in preparations of sachets for experiments in previous
sections (see Appendix H.1), however then the focus was on the quasi steady-state hexanal
headspace concentrations which were reasonably well predicted by the global model. The
findings in this section will therefore be discussed along with the results reported
previously, where appropriate.
The model prediction is plotted with the experimental data in Figure 6-17. There was a
small but noticeable increase in the measured hexanal mass near the end of the testing
period. This was possibly due to a drift in the balance baseline due to the necessary but
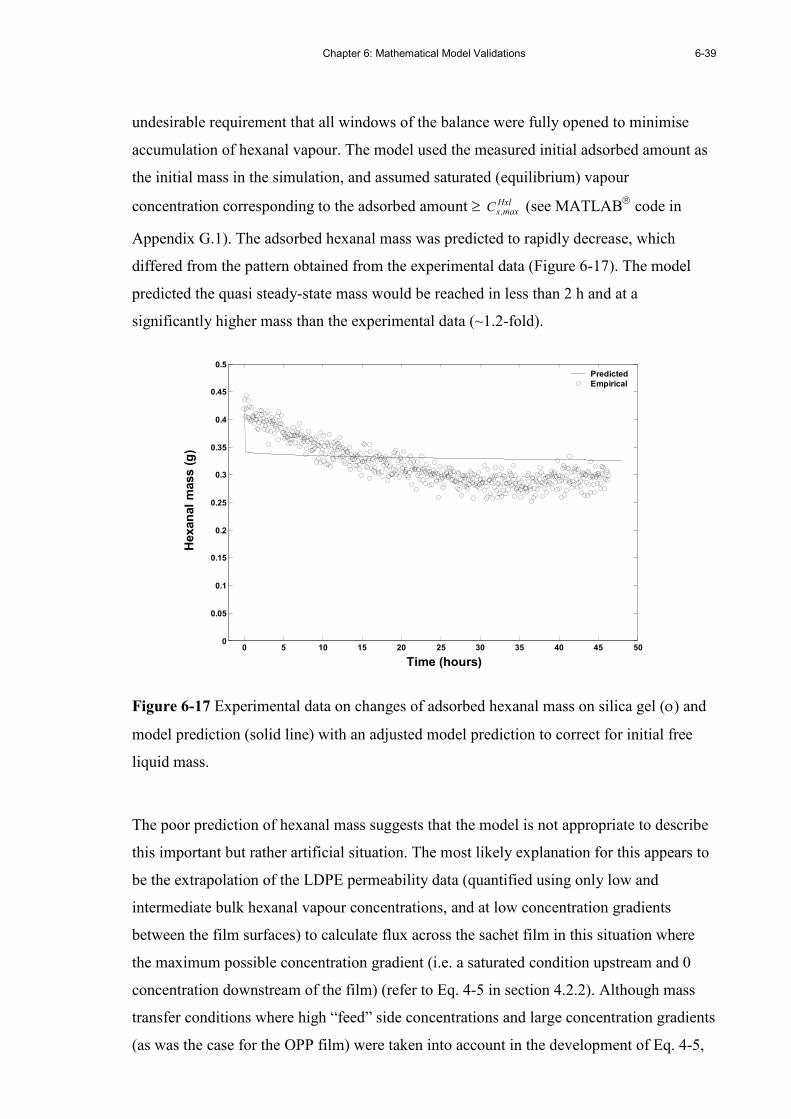
Chapter 6: Mathematical Model Validations
6-39
undesirable requirement that all windows of the balance were fully opened to minimise
accumulation of hexanal vapour. The model used the measured initial adsorbed amount as
the initial mass in the simulation, and assumed saturated (equilibrium) vapour
concentration corresponding to the adsorbed amount ≥ Hxlmax,sC (see MATLAB code in
Appendix G.1). The adsorbed hexanal mass was predicted to rapidly decrease, which
differed from the pattern obtained from the experimental data (Figure 6-17). The model
predicted the quasi steady-state mass would be reached in less than 2 h and at a
significantly higher mass than the experimental data (~1.2-fold).
0 5 10 15 20 25 30 35 40 45 500
0.05
0.1
0.15
0.2
0.25
0.3
0.35
0.4
0.45
0.5
Time (hours)
Hexanal mass (g)
Predicted
Empirical
Figure 6-17 Experimental data on changes of adsorbed hexanal mass on silica gel (ο) and
model prediction (solid line) with an adjusted model prediction to correct for initial free
liquid mass.
The poor prediction of hexanal mass suggests that the model is not appropriate to describe
this important but rather artificial situation. The most likely explanation for this appears to
be the extrapolation of the LDPE permeability data (quantified using only low and
intermediate bulk hexanal vapour concentrations, and at low concentration gradients
between the film surfaces) to calculate flux across the sachet film in this situation where
the maximum possible concentration gradient (i.e. a saturated condition upstream and 0
concentration downstream of the film) (refer to Eq. 4-5 in section 4.2.2). Although mass
transfer conditions where high “feed” side concentrations and large concentration gradients
(as was the case for the OPP film) were taken into account in the development of Eq. 4-5,

6-40 Mathematical Modelling of Active Packaging Systems for Horticultural Products
the model predictions clearly do not predict the experimental data of the system (Figure
6-17). Because of this, the data for LDPE permeability to hexanal vapour shown in section
4.2.2 may not be suitable for this current situation.
During the first ~24 hours, the experimental data (Figure 6-17) showed a reasonably linear
mass loss with time and this may be assumed to define the steady-state release flux under
these (extreme) conditions. The calculated flux value was ~5.37 × 10⁻⁶ mol·s-1·m-2 (or
~5.37 × 10⁻⁴ g·s-1·m-2), assuming saturated internal conditions. By using Eq. 4-5 with the
inputs for LDPE film at 20ºC reported in section 4.2.2, and with Hxlconc,hC and Hxl
conc,lC as 0.46
(saturated concentration) and 0 mol·m-3, respectively, the predicted flux is ~6.82 × 10⁻⁴
mol·s-1·m-2 (or ~6.82 × 10⁻² g·s-1·m-2), which is over 2-orders of magnitude higher than the
experimental value calculated above. The difference between the two values suggests that
the film has a much lower permeability to hexanal vapour in the sachet situation in the
initial stage of release. From this analysis it was clear that an alternative expression for
prediction of the flux from a sachet was required.
Permeability is a product of solubility and diffusivity (Robertson 1993c). The solubility
was assumed to follow Henry’s law and be concentration independent for the development
of the hexanal transfer model through the film (see Appendix D.1). As discussed in section
4.2.2, hexanal permeation through all tested films (LDPE, OPP and Tyvek) appeared to
be dominated by the sorption process. Therefore the relationship between hexanal vapour
and film sorption was considered further.
According to Robertson (1993c), interactions between VOCs and polymeric film under
situations such as those represented here may become large and relationship between
solubility and vapour pressure (concentration) may require to be described by alternative
models such as the Langmuir model or the dual mode (Henry’s law and Langmuir) model.
The Langmuir model (as expressed by Eq. 2-3) predicts linear sorption behaviour of the
permeant at low concentration but the sorbed amount reaches an asymptote as the
concentration increases (as for hexanal on silica gel). This behaviour could be caused for
example, by saturation of specific adsorption sites or immobilisation of permanent
molecules in microvoids in the polymer due to interactions between the permeant and
polymer (Robertson 1993c). Matsuguchi et al (2002) reported single component sorption
Chapter 6: Mathematical Model Validations
6-41
of water vapour or CO2 by highly photocrosslinked poly(vinyl cinnamate) (PVCA; a
hydrophilic film) at 30ºC were well described by the Langmuir sorption relationship.
Similarly Marin et al.(1992) reported that sorption of 2,6-di-tert-butyl-4-methylphenol
(DTP) vapour by HDPE film (both with or without the additive heptadecane (or steric
acid)) at 100-200ºC were well represented by the Langmuir sorption isotherm. The dual
mode is commonly used for sorption on glassy polymers, for which sorption of gaseous
molecules are governed by both Henry’s law and the Langmuir model (Robertson 1993c;
Mercea 2000; Selke et al. 2004). Examples of such systems are acetone vapour-PET and
acetone vapour-PET/PEN copolymer (at 35ºC; McDowell et al. 1999), and acetronitrile
vapour-cellulose acetate (at 25ºC; Guo & Barbari 2008).
Because the experimental temperature (20ºC) is well above the glass transition temperature
of LDPE (-110ºC, see Dury-Brun et al. 2007), the LDPE sachet film can reasonably be
considered as a rubbery polymer. The Langmuir model may therefore be the most
appropriate for the LDPE-hexanal vapour sorption system. If so, this implies that the
saturated sorption capacity of hexanal on LDPE (and on also OPP and Tyvek) could be at
or near the saturated concentration (~0.46 mol·m-3 at 20ºC estimated following
Covarrubias-Cervantes et al. 2004), while the highest concentration levels investigated in
section 4.2.2 were about 50% lower. Future work therefore is required to confirm and
characterise the sorption characteristics of these polymer-VOC combinations.
Taking this assumption, if the flux model (Eq. 4-5) is replaced with one where the
diffusivity is assumed constant (i.e. concentration independent to simplify mathematical
complexity, although permeation of organic vapours through polymeric film typically
shows a positive dependence on concentration as documented in Rogers et al. 1962; Zobel
1982; Rogers 1985) and the solubility is described by the Langmuir model (see Appendix
D.3 for the mathematical model derivation), the steady-state flux across the sachet film can
be described by Eq. 6-3.
( ) ( )
⋅+−
⋅+=
Hxlconc,l
Hxl1,Lgmfl
Hxlconc,h
Hxl1,Lgmfl
HxlLgmflfilm
Ck1
1
Ck1
1
ZJ (Eq. 6-3)
where
Hxl
LgmflZ = Fitted coefficient of Langmuir relationship for hexanal vapour sorption
on LDPE film (mol·s-1·m-2)

6-42 Mathematical Modelling of Active Packaging Systems for Horticultural Products
Hxl1,Lgmflk
= Fitted coefficient of Langmuir relationship for hexanal vapour sorption
on LDPE film (m3·mol-1)
Figure 6-18 illustrates the steady-state fluxes predicted by Eq. 6-3 (using the inputs,
including Hxlconc,hC , Hxl
conc,lC and film thickness as reported in section 4.2.2) and a comparison
with fluxes reported for experiments on LDPE film permeability at 20ºC (using Eq. 4-5;
section 4.2.2) and the hexanal mass loss experiment (this section). Fluxes predicted by Eq.
6-3 are in a good agreement with those predicted by Eq. 4-5, however the predicted fluxes
are nearly 2-fold lower than those measured in the range 0.01 to 0.02 mol·s-1·m-2. Good
agreement is again observed at the concentration observed across sachet film in the mass
loss experiment. In Figure 6-18, it can be observed that there is a reasonable linear
relationship between fluxes measured and those predicted by Eq. 4-5, except the unduly
high predicted steady-state flux across the sachet (contributed by the extrapolation of
measured LDPE permeability as discussed earlier).
0.00 0.02 0.04 0.06 0.08
0.00
0.02
0.04
0.06
0.08
5.00
6.00
7.00
8.00 predicted by Eq. 4-5
predicted by Eq. 6-3
calculated from sachet system
y=x line
Predicted flux (x 10-4 mol·s-1·m
-2)
Measured flux (x 10-4 mol·s
-1·m
-2)
Figure 6-18 Comparisons of fluxes measured in experiments on LDPE film permeability
(section 4.2.2) and hexanal mass loss (this section) to fluxes predicted by (i) Eq. 4-5
(section 4.2.2; ) or Eq. 6-3 (∆), and flux calculated from results of hexanal mass loss (ο).
The dotted line represents y = x line.
Chapter 6: Mathematical Model Validations
6-43
However it is also clear from Figure 6-18 that neither model for flux across the sachet film
(Eq. 4-5 or Eq. 6-3) appear satisfactory in all scenarios. The original exponential
relationship (Eq. 4-5) fits well for low to intermediate concentrations, while the Langmuir
isotherm model (Eq. 6-3) may reasonably describe the flux at very low and very high
concentrations but not for intermediate scenarios. This analysis suggests more detailed
hexanal transfer rate experiments will need to be carried out over the full range of
conditions (e.g. of both upstream concentrations and concentration gradients) before a
comprehensive model can be developed. Unfortunately this requires a very time
consuming and labour intensive experimental programmes and was outside the scope of
this thesis.
The current mathematical model describing steady-state flux across the sachet in the global
model was replaced with Eq. 6-3 to allow prediction of hexanal mass changes (for the
same conditions as those shown in Figure 6-17). The results are illustrated in Figure 6-19.
The experimental hexanal mass change, particularly during the unsteady-state period, is
well described by the modified mathematical model. The modified model however still
overestimated the quasi steady-state mass (to the same extent as before). The sensitivity
analysis (in respect to HxlLgmb and Hxl
max,sC ) was conducted and illustrated in Appendix H.2
(Table H-7). The model predictions, as might be expected, are highly sensitive to
uncertainty in Hxlmax,sC during the quasi steady-state period. If the Hxl
max,sC value is lowered by
its percentage SE, the modified model well predicted the quasi steady-state mass (Table
H-7).
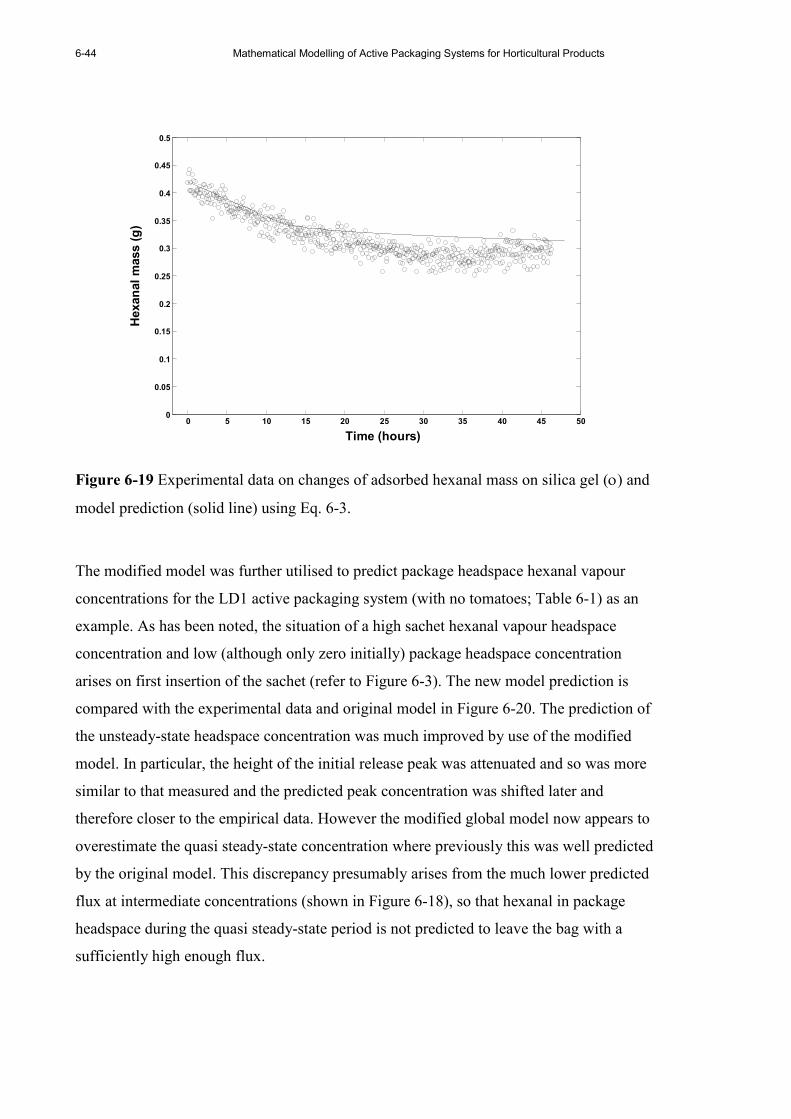
6-44 Mathematical Modelling of Active Packaging Systems for Horticultural Products
0 5 10 15 20 25 30 35 40 45 500
0.05
0.1
0.15
0.2
0.25
0.3
0.35
0.4
0.45
0.5
Time (hours)
Hexanal mass (g)
Figure 6-19 Experimental data on changes of adsorbed hexanal mass on silica gel (ο) and
model prediction (solid line) using Eq. 6-3.
The modified model was further utilised to predict package headspace hexanal vapour
concentrations for the LD1 active packaging system (with no tomatoes; Table 6-1) as an
example. As has been noted, the situation of a high sachet hexanal vapour headspace
concentration and low (although only zero initially) package headspace concentration
arises on first insertion of the sachet (refer to Figure 6-3). The new model prediction is
compared with the experimental data and original model in Figure 6-20. The prediction of
the unsteady-state headspace concentration was much improved by use of the modified
model. In particular, the height of the initial release peak was attenuated and so was more
similar to that measured and the predicted peak concentration was shifted later and
therefore closer to the empirical data. However the modified global model now appears to
overestimate the quasi steady-state concentration where previously this was well predicted
by the original model. This discrepancy presumably arises from the much lower predicted
flux at intermediate concentrations (shown in Figure 6-18), so that hexanal in package
headspace during the quasi steady-state period is not predicted to leave the bag with a
sufficiently high enough flux.
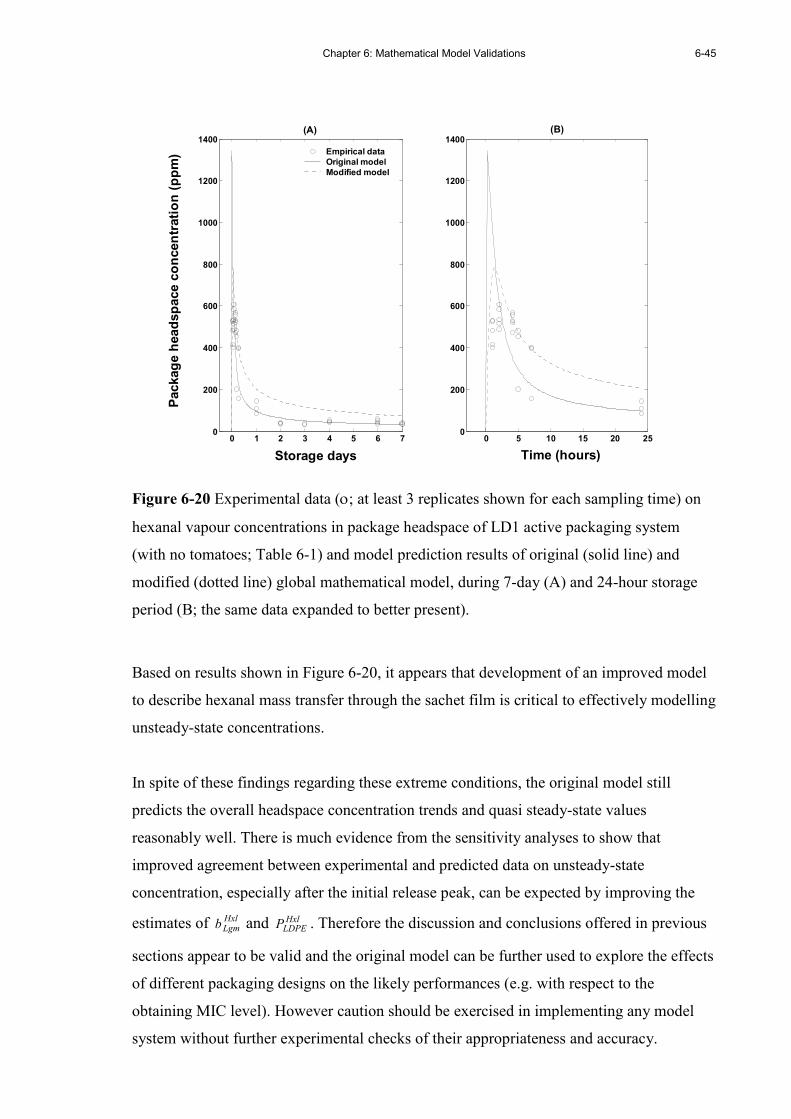
Chapter 6: Mathematical Model Validations
6-45
0 1 2 3 4 5 6 70
200
400
600
800
1000
1200
1400(A)
Storage days
Package headspace concentration (ppm)
0 5 10 15 20 250
200
400
600
800
1000
1200
1400(B)
Time (hours)
Empirical data
Original model
Modified model
Figure 6-20 Experimental data (ο; at least 3 replicates shown for each sampling time) on
hexanal vapour concentrations in package headspace of LD1 active packaging system
(with no tomatoes; Table 6-1) and model prediction results of original (solid line) and
modified (dotted line) global mathematical model, during 7-day (A) and 24-hour storage
period (B; the same data expanded to better present).
Based on results shown in Figure 6-20, it appears that development of an improved model
to describe hexanal mass transfer through the sachet film is critical to effectively modelling
unsteady-state concentrations.
In spite of these findings regarding these extreme conditions, the original model still
predicts the overall headspace concentration trends and quasi steady-state values
reasonably well. There is much evidence from the sensitivity analyses to show that
improved agreement between experimental and predicted data on unsteady-state
concentration, especially after the initial release peak, can be expected by improving the
estimates of HxlLgmb and Hxl
LDPEP . Therefore the discussion and conclusions offered in previous
sections appear to be valid and the original model can be further used to explore the effects
of different packaging designs on the likely performances (e.g. with respect to the
obtaining MIC level). However caution should be exercised in implementing any model
system without further experimental checks of their appropriateness and accuracy.

6-46 Mathematical Modelling of Active Packaging Systems for Horticultural Products
Based on experimental (Figure 6-17) and other modelled data, the final hexanal mass (after
7-14 days) does not differ greatly from that initially loaded on the silica gel. This implies
that smaller amounts of silica gel adsorbent (i.e. less than 1 g) could be successfully
deployed to still achieve the required MIC concentration, with consequently lesser amounts
of hexanal left on the carrier. A preliminary analysis can be conducted using the model
developed in the present study. However, the selection of appropriate loadings may have to
be carefully checked given that the outcome is affected by mass transport processes
occurring in the sachet, outer packaging film, and tomatoes as mentioned previously.
6.5 Summary
The mathematical model developed in this study can be used to predict hexanal vapour
concentrations in the headspace of a range of model active MA packaging systems. The
results of the model, in most cases, agreed reasonably well with experimental quasi steady-
state concentration data, which are the key to maintaining product quality through long-
term storage. A lack of fit was, however, noticeable in the unsteady-state period of the first
12-24 h and this cautions against the use of the model for quantifying “fumigation”
scenarios.
When the model was implemented to predict changes of hexanal adsorbed on the carrier
for the sachet only, a discrepancy between the model prediction and experimental data,
especially during the unsteady-state period, led to a review of the assumption made of
constant and concentration independent LDPE solubility of hexanal vapour (i.e. following
Henry’s law). This assumption may be valid for low and intermediate hexanal vapour
concentrations. However under extreme concentration gradients, the assumption of a
Langmuir relationship between hexanal vapour and LDPE film sorption may be more
appropriate. The mathematical model for describing steady-state flux across the sachet was
modified accordingly and when incorporated into the global model, predictions of hexanal
mass changes were improved for the initial dynamic phase of this extreme case.
Overall these validation experiments and their analysis have demonstrated that better
estimates of coefficients of the sorption isotherm for silica gel, and of film solubility and
permeability are required to achieve better model predictions. The gravimetric sorption

Chapter 6: Mathematical Model Validations
6-47
method utilised in the present work provided reasonable data but better technologies are
needed for temperature control and equilibrium vapour concentration measurement, and to
increase the sensitivity of the weighing scale. The latter may be achieved by using quartz-
spring type microbalances (noted in Chapter 4) or thermogravimetic equipment, which
includes a highly sensitive weighing scale and technically advanced controls of
temperature and pressure (vapour concentration). However the risk that the weighing and
pressure sensors may be damaged by hexanal vapour (or other VOCs) must be taken into
account. There are alternative methods for measuring film permeability to the isostatic
method employed in this study and these are summarised elsewhere (for example see
Robertson 1993c). Further studies of hexanal permeability, which should also consider
solubility, film swelling, and other types of VOCs-polymer interactions, should be
conducted. Experiments on film permeability must be conducted over a wide range of feed
side concentrations and concentration gradients to better characterise mass transfer of
hexanal for a range of scenarios.
Because the mathematical model developed can reasonably predict the quasi steady-state
active package performance and the MIC level during long term storage, the model can be
adapted for other volatile substances, such as eugenol, ethanol and 1-MCP, provided
appropriate isotherm and permeability data (and other required inputs) are available. The
mathematical model can therefore be utilised as a tool to gain insights into the effects of
packaging design variables on concentration levels of hexanal and other active agents for
different scenarios. This is further examined in the following chapter.

6-48 Mathematical Modelling of Active Packaging Systems for Horticultural Products
Chapter 7: Mathematical Model Applications
7-1
Chapter 7
MATHEMATICAL MODEL APPLICATIONS
7.1 Introduction
Although a range of designs of active packaging systems were tested to validate the
mathematical model (as reported in Chapter 6), a common pattern of hexanal release was
observed in all scenarios. A high initial concentration in the package headspace was
rapidly established, followed by a rapid drop to a relatively low level that was sustained for
the remainder of the storage period. This pattern was chiefly governed by the shape of the
Langmuir sorption isotherm. It is therefore of interest to explore through the model further
‘what-if’ scenarios with regard to the effects of different types of sorption isotherms on
release patterns. Also, it is of interest to gain insights to the mass transfer processes (with
an emphasis on the steady-state fluxes) across the sachet boundary as a function of
isotherm model and storage time to better understand their effects on the hexanal release
patterns. Although validation of model predictions for these scenarios was not conducted,
the results and their interpretation provide a theoretical basis for further development of
active packaging systems to achieve a range of release patterns of other active agent from
sachets.
7.2 Effects of isotherm types on hexanal release patterns
Possible release patterns that might be sought can be conceptualised as illustrated in Figure
7-1. Fumigation with a high concentration of active substance for a short period followed
by the attainment of a lower (but still inhibitory) concentration has been demonstrated.
One alternative release pattern of interest is where the active agent concentration is
maintained and sustained at the highest level after the initial release, for either a long (line
I; Figure 7-1) or short (line II; Figure 7-1) period prior to the concentration decreasing.
After the sustained period, it may be preferable for the concentration to decrease either
slowly or rapidly to zero to remove the volatile from the package headspace at the opening
or expiry date. Such a decrease of hexanal concentration after the sustained period could
provide the benefit of, for example, minimising the odour of the active agent in the
packaged product near its point of sale if this was considered sensorially undesirable by
end-users/consumers. Similarly, as reported in section 3.2.2, continuous exposure of light
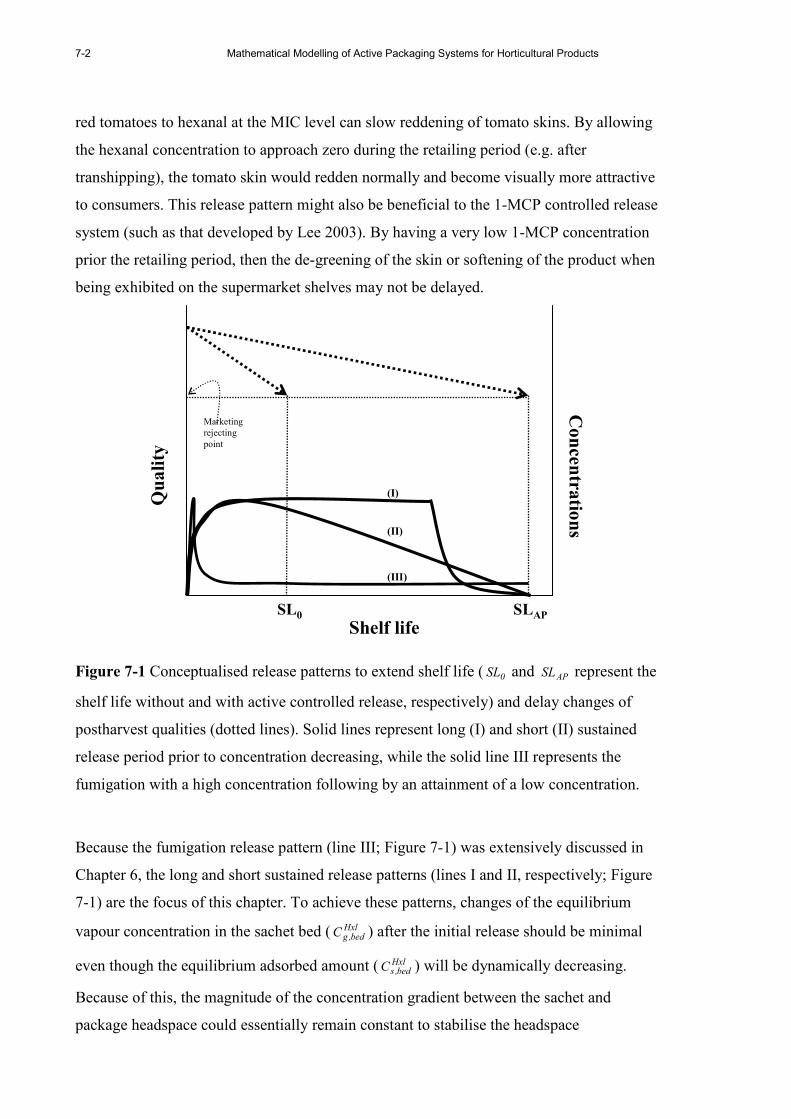
7-2 Mathematical Modelling of Active Packaging Systems for Horticultural Products
red tomatoes to hexanal at the MIC level can slow reddening of tomato skins. By allowing
the hexanal concentration to approach zero during the retailing period (e.g. after
transhipping), the tomato skin would redden normally and become visually more attractive
to consumers. This release pattern might also be beneficial to the 1-MCP controlled release
system (such as that developed by Lee 2003). By having a very low 1-MCP concentration
prior the retailing period, then the de-greening of the skin or softening of the product when
being exhibited on the supermarket shelves may not be delayed.
Shelf life
Concentrations
Marketing
rejecting
point
SL0 SLAP
Quality
(I)
(II)
(III)
Figure 7-1 Conceptualised release patterns to extend shelf life ( 0SL and APSL represent the
shelf life without and with active controlled release, respectively) and delay changes of
postharvest qualities (dotted lines). Solid lines represent long (I) and short (II) sustained
release period prior to concentration decreasing, while the solid line III represents the
fumigation with a high concentration following by an attainment of a low concentration.
Because the fumigation release pattern (line III; Figure 7-1) was extensively discussed in
Chapter 6, the long and short sustained release patterns (lines I and II, respectively; Figure
7-1) are the focus of this chapter. To achieve these patterns, changes of the equilibrium
vapour concentration in the sachet bed ( Hxlbed,gC ) after the initial release should be minimal
even though the equilibrium adsorbed amount ( Hxlbed,sC ) will be dynamically decreasing.
Because of this, the magnitude of the concentration gradient between the sachet and
package headspace could essentially remain constant to stabilise the headspace

Chapter 7: Mathematical Model Applications
7-3
concentrations. After a certain release period, Hxlbed,sC should then continuously decrease to
bring about a reduction of the Hxlbed,gC value. For the pattern with a long sustained period
(line I; Figure 7-1), the headspace concentration should eventually dramatically decrease
(to rapidly approach zero). In such a case, the change in Hxlbed,sC value should cause an
exponential and rapid reduction of Hxlbed,gC . In contrast, comparable relative reductions of
both Hxlbed,sC and Hxl
bed,gC values are required to achieve the short sustained release period (line
II). The isotherm shapes required to achieve the long and short sustained period are
therefore exponential and linear, respectively.
An exponential isotherm is the Brunauer’s Type III isotherm (Adamson 1990) (Figure 2-1)
and conceptually this is like a reflection of the Langmuir curve (or Type I isotherm).
Examples of an exponential isotherm system are the adsorption of (i) water vapour by
lactose (Bronlund 1997) and (ii) ethanol vapour by amorphous Teflon AF2400 (Tokarev et
al. 2006). A linear isotherm equation is illustrated in Eq. 2-2 and an example of this
adsorption system is 1-MCP on silica gel (Lee 2003; Lee et al. 2006). To illustrate the
effects of the isotherm form on release patterns, variable shapes of isotherms including
exponential (Eq. 7-1), linear (Eq. 2-2) and Langmuir (Eq. 2-3) were examined.
HxlexpHxl
exp
Hxlbed,gHxl
expHxlbed,s a
b
CexpaC −
⋅= (Eq. 7-1)
where
Hxlbed,sC = Equilibrium adsorbed amount of hexanal on the carrier bed (g·g
-1)
Hxlbed,gC = Equilibrium hexanal vapour concentration above the carrier bed
(presented as relative pressure; dimensionless see Figure 7-2)
Hxlexpa = Coefficient of the hexanal exponential isotherm equation (g·g-1)
Hxlexpb = Coefficient of the hexanal exponential isotherm equation
(dimensionless)
For the Langmuir and exponential isotherms, the degree of curvature can also be varied in
order to investigate its effects on changes of equilibrium conditions in the sachet and
package headspace. The coefficients associated with the isotherm equations and isotherm
shapes are shown in Table 7-1 and Figure 7-2, respectively. It should be noted that
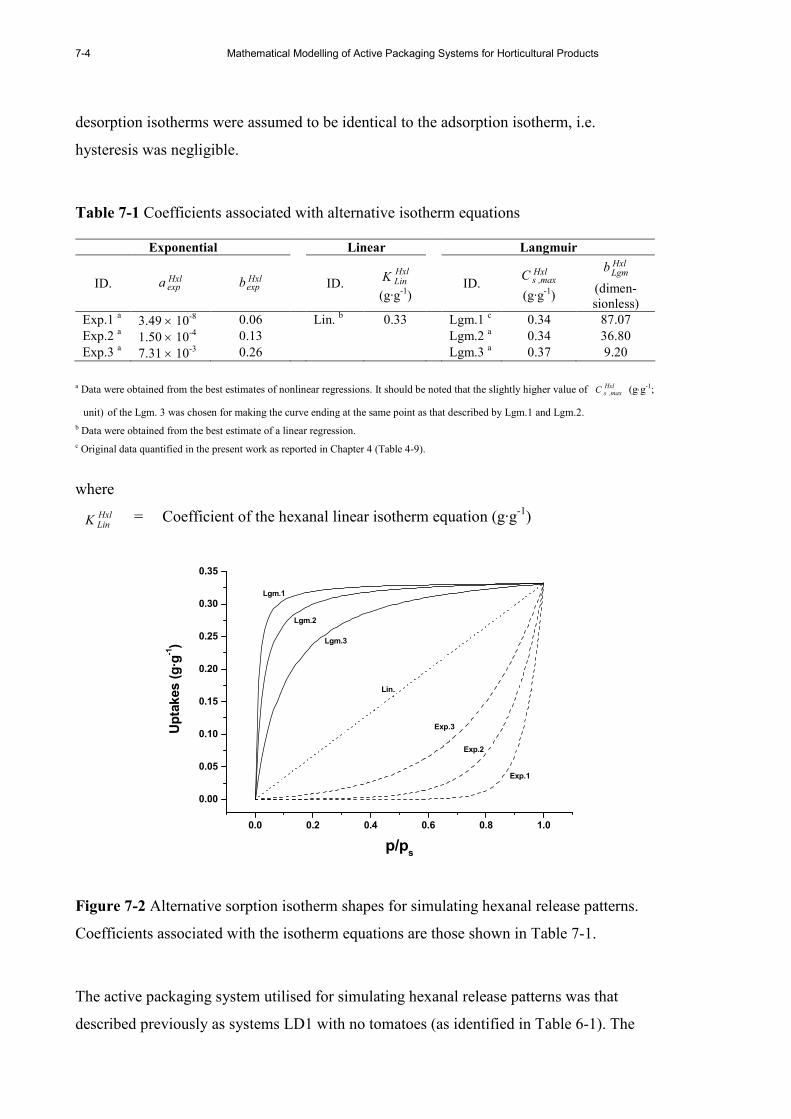
7-4 Mathematical Modelling of Active Packaging Systems for Horticultural Products
desorption isotherms were assumed to be identical to the adsorption isotherm, i.e.
hysteresis was negligible.
Table 7-1 Coefficients associated with alternative isotherm equations
Exponential Linear Langmuir
ID. Hxlexpa Hxl
expb ID. HxlLinK
(g·g-1) ID.
Hxlmax,sC
(g·g-1)
HxlLgm
b
(dimen-sionless)
Exp.1 a 3.49 × 10⁻⁸ 0.06 Lin. b 0.33 Lgm.1 c 0.34 87.07
Exp.2 a 1.50 × 10⁻⁴ 0.13 Lgm.2 a 0.34 36.80
Exp.3 a 7.31 × 10⁻³ 0.26 Lgm.3 a 0.37 9.20
a Data were obtained from the best estimates of nonlinear regressions. It should be noted that the slightly higher value of Hxlmax,sC (g⋅g-1;
unit) of the Lgm. 3 was chosen for making the curve ending at the same point as that described by Lgm.1 and Lgm.2. b Data were obtained from the best estimate of a linear regression.
c Original data quantified in the present work as reported in Chapter 4 (Table 4-9).
where
HxlLinK = Coefficient of the hexanal linear isotherm equation (g·g
-1)
0.0 0.2 0.4 0.6 0.8 1.0
0.00
0.05
0.10
0.15
0.20
0.25
0.30
0.35
Lgm.1
Lgm.2
Lgm.3
Lin.
Exp.3
Exp.2
Exp.1
Uptakes (g·g
-1)
p/ps
Figure 7-2 Alternative sorption isotherm shapes for simulating hexanal release patterns.
Coefficients associated with the isotherm equations are those shown in Table 7-1.
The active packaging system utilised for simulating hexanal release patterns was that
described previously as systems LD1 with no tomatoes (as identified in Table 6-1). The
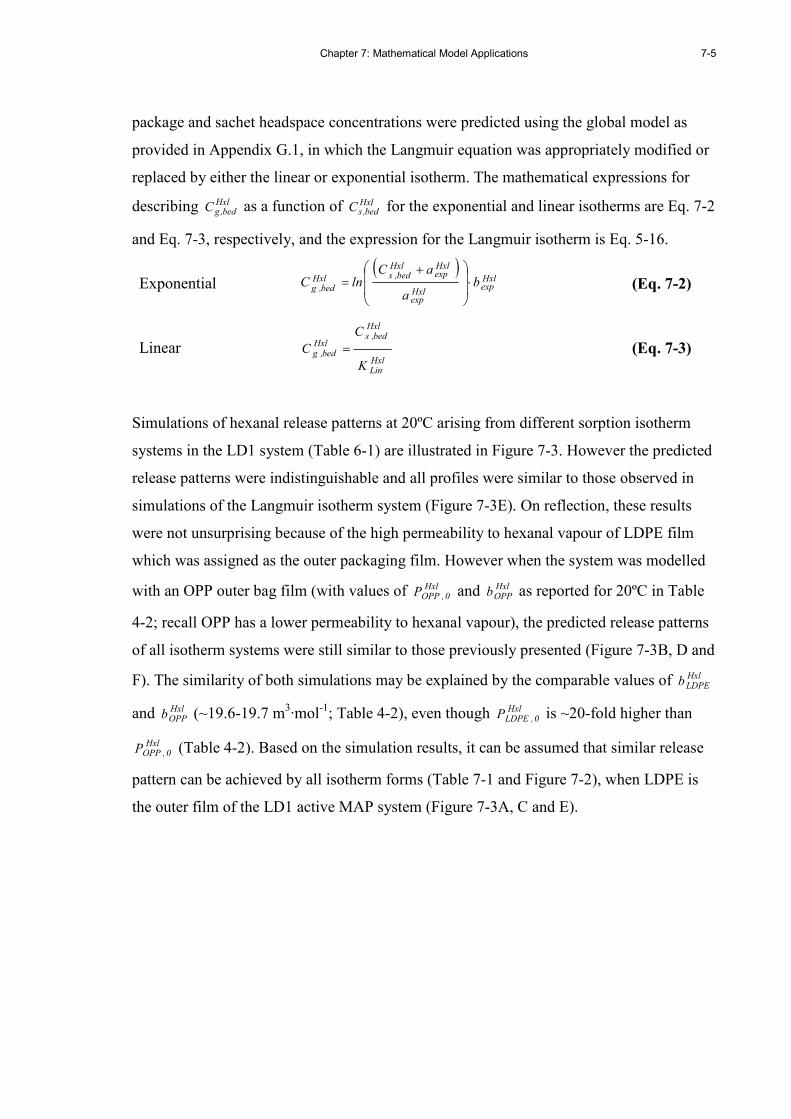
Chapter 7: Mathematical Model Applications
7-5
package and sachet headspace concentrations were predicted using the global model as
provided in Appendix G.1, in which the Langmuir equation was appropriately modified or
replaced by either the linear or exponential isotherm. The mathematical expressions for
describing Hxlbed,gC as a function of Hxl
bed,sC for the exponential and linear isotherms are Eq. 7-2
and Eq. 7-3, respectively, and the expression for the Langmuir isotherm is Eq. 5-16.
Exponential ( )
Hxlexp
Hxlexp
Hxlexp
Hxlbed,sHxl
bed,gb
a
aClnC ⋅
+= (Eq. 7-2)
Linear HxlLin
Hxlbed,s
Hxlbed,g
K
C
C = (Eq. 7-3)
Simulations of hexanal release patterns at 20ºC arising from different sorption isotherm
systems in the LD1 system (Table 6-1) are illustrated in Figure 7-3. However the predicted
release patterns were indistinguishable and all profiles were similar to those observed in
simulations of the Langmuir isotherm system (Figure 7-3E). On reflection, these results
were not unsurprising because of the high permeability to hexanal vapour of LDPE film
which was assigned as the outer packaging film. However when the system was modelled
with an OPP outer bag film (with values of Hxl0,OPPP and Hxl
OPPb as reported for 20ºC in Table
4-2; recall OPP has a lower permeability to hexanal vapour), the predicted release patterns
of all isotherm systems were still similar to those previously presented (Figure 7-3B, D and
F). The similarity of both simulations may be explained by the comparable values of HxlLDPEb
and HxlOPPb (~19.6-19.7 m3·mol-1; Table 4-2), even though Hxl
0,LDPEP is ~20-fold higher than
Hxl0,OPPP (Table 4-2). Based on the simulation results, it can be assumed that similar release
pattern can be achieved by all isotherm forms (Table 7-1 and Figure 7-2), when LDPE is
the outer film of the LD1 active MAP system (Figure 7-3A, C and E).
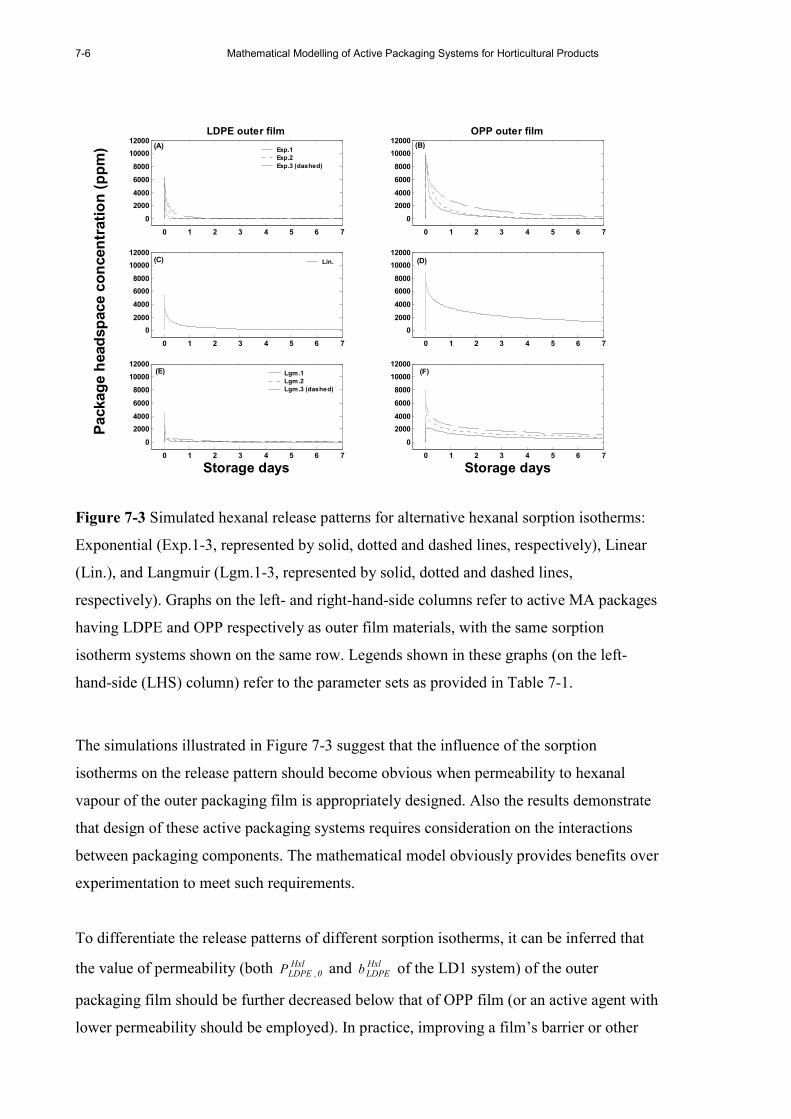
7-6 Mathematical Modelling of Active Packaging Systems for Horticultural Products
0 1 2 3 4 5 6 7
0
2000
4000
6000
8000
10000
12000
LDPE outer film
0 1 2 3 4 5 6 7
0
2000
4000
6000
8000
10000
12000
OPP outer film
0 1 2 3 4 5 6 7
0
2000
4000
6000
8000
10000
12000
Package headspace concentration (ppm)
0 1 2 3 4 5 6 7
0
2000
4000
6000
8000
10000
12000
0 1 2 3 4 5 6 7
0
2000
4000
6000
8000
10000
12000
Storage days0 1 2 3 4 5 6 7
0
2000
4000
6000
8000
10000
12000
Storage days
Lin.
Exp.1
Exp.2
Exp.3 (dashed)
Lgm.1
Lgm.2
Lgm.3 (dashed)
(A) (B)
(C) (D)
(E) (F)
Figure 7-3 Simulated hexanal release patterns for alternative hexanal sorption isotherms:
Exponential (Exp.1-3, represented by solid, dotted and dashed lines, respectively), Linear
(Lin.), and Langmuir (Lgm.1-3, represented by solid, dotted and dashed lines,
respectively). Graphs on the left- and right-hand-side columns refer to active MA packages
having LDPE and OPP respectively as outer film materials, with the same sorption
isotherm systems shown on the same row. Legends shown in these graphs (on the left-
hand-side (LHS) column) refer to the parameter sets as provided in Table 7-1.
The simulations illustrated in Figure 7-3 suggest that the influence of the sorption
isotherms on the release pattern should become obvious when permeability to hexanal
vapour of the outer packaging film is appropriately designed. Also the results demonstrate
that design of these active packaging systems requires consideration on the interactions
between packaging components. The mathematical model obviously provides benefits over
experimentation to meet such requirements.
To differentiate the release patterns of different sorption isotherms, it can be inferred that
the value of permeability (both Hxl0,LDPEP and Hxl
LDPEb of the LD1 system) of the outer
packaging film should be further decreased below that of OPP film (or an active agent with
lower permeability should be employed). In practice, improving a film’s barrier or other

Chapter 7: Mathematical Model Applications
7-7
properties, such as improving tensile strength, sealability or printability, may be achieved
through the use of multilayer films manufactured by film lamination and co-extrusion (see
Robertson 1993d). Alternatively, the metallocene catalyst processes of polymeric film
manufacturing can yield improved film properties as in the case of the Exact 4151 which
is an excellent barrier to hexanal vapour (as reported by Wolford 1998; Table 4-7). By
lowering the permeability of the outer packaging film, this may also provide benefits
including (i) retaining headspace concentrations at or higher than the MIC level, and (ii)
minimising the release of the active agent into the storage environment. Most active agents
have a distinctive odour, e.g. the grassy ‘green’ note of hexanal vapour or ‘fermented’
aroma of ethanol vapour, and these may be considered foreign by consumers as noted
earlier. In addition, the effects of film alterations to film properties to achieve required
release patterns on the establishment of MA conditions and consequent postharvest quality
changes in the product have to be taken into account in the design of active MAP systems.
These are discussed later in this section.
For simulation purposes, the values of Hxl0,LDPEP and Hxl
LDPEb of the outer packaging film were
set arbitrarily lower by a factor of 10, while those of the sachet film were not altered.
Simulations of the hexanal release pattern for the different sorption isotherms in the LD1
active MAP system are shown in Figure 7-4.
As Figure 7-4 makes clear, the different release patterns are now quite distinguishable and
are consistent with the earlier discussion on the release patterns (Figure 7-1). The slowest
changes of headspace hexanal concentration after the initial release were observed with the
exponential isotherm systems (Figure 7-4A), while the most rapid changes occurred with
the Langmuir systems (Figure 7-4E), as expected from the findings reported in Chapters 6.
The linear equilibrium gave a release pattern intermediate between these two extremes
(Figure 7-4C). All simulated release patterns exhibited in Figure 7-4 are sensible from a
mechanistic viewpoint and are discussed below.

7-8 Mathematical Modelling of Active Packaging Systems for Horticultural Products
0 1 2 3 4 5 6 70
5000
10000
15000
0 1 2 3 4 5 6 70
5000
10000
15000
0 1 2 3 4 5 6 70
5000
10000
15000
Package headspace concentration (ppm)
0 1 2 3 4 5 6 70
5000
10000
15000
Sachet h
eadspace concentra
tion (p
pm)
0 1 2 3 4 5 6 70
5000
10000
15000
Storage days0 1 2 3 4 5 6 7
0
5000
10000
15000
Storage days
Lgm.1
Lgm.2
Lgm.3 (dashed)
Lin.
Exp.1
Exp.2
Exp.3 (dashed)
(A) (B)
(C) (D)
(E) (F)
Figure 7-4 Simulated hexanal release patterns for alternative hexanal sorption isotherms
with 10-fold lower outer bag permeability: Exponential (Exp.1-3 represented by solid,
dotted and dashed lines, respectively), Linear (Lin.), and Langmuir (Lgm.1-3 represented
by solid, dotted and dashed lines, respectively) and legends shown in these graphs (on LHS
column) refer to variations as provided in Table 7-1. Graphs on the right-hand-side (RHS)
column show sachet headspace concentrations and lines refer to sorption isotherm systems
as provided in the same row of the LHS column.
The slow initial change in headspace concentration in the exponential system (Figure
7-4A) can be explained by the only small change in Hxlbed,gC (Figure 7-4B) and hence in the
concentration gradient between sachet and the headspace, even though Hxlbed,sC continuously
decreases. These effects manifest as reasonably stable headspace concentrations after the
initial release. The changes to Hxlbed,gC become apparent and rapid as Hxl
bed,sC approaches zero
and the headspace concentration only decreases significantly at this point. For the
exponential isotherms, the system having the lowest value of the exponential coefficient
( Hxlexpa ) (Exp.1; Figure 7-4A) exhibits the longest sustained period of elevated hexanal
concentration because its long horizontal asymptotic yields the slowest changes in Hxlbed,gC
and the concentration gradients after the initial release (Figure 7-4B). As the Hxlexpa value
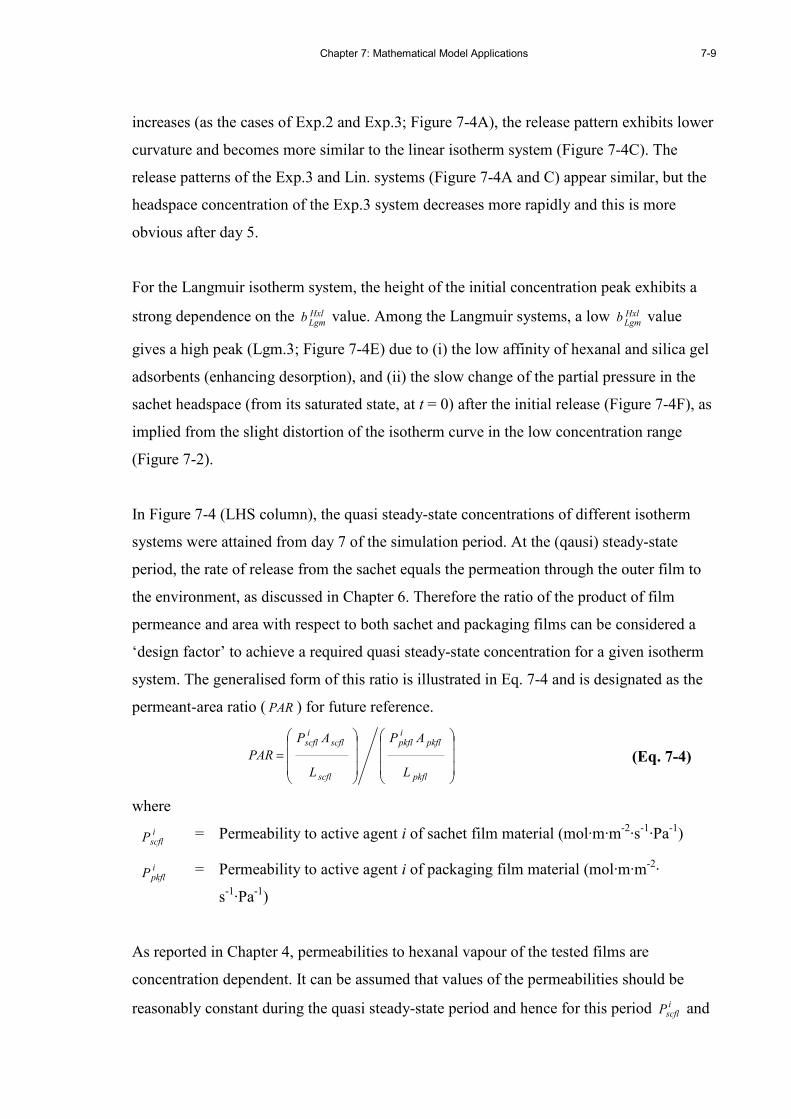
Chapter 7: Mathematical Model Applications
7-9
increases (as the cases of Exp.2 and Exp.3; Figure 7-4A), the release pattern exhibits lower
curvature and becomes more similar to the linear isotherm system (Figure 7-4C). The
release patterns of the Exp.3 and Lin. systems (Figure 7-4A and C) appear similar, but the
headspace concentration of the Exp.3 system decreases more rapidly and this is more
obvious after day 5.
For the Langmuir isotherm system, the height of the initial concentration peak exhibits a
strong dependence on the HxlLgm
b value. Among the Langmuir systems, a low HxlLgm
b value
gives a high peak (Lgm.3; Figure 7-4E) due to (i) the low affinity of hexanal and silica gel
adsorbents (enhancing desorption), and (ii) the slow change of the partial pressure in the
sachet headspace (from its saturated state, at t = 0) after the initial release (Figure 7-4F), as
implied from the slight distortion of the isotherm curve in the low concentration range
(Figure 7-2).
In Figure 7-4 (LHS column), the quasi steady-state concentrations of different isotherm
systems were attained from day 7 of the simulation period. At the (qausi) steady-state
period, the rate of release from the sachet equals the permeation through the outer film to
the environment, as discussed in Chapter 6. Therefore the ratio of the product of film
permeance and area with respect to both sachet and packaging films can be considered a
‘design factor’ to achieve a required quasi steady-state concentration for a given isotherm
system. The generalised form of this ratio is illustrated in Eq. 7-4 and is designated as the
permeant-area ratio ( PAR ) for future reference.
=
pkfl
pkflipkfl
scfl
scfliscfl
L
AP
L
AP
PAR (Eq. 7-4)
where
iscflP = Permeability to active agent i of sachet film material (mol·m·m-2·s-1·Pa-1)
ipkflP = Permeability to active agent i of packaging film material (mol·m·m-2·
s-1·Pa-1)
As reported in Chapter 4, permeabilities to hexanal vapour of the tested films are
concentration dependent. It can be assumed that values of the permeabilities should be
reasonably constant during the quasi steady-state period and hence for this period iscflP and
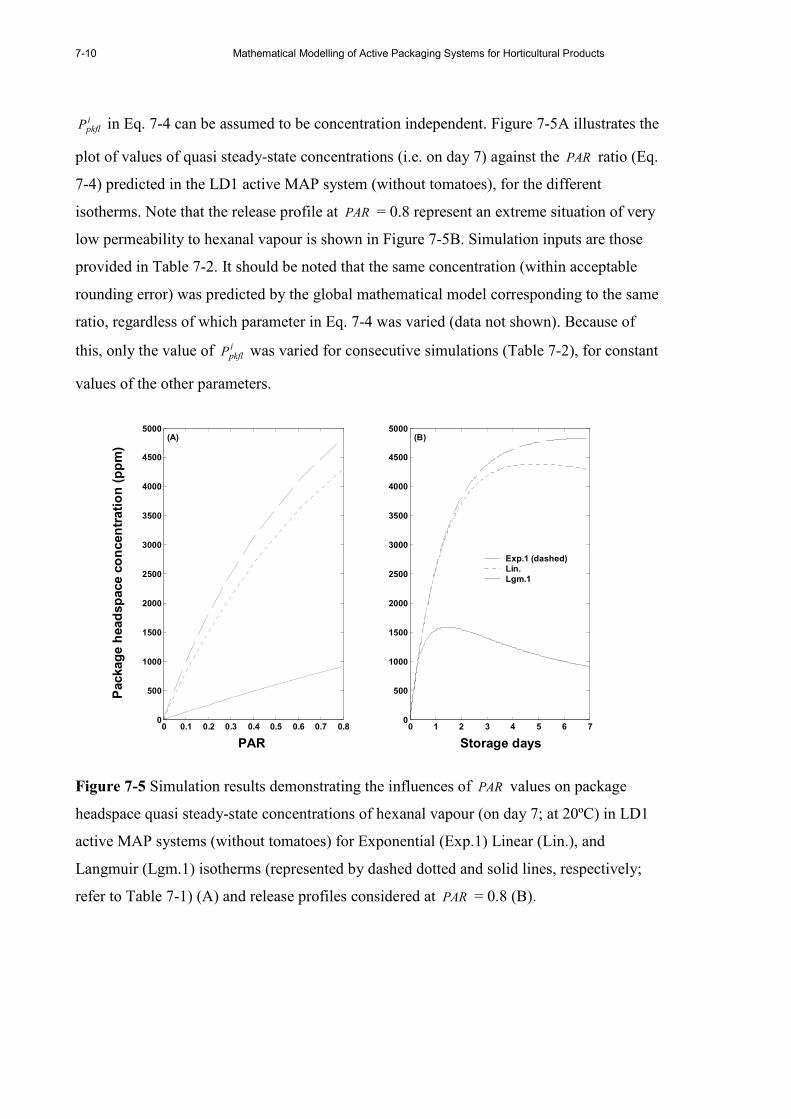
7-10 Mathematical Modelling of Active Packaging Systems for Horticultural Products
ipkflP in Eq. 7-4 can be assumed to be concentration independent. Figure 7-5A illustrates the
plot of values of quasi steady-state concentrations (i.e. on day 7) against the PAR ratio (Eq.
7-4) predicted in the LD1 active MAP system (without tomatoes), for the different
isotherms. Note that the release profile at PAR = 0.8 represent an extreme situation of very
low permeability to hexanal vapour is shown in Figure 7-5B. Simulation inputs are those
provided in Table 7-2. It should be noted that the same concentration (within acceptable
rounding error) was predicted by the global mathematical model corresponding to the same
ratio, regardless of which parameter in Eq. 7-4 was varied (data not shown). Because of
this, only the value of ipkflP was varied for consecutive simulations (Table 7-2), for constant
values of the other parameters.
0 0.1 0.2 0.3 0.4 0.5 0.6 0.7 0.80
500
1000
1500
2000
2500
3000
3500
4000
4500
5000
PAR
Package headspace concentration (ppm)
0 1 2 3 4 5 6 70
500
1000
1500
2000
2500
3000
3500
4000
4500
5000
Storage days
Exp.1 (dashed)
Lin.
Lgm.1
(A) (B)
Figure 7-5 Simulation results demonstrating the influences of PAR values on package
headspace quasi steady-state concentrations of hexanal vapour (on day 7; at 20ºC) in LD1
active MAP systems (without tomatoes) for Exponential (Exp.1) Linear (Lin.), and
Langmuir (Lgm.1) isotherms (represented by dashed dotted and solid lines, respectively;
refer to Table 7-1) (A) and release profiles considered at PAR = 0.8 (B).
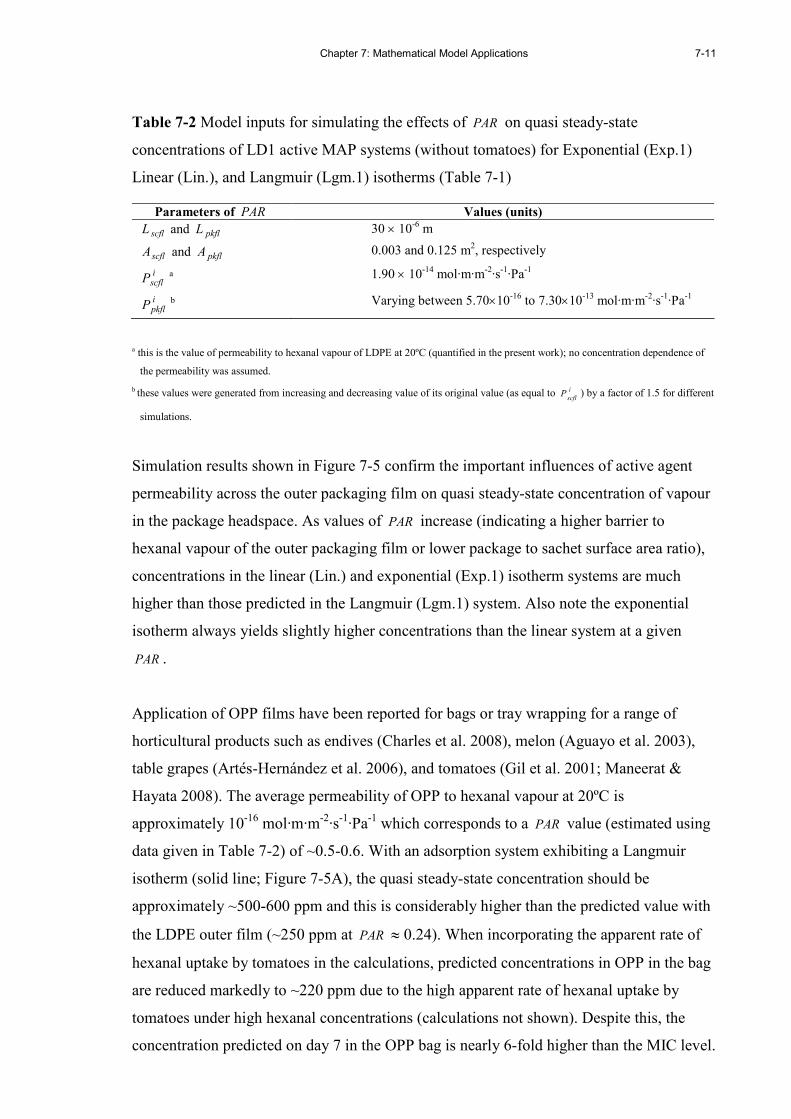
Chapter 7: Mathematical Model Applications
7-11
Table 7-2 Model inputs for simulating the effects of PAR on quasi steady-state
concentrations of LD1 active MAP systems (without tomatoes) for Exponential (Exp.1)
Linear (Lin.), and Langmuir (Lgm.1) isotherms (Table 7-1)
Parameters of PAR Values (units)
scflL and pkflL 30 × 10-6 m
scflA and pkflA 0.003 and 0.125 m2, respectively
iscflP
a 1.90 × 10⁻¹⁴ mol·m·m-2·s-1·Pa-1
ipkflP
b Varying between 5.70×10⁻¹⁶ to 7.30×10⁻¹³ mol·m·m-2·s-1·Pa-1
a this is the value of permeability to hexanal vapour of LDPE at 20ºC (quantified in the present work); no concentration dependence of
the permeability was assumed.
b these values were generated from increasing and decreasing value of its original value (as equal to i
scflP ) by a factor of 1.5 for different
simulations.
Simulation results shown in Figure 7-5 confirm the important influences of active agent
permeability across the outer packaging film on quasi steady-state concentration of vapour
in the package headspace. As values of PAR increase (indicating a higher barrier to
hexanal vapour of the outer packaging film or lower package to sachet surface area ratio),
concentrations in the linear (Lin.) and exponential (Exp.1) isotherm systems are much
higher than those predicted in the Langmuir (Lgm.1) system. Also note the exponential
isotherm always yields slightly higher concentrations than the linear system at a given
PAR .
Application of OPP films have been reported for bags or tray wrapping for a range of
horticultural products such as endives (Charles et al. 2008), melon (Aguayo et al. 2003),
table grapes (Artés-Hernández et al. 2006), and tomatoes (Gil et al. 2001; Maneerat &
Hayata 2008). The average permeability of OPP to hexanal vapour at 20ºC is
approximately 10-16 mol·m·m-2·s-1·Pa-1 which corresponds to a PAR value (estimated using
data given in Table 7-2) of ~0.5-0.6. With an adsorption system exhibiting a Langmuir
isotherm (solid line; Figure 7-5A), the quasi steady-state concentration should be
approximately ~500-600 ppm and this is considerably higher than the predicted value with
the LDPE outer film (~250 ppm at PAR ≈ 0.24). When incorporating the apparent rate of
hexanal uptake by tomatoes in the calculations, predicted concentrations in OPP in the bag
are reduced markedly to ~220 ppm due to the high apparent rate of hexanal uptake by
tomatoes under high hexanal concentrations (calculations not shown). Despite this, the
concentration predicted on day 7 in the OPP bag is nearly 6-fold higher than the MIC level.

7-12 Mathematical Modelling of Active Packaging Systems for Horticultural Products
Based on the simulation results, it may be inferred that the required MIC level in the OPP
bag could be achieved by using a lower sachet loading (1.5g was the loading used in
scenario LD1; Table 6-1). The predicted headspace concentration for a reduced sachet
loading of 0.5g (for the Langmuir isotherm system) is ~160 ppm (calculations not shown)
and this is still sufficiently higher than the MIC level. Lowering the sachet loading can
provide economical and environmental benefits because less hexanal mass would be
utilised for saturating the silica gel and subsequently left on the adsorbent after the quasi
steady-state condition was attained.
As mentioned earlier, when altering of components of the active MAP system one must
also consider the impact of such changes on the MA conditions in the bag. Simulations of
MA conditions for both LDPE and OPP bags are shown in Figure 7-6. It should be noted
that the permeabilities to O2 and CO2 of OPP film used as model inputs are those for 35µm
film measured at 15ºC, as reported by Rai & Paul (2007). Also, these simulations were
performed based on the assumption that there are negligible adverse effects of hexanal on
respiration rates or other physiological properties. Further studies may be required to
investigate the influence of the hexanal concentration developed in an OPP bag on
postharvest quality of tomatoes (if this was significantly higher than the MIC).
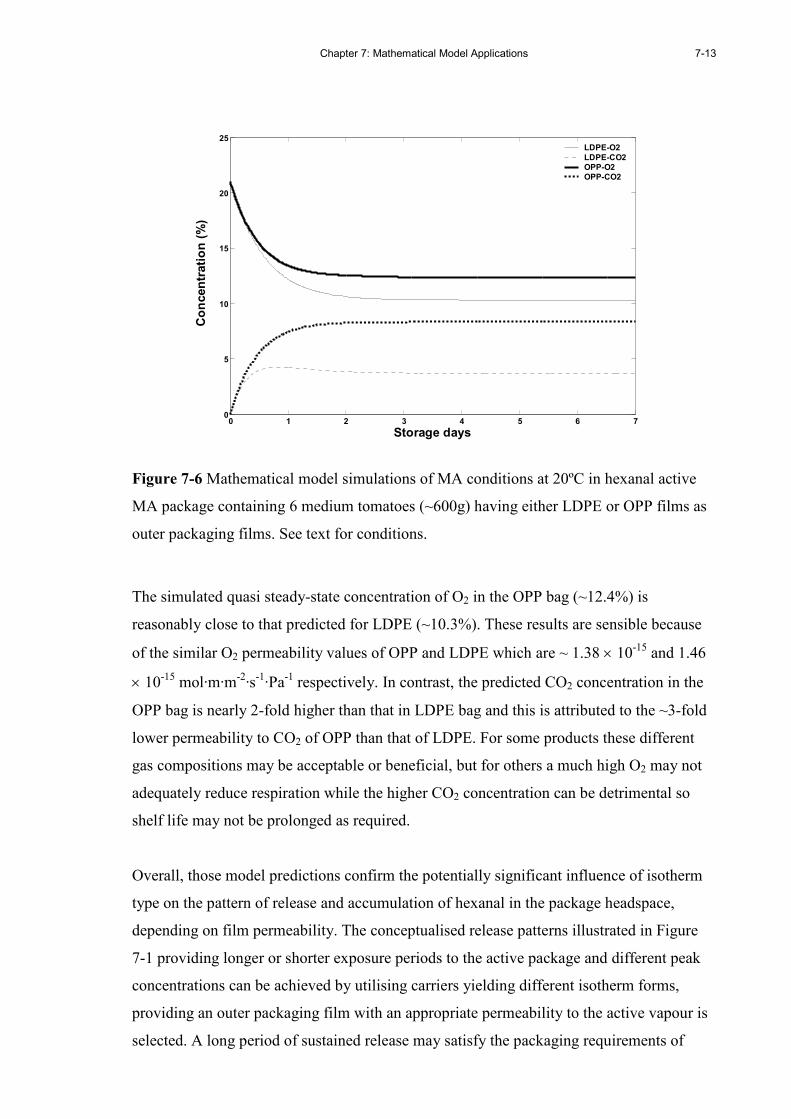
Chapter 7: Mathematical Model Applications
7-13
0 1 2 3 4 5 6 70
5
10
15
20
25
Storage days
Concentration (%)
LDPE-O2
LDPE-CO2
OPP-O2
OPP-CO2
Figure 7-6 Mathematical model simulations of MA conditions at 20ºC in hexanal active
MA package containing 6 medium tomatoes (~600g) having either LDPE or OPP films as
outer packaging films. See text for conditions.
The simulated quasi steady-state concentration of O2 in the OPP bag (~12.4%) is
reasonably close to that predicted for LDPE (~10.3%). These results are sensible because
of the similar O2 permeability values of OPP and LDPE which are ~ 1.38 × 10⁻¹⁵ and 1.46
× 10-15 mol·m·m-2·s-1·Pa-1 respectively. In contrast, the predicted CO2 concentration in the
OPP bag is nearly 2-fold higher than that in LDPE bag and this is attributed to the ~3-fold
lower permeability to CO2 of OPP than that of LDPE. For some products these different
gas compositions may be acceptable or beneficial, but for others a much high O2 may not
adequately reduce respiration while the higher CO2 concentration can be detrimental so
shelf life may not be prolonged as required.
Overall, those model predictions confirm the potentially significant influence of isotherm
type on the pattern of release and accumulation of hexanal in the package headspace,
depending on film permeability. The conceptualised release patterns illustrated in Figure
7-1 providing longer or shorter exposure periods to the active package and different peak
concentrations can be achieved by utilising carriers yielding different isotherm forms,
providing an outer packaging film with an appropriate permeability to the active vapour is
selected. A long period of sustained release may satisfy the packaging requirements of

7-14 Mathematical Modelling of Active Packaging Systems for Horticultural Products
certain products, in which a high effective level of the active volatile is required to ensure
maintenance of the targeted qualities. For this, the exponential isotherm is useful. In
contrast the Langmuir isotherm is more suitable when an initial fumigation at high
concentration is required for a short period, after which the concentration should decrease
to a low effective level and be sustained at this level throughout the subsequent storage
period. The generalised link between quasi steady-state concentration and PAR values
developed in the headspace for active MAP systems having different isotherms (as shown
Figure 7-5) could be used for preliminary design to achieve a desired active vapour MIC
level.
7.3 Effects of isotherm shape on flux of hexanal across the sachet boundary
In this section, the objective was to further investigate the effects of isotherm shape on the
flux of hexanal across the sachet boundary. As discussed in the previous section, isotherm
shape significantly influences changes in the equilibrium vapour concentration in the
sachet ( Hxlbed,gC ) which can consequently affect the concentration gradient between the
sachet and the package headspace, and hence the flux across the sachet film.
7.3.1 Changes of flux as a function of isotherm shape
The steady-state flux across the sachet film boundary is simplified as shown in Eq. 7-5 if a
constant permeability is assumed.
( )Hxlpkhs
Hxlbed,g
scfl
pkgHxlscfl
scfl CCL
RTPJ −= (Eq. 7-5)
where
scflJ = Steady-state flux at sachet boundary (mol·s-1·m-2)
Hxlbed,gC = Equilibrium hexanal vapour concentration above the carrier bed (mol⋅m-3)
HxlpkhsC = Hexanal vapour concentration in package headspace (mol⋅m-3)
Assuming Hxlpkhs
Hxlbed,g
C C >> (as is generally true in the concentration range of interest), Eq.
7-5 can be simplified to Eq. 7-6.
Hxlbed,g
scfl
pkgHxlscfl
scfl CL
RTPJ = (Eq. 7-6)
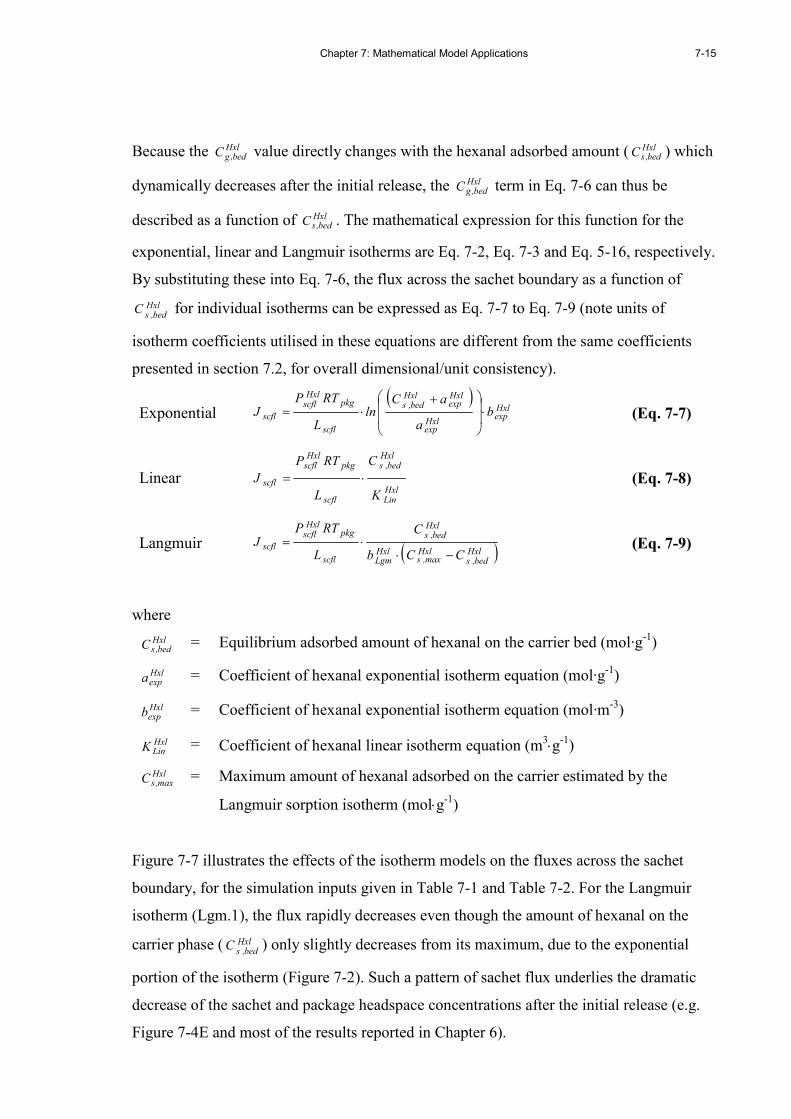
Chapter 7: Mathematical Model Applications
7-15
Because the Hxlbed,gC value directly changes with the hexanal adsorbed amount ( Hxl
bed,sC ) which
dynamically decreases after the initial release, the Hxlbed,gC term in Eq. 7-6 can thus be
described as a function of Hxlbed,sC . The mathematical expression for this function for the
exponential, linear and Langmuir isotherms are Eq. 7-2, Eq. 7-3 and Eq. 5-16, respectively.
By substituting these into Eq. 7-6, the flux across the sachet boundary as a function of
Hxlbed,s
C for individual isotherms can be expressed as Eq. 7-7 to Eq. 7-9 (note units of
isotherm coefficients utilised in these equations are different from the same coefficients
presented in section 7.2, for overall dimensional/unit consistency).
Exponential ( )
Hxlexp
Hxlexp
Hxlexp
Hxlbed,s
scfl
pkgHxlscfl
scfl ba
aCln
L
RTPJ ⋅
+⋅= (Eq. 7-7)
Linear
HxlLin
Hxlbed,s
scfl
pkgHxlscfl
scfl
K
C
L
RTP
J ⋅= (Eq. 7-8)
Langmuir ( )Hxlbed,s
Hxlmax,s
HxlLgm
Hxlbed,s
scfl
pkgHxlscfl
scflCCb
C
L
RTPJ
−⋅⋅= (Eq. 7-9)
where
Hxlbed,sC = Equilibrium adsorbed amount of hexanal on the carrier bed (mol·g
-1)
Hxlexpa = Coefficient of hexanal exponential isotherm equation (mol·g-1)
Hxlexpb = Coefficient of hexanal exponential isotherm equation (mol·m-3)
HxlLinK = Coefficient of hexanal linear isotherm equation (m
3⋅g-1)
Hxlmax,sC = Maximum amount of hexanal adsorbed on the carrier estimated by the
Langmuir sorption isotherm (mol⋅g-1)
Figure 7-7 illustrates the effects of the isotherm models on the fluxes across the sachet
boundary, for the simulation inputs given in Table 7-1 and Table 7-2. For the Langmuir
isotherm (Lgm.1), the flux rapidly decreases even though the amount of hexanal on the
carrier phase ( Hxlbed,s
C ) only slightly decreases from its maximum, due to the exponential
portion of the isotherm (Figure 7-2). Such a pattern of sachet flux underlies the dramatic
decrease of the sachet and package headspace concentrations after the initial release (e.g.
Figure 7-4E and most of the results reported in Chapter 6).
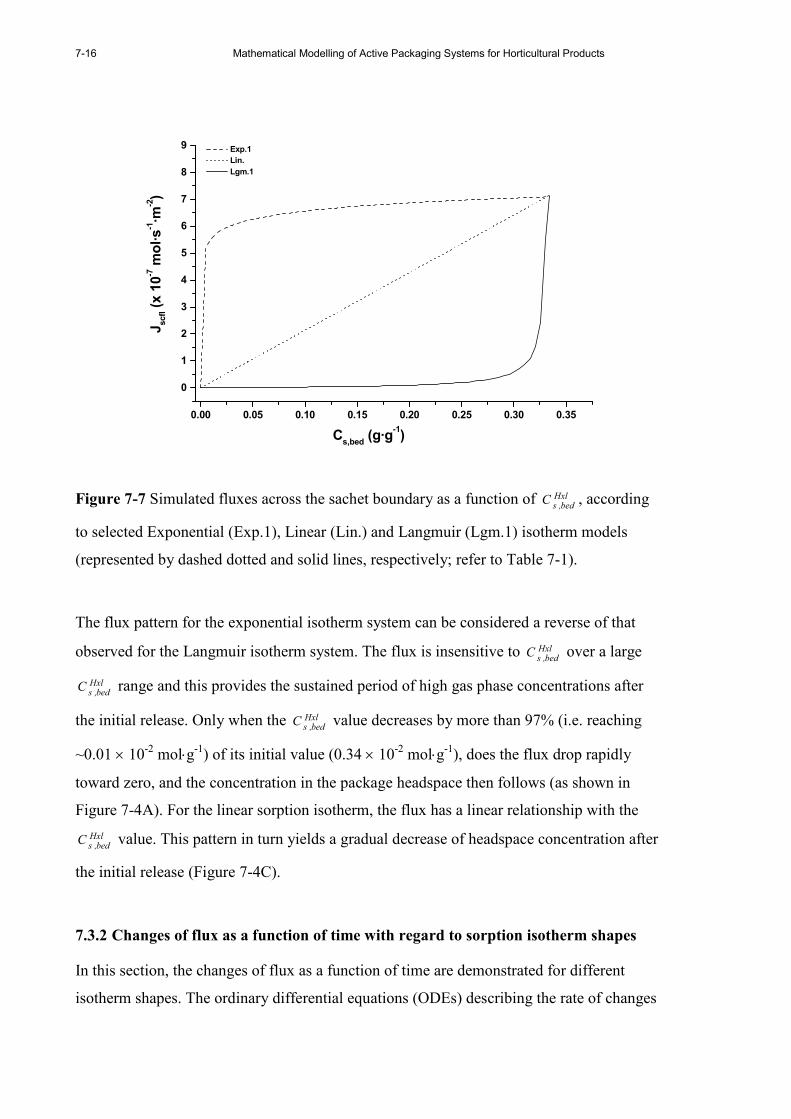
7-16 Mathematical Modelling of Active Packaging Systems for Horticultural Products
0.00 0.05 0.10 0.15 0.20 0.25 0.30 0.35
0
1
2
3
4
5
6
7
8
9 Exp.1
Lin.
Lgm.1
Jscfl (x 10-7 mol·s-1·m
-2)
Cs,bed
(g·g-1)
Figure 7-7 Simulated fluxes across the sachet boundary as a function of Hxlbed,s
C , according
to selected Exponential (Exp.1), Linear (Lin.) and Langmuir (Lgm.1) isotherm models
(represented by dashed dotted and solid lines, respectively; refer to Table 7-1).
The flux pattern for the exponential isotherm system can be considered a reverse of that
observed for the Langmuir isotherm system. The flux is insensitive to Hxlbed,s
C over a large
Hxlbed,s
C range and this provides the sustained period of high gas phase concentrations after
the initial release. Only when the Hxlbed,s
C value decreases by more than 97% (i.e. reaching
~0.01 × 10⁻² mol⋅g-1) of its initial value (0.34 × 10⁻² mol⋅g-1), does the flux drop rapidly
toward zero, and the concentration in the package headspace then follows (as shown in
Figure 7-4A). For the linear sorption isotherm, the flux has a linear relationship with the
Hxlbed,s
C value. This pattern in turn yields a gradual decrease of headspace concentration after
the initial release (Figure 7-4C).
7.3.2 Changes of flux as a function of time with regard to sorption isotherm shapes
In this section, the changes of flux as a function of time are demonstrated for different
isotherm shapes. The ordinary differential equations (ODEs) describing the rate of changes

Chapter 7: Mathematical Model Applications
7-17
of Hxlbed,s
C as a function of time are found in Chapter 5 Eq. 5-17. By utilising the
simplifications as stated in the previous section, Eq. 5-17 leads to Eq. 7-10.
Hxlbed,g
scfl
pkgscflHxlscfl
Hxlbed,s
bed C
L
RTAP
t
C
M −=∂
∂
(Eq. 7-10)
Also, by describing Hxlbed,gC as a function of Hxl
bed,sC according to the exponential, linear and
Langmuir isotherms, Eq. 7-10 gives Eq. 7-11 to Eq. 7-13 (note units of isotherm
coefficients utilised in these equations are same as those presented in section 7.3.1).
Exponential
( )Hxlexp
Hxlexp
Hxlexp
Hxlbed,s
scfl
pkgscflHxlscfl
Hxlbed,s
bed b
a
aC
ln
L
RTAP
t
C
M ⋅
+⋅−=
∂
∂ (Eq. 7-11)
Linear HxlLin
Hxlbed,s
scfl
pkgscflHxlscfl
Hxlbed,s
bed
K
C
L
RTAP
t
C
M ⋅−=∂
∂ (Eq. 7-12)
Langmuir ( )Hxl
bed,sHxlmax,s
HxlLgm
Hxlbed,s
scfl
pkgscflHxlscfl
Hxlbed,s
bed
CCb
C
L
RTAP
t
C
M
−⋅⋅−=
∂
∂ (Eq. 7-13)
By separating variables and integrating, the ODEs can be solved analytically and Hxlbed,s
C as
a function of time (for each isotherm) is predicted by Eq. 7-14 to Eq. 7-16, respectively.
Exponential Hxlexpbedscfl
Hxlexppkgscfl
Hxlscfl
Hxlexp
Hxli,bed,s
Hxlexp
Hxlexp
Hxlbed,s
Hxlexp
aML
tbRTAP
a
Ca
li
a
Ca
li −
+=
+ (Eq. 7-14)
Linear
−=
bedHxlLinscfl
pkgscflHxlscfl
Hxli,bed,s
Hxlbed,s
MKL
tRTAP
expCC (Eq. 7-15)
Langmuir Hxl
i,bed,sHxlLgmbedscfl
pkgscflHxlscfl
Hxli,bed,s
Hxlbed,s
Hxlmax,s
Hxlbed,s C
bML
tRTAP
C
C
lnCC ++
= (Eq. 7-16)
where
Hxli,bed,sC = Initial hexanal adsorbed amount of the carrier bed (mol⋅g-1)
t = Time (s)
li = Log integral function
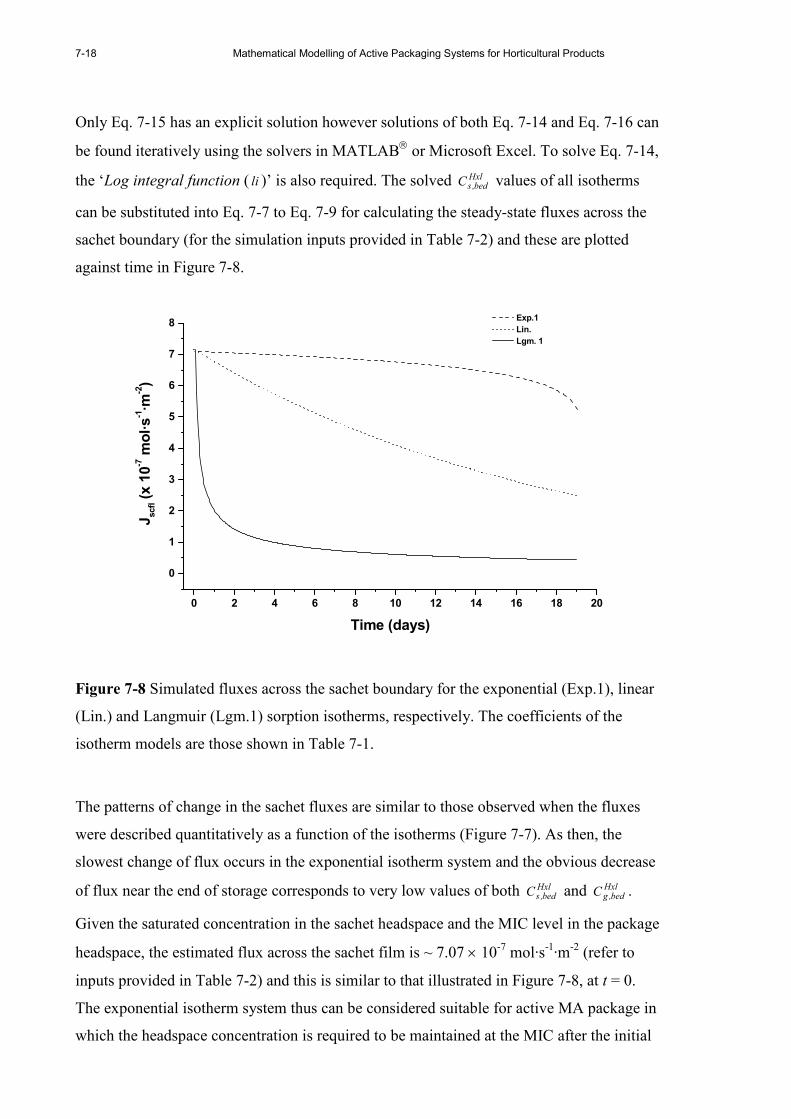
7-18 Mathematical Modelling of Active Packaging Systems for Horticultural Products
Only Eq. 7-15 has an explicit solution however solutions of both Eq. 7-14 and Eq. 7-16 can
be found iteratively using the solvers in MATLAB or Microsoft Excel. To solve Eq. 7-14,
the ‘Log integral function ( li )’ is also required. The solved Hxlbed,sC values of all isotherms
can be substituted into Eq. 7-7 to Eq. 7-9 for calculating the steady-state fluxes across the
sachet boundary (for the simulation inputs provided in Table 7-2) and these are plotted
against time in Figure 7-8.
0 2 4 6 8 10 12 14 16 18 20
0
1
2
3
4
5
6
7
8 Exp.1
Lin.
Lgm. 1
Jscfl (x 10-7 mol·s-1·m
-2)
Time (days)
Figure 7-8 Simulated fluxes across the sachet boundary for the exponential (Exp.1), linear
(Lin.) and Langmuir (Lgm.1) sorption isotherms, respectively. The coefficients of the
isotherm models are those shown in Table 7-1.
The patterns of change in the sachet fluxes are similar to those observed when the fluxes
were described quantitatively as a function of the isotherms (Figure 7-7). As then, the
slowest change of flux occurs in the exponential isotherm system and the obvious decrease
of flux near the end of storage corresponds to very low values of both Hxlbed,sC and Hxl
bed,gC .
Given the saturated concentration in the sachet headspace and the MIC level in the package
headspace, the estimated flux across the sachet film is ~ 7.07 × 10⁻⁷ mol·s-1·m-2 (refer to
inputs provided in Table 7-2) and this is similar to that illustrated in Figure 7-8, at t = 0.
The exponential isotherm system thus can be considered suitable for active MA package in
which the headspace concentration is required to be maintained at the MIC after the initial
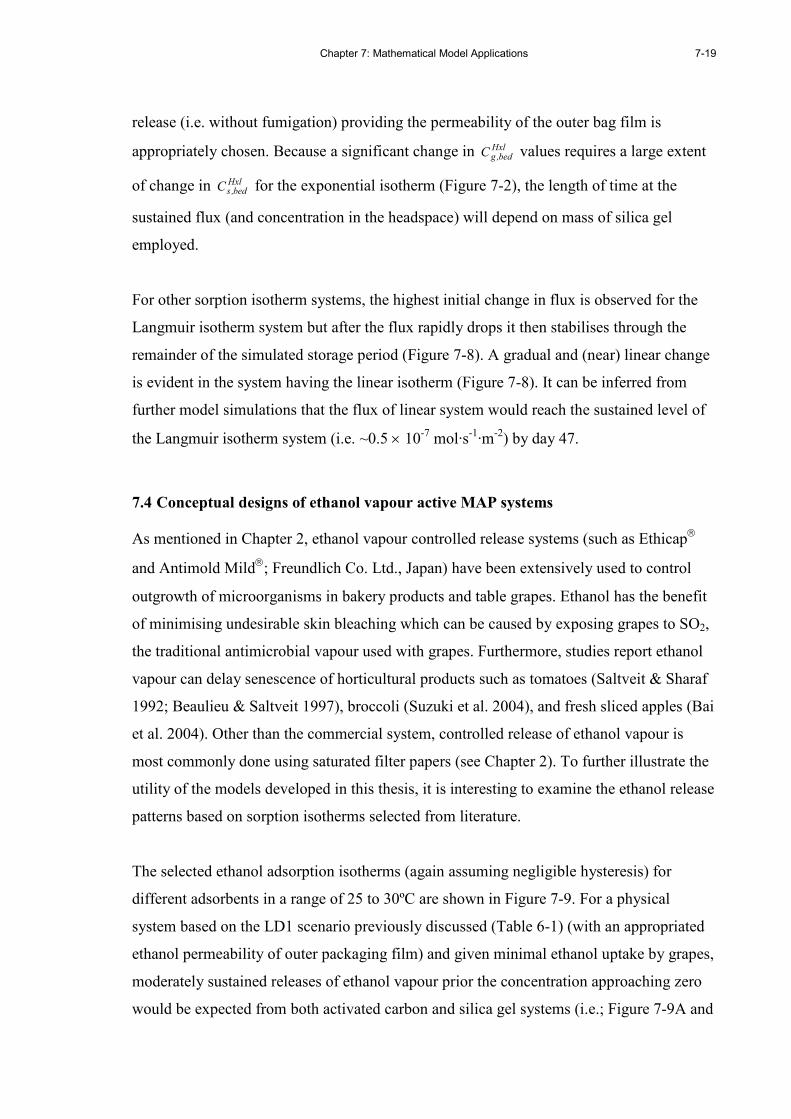
Chapter 7: Mathematical Model Applications
7-19
release (i.e. without fumigation) providing the permeability of the outer bag film is
appropriately chosen. Because a significant change in Hxlbed,gC values requires a large extent
of change in Hxlbed,sC for the exponential isotherm (Figure 7-2), the length of time at the
sustained flux (and concentration in the headspace) will depend on mass of silica gel
employed.
For other sorption isotherm systems, the highest initial change in flux is observed for the
Langmuir isotherm system but after the flux rapidly drops it then stabilises through the
remainder of the simulated storage period (Figure 7-8). A gradual and (near) linear change
is evident in the system having the linear isotherm (Figure 7-8). It can be inferred from
further model simulations that the flux of linear system would reach the sustained level of
the Langmuir isotherm system (i.e. ~0.5 × 10⁻⁷ mol·s-1·m-2) by day 47.
7.4 Conceptual designs of ethanol vapour active MAP systems
As mentioned in Chapter 2, ethanol vapour controlled release systems (such as Ethicap
and Antimold Mild; Freundlich Co. Ltd., Japan) have been extensively used to control
outgrowth of microorganisms in bakery products and table grapes. Ethanol has the benefit
of minimising undesirable skin bleaching which can be caused by exposing grapes to SO2,
the traditional antimicrobial vapour used with grapes. Furthermore, studies report ethanol
vapour can delay senescence of horticultural products such as tomatoes (Saltveit & Sharaf
1992; Beaulieu & Saltveit 1997), broccoli (Suzuki et al. 2004), and fresh sliced apples (Bai
et al. 2004). Other than the commercial system, controlled release of ethanol vapour is
most commonly done using saturated filter papers (see Chapter 2). To further illustrate the
utility of the models developed in this thesis, it is interesting to examine the ethanol release
patterns based on sorption isotherms selected from literature.
The selected ethanol adsorption isotherms (again assuming negligible hysteresis) for
different adsorbents in a range of 25 to 30ºC are shown in Figure 7-9. For a physical
system based on the LD1 scenario previously discussed (Table 6-1) (with an appropriated
ethanol permeability of outer packaging film) and given minimal ethanol uptake by grapes,
moderately sustained releases of ethanol vapour prior the concentration approaching zero
would be expected from both activated carbon and silica gel systems (i.e.; Figure 7-9A and
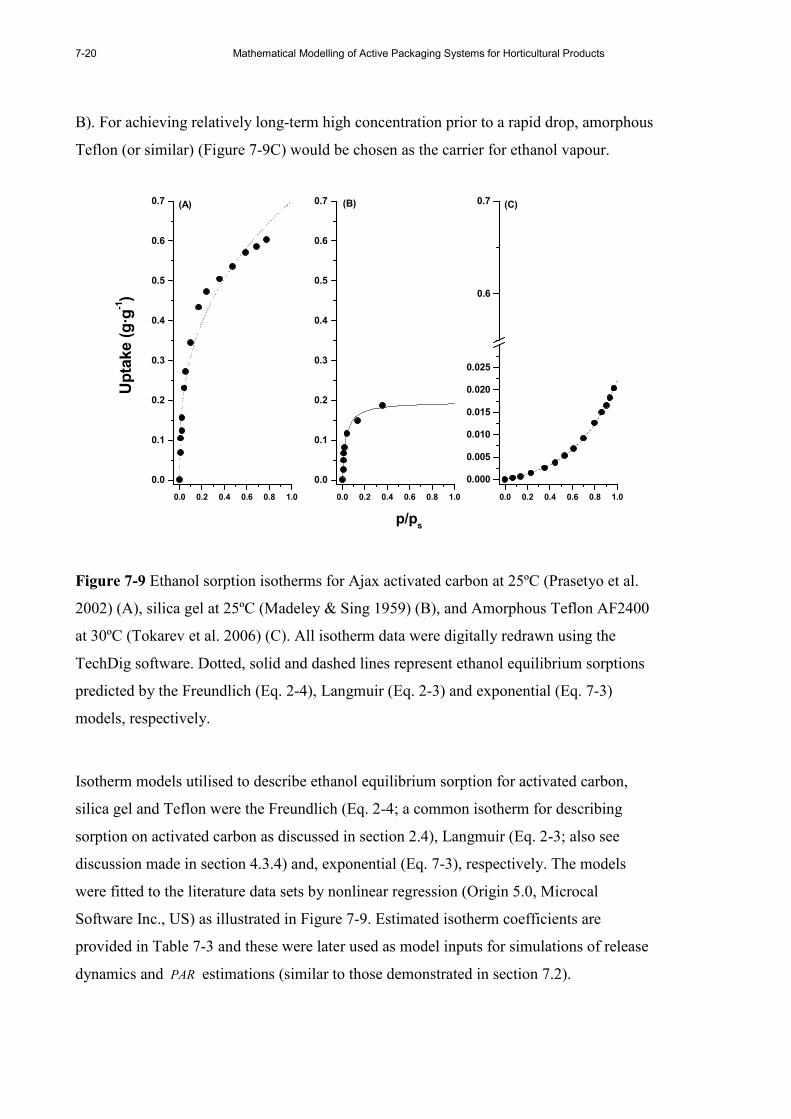
7-20 Mathematical Modelling of Active Packaging Systems for Horticultural Products
B). For achieving relatively long-term high concentration prior to a rapid drop, amorphous
Teflon (or similar) (Figure 7-9C) would be chosen as the carrier for ethanol vapour.
0.0 0.2 0.4 0.6 0.8 1.0
0.0
0.1
0.2
0.3
0.4
0.5
0.6
0.7 (A)
Uptake (g·g
-1)
0.0 0.2 0.4 0.6 0.8 1.0
0.000
0.005
0.010
0.015
0.020
0.025
0.6
0.7 (C)
p/ps
0.0 0.2 0.4 0.6 0.8 1.0
0.0
0.1
0.2
0.3
0.4
0.5
0.6
0.7 (B)
Figure 7-9 Ethanol sorption isotherms for Ajax activated carbon at 25ºC (Prasetyo et al.
2002) (A), silica gel at 25ºC (Madeley & Sing 1959) (B), and Amorphous Teflon AF2400
at 30ºC (Tokarev et al. 2006) (C). All isotherm data were digitally redrawn using the
TechDig software. Dotted, solid and dashed lines represent ethanol equilibrium sorptions
predicted by the Freundlich (Eq. 2-4), Langmuir (Eq. 2-3) and exponential (Eq. 7-3)
models, respectively.
Isotherm models utilised to describe ethanol equilibrium sorption for activated carbon,
silica gel and Teflon were the Freundlich (Eq. 2-4; a common isotherm for describing
sorption on activated carbon as discussed in section 2.4), Langmuir (Eq. 2-3; also see
discussion made in section 4.3.4) and, exponential (Eq. 7-3), respectively. The models
were fitted to the literature data sets by nonlinear regression (Origin 5.0, Microcal
Software Inc., US) as illustrated in Figure 7-9. Estimated isotherm coefficients are
provided in Table 7-3 and these were later used as model inputs for simulations of release
dynamics and PAR estimations (similar to those demonstrated in section 7.2).
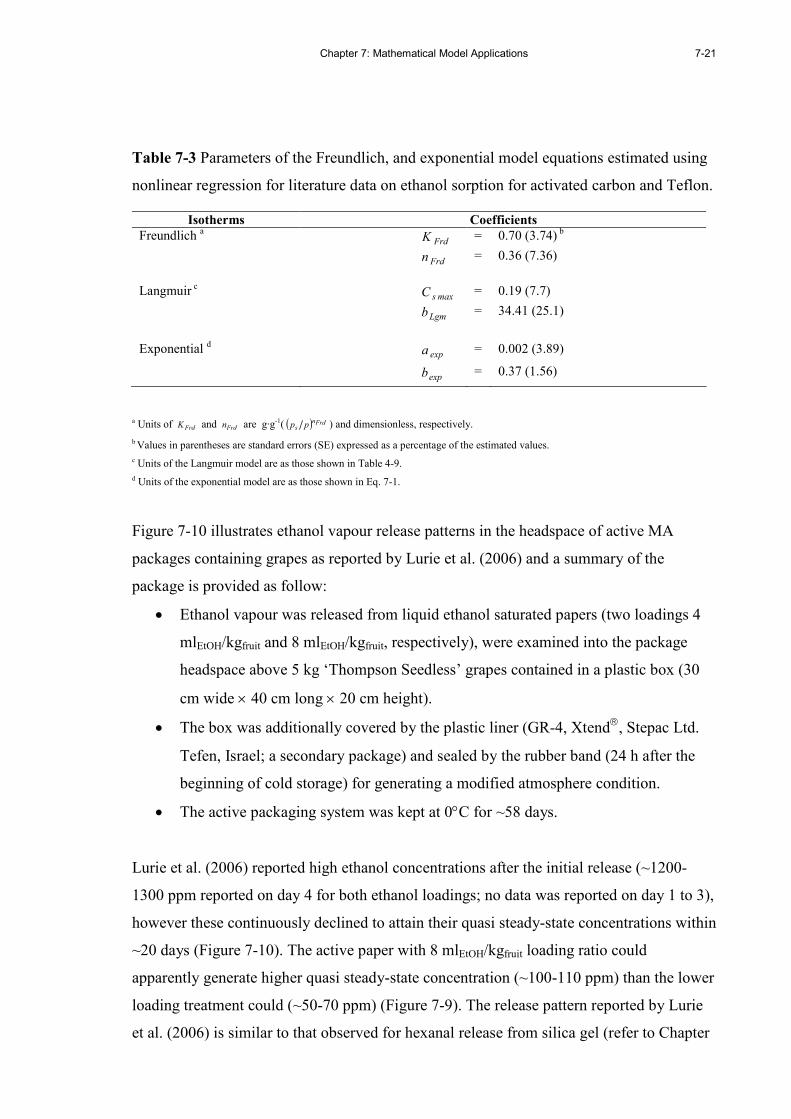
Chapter 7: Mathematical Model Applications
7-21
Table 7-3 Parameters of the Freundlich, and exponential model equations estimated using
nonlinear regression for literature data on ethanol sorption for activated carbon and Teflon.
Isotherms Coefficients
Freundlich a FrdK = 0.70 (3.74) b
Frdn = 0.36 (7.36)
Langmuir c
maxsC = 0.19 (7.7)
Lgmb = 34.41 (25.1)
Exponential d
expa = 0.002 (3.89)
expb = 0.37 (1.56)
a Units of FrdK and Frdn are g·g-1( ( ) Frdns pp ) and dimensionless, respectively.
b Values in parentheses are standard errors (SE) expressed as a percentage of the estimated values.
c Units of the Langmuir model are as those shown in Table 4-9.
d Units of the exponential model are as those shown in Eq. 7-1.
Figure 7-10 illustrates ethanol vapour release patterns in the headspace of active MA
packages containing grapes as reported by Lurie et al. (2006) and a summary of the
package is provided as follow:
• Ethanol vapour was released from liquid ethanol saturated papers (two loadings 4
mlEtOH/kgfruit and 8 mlEtOH/kgfruit, respectively), were examined into the package
headspace above 5 kg ‘Thompson Seedless’ grapes contained in a plastic box (30
cm wide × 40 cm long × 20 cm height).
• The box was additionally covered by the plastic liner (GR-4, Xtend, Stepac Ltd.
Tefen, Israel; a secondary package) and sealed by the rubber band (24 h after the
beginning of cold storage) for generating a modified atmosphere condition.
• The active packaging system was kept at 0°C for ~58 days.
Lurie et al. (2006) reported high ethanol concentrations after the initial release (~1200-
1300 ppm reported on day 4 for both ethanol loadings; no data was reported on day 1 to 3),
however these continuously declined to attain their quasi steady-state concentrations within
~20 days (Figure 7-10). The active paper with 8 mlEtOH/kgfruit loading ratio could
apparently generate higher quasi steady-state concentration (~100-110 ppm) than the lower
loading treatment could (~50-70 ppm) (Figure 7-9). The release pattern reported by Lurie
et al. (2006) is similar to that observed for hexanal release from silica gel (refer to Chapter

7-22 Mathematical Modelling of Active Packaging Systems for Horticultural Products
6) suggesting Type I equilibrium desorption of ethanol from the paper. This pattern has
also been found for other VOCs including acetophenone, naphthalene, benzophenone,
dibutyl phthalate (DBP) and methyl stearate, for corrugated liners and paperboards
(containing either virgin or recycled paper pulps) at 70 and 100ºC (Triantafyllou et al.
2005). To date, there is no report on the ethanol sorption isotherm for paper, nor on the
ethanol permeability of Xtend plastic liner.
0 10 20 30 40 50 600
200
400
600
800
1000
1200
1400
1600
1800
Storage days
Package headspace concentration (ppm)
4ml/kg (lit.)
8ml/kg (lit.)
Sim.1
Sim.2
Figure 7-10 Ethanol vapour concentrations released from 4 mlEtOH/kgfruit (ο) and 8
mlEtOH/kgfruit (◊) loading ratios of liquid ethanol saturated paper as reported by Lurie et al.
(2006) and data were digitally redrawn using the TechDig software. Solid and dotted lines
represent model predictions of the Langmuir ethanol sorption isotherm for silica gel,
provided model in puts in Table 7-4. See text for simulation conditions (for Sim.1 and
Sim.2).
It is interesting to try to predict the ethanol vapour release pattern in the headspace of
package using the mathematical model developed in Chapter 6 based on the Langmuir
ethanol vapour sorption isotherm for silica gel (Table 7-3) and a package having a physical
dimension as reported by Lurie et al. (2006). The model inputs for these simulations were
selected appropriately and shown in Table 7-4; interactions between grapes and ethanol
vapour were assumed negligible. These simulated results are also illustrated in Figure 7-10.
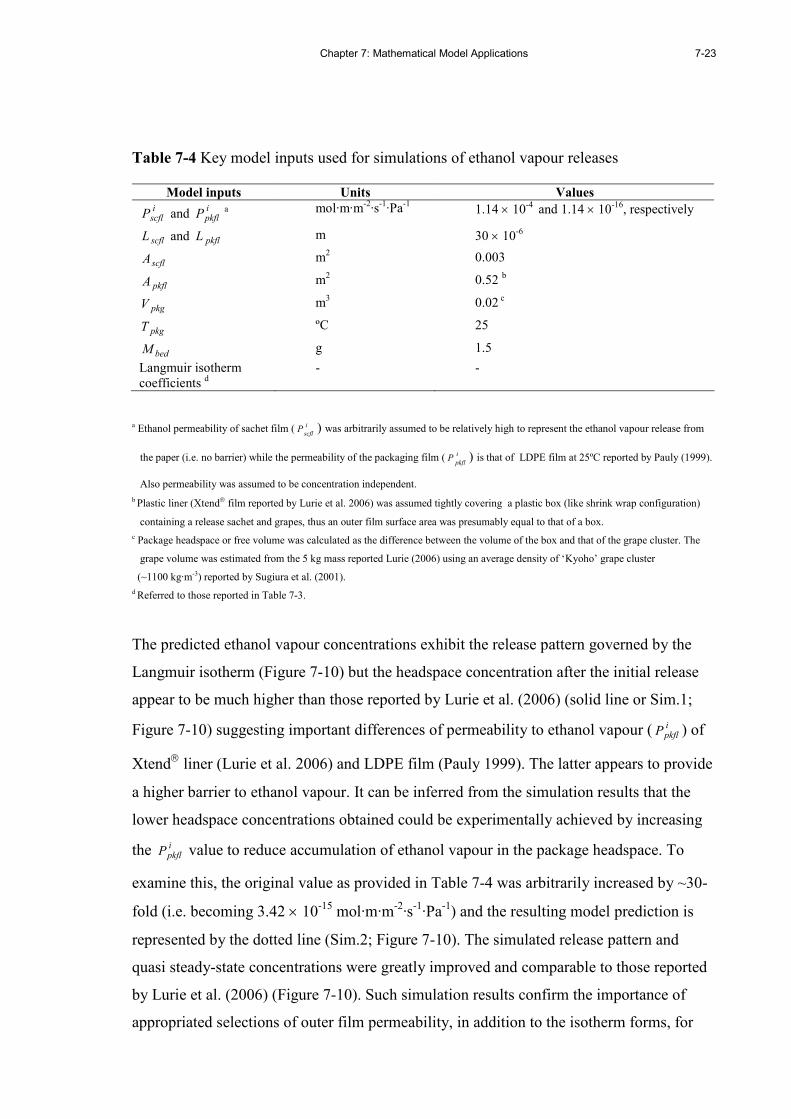
Chapter 7: Mathematical Model Applications
7-23
Table 7-4 Key model inputs used for simulations of ethanol vapour releases
Model inputs Units Values iscflP and
ipkflP
a mol·m·m-2·s-1·Pa-1 1.14 × 10⁻⁴ and 1.14 × 10⁻¹⁶, respectively
scflL and pkflL m 30 × 10-6
scflA m2 0.003
pkflA m2 0.52 b
pkgV m3 0.02 c
pkgT ºC 25
bedM g 1.5
Langmuir isotherm coefficients d
- -
a Ethanol permeability of sachet film ( i
scflP ) was arbitrarily assumed to be relatively high to represent the ethanol vapour release from
the paper (i.e. no barrier) while the permeability of the packaging film ( i
pkflP ) is that of LDPE film at 25ºC reported by Pauly (1999).
Also permeability was assumed to be concentration independent.
b Plastic liner (Xtend film reported by Lurie et al. 2006) was assumed tightly covering a plastic box (like shrink wrap configuration)
containing a release sachet and grapes, thus an outer film surface area was presumably equal to that of a box.
c Package headspace or free volume was calculated as the difference between the volume of the box and that of the grape cluster. The
grape volume was estimated from the 5 kg mass reported Lurie (2006) using an average density of ‘Kyoho’ grape cluster
(~1100 kg·m-3) reported by Sugiura et al. (2001).
d Referred to those reported in Table 7-3.
The predicted ethanol vapour concentrations exhibit the release pattern governed by the
Langmuir isotherm (Figure 7-10) but the headspace concentration after the initial release
appear to be much higher than those reported by Lurie et al. (2006) (solid line or Sim.1;
Figure 7-10) suggesting important differences of permeability to ethanol vapour ( ipkflP ) of
Xtend liner (Lurie et al. 2006) and LDPE film (Pauly 1999). The latter appears to provide
a higher barrier to ethanol vapour. It can be inferred from the simulation results that the
lower headspace concentrations obtained could be experimentally achieved by increasing
the ipkflP value to reduce accumulation of ethanol vapour in the package headspace. To
examine this, the original value as provided in Table 7-4 was arbitrarily increased by ~30-
fold (i.e. becoming 3.42 × 10⁻¹⁵ mol·m·m-2·s-1·Pa-1) and the resulting model prediction is
represented by the dotted line (Sim.2; Figure 7-10). The simulated release pattern and
quasi steady-state concentrations were greatly improved and comparable to those reported
by Lurie et al. (2006) (Figure 7-10). Such simulation results confirm the importance of
appropriated selections of outer film permeability, in addition to the isotherm forms, for
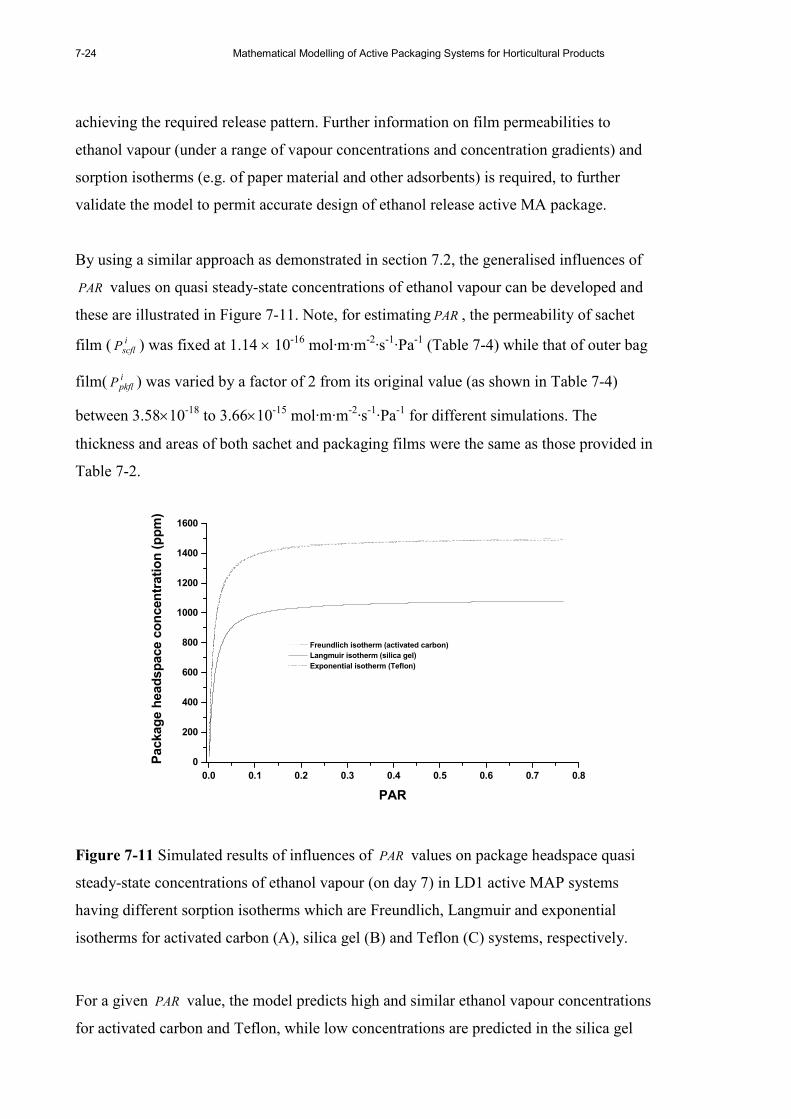
7-24 Mathematical Modelling of Active Packaging Systems for Horticultural Products
achieving the required release pattern. Further information on film permeabilities to
ethanol vapour (under a range of vapour concentrations and concentration gradients) and
sorption isotherms (e.g. of paper material and other adsorbents) is required, to further
validate the model to permit accurate design of ethanol release active MA package.
By using a similar approach as demonstrated in section 7.2, the generalised influences of
PAR values on quasi steady-state concentrations of ethanol vapour can be developed and
these are illustrated in Figure 7-11. Note, for estimating PAR , the permeability of sachet
film ( iscflP ) was fixed at 1.14 × 10⁻¹⁶ mol·m·m-2·s-1·Pa-1 (Table 7-4) while that of outer bag
film( ipkflP ) was varied by a factor of 2 from its original value (as shown in Table 7-4)
between 3.58×10⁻¹⁸ to 3.66×10⁻¹⁵ mol·m·m-2·s-1·Pa-1 for different simulations. The
thickness and areas of both sachet and packaging films were the same as those provided in
Table 7-2.
0.0 0.1 0.2 0.3 0.4 0.5 0.6 0.7 0.8
0
200
400
600
800
1000
1200
1400
1600
Freundlich isotherm (activated carbon)
Langmuir isotherm (silica gel)
Exponential isotherm (Teflon)
Package headspace concentration (ppm)
PAR
Figure 7-11 Simulated results of influences of PAR values on package headspace quasi
steady-state concentrations of ethanol vapour (on day 7) in LD1 active MAP systems
having different sorption isotherms which are Freundlich, Langmuir and exponential
isotherms for activated carbon (A), silica gel (B) and Teflon (C) systems, respectively.
For a given PAR value, the model predicts high and similar ethanol vapour concentrations
for activated carbon and Teflon, while low concentrations are predicted in the silica gel

Chapter 7: Mathematical Model Applications
7-25
systems (Figure 7-11). These results appear to be sensible and can be explained by the
extents of change of sachet headspace concentration after initial release in respect to
isotherm forms, as discussed above. It should be noted that the controlled release of
ethanol vapour from the activated carbon however may have to be carefully designed
because ethanol vapour (and other organic vapours such as 1-MCP as reported by Lee
2003) has a strong affinity with activated carbon adsorbents (Thomas & Crittenden 1998a).
Furthermore the patterns observed in Figure 7-11 were different from those illustrated in
Figure 7-5. In this case, the ethanol vapour quasi steady-state concentration reaches its
maximum value and levels off when PAR value ≥ ~0.1. This pattern is attributed to the low
permeability to ethanol vapour in both the sachet and outer packaging film (noted above).
These film properties can contribute to low rates of both ethanol vapour release from the
sachet and permeation through the packaging film.
7.5 Summary
The global mathematical model developed in the present work can be implemented to
predict sensible hexanal release patterns for different active packaging systems where the
sorption isotherm is the key variable. The mathematical equations formulated in the model
can be adjusted to suit particular scenarios for gaining insights into the steady-state fluxes
across the sachet boundary, which significantly influence the vapour release into the
package headspace. Overall, this chapter illustrates the applications of the mathematical
model and confirms its generality and potential to be utilised as a tool to mechanistically
understand key mass transfer processes and design active packaging systems with an
emphasis on the controlled release of volatile active agents for assuring the quality of
horticultural and other food products.

7-26 Mathematical Modelling of Active Packaging Systems for Horticultural Products

Chapter 8: General Discussion and Conclusions
8-1
Chapter 8
GENERAL DISCUSSION AND CONCLUSIONS
8.1 General discussion
The first step in the development of mathematical models for the design and analysis of
simple active packaging systems have recently appeared in the literature. Unsteady-state
mass balances for describing oxygen concentrations in oxygen scavenging active MA
packages for tomatoes and endives was reported by Charles et al. (2003) and Charles et al.
(2008), respectively. Models are important tools that can be used to identify key aspects for
the design of active packaging systems for horticultural products, such as identifying ideal
properties of active agents with respect to interactive control of postharvest qualities, and
the requirements of sorption isotherms of porous adsorbents and film permeability.
However the development of generalised models for the controlled release of volatiles into
a packaging headspace to inhibit spoilage or modify the physiological response of the
product have not so far been reported. This work set out to develop such models, to
provide clear guidelines on how such models of active MAP systems should be
constructed, and demonstrate their potential uses.
The work was based on a model active packaging system of hexanal vapour released from
a sachet (with silica gel adsorbent as the carrier) to inhibit growth of Botrytis cinerea (the
postharvest pathogen) on tomatoes, during storage under a MA generated using a LDPE
bag.
The antifungal activity of hexanal vapour to suppress in vivo growth of B. cinerea on
tomatoes under ambient atmosphere and extreme storage condition (20ºC; ~99% RH) was
demonstrated. Good results were achieved by continuous exposure of tomatoes to ~40-270
ppm hexanal vapour concentration. These findings are consistent with previous reports on
the antimicrobial properties of hexanal vapour on postharvest pathogens (e.g. Song et al.
1996; Archbold et al. 1997; Fan et al. 2006; Song et al. 2007). The minimum inhibition
concentration (MIC) was chosen from the effective concentration range as ~40-70 ppm and
this was assigned as the target for the sustained concentration to be achieved in active
MAP designs.
8-2 Mathematical Modelling of Active Packaging Systems for Horticultural Products
Although there is much evidence of the antifungal role of hexanal vapour, there was no
information on its influence on postharvest quality. This work has shown that continuous
exposure of intact light red tomatoes to MIC hexanal vapour for 7 days under ambient
conditions significantly stimulated the respiration rate and delayed skin reddening, while
changes in other quality parameters (i.e. firmness, mass loss and ethylene generation rate)
were not apparent. Under MA conditions (i.e.~10% O2 and ~5% CO2) such effects of
hexanal were minimal. However for both cases, there was apparent uptake of hexanal by
the tomatoes as evidenced by changes to the headspace hexanal concentration.
The presence of hexanal vapour was found not to significantly influence the steady-state
MA condition in LDPE bag as similar levels of O2 and CO2 in packages were found, with
or without hexanal vapour present. This finding is consistent with literature reports on
other active MAP systems utilising volatile active agents, such as the essential oils
eugenol, thymol, and menthol. These results further suggested that there was minimal
influence of hexanal vapour on the film permeability to O2 and CO2. As such, existing
models for passive MAP systems could be used to predict changes to O2 and CO2 in the
active MA package. This confirmed that it is possible to combine the benefits of applying
passive MAP systems (e.g. minimising respiration rates) with active controls of
postharvest quality to extend shelf life.
The apparent rate of hexanal uptake by tomatoes emphasised the influence of horticultural
products on the rate and extent of build up of the active agent in the package headspace. It
also provided insights to key mechanisms limiting hexanal uptake by tomatoes. It is likely
that the apparent rate of uptake is limited by mass transport (i.e. sorption and diffusion
processes) across the tomato cuticle, rather than reaction rate, because the apparent uptake
rate was higher at lower temperature (10°C). This observation mimics the so-called
sorption-dominated permeation of VOCs across polymer films, which is well documented
in the literature and experimentally quantified in the hexanal permeability data for LDPE,
Tyvek, and OPP films quantified in this work. Further studies on mass transport across
the cuticle should provide insights on how the cuticle limits the penetration of active
agents, (e.g. the extent of plasticisation that may occur due to sorption of hexanal and other
volatile active agents to the cuticle).

Chapter 8: General Discussion and Conclusions
8-3
There were no previous data reported in the literature on the hexanal permeability of
Tyvek and OPP films. These were therefore measured in the present research along with
that of LDPE. The Tyvek material provided the fastest rate of hexanal release from the
sachet due to its high porosity; while the OPP film could be selected for sachet materials to
achieve very slow release rates, principally because of the high crystallinity of the polymer
structure providing a good barrier to hexanal permeation. From literature, metallocene
catalyst-based polyethylene film (commercially traded under Exact 4151; reported by
Wolford 1998) and EVOH film (Johansson & Leufven 1994) were reported to have
excellent barrier properties to hexanal vapour and these could be utilised as possible
alternative sachet materials to OPP for achieving slow release. In particular EVOH, which
is a hydrophilic film and its permeability to hexanal vapour reportedly increased with RH
level (see Johansson & Leufven 1994), could also be useful for a sachet to be utilised in
high RH environments (as in MA package of horticultural products) because the high RH
could promote hexanal permeation through the EVOH film. This may assist control of
microbial proliferations when the RH conditions favour mould growth. In contrast to
Tyvek and OPP films, LDPE film permeability to the hexanal vapour was reported in the
literature. The magnitude of LDPE permeability quantified in the present research was
reasonably consistent with this data, given comparable hexanal concentrations and ambient
conditions. This finding indicated that the experimental methodology used yielded reliable
data.
Significant dependence on temperature and concentration of hexanal permeability of
Tyvek, OPP and LDPE was observed, as expected for volatile permeation through
polymer films. Relationships between hexanal vapour concentration and permeability were
well described by the exponential growth model and this information, which has not
previously been reported in the literature, was critical for modelling these active packaging
systems. This is because the films are subjected to a wide range of hexanal concentrations,
from the very high initial concentration at the sachet boundary observed immediately after
placing the sachet in the MA bag, through varying concentrations in the package headspace
to the relatively low and sustained quasi steady-state concentration levels. High variation
was however observed in the estimated coefficients of the model obtained from nonlinear
regression, especially in the LDPE film systems. This finding is in agreement with the
principles of VOC permeation through polymer films, where complex mass transport
mechanisms and polymer structure arrangement are likely due to the concentration

8-4 Mathematical Modelling of Active Packaging Systems for Horticultural Products
dependence of solubility and diffusivity, and in turn contribute to high variation in
measured permeability.
Hexanal sorption isotherms for silica gel adsorbents showed the Type I isotherm pattern as
expected for the adsorption of volatiles on a microporous adsorbent where pore diameters
are about or no more than a few molecular diameters of the adsorbate. Hexanal sorption
isotherms were also reasonably well described by the Langmuir sorption equation and this
could indicate that adsorbed hexanal molecules on silica gel surfaces principally arrange in
a monolayer due to the limits of pore size. The estimated values of HxlLgmb obtained from the
nonlinear regression were highly dependent on temperature ( HxlLgmb at 10ºC was significantly
higher than that at 20ºC) and contained significant levels of uncertainty. These were in
contrast to estimated results for Hxlmax,sC . Evidence from experiments using both gravimetric
and volumetric methods suggested that the highest changes in sorption extent occurred at
low vapour phase concentrations. Small errors in measurements in this region could yield
high errors in HxlLgmb which represented the affinity between the adsorbate and the adsorbent.
In contrast, variation in estimates for Hxlmax,sC was small because the assumed monolayer
formation resulted in the maximum adsorption value minimally sensitive to hexanal vapour
concentrations. The calculated thermodynamic parameters, including free energy, apparent
enthalpy and entropy using HxlLgmb values, confirmed the exothermic nature of hexanal
sorption on silica gels at 10ºC and 20ºC. The calculated apparent enthalpy in particular
indicated that hexanal sorption on silica gels was a physical adsorption, where desorption
of physically adsorbed molecules became more likely under stimulated conditions such as
high concentration gradients or heat. Hexanal molecules are released as the temperature
increases (due to the lower adsorption capacity) and this should provide a quick response
of the controlled release system when the higher temperature storage regime may enhance
proliferation of postharvest pathogens.
The sorption of hexanal on silica gel in the presence of water vapour gave variable results
suggesting that multicomponent sorption is complex. Other literature have also reported
complex trends arising from pre-adsorption of water vapour in the case of methane
sorptions on activated carbon (Zhou et al. 2002) and silica gel (Zhou et al. 2006). The
utilisation of sachets with polymeric film of relatively low water vapour permeability such
as LDPE and OPP should result in only minimal influence of water vapour on the hexanal

Chapter 8: General Discussion and Conclusions
8-5
desorption from the silica gel in these active MAP systems. In the case of sachets
constructed of Tyvek, there could potentially be high rates of water vapour transport into
the sachet. The experimentally observed initial release peak from the Tyvek system was
higher than the model prediction, a trend opposite to those observed for both the OPP and
LDPE systems. These results might be due to uptake of water vapour by silica gel if this
caused displacement of adsorbed hexanal molecules, so leading to increasing hexanal
concentration in sachet headspace and in turn greater concentration gradients across the
sachet film. In contrast, the influence of RH on hexanal release appeared to be insignificant
during the quasi steady-state period (even though the RH in the package headspace with
tomatoes was >95%).
Two alternative methods of sorption isotherm measurement, inverse gas chromatography
(IGC) and the volumetric technique, were attempted to compare with the gravimetric
method results. The gravimetric method provided results in good agreement with the
literature when it was used to quantify sorption of ethanol and acetaldehyde on silica gel.
For both the IGC and volumetric techniques it appeared that the exposure time of the
hexanal vapour to silica gel was not sufficiently long to allow full penetration of the
hexanal molecules to reach all available sites of the microporous adsorbent. This
contributed to incompletely developed equilibrium conditions. Given such limits, the
gravimetric method was considered a more practical method for quantifying sorption
isotherms for the silica gel and potentially for other microporous adsorbents. The IGC and
volumetric techniques may be more suitable for systems having fast development of
equilibrium conditions, (e.g. adsorption on wide pore adsorbents or nonporous solids).
These studies of isotherm measurements highlighted the importance of method selection
on the validity of sorption isotherm data. Isotherm data obtained from one measurement
must be verified by correlations with literature data or by comparison with data obtained
from alternative methods.
The proposed generalised modelling methodology and the decision tree developed in this
work allow further exploration of key mass transfer processes for active MA packages
incorporating a volatile controlled release sachet. A model was developed to demonstrate
this process for the example system of an active MA package of tomatoes with hexanal
release from silica gel in order to sustain the concentration at effective levels in the
package headspace during the storage period. The criteria provided with the decision tree
8-6 Mathematical Modelling of Active Packaging Systems for Horticultural Products
can be employed for appropriate simplification of the processes, thereby minimising
complexity in the formulation of mathematical models. The models were numerically
solved using MATLAB and the solution checked to ensure no coding or numerical errors.
Hexanal mass transfer phenomena were successfully simulated using the global
mathematical model for a range of example active MA packages for tomatoes and storage
temperature regimes. These simulations were carried out using the hexanal mass transport
properties collected in the early parts of the research work. Both experimental and model
predictions showed rapid decreases of the hexanal concentration after the initial release in
all model packaging systems, owing to a small decrease of the adsorbed amount causing a
significant reduction in the equilibrium vapour concentration above the carrier. This
finding confirmed the significant influence of the isotherm shape on the release profile.
The model predictions and experimental measurements for the package headspace
concentrations showed reasonably good agreement, particularly during the quasi steady-
state region after the initial release peak. The quasi steady-state concentrations were
generally in the MIC level and found to be sustained at this level during the storage period
evaluated (7 days) but would also be expected to be maintained for longer storage. These
results suggested the potential of further developing the example active packages for
practical applications in the horticultural industry. The mathematical models developed for
active substance release could be combined with further models relating antimicrobial
efficacy as a function of vapour concentration (or partial pressure). An example of such
models is the Gompertz equation, which is reportedly able to reasonably predict
experimental results for a range of active agent-pathogen systems including hexanal and
Aspergillus niger (Gardini et al. 1997), trans-2-hexenal and Aspergillus flavus (Gardini et
al. 2001), and thymol and Bacillus cereus, Candida lusitaniae, Streptococcus thermophilus
and Pseudomonas spp. (Del Nobile et al. 2008).
The model predictions provide insights to the key factors governing accumulation of
hexanal in the package. The sorption isotherm and volatile compound permeability were
shown to have great influence throughout the course of the release profile. Hexanal uptake
by tomatoes influenced the overall hexanal accumulation only during the unsteady-state
release period (the first few days of storage). The rate of hexanal uptake by tomatoes
became negligibly small after the MIC level was attained due to its exponential
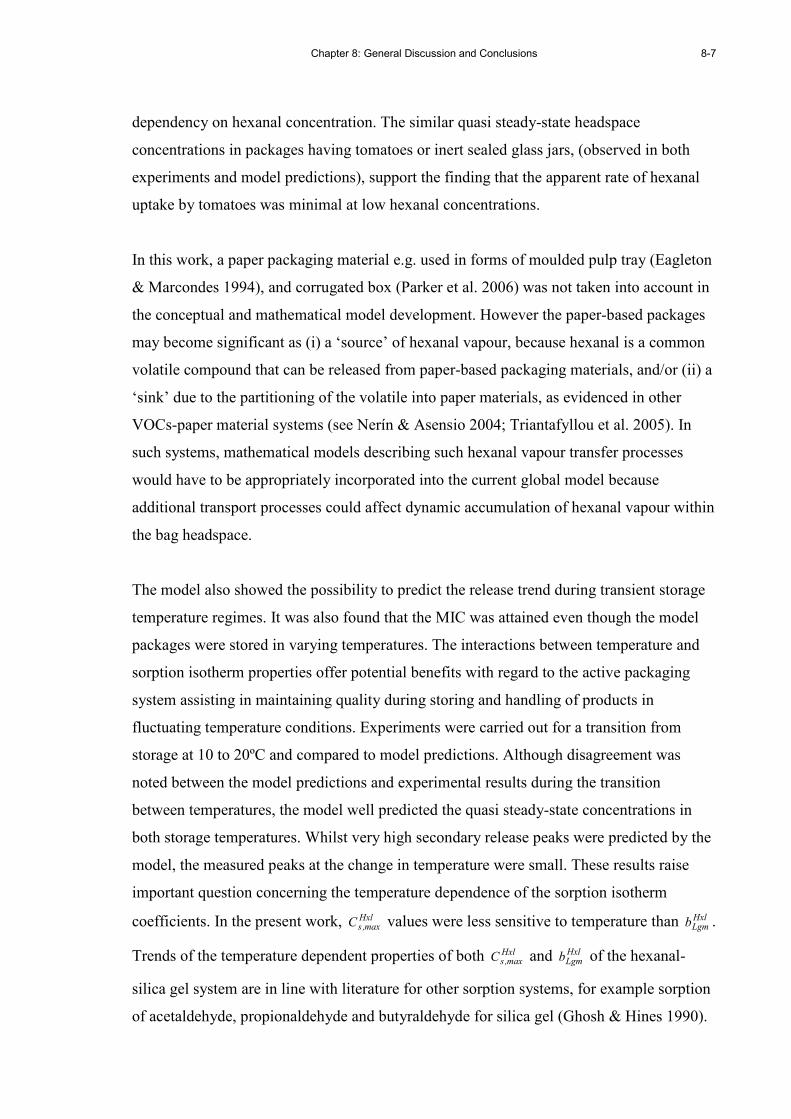
Chapter 8: General Discussion and Conclusions
8-7
dependency on hexanal concentration. The similar quasi steady-state headspace
concentrations in packages having tomatoes or inert sealed glass jars, (observed in both
experiments and model predictions), support the finding that the apparent rate of hexanal
uptake by tomatoes was minimal at low hexanal concentrations.
In this work, a paper packaging material e.g. used in forms of moulded pulp tray (Eagleton
& Marcondes 1994), and corrugated box (Parker et al. 2006) was not taken into account in
the conceptual and mathematical model development. However the paper-based packages
may become significant as (i) a ‘source’ of hexanal vapour, because hexanal is a common
volatile compound that can be released from paper-based packaging materials, and/or (ii) a
‘sink’ due to the partitioning of the volatile into paper materials, as evidenced in other
VOCs-paper material systems (see Nerín & Asensio 2004; Triantafyllou et al. 2005). In
such systems, mathematical models describing such hexanal vapour transfer processes
would have to be appropriately incorporated into the current global model because
additional transport processes could affect dynamic accumulation of hexanal vapour within
the bag headspace.
The model also showed the possibility to predict the release trend during transient storage
temperature regimes. It was also found that the MIC was attained even though the model
packages were stored in varying temperatures. The interactions between temperature and
sorption isotherm properties offer potential benefits with regard to the active packaging
system assisting in maintaining quality during storing and handling of products in
fluctuating temperature conditions. Experiments were carried out for a transition from
storage at 10 to 20ºC and compared to model predictions. Although disagreement was
noted between the model predictions and experimental results during the transition
between temperatures, the model well predicted the quasi steady-state concentrations in
both storage temperatures. Whilst very high secondary release peaks were predicted by the
model, the measured peaks at the change in temperature were small. These results raise
important question concerning the temperature dependence of the sorption isotherm
coefficients. In the present work, Hxlmax,sC values were less sensitive to temperature than Hxl
Lgmb .
Trends of the temperature dependent properties of both Hxlmax,sC and Hxl
Lgmb of the hexanal-
silica gel system are in line with literature for other sorption systems, for example sorption
of acetaldehyde, propionaldehyde and butyraldehyde for silica gel (Ghosh & Hines 1990).
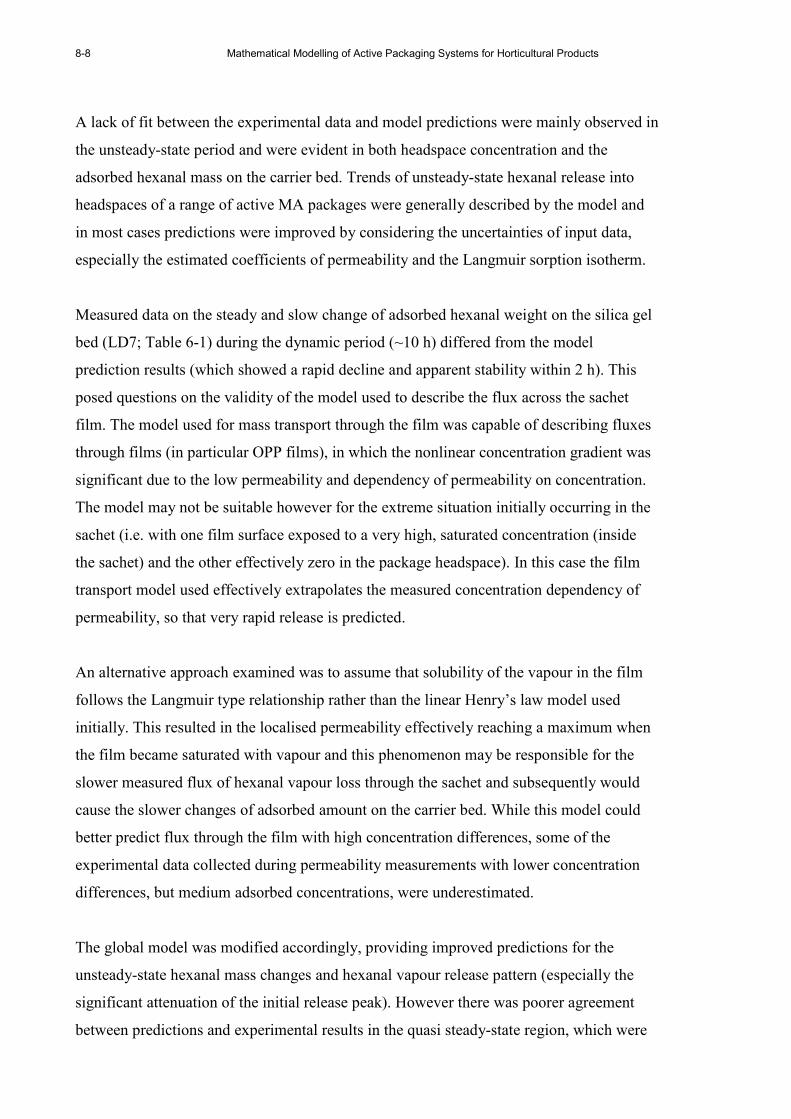
8-8 Mathematical Modelling of Active Packaging Systems for Horticultural Products
A lack of fit between the experimental data and model predictions were mainly observed in
the unsteady-state period and were evident in both headspace concentration and the
adsorbed hexanal mass on the carrier bed. Trends of unsteady-state hexanal release into
headspaces of a range of active MA packages were generally described by the model and
in most cases predictions were improved by considering the uncertainties of input data,
especially the estimated coefficients of permeability and the Langmuir sorption isotherm.
Measured data on the steady and slow change of adsorbed hexanal weight on the silica gel
bed (LD7; Table 6-1) during the dynamic period (~10 h) differed from the model
prediction results (which showed a rapid decline and apparent stability within 2 h). This
posed questions on the validity of the model used to describe the flux across the sachet
film. The model used for mass transport through the film was capable of describing fluxes
through films (in particular OPP films), in which the nonlinear concentration gradient was
significant due to the low permeability and dependency of permeability on concentration.
The model may not be suitable however for the extreme situation initially occurring in the
sachet (i.e. with one film surface exposed to a very high, saturated concentration (inside
the sachet) and the other effectively zero in the package headspace). In this case the film
transport model used effectively extrapolates the measured concentration dependency of
permeability, so that very rapid release is predicted.
An alternative approach examined was to assume that solubility of the vapour in the film
follows the Langmuir type relationship rather than the linear Henry’s law model used
initially. This resulted in the localised permeability effectively reaching a maximum when
the film became saturated with vapour and this phenomenon may be responsible for the
slower measured flux of hexanal vapour loss through the sachet and subsequently would
cause the slower changes of adsorbed amount on the carrier bed. While this model could
better predict flux through the film with high concentration differences, some of the
experimental data collected during permeability measurements with lower concentration
differences, but medium adsorbed concentrations, were underestimated.
The global model was modified accordingly, providing improved predictions for the
unsteady-state hexanal mass changes and hexanal vapour release pattern (especially the
significant attenuation of the initial release peak). However there was poorer agreement
between predictions and experimental results in the quasi steady-state region, which were

Chapter 8: General Discussion and Conclusions
8-9
better predicted by the original model. Clearly a more thorough investigation into volatile
mass transfer rates through packaging films is required to enable fitting of a transport
model appropriate for all conditions.
Although the modified global model provides insights to the changes occurring during the
unsteady-state period, the overall utility of the original model to predict vapour release
trends and (particularly) the quasi steady-state headspace concentration are reasonable and
valid. The original model was therefore used for exploring the outcomes of ‘what-if’
scenarios for a range of active packaging systems (such as changing sorption isotherm
forms). The simulation results suggest the importance of appropriated selections of outer
bag film permeability, in addition to the sorption isotherm form, for achieving the required
release patterns. With an appropriately selected outer film permeability, VOC release with
either a short and long term sustained period prior to decreasing to or near zero
concentration could be achieved by the linear and exponential isotherms, respectively.
These patterns could be useful to achieve a required concentration after initial release (i.e.
minimal or without fumigation) and to later ‘evacuate’ the active agents at or near the
opening or expiry date. Thus, with appropriate data selection, the model can be used to
design active packaging system to meet a range of product and/or market needs.
8.2 Conclusions
Hexanal vapour is a potential volatile active agent that can control key postharvest
pathogens without causing significant detrimental effects on other postharvest qualities.
Because of its degree of volatility and physical adsorption on silica gel adsorbents,
incorporation of hexanal to silica gel can be used to achieve slow release of the vapour into
the package headspace. This system was used as a practical example to maintain tomato
quality from which it was possible to demonstrate a model for active MA packaging
systems.
The generalised modelling methodology and the mathematical model developed is a
promising mechanistic tool with the advantage of reasonable simplicity and practical
accuracy for active packaging design. Because of the generality and confidence in model
performance demonstrated through validation trials of the hexanal/silica gel/tomato active
MA packages, the global mathematical model can potentially be applied for other active
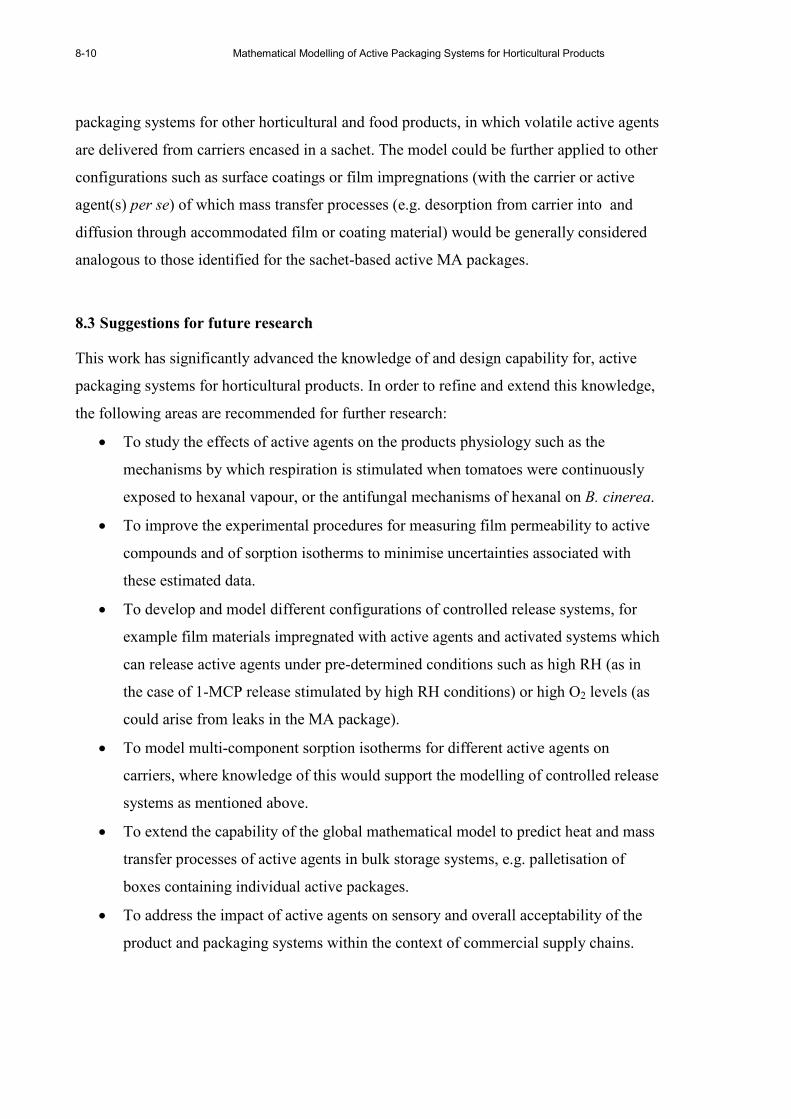
8-10 Mathematical Modelling of Active Packaging Systems for Horticultural Products
packaging systems for other horticultural and food products, in which volatile active agents
are delivered from carriers encased in a sachet. The model could be further applied to other
configurations such as surface coatings or film impregnations (with the carrier or active
agent(s) per se) of which mass transfer processes (e.g. desorption from carrier into and
diffusion through accommodated film or coating material) would be generally considered
analogous to those identified for the sachet-based active MA packages.
8.3 Suggestions for future research
This work has significantly advanced the knowledge of and design capability for, active
packaging systems for horticultural products. In order to refine and extend this knowledge,
the following areas are recommended for further research:
• To study the effects of active agents on the products physiology such as the
mechanisms by which respiration is stimulated when tomatoes were continuously
exposed to hexanal vapour, or the antifungal mechanisms of hexanal on B. cinerea.
• To improve the experimental procedures for measuring film permeability to active
compounds and of sorption isotherms to minimise uncertainties associated with
these estimated data.
• To develop and model different configurations of controlled release systems, for
example film materials impregnated with active agents and activated systems which
can release active agents under pre-determined conditions such as high RH (as in
the case of 1-MCP release stimulated by high RH conditions) or high O2 levels (as
could arise from leaks in the MA package).
• To model multi-component sorption isotherms for different active agents on
carriers, where knowledge of this would support the modelling of controlled release
systems as mentioned above.
• To extend the capability of the global mathematical model to predict heat and mass
transfer processes of active agents in bulk storage systems, e.g. palletisation of
boxes containing individual active packages.
• To address the impact of active agents on sensory and overall acceptability of the
product and packaging systems within the context of commercial supply chains.
References
9-1
REFERENCES
Abe K, & Watada A E (1991). Ethylene absorbent to maintain quality of lightly processed
fruits and vegetables. Journal of Food Science 56 1589-1592.
Adamson A W (1990). Adsorption of gases and vapors on solids. In Physical Chemistry of
Surfaces, pp. 591-681. New York: Wiley.
Adaskaveg J E, Förster H, & Sommer N F (2002). Principles of postharvest pathology and
management of decays of edible horticultural crops. In Postharvest Technology of
Horticultural Crops, 3rd, A A Kader (Ed.), pp. 163-195. Oakland: University of
California Agriculture and Natural Resources.
Adedeji O, Taiwo K A, Akanbi C T, & Ajani R (2006). Physicochemical properties of four
tomato cultivars grown in Nigeria. Journal of Food Processing and Preservation 30 79-
86.
Aguayo E, Allende A, & Artes F (2003). Keeping quality and safety of minimally fresh
processed melon. European Food Research and Technology 216 494-499.
Aguayo E, Jansasithorn R, & Kader A A (2006). Combined effects of 1-
methylcyclopropene, calcium chloride dip, and/or atmospheric modification on quality
changes in fresh-cut strawberries. Postharvest Biology and Technology 40 269-278.
Ahvenainen R (2003). Active and intelligent packaging: an introduction. In Novel Food
Packaging Techniques, R Ahvenainen (Ed.), pp. 5-21. Cambridge: Woodhead
Publishing Limited.
Almenar E, Auras R, Rubino M, & Harte B R (2006). Design of biodegradable
antimicrobial packaging film for prevention of postharvest fungal diseases. In
Proceedings of 15th IAPRI World Conference on Packaging. Conference Proceedings.
pp. 159-163. Tokyo, Japan.
Anonymous. (2004. July 2007). DuPontTM, Tyvek ® Users Manual Retrieved 14
November, 2007, from
http://www.graphics.dupont.com/en/productServices/HANDBOOK.pdf
Ansón A, Callejas M A, Benito A M, Maser W K, Izquierdo M T, Rubio B, Jagiello J,
Thommes M, Parra J B, & Martínez M T (2004). Hydrogen adsorption studies on single
wall carbon nanotubes. Carbon 42 1243-1248.
Apostolopoulos D, & Gilbert S G (1983). Water sorption of coffee solubles by inverse gas
chromatography. In The 3rd International Flavor Conference. Conference Proceedings.
G Charalambous & G Inglett (Eds.) pp. 51-92. Corfu, Greece.
9-2 Mathematical Modelling of Active Packaging Systems for Horticultural Products
Apostolopoulos D V (1985). Inverse Gas Chromatography as Used in Studying Water
Sorption of Coffee Solubles. The State University of New Jersey, New Brunswick
Rutgers, US.
Archbold D D, Hamilton-Kemp T R, Barth M M, & Langlois B E (1997). Identifying
natural volatile compounds that control gray mold (Botrytis cinerea) during postharvest
storage of strawberry, blackberry, and grape. Journal of Agricultural and Food
Chemistry 45 4032-4037.
Archbold D D, Hamilton-Kemp T R, Clements A M, & Collins R W (1999). Fumigating
'Crimson Seedless' table grapes with (E)-2-hexenal reduces mold during long-term
postharvest storage. HortScience 34 705-707.
Artés-Hernández F, Tomás-Barberán F A, & Artés F (2006). Modified atmosphere
packaging preserves quality of SO2-free 'Superior seedless' table grapes. Postharvest
Biology and Technology 39 146-154.
Artés F, Conesa M A, Hernández S, & Gil M I (1999). Keeping quality of fresh-cut
tomato. Postharvest Biology and Technology 17 153-162.
Artes F, Garcia F, Marquina J, Cano A, & Fernandez-Trujillo J P (1998). Physiological
responses of tomato fruit to cyclic intermittent temperature regimes. Postharvest
Biology and Technology 14 283-296.
Ayala-Zavala J F, del-Toro-Sanchez L, Alvarez-Parrilla E, & Gonzalez-Aguilar G A
(2008). High relative humidity in-package of fresh-cut fruits and vegetables: advantage
or disadvantage considering microbiological problems and antimicrobial delivering
systems? Journal of Food Science 73 R41-R47.
Bai J H, Baldwin E A, Fortuny R C S, Mattheis J P, Stanley R, Perera C, & Brecht J K
(2004). Effect of pretreatment of intact 'Gala' apple with ethanol vapor, heat, or 1-
methylcyclopropene on quality and shelf life of fresh-cut slices. Journal of the
American Society for Horticultural Science 129 583-593.
Bailén G, Guillén F, Castillo S, Serrano M, Valero D, & Martínez-Romero D (2006). Use
of activated carbon inside modified atmosphere packages to maintain tomato fruit
quality during cold storage. Journal of Agricultural and Food Chemistry 54 2229-2235.
Banerjee T l, Singh M K, Sahoo R K, & Khanna A (2005). Volume, surface and
UNIQUAC interaction parameters for imidazolium based ionic liquids via Polarizable
Continuum Model. Fluid Phase Equilibria 234 64-76.
References
9-3
Banks N H, Cleland D J, Cameron A C, Beaudry R M, & Kader A A (1995). Proposal for a
rationalized system of units for postharvest research in gas-exchange. HortScience 30
1129-1131.
Barbara L L, Henryk D, & G. S G (1991). Water sorption of gliadin. Journal of Food
Science 56 510-512.
Beaulieu J C, & Saltveit M E (1997). Inhibition or promotion of tomato fruit ripening by
acetaldehyde and ethanol is concentration dependent and varies with initial fruit
maturity. Journal of the American Society for Horticultural Science 122 392-398.
Begley T H, Biles J E, Cunningham C, & Piringer O (2004). Migration of a UV stabilizer
from polyethylene terephthalate (PET) into food simulants. Food Additives and
Contaminants 21 1007-1014.
Belmabkhout Y, Frere M, & De Weireld G (2004). High-pressure adsorption
measurements. A comparative study of the volumetric and gravimetric methods.
Measurement Science & Technology 15 848-858.
Ben-Yehoshua S, & Cameron A C (1989). Exchange determination of water vapour,
carbon dioxide, oxygen, ethylene and other gases of fruits and vegetables. In Modern
Methods of Plant Analysis: Volume 9-Gases in Plant and Microbial Cells, H F
Linskens & J F Jackson (Eds.), pp. 177-193. Berlin: Spinger-Verlag.
Beu T A (2000). Numerical solutions of the diffusion equation. In Plastic Packaging
Materials for Food : Barrier Function, Mass Transport, Quality Assurance and
Legislation, O-G Piringer & A L Baner (Eds.), pp. 221-238. Weinheim ; Cambridge:
Wiley-VCH.
Blahovec J (2004). Sorption isotherms in materials of biological origin mathematical and
physical approach. Journal of Food Engineering 65 489-495.
Blankenship S M, & Dole J M (2003). 1-Methylcyclopropene: a review. Postharvest
Biology and Technology 28 1-25.
Bodenhofer K, Hierlemann A, Schlunk R, & Gopel W (1997). New method of vaporising
volatile organics for gas tests. Sensors and Actuators B: Chemical 45 259-264.
Boukobza F, & Taylor A J (2002). Effect of postharvest treatment on flavour volatiles of
tomatoes. Postharvest Biology and Technology 25 321-331.
Brandsch J, & Piringer O-G (2000). Characteristics of plastic materials. In Plastic
Packaging Materials for Food : Barrier Function, Mass Transport, Quality Assurance
and Legislation, O-G Piringer & A L Baner (Eds.), pp. 9-45. Weinheim ; Cambridge:
Wiley-VCH.

9-4 Mathematical Modelling of Active Packaging Systems for Horticultural Products
Brecht J K (2003). Harvesting and handling techniques. In Postharvest Physiology and
Pathology of Vegetables, 2nd, J A Bartz & J K Brecht (Eds.), pp. 383-412. New York:
Marcel Dekker.
Brody A L (2002). Active and intelligent packaging: the saga continues. Food Technology
56 65-66.
Brody A L, Strupinsky E R, & Kline L R (2001a). Ethylene control. In Active Packaging
for Food Applications, pp. 99-106. Lancaster: Technomic Publishing.
Brody A L, Strupinsky E R, & Kline L R (2001b). Moisture control. In Active Packaging
for Food Applications, pp. 87-94. Lancaster: Technomic Publishing.
Bronlund J E (1997). The Modelling of Caking in Bulk Lactose. Massey University,
Palmerston North, New Zealand.
Buonocore G G, Sinigaglia M, Corbo M R, Bevilacqua A, La Notte E, & Del Nobile M A
(2004). Controlled release of antimicrobial compounds from highly swellable polymers.
Journal of Food Protection 67 1190-1194.
Burt S (2004). Essential oils: their antibacterial properties and potential applications in
foods-a review. International Journal of Food Microbiology 94 223-253.
Buttery R G, Teranishi R, & Ling L C (1987). Fresh tomato aroma volatiles: a quantitative
study. Journal of Agricultural & Food Chemistry 35 540-544.
Cameron A C, Boylanpett W, & Lee J (1989). Design of modified atmosphere packaging
systems - modeling oxygen concentrations within sealed packages of tomato fruits.
Journal of Food Science 54 1413-1416.
Cameron A C, Talasila P C, & Joles D W (1995). Predicting film permeability needs for
modified atmosphere packaging of lightly processed fruits and vegetables. HortScience
30 25-34.
Carslaw H S, & Jaeger J C (1959). Linear flow of heat in the solid bounded by two parallel
planes. In Conduction of Heat in Solids, 2nd, pp. 92-132. Oxford: Oxford University
Press.
Charara Z N, Williams J W, Schmidt R H, & Marshall M R (1992). Orange flavor
absorption into various polymeric packaging materials. Journal of Food Science 57 963-
966 & 972.
Charles F, Guillaume C, & Gontard N (2008). Effect of passive and active modified
atmosphere packaging on quality changes of fresh endives. Postharvest Biology and
Technology 48 22-29.
References
9-5
Charles F, Sanchez J, & Gontard N (2003). Active modified atmosphere packaging of fresh
fruits and vegetables: modeling with tomatoes and oxygen absorber. Journal of Food
Science 68 1736-1742.
Charles F, Sanchez J, & Gontard N (2005). Modeling of active modified atmosphere
packaging of endives exposed to several postharvest temperatures. Journal of Food
Science 70 E443-E449.
Chen X Y, Hertog M L A T M, & Banks N H (2000). The effect of temperature on gas
relations in MA packages for capsicums (Capsicum annuum L., cv. Tasty): an
integrated approach. Postharvest Biology and Technology 20 71-80.
Chen Y, Liu S, & Wang G (2007). A kinetic investigation of cationic starch adsorption and
flocculation in kaolin suspension. Chemical Engineering Journal 133 325-333.
Chervin C, Westercamp P, & Monteils G (2005). Ethanol vapours limit Botrytis
development over the postharvest life of table grapes. Postharvest Biology and
Technology 36 319-322.
Choehom R, Ketsa S, & van Doorn W G (2004). Senescent spotting of banana peel is
inhibited by modified atmosphere packaging. Postharvest Biology and Technology 31
167-175.
Chu K H, & Hashim M A (2002). Adsorption and desorption characteristics of zinc on ash
particles derived from oil palm waste. Journal of Chemical Technology and
Biotechnology 77 685-693.
Clarke R (2001). Temperature switchable membranes for creating and maintaining
beneficial package atmospheres for fresh produce. Journal of Plastic Film and Sheeting
17 22-34.
Cleland D J, Cleland A C, & Jones R S (1994). Collection of accurate experimental data
for testing the performance of simple methods for food freezing time prediction.
Journal of Food Process Engineering 17 93-117.
Conway W S, Janisiewicz W J, Klein J D, & Sams C E (1999). Strategy for combining
heat treatment, calcium infiltration, and biological control to reduce postharvest decay
of 'Gala' apples. HortScience 34 700-704.
Conway W S, Leverentz B, Janisiewicz W J, Saftner R A, & Camp M J (2005). Improving
biocontrol using antagonist mixtures with heat and/or sodium bicarbonate to control
postharvest decay of apple fruit. Postharvest Biology and Technology 36 235-244.
Conway W S, & Sams C E (1983). Calcium infiltration of Golden Delicious apples and its
effect on decay. Phytopathology 73 1068-1071.

9-6 Mathematical Modelling of Active Packaging Systems for Horticultural Products
Corbo M R, Lanciotti R, Gardini F, Sinigaglia M, & Guerzoni M E (2000). Effects of
hexanal, trans-2-hexenal, and storage temperature on shelf life of fresh sliced apples.
Journal of Agricultural and Food Chemistry 48 2401-2408.
Crank J (1975). The Mathematics of Diffusion. London: Oxford University Press.
Crisosto C H, Garner D, & Crisosto G (2002). Carbon dioxide-enriched atmospheres
during cold storage limit losses from Botrytis but accelerate rachis browning of
'Redglobe' table grapes. Postharvest Biology and Technology 26 181-189.
D'Aniello C, Guadagno L, Gorrasi G, & Vittoria V (2000). Influence of the crystallinity on
the transport properties of isotactic polypropylene. Polymer 41 2515-2519.
Daifas D P, Smith J P, Blanchfield B, Cadieux B, Sanders G, & Austin J W (2003).
Challenge studies with proteolytic Clostridium Botulinum in yeast and chemically
leavened crumpets packaged under modified atmospheres. Journal of Food Safety 23
107-125.
Daifas D P, Smith J P, Tarte I, Blanchfield B, & Austin J W (2000). Effect of ethanol
vapor on growth and toxin production by Clostridium botulinum in a high moisture
bakery product. Journal of Food Safety 20 111-125.
Daly J, & Kourelis B (2001). Synthesis methods, complexes and delivery methods for the
safe and convenient storage, transport and application of compounds for inhibiting the
ethylene response in plants. US Patent 6,313,068.
Davidson P M (2001). Chemical preservatives and natural antimicrobial compounds. In
Food Microbiology: Fundamentals and Frontiers, 2nd, M P Doyle, L R Beuchat & T J
Montville (Eds.), pp. 593-627. Washington, D.C.: ASM Press.
Day B P F (1989). Extension of shelf-life of chilled foods. European Food and Drink
Review 4 47-56.
Day B P F (2003). Active packaging. In Food Packaging Technology, R Coles, D
McDowell & M J Kirwan (Eds.), pp. 282-302. Boca Raton: CRC Press.
De Jong A R, Boumans H, Slaghek T, Van Veen J, Rijk R, & Van Zandvoort M (2005).
Active and intelligent packaging for food: Is it the future? Food Additives and
Contaminants 22 975-979.
De Pooter H L, Montens J P, Willaert G A, Dirinck P J, & Schamp N M (1983). Treatment
of Golden Delicious apples with aldehydes and carboxylic acids: effect on the
headspace composition. Journal of Agricultural and Food Chemistry 31 813-818.
References
9-7
de Wild H P J, Balk P A, Fernandes E C A, & Peppelenbos H W (2005). The action site of
carbon dioxide in relation to inhibition of ethylene production in tomato fruit.
Postharvest Biology and Technology 36 273-280.
Del-Valle V, Almenar E, Hernandez-Munoz P, Lagaron J M, Catala R, & Gavara R
(2004). Volatile organic compound permeation through porous polymeric films for
modified atmosphere packaging of foods. Journal of the Science of Food and
Agriculture 84 937-942.
Del-Valle V, Almenar E, Lagaron J M, Catala R, & Gavara R (2003). Modelling
permeation through porous polymeric films for modified atmosphere packaging. Food
Additives and Contaminants 20 170-179.
Del Nobile M A, Buonocore G G, Fava P, & Piergiovanni L (2002). Modeling of hexanal
sorption kinetic in an aldehydes scavenger film intended for food packaging. Journal of
Food Science 67 2687-2691.
Del Nobile M A, Conte A, Incoronato A L, & Panza O (2008). Antimicrobial efficacy and
release kinetics of thymol from zein films. Journal of Food Engineering 89 57-63.
DeLassus P T (1997). Barrier polymers. In The Wiley Encyclopaedia of Packaging
Technology, 2nd, A L Brody & K S Marsh (Eds.), pp. 71-77. New York: Wiley.
DeLassus P T, & Jenkins S R (1986). Advances in flavour and aroma testing in relation to
polymer barrier performance. In The Fifth International Seminar on Packaging.
Conference Proceedings. pp. 116-130. University of Auckland, New Zealand.
DeLassus P T, Tou J C, Babinec M A, Rulf D C, Karp B K, & Howell B A (1988).
Transport of apple aroma in polymer films. In Food and Packaging Interactions, ACS
Symposium Series 365, J H Hotchkiss (Ed.), pp. 11-27. Washington D.C.: American
Chemical Society.
Do D D (1998a). Fundamentals of diffusion and adsorption in porous media. In Adsorption
Analysis: Equilibria and Kinetics, pp. 337-414. London: Imperial College Press.
Do D D (1998b). Fundamentals of pure component adsorption equilibria. In Adsorption
Analysis: Equilibria and Kinetics, pp. 2-48. London: Imperial College Press.
Dury-Brun C, Chalier P, Desobry S, & Voilley A (2007). Multiple mass transfers of small
volatile molecules through flexible food packaging. Food Reviews International 23 199-
255.
Eagleton D G, & Marcondes J A (1994). Moisture-sorption isotherms for paper-based
components of transport packaging for fresh produce. Tappi Journal 77 75-81.
9-8 Mathematical Modelling of Active Packaging Systems for Horticultural Products
Earle M D, & Earle R L (2003). Product changes during processing. In Fundamentals of
Food Reaction Technology, pp. 32-72. Leatherhead: Leatherhead Food International.
Emond J P, Castaigne F, Toupin C J, & Desilets D (1991). Mathematical-modeling of gas-
exchange in modified atmosphere packaging. Transactions of the ASAE 34 239-245.
Fan L H, Song J, Beaudry R M, & Hildebrand P D (2006). Effect of hexanal vapor on
spore viability of Penicillium expansum, lesion development on whole apples and fruit
volatile biosynthesis. Journal of Food Science 71 M105-M109.
Felder R M, & Huvard G S (1980). Permeation, diffusion, and sorption of gases and
vapours. In Methods of Experimental Physics, R A Fava (Ed.), pp. 315-377. New
York: Academic Press.
Feldman D, Shapiro M M, & Banu D (1986). Organic phase change materials for thermal
energy storage. Solar Energy Materials 13 1-10.
Fishman S, Rodov V, & S B Y (1996). Mathematical model for perforation effect on
oxygen and water vapor dynamics in modified-atmosphere packages. Journal of Food
Science 61 956-961.
Fonseca S C, Oliveira F A R, & Brecht J K (2002a). Modelling respiration rate of fresh
fruits and vegetables for modified atmosphere packages: a review. Journal of Food
Engineering 52 99-119.
Fonseca S C, Oliveira F A R, Frias J M, Brecht J K, & Chau K V (2002b). Modelling
respiration rate of shredded Galega kale for development of modified atmosphere
packaging. Journal of Food Engineering 54 299-307.
Forney C F, & Brandl D G (1992). Control of humidity in small controlled-environment
chambers using glycerol-water solutions. HortTechnology 2 52-54.
Franke I, Wijma E, & Bouma K (2002). Shelf life extension of pre-baked buns by an active
packaging ethanol emitter. Food Additives and Contaminants 19 314-322.
Friedman M, Henika P R, Levin C E, & Mandrell R E (2004). Antibacterial activities of
plant essential oils and their components against Escherichia coli O157:H7 and
Salmonella enterica in apple juice. Journal of Agricultural and Food Chemistry 52
6042-6048.
Friess K, Sipek M, Hynek V, Sysel P, Bohata K, & Izak P (2004). Comparison of
permeability coefficients of organic vapors through non-porous polymer membranes by
two different experimental techniques. Journal of Membrane Science 240 179-185.
References
9-9
Gardini F, Lanciotti R, Caccioni D R L, & Guerzoni M E (1997). Antifungal activity of
hexanal as dependent on its vapor pressure. Journal of Agricultural and Food Chemistry
45 4297-4302.
Gardini F, Lanciotti R, & Guerzoni M E (2001). Effect of trans-2-hexenal on the growth of
Aspergillus flavus in relation to its concentration, temperature and water activity. Letters
in Applied Microbiology 33 50-55.
Gardner H W, Dornbos D L, & Desjardins A E (1990). Hexanal, trans-2-hexenal, and
trans-2-nonenal inhibit soybean, glycine-max, seed-germination. Journal of Agricultural
and Food Chemistry 38 1316-1320.
Gaysinsky S, Taylor T M, Davidson P M, Bruce B D, & Weiss J (2007). Antimicrobial
efficacy of eugenol microemulsions in milk against Listeria monocytogenes and
Escherichia coli O157 : H7. Journal of Food Protection 70 2631-2637.
Geankoplis C J (1993a). Liquid-liquid and fluid-solid separation processes. In Transport
Processes and Unit Operations, pp. 697-753. New Jersey: Prentice Hall.
Geankoplis C J (1993b). Principles of unsteady-state and convection mass transfer. In
Transport Processes and Unit Operations, pp. 426-487. New Jersey: Prentice Hall.
Geankoplis C J (1993c). Principles of unsteady-state heat transfer. In Transport Processes
and Unit Operations, pp. 330-380. New Jersey: Prentice Hall.
Ghosh T K, & Hines A L (1990). Adsorption of acetaldehyde, propionaldehyde, and
butyraldehyde on silica gel. Separation Science and Technology 25 1101-1115.
Giacin J R (1987). Chemical structure and properties of polymers. In Principles of Aseptic
Processing and Packaging, P E Nelson, J V Chambers & J H Rodriguez (Eds.), pp. 81-
96. Washington, D.C.: Food Processors Institute.
Gil M I, Conesa M A, & Artes F (2001). Modified atmosphere packaging of fresh-cut
tomato. Acta Horticulturae 2 703-704.
Gil M I, Conesa M A, & Artes F (2002). Quality changes in fresh cut tomato as affected by
modified atmosphere packaging. Postharvest Biology and Technology 25 199-207.
Gilbert S G (1993). Applications of IGC for research in kinetic thermodynamic problems
in food science. In Shelf Life Studies of Foods and Beverages : Chemical, Biological,
Physical, and Nutritional Aspects, G Charalambous (Ed.), pp. 1071-1079. Amsterdam
; New York: Elsevier.
Gorna-Binkul A, Kaczmarski K, & Buszewski B (2001). Modeling of the sorption and
diffusion processes of volatile organic air pollutants in grape fruits. Journal of
Agricultural & Food Chemistry 49 2889-2893.

9-10 Mathematical Modelling of Active Packaging Systems for Horticultural Products
Gouble B, Fath D, & Soudain P (1995). Nitrous oxide inhibition of ethylene production in
ripening and senescing climacteric fruits. Postharvest Biology and Technology 5 311-
321.
Gregg S J, & Sing K S W (1982). The physical adsorption of gases by microporous solids:
the Type-I isotherm. In Adsorption, Surface Area and Porosity, 2nd, pp. 195-247.
London: Academic Press.
Grierson D, & Kader A A (1986). Fruit ripening and quality. In The Tomato Crop: A
Scientific Basis for Improvement, J G Atherton & J Rudich (Eds.), pp. 241-280.
London, New York: Chapman and Hall.
Groen J C, Perez-Ramirez J, & Zhu W (2002). Adsorption of nitrous oxide on silicalite-1.
Journal of Chemical and Engineering Data 47 587-589.
Hamilton-Kemp T R, Archbold D D, Loughrin J H, Collins R W, & Byers M E (1996).
Metabolism of natural volatile compounds by strawberry fruit. Journal of Agricultural
and Food Chemistry 44 2802-2805.
Hamilton-Kemp T R, McCracken C T, Loughrin J H, Andersen R A, & Hildebrand D F
(1992). Effects of some natural volatile compounds on the pathogenic fungi Alternaria
alternata and Botrytis cinerea. Journal of Chemical Ecology 18 1083-1091.
Han J H (2000). Antimicrobial food packaging. Food Technology 54 56-65.
Han J H (2003). Antimicrobial food packaging. In Novel Food Packaging Techniques, R
Ahvenainen (Ed.), pp. 50-70. Cambridge: Woodhead Publishing Limited.
Han J H, & Floros J D (1998). Simulating diffusion model and determining diffusivity of
potassium sorbate through plastics to develop antimicrobial packaging films. Journal of
Food Processing and Preservation 22 107-122.
Han J H, Ho C H L, & Rodrigues E T (2005). Intelligent packaging. In Innovations in
Food Packaging, J H Han (Ed.), pp. 138-156. San Diego, Calif.: Elsevier Academic.
Hardenburg R E, Watada A E, & Wang C Y (1986). Summary of respiration and ethylene
production rates. In The Commercial Storage of Fruits, Vegetables, and Florist and
Nursery Stocks Agriculture Handbook, no. 66. Washington, D.C.: U.S. Dept. of
Agriculture, Agricultural Research Service.
Harima Y (1990). Free oxygen scavenging packaging. In Food Packaging, T Kadoya
(Ed.), pp. 229-252. San Diego: Academic Press.
Haros C M, Aguerre R J, & Suarez C (2005). Modeling sulfur dioxide uptake in dent corn
during steeping. Lebensmittel-Wissenschaft und-Technologie 38 393-398.
References
9-11
Heirlings L, Siró I, Devlieghere F, Van Bavel E, Cool P, De Meulenaer B, Vansant E F, &
Debevere J (2004). Influence of polymer matrix and adsorption onto silica materials on
the migration of α-tocopherol into 95% ethanol from active packaging. Food Additives
and Contaminants 21 1125-1136.
Hernandez-Munoz P, Catala R, & Gavara R (1999). Effect of sorbed oil on food aroma
loss through packaging materials. Journal of Agricultural & Food Chemistry 47 4370-
4374.
Hernandez-Munoz P, Catala R, Hernandez R J, & Gavara R (1998). Food aroma mass
transport in metallocene ethylene-based copolymers for packaging applications. Journal
of Agricultural and Food Chemistry 46 5238-5243.
Hernandez R J (1997). Food packaging materials, barrier properties, and selection. In
Handbook of Food Engineering Practice, K J Valentas, E Rotstein & R P Sing (Eds.),
pp. 291-360. Boca Raton: CRC Press.
Hertog M L A T, Peppelenbos H W, Evelo R G, & Tijskens L M M (1998). A dynamic
and generic model of gas exchange of respiring produce: the effects of oxygen, carbon
dioxide and temperature. Postharvest Biology and Technology 14 335-349.
Hertog M L A T M, Ben-Arie R, Roth E, & Nicolai B M (2004a). Humidity and
temperature effects on invasive and non-invasive firmness measures. Postharvest
Biology and Technology 33 79-91.
Hertog M L A T M, Lammertyn J, Desmet M, Scheerlinck N, & Nicolai B M (2004b). The
impact of biological variation on postharvest behaviour of tomato fruit. Postharvest
Biology and Technology 34 271-284.
Hotchkiss J H, Watkins C B, & Sanchez D G (2007). Release of 1-methylcyclopropene
from heat-pressed polymer films. Journal of Food Science 72 E330-E334.
Huang S J, & Giacin J R (1998). Evaluating the effect of temperature and vapor
concentration on the organic vapor barrier properties of polymer membranes by an
isostatic procedure. Journal of Plastic Film & Sheeting 14 308-333.
Hurme E, Sipilainen-Malm T, Ahvenainen R, & Nielsen T (2002). Active and intelligent
packaging. In Minimal Processing Technologies in the Food Industry, T Ohlsson & N
Bengtsson (Eds.), pp. 87-123. Cambridge: Woodhead Publishing Limited.
Illeperuma C K, & Jayasuriya P (2002). Prolonged storage of 'Karuthacolomban' mango by
modified atmosphere packaging at low temperature. Journal of Horticultural Science
and Biotechnology 77 153-157.
9-12 Mathematical Modelling of Active Packaging Systems for Horticultural Products
Järvi-Kääriäinen T (2003). Integrating intelligent packaging, storage and distribution. In
Novel Food Packaging Techniques, R Ahvenainen (Ed.), pp. 535-549. Cambridge:
Woodhead Publishing Limited.
Jayathunge K G L R, & Illeperuma C K (2001). Extension of postharvest life of oyster
mushroom under ambient conditions by modified atmosphere packaging. Tropical
Agricultural Research 13 78-89.
Jeong J, Huber D J, & Sargent S A (2002). Influence of 1-methylcyclopropene (1-MCP) on
ripening and cell-wall matrix polysaccharides of avocado (Persea americana) fruit.
Postharvest Biology and Technology 25 241-256.
Johansson F, & Leufven F (1994). Food packaging polymer films as aroma vapor barriers
at different relative humidities. Journal of Food Science 59 1328-1331.
Johnson A T (1999). Mass transfer. In Biological Process Engineering : An Analogical
Approach to Fluid Flow, Heat Transfer, and Mass Transfer Applied to Biological
Systems, pp. 494-700. New York: Wiley.
Johnston J H, Grindrod J E, Dodds M, & Schimitschek K (2008). Composite nano-
structured calcium silicate phase change materials for thermal buffering in food
packaging. Current Applied Physics 8 508-511.
Johnston J W, Hewett E W, Hertog M, & Harker F R (2002). Temperature and ethylene
affect induction of rapid softening in 'Granny Smith' and 'Pacific RoseTM' apple
cultivars. Postharvest Biology and Technology 25 257-264.
Kader A A (1992). Postharvest biology and technology: an overview. In Postharvest
Technology of Horticultural Crops, 2nd, A A Kader (Ed.), pp. 15-20. Oakland, Calif.:
University of California, Division of Agriculture and Natural Resources.
Kader A A (2002). Postharvest biology and technology: an overview. In Postharvest
Technology of Horticultural Crops, 3rd, A A Kader (Ed.), pp. 39-47. Oakland:
University of California Agriculture and Natural Resources.
Kader A A, & Saltveit M E (2003a). Atmosphere modification. In Postharvest Physiology
and Pathology of Vegetables, 2nd, J A Bartz & J K Brecht (Eds.), pp. 229-246. New
York: Marcel Dekker.
Kader A A, & Saltveit M E (2003b). Respiration and gas exchange. In Postharvest
Physiology and Pathology of Vegetables, 2nd, J A Bartz & J K Brecht (Eds.), pp. 7-29.
New York: Marcel Dekker.
Kader A A, Zagory D, & Kerbel E L (1989). Modified atmosphere packaging of fruits and
vegetables. Critical Reviews in Food Science and Nutrition 28 1-30.

References
9-13
Karel M (1975). Protective packaging of foods. In Principles of Food Science. Part II.
Physical Principles of Food Preservation, O R Fennema (Ed.), pp. 399-465. New
York: Marcel Dekker.
Kays S J (1991). Movement of gases, solvents, and solutes, within harvested products and
their exchange between the product and its external environment. In Postharvest
Physiology of Perishable Plant Products, pp. 409-455. New York: Van Nostrand
Reinhold.
Kim H O, Hewett E W, & Lallu N (2001). Softening and ethylene production of kiwifruit
reduced with 1- Methylcyclopropene. Acta Horticulturae 1 167-170.
Knoche M, Petracek P D, & Bukovac M J (1994). Urea penetration of isolate tomato fruit
cuticles. Journal of the American Society for Horticultural Science 119 761-764.
Kontominas M G, Gavara R, & Giacin J R (1994). The adsorption of hydrocarbons on
Polystyrene by inverse gas chromatography - infinite dilution concentration region.
European Polymer Journal 30 265-269.
Kopac T, & Kocabas S (2002). Adsorption equilibrium and breakthrough analysis for
sulfur dioxide adsorption on silica gel. Chemical Engineering and Processing 41 223-
230.
Kostansek E C (2003). Delivery systems for cyclopropenes. US Patent 6,548,448
Kou L, Luo Y, Wu D, & Liu X (2007). Effects of mild heat treatment on microbial growth
and product quality of packaged fresh-cut table grapes. Journal of Food Science 72
S567-S573.
Krantz W B (2007). Applications in heat transfer. In Scaling Analysis in Modeling
Transport and Reaction Processes: A Systematic Approach to Model Building and the
Art of Approximation, pp. 145-251. Hoboken, New Jersey: Wiley-Interscience.
Krumbein A, Peters P, & Bruckner B (2004). Flavour compounds and a quantitative
descriptive analysis of tomatoes (Lycopersicon Esculentum Mill.) of different cultivars
in short-term storage. Postharvest Biology and Technology 32 15-28.
Labuza T P (1982). Scientific evaluation of shelf-life. In Shelf-Life Dating of Foods, pp.
41-87. Westport, Conn., USA Food & Nutrition Press.
Labuza T P, & Breene W M (1989). Applications of active packaging for improvement of
shelf-life and nutritional quality of fresh and extended shelf-life foods. Journal of Food
Processing and Preservation 13 1-69.
9-14 Mathematical Modelling of Active Packaging Systems for Horticultural Products
Lanciotti R, Corbo M R, Gardini F, Sinigaglia M, & Guerzoni M E (1999). Effect of
hexanal on the shelf life of fresh apple slices. Journal of Agricultural and Food
Chemistry 47 4769-4776.
Lanciotti R, Gianotti A, Patrignani F, Belletti N, Guerzoni M E, & Gardini F (2004). Use
of natural aroma compounds to improve shelf-life and safety of minimally processed
fruits. Trends in Food Science & Technology 15 201-208.
Lee C H, An D S, Lee S C, Park H J, & Lee D S (2004). A coating for use as an
antimicrobial and antioxidative packaging material incorporating nisin and α−
tocopherol. Journal of Food Engineering 62 323-329.
Lee D S, Haggar P E, Lee J, & Yam K L (1991). Model for fresh produce respiration in
modified atmospheres based on principles of enzyme kinetics. Journal of Food Science
56 1580-1585.
Lee D S, Hwang Y L, & Cho S H (1998). Developing antimicrobial packaging film for
curled lettuce and soybean sprouts. Food Science and Biotechnology 7 117-121.
Lee Y S (2003). Development of a 1-Methylcyclopropene Delivery System to Control
Tomato Ripening. Michigan State University, US.
Lee Y S, Beaudry R, Kim J N, & Harte B R (2006). Development of a 1-
methylcyclopropene (1-MCP) sachet release system. Journal of Food Science 71 C1-
C6.
Leshem Y Y, & Wills R B H (1998). Harnessing senescence delaying gases nitric oxide
and nitrous oxide: a novel approach to postharvest control of fresh horticultural
produce. Biologia Plantarum 41 1-10.
Leufven A, & Stollman U (1992). Polymer films as aroma barriers at different
temperatures. Zeitschrift für Lebensmitteluntersuchung und -Forschung A 194 355-359.
Levenspiel O (1972). Introduction. In Chemical Reaction Engineering, 2nd, pp. 1-7. New
York: Wiley.
Liu K J, Hernandez R J, & Giacin J R (1991). The effect of water activity and penetrant
vapor activity on the permeation of toluene vapor through a two-side PVDC coated
opaque oriented polypropylene film. Journal of Plastic Film & Sheeting 7 56-67.
Longhurst T J, Tung H F, & Brady C J (1990). Development regulation of the expression
of alcohol dehydrogenase in ripening tomato fruits. Journal of Food Biochemistry 14
421-433.
References
9-15
Lurie S, Pesis E, Gadiyeva O, Feygenberg O, Ben-Arie R, Kaplunov T, Zutahy Y, &
Lichter A (2006). Modified ethanol atmosphere to control decay of table grapes during
storage. Postharvest Biology and Technology 42 222-227.
Lutzow N, Tihminlioglu A, Danner R P, Duda J L, De Haan A, Warnier G, & Zielinski J
M (1999). Diffusion of toluene and n-heptane in polyethylenes of different crystallinity.
Polymer 40 2797-2803.
Macnish A J, Joyce D C, Irving D E, & Wearing A H (2004). A simple sustained release
device for the ethylene binding inhibitor 1-Methylcyclopropene. Postharvest Biology
and Technology 32 321-338.
Madeley J D, & Sing K S W (1959). Adsorption of ethyl alcohol vapour by silica gel.
Chemistry & Industry 9 289-290.
MAF. (2007. August 2007). Situation and Outlook for New Zealand Agriculture and
Forestry 2007 Retrieved 05/05, 2008, from http://www.maf.govt.nz/mafnet/rural-
nz/statistics-and-forecasts/sonzaf/2007/index.htm
Mahovic M J, Tenney J D, & Bartz J A (2007). Applications of chlorine dioxide gas for
control of bacterial soft rot in tomatoes. Plant Disease 91 1316-1320.
Maneerat C, & Hayata Y (2008). Gas-phase photocatalytic oxidation of ethylene with
TiO2-coated packaging film for horticultural products. Transactions of the ASABE 51
163-168.
Mannapperuma J D, & Singh R P (1994). Modeling of gas exchange in polymeric
packages of fresh fruits and vegetable. In Minimal Processing of Foods and Process
Optimization : An Interface, R P Singh & F A R Oliveira (Eds.), pp. 437-458. Boca
Raton, FL: CRC Press.
Mannapperuma J D, Singh R P, & Montero M E (1991). Simultaneous gas diffusion and
chemical reaction in foods stored in modified atmospheres. Journal of Food
Engineering 14 167-183.
Mannapperuma J D, Zagory D, & Kader A A (1989). Design of polymeric packages for
modified atmosphere storage of fresh produce. In International Controlled Atmosphere
Research Conference. Conference Proceedings. J K Fellman (Ed.), pp. 225-233.
Wenatchee, Washington, USA
Mari M, & Guizzardi M (1998). The postharvest phase: emerging technologies for the
control of fungal diseases. Phytoparasitica 26 59-66.
9-16 Mathematical Modelling of Active Packaging Systems for Horticultural Products
Marin A P, Shlyapnikov Y A, Makhkamov A Z, & Dzhalilov A T (1992). Effect of
heptadecane on sorption of 2,6-di-tert-butyl-4-methylphenol by polyethylene.
International Journal of Polymeric Materials 16 37-44.
Marotta C (1997). Medical packaging. In The Wiley Encyclopedia of Packaging
Technology, 2nd, A L Brody & K S Marsh (Eds.), pp. 610-615. New York Wiley.
Matan N (2008). Control of Aspergillus niger growth on the surface of tomatoes by
cinnamon oil and clove oil. Food New Zealand 8 44-47.
Matan N, Rimkeeree H, Mawson A J, Chompreeda P, Haruthaithanasan V, & Parker M
(2006). Antimicrobial activity of cinnamon and clove oils under modified atmosphere
conditions. International Journal of Food Microbiology 107 180-185.
Matsuguchi M, Maeda N, & Sakai Y (2002). Competitive sorption of water vapor and CO2
in photocrosslinked PVCA film for a capacitive-type humidity sensor. Journal of
Applied Polymer Science 83 401-407.
Maul F, Sargent S A, Sims C A, Baldwin E A, Balaban M O, & Huber D J (2000). Tomato
flavor and aroma quality as affected by storage temperature. Journal of Food Science 65
1228-1237.
McCabe W L, Smith J C, & Harriott P (2001). Fixed-bed separation. In Unit Operations of
Chemical Engineering, pp. 812-856. Boston: McGraw Hill.
Meas P (2006). Mathematical Modelling and Improvement of Operating Practices of Sun
Drying of Rice. Massey University, Palmerston North, New Zealand.
Menniti A M, Gregori R, & Donati I (2004). 1-Methylcyclopropene retards postharvest
softening of plums. Postharvest Biology and Technology 31 269-275.
Mercea P (2000). Models for diffusion in polymers. In Plastic Packaging Materials for
Food : Barrier Function, Mass Transport, Quality Assurance and Legislation, O-G
Piringer & A L Baner (Eds.), pp. 125-157. Weinheim ; Cambridge: Wiley-VCH.
Merts I (1996). Mathematical Modelling of Modified Atmosphere Packaging Systems for
Apples. Massey University, Palmerston North, New Zealand.
Miller W R, Spalding D H, Risse L A, & Chew V (1984). The effects of an imazalil-
impregnated film with chlorine and imazalil to control decay of bell peppers.
Proceedings of the Florida State Horticultural Society 97 108-111.
Mills A F (1995a). Mass transfer. In Basic Heat and Mass Tranfer, pp. 677-824. Chicago:
Irwin.
Mills A F (1995b). Multidimensional and unsteady state conduction. In Basic Heat and
Mass tranfer, pp. 113-207. Chicago: Irwin.
References
9-17
Miltz J, Hoojjat P, Han J, Giacin J R, Harte B R, & Gray I J (1988). Loss of antioxidants
from high density polyethylene-its effect on oatmeal cereal oxidation. In Food and
Packaging Interactions, ACS symposium 365, J H Hotchiss (Ed.), pp. 83-93.
Washington, D.C.: American Chemical Society.
Mohsenin N N (1986). Physical characteristics. In Physical Properties of Plant and Animal
Materials: Structure, Physical Characteristics, and Mechanical Properties, 2nd Updated
and Revised Edition, pp. 79-127. New York: Gordon and Breach Science Publishers
Inc.
Moler C. (2003. May 2003). Stiff Differential Equations. Stiffness is a Subtle, Difficult, and
Important Concept in the Numerical Solution of Ordinary Differential Equations.
Retrieved 21/01, 2008, from
http://www.mathworks.com/company/newsletters/news_notes/clevescorner/may03_clev
e.html
Moore J E, Cherie Millar B, Kenny F, Lowery C J, Xiao L, Rao J R, Nicholson V, Watabe
M, Heaney N, Sunnotel O, McCorry K, Rooney P J, Snelling W J, & Dooley J S G
(2007). Detection of Cryptosporidium parvum in lettuce. International Journal of Food
Science & Technology 42 385-393.
Moyls A L (2004). Whole bag method for determining oxygen transmission rate.
Transactions of the ASAE 47 159-164.
Mugge J, Bosch H, & Reith T (2001). Measuring and modeling gas adsorption kinetics in
single porous particles. Chemical Engineering Science 56 5351-5360.
Mulder M (1991). Transport in membranes. In Basic Principles of Membrane Technology,
pp. 145-197. Dordrecht, Netherlands; Boston Kluwer Academic.
Mustonen H M (1992). The efficacy of a range of sulfur dioxide generating pads against
Botrytis cinerea infection and on out-turn quality of Calmeria table grapes. Australian
Journal of Experimental Agriculture 32 389-393.
Nanthachai N, Ratanachinakorn B, Kosittrakun M, & Beaudry R M (2007). Absorption of
1-MCP by fresh produce. Postharvest Biology and Technology 43 291-297.
Nerín C, & Asensio E (2004). Behaviour of organic pollutants in paper and board samples
intended to be in contact with food. Analytica Chimica Acta 508 185-191.
Nevins A L, Bronlund J E, Mawson A J, Chalmers I, & McKenzie A (2004) The effect of
moisture on the strength of corrugated cardboard packaging, 9th International Congress
on Engineering and Food (ICEF). Montpellier, France: Boca Raton, FL.
9-18 Mathematical Modelling of Active Packaging Systems for Horticultural Products
Ng K C, Chua H T, Chung C Y, Loke C H, Kashiwagi T, Akisawa A, & Saha B B (2001).
Experimental investigation of the silica gel-water adsorption isotherm characteristics.
Applied Thermal Engineering 21 1631-1642.
Nielsen T J, Jagerstad I M, & Oste R E (1992). Study of factors affecting the absorption of
aroma compounds into low-density polyethylene. Journal of the Science of Food and
Agriculture 60 377-381.
Ning B, Kubo Y, Inaba A, & Nakamura R (1997). Physiological responses of Chinese pear
'Yali' fruit to CO2-enriched and/or O2-reduced atmospheres. Journal of the Japanese
Society for Horticultural Science 66 613-620.
Nychas G J E (1995). Natural antimicrobials from plants. In New Methods ofFood
Preservation, G W Gould (Ed.), pp. 58-89. London: Blackie Academic & Professional.
Ozdemir M, & Floros J D (2004). Active food packaging technologies. Critical Reviews in
Food Science and Nutrition 44 185-193.
Parker M E, Bronlund J E, & Mawson A J (2006). Moisture sorption isotherms for paper
and paperboard in food chain conditions. Packaging Technology & Science 19 193-209.
Patterson B D, & Joyce D C (1993). A package allowing cooling and preservation of
horticultural produce without condensation of desiccants. International Patent
Application PCT/AU93/00398
Paul D R, & Clarke R (2002). Modeling of modified atmosphere packaging based on
designs with a membrane and perforations. Journal of Membrane Science 208 269-283.
Pauly S (1999). Permeability and diffusion data. In Polymer Handbook, J. Brandrup, E H
Immergut & E A Grulke (Eds.), pp. VI/543-VI/569. New York: Wiley.
Picón A, Martinez-Jávega J M, Cuquerella J, Delrio M A, & Navarro P (1993). Effects of
precooling, packaging film, modified atmosphere and ethylene absorber on the quality
of refrigerated Chandler and Douglas strawberries. Food Chemistry 48 189-193.
Piringer O-G (2000). Permeation of gases, water vapor and volatile organic compounds. In
Plastic Packaging Materials for Food : Barrier Function, Mass Transport, Quality
Assurance and Legislation, O-G Piringer & A L Baner (Eds.), pp. 238-285. Weinheim
; Cambridge: Wiley-VCH.
Plotto A, Bai J, Narciso J A, Brecht J K, & Baldwin E A (2006). Ethanol vapor prior to
processing extends fresh-cut mango storage by decreasing spoilage, but does not always
delay ripening. Postharvest Biology and Technology 39 134-145.
Ponce A G, Valle C, & Roura S I (2004). Shelf life of leafy vegetables treated with natural
essential oils. Journal of Food Science 69 FMS50-FMS56.
References
9-19
Pongjaruwat W (2007). Effect of Modified Atmosphere on Storage Life of Purple
Passionfruit and Red Tamarillo. Massey University, Palmerston North, New Zealand.
Pospisil J, Cikovic N, Dragovic-Uzelac V, Lukin V, & Brusic D (2001). The quality of
sliced carrots affected by modified polyethylene foil and storage temperatures. Acta
Alimentaria 30 233-246.
Prasetyo I, & Do D D (1998). Adsorption rate of methane and carbon dioxide on activated
carbon by the semi-batch constant molar flow rate method. Chemical Engineering
Science 53 3459-3467.
Prasetyo I, Do H D, & Do D D (2002). Surface diffusion of strong adsorbing vapours on
porous carbon. Chemical Engineering Science 57 133-141.
Rai D R, & Paul S (2007). Transient state in-pack respiration rates of mushroom under
modified atmosphere packaging based on enzyme kinetics. Biosystems Engineering 98
319-326.
Ratkowsky D A (1986). A suitable parameterization of the Michaelis-Menten enzyme
reaction. Biochemical Journal 240 357-360.
Ratkowsky D A (1990). Models with one x variable, convex/concave curves. In Handbook
of Nonlinear Regression Models, pp. 71-121. New York: M. Dekker.
Renault P, Houal L, Jacquemin G, & Chambroy Y (1994a). Gas-exchange in modified
atmosphere packaging. 2. Experimental results with strawberries. International Journal
of Food Science and Technology 29 379-394.
Renault P, Souty M, & Chambroy Y (1994b). Gas-exchange in modified atmosphere
packaging.1. A new theoretical approach for micro-perforated packs. International
Journal of Food Science and Technology 29 365-378.
Riederer M (2006). Introduction: biology of the plant cuticle. In Biology of the Plant
Cuticle, M Riederer & C Müller (Eds.), pp. 1-10. Oxford, UK; Ames, Iowa Blackwell
Pub.
Robertson G L (1993a). Deterioration reactions in foods. In Food Packaging: Principles
and Practice, pp. 252-302. New York: Marcel Dekker.
Robertson G L (1993b). Metal packaging materials. In Food Packaging: Principles and
Practice, pp. 173-203. New York: Marcel Dekker.
Robertson G L (1993c). Permeability of thermoplastic polymers. In Food Packaging:
Principles and Practice, pp. 73-110. New York: Marcel Dekker.
Robertson G L (1993d). Shelf life of foods. In Food Packaging: Principles and Practice,
pp. 338-380. New York: Marcel Dekker.

9-20 Mathematical Modelling of Active Packaging Systems for Horticultural Products
Robinson J E, Browne K M, & Burton W G (1975). Storage characteristics of some
vegetables and soft fruits. Annals of Applied Biology 81 399-408.
Rogers C E (1985). Permeation of gases and vapours in polymers. In Polymer
Permeability, J Comyn (Ed.), pp. 11-73. New York: Elsevier.
Rogers C E, Stannett V, & Szwarc M (1962). The permeation of organic vapors. In
Permeability of Plastic Films and Coated Paper to Gases and Vapors, V Stannett
(Ed.), pp. 78-101. New York: Technical Association of the Pulp and Paper Industry.
Romanazzi G, Karabulut O A, & Smilanick J L (2007). Combination of chitosan and
ethanol to control postharvest gray mold of table grapes. Postharvest Biology and
Technology 45 134-140.
Rooney M L (1995a). Active packaging in polymer films. In Active Food Packaging,
M.L.Rooney (Ed.), pp. 74-110. Glasgow: Blackie Academic & Professional.
Rooney M L (1995b). Overview of active food packaging. In Active Food Packaging, M
L Rooney (Ed.), pp. 1-37. Glasgow: Blackie Academic & Professional.
Ruiz J J, Alonso A, García-Martínez S, Valero M, Blasco P, & Ruiz-Bevia F (2005).
Quantitative analysis of flavour volatiles detects differences among closely related
traditional cultivars of tomato. Journal of the Science of Food and Agriculture 85 54-60.
Rychter A, Janes H W, Chin C K, & Frenkel C (1979). Effect of ethanol, acetaldehyde,
acetic-acid, and ethylene on changes in respiration and respiratory metabolites in potato-
tubers. Plant Physiology 64 108-111.
Sajilata M G, Savitha K, Singhal R S, & Kanetkar V R (2007). Scalping of flavors in
packaged foods. Comprehensive Reviews in Food Science and Food Safety 6 17-35.
Saltveit M E, & Sharaf A R (1992). Ethanol inhibits ripening of tomato fruit harvested at
various degrees of ripeness without affecting subsequent quality. Journal of the
American Society for Horticultural Science 117 793-798.
Schotte S, De Belie N, & De Baerdemaeker J (1999). Acoustic impulse-response technique
for evaluation and modelling of firmness of tomato fruit. Postharvest Biology and
Technology 17 105-115.
Schreiber L, Kirsch T, & Riederer M (1996). Diffusion through cuticles: principles and
models. In Plant Cuticles : An Integrated Functional Approach, Environmental Plant
Biology Series, G Kerstiens (Ed.), pp. 109-119. Oxford, UK Bios Scientific.
Selke S E M, Culter J D, & Hernandez R J (2004). Mass transfer in polymeric packaging
systems: sorption, diffusion, permeation and shelf life. In Plastics Packaging :
References
9-21
Properties, Processing, Applications, and Regulations, 2nd, pp. 333-374. Cincinnati,
Ohio: Hanser Gardner Publications.
Serrano M, Martinez-Romero D, Castillo S, Guillen F, & Valero D (2005). The use of
natural antifungal compounds improves the beneficial effect of MAP in sweet cherry
storage. Innovative Food Science & Emerging Technologies 6 115-123.
Shirazi A, & Cameron A C (1992). Controlling relative humidity in modified atmosphere
packages of tomato fruit. HortScience 2 14-16.
Sholberg P, Haag P, Hocking R, & Bedford K (2000). The use of vinegar vapor to reduce
postharvest decay of harvested fruit. HortScience 35 898-903.
Singh S P, & Rao D V S (2005). Quality assurance of papaya by shrink film wrapping
during storage and ripening. Journal of Food Science and Technology-Mysore 42 523-
525.
Smith J P, Hoshino J, & Abe Y (1995). Interactive packaging involving sachet technology.
In Active Food Packaging, M L Rooney (Ed.), pp. 143-173. Glasgow: Blackie
Academic & Professional.
Smith J P, Ooraikul B, Koersen W J, Voort F R v d, Jackson E D, & Lawrence R A (1987).
Shelf life extension of a bakery product using ethanol vapor. Food Microbiology 4 329-
337.
Solbakken A, & Reyerson L H (1959). Sorption and magnetic susceptibility studies on
nitric oxide-silica gel systems at a number of temperature. Journal of Physical
Chemistry 63 1622-1625.
Solomos T (1987). Principles of gas exchange in bulky plant tissues. HortScience 22 766-
771.
Song J, Hildebrand P D, Fan L H, Forney C F, Renderos W E, Campbell-Palmer L, &
Doucette C (2007). Effect of hexanal vapor on the growth of postharvest pathogens and
fruit decay. Journal of Food Science 72 M108-M112.
Song J, Leepipattanawit R, Deng W M, & Beaudry R M (1996). Hexanal vapor is a
natural, metabolizable fungicide: inhibition of fungal activity and enhancement of
aroma biosynthesis in apple slices. Journal of the American Society for Horticultural
Science 121 937-942.
Song Y, Vorsa N, & Yam K L (2002). Modeling respiration-transpiration in a modified
atmosphere packaging system containing blueberry. Journal of Food Engineering 53
103-109.

9-22 Mathematical Modelling of Active Packaging Systems for Horticultural Products
Soroka W (1995). Paper and paperboard. In Fundamentals of Packaging Technology, 2nd,
pp. 97-115. Virginia: Institute of Packaging Professionals.
Spotts R A, Sholberg P L, Randall P, Serdani M, & Chen P M (2007). Effects of 1-MCP
and hexanal on decay of d'Anjou pear fruit in long-term cold storage. Postharvest
Biology and Technology 44 101-106.
Steffan D G, & Akgerman A (2001). Thermodynamic modeling of binary and ternary
adsorption on silica gel. AIChE Journal 47 1234-1246.
Stone E J, Hall R M, & Kazeniac S J (1975). Formation of aldehydes and alcohols in
tomato fruit from U-14C-labeled linolenic and linoleic acids. Journal of Food Science 40
1138-1141.
Sugiura T, Kuroda H, Ito D, & Honjo H (2001). Correlations between specific gravity and
soluble solids concentration in grape berries. Journal of the Japanese Society for
Horticultural Science 70 380-384.
Suzuki Y, Uji T, & Terai H (2004). Inhibition of senescence in broccoli florets with
ethanol vapor from alcohol powder. Postharvest Biology and Technology 31 177-182.
Talasila P C, & Cameron A C (1997). Free-volume changes in flexible, hermetic packages
containing respiring produce. Journal of Food Science 62 659-664.
Tanner D J (1998). Mathematical Modelling for Design of Horticultural Packaging.
Massey University, Palmerston North, New Zealand.
Terry L A, Ilkenhans T, Poulston S, Rowsell L, & Smith A W J (2007). Development of
new palladium-promoted ethylene scavenger. Postharvest Biology and Technology 45
214-220.
Thiagu R, Chand N, Habibunnisa E A, Prasad B A, & Ramana K V R (1991). Effect of
evaporative cooling storage on ripening and quality of tomato. Journal of Food Quality
14 127-144.
Thielmann F (2004). Introduction into the characterisation of porous materials by inverse
gas chromatography. Journal of Chromatography A 1037 115-123.
Thomas W J, & Crittenden B (1998a). Adsorbents. In Adsorption Technology and Design,
pp. 8-30. Oxford, Boston: Butterworth-Heinemann.
Thomas W J, & Crittenden B (1998b). Fundamentals of adsorption equilibrium. In
Adsorption Technology and Design, pp. 31-65. Oxford, Boston: Butterworth-
Heinemann.

References
9-23
Thompson J F, & Mitchell F G (2002). Packages for horticultural crops. In Postharvest
Technology of Horticultural Crops, 3rd, A A Kader (Ed.), pp. 85-95. Oakland:
University of California Agriculture and Natural Resources.
Tien C (1994). Respresentation, correlation, and prediction of single-component adsorption
equilibrium. In Adsorption Calculations and Modeling, pp. 15-41. Boston:
Butterworth-Heinemann.
Tokarev A, Friess K, Machkova J, Sipek M, & Yampolskii Y (2006). Sorption and
diffusion of organic vapors in amorphous Teflon AF2400. Journal of Polymer Science
Part B-Polymer Physics 44 832-844.
Triantafyllou V I, Akrida-Demertzi K, & Demertzis P G (2005). Determination of partition
behavior of organic surrogates between paperboard packaging materials and air. Journal
of Chromatography A 1077 74-79.
Tripathi P, & Dubey N K (2004). Exploitation of natural products as an alternative strategy
to control postharvest fungal rotting of fruit and vegetables. Postharvest Biology and
Technology 32 235-245.
Utama I M S, Wills R B H, Ben-Yehoshua S, & Kuek C (2002). In vitro efficacy of plant
volatiles for inhibiting the growth of fruit and vegetable decay microorganisms. Journal
of Agricultural and Food Chemistry 50 6371-6377.
Utto W (2001). The Design of Modified Atmosphere Perforated Plastic Packaging for
Fresh Chillies. Massey University, Palmerston North, New Zealand.
Utto W, Mawson A J, Bronlund J E, & Wong K K Y (2005). Active packaging
technologies for horticultural produce. Food New Zealand 5 21-32.
Valenzuela D P (1989). Adsorption Equilibrium Data Handbook. Englewood Cliffs, N.J.:
Prentice Hall.
Valverde J M, Guillen F, Martinez-Romero D, Castillo S, Serrano M, & Valero D (2005).
Improvement of table grapes quality and safety by the combination of modified
atmosphere packaging (MAP) and eugenol, menthol, or thymol. Journal of Agricultural
and Food Chemistry 53 7458-7464.
Vaughn S F, Spencer G F, & Shasha B S (1993). Volatile compounds from raspberry and
strawberry inhibit postharvest decay fungi. Journal of Food Science 58 793-796.
Vermeiren L, Heirlings L, F D, & Debevere J (2003). Oxygen, ethylene and other
scavengers. In Novel Food Packaging Techniques, R.Ahvenainen (Ed.), pp. 22-49.
Cambridge: Woodhead Publishing Limited.
9-24 Mathematical Modelling of Active Packaging Systems for Horticultural Products
Vick B A, & Zimmerman D C (1987). Oxidative systems for modification of fatty acids:
the lipoxygenase pathway. In The Biochemistry of Plants, P K Stumpf (Ed.), pp. 53-90.
New York: Academic Press.
Weber W J (1985). Adsorption theory, concepts and models. In Adsorption Technology : A
Step-by-Step Approach to Process Evaluation and Application, F L Slejko (Ed.), pp. 1-
35. New York: Marcel Dekker.
Wenzl T, & Lankmayr E P (2001). Effect of the water content of cardboard on the static
headspace extraction of volatile aldehydes. Journal of Separation Science 24 885-888.
Wijeratnam R S W, Hewajulige I G N, & Abeyratne N (2005). Postharvest hot water
treatment for the control of Thielaviopsis black rot of pineapple. Postharvest Biology
and Technology 36 323-327.
Willige R v, Schoolmeester D, Ooij A v, Linssen J, & Voragen A (2002). Influence of
storage time and temperature on absorption of flavor compounds from solutions by
plastic packaging material. Journal of Food Science 67 2023-2031.
Wills R B H, McGlasson W B, Graham D, Lee T H, & Hall E G (1989). Effects of water
loss and humdity. In Postharvest: An Introduction to the Physiology and Handling of
Fruit and Vegetables, pp. 53-60. New South Wales: New South Wales University
Press.
Wilson C L, & Wisniewski M E (1989). Biological control of postharvest diseases of fruits
and vegetables - an emerging technology. Annual Review of Phytopathology 27 425-
441.
Wisniewski M E, & Wilson C L (1992). Biological control of postharvest diseases of fruits
and vegetables-recent advances. HortScience 27 94-98.
Wolford J J (1998). Hexanal Vapor to Control Decay of Sliced Apples in Modified
Atmosphere Packages Using Metallocene Film. Michigan State University, US.
Yahia E M, & Gonzalez-Aguilar G (1998). Use of passive and semi-active atmospheres to
prolong the postharvest life of avocado fruit. Food Science and Technology-
Lebensmittel-Wissenschaft & Technologie 31 602-606.
Yam K L, & Lee D S (1995). Design of modified atmosphere packaging for fresh produce.
In Active Food Packaging, M L Rooney (Ed.), pp. 55-73. Glasgow: Blackie Academic
& Professional.
Yang M, Dang T Q, Zhang J S, Gao X F, & Li H (2005). Determination of building
materials' transport properties for modeling VOC emissions. ASHRAE Transactions 111
88-100.
References
9-25
Yearsley C W, Banks N H, Ganesh S, & Cleland D J (1996). Determination of lower
oxygen limits for apple fruit. Postharvest Biology and Technology 8 95-109.
Zagory D (1995). Ethylene-removing packaging. In Active Food Packaging, M L Rooney
(Ed.), pp. 38-54. Glasgow: Blackie Academic & Professional.
Zhang W, Li X, Wang X, Wang G, Zheng J, Abeysinghe D C, Ferguson I B, & Chen K
(2007). Ethanol vapour treatment alleviates postharvest decay and maintains fruit
quality in Chinese bayberry. Postharvest Biology and Technology 46 195-198.
Zhou L, Liu X W, Li J W, Sun Y, & Zhou Y P (2006). Sorption/desorption equilibrium of
methane in silica gel with pre-adsorption of water. Colloids and Surfaces a-
Physicochemical and Engineering Aspects 273 117-120.
Zhou L, Sun Y, & Zhou Y P (2002). Enhancement of the methane storage on activated
carbon by preadsorbed water. AIChE Journal 48 2412-2416.
Zhu L, Chiu F C, Fu Q, Quirk R P, & Cheng S Z D (1999). Physical constants of
poly(ethylene). In Polymer Handbook, J. Brandrup, E H Immergut & E A Grulke
(Eds.), pp. V/9-V/18. New York: Wiley.
Zobel M G R (1982). Measurement of odour permeability of polypropylene packaging
films at low odourant levels. Polymer Testing 3 133-142.
Zobel M G R (1985). The odor permeability of polypropylene packaging film. Polymer
Testing 5 153-165.

9-26 Mathematical Modelling of Active Packaging Systems for Horticultural Products
Appendix A: Peer Review Article Published in Food New Zealand
A-1
Appendix A
ACTIVE PACKAGING TECHNOLOGIES FOR
HORTICULTURAL PRODUCE
Material from this chapter was published in Food New Zealand as:
Utto W, Mawson A J, Bronlund J E, & Wong K K Y (2005). Active packaging
technologies for horticultural produce. Food New Zealand 5 21-32.
The published article is provided in the ‘PDF’ format in the attached CD-ROM. The
filename is ‘Peer Review_Active Packaging Technology_FNZMarApr2005.pdf’.

A-2 Mathematical Modelling of Active Packaging Systems for Horticultural Products

Appendix B: Research Article Published in Postharvest Biology and Technoloy
B-1
Appendix B
HEXANAL REDUCES INFECTION OF TOMATOES BY
BOTRYTIS CINEREA WHILST MAINTAINING QUALITY
Material from this chapter was published in Postharvest Biology and Technology as:
Utto W, Mawson A J, & Bronlund J E (2008). Hexanal reduces infection of tomatoes by
Botrytis cinerea whilst maintaining quality. Postharvest Biology and Technology 47 434-
437.
The published article is provided in the ‘PDF’ format in the attached CD-ROM. The
filename is ‘Hexanal_Bcinerea_PBT2008_.pdf’.

B-2 Mathematical Modelling of Active Packaging Systems for Horticultural Products

Appendix C: Gas Chromatographic Analysis Procedures
C-1
Appendix C
GAS CHROMATOGRAPHIC ANALYSIS PROCEDURES
Gas chromatography conditions for identifying acetaldehyde and ethanol using the FID-
GC described in Chapter 3 are provided in Table C-1. Standard solutions were prepared by
dissolving acetaldehyde (≥ 99%, GC grade, Fluka, supplied by Sigma Aldrich, New
Zealand) or ethanol (≥99.8% GC grade, Riedel-de Haën supplied by Sigma Aldrich, New
Zealand) individually in high purity deionised water (Milli-Q water, Millipore
Corporation, US). For hexanol and hexylacetate, standard curves were not developed and
identification of the peaks was based on their retention times determined using solutions of
these chemicals in liquid ethanol (as described above). GC procedures utilised to quantify
hexanol and hexylacetate were the same as those used for identifying hexanal (described in
Chapter 3).
Table C-1 Gas chromatography conditions for identifying acetaldehyde and ethanol
Compound Operation condition
Acetaldehyde Ethanol
Detector temperature (ºC) 250 260
Inlet temperature (ºC) 140 250
Column temperature (ºC) 35 100
Carrier gas flowrate (ml·min-1) 2 2
Optimal spilt flow ratio 2:400 2:400
Peak retention time (min) 1.57± 0.02 1.71± 0.02
Concentrations (mol·m-3) of VOCs including hexanal, acetaldehyde, and ethanol were
calculated using Eq. C-1.
inj
iGC
iGCi
Vol
AKC = (Eq. C-1)
where
iC = Concentration of VOC i (mol·m-3)
iGCK = Detector response or slope (mol·area-1) of standard curve of VOC i as
shown in Figure C-1
iGCA = Area of gas chromatogram peak from the injected volume of sample

C-2 Mathematical Modelling of Active Packaging Systems for Horticultural Products
(area)
injVol = Injected volume of sample (m3)
0 20000 40000 60000
0
20000
40000
60000
80000
100000
120000
AcetaldehydeHexanal
KGC = 2E-15
R2= 0.996
ni (x 10-15 mol)
Chromatogram Area (area)
0 3000 6000 9000 12000
KGC = 6E-15
R2 = 0.996
0 10000 20000 30000
Ethanol
KGC = 5E-15
R2 = 0.978
Figure C-1 Standard curves of hexanal, acetaldehyde, and ethanol ( in = number of moles)
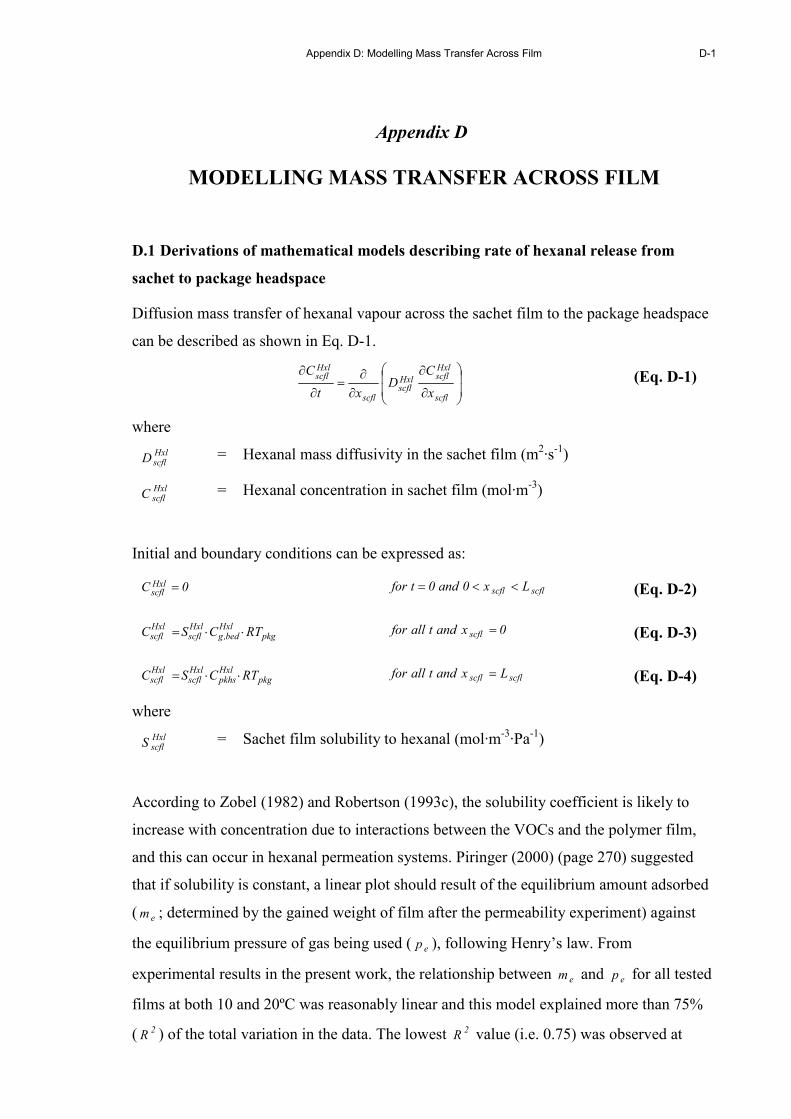
Appendix D: Modelling Mass Transfer Across Film
D-1
Appendix D
MODELLING MASS TRANSFER ACROSS FILM
D.1 Derivations of mathematical models describing rate of hexanal release from
sachet to package headspace
Diffusion mass transfer of hexanal vapour across the sachet film to the package headspace
can be described as shown in Eq. D-1.
∂
∂
∂∂
=∂
∂
scfl
HxlscflHxl
scflscfl
Hxlscfl
x
CD
xt
C (Eq. D-1)
where
HxlscflD = Hexanal mass diffusivity in the sachet film (m2·s-1)
HxlscflC = Hexanal concentration in sachet film (mol·m-3)
Initial and boundary conditions can be expressed as:
0C Hxlscfl = scflscfl Lx0and0tfor <<= (Eq. D-2)
pkgHxlbed,g
Hxlscfl
Hxlscfl RTCS C ⋅⋅= 0xandtallfor scfl = (Eq. D-3)
pkgHxlpkhs
Hxlscfl
Hxlscfl RTCS C ⋅⋅= scflscfl Lxandtallfor = (Eq. D-4)
where
HxlscflS = Sachet film solubility to hexanal (mol·m-3·Pa-1)
According to Zobel (1982) and Robertson (1993c), the solubility coefficient is likely to
increase with concentration due to interactions between the VOCs and the polymer film,
and this can occur in hexanal permeation systems. Piringer (2000) (page 270) suggested
that if solubility is constant, a linear plot should result of the equilibrium amount adsorbed
( em ; determined by the gained weight of film after the permeability experiment) against
the equilibrium pressure of gas being used ( ep ), following Henry’s law. From
experimental results in the present work, the relationship between em and ep for all tested
films at both 10 and 20ºC was reasonably linear and this model explained more than 75%
( 2R ) of the total variation in the data. The lowest 2
R value (i.e. 0.75) was observed at

D-2 Mathematical Modelling of Active Packaging Systems for Horticultural Products
20ºC for LDPE. This finding supported the information discussed in Chapter 4 where high
variation of permeability values was observed amongst LDPE films. Based on the
discussion above, it could be assumed that solubility stays reasonably constant and
presumably concentration independent. Because of this, Eq. D-1 becomes:
∂
∂
∂
∂=
∂
∂
scfl
Hxl
scflx,g
pkgHxl
scfl
Hxl
scfl
scfl
Hxl
scfl
x
C
RTSD
xt
C
(Eq. D-5)
where
Hxl
scflx,gC = Hexanal concentration in gas phase which is in equilibrium with the
sachet film material at a position x ( scflx ) (mol·m-3)
The product of diffusion coefficient and solubility coefficient is commonly considered as
permeability (Robertson 1993c; Selke et al. 2004). Therefore, a relationship between the
effective permeability to hexanal of sachet films (referred to in Chapter 4) and HxlscflD and
HxlscflS can be described by Eq. D-6.
⋅=⋅= scfl
Hxl
scflx,g
Hxl
0,scfl
Hxl
scfl
Hxl
scfl
Hxl
scflbCexpPSDP (Eq. D-6)
Substituting Eq. D-6 in Eq. D-5 then yields:
∂
∂
⋅
∂
∂=
∂
∂
scfl
Hxl
scflx,g
scflHxl
scflx,gpkgHxl
0,scfl
scfl
Hxl
scfl
x
C
bCexpRTP
xt
C
(Eq. D-7)
Initial and boundary conditions then become:
0CHxl
scflx,g= scflscfl Lx0and0tfor <<= (Eq. D-8)
Hxlbed,g
Hxl
scflx,gC C = 0xandtallfor scfl = (Eq. D-9)
Hxlpkhs
Hxl
scflx,gC C = scflscfl Lxandtallfor = (Eq. D-10)
At steady state permeation conditions, Eq. D-7 becomes:
scfl
Hxl
scflx,g
scflHxl
scflx,gpkgHxl
0,scfl
scfl x
C
bCexpRTP
x
0
∂
∂
⋅
∂
∂=
(Eq. D-11)
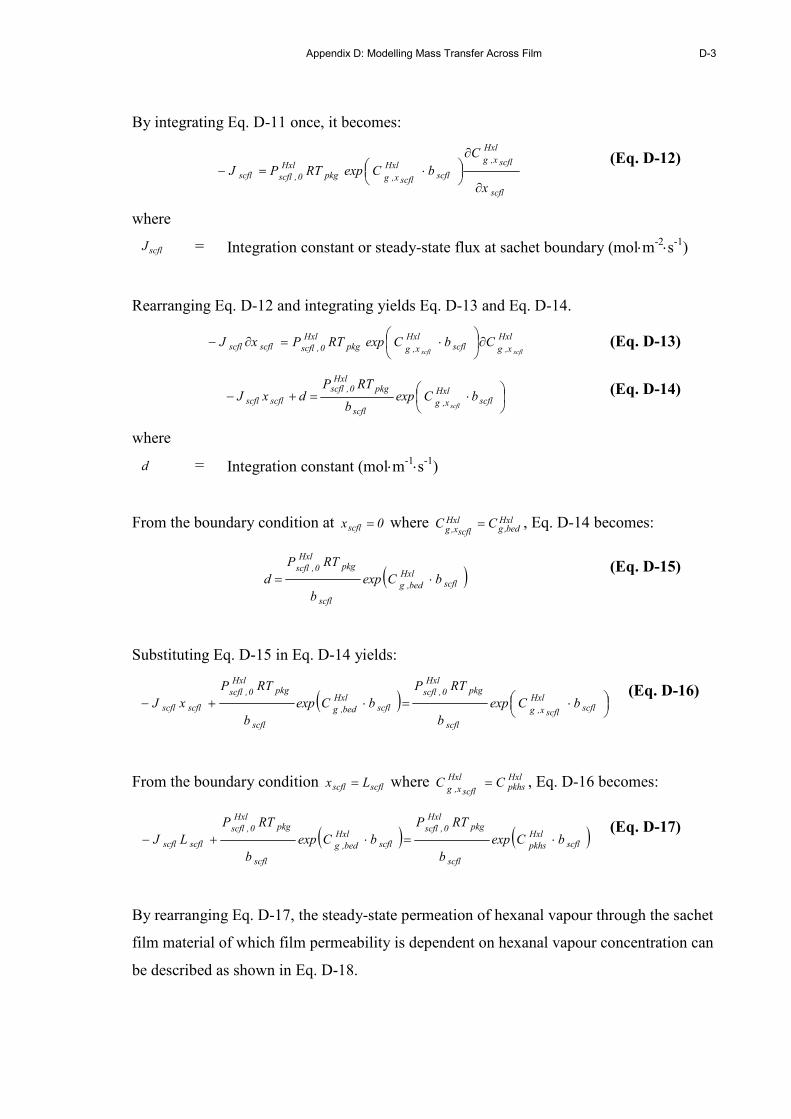
Appendix D: Modelling Mass Transfer Across Film
D-3
By integrating Eq. D-11 once, it becomes:
scfl
Hxl
scflx,g
scflHxl
scflx,gpkgHxl
0,scflscfl
x
C
bCexpRTPJ
∂
∂
⋅=−
(Eq. D-12)
where
scflJ = Integration constant or steady-state flux at sachet boundary (mol⋅m-2⋅s-1)
Rearranging Eq. D-12 and integrating yields Eq. D-13 and Eq. D-14.
Hxl
x,gscflHxl
x,gpkgHxl
0,scflscflscflscflscfl
CbCexpRTPxJ ∂
⋅=∂− (Eq. D-13)
⋅=+− scflHxl
x,gscfl
pkgHxl
0,scfl
scflscfl bCexpb
RTPdxJ
scfl
(Eq. D-14)
where
d = Integration constant (mol⋅m-1⋅s-1)
From the boundary condition at 0xscfl = where Hxlbed,g
Hxl
scflx,gCC = , Eq. D-14 becomes:
( )scflHxl
bed,g
scfl
pkgHxl
0,scfl
bCexp
b
RTP
d ⋅= (Eq. D-15)
Substituting Eq. D-15 in Eq. D-14 yields:
( )
⋅=⋅+− scfl
Hxl
scflx,g
scfl
pkgHxl
0,scfl
scflHxl
bed,g
scfl
pkgHxl
0,scfl
scflscfl bCexp
b
RTP
bCexp
b
RTP
xJ (Eq. D-16)
From the boundary condition scflscfl Lx = where Hxlpkhs
Hxl
scflx,gCC = , Eq. D-16 becomes:
( ) ( )scflHxl
pkhs
scfl
pkgHxl
0,scfl
scflHxl
bed,g
scfl
pkgHxl
0,scfl
scflscfl bCexp
b
RTP
bCexp
b
RTP
LJ ⋅=⋅+− (Eq. D-17)
By rearranging Eq. D-17, the steady-state permeation of hexanal vapour through the sachet
film material of which film permeability is dependent on hexanal vapour concentration can
be described as shown in Eq. D-18.

D-4 Mathematical Modelling of Active Packaging Systems for Horticultural Products
( ) ( )( )scflHxl
pkhsscflHxl
bed,g
scflscfl
pkgHxl
0,scfl
scfl bCexpbCexp
Lb
RTP
J ⋅−⋅= , for 0t > (Eq. D-18)
D.2 Modelling concentration gradients and fluxes across experimentally utilised films
D.2.1 Modelling concentration gradients
From section D.1, the mathematical model for describing a relationship between
equilibrium vapour concentration and film position (the concentration gradient) can be
obtained by substituting Eq. D-18 in Eq. D-16 and rearranging to yield Eq. D-19.
⋅−
⋅
⋅−
⋅
=
scflHxl
pkhsscflHxl
bed,g
scflHxl
x,gscflHxl
bed,g
scfl
scfl
bCexpbCexp
bCexpbCexp
L
x scfl
(Eq. D-19)
Given similar initial and boundary conditions to those of the sachet film, concentration
gradient of films (Tyvek, OPP and LDPE) used in the determination of hexanal
permeability (section 4.2.2) could be described by Eq. D-19 and this is expressed as Eq.
D-20.
( )( ) ( )film
Hxlconc,lfilm
Hxlconc,h
filmHxl
filmx,gfilmHxlconc,h
film
film
bCexpbCexp
bCexpbCexp
L
x
⋅−⋅
⋅−⋅
= (Eq. D-20)
Given the initial and boundary conditions of permeation through films in the permeability
cell as:
0C Hxl
filmx,g= filmfilm Lx0and0tfor <<= (Eq. D-21)
Hxlconc,h
Hxl
filmx,gC C = 0xandtallfor film = (Eq. D-22)
Hxlconc,l
Hxl
filmx,gCC = filmfilm Lxandtallfor = (Eq. D-23)
D.2.2 Modelling fluxes
In section 4.2.2, comparisons of flux across a LDPE film calculated using Eq. 2-8 (Fick’s
first law) and Eq. 4-5 were demonstrated. The derivation of Eq. 4-5 was based on Eq. D-
18, in which parameters were appropriately replaced and can be expressed as Eq. D-24.
Appendix D: Modelling Mass Transfer Across Film
D-5
( ) ( )( )filmHxlconc,lfilm
Hxlconc,h
scflfilm
pkgHxl
0,film
film bCexpbCexp
Lb
RTP
J ⋅−⋅= (Eq. D-24)
D.3 Alternative model describing the rate of hexanal release from sachet to package
headspace (based on an assumption of the Langmuir relationship between hexanal
vapour and LDPE film sorption)
As an alternative to assuming a Henry’s law isotherm relationship between the vapour
phase concentration and absorbed volatile concentrations in the film, the Langmuir type
relationship can be used. In this situation the effective permeability will be a strong
function of concentration at low partial pressures but less variable when the film becomes
saturated with absorbed volatile. As such the equations derived in section D.2.2 would
overpredict mass transfer rates through the film at high feed hexanal partial pressure.
At steady-state and provided concentration-independent mass transfer diffusivity ( HxlscflD ),
diffusion mass transfer of hexanal vapour across the sachet film to package headspace can
be described as shown in Eq. D-25.
∂
∂
∂
∂=
scfl
Hxlscfl
Hxlscfl
scfl x
C
D
x
0 (Eq. D-25)
By separating variables in Eq. D-25 and incorporating Hxl
scflx,gC , Eq. D-26 is obtained:
∂
∂
∂
∂
∂
∂=
scfl
Hxl
scflx,g
Hxl
scflx,g
Hxlscfl
Hxlscfl
scfl x
C
C
C
D
x
0 (Eq. D-26)
The Langmuir relationship between hexanal vapour and LDPE film sorption (considered at
position scflx ) can be described as:
Hxl
scflx,g
Hxl1,Lgmfl
Hxl
scflx,g
Hxl2,Lgmfl
Hxlscfl
Ck1
Ck
C
⋅+
⋅=
(Eq. D-27)
where
Hxl1,Lgmflk = Coefficient of Langmuir relationship between hexanal vapour and LDPE
film sorption (m3·mol-1)
D-6 Mathematical Modelling of Active Packaging Systems for Horticultural Products
Hxl2,Lgmflk = Coefficient of Langmuir relationship between hexanal vapour and LDPE
film sorption (dimensionless)
The derivative of HxlscflC in respect to Hxl
scflx,gC can be expressed as:
2Hxl
scflx,g
Hxl1,Lgmfl
Hxl2,Lgmfl
Hxl
scflx,g
Hxlscfl
Ck1
k
C
C
⋅+
=∂
∂
(Eq. D-28)
Substituting Eq. D-28 in Eq. D-26, Eq. D-29 is obtained:
∂
∂
⋅+∂
∂=
scfl
Hxl
scflx,g
2Hxl
scflx,g
Hxl1,Lgmfl
Hxl2,Lgmfl
Hxlscfl
scfl x
C
Ck1
k
D
x
0 (Eq. D-29)
Initial and boundary conditions can be expressed as:
0CHxl
scflx,g= scflscfl Lx0and0tfor <<= (Eq. D-30)
Hxlbed,g
Hxl
scflx,gC C = 0xandtallfor scfl = (Eq. D-31)
Hxlpkhs
Hxl
scflx,gC C = scflscfl Lxandtallfor = (Eq. D-32)
Integrating Eq. D-29 once, it becomes:
scfl
Hxl
scflx,g
2Hxl
scflx,g
Hxl1,Lgmfl
Hxl2,Lgmfl
Hxlscfl
scfl
x
C
Ck1
kD
J
∂
∂
⋅+
⋅=−
(Eq. D-33)
Rearranging Eq. D-33 and integrating yields Eq. D-34 and Eq. D-35.
2Hxl
x,g
Hxl
1,Lgmfl
Hxl
x,gHxl
2,Lgmfl
Hxl
scflscflscfl
scfl
scfl
Ck1
C
kDxJ
⋅+
∂⋅=∂−
(Eq. D-34)
( )
⋅+
⋅−=+−Hxlx,g
2Hxl1,Lgmfl
Hxl1,Lgmfl
Hxl2,Lgmfl
Hxlscflscflscfl
scflCkk
1kDdxJ
(Eq. D-35)
From the boundary condition at 0xscfl = where Hxlbed,g
Hxl
scflx,gCC = , Eq. D-35 becomes:
Appendix D: Modelling Mass Transfer Across Film
D-7
( )
⋅+
⋅−=Hxlbed,g
2Hxl1,Lgmfl
Hxl1,Lgmfl
Hxl2,Lgmfl
Hxlscfl
Ckk
1kDd
(Eq. D-36)
Substituting Eq. D-36 in Eq. D-35 yields:
( ) ( )
⋅+
⋅−=
⋅+
⋅−−Hxlx,g
2Hxl1,Lgmfl
Hxl1,Lgmfl
Hxl2,Lgmfl
Hxlscfl
Hxlbed,g
2Hxl1,Lgmfl
Hxl1,Lgmfl
Hxl2,Lgmfl
Hxlscflscflscfl
scflCkk
1kD
Ckk
1kDxJ
(Eq. D-37)
From the boundary condition scflscfl Lx = where Hxlpkhs
Hxl
scflx,gCC = , Eq. D-37 becomes:
( ) ( )
⋅+
⋅−=
⋅+
⋅−−Hxlpkhs
2Hxl1,Lgmfl
Hxl1,Lgmfl
Hxl2,Lgmfl
Hxlscfl
Hxlbed,g
2Hxl1,Lgmfl
Hxl1,Lgmfl
Hxl2,Lgmfl
Hxlscflscflscfl
Ckk
1kD
Ckk
1kDLJ
(Eq. D-38)
By rearranging Eq. D-38, the steady-state permeation (i.e. positive flux) of hexanal vapour
through sachet film material for which film solubility is described by Langmuir
relationship can be expressed as shown in Eq. D-39.
( ) ( )
⋅+−
⋅+
⋅=
Hxlpkhs
Hxl1,Lgmfl
Hxlbed,g
Hxl1,Lgmfl
Hxl1,Lgmflscfl
Hxl2,Lgmfl
Hxlscfl
scfl
Ck1
1
Ck1
1
kL
kD
J , for 0t > (Eq. D-39)
Given Hxl
1,Lgmflscfl
Hxl2,Lgmfl
Hxlscfl
HxlLgmfl
kL
kD
Z
⋅= (where scflL is the LDPE film thickness; 30µm); Hxl
LgmflZ and
Hxl1,Lgmflk were identified through fitting by minimising sum of squared residuals in Microsoft
Excel using steady-state flux data of the sachet system (Figure 6-17). Values of HxlLgmflZ
and Hxl1,Lgmflk are -1.26×10⁻⁴ mol·s-1·m-2 and 0.10 m3·mol-1, respectively.
D-8 Mathematical Modelling of Active Packaging Systems for Horticultural Products
To predict fluxes across LDPE films at 20ºC using Eq. D-39 for analysis of hexanal mass
loss (refer discussion in section 6.4.5.2), Hxlbed,gC and Hxl
pkhsC in Eq. D-39 were appropriately
substituted by Hxlconc,hC and Hxl
conc,lC , respectively.
Appendix E: Comparison of Hexanal Sorption Isotherms for Silica Gel
E-1
Appendix E
COMPARISON OF HEXANAL SORPTION ISOTHERM FOR
SILICA GEL ADSORBENTS ESTIMATED BY DIFFERENT
METHODS
E.1 Verification using IGC techniques
Two IGC techniques were investigated to collect hexanal sorption isotherm data in order to
verify those measured using the gravimetric method. The techniques included (i) pulse, and
(ii) frontal inverse gas chromatography. The principles of IGC can be found in a number of
reports in the literature (Apostolopoulos & Gilbert 1983; Apostolopoulos 1985;
Kontominas et al. 1994; Thielmann 2004). In both systems the absorbing compound of
interest is packed into a GC column as the stationary phase. In pulse IGC, a known amount
of the adsorbate is injected into the carrier before it flows through the stationery phase
(Thielmann 2004). The adsorbate subsequently adsorbs onto the stationaly phase and later
desorbs into the carrier steam. The key assumption of pulse IGC is that equilibrium is
achieved quickly between the adsorbate molecules on the surface of the stationery phase.
Frontal IGC (FIGC) involves the introduction of a continuous flow of adsorbate at a
constant concentration through the packed bed of adsorbent, by means of a gaseous carrier
as used in gas chromatography analysis (Thielmann 2004). After the adsorbate breaks
through (i.e. is detected in the outlet stream from the column), a frontal chromatogram is
developed and levels off at the plateau when an equilibrium condition is established
between the mobile and stationery phases. A key assumption of the FIGC technique is that
equilibrium can always be established due to its continuous nature.
E.2 Isotherm determination by pulse IGC method
E.2.1 Experimental procedures of pulse IGC
The pulse IGC experiments were performed with a gas chromatograph equipped with FID
(as used in Chapter 3), following the method of Lee (2003). The injector, detector, and
oven temperatures of the gas chromatograph were 200, 250, and 20ºC, respectively. The
GC grade stainless steel column (100 mm long and 6 mm outer diameter, Carlo Erba, Italy)
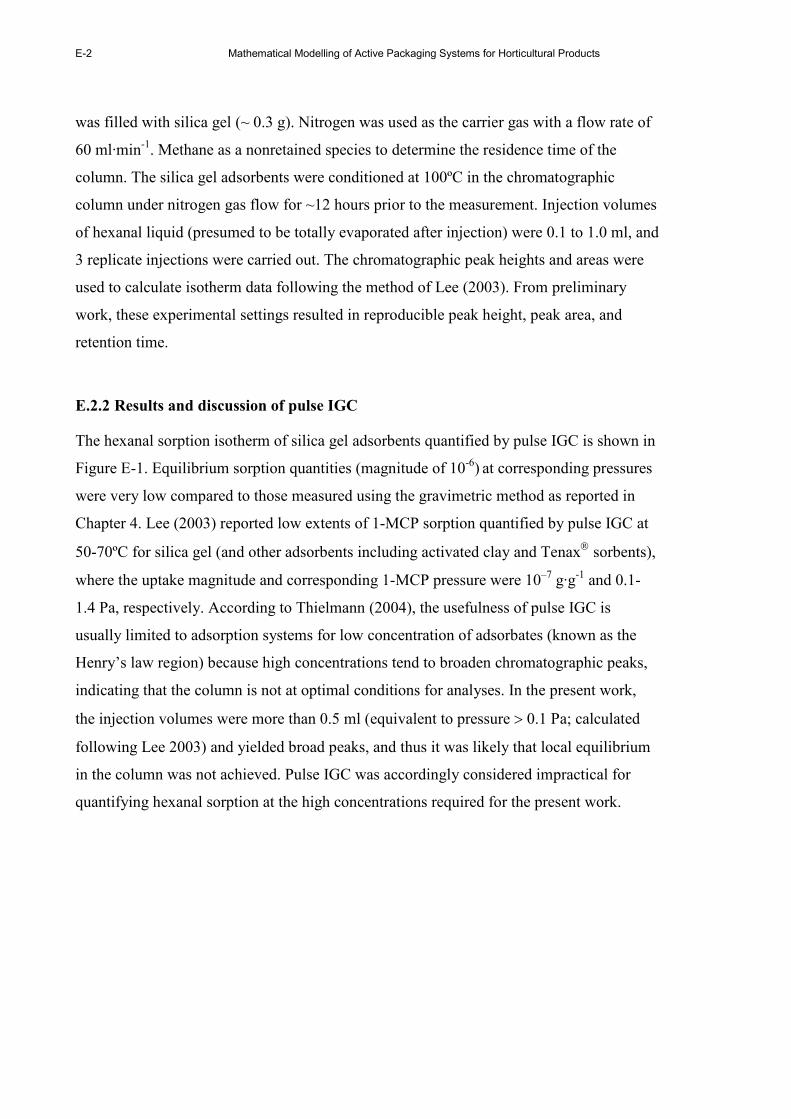
E-2 Mathematical Modelling of Active Packaging Systems for Horticultural Products
was filled with silica gel (~ 0.3 g). Nitrogen was used as the carrier gas with a flow rate of
60 ml·min-1. Methane as a nonretained species to determine the residence time of the
column. The silica gel adsorbents were conditioned at 100ºC in the chromatographic
column under nitrogen gas flow for ~12 hours prior to the measurement. Injection volumes
of hexanal liquid (presumed to be totally evaporated after injection) were 0.1 to 1.0 ml, and
3 replicate injections were carried out. The chromatographic peak heights and areas were
used to calculate isotherm data following the method of Lee (2003). From preliminary
work, these experimental settings resulted in reproducible peak height, peak area, and
retention time.
E.2.2 Results and discussion of pulse IGC
The hexanal sorption isotherm of silica gel adsorbents quantified by pulse IGC is shown in
Figure E-1. Equilibrium sorption quantities (magnitude of 10-6) at corresponding pressures
were very low compared to those measured using the gravimetric method as reported in
Chapter 4. Lee (2003) reported low extents of 1-MCP sorption quantified by pulse IGC at
50-70ºC for silica gel (and other adsorbents including activated clay and Tenax sorbents),
where the uptake magnitude and corresponding 1-MCP pressure were 10–7 g·g-1 and 0.1-
1.4 Pa, respectively. According to Thielmann (2004), the usefulness of pulse IGC is
usually limited to adsorption systems for low concentration of adsorbates (known as the
Henry’s law region) because high concentrations tend to broaden chromatographic peaks,
indicating that the column is not at optimal conditions for analyses. In the present work,
the injection volumes were more than 0.5 ml (equivalent to pressure > 0.1 Pa; calculated
following Lee 2003) and yielded broad peaks, and thus it was likely that local equilibrium
in the column was not achieved. Pulse IGC was accordingly considered impractical for
quantifying hexanal sorption at the high concentrations required for the present work.

Appendix E: Comparison of Hexanal Sorption Isotherms for Silica Gel
E-3
0.00 0.02 0.04 0.06 0.08 0.10
0
20
40
60
80
100
120
Uptake (x 10-6 g·g
-1)
Pressure (Pa)
Figure E-1 Hexanal sorption isotherm for silica gel at 20ºC (3 replicates shown for each
uptake) quantified by the Pulse IGC technique
E.3 Isotherm determination by frontal IGC method
E.3.1 Experimental procedures
Due to the limitations of pulse IGC, the frontal IGC method was evaluated. According to
Thielmann (2004), the peak broadening caused by the uneven distribution of adsorbate
within the column of the pulse technique could be minimised by using the frontal
technique, because a uniform amount of adsorbate is mixed with the gaseous carrier and
continuously introduced into the packed column.
The frontal IGC experimental settings and sorption isotherm calculations were performed
following Apostolopoulos & Gilbert (1983) and Apostolopoulos (1985). The IGC column
preparation and chromatographic operation conditions were similar to those reported for
pulse IGC. The continuous flow of the saturated hexanal vapour at 21-22ºC (slightly higher
than the oven temperature to minimise condensations occurring in the GC column) was
generated with flow rates of 20-22 ml·min-1 (controlled by the rotameter; Aalborg VA, US)
following the method of Bodenhofer et al. (1997). From preliminary work, these
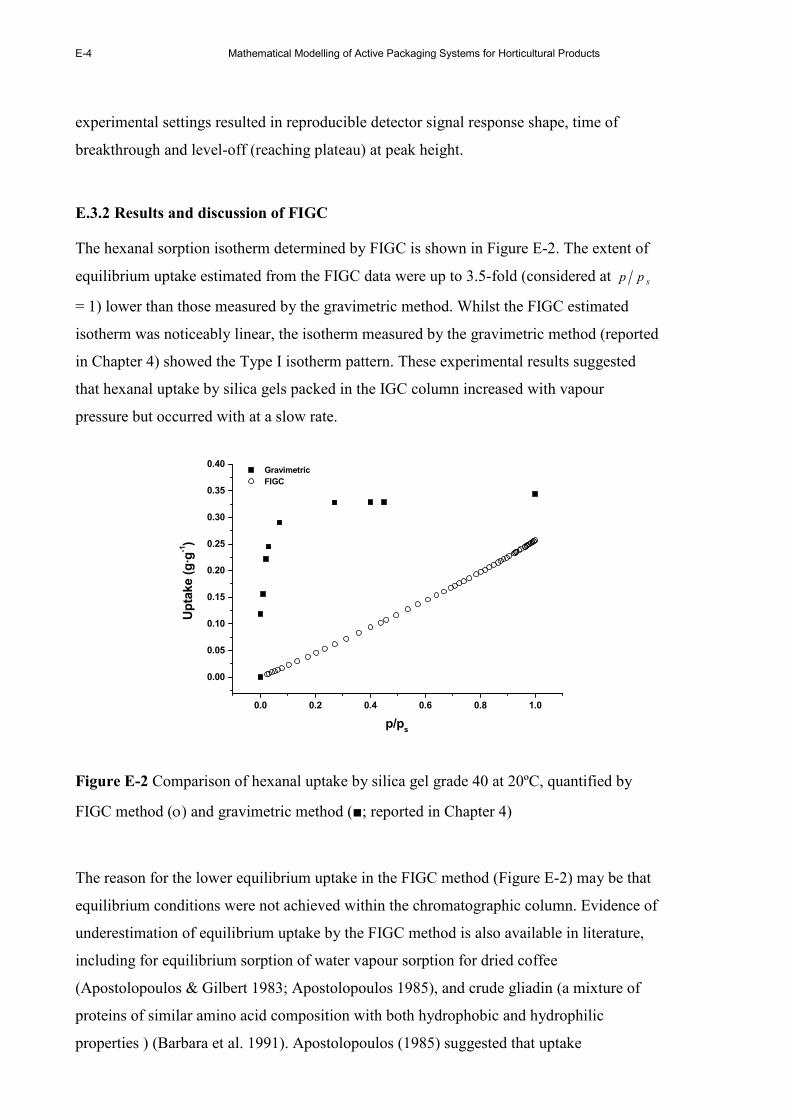
E-4 Mathematical Modelling of Active Packaging Systems for Horticultural Products
experimental settings resulted in reproducible detector signal response shape, time of
breakthrough and level-off (reaching plateau) at peak height.
E.3.2 Results and discussion of FIGC
The hexanal sorption isotherm determined by FIGC is shown in Figure E-2. The extent of
equilibrium uptake estimated from the FIGC data were up to 3.5-fold (considered at spp
= 1) lower than those measured by the gravimetric method. Whilst the FIGC estimated
isotherm was noticeably linear, the isotherm measured by the gravimetric method (reported
in Chapter 4) showed the Type I isotherm pattern. These experimental results suggested
that hexanal uptake by silica gels packed in the IGC column increased with vapour
pressure but occurred with at a slow rate.
0.0 0.2 0.4 0.6 0.8 1.0
0.00
0.05
0.10
0.15
0.20
0.25
0.30
0.35
0.40 Gravimetric
FIGC
Uptake (g·g
-1)
p/ps
Figure E-2 Comparison of hexanal uptake by silica gel grade 40 at 20ºC, quantified by
FIGC method (ο) and gravimetric method (■; reported in Chapter 4)
The reason for the lower equilibrium uptake in the FIGC method (Figure E-2) may be that
equilibrium conditions were not achieved within the chromatographic column. Evidence of
underestimation of equilibrium uptake by the FIGC method is also available in literature,
including for equilibrium sorption of water vapour sorption for dried coffee
(Apostolopoulos & Gilbert 1983; Apostolopoulos 1985), and crude gliadin (a mixture of
proteins of similar amino acid composition with both hydrophobic and hydrophilic
properties ) (Barbara et al. 1991). Apostolopoulos (1985) suggested that uptake

Appendix E: Comparison of Hexanal Sorption Isotherms for Silica Gel
E-5
underestimated by the frontal method at the low pressure region was because the solid
phase was not in equilibrium with the flow of adsorbate at the beginning of the sorption
process. A longer contact time between mobile and solid phase would provide better
equilibrium conditions because adsorbate molecules could have more opportunities to
penetrate deeper inside the particles and reach more available adsorption sites
(Apostolopoulos 1985). This proposition suggested that a lower flow rate of adsorbate may
be required for improving the equilibrium condition in the column. By lowering hexanal
flow rate from 20-22 to ~5-7 ml·min-1(the practical minimum using the apparatus used in
the present work), fluctuating vapour concentrations were found, which in turn caused
highly fluctuating chromatographic responses. Barbara et al. (1991) reported that even
when flow rates of water vapour were sufficiently low (as < 5 ml·min-1), evidence of non-
equilibrium condensation was still noticeable. Based on the findings in the present work
and evidence in the literature, FIGC was not considered reliable enough to provide
accurate sorption data for the hexanal/silica gel system.
Although quantifying hexanal sorption isotherm using the FIGC technique was not
practical here, there is evidence in the literature showing that FIGC is a promising tool to
quantify sorption isotherms (e.g. Apostolopoulos & Gilbert 1983; Apostolopoulos 1985;
Steffan & Akgerman 2001). To further investigate applications of FIGC, the acetaldehyde
sorption isotherm for silica gel at 14ºC as reported by Ghosh & Hines (1990) (also
discussed in Chapter 4) was used as a reference. The same experimental settings as utilised
for the hexanal experiments were employed for the acetaldehyde work. The saturated
acetaldehyde vapour was generated following the method of Bodenhofer et al. (1997) and
the flow rate was 5-7 ml·min-1. Unlike the behaviour for hexanal vapour, this flow rate
range yielded uniform inlet vapour concentrations, most likely because of the very high
vapour pressure of acetaldehyde (~80 kPa), compared to that of hexanal vapour (~1.1 kPa).
Figure E-3 illustrates the acetaldehyde sorption isotherm determined by FIGC and
compares this to the isotherm data reported by Ghosh & Hines (1990). The pattern of the
acetaldehyde sorption isotherm estimated by the FIGC method was similar to that of the
hexanal sorption isotherm, suggesting that equilibrium conditions between acetaldehyde
and silica gel packed in the column were still not fully developed. These findings
suggested that further studies are required to modify the current experimental settings to
achieve better estimations of uptake, especially at the low pressure regions.
E-6 Mathematical Modelling of Active Packaging Systems for Horticultural Products
As a result of these trials, IGC is not a suitable method for obtaining sorption isotherm data
for volatile compounds on carriers such as silica gel.
0.0 0.2 0.4 0.6 0.8 1.0
0.00
0.05
0.10
0.15
0.20
0.25
0.30 Literature data (gravimetric)
FIGC
Uptake (g·g
-1)
p/ps
Figure E-3 Comparison of acetaldehyde uptake by silica gel grade 40 at 14ºC, quantified
by the FIGC method (ο) and gravimetric method (■; as reported by Ghosh & Hines 1990)
E.4 Isotherm determinations by the volumetric sorption method
E.4.1 Experimental procedures
Equilibrium data for hexanal sorption by silica gels at 10 and 20ºC were also obtained
using volumetric sorption equipment (Autosorb-1; Quantachrome Inc., US). This work was
conducted by Quantachrome Inc. (Florida, US) as an independent study for verifying the
hexanal sorption isotherm. Sorption is determined in the Autosorb system by generating a
known vapour pressure of the volatile compound in a fixed volume and then allowing this
to become exposed to the sorbent. The amount of sorption or desorption is then calculated
from the change in vapour pressure measured in the system. The Autosorb-1 equipment
has been utilised to measured sorption isotherms of other systems for example hydrogen on
single walled carbon nanotubes (SWNTs) as reported by Ansón et al. (2004).
E.4.2 Results and discussion
Hexanal sorption isotherms (adsorption and desorption) at 10 and 20ºC quantified by the
volumetric method are shown in Figure E-4. Measured equilibrium data showed the Type I
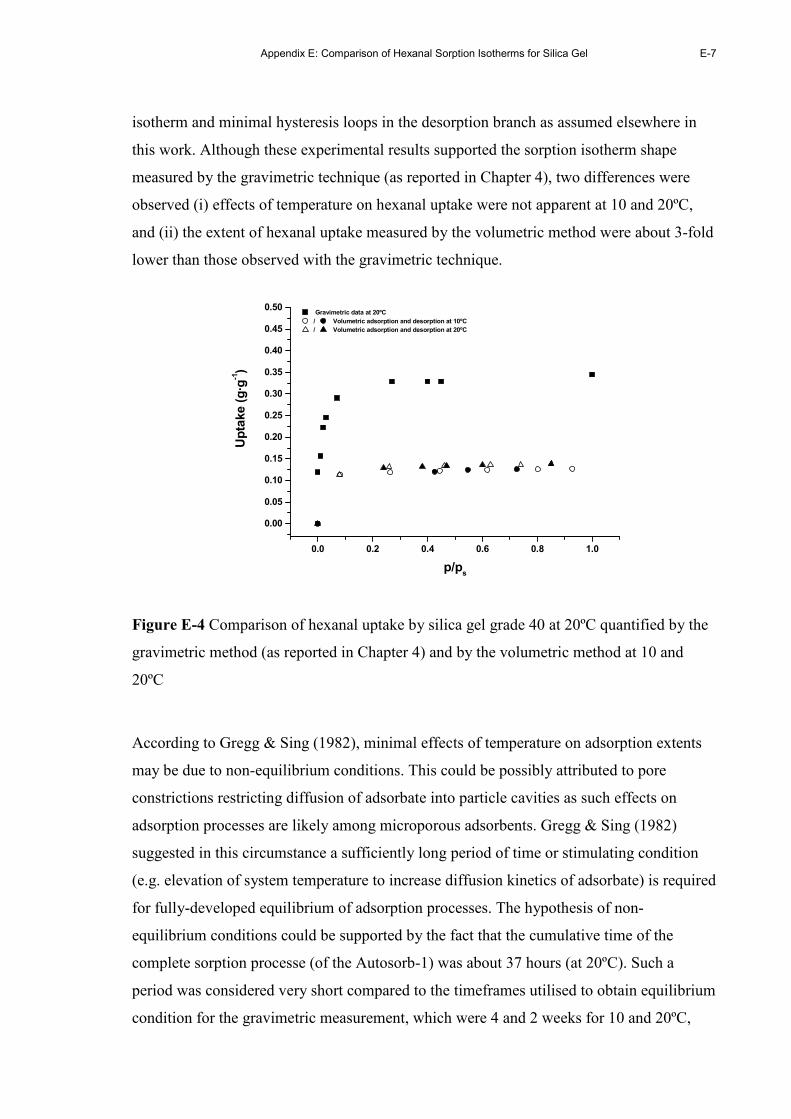
Appendix E: Comparison of Hexanal Sorption Isotherms for Silica Gel
E-7
isotherm and minimal hysteresis loops in the desorption branch as assumed elsewhere in
this work. Although these experimental results supported the sorption isotherm shape
measured by the gravimetric technique (as reported in Chapter 4), two differences were
observed (i) effects of temperature on hexanal uptake were not apparent at 10 and 20ºC,
and (ii) the extent of hexanal uptake measured by the volumetric method were about 3-fold
lower than those observed with the gravimetric technique.
0.0 0.2 0.4 0.6 0.8 1.0
0.00
0.05
0.10
0.15
0.20
0.25
0.30
0.35
0.40
0.45
0.50 Gravimetric data at 20ºC
/ Volumetric adsorption and desorption at 10ºC
/ Volumetric adsorption and desorption at 20ºC
Uptake (g·g
-1)
p/ps
Figure E-4 Comparison of hexanal uptake by silica gel grade 40 at 20ºC quantified by the
gravimetric method (as reported in Chapter 4) and by the volumetric method at 10 and
20ºC
According to Gregg & Sing (1982), minimal effects of temperature on adsorption extents
may be due to non-equilibrium conditions. This could be possibly attributed to pore
constrictions restricting diffusion of adsorbate into particle cavities as such effects on
adsorption processes are likely among microporous adsorbents. Gregg & Sing (1982)
suggested in this circumstance a sufficiently long period of time or stimulating condition
(e.g. elevation of system temperature to increase diffusion kinetics of adsorbate) is required
for fully-developed equilibrium of adsorption processes. The hypothesis of non-
equilibrium conditions could be supported by the fact that the cumulative time of the
complete sorption processe (of the Autosorb-1) was about 37 hours (at 20ºC). Such a
period was considered very short compared to the timeframes utilised to obtain equilibrium
condition for the gravimetric measurement, which were 4 and 2 weeks for 10 and 20ºC,

E-8 Mathematical Modelling of Active Packaging Systems for Horticultural Products
respectively. The longest cumulative time (i.e. 30 hours) was recorded at spp ≈ 0.1 and
this data supported the Type I equilibrium behaviour of hexanal sorption for silica gel
where most sorption processes occurred at low pressure. The hypothesis proposed in that
constriction effects yielded underestimates of uptake data from the volumetric method, and
improved estimates could be expected if the contact time between hexanal and silica gel
was increased.
In addition to limits of mass transfer within the adsorbent, Dixon (2007)12 suggested that
the volumetric method (Autosorb-1) was limited by condensation of hexanal vapour
among other key factors. Because the tubing and manifold systems of the Autosorb-1 could
be heated to only 50°C, the controlled temperature was well below the normal boiling
point of hexanal (~120°C), which was utilised to generate hexanal vapour. Condensation
occurring inside the tubing and manifold system was therefore likely. The condensed fluid
was not measured by the pressure transducers in the Autosorb-1, and was thus not correctly
considered in the uptake values and may subsequently yield the differences in hexanal
uptake observed. In addition to condensation, other potential factors contributing to
experimental errors include leakage from the sorption chamber, sorption into rubber seals,
and sample contamination. Sorption data obtained from the volumetric method were well
described by the Langmuir equation. The coefficients of the Langmuir equation estimated
by the nonlinear regression as discussed in Chapter 4 are summarised in Table E-1.
Table E-1 Parameter estimates and standard errors (SE) from nonlinear regression analysis
of the hexanal sorption isotherm data at 20ºC as measured by the volumetric-method
Temperatures (ºC) Hxlmax,sC (SE) a,b Hxl
Lgmb (SE)b n
c
20 d 0.14 (0.20) 53.06 (2.59) 6
a The standard errors (SE) are expressed as a percentage of the estimated values. The nonlinear regressions were conducted using the
Nonlinear Regression package of the Origin 5.0 (Microcal Software Inc.)
b Units of Hxlmax,sC and Hxl
Lgmb are g·g-1 and dimensionless, respectively
c n is the number of observations
d Because isotherm data at 10 and 20ºC are reasonably similar (refer to Figure E-4), only data at 20ºC therefore were chosen for the
nonlinear regression.
12 J. Dixon, a scientist, Quantachrome Instruments, Pers. Comm., February 2007
Appendix E: Comparison of Hexanal Sorption Isotherms for Silica Gel
E-9
The standard error of the HxlLgm
b value was lower than that found in data measured by the
gravimetric method as discussed in Chapter 4. From Figure E-4, it could be seen that the
magnitude of increases of hexanal uptake measured by the volumetric technique was
significantly lower than that measured by the gravimetric method and this could explain
the low variation associated with the estimated coefficients of the volumetric data.
Figure E-5 illustrates simulation results for hexanal accumulation in the package headspace
for the LD2 active MAP system without tomatoes (refer to Table 6-1). This system was use
as an example of how the predicted equilibrium vapour pressure in the sachet headspace
was influenced by the estimated coefficients in Table E-1 in comparison to results
predicted by the coefficients reported in Table 4-9. The mathematical models utilised for
these simulations are found in the computational files listed in sections G.1.1 and G.1.2.
Very similar results were obtained for both (i) package headspace concentration (also
showing reasonable agreement with experimental data) and (ii) equilibrium vapour
concentration in sachet headspace. These results suggested that both methods estimated
similar magnitudes for the reduction in the amount of adsorbed hexanal on silica gel over
the storage period. This is expected because of the similar shape between the two
isotherms. The sachet weight however would be underestimated if the volumetric data is
used. Given minimal condensation effects and fully developed equilibrium condition, it
could reasonably be assumed that hexanal uptake measured using the volumetric method
should be comparable to those measured using the gravimetric method. The gravimetric
sorption isotherm was extensively used in the present work because it was appeared more
reliable.

E-10 Mathematical Modelling of Active Packaging Systems for Horticultural Products
0 1 2 3 4 5 6 70
500
1000
1500
2000
2500
Storage days
Package headspace concentration (ppm)
Empirical data
Gravimetric
Volumetric
(A)
0 1 2 3 4 5 6 70
2000
4000
6000
8000
10000
12000
Storage days
Hexanal concentration in sachet headsapce (ppm)
Gravimetric
Volumetric
(B)
Figure E-5 Predictions of hexanal concentration in package headspace (A) and
equilibrium hexanal vapour in sachet headspace (B) in a model active package (without
packaged tomatoes), kept at 20ºC during 7 days, using Langmuir model coefficients which
were obtained from gravimetric (solid line) and the volumetric (Autosorb-1 instrument;
dotted line) sorption isotherms.
Appendix E: Comparison of Hexanal Sorption Isotherms for Silica Gel
E-11
E.5 Linearisation of Langmuir model (following Ratkowsky 1990)
To enable accurate isotherm parameter fitting, the Langmuir model was linearised
following the methods outlined by Ratkowsky (1990). A re-parameterisation of the
Langmuir model can be expressed as Eq. E-1.
( )( )s21
sHxlbed,s
pp
pp
C
θθ +=
(Eq. E-1)
where
HxlLgm
Hxlmax,s
1bC
1=θ (Eq. E-2)
HxlsC max,
2
1=θ (Eq. E-3)
By rearranging Eq. E-1, a linear form can be obtained as shown in Eq. E-4.
( )s21Hxlbed,s
s
pp
C
pp
θθ += (Eq. E-4)
Plots of Hxlbed,s
s
C
pp
against spp of hexanal sorption isotherm data at 10 and 20°C are shown
in Figure E-6. Langmuir model coefficients estimated using linear regression following the
reparameterisation proposed by Ratkowsky (1990) are summarised in Table E-2.
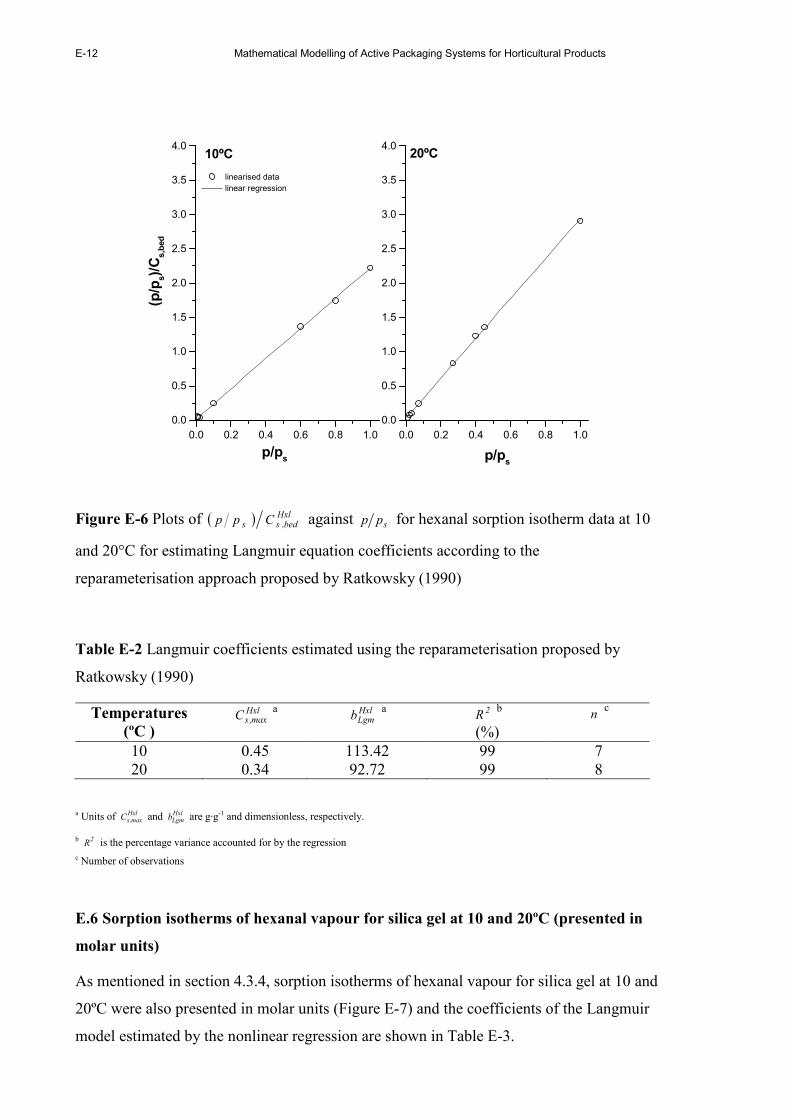
E-12 Mathematical Modelling of Active Packaging Systems for Horticultural Products
0.0 0.2 0.4 0.6 0.8 1.0
0.0
0.5
1.0
1.5
2.0
2.5
3.0
3.5
4.0(p/p
s)/Cs,bed
20ºC
linearised data
linear regression
p/ps
0.0 0.2 0.4 0.6 0.8 1.0
0.0
0.5
1.0
1.5
2.0
2.5
3.0
3.5
4.010ºC
p/ps
Figure E-6 Plots of ( ) Hxlbed,ss Cpp against spp for hexanal sorption isotherm data at 10
and 20°C for estimating Langmuir equation coefficients according to the
reparameterisation approach proposed by Ratkowsky (1990)
Table E-2 Langmuir coefficients estimated using the reparameterisation proposed by
Ratkowsky (1990)
Temperatures
(ºC )
Hxlmax,sC a Hxl
Lgmb a 2R b (%)
n c
10 0.45 113.42 99 7 20 0.34 92.72 99 8
a Units of Hxlmax,sC and Hxl
Lgmb are g·g-1 and dimensionless, respectively.
b 2R is the percentage variance accounted for by the regression
c Number of observations
E.6 Sorption isotherms of hexanal vapour for silica gel at 10 and 20ºC (presented in
molar units)
As mentioned in section 4.3.4, sorption isotherms of hexanal vapour for silica gel at 10 and
20ºC were also presented in molar units (Figure E-7) and the coefficients of the Langmuir
model estimated by the nonlinear regression are shown in Table E-3.
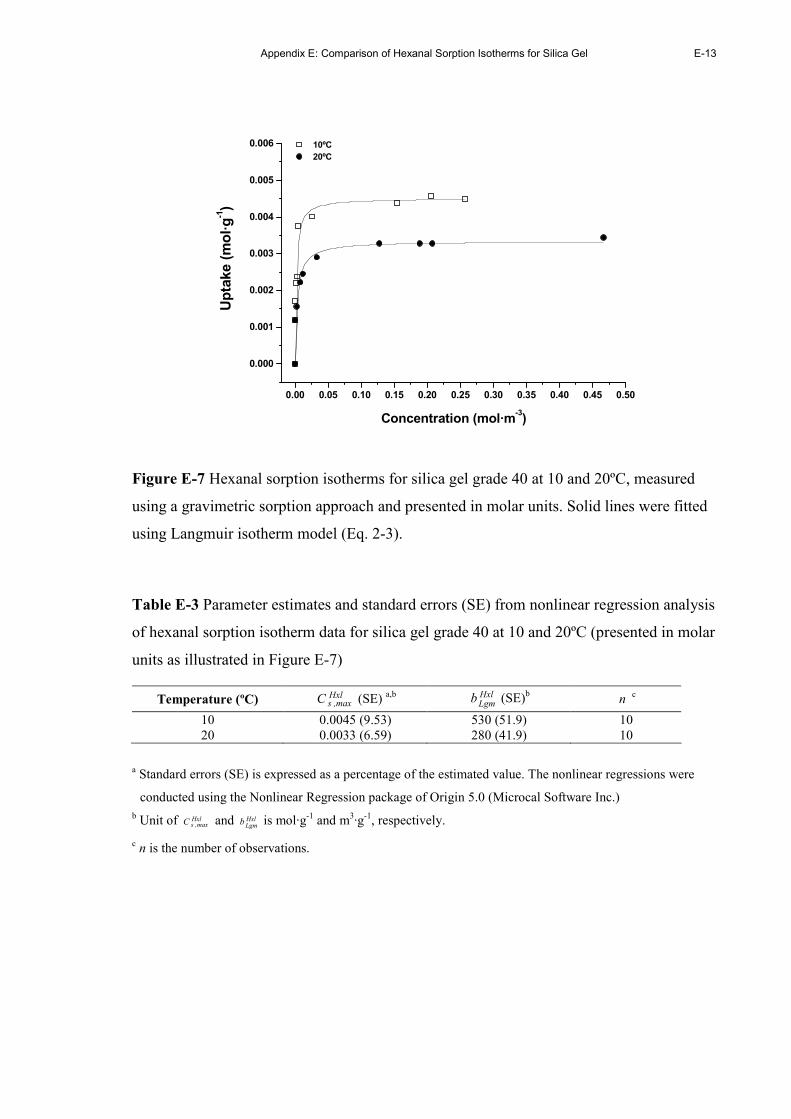
Appendix E: Comparison of Hexanal Sorption Isotherms for Silica Gel
E-13
0.00 0.05 0.10 0.15 0.20 0.25 0.30 0.35 0.40 0.45 0.50
0.000
0.001
0.002
0.003
0.004
0.005
0.006 10ºC
20ºC
Uptake (mol·g-1)
Concentration (mol·m-3)
Figure E-7 Hexanal sorption isotherms for silica gel grade 40 at 10 and 20ºC, measured
using a gravimetric sorption approach and presented in molar units. Solid lines were fitted
using Langmuir isotherm model (Eq. 2-3).
Table E-3 Parameter estimates and standard errors (SE) from nonlinear regression analysis
of hexanal sorption isotherm data for silica gel grade 40 at 10 and 20ºC (presented in molar
units as illustrated in Figure E-7)
Temperature (ºC) Hxlmax,sC (SE) a,b Hxl
Lgmb (SE)b n
c
10 0.0045 (9.53) 530 (51.9) 10 20 0.0033 (6.59) 280 (41.9) 10
a Standard errors (SE) is expressed as a percentage of the estimated value. The nonlinear regressions were
conducted using the Nonlinear Regression package of Origin 5.0 (Microcal Software Inc.)
b Unit of Hxlmax,sC and Hxl
Lgmb is mol·g-1 and m3·g-1, respectively.
c n is the number of observations.

E-14 Mathematical Modelling of Active Packaging Systems for Horticultural Products

Appendix F: Formulations of Global Mathematical Models
F-1
Appendix F
FORMULATION OF GLOBAL MATHEMATICAL MODELS
F.1 Calculations of Bi values for hexanal mass transfer in sachet and package
headspace
To justify the uniformity of hexanal concentration in sachet and package headspace, Bi
values were estimated using Eq. 5-2 and are summarised in Table F-1.
Table F-1 Estimated Bi values for diffusion of hexanal in sachet and package atmosphere
Temperature (ºC)
10 20 Packaging Films
L a (m) Hxlfilmk b (m·s-1) Bi c
Hxlfilmk b (m·s-1) Bi c
Sachet LDPE 0.002 4.62 × 10⁻⁶ 0.002 3.83 × 10⁻⁵ 0.013
OPP " 4.62 × 10⁻⁷ 0.0002 9.80 × 10⁻⁷ 0.0003
Tyvek " 4.59 × 10⁻⁴ 0.168 d 1.37 × 10⁻³ 0.470 d
Package d LDPE 0.009 4.62 × 10⁻⁶ 0.01 3.82 × 10⁻⁵ 0.05
a Because the sachet headspace was considered relatively small and the sachet was essentially flat, if there was no constraint from carrier
bed which was practically loose and arranged in one layer configuration. Based on this, the characteristic length ( L ) of diffusion
through the bed was designated as the average gel particle diameter (i.e. 1.70-3.35 mm particle) representing the conservative distance
of molecular diffusion through the bed (from the bottom to the upper film). For diffusion mass transfer in the package headspace, the
value of L for identifying Bi was determined following Geankoplis (1993c), as ratios of package volume to package surface area of
0.0012 m3 and 0.125 m2, respectively.
b Permeability ( Hxlfilmk ) was estimated as the averaged value of data presented in Figure 4-2, at determined temperatures.
c Bi values were calculated according to Eq. 5-2. Hexanal mass diffusivity ( Hxl
airD ) in air at 10 and 20ºC was estimated using a
correlation proposed by Fuller, Schettler, and Giddings (Johnson 1999) were 7.15 × 10⁻⁶ and 7.60 × 10⁻⁶ m2⋅s-1, respectively. d As Bi values of Tyvek sachet system were > 0.1, validity of an assumption on uniform hexanal vapour concentration in sachet
headspace was considered and discussed in section 5.5.1.1.
e Packaging films for the active packaging systems were limited to LDPE film.
F.2 Scaling analyses
Scaling analyses (Krantz 2007) can assist decision-making in selecting which modelling
approaches, (e.g. unsteady (Fick’s second law) or steady-state (Fick’s first law)) are best
suited to simulate mass transfer processes. Scaling analysis is used here to identify the
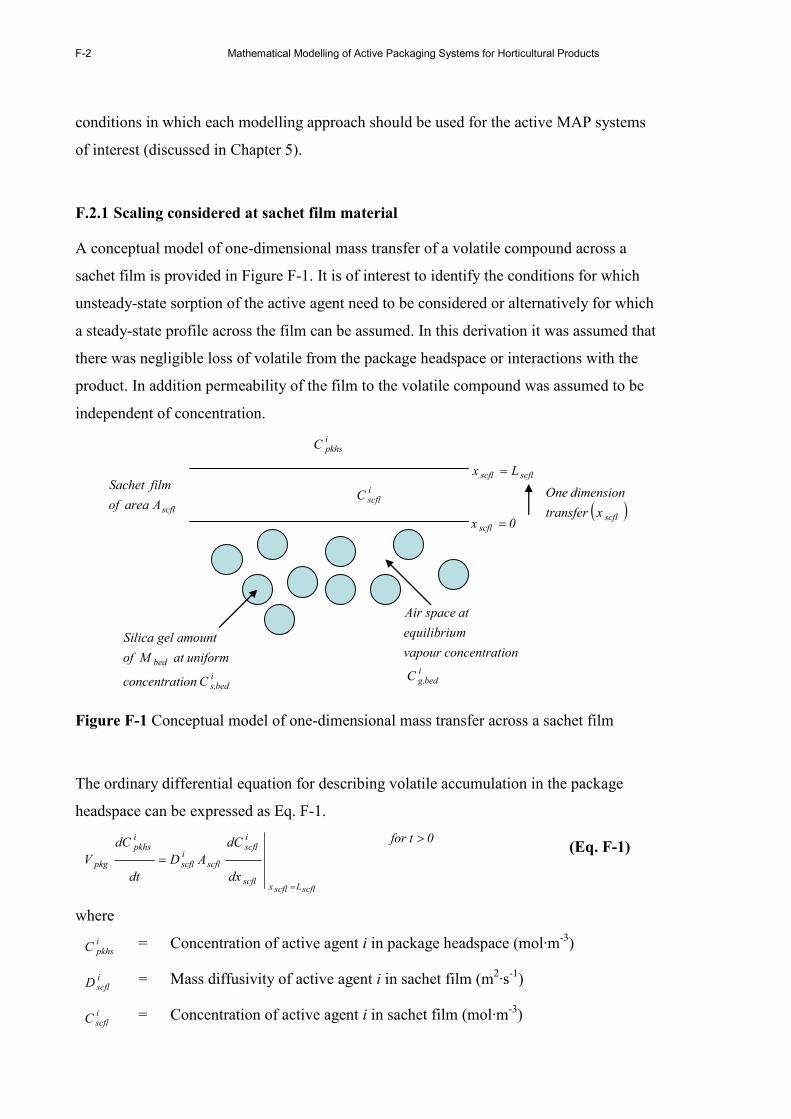
F-2 Mathematical Modelling of Active Packaging Systems for Horticultural Products
conditions in which each modelling approach should be used for the active MAP systems
of interest (discussed in Chapter 5).
F.2.1 Scaling considered at sachet film material
A conceptual model of one-dimensional mass transfer of a volatile compound across a
sachet film is provided in Figure F-1. It is of interest to identify the conditions for which
unsteady-state sorption of the active agent need to be considered or alternatively for which
a steady-state profile across the film can be assumed. In this derivation it was assumed that
there was negligible loss of volatile from the package headspace or interactions with the
product. In addition permeability of the film to the volatile compound was assumed to be
independent of concentration.
scflscfl Lx =
0x scfl =
iscflC
( )scflx transfer
dimension One
scflA area of
film achetS
ipkhsC
ibedg,C
ionconcentrat vapour
mequilibriu
at spaceAir
ibeds,
bed
C ionconcentrat
uniform at Mof
amount gel Silica
Figure F-1 Conceptual model of one-dimensional mass transfer across a sachet film
The ordinary differential equation for describing volatile accumulation in the package
headspace can be expressed as Eq. F-1.
scflLscflxscfl
iscfl
scfliscfl
ipkhs
pkg
dx
dC
AD
dt
dC
V
=
=
0t for > (Eq. F-1)
where
ipkhsC = Concentration of active agent i in package headspace (mol·m-3)
iscflD = Mass diffusivity of active agent i in sachet film (m2·s-1)
iscflC = Concentration of active agent i in sachet film (mol·m-3)
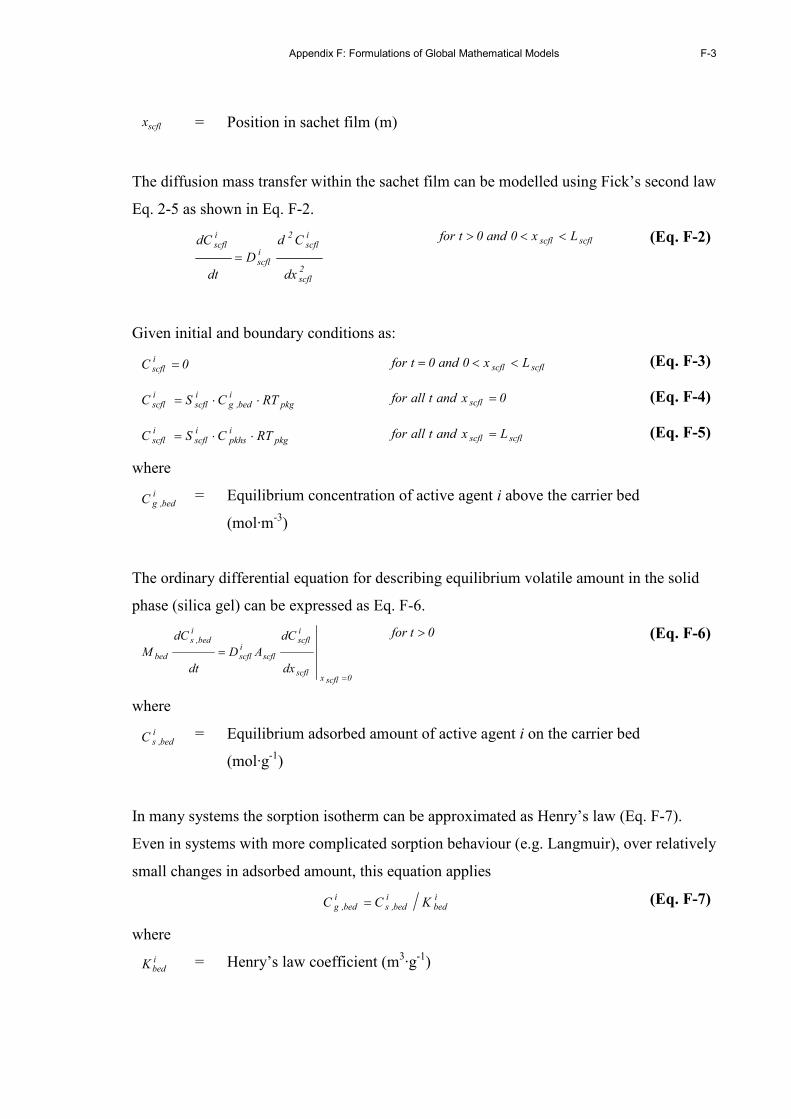
Appendix F: Formulations of Global Mathematical Models
F-3
scflx = Position in sachet film (m)
The diffusion mass transfer within the sachet film can be modelled using Fick’s second law
Eq. 2-5 as shown in Eq. F-2.
2scfl
iscfl
2
iscfl
iscfl
dx
Cd
D
dt
dC
= scflscfl Lx0and0tfor <<> (Eq. F-2)
Given initial and boundary conditions as:
0Ciscfl = scflscfl Lx0and0tfor <<= (Eq. F-3)
pkgibed,g
iscfl
iscfl RTCS C ⋅⋅= 0xandtallfor scfl = (Eq. F-4)
pkgipkhs
iscfl
iscfl RTCS C ⋅⋅= scflscfl Lxandtallfor = (Eq. F-5)
where
ibed,gC = Equilibrium concentration of active agent i above the carrier bed
(mol·m-3)
The ordinary differential equation for describing equilibrium volatile amount in the solid
phase (silica gel) can be expressed as Eq. F-6.
0scflxscfl
iscfl
scfliscfl
ibed,s
bed
dx
dC
AD
dt
dC
M
=
= 0t for > (Eq. F-6)
where
ibed,sC = Equilibrium adsorbed amount of active agent i on the carrier bed
(mol·g-1)
In many systems the sorption isotherm can be approximated as Henry’s law (Eq. F-7).
Even in systems with more complicated sorption behaviour (e.g. Langmuir), over relatively
small changes in adsorbed amount, this equation applies
ibed
ibed,s
ibed,g KCC = (Eq. F-7)
where
ibedK = Henry’s law coefficient (m3·g-1)
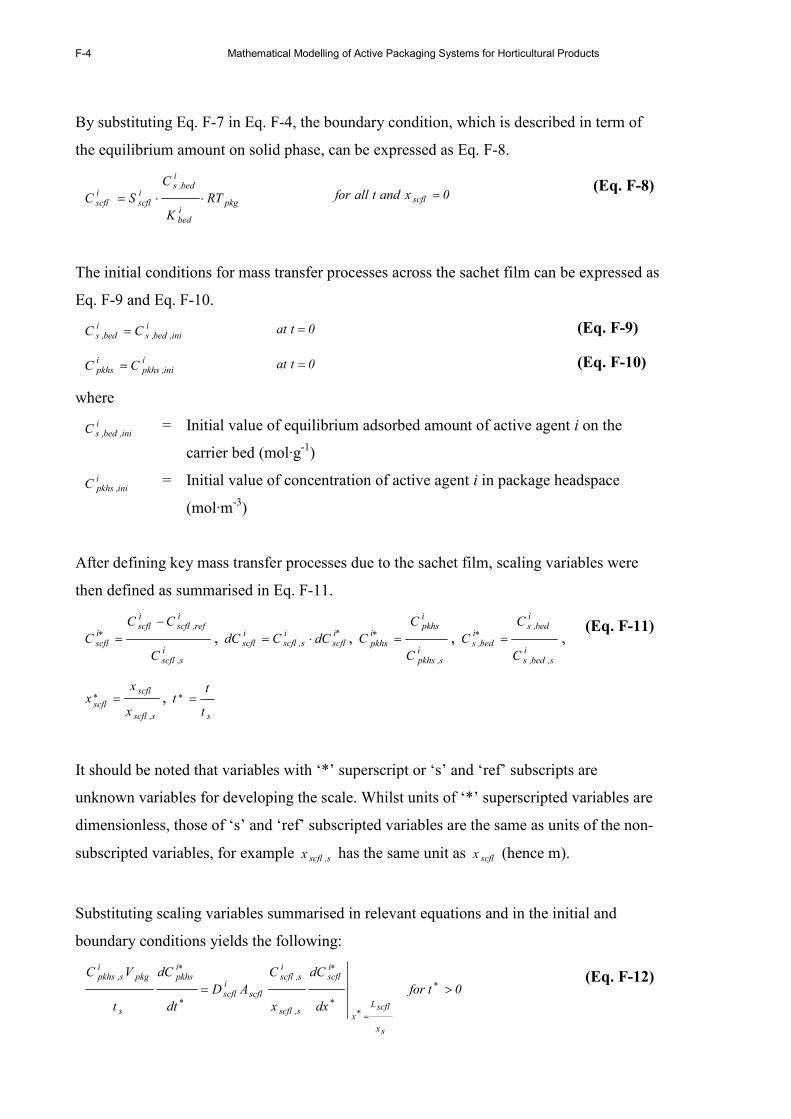
F-4 Mathematical Modelling of Active Packaging Systems for Horticultural Products
By substituting Eq. F-7 in Eq. F-4, the boundary condition, which is described in term of
the equilibrium amount on solid phase, can be expressed as Eq. F-8.
pkgibed
ibed,s
iscfl
iscfl RT
K
C
S C ⋅⋅= 0xandtallfor scfl = (Eq. F-8)
The initial conditions for mass transfer processes across the sachet film can be expressed as
Eq. F-9 and Eq. F-10.
iini,bed,s
ibed,s CC = 0tat = (Eq. F-9)
iini,pkhs
ipkhs CC = 0tat = (Eq. F-10)
where
iini,bed,sC = Initial value of equilibrium adsorbed amount of active agent i on the
carrier bed (mol·g-1)
iini,pkhsC = Initial value of concentration of active agent i in package headspace
(mol·m-3)
After defining key mass transfer processes due to the sachet film, scaling variables were
then defined as summarised in Eq. F-11.
is,scfl
iref,scfl
iscfl
iscfl
C
CC
C
−=∗ , *i
scfli
s,scfliscfl dCCdC ⋅= ,
is,pkhs
ipkhs
ipkhs
C
C
C =∗ , i
s,bed,s
ibed,s
ibed,s
C
C
C =∗ ,
s,scfl
scfl
scflx
xx =∗ ,
st
tt =∗
(Eq. F-11)
It should be noted that variables with ‘*’ superscript or ‘s’ and ‘ref’ subscripts are
unknown variables for developing the scale. Whilst units of ‘*’ superscripted variables are
dimensionless, those of ‘s’ and ‘ref’ subscripted variables are the same as units of the non-
subscripted variables, for example s,scflx has the same unit as scflx (hence m).
Substituting scaling variables summarised in relevant equations and in the initial and
boundary conditions yields the following:
sx
scflL
x
iscfl
s,scfl
is,scfl
scfliscfl
ipkhs
s
pkgi
s,pkhs
dx
dC
x
C
AD
dt
dC
t
VC
=∗∗
∗
∗
∗
= 0t for >∗ (Eq. F-12)
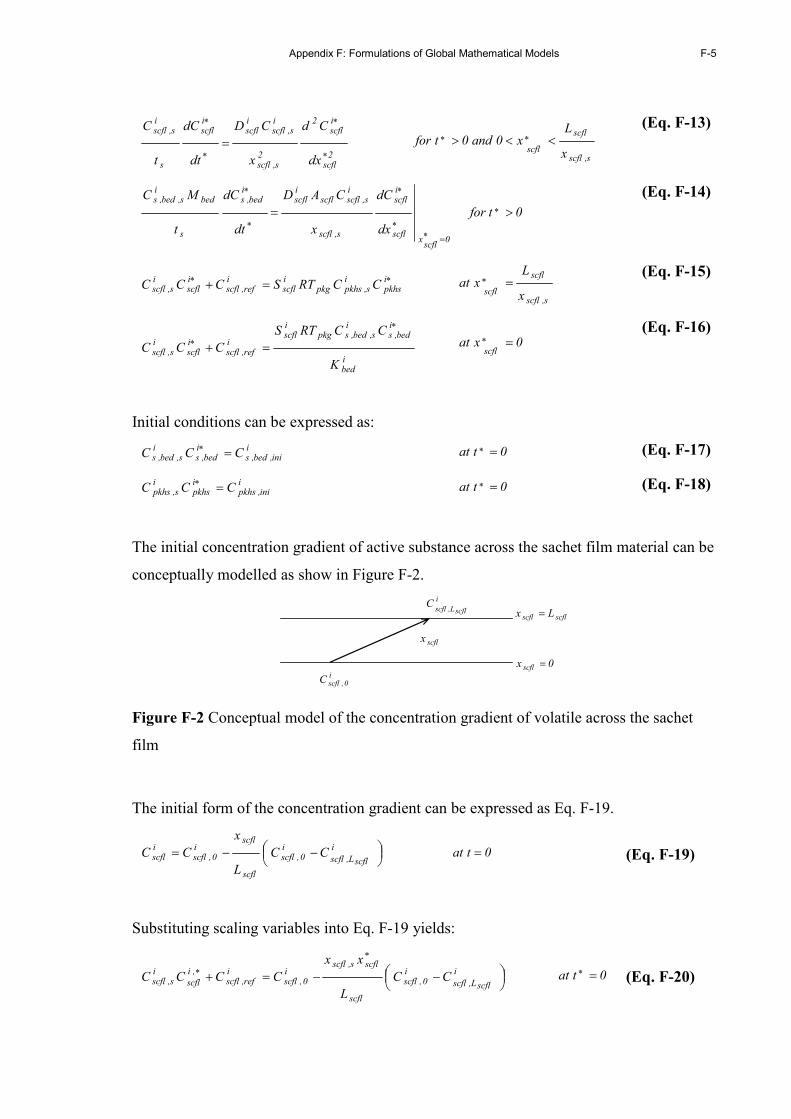
Appendix F: Formulations of Global Mathematical Models
F-5
2scfl
iscfl
2
2s,scfl
is,scfl
iscfl
iscfl
s
is,scfl
dx
Cd
x
CD
dt
dC
t
C
∗
∗
∗
∗
= s,scfl
scfl
scfl x
Lx0and0tfor <<> ∗∗
(Eq. F-13)
0scfl
xscfl
iscfl
s,scfl
is,scflscfl
iscfl
ibed,s
s
bedi
s,bed,s
dx
dC
x
CAD
dt
dC
t
MC
=∗∗
∗
∗
∗
= 0t for >∗
(Eq. F-14)
∗∗ =+ ipkhs
is,pkhspkg
iscfl
iref,scfl
iscfl
is,scfl CCRTSCCC
s,scfl
scfl
scfl x
Lxat =∗
(Eq. F-15)
ibed
ibed,s
is,bed,spkg
iscfl
iref,scfl
iscfl
is,scfl
K
CCRTS
CCC
∗
∗ =+ 0xatscfl
=∗ (Eq. F-16)
Initial conditions can be expressed as:
iini,bed,s
ibed,s
is,bed,s CCC =∗ 0tat =∗ (Eq. F-17)
iini,pkhs
ipkhs
is,pkhs CCC =∗ 0tat =∗ (Eq. F-18)
The initial concentration gradient of active substance across the sachet film material can be
conceptually modelled as show in Figure F-2.
i
scflL,scflC
i0,scflC
scflscfl Lx =
0x scfl =
scflx
Figure F-2 Conceptual model of the concentration gradient of volatile across the sachet
film
The initial form of the concentration gradient can be expressed as Eq. F-19.
−−= i
scflL,scfl
i0,scfl
scfl
scfli
0,scfliscfl CC
L
x
CC 0tat = (Eq. F-19)
Substituting scaling variables into Eq. F-19 yields:
−−=+
∗
∗ i
scflL,scfl
i0,scfl
scfl
scfls,scfli
0,scfli
ref,scfl,i
scfl
is,scfl CC
L
xx
CCCC 0tat * = (Eq. F-20)
F-6 Mathematical Modelling of Active Packaging Systems for Horticultural Products
Eq. F-12 to Eq. F-14, were divided through by scaling variables, to yield Eq. F-21 to Eq.
F-23, respectively:
s,scflx
scflL
scflx
iscfl
ipkhs
sscfliscfl
is,scfl
s,scflpkgi
s,pkhs
dx
dC
dt
dC
tADC
xVC
=∗∗
∗
∗
∗
= 0tfor >∗ (Eq. F-21)
2scfl
iscfl
2iscfl
siscfl
2s,scfl
dx
Cd
dt
dC
tD
x
∗
∗
∗
∗
= s,scfl
scfl
scfl x
Lx0and0tfor <<> ∗∗
(Eq. F-22)
0scfl
xscfl
iscfl
ibed,s
sscfliscfl
scflbed
is,scfl
is,bed,s
dx
dC
dt
dC
tAD
xM
C
C
=∗∗
∗
∗
∗
= 0tfor >∗ (Eq. F-23)
After rearranging the dimensionless equations, the scale factors are then determined.
Because scflx varies from 0 to scflL , ∗scfl
x varies from 0 to 1. Then value of s,scflx can be
determined as equal to scflL as demonstrated in Eq. F-24.
s,scfl
scfl
scflx
L1x ==∗ therefore scfls,scfl Lx = (Eq. F-24)
Substituting Eq. F-24 in the dimensionless concentration gradient Eq. F-20 yields Eq. F-25.
−−=+ ∗∗ i
scflL,scfl
i0,scflscfl
i0,scfl
iref,scfl
iscfl
is,scfl CCxCCCC (Eq. F-25)
By defining 1Ciscfl ≈∗ at 0x scfl =
∗ , then Eq. F-25 becomes Eq. F-26.
i0,scfl
iref,scfl
is,scfl CCC =+ (Eq. F-26)
Similarly by defining 0Ciscfl =∗ at 1x scfl =
∗ , Eq. F-25 becomes Eq. F-27.
i
scflL,scfl
iref,scfl CC = (Eq. F-27)
Substituting Eq. F-27 into Eq. F-26 yields Eq. F-28.
−= i
scflL,scfl
i0,scfl
is,scfl CCC (Eq. F-28)
Appendix F: Formulations of Global Mathematical Models
F-7
Considering the boundary condition at 1xscfl
=∗ (Eq. F-15 provided scfls,scfl Lx = ), it can be
defined that 1Ciscfl =∗ when 1C
ipkhs =∗ . By substituting these defined values and together with
Eq. F-27 and Eq. F-28 in Eq. F-15, Eq. F-29 is obtained.
pkgi
s,pkhsiscfl
i
scflL,scfl
i
scflL,scfl
i0,scfl RTCSCCC =+
− (Eq. F-29)
Rearranging Eq. F-29 yields Eq. F-30.
pkgiscfl
i0,scfl
is,pkhs
RTS
C
C = (Eq. F-30)
Considering the boundary condition at 0xscfl
=∗ Eq. F-16, it can be defined that 1Cibed,s =∗
when 1Ciscfl =∗ . Substituting these defined values in Eq. F-16 yields the following:
ibed
is,bed,spkg
iscfl
iref,scfl
is,scfl
K
CRTS
CC =+ (Eq. F-31)
Substituting Eq. F-26 in Eq. F-31 yields Eq. F-32.
ibed
is,bed,spkg
iscfl
i0,scfl
K
CRTS
C = (Eq. F-32)
By rearranging Eq. F-32, the value of is,bed,sC can be identified as shown in Eq. F-33.
pkgiscfl
ibed
i0,scfl
is,bed,s
RTS
KC
C = (Eq. F-33)
The value of st can be defined as equal to 0t (representing observation or contact time) as
shown in Eq. F-34.
0s tt = (Eq. F-34)
By substituting defined scaling factors into dimensionless equations and the initial and
boundary conditions, the following equations are obtained:
F-8 Mathematical Modelling of Active Packaging Systems for Horticultural Products
• Dimensionless ODE of package headspace
1scfl
x
iscfl
ipkhs
0scfliscfl
i
scflL,scfl
i0,scflpkg
iscfl
scflpkgi
0,scfl
dx
dC
dt
dC
tADCCRTS
LVC
=∗∗
∗
∗
∗
=
−
0tfor >∗
(Eq. F-35)
• Dimensionless PDE of sachet film
2scfl
iscfl
2iscfl
0iscfl
2scfl
dx
Cd
dt
dC
tD
L
∗
∗
∗
∗
= 1x0and0tforscfl
<<> ∗∗ (Eq. F-36)
• Dimensionless ODE of silica gel
0xscfl
iscfl
ibed,s
0scfliscfl
scflbed
i
scflL,scfl
i0,scflpkg
iscfl
ibed
i0,scfl
dx
dC
dt
dC
tAD
LM
CCRTS
KC
=∗∗
∗
∗
∗
=
−
0tfor >∗
(Eq. F-37)
• Initial conditions
For ibed,sC at 0t = :
By substituting Eq. F-33 to Eq. F-17, the initial value of ibed,sC can be expressed as Eq.
F-38.
ibed
i0,scfl
pkgiscfl
iini,bed,s
*ibed,s
KC
RTSC
C = 0t at =∗ (Eq. F-38)
For ipkhsC at 0t = :
By substituting Eq. F-30 in Eq. F-11, the initial value of i
pkhsC can be expressed as Eq.
F-39.
i0,scfl
pkgiscfl
iini,pkhs
*ipkhs
C
RTSC
C = 0t at =∗ (Eq. F-39)
For the initial concentration gradient (Eq. F-25) at 0t = : Substituting Eq. F-27 and Eq.
F-28 in Eq. F-25 yields Eq. F-40.
Appendix F: Formulations of Global Mathematical Models
F-9
−−
−=
− ∗∗ i
scflL,scfl
i0,scflscfl
i
scflL,scfl
i0,scfl
iscfl
i
scflL,scfl
i0,scfl CCxCCCCC
0t at =∗
(Eq. F-40)
By further rearranging Eq. F-40 where both sides of the equation are divided by
− i
scflL,scfl
i0,scfl CC , Eq. F-41 is obtained.
∗∗ −= scfliscfl x1C 0t at =∗ (Eq. F-41)
The summary of dimensionless models can be expressed as the following:
• Dimensionless ODE for package headspace
1scfl
x
iscfl
ipkhs
0scfliscfl
i
scflL,scfl
i0,scflpkg
iscfl
scflpkgi
0,scfl
dx
dC
dt
dC
tADCCRTS
LVC
=∗∗
∗
∗
∗
=
−
0tfor >∗
• Dimensionless PDE for sachet film
2scfl
iscfl
2iscfl
0iscfl
2scfl
dx
Cd
dt
dC
tD
L
∗
∗
∗
∗
= 1x0and0tforscfl
<<> ∗∗
• Dimensionless ODE for silica gel
0xscfl
iscfl
ibed,s
0scfliscfl
scflbed
i
scflL,scfl
i0,scflpkg
iscfl
ibed
i0,scfl
dx
dC
dt
dC
tAD
LM
CCRTS
KC
=∗∗
∗
∗
∗
=
−
0tfor >∗
• Dimensionless initial conditions
ibed
i0,scfl
pkgiscfl
iini,bed,s
*ibed,s
KC
RTSC
C = 0t at =∗
i0,scfl
iini,pkhspkg
iscfl
ipkhs
C
CRTS
C =∗ 0t at =∗
∗∗ −= scfliscfl x1C 0t at =∗
As the rate of concentration change is a function of the reciprocal of the system capacity
(Levenspiel 1972), the relative rate of two systems can be determined by comparing the
F-10 Mathematical Modelling of Active Packaging Systems for Horticultural Products
reciprocal of each system capacity. Therefore (i) relative rate in sachet film and silica gel
bed and (ii) relative rate in sachet film and package headspace can be expressed as Eq. F-
42 and Eq. F-43, respectively.
−⋅==
∗∗
∗∗
i
scflL,scfl
i0,scfl
i0,scfl
scflpkgiscflscfl
bedibed
bed
scfl
ibed,s
iscfl
CC
C
ARTSL
MK
r
r
dtdC
dtdC
(Eq. F-42)
−⋅==
∗∗
∗∗
i
scflL,sch
i0,scfl
i0,scfl
scflpkgiscflscfl
pkg
pkhs
scfl
ipkhs
iscfl
CC
C
ARTSL
V
r
r
dtdC
dtdC
(Eq. F-43)
Eq. F-42 and Eq. F-43 can be used to determine the need to model transport of volatile
through the sachet film as a dynamic or equilibrium process.
As mentioned in section 5.5.1.2, ratio of carrier bed capacity to sachet film capacity
(denoted as scflbedCR ) and ratio of package headspace capacity to that of the sachet film
(denoted as scflpkhsCR ) can be described by Eq. F-44 and Eq. F-45, respectively.
⋅=
scflpkgiscflscfl
bedibed
scflbed
ARTSL
MK
CR (Eq. F-44)
scflpkgiscflscfl
pkg
scflpkhs
ARTSL
V
CR = (Eq. F-45)
F.2.2 Scaling considered at packaging film
The importance of the dynamics of the outer packaging film absorption can be assessed
using a similar approach. The conceptual model for mass transfer across the packaging
film, of an active packaging system containing a controlled released sachet, is provided as
in Figure F-3. In this exercise, the release of volatile into the package headspace is
modelled assuming steady-state is achieved instaneously through the sachet film and the
concentration in the sachet headspace is constant. No absorption or product interactions are
considered. In addition permeability of the film to the volatile compound was assumed to
be independent of concentration.
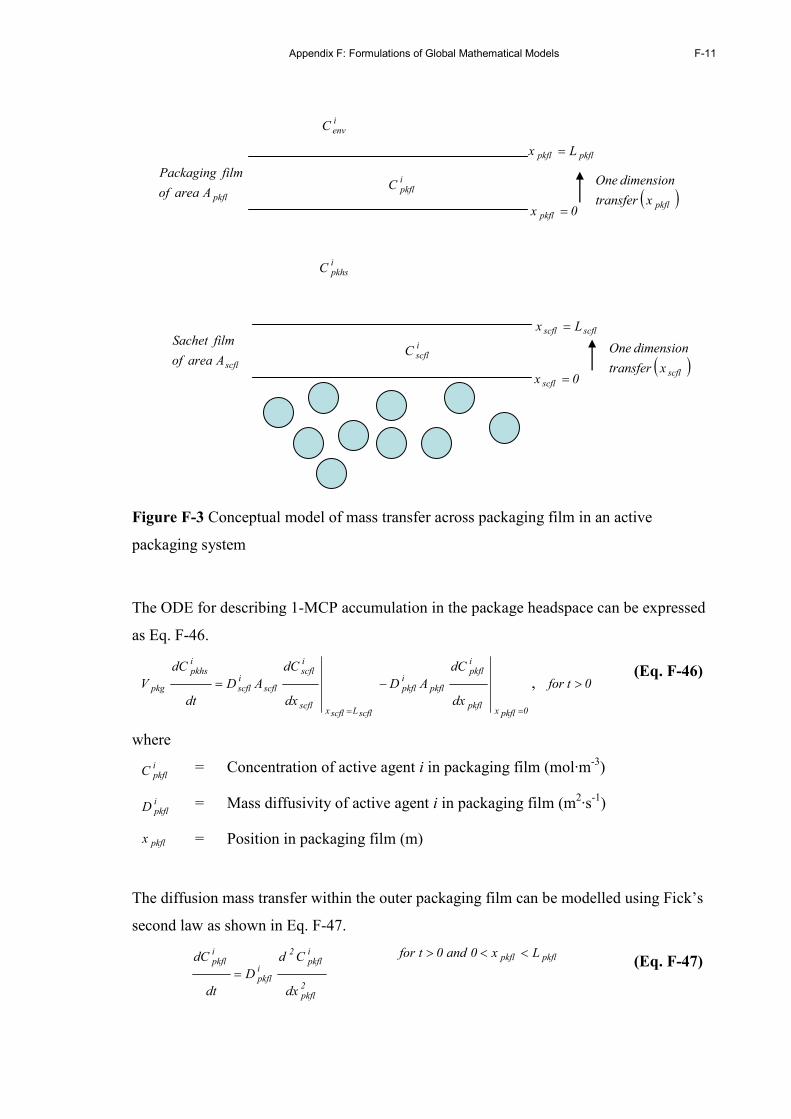
Appendix F: Formulations of Global Mathematical Models
F-11
pkflpkfl Lx =
0x pkfl =
scflscfl Lx =
0x scfl =
iscflC
( )scflx transfer
dimension One
scflA area of
film achetS
ipkhsC
ipkflC
pkflA area of
film ackagingP
( )pkflx transfer
dimension One
ienvC
Figure F-3 Conceptual model of mass transfer across packaging film in an active
packaging system
The ODE for describing 1-MCP accumulation in the package headspace can be expressed
as Eq. F-46.
0pkflxpkfl
ipkfl
pkflipkfl
scflLscflxscfl
iscfl
scfliscfl
ipkhs
pkg
dx
dC
AD
dx
dC
AD
dt
dC
V
==
−= , 0t for > (Eq. F-46)
where
ipkflC = Concentration of active agent i in packaging film (mol·m-3)
ipkflD = Mass diffusivity of active agent i in packaging film (m2·s-1)
pkflx = Position in packaging film (m)
The diffusion mass transfer within the outer packaging film can be modelled using Fick’s
second law as shown in Eq. F-47.
2pkfl
ipkfl
2
ipkfl
ipkfl
dx
Cd
D
dt
dC
= pkflpkfl Lx0and0tfor <<>
(Eq. F-47)
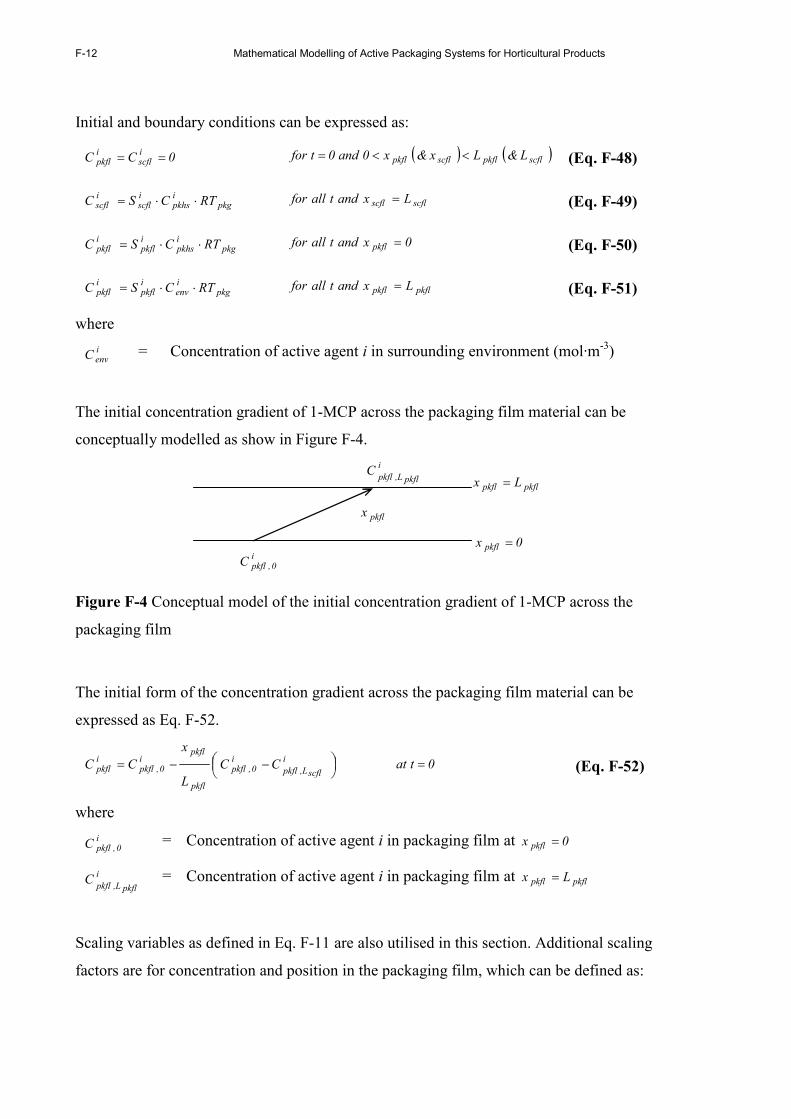
F-12 Mathematical Modelling of Active Packaging Systems for Horticultural Products
Initial and boundary conditions can be expressed as:
0CCiscfl
ipkfl == ( ) ( )scflpkflscflpkfl L&Lx&x0and0tfor <<= (Eq. F-48)
pkgipkhs
iscfl
iscfl RTCS C ⋅⋅= scflscfl Lxandtallfor = (Eq. F-49)
pkgipkhs
ipkfl
ipkfl RTCS C ⋅⋅= 0xandtallfor pkfl = (Eq. F-50)
pkgienv
ipkfl
ipkfl RTCS C ⋅⋅= pkflpkfl Lxandtallfor = (Eq. F-51)
where
ienvC = Concentration of active agent i in surrounding environment (mol·m-3)
The initial concentration gradient of 1-MCP across the packaging film material can be
conceptually modelled as show in Figure F-4.
i
pkflL,pkflC
i0,pkflC
pkflpkfl Lx =
0x pkfl =
pkflx
Figure F-4 Conceptual model of the initial concentration gradient of 1-MCP across the
packaging film
The initial form of the concentration gradient across the packaging film material can be
expressed as Eq. F-52.
−−= i
scflL,pkfl
i0,pkfl
pkfl
pkfli
0,pkflipkfl CC
L
x
CC 0tat = (Eq. F-52)
where
i0,pkflC = Concentration of active agent i in packaging film at 0x pkfl =
i
pkflL,pkflC = Concentration of active agent i in packaging film at pkflpkfl Lx =
Scaling variables as defined in Eq. F-11 are also utilised in this section. Additional scaling
factors are for concentration and position in the packaging film, which can be defined as:

Appendix F: Formulations of Global Mathematical Models
F-13
is,pkfl
iref,pkfl
ipkfl
ipkfl
C
CC
C
−=∗
(Eq. F-53)
*ipkfl
is,pkfl
ipkfl dCCdC ⋅= (Eq. F-54)
s,pkfl
pkfl
pkflx
xx =∗ (Eq. F-55)
It should be noted that iscflD is assumed to be equal to i
pkflD (i.e. same polymer material for
sachet and packaging film) and thus designated as iflD . Given this assumption, following
scaling parameters were applied: *iscfl
is,pkfl
iscfl dCCdC ⋅= and *
pkfl*scfl xx = . Substituting these
scaling factors in relevant equations and the initial and boundary conditions yields the
following:
• Dimensionless ODE for package headspace
−=
=∗
∗
=∗
∗
∗
∗
0pkflx
*pkfl
ipkfl
1scflx
*pkfl
iscfl
pkfl
scfl
s,pkfl
is,scflpkfl
ifl
ipkhs
s
pkgi
s,pkhs
dx
dC
dx
dC
A
A
x
CAD
dt
dC
t
VC 0tfor >∗
(Eq. F-56)
• Dimensionless PDE for packaging film
2pkfl
ipkfl
2
2s,pkfl
is,pkfl
ifl
ipkfl
s
is,scfl
dx
Cd
x
CD
dt
dC
t
C
∗
∗
∗
∗
=
s,pkfl
pkfl
pkfl
x
L
x0and0tfor <<> ∗∗ (Eq. F-57)
• Dimensionless boundary conditions
∗∗ =+ ipkhs
is,pkhspkg
ipkfl
iref,pkfl
ipkfl
is,pkfl CCRTSCCC 0xat pkfl =
∗ (Eq. F-58)
0CCCi
ref,pkflipkfl
is,pkfl =+∗
s,pkfl
pkfl
pkfl
x
L
xat =∗ (Eq. F-59)
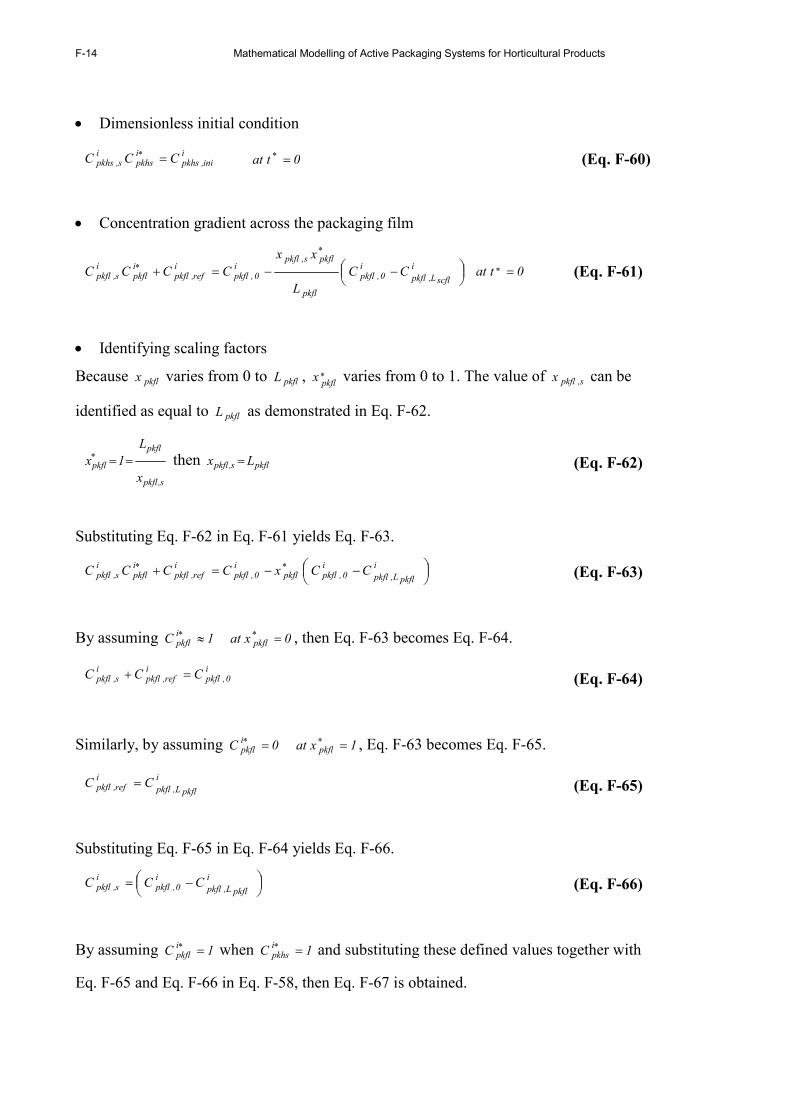
F-14 Mathematical Modelling of Active Packaging Systems for Horticultural Products
• Dimensionless initial condition
iini,pkhs
ipkhs
is,pkhs CCC =∗ 0tat =∗ (Eq. F-60)
• Concentration gradient across the packaging film
−−=+
∗
∗ i
scflL,pkfl
i0,pkfl
pkfl
pkfls,pkfli
0,pkfli
ref,pkflipkfl
is,pkfl CC
L
xx
CCCC 0tat =∗ (Eq. F-61)
• Identifying scaling factors
Because pkflx varies from 0 to pkflL , ∗pkfl
x varies from 0 to 1. The value of s,pkflx can be
identified as equal to pkflL as demonstrated in Eq. F-62.
s,pkfl
pkfl
pkfl
x
L
1x ==∗ then pkfls,pkfl Lx = (Eq. F-62)
Substituting Eq. F-62 in Eq. F-61 yields Eq. F-63.
−−=+ ∗∗ i
pkflL,pkfl
i0,pkflpkfl
i0,pkfl
iref,pkfl
ipkfl
is,pkfl CCxCCCC (Eq. F-63)
By assuming 0x at1C pkflipkfl =≈ ∗∗ , then Eq. F-63 becomes Eq. F-64.
i0,pkfl
iref,pkfl
is,pkfl CCC =+ (Eq. F-64)
Similarly, by assuming 1x at0C pkflipkfl == ∗∗ , Eq. F-63 becomes Eq. F-65.
i
pkflL,pkfl
iref,pkfl CC = (Eq. F-65)
Substituting Eq. F-65 in Eq. F-64 yields Eq. F-66.
−= i
pkflL,pkfl
i0,pkfl
is,pkfl CCC (Eq. F-66)
By assuming 1Cipkfl =∗ when 1C
ipkhs =∗ and substituting these defined values together with
Eq. F-65 and Eq. F-66 in Eq. F-58, then Eq. F-67 is obtained.
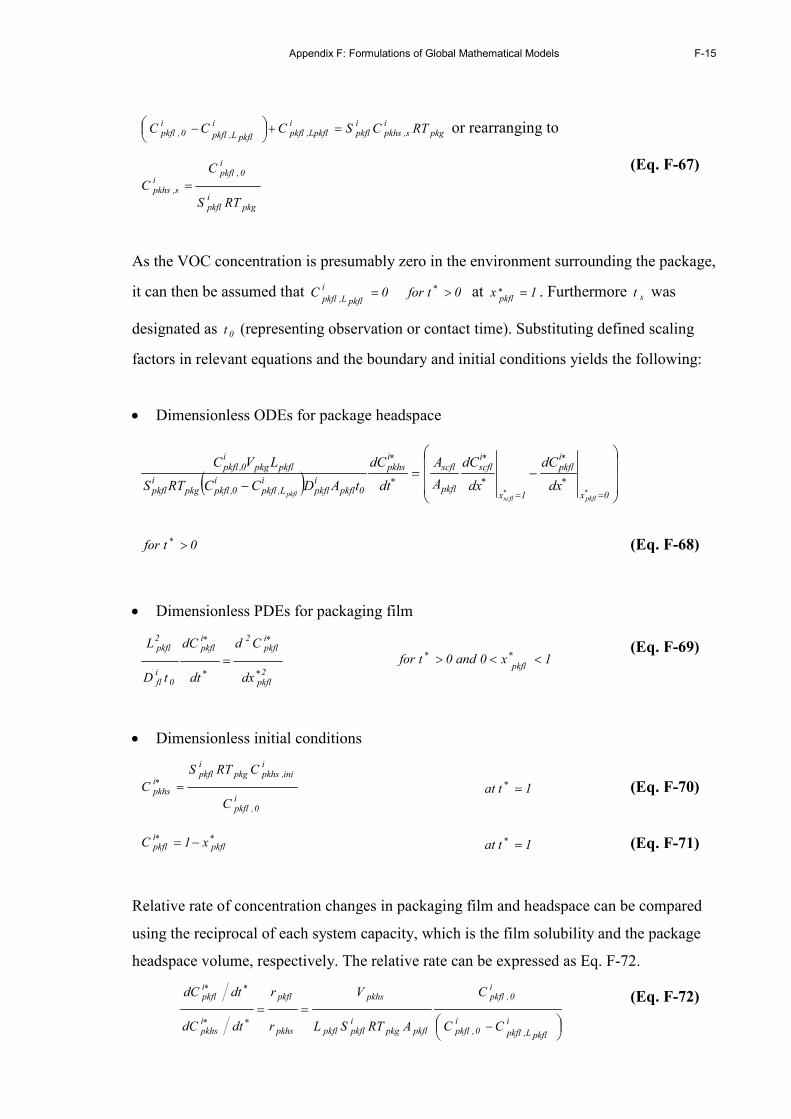
Appendix F: Formulations of Global Mathematical Models
F-15
pkgi
s,pkhsipkfl
iLpkfl,pkfl
i
pkflL,pkfl
i0,pkfl RTCSCCC =+
− or rearranging to
pkgipkfl
i0,pkfl
is,pkhs
RTS
C
C =
(Eq. F-67)
As the VOC concentration is presumably zero in the environment surrounding the package,
it can then be assumed that 0tfor0Ci
pkflL,pkfl>= ∗ at 1x
pkfl=∗ . Furthermore st was
designated as 0t (representing observation or contact time). Substituting defined scaling
factors in relevant equations and the boundary and initial conditions yields the following:
• Dimensionless ODEs for package headspace
( )
−=−
=
∗
∗
=
∗
∗
∗
∗
∗∗0x
ipkfl
1x
iscfl
pkfl
scflipkhs
0pkflipkfl
iL,pkfl
i0,pkflpkg
ipkfl
pkflpkgi
0,pkfl
pkflscflpkfl
dx
dC
dx
dC
A
A
dt
dC
tADCCRTS
LVC
0tfor >∗ (Eq. F-68)
• Dimensionless PDEs for packaging film
2pkfl
ipkfl
2ipkfl
0ifl
2pkfl
dx
Cd
dt
dC
tD
L
∗
∗
∗
∗
= 1x0and0tforpkfl
<<> ∗∗ (Eq. F-69)
• Dimensionless initial conditions
i0,pkfl
iini,pkhspkg
ipkfl
ipkhs
C
CRTS
C =∗ 1t at =∗ (Eq. F-70)
∗∗ −= pkflipkfl x1C 1t at =∗ (Eq. F-71)
Relative rate of concentration changes in packaging film and headspace can be compared
using the reciprocal of each system capacity, which is the film solubility and the package
headspace volume, respectively. The relative rate can be expressed as Eq. F-72.
−
==∗∗
∗∗
i
pkflL,pkfl
i0,pkfl
i0,pkfl
pkflpkgipkflpkfl
pkhs
pkhs
pkfl
ipkhs
ipkfl
CC
C
ARTSL
V
r
r
dtdC
dtdC
(Eq. F-72)

F-16 Mathematical Modelling of Active Packaging Systems for Horticultural Products
Eq. F-72 can be used to determine the need to model transport of volatile through the outer
packaging film as a dynamic or equilibrium process. As mentioned in section 5.5.2, ratio of
the capacity of the package headspace for holding adsorbent to that of the packaging film
(denoted as pkflpkhsCR ) can be described by Eq. F-73.
pkflpkgipkflpkfl
pkhs
pkflpkhs
ARTSL
V
CR = (Eq. F-73)
F.3 Derivations of mathematical models for exploring the effects of capacity ratios
( scflpkhsCR and pkflpkhsCR ; Chapter 5) on modelling 1-MCP accumulation in package
headspace
The global ordinary differential equation (ODE) model for describing 1-MCP
accumulation in the package headspace, according to the modes of mass transfer processes
considered at (i) the sachet film and (ii) the packaging film, are derived in this section.
Computational files (developed using MATLAB language) are provided in the attached
CD-ROM.
F.3.1 Modelling 1-MCP accumulation in package headspace based on ‘Modes of mass
transfer across sachet film material’
The mass transfer process across sachet film material can be modelled using either steady-
state permeation (Fick’s first law; Eq. 2-8) or transient diffusion (Fick’s second law; Eq.
2-5) approachs. This investigation was carried out to understand what values of the
parameters in scflpkhsCR (Eq. F-45) justify each modelling approach. A simplified system
was considered for 1-MCP release from a sachet into a package head space. The key
assumptions made included (i) no packaged horticultural products, (ii) film permeability is
not concentration dependend (iii) no mass transfer out from the headspace (of a bag) to the
surrounding environment (given MCPpkfl
P = 0), and (iv) 1-MCP concentration in the sachet is
always equal to its saturated value ( MCPsatC ) at 23ºC.
For ‘steady-state permeation’ across the sachet film, the global ODE for describing 1-MCP
accumulation in package headspace can be expressed as Eq. F-74.

Appendix F: Formulations of Global Mathematical Models
F-17
( ) ( )pkg
pkgMCPenv
MCPpkhs
pkfl
pkflMCPpkfl
MCPpkhs
MCPsat
scfl
scflMCPscfl
MCPpkhs
V
RT
CC
L
AP
CC
L
AP
dt
dC
−−−= , 0t for > (Eq. F-74)
where
MCPscflP = Sachet film permeability to 1-MCP vapour (mol·m·m-2·s-1·Pa-1)
MCPpkflP = Packaging film permeability to 1-MCP vapour (mol·m·m-2·s-1·Pa-1)
MCPsatC = 1-MCP saturated vapour concentration (mol·m-3)
For ‘transient diffusion’ mass transfer across the sachet film, diffusion in the sachet film
can be described as Eq. F-75 and the global mathematical model for describing 1-MCP
accumulation in package headspace can be expressed as Eq. F-76.
2scfl
MCPscfl
2
MCPscfl
MCPscfl
dx
Cd
D
dt
dC
= (Eq. F-75)
( )pkg
MCPenv
MCPpkhs
pkfl
pkgpkflMCPpkfl
scflLscflxscfl
MCPscfl
scflMCPscfl
MCPpkhs
V
1
CC
L
RTAP
dx
dC
AD
dt
dC
−−=
=
, 0t for >
(Eq. F-76)
where
MCPscflC = 1-MCP concentration in sachet film (mol·m-3)
MCPscflD = Mass diffusivity of 1-MCP in sachet film (m2·s-1)
Initial and boundary conditions for diffusions across the sachet film can be expressed as:
0CMCP
scfl= scflscfl Lx0and0tfor <<= (Eq. F-77)
pkgMCPsat
MCP
scfl
MCP
scflRTCS C ⋅⋅= 0xandtallfor scfl = (Eq. F-78)
pkgMCP
pkhs
MCP
scfl
MCP
scflRTCS C ⋅⋅= scflscfl Lxandtallfor = (Eq. F-79)
where
MCPscflS = Sachet film solubility to 1-MCP (mol·m-3·Pa-1)
The Finite Difference scheme (similar to that shown in Chapter 5) was utilised to solve the
PDE model describing diffusion in the sachet film material.

F-18 Mathematical Modelling of Active Packaging Systems for Horticultural Products
F.3.2 Modelling 1-MCP accumulations in package headspace based on ‘Modes of
mass transfer across packaging film material’
Like for the sachet film material, the mass transfer process across the packaging film
material (from headspace to surrounding environment) can be modelled using the steady-
state permeation or transient diffusion (unsteady-state) approach. In a similar investigation
a model was developed to identify how pkflpkhsCR (Eq. F-73) determines when each
approach is more suitable. For this exercise models using each approach were developed
for the simplistic scenario of 1-MCP release from a sachet into a package headspace
initially free of 1-MCP. At the sachet, an assumption was made regarding steady-state
permeation to describe the mass transfer across the sachet film material, to simplify model
complexity.
The global ODE for describing 1-MCP accumulation in package headspace, in which the
mass transfer across the packaging film is modelled using ‘steady-state permeation’, can be
expressed as Eq. F-74.
For ‘transient diffusion’ across the packaging film, diffusion in the packaging film can be
described as Eq. F-80 and the global model for describing 1-MCP accumulation in package
headspace can be expressed as Eq. F-81.
2pkfl
MCPpkfl
2
MCPpkfl
MCPpkfl
dx
CdD
dt
dC= (Eq. F-80)
( )pkg
pkflLpkflxpkfl
MCP
pkfl
pkflMCP
pkfl
MCP
pkhs
MCPsat
scfl
pkgscflMCP
scfl
MCP
pkhs
V
1
dx
dC
ADCC
L
RTAP
dt
dC
−−=
=
, 0t for >
(Eq. F-81)
where
MCPpkflC = 1-MCP concentration in packaging film (mol·m-3)
MCPpkflD = Mass diffusivity of 1-MCP in packaging film (m2·s-1)
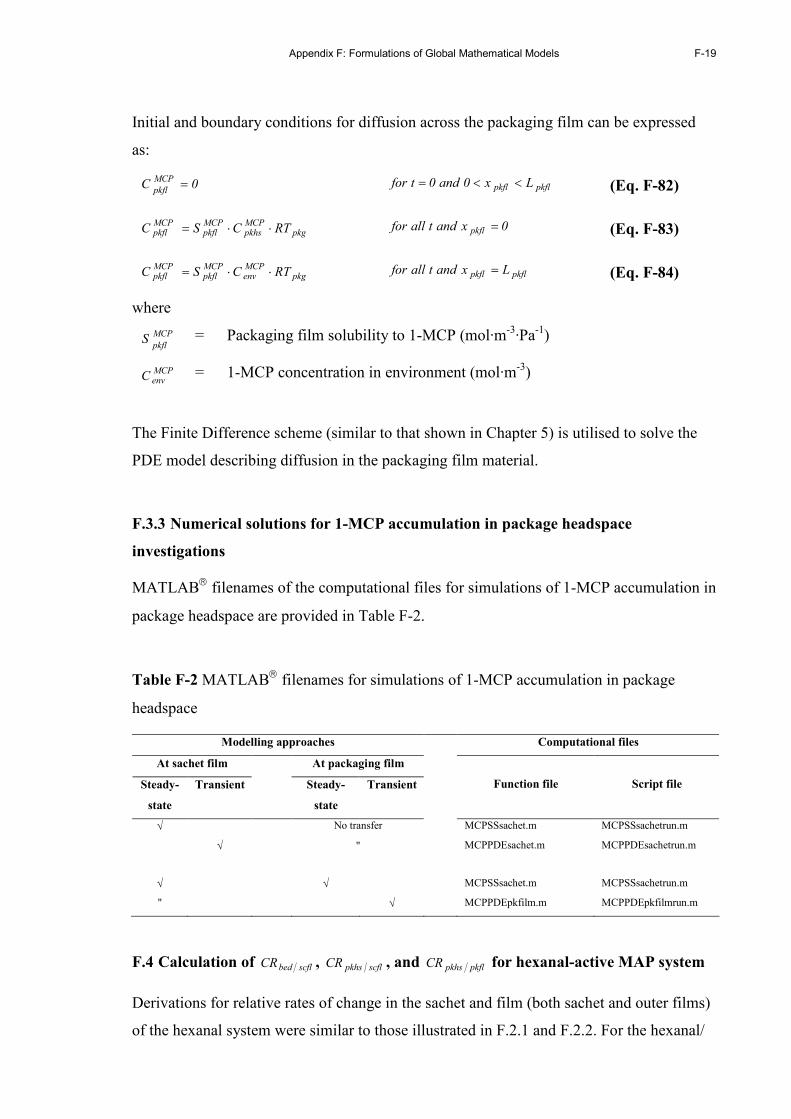
Appendix F: Formulations of Global Mathematical Models
F-19
Initial and boundary conditions for diffusion across the packaging film can be expressed
as:
0CMCP
pkfl= pkflpkfl Lx0and0tfor <<= (Eq. F-82)
pkgMCPpkhs
MCPpkfl
MCPpkfl RTCS C ⋅⋅= 0xandtallfor pkfl = (Eq. F-83)
pkgMCPenv
MCPpkfl
MCPpkfl RTCS C ⋅⋅= pkflpkfl Lxandtallfor = (Eq. F-84)
where
MCP
pkflS = Packaging film solubility to 1-MCP (mol·m-3·Pa-1)
MCPenvC = 1-MCP concentration in environment (mol·m-3)
The Finite Difference scheme (similar to that shown in Chapter 5) is utilised to solve the
PDE model describing diffusion in the packaging film material.
F.3.3 Numerical solutions for 1-MCP accumulation in package headspace
investigations
MATLAB filenames of the computational files for simulations of 1-MCP accumulation in
package headspace are provided in Table F-2.
Table F-2 MATLAB filenames for simulations of 1-MCP accumulation in package
headspace
Modelling approaches Computational files
At sachet film At packaging film
Steady-
state
Transient Steady-
state
Transient Function file Script file
√ No transfer MCPSSsachet.m MCPSSsachetrun.m
√ " MCPPDEsachet.m MCPPDEsachetrun.m
√ √ MCPSSsachet.m MCPSSsachetrun.m
" √ MCPPDEpkfilm.m MCPPDEpkfilmrun.m
F.4 Calculation of scflbedCR , scflpkhsCR , and pkflpkhsCR for hexanal-active MAP system
Derivations for relative rates of change in the sachet and film (both sachet and outer films)
of the hexanal system were similar to those illustrated in F.2.1 and F.2.2. For the hexanal/
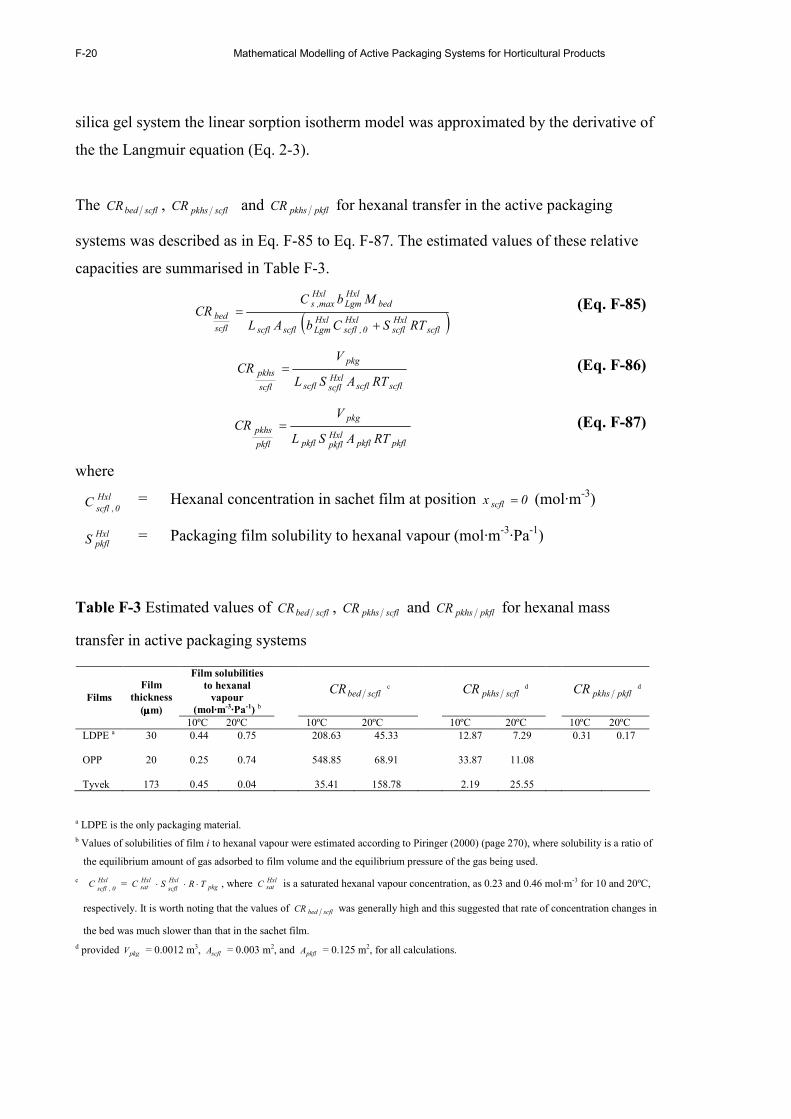
F-20 Mathematical Modelling of Active Packaging Systems for Horticultural Products
silica gel system the linear sorption isotherm model was approximated by the derivative of
the the Langmuir equation (Eq. 2-3).
The scflbedCR , scflpkhsCR and pkflpkhsCR for hexanal transfer in the active packaging
systems was described as in Eq. F-85 to Eq. F-87. The estimated values of these relative
capacities are summarised in Table F-3.
( )scflHxlscfl
Hxl0,scfl
HxlLgmscflscfl
bedHxlLgm
Hxlmax,s
scfl
bed
RTSCbAL
MbCCR
+= (Eq. F-85)
scflscflHxlscflscfl
pkg
scfl
pkhsRTASL
VCR = (Eq. F-86)
pkflpkflHxlpkflpkfl
pkg
pkfl
pkhsRTASL
VCR = (Eq. F-87)
where
Hxl
0,scflC = Hexanal concentration in sachet film at position 0x scfl = (mol·m-3)
HxlpkflS = Packaging film solubility to hexanal vapour (mol·m-3·Pa-1)
Table F-3 Estimated values of scflbedCR , scflpkhsCR and pkflpkhsCR for hexanal mass
transfer in active packaging systems
Film solubilities
to hexanal
vapour
(mol·m-3·Pa-1) b
scflbedCR c scflpkhsCR d pkflpkhsCR d Films
Film
thickness
(µµµµm) 10ºC 20ºC 10ºC 20ºC 10ºC 20ºC 10ºC 20ºC
LDPE a 30 0.44 0.75 208.63 45.33 12.87 7.29 0.31 0.17 OPP 20 0.25 0.74 548.85 68.91 33.87 11.08 Tyvek 173 0.45 0.04 35.41 158.78 2.19 25.55
a LDPE is the only packaging material.
b Values of solubilities of film i to hexanal vapour were estimated according to Piringer (2000) (page 270), where solubility is a ratio of
the equilibrium amount of gas adsorbed to film volume and the equilibrium pressure of the gas being used.
c Hxl
0,scflC = pkg
Hxl
scfl
Hxlsat TRSC ⋅⋅⋅ , where Hxl
satC is a saturated hexanal vapour concentration, as 0.23 and 0.46 mol·m-3 for 10 and 20ºC,
respectively. It is worth noting that the values of scflbedCR was generally high and this suggested that rate of concentration changes in
the bed was much slower than that in the sachet film.
d provided pkgV = 0.0012 m3, scflA = 0.003 m2, and pkflA = 0.125 m2, for all calculations.
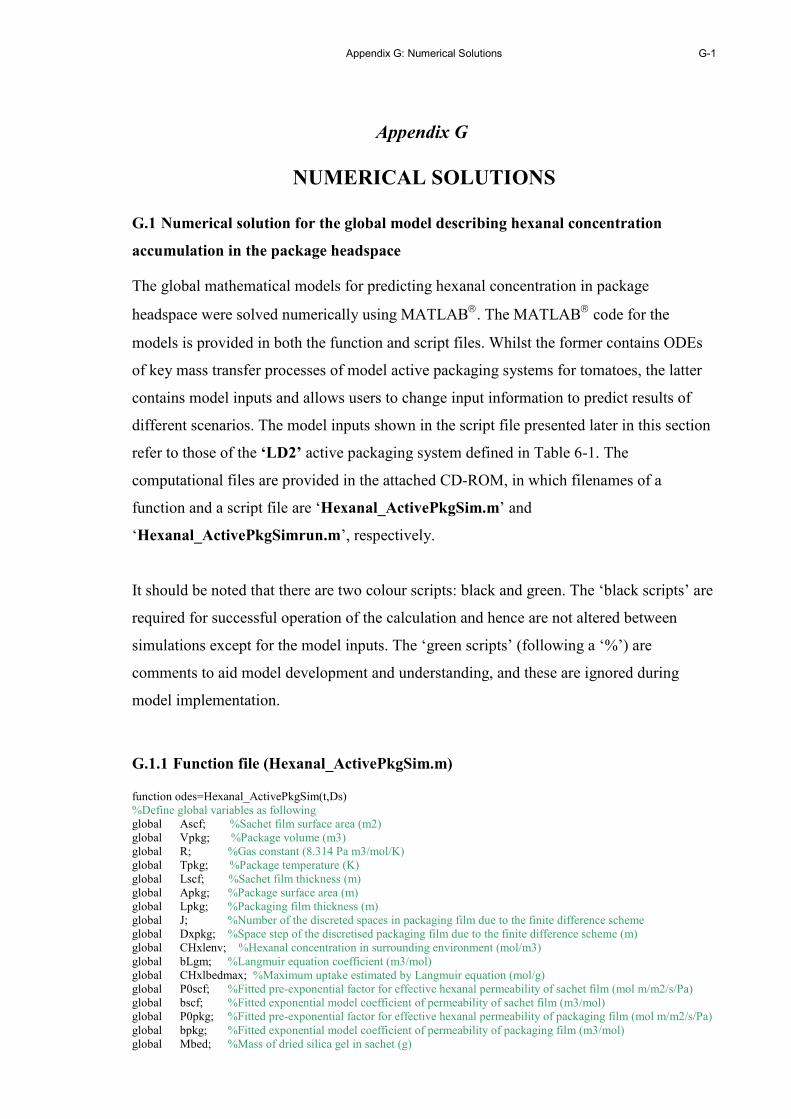
Appendix G: Numerical Solutions
G-1
Appendix G
NUMERICAL SOLUTIONS
G.1 Numerical solution for the global model describing hexanal concentration
accumulation in the package headspace
The global mathematical models for predicting hexanal concentration in package
headspace were solved numerically using MATLAB. The MATLAB code for the
models is provided in both the function and script files. Whilst the former contains ODEs
of key mass transfer processes of model active packaging systems for tomatoes, the latter
contains model inputs and allows users to change input information to predict results of
different scenarios. The model inputs shown in the script file presented later in this section
refer to those of the ‘LD2’ active packaging system defined in Table 6-1. The
computational files are provided in the attached CD-ROM, in which filenames of a
function and a script file are ‘Hexanal_ActivePkgSim.m’ and
‘Hexanal_ActivePkgSimrun.m’, respectively.
It should be noted that there are two colour scripts: black and green. The ‘black scripts’ are
required for successful operation of the calculation and hence are not altered between
simulations except for the model inputs. The ‘green scripts’ (following a ‘%’) are
comments to aid model development and understanding, and these are ignored during
model implementation.
G.1.1 Function file (Hexanal_ActivePkgSim.m)
function odes=Hexanal_ActivePkgSim(t,Ds) %Define global variables as following global Ascf; %Sachet film surface area (m2) global Vpkg; %Package volume (m3) global R; %Gas constant (8.314 Pa m3/mol/K) global Tpkg; %Package temperature (K) global Lscf; %Sachet film thickness (m) global Apkg; %Package surface area (m) global Lpkg; %Packaging film thickness (m) global J; %Number of the discreted spaces in packaging film due to the finite difference scheme global Dxpkg; %Space step of the discretised packaging film due to the finite difference scheme (m) global CHxlenv; %Hexanal concentration in surrounding environment (mol/m3) global bLgm; %Langmuir equation coefficient (m3/mol) global CHxlbedmax; %Maximum uptake estimated by Langmuir equation (mol/g) global P0scf; %Fitted pre-exponential factor for effective hexanal permeability of sachet film (mol m/m2/s/Pa) global bscf; %Fitted exponential model coefficient of permeability of sachet film (m3/mol) global P0pkg; %Fitted pre-exponential factor for effective hexanal permeability of packaging film (mol m/m2/s/Pa) global bpkg; %Fitted exponential model coefficient of permeability of packaging film (m3/mol) global Mbed; %Mass of dried silica gel in sachet (g)
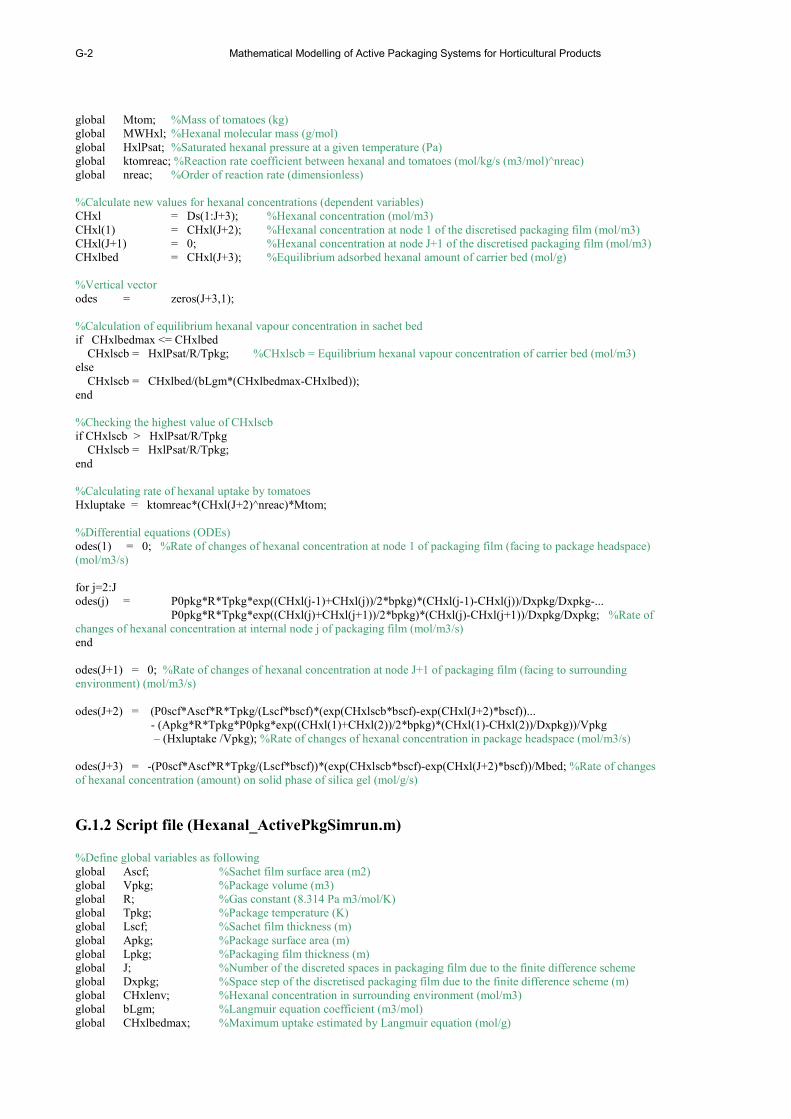
G-2 Mathematical Modelling of Active Packaging Systems for Horticultural Products
global Mtom; %Mass of tomatoes (kg) global MWHxl; %Hexanal molecular mass (g/mol) global HxlPsat; %Saturated hexanal pressure at a given temperature (Pa) global ktomreac; %Reaction rate coefficient between hexanal and tomatoes (mol/kg/s (m3/mol)^nreac) global nreac; %Order of reaction rate (dimensionless) %Calculate new values for hexanal concentrations (dependent variables) CHxl = Ds(1:J+3); %Hexanal concentration (mol/m3) CHxl(1) = CHxl(J+2); %Hexanal concentration at node 1 of the discretised packaging film (mol/m3) CHxl(J+1) = 0; %Hexanal concentration at node J+1 of the discretised packaging film (mol/m3) CHxlbed = CHxl(J+3); %Equilibrium adsorbed hexanal amount of carrier bed (mol/g) %Vertical vector odes = zeros(J+3,1); %Calculation of equilibrium hexanal vapour concentration in sachet bed if CHxlbedmax <= CHxlbed CHxlscb = HxlPsat/R/Tpkg; %CHxlscb = Equilibrium hexanal vapour concentration of carrier bed (mol/m3) else CHxlscb = CHxlbed/(bLgm*(CHxlbedmax-CHxlbed)); end %Checking the highest value of CHxlscb if CHxlscb > HxlPsat/R/Tpkg CHxlscb = HxlPsat/R/Tpkg; end %Calculating rate of hexanal uptake by tomatoes Hxluptake = ktomreac*(CHxl(J+2)^nreac)*Mtom; %Differential equations (ODEs) odes(1) = 0; %Rate of changes of hexanal concentration at node 1 of packaging film (facing to package headspace) (mol/m3/s) for j=2:J odes(j) = P0pkg*R*Tpkg*exp((CHxl(j-1)+CHxl(j))/2*bpkg)*(CHxl(j-1)-CHxl(j))/Dxpkg/Dxpkg-... P0pkg*R*Tpkg*exp((CHxl(j)+CHxl(j+1))/2*bpkg)*(CHxl(j)-CHxl(j+1))/Dxpkg/Dxpkg; %Rate of changes of hexanal concentration at internal node j of packaging film (mol/m3/s) end odes(J+1) = 0; %Rate of changes of hexanal concentration at node J+1 of packaging film (facing to surrounding environment) (mol/m3/s) odes(J+2) = (P0scf*Ascf*R*Tpkg/(Lscf*bscf)*(exp(CHxlscb*bscf)-exp(CHxl(J+2)*bscf))...
- (Apkg*R*Tpkg*P0pkg*exp((CHxl(1)+CHxl(2))/2*bpkg)*(CHxl(1)-CHxl(2))/Dxpkg))/Vpkg – (Hxluptake /Vpkg); %Rate of changes of hexanal concentration in package headspace (mol/m3/s)
odes(J+3) = -(P0scf*Ascf*R*Tpkg/(Lscf*bscf))*(exp(CHxlscb*bscf)-exp(CHxl(J+2)*bscf))/Mbed; %Rate of changes of hexanal concentration (amount) on solid phase of silica gel (mol/g/s)
G.1.2 Script file (Hexanal_ActivePkgSimrun.m)
%Define global variables as following global Ascf; %Sachet film surface area (m2) global Vpkg; %Package volume (m3) global R; %Gas constant (8.314 Pa m3/mol/K) global Tpkg; %Package temperature (K) global Lscf; %Sachet film thickness (m) global Apkg; %Package surface area (m) global Lpkg; %Packaging film thickness (m) global J; %Number of the discreted spaces in packaging film due to the finite difference scheme global Dxpkg; %Space step of the discretised packaging film due to the finite difference scheme (m) global CHxlenv; %Hexanal concentration in surrounding environment (mol/m3) global bLgm; %Langmuir equation coefficient (m3/mol) global CHxlbedmax; %Maximum uptake estimated by Langmuir equation (mol/g)

Appendix G: Numerical Solutions
G-3
global P0scf; %Fitted pre-exponential factor for effective hexanal permeability of sachet film (mol m/m2/s/Pa) global bscf; %Fitted exponential model coefficient of permeability of sachet film (m3/mol) global P0pkg; %Fitted pre-exponential factor for effective hexanal permeability of packaging film (mol m/m2/s/Pa) global bpkg; %Fitted exponential model coefficient of permeability of packaging film (m3/mol) global Mbed; %Mass of dried silica gel in sachet (g) global Mtom; %Mass of tomatoes (kg) global MWHxl; %Hexanal molecular mass (g/mol) global HxlPsat; %Saturated hexanal pressure at a given temperature (Pa) global ktomreac; %Reaction rate coefficient between hexanal and tomatoes (mol/kg/s (m3/mol)^nreac) global nreac; %Order of reaction rate (dimensionless) %System Input values %General inputs CHxlenv = 0; %Assumption R = 8.314; %Gas constant Apkg = 0.125; %Experimental measurement P0pkg = 1.97E-14; %Experimental measurement bpkg = 19.65; %Experimental measurement Vpkg = 0.0012; %Experimental measurement Lpkg = 30*10^-6; %Experimental measurement Mtom = 600*10^-3; %Experimental measurement MWHxl = 100.16; %SciFinder Scholar database %Varied input values of 'storage temperature' Storagetemp = 20; %Experimental measurement (referred to storage temperature (ºC)) Tpkg = 273.15+Storagetemp; %Calculation HxlPsat = 1137; %Estimation following Covarrubias-Cervantes et al (2004) %Varied input values of 'sachet content' Mbed = 3; %Experimental measurement Lscf = 30*10^-6; %Experimental measurement Ascf = 0.003; %Experimental measurement P0scf = 1.97E-14; %Experimental measurement bscf = 19.65; %Experimental measurement %Varied input values of 'coefficients of Langmuir equation' CHxlbedmax = 0.00334; %Experimental measurement bLgm = 281.069; %Experimental measurement %Varied input values of 'rate of hexanal uptakes by tomatoes' ktomreac = 0.00009; %Experimental measurement nreac = 2.64; %Experimental measurement %Input simulation conditions J = 10; %Assumption Dxpkg = Lpkg/J; %Estimation tPrint = 500; %Given time period for printing simulated results (second) Day = 7; %Simulated storage day (assumption) (day) tTotal = Day*24*60*60; %Total simulation time (second) tSpan = [0:tPrint:tTotal]; %Given time to evaluate the solution between initial time and total simulation time %Initial condition CHxl = zeros(J+3,1); %No Hexanal concentration in all nodes CHxl(J+3) = CHxlbedmax; %Assumption %Input simulation conditions and initial conditions for changing storage temperature (e.g. from 10 to 20C) during the storage regime %Day = 5; %storage period of new storage temperature %tTotal = Day*24*60*60; %Total simulation time (second) %tSpan = [t(end):tPrint:tTotal+t(end)]; %t(end) as the last simulated time from the previous storage temperature simulation %CHxl = zeros(J+3,1); %CHxl(J+2) = result(end,J+2); %using last simulated result from the previous simulation as an initial for the new storage temperature simulation
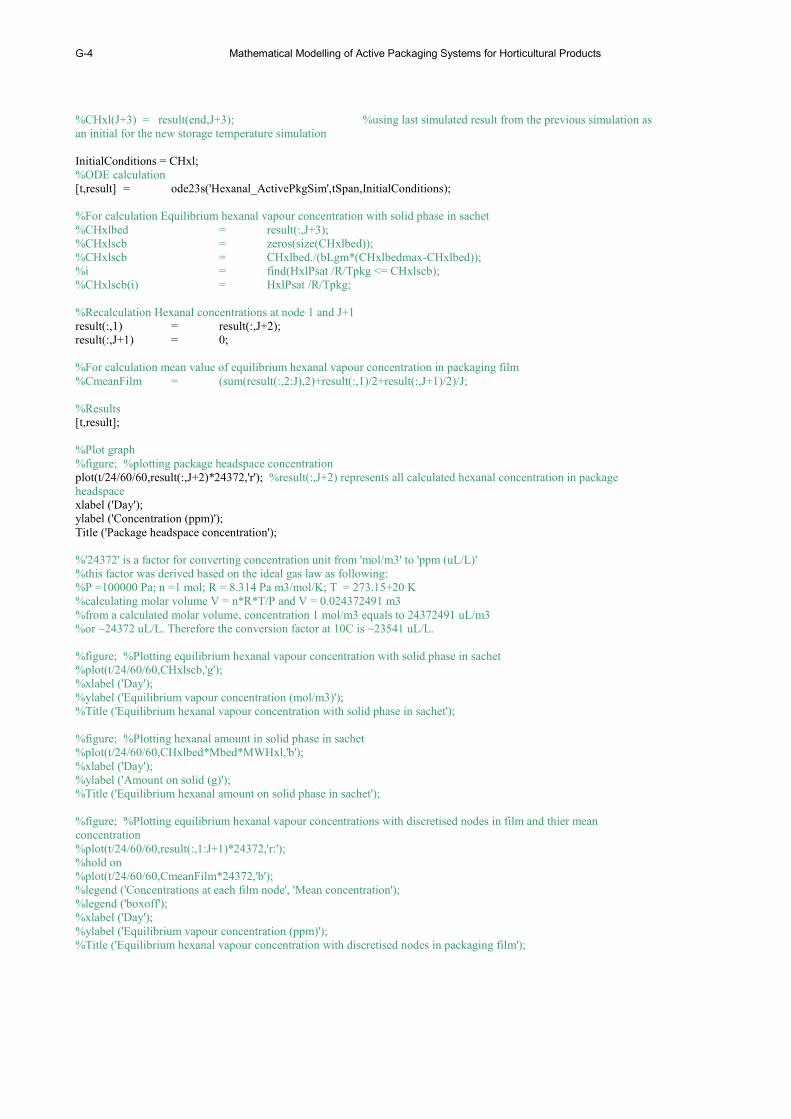
G-4 Mathematical Modelling of Active Packaging Systems for Horticultural Products
%CHxl(J+3) = result(end,J+3); %using last simulated result from the previous simulation as an initial for the new storage temperature simulation InitialConditions = CHxl; %ODE calculation [t,result] = ode23s('Hexanal_ActivePkgSim',tSpan,InitialConditions); %For calculation Equilibrium hexanal vapour concentration with solid phase in sachet %CHxlbed = result(:,J+3); %CHxlscb = zeros(size(CHxlbed)); %CHxlscb = CHxlbed./(bLgm*(CHxlbedmax-CHxlbed)); %i = find(HxlPsat /R/Tpkg <= CHxlscb); %CHxlscb(i) = HxlPsat /R/Tpkg; %Recalculation Hexanal concentrations at node 1 and J+1 result(:,1) = result(:,J+2); result(:,J+1) = 0; %For calculation mean value of equilibrium hexanal vapour concentration in packaging film %CmeanFilm = (sum(result(:,2:J),2)+result(:,1)/2+result(:,J+1)/2)/J; %Results [t,result]; %Plot graph %figure; %plotting package headspace concentration plot(t/24/60/60,result(:,J+2)*24372,'r'); %result(:,J+2) represents all calculated hexanal concentration in package headspace xlabel ('Day'); ylabel ('Concentration (ppm)'); Title ('Package headspace concentration'); %'24372' is a factor for converting concentration unit from 'mol/m3' to 'ppm (uL/L)' %this factor was derived based on the ideal gas law as following: %P =100000 Pa; n =1 mol; R = 8.314 Pa m3/mol/K; T = 273.15+20 K %calculating molar volume V = n*R*T/P and V = 0.024372491 m3 %from a calculated molar volume, concentration 1 mol/m3 equals to 24372491 uL/m3 %or ~24372 uL/L. Therefore the conversion factor at 10C is ~23541 uL/L. %figure; %Plotting equilibrium hexanal vapour concentration with solid phase in sachet %plot(t/24/60/60,CHxlscb,'g'); %xlabel ('Day'); %ylabel ('Equilibrium vapour concentration (mol/m3)'); %Title ('Equilibrium hexanal vapour concentration with solid phase in sachet'); %figure; %Plotting hexanal amount in solid phase in sachet %plot(t/24/60/60,CHxlbed*Mbed*MWHxl,'b'); %xlabel ('Day'); %ylabel ('Amount on solid (g)'); %Title ('Equilibrium hexanal amount on solid phase in sachet'); %figure; %Plotting equilibrium hexanal vapour concentrations with discretised nodes in film and thier mean concentration %plot(t/24/60/60,result(:,1:J+1)*24372,'r:'); %hold on %plot(t/24/60/60,CmeanFilm*24372,'b'); %legend ('Concentrations at each film node', 'Mean concentration'); %legend ('boxoff'); %xlabel ('Day'); %ylabel ('Equilibrium vapour concentration (ppm)'); %Title ('Equilibrium hexanal vapour concentration with discretised nodes in packaging film');

Appendix G: Numerical Solutions
G-5
G.2 MATLAB language for the global model for predicting accumulations of O2 and
CO2 in active MAP for tomatoes
The MATLAB code for simulating accumulation of O2 and CO2 in the active packaging
system as well as model inputs are provided in the attached CD-ROM. The filenames of
the function and the script files are ‘PassiveMAP.m’ and ‘PassiveMAPrun.m’,
respectively.
G.2.1 Function file (PassiveMAP.m)
function odes=PassiveMAP(t,Ds)
%Define global variables
global rO2max; %Maximum rate of oxygen uptake by fruit (mol/s/kg),
global KmO2; %Michaelis constant for O2 consumption (Pa)
global Mtom; %Tomato mass (kg)
global PO2pkg; %Packaging film permeability to oxygen (mol m/s/m2/Pa)
global PCO2pkg; %Packaging film permeability to carbon dioxide (mol m/s/m2/Pa)
global pO2env; %O2 partial pressure in surrounding environment (Pa)
global pCO2env; %CO2 partial pressure in surrounding environment (Pa)
global RQ; %Respiration quotient (dimensionless)
global Vpkg; %Package volume (m3)
global R; %Gas constant (8.314 Pa m3/mol/K)
global Tpkg; %Package temperature (K)
global Lscf; %Sachet film thickness (m)
global Apkg; %Package surface area (m)
global Lpkg; %Packaging film thickness (m)
%Calculate new values for number of moles of O2 and CO2 in pacakge headspace(dependent variables)
nO2pkg =Ds(1); %number of oxygen moles in package headspace (mol)
nCO2pkg=Ds(2); %number of carbon dioxide moles in package headspace (mol)
%Calculate new values for partial pressure of O2 and CO2 in package headspace
pO2pkg=nO2pkg*R*Tpkg/Vpkg; %O2 partial pressure in package headspace (Pa)
pCO2pkg=nCO2pkg*R*Tpkg/Vpkg; %CO2 partial pressure in package headspace (Pa)
%Calculation of O2 consumption rate and CO2 generation rate
rO2fr = rO2max*pO2pkg*Mtom/(KmO2+pO2pkg); %O2 consumption rate (mol/s)
rCO2fr = RQ*rO2fr; %CO2 generation rate (mol/s)
%Differential equations (ODEs)
odes=zeros(2,1);
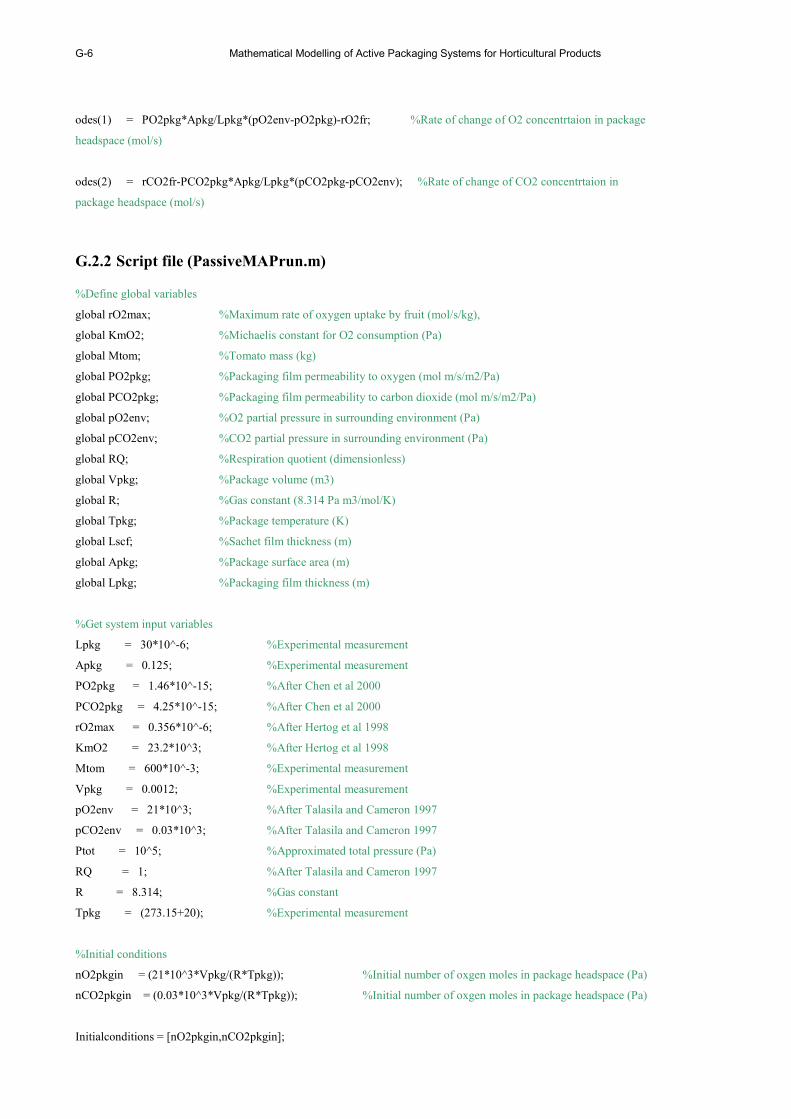
G-6 Mathematical Modelling of Active Packaging Systems for Horticultural Products
odes(1) = PO2pkg*Apkg/Lpkg*(pO2env-pO2pkg)-rO2fr; %Rate of change of O2 concentrtaion in package
headspace (mol/s)
odes(2) = rCO2fr-PCO2pkg*Apkg/Lpkg*(pCO2pkg-pCO2env); %Rate of change of CO2 concentrtaion in
package headspace (mol/s)
G.2.2 Script file (PassiveMAPrun.m)
%Define global variables
global rO2max; %Maximum rate of oxygen uptake by fruit (mol/s/kg),
global KmO2; %Michaelis constant for O2 consumption (Pa)
global Mtom; %Tomato mass (kg)
global PO2pkg; %Packaging film permeability to oxygen (mol m/s/m2/Pa)
global PCO2pkg; %Packaging film permeability to carbon dioxide (mol m/s/m2/Pa)
global pO2env; %O2 partial pressure in surrounding environment (Pa)
global pCO2env; %CO2 partial pressure in surrounding environment (Pa)
global RQ; %Respiration quotient (dimensionless)
global Vpkg; %Package volume (m3)
global R; %Gas constant (8.314 Pa m3/mol/K)
global Tpkg; %Package temperature (K)
global Lscf; %Sachet film thickness (m)
global Apkg; %Package surface area (m)
global Lpkg; %Packaging film thickness (m)
%Get system input variables
Lpkg = 30*10^-6; %Experimental measurement
Apkg = 0.125; %Experimental measurement
PO2pkg = 1.46*10^-15; %After Chen et al 2000
PCO2pkg = 4.25*10^-15; %After Chen et al 2000
rO2max = 0.356*10^-6; %After Hertog et al 1998
KmO2 = 23.2*10^3; %After Hertog et al 1998
Mtom = 600*10^-3; %Experimental measurement
Vpkg = 0.0012; %Experimental measurement
pO2env = 21*10^3; %After Talasila and Cameron 1997
pCO2env = 0.03*10^3; %After Talasila and Cameron 1997
Ptot = 10^5; %Approximated total pressure (Pa)
RQ = 1; %After Talasila and Cameron 1997
R = 8.314; %Gas constant
Tpkg = (273.15+20); %Experimental measurement
%Initial conditions
nO2pkgin = (21*10^3*Vpkg/(R*Tpkg)); %Initial number of oxgen moles in package headspace (Pa)
nCO2pkgin = (0.03*10^3*Vpkg/(R*Tpkg)); %Initial number of oxgen moles in package headspace (Pa)
Initialconditions = [nO2pkgin,nCO2pkgin];
Appendix G: Numerical Solutions
G-7
%Simulation condition
tSpan = 200;
Day = 7; %Storage day
tStop = Day*24*60*60;
%ODE calculation
[t,Ds]=ode45('PassiveMAP',[0:tSpan:tStop],Initialconditions);
%Plot graphs
plot (t/60/60/24,Ds(:,1)*R*Tpkg*100/Vpkg/Ptot,'r'); %plot O2 concentration (% v/v) in package headspace
hold on
plot (t/60/60/24,Ds(:,2)*R*Tpkg*100/Vpkg/Ptot,'b'); %plot CO2 concentration (% v/v) in package headspace
ylabel ('Concentration (%)');
xlabel ('Day');
legend ('O2','CO2');
legend ('boxoff');
G.2.3 Model inputs for simulations of O2 and CO2
Parameters Units Values Sources
2O
pkflP mol·m·m-2·s-1·Pa-1 1.46 × 10⁻¹⁵ Chen et al (2000)
2CO
pkflP mol·m·m-2·s-1·Pa-1 4.25× 10⁻¹⁵ "
pkflA m2 0.125 Experimentally measured
pkflL m 30 × 10-6 "
2Oenvp kPa 21 Talasila & Cameron (1997)
2COenvp kPa 0.03 Talasila & Cameron (1997)
max
O2r (tomato) mol·s-1·kg-1 0.356 × 10⁻⁶ Hertog et al (1998)
2Omk (tomato) kPa 23.2 Hertog et al (1998)
tomM kg 0.6 Experimentally measured
pkgT K 293.15 "
pkgV m3 0.0012 "
G.3 Analytical solution for mean hexanal vapour concentration in the packaging film
(PDE modelling approach)
As part of an effort to demonstrate no numerical coding errors existed in the MATLAB
solutions, the programme was checked against a number of simplified scenarios where
analytical solution was possible.
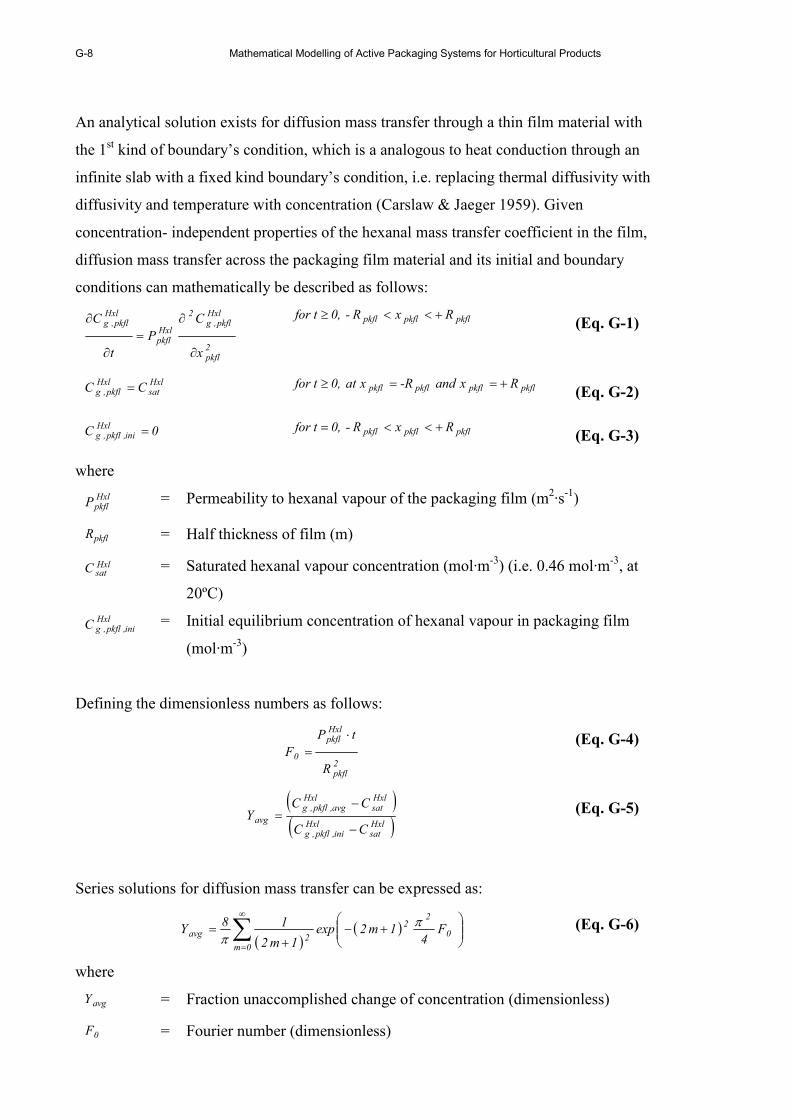
G-8 Mathematical Modelling of Active Packaging Systems for Horticultural Products
An analytical solution exists for diffusion mass transfer through a thin film material with
the 1st kind of boundary’s condition, which is a analogous to heat conduction through an
infinite slab with a fixed kind boundary’s condition, i.e. replacing thermal diffusivity with
diffusivity and temperature with concentration (Carslaw & Jaeger 1959). Given
concentration- independent properties of the hexanal mass transfer coefficient in the film,
diffusion mass transfer across the packaging film material and its initial and boundary
conditions can mathematically be described as follows:
2pkfl
Hxlpkfl,g
2
Hxlpkfl
Hxlpkfl,g
x
C
P
t
C
∂
∂=
∂
∂
pkflpkflpkfl RxR- 0,t for +<<≥ (Eq. G-1)
Hxlsat
Hxlpkfl,g CC = pkflpkflpkflpkfl Rx and -Rx at 0,t for +==≥
(Eq. G-2)
0CHxl
ini,pkfl,g = pkflpkflpkfl RxR- 0,t for +<<= (Eq. G-3)
where
HxlpkflP = Permeability to hexanal vapour of the packaging film (m2·s-1)
pkflR = Half thickness of film (m)
HxlsatC = Saturated hexanal vapour concentration (mol·m-3) (i.e. 0.46 mol·m-3, at
20ºC)
Hxlini,pkfl,gC = Initial equilibrium concentration of hexanal vapour in packaging film
(mol·m-3)
Defining the dimensionless numbers as follows:
2pkfl
Hxlpkfl
0
R
tP
F
⋅=
(Eq. G-4)
( )( )Hxl
satHxl
ini,pkfl,g
Hxlsat
Hxlavg,pkfl,g
avg
CC
CCY
−
−= (Eq. G-5)
Series solutions for diffusion mass transfer can be expressed as:
( )( )
+−
+= ∑
∞
=
0
22
0m2avg F
41m2exp
1m2
18Y
ππ
(Eq. G-6)
where
avgY = Fraction unaccomplished change of concentration (dimensionless)
0F = Fourier number (dimensionless)

Appendix G: Numerical Solutions
G-9
Hxlavg,pkfl,gC = Mean equilibrium concentration of hexanal vapour in film (mol·m
-3)
m = Term in series solution (given as 5 terms)
The mean concentration of equilibrium hexanal vapour in the packaging films from the
analytical solution (m = 5) was compared with that produced by the numerical
(MATLAB) solution using the same situations as described above and the results are
shown in Figure G-1. It can be seen that the mean concentration obtained by both solution
methods agree well and the maximum difference for the values is < 700 ppm. A small
difference is observed only at the commencement of the simulation (t = 0) where more
than 5 terms are needed in the analytical solution to achieved accurate predictions, but
from this point forward differences are virtually absent. The finding indicates that the term
formulated to describe the mass transfer through the packaging film (thin slab) has been
correctly implemented in the model.
0 1 2 3 4 5 60
2000
4000
6000
8000
10000
12000
Time (seconds)
Concentration (ppm)
numerical
analytical
Figure G-1 Comparison of mean concentrations of equilibrium hexanal vapour in the
packaging film from analytical (m = 5) and numerical solutions for diffusion mass transfer
with the first kind of boundary condition.

G-10 Mathematical Modelling of Active Packaging Systems for Horticultural Products
G.4 Analytical solution for hexanal permeation across the sachet film (steady-state
modelling approach)
Similar checking was performed on other parts of the model. One check was to simplify
the steady-state of hexanal permeation across the sachet film as follows:
• Hxlbed,g
C is assumed to be constant and equals to the saturated vapour concentration at
20ºC (0.46 mol·m-3)
• no mass transfer out of package headspace to the environment
• hexanal permeability of film is independent of hexanal vapour concentration
• no packaged tomatoes in the bag
According to the assumptions made above, the ODE describing the change in headspace
concentration can be described as Eq.G-7.
( )Hxlpkhs
Hxlbed,g
scfl
pkgscflHxlscfl
Hxlpkhs
pkg CCL
RTAP
dt
dCV −= (Eq. G-7)
Given
pkgscfl
pkgscflHxlscfl
scflVL
RTAPk = (Eq. G-8)
where
scflk = Constant in simplified ODE (s-1)
Substituting Eq. G-8 in Eq. G-7 yields Eq. G-9.
( )Hxlpkhs
Hxlbed,gscfl
Hxlpkhs
CCkdt
dC−= (Eq. G-9)
Rearranging Eq. G-9 gives:
( )dtk
CC
dC
scflHxlpkhs
Hxlbed,g
Hxlpkhs
=−
(Eq. G-10)
Separating variables and integrating according to initial condition 0C ; 0t Hxlpkhs
== , gives:
( )tscflkHxlbed,g
Hxlpkhs
e1CC ⋅−−= (Eq. G-11)

Appendix G: Numerical Solutions
G-11
A comparison between the analytical solution and the numerical one solved by MATLAB
when these simplifications were made by setting input values in the code to appropriate
values (e.g. setting package film permeability = 0). This comparison is shown in Figure
G-2 and it suggests good agreement of both results (with the maximum difference < 31
ppm). A small difference was observed only at the commencement of simulation (t = 0),
but from this point forward differences are virtually absent. This finding confirms that the
term describing diffusion of hexanal across the sachet film material has been correctly
implemented in the model.
0 2 4 6 8 10 12 140
2000
4000
6000
8000
10000
12000
Days
Concentration (ppm)
numerical
analytical
Figure G-2 Comparison of the numerical and analytical solutions for package headspace
hexanal concentration, of which hexanal mass transfer across sachet film was modelled
using steady-state approach

G-12 Mathematical Modelling of Active Packaging Systems for Horticultural Products
Appendix H: Model Validation
H-1
Appendix H
MODEL VALIDATIONS
H.1 Controlled release sachet preparations
Experimental procedures to prepare hexanal controlled release sachets are provided as
follows:
Silica gel adsorbent samples having slightly higher than desired amounts (i.e. 5% above
1.5, 3.0 and 4.5 g) were placed in aluminium moisture cans and dried in an oven at 110ºC
for ten hours. Afterward the aluminium cans were covered with aluminium lids and cooled
in a desiccator for three hours at ambient condition. The cooled aluminium weighing dish
were weighed (recorded as the gross weight) and dry weight of silica gel samples was
obtained by subtracting the known weight of the weighing dish from the gross weight. The
dry silica gel samples were then placed into individual 50 ml borosilicate flasks, and ~3-5
ml hexanal liquid (97% GC grade, Sigma-Aldrich, US) were added. Each flask was
covered with a flask cap and transferred to a shaker (Orbital Incubator, Gallenkamp,
Leicester, UK) for shaking at 40 rpm for at least one week and three days at 10 and 20ºC,
respectively. From preliminary work, these timeframes provided maximum uptake
compared to that resulting from shaking for longer periods.
After shaking, the saturated silica gel samples were transferred to a vacuum filter to
remove excess hexanal liquid. The filtered silica gel sample was then transferred to an
aluminium weighing dish and weighed. The weight of adsorbed hexanal was obtained by
subtracting the known weight of the aluminium can and dry silica gel from the aluminium
can with the saturated silica gel. It should be noted that experimental adsorbed amounts
were slightly higher (on average less than 1.7-fold) than those predicted by Langmuir
isotherm model (Eq. 2-3; coefficients as shown in Table 4-9) given 1pp s ≈ and these
were presumably attributed to presences of thin films of excess hexanal liquid in the carrier
bed (as discussed in Chatper 6). However comparable results of experimental and
predicted data suggest that sorption isotherm quantified by gravimetric method is sensible.
Silica gels from individual cans were individually packed and immediately sealed into a
5×6 cm sachet which was composed on one side of Tyvek, LDPE or OPP material, and,
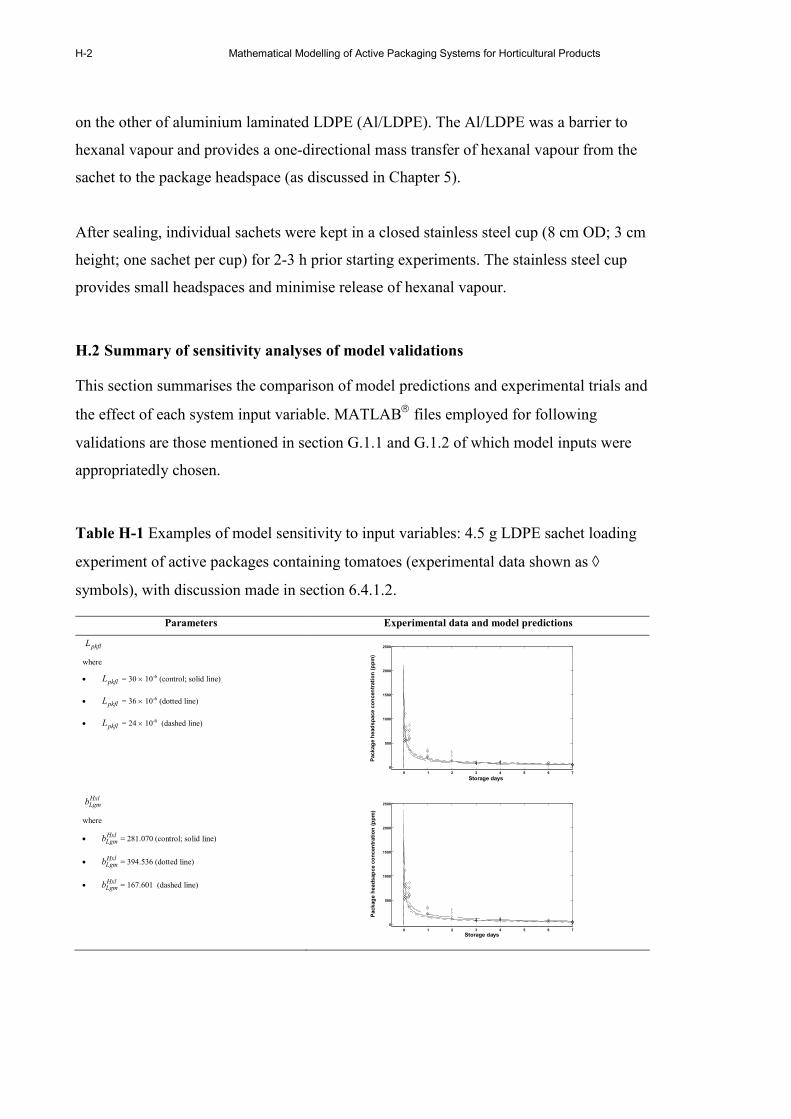
H-2 Mathematical Modelling of Active Packaging Systems for Horticultural Products
on the other of aluminium laminated LDPE (Al/LDPE). The Al/LDPE was a barrier to
hexanal vapour and provides a one-directional mass transfer of hexanal vapour from the
sachet to the package headspace (as discussed in Chapter 5).
After sealing, individual sachets were kept in a closed stainless steel cup (8 cm OD; 3 cm
height; one sachet per cup) for 2-3 h prior starting experiments. The stainless steel cup
provides small headspaces and minimise release of hexanal vapour.
H.2 Summary of sensitivity analyses of model validations
This section summarises the comparison of model predictions and experimental trials and
the effect of each system input variable. MATLAB files employed for following
validations are those mentioned in section G.1.1 and G.1.2 of which model inputs were
appropriatedly chosen.
Table H-1 Examples of model sensitivity to input variables: 4.5 g LDPE sachet loading
experiment of active packages containing tomatoes (experimental data shown as ◊
symbols), with discussion made in section 6.4.1.2.
Parameters Experimental data and model predictions
pkflL
where
• pkflL = 30 × 10-6 (control; solid line)
• pkflL = 36 × 10-6 (dotted line)
• pkflL = 24 × 10-6 (dashed line)
0 1 2 3 4 5 6 7
0
500
1000
1500
2000
2500
Storage days
Package headspace concentration (ppm)
HxlLgmb
where
• HxlLgmb = 281.070 (control; solid line)
• HxlLgmb = 394.536 (dotted line)
• HxlLgmb = 167.601 (dashed line)
0 1 2 3 4 5 6 7
0
500
1000
1500
2000
2500
Storage days
Package headsapce concentration (ppm)
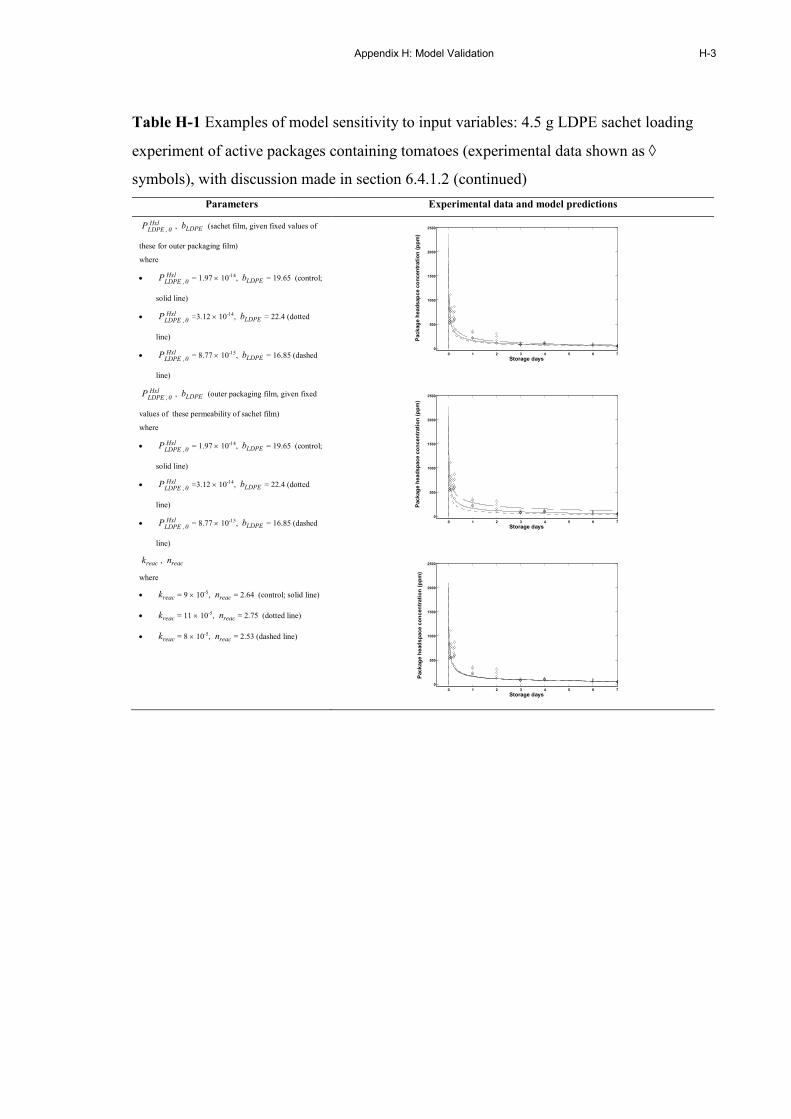
Appendix H: Model Validation
H-3
Table H-1 Examples of model sensitivity to input variables: 4.5 g LDPE sachet loading
experiment of active packages containing tomatoes (experimental data shown as ◊
symbols), with discussion made in section 6.4.1.2 (continued)
Parameters Experimental data and model predictions
Hxl0,LDPE
P , LDPEb (sachet film, given fixed values of
these for outer packaging film)
where
• Hxl0,LDPE
P = 1.97 × 10⁻¹⁴, LDPEb = 19.65 (control;
solid line)
• Hxl0,LDPE
P =3.12 × 10⁻¹⁴, LDPEb = 22.4 (dotted
line)
• Hxl0,LDPE
P = 8.77 × 10⁻¹⁵, LDPEb = 16.85 (dashed
line)
0 1 2 3 4 5 6 7
0
500
1000
1500
2000
2500
Storage days
Package headsapce concentration (ppm)
Hxl0,LDPE
P , LDPEb (outer packaging film, given fixed
values of these permeability of sachet film)
where
• Hxl0,LDPE
P = 1.97 × 10⁻¹⁴, LDPEb = 19.65 (control;
solid line)
• Hxl0,LDPE
P =3.12 × 10⁻¹⁴, LDPEb = 22.4 (dotted
line)
• Hxl0,LDPE
P = 8.77 × 10⁻¹⁵, LDPEb = 16.85 (dashed
line)
0 1 2 3 4 5 6 7
0
500
1000
1500
2000
2500
Storage days
Package headspace concentration (ppm)
reack , reacn
where
• reack = 9 × 10⁻⁵, reacn = 2.64 (control; solid line)
• reack = 11 × 10-5, reacn = 2.75 (dotted line)
• reack = 8 × 10⁻⁵, reacn = 2.53 (dashed line)
0 1 2 3 4 5 6 7
0
500
1000
1500
2000
2500
Storage days
Package headspace concentration (ppm)
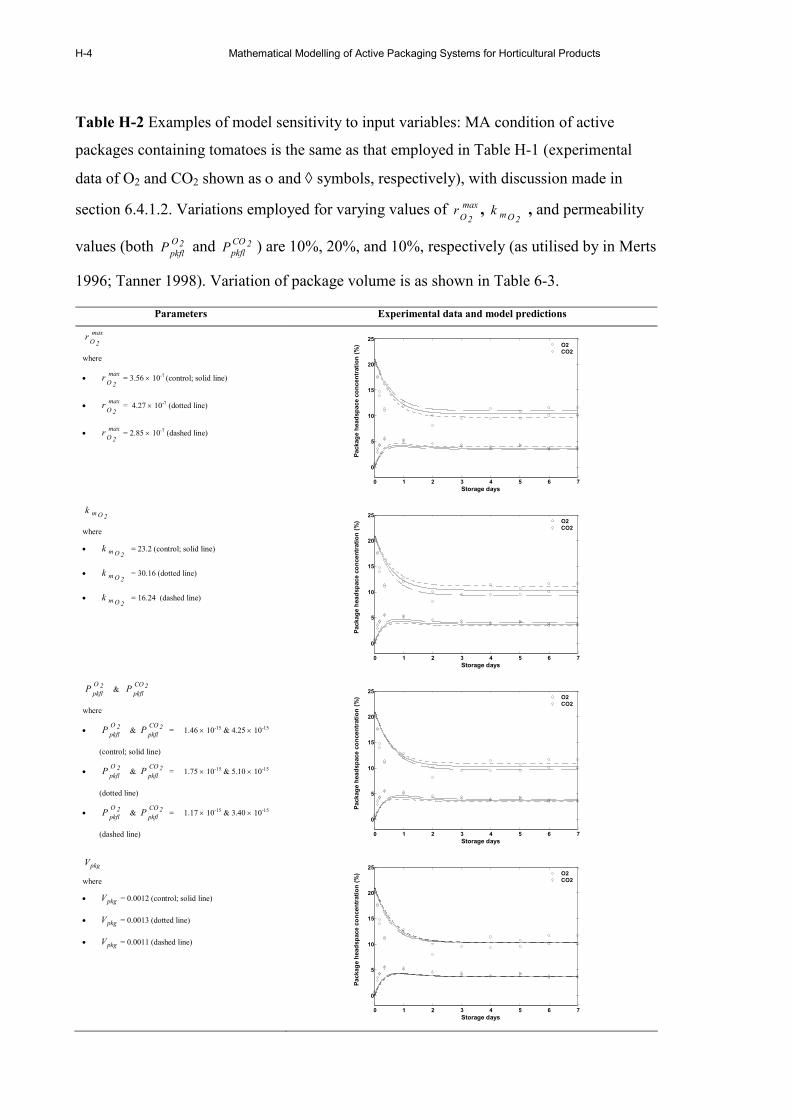
H-4 Mathematical Modelling of Active Packaging Systems for Horticultural Products
Table H-2 Examples of model sensitivity to input variables: MA condition of active
packages containing tomatoes is the same as that employed in Table H-1 (experimental
data of O2 and CO2 shown as ο and ◊ symbols, respectively), with discussion made in
section 6.4.1.2. Variations employed for varying values of max
2Or ,
2Omk , and permeability
values (both 2O
pkflP and 2CO
pkflP ) are 10%, 20%, and 10%, respectively (as utilised by in Merts
1996; Tanner 1998). Variation of package volume is as shown in Table 6-3.
Parameters Experimental data and model predictions
max
2Or
where
• max
2Or = 3.56 × 10⁻⁷ (control; solid line)
• max
2Or = 4.27 × 10⁻⁷ (dotted line)
• max
2Or = 2.85 × 10⁻⁷ (dashed line)
0 1 2 3 4 5 6 7
0
5
10
15
20
25
Storage days
Package headspace concentration (%) O2
CO2
2Omk
where
• 2Omk = 23.2 (control; solid line)
• 2Omk = 30.16 (dotted line)
• 2Omk = 16.24 (dashed line)
0 1 2 3 4 5 6 7
0
5
10
15
20
25
Storage days
Package headspace concentration (%) O2
CO2
2O
pkflP & 2CO
pkflP
where
• 2O
pkflP & 2CO
pkflP = 1.46 × 10⁻¹⁵ & 4.25 × 10⁻¹⁵
(control; solid line)
• 2O
pkflP & 2CO
pkflP = 1.75 × 10⁻¹⁵ & 5.10 × 10⁻¹⁵
(dotted line)
• 2O
pkflP & 2CO
pkflP = 1.17 × 10⁻¹⁵ & 3.40 × 10⁻¹⁵
(dashed line) 0 1 2 3 4 5 6 7
0
5
10
15
20
25
Storage days
Package headspace concentration (%) O2
CO2
pkgV
where
• pkgV = 0.0012 (control; solid line)
• pkgV = 0.0013 (dotted line)
• pkgV = 0.0011 (dashed line)
0 1 2 3 4 5 6 7
0
5
10
15
20
25
Storage days
Package headspace concentration (%) O2
CO2
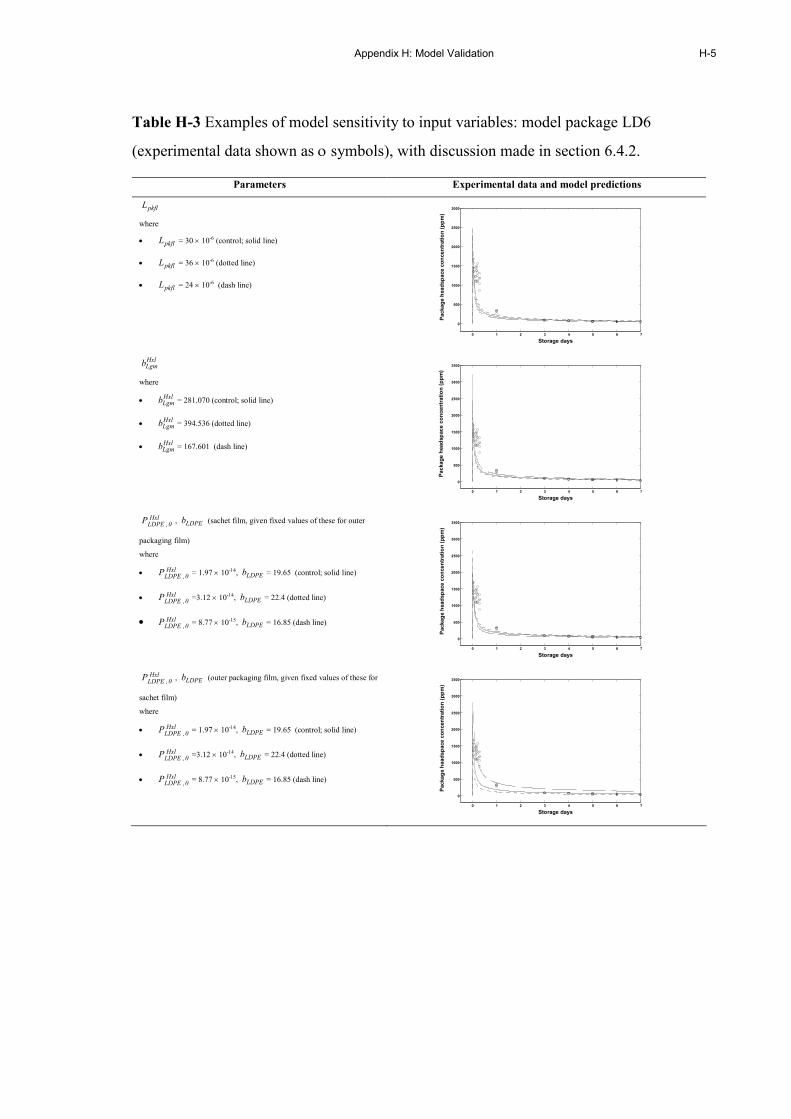
Appendix H: Model Validation
H-5
Table H-3 Examples of model sensitivity to input variables: model package LD6
(experimental data shown as ο symbols), with discussion made in section 6.4.2.
Parameters Experimental data and model predictions
pkflL
where
• pkflL = 30 × 10-6 (control; solid line)
• pkflL = 36 × 10-6 (dotted line)
• pkflL = 24 × 10-6 (dash line)
0 1 2 3 4 5 6 7
0
500
1000
1500
2000
2500
3000
Storage days
Package headspace concentration (ppm)
HxlLgmb
where
• HxlLgmb = 281.070 (control; solid line)
• HxlLgmb = 394.536 (dotted line)
• HxlLgmb = 167.601 (dash line)
0 1 2 3 4 5 6 7
0
500
1000
1500
2000
2500
3000
3500
Storage days
Package headspace concentration (ppm)
Hxl0,LDPE
P , LDPEb (sachet film, given fixed values of these for outer
packaging film)
where
• Hxl0,LDPE
P = 1.97 × 10⁻¹⁴, LDPEb = 19.65 (control; solid line)
• Hxl0,LDPE
P =3.12 × 10⁻¹⁴, LDPEb = 22.4 (dotted line)
• Hxl0,LDPE
P = 8.77 × 10⁻¹⁵, LDPEb = 16.85 (dash line)
0 1 2 3 4 5 6 7
0
500
1000
1500
2000
2500
3000
3500
Storage days
Package headspace concentration (ppm)
Hxl0,LDPE
P , LDPEb (outer packaging film, given fixed values of these for
sachet film)
where
• Hxl0,LDPE
P = 1.97 × 10⁻¹⁴, LDPEb = 19.65 (control; solid line)
• Hxl0,LDPE
P =3.12 × 10⁻¹⁴, LDPEb = 22.4 (dotted line)
• Hxl0,LDPE
P = 8.77 × 10⁻¹⁵, LDPEb = 16.85 (dash line)
0 1 2 3 4 5 6 7
0
500
1000
1500
2000
2500
3000
3500
Storage days
Package headspace concentration (ppm)
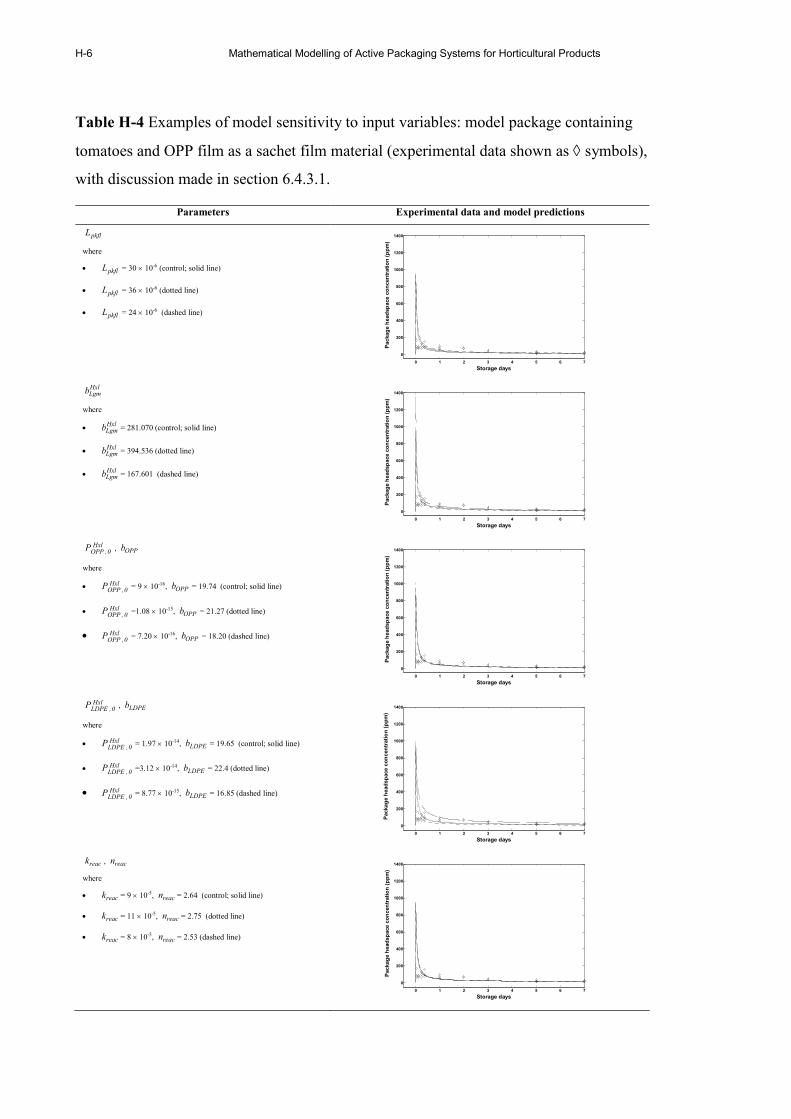
H-6 Mathematical Modelling of Active Packaging Systems for Horticultural Products
Table H-4 Examples of model sensitivity to input variables: model package containing
tomatoes and OPP film as a sachet film material (experimental data shown as ◊ symbols),
with discussion made in section 6.4.3.1.
Parameters Experimental data and model predictions
pkflL
where
• pkflL = 30 × 10-6 (control; solid line)
• pkflL = 36 × 10-6 (dotted line)
• pkflL = 24 × 10-6 (dashed line)
0 1 2 3 4 5 6 7
0
200
400
600
800
1000
1200
1400
Storage days
Package headspace concentration (ppm)
HxlLgmb
where
• HxlLgmb = 281.070 (control; solid line)
• HxlLgmb = 394.536 (dotted line)
• HxlLgmb = 167.601 (dashed line)
0 1 2 3 4 5 6 7
0
200
400
600
800
1000
1200
1400
Storage days
Package headspace concentration (ppm)
Hxl0,OPP
P , OPPb
where
• Hxl0,OPP
P = 9 × 10-16, OPPb = 19.74 (control; solid line)
• Hxl0,OPP
P =1.08 × 10⁻¹⁵, OPPb = 21.27 (dotted line)
• Hxl0,OPP
P = 7.20 × 10⁻¹⁶, OPPb = 18.20 (dashed line)
0 1 2 3 4 5 6 7
0
200
400
600
800
1000
1200
1400
Storage days
Package headspace concentration (ppm)
Hxl0,LDPE
P , LDPEb
where
• Hxl0,LDPE
P = 1.97 × 10⁻¹⁴, LDPEb = 19.65 (control; solid line)
• Hxl0,LDPE
P =3.12 × 10⁻¹⁴, LDPEb = 22.4 (dotted line)
• Hxl0,LDPE
P = 8.77 × 10⁻¹⁵, LDPEb = 16.85 (dashed line)
0 1 2 3 4 5 6 7
0
200
400
600
800
1000
1200
1400
Storage days
Package headspace concentration (ppm)
reack , reacn
where
• reack = 9 × 10⁻⁵, reacn = 2.64 (control; solid line)
• reack = 11 × 10-5, reacn = 2.75 (dotted line)
• reack = 8 × 10⁻⁵, reacn = 2.53 (dashed line)
0 1 2 3 4 5 6 7
0
200
400
600
800
1000
1200
1400
Storage days
Package headspace concentration (ppm)

Appendix H: Model Validation
H-7
Table H-5 Examples of model sensitivity to input variables: model package containing
tomatoes and Tyvek film as a sachet film material (experimental data shown as ◊
symbols), with discussion made in section 6.4.3.2.
Parameters Experimental data and model predictions
pkflL
where
• pkflL = 30 × 10-6 (control; solid line)
• pkflL = 36 × 10-6 (dotted line)
• pkflL = 24 × 10-6 (dashed line)
0 1 2 3 4 5 6 7
0
500
1000
1500
2000
2500
Storage days
Package headspace concentration (ppm)
HxlLgmb
where
• HxlLgmb = 281.070 (control; solid line)
• HxlLgmb = 394.536 (dotted line)
• HxlLgmb = 167.601 (dashed line)
0 1 2 3 4 5 6 7
0
500
1000
1500
2000
2500
Storage days
Package headspace concentration (ppm)
Hxl0,Tyvek
P , Tyvekb
where
• Hxl0,Tyvek
P = 1.97 × 10⁻¹⁴, Tyvekb = 19.65 (control; solid line)
• Hxl0,Tyvek
P =3.12 × 10⁻¹⁴, Tyvekb = 22.4 (dotted line)
• Hxl0,Tyvek
P = 8.77 × 10⁻¹⁵, Tyvekb = 16.85 (dashed line)
0 1 2 3 4 5 6 7
0
500
1000
1500
2000
2500
Storage days
Package headsapce concentration (ppm)
Hxl0,LDPE
P , LDPEb
where
• Hxl0,LDPE
P = 1.97 × 10⁻¹⁴, LDPEb = 19.65 (control; solid line)
• Hxl0,LDPE
P =3.12 × 10⁻¹⁴, LDPEb = 22.4 (dotted line)
• Hxl0,LDPE
P = 8.77 × 10⁻¹⁵, LDPEb = 16.85 (dashed line)
0 1 2 3 4 5 6 7
0
500
1000
1500
2000
2500
Storage days
Package headspace concentration (ppm)
reack , reacn
where
• reack = 9 × 10⁻⁵, reacn = 2.64 (control; solid line)
• reack = 11 × 10-5, reacn = 2.75 (dotted line)
• reack = 8 × 10⁻⁵, reacn = 2.53 (dashed line)
0 1 2 3 4 5 6 7
0
500
1000
1500
2000
2500
Storage days
Package headspace concentration (ppm)
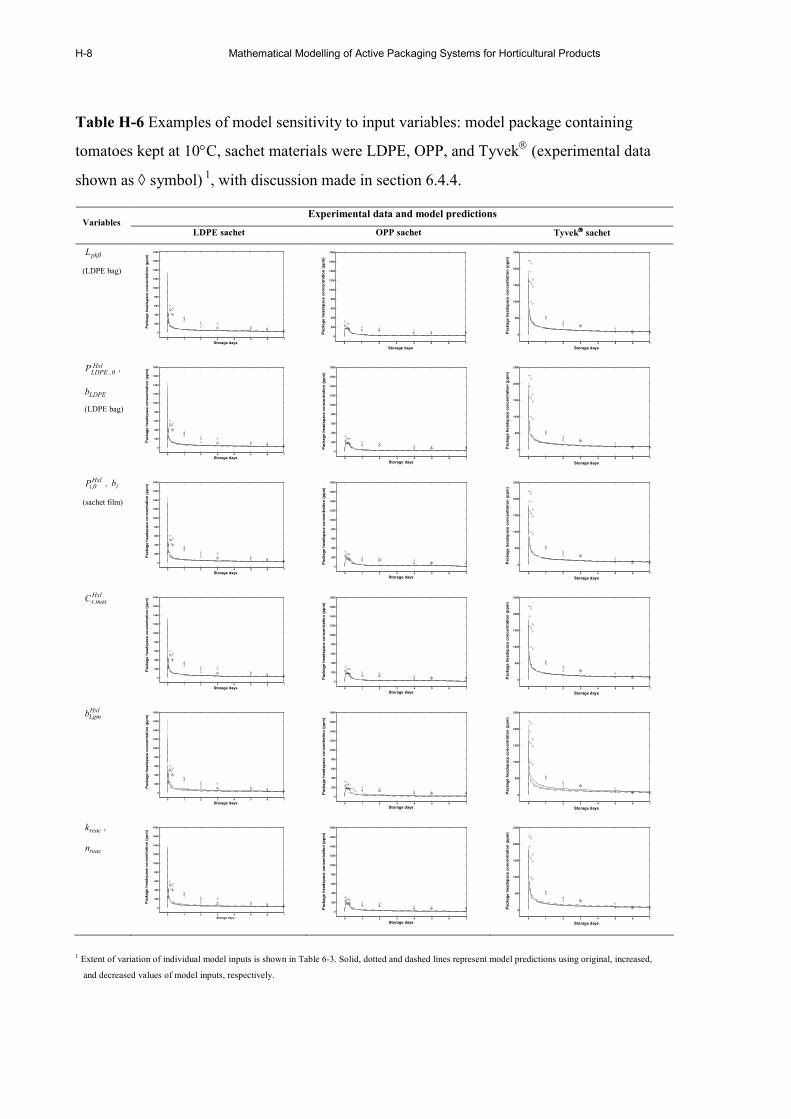
H-8 Mathematical Modelling of Active Packaging Systems for Horticultural Products
Table H-6 Examples of model sensitivity to input variables: model package containing
tomatoes kept at 10°C, sachet materials were LDPE, OPP, and Tyvek (experimental data
shown as ◊ symbol) 1, with discussion made in section 6.4.4.
Experimental data and model predictions Variables
LDPE sachet OPP sachet Tyvek sachet
pkflL
(LDPE bag)
0 1 2 3 4 5 6 7
0
200
400
600
800
1000
1200
1400
1600
1800
Storage days
Package headspace concentration (ppm)
0 1 2 3 4 5 6 7
0
200
400
600
800
1000
1200
1400
1600
1800
Storage days
Package headspace concentration (ppm)
0 1 2 3 4 5 6 7
0
500
1000
1500
2000
2500
Storage days
Package headspace concentration (ppm)
Hxl0,LDPE
P ,
LDPEb
(LDPE bag)
0 1 2 3 4 5 6 7
0
200
400
600
800
1000
1200
1400
1600
1800
Storage days
Package headspace concentration (ppm)
0 1 2 3 4 5 6 7
0
200
400
600
800
1000
1200
1400
1600
1800
Storage days
Package headspace concentration (ppm)
0 1 2 3 4 5 6 7
0
500
1000
1500
2000
2500
Storage days
Package headspace concentration (ppm)
Hxl0,iP , ib
(sachet film)
0 1 2 3 4 5 6 7
0
200
400
600
800
1000
1200
1400
1600
1800
Storage days
Package headspace concentration (ppm)
0 1 2 3 4 5 6 7
0
200
400
600
800
1000
1200
1400
1600
1800
Storage days
Package headspace concentration (ppm)
0 1 2 3 4 5 6 7
0
500
1000
1500
2000
2500
Storage days
Package headspace concentration (ppm)
Hxlmax,sC
0 1 2 3 4 5 6 7
0
200
400
600
800
1000
1200
1400
1600
1800
Storage days
Package headspace concentration (ppm)
0 1 2 3 4 5 6 7
0
200
400
600
800
1000
1200
1400
1600
1800
Storage days
Package headspace concentration (ppm)
0 1 2 3 4 5 6 7
0
500
1000
1500
2000
2500
Storage days
Package headspace concentration (ppm)
HxlLgmb
0 1 2 3 4 5 6 7
0
200
400
600
800
1000
1200
1400
1600
1800
Storage days
Package headspace concentration (ppm)
0 1 2 3 4 5 6 7
0
200
400
600
800
1000
1200
1400
1600
1800
Storage days
Package headspace concentration (ppm)
0 1 2 3 4 5 6 7
0
500
1000
1500
2000
2500
Storage days
Package headspace concentration (ppm)
reack ,
reacn
0 1 2 3 4 5 6 7
0
200
400
600
800
1000
1200
1400
1600
1800
Storage days
Package headspace concentration (ppm)
0 1 2 3 4 5 6 7
0
200
400
600
800
1000
1200
1400
1600
1800
Storage days
Package headspace concentration (ppm)
0 1 2 3 4 5 6 7
0
500
1000
1500
2000
2500
Storage days
Package headspace concentration (ppm)
1 Extent of variation of individual model inputs is shown in Table 6-3. Solid, dotted and dashed lines represent model predictions using original, increased,
and decreased values of model inputs, respectively.
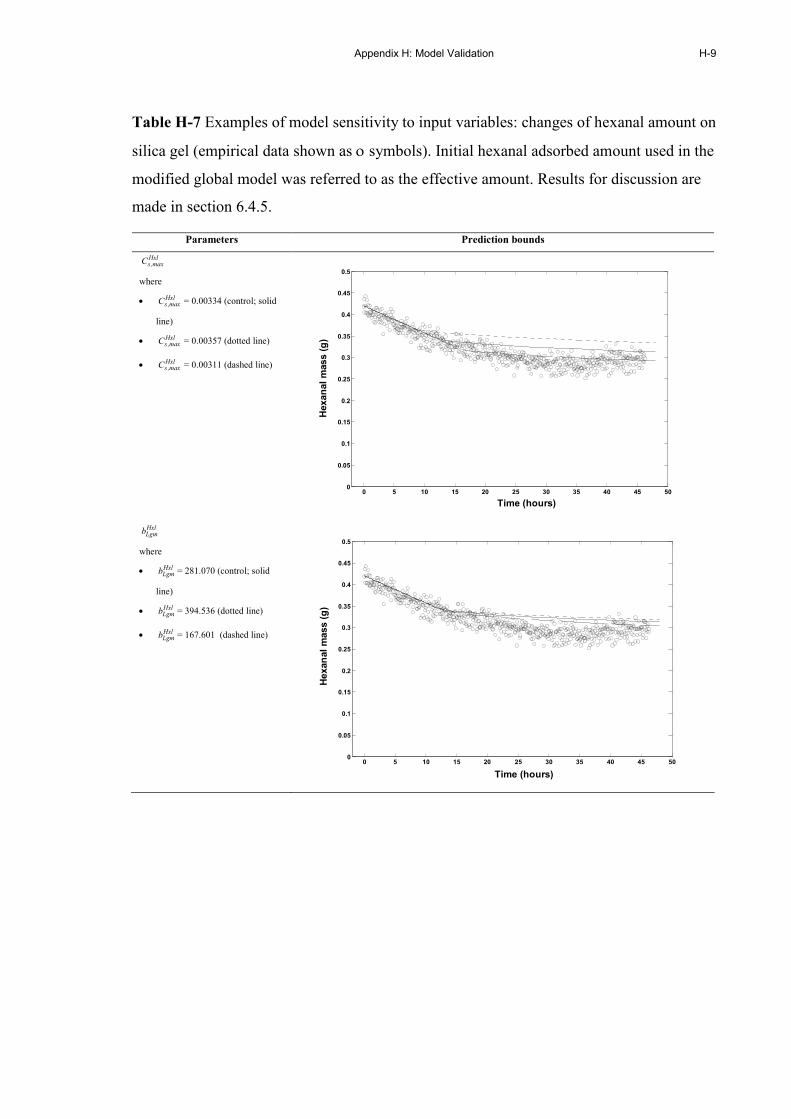
Appendix H: Model Validation
H-9
Table H-7 Examples of model sensitivity to input variables: changes of hexanal amount on
silica gel (empirical data shown as ο symbols). Initial hexanal adsorbed amount used in the
modified global model was referred to as the effective amount. Results for discussion are
made in section 6.4.5.
Parameters Prediction bounds
Hxlmax,sC
where
• Hxlmax,sC = 0.00334 (control; solid
line)
• Hxlmax,sC = 0.00357 (dotted line)
• Hxlmax,sC = 0.00311 (dashed line)
0 5 10 15 20 25 30 35 40 45 500
0.05
0.1
0.15
0.2
0.25
0.3
0.35
0.4
0.45
0.5
Time (hours)
Hexanal mass (g)
HxlLgmb
where
• HxlLgmb = 281.070 (control; solid
line)
• HxlLgmb = 394.536 (dotted line)
• HxlLgmb = 167.601 (dashed line)
0 5 10 15 20 25 30 35 40 45 500
0.05
0.1
0.15
0.2
0.25
0.3
0.35
0.4
0.45
0.5
Time (hours)
Hexanal mass (g)

H-10 Mathematical Modelling of Active Packaging Systems for Horticultural Products