Exercise No. 1 Preparation of Saturated Paste and saturation ...
Upload
khangminh22Category
view
2download
0
MEASUREMENT OF SOLIDS IN TOMATO PASTE AND THE COMPOSITION
AND PROPERTIES OF THE SOLUBLE SOLIDS FRACTION
A Thesis
Presented to
The Faculty of Graduate Studies
of
The University of Guelph
by
SAHAR JAZAERI
In partial fulfilment of requirements
for the degree of
Master of Science
March, 2009
©Sahar Jazaeri, 2009
1*1 Library and Archives Canada
Published Heritage Branch
395 Wellington Street Ottawa ON K1A 0N4 Canada
Bibliotheque et Archives Canada
Direction du Patrimoine de I'edition
395, rue Wellington Ottawa ON K1A 0N4 Canada
Your file Votre r6f6rence ISBN: 978-0-494-60400-7 Our file Notre r6f6rence ISBN: 978-0-494-60400-7
NOTICE: AVIS:
The author has granted a nonexclusive license allowing Library and Archives Canada to reproduce, publish, archive, preserve, conserve, communicate to the public by telecommunication or on the Internet, loan, distribute and sell theses worldwide, for commercial or noncommercial purposes, in microform, paper, electronic and/or any other formats.
L'auteur a accorde une licence non exclusive permettant a la Bibliotheque et Archives Canada de reproduire, publier, archiver, sauvegarder, conserver, transmettre au public par telecommunication ou par I'lnternet, preter, distribuer et vendre des theses partout dans le monde, a des fins commerciales ou autres, sur support microforme, papier, electronique et/ou autres formats.
The author retains copyright ownership and moral rights in this thesis. Neither the thesis nor substantial extracts from it may be printed or otherwise reproduced without the author's permission.
L'auteur conserve la propriete du droit d'auteur et des droits moraux qui protege cette these. Ni la these ni des extraits substantiels de celle-ci ne doivent etre imprimes ou autrement reproduits sans son autorisation.
In compliance with the Canadian Privacy Act some supporting forms may have been removed from this thesis.
Conformement a la loi canadienne sur la protection de la vie privee, quelques formulaires secondaires ont ete enleves de cette these.
While these forms may be included in the document page count, their removal does not represent any loss of content from the thesis.
Bien que ces formulaires aient inclus dans la pagination, il n'y aura aucun contenu manquant.
• + •
Canada

ABSTRACT
MEASUREMENT OF SOLIDS IN TOMATO PASTE AND THE
COMPOSITION AND PROPERTIES OF THE SOLUBLE SOLIDS FRACTION
SAHAR JAZAERI Advisor: University of Guelph, March 2009 Dr.Yukio Kakuda
This thesis is an evaluation of two analytical procedures in the determination
of total, soluble solids and insoluble solids in tomato paste.
The microwave oven method was compared to the vacuum oven method. The
vacuum oven method measures each solids fraction in the paste directly while
the microwave method measures the total solids directly but employs an
equation to calculate soluble and insoluble solids. The microwave method was
faster and less labour intensive but gave small but significantly higher values for
total (%) and insoluble solids (%) and lower values for soluble solids. These
small differences although significant may not be important at the production
level and therefore the microwave method is recommended for use by the
industry. Additionally the soluble solids fraction showed to contain large amounts
of lycopene-rich particles held in suspension. These particles were destabilized
with pectinase treatment causing their precipitation. The presence of nitrogen in
the soluble fraction and the loss of stability following pectinase treatment
suggests that the particle is a pectin-polypeptide-lycopene complex.
ACKNOWLEDGEMENTS
I am in debt to my advisor, Dr. Yukio Kakuda for his scientific advises, support
and patience through my study. I am also grateful to my advisory committee, Dr.
Gopinadhan Paliyath and Dr. Steve Gismondi for their constructive guidance.
It is an opportunity to thank Dr.Milena Corredig and Dr.Massimo Marcone for
their encouragements and providing new source of information and insight
through this investigation.
I specially thanks my friends Saeed Rahimi Yazdi , Azadeh (Rose) Namvar
and Azadeh Koushan who helped me through my research by sharing their
academic knowledge and friendship.
Also I would like to express my great gratitude to Douglas Wigle who shared
his experience and knowledge through all parts of this research.
Finally, I would like to thank my family, my mother ,Mina Kazemi Kourdestani,
and sisters, Khandan , Sadaf and my brother in law Farzam for their love,
support.
To my lovely family, Mina, Khandan and Sadaf
i
Table of Contents Page
Chapter 1
MEASUREMENT OF SOLIDS IN TOMATO PASTE
1.1 Introduction 1
1.2 Literature Review 8
1.2.1 Tomato 8
1.2.2 Tomato Paste 9
1.2.3 Tomato Paste Processing 10
1.2.4 Total Solids 12
1.2.4.1 Total Solids: AOAC Method 13
1.2.4.1.a Vacuum Oven Method of AOAC 13
1.2.4.1.D Microwave Oven Method of AOAC 15
1.2.4.2 Total Solids: Canadian Method 16
1.2.4.3 Total Solids by NTSS: United State Method 17
1.2.5 Water Soluble Solids 19
1.2.5.1 Soluble Solids: AOAC Method 19
1.2.5.2 Soluble Solids: Formula Method 21
1.2.6 Water Insoluble Solids 22
1.2.6.1 Water Insoluble Solids: AOAC Method 22
1.2.6.2 Water Insoluble Solids: Formula Method 22
1.3 Experimental 25
1.3.1 Material and Equipment 25
ii

1.3.2 Methods 26
1.3.2.1 Vacuum Oven Methods 26
1.3.2.1.a Total Solids (Vacuum Oven) 26
1.3.2.1.a.b Sample Preparation 26
1.3.2.1.a.c Procedure 27
1.3.2.1 .b Water Insoluble Solids (Vacuum Oven) 28
1.3.2.1.b.a Sample Preparation 29
1.3.2.1.b.b Procedure 29
1.3.2.1 .c Water Soluble Solids (Vacuum Oven) 31
1.3.2.1.c.a Sample Preparation 31
1.3.2.1.c.b Procedure 31
1.3.2.2 Microwave Oven Method 32
1.3.2.2.a Total Solid (Microwave Oven) 32
1.3.2.2.a.b Sample Preparation 33
1.3.2.2.a.c Procedure 33
1.3.2.2.b Water Insoluble Solid (Microwave Oven) 34
1.3.2.2.C Solids in Supernatant Fraction
(Microwave) 34
1.3.2.2.c.a Sample Preparation 34
1.3.2.2.c.b Procedure 35
1.3.2.2.d Water Soluble Solid (Microwave Oven) 35
1.4 Results 37
1.4.1 Vacuum Oven Method 37
1.4.1.1 Total Solids (vacuum Oven) 37
iii
1.4.1.2 Water Insoluble Solids (Vacuum Oven) 37
1.4.1.3 Water Soluble Solids (Vacuum Oven) 38
1.4.2 Microwave Oven Method 38
1.4.2.1 Total Solid (Microwave Oven) 39
1.4.2.2 Solids in the Soluble Supernatant (Microwave Oven) 39
1.4.2.3 Water Insoluble Solids (Microwave Oven) 40
1.4.2.4 Soluble Solids (Microwave Oven) 40
1.4.3 Comparison of Methods (Microwave vs. Vacuum oven) 41
1.5 Statistical Analysis 42
1.5.1 Repeatability (Vacuum and Microwave Oven) 42
1.5.1.1 Total Solids (Vacuum Oven) 42
1.5.1.2 Water Insoluble Solids (Vacuum Oven) 43
1.5.1.3 Water Soluble Solid (Vacuum Oven) 43
1.5.1.4 Total solids (Microwave Oven) 43
1.5.1.5 Solids in the Supernatant Fraction (Microwave Oven) ....43
1.5.2 Comparison of Methods (Vacuum vs. Microwave Oven) 43
1.5.2.1 Total Solids (Vacuum vs. Microwave oven) 43
1.5.2.1.a Equality of the Methods (Total Solids) 43
1.5.2.1 .b Regression Equation of the Methods
(Total Solids) 44
1.5.2.1.C Regression of Exact Equality (Total Solids) 44
1.5.2.1.d Average Error Between Methods (Total Solids) 45
1.5.2.2 Water Insoluble Solids (Vacuum vs. Microwave oven) ....46
iv
1.5.2.2.a Equality of the methods
(Water Insoluble Solids) 46
1.5.2.2.D Regression Equation of the Methods (Water Insoluble Solids) 46
1.5.2.2.c The Regression of Exact Equality (Water Insoluble Solids) 46
1.5.2.2.d Average Error Between Methods
(Water Insoluble Solids) 47
1.5.2.3 Water Soluble Solid (Microwave vs. Vacuum oven) 47
1.5.2.3.a Equality of the Methods (Water Soluble Solids) 47
1.5.2.3.b Regression Equation of the Methods (Water Soluble Solids) 48
1.5.2.3.C Regression of Exact Equality (Water Soluble Solids) 48
1.5.2.3.d Average Difference of the Methods (Water Insoluble Solids) 49
1.6 Discussion 50
V
Page
Chapter 2
THE COMPOSITION AND PROPERTIES OF THE SOLUBLE SOLIDS
FRACTION
2.1 Introduction 52
2.2 Literature Review 53
2.2.1 Tomato Composition 53
2.2.1.1 Solids in Tomato 53
2.2.1.2 Tomato Chromoplasts 57
2.2.2 Lycopene 59
2.2.2.1 Lycopene in Tomato 59
2.2.2.2 Lycopene Structure 60
2.2.2.3 Lycopene Isomers in Tomato 60
2.2.2.4 Lycopene and Health Benefits 61
2.2.2.5 Lycopene Extraction by Enzyme 61
2.2.2.6 Lycopene and Tomato Processing 62
2.2.2.7 Lycopene and Temperature 62
2.2.2.8 Lycopene and Storage 63
2.2.2.9 Lycopene and Illumination 63
2.2.2.10 Lycopene in Different Food Systems 64
2.2.2.11 Lycopene and its Bioavailability in Processed Tomato 64
2.2.2.12 Lycopene Rich Granules in Tomato Juice 66
vi

2.2.2.13 Lycopene, Protein and Different Elements (Ca, Mg,
P and N) in Various Fractions of Tomato Juice 67
2.2.2.14 Stabilization of Lycopene 69
2.2.2.14.a Encapsulation of All-Trans- Lycopene by
Cyclodextrins 69
2.2.2.14.b Lycopene Coating with Protein 70
2.2.2.14.c Nano-encapsulation of Lycopene by Casein 70
2.2.2.14.d Pectin and lycopene in Tomato and
Tomato Products 71
2.2.3 Pectin 72
2.2.3.1 Peptide-Pectin Interaction and Gelation Behavior of
Plant Cell Wall Pectin 73
2.2.3.2 Pectin-Protein Interaction in Tomato Products 74
2.3 Experimental 76
2.3.1 Sample Preparation 76
2.3.1.1 Paste (Diluted) 77
2.3.1.2 Soluble Solids (Diluted) 77
2.3.1.3 Soluble Solids (Dried) 77
2.3.1.4 Paste (Dried) 78
2.3.1.5 Soluble Solids (Dilute-Dialysis) 78
2.3.1.6 Soluble Solids (Dried-Dialysis) 78
2.3.2 Total Solid and Total Soluble Solids 78
2.3.3 Soluble Solids Dry Weight (1s t Centrifugation) 78
2.3.4 Pectin Determination 79
2.3.4.1 Material and Equipment 79 vii
2.3.4.2 Methods 79
2.3.5 Lycopene Determination 80
2.3.5.1 Material and Equipment 81
2.3.5.2 Methods 81
2.3.6 Nitrogen Determination 82
2.3.6.1 Material and Equipment 82
2.3.6.2 Methods 82
2.3.7 Gel Electrophoresis (SDS-PAGE) 83
2.3.7.1 Material and Equipment 83
2.3.7.2 Methods 83
2.3.8 Fatty Acid Composition 84
2.3.8.1 Material and Equipment 85
2.3.8.2 Methods 85
2.3.9 Enzymatic Treatment of Soluble Solids 85
2.3.9.1 Material and Equipment 86
2.3.9.2 Methods 86
2.3.10 Ions Determination (Ca+2, Fe +2, Mg +2, K+, Na +, P-5) by
ICP-OES 88
2.3.10.1 Material and Equipment 88
2.3.10.2 Methods 89
2.3.11 Transmission Electron Microscopy (TEM) Analysis 89
2.3.12.1 Material and Equipment 89
2.3.12.2 Methods 89
2.4 Results 91
viii

2.4.1 Schematic Diagram of Sample Replications 91
2.4.2 Total Solids and Total Soluble Solids 92
2.4.3 Soluble Solid Dry Weight (1s t centrifugation) 92
2.4.4 Pectin Determination 92
2.4.5 Lycopene Determination 93
2.4.6 Nitrogen Determination 94
2.4.7 Gel Electrophoresis (SDS-PAGE) 94
2.4.8 Fatty Acids Determination 96
2.4.9 Enzymatic Treatment of Soluble Solids 96
2.4.10 Ions Determination (Ca+2, Fe +2, Mg +2, K+, Na +, P-5) bylCP-OES 98
2.4.11 Transmission Electron Microscopy (TEM) Analysis 99
2.6 Discussion 103
2.7 Conclusion 109
2.8 Future Study 112
References 114
IX
List of Tables Page
Table 1.1 Percent Total Solids (%TS) in Tomato Pastes by
Vacuum Oven 37
Table 1.2 Percent Water Insoluble Solids (%WIS) in Tomato Pastes by
Vacuum oven. Mean of Three Determinations (%)
± Standard Deviation 38
Table 1.3 Percent Water Soluble Solids (%SS) in Tomato Pastes by
Vacuum Oven. Mean of Three Determinations (%)
± Standard Deviation 38
Table 1.4 Percent Total Solids (%TS) in Tomato Pastes by Microwave.
Mean of Three Determinations (%) ±Standard Deviation 39
Table 1.5 Percent Solids in the Supernatant Fraction (%SSF) in Tomato
Pastes by Microwave. Mean of Three Determinations (%)
±Standard Deviation 39
Table 1.6 Percent Water Insoluble Solids (WIS) in Tomato Pastes by
Equation 3 (Microwave Oven) 40
x

Table 1.7 Percent Soluble Solids (%SS) by Difference Between Total
and Insoluble Solids (Microwave Oven) 40
Table 1.8 Comparison of Mean Values of % Total, % Water Insoluble and
% Water Soluble Solids Measured by Vacuum and Microwave
Methods 41
Table 1.9 Total Solids, t-Test: Paired Means 44
Table 1.10 Water Insoluble Solids,t-Test: Paired Means 46
Table 1.11 Water Insoluble Solids,t-Test: Paired Means 48
Table 2.1 Organic Acids in Fresh and Processed Tomato 54
Table 2.2 Free Amino Acids in Pastes Made from Red Tomatoes and Amino
Acid Composition of Water-Soluble Proteins in Tomato Juice and
Tomato Plastids 56
Table 2.3 Fatty Acid Composition of Tomato Seed Oil (%) from the Hot Break
Process and Fatty Acid Composition of Tomato Plastids 57
XI

Table 2.4 Distribution of Protein, Lycopene, and Ca, Mg, P and N Among
Tomato Juice Fractions 68
Table 2.5 Combination of Enzymes in Their Optimum Conditions 87
Table 2.6 Total and Soluble Solids Content of Tomato Paste 92
Table 2.7 Solids in Soluble Solids Fraction (1s t centrifugation) 92
Table 2.8 Pectin Content in Paste and Soluble Solid (ng/g dry wt) 93
Table 2.9 Lycopene Content in Paste and Soluble Solid (|ig/g dry weight)....93
Table 2.10 Nitrogen Content of Soluble Solid, Paste and Dialyzed
Soluble Solid (% dry wt.) 94
Table 2.11 Ions in Filtrated, Dialyzed and Original Soluble Solids 99
xii
List of Figures Page
Figure 1.1 Mean Composition of Tomato Fruit 9
Figure 1.2 Simplified Flow Diagram for the Manufacture of Tomato Paste 11
Figure 1.3 Flow Chart for Solids Analysis by the Vacuum
and Microwave Oven Method 25
Figure 1.4 The Regression of Exact Equality Between Vacuum and Microwave
Oven Method in Total Solid Determination 45
Figure 1.5 The Regression of Exact Equality Between Vacuum and Microwave
Oven Method in Water Insoluble Solid Determination 47
Figure 1.6 The Regression of Exact Equality Between Vacuum and Microwave
Oven Method in Water Soluble Solid Determination 49
Figure 2.1 The Basic Structure of Lycopene 60
Figure 2.2 Structural Formula for Partly Methylated Poly-Galacturonic 72
Figure 2.3 Schematic Illustration of the Egg-Box Model 73
Xlll
Figure 2.4 Suspected Schematic Model of Pectin-Protein
Interaction in Tomato Products 75
Figure 2.5 Schematic Illustration of Sample Preparation and
Related Measurement 76
Figure 2.6 Enzymatic Treatment of Soluble Solids in Terms of
Concentration, Temperature and pH 87
Figure 2.7 Combinations of Enzymes in Their Optimum Conditions 88
Figure 2.8 Schematic Illustration of Sample Replications 91
Figure 2.9 SDS-PAGE of Tomato Paste and Its Different Fraction
in Gel Cross Linking of 18% and 12.5% 95
Figure 2.10 Enzyme Treatment of Soluble Solids 97
Figure 2.11 Ultracentrifuged Soluble Solid Samples Showing Three Distinct
Layers and an Ultracentrifuged Sample After 1h 100
xiv
Figure 2.12 Transmission Electron Micrograph of Soluble Solids 101
Figure 2.13 Transmission Electron Micrograph of Top Layer After
Ultracentrifugation 101
Figure 2.14 Transmission Electron Micrograph of Middle Layer After
Ultracentrifugation 101
Figure 2.15 Transmission Electron Micrograph of Bottom Layer After
Ultracentrifugation 102
xv
Chapter 1
MEASUREMENT OF SOLIDS IN TOMATO PASTE
1.1 Introduction
Tomatoes are part of the solanacea family which includes many other familiar
food products such as paprika, chili pepper, potato and eggplants. Tomatoes
were not accepted as a food until the mid 19th century but since that time there
has been a steady increase in production to the point where in 1979 tomatoes
were ranked third in the world behind grapes (ranked first) and citrus fruits
(ranked second) (Heutink, 1986). In those early days, the nutritional value of
tomatoes was given less attention than the processing conditions required to
produce such products as ketchup, tomato juice and pasta sauce. The first legal
classification of tomatoes was given in 1887 when a U.S. tariff law imposed a
duty on vegetables and included tomatoes in this category. This ambiguity
persisted until 1893 when the U.S Supreme Court settled the controversy by
declaring tomato a vegetable based on its common application in culinary
practices (Nix v Hedden 1893). This decision demonstrates the importance of
commerce over science since the scientific definition still categorizes tomato as a
fruit.
The two main approaches to evaluate tomato product quality are the
quantitative and qualitative examination of their solids content. The quantitative
determination of solids can be used to estimate the potential yield of final
product, the effects of the growing season and the variations between varieties.
Furthermore the solids content can be used to determine if they comply with
1

standards such as the U.S.A standards of identity for tomato pulp (puree) and
paste.
In the industry, the attribute that is relied upon the most to assess quality is
the flow characteristics of the finished products. Like the solids content, the flow
characteristics are dependent on the growing conditions, variety of tomato and
production practices. Based on these relationships, it seems that the solids
measurements can be used to estimate the quality of tomato products.
Acknowledging the importance of solids content of tomato and tomato products,
the government agencies proceeded to establish standards to determine solids
(total, water soluble and water insoluble solids) and used these standards to rank
tomato products. Since most tomato products such as ketchup, pizza and pasta
sauce utilize tomato paste as their main ingredient, the determination of the
solids content of paste has become an important factor not only for the paste
manufacturer but also for the users of paste. Because of the importance of solids
on tomato product quality, regulations on solids content of paste products and
their determination have been implemented not only by government but also by
nonprofit scientific organizations. For example, the Association of Official
Analytical Chemist (AOAC) has developed recognized methods, which have
been referenced and used internationally.
In general there are three different solids in paste that can be measured: total
solids, soluble solids and insoluble solids. It is apparent that total solids are the
sum of the soluble solids and insoluble solids. Total solids are the most
recognized of the three solids as they play a major role in commerce. However,
2

the definition of total solids (in paste) in the U.S is different from that in Canada.
The Canadian government describes pastes as a product with a certain amount
(> 20%) of salt free solids determined by vacuum oven. The sources of salt that
have to be deducted from the measured total solids are both native and added
(Health Protection Branch Ottawa 1981). In the U.S regulations, the native salt is
not eliminated and the terminology "Natural Tomato Soluble Solids" is used in
place of total solids. The Food and Drug Administration (USDA 2000-1) defines
tomato paste as a product not containing less than 24.0% 'Natural Tomato
Soluble Solids' and is determined by refractometry according to the AOAC
method (AOAC 2000).
All Official Methods of Analysis of the AOAC require an inter-laboratory
collaborative study prior to approval. These standardization procedures result in
a reproducible method that is precise and accurate when performed exactly as
outlined. The AOAC approved method for total solids (AOAC 1980) utilizes
vacuum oven drying to remove water but has been criticized as being too
elaborate and time consuming and an alternative procedure should be found.
One such procedure was the microwave oven method. A collaborative study
among 14 laboratories was organized to compare the microwave oven method to
the vacuum oven method. The findings of the collaborative study resulted in the
approval of the microwave oven method as an alternative for the previously
approved vacuum oven method (Chin 1985). However, the microwave oven
method has been shown to produce values higher than the vacuum oven when
3
scrutinizing unpublished industry data and some internal documents from tomato
processing companies.
Various explanations have been put forward to identify the reasons for the
lack of agreement between the results produced by microwave oven and vacuum
oven. Some authors have attributed the differences to the use of dissimilar
microwave models (the first employed while developing the method and the
second when doing the comparison test), failure of the technician to conduct the
assigned procedures properly and failure of the vacuum oven to attain the
conditions specified in the official method.
Even though some researchers have expressed concerns over the
discrepancy between the two methods, the ease with which the microwave
procedure can be performed compared to the vacuum oven procedure has
established the microwave as the preferred method in the industry.
Most of our information on the two methods has been gleaned from total
solids data that were determined with non-standardized procedures and older
equipment. There haven't been any recent investigations comparing the two
methods employing the recommended procedures and modification or taking into
account potential sources of error. One objective of this research was to compare
the microwave and vacuum oven methods and addressing those limiting factors
that were observed in the early studies.
In addition to total solid which has been the main focus of most researchers,
the total insoluble solids fraction is also important as it is the major component
that determines the consistency of many tomato products and serves as a source
4
of many important nutrients. However, the low levels of insoluble solids in
comparison with the soluble solids make them difficult to measure accurately.
The official method of analysis requires several washing steps with hot water
followed by filtration and drying in a vacuum oven (AOAC 2000). This method
measures the insoluble solid directly. However, due to the extensive time of
analysis and the multiple steps, this procedure is not popular.
A second approach that can be used to determine water insoluble solids is an
indirect procedure that employs a model to calculate the water insoluble solids.
In this procedure the total solids and the solids in the soluble fraction are
determined experimentally and used in an empirically derived equation (Bohart
1940). This formula method (indirect) has a big advantage over the vacuum oven
method in terms of greatly reducing the workload and significantly shortening the
analysis time. Although this method has been recommended by the National
Canners Association (Lamb 1977) and adopted and used by the tomato
processors, very little academic attention has been given to this approach in
terms of examining its reliability and accuracy or even suggesting modifications
for improvements. Moreover it would be beneficial to employ the microwave oven
with the formula (indirect) instead of the vacuum oven because of the reduction
in assay time.
In the case of soluble solids, there are no known direct procedures that
isolate the soluble from insoluble solids and measure them directly. The AOAC
measures soluble solids by refractive index and converts the Rl readings to
percent sucrose with a conversion table, and finally derives the soluble solids
5
concentration. However, since there are many new tomato varieties, these tables
would have to be re-examined and developed based on these new varieties.
Without these new conversion tables, this method could have some serious
limitations.
When measuring tomato paste solids, especially the soluble solids, filtration
is a critical step and may affect the determination. The reason for filtering the
sample is to separate the insoluble components from the soluble components;
the boundary between soluble and insoluble solids is not clear and clean
separation of the two is not always possible.
During the preparation of the soluble solid fraction, some colloidal particles
remains suspended in the supernatant after centrifugation and did not
precipitated with the insoluble solids. This suspended material appear to have
unique properties because they behave like soluble solids but are composed of
large molecular weight macromolecules and lipid material. Disrupting the
complex by enzymatic hydrolysis or by dialysis results in loss in solubility.
Determining the true nature of this suspended material may provide information
about the behavior of the solid fractions in paste and may lead to greater
understanding of tomato product properties or better definition of rheological
property of tomato paste. As well, the ability of this complex to suspend insoluble
components may have applications in other systems if the mechanism is
revealed.
The objectives of this research can be summarized as follows: revealed
6

• Examine the repeatability of total solids, water insoluble solids and soluble
solids measurements as determined by vacuum oven.
• Examine the repeatability of total solids and solids in soluble fraction
measurements as determined by microwave oven.
• Compare the total solids values determined by vacuum oven and microwave
oven methods.
• Compare the insoluble solids values determined by vacuum oven versus
insoluble solids values derived from the model using microwave oven data.
• Compare the soluble solids determined by vacuum oven versus soluble solids
calculated by difference of insoluble solids and total solids using microwave
oven data.
• Characterize the type of particles suspended in the soluble solid matrix.
7
1.2 Literature Review
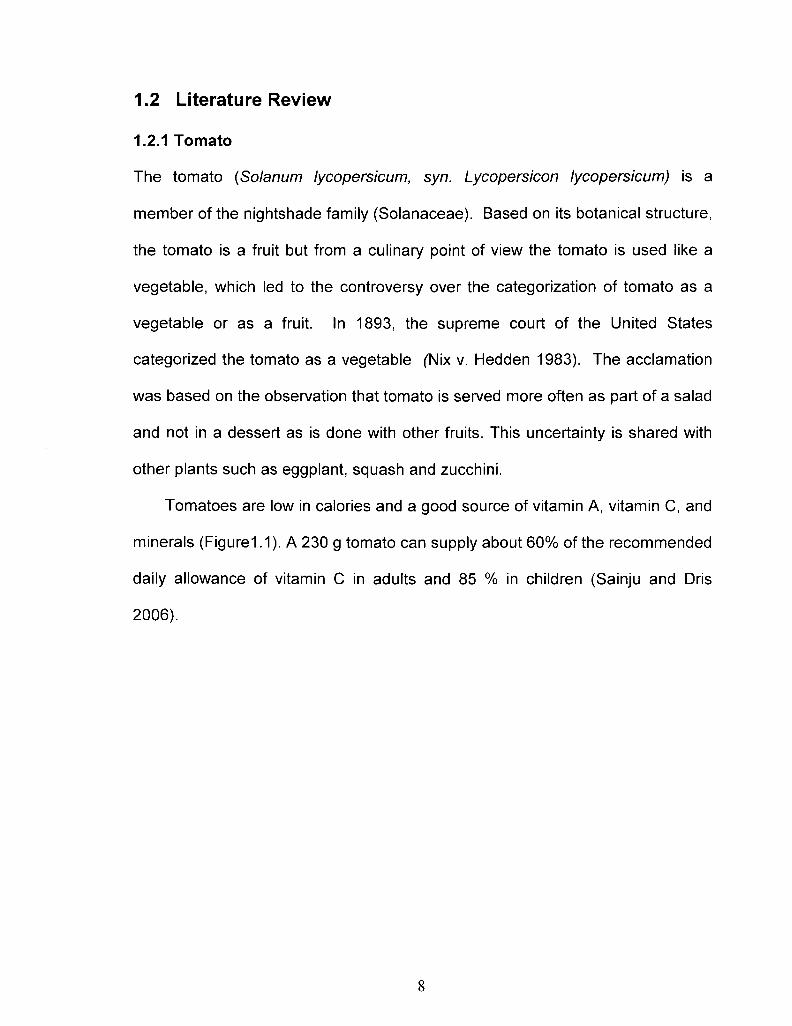
1.2.1 Tomato
The tomato (Solanum lycopersicum, syn. Lycopersicon lycopersicum) is a
member of the nightshade family (Solanaceae). Based on its botanical structure,
the tomato is a fruit but from a culinary point of view the tomato is used like a
vegetable, which led to the controversy over the categorization of tomato as a
vegetable or as a fruit. In 1893, the supreme court of the United States
categorized the tomato as a vegetable (Nix v. Hedden 1983). The acclamation
was based on the observation that tomato is served more often as part of a salad
and not in a dessert as is done with other fruits. This uncertainty is shared with
other plants such as eggplant, squash and zucchini.
Tomatoes are low in calories and a good source of vitamin A, vitamin C, and
minerals (Figure1.1). A 230 g tomato can supply about 60% of the recommended
daily allowance of vitamin C in adults and 85 % in children (Sainju and Dris
2006).
8
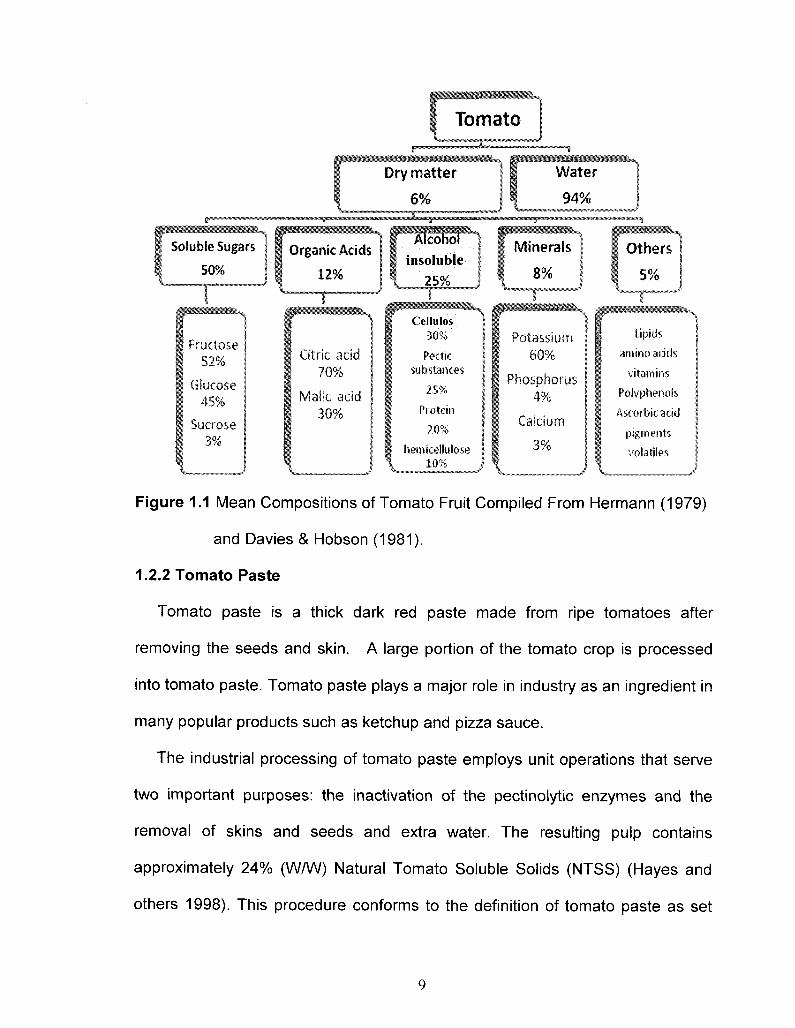
Figure 1.1 Mean Compositions of Tomato Fruit Compiled From Hermann (1979)
and Davies & Hobson (1981).
1.2.2 Tomato Paste
Tomato paste is a thick dark red paste made from ripe tomatoes after
removing the seeds and skin. A large portion of the tomato crop is processed
into tomato paste. Tomato paste plays a major role in industry as an ingredient in
many popular products such as ketchup and pizza sauce.
The industrial processing of tomato paste employs unit operations that serve
two important purposes: the inactivation of the pectinolytic enzymes and the
removal of skins and seeds and extra water. The resulting pulp contains
approximately 24% (W/W) Natural Tomato Soluble Solids (NTSS) (Hayes and
others 1998). This procedure conforms to the definition of tomato paste as set
9
out by the U.S. Department of Agriculture, "a product containing solids not less
than 24% natural tomato solids" (USDA 2000-01). A specially designed
concentration process produces tomato paste, which is a dispersion of solid
particles in an aqueous serum phase (Yoo and Rao 1994).
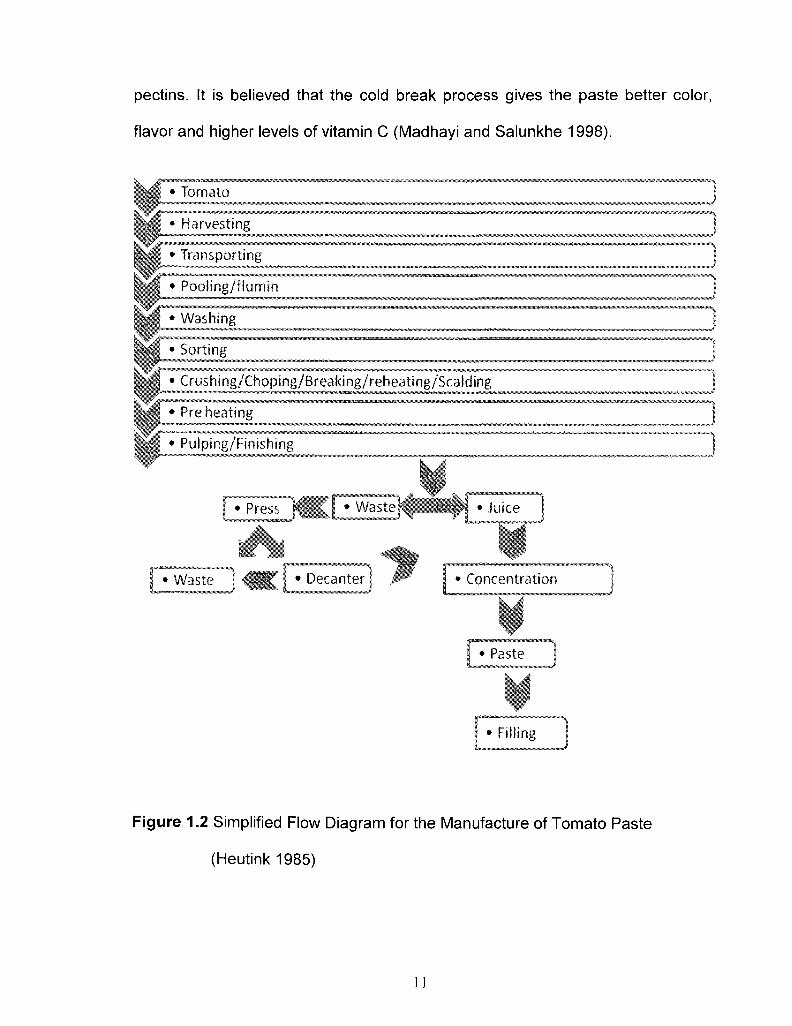
1.2.3 Tomato Paste Processing
The flow diagram for the processing of tomato paste is shown in Figure. 1.2.
Prior to process, the tomatoes are thoroughly washed and sorted to remove
defects. The tomatoes are chopped into small pieces and heated to a specific
temperature.
There are two ways to heat process tomatoes in the industry: the hot break
process and the cold break process. In the hot break process the tomatoes are
heated as quickly as possible to a temperature higher than 90°C in order to
inactivate pectinolytic enzymes. It is common to simultaneously heat and chop
tomatoes in the hot break procedure. It is also common practice to pass the
tomatoes through a two or three stage pulper/finisher unit to remove seeds and
skins. The final evaporation step concentrates the paste to the desired moisture
content. It has been reported that the rheological behaviour of tomato paste,
such as consistency, depends on variables such as sieve pore size and break
temperature (Sanchez and others 2002).
In the cold break procedure, scalding prior to chopping loosens the tomato
skin. The chopping process is performed at around 66°C. The chopped tomato is
held static for a certain amount of time to allow the enzymatic breakdown of
10
pectins. It is believed that the cold break process gives the paste better color,
flavor and higher levels of vitamin C (Madhayi and Salunkhe 1998).
• Tomato
• Harvesting
• Transporting
Pooling/flumin
• Washing
Sorting
Crushing/Choping/Breaking/reheating/Scalding
Preheating
Pulping/Finishing
Figure 1.2 Simplified Flow Diagram for the Manufacture of Tomato Paste
(Heutink 1985)
11
1.2.4 Total Solids
The total solids content of concentrated tomato products is an important
property that purchasers and producers need to know. This key property can aid
in determining the final product's composition, stability and quality when paste is
used as the main ingredient. For these reasons, considerable attention has been
given to regulations and legislations that relate directly to the measurement of
total solids in tomato products.
The regulations concerning total solids are different in Canada and the USA
The Canadian government utilizes the terminology "total solids" (TS) where the
measurement is determined by oven drying and the salt is deducted, while the
U.S utilizes the terminology 'Natural Tomato Soluble Solid' (NTSS) where the
measurement is determined by refractometry. NTSS is an estimation of total
solids but is much easier to perform than oven drying. Another distinction
between these two definitions is that the natural salt originating from the tomato
is included in NTSS reading but the "salt-free solid" definition used by the
Canadian government excludes both natural and added salt.
Similarly the definition of total solid (TS) put forward by the Canadian
government is different from the total solids determined by the Official Methods of
Analysis (AOAC). The Canadian law defines total solids as the solids determined
by oven drying minus natural and added salt. In the AOAC method, the natural
salt is part of the total solids value.
12
1.2.4.1 Total Solids: AOAC Method
1.2.4.1.a Vacuum Oven Method of AOAC
The most recent investigation of total solids, based on the Official Methods,
was by Frank C. Lamb who was working for the National Canners Association at
the time (Lamb, 1964). Realizing that the determination of the true solids content
was not possible even with the official methods, Lamb (1964) made modifications
to the official method (9th edition 1960) with the intention of shorten the analysis
time and implement conditions that would make the procedure more flexible and
improve its reproducibility. The modified method was compared to the original
official method in a collaborative study that involved 17 analysts in 9 laboratories.
The modification that were made included optimizing sample size, adjusting pre-
drying conditions, employing diatomaceous earth, selecting vacuum oven
pressure, and determining the best drying time.
The sample size used in the analysis was increased from 9-12 mg/sq cm
residue to 9-30 mg/sq cm to increase the flexibility in selecting the proper
sample size. Diatomaceous earth was substituted for pumice to improve the
drying conditions. When pre-drying with diatomaceous earth in a boiling water
bath, in a forced draft oven at 70°C or in a vacuum oven at 70°C with released
cocked left partly open, a moderate amount of over drying or under drying did not
affect the final results. In case of pressure, it was considered advisable that the
pressure should not exceed 50 mm mercury during vacuum drying. One of the
major objectives of their study was to shorten the 4h analysis time specified in
the official method. In the presence of diatomaceous earth it was possible to dry
13

samples in 1h at 70°C but to avoid problems and have an adequate safety
margin, a drying time of 2h at 70°C was recommended.
The suggested recommendations were employed by AOAC as first action in
1964 and final action in 1965 (AOAC 1965) and its status is still in action (AOAC
2000).
In summary the method is carried out by adding diatomaceous earth dispersed
at ca 15 mg /sq cm in a metal dish with a tight fitting cover and dried for 30min at
110°C. The dish is cooled in a desiccator and weighed (W1). The amount of
added sample to the dish should be so that the dry residue ranges from 9-30
mg/sq cm. The weight of sample (W2) should be recorded soon enough to avoid
moisture loss. If necessary, sample can be diluted with H20 and spread
uniformly in the dish.
Pre-drying would be conducted by one of the three specified procedures until
apparent dryness is reached. Apparent dryness was defined as "the point at
which the remaining content is equal to not more than 50% of the weight of the
dried solids" (Lamb 1964). The partially dried samples is transferred to the
vacuum oven with a reduced internal pressure equal to or less than 50 mm of
mercury. Samples should be dried for 2 hours at 69-71 °C and removed from
oven and cool to room temperature in a desiccator. The dish should be covered
and weighed (W3).
The difference between dried weight of sample and initial weight would
determine total solid of sample and should be calculated as a percent.
W 3 - W 1 % Total Solids = „ XAT x100 Equationl
W 2 —Wl
14

Where:
W1 : Weight of dish
W2: Weight of the sample and dish
W3: Weight of the dried sample and dish
1.2.4.1.b Microwave Oven Method ofAOAC
Green and Park (1980) employed the microwave oven to determine solids in
foods and other non-foods items. The advantages of microwave drying are
shorter drying times and reduced sample handling. In microwave drying, the
water molecules absorb electromagnetic radiation directly and heat the sample
from the inside, which reduces the heating time considerably (May and others
2003). These advantages led Chin and others (1985) to standardize and validate
a microwave method for tomato products. The method involves weighting the
sample on a glass fibre pad and drying the pad in a CEM microwave oven Model
AVC-MP for 4 minutes. The sample is automatically weighed before and after the
heat treatment and the loss in weight is used to calculate the moisture content of
the sample.
The validation was done in a collaborative study with 14 laboratories
analyzing 7 samples with solids content ranging from 6.5 to 40.2%. The
repeatability (std dev) ranged from 0.02 to 0.22 and the reproducibility (std dev)
ranged from 0.08 to 0.37 over the concentration range of the samples (Chin and
others 1985).
A comparison of the vacuum oven method (13th edition ofAOAC, 1980) with
the microwave drying method showed no difference at the 95% confidence level
15
indicated that these two methods were in excellent agreement (Chin and others
1985). Based on these results, Chin and others (1985) recommended that the
microwave oven drying method be considered as an alternative to the official
vacuum oven method.
In another study conducted in Canada, the reproducibility and accuracy of the
total solid measurement by microwave were examined on tomato samples
(Wang 1987). However in Wang's experiment, the CEM Model AVC-80
microwave was employed rather than the microwave employed by Chin (AVC-
MP). The results of an eight lab collaborative study indicated that the microwave
oven method produces higher value than the vacuum oven method. Moreover,
their result demonstrated that the AVC-80 model produced higher result than the
AVC-MP model (Wang 1987).
1.2.4.2 Total Solids: Canadian Method
The Canadian regulatory agency has adopted the vacuum oven methods for
the determination of total solids in tomato paste (Health Protection Branch
Ottawa 1981). The regulation states a 'salt-free' total solid in its methodology.
Health protection branch Ottawa method FO-19 states "The method shall be
used for determination of the percent tomato solids in tomato paste under section
B. 11.009 of the Food and Drug Regulation and in concentrated tomato paste
under section B. 11.010 of the Food and Drug Regulation.
Section B. 11.009 states that "Tomato paste shall be the product made by
evaporating a portion of the water from tomato or sound tomato trimmings, may
contain salt and class II preservatives and shall contain not less than 20 percent
16

tomato solids as determined by Official Method FO-19, Determination of Tomato
Solids". Section B.11.010 also states "Concentrated tomato paste shall be
tomato paste containing not less than 30 percent tomato solids as defied by
Official Method FO-19".
The procedure is similar to method Solids (Total) AOAC (2000) with the
exception that the inherent salt is deducted from total solids determined by drying
in a vacuum oven. The official methods FO-1 determines sodium chloride by
titration with 0.1N NH4SCN in the presence of concentrated HN03 and ferric
indicator (Health Protection Branch Ottawa 1981).
1.2.4.3 Total Solids by NTSS: United State Method
The US Food and Drug Administration's standards of identity for tomato pulp
(puree) and paste employs a different term when describing tomato solids.
They use the term 'Natural Tomato Soluble Solids' (NTSS). In the NTSS method,
a refractometer reading is taken at 20°C on the clear serum fraction of a tomato
product containing no added salt. Solid content is expressed as percent sucrose.
Since the official method for total solids determination is labor intensive and time
consuming, many processors have tried faster procedures based on specific
gravity or refractive index. In an attempt to relate the values obtained by
refractometry, vacuum oven and specific gravity, the National Canners
Association (NCA) derived an average factor that links these three
measurements to total solids (Bigelow and Fitzgerald 1915).
17
This attempt resulted in a table providing numerical factors for refractive index,
vacuum oven drying and specific gravity (Bigelow and Stevenson 1923).
However this first table was based on data from sample with concentrations
below 20% solids. A second edition followed extending the values to samples
with solids content up to 35%.
A similar approach was taken by Saywell and Cruess (1932), where a factor
relating refractive index with total solids as established on California tomatoes.
However the proposed factor was very different from the one in the National
Canners Association publication. This poor agreement has appeared in many
other investigations over the years. The main reason for this difference was
attributed to variations in the ratio of soluble solids / insoluble solids in different
pastes.
Due to this problem, the quest to find a valid factor to relate total solids,
refractive index and specific gravity was delayed until the adoption of a new
official method for total solids by vacuum oven (10th edition, AOAC 1965) and the
adoption of the refractive index method employing pectic enzymes. The use of
enzymes accelerates paste filtration time and reduces evaporation during the
test.
Taking advantage of the modified procedure for total solid determination by
vacuum oven in the 10th edition (AOAC 1965) and employing enzymes to
improve the filtration step in the refractive index determination, Lamb (1967) not
only compared the old official method to his modified method but also attempted
to establish a relationship between refractive Index, specific gravity, and total
18
solids in tomato juice, puree and paste. Based on these studies the National
Canners Association developed a table to convert the NTSS value obtained by
refractive index to percent total solids (corrected for added salt).
1.2.5 Water Soluble Solids
The soluble solid is the main solids fraction in tomato and tomato products.
Sugars accounts for almost 50% of the solids in concentrated samples and the
major aroma compounds are also found in this fraction.
1.2.5.1 Soluble Solids: AOAC Method
In 1951, Cheftel made comments on the validity of solids determination by
drying. He questioned the ability of oven drying to distinguish between free and
bound water in paste samples. He recommended that the "refractive index
method" be used to specify the solids content of tomato products. The
recommendation was based on his observation that the refractive index method
was more controllable, had a higher degree of precision and was easy to
perform.
Lamb (1969) initiated a collaborative study to evaluate the methodology for
soluble solids determination in tomato products by refractive index. In that
collaborative study the various laboratories evaluated three paste concentrations,
two filtration methods and the use of pectic enzymes. In that same trial, an
ultracentrifuge (150,000 x g) was used to prepare clear serum samples without
the need for pectic enzyme treatment or filtration. The standard deviation for the
soluble solids measurements varied from 0.15% for samples containing 24%
soluble solids (based on sucrose) to 0.40% for sample with 44% soluble solids.
19
This range of 0.15%-0.40% in standard deviation was comparable with results
obtained with the official AOAC method (vacuum drying method). Although the
ultracentrifugation results showed good agreement with the filtration method,
conclusions were not made because the ultracentrifugation results were from
only one lab (Lamb 1969). Based on the collaborative study and Lamb's
recommendations, the refractive index method employing filtration was adopted
as official method of AOAC for first action in 1970.
The 17th edition (AOAC 2000) describes the refractive index procedure for the
measurement of soluble solids. The method involves measuring the refractive
index (± 0.0001 Rl units) of the clear soluble solids solution from a tomato
product. To isolate the soluble solids, the sample is treated with a pectic enzyme
and depending on the filtration behavior of the sample it may or may not need
dilution. Centrifugation is another option if an ultracentrifuge is available.
Measuring the refractive index and correcting for added enzyme and insoluble
solids determine the solids content. Correction for added enzyme in case of
filtration without dilution is achieved by subtracting the term 1.15*BxC from the
refractive index reading where 1.15 is the correction for insoluble solids, B
accounts for % enzyme preparation and C is the reading as sucrose obtained on
a 1% solution. In case of dilution, the correction term becomes 0.55xD*C where
0.55 is the correction for insoluble solids, D is the % added enzyme, C is the
reading as sucrose obtained on a 1% solution.
In the case of added salt, the refractometer value expressed as % sucrose
should be corrected for salt by the following equation:
20
Equation 2
NTSS= (Refractometer sugar scale reading at 20 °C - % Total salt) x 1.016
1.2.5.2 Soluble Solids: Formula Method
Another way to determine soluble solids is to measure the total solids and
subtract the insoluble solids (Bohart 1940). The principle behind this procedure
assumes that a negligible amount of soluble solids is adsorbed by the insoluble
fraction and with appropriate centrifugation of the sample a clear supernatant
containing all the soluble solids can be made. In this method, both total solids in
the paste and the solids content of the supernatant fraction are measured. It
should be noted that the % solids in the supernatant fraction (%SSF) is not the
same as the % soluble solids (%SS) in the paste. Equation 3 is used to calculate
the % water insoluble solids (%WIS).
%WIS = 100(%TS-%SSF) Equation 3 100-%SSF
Where:
%WIS = % Water Insoluble Solids in paste
%TS = % Total Solid in Paste
%SSF = % Solid in Supernatant fraction after one centrifugation
The soluble solids (%SS) in the paste can then calculated with Equation 4.
%SS =%TS-%WIS Equation 4
Where:
%SS = % Soluble Solids in paste
%TS= % Total Solid in paste
%WIS=% Water Insoluble Solids in paste
21
1.2.6 Water Insoluble Solids
There is wide agreement among researchers that the amount of insoluble
solids (WIS) has the greatest influence on gross juice viscosity, but titrable
acidity, serum viscosity and the nature of the suspended particles may also
contribute to the gross viscosity (Kertesz and Loconti 1944, York and others
1967, Bartolome 1972).
1.2.6.1 Water Insoluble Solids: AOAC Method
The AOAC Methods (AOAC 2000) determines water insoluble solids by
adding a certain amount of tomato products to boiling water and separating out
the soluble fraction by centrifugation. Multiple washings and centrifugations
achieve complete removal of the soluble fraction. The weight of the dried residue
represents the WIS fraction.
In brief, the official AOAC Method subjects 20 g of paste to 4 or 5 washings
with hot water. Each washing step is centrifuged to produce a clear supernatant.
The supernatant is filtered through tared filter paper in a Buchner funnel. The
pallet is collected on the same filter paper and the residue dried in an uncovered
dish for 2 hours at 100 °C, cooled in a desiccator and then weighed.
1.2.6.2 Water Insoluble Solids: Formula Method
To determine insoluble solids by the formula method, the procedure outlined
in section (1.2.5.2 soluble solids) is followed. The principle is based on the
measurement of total solid and the % solids in the supernatant fraction (%SSF)
after one centrifugation and utilizing Equation 3.
22
One of the most scholarly sources of information on tomato and tomato
product testing is the National Food Processor Association Bulletin 27-L. In the
7th edition Equation 3 is given high marks. The bulletin describes the procedure
for determining %TS and %SSF. An unfiltered paste sample is vacuum dried to
determine %TS. For %SSF determination, the paste sample is diluted with water
and filtered and the clear filtrate is vacuum dried. To overcome the possibility of
evaporation during filtration, the method recommends using centrifugation of the
diluted sample (approximate 12% solid) for 10 minutes at 2,000 RPM. The
supernatant is easier to filter and the possibility of evaporation is lower. The
results (%TS and %SSF) are multiplied by the dilution factor and used in
Equation 3 to calculate %WIS. However, this publication acknowledges the
possibility of error if appreciable amount of water was absorbed by the insoluble
solids or by the filter paper.
Although it appears to be a simple task, the determination of solids in tomato
products and especially concentrated tomato pastes has been a challenge over
the years. The lack of a recognized definition for the different solids fractions has
led to controversy not only in international commerce but also among industrial
processors and the scientific community. However, all the proposed methods that
were developed for scientific purposes or for commerce, were intended to be
rapid and with sufficient reproducibility to serve their intended purpose.
Because different definitions and approaches have been employed to
measure solids, we will use the following definitions of solids in our study. The
following are the solids definitions:
23
A. Total Solids: The residue that remains after all the moisture has been
removed from the paste by the conditions specified by the vacuum or microwave
oven methods and without subtracting inherent salt.
B. Insoluble Solids: The water insoluble fraction free of all soluble compounds.
C. Soluble Solids: The fraction containing the compounds that dissolves in water.
D. Solids in Soluble Fraction: The supernatant from first centrifugation of diluted
paste containing soluble solids and colloidal particles.
Although the principles behind the procedures used in this study are similar to
the AOAC official method, some modifications were made to facilitate the
removal of water and to reduce some of the sources of errors. The repeatability
of the measurements was used to assess the effects of these modifications on
the robustness of the procedures. In addition it was considered important to
compare the results obtained by the vacuum oven method with the results
obtained by the microwave method and applying Equation 3 and 4.
It is known that one of the drawbacks in the soluble solid measurement in the
official method is the filtration step to remove some suspended particles, which
appear to be soluble. The nature of these particles is not known and
consequently can not be categorized as soluble or insoluble but for now is
considered to be soluble as long as their composition is unknown.
24

1.3 Experimental
The Figure 1.3 depicts the analysis of the diluted paste sample for total solids,
insoluble solids and soluble solids. Two methods are used to analyze the same
paste sample. The vacuum oven is a direct method and is recommended by the
AOAC. In the direct method, all three solids fractions are individually separated
and weighed. The microwave oven is an indirect method and is recommended by
the National Canners Association. For the indirect method the total solids is
determined directly by microwave drying but the soluble and insoluble solids are
determined by equation using microwave.
I Dilluted Sample
Figure 1.3 Flow Chart for Solids Analysis by the Vacuum and Microwave
Methods.
1.3.1 Material and Equipment
Analytical balance model Mettler AE 240 (Mississauga, ON. Canada),
centrifuge model J2-21 and rotor Ja-20 capable of producing approximately
20000 rpm, 31,360xg force (Beckman, Mississauga, ON, Canada), plastic
centrifuge tube 50 ml_ (Fisher Scientific, Mississauga, ON, Canada), aluminum
25
70mm x 32mm pans with covers (Dual Manufacturing Co. Inc. Chicago, IL, USA),
water bath equipped with digital thermostat model HAKKE W26 (Thermo Fisher
Scientific, Mississauga, ON, Canada), sintered glass filter: 50 mil Pyrex® coarse
40-60 ASTM (Fisher Scientific, Pittsburgh, PA, USA), jumbo bulb 10 cm pipette
(Curtin Matheson Scientific, Wood Dale, IL, USA), celite acid wash (Sigma
Aldrich, St. Louis, Mo, USA), vacuum oven model 281 capable of maintaining
temperature at 70°C ±1° with no more than 2°C variation between shelves
(Fisher ISoTemp® Co., Pittsburgh, PA, USA), vacuum pump operating pressure
-30 inches Hg (-100 Kpa) (Duoseal 1380 Welsh Vacuum .Thomas Industries
Inc., IL,USA), microwave oven solid analyzer (CEM model AVC-80), glass fibers
10x10cm sample pads suitable to be used in CEM microwave oven model AVC-
80, convention drying oven (Memmert), stomacher (400 lab blender), laboratory
hot plate, desiccators with silica gel absorbent, commercially available tomato
paste samples in range 25-30 % total solids.
1.3.2 Methods
1.3.2.1 Vacuum Oven Method
1.3.2.1.a Total Solids (Vacuum Oven)
The total solids were determined by drying the sample in a vacuum oven.
1.3.2.1.a.b Sample Preparation
Due to the high solids content of the samples, a dilution step was required.
50g of paste was weighed into a stomacher bag and diluted with 100g of distilled
water. The level of dilution was determined in preliminary trials. The diluted
sample was thoroughly mixed in the stomacher until no paste clumps were
26

visible. By turning the bag over at intervals in the stomacher this procedure
quickly dispersed the paste into a homogenous mass. Three replicate samples
were prepared with this procedure.
1.3.2.1.a.c Procedure
Approximately 15 mg/sq cm of diatomaceous earth was added to drying pans
and heated in an oven set at 110°C for 30 minutes to dry the pan and
diatomaceous earth. The dried pans were transferred to a desiccator and cooled
for 30 minutes. The dried pans were weighed on an analytical balance and the
initial weight recorded.
Approximately 7g of diluted sample were weighed into the pan in triplicate.
The initial weight was adjusted to give a final dry residue weight in the pan of 9-
30 mg per square centimetre. To reduce problems due to evaporation during the
weighing process, this step has to be performed quickly or alternatively the pan
has to be covered during the weighing procedure. After weighing the sample, a
small amount of water was added to the mixture of diatomaceous earth and
sample to evenly distribute the sample in the pan.
To facilitate the drying process, the samples were pre-dried in a boiling water
bath prior to transferring them to the vacuum oven. The vacuum oven was set at
70°C and the temperatures of the shelves were measured with a thermometer in
direct contact with the shelves. Following the procedure of Lewis and Kimbal
(1961), two 250 ml_ bottles were connected in series with the petcock release
valve on the vacuum oven. The nearest bottle to the petcock was filled with
glass wool and the farthest was filled with 90 ml_ of concentrated sulfuric acid.
27

This design worked as a trap to remove moisture and sulfuric acid from the air
entering the chamber. When the volume of sulfuric acid increased by more than
5 mm due to absorbed moisture, the acid was replaced with fresh concentrated
sulfuric acid. Replicates of each sample were uncovered and placed in rows from
back to front as it seemed that the back of the chamber had a slightly higher
temperature. The applied pressure of <50 mm Hg was applied to the chamber.
Dry air (pass through concentrated sulfuric acid) was allowed to purge the
chamber at a rate of 3 bubbles/second. The temperature of the vacuum oven
chamber dropped initially, but reached the set temperature of 70 °C±rC after 15
minutes. Samples were kept in the vacuum oven for exactly 2 hours. The
vacuum was turned off after 2 hours and the rate of air entering the chamber
increased to 6-8 bubble/second. When the vacuum was completely released the
oven was opened and lids were placed on the pans and transferred to a
desiccators to cool. The cooled samples were weighed on an analytical balance.
The total solids content of each replication was calculated based on weight
loss. Because the samples were diluted 1:3, a dilution factor of 3 was applied to
calculate the true total solids.
Equation 5
% Total solids = (Weight of dry residue + dish) - (Weight of dish )x100 * 3 (Weight of sample +dish)- (Weight of dish)
1.3.2.1.b Water Insoluble Solids (Vacuum Oven)
The water insoluble solids were separated from the soluble solids by
successive washing of the paste with water. To avoid solubilizing the cell wall
28
materials, hot water was not used. However to compensate for the reduced
efficiency, the total number of washing steps was increased.
1.3.2.1.b.a Sample Preparation
The same procedure detailed in section 1.3.2.1.a.b was used to prepare the
diluted sample.
1.3.2.1.b.b Procedure
23-25 g of diluted sample were weighed into three 50 ml_ centrifuge tubes. To
aid with the subsequent filtration step, 10 to 15 mL of water (adequate to balance
the tubes for centrifugation) was added to each tube. It was shown in preliminary
trials that the addition of water at this stage was better than diluting the original
sample down to this solids level. By vortexing the centrifuge tube, the added
water was mixed thoroughly with the diluted sample.
The three replications were centrifuged for 18 minutes at 26000*g to
separate the soluble solids from the insoluble solids. Glass beads (3 mm) were
added to a sintered glass filter to act as a filter aid during the filtration of the
supernatant after each washing/centrifugation step. The filter and filter aid was
dried in the oven set at 110 °C for 2 h prior to their use.
Aluminum pans were prepared by adding approximately 15 mg/sq cm of
diatomaceous earth and drying them in an oven set at 110°C for 30 minutes.
The weight of the pan and diatomaceous earth was recorded after cooling in a
desiccator for 30 minutes to 1 hour. The supernatant from the centrifugation was
filtered through the sintered glass filter and collected in the weighed pan. This
material represents the soluble solids and will be discussed in the next section.
29
The recommended procedure is to repeat the washing step until no soluble
solids is detected in the supernatant. The best indication of this point is the
refractive index measurement of the supernatant. A Brix value of zero would
indicate zero soluble solids in the supernatant. After a few trials, it was
determined experimentally that by adding 10ml_ to 15ml_ water (adequate to
balance the tubes for centrifugation) to each centrifuge tube and washing the
sample 5 times, a Brix value of zero can be obtained. However, to have a little
safety margin, a total of 6 washing steps were used in this study.
The pellet resulting from 6 washed steps was transferred to a pre-dried and
weighed aluminum pan. For each centrifuge tube there was a designated pan.
By adding small amount of water and using a spatula, the insoluble solids were
spread uniformly over the bottom of the pan. Because this sample is free of
sugars and is less prone to caramelize, it was possible to subject it to higher
temperatures and longer drying times. The experimental practice showed that
subjecting this sample to a temperature of 100°C for 8h or over night resulted in
the efficient evaporation of water. The dried sample was covered and placed into
a desiccator and weighed when they reached room temperature.
As the number of washing steps increased, it became more difficult to form a
firm pellet during centrifugation. These loose pellets would release insoluble
material into the supernatant liquid during decanting and lead to a loss in
insoluble solids. To prevent this error, the supernatant is decanted into a
sintered glass filter to collect the released insoluble material. This amount of
trapped insoluble solids on filter is dried and added to the dried insoluble pellet.
30

The water insoluble solids (WIS) of each replication was calculated as the dry
weight of the residue after 6 washings divided by the initial weight of the paste
while the dried weight of the residue itself is the sum of dried weight in the pan
and on the sinter glass filter.
Equation 6
Dried weight of residue in pan = (Weight of dry residue + pan) - (Weight of pan)
Equation 7
Dried weight of residue in filter=(Weight of dry residue + filter) - (Weight of filter)
Because the samples were diluted 1:3, a dilution factor of 3 was applied to
calculate the true WIS.
Equation 8
% Insoluble Solids = ( Equation 6 + Equation7 ) x 3 * 100
Weight of the initial sample in the centrifuge tube
1.3.2.1.c Water Soluble Solids (Vacuum Oven)
None of the recognized methods measure soluble solids directly by isolating
soluble solids from insoluble solids. The method developed in the present study
is the first reported procedure that measures soluble solids directly.
1.3.2.1.c.a Sample Preparation
The same dilution procedure that was used for total solids measurement
(1.3.2.1 .a.b) was used for soluble solids.
1.3.2.1.c.b Procedure
The same procedure used for the isolation of WIS (section 1.3.2.1.b.b) was
used for the isolation of soluble solids. In this experiment, the supernatant is
collected rather than the pellet. The supernatants from six successive washing
31
steps were passed through a sintered glass filter with glass beads and collected
in a dried and pre-weighed pan.
The filtered soluble solids solution contains a large amount of water and was
therefore pre-dried in a water bath set at 70°C to prevent the caramelization of
the sugars. The pre-weighed pans containing diatomaceous earth and the
soluble solids solution were placed in the water bath. Approximately 24 h was
needed to partially dry these samples. The pre-dried samples were transferred to
a vacuum oven set at 70°C and the applied pressure of <50 mm Hg. After exact
2 h the vacuum was released as describe previously. The sample were covered
with a lid and transferred to a desiccator and weighed after cooling to room
temperature.
The water soluble solid content (%SS) of each replication was calculated as
the difference in the dry weight of the supernatant from 6 centrifugations divided
by the weight of the initial paste. Because the samples were diluted 1:3, a dilution
factor of 3 was applied to calculate the true soluble solids content.
Equation 9
Soluble Solids (%) = (Weight of dry residue + dish) - (Weight of dish)x100 *3
Wight of the initial sample in the centrifuge tube
It should be noted that in our experiment we collected the soluble solids from
the same centrifuged tube that the insoluble solids was collected, but it is not
necessary to collect the insoluble solids if only the soluble fraction is required.
1.3.2.2 Microwave Oven Method
1.3.2.2.a Total Solids (Microwave Oven)
The following procedure is based on the official method of AOAC sec 42.1.09
32
(AOAC 2000) for the total solids content of paste determined by the microwave
oven method.
1.3.2.2.a.b Sample Preparation
The same procedure detailed in section 1.3.2.1.a.b was used to prepare the
diluted sample.
1.3.2.2.a.c Procedure
The microwave oven was set for power level 100% and time 4 minutes. Two
glass fibre pads were placed on the balance ring in the microwave and the
complete cycle of 4 minutes was run. By performing this cycle any moisture in
the pads was removed. The pre-dried pads were placed on the scale in the oven
and tared. The balance displays 0.0000 with a deviation of ±0.0002.
Approximately 2 g of the diluted paste was removed with a jumbo bulb pipette
and deposited on the first pad and then covered with the second pad. The
diluted sample is composed of large paste particles suspended in water that
could clog the pipette and not deliver a homogeneous sample. To remedy this
problem, the pipette tip was cut off to increase the outlet pore size and allow the
free flow of the sample. The deposition of the sample on the pad was performed
quickly to reduce absorption of air moisture and/or evaporation of samples
moisture. After placing of the sample on the balance, the microwave door was
closed and the microprocessor displays the weight of the sample in less than 5
second. When the weight starts to decrease the run button was pressed and the
drying cycle starts. The percent solids content of samples was automatically
displayed at the end of the 4 minutes cycle.
33
Three determinations were performed on each sample and if the variation
between readings was greater than 0.02, the reading was not accepted and more
replications were performed.
1.3.2.2.b Water Insoluble Solids (Microwave Oven)
The insoluble solids were determined by calculation using values for total
solids (%TS) and % solids in the supernatant fraction (%SSF) in Equation 3
(see 1.2.5.2). %TS was determined by microwave oven (see 1.3.2.2).
%WIS = 100(%TS-%SSR 100-%SSF
Where:
%WIS = % Water Insoluble Solids in paste
%TS = % Total Solid in paste (see 1.3.2.2.a)
%SSF = % solids in the supernatant fraction from one centrifugation (see
1.3.2.2.C)
1.3.2.2.C Solids in the Supernatant Fraction (Microwave Oven)
The % solid in the supernatant fraction (%SSF) is the concentration of
dissolved solids in the supernatant of a paste sample that was centrifuged once
to separate the water insoluble solids from the aqueous phase (supernatant
fraction). The (%SSF) should not be confused with the % soluble solids (%SS)
term which represents the total soluble solids in the paste.
1.3.2.2.c.a Sample Preparation
Three replications of each sample were prepared by pipetting 25 g of diluted
paste into a 50 ml_ centrifuge tubes (details given at 1.3.2.1.b).
34
1.3.2.2.c.b Procedure
Replicate samples were centrifuged for 18 minutes at 26672xg. The clear
supernatant was collected and used directly without filtration to avoid absorption
of serum on the filter medium and moisture evaporation during filtration. The
solids in the supernatant was determined by evaporating the moisture in a CEM
microwave set at 100% power level and run time of 5 min. Before starting, the
empty microwave oven was pre-conditioned by running the cycle once. Two
glass fiber pads were dried by placing them on the scale in the microwave oven
and running one cycle. The dried pads were tared on the scale. To one pad, 2.5-
3.5 g of sample were spread out evenly and then covered with the second pad.
The sample containing pads were placed on the microwave internal balance and
automatically weighed by pressing the run button. After completing the heating
cycle, the microwave reports the soluble solid in the supernatant as a percentage
of the starting weight.
1.3.2.2.d Water Soluble Solid (Microwave Oven)
The percent water soluble solids (%SS) is the final component that was
determined by the microwave method. The concept of soluble solids defines it as
the portion of solids in the paste that is soluble. The water soluble solids were
determined indirectly by calculation. The difference between total solids and
insoluble solid is equal to the soluble solids in the paste. The total solid was
determined by microwave method (section 1.3.2.2.a) and the water insoluble
solids were determined by calculation (section 1.3.2.2.b). Soluble solid was
calculated with the following equation:
35
Equation 10
%Water Soluble Solids = %TS - %WIS
%TS = % Total Solid in paste (see 1.3.2.2.a)
%WIS=% Water Insoluble Solids (see 1.3.2.2.b)
As the samples were diluted prior to analysis, all values have to be multiplied by
a factor of 3 to obtain the final concentrations.
36

1.4 Results
The results from these experiments were used to examine the repeatability of
each method and to compare the two methods (the microwave method and the
vacuum oven method).
1.4.1 Vacuum Oven Method
1.4.1.1 Total Solids (Vacuum Oven)
The % total solids were determined in triplicate following the procedure
outlined in section 1.3.2.1.a. The mean of three determinations and the standard
deviation for 20 different paste samples are given in Table 1.1.
Table 1.1 Percent Total Solids (%TS) in Tomato Pastes by Vacuum Oven.
Mean of Three Determinations (%) ± Standard Deviation.
ID
1
2
3
4
5
TS (%)
28.51±0.05
28.03±0.07
27.45±0.12
28.44±0.09
27.68±0.02
ID
6
7
8
9
10
TS (%)
27.07±0.05
24.85±0.05
26.58±0.09
27.83±0.10
26.72±0.08
ID
11
12
13
14
15
TS (%)
25.53±0.06
24.63±0.07
28.37±0.06
28.21±0.06
28.19±0.06
ID
16
17
18
19
20
TS (%)
26.63±0.04
29.69±0.07
27.88±0.09
25.15±0.00
25.02±0.02
1.4.1.2 Water Insoluble Solids (Vacuum Oven)
Similar to total solids, the water insoluble solids were determined in triplicate
on 20 different paste samples following the procedure in section 1.3.2.1.b. The
mean of three determinations and the standard deviation for 20 different paste
samples are given in Table 1.2.
37

Table 1.2 Percent Water Insoluble Solids (%WIS) in Tomato Pastes by
Vacuum oven. Mean of Three Determinations (%) ± Standard Deviation.
ID
1
2
3
4
5
WIS (%)
5.67±0.08
5.52±0.08
5.93±0.05
6.31±0.08
5.20±0.02
ID
6
7
8
9
10
WIS (%)
5.54±0.04
5.28±0.49
6.43±0.23
6.10±0.09
5.68±0.22
ID
11
12
13
14
15
WIS (%)
5.56±0.07
5.23±0.03
5.98±0.06
5.58±0.06
6.66±0.01
ID
16
17
18
19
20
WIS (%)
5.01 ±0.08
5.53±0.8
6.1U0.04
5.42±0.02
5.47±0.10
1.4.1.3 Water Soluble Solids (Vacuum Oven)
Following the procedure detailed in section 1.3.2.1.C, the soluble solid fraction
of tomato paste was determined in triplicate. The mean of three determinations
and the standard deviation for 20 paste samples are given in Table 1.3.
Table 1.3 Percent Water Soluble Solids (%SS) in Tomato Pastes by Vacuum
Oven. Mean of Three Determinations (%) ± Standard Deviation.
ID
1
2
3
4
5
SS (%)
22.77±0.07
22.19±0.07
21.55±0.18
22.21±0.09
22.94±0.03
ID
6
7
8
9
10
SS (%)
22.05±0.05
19.61±0.07
21.47±0.54
22.14±0.08
21.15±0.08
ID
11
12
13
14
15
SS (%)
20.18+0.10
19.41±0.11
22.34±0.12
22.93±0.17
21.92±0.06
ID
16
17
18
19
20
SS (%)
22.10±0.07
23.54±0.25
22.05±0.12
19.97±0.01
19.98+0.05
1.4.2 Microwave Oven Method
The total solids content of tomato paste were determined directly by
microwave oven drying. However the soluble solids and water insoluble solids
were calculated with a formula that requires values for the % total solids (%TS)
and % solids in the supernatant (%SSF).
38

1.4.2.1 Total Solids (Microwave Oven)
The % total solids were determined by microwave as described in section
1.3.2.2.a. The mean of three determinations and the standard deviation for 20
different paste samples are given in Table 1.4.
Table 1.4 Percent Total Solids (%TS) in Tomato Pastes by Microwave. Mean of
Three Determinations (%) ±Standard Deviation
ID
1 2 3 4 5
TS (%)
28.28+0.09 28.20±0.06 27.77±0.06 28.66±0.05 27.50±0.02
ID
6 7 8 9 10
TS (%)
27.48±0.00 25.32±0.04 28.13±0.06 27.92±0.06 26.91+0.00
ID
11 12 13 14 15
TS (%)
25.52±0.06 24.89±0.02 28.47±0.04 27.99±0.04 28.29+0.04
ID
16 17 18 19 20
TS (%)
26.88±0.04 29.99±0.02 28.26±0.09 25.28±0.02 25.40±0.06
1.4.2.2 Solids in the Supernatant Fraction (Microwave Oven)
The % solids in the supernatant fraction (%SSF) were determined using the
procedure described in section 1.3.2.2.C. Three replicate samples were
centrifuged and the supernatant dried in the microwave oven. The readings were
repeated at least three times and in some cases where high variations were
detected, it was repeated more than 3 times. The results are shown in Table 1.5.
Table 1.5 Percent Solids in the Supernatant Fraction (%SSF) in Tomato
Pastes by Microwave. Mean of Three Determinations (%) ± Standard Deviation.
ID
1 2 3 4 5
SSF(%)
23.25±0.06 22.78±0.11 22.12±0.09 23.01±0.00 22.40+0.02
ID
6 7 8 9 10
SSF (%)
22.22±0.02 20.12±0.02 21.84±0.00 22.23±0.08 21.38±0.06
ID
11 12 13 14 15
SSF (%)
20.34±0.04 19.64±0.02 22.64±0.04 22.845±0.02 22.28±0.02
ID
16 17 18 19 20
SSF (%)
22.28±0.06 23.90±0.11 22.58±0.02 20.22±0.04 20.1 ±0.00
39
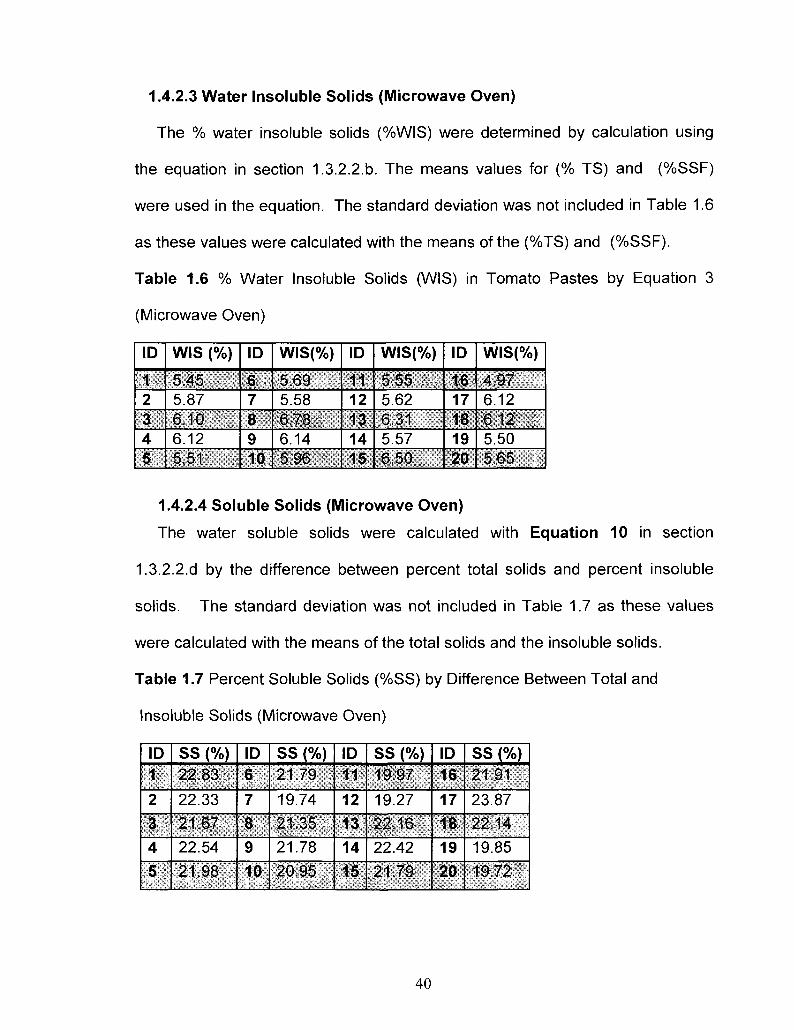
1.4.2.3 Water Insoluble Solids (Microwave Oven)
The % water insoluble solids (%WIS) were determined by calculation using
the equation in section 1.3.2.2.b. The means values for (% TS) and (%SSF)
were used in the equation. The standard deviation was not included in Table 1.6
as these values were calculated with the means of the (%TS) and (%SSF).
Table 1.6 % Water Insoluble Solids (WIS) in Tomato Pastes by Equation 3
(Microwave Oven)
ID
1 2 3 4 5
WIS (%)
5.45 5.87 6.10 6.12 5.51
ID
6 7 8 9 10
WIS(%)
5.69 5.58 6.78 6.14 5.96
ID
11 12 13 14 15
WIS(%)
5.55 5.62 6.31 5.57 6.50
ID
16 17 18 19 20
WIS(%)
4.97 6.12 6.12 5.50 5.65
1.4.2.4 Soluble Solids (Microwave Oven)
The water soluble solids were calculated with Equation 10 in section
1.3.2.2.d by the difference between percent total solids and percent insoluble
solids. The standard deviation was not included in Table 1.7 as these values
were calculated with the means of the total solids and the insoluble solids.
Table 1.7 Percent Soluble Solids (%SS) by Difference Between Total and
Insoluble Solids (Microwave Oven)
ID 1
2
3
4
5
SS (%) 22.83
22.33
21.67
22.54
21.98
ID 6
7
8
9
10
SS (%) 21.79
19.74
21.35
21.78
20.95
ID 11
12
13 14
15
SS (%) 19.97
19.27
22.16
22.42
21.79
ID 16
17
18
19
20
SS (%) 21.91
23.87
22.14
19.85
19.72
40
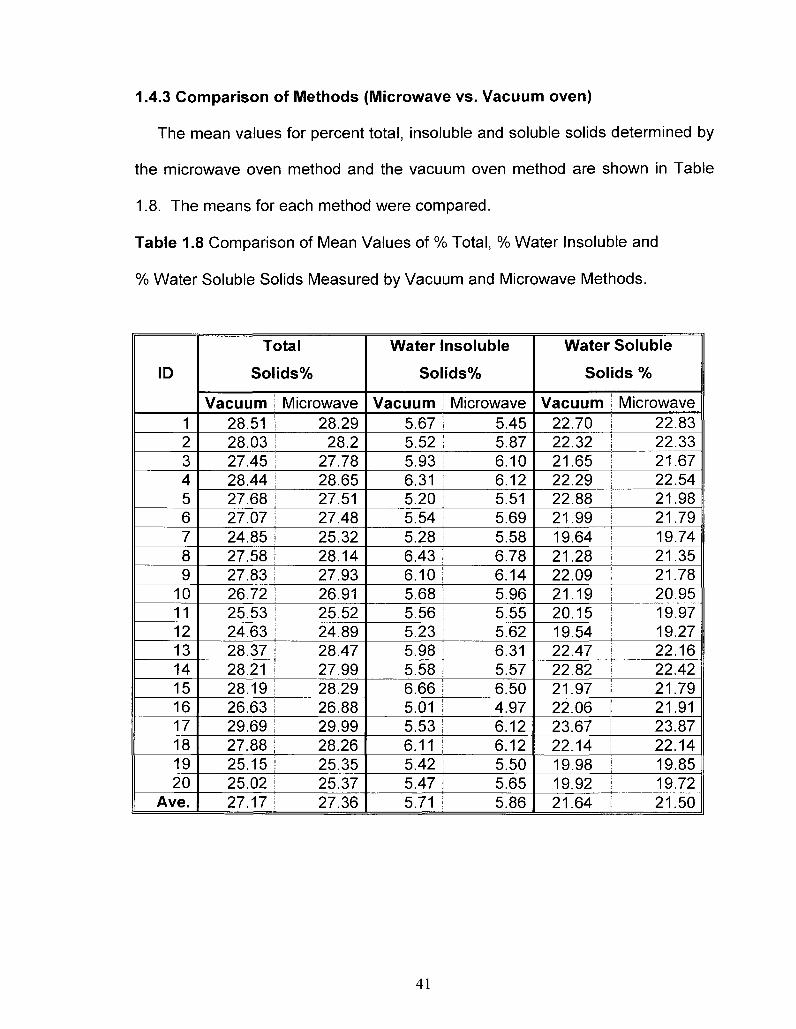
1.4.3 Comparison of Methods (Microwave vs. Vacuum oven)
The mean values for percent total, insoluble and soluble solids determined by
the microwave oven method and the vacuum oven method are shown in Table
1.8. The means for each method were compared.
Table 1.8 Comparison of Mean Values of % Total, % Water Insoluble and
% Water Soluble Solids Measured by Vacuum and Microwave Methods.
ID
1 2 3 4 5 6 7 8 9
10 11 12 13 14 15 16 17 18 19 20
Ave.
Total
Solids%
Vacuum 28.51 28.03 27.45 28.44 27.68 27.07 24.85 27.58 27.83 26.72 25.53 24.63 28.37 28.21 28.19 26.63 29.69 27.88 25.15 25.02 27.17
Microwave 28.29
28.2 27.78 28.65 27.51 27.48 25.32 28.14 27.93 26.91 25.52 24.89 28.47 27.99 28.29 26.88 29.99 28.26 25.35 25.37 27.36
Water Insoluble
Solids%
Vacuum 5.67 5.52 5.93 6.3JL 5.20 5.54 5.28 6.43 6.10 5.68 5.56 5.23 5.98 5.58 6.66 5.01 5.53 6.11 5.42 5.47 5.71
Microwave 5.45 5.87 6.10 6.12 5.51 5.69 5.58 6.78 6.14 5.96 5.55 5.62 6.31 5.57 6.50 4.97 6.12 6.12 5.50 5.65 5.86
Water Soluble
Solids %
Vacuum 22.70 22.32 21.65 22.29 22.88 21.99 19.64 21.28 22.09 21.19 20.15 19.54 22.47 22.82 21.97 22.06 23.67 22.14 19.98 19.92 21.64
Microwave 22.83 22.33 21.67 22.54 21.98 21.79 19.74 21.35 21.78 20.95 19.97 19.27 22.16 22.42 21.79 21.91 23.87 22.14 19.85 19.72 21.50
41

1.5 Statistical Analysis
Data analysis was done by S-PLUS, Copyright (c) 1988, 2007 Insightful Corp.
S: Copyright Insightful Corp. Enterprise Developer Version 8.0.4 for Microsoft
Windows: 2007. All data used in the statistical analysis were from the data set
where the total solids in the 20 paste samples ranged from 24 to 29%.
1.5.1 Repeatability (Vacuum and Microwave Oven Methods)
1.5.1.1 Total Solids (Vacuum Oven)
To compare the repeatability of the microwave and vacuum oven methods,
the Average Standard Deviation (ASD) was calculated. ASD is defined as the
square root of the arithmetic mean of the square of the deviations from the
average value for a set of observations.
Equation 9
MD= |Z?°ZJ(w-W (3 - 1) X (20)
Where:
yij: Observation for one replication of a sample
yi: Mean of replications for a sample
ASD can be considered as a measure of statistical dispersion, measuring how
widely spread the values are in a data set. If many data points are close to the
mean, then the ASD is small; if many data points are far from the mean, and then
the ASD is large. If all data values are equal, then the ASD is zero. The source of
the errors is both systematic errors (calibration of instruments, changes in the
environment, imperfect observational measurements) and random errors
42
(inherent limitations of the instrument or the experimenter's inability to precisely
make measurements or take measurements). In this project, ASD was calculated
for the 20 samples with 3 replications on each sample. For Total Solids, the
vacuum method produced an ASD of 0.067%.
1.5.1.2 Water Insoluble Solids (Vacuum Oven)
The ASD of 0.23% for insoluble solids was determined by the vacuum oven
method.
1.5.1.3 Water Soluble Solids (Vacuum Oven)
The ASD for soluble solids determined by the vacuum oven method was 0.21%.
1.5.1.4 Total solids (Microwave Oven)
The microwave method for total solids was evaluated for repeatability in the
same manner as was done with the vacuum oven method. The ASD of
measurements determined by microwave was 0.045%.
1.5.1.5 Solids in Supernatant Fraction (Microwave Oven)
The average standard deviation for solids in the soluble solids fraction was
0.050%.
1.5.2 Comparison of Methods (Microwave vs. Vacuum oven)
1.5.2.1 Total Solids (Microwave vs. Vacuum oven)
1.5.2.1.a Equality of the Methods (Total Solids)
A paired t-test was performed at the 5% significant level to test equality of
means between the two methods. A mean difference of -0.187 (27.17- 27.36)
was calculated for total solids (Table 1.8, section 1.4.3) The p-value was 0.001
43
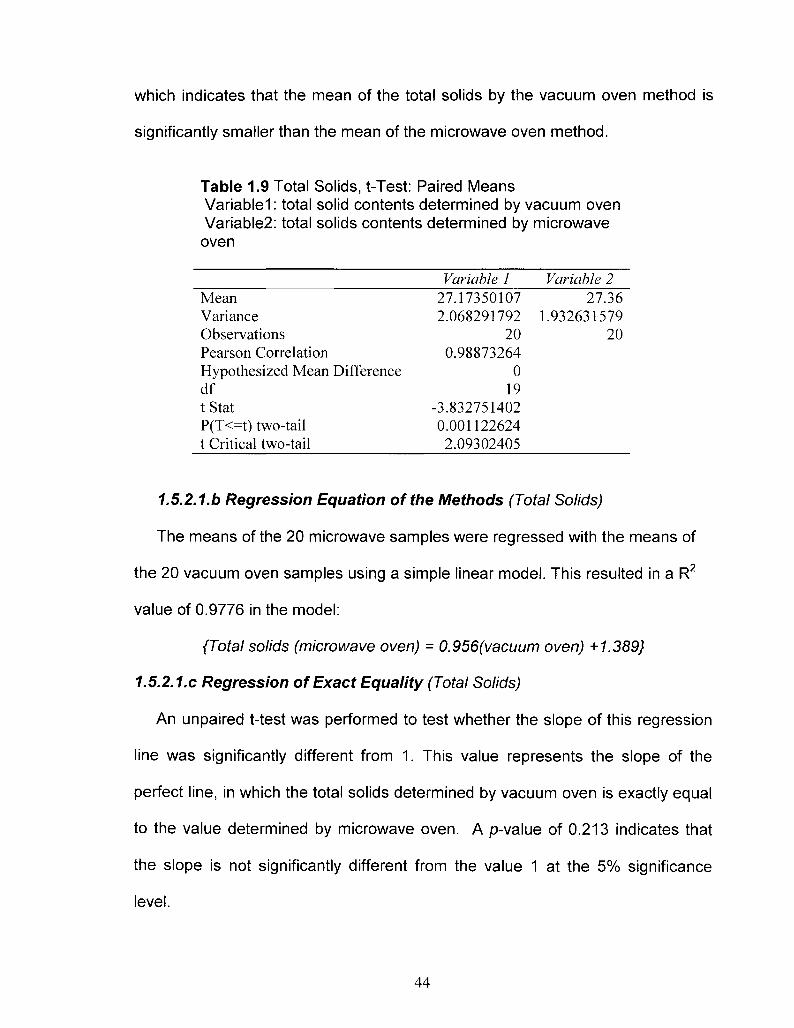
which indicates that the mean of the total solids by the vacuum oven method is
significantly smaller than the mean of the microwave oven method.
Table 1.9 Total Solids, t-Test: Paired Means Variablel: total solid contents determined by vacuum oven Variable2: total solids contents determined by microwave oven
Variable 1 Variable 2 Mean 27.17350107 27.36 Variance 2.068291792 1.932631579 Observations 20 20 Pearson Correlation 0.98873264 Hypothesized Mean Difference 0 df 19 tStat -3.832751402 P(T<=t) two-tail 0.001122624 t Critical two-tail 2.09302405
1.5.2.1.b Regression Equation of the Methods (Total Solids)
The means of the 20 microwave samples were regressed with the means of
the 20 vacuum oven samples using a simple linear model. This resulted in a R2
value of 0.9776 in the model:
{Total solids (microwave oven) = 0.956(vacuum oven) +1.389}
1.5.2.1.c Regression of Exact Equality (Total Solids)
An unpaired t-test was performed to test whether the slope of this regression
line was significantly different from 1. This value represents the slope of the
perfect line, in which the total solids determined by vacuum oven is exactly equal
to the value determined by microwave oven. A p-value of 0.213 indicates that
the slope is not significantly different from the value 1 at the 5% significance
level.
44
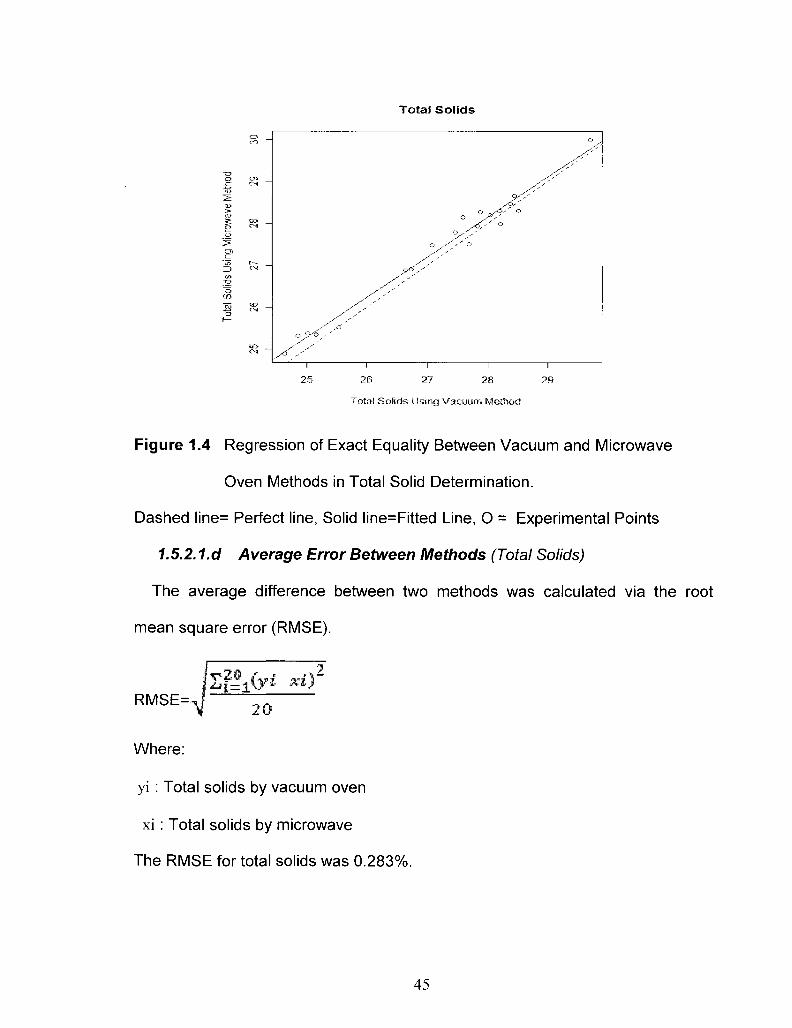
Total Solids
y K °
25 26 27 28 29
Total Solids Using Vacuum Method
Figure 1.4 Regression of Exact Equality Between Vacuum and Microwave
Oven Methods in Total Solid Determination.
Dashed line= Perfect line, Solid line=Fitted Line, O = Experimental Points
1.5.2.1.d Average Error Between Methods (Total Solids)
The average difference between two methods was calculated via the root
mean square error (RMSE).
^fi&i *02
20 RMSE=AJ
Where:
yi : Total solids by vacuum oven
xi : Total solids by microwave
The RMSE for total solids was 0.283%.
45
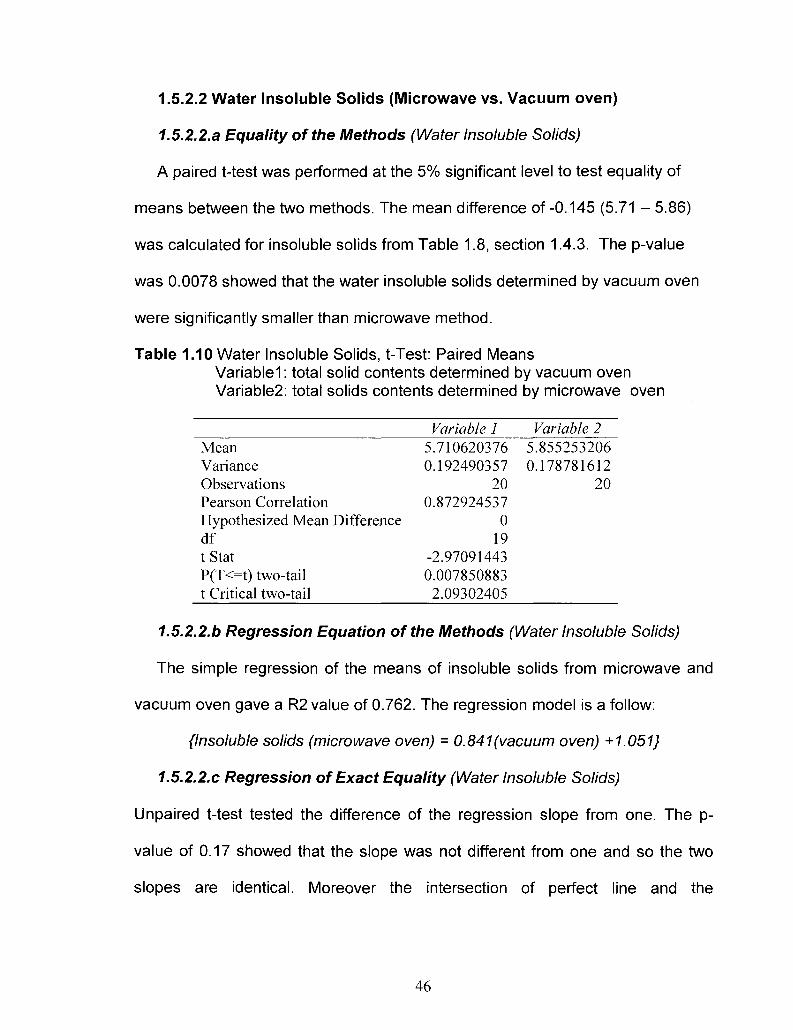
1.5.2.2 Water Insoluble Solids (Microwave vs. Vacuum oven)
1.5.2.2.a Equality of the Methods (Water Insoluble Solids)
A paired t-test was performed at the 5% significant level to test equality of
means between the two methods. The mean difference of -0.145 (5.71 - 5.86)
was calculated for insoluble solids from Table 1.8, section 1.4.3. The p-value
was 0.0078 showed that the water insoluble solids determined by vacuum oven
were significantly smaller than microwave method.
Table 1.10 Water Insoluble Solids, t-Test: Paired Means Variablel: total solid contents determined by vacuum oven Variable2: total solids contents determined by microwave oven
Variable 1 Variable 2 Mean 5.710620376 5.855253206 Variance 0.192490357 0.178781612 Observations 20 20 Pearson Correlation 0.872924537 Hypothesized Mean Difference 0 df 19 t Stat -2.97091443 P(T<=t) two-tail 0.007850883 t Critical two-tail 2.09302405
1.5.2.2.b Regression Equation of the Methods (Water Insoluble Solids)
The simple regression of the means of insoluble solids from microwave and
vacuum oven gave a R2 value of 0.762. The regression model is a follow:
{Insoluble solids (microwave oven) = 0.841(vacuum oven) +1.051}
1.5.2.2.C Regression of Exact Equality (Water Insoluble Solids)
Unpaired t-test tested the difference of the regression slope from one. The p-
value of 0.17 showed that the slope was not different from one and so the two
slopes are identical. Moreover the intersection of perfect line and the
46
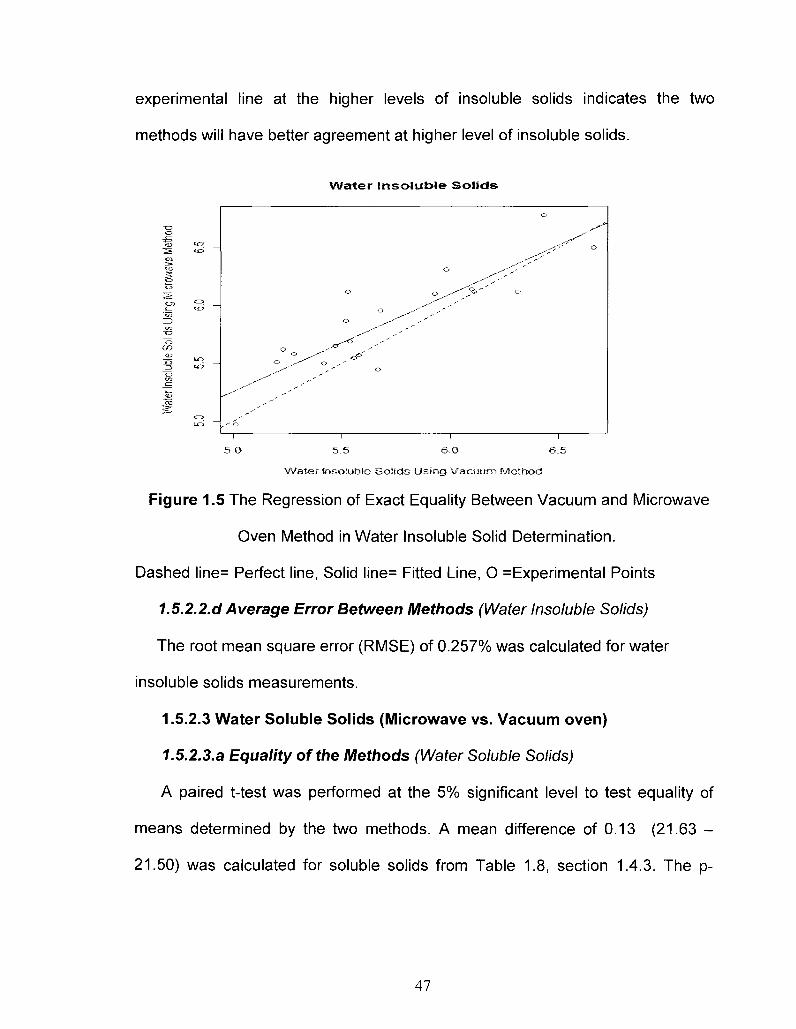
experimental line at the higher levels of insoluble solids indicates the two
methods will have better agreement at higher level of insoluble solids.
Water I nso lub le So l i ds
Water insoluble Softds Using Vacuum Method
Figure 1.5 The Regression of Exact Equality Between Vacuum and Microwave
Oven Method in Water Insoluble Solid Determination.
Dashed line= Perfect line, Solid line= Fitted Line, O =Experimental Points
1.5.2.2.d Average Error Between Methods (Water Insoluble Solids)
The root mean square error (RMSE) of 0.257% was calculated for water
insoluble solids measurements.
1.5.2.3 Water Soluble Solids (Microwave vs. Vacuum oven)
1.5.2.3.a Equality of the Methods (Water Soluble Solids)
A paired t-test was performed at the 5% significant level to test equality of
means determined by the two methods. A mean difference of 0.13 (21.63 -
21.50) was calculated for soluble solids from Table 1.8, section 1.4.3. The p-
47

value was 0.015 which indicates that the vacuum oven mean was significantly
greater than the microwave mean.
Table 1.11 Water Insoluble Solids,t-Test:Paired Means. Variablel: total solid contents determined by vacuum oven Variable2: total solids contents determined by microwave oven
Variable 1 Variable 2 Mean 21.63712272 21.50199679 Variance 1.438125639 1.483295167 Observations 20 20 Pearson Correlation 0.977603697 Hypothesized Mean Difference 0 df 19 t Stat 2.356342375 P(T<=t) one-tail 0.014672328 t Critical two-tail 2.09302405
1.5.2.3.b Regression Equation of the Methods (Water Soluble Solids)
The means of soluble solids determined by vacuum oven were regressed with
the means of the soluble solids determined by the microwave oven. The simple
linear model has the following relationship:
{Soluble solids (microwave oven) = 0.993(vacuum oven) +0.020}
A R2 value of 0.956 demonstrates that 95.6% of the variance is shared between
the microwave and vacuum oven methods.
1.5.2.3.C Regression of Exact Equality (Water Soluble Solids)
An unpaired t-test determined how close the slope of the regression line was
to one. The p-value of 0.89 indicated that the slope was not significantly different
from one.
48
Water So lub le So l ids
o to
22 23
Water Soluble Solids Using Vacuum Method
Figure 1.6 Regression of Exact Equality Between Vacuum and Microwave
Oven Method in Water Soluble Solids Determination
Dashed line= Perfect line, Solid line= Fitted Line, 0 =Experimental Points
1.5.2.3.d Average Error Between Methods (Water Soluble Solids)
The average difference between two methods was calculated via the root
mean square error (RMSE). The RMSE of 0.284% was determined for water
soluble solids.
49
1.6 Discussion
The comparison of solids measurements by vacuum oven and the
microwave/formula methods on tomato paste samples with total solids in the
range of 24-29% revealed that higher values were produced by the microwave
method when determining total solids and insoluble solids. For total solids the
same diluted paste sample was used for both methods so the most likely source
of error would be the drying step. For the vacuum oven the decomposition of
sugars and other labile compounds or loss of volatiles other than water could
contribute to lower values. However, care was taken to maintain the temperature
of the vacuum oven at 70°C to reduce these decomposition reactions. For the
microwave oven it should be noted that due to the rapid evaporation of water in
the microwave the exposure of the sample to heat is much shorter than the
vacuum oven. This would limit the weight loss due to decomposition reactions
which is important in product containing high amount of sugar such as paste and
especially soluble solids. The microwave oven could give higher values if the
sample was not completely dry after the 4 minute drying cycle. Additionally it has
been reported that the microwave oven model AVC-MP which is used in method
42.01.09 (AOAC, 2000), could be substituted with the AVC-80 model (Chin and
others ,1985). However, in another study by Wang (1987), the AVC-80 model
produced results higher than the AVC-MP model. This study employed the AVC-
80 model which might be the source of higher results for total solids.
In the case of the water insoluble solids (% WIS) the determination is
calculated with an equation that requires data obtained by extracting the diluted
50
paste sample with water. The assumption here is that all the soluble solids are
extracted by the water and is in the supernatant fraction (%SSF) after
centrifugation. Higher values for %WIS would be calculated if the %SSF value
was lower than the true value because not all the soluble solids were extracted.
On the other hand, the results produced by microwave/formula for soluble
solids (%SS) were slightly lower than the vacuum oven results. This difference
could be due to way it was calculated. Using the equation, %SS = %TS - %WIS,
the value for %SS will decrease if %WIS increases. Because the %SS is
determined by the difference between %TS and %WIS, any errors in these two
values will be reflected in an error in %SS. However, in the absence of clear-cut
definition for moisture content (free or bound) it is unclear which of the methods
would produce the true value. More over the good linear correlation of the
methods and the high repeatability of the microwave oven method in addition to
its ease of performance would suggest that the microwave/formula method is a
good alternative method for the determination of solids in tomato paste.
51
Chapter 2
THE COMPOSITION AND PROPERTIES OF THE
SOLUBLE SOLIDS FRACTION
2.1 Introduction
From a simplified point of vie,w, tomato juice and tomato paste are
considered to be composed of suspended particles (pulp) dispersed in a liquid
medium (serum), which can be separated by high speed centrifugation. These
tomato products can be viewed as a special type of dispersion in which the pulp
is suspended in a colloidal medium called serum. Depending on the processing
conditions, the serum is believed to contain soluble pectic substances, sugars,
salts and organic acids.
The soluble solid or serum solid phase has been extensively investigated for
its contribution to the consistency of tomato products, but much less attention
has been paid to its chemical interactions or nutritional value. Investigations that
have been conducted so far can be placed into the following categories:
measurements of soluble constituents, changes during harvesting or process and
measurement of its viscosity or consistency behavior.
This study investigated the chemical interactions of different constituents
present in the soluble solid fraction of tomato paste. The bright red appearance
of soluble solids separated by centrifugation denotes the presence of lycopene in
this fraction. Since lycopene is a hydrophobic compound it was not expected to
be in the water soluble fraction. It was hypothesized that lycopene interacts and
52

associates with hydrophilic compounds during the processing of tomato paste
and form a complexes that suspend lycopene in the aqueous environment.
2.2 Literature Review
2.2.1 Tomato Composition
To better understand the properties of the soluble solids fraction in tomato
paste, it is important to investigate the composition of the tomato.
2.2.1.1 Solids in Tomato
Water is the predominant constituent in tomatoes and represents about 90 to
95% of the total weight. The remaining constituents are the tomato solids. A
project in California on commercially grown tomatoes reported a variation of 4.56
to 9.55% in the total solids content of their tomatoes. However, the insoluble
solids were reported to be about 1 to 2%, leaving the soluble solids as the main
solids in tomato (Saywell and Cruess 1932).
The solids in tomato can be placed into 5 groups: carbohydrates, proteins/amino
acids, organic acids, minerals and lipids.
Carbohydrates: The predominant carbohydrate components in tomato are
reducing sugars (El Miladi and others 1969) while sucrose accounts for less than
0.1% (Goose and Binsted 1964). Glucose and fructose are the predominant
reducing sugars with relatively more fructose than glucose (Davies 1964). Among
the polysaccharides, pectins and arabinogalactans account for 50%; cellulose
about 25%; and the xylans and arabinoxylans constitute the rest of the fraction
(El Miladi and others 1969).
53
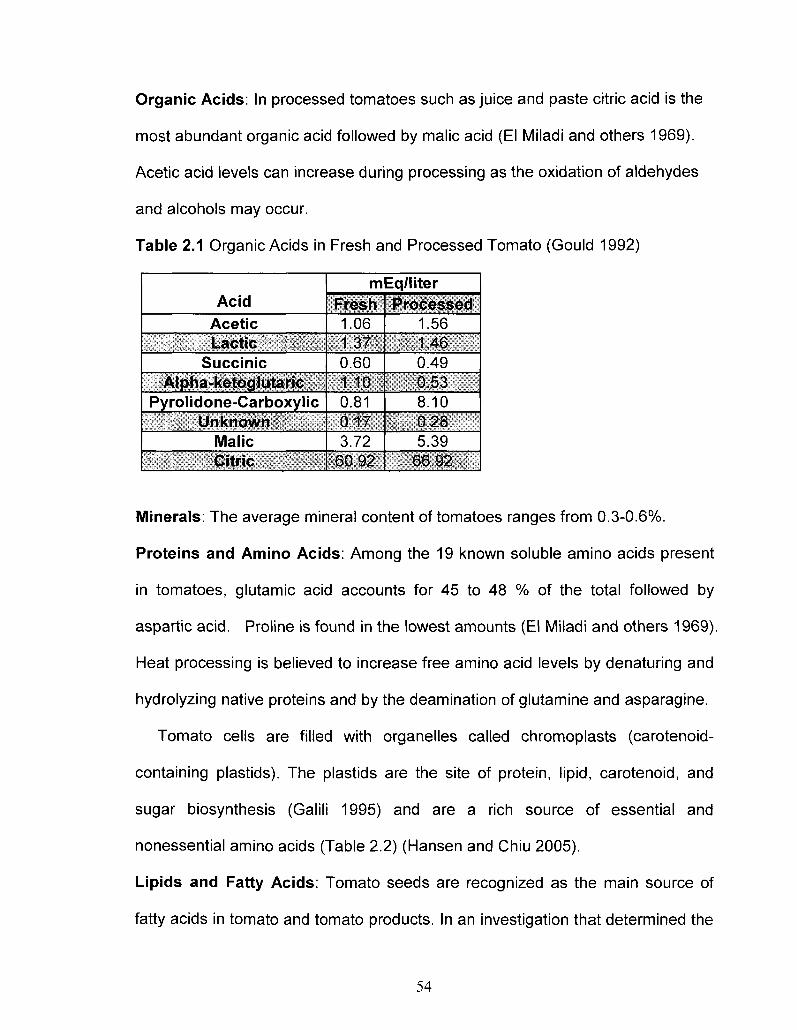
Organic Acids: In processed tomatoes such as juice and paste citric acid is the
most abundant organic acid followed by malic acid (El Miladi and others 1969).
Acetic acid levels can increase during processing as the oxidation of aldehydes
and alcohols may occur.
Table 2.1 Organic Acids in Fresh and Processed Tomato (Gould 1992)
Acid Acetic Lactic
Succinic Alpha-ketoglutaric
Pyrolidone-Carboxylic Unknown
Malic Citric
m Fresh 1.06 1.37 0.60 1.10 0.81 0.17 3.72
60.92
Eq/liter Processed
1.56 1.46 0.49 0.53 8.10 0.28 5.39
66.92
Minerals: The average mineral content of tomatoes ranges from 0.3-0.6%.
Proteins and Amino Acids: Among the 19 known soluble amino acids present
in tomatoes, glutamic acid accounts for 45 to 48 % of the total followed by
aspartic acid. Proline is found in the lowest amounts (El Miladi and others 1969).
Heat processing is believed to increase free amino acid levels by denaturing and
hydrolyzing native proteins and by the deamination of glutamine and asparagine.
Tomato cells are filled with organelles called chromoplasts (carotenoid-
containing plastids). The plastids are the site of protein, lipid, carotenoid, and
sugar biosynthesis (Galili 1995) and are a rich source of essential and
nonessential amino acids (Table 2.2) (Hansen and Chiu 2005).
Lipids and Fatty Acids: Tomato seeds are recognized as the main source of
fatty acids in tomato and tomato products. In an investigation that determined the
54
fatty acid composition of tomato seed oil from processing wastes, palmitic acid
was identified as the major saturated fatty acid (23.4%), while linoleic (42.8%)
and oleic (18.3%) was the major unsaturated fatty acids (Cantarelli 1993). The
analysis of tomato plastids showed 47% linoleic and 37% palmitic as the major
fatty acids (Table 2.3).
An important and much studied carotenoid in tomatoes is lycopene. There
are increasing numbers of clinical studies that support the role of lycopene in the
protection against prostate cancer, lung cancer and a broad range of epithelial
cancers. This important micronutrient is synthesized in the chromoplasts of
tomatoes during its maturation. The investigation of lycopene's behavior and its
interaction with other compounds requires a clear description of the tomato
chromoplast and its major constituents.
55

Table 2.2 Free Amino Acids in Pastes Made from Red Tomatoes (Liu and Luh
1979) and Amino Acid Composition of Water-Soluble Proteins in Tomato Juice
(Stein and Mohr 1949) and Tomato Plastids (Hansen and Chiu 2005).
Amino acid
Aspartic acid
Threonine
Serine
Asparagine
Glutamic acid
Glutamine
Proline
Glycine
Alanine
Valine
Cystine
Methionine
Isoleucine
Leucine
Tyrosine
Phenylalanine
y-amino-butyric acid
Lysine
Histidine
Arginine
Tryptophan
mg/100g paste
112.91
15.61
24.43
84.79
320.70
4.00
Trace
2.89
14.17
2.54
0.58
1.08
6.32
4.24
3.93
15.92
240.08
8.81
10.84
6.72
—
Molar ratio of amino acids in tomato
water soluble protein 12.71
5.70
4.02
—
11.73
—
6.22
9.02
7.17
6.53
0.00
1.22
5.68
10.21
3.29
4.08
—
6.67
2.00
3.75
—
mg/g of plastid protein
105.4
49.7
56.8
—
161.5
—
46.6
48
58.4
47.6
6.2
17.9
52.4
85.5
40.9
93.2
—
71.6
31.4
63.5
28.4
56

Table 2.3 Fatty Acid Composition of Tomato Seed Oil (%) from the Hot Break
Process (Cantarelli and others 1993) and Fatty Acid Composition of Tomato
Plastids (Hansen 2005).
FATTY ACID UNSATURATED
Myristoleic C14:1 Palmitoleic C16:1 Oleic C18:1 Linoleic C18:2 Linolenic C18:3
Arachiadoinc C20:4
TOTAL FATTY ACID SATURATED
Laurie C12:0 Myristic C14:0 Palmitic C16:0 Stearic C18:0 Arachidic C20:0 Monosaturated oleic C18:1 TOTAL
% in Seeds Hot Break
Trace 6.8 18.3 42.8 0.7
*
68.6 % in Seeds Hot Break
0.3 2.3
23.4 4.0 1.3 *
31.3
% in Tomato Plastids
*
* *
47.0 2.1
0.37
49.6 % in Tomato
Plastids *
*
37.0 3.0 8.5 1.0
49.6
2.2.1.2 Tomato Chromoplasts
Chromoplasts or plastids are organelles present in the tomato cell and are a
rich source of macro and micronutrients such as proteins, lipids, sugars and
lycopene. Plastids can be described as a membrane encapsulated vesicle
containing these concentrated nutrients. Plastids can be isolated from whole
tomatoes. The tomatoes are cut into pieces, homogenized in a Waring blender
and the seeds, skins, membranes and cell wall material are removed by filtration.
The filtrate is centrifuged to separate the deep red intact plastids from the clear
amber-colored supernatant liquid. The supernatant contains a high level of
57
ascorbic acid, sugars and other water-soluble compounds (Hansen and Chiu
2005). The precipitated plastids are rich in proteins, lipids, carbohydrates and
dietary fibre.
Amino Acids in Plastids: The nonessential amino acids, glutamic, aspartic and
phenylalanine, are found in the highest amounts in plastids. However, plastids
have a good balance of essential amino acids and its high lysine levels can be
used to supplement low levels found in white rice flour and white wheat flour
making these flours a more complete protein source. Also, the low content of
methionine in plastids can be an advantage when used as a supplement by
reducing the potential buildup of homocysteine. Homocysteine is formed when
methionine loses a methyl group by the action of methyl transferase (Hensen and
Chiu 2005). Amino acid profiles of plastids are shown in Table 2.2.
Dietary Fiber in Plastids: The dietary fiber content of the total, soluble and
insoluble solids in plastids are 21.1%, 17.7% and 3.4 %, respectively. Pectin is
the main soluble dietary fiber in plastids. Human digestive enzymes do not
hydrolyze pectin. The colonic bacteria however are capable of hydrolyzing the a-
glycosidic linkage in galacturonic acid polymers and produce butyric acid which is
known to induce the apoptosis process and cause cancerous cells to die (Hague
and others 1993, Smith and others 1998). Also insoluble fibers are believed to
prevent digestive tract cancers by complexing with food material and accelerating
the intestinal transit time of fecal matter.
Fatty acids in Plastids: Tomato plastids have a very high level of the essential
fatty acid linoleic acid (47%) which is a cholesterol-lowering fatty acid followed by
58

linolenic acid (2.1%). Meanwhile palmitic acid (37%) followed by arachidic acid
(8.5%) is present as saturated fatty acids in plastids (Hansen and Chiu 2005).
The fatty acid profile of plastids is shown in Table 2.3.
2.2.2 Lycopene
2.2.2.1 Lycopene in Tomato
In their investigation of plastids, Hansen and Chiu (2005) reported on the high
concentration of ascorbic acid, sugars and others soluble solids but they didn't
comment on the source of the amber colour in the supernatant while isolating
tomato plastids. A large amount of lycopene is precipitated with the plastids but
a significant amount remains in the supernatant. Because lycopene is a lipophilic
compound, it should not be in the water soluble fraction. This solubilization or
suspension of lycopene requires a special type of complex formation or an
association between lycopene and a more hydrophilic component(s) present in
tomato.
Lycopene is an important carotenoid that exists as a microcrystal, and
imparts the familiar red color to tomato, watermelon and a few other fruits.
However, tomato and tomato products are one of the best sources of lycopene.
The outer pericarp of the tomato has the highest concentration of lycopene
(McCollum 1955). Although there are different reports on the concentration of
lycopene in different parts of the tomato, the skin accounts for 3 or 5 times more
than the pulp, which indicates that lycopene is associated mainly with the
insoluble fiber components.
59
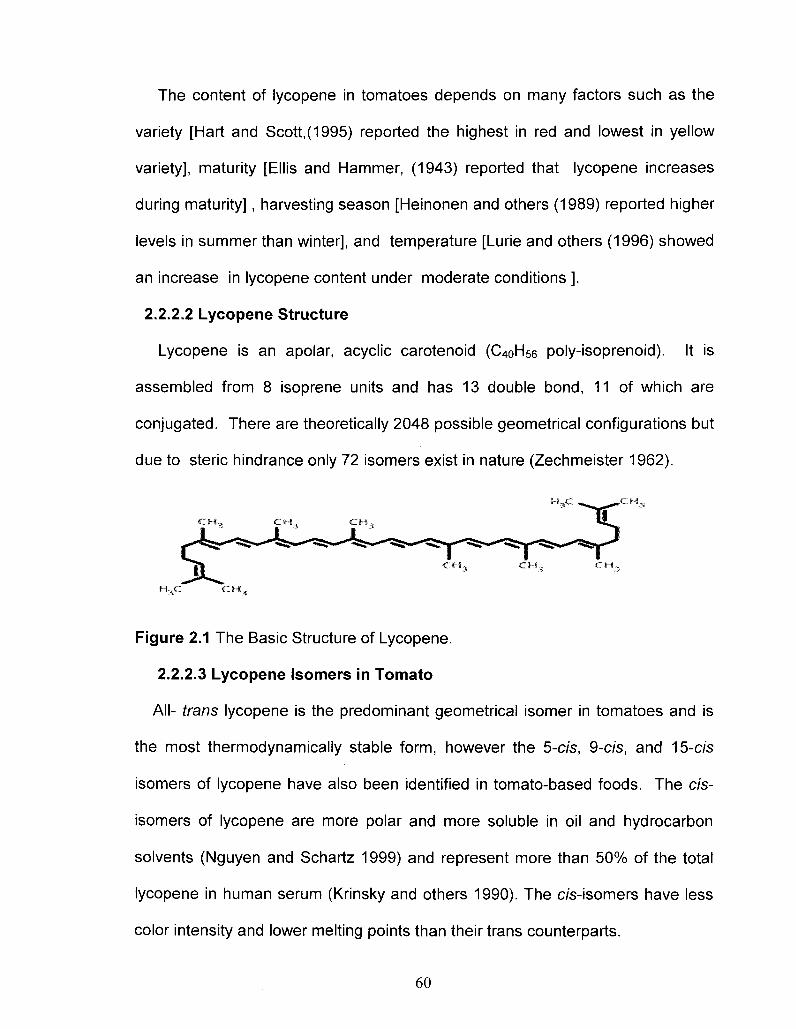
The content of lycopene in tomatoes depends on many factors such as the
variety [Hart and Scott,(1995) reported the highest in red and lowest in yellow
variety], maturity [Ellis and Hammer, (1943) reported that lycopene increases
during maturity], harvesting season [Heinonen and others (1989) reported higher
levels in summer than winter], and temperature [Lurie and others (1996) showed
an increase in lycopene content under moderate conditions ].
2.2.2.2 Lycopene Structure
Lycopene is an apolar, acyclic carotenoid (C40H56 poly-isoprenoid). It is
assembled from 8 isoprene units and has 13 double bond, 11 of which are
conjugated. There are theoretically 2048 possible geometrical configurations but
due to steric hindrance only 72 isomers exist in nature (Zechmeister 1962).
Figure 2.1 The Basic Structure of Lycopene.
2.2.2.3 Lycopene Isomers in Tomato
All- trans lycopene is the predominant geometrical isomer in tomatoes and is
the most thermodynamically stable form, however the 5-c/s, 9-c/s, and 15-c/s
isomers of lycopene have also been identified in tomato-based foods. The cis-
isomers of lycopene are more polar and more soluble in oil and hydrocarbon
solvents (Nguyen and Schartz 1999) and represent more than 50% of the total
lycopene in human serum (Krinsky and others 1990). The c/'s-isomers have less
color intensity and lower melting points than their trans counterparts.
60

The conversion from trans to the cis form (unstable, energy-rich) is a reaction
that has been shown to take place during tomato processing. The formation of di
-cis isomers has been detected during heat processing while heat, light, acids
and some chemicals can be used to promote isomerization of lycopene in
laboratory experiments.
2.2.2.4 Lycopene and Health Benefits
Lycopene's configuration enables it to trap peroxyl radicals (ROO ) and act
as a very efficient quencher of singlet oxygen (Di Mascio and others 1991). The
ability of lycopene to quench singlet-oxygen is reported to be twice that of (3-
carotene and 10 times greater than a-tocopherol (Weisburger 2002).
Various epidemiological studies have suggested that lycopene can lower the
risk of certain types of cancers. The treatment of diseases such as skin cancer
and prostate cancer by lycopene has been reported in the literature (Ribayo-
Mercado and others 1995). Dietary intake of tomato and tomato products
containing lycopene has been shown to be associated with a decrease in the risk
of chronic diseases such as cardiovascular disease (Clinton 1998). Also the
consumption of tomato-based foods can reduce the susceptibility of lymphocyte
DNA to oxidative damage (Riso and Porari 1997).
2.2.2.5 Lycopene Extraction by Enzyme
The increasing evidence of the health-promoting benefits of consuming
lycopene has induced many researchers to investigate novel approaches to
isolate and purify lycopene from tomatoes. Studies conducted by Sharma and
Le Maguer (1996) reporting high amounts of lycopene in tomato skin, led
61
Choudhari and Ananthanarayan (2007) to employ enzymes to extract lycopene
from tomato tissues. Their results showed the effectiveness of using pectinase
and cellulase for lycopene extraction. Optimum conditions for pectinase activity
were 2% w/w enzyme at pH 5, 60°C for 20 minutes. Cellulase required 3% w/w
enzyme at pH 4.5, 55 °C for 15 minutes.
2.2.2.6 Lycopene and Tomato Processing
The lycopene content in concentrated tomato products is generally lower than
expected because of losses during tomato processing (Tavares and Rodriguez-
Amaya 1994). Thermal and mechanical treatments are involved in tomato
processing which can cause lycopene degradation. Isomerization and oxidation
are the main reasons for lycopene degradation during tomato processing. High
temperatures, light intensity and oxygen levels accelerate these degradation
reactions.
2.2.2.7 Lycopene and Temperature
Heat treatment promotes the isomerization of lycopene from trans to cis.
The degree of isomerization is directly correlated with the intensity and duration
of the heat processing conditions (Schierle and others 1996, Shi and others
1999). To determine the effect of heat treatment on lycopene, an experiment
was conducted on lycopene dissolved in hexane and heated at 50°C, 100 °C and
150 °C for different times. The HPLC analysis of the lycopene solutions following
treatment demonstrated that at 50°C the all-frans-lycopene showed no significant
change for the first 12 hours, but it began to degrade afterwards. In that study an
increase in di-c/'s isomers was observed, indicating that the mono-c/'s-lycopene
62
was being converted into the di-c/'s. The decrease in mono-cis-lycopene when
the heating time was increased, could also suggest that its degradation rate was
greater than its formation rate. They concluded that the isomerization reaction
was dominant during the early stages of the heat treatment and degradation was
the dominant reaction at the latter stages (Lee and Chen 2001).
2.2.2.8 Lycopene and Storage
To study lycopene storage stability, Sharma and Le Maguer (1996) placed
fiber-rich tomato pulp samples under 3 different storage conditions (vacuum/dark,
air/light, air/dark) at -20, 5 and 25 °C for 60 days. The degradation of lycopene
followed pseudo first order kinetics and the maximum losses occurred in the
presence of air and light at 25°C. The small amount of lycopene loss in the
samples stored at -20 °C under vacuum/dark shows the possibility of an
autocatalytic reaction.
2.2.2.9 Lycopene and Illumination
Lee and Chen (2002) placed lycopene in an incubator at 25°C for 6 days
under four fluorescent 20 W tubes. The result showed a decrease in the a\\-trans-
lycopene content with increasing incubation time, but the mono-c/s isomers
showed inconsistent changes (an increase at the beginning and a decrease after
2 h) suggesting that isomerization and degradation of lycopene was proceeding
simultaneously. In another study, the effects of light exposure on tomato powder
under different temperature conditions were investigated. An increase in cis-
isomer that ranged from 14-18% was reported (Anguelova and Warthesen 2000).
63
2.2.2.10 Lycopene in Different Food Systems
A study conducted by Ribeiro and Schubert (2003) showed the influence of
food systems on the stability of lycopene. In their study an emulsion of lycopene
was diluted in three food systems, (skimmed milk, orange juice and water). The
lycopene emulsion diluted in orange juice had the greatest lycopene stability.
This result showed the stability of lycopene in food systems was also influenced
by the presence of antioxidants. The presence of a-tocopherol in orange juice
enhanced the stability of lycopene.
2.2.2.11 Lycopene and its Bioavailability in Processed Tomato
It has been suggested by scientists that lycopene in processed tomatoes is
more bioavailable than in fresh tomatoes (Hadley and others 2003). The
bioavailability of lycopene has been strongly associated with the trans and cis
isomer content of the tomato product. The cis form is thought to be more
bioavailable than the trans form as serum contains more cis- lycopene than the
trans, which is the naturally occurring form of lycopene. This trend is based on
the cis isomer's greater solubility in bile acid micelles and its preferential
incorporation into chylomicrons (Boileau and others 1999). The chylomicrons
transport carotenoids from the intestinal mucosa to the blood via the lymphatic
system (Parker, 1996). In plasma, the carotenoids are carried by lipoproteins,
which surround the lipophilic carotenoids and increase their solubility in the
aqueous plasma.
In a study by Gartner (1997) focusing on the concentration of lycopene in
chylomicrons, he demonstrated that the lycopene that originated from tomato
64

paste was more bioavailable than the lycopene from fresh tomatoes. His study
showed that 65% of lycopene in the chylomicrons was in the trans form
(predominant form in the food) but only 45% were present in the trans form in
serum. The isomerization from trans to cis appears to be more prevalent in vivo
through biochemical or physiologic mechanisms than the pre-formed cis
lycopene found in paste forms during processing of fresh tomatoes.
Additional factors that can explain the greater bioavailability of lycopene in
processed tomato are food matrix effects and the disruption of the chromoplast,
which makes lycopene more accessible due to the breakage of cell wall
structures and membrane. In addition, the bioavailability of carotenoids can be
promoted by heat treatment of the food matrix, which dissociates the protein-
carotenoid complexes (Erdman, 1993).
It has also been shown that an oil medium improves the extraction of
lycopene into a lipophilic phase (Stahl and Sies 1992&1996). The complexes of
lipid-carotenoid that enters the duodenum (following the action by pancreatic
lipases and bile salts) are in the form of multi-lamellar lipid vesicle (Parker 1996).
In another study, it was suggested that there are interactions between
carotenoids such that lycopene ingested with p-carotene will be absorbed better
than lycopene ingested alone (Jackson 1997).
Dietary fiber can reduce the bioavailability of carotenoids due to matrix
interactions. Pectin for example, can produce high viscosity conditions that can
delay gastric emptying and interfere with micelle formation, which is needed for
65

carotenoid absorption (Rock and Swendseid 1992 and Di Lorenzo and others
1988).
2.2.2.12 Lycopene Rich Granules in Tomato Juice
During the investigation of the influence of insoluble solids on the viscosity of
tomato juice, Whittenberger and Nutting (1958) encountered an unexpected
phenomenon. When the serum (soluble solids fraction) was removed and
substituted with water, they noticed an increase in viscosity accompanied by a
decrease in the conductivity of the sample. In their microscopic examination,
they described tomato cell walls with visible lines outlining the cells along with
numerous small granules. These granules occurred commonly in clusters within
the cells and singly outside the cells and could be washed out along with the
soluble solids. The presence of these proteinaceous granules accompanied by
carotenoids and cellulosic cell wall material in the insoluble solid fraction was
previously reported by Kimball and others (1952). However, neither of these
researchers reported on the nature of these so called proteinaceous granules.
Linder and others (1984) assumed that lycopene was located in the chloroplast
and its distribution could be used as a marker for the distribution of coagulated
cytoplasmic material. Using this assumption he estimated that the cytoplasmic
material accounts for 34% of the total insoluble solids in tomato juice and that
25-30% of the total calcium is associated with this insoluble fraction (Linder,
Shomer and Vasilver 1984).
66
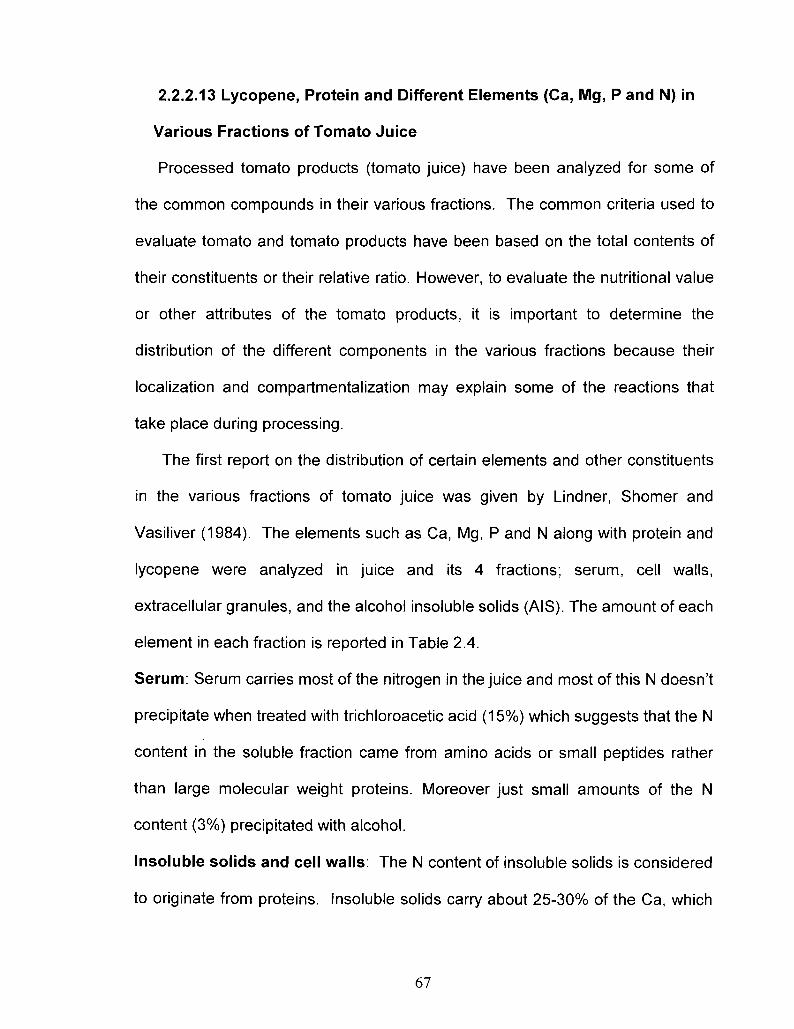
2.2.2.13 Lycopene, Protein and Different Elements (Ca, Mg, P and N) in
Various Fractions of Tomato Juice
Processed tomato products (tomato juice) have been analyzed for some of
the common compounds in their various fractions. The common criteria used to
evaluate tomato and tomato products have been based on the total contents of
their constituents or their relative ratio. However, to evaluate the nutritional value
or other attributes of the tomato products, it is important to determine the
distribution of the different components in the various fractions because their
localization and compartmentalization may explain some of the reactions that
take place during processing.
The first report on the distribution of certain elements and other constituents
in the various fractions of tomato juice was given by Lindner, Shomer and
Vasiliver (1984). The elements such as Ca, Mg, P and N along with protein and
lycopene were analyzed in juice and its 4 fractions; serum, cell walls,
extracellular granules, and the alcohol insoluble solids (AIS). The amount of each
element in each fraction is reported in Table 2.4.
Serum: Serum carries most of the nitrogen in the juice and most of this N doesn't
precipitate when treated with trichloroacetic acid (15%) which suggests that the N
content in the soluble fraction came from amino acids or small peptides rather
than large molecular weight proteins. Moreover just small amounts of the N
content (3%) precipitated with alcohol.
Insoluble solids and cell walls: The N content of insoluble solids is considered
to originate from proteins. Insoluble solids carry about 25-30% of the Ca, which
67
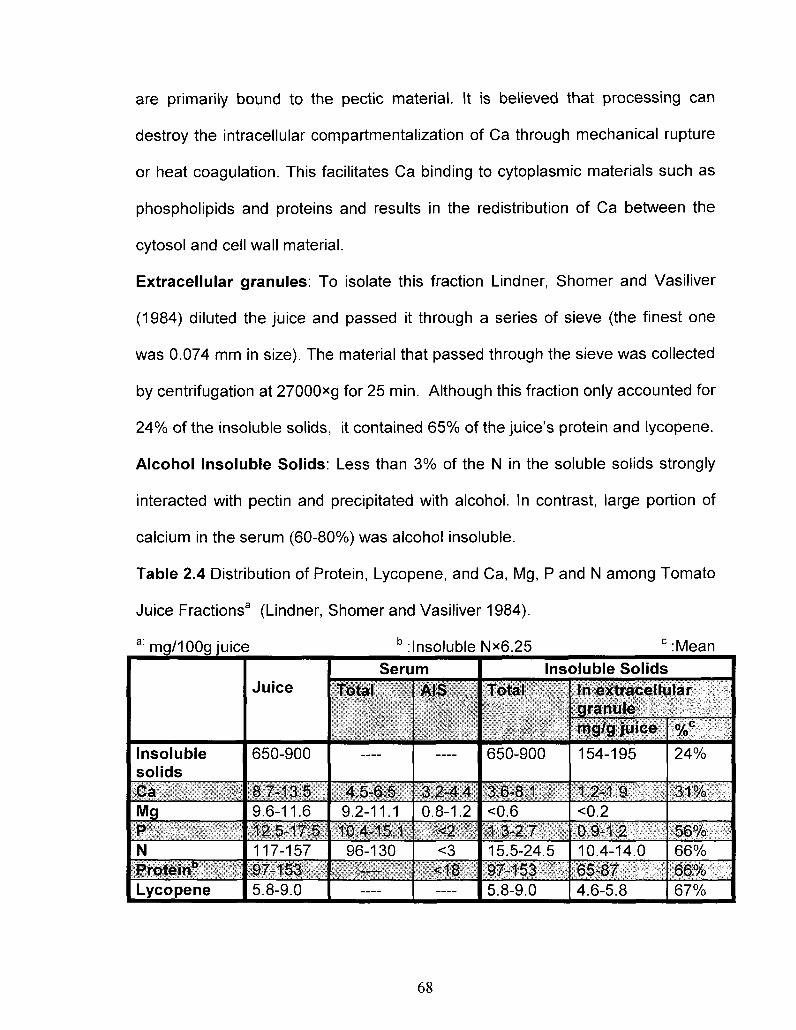
are primarily bound to the pectic material. It is believed that processing can
destroy the intracellular compartmentalization of Ca through mechanical rupture
or heat coagulation. This facilitates Ca binding to cytoplasmic materials such as
phospholipids and proteins and results in the redistribution of Ca between the
cytosol and cell wall material.
Extracellular granules: To isolate this fraction Lindner, Shomer and Vasiliver
(1984) diluted the juice and passed it through a series of sieve (the finest one
was 0.074 mm in size). The material that passed through the sieve was collected
by centrifugation at 27000*g for 25 min. Although this fraction only accounted for
24% of the insoluble solids, it contained 65% of the juice's protein and lycopene.
Alcohol Insoluble Solids: Less than 3% of the N in the soluble solids strongly
interacted with pectin and precipitated with alcohol. In contrast, large portion of
calcium in the serum (60-80%) was alcohol insoluble.
Table 2.4 Distribution of Protein, Lycopene, and Ca, Mg, P and N among Tomato
Juice Fractions3 (Lindner, Shomer and Vasiliver 1984).
a: mg/100g juice b insoluble N*6.25 c :Mean
Insoluble solids Ca Mg P N Protein" Lycopene
Juice
650-900
8.7-13.5 9.6-11.6 12.5-17.5 117-157 97-153 5.8-9.0
Serum Total
—
4.5-6.5 9.2-11.1 10.4-15.1 96-130
—
—
AIS
—
3.2-4.4 0.8-1.2
<2 <3
<18 —
Insoluble Solids Total
650-900
3.6-8.1 <0.6 1.3-2.7 15.5-24.5 97-153 5.8-9.0
In extracellular granule mg/g juice
154-195
1.2-1.9 <0.2 0.9-1.2 10.4-14.0 65-87 4.6-5.8
% c
24%
31%
56% 66% 66% 67%
68

In this experiment lycopene was detected in the serum fraction of
homogenized juice when the serum was obtained through centrifugation at
27,000*g for 30 min. Disintegration of some granules into submicron size
particles due to homogenization can account for this observation. Apparently the
conditions introduced by centrifugation (27,00Og) could not precipitate these
submicron particles.
These results reflect the variation in the distribution of tomato constituents in
the different fractions of tomato juice caused by processing.
2.2.2.14 Stabilization of Lycopene
The high sensitivity of lycopene to oxidation and other degradation reactions
have lead to various protective treatments such as the coating of this lipophilic
nanoparticle with a hydrophilic matrix. This treatment not only protects the
lycopene from oxidation but may also serve as a vehicle to disperse lycopene in
an aqueous medium.
2.2.2.14.a Encapsulation of All-Trans- Lycopene by Cyclodextrins
The nutritional importance of lycopene and its susceptibility to oxidative
degradation lead many researchers to investigate different methods of stabilizing
this compound. Blanch and others (2007) used cyclodextrins (CD) to
encapsulate all trans lycopene. They compared a supercritical fluid-C02 (SF-
C02) method to a conventional method in performing the encapsulation
procedure. The macrocycles of (3-CD in the torus-shaped structure with a
hydrophobic cavity hosting the lipophilic guest were favoured in comparison with
a-CD and y-CD in this study. The conventional method demonstrated a greater
69

encapsulation yield over the SF-C02 method (93.8% vs. 67.5%) but the
supercritical method has some important advantages. The authors
recommended the SF-C02 method due to its shorter time (1/6 of the
conventional method) and the extraction, fractionation and encapsulation could
be done in one step.
2.2.2.14.b Lycopene Coating with Protein
A patent by Garti and others (2003) describes a procedure to prevent
lycopene from migrating into the lipid, oil or fat phase and in so doing prevent the
fading of lycopene's bright red color in the product. The procedure involves
coating lycopene with a non-soluble film containing an amphiphilic protein which
itself can be attached to a colloid (proteinaceous polysaccharides). A preliminary
grinding process is a prerequisite to enable coating of lycopene by protein
(Patent Number WO/2003/045167 carotenoid formulation). The lycopene source
was either synthetic or an extract from tomato. However, crystalline micronized
lycopene (1-10 \xm) from tomato pulp was preferred in this patent.
The protein should contain lipophilic amino acids such as leucine, isoleucine,
phenylalanine and valine. However, the three dimensional conformation of the
protein has to also be modified. This transformation was achieved by heating the
protein dispersion in water in a pH range of 9-10 followed by cooling and
lyophilization. The protective colloids can be a polysaccharide such as amidated
pectin, xanthan gum or modified methylcellulose.
2.2.2.13.c Nano-encapsulation of Lycopene by Casein
Some attempts to incorporate hydrophobic ingredients into an aqueous
70
environment or to protect and deliver sensitive nutraceuticals have been based
on sodium caseinates. Caseins can be used to form nanocapsules that can hold
sensitive nutraceuticals and serve as a vesicle for their dispersion in an aqueous
beverages (Livney 2007).
The procedure to encapsulate hydrophobic molecules such as vitamin D or
lycopene is done in stages. The encapsulation is initiated by adding the
hydrophobic molecule to an aqueous solution of casein. In consecutive steps,
citrate phosphate and calcium ions from different sources are added to the
solution. The solution is adjusted to pH 6.5-7 and if needed the formed micelle is
dried. The result would be the non covalent bonding of nutraceuticals to sodium
caseinate. This procedure has been reported in another publication introducing
casein micelle as a natural nano-capsular vehicle for nutraceutical (Semo 2007).
2.2.2.14.d Pectin and lycopene in Tomato and Tomato Products
Pectin has been extensively studied in the tomato industry, as it is believed to
be an important contributor to the textural properties of tomato products. Most
studies have focused on the quantitative measurement of pectin in different
tomato fractions or pectin's gel-forming and aggregation capabilities. However
none of these studies have investigated the influence of pectin on lycopene
especially after processing.
In a study performed by Lee and Chen (2002), the degradation rate constants
for standard lycopene were determined at 150 °C, 100 °C and 50 °C. The
standard lycopene degradation rate constant was 0.0124 (min ~ 1) at 100°C.
However, in a study performed by Sharma and Le Maguer (1996) on tomato pulp
71

lycopene, the degradation rate constant was much lower (0.0023 min - 1). Their
results suggest that some macromolecules in tomato pulp (such as pectin), may
have a protective effect on lycopene during heat processing.
2.2.3 Pectin
Pectins are polysaccharide present mainly in plant cell walls and consists of
more than 100 a (1 _+.4) galacturonic acid units. The galacturonic acid residues
can be partly esterified with methyl groups (Gamier and others 1993).
H H, 'HO
H3COOC ^ ^ ^
Figure 2.2 Structural Formula for Partly Methylated Poly-Galacturonic (Tho and
others 2005).
The degree of methylation is different among pectins. High-methoxy pectins
have more than 50% methoxylation in their backbone while low-methoxy (LM)
pectins have less than 50% methoxylation and can be prepared by acid de-
esterification of the high methoxy pectin. If ammonia is employed in the de-
esterifaction process, the resulting LM pectin would be amidated and would
demonstrate different properties such as the ability to form gel in the presence of
lower calcium levels with thermo reversible properties (Reitsma and others,
1984).
72
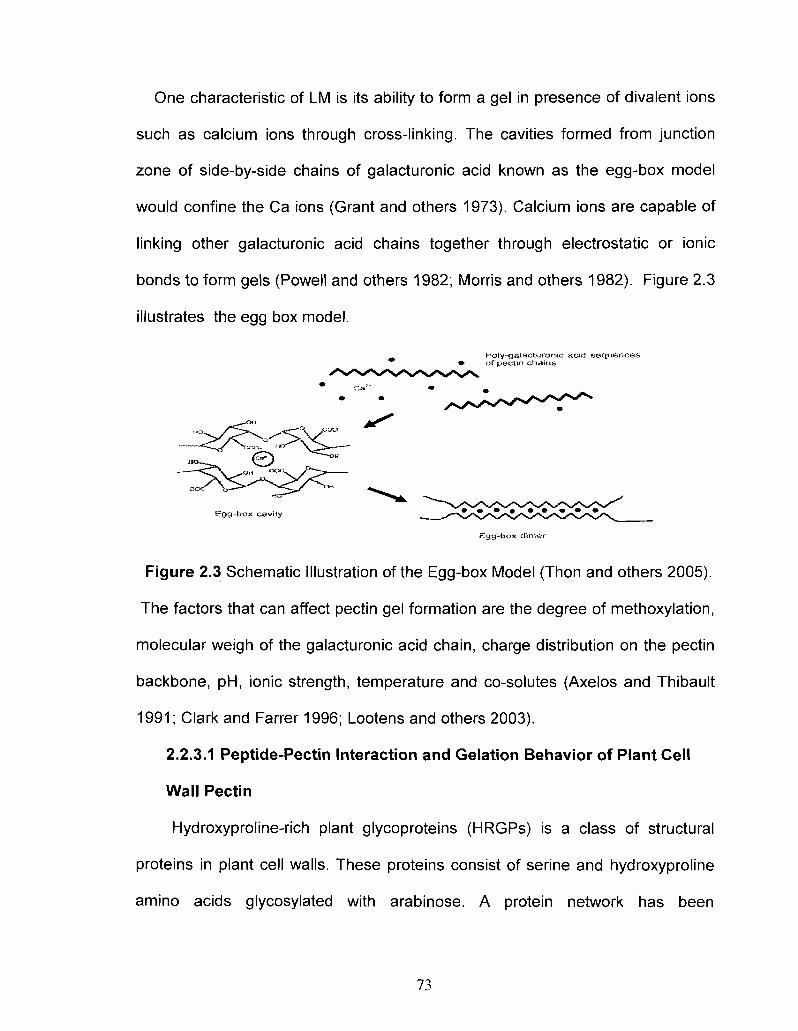
One characteristic of LM is its ability to form a gel in presence of divalent ions
such as calcium ions through cross-linking. The cavities formed from junction
zone of side-by-side chains of galacturonic acid known as the egg-box model
would confine the Ca ions (Grant and others 1973). Calcium ions are capable of
linking other galacturonic acid chains together through electrostatic or ionic
bonds to form gels (Powell and others 1982; Morris and others 1982). Figure 2.3
illustrates the egg box model.
Poly-Qaiacturonic acid sequences • of pectin chains
Figure 2.3 Schematic Illustration of the Egg-box Model (Thon and others 2005).
The factors that can affect pectin gel formation are the degree of methoxylation,
molecular weigh of the galacturonic acid chain, charge distribution on the pectin
backbone, pH, ionic strength, temperature and co-solutes (Axelos and Thibault
1991; Clark and Farrer 1996; Lootens and others 2003).
2.2.3.1 Peptide-Pectin Interaction and Gelation Behavior of Plant Cell
Wall Pectin
Hydroxyproline-rich plant glycoproteins (HRGPs) is a class of structural
proteins in plant cell walls. These proteins consist of serine and hydroxyproline
amino acids glycosylated with arabinose. A protein network has been
73
hypothesized that involves covalent crosslinking through tyrosine residues (Qi
1995, Bradly 1996) while an ionic complex between pectin and HRGPs has also
been speculated (Showalter 1993, Sommer_Knudsen 1998, Kieliszewski 1994).
In a study conducted by MacDougall and others (2001), the ionic interaction of
pectin (from unripe tomato pericarp ) and basic peptides (poly-L-lysine, poly-L-
arginine ) and carrot extensin were examined. Additionally the swelling behavior
of pectin-peptide gels was also monitored.
The experiment was performed by acidifying the pectin solution (pH=2) to
suppressing the pectin charge, then allowing the basic amino acids components
perfuse into the pectin network and then readjusting the pH to 5.5-6.0. Under
these conditions the basic peptides formed a gel within the pectin network.
Monitoring the shear modulus (G) of these peptide-pectin gels and pectin-
calcium gels demonstrated that the cross-linking effectiveness was in the order
poly-L-arginine > poly-L-Lysine and finally > calcium ions. These results indicated
that a multiple charged peptide can initiate crosslinking reactions and that
calcium crosslinking will enhance it (MacDougall and others 2001).
2.2.3.2 Pectin-Protein Interaction in Tomato Products
In an investigation concerning the contribution of various tomato components
to the consistency of tomato products, the critical contribution of pectic
substances (McColloch and others 1950) was recognized. Others have reported
that proteolytic enzyme treatment caused only a small loss in tomato juice
consistency but cellulase treatment greatly decreased it (Foda and McCollum
1970). The role of protein was investigated more thoroughly by Takada and
74

Nelson (1983) using a pectin-protein model system. Their research studied the
interaction between bovine serum albumin and pectin from citrus fruit (low
methoxy pectin). The results from the study indicated that the viscosity of the
pectin-protein complex was dependent on pH but the same effect was not
observed when each of components where treated separately. This behaviour
was attributed to pectin-protein interactions. The pH examined in their
experiment ranged from acidic to neutral. The maximum viscosity was achieved
at pH 4.2, which is close to the pH of tomato juice and paste. The effect of pH on
viscosity was reversible, which indicated the formation of a reversible
electrostatic complex between pectin and protein (Figure 2.4). However, an
irreversible pH effect has also been reported by Dougherty and Nelson (1974).
Considering that tomato pectin and bovine serum albumin have a similar
isoelectric point of 4.7-4.9 (Young 1963), the possible difference in pKa of pectin
and protein could explain their electrostatic interaction or repulsion.
c o o C O O C H 3 C O O "
( i.) p H > p l p r o t e i n
( i i ) p H = P I p r o t e i n
( H i ) p K a , p e c t i n < p H < P I p r o t e i n
( i v ) p H < p K o , p e c l i
C O O C M 3 c o o -
C O O C M 3 C O O -
Figure 2.4. Suspected Schematic Model of Pectin-Protein Interactions in
Tomato Products (Takada and Nelson 1983).
75

In spite of all the information available on the components present in tomato
paste products, little is known about their interactions and the complexes formed.
The present study intends to clarify the interactions that are possible among
pectin, protein and lycopene in tomato paste products. Studying these
interactions will provide information on lycopene's ability to form soluble
complexes in an aqueous environment.
2.3 Experimental
2.3.1 Sample Preparation
In order to properly conduct the experiments in this study, four different sample
preparation protocols were employed to produce the samples for all the required
analyses. Some of the assays required a liquid sample while others were better
conducted on dried samples. Also, to gain a better understanding of the behavior
of soluble solids, some samples were dialyzed. Figure 2.6 outlines the sample
preparation used for each assay.
Dried Paste Dr ied
So lub leSo l ids
Dilute Paste
• U i l So
"1 ute lub ieSol ids
_ J
Figure 2.5 Schematic Illustration of Sample Preparation and Related
Measurement.
76

It should be noted that this study intended to investigate the quality
characteristics of the soluble solids that enable them to form soluble complexes
with lycopene and not just its quantitative levels. Therefore the soluble solids
employed in this study was not exhaustively extracted but rather were collected
from a single centrifugation (first centrifugation) as described in detailed in
section 2.3.1.2.
2.3.1.1 Paste (Diluted)
A dilution of 1:2 ( paste:water) was prepared by adding 100 ml_ of water to 50
g of tomato paste. The diluted paste was stomached for 2 minutes to completely
disperse the paste.
2.3.1.2 Soluble Solids (Diluted)
A dilution of 1:2 (paste: water) was prepared following procedure detailed at
2.3.1.1. The soluble solid fraction was prepared by placing 20±3 g of the diluted
paste into a 25 ml_ centrifuge tube and centrifuging at 25,000xg for 18 min
(Beckman JA-20 rotor). The supernatant was decanted into a coarse sintered
glass filter to remove any solid materials. This filtered sample was used for
lycopene determination, transmission electron microscopy (TEM) examination
and ion exchange chromatography.
2.3.1.3 Soluble Solids (Dried)
The soluble solid collected from the first centrifugation of diluted paste was
frozen (VIP series) at - 80 °C then freeze dried (Gardiner, VirTis Co.) for 48 h.
This dried sample was used to determine total nitrogen, pectin content and
protein composition by SDS-PAGE.
77

2.3.1.4 Paste (Dried)
A dilution sample of paste (section 2.3.1.1) was spread in an aluminum pan,
frozen and lyophilized following the same procedure as soluble solids.
2.3.1.5 Soluble Solids (Dilute-Dialysis)
Some assays were conducted on dialyzed samples of dilute soluble solids.
One hundred ml_ of diluted soluble solids (section 2.3.1.2) was filled into dialysis
tubing (Fisher Scientific, Mississauga, ON, Canada) with MW cut off of 3500 Da
and dialyzed in 4 L of Milli-Q water for 48 h with a water change every 4 h. This
sample was used in the determination of minerals.
2.3.1.6 Soluble Solids (Dried- Dialysis)
Dilute- dialyzed soluble solid samples from the previous step (2.3.1.5.) were
frozen at 80 °C and freeze dried for 48 h resulting in dried samples of dialyzed
soluble solids. These samples were employed for determination of nitrogen
content of soluble solid and proteins by SDS-PAGE.
2.3.2 Total Solid and Total Soluble Solids
The total solids were determined according to the procedure in section
(1.3.2.1.a). The total soluble solid was determined on the same samples using
the procedure outlined in section (1.3.2.1.c). The mean value of replicates was
calculated and reported as total solids and total soluble solids.
2.3.3 Soluble Solid Dry Weight (1s t centrifugation)
The solid content of the soluble solids from the first centrifugation (see 2.3.1.3)
was determined by the difference in weight before and after freeze drying.
% Soluble Solids =Weiqht before drying - Weight after drying *100 Weight before drying
78

This measurement was necessary, as some procedures using diluted soluble
solids samples required the results on a dry weight basis.
2.3.4 Pectin Determination
The uronic acid content of the soluble solids and paste was determined by a
colorimetric method developed by Blumenkrantz and Asboe-Hansen (1973) and
modified by Ahmed and Labavitch (1977). The principle of the method requires
the hydrolysis of the pectin to free the galacturonic acid units. This procedure
also releases the side chain sugars from the polygalacturonic acid backbone and
the color produced by these side chain sugars is corrected in the assay
procedure.
2.3.4.1 Material and Equipment
UV-visible spectrophotometer model 260 (Shimatzu, Tokyo, Japan), D-(+1)
Galacturonic acid powder (Fluka, Buchs, Switzerland), glass cuvettes 10 mm
pathlength (Hellma, Concord, ON, Canada), 3-phenylphenol 85% (Sigma-
Aldrich, Oakville, ON, Canada), pyrex centrifuge tube (30ml_), sodium tetraborate
(99.98%), sulfuric acid (Fisher Scientific, Mississauga, ON, Canada).
2.3.4.2 Methods
The galacturonic acid stock solution was prepared by dissolving 100 mg dry
galacturonic acid powder in 100 ml_ of deionized water. The 1 mg/mL stock
solution was diluted to prepare the calibration curve. A 0.0125 M solution of
sodium tetraborate was prepared by dissolving 1.192 g of sodium tetraborate in
250 ml_ of concentrated sulfuric acid.
79

Approximately 0.034 g of freeze dried paste and approximately 0.0650 g of
freeze dried soluble solids were diluted in 50 ml_ of water. This dilution was
selected to give a galacturonic acid concentration of less than 100 (ig/mL to avoid
off scale readings on the spectrophotometer. 1 ml_ aliquots of diluted soluble
solid and paste was pipetted into a pyrex centrifuge tube and placed into an ice
bath. Then 6 ml_ of cold sodium tetraborate solution was added to the sample
dropwise. The tube was placed into a boiling water bath for exactly 6 minutes
and returned to the ice bath immediately. When cold, 0.1 ml_ of 3-phenylphenol
(0.5%) was pipetted into the hydrolyzed sample to develop the color. A similar
procedure was performed on another sample except the 0.1 ml_ of 3-
phenylphenol was replaced with a 0.5% solution of sodium hydroxide. Both
samples were vortexed and allowed to stand for 10-15 min for color formation. If
bubbles were present, the samples were centrifuged at low speed for 5 min at
room temperature. The absorbance was read at 520 nm in glass cuvettes. The
absorbance in the presence of the sodium hydroxide was subtracted from the
absorbance of the 3-phenylphenol reaction mixture. Employing the standard
curve, the concentration of galacturonic acid was determined.
2.3.5 Lycopene Determination
Numerous HPLC methods have been used to separate the various
carotenoids in fruit and vegetables. After minor modifications, the method
developed by Ishida and others (2001) was used in this study for lycopene
determination.
80

2.3.5.1 Material and Equipment
HPLC system model Waters 2690 Auto-injector, Detector model Waters 996
Photo-Diode-Array (Waters Ltd, Mississauga, ON, Canada) Column C30 (250 x
4.6mm I.D, particle diameter 3- urn) (YMC Inc., Wilmington, NC).
Spectrophotometer (Shimadzu UV-260, Tokyo, Japan). Polytetrafluoroethylene
filter (Alltech Associates, Inc., Deerfield, IL, USA), lycopene 90% from tomato
(Sigma-Aldrich, Oakville, ON, Canada )
Hexane, ethanol, methanol, acetone, ethyl acetate (EtOAc) and methyl f-butyl
ether (MTBE) were HPLC grade (Fisher Scientific, Mississauga, ON, Canada),
ethyl alcohol 95% commercial grade (Commercial Alcohol Inc., Brampton, ON,
Canada).
2.3.5.2 Methods
One gram of the diluted paste and soluble solids from the first centrifugation
prepared as detailed in sections 2.3.1.1 and 2.3.1.2 were used for lycopene
determination. The modified method used in this study was able to separate and
quantify lycopene and its geometric isomers.
Lycopene Extraction: 20 mL of hexane/acetone/methanol (2:1:1) was added to
1 g of soluble solid from the first centrifugation and diluted paste (dilutionl: 2)
and mixed until the aqueous phase was bleached and no red colour was visible
in the residue material. The hexane phase was separated by adding 10 mL of
Milli-Q water and stirring thoroughly on a vortex mixer. The top layer containing
the extracted lycopene was filtered by 0.45-um polytetrafluoro ethylene filter.
Lycopene Analysis: A HPLC system equipped with a C30 reversed phase
81
column and a thermostated column compartment was used. The system was
conditioned for 30 min at 1 mL/min with the mobile phase, methyl f-butyl ether
(MTBE): MeOH: ethyl acetate (EtOAc) (40:50:10 V/V). An Injection volume of 15
ul was used and the column temperature was set at 28°C. The absorbance was
monitored at 470 nm using a Photo-Diode Array Detector (Waters 996).
Lycopene and its cis isomers eluted within 27 min. A standard curve constructed
with known concentrations of standard all trans lycopene was used to calculate
the levels of all isomers in the tomato samples.
2.3.6 Nitrogen Determination
The total nitrogen content of the lyophilized soluble solids (from the first
centrifugation), paste and dialyzed soluble solids was determined by the Dumas
combustion method (Jung and others 2003).
2.3.6.1 Material and Equipment
Protein/Nitrogen FP-528 instrument, EDTA, Tin foil sample holder (LECO
Instruments Ltd. Mississauga, ON, Canada).
2.3.6.2 Methods
The instrument was standardized and calibrated by running at least 8 blanks
and 8 EDTA calibration standards. The same diluted paste (1:2) sample that
was subjected to pectin and lycopene measurements was freeze dried before the
nitrogen determination (described in section 2.3.1.4). Approximately 0.15 g of
freeze dried paste was compressed into the tin foil to form a ball, weighed and
subjected to the combustion procedure. The results are reported as percent total
nitrogen.
82
The total nitrogen content of the dried soluble solids and dialyzed soluble
solids prepared with the procedure outlined in section 2.3.1.3 and 2.3.1.6 were
determined as described above.The sample size was approximately 0.15- 0.20 g.
2.3.7 Gel Electrophoresis (SDS-PAGE)
SDS-PAGE was used for protein separation and identification based on size
or molecular weight. By binding to the protein, the SDS detergent gives the
protein a negative charge. The separation will be based on size as the SDS gives
the protein the same overall charge to mass ratio.
This assay was carried out to determine the source of nitrogen, which was
detected in the combustion procedure. Lyophilized soluble solids ,dialyzed
soluble solids , paste and bottom layer in ultracentrifuged soluble solids were
analyzed by the method developed by Laemmli (1970).
2.3.7.1 Material and Equipment
Acrylamide: Bis (30%). Ammonium Persulfate (10%), and TEMED (Bio-Rad
Laboratories-Canada Ltd., Missisuaga, ON, Canada),Tris-Base, SDS (Sodium
Dodecyl Sulfate), glycine, B-mercaptoethanol, bromophenol blue (1.0%) and
Commassie Brilliant Blue (Sigma-Aldrich Canada Ltd., Oakville, ON, Canada).
Ethanol, methanol, Milli-Q water, acetic acid and glycerol 75% (Fisher Scientific,
Mississauga, ON, Canada), standard protein as marker (ten protein band,
Precision Plus Protein Kaleidoscope ™,BIO-Rad Laboratories, Inc , Hercules,CA,
USA), scanner (SHARP JX-330, AmorshamBioscience, Quebec, QC, Canada).
2.3.7.2 Methods
0.0225 g freeze dried samples of soluble solids (see 2.3.1.3) and 0.0234 g
83
dialyzed soluble solids (see 2.3.1.6), 0.0211g dried paste (see 2.3.1.4) and
0.0063gr. bottom layer from ultra centrifuged sample (see 2.3.12.2.a) were
analyzed in this experiment. 200 \x\ of the extracting sample buffer (0.06g of
50mM Tris HCL (MW 121.1) and 3.0g of 5M Urea were mixed in 4 ml_ warm
water and adjusted to to pH=8.0.This solution was added to 1ml_ of 10% SDS
and 0.4ml_ of 2-mercaptoethanol) was added to each sample in Eppendorf tubes,
vortexed and heated for 10 minutes at 95°C.
Gels in 12.5% and 18% cross linking were prepared following method
described by Laemmli (1970).
5|aL and 10fal_ of each sample was loaded into the wells, along with one well
containing 10|J- of a broad range molecular weight marker (250, 150, 100, 75,
50, 37,25,20, 15, 10 KD).
The applied voltage was 200v to induce migration proteins. The gels were
placed in Coomassie working staining solution for 30 minutes, rinsed with
deionized water, and placed in destaining solution for 1 to 1.5 hours. After
destaining the gels were placed in deionized water and shaken over night. The
destained gel was scanned.
2.3.8 Fatty Acid Composition
The fatty acid composition of the lyophilized soluble solids and paste was
determined by gas liquid chromatography (GLC). This method requires
conversion of the fatty acids into their fatty acid methyl esters (FAME). The
chromatography was performed according to the method of Bannon, Craske and
Hilliker (1985).
84
2.3.8.1 Material and Equipment
Shimadzu GC-8A equipped with a flame ionization detector and Shimadzu C-
R3A Chromatopac integrator, glass column packed with 10% Silar 9CP
Chromosorb W- AW, 80/100 (Chromatographic Specialties Inc. Brokville, ON,
Canada). Potassium hydroxide, methanol, iso-octane, hydrochloric acid (Fisher
Scientific, Mississauga, ON, Canada), standard fatty acid methyl esters (Nu
Check Prep supplier, Elysian.MN, USA ).
2.3.8.2 Methods
Fatty acid methyl esters (FAME) were prepared by dissolving 50 mg of freeze
dried paste and soluble solids in 2 ml_ of iso-octane. 200 .̂L of KOH (2N) in
methanol was added to the solution and vortexed for 1 min. The prepared
sample was held for 5 minutes to allow the reaction to proceed. Two drops of
methyl orange indicator was added and the reaction mixture neutralized with 2 N
HCI according to the method of Bannon and others (1985).
1 nl of the top layer was injected into a Shimadzu GC-8A equipped with a
flame ionization detector (FID) and Shimadzu C-R3A Chromatopac integrator.
The carrier gas was nitrogen, the injector and detector temperatures were 230°C
and the column was temperature programmed from 60-210 °C at 6°C/min. The
FAME were identified by comparison of their retention time with those of
authentic compounds previously analyzed.
2.3.9 Enzymatic Treatment of Soluble Solids
The red colour of the soluble solid fraction is a good indication of the
presence of carotenoids and in particular lycopene. This was supported by the
85
HPLC analysis of the soluble solids. The possible interactions and association
between lycopene and other components in the soluble fraction was investigated
with an enzyme procedure reported by Choudhari and Ananthanarayan (2007).
2.3.9.1 Material and Equipment
Cellulase from Aspergillus sp.activity >1000 U/g, protease from Aspergillus
oryzae activity >500 U/g (Novozyme Corp, Franklinton, NC, USA), pectinase
from Rhizospus sp. activity 448 U/g, (SigmaAldrich, st.Louis, MO, USA),
hemicellulase from Aspergillus niger contaminated with galacto-mannanase,
polygalacturonase and acid protease (Enzyco®, New York,NY,USA ).
2.3.9.2 Methods
5 ml_ of dilute soluble solid (7.57± 0.05 % dried solids) was treated with
different concentrations of enzymes (Pectinase, Protease, Cellulase,
Hemicellulase) and different pHs (4.5, 5.0, 5.5, 6.0, 6.5, 7.0 and 7,5). These
reaction mixtures were held for 24 h at different temperatures (-8 °C, 21 °C, 40,
50, and 60 °C). The schematic diagram (Figure 2.6) shows the various conditions
used for the enzyme treatments.
Moreover various combinations of enzymes were practiced. In this case
suitable condition for pectinase and cellulase was determined based on previous
step in which the reaction of enzyme and substrate took place (0.02g enzymes
added to 5 ml_ sample at 20°C, pH 5). The optimum condition for cellulase and
protease determined based on the information from provider company (50|aL at
40-50°C, pH 7.5). For each enzyme the optimum condition in sample was
provided and after 24h samples were combined starting from combination of two
86

followed by the combination that 3 enzymes were involved and eventually the
last combination when all enzymatic treated samples were mixed together (Table
2.5).
Cellu
lase
Pectinase
25,
50,
75,
100
fiL
0.02, 0.05 g
pH 4.5, 5.5, 6.5, 7.5
Temp-8, 21,40, 50, 60 °C
0.02, 0.05 g
at
en o •>i
©
o •p r-
Hemicellulase
/
Protease
Figure 2.6 Enzymatic Treatment of Soluble Solids in Terms of Concentration,
Temperature and pH.
Table 2.5 Combination of Enzymes in Their Optimum Conditions.
Enzyme Combination 1 2 3 4 5 6 7 8 9 10
Pectin
* * * * *
*
Hemicellulase
*
*
* * *
*
Cellulase \ Protease
* *
. 1 __ * l * *
*
* * *
The designed combination is illustrated in Figure 2.7, while each overlapping
area demonstrates the combination of samples.
87
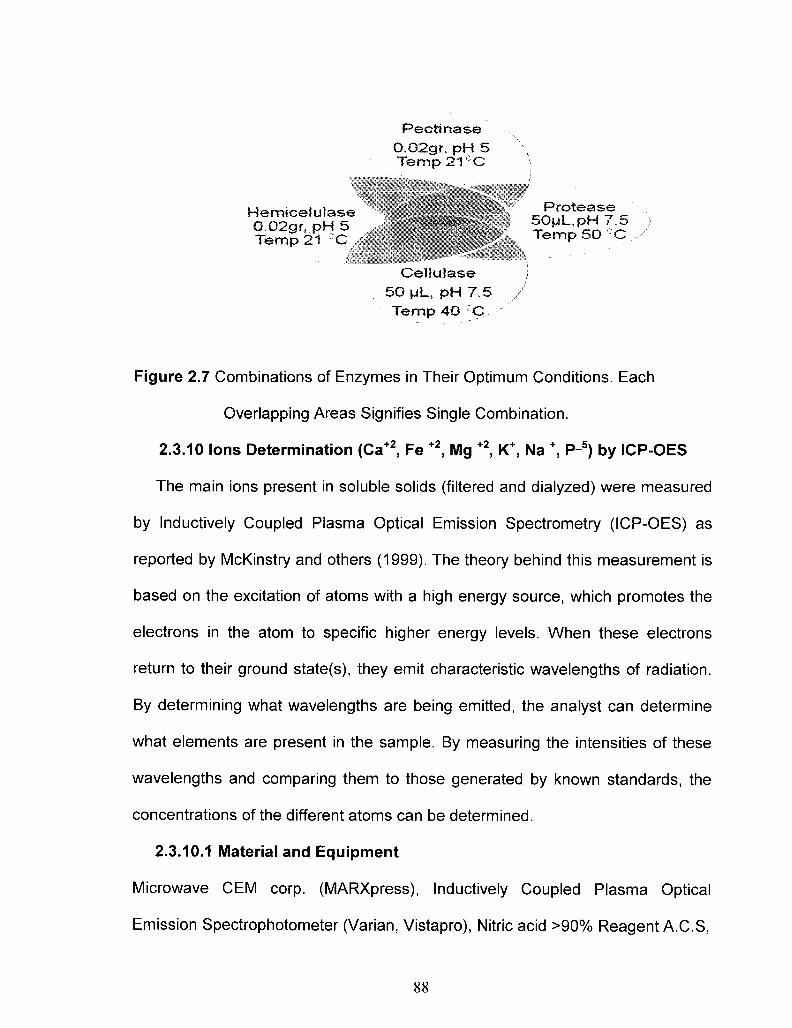
Pecf inase 0.02gr, pH 5 Temp 21CC
HemiceJutas€ 0,02gr, pH 5 Temp 21 -C
Cel fu lase SO pL, pH 7.5 Temp 4 0 ':Q.,-
Figure 2.7 Combinations of Enzymes in Their Optimum Conditions. Each
Overlapping Areas Signifies Single Combination.
2.3.10 Ions Determination (Ca+2, Fe +2, Mg +2, K+, Na +, P-5) by ICP-OES
The main ions present in soluble solids (filtered and dialyzed) were measured
by Inductively Coupled Plasma Optical Emission Spectrometry (ICP-OES) as
reported by McKinstry and others (1999). The theory behind this measurement is
based on the excitation of atoms with a high energy source, which promotes the
electrons in the atom to specific higher energy levels. When these electrons
return to their ground state(s), they emit characteristic wavelengths of radiation.
By determining what wavelengths are being emitted, the analyst can determine
what elements are present in the sample. By measuring the intensities of these
wavelengths and comparing them to those generated by known standards, the
concentrations of the different atoms can be determined.
2.3.10.1 Material and Equipment
Microwave CEM corp. (MARXpress), Inductively Coupled Plasma Optical
Emission Spectrophotometer (Varian, Vistapro), Nitric acid >90% Reagent A.C.S,
Protease 50ML,pH 7.5 ) Temp SO ! : C , /
88

HPLC grade submicron filtered water W5-4 (Fisher Scientific, Mississauga, ON,
Canada).
2.3.10.2 Methods
The soluble solid samples were prepared following the method described in
section 2.3.1.2. Dialyzed soluble solid prepared following method detailed at
2.3.1.5. A third aliquot of the same sample of soluble solid was filtered through
0.45 u filter and subjected to the same procedure.
2 g of each sample were microwave digested in 5 ml_ of concentrated nitric
acid. The digested sample was diluted to 25 mL final volume with HPLC grade
water and filtered (submicron filtered W5-4). This solution was analyzed using a
radial ICP-OES. The intensity of light was compared to a calibration curve
prepared with known concentrations of each element.
2.3.11 Transmission Electron Microscopy (TEM) Analysis
TEM was employed to determine the microstructure of three soluble solids
fraction.
2.3.12.1 Material and Equipment
LEO 912 ab TEM (Carl Zeiss SMT, Oberkochen, Germany) at 100kv
equipped with camera SIS/Olympus Cantega 2K CCD employing iTEM software
(Soft Imaging System, Munster, Germany), ultracentrifuge model Optima LE-80K
(Beckman Coulter, Rotor 70.1 Tl Mississauga, ON,Canada).
2.3.12.2 Methods
Sample preparation: The soluble solid fraction from the first centrifugation
(red coloured liquid) was collected and subjected to ultracentrifugation at
89
~171,000 x g for 30 min at 20 °C. Three distinct layers were obtained under
these high centrifugal forces. Each layer was collected by carefully pipetting out
the fractions.
Analysis: Each layer was subjected to EM following the procedure
described by Jacob and Paliyath (2008). A drop of each layer of sample was
mounted on a 200 mesh fomvar-coated nickel grid for 1 min. After removing the
excess sample, the grid sample was blotted dry and stained for 30 s with 1%
uranyl acetate. After removing excess stain the grid was monitored in the
transmission electron microscope.
90
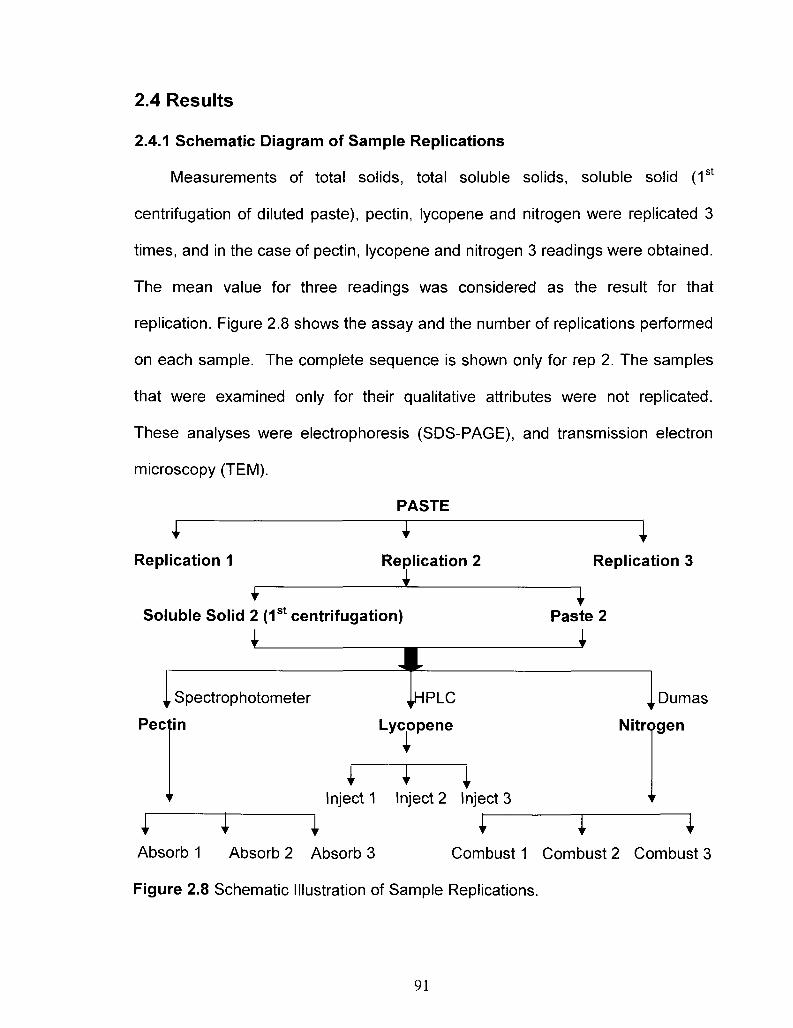
2.4 Results
2.4.1 Schematic Diagram of Sample Replications
Measurements of total solids, total soluble solids, soluble solid (1st
centrifugation of diluted paste), pectin, lycopene and nitrogen were replicated 3
times, and in the case of pectin, lycopene and nitrogen 3 readings were obtained.
The mean value for three readings was considered as the result for that
replication. Figure 2.8 shows the assay and the number of replications performed
on each sample. The complete sequence is shown only for rep 2. The samples
that were examined only for their qualitative attributes were not replicated.
These analyses were electrophoresis (SDS-PAGE), and transmission electron
microscopy (TEM).
PASTE
Replication 1 Replication 2 1
Replication 3
Soluble Solid 2 (1st centrifugation)
4 Paste 2
| Spectrophotometer
Pectin
{ T I
JHPLC
Lycopene
I I I Inject 1 Inject 2 Inject 3
, Dumas
Nitrogen
T 1 Absorb 1 Absorb 2 Absorb 3 Combust 1 Combust 2 Combust 3
Figure 2.8 Schematic Illustration of Sample Replications.
91
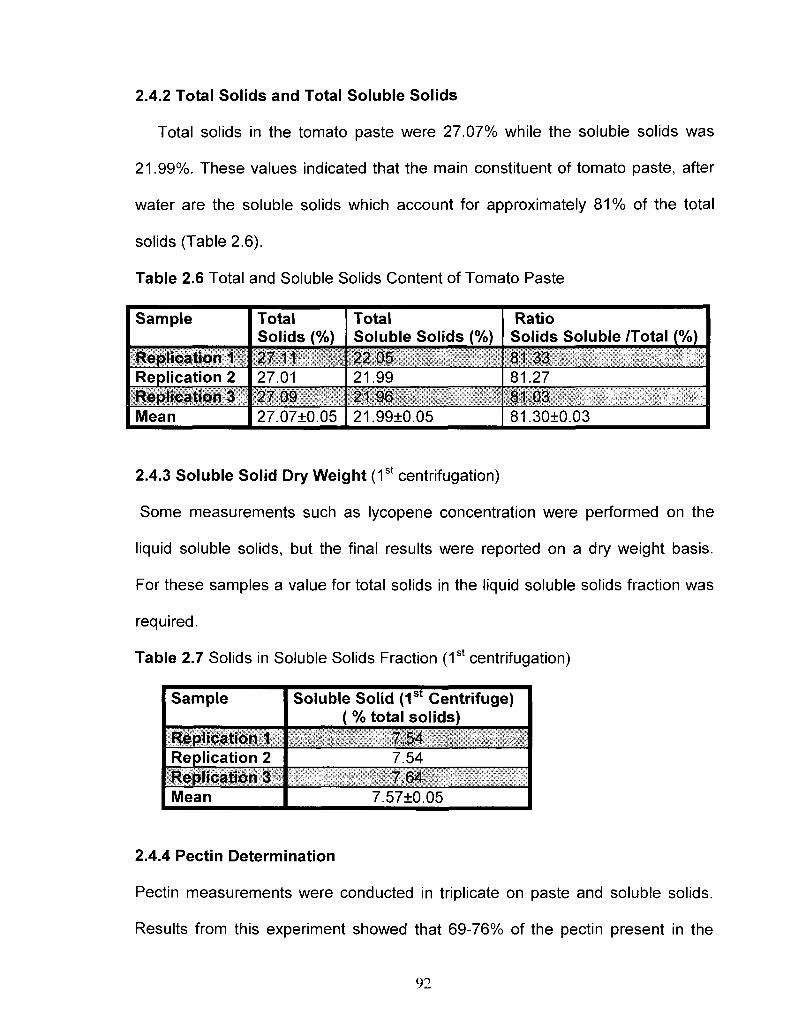
2.4.2 Total Solids and Total Soluble Solids
Total solids in the tomato paste were 27.07% while the soluble solids was
21.99%. These values indicated that the main constituent of tomato paste, after
water are the soluble solids which account for approximately 81% of the total
solids (Table 2.6).
Table 2.6 Total and Soluble Solids Content of Tomato Paste
Sample
Replication 1 Replication 2 Replication 3 Mean
Total Solids (%) 27.11 27.01 27.09 27.07±0.05
Total Soluble Solids (%) 22.05 21.99 21.96 21.99±0.05
Ratio Solids Soluble /Total (%) 81.33 81.27 81.03 81.30±0.03
2.4.3 Soluble Solid Dry Weight (1s t centrifugation)
Some measurements such as lycopene concentration were performed on the
liquid soluble solids, but the final results were reported on a dry weight basis.
For these samples a value for total solids in the liquid soluble solids fraction was
required.
Table 2.7 Solids in Soluble Solids Fraction (1s t centrifugation)
Sample
Replication 1 Replication 2 Replication 3 Mean
Soluble Solid (1st Centrifuge) (% total solids)
7.54 7.54 7.64
7.57±0.05
2.4.4 Pectin Determination
Pectin measurements were conducted in triplicate on paste and soluble solids.
Results from this experiment showed that 69-76% of the pectin present in the
92
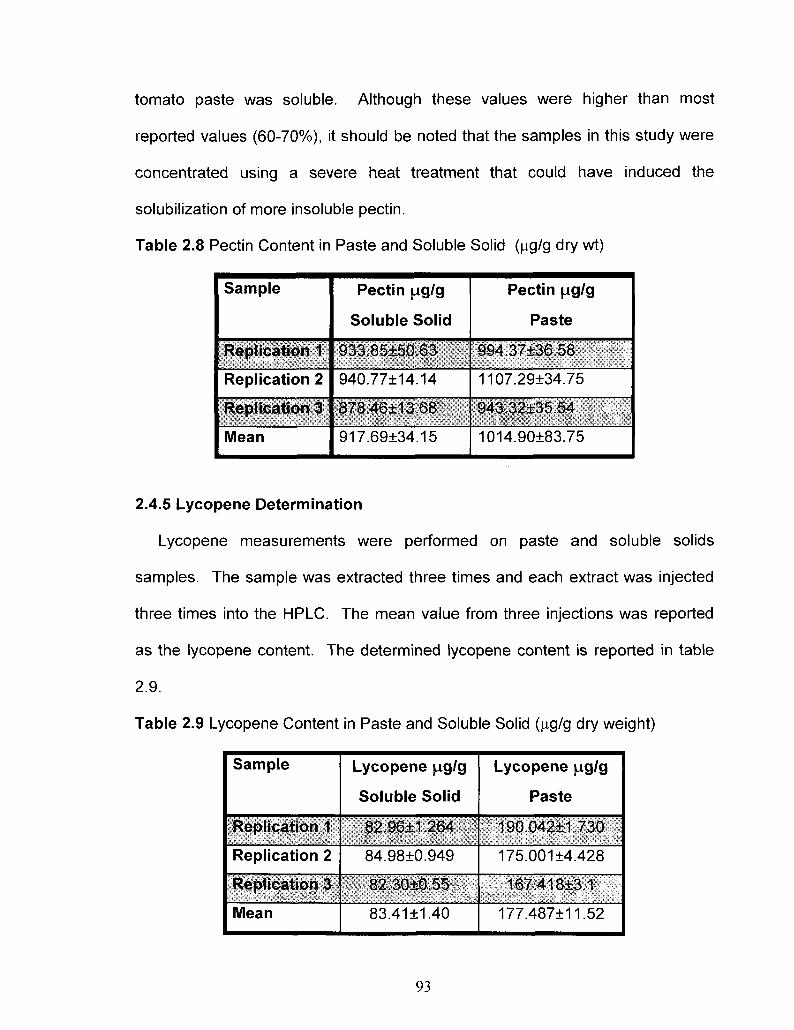
tomato paste was soluble. Although these values were higher than most
reported values (60-70%), it should be noted that the samples in this study were
concentrated using a severe heat treatment that could have induced the
solubilization of more insoluble pectin.
Table 2.8 Pectin Content in Paste and Soluble Solid (|ag/g dry wt)
Sample
Replication 1
Replication 2
Replication 3
Mean
Pectin |ag/g
Soluble Solid
933.85±50.63
940.77±14.14
878.46±13.68
917.69±34.15
Pectin |ng/g
Paste
994.37±36.58
1107.29±34.75
943.32±35.54
1014.90±83.75
2.4.5 Lycopene Determination
Lycopene measurements were performed on paste and soluble solids
samples. The sample was extracted three times and each extract was injected
three times into the HPLC. The mean value from three injections was reported
as the lycopene content. The determined lycopene content is reported in table
2.9.
Table 2.9 Lycopene Content in Paste and Soluble Solid (jag/g dry weight)
Sample
Replication 1
Replication 2
Replication 3
Mean
Lycopene ^g/g
Soluble Solid
82.96l1.264
84.98±0.949
82,30±0.55
83.41±1.40
Lycopene jag/g
Paste
190.042±1.730
175.001±4.428
167:418±3.1
177.487±11.52
93
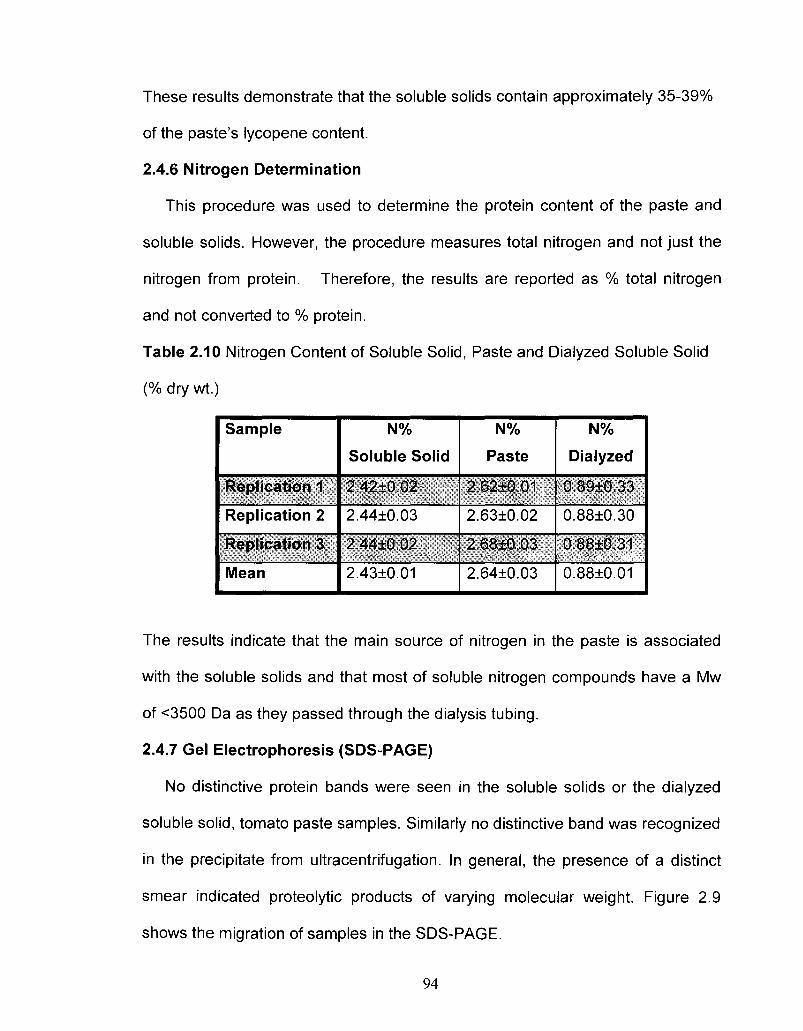
These results demonstrate that the soluble solids contain approximately 35-39%
of the paste's lycopene content.
2.4.6 Nitrogen Determination
This procedure was used to determine the protein content of the paste and
soluble solids. However, the procedure measures total nitrogen and not just the
nitrogen from protein. Therefore, the results are reported as % total nitrogen
and not converted to % protein.
Table 2.10 Nitrogen Content of Soluble Solid, Paste and Dialyzed Soluble Solid
(% dry wt.)
Sample
Replication 1
Replication 2
Replication 3
Mean
N%
Soluble Solid
2.42±0.02
2.44±0.03
2.44±0.02
2.43±0.01
N%
Paste
2.62±0.01
2.63±0.02
2.68±0.03
2.64±0.03
N%
Dialyzed
0.89±0.33
0.88±0.30
0.88±0.31
0.88±0.01
The results indicate that the main source of nitrogen in the paste is associated
with the soluble solids and that most of soluble nitrogen compounds have a Mw
of <3500 Da as they passed through the dialysis tubing.
2.4.7 Gel Electrophoresis (SDS-PAGE)
No distinctive protein bands were seen in the soluble solids or the dialyzed
soluble solid, tomato paste samples. Similarly no distinctive band was recognized
in the precipitate from ultracentrifugation. In general, the presence of a distinct
smear indicated proteolytic products of varying molecular weight. Figure 2.9
shows the migration of samples in the SDS-PAGE.
94
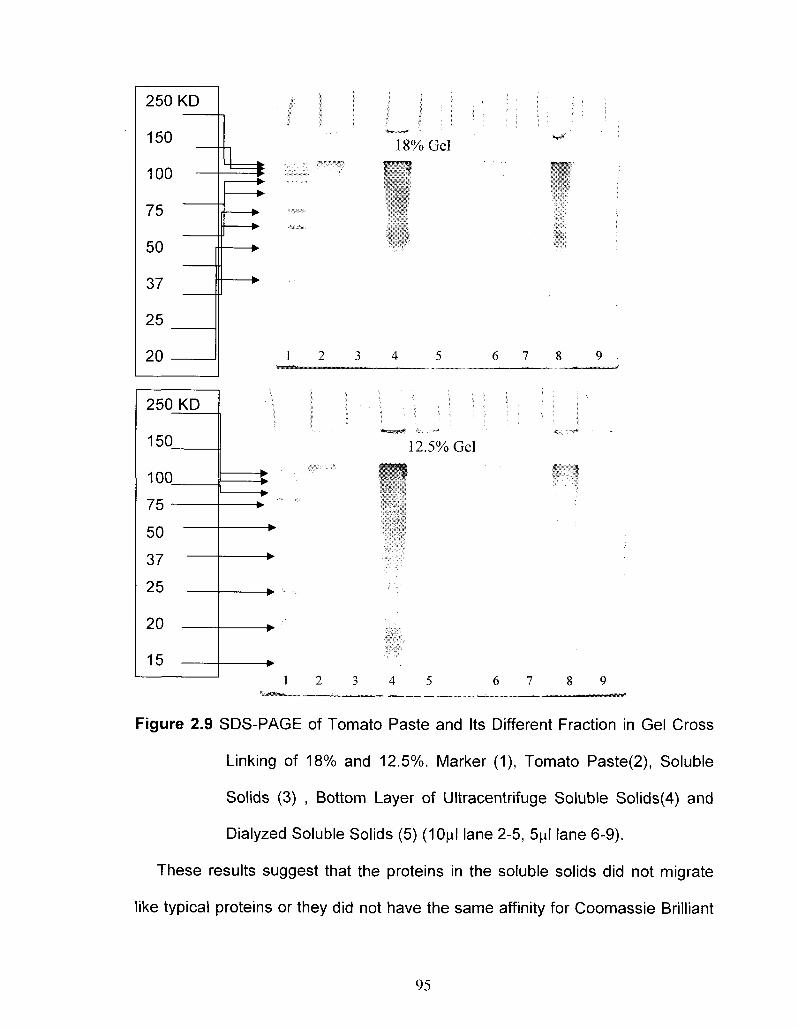
250 KD
150
•i nr\ IUU
75
50
37
25
20
250 KD
150
100 T^ to
50
37
25
?n
15
1 f
• Z
18% Gel
2 3 4 5 6 7
12.5% Gel
Figure 2.9 SDS-PAGE of Tomato Paste and Its Different Fraction in Gel Cross
Linking of 18% and 12.5%. Marker (1), Tomato Paste(2), Soluble
Solids (3) , Bottom Layer of Ultracentrifuge Soluble Solids(4) and
Dialyzed Soluble Solids (5) (10(il lane 2-5, 5^1 lane 6-9).
These results suggest that the proteins in the soluble solids did not migrate
like typical proteins or they did not have the same affinity for Coomassie Brilliant
95
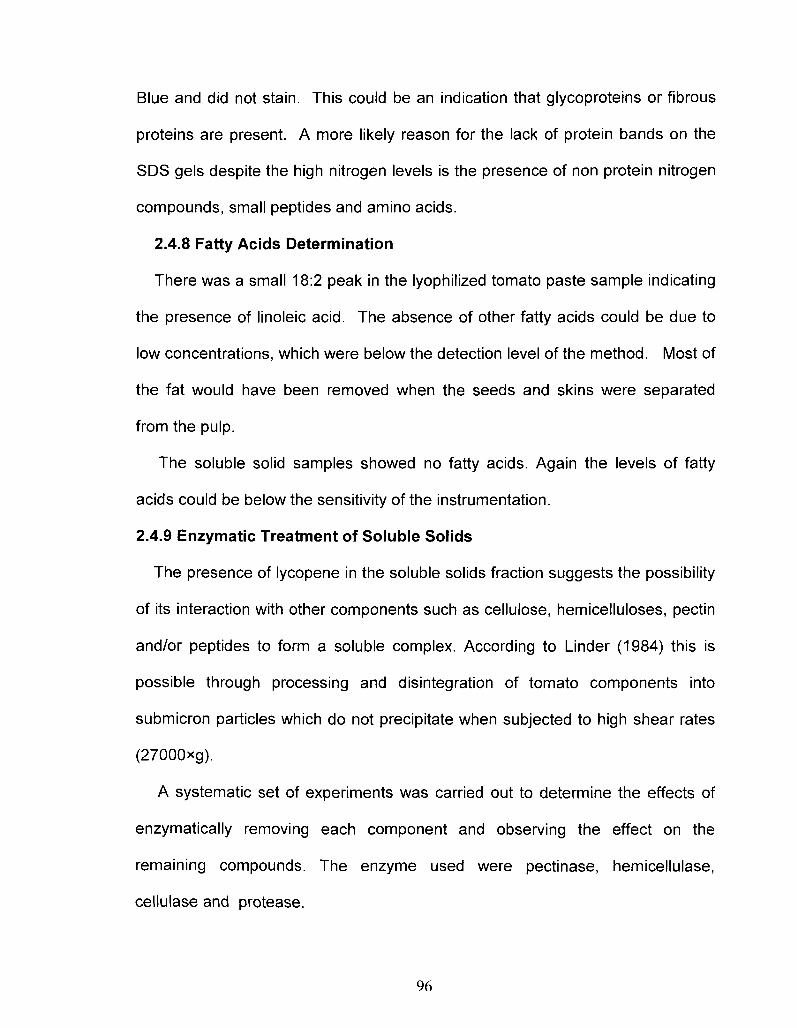
Blue and did not stain. This could be an indication that glycoproteins or fibrous
proteins are present. A more likely reason for the lack of protein bands on the
SDS gels despite the high nitrogen levels is the presence of non protein nitrogen
compounds, small peptides and amino acids.
2.4.8 Fatty Acids Determination
There was a small 18:2 peak in the lyophilized tomato paste sample indicating
the presence of linoleic acid. The absence of other fatty acids could be due to
low concentrations, which were below the detection level of the method. Most of
the fat would have been removed when the seeds and skins were separated
from the pulp.
The soluble solid samples showed no fatty acids. Again the levels of fatty
acids could be below the sensitivity of the instrumentation.
2.4.9 Enzymatic Treatment of Soluble Solids
The presence of lycopene in the soluble solids fraction suggests the possibility
of its interaction with other components such as cellulose, hemicelluloses, pectin
and/or peptides to form a soluble complex. According to Linder (1984) this is
possible through processing and disintegration of tomato components into
submicron particles which do not precipitate when subjected to high shear rates
(27000xg).
A systematic set of experiments was carried out to determine the effects of
enzymatically removing each component and observing the effect on the
remaining compounds. The enzyme used were pectinase, hemicellulase,
cellulase and protease.
96
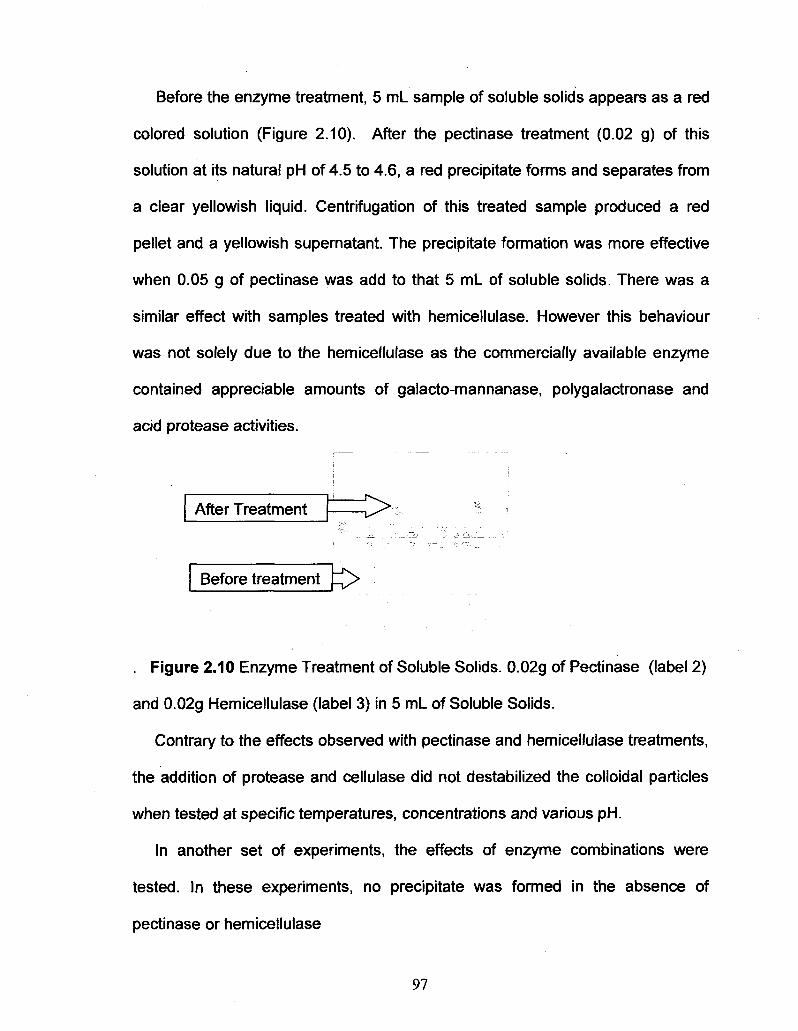
Before the enzyme treatment, 5 ml_ sample of soluble solids appears as a red
colored solution (Figure 2.10). After the pectinase treatment (0.02 g) of this
solution at its natural phi of 4.5 to 4.6, a red precipitate forms and separates from
a clear yellowish liquid. Centrifugation of this treated sample produced a red
pellet and a yellowish supernatant. The precipitate formation was more effective
when 0.05 g of pectinase was add to that 5 ml_ of soluble solids. There was a
similar effect with samples treated with hemicellulase. However this behaviour
was not solely due to the hemicellulase as the commercially available enzyme
contained appreciable amounts of galacto-mannanase, polygalactronase and
acid protease activities.
After Treatment >
Before treatment p^>
. Figure 2.10 Enzyme Treatment of Soluble Solids. 0.02g of Pectinase (label 2)
and 0.02g Hemicellulase (label 3) in 5 mL of Soluble Solids.
Contrary to the effects observed with pectinase and hemicellulase treatments,
the addition of protease and cellulase did not destabilized the colloidal particles
when tested at specific temperatures, concentrations and various pH.
In another set of experiments, the effects of enzyme combinations were
tested. In these experiments, no precipitate was formed in the absence of
pectinase or hemicellulase
97
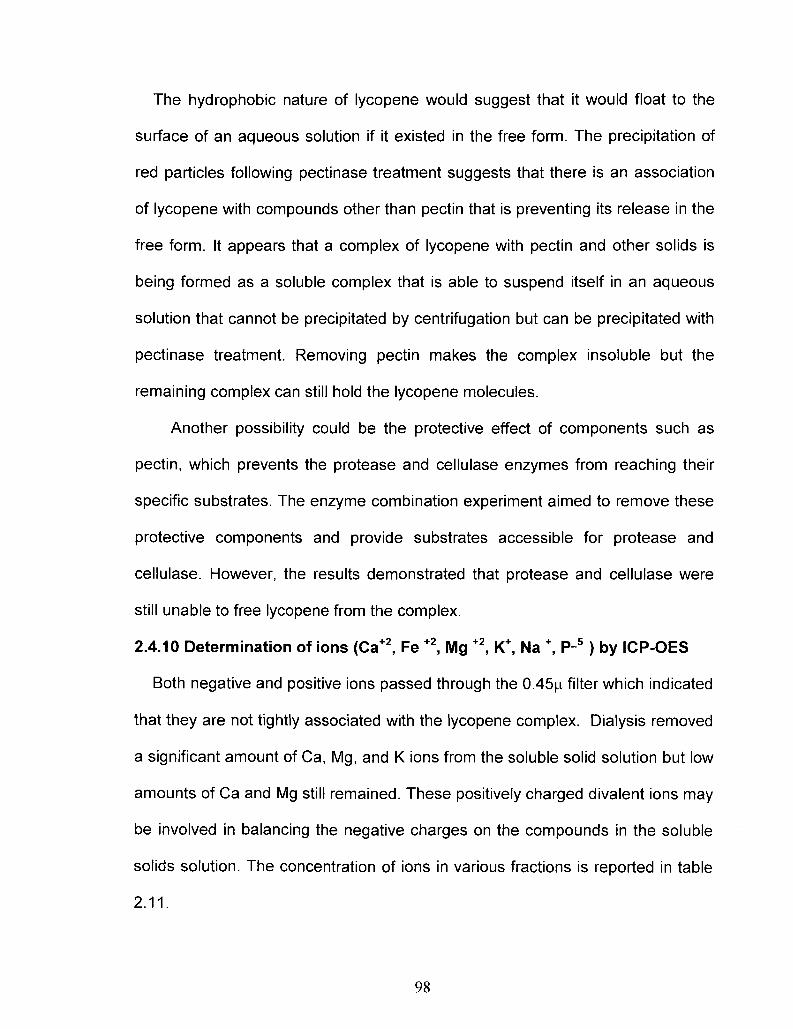
The hydrophobic nature of lycopene would suggest that it would float to the
surface of an aqueous solution if it existed in the free form. The precipitation of
red particles following pectinase treatment suggests that there is an association
of lycopene with compounds other than pectin that is preventing its release in the
free form. It appears that a complex of lycopene with pectin and other solids is
being formed as a soluble complex that is able to suspend itself in an aqueous
solution that cannot be precipitated by centrifugation but can be precipitated with
pectinase treatment. Removing pectin makes the complex insoluble but the
remaining complex can still hold the lycopene molecules.
Another possibility could be the protective effect of components such as
pectin, which prevents the protease and cellulase enzymes from reaching their
specific substrates. The enzyme combination experiment aimed to remove these
protective components and provide substrates accessible for protease and
cellulase. However, the results demonstrated that protease and cellulase were
still unable to free lycopene from the complex.
2.4.10 Determination of ions (Ca+2, Fe +2, Mg +2, K\ Na \ P-5 ) by ICP-OES
Both negative and positive ions passed through the 0.45(j. filter which indicated
that they are not tightly associated with the lycopene complex. Dialysis removed
a significant amount of Ca, Mg, and K ions from the soluble solid solution but low
amounts of Ca and Mg still remained. These positively charged divalent ions may
be involved in balancing the negative charges on the compounds in the soluble
solids solution. The concentration of ions in various fractions is reported in table
2.11.
98
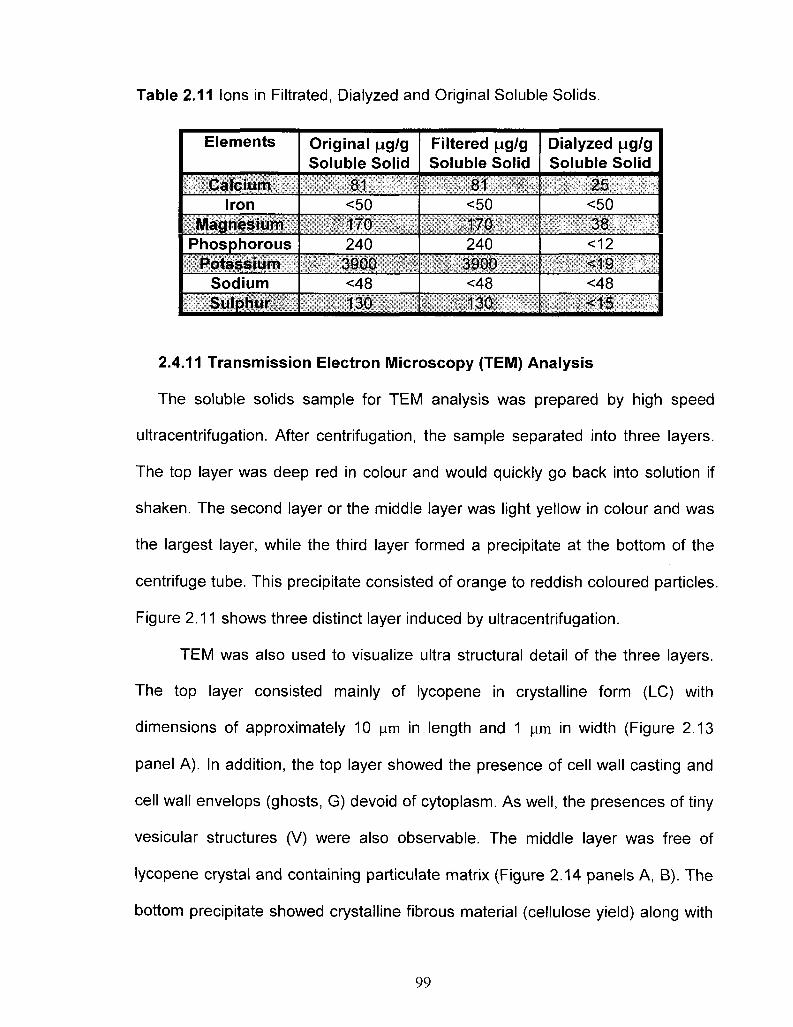
Table 2.11 Ions in Filtrated, Dialyzed and Original Soluble Solids.
Elements
Calcium Iron
Magnesium Phosphorous
Potassium Sodium Sulphur
Original \xglg Soluble Solid
81 <50 170 240 3900 <48 130
Filtered |ag/g Soluble Solid
81 <50 170 240 3900 <48 130
Dialyzed pg/g Soluble Solid
25 <50 38 <12 <19 <48 <15
2.4.11 Transmission Electron Microscopy (TEM) Analysis
The soluble solids sample for TEM analysis was prepared by high speed
ultracentrifugation. After centrifugation, the sample separated into three layers.
The top layer was deep red in colour and would quickly go back into solution if
shaken. The second layer or the middle layer was light yellow in colour and was
the largest layer, while the third layer formed a precipitate at the bottom of the
centrifuge tube. This precipitate consisted of orange to reddish coloured particles.
Figure 2.11 shows three distinct layer induced by ultracentrifugation.
TEM was also used to visualize ultra structural detail of the three layers.
The top layer consisted mainly of lycopene in crystalline form (LC) with
dimensions of approximately 10 ^m in length and 1 jim in width (Figure 2.13
panel A). In addition, the top layer showed the presence of cell wall casting and
cell wall envelops (ghosts, G) devoid of cytoplasm. As well, the presences of tiny
vesicular structures (V) were also observable. The middle layer was free of
lycopene crystal and containing particulate matrix (Figure 2.14 panels A, B). The
bottom precipitate showed crystalline fibrous material (cellulose yield) along with
99
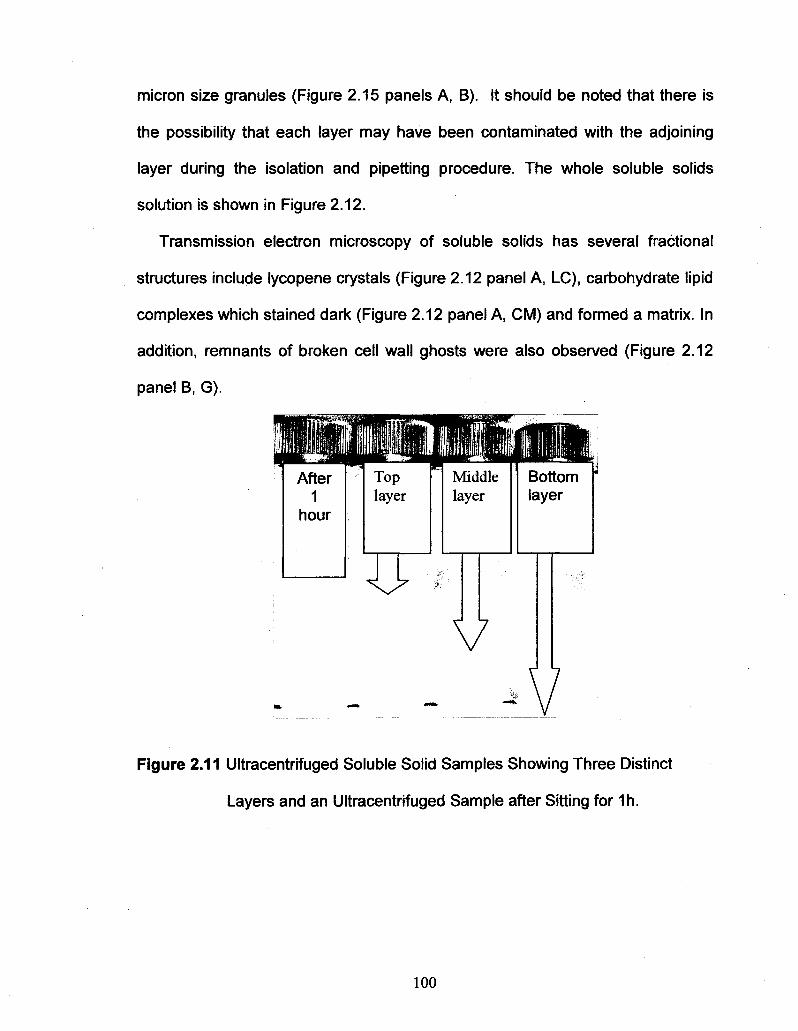
micron size granules (Figure 2.15 panels A, B). It should be noted that there is
the possibility that each layer may have been contaminated with the adjoining
layer during the isolation and pipetting procedure. The whole soluble solids
solution is shown in Figure 2.12.
Transmission electron microscopy of soluble solids has several fractional
structures include lycopene crystals (Figure 2.12 panel A, LC), carbohydrate lipid
complexes which stained dark (Figure 2.12 panel A, CM) and formed a matrix. In
addition, remnants of broken cell wall ghosts were also observed (Figure 2.12
panel B, G).
Figure 2.11 Ultracentrifuged Soluble Solid Samples Showing Three Distinct
Layers and an Ultracentrifuged Sample after Sitting for 1h.
100
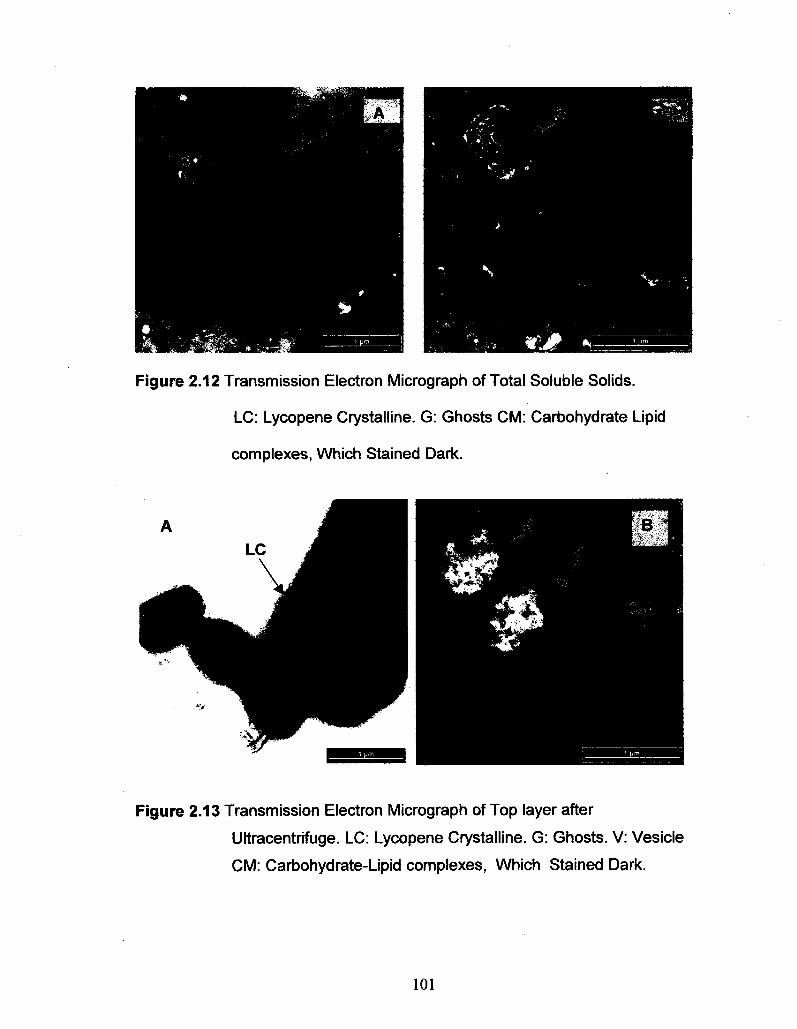
Figure 2.12 Transmission Electron Micrograph of Total Soluble Solids.
LC: Lycopene Crystalline. G: Ghosts CM: Carbohydrate Lipid
complexes, Which Stained Dark.
Figure 2.13 Transmission Electron Micrograph of Top layer after
Ultracentrifuge. LC: Lycopene Crystalline. G: Ghosts. V: Vesicle
CM: Carbohydrate-Lipid complexes, Which Stained Dark.
101
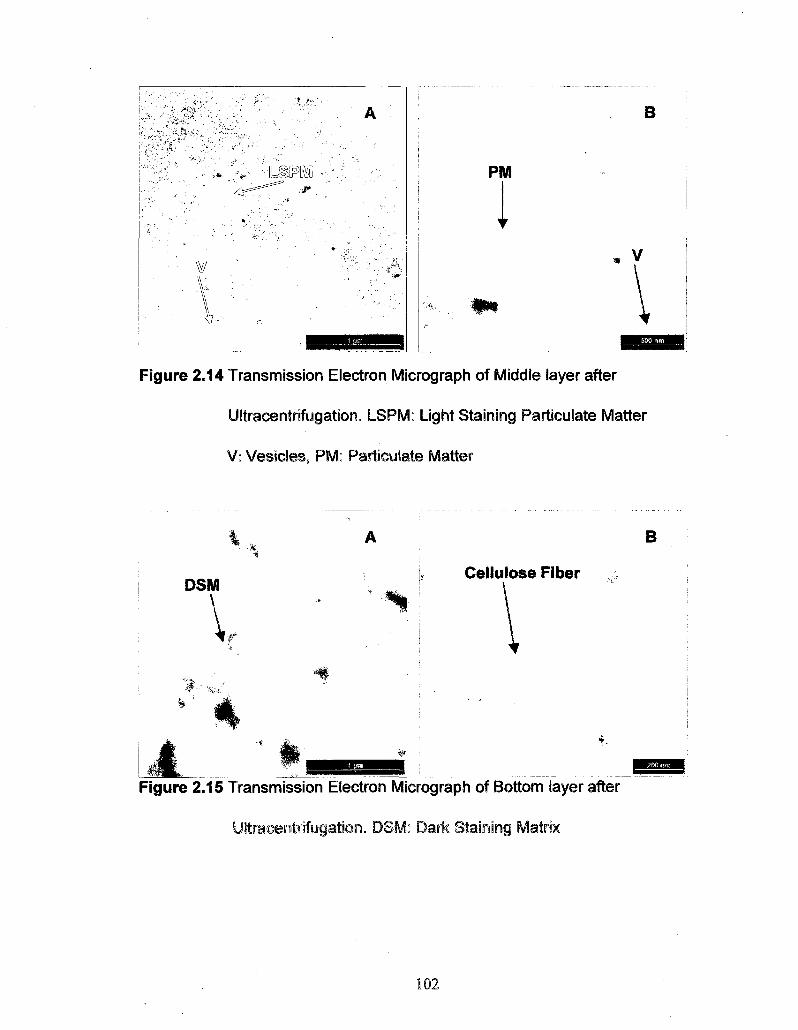
B
PM
Figure 2.14 Transmission Electron Micrograph of Middle layer after
Ultracentrifugation. LSPM: Light Staining Particulate Matter
V: Vesicles, PM: Particulate Matter
%.
DSM
y # :
B
i
H Cellulose Fiber
Figure 2.15 Transmission Electron Micrograph of Bottom layer after
Ultracentrifugation. DSM: Dark Staining Matrix
102
2.6 Discussion
The present study was employed to determine chemical and structural factors
affecting the consistency of tomato products. One of these methods is known as
precipitate weight ratio, which refers to the ratio of precipitate weight to the initial
weight of sample (Takada and Nelson, 1983). The precipitate is obtained by
centrifugation at 12,880* g for 30min at 4°C. Takada and Nelson (1983)
recommended this g-force to avoid producing a loose and less packed precipitate
and to cleanly separate insoluble solids from soluble solids. However in our
experiment, we applied a centrifugation force of 25,000* g for 18 min, which was
more effective at separating the soluble and insoluble fractions.
The collected soluble solids appeared as a distinctively red liquid, which was
shown by further analysis to contain considerable amounts of lycopene.
Lycopene is present in nature as trans/cis (90/10) crystals, insoluble in water and
with limited solubility in oil or fat. It has a dark red colour when dispersed in
water and a particle size ranging frornl to 10 urn.
In order to better understand how a highly lipophilic compound such as
lycopene can exist as a soluble complex in an aqueous environment, an
investigation into its composition and properties was undertaken.
The present study showed that a large amount of pectin was present in the
soluble solids fraction. Pectin is a high molecular weight charged hydrocolloid
that can exist as a soluble molecule, a colloidal particle form or as a gel. The
association of pectin and lycopene in the soluble complex was investigated by
digesting the pectin polymer with pectinase. The enzymatic breakdown of the
103
pectinases material resulted in the destabilization of the soluble complex and the
formation of a distinctively red precipitate when left standing or after
centrifugation. The hydrolysis of the pectinases material resulted in a dramatic
loss in solubility and indicated the importance of pectin in maintaining the
colloidal complex in solution. Lycopene was not free to float to the surface but
was mostly recovered with the insoluble material, suggesting that lycopene is
present in a complex interacting not only with pectin but also with other
components. Treatment with other enzymes (protease, cellullase) did not induce
any changes in the behavior of the soluble complex except for hemicellulase,
most likely because this enzyme contained some pectinase as well. It could be
hypothesised that proteins and cellulose are not directly responsible for
maintaining the solubility of the complex. A combination of protease and cellulase
also showed no effects on the soluble complex, which may indicate the possibility
that a pectin layer is surrounding the complex, preventing the protease and
cellulase enzymes from reaching their respective substrates.
Another interesting behavior of the soluble solid fraction was its precipitation
following dialysis. A major change brought about by dialysis was the reduction in
divalent ion levels, especially Ca ions. The loss of Ca ions could disrupt
electrostatic cross linkages of the pectin-protein complexes or induce swelling of
the pectin colloidal particles. These changes may lead to the breakdown of
pectin's interactions in the soluble complex and result in the precipitation of the
complex. It was reported that the heat degradation rate of crystalline lycopene
was much greater (Lee and Chen, 2002) than the rate of degradation of lycopene
104
in tomato pulp (Sharma and Le Maguer, 1996). This is further evidence that
macromolecules in tomato pulp, such as pectin are associated with lycopene and
in some way protect lycopene from heat degradation. This same protective
structure may also be involved with the stabiliziation of the soluble complex and
maintaining its solubility.
The direct complexation of pectin and lycopene is highly unlikely due to the
hydrophobic nature of lycopene and the hydrophilic properties of the charged
pectin molecule. In order for a complex to form between pectin and lycopene,
there needs to be an intermediate compound with both hydrophilic and
hydrophobic properties. Proteins are good candidates for that can associate with
the polar pectin molecule through electrostatic interactions or cross linkages with
Ca ions and to interact with non polar lycopene molecules through hydrophobic
interactions if sufficient hydrophobic amino acids such as valine, leucine
isoleucine and methionine are present. The combustion experiment that
determined the nitrogen content in paste and soluble solids, indicated the
presence of more than 2% N. However, the absence of protein bands on the
SDS-PAGE gel appears to exclude proteins with molecular weights between 6.5-
200 KDa. There is however the possibility that these proteins are mainly
glycoproteins (Hansen 2005) and do not migrate normally on the SDS-PAGE
gels or that the source of the nitrogen are amino acids and small peptides. This
speculation is supported by the dialyses results on the soluble solid samples that
showed a reduction in the amount of nitrogen when the soluble solids were
dialyzed in a 3500 MW cut off membrane dialysis tube. The presence of non-
105

protein N in the soluble solid has also been reported by Under and others (1984).
However it seems a little unrealistic to exclude proteins at this time since a high
amount of glycoproteins are present in the plastids (chromoplasts) where
lycopene is synthesized and deposited in plant cells (Hansen 2005).
Assuming that the nitrogen source in the soluble solids is peptides and
amino acids would explain why the protease treatment did not cause changes in
the lycopene complex. The enzymes are specific for certain chemical bonds
within the substrate molecule in much the same way as a key fits into a lock.
Without this specific bonding, no reaction will occur. In our research, this
addresses the reason why employing a protease did not have an effect on the
suspension behavior of lycopene.
In an industrial patent, micronized lycopene was coated with a thin film of
amphiphilic biopolymers such as proteins forming an insoluble network in water.
This water insoluble complex was then further treated with a colloidal material
such as pectin. By introducing lycopene (particle size of 1-10 urn) into an
aqueous solution of proteins, a protein coated lycopene complex can be
produced which can then be further treated in a colloidal water system to form a
second colloidal coat over the protein. The TEM experiment demonstrated the
presence of lycopene in a size smaller than 10 urn suitable for coating. The
protein present in the soluble fraction mostly as small peptides may be suitable
for this coating process. The presence of hydrophobic amino acids in the
peptides or free hydrophobic amino acids in the soluble solids would facilitate
such absorption.
106

Amino acids such as Valine, leucine and isoleucine have aliphatic
hydrocarbon side chains and these side chains are incapable of forming
hydrogen bonds with water as they have no, or very small, electrical charges
associated with their structure. In an aqueous solution, these side chains tend to
stable themselves by disrupting the hydrogen bonding structure between water
molecules as well as joining together through hydrophobic interaction, thus
minimizing the ordering of water molecules around hydrophobic pockets.
Lycopene is an oil soluble compound (highly hydrophobic) having along a long
aliphatic hydrocarbon chain structure which can undergo hydrophobic
interactions with other aliphatic or aromatic side chains of proteins or other super
molecular structures by packing together in order to exclude water (i.e. the lowest
energy conformation). If the side chains of leucine, isoleucine or valine can form
an aliphatic hydrophobic pocket, it may be possible for lycopene to become a
part of conformation. These interactions (hydrophobic) are to an important extent,
solvent (water) dependent, as the hydrogen bond network form by the water
molecules keep the hydrophobic groups together.
The hydrophilic amino acids face away from the hydrophobic core of proteins
and are conformationally more mobile in the water surrounding them. Amino
acids with fairly strong acidic or basic side chains are more or less fully ionized at
the measured pH (4.5-4.6) and therefore carry an electrical charge. Those amino
acids with acidic side chains carry a negative charge, while those with basic side
chains, are positively charged. Among this group of charged amino acids, the
most recognized ones are lysine and arginine. Lysine provides a positive charge
107
on the protein, as it is strongly basic (pKa=10.8). Arginine is more strongly basic
than lysine (pKa=12.5) and also provides a positive charge. The tomato products
have a relatively large amount of lysine that may facilitate such association.
A well-defined dissociation constant is not known for pectin but a pKa range of
3.0-5.0 has been suggested by Deuel (1958). In this experiment, the sample had
a pH of 4.5-4.6, where pectin carries a negative charge on its backbone and
peptides that are part of the peptide structure will have a positive charge on the
amino acids. Under these conditions it is possible to have electrostatic
interactions between positively charged side chains on the peptide molecule with
the negative charges on the backbone on the pectin molecule. These are the
interactions suggested in the model by Takada and Nelson (1983).
It is hypothesized that the hydrophobic lycopene molecules can interact with
hydrophobic patches on the peptide molecules to form complexes. These
complexes are not completely soluble in an aqueous medium and will form a
precipitate with time. However, in the presence of pectin, a soluble complex can
form where the positively charged groups on the peptide could bind to the
negatively charged pectin. The charge interactions between peptide and pectin
could stabilize the complex and at the same time protect embedded lycopene
from the aqueous medium.
The removal of pectin by pectinase treatment could destabilize the pectin-
peptide-lycopene complex and result in the precipitation of lycopene, which is still
attached to the peptides.
108
2.7 Conclusion
The objectives of this research were to investigate some of the important
properties of tomato paste. The initial study focussed on the methodologies used
to determine percent total solids (%TS), percent soluble solids (%SS) and
percent water insoluble solids (%WIS) in paste by two methods. The solids were
determined by the direct vacuum over method and the indirect microwave oven
method. The repeatability of each method was tested on 20 paste samples and
the values produced by the two methods (%TS, %SS, and %SSF) were
compared by the paired t-test, linear regression, regression of exact equality and
the average difference between the means. In the last chapter, the properties of
the soluble solids fraction were examined.
The repeatability of the vacuum oven and microwave oven methods were
determined by calculating the average standard deviation (ASD). The ASD were
0.067% and 0.045% based on 20 samples for the vacuum and microwave
methods respectively. The microwave method showed slightly better results but
overall, the two methods showed good repeatability. The paired t-test indicated
that the mean (27.17%) for total solids by vacuum oven was significantly smaller
than the mean (27.36%) determined by microwave oven. The same trend was
seen with the %WIS results. The mean (5.71%) for water insoluble solids was
significantly smaller than the mean (5.86%) determined by the microwave oven
method. The %SS however was just the reverse. The paired t-test indicated that
the mean (21.63%) for the soluble solids was significantly greater than the mean
(21.50%) for the microwave oven method. The slightly greater means obtained
109

with the microwave method for %TS and %WIS may have been caused by
incomplete drying in the case of %TS or incomplete extraction of soluble solids
in the case of %WIS. Because the %SS value is calculated with the %TS
and %WIS values, any error in the two latter values will be expressed in the %SS
value. These differences, although significant may not be large enough to be a
factor in the commercial processing of paste and that both methods can be used
to determine the solids content of paste. Supporting evidence that the two
methods were able to give essentially the same values for %TS, %WIS and %SS
was gleaned from the results obtained by simple linear regression, by regression
of exact quality, and root mean square error.
The soluble solids fraction was shown to contain considerable levels of
lycopene which in its native state is insoluble in water and has only limited
solubility in oil. The lycopene in the soluble solids fraction was dispersed in water
as a soluble complex. The properties of this soluble complex were shown to
contain large amounts of pectin. The hydrolysis of the pectin with pectinase
resulted in the destabilization of the soluble complex and the formation of a red
precipitate. The dramatic loss of solubility after pectinase treatment is one
indication of pectins involvement in the structure of the soluble complex. It
appears that lycopene is complex with other components since the hydrolysis of
pectin did not release free lycopene.
A second interesting behaviour of the soluble solid fraction was its
precipitation when dialyzed against water. There was a significant reduction in
the Ca+2 ions. Concentration after dialysis. The loss of Ca+2 ions could disrupt
110
the electrostatic cross linkages of pectin-protein complexes. These disruptions
could lead to the breakdown of pectin's interactions in the soluble complex and
result in the precipitation of the complex. It is unlikely that pectin and lycopene
are able to form a soluble complex without the aid of an intermediate compound
that can bond to both lycopene and pectin. Protein may be able to serve as that
intermediate compound through electrostatic interactions or crosslinkages with
Ca ions and through hydrophobic interactions with hydrophobic amino acids
and peptides. Based on the Dumas analysis, there is more than 2% nitrogen in
the soluble solids fraction which is enough to account for 12-13% proteins,
peptides or amino acids. It is therefore possible for the hydrophobic lycopene
molecules to interact with hydrophobic patches on the peptide/protein molecules
to form complexes. These complexes are not completely soluble in an aqueous
medium and will precipitate with time. To form the soluble complex, the pectin
molecule binds to the positively charged groups on the peptide/protein with its
negatively charged carboxyl groups. The charge interactions between
peptide/protein and pectin stabilize the complex and at the same time protect
lycopene from the aqueous medium. It is therefore hypothesized that the soluble
complex has a structure with a peptide/protein-lycopene core stabilized with a
pectin coat.
I l l

2.8 Future Study
To explore the accuracy of the microwave oven/formula method, it is
suggested that a study be undertaken to utilize Equation 3 to calculate (%WIS)
but determine (%TS) and (%SSF) by the vacuum oven. That is the (%TS) will be
determined by the procedure in section 1.3.2.1.a and (%SSF) by procedure in
section 1.3.2.2.C on the supernatant from the first centrifugation. The WIS values
from the vacuum method can then be compared to the value obtained by
calculation but without the microwave drying steps. This will give a better
indication if the microwave drying is causing the difference between vacuum and
microwave drying or if the supernatant from the first centrifugation is or is not a
true representation of the soluble solids in the paste.
A collaborative study of solids measurements employing the
microwave/formula method among laboratories is suggested to determine the
reproducibility and robustness of the microwave/formula method.
More work should be done to further characterize the soluble lycopene
complex and determine its composition and perhaps its structure. Since this
complex is able to suspend the very hydrophobic lycopene molecule in an
aqueous environment, it would be worth while to investigate the possibility that it
may have some other unique properties. For example, pure lycopene in an
organic solvent is very unstable and will rapidly oxidize and isomerize. The
structure of the complex may protect lycopene from these reactions.
Experiments can be conducted to determine the stability of the lycopene
complex against light exposure (photooxidation), high temperatures, pH, salts
112
and other environmental variables. Because the lycopene can be suspended in
an aqueous medium, the complex has the potential to be used as a delivery
system for lycopene in aqueous food systems. For this application to be viable,
the stability of the lycopene complex in the food system and its bioavailability has
to be investigated.
113

REFERENCES Ahmed, A. E. R., Labavitch, J. M. 1977. A simplified method for accurate
determination of cell wall uronide content. J. Food Biochem. 1: 361-365.
Anguelova T, Warthesen J. 2000. Lycopene stability in tomato powders. J. Food Sci. 65: 67-70.
AOAC . 2000 .Official Method of Analysis .17th ed. Solids (Insoluble) in Canned Vegetables .Gravimetric Method, sec 42.1.06.
AOAC . 2000 .Official Method of Analysis .17th ed. Solids (Soluble) in Canned Vegetables.Refractive index Method.sec 42.1.10.
AOAC . 2000 .Official Method of Analysis .17th ed. Solids (Total) in Canned Vegetables .Gravimetric Method.sec 42.1.05.
AOAC . 2000 .Official Method of Analysis .17th ed. Solids (Total) in processed tomato products.Microwave Oven drying Method.sec 42.1.09.
AOAC.1965. Official Methods of Analysis. 10th ed.Total Solids (1).30.003.
AOAC. 1980. Official Method of Analysis .13th ed. Total Solids (2). 32.010.
Axelos, M.A.V., Thibault, J.F., 1991.The chemistry of low-methoxyl pectingelation. In: Walter, R.H. (Ed.), The Chemistry and Technology of Pectin. Academic Press, San Diego, pp. 109-118.
Bannon, C. D.,Craske, J. D., Hilliker, A. E. 1985. Analysis of fatty acid methyl esters with high accuracy and reliability.IV. Fats with fatty acids containing four or more carbon atoms. J Am Oil Chem Soc. 62: 1501-1507.
Bigelow, W. D. Smith, H.R. and Green leaf ,C.A. 1950.Tomato products, National Canners Association, Bulletin 27-L,Revised.
Blanch, G.P., Ruiz del Castillo, M.L., Del Mar Caja,M., Perez-Mendez, M., Sanchez-Cortes, S. 2007. Stabilization of all-trans-Lycopene from tomato by encapsulation using cyclodextrins. Food Chem. 105:1335-1341.
Blumenkrantz, N., Asboe-Hansen, G. 1973. New method for quantitative determination of uronic acids. J. Biochem. 54: 200-201.
Bohart, G.S. 1940. Studies of western tomatoes. J. Food Sci. 5(5): 469-486.
114

Boileau, A. C , Merchen, N. R., Wasson, K., Atkinson, C. A., and Erdman, J. W. 1999. C/s-lycopene is more bioavailable than trans lycopene in vitro and in vivo in lymph-cannulated ferrests. J. Nut. 129: 1176-1181.
Brady, J. D.; Sadler, I. H.; Fry, S. C. Di-isodityrosine, a novel tetrameric derivative of tyrosine in plant cell wall proteins: a new potential cross-link 1996. Biochem. J.:315, 323-327.
Buss, CD. 1961. Refractometric tests on tomato products. Food technol. 15: 327-328.
Cantarelli, P.R., Regitano-D'arce, M.A.B. and Palma, E.R. 1993.Physicochemical characteristics and fatty acid composition of tomato seed oils from processing wastes. Sci. agric. (Piracicaba, Braz.) 50(1): 117-120.
Cheftel ,H.,Frichet.P. and Estang, J. 1951. Die Bestimmung der Troekensubstanz in Lebensmitteln. J.Ann.Fals.Fraudes 44, 1-16.
Chin, H. B.,Kimball, J.R., Hung, J. and Allen, B. 1985 . Microwave drying determination of total solids in processed tomato products: Collaborative study. J.Assoc.off Anal.Chem., 68(6), 1081-1083.
Choudhari, S.M., Ananthanarayan, L. 2007. Enzyme aided extraction of lycopene from tomato tissues, Food Chem. 102: 77-78.
Clark, A.H., Farrer, D.B., 1996. Shear modulus-concentration relationships for low DE pectin-calcium gels in the temperature range 20-85 °C. Food Hydrocolloids. 10, 31-39.
Clinton, S. K. 1998. Lycopene: Chemistry, biology, and implications for human health and disease. Nutrition Reviews. 56: 35-51.
Davies, J. N. 1964. Effect of nitrogen, phosphorous and potassium fertilizers on the non-volatile organic acids of tomato fruit. J. Sci. Food Agric. 15: 665-673.
Davies, J.N. and Hobson, G.E. 1981 .Constituent of tomato fruit-the influence of environment nutrition and genotype.C.R.C. Crit.Rev.Food Sci.Nutr. 15: 205-280.
Davis,A.B. and Lai,C.S. 1984. Microwave utilization in the rapid determination of flour moisture .Cereal chemistry,61(1) :1-4.
Denny C: technical editor. 1997 Tomato Products. 7th ed. NFPA Bulletin 27-L . 197p.
115
Di Mascio, P. Murphy, M. C. Sies, H. 1991. Anti-oxidant defense system, the role
of carotenoids, tocopherol and thiols. Am. J. Clin. Nutr. Suppl. 53: 194-200.
DiLorenzo, C. Williams, CM. Hajnal, F. Valenzuela J.E.1988. Pectin delays gastric emptying and increases satiety in obese subjects. Gastroenterology. 95:1211-5.
Dougherty. R.H. and Nelson, P.E. 1974. Effects of pH on quality of stored tomato juice. J. Food Sci. 39: 254.
Dzurec, D.J. and Baptie,P. 1989. Rapid,inexpensive microwave oven method for total solids determination in fluid dairy products. J.Dairy Sci.72:2777'-27'81.
El Miladi. S.S., Gould, W.A. and Clements, R.L.1969. Heat processing effect on starch,sugar, proteins, amino acids and organic acids of tomato juice. Food Technol. 23:93.
Ellis, G. H., Hammer, K. C. 1943. The carotene content of tomatoes as influenced by various factors. J. Nutr. 25: 539-553.
Erdman, J.J.W., Biere, T.L., Gugger, E.T. 1993. Absorption and transport of carotenoids. Ann. N. Y. Acad. Sci. 691:76-85.
Foda, Y.H., McCollum, J.P. 1970. Viscosity as affected by various constituents of tomato juice. J. Food Sci. 35 (4): 333-338.
Galili, G. 1995. Regulation of Lysine and threonine biosynthesis.Plant Cell.7:899-906.
Garti, N., Zelkha. M, Sedlov, T. 2003. Carotenoid formulation,Patent No. WO/2003/045167.
Gamier, C, Axelos, M.A.V.Thibault, J.-F.1993. Phase diagrams of pectin-calcium systems: influence of pH, ionic strength, and temperature on the gelation of pectins with different degrees of methylation. Carbohydrate Research 240,219-232.
Gartner, C. Stahl, W. and Sies H. 1997. Lycopene is more bioavailable from tomato paste than from fresh tomatoes. Am J Clin Nutr .66:116-122.
Goose, P.G., Binsted, R. 1964. Tomato paste. In Tomato paste, puree, juice and powder, 1s t ed.; Food Trade Press: London. 62-77.
Gould, W.A. 1983. Tomato Production, processing and quality evaluation, 2nd ed., Westport, CT.AVI Publishing Co. Inc. 445p.
116

Gould, W.A. 1992. Tomato Production, Processing & Technology, 3 ed., Baltimore, MD. CTI Publication lnc.550 p.
Grant, G.T., Morris, E.R., Rees, D.A., Smith, P.J.C., Thorn, D.1973. Biological interactions between polysaccharides and divalent cations: the egg-box model. FEBS Letter. 32: 195-198.
Green, W.C and Park,K.K. 1980. Comparison of AOAC microwave and vacuum oven methods for determination total solids in milk. J.Food Prot. 43:782.
Hadley, C.W., Clinton, S.K., Schwartz, S.J. 2003. The consumption of processed tomato products enhances plasma lycopene concentrations in association with a reduced lipoprotein sensitivity to oxidative damage. J. Nutr. 133:727-732.
Hague, A., Manning, A. M., Hanlon, K. A., Huschtscha, L. I., Hart, D., Paraskeva, C. 1993. Sodium butyrate induces apoptosis in human colonic cell lines in a p53 independent pathway. Implications for a possible role of dietary fiber in the prevention of large-bowel cancer. Int. J. Cancer. 55: 498.
Hansen, L. U., Chiu, M.M. 2005. Isolation and composition of chromoplasts from tomatoes. J.Agric.Food Chem. 53: 6678-6682.
Hart, D. J., Scott, K. J. 1995. Development and evaluation of an HPLC method for the analysis of carotenoids in foods, and the measurement of the carotenoid content of vegetables and fruits commonly consumed in the UK. Food Chem. 54: 101-111.
Hayes, W.A., Smith P.G. and Morris A.E.J. 1998 . The production and quality of tomato concentrates. Crit.Rev.Food Sci.Nutr .38(7): 537-564.
Health protection Branch Ottawa. 1981. Determination of tomato solids. Official Method FO-19 October 15.
Heutink R. 1986 Tomato Juices and tomato juice concentrates:a study of factores contribution to their gross viscosity . WAU dissertation no.1095.Nageninge Publisher, p 200.
Heinonen, M. I., Ollilainen, V., Linkola, E. K.,Varo, P. T., and Koivistoinen, P. E. 1989.Carotenoids in Finnish foods, vegetables,fruits, and berries. J. Agric. Food Chem. 37,655-659.
Hileman, G.A., Upadrashta, S.M., Neau, S.H., 1997. Drug solubility effects on predicting optimum conditions for extrusion and spheronization of pellets. Pharmaceutical Development and Technology 2, 43-52.
117
Hogans,SA, McNamess.B.F., 0'Riordan,E.D., O'Sullivan, M. 2001. Microencapsulating Properties of Sodium Casein. J.Agric.Food Chem. 49: 1934-1938.
Hurmann K.1979.Ubersicht Uberdie In haltstoffe dertomaten.Z.Lebensm.Unters. u.-Forsch.169:179-200.
Ishida, B.K., Ma, J.C., Chan B.G., Bartley, G.E., Grossman, J.N. 2001. Modified method for simple, rapid hplc analysis of lycopene isomers. Acta Hort ISHS, 235-249.
Jackson, M. J. 1997. The assessment of bioavailibility of micronutrients: introduction. Eur. J. Clin. Nutr. 51 (Supple 1): S1-S2.
Jung, S. Rickert, D.A., Deak, N.A., Aldin , E.D ., Recknor, J., Johnson, L.A., Murphy, P.A. 2003. Comparison of Kjeldahl and Dumas methods for determining protein contents of soybean products. J. Am. Oil Chem. Soc. 80:1169-1173.
Kieliszewski, M.J and Lamport D.T.A.7994. Extensin: repetitive motifs, functional sites, post-translational codes, and phylogeny, Plant J. 5(2): 157-172.
Kimball, L.B., Lillian, B., Kertesz, Z.I. 1952. Practical determination of size distribution of suspended particles in macerated tomato products. Food Technol. 6: 68-71.
Krinsky, N. I., Russett, M. D., Handeman.G. J., and Snodderly, D. M. 1990. Structural and germetrical isomers of carotenoids in human plasma. J. Nutr., 120, 1654-1662.
Laemmli U.K. 1970, Cleavage of structural proteins during the assembly of the head of bacteriophage T4. Mature.221 .$ 680-685.
Lamb F. C. 1969. Collaborative Study of the determination of soluble Solids in tomato products by refractive Index Expressed as Per Cent Sucrose. J. AOAC. 52(5) : 1050-1054.
Lamb, F.C. 1977. Tomato Product. Bulletin 27-L National Canners' Assoc, Washington. DC.
Lamb. F.C. 1964. Processed vegetable products: Total solids in processed vegetable. J.Assoc.Off. Agric.Chem. 47,492-500.
Lee M.T., Chen B. H. 2002. Stability of Lycopene during heating and illumination in model system. Food Chem. 78: 425-432.
118
Lindner, P., Shomer, I., Vasiliver, R. 1984. Distribution of Protein, Lycopene and the Elements Ca, Mg, P and N among various fractions of tomato juice. J. FoodSci. 49(4): 1214-1215.
Liu, Y. K., Luh, B. S. 1979. Effect of harvest maturity on free amino acids, pectins, ascorbic acid, total nitrogen and minerals in tomato pastes. J. Food Sci. 44(2):425-428.
Livney,Y. Dalgleish, D. 2007. Casein micelles for nanoencapsulation of hydrophobic compounds. Patent no. WO/2007/122613.
Lootens, D., Capel, F., Durand, D., Nicolai, T., Boulenguer, P., Langendorff, V., 2003. Influence of pH, Ca-concentration, temperature and amidation on the gelation of low methoxyl pectin. Food Hydrocolloids. 17, 237-244.
Lurie, S. Handros, A. Fallik, E. and Shapira.1996. Reversible inhibition of tomato fruit gene expression at high temperature. Plant Physiol. 110: 1207-1214.
MacDougall, A.J., Brett, G.M., Morris, V.J., Rigby, N.M., Ridout, M.J. and Ring, S.G. 2001. The effect of peptide-pectin interactions on the gelation behaviour of a plant cell wall pectin. Carbohydr. Res. 335: 115-126.
Madhayi, D.L.Salunkhe, D.K.1998. Tomato.ln: Salunkhe ,D.K. and Kadam.S.S. Handbook of vegetable science and technology: Production, composition, storage, and processing.CRC Publisher, p 171-203.
Makarchuck, M. J., Hill, A. R.,and Szijarto, L. F. 1991. Accuracy and repeatability of milk total solids analysis by microwave moisture oven. Can. Inst. Sci. Technol. J., 24(3/4): 172-175.
May B. 2003 Handbook of Vegetable Preservation and Processing : Hui Y.H, Ghazala S., Graham D.M., Murrell K.D. ,Nip Wai-Kit. 2003 ..CRC Press.752 p.
McColloch, R J., Nielsen, B.W, Beavens, E.A. 1950. Factors influencing the quality of tomato paste. II. Pectic changes during processing. Food Technol. 4: 339.
McCollum, J. P. 1955. Distribution of carotenoids in the tomato. Food Res. 20: 55-59.
McKinstrya, P. J., Indyka, H. E., and Kim, N. D.1999. The determination of major and minor elements in milk and infant formula by slurry nebulisation and inductively coupled plasma - optical emission spectrometry (ICP-OES). Food Chem. 65 . 245-252.
119
Morris, E.R., Powell, D.A., Gidley, M.J., Rees, D.A.1982. Conformations and interactions of pectins. I. between gel and solid states of calcium polygalacturonate. J. Mol. Biol. 155: 507-516.
Nguyen, M. L, Schwartz, S. J. Lycopene 1999: chemical and biological propertiesn. Food Tech 53: 38-45.
Oomah, B. D., and Mazza, G. 1992. Microwave oven drying for moisture determination in flax, canola and yellow mustard seeds. Lebensm. -Wiss. U.-Technol.25: 523-526.
Parker, R.S.1996. Absorption, metabolism, ad transport of carotenoids. FABS J. 10:542-51.
Powell, D.A. 1982. Conformations and interactions of pectins II.Influence of residue sequence on association in calcium pectate gels. J. Mol. Biol. 155:517-531.
Qi, X.; Behrens, B. X.; West, P. R.; Mort, A. E. 1995. solubilization and partial characterization of extensin fragments from cell walls of cotton suspension cultures (Evidence for a covalent cross-link between extensin and pectin). PlantPhysiol. 108, 1691-1701.
Qiu, W., Jiang, H., Wang, H , Gao, Y. 2006. Effect of high hydrostatic pressure on lycopene stability. Food Chem. 97: 516-523.
Reitsma, J.C.E., Thibault, J.F., Pilnik, W., 1986. Properties of amidated pectins. I. Preparation and characterization of amidated pectins and amidated pectin acids. Food Hydrocolloids. 1:121-127.
Ribayo-Mercado, J. D., Garmyn, M., Gilchrest, B. A., Russell, R. M. 1995. Skin lycopene is destroyed preferentially over betacarotene during ultraviolet irradiation in humans. J. Nutr. 125: 1854-1859.
Ribeiro HS, Ax K, Schubert H. 2003. Stability of lycopene emulsions in food systems. J Food Sci .68(9):2730-2740.
Riso, P. & Porrini, M. (1997) Determination of carotenoids in vegetable foods and plasma. Int. J. Vitam. Nutr. Res. 67: 47-54.
Rock, C.L. and Swendseid,M. F. 1992. Plasma -carotene response in human after meals, supplemented with dietary pectin. Am. J. Clin. Nutr. 55: 96-99.
120

Sa' nchez M.C., Valencia C, Ciruelos A., Latorre A. and Gallegos C. (2002). Influence of processing on the rheological properties of tomato paste. J. Sci. FoodAgric .82: 990-997.
Sainju, U. M. and Dris R. 2006. Sustainable production of tomato. In: Dris.R. editor, Crops: Quality, growth, and biotechnology. Helsinki, Finland: WFL Publisher, p. 190-216.
Saywell.L . G., and Cruess, W .V. 1932. Composition of canning tomatoes. Calif. Agr.Expt. Sta. Bull. 545.
Schierle, J., Bretzel, W., Buhler, I., Faccin.N., Hess, D., Steiner, K., and Schuep, W. 1996. Content and isomeric ratio of lycopene in food and human blood plasma. Food Chem. 59(3): 459^65.
Semo, E.,Kesselman, E., Danino, D., Livney, Y.D. 2007.Casein micelle as a natural nano-capsular vehicle for netraceuticals. Food Hydrocolloids. 21:936-942.
Sharma, S.K. and Le Maguer, M. 1996. Lycopene in tomatoes and tomato pulp fractions. J. Food Sci., 2, 107-113.
Sharma, S.K. and Le Maguer, M. 1996. Kinetics of lycopene degradation in tomato pulp solids under different processing and storage conditions. Food Res Int. 29: 309-315.
Shi, J., Le Maguer, M., Kakuda, Y., Liptay, A.1999. Lycopene degradation and isomerization in tomato dehydration. Food Res. Intl. 32(1): 15-21.
Showalter, A. M. 1993. Structure and function of plant cell Wall protein, of Plant cell 5: 9-23.
Smith, J. G., Yokoyama, W. H., German, J. B. 1998. Butyric acid from the diet: actions at the level of gene expression. Crit. ReV. Food Sci. 38 (4): 259-297.
Sommer-Knudsen, J., Bacic A., Clarke A.E., 1998. Hydroxyproline-rich plant glycoproteins. Phytochemistry, 47(4), pp. 483-497.
Stahl, W., Sies, H. 1992. Uptake of lycopene and its geometrical isomers is greater from heat-processed than from unprocessed tomato juice in humans. J. Nutr. 122: 2161-2166.
Stahl, W., Sies, H. 1996. Perspectives in biochemistry and biophysics. Arch. Biochem. Biophys. 336(1): 1-9.
121
Stein, W.H. and Mohr, S. 1949. Amino acid composition of-Lactogobulin and bovine serum albumin. J. Biol. Chem. 178: 79.
Takada, N. Nelson P. E. 1983. Pectine protein Interaction in tomato products. J. Food Sci. 48: 1408-1411.
Tavares, C. A., Rodriguez-Amaya D. B. 1994. Carotenoid composition of Brazilian tomatoes and tomato products. Lebensmittel - Wissenschaft Technologie.27 (33): 219-224.
Tho, I., Sande S.A., Kleinebudde P. 2005. Cross-linking of amidated low-methoxylated pectin with calcium during extrusion/spheronisation: effect on particle size and shape Chem. Eng. Sci. 60, 3899-3907.
U.S. Department of Agriculture (2000-01). Standards for Grades of Canned Tomatoes. Quoted in: The Almanac,2000-01. P. 642. Westminster, MD: E.E. Judge and Sons, Inc.
U.S. Supreme Court. MX v. HEDDEN, 149 U.S. 304. 1893. Collector. No. 137. May 10.
Wang,S. L. 1987.Microwave drying method for total solids determination in tomatoes: collaborative study. J.Assoc.offAnal.Chem.,70(4),758-759.
Weisburger, J.H. 2002. Lycopene and tomato products in health promotion. Exp Biol Med. 227: 924-927.
Whittenberger, R.T., Nutting, G.C. 1958. High viscosity of cell wall suspensions prepared from tomato juice. Food Technol. 12: 420-424.
Yoo,B. and Rao M.A. (1994). Effect of unimodal particle size and pulp content on the rheological propertiesof the tomato puree. Journal Texture Studies 25:421^36.
Young. E.G. 1963. Occurrence, classification, preparation and analysis of proteins. In "Comprehensive Biochemistry", Vol.7: 1. Elsevier Publishing Co.. New York, NY.MS received 3131183; revised 5127183: accepted 613183.Volume48.
Zechmeister L, Lerosen A.L, Schroeder W.A, Polgar A, Pauling L. 1943. Spectral characteristics and configuration of some stereoisomeric carotenoids including prolycopene and pro-y-carotene. J. Am Chem Soc .65:1940-1945.
122
Copyright © 2022 FDOKUMEN


![chapter – 21 solids [surface area and volume of 3-d solids]](https://static.fdokumen.com/doc/165x107/632737f8051fac18490e22eb/chapter-21-solids-surface-area-and-volume-of-3-d-solids.jpg)