The tomato paste quality attributes along the industrial ...
10
Vol. 13(10) pp. 215-224, October 2019 DOI: 10.5897/AJFS2019.1825 Article Number: 2AABD3162120 ISSN: 1996-0794 Copyright ©2019 Author(s) retain the copyright of this article http://www.academicjournals.org/AJFS African Journal of Food Science Full Length Research Paper The tomato paste quality attributes along the industrial processing chain Karla Ariane Silveira Munhoz and Flávio Luís Schmidt * Department of Food Technology, School of Food Engineering, University of Campinas, Campinas - SP 13083-862, Brazil. Received 28 May, 2019; Accepted 2 October, 2019 Tomato is widely consumed in the world and its concentrated paste represents the main product from industrial tomato cultivars. One of the industry's biggest challenges is to produce in a sustainable and effective chain to simultaneously fulfill the cost reduction and quality improvement demands. This study aimed to show the loss of tomato paste quality attributes along its industrial processing chain, focusing on three parameters: (1) ascorbic acid content; (2) color and (3) consistency. Samples of tomato paste (29 °Brix) were subjected to thermal treatment at 60, 70 and 80°C, cooled down and analyzed for the mentioned attributes by kinetic parameters. Both ascorbic acid (z = 62.8°C, R 2 = 0.9499) and instrumental color (z = 19.0°C, R 2 = 0.9924 for a*/b*, and z = 16.3°C, R 2 = 0.9897 for TPS) parameters degradation were well described by first-order kinetic models. Consistency attributes were not affected by the thermal treatment temperature. The temperature effect at each stage of processing allowed identifying the sterilization and storage steps as responsible for the greater degradation of color and ascorbic acid, respectively. The industry must control sterilization and increase sun protection in the offseason to preserve color and ascorbic acid, ensure lower losses of sensorial quality without reducing its productive flexibility, always prioritizing food safety. Key words: Color, storage, shelf life, vitamin C, consistency. INTRODUCTION Tomatoes are widely consumed in the world and as a fruit of limited durability and short agricultural season, much of the tomato produced for industrial purposes is transformed into concentrated pulp, which is reconstituted throughout the year, mainly during the off-season (Ochida et al., 2019). In Brazil, the Support Program for the Production and Marketing of Horticultural Products (PROHORT) was implemented in 1992-2012, when it was noted although only garlic, onions, potatoes, and tomatoes were priorities for PROHORT, the modernization of production and commercialization of these four vegetables resulted in positive impacts in the chains of many others (Camargo Filho and Camargo, 2017). The quality of the processed tomato product is dependent upon processing conditions (Xu et al., 2018) *Corresponding author. E-mail: [email protected]. Author(s) agree that this article remain permanently open access under the terms of the Creative Commons Attribution License 4.0 International License
-
Upload
khangminh22 -
Category
Documents
-
view
1 -
download
0
Transcript of The tomato paste quality attributes along the industrial ...

Vol. 13(10) pp. 215-224, October 2019
DOI: 10.5897/AJFS2019.1825
Article Number: 2AABD3162120
ISSN: 1996-0794
Copyright ©2019
Author(s) retain the copyright of this article
http://www.academicjournals.org/AJFS
African Journal of Food Science
Full Length Research Paper
The tomato paste quality attributes along the industrial processing chain
Karla Ariane Silveira Munhoz and Flávio Luís Schmidt*
Department of Food Technology, School of Food Engineering, University of Campinas, Campinas - SP 13083-862,
Brazil.
Received 28 May, 2019; Accepted 2 October, 2019
Tomato is widely consumed in the world and its concentrated paste represents the main product from industrial tomato cultivars. One of the industry's biggest challenges is to produce in a sustainable and effective chain to simultaneously fulfill the cost reduction and quality improvement demands. This study aimed to show the loss of tomato paste quality attributes along its industrial processing chain, focusing on three parameters: (1) ascorbic acid content; (2) color and (3) consistency. Samples of tomato paste (29 °Brix) were subjected to thermal treatment at 60, 70 and 80°C, cooled down and analyzed for the mentioned attributes by kinetic parameters. Both ascorbic acid (z = 62.8°C, R
2 = 0.9499)
and instrumental color (z = 19.0°C, R2 = 0.9924 for a*/b*, and z = 16.3°C, R
2 = 0.9897 for TPS) parameters
degradation were well described by first-order kinetic models. Consistency attributes were not affected by the thermal treatment temperature. The temperature effect at each stage of processing allowed identifying the sterilization and storage steps as responsible for the greater degradation of color and ascorbic acid, respectively. The industry must control sterilization and increase sun protection in the offseason to preserve color and ascorbic acid, ensure lower losses of sensorial quality without reducing its productive flexibility, always prioritizing food safety. Key words: Color, storage, shelf life, vitamin C, consistency.
INTRODUCTION Tomatoes are widely consumed in the world and as a fruit of limited durability and short agricultural season, much of the tomato produced for industrial purposes is transformed into concentrated pulp, which is reconstituted throughout the year, mainly during the off-season (Ochida et al., 2019). In Brazil, the Support Program for the Production and Marketing of Horticultural Products (PROHORT) was implemented in 1992-2012, when it
was noted although only garlic, onions, potatoes, and tomatoes were priorities for PROHORT, the modernization of production and commercialization of these four vegetables resulted in positive impacts in the chains of many others (Camargo Filho and Camargo, 2017).
The quality of the processed tomato product is dependent upon processing conditions (Xu et al., 2018)
*Corresponding author. E-mail: [email protected].
Author(s) agree that this article remain permanently open access under the terms of the Creative Commons Attribution
License 4.0 International License

216 Afr. J. Food Sci. and the essential quality parameters for the classification and marketing of processed tomato products are color and consistency. The desired color pattern, both in fresh and concentrated tomatoes products, is a red-intense and uniform pulp, by the presence of carotenoids, which lycopene represents about 80%. The color maintenance of tomato products depends directly on the control of process factors that trigger oxidation or thermal isomerization of carotenoids. Throughout the processing chain of concentrated pulp, the presence of oxygen must be limited, making heating the main cause of color changes (Qiu et al., 2019; Motamedzadegan and Tabarestani, 2011; Shi and Maguer, 2000; Barreiro et al., 1997). Remini et al. (2015) showed the effect of storage temperature and deaeration was the most influent factors on kinetics degradation of color and ascorbic acid in pasteurized blood orange juice.
Consistency in tomato products is closely linked to cost, as well as sensory acceptance. The main factors affecting the tomato pulp consistency are the differences in composition between cultivars, different maturation stages of the fruit, the content of total solids and insoluble solids, the particle size distribution and the shape of the insoluble particles, and initial heat processing parameters (hot break or cold break) (Page et al., 2019; Xu et al., 2018; Sánchez et al., 2002).
Tomato is also considered an important source of ascorbic acid (AA) due to its high consumption, both fresh and processed products. AA is relatively thermolabile and it is considered one of the most sensitive nutrients to adverse conditions, so its content is often taken as an indicator of general quality changes in processed foods (Tchuenchieu et al., 2018; Koh et al., 2011).
The loss of quality of the concentrated tomato pulp generates a direct impact on derived products like ready sauces, extracts, and ketchup, whose quality is perceived and evaluated directly by the final consumers. Based on California, the US state responsible for significant 35% of world production, other producers in the world opt for the less expensive storage system under uncontrolled conditions, that is, the ambient temperature in open courtyards. But the American product remains exposed to the mild winter conditions of the southern United States, averages from 9.1 to 20.2°C (Rssweather, 2019); while in other tropical counties the product is subjected to warmer climate conditions. For this reason, this storage system, although cost efficient, can contribute to the deterioration of the concentrated pulp throughout its shelf life, exposed to heat and direct sunlight. Sometimes, the maximum storage time in the mentioned conditions is established around 24 months, but it can also be added to the shelf life of the concentrated pulp for another 12 to 18 months, considering the cases in which it is used in the tomato processed products, such as sauces and extracts, during the off-season. In these cases, the pulp quality loss is
perceived directly in the products that arrive at the consumer's table, reflecting in great variability in the quality parameters of processed tomato products throughout the year.
Since even the quality attributes of homemade tomato sauce can vary according to different storage temperatures (Nkhata and Ayua, 2018), many authors have shown the applicability of a kinetics-based testing approach to obtain faster insight into food product changes, useful for shelf-life investigations (Peleg et al. 2018), for example for strawberry juice (Buvé et al., 2018), or tomato hot pot sauce (Li et al., 2018), among others.
This study can, therefore, help the industry to identify the critical stages for the degradation of the main attributes of quality along the industrial processing chain of concentrated tomato pulp: color, consistency and AA content. The study of the kinetics of degradation must provide data to direct the application of improvements in the processing, manipulation, and storage of concentrated tomato pulp, combining food safety and sensorial quality. MATERIALS AND METHODS In the kinetic studies, concentrated tomato pulp samples, produced from the varieties N-901 (80%), H-9553, H-9992, U-2006, IT-761, IT-619 were used (quantity in descending order). The samples were collected, aseptically packed in 4 kg bags, at an industrial tomato processing plant and stored at -15°C until physicochemical analysis.
Physicochemical analysis
The pH was measured in Digimed DM-70 pH meter and the total soluble solids (ºBrix) determined by direct reading in Abee Mark II, Reichert Technologies refractometer (AOAC, 2010).
Titratable acidity was determined by titration (AOAC, 2010) and the wet basis moisture was determined by thermogravimetric, with halogen drying, using the HB43-S Mettler Toledo® moisture analyzer.
The determination of AA was done by iodometry (IAL, 2008 - 3664/IV method). Aliquots of pulp added with 20% sulfuric acid solution, 10% potassium iodide solution and 1% starch indicator solution were titrated in triplicate with potassium iodate solution (0.2 mM) to blue coloration.
Determination of kinetic parameters
The Bigelow model (Singh and Heldman, 2013) was applied to determine the kinetic parameters: decimal reduction time, D (hour) and thermal resistance constant, z (°C), for color and AA degradation, and loss of consistency, in 29 °Brix tomato concentrate pulp. The kinetic parameters were determined after the data analysis of the experiment planning: 60 and 70°C for 12, 24, 46, 48, 60, 72, 84 and 96 min; and 80°C for 6, 12, 24, 30, 36 and 48 min.
Samples were packed in 120 ml screw cap polystyrene bottles which were submitted to thermal treatment, immersed in a

thermostatic Lauda® bath, kept closed to minimize temperature fluctuations. The temperature in the center of the vials was measured with a thermometer and at each set time interval; the vials were transferred to a cold thermostatic bath set at 2°C in order to interrupt the heat treatment. As suggested by Barreiro et al. (1997), the samples were preheated in the microwave to accelerate the heat transfer, thus reducing the come up time.
Instrumental color analysis This analysis was carried out in a colorimeter (Hunterlab® model LabScan XE), with a 64 mm quartz cuvette (Hunterlab, 2015). The apparatus was calibrated for reflectance measurement (RSIN), CIELAB color system (L*, a*, and b*), C-type illuminant and 2° observer angle, according to the equipment manual, to obtain the colorimetric coordinates L*, a* and b*. The equipment was also calibrated with standard black and white tiles prior to measurements. Checks with red standard tile (L* = 26.18; a* = 27.3 and b* = 12.7) were performed periodically. The Concentrated Tomato Paste Score (TPS) was calculated according to Equation (1):
(1) At each reading, the cuvette was filled with the same sample volume and an opaque black cover was placed over it to prevent interference of the ambient light in the measurement.
Consistency and shear stress measurements After the heat treatment, the samples were cooled down for consistency and shear stress measurements. Consistency test was carried out at 25°C according to Garcia and Barrett (2005), using a Marconi® Bostwick device MA441, 75 mL, 0.5 cm scale intervals. The concentration of the tomato pulp samples was standardized by dilution to 12% NTSS (natural tomato soluble solids) or 12 °Brix with deionized water.
Shear stress measurement was carried out by back extrusion using the Universal Testing Machine, model TA XT Plus, Stable Micro Systems. In the back-extrusion test, a piston is forced through the sample and the product is expelled around the disc, and the maximum force (gf) is measured.
The readings were made directly in the polystyrene pot, inner 40 mm in diameter, and 70 mm in height, where the samples were before conditioned for the heat treatment. The geometry (probe) used for the back-extrusion test was the 35 mm in diameter acrylic disc, code A/BE-d35.
Correlating theoretical analysis and real process conditions
The kinetic parameters of color and AA degradation were correlated to the industrial tomato processing conditions observing time and temperature parameters from the tomato reception to storage in the yard or shelves, up to industrial steps, taking into account how much each stage influenced these characteristics.
Equation 2 represents the linear form of the first order model, where (Co) and final (Ct) represent respectively the initial and final concentration of the analyzed parameter after a process time t (hour), based on its D (hour) value:
(2)
Munhoz and Schmidt 217 Knowing the thermal resistance constant z, D values can be calculated for other temperatures T (°C) (Equation 3):
(3)
From D (hours) values, the dimensionless degradation rate (DR) at each step of the concentrated tomato pulp process was calculated (Equation 4):
(4)
Where, DR represents the degradation rate; Tp (°C) is the step process temperature; TR (°C) is the average temperature of the kinetics study, 70°C, adopted as the reference temperature.
The integration of DR over time allows us to obtain an equivalent process, called F (hours), at the reference temperature (70°C). In practice, the integration took into account the processing time Δt (hours) and its DR at the corresponding Tp along i to n process steps (Equation 5):
(5)
Then it is possible to determine the process Effect, E (%) in each step (Equations 6):
(6)
Result analysis
All analyses were performed in triplicate, and the mean result and its respective standard deviation were considered. When applicable, the results of the determinations were statistically evaluated using ANOVA Variance Analysis and Tukey's Test at a significance level of 5% for the comparison between means.
RESULTS AND DISCUSSION The physical-chemical characterization of the aseptic pulp used in the kinetic study showed 67.35±0.23% wet basis moisture, 29.64±0.10 °Brix; pH of 4.31±0.01; 2.11±0.06% citric acid; and 75.3±0.9 mg of AA/100 g. Xu et al. (2018) found similar results (55.9±0.05 mg of AA/100 g) to high temperature short time 21.6 °Brix processed tomato pulp.
The come up time of the samples in the microwave was of 5 min to reach 60°C; 7.5 min to reach 70°C, and 9.5 min to reach 80°C and may be considered negligible in relation to the applied heat treatments. Kinetics of ascorbic acid (AA) degradation The data obtained from the degradation of AA in the
𝑇𝑃𝑆 = −40.926 + 1.061𝑎∗ + 9.473𝑏∗ − 0.346𝑏∗2
log 𝐶𝑡 = log 𝐶0 −𝑡
𝐷
log 𝐷2 = log 𝐷1 −(𝑇2−𝑇1)
𝑧
𝐷𝑅 = 10(𝑇𝑝−𝑇𝑅 )
𝑧
𝐹 = DR𝑖∆𝑡𝑖𝑛𝑖
𝐸 % = 1−𝐶𝑡
𝐶0 100% = 1− 10
−𝐹𝑇𝐷𝑇 ∗ 100%

218 Afr. J. Food Sci.
Table 1. Concentrations of AA during heating at different temperatures, and respective kinetic parameters calculated by the Bigelow’s model. Values expressed as average ± standard deviation.
Time (h) AA (mg/100 g)
60°C 70°C 80°C
0 75.3±0.9 75.3±0.9 75.3±0.9
6 - - 45.9±1.0
12 53.8±1.1 46.1±1.6 33.4±0.5
24 51.7±4.4 33.2±1.0 21.9±1.8
30 - - 23.5±1.1
36 42.4±1.4 27.4±1.1 20.8±1.4
48 38.1±1.5 22.0±0.7 24.0±3.4
60 37.2±0.4 20.2±0.7 -
72 33.6±1.9 19.4±1.0 -
84 26.7±0.9 19.3±1.2 -
96 21.2±1.2 16.1±0.8 -
D (h) 203.22 163.18 97.65
z °C 62.84
R2 0.9499
three studied temperatures (Table 1) were analyzed based on the reaction order and then the kinetic parameters were calculated by the Bigelow model.
In general, the values of D and z obtained in the present study demonstrate thermal dependence within the ranges reported in the literature for similar products. The AA concentration decreased with heating and 50% of this reduction occurred after 48 min at 60°C, 20 min at 70°C and 10 min at 80°C. The determination coefficients (R
2) suggest that the first order model satisfactorily
describes the degradation reaction of AA in tomato pulp only at 60°C. The z values obtained are in accordance to other published kinetic parameters, as 64°C for guava pure and 36.7°C for cupuaçu nectar, among other cited by Ling et al. (2015).
Many authors have mentioned that most of the reactions studied in foods are characterized as zero order or first order kinetics; and the most frequent first-order reactions in foods are microbial development, degradation of vitamins and pigments during processing and storage, enzymatic inactivation and destruction of toxins by heating. Sarkar et al. (2015) reported a deleterious effect of the temperature when studying storage conditions on the nutritional quality of tomato pulp. Sonar et al. (2019) showed the combined effect of thermal treatment and oxygen transmission rate on quality and nutritional attributes of carrot puree processed in pouches, obtaining zero and/or first-order kinetics for AA degradation, depending on the permeability of the pouch.
For Ruiz et al. (2018), the kinetic modelling of AA in a model solution at different temperatures and oxygen contents showed that AA degradation increased with temperature and oxygen concentration; a kinetic model based on first order reactions was developed to simulate the AA degradation as a function of temperature and concentration in dissolved oxygen.
For Robertson and Samaniego (1986), the first-order reaction is valid only when oxygen is present in abundance (aerobic degradation) or when it is completely absent from the medium. When oxygen is contained in limited concentrations, as in the present study in which the air incorporation in the sample was not controlled, the authors report that the second order kinetics may represent that the reaction depends on both the oxygen concentration and the AA.
As the focus of this work was to compare the changes of three important quality parameters during processing and storage, the anaerobic degradation of AA best represents the behavior of the tomato pulp during the storage period after concentration and aseptic packaging. For this reason, the first order model was selected for this work. The first order model was also used to describe the kinetics of AA degradation in pasteurized mango juice (Wibowo et al., 2015), in lyophilized plums (Gabas et al., 2003), in concentrated citrus juices (Burdurlu et al., 2006), in ketchup (Rajchl et al., 2010), in tomato extract (Pedro, 2009), and in concentrated tomato juice during heating and drying (Qiu et al., 2018).
For comparison purposes, the kinetic results of
Munhoz and Schmidt 219
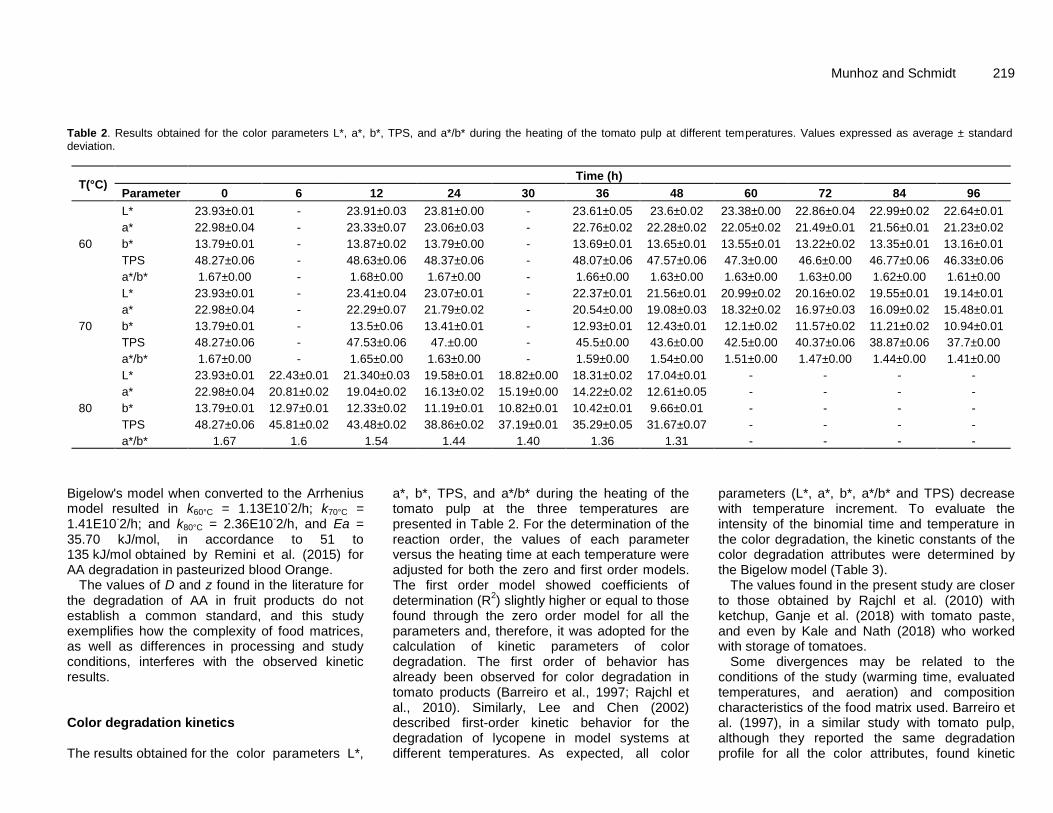
Table 2. Results obtained for the color parameters L*, a*, b*, TPS, and a*/b* during the heating of the tomato pulp at different temperatures. Values expressed as average ± standard deviation.
T(°C) Time (h)
Parameter 0 6 12 24 30 36 48 60 72 84 96
60
L* 23.93±0.01 - 23.91±0.03 23.81±0.00 - 23.61±0.05 23.6±0.02 23.38±0.00 22.86±0.04 22.99±0.02 22.64±0.01
a* 22.98±0.04 - 23.33±0.07 23.06±0.03 - 22.76±0.02 22.28±0.02 22.05±0.02 21.49±0.01 21.56±0.01 21.23±0.02
b* 13.79±0.01 - 13.87±0.02 13.79±0.00 - 13.69±0.01 13.65±0.01 13.55±0.01 13.22±0.02 13.35±0.01 13.16±0.01
TPS 48.27±0.06 - 48.63±0.06 48.37±0.06 - 48.07±0.06 47.57±0.06 47.3±0.00 46.6±0.00 46.77±0.06 46.33±0.06
a*/b* 1.67±0.00 - 1.68±0.00 1.67±0.00 - 1.66±0.00 1.63±0.00 1.63±0.00 1.63±0.00 1.62±0.00 1.61±0.00
70
L* 23.93±0.01 - 23.41±0.04 23.07±0.01 - 22.37±0.01 21.56±0.01 20.99±0.02 20.16±0.02 19.55±0.01 19.14±0.01
a* 22.98±0.04 - 22.29±0.07 21.79±0.02 - 20.54±0.00 19.08±0.03 18.32±0.02 16.97±0.03 16.09±0.02 15.48±0.01
b* 13.79±0.01 - 13.5±0.06 13.41±0.01 - 12.93±0.01 12.43±0.01 12.1±0.02 11.57±0.02 11.21±0.02 10.94±0.01
TPS 48.27±0.06 - 47.53±0.06 47.±0.00 - 45.5±0.00 43.6±0.00 42.5±0.00 40.37±0.06 38.87±0.06 37.7±0.00
a*/b* 1.67±0.00 - 1.65±0.00 1.63±0.00 - 1.59±0.00 1.54±0.00 1.51±0.00 1.47±0.00 1.44±0.00 1.41±0.00
80
L* 23.93±0.01 22.43±0.01 21.340±0.03 19.58±0.01 18.82±0.00 18.31±0.02 17.04±0.01 - - - -
a* 22.98±0.04 20.81±0.02 19.04±0.02 16.13±0.02 15.19±0.00 14.22±0.02 12.61±0.05 - - - -
b* 13.79±0.01 12.97±0.01 12.33±0.02 11.19±0.01 10.82±0.01 10.42±0.01 9.66±0.01 - - - -
TPS 48.27±0.06 45.81±0.02 43.48±0.02 38.86±0.02 37.19±0.01 35.29±0.05 31.67±0.07 - - - -
a*/b* 1.67 1.6 1.54 1.44 1.40 1.36 1.31 - - - -
Bigelow's model when converted to the Arrhenius model resulted in k60°C = 1.13E10
-2/h; k70°C =
1.41E10-2/h; and k80°C = 2.36E10
-2/h, and Ea =
35.70 kJ/mol, in accordance to 51 to 135 kJ/mol obtained by Remini et al. (2015) for AA degradation in pasteurized blood Orange.
The values of D and z found in the literature for the degradation of AA in fruit products do not establish a common standard, and this study exemplifies how the complexity of food matrices, as well as differences in processing and study conditions, interferes with the observed kinetic results. Color degradation kinetics The results obtained for the color parameters L*,
a*, b*, TPS, and a*/b* during the heating of the tomato pulp at the three temperatures are presented in Table 2. For the determination of the reaction order, the values of each parameter versus the heating time at each temperature were adjusted for both the zero and first order models. The first order model showed coefficients of determination (R
2) slightly higher or equal to those
found through the zero order model for all the parameters and, therefore, it was adopted for the calculation of kinetic parameters of color degradation. The first order of behavior has already been observed for color degradation in tomato products (Barreiro et al., 1997; Rajchl et al., 2010). Similarly, Lee and Chen (2002) described first-order kinetic behavior for the degradation of lycopene in model systems at different temperatures. As expected, all color
parameters (L*, a*, b*, a*/b* and TPS) decrease with temperature increment. To evaluate the intensity of the binomial time and temperature in the color degradation, the kinetic constants of the color degradation attributes were determined by the Bigelow model (Table 3).
The values found in the present study are closer to those obtained by Rajchl et al. (2010) with ketchup, Ganje et al. (2018) with tomato paste, and even by Kale and Nath (2018) who worked with storage of tomatoes.
Some divergences may be related to the conditions of the study (warming time, evaluated temperatures, and aeration) and composition characteristics of the food matrix used. Barreiro et al. (1997), in a similar study with tomato pulp, although they reported the same degradation profile for all the color attributes, found kinetic

220 Afr. J. Food Sci.
Table 3. Kinetic parameters for color degradation (L*, a*, b*, TPS, and a*/b*) in concentrated tomato pulp, and R2 for z determination.
Parameter D60 °C (h) D70 °C (h) D80 °C (h) z (°C) R2
L* 3850 939 331 18.8 0.9925
a* 2284 523 184 18.3 0.9904
b* 4177 900 184 14.8 0.9999
TPS 4463 844 263 16.3 0.9897
a*/b* 5037 1248 446 19.0 0.9924
Table 4. Results of the maximum force, measured by back extrusion, after heat treatment at 60 and 70 °C for different time intervals. Values expressed as mean ± standard deviation.
Time (h) The maximum force (gf)
*
60 °C 70 °C
0 1070±62a 1070±62
a
12 1000±13ab
1050±40a
24 1029±48ab
1014±22ab
36 1002±38ab
835±27c
48 900±17b 845±20
c
60 976±17ab
915±34bc
72 925±55b 925±34
bc
84 941±20ab
923±21bc
96 929±25b 927±8
bc
*Values in the same column with the same letter do not differ significantly from each other at the significance level of 5% by the Tukey test.
parameters demonstrating greater color sensitivity to temperature. Consistency and shear stress measurements Consistency analysis using the Bostwick device showed no significant variation between the measurements carried out at 60°C (4.0±0.1 cm/30s) and 70°C (4.1±0.1 cm/30 s). At 80°C, the degradation of the consistency was observed only after 6 h of heating. However, there was no statistically significant difference between samples heated for 6 to 48 h (from 4.3 to 4.5 cm/30 s). In this way, it can be inferred that in a closed environment and admitting insignificant moisture loss, the heat treatment temperature exerts a very small effect on the consistency of the concentrated tomato pulp.
For the shear stress measurement only the results of the maximum force for samples submitted to treatment at 60 and 70°C were presented, because at 80°C the polystyrene flasks deformed, preventing the comparison of the readings by the initial height difference between
the (Table 4). The firmness degradation was observed after 48 h of
heating at 60°C and after 36 h of heating at 70°C. However, the samples collected in the following times, until the end of the study, did not present statistical difference. The shear stress measured by back extrusion showed similar behavior to that observed for the Bostwick consistency, showing little influence of the temperature. It is possible to affirm that the Bostwick method is satisfactory for the evaluation of consistency of tomato pulp. Although not very precise, this simple and low-cost equipment was able to demonstrate results comparable to those obtained in the back extrusion system, a more precise and sophisticated equipment. Storage correlation Based on the z values of each attribute measured, color showed to be more temperature dependent than AA. In this way, greater color degradation is expected during thermal processing, when higher temperatures are

Munhoz and Schmidt 221
Table 5. Color (TPS) extracted from the analytical reports in industrial concentrated tomato pulp production.
Parameter Crop A - 27 months Crop B - 16 months Crop C - 3 months
Initial* Final
** % Initial Final % Initial Final %
Color (TPS) 46.9 18.7±0.0 -60.1 46.2 41.5±0.0 -10.2 47.3 48.3±0.1 +2.1
*Average value referring to the factory sampling plan for quality assurance of the concentrated tomato pulp. **Measured values.
Figure 1. Thermal map of the productive process of concentrated tomato pulp, where A = harvest, transport, reception, classification, washing and selection; B = crushing and enzymatic inactivation; C = refining and storage; D1, D2 and D3 concentrations of first, second and third effects, respectively; E = sterilization; F = cooling; G = container; H = storage.
achieved, with some loss along with the storage. With respect to AA, the reverse is expected, that is a higher resistance to processing and a more time-dependent degradation, throughout the store.
Kinetic models are restricted to variations within the studied temperature range. The extrapolation of the results obtained for temperatures outside the studied range (60 to 80°C) is commonly used in the food industry in accelerated stability tests, with the objective of reducing the time required to determine the product shelf life. The results obtained must be interpreted with caution and, where possible, validated under the actual storage conditions.
Table 5 shows the TPS results extracted from the analytical reports issued in industrial concentrated pulp production. For AA content there is no data available since this parameter does not usually take part in the manufacturer's routine controls.
A 60 and 10% drop were observed in the TPS color
measurements, respectively after 27 and 16 months storage. Considering a storage temperature of 28.7°C, based on the annual average of the daily maximum temperatures of the factory (Agrometeorological Information Center), it is possible to mathematically predict TPS color drop during storage. Using the D70°C for TPS degradation (844 h) and z = 16.3°C, equation 3 shows D28.7°C = 288460 h. Them, using equation 1, after 27 months (19440 h), 16 months (11520 h) and 3 months (2160 h) of storage, the TPS value should be respectively 40.2 (crop A), 42.1 (crop B) and 46.5 (crop C). With the exception of Crop A, the other predicted values were satisfactory.
Figure 1 shows the thermal map of an industrial process of concentrated tomato pulp, built from industrial temperatures and processing times. The time in each process step may vary according to the flow of the lines, which in turn is regulated according to the classification of the tomato received (initial solids concentration, color,

222 Afr. J. Food Sci.
Table 6. Effect of the temperature of each stage of the processing of concentrated tomato pulp on the degradation of AA and TPS color.
Step AA Color TPS
T(°C) Δt(h) DR* F(h)** E(%)*** DR F(h) E(%)
Harvest 28.7 0 0.22 0.00 0.00 0.00 0.00 0.00
Field/factory transport 28.7 2 0.22 0.44 0.14 0.00 0.01 0.00
Receiving/Drainage 28.7 6 0.22 1.32 0.41 0.00 0.02 0.01
Sampling/Selection 28.7 18 0.22 3.96 1.22 0.00 0.05 0.02
Water transport, washing, selection 28.7 1 0.22 0.22 0.07 0.00 0.00 0.00
Crushing, enzymatic inactivation 77.5 0.08 1.32 0.11 0.20 2.88 0.23 0.43
Enzymatic inactivation (holding) 77.5 0.42 1.32 0.55 1.02 2.88 1.21 2.23
Refining 70.0 0.08 1.00 0.08 0.11 1.00 0.08 0.11
Storage of juice (tank) 70.0 1 1.00 1.00 1.40 1.00 1.00 1.40
3° effect Concentration 55.0 0.42 0.58 0.24 0.20 0.12 0.05 0.04
2° effect Concentration 75.0 0.42 1.20 0.50 0.85 2.03 0.85 1.43
1° effect Concentration 90.0 0.42 2.08 0.87 2.53 16.87 7.08 18.78
Flash Cooler Tank 85.0 0.13 1.73 0.23 0.55 8.32 1.08 2.61
Heating for sterilization 106.5 0.25 3.81 0.95 4.99 173.49 43.37 90.28
Sterilization Flash Cooler (holding) 106.5 0.13 3.81 0.50 2.63 173.49 22.55 70.25
Cooling and aseptic filling 36.5 0.25 0.29 0.07 0.03 0.01 0.00 0.00
Equilibrium at room temperature 28.7 0.50 0.22 0.11 0.03 0.00 0.00 0.00
Storage (24 months) 28.7 17280 0.22 3805 99.999 0.00 50.56 14.54
*DR = dimensionless rate of degradation (Equation 4). **F(h) = Equivalent process time (hours) at the adopted reference temperature of 70 °C (Equation 5). ***E(%) = Corresponding degradation Effect (%) for each phase of the process (Equation 6).
and consistency).
From the thermal map and kinetic parameters of AA and TPS degradation, the DR at each stage of processing of the concentrated tomato pulp (Equation 4) was calculated. Then, it was possible to compare how much the heat treatment at each stage of the process affected the quality. The integration of DR over time allowed to obtain equivalent processes in the reference temperature (Equation 5), or the F value (hours). Table 6 presents these results for AA and TPS color.
AA loss occurs almost exclusively during the storage period of the concentrated pulp due to its high z value (62.84 °C). Probably the decrease in vitamin C over time helps to explain the sharp drop in the industrial storage, according to results presented by the crop A industrial pulp (Table 6), because AA works as an antioxidant, preventing other alterations.
The TPS index used to classify the tomato pulp in terms of color also shows its dependence on the process parameters. Although the store has an important influence on color degradation, the intensity of the sterilization step is also relevant. Improvements in the sterilization stage would allow improvement in the TPS index, as better-conditioned storage for prolonged storage.
In order to minimize losses, different scenarios of sterilization and storage conditions for concentrated
tomato pulp can be simulated. In theory, the product would be conditioned in better storage conditions. A second planned change would be the optimization of the sterilization step, that is the heat treatment time/ temperature binomial, always considering the effectiveness in reducing microbial load. In this sense, considering the operation temperature range of the heat exchanger (104 to 108°C) and assuming 5 logarithmic cycles reductions of Bacillus coagulans spores, whose D121.1 °C = 0.0347 min and z = 10°C - mean value according to Peng et al. (2012) - equivalent process can be proposed.
Table 7 shows the effect of heating treatment and sterilization flash cooler, changed from 106.5 to 107.5°C, and storage temperature (24 and 12 months), changed from 28.7 to 20°C, on AA degradation and color TPS retention.
As noted, comparing Tables 6 and 7, changes in the sterilization temperature (from 106.5 to 107.5°C) were more significant for vitamin C retention, while the storage temperature (from 28.7 to 20.0°C) helped color retention. Conclusion The consistency was not significantly affected by the heat

Munhoz and Schmidt 223
Table 7. Simulation of different heating treatments and storage conditions.
Step AA Color TPS
T(°C) Δt(h) DR*
F(h)**
E(%)***
DR F(h) E(%)
Heating for sterilization 107.5 0.1986 3.95 0.78 4.3 199.81 39.68 89.06
Sterilization Flash Cooler (holding) 107.5 0.1033 3.95 0.41 2.3 199.81 20.64 68.36
Storage (24 months) 20 17280 0.16 2766 99.8 0.00 17.79 3.29
Storage (12 months) 20 8640 0.16 1383 95.6 0.00 7.40 1.66
*DR = dimensionless rate of degradation (Equation 4). **F(h) = Equivalent process time (hours) at the adopted reference temperature of 70 °C (Equation 5). ***E(%) = Corresponding degradation Effect (%) for each phase of the process (Equation 6).
treatment temperature and the Bostwick method (widely used in the industry) was satisfactory for this evaluation and quality control in tomato pulp. The Bostwick results were in practice comparable to the maximum force obtained by a back extrusion system.
The effect of temperature at each stage of the concentrated tomato pulp processing allows identifying the steps of sterilization and storage as those responsible for the greater part of the degradation of color and AA, respectively. Tomato industry must strictly control sterilization and increase the sun protection in the off-season in order to preserve AA and color, respectively, ensuring lower losses of sensorial quality without reducing flexibility, always prioritizing food safety CONFLICT OF INTERESTS The authors have not declared any conflict of interests. ACKNOWLEDGMENTS
The authors acknowledge The State University of Campinas for the installation and equipment used, and Cargill for samples and provided information. REFERENCES Association of Official Analytical Chemists (AOAC) (2010). Official
methods of Analysis. 18 ed. Washington DC USA. Barreiro JA, Milano M, Sandoval AJ (1997). Kinetics of Color Change of
Double Concentrated Tomato Paste During Thermal Treatment. Journal of Food Engineering 33:359-371.
Burdurlu HS, Koca N, Karadeniz F (2006). Degradation of vitamin C in citrus juice concentrates during storage. Journal of Food Engineering 74(2):211-216.
Buvé C, Kebede BT, Batselier CD, Carrillo C, Pham HTT, Hendrickx M, Grauwet T, Loey AV (2018). Kinetics of colour changes in pasteurized strawberry juice during storage. Journal of Food Engineering 216:42-51.
Camargo Filho WP, Camargo FP (2017). A quick review of the production and commercialization of the main vegetables in Brazil and the world from 1970 to 2015. Horticultura Brasileira 35:160-166.
Gabas AL, Telis-Romero J, Menegalli FC (2003). Cinética de
Degradação do Ácido Ascórbico em Ameixas Liofilizadas. Ciência e Tecnologia de Alimentos 23(Supl):66-70.
Ganje M, Jafari, SM, Farzaneh V, Malekjani N (2018). Kinetics modeling of color deterioration during thermal processing of tomato paste with the use of response surface methodology. Heat and Mass Transfer 54(12):3663-3671.
Hunterlab (2015): Tomato Scores. Application Note AN 1014.00. Available at: http://www.hunterlab.com/.
Kale SJ, Nath P (2018). Kinetics of quality changes in tomatoes stored in evaporative cooled room in hot region. International Journal of Current Microbiology and Applied Sciences 7(6):1104-1112.
Koh E, Charoenprasert S, Mitchell AE (2011). Effects of industrial tomato paste processing on ascorbic acid, flavonoids and carotenoids and their stability over one-year storage. Journal of the Science of Food and Agriculture 92(1):23-28.
Instituto Adolfo Lutz (IAL) (2008). Normas Analíticas do Instituto Adolfo Lutz: v. 1, Métodos Químicos e Físicos para Análise de Alimentos, 4. ed. São Paulo, SP: Instituto Adolfo Lutz. pp. 649-686.
Lee MT, Chen BH (2002). Stability of lycopene during heating and illumination in a model system. Food Chemistry 78(4):425-432.
Garcia E, Barrett DM (2005). Evaluation of processing tomatoes from two consecutive growing seasons: quality attributes, peelability and yield. Journal of Food Processing and Preservation 30:20-36.
Li H, Zhang J, Wang Y, Li J, Yang Y, Liu X (2018). The Effects of Storage Conditions on Lycopene Content and Color of Tomato Hot Pot Sauce. International Journal of Analytical Chemistry. Available at https://doi.org/10.1155/2018/1273907.
Ling B, Tang T, Kong F, Mitcham EJ, Wang S (2015). Kinetics of Food Quality Changes During Thermal Processing: a Review. Food Bioprocess Technology 8:343-358.
Motamedzadegan A, Tabarestani HS (2011). Tomato Processing, Quality, and Nutrition In: SINHA, Nirmal K. (Ed.). Handbook of Vegetables and Vegetables Processing. Oxford, UK: Blackwell Publishing Ltd. 37:739-757.
Nkhata SG, Ayua EO (2018). Quality attributes of homemade tomato sauce stored at different temperatures. African Journal of Food Science 12(5):97-103.
Ochida CO, Itodo AU, Nwanganga PA (2019). A Review on Postharvest Storage Processing and Preservation of Tomatoes (Lycopersicon esculentum Mill). Asian Food Science Journal 6(2):1-10.
Pedro AMK (2009). Desenvolvimento do método multivariado acelerado para determinação do prazo de validade de produtos unindo quimiometria e cinética química. Tese [Doutorado]. Instituto de Química da Universidade Estadual de Campinas, (Unicamp).
Page D, Labadie C, Reling P, Bott R, Garcia C, Gaillard C, Fourmaux B, Bernoud-Hubac N, Goupy P, Georgé S, Caris-Veyrat C (2019). Increased diffusivity of lycopene in hot break vs. cold break purees may be due to bioconversion of associated phospholipids rather than differential destruction of fruit tissues or cell structures. Food Chemistry 274:500-509.
Peleg M, Normand MD, Corradini MG (2018). A New Look at Kinetics in Relation to Food Storage. Annual Review of Food Science and Technology 8:135-153.
224 Afr. J. Food Sci. Peng J, Mah JV, Somavat R, Mohamed H, Sastry S, Tang J (2012).
Thermal inactivation kinetics of Bacillus coagulans spores in tomato juice. Journal of Food Protection 75(7):1236-1242
Qiu J, Vuist JE, Boom RM, Schutyser MAI (2018). Formation and degradation kinetics of organic acids during heating and drying of concentrated tomato juice. Food Science and Technology 87:112-121.
Qiu J, Acharya P, Jacobs DM, Boom RM, Schutyser MAI (2019). A systematic analysis on tomato powder quality prepared by four conductive drying technologies. Innovative Food Science and Emerging Technologies 54:103-112.
Rajchl A et al. (2010). Stability of nutritionally important compounds and shelf life prediction of tomato ketchup. Journal of Food Engineering 99(4):465-470.
Remini H, Mertz C, Belbahi A, Achir N, Dornier M, Madani K (2015). Degradation kinetic modelling of ascorbic acid and colour intensity in pasteurised blood orange juice during storage. Food Chemistry 173:665-673.
Robertson GL, Samaniego CML (1986). Effect of initial dissolved oxygen levels on the degradation of ascorbic acid and the browning of lemon juice during storage. Journal of Food Science 51(1):184-187.
Rssweather (2019). World Weather Forecasts by RSS. Available at: http://www.rssweather.com.
Ruiz BG, Roux S, Courtois F, Bonazzi C (2018). Kinetic modelling of ascorbic and dehydroascorbic acids concentrations in a model solution at different temperatures and oxygen contents. Food Research International 106:901-908.
Sánchez MC, Concepción V, Críspulo G, Ascensión C, Antonio L (2002). Influence of processing on the rheological properties of tomato paste. Journal of the Science of Food and Agriculture 82(9):990-997.
Sarkar S, Roy DKD, Alomoni, Siddik MdAB, Das K, Rahman MdJ (2015). Effect of Chemical Preservatives and Storage Conditions on the Nutritional Quality of Tomato Pulp. American Journal of Food and Nutrition 3(4):90-100.
Shi J, Maguer ML (2000). Lycopene in Tomatoes: Chemical and Physical Properties Affected by Food Processing, Critical Reviews in Food Science and Nutrition 40(1):1-42.
Singh RP, Heldman D (2013). Introduction to Food Engineering. 5
th
Edition. Academic Press. eBook ISBN: 9780124016750. Sonar CR, Paccola CS, Al-Ghamdi S, Rasco B, Tang J, Sablani SS
(2019). Stability of color, β-carotene, and ascorbic acid in thermally pasteurized carrot puree to the storage temperature and gas barrier properties of selected packaging films. Journal of Food Process Engineering 13074:1-12.
Tchuenchieu A, Ngang JJE, Servais M, Dermience M, Kamdem SS, Etoa FX, Sindic M (2018). Effect of low thermal pasteurization in combination with carvacrol on color, antioxidant capacity, phenolic and vitamin C contents of fruit juices. Food Science Nutrition 6:736-746.
Wibowo S, Grauwet T, Gedefa GB, Hendrickx M, Loey AV (2015). Quality changes of pasteurised mango juice during storage. Part II: Kinetic modelling of the shelf-life markers. Food Research International 78:410-423.
Xu Q, Adyatni I, Reuhs B (2018). Effects of processing methods on the quality of tomatoes products. Food Nutrition Sciences 9:86-98.