Design of ceramic paste formulations for co-extrusion
8
Newcastle University ePrints Powell J, Assabumrungrat S, Blackburn S. Design of ceramic paste formulations for co-extrusion. Powder Technology 2013, 245, 21-27. Copyright: Copyright © 2013 The Authors. Published by Elsevier B.V. This is an open-access article distributed under the terms of the Creative Commons Attribution License, which permits unrestricted use, distribution, and reproduction in any medium, provided the original author and source are credited. Link to published article: http://dx.doi.org/10.1016/j.powtec.2013.04.017 Date deposited: 29 th November 2013 This work is licensed under a Creative Commons Attribution 3.0 Unported License ePrints – Newcastle University ePrints http://eprint.ncl.ac.uk
-
Upload
khangminh22 -
Category
Documents
-
view
4 -
download
0
Transcript of Design of ceramic paste formulations for co-extrusion
Newcastle University ePrints
Powell J, Assabumrungrat S, Blackburn S. Design of ceramic paste
formulations for co-extrusion. Powder Technology 2013, 245, 21-27.
Copyright:
Copyright © 2013 The Authors. Published by Elsevier B.V.
This is an open-access article distributed under the terms of the Creative Commons Attribution License,
which permits unrestricted use, distribution, and reproduction in any medium, provided the original
author and source are credited.
Link to published article:
http://dx.doi.org/10.1016/j.powtec.2013.04.017
Date deposited: 29th November 2013
This work is licensed under a Creative Commons Attribution 3.0 Unported License
ePrints – Newcastle University ePrints
http://eprint.ncl.ac.uk

Powder Technology 245 (2013) 21–27
Contents lists available at SciVerse ScienceDirect
Powder Technology
j ourna l homepage: www.e lsev ie r .com/ locate /powtec
Design of ceramic paste formulations for co-extrusion☆
Jonathan Powell a,⁎, Suttichai Assabumrungrat b, Stuart Blackburn c
a School of Chemical Engineering and Advanced Materials, Newcastle University, UKb Department of Chemical Engineering, Faculty of Engineering, Chulalongkorn University, Bangkok 10330, Thailandc School of Chemical Engineering, The University of Birmingham, UK
☆ This is an open-access article distributed under the tAttribution License, which permits unrestricted use, disany medium, provided the original author and source a⁎ Corresponding author. Tel.: +44 65 96255366.
E-mail address: [email protected] (J. Powell).
0032-5910/$ – see front matter © 2013 The Authors. Puhttp://dx.doi.org/10.1016/j.powtec.2013.04.017
a b s t r a c t
a r t i c l e i n f oArticle history:Received 15 November 2012Received in revised form 1 April 2013Accepted 15 April 2013Available online 22 April 2013
Keywords:Co-extrusionPasteSlip flow
The rheological and flow behaviour of ceramic pastes with varying solids loadings (solids volume fraction)has been studied. The pastes were shown to exhibit power law slip flow at both low and high solids loadings,with no slip yield stress. As would be expected, the extrusion rheometry data showed an increase in the dieentry extrusion pressures with solids loading, in a trend similar to that of the Dougherty–Krieger equation.The die land flow however was shown to exhibit, only within a narrow range of solids loadings of approxi-mately 53 to 56 v/v %, a trend in the die land extrusion pressure that was relatively independent of solidsloading. Outside of this range the die land extrusion pressures increased significantly with solids loading ina trend similar to that of the die entry pressures. Using the Mooney analysis method, this was shown to bedue to the development of slip flowwith solids loading, as is consistent with other studies into the flow behaviourof concentrated suspensions. The slip velocitywas also shown to be related to thewall shear stress byway of powerlaw relationship also consistent with results from previous studies of concentrated suspensions using shearthinning liquid phases. The results presented in this report show that by using paste formulations that lie withinsaid range of solids loadings, improved plug flow can be achieved in the die land without a significant change inthe die land extrusion pressure at a given flow rate. This offers an advantage in the co-extrusion of ceramicproducts such as micro-tubular solid oxide fuel cells, as a uniform velocity profile results in improved control ofthe laminate structure.
© 2013 The Authors. Published by Elsevier B.V. All rights reserved.
1. Introduction
The co-extrusion of multiple pastes into a single extrudate requiresthe fine tuning and unification of the paste rheologies in order to preventthe formation of flow defects in a continuous or semi-continuous extru-sion process. This requires the formulation of individual pastes with con-sideration of effects due to particle size, size distribution, morphologyand surface chemistry, as well as pore size, distribution and shape. Previ-ous work by Liang and Blackburn [1,2], Zhang et al. [3], Chen et al. [4],Powell and Blackburn [5,6] and others have looked at the co-extrusionof multi-layered tubes. The tubes were relatively large, with layer thick-nesses being in the order of 1 mm, a limitationwhich could be overcomeby a change in design of the co-extrusion process and equipment. Someof these authors also reported the formation of delamination defects,which again can be overcome by improved design of the co-extruder[5,6]. This paper follows on from two previous publications by thesame authors [5,6] which presented the results of an investigation into
erms of the Creative Commonstribution, and reproduction inre credited.
blished by Elsevier B.V. All rights re
the manufacture of multi-layered ceramic micro-tubes that could beused in the manufacture of solid oxide fuel cells.
When co-extruding pastes into laminate structures, it is preferable toachieve a uniform velocity profile across the co-extrudate, such that thevelocities of the laminate layers are equal. By obtaining a uniformvelocityprofile which is relatively independent of the extrudate velocity, it ispossible to have a co-extrusion process where the laminate structure ofthe co-extrudate is well controlled and relatively independent of theextrudate velocity and time. Uniformvelocity profiles are achieved by de-signing the paste rheology to include a yield stress and slip or apparentslip at the wall.
The die land flow of ceramic pastes has been shown to be influencedby apparent slip at the wall [7–11], which in turn is influenced by thewall shear stress and solids loading of the paste. Unlike true wall slipwhere the velocity of the fluid at the wall is greater than zero, in pasteflow the exclusion or depletion of solid particles from the wall resultsin the formation of a lubricating layer where this liquid itself has a diewall velocity of zero.
For extruding ‘hard’ sphere pastes with a high Peclet number(Pe ≫ 100) [12] slip occurs at low solids loadings (~45%) [13] aswell as high solids loadings (>50%) [14], but with increasing solidsloading, slip flow becomes increasingly dominant [12,13]. Ballesta et al.have shown that for hard sphere colloidal suspensions, slip occurs forboth low and high concentration suspensions but is shown to be much
served.

Table 2Composition of solid constituents as percentage volume and mass for z-blade and twinroll mill mixed pastes containing (26.97 ± 0.05) × 10−6 m3 of binder.
22 J. Powell et al. / Powder Technology 245 (2013) 21–27
more significant for pasteswith high solids loadingswhereby the powderparticles arrange themselves into a glass like structure [15].
For colloidal suspensions, with increasing Peclet number the deple-tion of solids from the wall and hence slip become increasingly impor-tant due to hydrodynamic effects [16]. For colloidal suspensions withlow Peclet numbers where Brownian motion has a more significantrole, slip has been shown to not take place at low solids loadings [17]as result of Brownian motion that hinders depletion of the solids fromthe die wall. For high solids loadings however, the particles crowd andlock in place reducing the extent to which the particle Brownianmotiondisturbs the slip layer. The transition to a solid like rheology where par-ticles are locked together is therefore associated with an increase in slipflow [12].
This paper is part of studywhich investigated the influence of variousformulation and processing variables on paste rheology, with the aim ofunifying the rheology of 6 pastes. These variables included powder com-position (three components NiO, YSZ and C), powder packing density,binder chemistry (water or cyclohexanone based), binder volume con-tent in the paste and paste mixingmethod. Pastesmade under these dif-fering conditions and formulations were tested extrusion rheometry.This paper focusses on the effect of solids loading on the paste rheologyand extrusion pressures, where the Benbow–Bridgwater model [18] aswell as the Mooney analysis method is used to analyse the flow behav-iour of pastes. Results presented include those from pastes mixed usingtwo different mixing methods. The purpose of this is due to a limitationof the twin roll mill which only allows pastes with a narrow range ofsolids loadings to mixed, but also provides the benefit of emphasisingthat the observed trend in paste rheology with solids loading was inde-pendent on the mixing history of the pastes.
2. Materials
The ceramic pastes used for the rheological studies reported in thispaper were made using 8 mol% yttria stabilised zirconia powder (YSZ)as the solid phase, HSY8 (Daiichi Kigenso Kagaku Kogyo Co., Japan),with a mean particle size of 0.5 μm, which is used to fabricate solidoxide fuel cell electrolytes. For the liquid phase of the paste, a proprietarybinder system was used (Functional Materials Group, University ofBirmingham, UK). This binder system is highly viscous in order to pre-vent phase migration during the extrusion process and to improve thestability of the paste. The viscosity wasmeasured using a TA instrumentsAR500 rotational rheometer with a cone and plate geometry and wasfound to have a shear viscosity of 90 Pa.s at a shear rate of 2 s−1. Theconstituents of the binder phase are provided in Table 1. Further detailsregarding the constituents cannot be provided as this is a proprietaryformulation;
3. Methods
3.1. Paste Preparation
Prior tomixing the YSZ powder was dried in an oven at 120 °C over-night and stored in a desiccator to be cooled to room temperature. Forboth the twin roll mixing and the z-blade mixing, all the powders,which included the oxide, the stearic acid and the polyvinyl butyral,were dry mixed prior to adding the liquids.
Table 1Binder formulation.
Constituents Mass (g)
Cyclohexanone 25.50Polyvinyl butyral 22.50Stearic acid 0.45Dibutyl phthalate 0.90
The density of the bindermade according to the formulation given inTable 1 was measured using a constant volume pycnometer (Accupyc1330, Micromeritics, UK) and was found to be 1835 kg.m−3. This indi-cates that the constituents, PVB, DBP and stearic acid dissolve into thecylcohexanonewith an insignificant increase in volume of the cyclohex-anone—where the density of the binder, calculated based upon the as-sumption there is no volume change in the cyclohexanone with theaddition of the other components, is 1840 kg.m−3 — therefore the vol-ume of the binder added to each paste was taken as the exact volumeaddition of cyclohexanone.
The volume fraction of solids in the pastes produced using thetwin roll mill and z-blade mixer are provided in Table 2.
For the purpose of checking the liquid volume fraction of thepastes after mixing, the volume content of two twin mill rolled pastesnot containing dibutyl phthalate and with solids loadings of 52.10%and 55.40% were checked by measuring the change in mass beforeand after drying over night at 120 °C. The calculated volume fractionswere in agreement with the volume measured into the mixturewhich had an associated estimated error of ± 50 mm3.
3.1.1. Twin roll millingThe twin roll milled pastes were mixed using a Bra bender
Polymix, connected to a refrigeration unit for temperature control ofthe rollers. The rollers were kept at a temperature of 15 °C and soprior to the addition of material to the rollers condensation was re-movedwith a long fibre cloth (long fibres were used in order to preventcontamination of the pastewithfibres). The slow roller rotated at a fixedfrequency of 27 min−1 and both rollers have a diameter of 50 mm.
The twin rollmilled pastes,whichweremade of the solid YSZ powderand the liquid binder, were made with solids volume fractions (solidsloadings) of 0.522, 0.525, 0.535, 0.545 and 0.554. The values 0.522 and0.554 represent the range of solids loadings that could be made on thetwin roll mills. At higher solids loadings the paste became brittle andno longer adhered to the rollers. At lower solids loadings the pastewould adhere to both rollers rather than to the roller that rotates at aslightly higher rate, as intended, and would also fail to form a sheet ofpaste.
The material was mixed for a total of 12 min and added graduallyduring the first 5 min, ensuring that for each addition of material, themixture was well homogenised. During this period of incrementallyadding and mixing the paste, the rollers spacing was incrementallyincreased from 1 to 4 mm. Having added the complete mixture, thepaste was repeatedly passed through the mixer, not allowing thepaste to adhere to the rollers, with the rollers set at a spacing of0.1 mm, to ensure all powder agglomerates were dispersed and thepaste well homogenised.
3.1.2. z-blade mixingFor the purposes of consistency in the experimental method the
powders and liquids were premixed as previously described andthis mixture was then added to the z-blade mixer for a total of 4.5 h
HSY8 mass (g) % w/w of solids HSY8 vol (cm3)
z-blade 88.97 64.32 14.58175.38 78.04 28.75205.16 80.61 33.63211.07 81.05 34.60
Twin roll mill 179.64 78.45 29.45181.82 78.65 29.81189.26 79.32 31.03197.04 79.97 32.30204.33 80.55 33.50

23J. Powell et al. / Powder Technology 245 (2013) 21–27
inside a small sealed unit, kept cool using a supply of cold tap waterthrough a cooling jacket. Such a long mixing period was used as thiswas theminimumperiod required to form a paste from the formulationwith the highest solids loading. The material was intermittently re-moved from the sides of themixing bowl and the blades to ensure thor-ough mixing. All pastes were left to equilibrate for an hour after mixingbefore extrusion.
A wider range of solids loadings could be manufactured using thez-blade mixer as themixing mechanism of this equipment is less sensi-tive to this variable. The pastes produced using thismixer,weremade tosolids loadings of 0.351, 0.516, 0.555, 0.562. At solids loadings higherthan this it was not possible to form a paste.
3.2. Extrusion rheometry and rheological characterisation
A range of pastes, with varying solids loadings were rheologicallycharacterised using a ram extrusion rheometer driven by a universalload frame. A 20.3 mm diameter barrel was fitted with interchangeabledies, eachwith a die entry angle of 90°. The ceramic pasteswere extrudedthrough dies with one of three diameters, 4, 6 and 8 mm. All dies of agiven diameter came with three length/diameter (L/D) ratios; 1:1, 1:4and 1:8. For each die geometry, the pasteswere extruded at six extrudatevelocities; 5.00, 2.00, 1.00, 0.50, 0.25 and 0.13 mm.s−1. The extrusionpressures were calculated as the average values from data gatheredover a ram displacement of at least 5 mm.
The pastes were rheologically characterised using the Benbow–
Bridgwater six paste parameter equation [18];
P ¼ P1 þ P2 ¼ 2 σ0 þ αVmext
� �ln
D0
D
� �þ 4
LD
τ0 þ βVnext
� �1
where Vext denotes the extrudate velocity, P represents the extrusionpressure, P1 and P2 represent the pressure drop due to die entry anddie land flow, respectively. σ0, α andm denote the yield stress, velocitycoefficient and velocity exponent respectively, for die entryflow. τ0 rep-resents the die wall yield stress and β and n represent the die land flowvelocity factor and exponent.
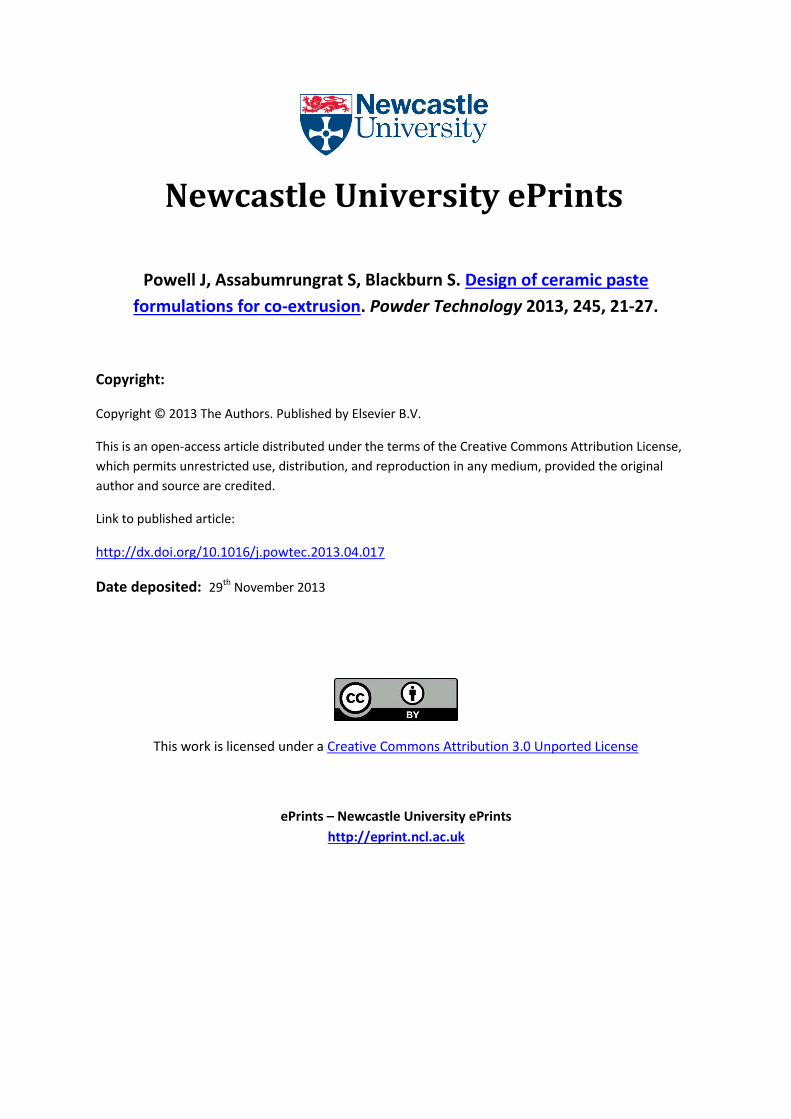
The die entry parameters were calculated from the die entry pres-sure which is obtained from a Bagley plot (extrusion pressure versusL/D) (Fig. 1). Extrapolating a linear plot at a given velocity back to they-axis, the extrusion pressures for a die land length of zero (die entrypressure, P1) are obtained. The die entry parameterswere then obtainedby fitting a three parameter power law curve to a plot of P1 versusextrudate velocity, Vext. Likewise the die land parameters were obtainedfrom a plot of P2 versus Vext.
Fig. 1. Typical Bagley plot of extrusion data.
The Benbow–Bridgwater equation assumes that extrusion pastesundergo complete slip flow in the die land i.e. the slip and the extrudatevelocities are equal. The applicability of this model to the pastes used inthis study is assessed by means of a Mooney analysis and the change inextrusion pressures with solids loading.
3.3. Mooney analysis
The Mooney analysis method [9,19] was used to analyse for thepresence of slip at the die wall, for which it is required to find the ap-parent wall shear rate at controlled values of wall shear stress. Usingan experimental setup where the extrusion is controlled via the loadframe cross head speed, extrusion pressures were measured for aspecified set of velocities used for all three die diameter sets. Havingfitted a three parameter power law curve to the data, the apparentwall shear rates corresponding to the specified wall shear stressvalues required for the Mooney analysis, were interpolated for eachdie set.
This data was then used to estimate the slip velocity at the diewall. The flow rate of the extrudate is assumed to be due to the super-imposition of the bulk material flow rate and the slip flow rate;
Qtot ¼ Qbulk þ Qslip: 2
Writing the flow rates in terms of velocity, the shear rate at the diewall for a Newtonian fluid is given by the first term of the followingequation;
8Vext
D¼ 8Vbulk
Dþ 8Vslip
D3
where Vext is the extrudate velocity, Vbulk is the velocity of the bulkmaterial and Vslip is the slip velocity. The slip velocity can be obtainedfrom the gradient of 8Vext/D versus 1/D at a given wall shear stress, asindicated by Eq. (3). The first term on the right side of Eq. (3) repre-sents for a Newtonian fluid, the shear rate of the bulk material at theslip interface. To find the true shear rate of the bulk material at theslip interface, a correction for non-Newtonian flow is required.
For pastes made with Newtonian binder systems the slip velocity istypically found to be proportional to the wall shear stress as follows,where β is the slip coefficient.
Vslip ¼ βτw 4
For non-Newtonian binder systems the slip velocity is not directlyproportional to thewall shear stress, as a result of the binder rheologicalproperties. The application of a power law relationship has successfullybeen applied in previous studies such as that by Kalyon [14];
Vslip ¼ βτnw 5
where n is a power law exponent which should have a positive valuewhich is dependent upon the binder rheological properties as well asthe properties of the bulk material/powder suspension [10,14]. Theslip coefficient is itself a function of the slip layer thickness, the flowproperties of the binder [14].
Lam et al. [10] showed the slip velocity to be a function of solidsloading obtaining a significant improvement in correlation betweenthe slip velocities of pastes of various solids loadings by plotting theslip velocity versus the product of wall shear stress and the squareroot of solids loading. The following relationship was proposed;
Vslip ¼ β τwffiffiffiffiϕ
p� �n: 6
Jastrzebski has previously reported capillary rheometry resultswhichpropose the slip velocity is inversely proportional to the inverse of the

Fig. 2. YSZ extrusion rheometry pressure data, D = 4 mm. Solid line represents theBenbow–Bridgwater model fit. Paste solids loading.
24 J. Powell et al. / Powder Technology 245 (2013) 21–27
die radius such that a linear plot could be obtained from the apparentshear rate versus 8/D2. However, as critical reviews of this proposedmethod, it has no physical basis [20]. In situations where the Mooneyanalysis does not result in a linear plot, the Tikhonov regularizationmethod is reported to have provided improved results [20].
3.4. Velocity profile
For the purposes of finding the velocity profile, the bulk flow proper-ties under shear flow were characterised using the Herschel Bulkleymodel;
τw ¼ τB þ K _γbw 7
where τw is the wall shear stress, τHB is the Herschel Bulkley yield shearstress, K is the shear rate coefficient (flow index), b represents thepower law exponent and _γw is the bulk shear rate at the wall (or theslip layer interface).
The true bulk shear rate of the paste at the wall (slip interface) isobtained by correcting the shear rate at the wall calculated for aNewtonian fluid, _γbulk, taking into account the non-parabolic velocityprofile of the paste (attributed to non-Newtonian flow behaviour),referred to as the Weissenberg–Rabinowitsch correction [21];
_γw ¼ 8Vext
D14
3þ d ln _γbulk
d lnτw
� � 8
where the gradient of the apparent shear ratewas obtained by differen-tiating a quadratic equation fitted to a plot of ln _γbulk versus ln τw.
3.5. Relative viscosity predictions
The Krieger–Dougherty equation [22] was used as an empirical ex-pression of the change in shear viscosity or die entry pressure withsolids loading;
ηr ¼ 1− ϕϕm
� �− η½ �ϕm
9
where ηr is the relative viscosity and ϕ is the solids packing fraction. Ahydrodynamic factor [η] of 2.5 was used and maximum (critical)solids loading values (ϕm) of 56.5% v/v for the twin roll mixed pastesand 57% v/v for the z-blade mixed pastes were used. The critical solidsloading values were obtained using the method previously describedby Powell and Blackburn [5]. This method involves extruding pastesof a given powder composition and binder formulation butwith varyingpowder to binder ratios, therefore producing extrusion pressures forpastes with varying solids loadings (solids volume fractions). Fromthis data it is possible to extrapolate to a solids loadingwhere the extru-sion pressure tends to infinity, which represents the solids loading ofpaste that cannot undergo extrusion. It is assumed that such a solidsloading represents the maximum solids loading of the paste, wherethe solid particles are no longer lubricated by the liquid binder andare in direct contact with each other, resulting in interlocked powderparticles, preventing deformation of the powder bed.
4. Results
4.1. Paste rheology
The described extrusion rheometry test was carried out for allpastes. Fig. 2 shows a typical Bagley plot of the extrusion pressuredata. As indicated by the linear plot, the pastes were well mixed anddie land flow was fully developed at the entrance to the die. The datapoints for the various pastes fit the linear regression curve with an R2
values ranging between 0.985 and 0.999.
Fig. 2 shows a typical plot of the extrusion pressure versus ramvelocity for the three die lengths, where the data is that of a pastewith a solids loading of 52.5% v/v. The estimated error of each extrusionpressure data point ranges between 0.5% and 2.5%, based on the stan-dard deviation of extrusion loads measured at a given ram velocityover a ram displacement of at least 5 mm as well as data obtainedfrom at least two batches of the same formulation.
The chart shows a good fit between the experimental data and theBenbow–Bridgwater model curves, the parameters for which are givenin Table 3. The high σ0 parameter indicates a significant die entry yieldstress, whereas, there exists no apparent yield stress for the die landflow, as indicated by the zero value for τ0. This result is consistentwith results published by Kalyon which showed concentrated suspen-sions of particles with a high Peclet number (subject to negligibleBrownian motion effects) to have a slip yield stress of zero [14].
4.2. Solids loading
The apparent viscosity (wall shear stress/apparent wall shear rate)and die entry pressure drop were calculated and compared to the pre-dicted trend in viscosity with increasing solids loading. The relative vis-cosity, which is the ratio of the paste viscosity and the binder viscosity,was obtained using the Krieger–Dougherty equation, refer to Eq. (10).The Krieger–Dougherty equation is not used to predict the paste viscosityat various solids loadings, but for the purpose of comparing the trend inextrusion pressures and apparent viscosities with solids loadings for thetwo flow regimes, die entry and die land.
Figs. 3 and 4 show the apparent shear viscosities, die entry pres-sures and predicted relative viscosities at various solids loadings, forpastes mixed using a twin roll mill and a z-blade kneader respectively.As expected from the trends indicated by the Krieger–Dougherty equa-tion, there is an exponential growth in viscosity with increasing solidsloading, which is mirrored by the increase in die entry pressure, whichof course is independent of slipflow. However for apparent shear viscos-ities measured for both z-blade and twin roll mill mixed pastes, thetrend does not follow that of the Krieger–Dougherty equation. For thetwin roll mill pastes a well pronounced plateau in the apparent viscosityexists, with the apparent viscosity at a given shear rate being relativelyindependent of solids loading above a value 54% v/v, as shown in theupper plot of Fig. 3.
The solids loading of 55.4% v/v was the highest that could be pro-duced with the twin roll mill. Above this maximum solids loading, thepaste was not only too dry to adhere effectively to the rollers of the

Table 3Example of Benbow–Bridgwater parameters for YSZ pastes used in this study.
Die entry parameters σ0 (MPa) 0.44α (MPa (s/m)m) 37.05m (dimensionless) 0.52
Die land parameters τ0 (MPa) 0.00β (MPa (s/m)n) 8.90n (dimensionless) 0.38
Fig. 4. Apparent shear viscosities and die entry pressures for z-blade mixed pastes atvarious solids loadings. Critical solids loading of 57% v/v. Relative viscosity predictionsobtained using Dougherty–Krieger equation. Vext = 5 mm.s−1 and D = 4 mm.
25J. Powell et al. / Powder Technology 245 (2013) 21–27
mill, but could also not be extruded at loads below the 100 kN safetylimit set on the load frame.
Referring to Fig. 4, one can observe a similar plateau in apparentvelocity as seen for the twin roll mill mixed pastes, but in this casea higher solids loading could be produced. This paste exhibits a suddenand significant increase in apparent shear viscosity indicating the end ofthe plateau region. Again, the die entry pressure shows a trend similarto that of the Krieger–Dougherty relationship.
This observed plateau in the die land extrusion pressure/apparentviscosity lies within a range of solids loadings which according to resultsreported by Pusey and van Megen [23] for suspensions of mono-sizedspherical particles exhibit crystal or glass phase properties. The crowdingof particles in this glass or crystal like state inhibits Brownian motion ofthe solid particles and so slip flow is promoted. As the powder usedwas not composed of mono-sized spherical particles one would expecta lower maximum packing density and therefore would expect theglass transition to take place at a lower solids loading than the valuequoted by Pusey and van Megen.
4.3. Wall slip
Mooney analysis was performed on two paste formulations, eachwith a different solids loading, 52.5% v/v and 55.4% v/v. Both pasteswere mixed using the twin roll mill. The purpose of this analysis isto confirm if the observed plateau in die land extrusion pressures isdue to slip flow behaviour. The solids loadings 52.5% v/v twin roll
Fig. 3. Apparent shear viscosities and die entry pressures for twin roll mixed pastes atvarious solids loadings. Critical solids loading of 56.5% v/v. Relative viscosity predic-tions obtained using Dougherty–Krieger equation. Vext = 5 mm.s−1 and D = 4 mm.
milled paste sits outside of this plateau, whereas the higher solidsloading 55.5% v/v, the maximum solids loading tested, represents asolids loading that sits within the observed die land extrusion pres-sure plateau.
The interpolated wall shear stress data obtained for the paste witha 52.5% v/v solids loading is plotted as a function of the inverse of thedie diameter in Fig. 5, showing a good fit between the linear regres-sion and the data, with positive values for the intercept at the y-axisas should be the case for the Mooney analysis to be applicable.
Figs. 6 and 7 shows the velocity profiles of the paste in a 6 mm di-ameter die at various wall shear stresses. These profiles are basedupon the estimated slip velocities obtained from theMooney analysis,and the rheological parameters of the bulk shear flow behaviour,obtained using the Herschel–Bulkley equation (Eq. (8)), the parame-ters for which are provided in Table 4. From Figs. 6 and 7 it can beseen that over this range of solids loadings the slip flow is
Fig. 5. Mooney plot of YSZ extrusion rheometry data.

Fig. 6. Velocity profile of paste with 52.5% v/v solids loading at various wall shearstresses.
Fig. 7. Velocity profiles of a paste with a 55.4% v/v solids loading at various wall shearstresses.
26 J. Powell et al. / Powder Technology 245 (2013) 21–27
significantly more dominant for the paste with a solids loading of55.4%, which also has more uniform velocity profiles as is desirablein co-extrusion processes. This greater uniformity of the velocity pro-file is a result of a more significant slip velocity relative to the maxi-mum velocity as well as a higher yield stress τ0.
Fig. 8 shows a log–log scale of wall shear stress versus the slipvelocity for pastes with 52.5% and 55.5% solids loadings. These resultsare consistent with those reported by Lam et al. [10] which show anincrease in slip velocity with solids loading at constant wall shearstress, which as stated by these authors indicates that the relationshipbetween slip velocity and solids loading is not adequately describedby wall shear stress alone. The parameters for Eq. (5), the coefficientβ and wall shear stress exponent, 1/n, are given in Table 5, where n isthe power law index of the binder in the slip layer. The increase in βwith solids loading is consistent with results reported by Jana et al.[13] and Ballesta et al. [12].
Lam et al. [10] correlated the slip velocities of pastes with varioussolids loadings by plotting the slip velocity as a function of wall shearstress and the solids loading. As can be seen from Fig. 8 no significantchange in the correlation between the two data sets was achieved.The standard error of estimate for the power law regression curvefitted to the Vslip versus τw data is 0.55, compared to that of the Vslip
versus τwffiffiffiffiϕ
pplot where the standard error is 0.67.
5. Discussion
Formulating a paste within the range of solids loadings where slipflow is dominant provides a benefit in the co-extrusion of pastes suchas in the manufacture of micro-tubular solid oxide fuel cells [6]. In suchapplications where the relative feed rates of the streams are fixed suchthat they cannot be controlled separately, the promotion of plug flowdue to wall slip is necessary to obtain a stable laminate geometry.
Figs. 3, 4 and 10 show that for a narrow range of solids loadings(approximately 0.54 to 0.56), at an extrusion velocity of 5 mm.s−1,the die land extrusion pressure is relatively independent of solidsloading. This effect is observed for z-blade and twin roll milled pastes,mixers which have very different mixing mechanisms, implying that
Table 4Herschel Bulkley parameters for pastes with solids loadings of 52.5% and 55.5%.
Solids loading 52.5% v/v 55.5% v/v
τHB 0.0931 0.1620K 0.2830 1.376b 0.5102 0.6592
it is not a result of the mixing process and a change in its performancewith solids loading.
Figs. 8 and 9 show that the slip velocity is a function of the wallshear stress by means of a power law relationship, such that thehigher the wall shear stress the higher the slip velocity, which isexpected in light of the shear thinning behaviour of the binder.
The higher slip velocities observed for the higher solids loadingpaste are conducive with the results shown in Fig. 9. However the dif-ferences in slip velocity at a givenwall shear stress cannot be explained interms of solid loading by application of the relationship proposed by Lamet al. [10].
Kalyon [14] presented an equation that presents the slip coefficientattributed to solids depletion slip flow as being a function of the slip, δ,the flow consistency parameter of the binder, m, slip layer and thepower law index of the binder slip layer, n, according to the followingequation;
β ¼ δm1=n : 10
As the pastes of different solids loadings were made using the samebinder system, one might assume the power law index, n, and the con-sistency index, m, the same for all pastes tested in this study. Howeveraccording to the results presented in Table 5, it is the apparent decreasein the 1/n term that leads to the increase in the slip coefficient, which inturn leads to the increase in the slip velocity. This implies that n is notonly a function of the binder rheological properties but also the solidsloading and powder properties.
Assuming a constant value for the consistency index, m, according toEq. (10),in order to the achieve the observed increase in the slip coeffi-cient, an approximately 50% decrease in the slip layer thickness, δ,would need to take place. Results from previous studies includingresults published by Kalyon [14]have shown an inverse relationship be-tween the solids loading and slip layer thickness. Experimental data wasfitted to the following equation,whereDp is the harmonicmeandiameter.
δDp
¼ 1− ϕϕm
Table 5Slip parameters for pastes with 52.5% and 55.5% solids loadings calculated usingEq. (5).
Solids loading % β(MPa− n m. s−1) 1/n
52.5 0.9 3.555.5 1.7 2.2

Fig. 8. Log–log scale plot of wall shear stress versus slip velocity for pastes with solidsloadings of 52.5% and 55.5%.
Fig. 10. Chart of apparent shear viscosity for z-blade and twin roll mill mixed pasteswith varying solids loading and the predicted trend in relative viscosity calculatedfrom the Krieger–Dougherty equation. Dotted vertical lines represent the approximatelimits for solids loadings, where paste die land flow is dominated by slip.
27J. Powell et al. / Powder Technology 245 (2013) 21–27
Assuming a maximum packing density of 56.5% for the z-blademixed pastes, as approximated from the extrusion pressure results,then using the above equation one would expect a 75% reduction inthe slip layer thickness with an increase in solids loading from 52.5to 56.5%.
6. Conclusions
The rheological properties and thus the extrusion pressure of pastesare highly sensitive to the volume fraction of solids. The change in dieentry extrusion pressure with solids loading follows a similar trend tothat given by the Krieger–Dougherty equation. Regarding the changein die land extrusion flow behaviour with solids loading, the resultsshown indicate that for twin roll milled pastes with solids loadingsbelow 54% v/v, the ceramic pastes exhibit relatively little slip flow. Forpastes with a solids loading above approximately 53/54% v/v andbelow the critical solids loading of approximately 56/57% v/v, the ap-parent shear viscosity of the paste was relatively independent of thesolids loading. These results show some similarity to those reportedby Ballesta et al. [12] where a significant increase in slip flow behaviourwas observed in the transition from a viscous paste to a glass phasepaste and the onset of plug flow behaviour.
Fig. 9. Log–log scale plot of the product of wall shear stress and the square root of solidsloading versus the slip velocity for pastes with solids loadings of 52.5% and 55.5%.
References[1] Z. Liang, S. Blackburn, Design and characterisation of a co-extruder to produce
trilayer ceramic tubes semi-continuously, Journal of the European Ceramic Society21 (7) (2001) 883–892.
[2] Z. Liang, S. Blackburn, Analysis of crack development during processing of lami-nated ceramic tubes, Journal of Materials Science 37 (19) (2002) 4227–4233.
[3] W. Zhang, J. Xie, C. Wang, Fabrication of multilayer 316L/PSZ gradient compositepipes by means of multi-billet extrusion, Materials Science and Engineering A 382(1–2) (2004) 371–377.
[4] Z. Chen, K. Ikeda, T. Murakami, T. Takeda, J.-X. Xie, Fabrication of composite pipesby multi-billet extrusion technique, Journal of Materials Processing Technology137 (1–3) (2003) 10–16.
[5] J. Powell, S. Blackburn, The unification of paste rheologies for the co-extrusion ofsolid oxide fuel cells, Journal of the European Ceramic Society 29 (5) (2009)893–897.
[6] J. Powell, S. Blackburn, Co-extrusion of multilayered ceramic micro-tubes for useas solid oxide fuel cells, Journal of the European Ceramic Society 30 (14) (2010)2859–2870.
[7] H.A. Barnes, A review of the slip (wall depletion) of polymer solutions, emulsionsand particle suspensions in viscometers: its cause, character, and cure, Journal ofNon-Newtonian Fluid Mechanics 56 (3) (1995) 221–251.
[8] D.I. Wilson, S.L. Rough, Exploiting the curious characteristics of dense solid–liquidpastes, Chemical Engineering Science 61 (13) (2006) 4147–4154.
[9] A.U. Khan, B.J. Briscoe, P.F. Luckham, Evaluation of slip in capillary extrusion ofceramic pastes, Journal of the European Ceramic Society 21 (4) (2001) 483–491.
[10] Y.C. Lam, Z.Y. Wang, X. Chen, S.C. Joshi, Wall slip of concentrated suspensionmelts in capillary flows, Powder Technology 177 (3) (2007) 162–169.
[11] J. Gotz, D. Muller, H. Buggisch, C. Tasche-Lara, NMR flow imaging of pastes insteady-state flows, Chemical Engineering and Processing 33 (5) (1994) 385–392.
[12] P. Ballesta, G. Petekidis, L. Isa, W.C.K. Poon, R. Besseling, Wall slip and flow of con-centrated hard-sphere colloidal suspensions, Journal of Rheology 56 (5) (2012)1005–1037.
[13] S.C. Jana, B. Kapoor, A. Acrivos, Apparent wall slip velocity coefficients in concen-trated suspensions of noncolloidal particles, Journal of Rheology 39 (6) (1995)1123–1132.
[14] D.M. Kalyon, Apparent slip and viscoplasticity of concentrated suspensions, Journalof Rheology 49 (3) (May/June 2005) 621–640.
[15] P. Ballesta, R. Besseling, L. Isa, G. Petekidis, W.C.K. Poon, Slip and flow ofhard-sphere colloidal glasses, Physical Review Letters 101 (25) (2008) 258301.
[16] P.J.A. Hartman Kok, S.G. Kazarian, B.J. Briscoe, C.J. Lawrence, Effects of particle sizeon near-wall depletion in mono-dispersed colloidal suspensions, Journal of Colloidand Interface Science 280 (2) (2004) 511–517.
[17] D.R. Foss, J.F. Brady, Structure, diffusion and rheology of Brownian suspensions byStokesian Dynamics simulation, Journal of Fluid Mechanics 407 (2000) 167–200.
[18] J.J. Benbow, J. Bridgwater, Paste Flow and Extrusion, Clarendon Press, Oxford,1993.
[19] M. Mooney, Explicit formulas for slip and fluidity, Journal of Rheology 2 (2) (1931)210–222.
[20] P.J. Martin, D.I. Wilson, A critical assessment of the Jastrzebski interface conditionfor the capillary flow of pastes, foams and polymers, Chemical Engineering Science60 (2) (2005) 493–502.
[21] R. Eisenschitz, B. Rabinowitsch, K. Weissenberg, Mitteil Deutsch, Materialspruefungsamt,Sonderheft, 9(91), 1929.
[22] I.M. Krieger, T.J. Dougherty, A mechanism for non-Newtonian flow in suspensionsof rigid spheres, Transactions of the Society of Rheology 3 (1959) 137–152.
[23] P.N. Pusey, W. van Megen, Phase behaviour of concentrated suspensions of nearlyhard colloidal spheres, Nature 320 (6060) (1986) 340–342.