FT-IR, FT-Raman, NMR spectra, and molecular structure investigation of 2,3-dibromo-...
7
FT-IR, FT-Raman, NMR spectra, and molecular structure investigation of 2,3-dibromo-N-methylmaleimide: A combined experimental and theoretical study Mehmet Karabacak a, * , Ali Çoruh b , Mustafa Kurt c a Department of Physics, Afyon Kocatepe University, 03040 Afyonkarahisar, Turkey b Department of Physics, Sakarya University, Sakarya, Turkey c Department of Physics, Ahi Evran University, 40100 Kırs ßehir, Turkey article info Article history: Received 9 March 2008 Received in revised form 5 May 2008 Accepted 5 May 2008 Available online 16 May 2008 Keywords: 2,3-Dibromo-N-methylmaleimide FT-IR and FT-Raman spectra Vibrational frequencies GIAO 13 C and 1 H NMR spectra HF and DFT abstract In the present work, the experimental and theoretical vibrational spectra and chemical shifts of 2,3- dibromo-N-methylmaleimide (2,3DBrNMM, C 5 H 3 NO 2 Br 2 ) were studied. FT-IR and FT-Raman spectra of 2,3DBrNMM in the solid phase were recorded in the region 4000–4400 cm 1 and 3500–3550 cm 1 , respectively. The structural and spectroscopic data of the molecule in the ground state were calculated by using Hartree-Fock and density functional method (B3LYP) with the 6-31G(d), 6-31G(d,p), 6- 31+G(d,p), 6-31++G(d,p), 6-311G(d), 6-311G(d,p), 6-311+G(d,p) and 6-311++G(d,p) basis sets. The scaled values have been compared with experimental FT-IR and FT-Raman spectra. The observed and calculated frequencies are found to be in good agreement. The complete assignments were performed on the basis of the total energy distribution (TED) of the vibrational modes, calculated with scaled quantum mechanics (SQM) method. 13 C NMR, 1 H NMR and DEPT spectra were recorded. 13 C NMR and 1 H NMR chemical shifts were calculated by using HF and B3LYP methods with 6-311++G(d,p) basis sets. The optimized geometric parameters (bond lengths and bond angles) were given corresponding experimental values of maleimide and 3-benzoylmethyl-2-chloro-N-methylmaleimide molecules. Ó 2008 Published by Elsevier B.V. 1. Introduction Derivatives of maleimide have been the subject of investigation for many reasons. The maleimide group is used in many areas such as antibiotic antitumor medicine [1] and biochemical conjugations rings [2]. N-Phenylmaleimide serves as an excellent model com- pound for the important class of resin/fibre advanced materials based on bismaleimides [3–5]. Example of the compound N-meth- ylmaleimide is especially preferred from the standpoints of heat resistance, mechanical properties, and transparency. Because of their spectroscopic properties and chemical signifi- cance in particular, maleimide and its derivatives have been stud- ied extensively by spectroscopic (IR and Raman spectra) and theoretical methods. Vibrational modes and frequency analyses have been assigned in extensive recent studies on vibrational spec- tra of substituted maleimides [3,4,6–8]. Lazslo et al. [8] investi- gated the molecular structure of maleimide by using electron diffraction experimental method and MINDO/3 and CNDO/2 calcu- lation methods. They determined bond lengths and angles of maleimide and related molecules. Harsányi et al. [7] studied all vibrations of maleimide experimental and theoretical. Parker stud- ied extensively the vibrational assignments of infrared (IR), Fourier transform Raman (FT-Raman) and inelastic neutron scattering of N-methylmaleimide [3]. N-Phenylmaleimide and N-(perdeuter- ophenyl)maleimide are investigated experimentally (infrared, Ra- man and inelastic neutron scattering (INS) spectroscopies) and theoretically with density functional theory (DFT) [4]. The infrared and Raman spectra of N-methylmaleimide (solid, solution, gas) and of (p-N-methylmaleimide) iron tetracarbonyl (solid, solution) which the assignment of the normal modes of both molecules was offered and compared with the data for (p-maleic anhydride) iron tetracarbonyl are obtained by Lokshin et al. [6]. Steege and Buma [9] investigated the spectroscopic and dynamic properties of the strongly one–photon absorbing S4(pC@Cp * ) state of malei- mide and N-methylmaleimide with an experimental approach that combined with ab initio calculations of the electronic structure of the molecules. N-Phenylmaleimide and N-ethylmaleimide are also studied by X-ray crystallography [10–11]. Literature survey reveals that to the best of our knowledge, no experimental vibrational assignment for 2,3DBrNMM (also known as 3,4-dibromo-N-methylpyrrole-2,5-dione) molecule has been performed yet. Also, ab initio Hartree–Fock (HF) and density func- tional theory (DFT) calculations have not been performed on title 0022-2860/$ - see front matter Ó 2008 Published by Elsevier B.V. doi:10.1016/j.molstruc.2008.05.014 * Corresponding author. Tel.: +90 272 2281311; fax: +90 272 2281235. E-mail address: [email protected] (M. Karabacak). Journal of Molecular Structure 892 (2008) 125–131 Contents lists available at ScienceDirect Journal of Molecular Structure journal homepage: www.elsevier.com/locate/molstruc
Transcript of FT-IR, FT-Raman, NMR spectra, and molecular structure investigation of 2,3-dibromo-...
Journal of Molecular Structure 892 (2008) 125–131
Contents lists available at ScienceDirect
Journal of Molecular Structure
journal homepage: www.elsevier .com/ locate /molst ruc
FT-IR, FT-Raman, NMR spectra, and molecular structure investigationof 2,3-dibromo-N-methylmaleimide: A combined experimentaland theoretical study
Mehmet Karabacak a,*, Ali Çoruh b, Mustafa Kurt c
a Department of Physics, Afyon Kocatepe University, 03040 Afyonkarahisar, Turkeyb Department of Physics, Sakarya University, Sakarya, Turkeyc Department of Physics, Ahi Evran University, 40100 Kırs�ehir, Turkey
a r t i c l e i n f o
Article history:Received 9 March 2008Received in revised form 5 May 2008Accepted 5 May 2008Available online 16 May 2008
Keywords:2,3-Dibromo-N-methylmaleimideFT-IR and FT-Raman spectraVibrational frequenciesGIAO13C and 1H NMR spectraHF and DFT
0022-2860/$ - see front matter � 2008 Published bydoi:10.1016/j.molstruc.2008.05.014
* Corresponding author. Tel.: +90 272 2281311; faxE-mail address: [email protected] (M. Karabac
a b s t r a c t
In the present work, the experimental and theoretical vibrational spectra and chemical shifts of 2,3-dibromo-N-methylmaleimide (2,3DBrNMM, C5H3NO2Br2) were studied. FT-IR and FT-Raman spectra of2,3DBrNMM in the solid phase were recorded in the region 4000–4400 cm�1 and 3500–3550 cm�1,respectively. The structural and spectroscopic data of the molecule in the ground state were calculatedby using Hartree-Fock and density functional method (B3LYP) with the 6-31G(d), 6-31G(d,p), 6-31+G(d,p), 6-31++G(d,p), 6-311G(d), 6-311G(d,p), 6-311+G(d,p) and 6-311++G(d,p) basis sets. The scaledvalues have been compared with experimental FT-IR and FT-Raman spectra. The observed and calculatedfrequencies are found to be in good agreement. The complete assignments were performed on the basis ofthe total energy distribution (TED) of the vibrational modes, calculated with scaled quantum mechanics(SQM) method. 13C NMR, 1H NMR and DEPT spectra were recorded. 13C NMR and 1H NMR chemical shiftswere calculated by using HF and B3LYP methods with 6-311++G(d,p) basis sets. The optimized geometricparameters (bond lengths and bond angles) were given corresponding experimental values of maleimideand 3-benzoylmethyl-2-chloro-N-methylmaleimide molecules.
� 2008 Published by Elsevier B.V.
1. Introduction
Derivatives of maleimide have been the subject of investigationfor many reasons. The maleimide group is used in many areas suchas antibiotic antitumor medicine [1] and biochemical conjugationsrings [2]. N-Phenylmaleimide serves as an excellent model com-pound for the important class of resin/fibre advanced materialsbased on bismaleimides [3–5]. Example of the compound N-meth-ylmaleimide is especially preferred from the standpoints of heatresistance, mechanical properties, and transparency.
Because of their spectroscopic properties and chemical signifi-cance in particular, maleimide and its derivatives have been stud-ied extensively by spectroscopic (IR and Raman spectra) andtheoretical methods. Vibrational modes and frequency analyseshave been assigned in extensive recent studies on vibrational spec-tra of substituted maleimides [3,4,6–8]. Lazslo et al. [8] investi-gated the molecular structure of maleimide by using electrondiffraction experimental method and MINDO/3 and CNDO/2 calcu-lation methods. They determined bond lengths and angles ofmaleimide and related molecules. Harsányi et al. [7] studied all
Elsevier B.V.
: +90 272 2281235.ak).
vibrations of maleimide experimental and theoretical. Parker stud-ied extensively the vibrational assignments of infrared (IR), Fouriertransform Raman (FT-Raman) and inelastic neutron scattering ofN-methylmaleimide [3]. N-Phenylmaleimide and N-(perdeuter-ophenyl)maleimide are investigated experimentally (infrared, Ra-man and inelastic neutron scattering (INS) spectroscopies) andtheoretically with density functional theory (DFT) [4]. The infraredand Raman spectra of N-methylmaleimide (solid, solution, gas) andof (p-N-methylmaleimide) iron tetracarbonyl (solid, solution)which the assignment of the normal modes of both moleculeswas offered and compared with the data for (p-maleic anhydride)iron tetracarbonyl are obtained by Lokshin et al. [6]. Steege andBuma [9] investigated the spectroscopic and dynamic propertiesof the strongly one–photon absorbing S4(pC@Cp*) state of malei-mide and N-methylmaleimide with an experimental approach thatcombined with ab initio calculations of the electronic structure ofthe molecules. N-Phenylmaleimide and N-ethylmaleimide are alsostudied by X-ray crystallography [10–11].
Literature survey reveals that to the best of our knowledge, noexperimental vibrational assignment for 2,3DBrNMM (also knownas 3,4-dibromo-N-methylpyrrole-2,5-dione) molecule has beenperformed yet. Also, ab initio Hartree–Fock (HF) and density func-tional theory (DFT) calculations have not been performed on title
126 M. Karabacak et al. / Journal of Molecular Structure 892 (2008) 125–131
molecule, and analysis of the vibrational modes of this moleculeusing quantum chemical methods has not been published in theliterature so far.
In this study, we recorded FT-IR, FT-Raman, 1H NMR and 13CNMR spectra of title compound and calculated the vibrational fre-quencies of 2,3DBrNMM in the ground state to distinguish funda-mentals from experimental vibrational frequencies and geometricparameters using HF and DFT/B3LYP (Becke 3-Lee-Yang-Parr)methods. In addition, the gauge-including atomic orbital (GIAO)13C and 1H chemical shifts calculations of the title compound werecalculated by using HF and B3LYP methods with 6-311++G(d,p) ba-sis set. A detailed quantum chemical study will aid in making def-inite assignments to fundamental normal modes of 2,3DBrNMMand in clarifying the experimental data for this importantmolecule.
2. Experimental
The compound 2,3DBrNMM molecule in solid state was pur-chased from Sigma–Aldrich chemical company with a stated purityof 99%. The FT-IR spectrum of title molecule was recorded between4000 cm�1 and 400 cm�1 on a Perkin Elmer FT-IR System SpectrumBX spectrometer which was calibrated using polystyrene bands.The spectrum was recorded at room temperature, with a scanningspeed of 10 cm�1 min�1 and the spectral resolution of 4.0 cm�1. FT-Raman spectra of the sample was recorded on a Bruker RFS 100/SFT-Raman instrument using 1064 nm excitation from an Nd:YAGlaser. The detector is a liquid nitrogen cooled Ge detector. Fivehundred scans were accumulated at 4 cm�1 resolution using a laserpower of 100 mW.
NMR experiments were performed in Varian Infinity Plus spec-trometer at 300 K. The 2,3DBrNMM molecule was dissolved inchloroform (CDCl3). Chemical shifts were reported in ppm relativeto tetramethylsilane (TMS) for 1H NMR, 13C NMR and DEPT NMRspectra. 1H and 13C NMR spectra were obtained at a base frequencyof 75 MHz for 13C and 300 MHz for 1H nuclei.
Table 1Calculated energies for 2,3DBrNMM by HF and B3LYP methods
Basis sets HF B3LYP
Energy (Hartree) Energy (Hartree)
6-311++G(d,p) �5540.10192571 �5545.939784856-311+G(d,p) �5540.10185337 �5545.939729686-311G(d,p) �5540.09486481 �5545.930823226-311G(d) �5540.09046665 �5545.926858956-31++G(d,p) �5535.10910380 �5541.018021706-31+G(d,p) �5535.10886019 �5541.017811446-31G(d,p) �5535.05066724 �5540.948164806-31G(d) �5535.04587248 �5540.92685895
3. Calculations
The molecular structure of 2,3DBrNMM in the ground state(in vacuo) was determined with HF and B3LYP employing the6-31G(d), 6-31G(d,p), 6-31+G(d,p), 6-31++G(d,p), 6-311G(d),6-311G(d,p), 6-311+G(d,p) and 6-311++G(d,p) basis sets. Theoptimized structural parameters are used in the vibrational fre-quencies calculations at HF and DFT levels. By using the samemethods and basis sets, it was seen that all the vibration frequen-cies of title molecule were positive. Therefore, we were confidentthat a definite absolute minimum in the potential energy surfacewas found. The minimum energy of geometrical structure is ob-tained by using level 6-311++G(d,p) basis set. Therefore, calculatedvalues by this set are used in discussion. The calculated vibrationalfrequencies are scaled by 0.9050 for HF [12]. For B3LYP with 6-311++G(d,p) basis set, the wavenumbers in the ranges from 4000to 1700 cm�1 and lower than 1700 cm�1 are scaled with 0.958and 0.983, respectively [13]. The total energy distribution (TED)was calculated by using the SQM program [14] and the fundamen-tal vibrational modes were characterized by their TED. The theoret-ical results have enabled us to make the detailed assignments ofthe experimental IR and Raman spectra of title molecule.
For NMR calculations, the title molecule was firstly optimized atHF and B3LYP methods with 6-311++G(d,p) level. After optimiza-tion, 1H NMR and 13C NMR chemical shifts (dH and dC) were calcu-lated using the GIAO method [15] in chloroform (CDCl3) at HF andB3LYP methods with 6-311++G(d,p) basis set. Relative chemicalshifts were then estimated by using the corresponding TMS shield-
ing calculated in advance at the same theoretical level as the refer-ence. 13C and 1H isotropic magnetic shielding (I.M.S.) of any Xcarbon (or hydrogen) atom was made according to the value 13CIMS of TMS: CSx = IMSTMS�IMSx (1H IMS of TMS:HSx = IMSTMS�IMSx). Calculated 1H and 13C isotropic chemicalshieldings for TMS at HF and B3LYP methods with 6-311++G(d,p)level in CDCl3 by using the IEFPCM method were 32.421 ppm,31.884 ppm and 196.365 ppm, 184.252 ppm, respectively. Theexperimental values for 1H and 13C isotropic chemical shifts forTMS were 30.84 ppm and 188.1 ppm, respectively [16].
The calculations are performed by using GaussView molecularvisualisation program [17] and GAUSSSIAN 03 program packageon the personal computer [18].
4. Results and discussion
The present molecule 2,3DBrNMM which the five memberedring had an envelope from retaining the planarity of the C–C@C–C part belongs to Cs point group symmetry. The title molecule con-sists of 13 atoms, so it has 33 normal vibrational modes which fallinto 22 in-plane vibrations of the A0 species and 11 out-planevibrations of the A00 species. All the 33 fundamental vibrationsare active in both IR and Raman. Calculated energies for title mol-ecule, determined by HF and B3LYP/all basis sets are presented inTable 1. As clearly seen from the values given in Table 1, on the cal-culated energies, there is a little difference between basis sets for6-311 (or 6-31), use of the basis sets of larger sizes give rise to in-creases in the differences between the calculated energies of the ti-tle molecule. However, when we compared the 6-31 and 6-311basis sets the difference is large.
The molecular structure and numbering of the atoms of2,3DBrNMM is shown in Fig. 1. Since the crystal structure of the ti-tle compound is not available in the literature till now, the geomet-ric parameters compared with the maleimide [7,8], N-phenylmaleimide [10] and 3-benzoylmethyl-2-chloro-N-meth-ylmaleimide (3BM2ClNMM) [19] bond lengths and bond angles.The calculated vibrational frequencies are compared with theexperimental FT-IR and FT-Raman spectra of title molecule.
4.1. Geometrical structure
The first task for a computational work was to determine theoptimized geometry of 2,3DBrNMM. Calculations on 2,3DBrNMMhave been performed under the restriction of Cs symmetry withthe mirror plane perpendicular to the ring. The optimized structureparameters calculated ab initio HF and DFT (B3LYP) with the 6-31++G(d,p) and 6-311++G(d,p) basis sets are listed in Table 2 inaccordance with the atom numbering scheme given in Fig. 1.
As discussed in our previous paper [20,21], it is well known thatHF methods underestimate bond lengths; DFT method predictsbond lengths which are systematically too long, particularly the
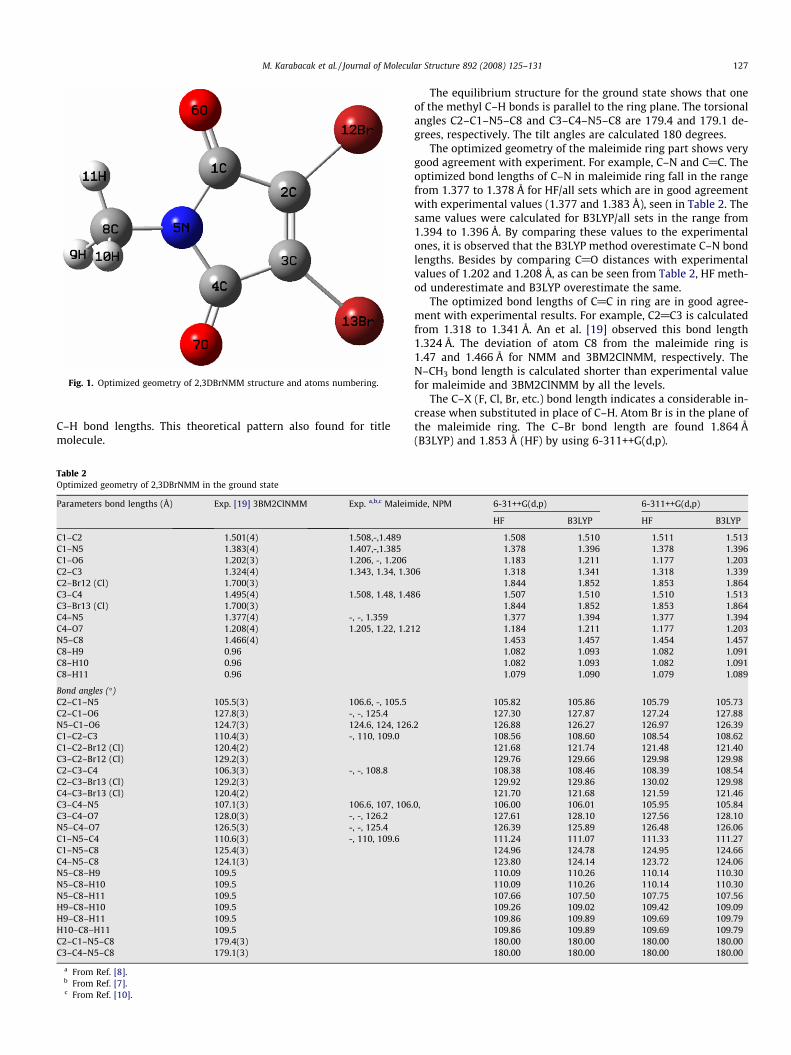
Fig. 1. Optimized geometry of 2,3DBrNMM structure and atoms numbering.
M. Karabacak et al. / Journal of Molecular Structure 892 (2008) 125–131 127
C–H bond lengths. This theoretical pattern also found for titlemolecule.
Table 2Optimized geometry of 2,3DBrNMM in the ground state
Parameters bond lengths (Å) Exp. [19] 3BM2ClNMM Exp. a,b,c Maleim
C1–C2 1.501(4) 1.508,-,1.489C1–N5 1.383(4) 1.407,-,1.385C1–O6 1.202(3) 1.206, -, 1.206C2–C3 1.324(4) 1.343, 1.34, 1.30C2–Br12 (Cl) 1.700(3)C3–C4 1.495(4) 1.508, 1.48, 1.48C3–Br13 (Cl) 1.700(3)C4–N5 1.377(4) -, -, 1.359C4–O7 1.208(4) 1.205, 1.22, 1.21N5–C8 1.466(4)C8–H9 0.96C8–H10 0.96C8–H11 0.96
Bond angles (�)C2–C1–N5 105.5(3) 106.6, -, 105.5C2–C1–O6 127.8(3) -, -, 125.4N5–C1–O6 124.7(3) 124.6, 124, 126C1–C2–C3 110.4(3) -, 110, 109.0C1–C2–Br12 (Cl) 120.4(2)C3–C2–Br12 (Cl) 129.2(3)C2–C3–C4 106.3(3) -, -, 108.8C2–C3–Br13 (Cl) 129.2(3)C4–C3–Br13 (Cl) 120.4(2)C3–C4–N5 107.1(3) 106.6, 107, 106C3–C4–O7 128.0(3) -, -, 126.2N5–C4–O7 126.5(3) -, -, 125.4C1–N5–C4 110.6(3) -, 110, 109.6C1–N5–C8 125.4(3)C4–N5–C8 124.1(3)N5–C8–H9 109.5N5–C8–H10 109.5N5–C8–H11 109.5H9–C8–H10 109.5H9–C8–H11 109.5H10–C8–H11 109.5C2–C1–N5–C8 179.4(3)C3–C4–N5–C8 179.1(3)
a From Ref. [8].b From Ref. [7].c From Ref. [10].
The equilibrium structure for the ground state shows that oneof the methyl C–H bonds is parallel to the ring plane. The torsionalangles C2–C1–N5–C8 and C3–C4–N5–C8 are 179.4 and 179.1 de-grees, respectively. The tilt angles are calculated 180 degrees.
The optimized geometry of the maleimide ring part shows verygood agreement with experiment. For example, C–N and C@C. Theoptimized bond lengths of C–N in maleimide ring fall in the rangefrom 1.377 to 1.378 Å for HF/all sets which are in good agreementwith experimental values (1.377 and 1.383 Å), seen in Table 2. Thesame values were calculated for B3LYP/all sets in the range from1.394 to 1.396 Å. By comparing these values to the experimentalones, it is observed that the B3LYP method overestimate C–N bondlengths. Besides by comparing C@O distances with experimentalvalues of 1.202 and 1.208 Å, as can be seen from Table 2, HF meth-od underestimate and B3LYP overestimate the same.
The optimized bond lengths of C@C in ring are in good agree-ment with experimental results. For example, C2@C3 is calculatedfrom 1.318 to 1.341 Å. An et al. [19] observed this bond length1.324 Å. The deviation of atom C8 from the maleimide ring is1.47 and 1.466 Å for NMM and 3BM2ClNMM, respectively. TheN–CH3 bond length is calculated shorter than experimental valuefor maleimide and 3BM2ClNMM by all the levels.
The C–X (F, Cl, Br, etc.) bond length indicates a considerable in-crease when substituted in place of C–H. Atom Br is in the plane ofthe maleimide ring. The C–Br bond length are found 1.864 Å(B3LYP) and 1.853 Å (HF) by using 6-311++G(d,p).
ide, NPM 6-31++G(d,p) 6-311++G(d,p)
HF B3LYP HF B3LYP
1.508 1.510 1.511 1.5131.378 1.396 1.378 1.3961.183 1.211 1.177 1.203
6 1.318 1.341 1.318 1.3391.844 1.852 1.853 1.864
6 1.507 1.510 1.510 1.5131.844 1.852 1.853 1.8641.377 1.394 1.377 1.394
2 1.184 1.211 1.177 1.2031.453 1.457 1.454 1.4571.082 1.093 1.082 1.0911.082 1.093 1.082 1.0911.079 1.090 1.079 1.089
105.82 105.86 105.79 105.73127.30 127.87 127.24 127.88
.2 126.88 126.27 126.97 126.39108.56 108.60 108.54 108.62121.68 121.74 121.48 121.40129.76 129.66 129.98 129.98108.38 108.46 108.39 108.54129.92 129.86 130.02 129.98121.70 121.68 121.59 121.46
.0, 106.00 106.01 105.95 105.84127.61 128.10 127.56 128.10126.39 125.89 126.48 126.06111.24 111.07 111.33 111.27124.96 124.78 124.95 124.66123.80 124.14 123.72 124.06110.09 110.26 110.14 110.30110.09 110.26 110.14 110.30107.66 107.50 107.75 107.56109.26 109.02 109.42 109.09109.86 109.89 109.69 109.79109.86 109.89 109.69 109.79180.00 180.00 180.00 180.00180.00 180.00 180.00 180.00
128 M. Karabacak et al. / Journal of Molecular Structure 892 (2008) 125–131
The maleimide ring is also evident from the negative deviationof C2–C1–N2 and C3–C4–N5 angles which are calculated ca. 105�and 106� (HF and B3LYP) and positive deviation of C1–N5–C4(111�) angle from the normal value of 108�. The remaining anglesare calculated normal value of pentagonal ring. Similar values wereobtained for 3BM2ClNMM [19].
4.2. Vibrational spectra
In order to obtain the spectroscopic signature of 2,3DBrNMMmolecule, we performed a frequency calculation analysis. Calcula-tions were made for a free molecule in vacuum, while experimentswere performed for solid sample, so there are disagreements be-tween calculated and observed vibrational wavenumbers.
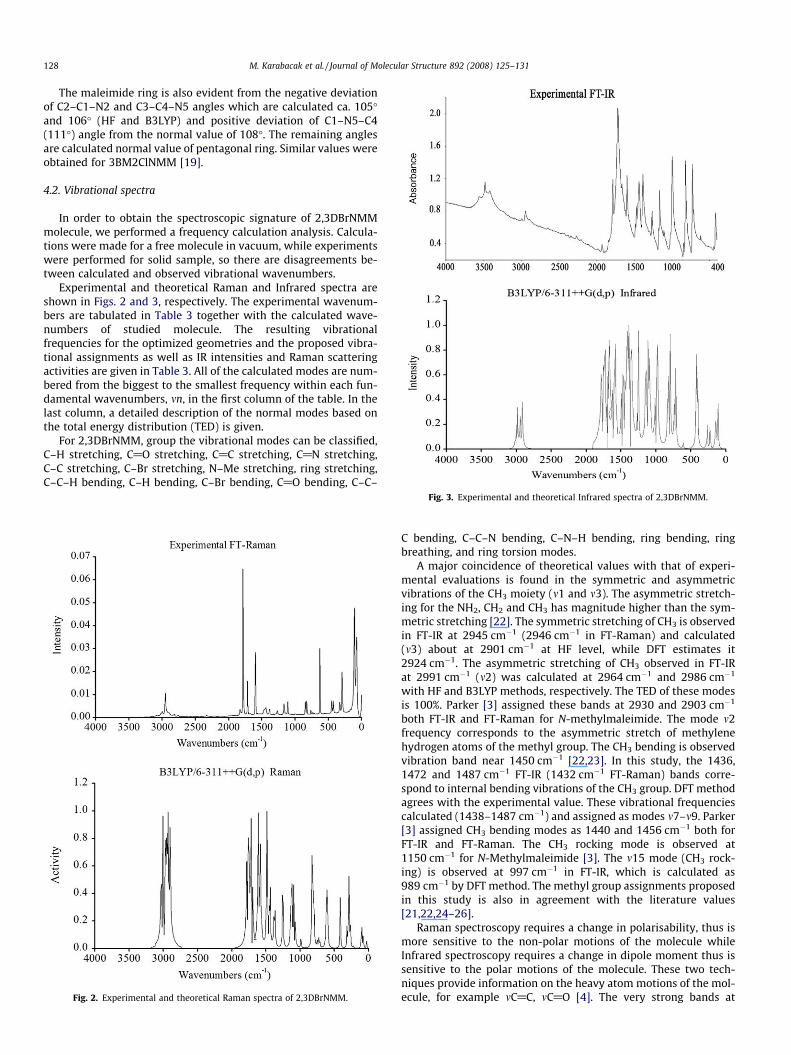
Experimental and theoretical Raman and Infrared spectra areshown in Figs. 2 and 3, respectively. The experimental wavenum-bers are tabulated in Table 3 together with the calculated wave-numbers of studied molecule. The resulting vibrationalfrequencies for the optimized geometries and the proposed vibra-tional assignments as well as IR intensities and Raman scatteringactivities are given in Table 3. All of the calculated modes are num-bered from the biggest to the smallest frequency within each fun-damental wavenumbers, mn, in the first column of the table. In thelast column, a detailed description of the normal modes based onthe total energy distribution (TED) is given.
For 2,3DBrNMM, group the vibrational modes can be classified,C–H stretching, C@O stretching, C@C stretching, C@N stretching,C–C stretching, C–Br stretching, N–Me stretching, ring stretching,C–C–H bending, C–H bending, C–Br bending, C@O bending, C–C–
Fig. 2. Experimental and theoretical Raman spectra of 2,3DBrNMM.
Fig. 3. Experimental and theoretical Infrared spectra of 2,3DBrNMM.
C bending, C–C–N bending, C–N–H bending, ring bending, ringbreathing, and ring torsion modes.
A major coincidence of theoretical values with that of experi-mental evaluations is found in the symmetric and asymmetricvibrations of the CH3 moiety (m1 and m3). The asymmetric stretch-ing for the NH2, CH2 and CH3 has magnitude higher than the sym-metric stretching [22]. The symmetric stretching of CH3 is observedin FT-IR at 2945 cm�1 (2946 cm�1 in FT-Raman) and calculated(m3) about at 2901 cm�1 at HF level, while DFT estimates it2924 cm�1. The asymmetric stretching of CH3 observed in FT-IRat 2991 cm�1 (m2) was calculated at 2964 cm�1 and 2986 cm�1
with HF and B3LYP methods, respectively. The TED of these modesis 100%. Parker [3] assigned these bands at 2930 and 2903 cm�1
both FT-IR and FT-Raman for N-methylmaleimide. The mode m2frequency corresponds to the asymmetric stretch of methylenehydrogen atoms of the methyl group. The CH3 bending is observedvibration band near 1450 cm�1 [22,23]. In this study, the 1436,1472 and 1487 cm�1 FT-IR (1432 cm�1 FT-Raman) bands corre-spond to internal bending vibrations of the CH3 group. DFT methodagrees with the experimental value. These vibrational frequenciescalculated (1438–1487 cm�1) and assigned as modes m7–m9. Parker[3] assigned CH3 bending modes as 1440 and 1456 cm�1 both forFT-IR and FT-Raman. The CH3 rocking mode is observed at1150 cm�1 for N-Methylmaleimide [3]. The m15 mode (CH3 rock-ing) is observed at 997 cm�1 in FT-IR, which is calculated as989 cm�1 by DFT method. The methyl group assignments proposedin this study is also in agreement with the literature values[21,22,24–26].
Raman spectroscopy requires a change in polarisability, thus ismore sensitive to the non-polar motions of the molecule whileInfrared spectroscopy requires a change in dipole moment thus issensitive to the polar motions of the molecule. These two tech-niques provide information on the heavy atom motions of the mol-ecule, for example mC@C, mC@O [4]. The very strong bands at
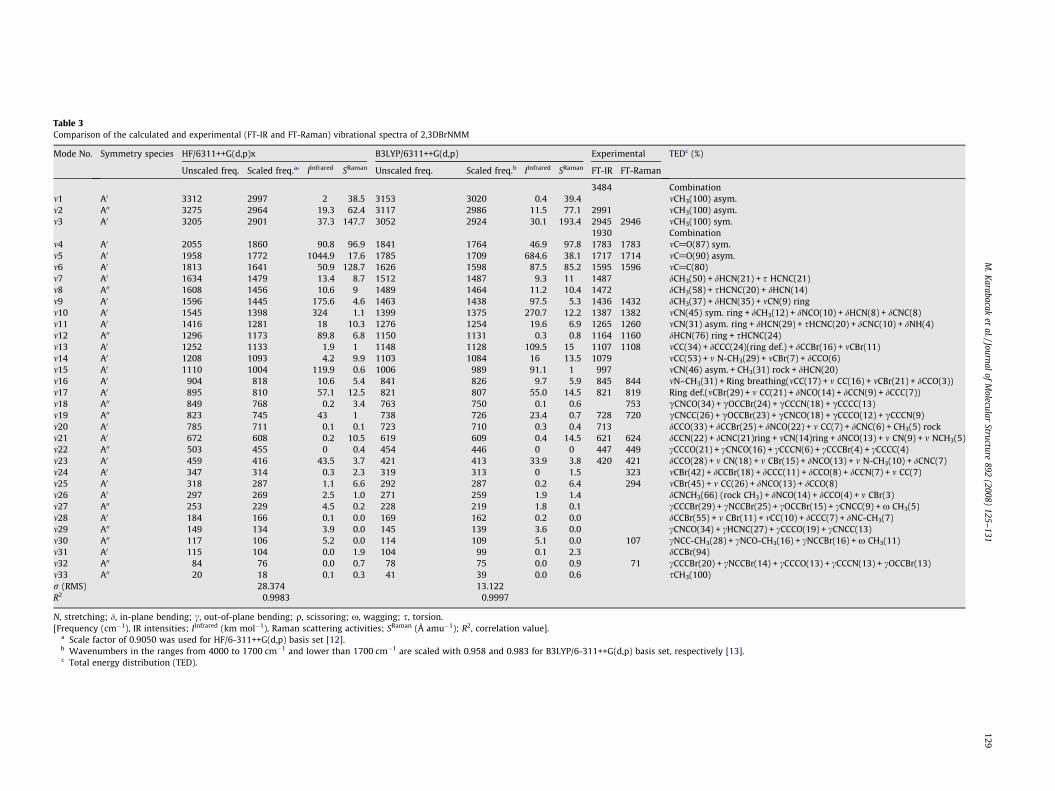
Table 3Comparison of the calculated and experimental (FT-IR and FT-Raman) vibrational spectra of 2,3DBrNMM
Mode No. Symmetry species HF/6311++G(d,p)x B3LYP/6311++G(d,p) Experimental TEDc (%)
Unscaled freq. Scaled freq.a‘ IInfrared SRaman Unscaled freq. Scaled freq.b IInfrared SRaman FT-IR FT-Raman
3484 Combinationm1 A0 3312 2997 2 38.5 3153 3020 0.4 39.4 mCH3(100) asym.m2 A00 3275 2964 19.3 62.4 3117 2986 11.5 77.1 2991 mCH3(100) asym.m3 A0 3205 2901 37.3 147.7 3052 2924 30.1 193.4 2945 2946 mCH3(100) sym.
1930 Combinationm4 A0 2055 1860 90.8 96.9 1841 1764 46.9 97.8 1783 1783 mC@O(87) sym.m5 A0 1958 1772 1044.9 17.6 1785 1709 684.6 38.1 1717 1714 mC@O(90) asym.m6 A0 1813 1641 50.9 128.7 1626 1598 87.5 85.2 1595 1596 mC@C(80)m7 A0 1634 1479 13.4 8.7 1512 1487 9.3 11 1487 dCH3(50) + dHCN(2 + s HCNC(21)m8 A00 1608 1456 10.6 9 1489 1464 11.2 10.4 1472 dCH3(58) + sHCNC ) + dHCN(14)m9 A0 1596 1445 175.6 4.6 1463 1438 97.5 5.3 1436 1432 dCH3(37) + dHCN(3 + mCN(9) ringm10 A0 1545 1398 324 1.1 1399 1375 270.7 12.2 1387 1382 mCN(45) sym. ring dCH3(12) + dNCO(10) + dHCN(8) + dCNC(8)m11 A0 1416 1281 18 10.3 1276 1254 19.6 6.9 1265 1260 mCN(31) asym. rin dHCN(29) + sHCNC(20) + dCNC(10) + dNH(4)m12 A00 1296 1173 89.8 6.8 1150 1131 0.3 0.8 1164 1160 dHCN(76) ring + sH NC(24)m13 A0 1252 1133 1.9 1 1148 1128 109.5 15 1107 1108 mCC(34) + dCCC(24 ing def.) + dCCBr(16) + mCBr(11)m14 A0 1208 1093 4.2 9.9 1103 1084 16 13.5 1079 mCC(53) + m N-CH3 ) + mCBr(7) + dCCO(6)m15 A0 1110 1004 119.9 0.6 1006 989 91.1 1 997 mCN(46) asym. + C (31) rock + dHCN(20)m16 A0 904 818 10.6 5.4 841 826 9.7 5.9 845 844 mN–CH3(31) + Ring reathing(mCC(17) + m CC(16) + mCBr(21) + dCCO(3))m17 A0 895 810 57.1 12.5 821 807 55.0 14.5 821 819 Ring def.(mCBr(29) m CC(21) + dNCO(14) + dCCN(9) + dCCC(7))m18 A00 849 768 0.2 3.4 763 750 0.1 0.6 753 cCNCO(34) + cOCC (24) + cCCCN(18) + cCCCC(13)m19 A00 823 745 43 1 738 726 23.4 0.7 728 720 cCNCC(26) + cOCC (23) + cCNCO(18) + cCCCO(12) + cCCCN(9)m20 A0 785 711 0.1 0.1 723 710 0.3 0.4 713 dCCO(33) + dCCBr( ) + dNCO(22) + m CC(7) + dCNC(6) + CH3(5) rockm21 A0 672 608 0.2 10.5 619 609 0.4 14.5 621 624 dCCN(22) + dCNC(2 ring + mCN(14)ring + dNCO(13) + m CN(9) + m NCH3(5)m22 A00 503 455 0 0.4 454 446 0 0 447 449 cCCCO(21) + cCNC 16) + cCCCN(6) + cCCCBr(4) + cCCCC(4)m23 A0 459 416 43.5 3.7 421 413 33.9 3.8 420 421 dCCO(28) + m CN(1 + m CBr(15) + dNCO(13) + m N-CH3(10) + dCNC(7)m24 A0 347 314 0.3 2.3 319 313 0 1.5 323 mCBr(42) + dCCBr(1 + dCCC(11) + dCCO(8) + dCCN(7) + m CC(7)m25 A0 318 287 1.1 6.6 292 287 0.2 6.4 294 mCBr(45) + m CC(26 dNCO(13) + dCCO(8)m26 A0 297 269 2.5 1.0 271 259 1.9 1.4 dCNCH3(66) (rock 3) + dNCO(14) + dCCO(4) + m CBr(3)m27 A00 253 229 4.5 0.2 228 219 1.8 0.1 cCCCBr(29) + cNCC (25) + cOCCBr(15) + cCNCC(9) + x CH3(5)m28 A0 184 166 0.1 0.0 169 162 0.2 0.0 dCCBr(55) + m CBr( ) + mCC(10) + dCCC(7) + dNC-CH3(7)m29 A00 149 134 3.9 0.0 145 139 3.6 0.0 cCNCO(34) + cHCN 27) + cCCCO(19) + cCNCC(13)m30 A00 117 106 5.2 0.0 114 109 5.1 0.0 107 cNCC-CH3(28) + cN O-CH3(16) + cNCCBr(16) + x CH3(11)m31 A0 115 104 0.0 1.9 104 99 0.1 2.3 dCCBr(94)m32 A00 84 76 0.0 0.7 78 75 0.0 0.9 71 cCCCBr(20) + cNCC (14) + cCCCO(13) + cCCCN(13) + cOCCBr(13)m33 A00 20 18 0.1 0.3 41 39 0.0 0.6 sCH3(100)r (RMS) 28.374 13.122R2 0.9983 0.9997
N, stretching; d, in-plane bending; c, out-of-plane bending; q, scissoring; x, wagging; s, torsion.[Frequency (cm�1), IR intensities; IInfrared (km mol�1), Raman scattering activities; SRaman (Å amu�1); R2, correlation value].
a Scale factor of 0.9050 was used for HF/6-311++G(d,p) basis set [12].b Wavenumbers in the ranges from 4000 to 1700 cm�1 and lower than 1700 cm�1 are scaled with 0.958 and 0.983 for B3LYP/6-311++G(d,p) basis set, respectively [13]c Total energy distribution (TED).
M.K
arabacaket
al./Journalof
Molecular
Structure892
(2008)125–
131129
1)(205)+
g +C
)(r(29H3
b+BrBr251)
O(8)8)) +CHBr
11C(C
Br
.
Table 4Experimental and theoretical, 13C and 1H NMR isotropic chemical shifts (with respectto TMS) of 2,3DBrNMM by HF and DFT (B3LYP) methods
Atom Experimentala HF/6-311++G(d,p)a B3LYP/6-311++G(d,p)a
C1 164.255 166.744 170.412C2 129.628 152.876 156.517C3 129.628 153.223 156.674C4 164.255 167.999 171.570C8 25.731 25.039 26.581H9 3.144 2.808 2.752H10 3.144 2.808 2.752H11 3.144 3.621 3.611r (RMS) 11.823 13.906R2 0.9882 0.9880
a All values in ppm; R2, correlation value.
130 M. Karabacak et al. / Journal of Molecular Structure 892 (2008) 125–131
1717 cm�1 in FT-IR (1714 cm�1, FT-Raman) and 1783 cm�1 in FT-IR(1783 cm�1, FT-Raman) spectra were assigned as asymmetric andsymmetric C@O stretching vibration, respectively. The theoreti-cally computed values (1764 and 1709 cm�1, B3LYP) show verygood agreement with experimental results. The HF method calcu-lated m(C@O) frequencies higher than the B3LYP method. Lokshinet al. [6] observed C@O symmetric stretching vibration at1771 cm�1 in FT-Raman (1773 cm�1, FT-IR solid) and asymmetricstretching vibration at 1724 cm�1 in FT-IR. These bands are as-signed at 1770, 1712 and 1580 cm�1 for maleimide by Harsanyiet al. [7]. Wolbaek [27] observed C@O vibrations at 1775 and1756 cm�1 for maleimide. For N-methylmaleimide, Parker [3] ob-served C@O vibrations at 1751 and 1701 cm�1 in FT-IR (1757 and1694 cm�1, FT-Raman) symmetric and asymmetric stretching,respectively. The C@O symmetric and asymmetric stretchingvibrations are assigned at 1775 and 1719 cm�1 FT-IR (1766 and1720 cm�1, FT-Raman) and calculated at 1856 and 1805 cm�1 forN-phenylmaleimide [4]. The bands at 420 and 713 cm�1 in FT–IR(421 cm�1 in FT-Raman) spectra are assigned to C@O in-planebending and the band at 447 cm�1 in FT-IR (449 cm�1 in FT-Ra-man) is assigned out-of-plane bending which are supported by cal-culation also. For N-methylmaleimide, C@O in-plane bending isobserved at 695 cm�1 solid phase (708 cm�1 gases phase) FT-IR[4]. For maleimide, C@O vibrations are assigned at 415 and778 cm-1 in-plane and out-plane bending, respectively [7]. Thepresent calculated modes agree well with the values in the exper-imental (modes 20, 22–23) [27].
The C@C aromatic stretching vibration predicted at 1598 cm�1
(m6) is in excellent agreement with experimental observations ofboth FT-IR (1595 cm�1) and FT-Raman (1596 cm�1) spectra in Ta-ble 3. The C@C aromatic stretch is assigned at 1594 cm-1 in FT-IR(1586 cm�1, FT-Raman) [6]. Wolbaek [27] observed C@C vibrationat 1580 cm�1 for maleimide. Parker [4] observed this band at1586 cm�1 in FT-IR (1585 cm�1, FT-Raman) for N-phenylmaleim-ide. The other C–C stretch band is assigned at 1109 cm�1 in FT-IRfor N-methylmaleimide. We assigned this band at 1107 and1079 cm�1 in FT-IR which is calculated at 1128 and 1084 cm�1,respectively in this work. When the ring modes in maleimide arecompared to 2,3DBrNMM molecule, which contain one substituentgroup attached to a ring, it is seen that the ring modes (C@C, C@O,etc.) of maleimide are different in 2,3DBrNMM molecule. This dif-ference seen in the ring modes with the inclusion of a substituentgroup to maleimide can be explained depending on the corre-sponding changes in the reduced masses and force constants. Theother theoretically calculated C–C–C out-of-plane and in-planebending modes (ring deformation) have been found to be consis-tent with the recorded spectral values. The remainder of the ob-served and calculated frequencies accounted in Table 3, whichare in agreement with experimental values in the literature[3,4,6–8].
The C–N stretching frequency is a rather difficult task sincethere are problems in identifying these frequencies from othervibrations. Gall et al. [28] assigned C–N stretching at 1350 and936 cm�1 for maleimide. For N-methylmaleimide, Parker [3] ob-served the bands at 1388 and 1254 cm�1 in FT-IR and at 1384and 1254 cm�1 in FT-Raman and assigned to C–N symmetric andasymmetric stretching vibrations, respectively. The same vibra-tions were obtained at 1394 and 1146 cm�1 for N-phenylmaleim-ide [4]. In the present work, the bands assigned at 1387 cm�1,1265 in FT-IR (1382 cm�1, 1260 cm�1, FT-Raman) and at997 cm�1 in FT-IR spectrum have been assigned to C–N symmetricand asymmetric stretching vibration, respectively. The theoreti-cally computed values of C–N stretching vibration deviate nega-tively by B3LYP and positively by HF from experimental value.The TED for this mode suggests that this is a mixed mode (m10–m11, m15).
The FT-IR and FT-Raman stretching mode (at 845 and 844 cm�1,respectively) corresponding to N–CH3 moiety was calculated at826 cm�1 with B3LYP (unscaled value is 841 cm�1, agrees withexperiment) in Table 3.
The assignments of C–Br stretching and deformation vibrationshave been made on the basis of the calculated TED. Mooney [29,30]assigned vibrations of C–X group (X = Cl, Br, I) in the frequencyrange of 1129–480 cm�1. The C–Br stretching mode appears atlonger wavelength region (200–480 cm�1) as reported by Varsanyi[31]. In FT-Raman spectrum of 2,3DBrNMM, the band at 294 cm�1
is assigned to C–Br stretching vibration coupled with ring deforma-tion (mode m25). The theoretical wavenumber of this band(287 cm�1) coincides well with the experimental, and the calcu-lated TED (in 45%), confirms this assignment. Moreover, modesm17 and m13, observed at 821 and 1107 cm�1, in infrared spectrum,involve some contribution from the C–Br stretching vibration. TheC–Br in-plane bending vibration is assigned at 323 cm�1 in FT-Ra-man, which is calculated at 313 cm�1. This is in agreement withthe literature data [29–33].
The experimental bands at 3484 cm�1 and at 1930 cm�1 in FT-IR spectrum do not correspond to a fundamental transition; how-ever, they should be ascribed as the combination bands. Theremainder of the observed and calculated frequencies accountedin Table 3.
The infrared intensity for title molecule from experimental fun-damentals at 1717 cm�1 (m5) is very strong, theoretical intensity ofthese fundamentals is in the same order for HF and B3LYP meth-ods. While experimental intensity is very strong for this mode, cal-culated intensity is 1044.9 and 684.6 km mol�1 for HF and B3LYPmethods, respectively (see Table 3). This mode correspond tom(C@O) asymmetric stretching (m5).
We present RMS (r) values to make comparison with experimen-tal data, based on the calculations bottom of Table 3. As seen in Table3 the vibrational frequencies calculated by means of the B3LYPmethod are the closest to experimental data. After scaling, the RMSerrors between the observed and scaled frequencies of the moleculeare found to be 13.122 and 28.374 and the plots are linear with a unitslope and the correlation (R2) values are found to be 0.9983 and0.9997 for B3LYP and HF methods, respectively.
4.3. NMR spectra
The experimental and calculated values for 13C and 1H NMR areshown in Table 4. As in Fig. 1, the studied molecule shows threedifferent carbon atoms, which is consistent with the structure onthe basis of molecular symmetry. Due to that fact, three peaksare observed in 13C NMR spectrum. In DEPT spectra two peakswhich appear in 164.255 and 129.628 ppm in 13C spectrum cannotbe observed. Therefore, it can be concluded that the two peaks be-long to the maleimide ring and does not contain any H bond. 1Hand 13C chemical shift values (with respect to TMS) have been
M. Karabacak et al. / Journal of Molecular Structure 892 (2008) 125–131 131
calculated for the optimized structures of the title compound andcompared to the experimental chemical shift values. As can beseen in Fig. 1, molecular structure of the title compound includesmaleimide ring. This ring include nitrogen atom which shows elec-tronegative property. On the other side, oxygen atom show moreelectronegative property than bromine atom. Therefore, the chem-ical shift values of C1, C4 and C2, C3 have been observed at164.255 ppm (C@O) and 129.628 ppm (@C–Br) and calculated(with respect to TMS) 166.744, 167.999 ppm and 152.876,153.223 ppm by using HF method and 170.412, 171.570 ppm and156.517, 156.674 ppm by using B3LYP method (in Table 4). Simi-larly, other carbon peak (N–CH3) is observed at 25.731 ppm andcalculated at 25.039 and 26.581 ppm by using HF and B3LYP meth-ods, respectively. 1H NMR spectrum just one type of protons ap-pears at 3.144 ppm as a singlet. This is in accordance with DEPTspectra which also gives just one –CH3 peak, whereas the chemicalshift values (with respect to TMS) of 2.808 and 3.621 ppm, 2.752and 3.611 ppm have been determined by using HF and B3LYPmethods, respectively. As can be seen from Table 4, there is a goodagreement between experimental and theoretical chemical shiftresults for the title compound.
We present RMS (r) values to make comparison with experimen-tal data, based on the calculations bottom of Table 4. As seen in Table4 the NMR isotropic chemical shifts calculated by means of the HFmethod are the closest to experimental data. The RMS errors be-tween the observed and calculated isotropic chemical shifts of themolecule are found to be 11.823 and 13.906 and the plots are linearwith a unit slope and the correlation (R2) values are found to be0.9882 and 0.9880 for HF and B3LYP methods, respectively.
5. Conclusion
In the present work, we have performed the experimental andtheoretical vibrational, 1H and 13C chemical shifts analysis of2,3DBrNMM, for the first time. The molecular geometry, vibra-tional frequencies, infrared intensities and Raman scattering activ-ities of the molecule in the ground state have been calculated byusing ab initio HF and DFT (B3LYP) methods with 6-31G(d),6-31G(d,p), 6-31+G(d,p), 6-31++G(d,p), 6-311G(d), 6-311G(d,p),6-311+G(d,p), and 6-311++G(d,p) basis sets. The vibrational fre-quencies were calculated and scaled values (6-311++G(d,p) basisset) have been compared with experimental FT-IR and FT-Ramanspectra. The results calculated by density functional B3LYP andab initio HF methods indicate that B3LYP is superior to the scaledHF approach for molecular vibrational problems. Similarly, 1H and13C chemical shifts were calculated by HF and B3LYP methods with6-311++G(d,p) basis set and were compared with experimentalvalues. The observed and the calculated frequencies and isotropicchemical shifts are found to be in good agreement.
Acknowledgements
This work was supported by the Scientific Research fund of Af-yon Kocatepe University. Project No. 051.FENED.07. We also thankDr. Tahir Güllüoglu for SQM program Ahi Evran University,
Kırs�ehir, Turkey and Dr. Mehmet Nebioglu for NMR measurements,Sakarya University, Sakarya, Turkey.
Appendix A. Supplementary data
Supplementary figures which are related with NMR spectrawith this article can be found, in the online version. And the inter-nal coordinates and Gaussian output file are available from theauthors, on request. Supplementary data associated with this arti-cle can be found, in the online version, at doi:10.1016/j.molstruc.2008.05.014.
References
[1] G.T. Gam, J.G. Jeong, N.J. Lee, C.S. Ha, W.J. Cho, J. Appl. Polymer Sci., 57 (1995)219.
[2] J.P. Cox, F.S. Parker, Acta Cryst. C52 (1996) 2578.[3] S.F. Parker, Spectrochimica Acta A 51 (1995) 2067.[4] S.F. Parker, Spectrochimica Acta A 63 (2006) 544.[5] B.A. Rozenberg, G.N. Boiko, R.J. Morgan, E.E. Shin, Polym. Sci. Ser. A 43 (2001)
386.[6] B.V. Lokshin, V.T. Aleksanyan, Z.S. Klemenkova, L.V. Rybin, N.T. Gubbnko, J.
Organomet. Chem. 74 (1974) 97.[7] L. Harsányi, P. Császár, G. Fogarasi, G. Horváth, I. Szilágyi, J. Mol. Struct. 104
(1983) 79.[8] L. Harsányi, É. Vajda, I. Hargittai, J. Mol. Struct. 129 (1985) 315.[9] D.H.A. ter Steege, W.J. Buma, J. Chem. Phys. 118 (24) (2003).
[10] C.W. Miller, C.E. Hoyle, E.J. Valente, D.H. Magers, E.S. Jönsson, J. Phys. Chem. A103 (1999) 6406.
[11] C.A. McPhallen, M.N.G. James, Acta Cryst. C39 (1983) 1439.[12] D.C. Young, Computational Chemistry: A Practical Guide for Applying
Techniques to Real World Problems (Electronic), John Wiley & Sons Inc., NewYork, 2001.
[13] N. Sundaraganesan, S. Ilakiamani, H. Saleem, P.M. Wojciechowski, D.Michalska, Spectrochimica Acta A 61 (2005) 2995.
[14] J. Baker, A.A. Jarzecki, P. Pulay, J. Phys. Chem. A 102 (1998) 1412.[15] K. Wolinski, J.F. Hinton, P. Pulay, J. Am. Chem. Soc. 112 (1990) 8251.[16] J.R. Cheeseman, G.W. Trucks, T.A. Keith, M.J. Frisch, J. Chem. Phys. 104 (1996)
5497.[17] A. Frisch, A.B. Nielsen, A.J. Holder, Gaussview Users Manual, Gaussian Inc.,
Pittsburg.[18] M. J. Frisch et al., Gaussian 03, Revision B.4, Gaussian Inc., Pittsburgh PA, 2003.[19] Hui-Ying An, Zhi-Feng Lu, Yong-Miao Shen, Jian-Hua Xu, Acta Cryst. E62
(2006) o70.[20] M. Karabacak, M. Çınar, M. Kurt, J. Mol. Struct. 885 (1-3) (2008) 28.[21] M. Kurt, M. Yurdakul, S�. Yurdakul, J. Mol. Struct. (Theochem) 711 (2004) 25.[22] D. Lin-Vien, N.B. Colthup, W.G. Fateley, J.G. Grasselli, The Handbook of Infrared
and Raman Characteristic Frequencies of Organic Molecules, Academic Press,1991.
[23] A.B. Dempster, D.B. Powell, N. Sheppard, Spectrochimica Acta 28A (1972) 373.[24] M. Silverstein, G. Clayton Basseler, C. Morill, Spectrometric Identification of
Organic Compounds, Wiley, New York, 1981.[25] M. Karabacak, E. Sahin, M. Çınar, _I. Erol, M. Kurt, J. Mol. Struct. 892 (2008)
25.[26] M. Karabacak, D. Karagöz, M. Kurt, J. Mol. Struct. 892 (2008) 25.[27] T. Wolbaek, P. Klaboe, C.J. Nielsen, J. Mol. Struct. 27 (1975) 283.[28] L. Le Gall, P. Caillet, M.T. Forel, J. Chim. Phys. 75 (1978) 444.[29] E.F. Mooney, Spectrochimica Acta 20 (1964) 1021.[30] E.F. Monney, Spectrochimica Acta 19 (1963) 877.[31] G. Varsanyi, Assignments of Vibrational Spectra of 700 Benzene Derivatives,
Wiley, New York, 1974.[32] N. Sundaraganesan, H. Saleem, S. Mohan, M. Ramalingam, V. Sethuraman,
Spectrochimica Acta A 62 (2005) 740.[33] N. Sundaraganesan, C. Meganathan, B. Anand, C. Lapouge, Spectrochimica Acta
A 66 (2007) 773.


![Efficient synthesis of 2- and 3-substituted-2,3-dihydro [1,4]dioxino[2,3- b]pyridine derivatives](https://static.fdokumen.com/doc/165x107/6324e7974643260de90d793b/efficient-synthesis-of-2-and-3-substituted-23-dihydro-14dioxino23-bpyridine.jpg)
![Vibrational spectroscopic (FT-IR and FT-Raman) studies, HOMO-LUMO, NBO analysis and MEP of 6-methyl-1-({[(2E)-2-methyl-3-phenyl-prop-2-en-1-yl]oxy}methyl)-1,2,3,4-tetra-hydroquinazoline-2,4-dione,](https://static.fdokumen.com/doc/165x107/633494f441100cab3c07ce05/vibrational-spectroscopic-ft-ir-and-ft-raman-studies-homo-lumo-nbo-analysis.jpg)