Pengaruh jarak nugget..., Subowo, FT UI, 1997 Pengaruh jarak nugget..., Subowo, FT UI, 1997
Upload
independentCategory
view
3download
0
Indian Journal of Pure & Applied Physics Vol. 48, February 2010, pp. 85-94
Ab-initio calculations, FT-IR and FT-Raman spectra of 2-chloro-6-methyl benzonitrile
Virendra Kumar1, Y Panikar2, M A Palafox3, J K Vats1, I Kostova4, K Lang5 & V K Rastogi1
1Department of Physics, C C S University, Meerut 250 004, India 2Department of Physics, T K M College, Kollam, Kerala, India
3Departamento de Química-Física I, Facultad de Ciencias Químicas, Universidad Complutense, Madrid-28040, Spain 4Department of Chemistry, Faculty of Pharmacy, 2 Dunav St, Sofia 1000, Bulgaria
5Department of Kinetics, Institute of Inorganic Chemistry, Academy of Sciences of the Czech Republic, Czech Republic 1E-mail: [email protected]
Received 10 June 2009; accepted 8 October 2009
FT-IR spectrum of 2-chloro-6-methyl benzonitrile in the region 400-4000 cm–1 has been recorded in KBr pellet technique with a Bruker IFS-66 Fourier transform spectrometer. FT-Raman spectrum in powder form has been recorded in the region 50-4000 cm–1 on a Bruker IFS 66 optical bench with an FRA 106 Raman module attachment interfaced to a microcomputer. Geometry and vibrational wavenumbers were calculated using ab-initio calculations with HF method. The results were compared with experimental values. The observed FT-IR and FT-Raman vibrational frequencies were analyzed and assigned to different normal modes of the molecule. Most of the modes have wavenumbers in the expected range and the error obtained was, in general, very low. Using PEDs, the contributions were determined for different modes to each wavenumber. From the PED, it is apparent that the frequency corresponding to C≡N stretching contains 88% contribution from the C≡N stretching force constant and it mixes with C-CN stretching mode to the extent of 12%.
Keywords: Ab-initio calculations, FT-IR, FT-Raman spectra
1 Introduction Benzonitrile (BN) is a phenyl cyanide compound which is derived mainly from benzoic acid reaction with lead thiocyanate by heating. It is colourless liquid with a boiling point of 197°C and having a smell of bitter almonds. It reacts violently with strong acids to produce toxic hydrogen cyanide and it decomposes on heating, producing very toxic fumes of hydrogen cyanide and nitrous oxides1. Several benzonitrile derivatives have important applications and the importance of these compounds has been reviewed recently2. Benzonitrile is used as a solvent and chemical intermediate for the synthesis of pharmaceuticals, dye stuffs and rubber chemicals through the reactions of alkylation, condensation, esterification, hydrolysis, halogenation or nitration. Benzonitrile (BN) and its derivatives are used in the manufacturing of lacquers, polymers and anhydrous metallic salts as well as intermediates for pharmaceuticals, agrochemicals and other organic chemicals. Many derivatives of benzonitrile are used in medicine as urinary antiseptic in the form of salt and in vapour form for disinfecting bronchisl tubes.
They are also used in dye industry for making aniline blue and for preserving food products3. Several BN derivatives have important applications, e.g. 3-ethyl-BN for the treatment of urge urinary incontinence4 (UUI), vamicamide (a new antichloinergic agent synthesized from BN) also for treatment5 of UUI, p-hydroxy BN has alpha blocker properties on the cardiovascular system of rats6, BN, 3-chloro BN, and 4-chloro BN for the inhibition of the hydrogen absorption (i.e. the corrosion) of steel, although 2-chlorobenzonitrile increases the hydrogen absorption7. From the spectroscopic point of view, the vibrational spectra of benzonitrile8,9 and its mono-substituted10,11 and disubstituted12,13 derivatives have been extensively studied. Force field calculations have also been made in a few cases using the classical method14 developed by Wilson to support the vibrational analysis. Boxer and co-workers15-18 have used vibrational Stark spectroscopy to show that the υ(C≡N) wavenumber of nitriles, especially aromatic nitriles, is highly sensitive to electric field in its environment.

INDIAN J PURE & APPL PHYS, VOL 48, FEBRUARY 2010
86
Density functional theoretical modeling of substituted benzene and benzonitrile have been reported by Fleming et al
19,20. Sundaraganesan et al.
21
have reported the molecular structure and vibrational spectra of 3-chloro-4-fluorobenzonitrile by ab-initio
HF and density functional methods. The F- and Cl-monosubstituted BN derivatives have been investigated by vibrational spectroscopy22,23 and in some cases also by ultraviolet (UV) absorption spectroscopy24. Chloro-disubstituted25 BN and chloro-and methyl-disubstituted26-28 BNs have also been studied by infrared (IR) spectroscopy. Rastogi et al.
29a have reported vibrational wavenumbers and several thermodynamical parameters for the, 2,3- ; 2,4- ; and 3,5- difluorobenzonitriles using ab-initio quantum chemical methods. However, a complete vibrational analysis on 2-chloro-6-methylbenzonitrile molecule has not been reported as yet, although its Raman spectrum have been reported by Mohan et al
29b. They assigned only prominent bands by assuming that the molecule belongs to Cs point group. Therefore, the present investigation has been undertaken to study the vibrational spectra of this molecule completely and to identify the various normal modes of vibration. HF ab-initio calculations were performed to support our frequency assignments.
2 Experimental Details The pure sample of 2-chloro-6-methylbenzonitrile (solid) was obtained from M/s Sigma Chemical Co, St Louis, MO, USA) and used as such without any further purification. The mid-infrared spectrum of the compound in powder form in the region 400-4000 cm–1 was recorded with a Bruker IFS-66 Fourier transform spectrometer equipped with a Globar source, Ge/KBr beamsplitter and a TGS detector. For the spectrum acquisition,50 interferograms were collected at 4 cm−1 resolution. The FT-Raman spectrum in the region 50-4000 cm−1 was recorded on a Bruker IFS 66 optical bench with an FRA 106 Raman module attachment interfaced to a microcomputer. The sample was mounted in the sample illuminator using optical mount and no sample pretreatment of any kind was undertaken. The NIR output (1064 nm) of an Nd: YAG laser was used to excite the spectrum. The laser power was set at 250 mW and the spectrum was recorded over 500 scans at a fixed temperature. The spectral resolution was 6.0 cm−1 after apodisation. The spectra are shown in Figs 1-4.
3 Computational Methods
The calculations of vibrational wavenumbers and geometrical parameters were carried out by using
Fig. 1 — Infrared spectrum of 2-chloro-6-methylbenzonitrile

KUMAR et al.: AB-INITIO CALCULATIONS OF 2-CHLORO-6-METHYL BENZONITRILE
87
Fig. 2 — Infrared spectrum of 2-chloro-6-methylbenzonitrile
Fig. 3 — Raman spectrum of 2-chloro-6-methylbenzonitrile

INDIAN J PURE & APPL PHYS, VOL 48, FEBRUARY 2010
88
Fig. 4 — Raman spectrum of 2-chloro-6-methylbenzonitrile
ab-initio methods, including HF/6-31G* and HF/6-311+G* level. These procedures are implemented in the Gaussian 03 program package30. The optimum geometry was determined with the keyword OPT, by minimizing the energy with respect to all geometric parameters without imposing molecular symmetry constraints. The keyword FREQ was used for wavenumber calculations. The potential energy distribution (PED) is calculated with the help of GAR2PED software package31. 4 Results and Discussion Molecular geometry — The optimized bond lengths and bond angles of 2-chloro-6-methyl benzonitrile using HF/6-311+G* are given in Table 1. The labeling of the atoms is shown in Fig. 5. Experimental data of the isolated molecule in the gaseous phase has not been reported. Since bond lengths in the crystal data are usually smaller than in the gas phase, the HF calculations may describe the bond lengths of 2-chloro-6-methylbenzonitrile in the gaseous phase correctly. In general, the values obtained in bond lengths and angles are very similar in accordance with the microwave data32, and NMR results33 reported in the case of benzonitrile (BN)
molecule. The differences are in accordance with the average errors reported for these methods34,35. However, some particular differences may be seen. It is noted that the benzene rings appear a little distorted with larger C1-C2, C5-C6 and C1-C6 bond lengths and shorter C2-C3, C3-C4 and C4-C5 and angles slightly out of the regular hexagonal structure. These distortions may be explained in terms of the change in hybridization affected by the substituent at the carbon site to which it is appended. 4.1 Wavenumbers
The observed IR and Raman bands with their relative intensities, calculated wavenumbers and assignments are presented in Table 2. C≡N vibrations — Nitrogen compounds featuring triple or cumulated double bonds, such as cyanides or nitriles and cyanates , all provide a unique spectrum, typically with a single36,37, normally intense absorption in the range 2280-2200 cm−1 (for cyano compounds) and 2285-1990 cm−1 (for cyanates, isocyanates and thiocyanates). The geometry of the cyano group is affected insignificantly by a new substituent on the phenyl ring. Hence, the vibrational wavenumber of the cyano group remains almost

KUMAR et al.: AB-INITIO CALCULATIONS OF 2-CHLORO-6-METHYL BENZONITRILE
89
unchanged from the benzonitrile molecule. Electron withdrawing groups, such as −Cl, −F, −Br, −NO2, −OH or CF3, decrease the IR band intensity and increase the wavenumber value to the higher limit of the characteristic spectral region38, whereas electron-donating groups, such as the amino group, increase the IR intensity and decrease the wavenumber. Experimentally in mono-substituted benzonitriles, this vibration appears in the range 2220-2240 cm−1, whereas in disubstituted benzonitriles at 2230 cm–1 in accordance with scaled values of 2238 cm–1 in 4-aminobenzonitrile and 2248 cm−1 in benzonitrile with an IR intensity that varies from medium-weak to strong depending on the substitutent25a,39. In the present case, the stretching mode υ(C≡N) is observed at 2225 in IR and at 2227 cm−1 in Raman corresponding to theoretically observed band at 2240 cm−1 (Table 2). As in benzonitrile molecule and its derivatives, this stretching mode appears with the strongest Raman intensity. The intensity is enhanced by the conjugation of the phenyl ring.
Aromatic nitriles have two bands, one band is of strong intensity in the region 580-540 cm−1 and other of medium intensity in the region 430-380 cm–1. The former band is due to the combination of the out-of-plane aromatic ring deformation vibration and the in-plane deformation vibration of the −C≡N group. The latter band is due to the in-plane bending of the aromatic ring C−CN bond40. In the present case, these deformation modes are observed at 601, 580, 411 cm−1 in the IR spectrum, at 602, 582, 411 cm–1 in the Raman spectrum and theoretically by HF/6-311+G* at 608, 587, 416, cm−1, and at 380, 200, 145, 91 cm−1 by HF/6-31G*. This is in agreement with the literature data41, 42. Krishna Kumar et al.
43 assigned the bands at 229 and 131 cm–1 to the individual CN out-of-plane and in-plane deformations, respectively for 4-bromobenzonitrile. For benzonitrile derivatives, the ring C-CN deformations are reported44 at 370, 392, 394, 437, 455, 471, 561 and 638 cm−1 . C-Cl vibration — The vibrations belonging to the bond between the ring and the halogen atom are worth to discuss since mixing of vibrations are possible due to the lowering of the molecular symmetry and the presence of heavy atoms on the periphery of the molecule45. The assignments of C-Cl group vibrations have been made by comparison with the halogen-substituent benzene derivatives46,47. Mooney48,49 assigned vibrations of C–X group (X = Cl, Br, I) in the frequency range 1129-480 cm−1. The C-Cl stretching vibrations give generally strong bands in the region50 710-505 cm−1. However, vibrational
Fig. 5 — Structure of 2-chloro-6-methylbenzonitrile
Table 1 — Optimized geometrical parameters of 2-chloro-6-methylbenzonitrile
Bond length Bond angles
HF/6-311+G* Expt32,33 HF/6-311+G* Expt32,33
C1-C2 1.3901 1.399 A(2,1,6) 119.6 120.0 C1-C6 1.4034 1.402 A(2,1,11) 121.2 119.9 C1-C11 1.4334 1.431 A(6,1,11) 119.3 119.9 C2-C3 1.3771 1.387 A(1,2,3) 121.7 119.9 C2-Cl12 1.7988 1.741 A(1,2,12) 120.0 120.6 C3-C4 1.3855 1.391 A(3,2,12) 118.2 120.1 C3-H7 1.0679 A(2,3,4) 118.7 119.3 C4-C5 1.3851 1.387 A(2,3,7) 120.1 C4-H8 1.0704 A(4,3,7) 121.3 C5-C6 1.3890 1.388 A(3,4,5) 120.5 120.1 C5-H9 1.0701 1.074 A(3,4,8) 119.5 C6-C10 1.5074 A(5,4,8) 120.0 C10-H13 1.0794 A(4,5,6) 121.1 120.2 C10-H14 1.0819 A(4,5,9) 119.7 119.0 C10-H15 1.0819 A(6,5,9) 119.2 121.6 C11-N16 1.1415 1.152 A(1,6,5) 118.4 119.7 A(1,6,10) 120.7 120.0 A(5,6,10) 120.9 120.2 A(6,10,13) 110.6 A(6,10,14) 111.3 A(6,10,15) 111.3 A(13,10,14) 108.1 A(13,10,15) 108.1 A(14,10,15) 107.3
INDIAN J PURE & APPL PHYS, VOL 48, FEBRUARY 2010
90
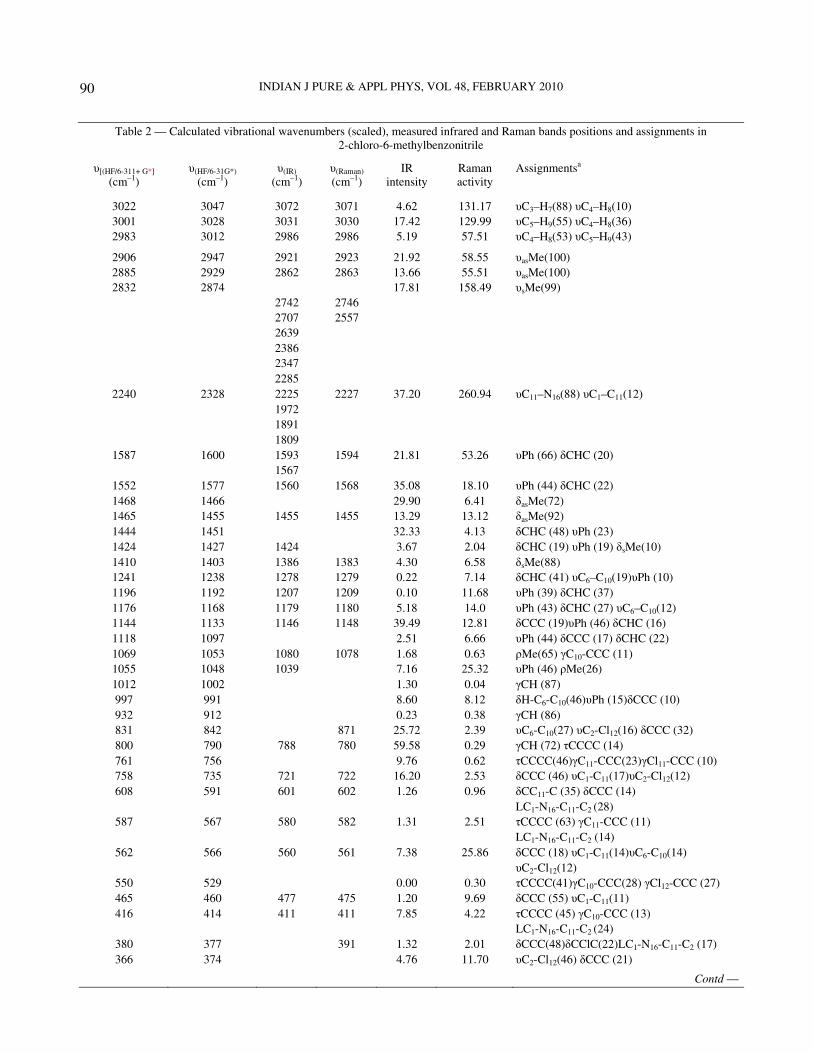
Table 2 — Calculated vibrational wavenumbers (scaled), measured infrared and Raman bands positions and assignments in 2-chloro-6-methylbenzonitrile
υ[(HF/6-311+ G*] υ(HF/6-31G*) υ(IR) υ(Raman) IR Raman Assignmentsa (cm–1) (cm–1) (cm–1) (cm–1) intensity activity
3022 3047 3072 3071 4.62 131.17 υC3–H7(88) υC4–H8(10) 3001 3028 3031 3030 17.42 129.99 υC5–H9(55) υC4–H8(36) 2983 3012 2986 2986 5.19 57.51 υC4–H8(53) υC5–H9(43)
2906 2947 2921 2923 21.92 58.55 υasMe(100) 2885 2929 2862 2863 13.66 55.51 υasMe(100) 2832 2874 17.81 158.49 υsMe(99)
2742 2746 2707 2557 2639 2386 2347 2285
2240 2328 2225 2227 37.20 260.94 υC11–N16(88) υC1–C11(12) 1972 1891 1809
1587 1600 1593 1594 21.81 53.26 υPh (66) δCHC (20) 1567
1552 1577 1560 1568 35.08 18.10 υPh (44) δCHC (22) 1468 1466 29.90 6.41 δasMe(72) 1465 1455 1455 1455 13.29 13.12 δasMe(92) 1444 1451 32.33 4.13 δCHC (48) υPh (23) 1424 1427 1424 3.67 2.04 δCHC (19) υPh (19) δsMe(10) 1410 1403 1386 1383 4.30 6.58 δsMe(88) 1241 1238 1278 1279 0.22 7.14 δCHC (41) υC6–C10(19)υPh (10) 1196 1192 1207 1209 0.10 11.68 υPh (39) δCHC (37) 1176 1168 1179 1180 5.18 14.0 υPh (43) δCHC (27) υC6–C10(12) 1144 1133 1146 1148 39.49 12.81 δCCC (19)υPh (46) δCHC (16) 1118 1097 2.51 6.66 υPh (44) δCCC (17) δCHC (22) 1069 1053 1080 1078 1.68 0.63 ρMe(65) γC10-CCC (11) 1055 1048 1039 7.16 25.32 υPh (46) ρMe(26) 1012 1002 1.30 0.04 γCH (87) 997 991 8.60 8.12 δH-C6-C10(46)υPh (15)δCCC (10) 932 912 0.23 0.38 γCH (86) 831 842 871 25.72 2.39 υC6-C10(27) υC2-Cl12(16) δCCC (32) 800 790 788 780 59.58 0.29 γCH (72) τCCCC (14) 761 756 9.76 0.62 τCCCC(46)γC11-CCC(23)γCl11-CCC (10) 758 735 721 722 16.20 2.53 δCCC (46) υC1-C11(17)υC2-Cl12(12) 608 591 601 602 1.26 0.96 δCC11-C (35) δCCC (14)
LC1-N16-C11-C2 (28) 587 567 580 582 1.31 2.51 τCCCC (63) γC11-CCC (11)
LC1-N16-C11-C2 (14) 562 566 560 561 7.38 25.86 δCCC (18) υC1-C11(14)υC6-C10(14)
υC2-Cl12(12) 550 529 0.00 0.30 τCCCC(41)γC10-CCC(28) γCl12-CCC (27) 465 460 477 475 1.20 9.69 δCCC (55) υC1-C11(11) 416 414 411 411 7.85 4.22 τCCCC (45) γC10-CCC (13)
LC1-N16-C11-C2 (24) 380 377 391 1.32 2.01 δCCC(48)δCClC(22)LC1-N16-C11-C2 (17) 366 374 4.76 11.70 υC2-Cl12(46) δCCC (21)
Contd —

KUMAR et al.: AB-INITIO CALCULATIONS OF 2-CHLORO-6-METHYL BENZONITRILE
91
Table 2 — Calculated vibrational wavenumbers (scaled), measured infrared and Raman bands positions and assignments in 2-chloro-6-methylbenzonitrile — Contd
υ[(HF/6-311+ G*] υ(HF/6-31G*) υ(IR) υ(Raman) IR Raman Assignmentsa
(cm–1) (cm–1) (cm–1) (cm–1) intensity activity
229 231 237 1.53 1.18 δCClC (53) δCC10-C (23) 219 213 210 0.68 1.35 τCCCC(47) γC10-CCC(19)γC11-CCC(12) 200 200 0.12 0.18 γC11-CCC (29) γCl12-CCC 145 140 157 3.15 3.92 δCC11-C (48) δCCl12-C (10)
LC1-N16-C11-C2 (40) 113 108 0.38 0.23 τCCMe (87) 91 91 96 1.58 0.10 τCCCC (60) γC11-CCC (12)
LC1-N16-C11-C1 (18) υ–stretching, δ-in-plane bending, γ–out-of-plane bending, τ–torsion, L–linear bending, Me- Methyl; Ph-Phenyl; υasMe- CH3 asymmetric stretching; υsMe- CH3 symmetric stretching aPED, potential energy distribution, only contribution larger than 10% were given.
coupling with other groups may result in a shift in the absorption band as high as 840 cm−1. For simple chlorine containing organic compounds, C-Cl absorptions are in the region 750-700 cm−1, whereas for the trans-and gauche-forms40 they are near 650 cm−1. In the present study, the band observed at 871 cm−1 in the Raman spectrum has been identified as C-Cl stretching corresponding to theoretically calculated value 842 cm−1 (HF/6-31G*). This mode is not pure but contains significant contributions from other modes (Table 2). This result is in agreement with the reported values given by Varghese et al.
51, George et al.
52 and Palafox et al.2 Sundaraganesan
et al.21 reported υ(C-Cl) at 704 (IR), 705 (Raman),
715 (theoretical value) and the deformation bands of C-Cl at 250 and 160 cm–1. C-Cl stretching modes are reported at around 738 cm–1 for dichloromethane38,47 whereas, Pazdera et al.
53,54 reported the C-Cl stretching mode at 890 cm–1. C-H vibrations — The C-H stretching vibrations occur above 3000 cm−1 and are typically exhibited as weak to moderate bands36,37. In the present study, the bands observed at 3072, 3031, 2986 cm−1 in the IR and at 3071, 3030, 2986 cm−1 in the Raman spectra are identified as the C-H stretching modes of the phenyl ring, which correspond to theoretically calculated values 3022, 3001 and 2983 cm−1. The out-of-plane and in-plane C-H bending vibrations of the phenyl ring are expected to appear in the range 700-1000 cm−1 and 1000-1300 cm−1, respectively36,55. Generally, the C-H out-of-plane deformations with the higher wavenumbers have weaker intensity than those absorbing at lower wavenumbers. In the present study, the out-of-plane C-H vibrations are identified at 780 cm–1 in the
Raman spectrum and at 788 cm–1 in the IR spectrum, while the ab-initio calculations give these modes at 1012, 932, 800 cm−1. The in-plane C-H vibrations of the phenyl ring are also identified and most of the modes are not pure but contains a significant contribution from other modes (Table 2). CH3 group vibrations — In aromatic compounds, the CH3 asymmetric stretching vibrations are expected in the range 2925-3000 cm−1 and the symmetric CH3 vibrations36,38 in the range 2905-2940 cm−1. The first of these results from the antisymmetric stretching, υas(CH3) mode in which the two C-H bonds of the methyl group are extending while the third one is contracting. The second arises from the symmetric stretching, υs(CH3) in which all three C-H bonds extend and contract in phase. The asymmetric stretching modes of the methyl group are calculated at 2906, 2885 cm−1 and the symmetric mode at 2832 cm−1 (HF). Therefore, the bands observed at ~ 2921, 2862 cm−1 are assigned as asymmetric stretching modes of the methyl group. In the present study, the symmetric stretching νs Me could be observed neither in IR nor in Raman. The asymmetric and symmetric stretching modes of the methyl group attached with the benzene ring are usually down shifted due to electronic effects56.
Two bending modes can occur within a methyl group. The first of these, the symmetric bending vibration, involves the in-phase bending of the C-H bonds. The second, the antisymmetrical bending vibration, involves out-of-phase bending of the C-H bonds. The asymmetric deformations are expected in the region36 1400-1485 cm−1. The calculated values of δas(CH3) appear at 1468 and 1465 cm−1 (HF). Therefore, the band observed at

INDIAN J PURE & APPL PHYS, VOL 48, FEBRUARY 2010
92
1455 cm−1 in both IR and Raman spectra is assigned to this mode. In many molecules, the symmetric deformation δs(CH3) is expected to appear in the range 1360-1390 cm–1 with an intensity varying from medium to strong36. The HF calculations give δs(CH3) at 1410 cm–1 and therefore, the band observed at 1386 cm−1 in IR and at 1383 cm−1 in Raman spectra is assigned to this mode. Aromatic compounds display a methyl rock (ρCH3) in the neighbourhood36 of 1045 cm−1. The second rock in the region 970 ± 70 cm−1 is more difficult to find among the C-H out-of-plane deformations36. For the title compound, these ρ(CH3) modes are calculated at 1069 and 1055 cm–1 (HF). The bands at 1080, 1039 cm–1 in the IR and at 1078 cm−1 in the Raman spectra are identified as ρ(CH3) modes. These modes are not pure but contains contributions from phenyl ring vibrations (Table 2). Methyl groups are generally referred as electron donating substituents in the aromatic ring system57. Hyperconjugation causes the interaction of the orbital of a methyl group with the π orbital of an aromatic ring system58-60. This interaction occurs with the releasing of electronic charge from methyl group to the C–C bond that connects the two interacting groups. The most evident effect of this interaction is that the C6-C10 bond decreases in length from its normal value (1.54 Å) and increases in strength, but effects of hyperconjugation can also be on C-H bonds. C-C vibrations — There are six equivalent C–C bonds in benzene and consequently, there will be six C−C stretching vibrations. In addition, there are several in-plane and out-of-plane bending vibrations of the ring carbons. The benzene ring possesses six ring stretching vibrations, of which the four with the higher wavenumbers36 occur, respectively, near 1600, 1580, 1490, 1440 cm−1. With heavy substituents, the bands tend to shift to somewhat lower values. The bands observed at 1593, 1560, 1424, 1207, 1039 cm−1 in IR spectrum and 1594, 1568, 1209 cm−1 in Raman spectrum are identified as ring stretching modes. The corresponding calculated values for these modes appear at 1587, 1552, 1444, 1424, 1196, 1118, 1055 cm−1 (HF). In the benzene ring, fundamentals (992 cm−1) and (1010 cm–1) represent the ring breathing mode and carbonal trigonal bending mode, respectively. When a substituent like C≡N or Cl is directly conjugated to the aromatic ring, a doublet61,62 is observed in the range 1625-1575 cm−1 and for the title compound we have observed such vibrations at 1593 and 1567 cm−1 in the IR spectrum. The ring breathing and trigonal bending modes of the title
compound are assigned at 997 and 1055 cm−1, respectively, by PED calculations. The C-C-C out-of-plane and in-plane bending modes of the phenyl ring have been found to be consistent with the experimental observations (Table 2). A series of overtone and combination bands are observed in the IR spectrum in the range 1809-2742 cm−1 which is quite common in the spectra having C-C stretching and C-H bending vibrations. In order to investigate the performance of vibrational wavenumbers of the title compound, root mean square (RMS) values between calculated and observed wavenumbers were calculated using the following expression63.
( )n 2calc exp
i ii
1RMS
1n= υ − υ
−∑
The RMS error of the observed IR and Raman bands were found to be 38.76 (HF/6-31G*), 23.74 (HF/6-311+G*) and 36.32 (HF/6-31G*), 23.69 (HF/6-311+G*), respectively. The small difference between experimental and calculated vibrational modes are observed. It must be due to the fact that hydrogen bond vibrations present in the crystal lead to strong perturbation of the IR wavenumbers and intensities of many other modes. Also, we state that experimental results belong to the solid phase and theoretical calculations belong to the gaseous phase. First hyperpolarizability — Analysis of organic molecules having conjugated π-electron systems and large hyperpolarizability using infrared and Raman spectroscopy has been evolved as a subject of research64. The potential applications of the substituted benzonitriles demand the investigation of their structural and bonding features contributing to the hyperpolarizability enhancement, by analyzing the vibrational modes using the IR and Raman spectra. In the present study, the ring stretching bands at 1593, 1560, 1207, 1179, 1146 cm−1 observed in IR have their counterparts in Raman at 1594, 1568, 1209, 1180, 1148 cm−1, respectively and their relative intensities in IR and Raman spectra are comparable. The first hyperpolarizability (β0) of this molecular system can calculated using HF/6-311+G* basis set, based on the finite field approach. In the presence of an applied electric field, the energy of a system is a function of the electric field. First hyperpolarizability is a third rank tensor that can be described by a 3 × 3 × 3 matrix. The 27 components of the 3D matrix can be reduced to 10 components due to the Kleinman

KUMAR et al.: AB-INITIO CALCULATIONS OF 2-CHLORO-6-METHYL BENZONITRILE
93
symmetry65. The components of β are defined as the coefficients in the Taylor series expansion of the energy in the external electric field. When the electric field is weak and homogeneous, this expansion becomes:
i i j i j ko i ij ijk
i j ijk
1 1
2 6i
E E F F F F F F= − µ − α − β∑ ∑ ∑
i j k lijkl
ijkl
1....
24F F F F− γ +∑
where E0 is the energy of the unperturbed molecule, F
i is the field at the origin, µi, αij, βijk and γijkl are the
components of dipole moment, polarizability, the first hyper polarizabilities and second hyperpolariz-abilities, respectively. The calculated first hyperpola-rizability of the title compound is 1.044×10⁻³⁰ esu, which is comparable with the reported values of similar derivatives66.
5 Conclusions
The equilibrium geometries and the harmonic frequencies of 2-chloro-6-methylbenzonitrile were determined and analysed. The small distortions of the benzene ring are explained in terms of the change in hybridisation affected by the substituent at the carbon site to which it is appended. An accurate assignment of the vibrational bands was carried out with the help of ab-initio HF method. The difference between the observed and calculated wavenumber values of most of the fundamentals is very small and therefore, the assignment seems to be correct. Acknowledgement
The authors are thankful to Prof Of Nielsen, Department of Chemistry, University of Copenhagen, Copenhagen, Denmark for recording the FT-IR and FT-Raman spectra. One of the authors (VKR) is thankful to Prof S K Kak, Vice Chancellor, CCS University, Meerut, India to motivate and to provide necessary research facilities in the department. References
1 Krishnakumar V, Keresztury G, Sundius R T & Ramaswamy, J Mol Struct, 704 (2004) 9.
2 Palafox M A, Rastogi V K & Mittal L, Int J Quantum Chem, 94 (2003) 189.
3 Irugartingev H, Fettle E, Eschev T, Tinneteld P, Nord S, Fauer M, Eur J Org Chem, 3 (2000) 455.
4 Butera J, Antane M M, Antane S A, Argentieri T M, Freeden C, Graceffa R F, Hirth B H, Jenkins D, Lennox J R, Matelan E, Norton N W, Quagliato D, Sheldon J H, Spinelli W, Warga D, Wajdan A, Woods M, J Med Chem, 43 (2000) 1187;1203.
5 Kagara K, Goto S & Ichihara M, J Synt Org Chem Jpn, 57 (1999) 415.
6 Cheav SL, Kirkiacharian S, Pieri F & Poisson D, Ann Phar
Fr, 56 (1998) 205. 7 Agarwal R & Namboodhri T K G, J Appl Electrochem, 27
(1997) 1265. 8 Bhattacharjee D, Purkayastha A G, Misra T N & Nandy S K,
J Raman Spectrosc, 27 (1996) 457. 9 (a) Csaszar A G & Fogarasi G, Spectrochim Acta, 45A
(1989) 845; (b) Csaszar A G, Fogarasi G & Boggs J E, J
Phys Chem I, 93 (1989) 7644; (c) Higgins J, Zhou X F & Liu R F, Spectrochim Acta, 53A (1997) 721.
10 (a) Rastogi V K, Mital H P, Sharma S N & Chattopadhya, Indian J Phys, 65B (1991) 356; (b) Goel R K & Agarwal M L, Spectrochim Acta, 38A (1992) 583; (c) Arenas J F, Marcos J L & Ramirez F J, Canadian J Spectrosc, 34 (1989) 1; (d) Binev I T, Tsenov J A, Velcheva E A, Radomirska V B & Juchnovski I N, J Molec Struct, 14 (1996) 133; (e) Palafox M A, Rastogi V K, Mittal L, Kiefer W & Mital H P, Int J Quantum Chem,106 (2006) 1885; (f) Palafox M A, Rastogi V K & Vats J K, J Raman
Spectrosc, 37 (2006) 85; (g) Pathak A N & Sinha B K, Indian J Pure & Appl Phys, 18 (1980) 619; (h) Sinha S P & Chatterjee C L, Indian J Pure & Appl Phys, 14 (1976) 419; (i) Rastogi V K, Palafox M A, Lal B & Jain V, Indian J Pure
& Appl Phys, 38 (2000) 564. 11 Kumar A P & Rao G R, Spectrochim Acta, 53A (1997) 2023,
2033, 2041, 2049. 12 Bottura G, Arora S, Gupta J K & Rastogi V K, Asian J Phys,
1 (1992) 58. 13 (a) Chandra R, Singh A & Singh T P, Asian J Phys, 2 (1993)
50; (b) Rastogi VK, Singhal Surabhi, Kumar A Pavan, Rao G Ramana, Palafox MA, Indian J Pure & Appl Phys, (2009), In Press.
14 Rastogi V K, Arora C B, Singhal S K, Singh D N & Yadav R A, Spectrochim Acta, 53A (1997) 2505.
15 Andres S S & Boxer S G, J Phys Chem A, 104 (2000) 11853.
16 Andrews S S & Boxer S G, J Phys Chem A, 106 (2002) 469. 17 Suydam I T & Boxer S G, Biochemistry, 42 (2003) 12050. 18 Suydam I T, Snow C D, Pande V S & Boxer S G, Science,
313 (2006) 200. 19 Fleming G D, Golsio I, Aracena A, Celis F, Vera L,
Koch R, Campos-Vallette M, Spectrochim Acta, 71A (2008) 1074.
20 Fleming G D, Golsio I, Aracena A, Celis F, Vera L, Koch R & Campos-Vallette M, Spectrochim Acta, 71A (2008) 1049.
21 Sundaraganesan N, Meganathan C, Joshua BD, Mani P & Jayaprakash A, Spectrochim Acta, 71A (2008) 1134.
22 Maiti S, Jaman A I, Datta A & Nandi R N, J Mol Spectrosc, 140 (1990) 416.
23 Sharma SD & Doraiswamy S, J Mol Spectrosc, 180 (1996) 7. 24 Ramu K, Rao C G & Santhamma C, Spectrochim Acta, 49A
(1993) 223. 25 (a) Joshi A, Suryanarayana K R & Shashidhar M A, Curr
Sci, 57 (1988) 477; (b) Rastogi V K, Jain V, Palafox M A, Singh D N & Yadav R, Spectrochim Acta, 57A (2001) 209.
26 Aralakkanavar M K, Joshi A M, Rao R, Suryanarayana K R & Shashidhar M A, Indian J Phys, 64B (1990) 152.
27 Mohan S, Murugan R & Srinivasan S, Proc Natl Acad Sci
Ind (Phys Sci), 62 (1992) 121. 28 Goel R K, Sharma S K & Sharma S N, Indian J Pure & Appl
Phys, 21 (1983) 61.

INDIAN J PURE & APPL PHYS, VOL 48, FEBRUARY 2010
94
29 (a) Rastogi V K, Palafox M A, Tanwar R P & Mittal L, Spectrochim Acta, 58A (2002) 1987; (b) Mohan S, Murugan R & Srinivasan S, Proc Nat Acad Sci India, 62 A (1992) 12.
30 Nakatsuji N, Hada M, Ehara M, Toyota K, Fukuda R, Hasegawa J, Ishida M, Nakajima T, Honda Y, Kitao O, Nakai H, Klene M, Li X, Knox J E, Hratchian H P, Cross J B, Adamo C, Jaramillo J, Stratmann R E, Yazyev O, Austin A J, Pomelli C, Ochterski J W, Morokuma K, Voth G A, Salvador P, Dannenberg J J, Clifford S, Frisch M J, Trucks G W, Schlegel H B, Scuseria G E, Robb M A, Cheeseman J R, Zakrzewski V G, Montgomery J A Jr , Stratmann R E, Burant J C, Dapprich S, Millam J M, Daniels A D, Kudin K N, Strain M C, Farkas O, Tomasi J, Barone V, Cossi M, Cammi R, Mennucci B, Pomelli C, Adamo C, Clifford S, Ochterski J, Petersson G A, Ayala P Y, Cui Q, Morokuma K, Malick D K, Rabuck A D, Raghavachari K, Foresman J B, Cioslowski J, Ortiz J V, Baboul A G, Stefanov B B, Liu G, Liashenko A, Piskorz P, Komaromi I, Gomperts R, Martin R L, Fox, Keith T, Al- Laham M A, Peng C Y, Nanayakkara A, Challacombe , Gill P M W, Johnson B, Chen W, Wong M W, Andre J L, Gonzalez C, Head-Gordon M, Replogle E S, Pople J A, Gaussian 03 , Revision B.04 , Gaussian , Inc , Pittsburgh PA , 2003.
31 Martin J M L & Van Alsenoy C, GAR2PED Program, University of Antwerpen, Belgium, 1995.
32 Casado J, Nygaard L & Sorensen G O, J Mol Struct, 8 (1971) 211.
33 Dieh P, Amerin J & Veracini CA, Organ Magn Reson, 20 (1982) 276.
34 Hehre WJ, Radom L, Schleyer PvR & Pople JA, Ab-initio
Molecular Orbital Theory, (Wiley, New York), 1986. 35 Finley J W & Stephens P J, J Mol Struct (Theochem), 357
(1995) 225. 36 Roeges N P, A Guide to the Complete Interpretation of
Infrared Spectra of Organic Structures, (Wiley, New York), 1994.
37 Coates J, Encyclopedia of Analytical Chemistry, in: RA Meyers (Ed), Interpretation of Infrared Spectrum, A
Practical Approach, (John Wiley, Chichester), 2000. 38 Colthup N B, Daly LH & Wiberly S E, Introduction to
infrared and Raman spectroscopy, (eds 3, Academic Press, New York), 1990.
39 Krishnakumar V & Xavier R J, Spectrochim Acta, 61A (2005) 253.
40 Socrates G, Infrared characteristic group frequencies, (John Wiley, New York), 1987.
41 Prystupa D A, Anderson A, Torrie B H, J Raman Spectrosc, 25 (1994) 175.
42 Palafox M A, Int J Quantum Chem, 77 (2000) 661. 43 Krishnakumar V, Surumbarkuzhali N & Muthunatesa S,
Spectrochim Acta, 71A (2009) 1810. 44 Fleming G D, Golsio I, Aracena A, Celis F, Vera L, Koch R
& Campos-Valette M, Spectrochim Acta, 71A (2008) 1074. 45 Lee C, Yang W & Parr R C, Phys Rev, 378 (1998) 785. 46 Bakiler M, Masiov LV & Akyuz S, J Mol Struct, 475 (1999)
83. 47 Varsanyi G, Assignments for Vibrational Spectra of Seven
Hundred Benzene Derivatives, (Wiley, New York), 1974. 48 Mooney E F, Spectrochim Acta, 20 (1964) 1021. 49 Mooney E F, Spectrochim Acta, 19 (1963) 877. 50 Monnier J, Davidovics G & Allouche A, J Mol Struct, 243
(1991) 13. 51 Varghese H T, Panicker CY, Philip D & Pazdera P,
Spectrochim Acta, 67A (2007) 1055. 52 George W O & Mcintyre S, Introduction to Spectroscopy,
(John Wiley,New York), 1987. 53 Pazdera P, Divisova H, Havlisova H & Borek P, Molecules,
5 (2000) 189. 54 Pazdera P, Divisova H, Havlisova H & Borek P, Molecules,
5 (2000) 1166. 55 Silverstein R M, Bassler G C & Morril T C, Spectrometric
Identification of Organic Compounds, Ed 5, (John Wiley, Singapore), 1991.
56 Smith B, Infrared spectral introduction, A systematic
approach, (CRC Press, New York), 1999. 57 Tzeng WB, Narayanan K, Lin J L & Tung C C, Spectrochim.
Acta, 55A (1999) 153. 58 Jona P, Gussoni M & Zerbi G, J Mol Struct, 95 (1982) 15. 59 Jona P, Gussoni M & Zerbi G, J Mol Struct, 80 (1982) 349. 60 Castiglioni C, Gussoni M & Zerbi G, J Mol Struct, 198
(1989) 475. 61 Shanker R, Yadav R A, Singh I S & Singh O N, J Raman
Spectrosc, 23 (1992) 141. 62 Suryanarayana V, Kumar A P, Rao G R & Pandey G C,
Spectrochim Acta, 48A (1992) 1481. 63 Ushakumari L, Varghese H T, Panicker C Y, Ertan T &
Yildiz I, J Raman Spectrosc, 39 (2008) 1832. 64 Tommasini M, Castiglioni C, Del Zoppo M & Zerbi G, J Mol
Struct, 480 (1999) 179. 65 Kleinman D A, Phys Rev, 126 (1962) 1977. 66 Jothy V B, Vijayakumar T, Jayakumar V S, Udayalekshmi
K, Ramamoorthy K & Joe I H, J Raman Spectrosc, 38 (2007) 1148.
Copyright © 2022 FDOKUMEN


![Synthesis of [(4-Chloro-5H-1,2,3-dithiazol-5-ylidene)amino]azines](https://static.fdokumen.com/doc/165x107/6344ded56cfb3d4064096a20/synthesis-of-4-chloro-5h-123-dithiazol-5-ylideneaminoazines.jpg)