FREE JET-COOLED LASER-INDUCED FLUORESCENCE-SPECTRUM OF METHOXY RADICAL .2. ROTATIONAL ANALYSIS OF...
8
5914 J. Phys. Chem. 1988, 92, 5914-5921 Free Jet Cooled Laser-Induced Fluorescence Spectrum of Methoxy. 1. Vibronic Analysis of the and 2 States Stephen C. Foster,+Prabhakar Misra, Tai-Yuan D. Lin, Cristino P. Damo, Christopher C. Carter, and Terry A. Miller* Laser Spectroscopy Facility, Department of Chemistry, The Ohio State University, 120 West 18th Avenue, Columbus, Ohio 4321 0 (Received: February 8, 1988) The methoxy free radical has been formed in a supersonic free jet expansion by KrF photolysis of methyl nitrite. Its laser-induced fluorescence excitation and wavelength-resolved-emission _spectrahave been recorded at low temperature. This paper reports the vibronic analysis of the C H 3 0 and CD30 A2Al - XZE electronic spectra. A new value for the electronic origin has been determined as well as a nearly complete set of vibrational frequencies. I. Introduction The methoxy radical is one of the most interesting and most widely studiedl-10 of all organic free radicals. Much of the interest in CH30 lies in its ubiquity. The radical is well-known to play important roles in combustion and atmospheric pollution chem- istry. It is also of considerable interest in astrophysical work. Since CH30 is indeed a very reactive free radical, highly sensitive, unambiguous diagnostic techniques for C H 3 0 are quite valuable. Almost exclusively, these diagnpstic teciniques are spectroscopic, most usually based upon the A2A1 - X2E optical transition in the near-ultraviolet, analogous to the A2Z - X211 transition in the closely related, but nonorganic, free radical OH. This latter transition is usually described in “one-electron parlance” as corresponding to the promotion of a p-CJ bonding electron to fill the nearly nonbonding p-7r orbitals mainly localized on the 0 atom, with an analogous explanation being appropriate for CH30. However, diagnostic considerations are not the only ones which make spectroscopic studies of methoxy interesting. Theoretical questions about both the ground 2E and excited 2A1states are extensive. Indeed, since methoxy is one of the simplest of poly- atomic free radicals, it has been the subject of several ab initio calculations1 which are by no means in complete agreement with respect to many of its properties. Methoxy is also of particular theoretical significance from another point of view. It has nominal C,, symmetry, but its ground electronic state is doubly degenerate and subject to a Jahn-Teller distortion. Such a distortion should produce a very unique and interesting spectrum, particularly considering methoxy’s moderate spin-orbit splitting (-60 cm-I). Consequently, methoxy’s spectrum should give us the best means for understanding any Jahn-Teller distortion and its interaction with the spin-orbit coupling. As mentioned above, the literature on methoxy is by most measures vast. Particularly germane to this work, there recently have been a microwave s t ~ d y , ~ a laser-induced fluorescence (LIF) study,g and a “cold” jet emission study.1° Although we have been involvedt6 in a series of supersonic free jet LIF studies of larger alkoxy radicals, e.g., C2H30, C2H50,and C3H70, we initially believed that the spectroscopy of methoxy was generally well understood and required little further investigation. On closer inspection, however, we recognized that, despite the extensive spectroscopic i_nvestiga$onsof the radical, none of the bands of the well-known A2A1 - X2E UV transition has ever been subjected to a detailed rotational analysis (however, note the pioneering work of Powers et al.’), resulting, of course, in a lack of knowledge about the excited-state “rotational” parameters. We also realized that the analysis of the relatively simple, cold jet LIF rotational spectra, along with the existence of ground-state pa- rameters from the microwave work, should yield excellent ex- cited-state molecular parameters. Present address: Department of Chemistry, Florida State University, Tallahassee. FL 32306. 0022-3654188 12092-5914$01.50/0 TABLE I: CH30 AzAl-%zE3,2 Origin Frequency (em-’) <1975 1975-1980 1980-1985 >1985 30 465‘ 32 800b 31 536d 3 1 690hJ 31 53SC 3 1 540eJ‘ 32 306’J‘ 31 5309 31 644.Yf Reference 1. Reference 4. Reference 5. Reference 6. e Reference 7. ’Value quoted specifically for ’E312 state; other refer- ences do not distinguish between ’E3/? and states. ZReference 8. *Reference 9. ‘Reference 10. ’This work and ref 17. The value quoted is measured_ from the lowest RZE3/, rotational level, K = 0, J = 0.5, to the lowest A2A1 rotational level, N = 0, K = 0. Once this work began, we discovered that there were a large number of other spectroscopic questions concerning methoxy that are not properly resolved. For instance, Table I summarizes nine different reports purporting to give frequencies for the origin of the methoxy UV electronic transition. Clearly, one must know which band to analyze as the origin to obtain “r0 rotational” parameters. We have thus carried out a detailed study of the vibronic spectrum of methoxy as a necessary prelude to the rotational analysis of its bands. The results of this analysis, which are described in this paper, yield a new and, we believe, reliable value for the electronic origin as well as 5 nearly complete set of vi- brational frequencies for both the X and A states. These fre- quencies are significantly revised from earlier reports. Figure 1 shows a schematic representation of these vibrational motions. A following paper17 describes the rovibronic analysis of the 0; and (1) Style, D. W. G.; Ward, J. C. Trans. Faraday SOC. 1953, 49, 999. (2) Radford, H. E.; Russell, D. K. J. Chem. Phys. 1977, 66, 2222. Russell, (3) Endo, Y.; Saito, S.; Hirota, E. J. Chem. Phys. 1984, 81, 122. (4) Ohbayashi, R.; Akimoto, H.; Tanaka, I. J. Phys. Chem. 1977,81,798. (5) Wendt, H. R.; Hunziker, H. E. J. Chem. fhys. 1979, 71, 5202. (6) Inoue, G.; Akimoto, H.; Okuda, M. J. Chem. Phys. 1980, 72, 1769. (7) Powers, D. E.; Hopkins, J. B.; Smalley, R. E. J. Phys. Chem. 1981, 85, (8) Ebata, T.; Yanagishita, H.; Obi, K.; Tanaka, I. Chem. Phys. 1982, 69, (9) Fuke, K.; Ozawa, K.; Kaya, K. Chem. Phys. Lett. 1986, 126, 119. (10) Brossard, S. D.; Carrick, P. G.; Chappell, E. L.; Hulegaard, S. C.; Engelking, P. C. J. Chem. Phys. 1986, 84, 2459. See also the even more extensive list of references in this paper. (1 1) Yarkony, D. R.; Schaefer, H. F., 111; Rothenberg, S. J. Am. Chem. Sor. 1974, 96, 656. (12) Ohkubo, K.; Fujita, T.; Sato, H. J. Mol. Strucr. 1977, 36, 101. (13) Bent, G. D.; Adams, G. F.; Bartram, R. H.; Purvis, G. D.; Bartlett, (14) Jackels, C. F. J. Chem. Phys. 1982, 76, 505. (15) Saeb~, S.; Radom, L.; Schaefer, H. F., 111 J. Chem. Phys. 1983, 78, (16) Foster, S. C.; Hsu, Y.-C.; Damo, C. P.; Liu, X.; Kung, ‘2.-Y.; Miller, D. K.; Radford, H. E. J. Chem. Phys. 1980, 72, 2750. 2711. 27. R. J. J. Chem. Phys. 1982, 76, 4144. 845. T. A. J. Phys. Chem. 1986, 90, 6766. 0 1988 American Chemical Societv
Transcript of FREE JET-COOLED LASER-INDUCED FLUORESCENCE-SPECTRUM OF METHOXY RADICAL .2. ROTATIONAL ANALYSIS OF...
5914 J . Phys. Chem. 1988, 92, 5914-5921
Free Jet Cooled Laser-Induced Fluorescence Spectrum of Methoxy. 1. Vibronic Analysis of the and 2 States
Stephen C. Foster,+ Prabhakar Misra, Tai-Yuan D. Lin, Cristino P. Damo, Christopher C. Carter, and Terry A. Miller*
Laser Spectroscopy Facility, Department of Chemistry, The Ohio State University, 120 West 18th Avenue, Columbus, Ohio 4321 0 (Received: February 8, 1988)
The methoxy free radical has been formed in a supersonic free jet expansion by KrF photolysis of methyl nitrite. Its laser-induced fluorescence excitation and wavelength-resolved-emission _spectra have been recorded at low temperature. This paper reports the vibronic analysis of the C H 3 0 and CD30 A2Al - XZE electronic spectra. A new value for the electronic origin has been determined as well as a nearly complete set of vibrational frequencies.
I. Introduction The methoxy radical is one of the most interesting and most
widely studiedl-10 of all organic free radicals. Much of the interest in CH30 lies in its ubiquity. The radical is well-known to play important roles in combustion and atmospheric pollution chem- istry. It is also of considerable interest in astrophysical work. Since C H 3 0 is indeed a very reactive free radical, highly sensitive, unambiguous diagnostic techniques for C H 3 0 are quite valuable. Almost exclusively, these diagnpstic teciniques are spectroscopic, most usually based upon the A2A1 - X2E optical transition in the near-ultraviolet, analogous to the A2Z - X211 transition in the closely related, but nonorganic, free radical OH. This latter transition is usually described in “one-electron parlance” as corresponding to the promotion of a p-CJ bonding electron to fill the nearly nonbonding p-7r orbitals mainly localized on the 0 atom, with an analogous explanation being appropriate for C H 3 0 .
However, diagnostic considerations are not the only ones which make spectroscopic studies of methoxy interesting. Theoretical questions about both the ground 2E and excited 2A1 states are extensive. Indeed, since methoxy is one of the simplest of poly- atomic free radicals, it has been the subject of several ab initio calculations1 which are by no means in complete agreement with respect to many of its properties.
Methoxy is also of particular theoretical significance from another point of view. It has nominal C,, symmetry, but its ground electronic state is doubly degenerate and subject to a Jahn-Teller distortion. Such a distortion should produce a very unique and interesting spectrum, particularly considering methoxy’s moderate spin-orbit splitting (-60 cm-I). Consequently, methoxy’s spectrum should give us the best means for understanding any Jahn-Teller distortion and its interaction with the spin-orbit coupling.
As mentioned above, the literature on methoxy is by most measures vast. Particularly germane to this work, there recently have been a microwave s t ~ d y , ~ a laser-induced fluorescence (LIF) study,g and a “cold” jet emission study.1° Although we have been involvedt6 in a series of supersonic free jet LIF studies of larger alkoxy radicals, e.g., C2H30, C2H50, and C3H70, we initially believed that the spectroscopy of methoxy was generally well understood and required little further investigation.
On closer inspection, however, we recognized that, despite the extensive spectroscopic i_nvestiga$ons of the radical, none of the bands of the well-known A2A1 - X2E UV transition has ever been subjected to a detailed rotational analysis (however, note the pioneering work of Powers et al.’), resulting, of course, in a lack of knowledge about the excited-state “rotational” parameters. We also realized that the analysis of the relatively simple, cold jet LIF rotational spectra, along with the existence of ground-state pa- rameters from the microwave work, should yield excellent ex- cited-state molecular parameters.
Present address: Department of Chemistry, Florida State University, Tallahassee. FL 32306.
0022-3654188 12092-59 14$01.50/0
TABLE I: C H 3 0 AzAl-%zE3,2 Origin Frequency (em-’) <1975 1975-1980 1980-1985 >1985 30 465‘ 32 800b 31 536d 3 1 690hJ
31 53SC 3 1 540eJ‘ 32 306’J‘ 31 5309 31 644.Yf
Reference 1. Reference 4. Reference 5. Reference 6. e Reference 7. ’Value quoted specifically for ’E312 state; other refer- ences do not distinguish between ’E3/? and states. ZReference 8. *Reference 9. ‘Reference 10. ’This work and ref 17. The value quoted is measured_ from the lowest RZE3/, rotational level, K = 0, J = 0.5, to the lowest A2A1 rotational level, N = 0, K = 0.
Once this work began, we discovered that there were a large number of other spectroscopic questions concerning methoxy that are not properly resolved. For instance, Table I summarizes nine different reports purporting to give frequencies for the origin of the methoxy UV electronic transition. Clearly, one must know which band to analyze as the origin to obtain “r0 rotational” parameters.
We have thus carried out a detailed study of the vibronic spectrum of methoxy as a necessary prelude to the rotational analysis of its bands. The results of this analysis, which are described in this paper, yield a new and, we believe, reliable value for the electronic origin as well as 5 nearly complete set of vi- brational frequencies for both the X and A states. These fre- quencies are significantly revised from earlier reports. Figure 1 shows a schematic representation of these vibrational motions. A following paper17 describes the rovibronic analysis of the 0; and
(1 ) Style, D. W. G.; Ward, J. C. Trans. Faraday SOC. 1953, 49, 999. (2) Radford, H. E.; Russell, D. K. J . Chem. Phys. 1977, 66, 2222. Russell,
(3) Endo, Y.; Saito, S.; Hirota, E. J . Chem. Phys. 1984, 81, 122. (4) Ohbayashi, R.; Akimoto, H.; Tanaka, I . J . Phys. Chem. 1977,81,798. (5) Wendt, H. R.; Hunziker, H. E. J . Chem. f h y s . 1979, 71, 5202. (6) Inoue, G.; Akimoto, H.; Okuda, M. J . Chem. Phys. 1980, 72, 1769. (7) Powers, D. E.; Hopkins, J. B.; Smalley, R. E. J . Phys. Chem. 1981, 85,
(8) Ebata, T.; Yanagishita, H.; Obi, K.; Tanaka, I . Chem. Phys. 1982, 69,
(9) Fuke, K.; Ozawa, K.; Kaya, K. Chem. Phys. Lett. 1986, 126, 119. (10) Brossard, S. D.; Carrick, P. G.; Chappell, E. L.; Hulegaard, S. C.;
Engelking, P. C. J . Chem. Phys. 1986, 84, 2459. See also the even more extensive list of references in this paper.
(1 1) Yarkony, D. R.; Schaefer, H. F., 111; Rothenberg, S. J . Am. Chem. Sor. 1974, 96, 656.
(12) Ohkubo, K.; Fujita, T.; Sato, H. J . Mol. Strucr. 1977, 36, 101. (13) Bent, G. D.; Adams, G. F.; Bartram, R. H.; Purvis, G. D.; Bartlett,
(14) Jackels, C. F. J . Chem. Phys. 1982, 76, 505. (15) S a e b ~ , S.; Radom, L.; Schaefer, H. F., 111 J . Chem. Phys. 1983, 78,
(16) Foster, S . C.; Hsu, Y.-C.; Damo, C. P.; Liu, X.; Kung, ‘2.-Y.; Miller,
D. K.; Radford, H. E. J . Chem. Phys. 1980, 72, 2750.
2711.
27.
R. J. J . Chem. Phys. 1982, 76, 4144.
845.
T. A. J . Phys. Chem. 1986, 90, 6766.
0 1988 American Chemical Societv
Free Jet Cooled LIF Spectrum of Methoxy The Journal of Physical Chemistry, Vol. 92, No. 21, 1988 5915
CH30.
# C - H stretch Umbrella C-0 stretch
C-H stretch Scissors Rocking
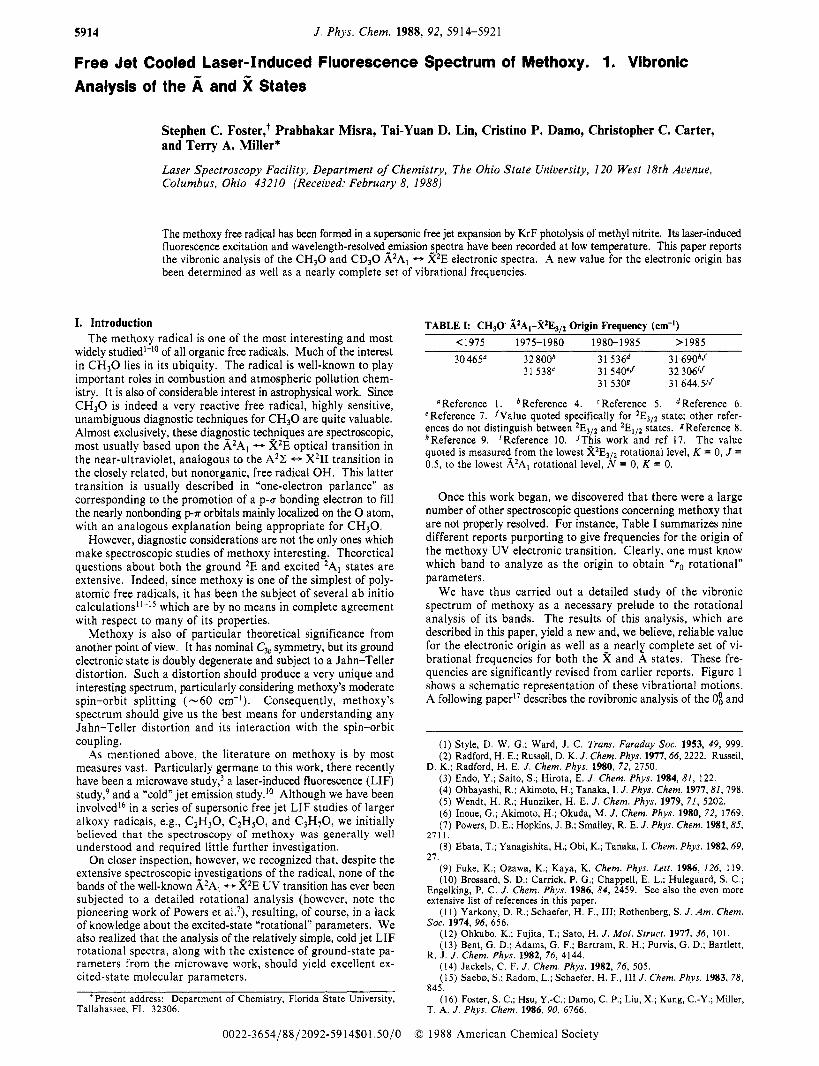
Figure 1. Schematic representations of the three a, and three doubly degenerate e vibrations of methoxy.
3; bands of C H 3 0 which yield the first rotational parameters for the 6 state and, perhaps surprisingly, slightly revised values for the X state. A complete vibrational analysis of the ground state requires an unraveling of the Jahn-Teller effect therein. That Jahn-Teller analysis is deferred to a subsequent paper.
The vibronic analysis of this paper is based upon two kinds of data taken in a supersonic free jet expansion wherein very cold methoxy radicals with rotational temperatures in the range 3-25 K are observed. Laser excitation of these cold radicals are re- corded, without rotational resolution, to give an overview of the vibronic structure of the excited state. Once over 6500 cm-I of this spectrum has been recorded, individual bands can be laser excited and the resulting emission wavelength-resolved with a monochromator and optical multichannel analyzer. These results are used to determine the vibronic structure of the ground state and elucidate ambiguous excited-state vibronic assignments. Experiments have been performed on both C H 3 0 and its per- deuterio analogue, CD30.
11. Experimental Section The methoxy and perdeuteriated methoxy radicals were formed
in the excimer laser photolysis of their respective precursors, the alkyl nitrites (CH,ONO and CD30NO) seeded in low concen- tration into a supersonic free jet expansion. The radicals were then excited by a probe dye laser, and fluorescence was collected with an f/ 1 lens. Fluorescence excitation spectra were recorded by scanning the excitation wavelength and monitoring total fluorescence. Dispersed fluorescence spectra were obtained by exciting the radicals a t the wavelength of a rotational line near the band maxima. After passing through a monochromator a t a fixed grating position, the fluorescence was then focused onto the diode array detector of an optical multichannel analyzer (OMA).
The nitrites were synthesized by the dropwise addition of dilute sulfuric acid to a solution of sodium nitrite and the corresponding alcohol.I8 Gaseous at room temperature, the nitrites were col- lected at -78 OC with an acetone/dry ice bath. FT-IR spectra (Mattson Instruments CYGNUS 25) of the gas showed infrared bands highly characteristic of alkyl n i t r i t e ~ ' ~ and the absence of any significant impurities.
Our experiments coupling supersonic free jet expansions with laser-induced fluorescence have been previously described.I6 Briefly, the precursor was seeded in a He carrier gas at - 10 atm and introduced into the chamber through a commercial pulsed nozzle (Newport BV-100) with a 0.5-mm orifice. A KrF (248
30000 31000 32000 33000 34000 35000 36000 37000
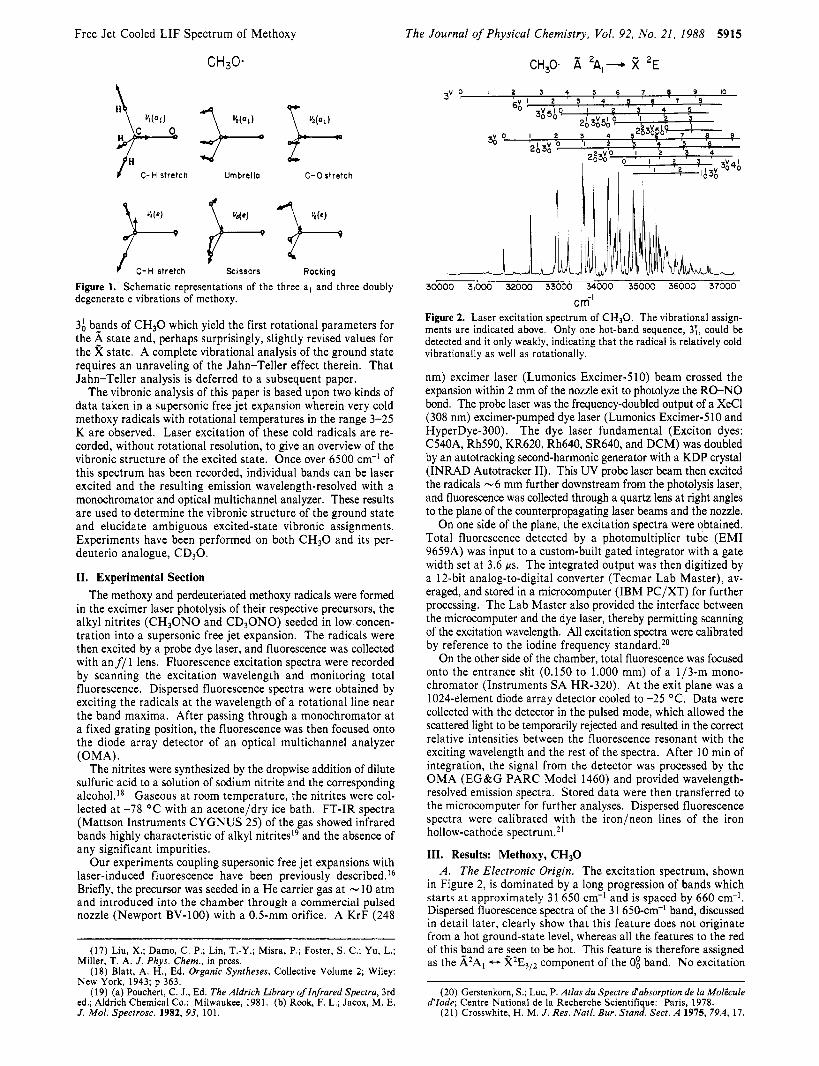
c m-' Figure 2. Laser excitation spectrum of CH30. The vibrational assign- ments are indicated above. Only one hot-band sequence, 3;, could be detected and it only weakly, indicating that the radical is relatively cold vibrationally as well as rotationally.
nm) excimer laser (Lumonics Excimer-5 10) beam crossed the expansion within 2 mm of the nozzle exit to photolyze the RO-NO bond. The probe laser was the frequency-doubled output of a XeCl (308 nm) excimer-pumped dye laser (Lumonics Excimer-510 and HyperDye-300). The dye laser fundamental (Exciton dyes: C540A, Rh590, KR620, Rh640, SR640, and DCM) was doubled by an autotracking second-harmonic generator with a KDP crystal (INRAD Autotracker 11). This UV probe laser beam then excited the radicals -6 mm further downstream from the photolysis laser, and fluorescence was collected through a quartz lens at right angles to the plane of the counterpropagating laser beams and the nozzle.
On one side of the plane, the excitation spectra were obtained. Total fluorescence detected by a photomultiplier tube (EM1 9659A) was input to a custom-built gated integrator with a gate width set at 3.6 ~ s . The integrated output was then digitized by a 12-bit analog-to-digital converter (Tecmar Lab Master), av- eraged, and stored in a microcomputer (IBM PC/XT) for further processing. The Lab Master also provided the interface between the microcomputer and the dye laser, thereby permitting scanning of the excitation wavelength. All excitation spectra were calibrated by reference to the iodine frequency standard.20
On the other side of the chamber, total fluorescence was focused onto the entrance slit (0.150 to 1.000 mm) of a 1/3-m mono- chromator (Instruments S A HR-320). At the exit plane was a 1024-element diode array detector cooled to -25 OC. Data were collected with the detector in the pulsed mode, which allowed the scattered light to be temporarily rejected and resulted in the correct relative intensities between the fluorescence resonant with the exciting wavelength and the rest of the spectra. After 10 min of integration, the signal from the detector was processed by the OMA (EG&G PARC Model 1460) and provided wavelength- resolved emission spectra. Stored data were then transferred to the microcomputer for further analyses. Dispersed fluorescence spectra were calibrated with the iron/neon lines of the iron hollow-cathode spectrum.21
111. Results: Methoxy, CH30 A . The Electronic Origin. The excitation spectrum, shown
in Figure 2, is dominated by a long progression of bands which starts a t approximately 31 650 cm-' and is spaced by 660 cm-'. Dispersed fluorescence spectra of the 3 1 650-cm-' band, discussed in detail later, clearly show that this feature does not originate from a hot ground-state level, whereas all the features to the red of this band are seen to be hot. This feature is therefore assigned as the A2Al - X2E3j2 component of the 0; band. No excitation
(20) Gerstenkorn, S.; Luc, P. Atlas du Spectre d'absorption de la Molicule
( 2 1 ) Crosswhite, H. M. J . Res. Natl. Bur. Stand. Sect. A 1975, 79A, 17.
(17) Liu, X.; Darno, C. P.; Lin, T.-Y.; Misra, P.; Foster, S. C.; Yu, L.; Miller, T. A. J . Phys. Chem., in press.
(18) Blatt, A. H., Ed. Organic Syntheses, Collective Volume 2; Wiley: New York, 1943; p 363.
(19) (a) Pouchert, C. J., Ed. The Aldrich Library of Infrared Spectra, 3rd ed.; Aldrich Chemical Co.: Milwaukee, 1981. (b) Rook, F. L.; Jacox, M. E. J . Mol. Spectrosc. 1982, 93, 101.
d'lode; Centre National de la Recherche Scientifique: Paris, 1978.
5916 The Journal of Physical Chemistry, Vol. 92, No. 21, 1988 Foster et al.
spectrum is observed from the higher lying %2El/2 spin-orbit component, presumably because of its essentially nonexistent population at the very low temperature of the jet expansion. Small differences quoted in band positions between the analyses in this paper and ref 17 reflect the error introduced by using band maxima (quoted throughout this paper) rather than the true band origins (used in ref 17).
Traditionally, the origin of a spin-orbit split transition is taken as the mean of the 'E312 and 2E112 state's excitation frequencies. Since the ground-state spin-orbit splitting is 63 cm-I, this places the traditionally defined origin at 31 618 cm-I, using band maxima. The detailed" rotational analysis of this band gives a more ac- curate value of 31 614.5 cm-' for the origin and 62.0 cm-' for the spin-orbit splitting. The value of 3 1 644.5 cm-I quoted in Table I is the frequency of the transition from the lowest rotational level of the 2E3/2 state, a value more comparable to the other entries in Table I .
It should be noted here that there has been a good deal of controversy (see Table I) about the assignment of the methoxy origin band and that we present another new value. Most earlier work involved hot ~ p e c t r a , l > ~ * ~ * ~ which are much more difficult to interpret unambiguously. Three other jet-cooled spectra have been published which might have been expected to produce a single consistent value for the origin. In 1981 Powers et al.' recorded the first cold spectrum of methoxy. They show a portion of their spectrum between 3 1 440 and 3 1 690 cm-I, with the origin centered at 3 1 540 cm-' in their Figure 2. We have carefully checked the calibration of our present spectrum and can only conclude that there must be a calibration error in ref 7 .
Brossard et a1.I0 made an extensive study of the emission from a jet-cooled corona discharge and proposed a value of 32 306 cm-' for the 2E3,2 subband of the origin. Although somewhat rota- tionally ccpled, the spectrum was characteristic of a vibrationally very hot A state and contained a large number of bands. Their origin is in good agreement with our 3; band. It appears that these authors simply missed the first member of the v3' progression.
Another recent study, published by Fuke et al.? is very similar to the spectrum presented here. It was surprising that their reported origin, 31 690 cm-', differs from the value given here. A careful inspection of Fuke et al.'s Figure 1 reveals that all features below 32 000 cm-I differ by 40 cm-I from our values, whereas both studies are in good agreement above 32000 cm-I. As noted above, our calibration has been carefully examined and we must conclude that a calibration error was also made in ref 9.
B. .$Al Vibrational Assignment. Although the spectrum shown in Figure 2 is rotationally and vibrationally cold, it is quite complex, containing a large number of vibrational bands. The complexity reflects the fact that all six fundamental vibrational modes (see Figure 1) of methoxy are observed-not just the three totally symmetric vibrations. The three e vibrations gain intensity in excitation because of the Jahn-Teller distortion of the ground electronic state.22 One might consider that the eigenfunction which describes the vibrationless level of the ground electronic state is mixed with the e vibration eigenfunctions of the ground state by the Jahn-Teller effect. Since the vibrationless level has partial e character, transitions to levels with e vibronic symmetry in the excited electronic state become allowed.
Most of the bands observed in the excitation spectrum can be seen to lie in progressions with a 660-cm-l vibrational interval. Ab initio calculatiois predict" a large change in the C-0 bond length between the A and X states, and consequently we expect a long progression in v3', the CO stretching vibration. This large
(22) See, for example, the discussion in the chapter by T. A. Miller and V. E. Bondybey in Molecular Ions: Spectroscopy, Structure, and Chemistry; Miller, T. A,, Bondybey, V. E., Eds.; North-Holland: Amsterdam, 1983; p 201.
(23) Herzberg, G. Molecular Spectra and Molecular Structure II In- frared and Raman Spectra of Polyatomic Molecules; Van Nostrand Reinhold: New York, 1945; p 315.
(24) Stokes, S.; Duncan, A. B. F. J . Am. Chem. SOC. 1958, 80, 6177. (25) Karlsson, L.; Jadrny, R.; Mattsson, L.; Chau, F. T.; Siegbahn, K.
Phys. Script. 1977, 16, 225.
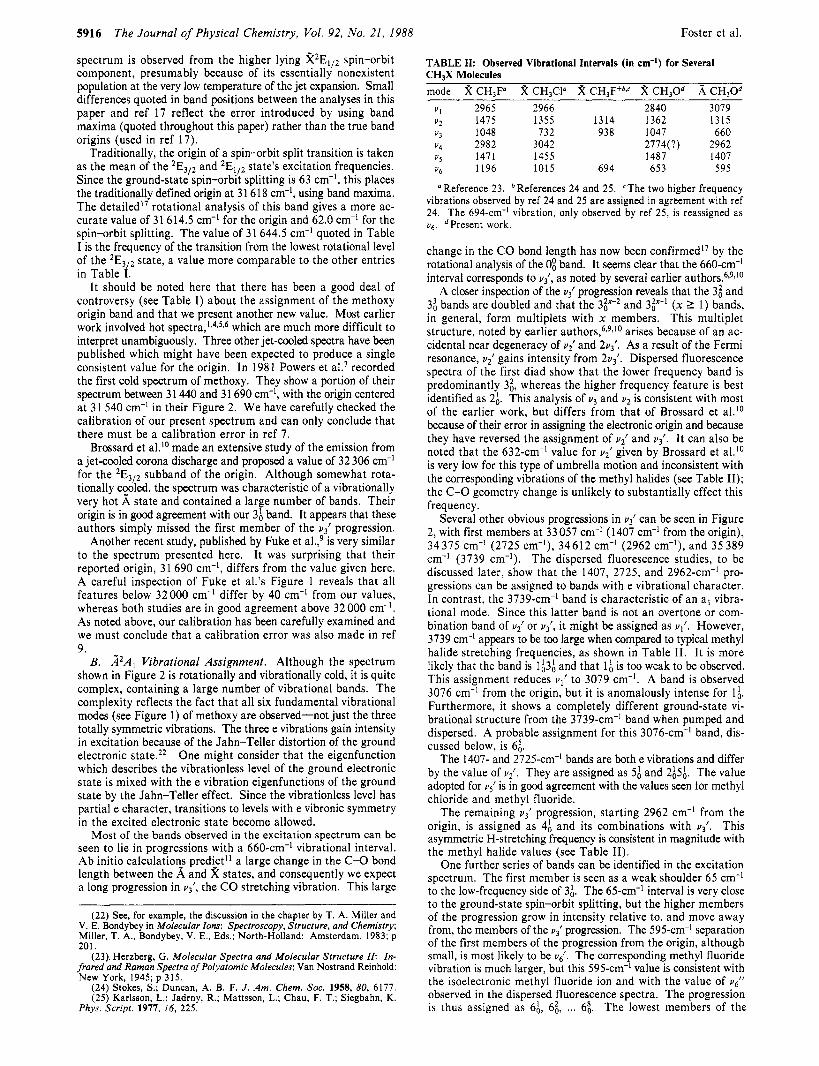
TABLE II: Observed Vibrational Intervals (in cm-') for Several CH3X Molecules mode d% CH2F" d% CHXI" 2 CHIF*bsC d% CH,Od A CHIOd
V I 2965 2966 2840 3079 Y Z 1475 1355 1314 1362 1315 "3 1048 732 938 1047 660 L J ~ 2982 3042 2774(?) 2962 " 5 1471 1455 1487 1407 "6 1 I96 1015 694 653 595
"Reference 23. bReferences 24 and 25. CThe two higher frequency vibrations observed by ref 24 and 25 are assigned in agreement with ref 24. The 694-cm-' vibration, only observed by ref 25, is reassigned as v6. dPresent work.
change in the CO bond length has now been confirmed1' by the rotational analysis of the 0; band. It seems clear that the 660-cm-' interval corresponds to v i , as noted by several earlier author^.^*^^^^
A closer inspection of the v3' progression reveals that the 36 and 3; bands are doubled and that the 3F-2 and 3F-' (x 2 1) bands, in general, form multiplets with x members. This multiplet structure, noted by earlier author^,^^^^'^ arises because of an ac- cidental near degeneracy of v i and 2vi. As a result of the Fermi resonance, v i gains intensity from 2 ~ ~ ' . Dispersed fluorescence spectra of the first diad show that the lower frequency band is predominantly 3:, whereas the higher frequency feature is best identified as 2;. This analysis of u3 and u2 is consistent with most of the earlier work, but differs from that of Brossard et al.Io because of their error in assigning the electronic origin and because they have reversed the assignment of v i and u3'. It can also be noted that the 632-cm-' value for vz' given by Brossard et a1.I0 is very low for this type of umbrella motion and inconsistent with the corresponding vibrations of the methyl halides (see Table 11); the C-0 geometry change is unlikely to substantially effect this frequency.
Several other obvious progressions in v3' can be seen in Figure 2, with first members at 33 057 cm-' (1407 cm-' from the origin), 34375 cm-' (2725 cm-I), 34612 cm-' (2962 cm-I), and 35389 cm-l (3739 cm-I). The dispersed fluorescence studies, to be discussed later, show that the 1407, 2725, and 2962-cm-' pro- gressions can be assigned to bands with e vibrational character. In contrast, the 3739-cm-l band is characteristic of an a , vibra- tional mode. Since this latter band is not an overtone or com- bination band of vi or q', it might be assigned as ul ' . However, 3739 cm-' appears to be too large when compared to typical methyl halide stretching frequencies, as shown in Table 11. It is more likely that the band is 1;3; and that 1; is too weak to be observed. This assignment reduces vl' to 3079 cm-I. A band is observed 3076 cm-l from the origin, but it is anomalously intense for 1;. Furthermore, it shows a completely different ground-state vi- brational structure from the 3739-cm-' band when pumped and dispersed. A probable assignment for this 3076-cm-I band, dis- cussed below, is 6;.
The 1407- and 2725-cm-I bands are both e vibrations and differ by the value of vi. They are assigned as 5; and 2;s;. The value adopted for v{ is in good agreement with the values seen for methyl chloride and methyl fluoride.
The remaining v3' progression, starting 2962 cm-I from the origin, is assigned as 4; and its combinations with v i . This asymmetric H-stretching frequency is consistent in magnitude with the methyl halide values (see Table 11).
One further series of bands can be identified in the excitation spectrum. The first member is seen as a weak shoulder 65 cm-I to the low-frequency side of 3;. The 65-cm-' interval is very close to the ground-state spin-orbit splitting, but the higher members of the progression grow in intensity relative to, and move away from, the members of the +' progression. The 595-cm-l separation of the first members of the progression from the origin, although small, is most likely to be vgl. The corresponding methyl fluoride vibration is much larger, but this 595-cm-' value is consistent with the isoelectronic methyl fluoride ion and with the value of vi' observed in the dispersed fluorescence spectra. The progression is thus assigned as 6:, 62,, ... 68,. The lowest members of the
Free Jet Cooled LIF Spectrum of Methoxy
TABLE 111: CH30 A'A, - %zE Excitation Spectrum (cm-I) wave- re1 wave- re1
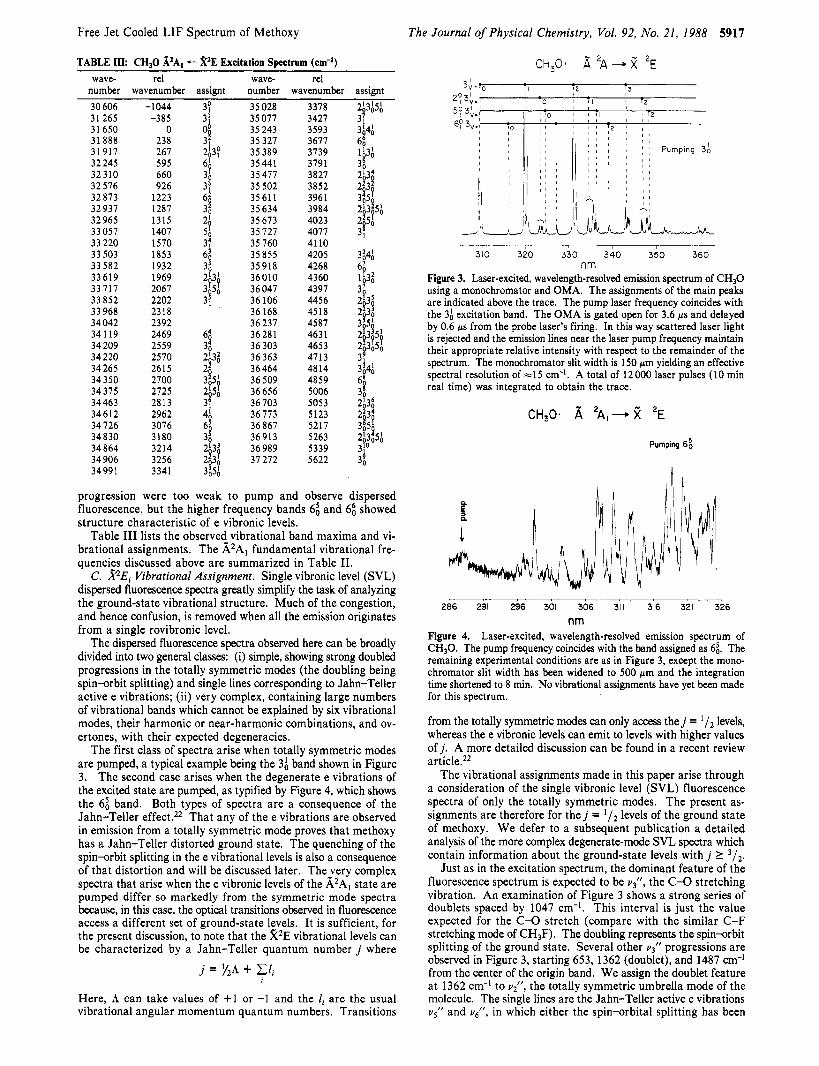
number wavenumber assignt number wavenumber assignt 30 606 31 265 31 650 3 1 888 3 1 917 32 245 32310 32 576 32 873 32 937 32 965 33 057 33 220 33 503 33 582 33619 33717 33 852 33 968 34 042 34119 34 209 34 220 34 265 34 350 34 375 34463 34612 34 726 34 830 34 864 34 906 34991
-1044 -385
0 238 267 595 660 926
1223 1287 1315 1407 1570 1853 1932 1969 2067 2202 2318 2392 2469 2559 2570 2615 2700 2725 2813 2962 3076 3180 3214 3256 3341
35 028 35 077 35 243 35 327 35 389 35 441 35 477 35 502 35 61 1 35 634 35 673 35 727 35 760 35 855 35918 36010 36 047 36 106 36 168 36 237 36281 36 303 36 363 36 464 36 509 36 656 36 703 36 773 36 867 36913 36 989 37 272
3378 3427 3593 3677 3739 3791 3827 3852 3961 3984 4023 4077 4110 4205 4268 4360 4397 4456 4518 4587 463 1 4653 4713 4814 4859 5006 5053 5123 5217 5263 5339 5622
fp:
progression were too weak to pump and observe dispersed fluorescence, but the higher frequency bands 6; and 68 showed structure characteristic of e vibronic levels.
Table I11 lists the observed_vibrational band maxima and vi- brational assignments. The A2AI fundamental vibrational fre- quencizs discussed above are summarized in Table 11.
C. *E, Vibrational Assignment. Single vibronic level (SVL) dispersed fluorescence spectra greatly simplify the task of analyzing the ground-state vibrational structure. Much of the congestion, and hence confusion, is removed when all the emission originates from a single rovibronic level.
The dispersed fluorescence spectra observed here can be broadly divided into two general classes: (i) simple, showing strong doubled progressions in the totally symmetric modes (the doubling being spin-orbit splitting) and single lines corresponding to Jahn-Teller active e vibrations; (ii) very complex, containing large numbers of vibrational bands which cannot be explained by six vibrational modes, their harmonic or near-harmonic combinations, and ov- ertones, with their expected degeneracies.
The first class of spectra arise when totally symmetric modes are pumped, a typical example being the 3; band shown in Figure 3. The second case arises when the degenerate e vibrations of the excited state are pumped, as typified by Figure 4, which shows the 6; band. Both types of spectra are a consequence of the Jahn-Teller effectsz2 That any of the e vibrations are observed in emission from a totally symmetric mode proves that methoxy has a Jahn-Teller distorted ground state. The quenching of the spin-orbit splitting in the e vibrational levels is also a consequence of that distortion and will be discussed later. Thejery complex spectra that arise when the e vibronic levels of the A2Al state are pumped differ so markedly from the symmetric mode spectra because, in this case, the optical transitions observed in fluorescence access a different set of ground-state levels. It is sufficient, for the present discussion, to note that the X2E vibrational levels can be characterized by a Jahn-Teller quantum number j where
j = Y2A + Eli i
Here, A can take values of +1 or -1 and the li are the usual vibrational angular momentum quantum numbers. Transitions
The Journal of Physical Chemistry, Vol. 92, No. 21, 1988 5917
CH,O* A 'A,- R 2~
3io 320 330 340 350 360 nm
Figure 3. Laser-excited, wavelength-resolved emission spectrum of CHpO using a monochromator and OMA. The assignments of the main peaks are indicated above the trace. The pump laser frequency coincides with the 3; excitation band. The OMA is gated open for 3.6 ps and delayed by 0.6 ps from the probe laser's firing. In this way scattered laser light is rejected and the emission lines near the laser pump frequency maintain their appropriate relative intensity with respect to the remainder of the spectrum. The monochromator slit width is 150 pm yielding an effective spectral resolution of =I5 cm-I. A total of 12000 laser pulses (10 min real time) was integrated to obtain the trace.
Pumping 650
286 291 296 301 306 311 316 321 326
nm Figure 4. Laser-excited, wavelength-resolved emission spectrum of CH30. The pump frequency coincides with the band assigned as 6;. The remaining experimental conditions are as in Figure 3, except the mono- chromator slit width has been widened to 500 pm and the integration time shortened to 8 min. No vibrational assignments have yet been made for this spectrum.
from the totally symmetric modes can only access t h e j = l/z levels, whereas the e vibronic levels can emit to levels with higher values of j . A more detailed discussion can be found in a recent review article.22
The vibrational assignments made in this paper arise through a consideration of the single vibronic level (SVL) fluorescence spectra of only the totally symmetric modes. The present as- signments are therefore for the j = levels of the ground state of methoxy. We defer to a subsequent publication a detailed analysis of the more complex degenerate-mode SVL spectra which contain information about the ground-state levels with j I 3/z .
Just as in the excitation spectrum, the dominant feature of the fluorescence spectrum is expected to be vjll, the C-0 stretching vibration. An examination of Figure 3 shows a strong series of doublets spaced by 1047 cm-'. This interval is just the value expected for the C-0 stretch (compare with the similar C-F stretching mode of CH3F). The doubling represents the spin-orbit splitting of the ground state. Several other v3/1 progressions are observed in Figure 3, starting 653, 1362 (doublet), and 1487 cm-' from the center of the origin band. We assign the doublet feature a t 1362 cm-' to vi', the totally symmetric umbrella mode of the molecule. The single lines are the Jahn-Teller active e vibrations us'' and v6", in which either the spin-orbital splitting has been
5918 The Journal of Physical Chemistry, Vol. 92, No. 21, 1988 Foster et al.
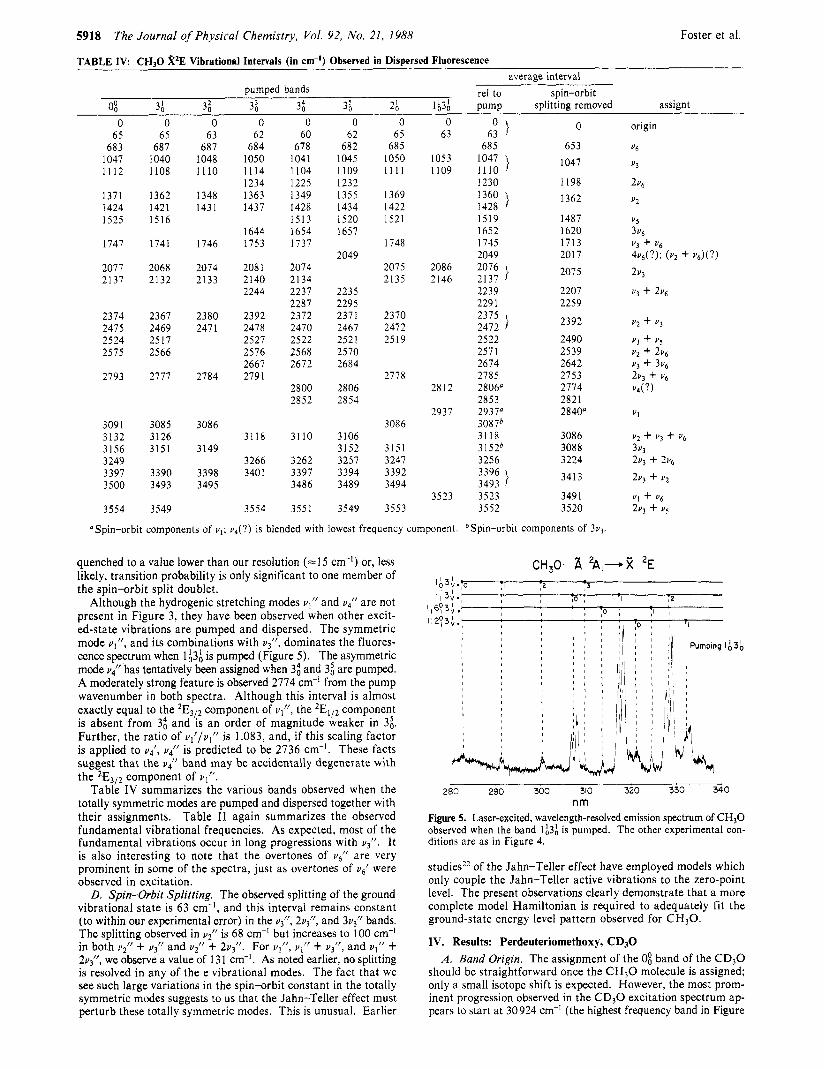
TABLE I V CHsO %*E Vibrational Intervals (in cm-’) Observed in Dispersed Fluorescence average interval
pumped bands re1 to spin-orbi t 0: 3; 32, 3; 340 3: 26 163; pump splitting removed assignt
0 65 683 1047 1112
1371 1424 1525
1747
2077 2137
2374 2475 2524 2575
2793
3091 3132 3156 3249 3397 3500
3554
0 65 687 1040 1108
1362 1421 1516
1741
2068 2132
2367 2469 2517 2566
2777
3085 3126 3151
3390 3493
3549
0 63 687 1048 Ill0
1348 1431
1746
2074 2133
2380 247 1
2784
3086
3149
3398 3495
0 62 684 1050 1114 1234 1363 1437
1644 1753
208 1 2140 2244
2392 2478 2527 2576 2667 2791
3118
3266 3401
3554
0 60 678 1041 1104 1225 1349 1428 1513 1654 1737
2074 2134 2237 2287 2372 2470 2522 2568 2672
2800 2852
31 10
3262 3397 3486
3551
0 62 682 1045 1109 1232 1355 1434 1520 1657
2049
2235 2295 2371 2467 252 1 2570 2684
2806 2854
3106 3152 3257 3394 3489
3549
0 65 685 1050 1111
1369 1422 1521
1748
2075 2135
2370 2472 2519
2778
3086
3151 3247 3392 3494
3553
0 63
1053 1 IO9
2086 2146
2812
2937
3523
“Spin-orbit components of u l ; u 4 ( ? ) is blended with lowest frequency component
quenched to a value lower than our resolution (=15 cm-I) or, less likely, transition probability is only significant to one member of the spin-orbit split doublet.
Although the hydrogenic stretching modes ulr ’ and uqll are not present in Figure 3, they have been observed when other excit- ed-state vibrations are pumped and dispersed. The symmetric mode u I r r , and its combinations with u3”, dominates the fluores- cence spectrum when lA3A is pumped (Figure 5 ) . The asymmetric mode u/ has tentatively been assigned when 3: and 3; are pumped. A moderately strong feature is observed 2774 cm-l from the pump wavenumber in both spectra. Although this interval is almost exactly equal to the 2E3!2 component of q”, the 2E,,z component is absent from 3: and IS an order of magnitude weaker in 3;. Further, the ratio of ul’/”’’ is 1.083, and, if this scaling factor is applied to uq/, u.,” is predicted to be 2736 crn-’. These facts suggest that the v i ’ band may be accidentally degenerate with the 2E3,2 component of u,” .
Table I V summarizes the various bands observed when the totally symmetric modes are pumped and dispersed together with their assignments. Table I1 again summarizes the observed fundamental vibrational frequencies. As expected, most of the fundamental vibrations occur in long progressions with u3”. It is also interesting to note that the overtones of vg// are very prominent in some of the spectra, just as overtones of v6’ were observed in excitation.
D. Spin-Orbit Splitting. The observed splitting of the ground vibrational state is 63 cm-I, and this interval remains constant (to within our experimental error) in the u3”, 213‘: and 3u3“ bands. The splitting observed in UT is 68 cm-’ but increases to 100 cm-I in both uZ” + v3“ and u2“ + 2u3”. For u l r r , ul’r + u3”, and ul r ’ + 2~311, we observe a value of 13 1 cm-I. As noted earlier, no splitting is resolved in any of the e vibrational modes. The fact that we see such large variations in the spin-orbit constant in the totally symmetric modes suggests to us that the Jahn-Teller effect must perturb these totally symmetric modes. This is unusual. Earlier
63 O >
1047 1110 }
1360 1428 }
2076 2137 }
2375 2472 }
685
1230
1519 1652 1745 2049
2239 229 1
2522 2571 2674 2785 2806” 2853 2937“ 3087b 3118 3 1 52b 3256
3396 3493 } 3523 3552
0
653 1047
1198 1362
1487 1620 1713 2017 2075
2207 2259 2392 2490 2539 2642 2753 2774 2821 2840“
3086 3088 3224 3413
349 1 3520
Spin-orbit components of 3u3.
CH,O. f i 2A,-+R ‘E
320 330 340 280 290 300 310 nm
Figure 5. Laser-excited, wavelength-resolved emission spectrum of CH30 observed when the band lA3A is pumped. The other experimental con- ditions are as in Figure 4.
studiesZZ of the Jahn-Teller effect have employed models which only couple the Jahn-Teller active vibrations to the zero-point level. The present observations clearly demonstrate that a more complete model Hamiltonian is required to adequately fit the ground-state energy level pattern observed for C H 3 0 .
IV. Results: Perdeuteriomethoxy, CD30 A . Band Origin. The assignment of the 0; band of the CD30
should be straightforward once the CH30 molecule is assigned; only a small isotope shift is expected. However, the most prom- inent progression observed in the CD30 excitation spectrum ap- pears to start at 30924 cm-’ (the highest frequency band in Figure
Free Jet Cooled LIF Spectrum of Methoxy The Journal of Physical Chemistry, Vol. 92, No. 21, 1988 5919
CD~O. A 'A,- ii: 2~ C D ~ O , A ' ~ ~ - 2 'E
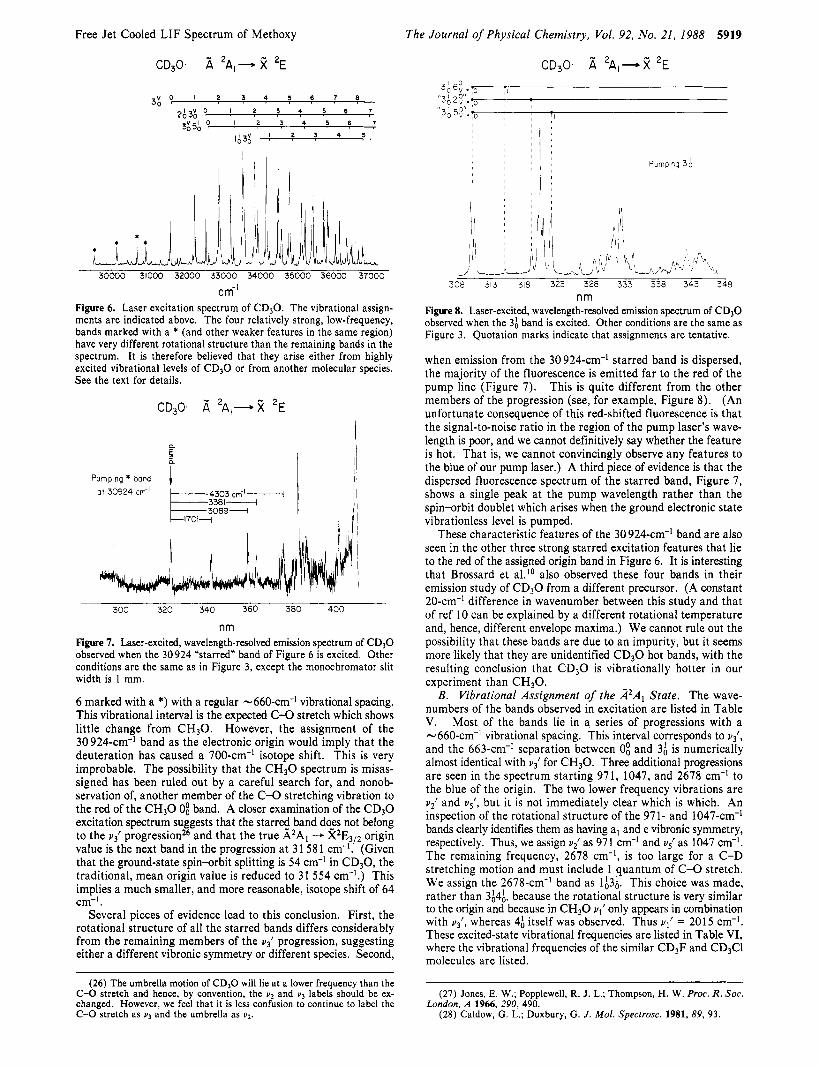
30000 31000 32000 33000 34000 35000 36000 37000
cm-l Figure 6. Laser excitation spectrum of CD30. The vibrational assign- ments are indicated above. The four relatively strong, low-frequency, bands marked with a * (and other weaker features in the same region) have very different rotational structure than the remaining bands in the spectrum. It is therefore believed that they arise either from highly excited vibrational levels of C D 3 0 or from another molecular species. See the text for details.
a
a 5 I Pumping * band 1
4303cm-I- 1
~
3381- 3089+
~
1701--
a t 30924 cm-l il i i!
300 320 340 360 380 400
nm Figure 7. Laser-excited, wavelength-resolved emission spectrum of C D 3 0 observed when the 30 924 "starred" band of Figure 6 is excited. Other conditions are the same as in Figure 3, except the monochromator slit width is 1 mm.
6 marked with a *) with a regular -660-cm-l vibrational spacing. This vibrational interval is the expected C-O stretch which shows little change from C H 3 0 . However, the assignment of the 30 924-cm-' band as the electronic origin would imply that the deuteration has caused a 700-cm-' isotope shift. This is very improbable. The possibility that the C H 3 0 spectrum is misas- signed has been ruled out by a careful search for, and nonob- servation of, another member of the C-0 stretching vibration to the red of the C H 3 0 0; band. A closer examination of the CD30 excitation spectrum suggests that the starred band do-es not belong to the u j l progression26 and that the true A2Al - X2EfI2 origin value is the next band in the progression at 3 1 58 1 cm- . (Given that the ground-state spin-orbit splitting is 54 cm-' in CD,O, the traditional, mean origin value is reduced to 31 554 cm-'.) This implies a much smaller, and more reasonable, isotope shift of 64 cm-' .
Several pieces of evidence lead to this conclusion. First, the rotational structure of all the starred bands differs considerably from the remaining members of the uj l progression, suggesting either a different vibronic symmetry or different species. Second,
(26) The umbrella motion of CDpO will lie at a lower frequency than the C-0 stretch and hence, by convention, the u2 and v3 labels should be ex- changed. However, we feel that it is less confusion to continue to label the C-0 stretch as up and the umbrella as v2.
Pumping 3b
- 308 313 318 323 328 333 338 343 348
nm Figure 8. Laser-excited, wavelength-resolved emission spectrum of CD,O observed when the 3; band is excited. Other conditions are the same as Figure 3. Quotation marks indicate that assignments are tentative.
when emission from the 30 924-cm-' starred band is dispersed, the majority of the fluorescence is emitted far to the red of the pump line (Figure 7). This is quite different from the other members of the progression (see, for example, Figure 8). (An unfortunate consequence of this red-shifted fluorescence is that the signal-to-noise ratio in the region of the pump laser's wave- length is poor, and we cannot definitively say whether the feature is hot. That is, we cannot convincingly observe any features to the blue of our pump laser.) A third piece of evidence is that the dispersed fluorescence spectrum of the starred band, Figure 7, shows a single peak at the pump wavelength rather than the spin-orbit doublet which arises when the ground electronic state vibrationless level is pumped.
These characteristic features of the 30 924-cm-I band are also seen in the other three strong starred excitation features that lie to the red of the assigned origin band in Figure 6. It is interesting that Brossard et a1.I0 also observed these four bands in their emission study of CD30 from a different precursor. (A constant 20-cm-' difference in wavenumber between this study and that of ref 10 can be explained by a different rotational temperature and, hence, different envelope maxima.) We cannot rule out the possibility that these bands are due to an impurity, but it seems more likely that they are unidentified CD30 hot bands, with the resulting conclusion that CD30 is vibrationally hotter in our experiment than CH30.
B. Vibrational Assignment of the d2Al State. The wave- numbers of the bands observed in excitation are listed in Table V. Most of the bands lie in a series of progressions with a -660-cm-' vibrational spacing. This interval corresponds to u3', and the 663-cm-' separation between 0; and 3; is numerically almost identical with uj l for CH30. Three additional progressions are seen in the spectrum starting 971, 1047, and 2678 cm-' to the blue of the origin. The two lower frequency vibrations are vi and us', but it is not immediately clear which is which. An inspection of the rotational structure of the 971- and 1047-cm-' bands clearly identifies them as having a, and e vibronic symmetry, respectively. Thus, we assign u i as 971 cm-' and u{ as 1047 cm-'. The remaining frequency, 2678 cm-', is too large for a C-D stretching motion and must include 1 quantum of C-0 stretch. We assign the 2678-cm-' band as IA3:. This choice was made, rather than 3;4;, because the rotational structure is very similar to the origin and because in C H 3 0 uI' only appears in combination with u3', whereas 4; itself was observed. Thus ul' = 2015 cm-I. These excited-state vibrational frequencies are listed in Table VI, where the vibrational frequencies of the similar CD3F and CD3C1 molecules are listed.
(27) Jones, E. W.; Popplewell, R. J. L.; Thompson, H. W. Proc. R. SOC.
(28) Caldow, G. L.; Duxbury, G. J . Mol. Spectrosc. 1981, 89, 93. London, A 1966, 290, 490.
5920 The Journal of Physical Chemistry, Vol. 92, No. 21, 1988 Foster et al.
C. Vibrational Assignment of the %Ei State. The 3; dispersed fluorescence spectrum shown in Figure 8 is typical of the CD30 spectra and demonstrates some of the problems found when the ground-state vibrational structure is assigned. On deuteriation, the u;, UT, u5", and 2u[ vibrations are all expected to lie close to 1000 cm-I. An even more complex picture is expected near 2000 cm-I, where uI", 2uF, 2~311, u t , 2u/, and 4u6" are clustered. This leads to the characteristic "clumped" spectrum shown in Figure 8, and assignments become difficult to make. Table VI1 lists thtground-state intervals observed when the indicated modes of the A2A, state are pumped. The lowest frequency vibration, 496 cm-', is assigned as u6". It lies close to the value estimated by assuming a 2lI2 isotopic dependence.
A second vibrational interval, 1174 cm-I, can be assigned with some confidence as 3". This vibrational frequency is too small for u i ' or q", and u2" is expected to lie a t lower frequency than Q". The fact that the 1174-cm-' vibration is enhanced when $3; is pumped further supports this assignment.
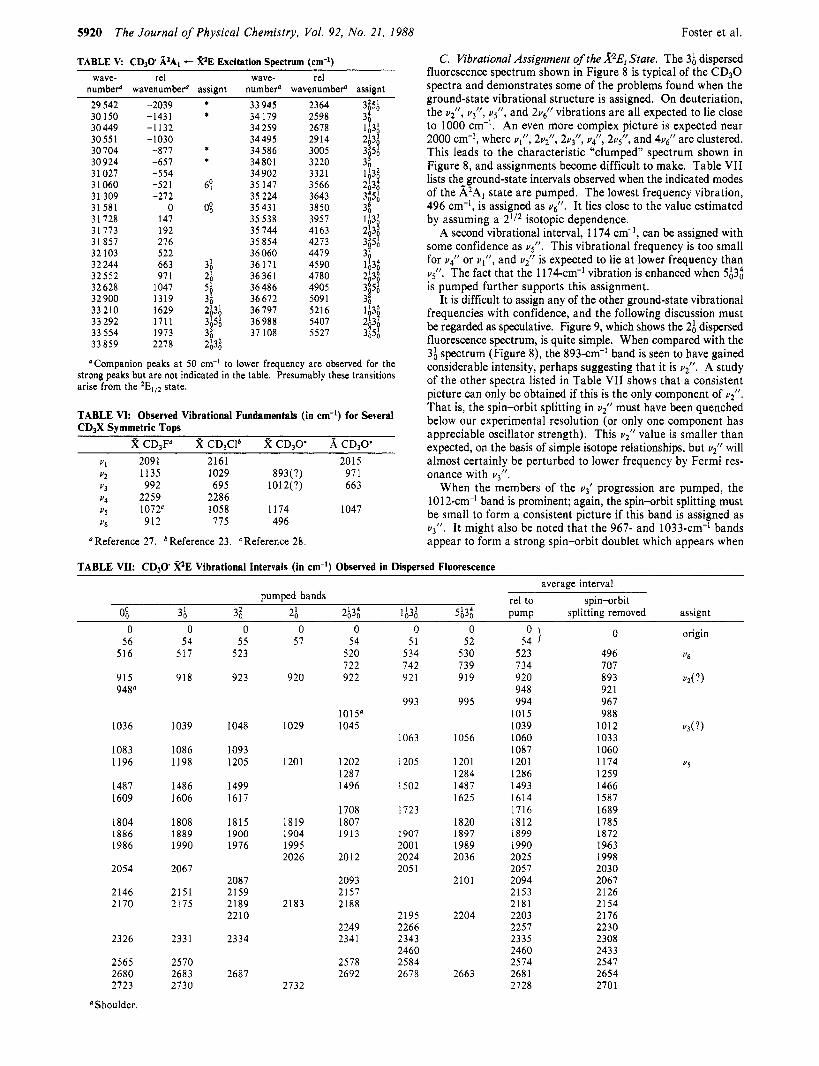
It is difficult to assign any of the other ground-state vibrational frequencies with confidence, and the following discussion must be regarded as speculative. Figure 9, which shows the 2; dispersed fluorescence spectrum, is quite simple. When compared with the 3; spectrum (Figure 8), the 893-cm-' band is seen to have gained considerable intensity, perhaps suggesting that it is up. A study of the other spectra listed in Table VI1 shows that a consistent picture can only be obtained if this is the only component of u2/1.
TABLE V CD30 A2Al - k2E Excitation Spectrum (cm-') wave- re1 wave- re1
number" wavenumber" assiant number" wavenumbeP assiant 29 542 30 150 30 449 30551 30 704 30924 31 027 31 060 31 309 31 581 31 728 31 773 31 857 32 103 32 244 32552 32628 32 900 33210 33 292 33 554 33 859
-2039 -1431 -1132 -1030 -877 -657 -554 -521 -272
0 147 192 276 522 663 97 1
1047 1319 1629 1711 1973 2278
* * 33 945
34 179 34 259 34 495 34 586 34 801 34 902 35 147 35 224 35431 35 538 35 744 35 854 36 060 36 171 36361 36 486 36 672 36 797 36 988 37 108
2364 2598 2678 2914 3005 3220 3321 3566 3643 3850 3957 4163 4273 4479 4590 4780 4905 509 1 5216 5407 5527
'Companion peaks at 50 cm-' to lower frequency are observed for the strong peaks but are not indicated in the table. Presumably these transitions arise from the 2Eli2 state.
That is, the spin-orbit splitting in u2" must have been quenched below our experimental resolution (or only one component has appreciable oscillator strength). This up value is smaller than
2 CD3F' 2 CD3Clb 2 CD30' A CD30' expected, on the basis of simple isotope relationships, but UT will
TABLE VI: Observed Vibrational Fundamentals (in cm-') for Several CD3X Symmetric Tops
~ ~ ~
u I 2091 2161 2015 almost certainly be perturbed to lower frequencyby Fermi res- YZ 1135 1029 893(?) 97 1 onance with u3". u3 992 695 1012(?) 663 When the members of the uj' progression are pumped, the ~q 2259 2286 101 2-cm-' band is prominent; again, the spin-orbit splitting must
be small to form a consistent picture if this band is assigned as ~5 1072' 1058 1174 1047
u3". It might also be noted that the 967- and 1033-cm-' bands y6 912 775 496
'Reference 27. *Reference 23. 'Reference 28. appear to form a strong spin-orbit doublet which appears when
TABLE VII: CD,O %*E Vibrational Intervals (in ern-') Observed in Diswrsed Fluorescence ~
average interval re1 to spin-orbit pumped bands
0; 36 3; 2; 263; 1 h3: $3; pump splitting removed assignt 0
56 516
0 54
517
0 0 55 57
523
0 54
520 722 922
O > 0 0
51 52 54 534 530 523 742 739 734 92 1 919 920
948 993 995 994
1015 1039
1063 1056 1060 1087
1205 1201 1201 1284 1286
1502 1487 1493 1625 1614
1723 1716 1820 1812
1907 1897 1899 200 1 1989 1990 2024 2036 2025 205 1 2057
2101 2094 2153 2181
2195 2204 2203 2266 2257 2343 2335 2460 2460 2584 2574 2678 2663 268 1
2728
0 origin
496 u6 707
92 1 961 988
1033 1060
1259 1466 1587 1689 1785 1872 1963 1998 2030 2067 2126 2154 2176 2230 2308 2433 2547 2654 2701
893 4)
1012 %(?)
1174 US
915 948'
918 923 920
1015' 1045 1036
1083 1196
1487 1609
1804 1886 1986
1039
1086 1198
1486 1606
1808 1889 1990
1048 1029
1093 1205 1201
1499 1617
1815 1819 1900 1904 1976 1995
2026
2087 2159 2189 2183 2210
2334
1202 1287 1496
1708 1807 1913
2012
2093 2157 2188
2054 2067
2146 2170
2151 2175
2249 2341
2578 2692
2326
2565 2680 2723
"Shoulder.
2331
2570 2683 2730
2687 2732
J . Phys. Chem. 1988, 92, 5921-5925 5921
I 305 310 315 320 325 330 335 340 345
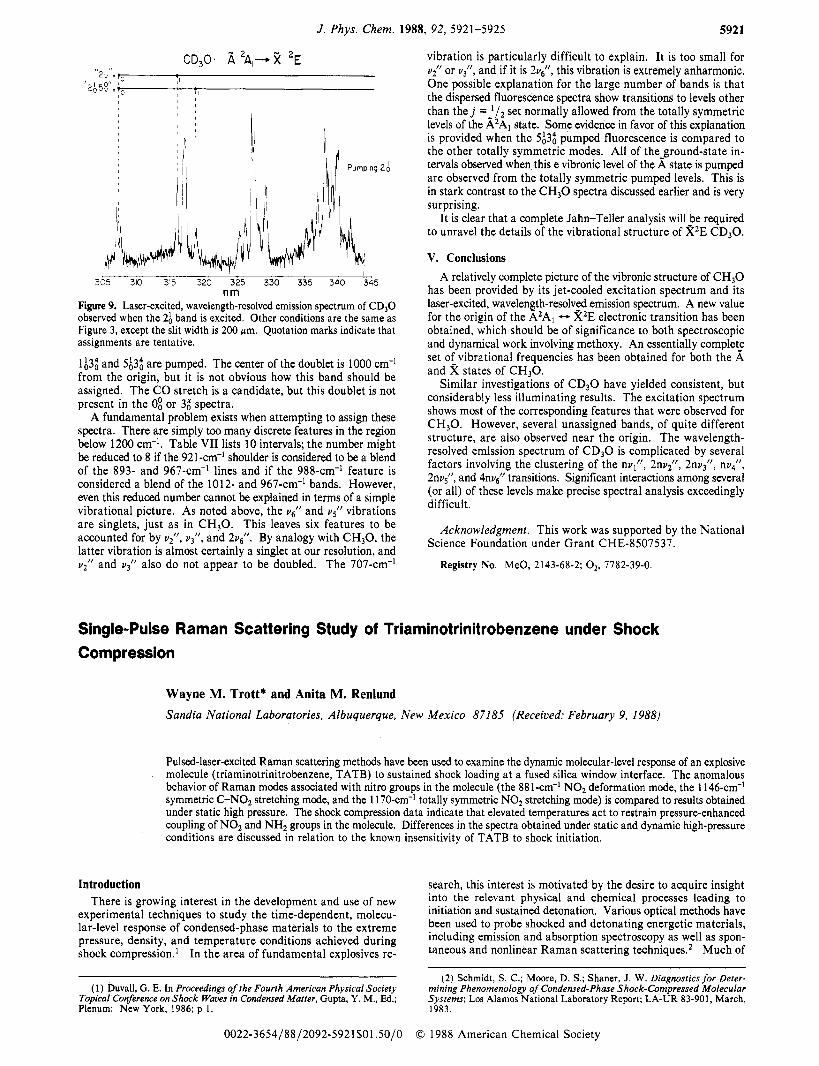
nm Figure 9. Laser-excited, wavelength-resolved emission spectrum of CD30 observed when the 2; band is excited. Other conditions are the same as Figure 3, except the slit width is 200 Km. Quotation marks indicate that assignments are tentative.
lA3; and $3; are pumped. The center of the doublet is 1000 cm-' from the origin, but it is not obvious how this band should be assigned. The CO stretch is a candidate, but this doublet is not present in the 0; or 3; spectra.
A fundamental problem exists when attempting to assign these spectra. There are simply too many discrete features in the region below 1200 cm-'. Table VI1 lists 10 intervals; the number might be reduced to 8 if the 921-cm-' shoulder is considered to be a blend of the 893- and 967-cm-' lines and if the 988-cm-' feature is considered a blend of the 1012- and 967-cm-' bands. However, even this reduced number cannot be explained in terms of a simple vibrational picture. As noted above, the ug/l and us'' vibrations are singlets, just as in C H 3 0 . This leaves six features to be accounted for by vr, vjll, and 2vc. By analogy with CH30, the latter vibration is almost certainly a singlet a t our resolution, and u; and uj l l also do not appear to be doubled. The 707-cm-'
vibration is particularly difficult to explain. It is too small for Y? or UT, and if it is 2v/, this vibration is extremely anharmonic. One possible explanation for the large number of bands is that the dispersed fluorescence spectra show transitions to levels other than t h e j =-l/Z set normally allowed from the totally symmetric levels of the A2AI state. Some evidence in favor of this explanation is provided when the $3; pumped fluorescence is compared to the other totally symmetric modes. All of the-ground-state in- tervals observed when this e vibronic level of the A state is pumped are observed from the totally symmetric pumped levels. This is in stark contrast to the C H 3 0 spectra discussed earlier and is very surprising.
It is clear that a complete Jahn-Teller analysis will )e required to unravel the details of the vibrational structure of X2E CD30.
V. Conclusions A relatively complete picture of the vibronic structure of C H 3 0
has been provided by its jet-cooled excitation spectrum and its laser-excited, wavelength-resolved emission spectrum. A new value for the origin of the A2Al - X2E electronic transition has been obtained, which should be of significance to both spectroscopic and dynamical work involving methoxy. An essentially complet_e set of_ vibrational frequencies has been obtained for both the A and X states of CH30.
Similar investigations of C D 3 0 have yielded consistent, but considerably less illuminating results. The excitation spectrum shows most of the corresponding features that were observed for CH30. However, several unassigned bands, of quite different structure, are also observed near the origin. The wavelength- resolved emission spectrum of C D 3 0 is complicated by several factors involving the clustering of the nu1", 2 n v r , 2nv3", nu/, 2nvF, and 4nvc transitions. Significant interactions among several (or all) of these levels make precise spectral analysis exceedingly difficult.
Acknowledgment. This work was supported by the National
Registry No. MeO, 2143-68-2; O,, 7782-39-0,
Science Foundation under Grant CHE-8507537.
Single-Pulse Raman Scattering Study of Triaminotrinitrobenzene under Shock Compression
Wayne M. Trott* and Anita M. Renlund Sandia National Laboratories, Albuquerque, New Mexico 871 85 (Received: February 9, 1988)
Pulsed-laser-excited Raman scattering methods have been used to examine the dynamic molecular-level response of an explosive molecule (triaminotrinitrobenzene, TATB) to sustained shock loading at a fused silica window interface., The anomalous behavior of Raman modes associated with nitro groups in the molecule (the 881-cm-' NO2 deformation mode, the 1146-cm-' symmetric C-N02 stretching mode, and the 1170-cm-' totally symmetric NO2 stretching mode) is compared to results obtained under static high pressure. The shock compression data indicate that elevated temperatures act to restrain pressure-enhanced coupling of NO2 and NH, groups in the molecule. Differences in the spectra obtained under static and dynamic high-pressure conditions are discussed in relation to the known insensitivity of TATB to shock initiation.
Introduction There is growing interest in the development and use of new
experimental techniques to study the time-dependent, molecu- lar-level response of condensed-phase materials to the extreme pressure, density, and temperature conditions achieved during shock compression.i ln the area of fundamental explosives re-
search, this interest is motivated by the desire to acquire insight into the relevant physical and chemical processes leading to initiation and sustained detonation. Various optical methods have been used to Probe shocked and detonating energetic materials, including emission and absorption SPeCtrOSCOpy as well as spon- taneous and nonlinear Raman scattering techniques.2 Much of
(2) Schmidt, S. C.; Moore, D. S.; Shaner, J. W. Diagnostics for Deter- mining Phenomenology of Condensed-Phase Shock-Compressed Molecular Systems; Los Alarnos National Laboratory Report; LA-UR 83-901, March,
(1) Duvall, G. E. In Proceedings of the Fourth American Physical Society Topical Conference on Shock Waves in Condensed Matter, Gupta, Y . M., Ed.; Plenum: New York, 1986; p 1. 1983.
0022-3654/88/2092-5921$01.50/0 0 1988 American Chemical Society