Fraction of photosynthetically active radiation absorbed by Amazon tropical forest: A comparison of...
8
Fraction of photosynthetically active radiation absorbed by Amazon tropical forest: A comparison of field measurements, modeling, and remote sensing Mo ˆnica C. A. Senna and Marcos H. Costa Department of Agricultural and Environmental Engineering, Federal University of Vic ¸osa (UFV), Vic ¸osa, Minas Gerais, Brazil Yosio E. Shimabukuro Department of Remote Sensing, National Institute for Space Research (INPE), Sa ˜o Jose ´ dos Campos, Sa ˜o Paulo, Brazil Received 10 December 2004; revised 29 April 2005; accepted 13 June 2005; published 15 September 2005. [1] The fraction of absorbed photosynthetically active radiation (FAPAR) is a vegetation biophysical variable that characterizes energy, mass, and momentum exchanges and is used extensively in models that represent the transfer of energy, carbon, water, and the biogeochemistry of terrestrial ecosystems. This paper compares three estimates of FAPAR by an Amazonian tropical rain forest. In the Tapajo ´s National Forest, near Santare ´m, state of Para ´, Brazil, FAPAR is estimated based on field measurements, modeling (using IBIS which simulates the fluxes in the soil-vegetation-atmosphere system considering two vegetation layers) and remotely sensed Moderate Resolution Imaging Spectroradiometer (MODIS) monthly FAPAR product, which has not been validated for a tropical rain forest yet. FAPAR based on field observations is calculated from incoming and reflected PAR measurements taken above the canopy, and downward PAR at a 15 m height, corrected to be representative of the entire canopy, obtaining an annual mean value of 0.91. FAPAR simulated by the Integrated Biosphere Simulator (IBIS) is 0.76, while the annual average FAPAR estimated by MODIS is 0.85. If we consider that MODIS estimates include only PAR absorbed by leaves, the remote sensing estimates are very close to field measurements corrected to include only the absorption by leaves (0.87); hence we conclude that the MODIS FAPAR product for the tropical rain forest is reliable to be used in future studies. However, model estimates of FAPAR for the tropical forest are low, and adjustments on the algorithm used to calculate the absorbed radiation by the canopy are necessary. Citation: Senna, M. C. A., M. H. Costa, and Y. E. Shimabukuro (2005), Fraction of photosynthetically active radiation absorbed by Amazon tropical forest: A comparison of field measurements, modeling, and remote sensing, J. Geophys. Res., 110, G01008, doi:10.1029/2004JG000005. 1. Introduction [2] Accurate monitoring of changes in the terrestrial biosphere has become increasingly important as the human impacts on biological systems and atmospheric chemistry grow. The detection of interannual variability and long-term trends of ecosystem structure permits early indication of fundamental changes in the biosphere, which would other- wise go undetected until major biome conversion begins [Running et al., 1999]. [3] Tropical rain forests are among the most important biomes of the planet in terms of fluxes of energy, water and carbon. According to Williams et al. [1998], although tropical rain forests extend over only about 8% of the global land surface (1210 6 km 2 ), they contain about 40% of the biomass (240 Pg C) and account for about 50% of the annual net primary production of the biosphere (30 Pg Ca 1 ). [4] The productivity of a vegetated surface is related, among other factors, to the photosynthetically active radi- ation (PAR) absorbed by the vegetation. The fraction of absorbed PAR (FAPAR) is defined by the ratio APAR/ PAR in , where PAR in is the incident PAR on the top of the canopy and APAR is the PAR absorbed by the photo- synthesizing tissue of the canopy. FAPAR may be used to characterize energy, mass and momentum exchanges be- tween the canopy and the atmosphere and is extensively used in models that represent the transfer of energy, carbon, water, and biogeochemistry of terrestrial ecosystems. The most significant variables to determine FAPAR are land cover, leaf area, solar angle, proportion of diffuse radiation and soil reflectance [Myneni and Williams, 1994; Mariscal et al., 2000; Nouvellon et al., 2000]. JOURNAL OF GEOPHYSICAL RESEARCH, VOL. 110, G01008, doi:10.1029/2004JG000005, 2005 Copyright 2005 by the American Geophysical Union. 0148-0227/05/2004JG000005$09.00 G01008 1 of 8
Transcript of Fraction of photosynthetically active radiation absorbed by Amazon tropical forest: A comparison of...

Fraction of photosynthetically active radiation absorbed by Amazon
tropical forest: A comparison of field measurements, modeling, and
remote sensing
Monica C. A. Senna and Marcos H. CostaDepartment of Agricultural and Environmental Engineering, Federal University of Vicosa (UFV), Vicosa, Minas Gerais,Brazil
Yosio E. ShimabukuroDepartment of Remote Sensing, National Institute for Space Research (INPE), Sao Jose dos Campos, Sao Paulo, Brazil
Received 10 December 2004; revised 29 April 2005; accepted 13 June 2005; published 15 September 2005.
[1] The fraction of absorbed photosynthetically active radiation (FAPAR) is a vegetationbiophysical variable that characterizes energy, mass, and momentum exchanges and isused extensively in models that represent the transfer of energy, carbon, water, and thebiogeochemistry of terrestrial ecosystems. This paper compares three estimates of FAPARby an Amazonian tropical rain forest. In the Tapajos National Forest, near Santarem,state of Para, Brazil, FAPAR is estimated based on field measurements, modeling(using IBIS which simulates the fluxes in the soil-vegetation-atmosphere systemconsidering two vegetation layers) and remotely sensed Moderate Resolution ImagingSpectroradiometer (MODIS) monthly FAPAR product, which has not been validated for atropical rain forest yet. FAPAR based on field observations is calculated from incomingand reflected PAR measurements taken above the canopy, and downward PAR at a15 m height, corrected to be representative of the entire canopy, obtaining an annual meanvalue of 0.91. FAPAR simulated by the Integrated Biosphere Simulator (IBIS) is 0.76,while the annual average FAPAR estimated by MODIS is 0.85. If we consider thatMODIS estimates include only PAR absorbed by leaves, the remote sensing estimates arevery close to field measurements corrected to include only the absorption by leaves (0.87);hence we conclude that the MODIS FAPAR product for the tropical rain forest isreliable to be used in future studies. However, model estimates of FAPAR for the tropicalforest are low, and adjustments on the algorithm used to calculate the absorbed radiationby the canopy are necessary.
Citation: Senna, M. C. A., M. H. Costa, and Y. E. Shimabukuro (2005), Fraction of photosynthetically active radiation absorbed by
Amazon tropical forest: A comparison of field measurements, modeling, and remote sensing, J. Geophys. Res., 110, G01008,
doi:10.1029/2004JG000005.
1. Introduction
[2] Accurate monitoring of changes in the terrestrialbiosphere has become increasingly important as the humanimpacts on biological systems and atmospheric chemistrygrow. The detection of interannual variability and long-termtrends of ecosystem structure permits early indication offundamental changes in the biosphere, which would other-wise go undetected until major biome conversion begins[Running et al., 1999].[3] Tropical rain forests are among the most important
biomes of the planet in terms of fluxes of energy, water andcarbon. According to Williams et al. [1998], althoughtropical rain forests extend over only about 8% of theglobal land surface (�12�106 km2), they contain about
40% of the biomass (240 Pg C) and account for about50% of the annual net primary production of the biosphere(�30 Pg C�a�1).[4] The productivity of a vegetated surface is related,
among other factors, to the photosynthetically active radi-ation (PAR) absorbed by the vegetation. The fraction ofabsorbed PAR (FAPAR) is defined by the ratio APAR/PARin, where PARin is the incident PAR on the top of thecanopy and APAR is the PAR absorbed by the photo-synthesizing tissue of the canopy. FAPAR may be used tocharacterize energy, mass and momentum exchanges be-tween the canopy and the atmosphere and is extensivelyused in models that represent the transfer of energy, carbon,water, and biogeochemistry of terrestrial ecosystems. Themost significant variables to determine FAPAR are landcover, leaf area, solar angle, proportion of diffuse radiationand soil reflectance [Myneni and Williams, 1994; Mariscalet al., 2000; Nouvellon et al., 2000].
JOURNAL OF GEOPHYSICAL RESEARCH, VOL. 110, G01008, doi:10.1029/2004JG000005, 2005
Copyright 2005 by the American Geophysical Union.0148-0227/05/2004JG000005$09.00
G01008 1 of 8

[5] A detailed estimation of FAPAR requires long termmonitoring with high temporal and spatial resolution, whichdemands a triple methodology, combining field measure-ments, remote sensing and modeling. While the hightemporal resolution monitoring may be obtained by fieldmeasurements, remote sensing is used to quantify the spatialheterogeneity of FAPAR and, since the temporal and spatialmeasurements cannot provide a complete view of theecosystem, modeling is required to isolate unmeasuredecosystem processes and to provide predictive capacity[Running et al., 1999].[6] One of the recent improvements in remote sensing is
MODIS (Moderate Resolution Imaging Spectroradiometer),the main high temporal frequency global mapping sensoronboard the Terra and Aqua satellites. MODIS acquires datain 36 spectral bands between 0.4–14.4 mm with spatialresolution of 250 m (2 bands), 500 m (5 bands) and 1 km(29 bands) [Running et al., 1994, 1999; Cohen and Justice,1999], and is ideal for monitoring large-scale changes in thebiosphere that will yield new insights into the workings ofthe global carbon cycle. MODIS products include surfacereflectance and temperature, and from these, spectral veg-etation index, leaf area index, land cover, net primaryproductivity and FAPAR. These and other products playan important role in measuring and monitoring surfacevariables, and in the development and validation of globalecosystem models [Cohen and Justice, 1999].[7] By modeling the radiative transfer through a canopy
using a process-based model, it is possible to understandthe absorption, transmission and reflection of radiation byleaves, branches and soil surface, at the same time themodel’s ability to reproduce the measured values can beassessed. A model of the Earth’s biosphere, the IntegratedBiosphere Simulator (IBIS) [Foley et al., 1996], wasdeveloped as a first step toward gaining an improvedunderstanding of global biospheric processes and studyingtheir potential response to human activity. IBIS is one ofthe new generation of global biosphere models, namedDynamic Global Vegetation Models, that considers changesin vegetation composition and structure in response toenvironmental change. This model represents a wide rangeof processes, including interactions between land andatmosphere, carbon and nutrient cycling and vegetationdynamics, and is also coupled to climate models, allowingstudies of the long-term interactions between biosphere andatmosphere.[8] Here in this paper, we compare FAPAR estimates by
IBIS and MODIS for a tropical rain forest with fieldmeasurements collected at a micrometeorological site inAmazonia. Section 2 describes the site where field measure-ments were taken, and section 3 describes the three meth-odologies used (field measurements, modeling and remotesensing). Section 4 discusses the results obtained by eachmethodology, while section 5 presents an overall discussionof the results, comparing the three methodologies andindicating strengths and limitations of each one. The finalsection presents a summary and conclusions of the work.
2. Site Description
[9] Data used in this work were collected at the IBAMATapajos National Forest (Flona Tapajos), a primary tropical
forest area located in Santarem, state of Para, Brazil(Figure 1). The canopy is characterized by large emergenttrees up to 55 m tall, and a closed canopy at �40 m; thereare few indications of recent anthropogenic disturbanceother than hunting trails. Soils are nutrient-poor clay oxisolswith low organic content and low cation exchange capacity[Saleska et al., 2003]. The mean leaf area index (LAI)measured on the field is 5.6 (unpublished data).
3. Methods
3.1. Field Measurements
[10] The PAR components in the Flona Tapajos arestudied by two time series, one collected at the tower closeto km 67 on the Cuiaba-Santarem Highway, and the other atthe tower close to km 83. Both towers have two PARsensors, but they are installed differently. At km 67(2.855�S; 55.036�W), the sensors measure the downwardPAR, but one is installed above the canopy (58 m high,PARin) while the other is 15 m above the ground (PAR15m),above the understory vegetation. Later, these data arecorrected to become representative of the entire canopy.At km 83 (3.018�S; 54.971�W), both are installed on the topof the canopy, one measuring the incident PAR (PARin) andthe other measuring the reflected PAR (PARout). Thereforedata from km 67 are used to study radiation inside thecanopy, while those from km 83 are used to quantify theradiation reflected by the forest. We use km 67 datacollected from April 2001 to October 2002, and km 83data collected from June 2000 to June 2001, prior to theselective logging at the km 83 site in September 2001.
Figure 1. Location of the experimental area.
G01008 SENNA ET AL.: AMAZON TROPICAL FOREST FAPAR
2 of 8
G01008

[11] FAPAR between top of canopy and 15 m(FAPARtop-15m) is calculated assuming that r (PAR reflec-tance, r = PARout/PARin) and ttop-15m (PAR transmittancebetween top and 15 m, ttop-15m = PAR15m/PARin) do notvary between the sites (r is obtained from km 83 data and tfrom km 67 data), and that the PAR reflected by the soilsurface is negligible [Gower et al., 1999],
FAPARtop-15m ¼ PARin � PARoutð Þ½� PAR15m � PARout soilð Þ�=PARin; ð1Þ
which can be re-written as
FAPARtop-15m ¼ 1� r � ttop-15m: ð2Þ
3.2. Modeling
[12] The IBIS land surface model simulates theexchanges of energy, water, CO2 and momentum in thesoil-vegetation-atmosphere system. The model represents
two vegetation layers (trees and grasses) and eight soillayers. The model uses a 60-min integration interval tocapture the diurnal cycle of the biophysical and physiolog-ical processes. The version 2.6.4 IBIS is calibrated against2000 to 2001 data from the km 83 site. The calibrationconsisted simply of the update of the coefficient fvis (below)using the value obtained by a least squares fit between theincoming PAR and the incoming shortwave radiation. Next,the model was run forced by km 67 data, with a one-hourintegration interval for the period 11 April 2001 to 2October 2002.[13] IBIS calculates the solar radiation for each vegeta-
tion level with separate computations for direct and diffuseradiation in two wavelength bands (visible and nearinfrared). In ecosystem models coupled to climate models,such as IBIS, the incident PAR is usually calculated fromthe incoming solar radiation, according to equations likeequation (3),
PARin ¼ PARudir þ PARudif
¼ Qtop � 4:59 � fvis � 1� fdifð Þ� �
þ Qtop � 4:59 � fvis � fdif� �
;
ð3Þ
where PARudir is the incident direct PAR in the uppercanopy, PARudif is the incident diffuse PAR in the uppercanopy, Qtop is the incident solar radiation at the canopy top(measured at the tower), fvis is the energy fraction of thevisible band (0.427, calibrated coefficient) and the fdif is thefraction of diffuse solar radiation, calculated according toNikolov and Zeller [1992] and Friend [1998]. In this study,although we force IBIS with field-measured data, we chooseto force the model with incoming solar radiation andconvert it to incoming PAR, rather than force it withincoming PAR. This is done to keep compatibility withother applications of the model, notably when the model isforced by atmospheric models or by climate data. TotalAPAR is calculated as the sum of the upper and lowercanopy APAR,
APARt ¼ PARudir � audir þ PARudif � audifð Þþ PARldir � aldir þ PARldif � aldifð Þ; ð4Þ
where audir is the fraction of direct PAR absorbed bythe upper canopy, audif is the fraction of the diffuse PARabsorbed by the upper canopy, PARldir is the directPAR incident on the lower canopy, aldir is the fraction ofPAR absorbed by the lower canopy, and PARldif and aldifhave the same significance, for diffuse PAR. The radiationtransmittance through the canopy and the absorptancecoefficients are dynamically calculated by IBIS as afunction of the zenith angle, leaf area index, leaforientation, and transmission and scattering coefficients,according to the methodology proposed by Sellers [1985].The absorptance coefficients include the absorption byleaves, branches and stems. FAPAR is calculated by theratio APARt/PARin.
3.3. Remote Sensing
[14] The FAPAR products from MODIS are producedwith a spatial resolution of 1 km, and are provided as adaily product (MOD15A1), as a product from the maximum
Figure 2. Monthly mean of (a) incident PAR observedabove the canopy and at 15 m from the ground at km 67 and(b) incident and reflected PAR observed above the canopyat km 83.
G01008 SENNA ET AL.: AMAZON TROPICAL FOREST FAPAR
3 of 8
G01008

value on a period of 8 days (MOD15A2), and as a monthlyaverage product (MOD15_BU). The MODIS FAPAR algo-rithm is based on three-dimensional radiative transfer theoryand developed by inversion using a look-up table approach[Privette et al., 2002; Myneni et al., 2002]. It has interfaceswith the MODIS surface reflectance (MOD09) and landcover (MOD12) products. When this method fails to find asolution, a backup method based on the relationship betweenthe normalized difference vegetation index (NDVI) andFAPAR is used [Myneni et al., 2002; Knyazikhin et al.,1999].[15] The product used in this study is MOD15_BU–
collection 4, that is produced and distributed by the BostonUniversity and available at the address ftp://crsa.bu.edu/pub/rmyneni/myneniproducts/MODIS. We used data fromOctober 2001 to September 2002. The study area containstwenty-five 1 km2 cells and is situated between 2.85�S and2.88�S and between 55.05�W and 55.01�W, which includesthe km 67 tower.[16] For each cell, we analyze the FAPAR value and the
quality assessment (QA), which informs the type of algo-
rithm used or the inexistence of data. The monthly FAPARmean is obtained by the arithmetic mean of the 25 gridpoints, whenever data existed. From the QA value for eachcell, we also calculate a quality index for each cell. Thisquality index assumes values from 4.0 to 2.5 if the primaryalgorithm was used, from 2.0 to 0.5 if the secondaryalgorithm was used, and zero if no data is available. Thetotal quality index (QI) is the sum of the individual qualityindexes for the 25 cells, and varies from zero to 100. Thegreater the QI, the more reliable is the quality of theestimated FAPAR.
4. Results
4.1. Field Measurements
[17] Figure 2a presents the monthly variation in PARin
and PAR15m at the km 67 site. The monthly PARin valuesvary from 640 to 850 mmol m�2s�1, with mean value of732 mmol m�2s�1, while the monthly PAR15m values varybetween 129 and 404 mmol m�2s�1 with a mean value of239 mmol m�2s�1. Figure 2b shows the monthly variation inPARin and PARout at the km 83 site. The minimum, meanand maximum PARin values are 536, 693 and 894 mmolm�2s�1, respectively, and for PARout they are 21, 25 and30 mmol m�2s�1. At both sites, the maximum values occurduring the dry season and the minimum during the rainyseason, when cloudiness is greater.[18] The relationship between ttop-15m and r with the solar
zenith angle is illustrated in Figure 3. The lower values ofttop-15m occur at the higher zenith angles, when the pathtaken by the radiation within the canopy is longer, increas-ing the chance of absorption by leaves and branches.Figure 3b shows the relationship of r with the solar zenithangle, showing that the reflectance increases with the zenithangle (0.03 to 0.05) but are relatively low compared tochanges in transmittance (0.2 to 0.7).[19] We use the relationships obtained by Anhuf and
Rollenbeck [2001] to correct the km 67 transmittance valuesto a transmittance value representative of the entire canopy(ttop-0m). They studied the PAR transmittance behavior in atropical forest in Venezuela (assumed similar to the structureof our study site), using PAR measurements every 10 min atfive heights (0, 5, 12, 21 and 42 m). Between 5 and 21 m,data were collected by a sensor coupled to an electric
Figure 3. Monthly mean of (a) transmittance between thetop of the canopy and 15 m at km 67 and (b) reflectance atkm 83; as a function of the solar zenith angle. The barsrepresent the standard deviation.
Table 1. Monthly Means of ttop-15m (± the Standard Deviation)
and ttop-0m (Both From km 67), r (From km 83), FAPARtop-15m, and
FAPARtop-0m
ttop-15m ttop-0m r FAPARtop-15m FAPARtop-0m
January 0.215 ± 0.053 0.040 0.031 0.754 0.929February 0.221 ± 0.080 0.041 0.031 0.749 0.928March 0.308 ± 0.102 0.058 0.027 0.665 0.915April 0.330 ± 0.136 0.062 0.028 0.642 0.910May 0.332 ± 0.141 0.062 0.029 0.639 0.909June 0.303 ± 0.155 0.057 0.028 0.669 0.915July 0.340 ± 0.206 0.064 0.031 0.629 0.905August 0.452 ± 0.238 0.085 0.029 0.519 0.886September 0.437 ± 0.223 0.082 0.028 0.535 0.890October 0.317 ± 0.146 0.059 0.030 0.652 0.911November 0.206 ± 0.058 0.039 0.032 0.762 0.929December 0.168 ± 0.031 0.032 0.033 0.799 0.935Annualmean
0.308 0.057 0.030 0.668 0.914
G01008 SENNA ET AL.: AMAZON TROPICAL FOREST FAPAR
4 of 8
G01008

system that went up or down at constant speed. Accordingto their results, the ratio between the transmittance of theentire canopy (4.5%) and the transmittance above 15 m(24%) is 0.1875. These data agree with the study byJanuario et al. [1992], who compared the total solarradiation inside and outside the Tucuruı Forest, Para (usingsensors randomly installed on the forest ground and a sensorlocated in an open area) and reported that the groundradiation was 4.7% of the incident radiation.[20] Thus the ttop-15m values are multiplied by the ratio
0.1875 to obtain the ttop-0m values. Table 1 shows the meanmonthly values of r, ttop-15m, ttop-0m, FAPARtop-15m andFAPARtop-0m. The values of r vary from 0.027 to 0.033with a mean value of 0.030, similar to the results obtainedby Leitao et al. [2002], who found 0.020 for a tropical rainforest in Manaus. The ttop-0m values range from 0.032 to0.085, with a mean value of 0.057, and are consistent withthe values obtained by Anhuf and Rollenbeck [2001], 0.045for PAR, and by Januario et al. [1992], 0.047 for globalsolar radiation. FAPARtop-0m varies from 0.886 to 0.935with a mean value of 0.914. Figure 4 shows the monthlymean values of PARin, FAPARtop-0m and APARtop-0m.FAPARtop-0m presents little variation along the year, andits lower values occur in August and September.
4.2. Modeling
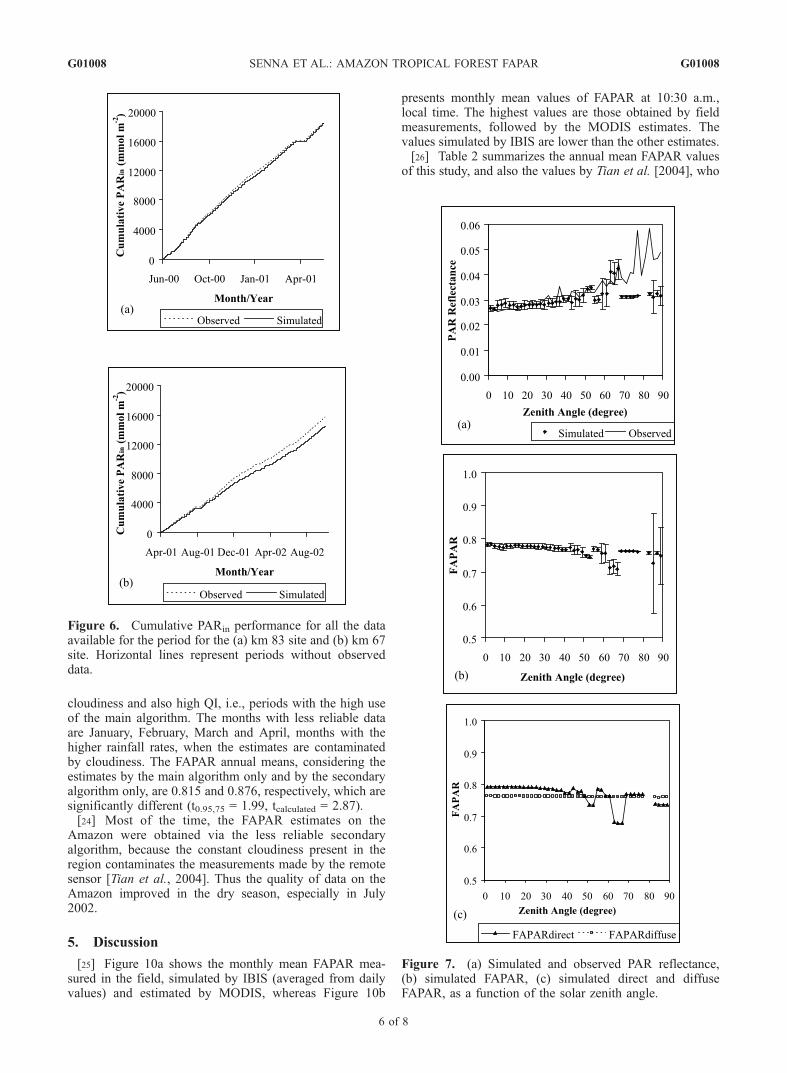
[21] As the conversion of incident solar radiation toincident PAR may be a source of error in the estimate ofmodeled APAR, we include here an analysis of the simu-lated PARin. Figure 5 shows the dispersion of PARin
simulated by IBIS versus the observed values for the km83 and km 67 data, while Figure 6 shows the cumulativeobserved and simulated PARin in this ecosystem for the km83 and km 67. While the model does not tend to underes-timate or overestimate the values observed for km 83, itunderestimates the km 67 observed values by about 7%.[22] Figure 7a shows the simulated and observed PAR
reflectance (from km 83) as a function of the solar zenithangle. Although the simulated reflectance increases with thezenith angle, it underestimates the canopy PAR reflectanceat very high zenith angles. The mean simulated reflectance
is around 0.03, similar to the observed. Figure 7b shows thedependency of the simulated FAPAR on the solar zenithangle. FAPAR is slightly smaller when the zenith angle isgreater, owing to higher reflectance (Figure 3) and higherabsorptance of the sunrays by leaves and branches (longerin-canopy path). The mean simulated FAPAR value isapproximately 0.76. The direct and diffuse simulatedFAPAR is shown in Figure 7c. The diffuse FAPAR remainsapproximately constant (0.762) for any solar angle value,while the direct FAPAR decreases with the zenith angle andits mean value is 0.769. Figure 8 shows the monthlysimulated values for PARin, APAR and FAPAR, showingthat APAR follows PARin closely, and FAPAR variesslightly between 0.763 and 0.775.
4.3. Remote Sensing
[23] Figure 9 shows the monthly variation of FAPARestimated by MODIS and its QI, obtained in the 5 5 grid.During March 2002 there were no data for this grid, becauseof problems presented by MODIS in this period. The meanFAPAR is 0.853 throughout the period. The months withmost reliable data are June and July, a period with less
Figure 4. Monthly mean of PARin, APARtop-0m, andFAPARtop-0m of the observed data at km 67.
Figure 5. Simulated versus observed PARin for (a) km 83and (b) km 67.
G01008 SENNA ET AL.: AMAZON TROPICAL FOREST FAPAR
5 of 8
G01008
cloudiness and also high QI, i.e., periods with the high useof the main algorithm. The months with less reliable dataare January, February, March and April, months with thehigher rainfall rates, when the estimates are contaminatedby cloudiness. The FAPAR annual means, considering theestimates by the main algorithm only and by the secondaryalgorithm only, are 0.815 and 0.876, respectively, which aresignificantly different (t0.95,75 = 1.99, tcalculated = 2.87).[24] Most of the time, the FAPAR estimates on the
Amazon were obtained via the less reliable secondaryalgorithm, because the constant cloudiness present in theregion contaminates the measurements made by the remotesensor [Tian et al., 2004]. Thus the quality of data on theAmazon improved in the dry season, especially in July2002.
5. Discussion
[25] Figure 10a shows the monthly mean FAPAR mea-sured in the field, simulated by IBIS (averaged from dailyvalues) and estimated by MODIS, whereas Figure 10b
presents monthly mean values of FAPAR at 10:30 a.m.,local time. The highest values are those obtained by fieldmeasurements, followed by the MODIS estimates. Thevalues simulated by IBIS are lower than the other estimates.[26] Table 2 summarizes the annual mean FAPAR values
of this study, and also the values by Tian et al. [2004], who
Figure 7. (a) Simulated and observed PAR reflectance,(b) simulated FAPAR, (c) simulated direct and diffuseFAPAR, as a function of the solar zenith angle.
Figure 6. Cumulative PARin performance for all the dataavailable for the period for the (a) km 83 site and (b) km 67site. Horizontal lines represent periods without observeddata.
G01008 SENNA ET AL.: AMAZON TROPICAL FOREST FAPAR
6 of 8
G01008

compared the FAPAR obtained by CLM and MODIS for2001 over various regions, including the Amazon. TheFAPAR values found at 10:30 a.m. are slightly higher thanthose for the entire day. The MODIS estimated FAPAR isthe same in both studies, although the model estimates byboth studies are lower than the remote sensing estimates.[27] We consider that the field measurements are the
least-biased of the three estimates, despite the correctionwe made from 15 m to the ground, and the clearing of thecanopy around the tower, which increases ttop-15m andtherefore reduces FAPAR. In the absence of a microme-teorological tower, the actual FAPAR of a tropical rainforest is probably a little higher than 0.91.[28] We also should consider the differences in absorp-
tion. While the MODIS algorithm determines FAPAR fromthe absorption of radiation by leaves only, the field obser-vations and the IBIS simulations include PAR absorbed byleaves (proportional to the leaf area index, LAI) and bybranches (proportional to the stem area index, SAI). For example, if we correct the field measurements by a factor of
0.951 (e�0.5 (LAI+SAI)/e�0.5 LAI, assuming LAI = 5.6 andSAI = 0.1), FAPAR by leaves would be 0.87, closer to theMODIS estimates. We should not ignore, however, thatMODIS estimates are affected by atmospheric conditions,such as aerosols and cloud presence, which are verycommon in this region.[29] IBIS estimates of FAPAR are somewhat low, and
adjustments on the algorithm used to calculate the absorbedradiation by the canopy are necessary. As far as we could
Figure 8. Monthly mean of simulated PARin, APAR, andFAPAR.
Figure 9. Monthly FAPAR mean estimated by MODISand its quality index (QI). The bars represent the standarddeviation of the spatial data.
Figure 10. Monthly mean of the observed and simulatedFAPAR by IBIS and estimated FAPAR by MODIS(a) throughout the day and (b) at 10:30 a.m. local time.The bars represent the standard deviation. Markers areslightly shifted horizontally to avoid overlapping of the bars.
Table 2. Comparison of the Mean Annual FAPAR Values Found
in This Study For the Whole Day and at 10:30 a.m. Local Time
With Those Reported by Tian et al. [2004]
FAPAR
Entire Day At 10:30 a.m.
This study,Flona Tapajos(3�S, 55�W)
This study,Flona Tapajos(3�S, 55�W)
Tian et al. [2004]Amazon (10�S–0�S, 70�W–50�W)
FieldMeasurements
0.91 0.93 . . .
Modeling 0.76 (IBIS) 0.77 (IBIS) 0.83 (CLM)MODIS . . . 0.85 0.85
G01008 SENNA ET AL.: AMAZON TROPICAL FOREST FAPAR
7 of 8
G01008

investigate in several sensitivity experiments, for the rangeof LAI used (5 to 6), IBIS FAPAR simulations are notmuch sensitive to changes in canopy optical parameters(Figure 11). Although the incoming PAR and the reflectionof PAR by the canopy are apparently correct, the simula-tions of ground radiation and soil heat flux (not shown)indicate that there is too much radiation reaching the groundas compared to actual amounts. We suggest here that thelow radiation absorption by the canopy may be a conse-quence of simplifications introduced to the canopy radiationtransfer algorithm of Sellers [1985], used by IBIS and manyother models.
6. Summary and Conclusions
[30] This paper compares three estimates of FAPAR by anAmazonian tropical rain forest. In the Tapajos NationalForest, near Santarem, state of Para, Brazil, FAPAR isestimated based on field measurements, modeling andremotely sensed MODIS monthly FAPAR product, whichhas not been validated for a tropical rain forest yet. FAPARbased on field observations is calculated from incoming andreflected PAR measurements taken above the canopy, anddownward PAR at a 15 m height, corrected to be represen-tative of the entire canopy, obtaining an annual mean valueof 0.91. FAPAR simulated by IBIS is 0.76, while the annualaverage FAPAR estimated by MODIS is 0.85.[31] Concluding, IBIS estimates of FAPAR are low, and
an algorithm revision is necessary, while the MODISestimates, that consider only PAR absorbed by leaves, arevery close to field measurements corrected to include onlythe absorption by leaves. According to our results, theMODIS FAPAR product for the tropical rain forests isreliable to be used in future studies. Despite this, theproportion of missing data through the year is substantial,and the MODIS team should seriously consider improve-ments in both primary and secondary algorithms to increaseFAPAR data existence.
[32] Acknowledgments. We thank Scott Saleska (Harvard Universi-ty), Scott Miller (University of California, Irvine), and Humberto Rocha(University of Sao Paulo) for the field data used in this paper. MonicaSenna was supported by the Brazilian agency CNPq.
ReferencesAnhuf, D., and R. Rollenbeck (2001), Canopy structure of the Rio Surumonirain forest (Venezuela) and its influence on microclimate, Ecotropica, 7,21–32.
Cohen, W. B., and C. O. Justice (1999), Validating MODIS terrestrialecology products: Linking in situ and satellite measurements, RemoteSens. Environ., 70, 1–3.
Foley, J. A., I. C. Prentice, N. Ramankutty, S. Levis, D. Pollard, S. Sitch,and A. Haxeltine (1996), An integrated biosphere model of land surfaceprocesses, terrestrial carbon balance, and vegetation dynamics, GlobalBiogeochem. Cycles, 10, 603–628.
Friend, A. D. (1998), Parameterisation of a global daily weather generatorfor terrestrial ecosystem modeling, Ecol. Modell., 109(2), 121–140.
Gower, S. T., C. J. Kucharik, and J. M. Norman (1999), Direct and indirectestimation of leaf area index, FAPAR, and net primary production ofterrestrial ecosystems, Remote Sens. Environ., 70, 29–51.
Januario, M., Y. Viswanadham, and R. C. Senna (1992), Radiacao solartotal dentro e fora de floresta tropical umida de terra firme (Tucuruı,Para), Acta Amazon., 22(3), 335–340.
Knyazikhin, Y., et al. (1999), MODIS leaf area index (LAI) and fraction ofphotosynthetically active radiation absorbed by vegetation (FPAR) pro-duct (MOD15) algorithm, theor. basis doc., NASA Goddard Space FlightCent., Greenbelt, Md. (Available at http://modis.gsfc.nasa.gov/data/atbd/atbd_mod15.pdf)
Leitao, M. M. V. B. R., J. M. Santos, and G. M. Oliveira (2002), Estima-tivas do albedo em tres ecossistemas da floresta amazonica, Rev. Bras.Eng. Agric. Ambient., 6, 256–261.
Mariscal, M. J., F. Orgaz, and F. J. Villalobos (2000), Modelling andmeasurement of radiation interception by olive canopies, Agric. For.Meteorol., 100, 183–197.
Myneni, R. B., and D. L. Williams (1994), On the relationship betweenFAPAR and NDVI, Remote Sens. Environ., 49, 200–211.
Myneni, R. B., et al. (2002), Global products of vegetation leaf area andfraction absorbed PAR from year one of MODIS data, Remote Sens.Environ., 83, 214–231.
Nikolov, N. T., and K. F. Zeller (1992), A solar radiation algorithm forecosystem dynamic models, Ecol. Modell., 61, 149–168.
Nouvellon, Y., A. Begue, M. S. Moran, D. L. Seen, S. Rambal, D. Luquet,G. Chehbouni, and Y. Inoue (2000), PAR extinction in shortgrassecosystems: Effects of clumping, sky conditions and soil albedo, Agric.For. Meteorol., 105, 21–41.
Privette, J. L., R. B. Myneni, Y. Knyazikhin, M. Mukelabai, G. Roberts,Y. Tian, Y. Wang, and S. G. Leblanc (2002), Early spatial and temporalvalidation of MODIS LAI product in the Southern Africa Kalahari,Remote Sens. Environ., 83, 232–243.
Running, S. W., et al. (1994), Terrestrial remote sensing science andalgorithms planned for EOS/MODIS, Int. J. Remote Sens., 15, 3587–3620.
Running, S. W., D. D. Baldocchi, D. P. Turner, S. T. Gower, P. S. Bakwin,and K. A. Hibbard (1999), A global terrestrial monitoring network inte-grating tower fluxes, flask sampling, ecosystem modeling and EOSsatellite data, Remote Sens. Environ., 70, 108–127.
Saleska, S. R., et al. (2003), Carbon in Amazon forests: Unexpected sea-sonal fluxes and disturbance-induced losses, Science, 302, 1554–1557.
Sellers, P. J. (1985), Canopy reflectance, photosynthesis, and transpiration,Int. J. Remote Sens., 6, 1335–1372.
Tian, Y., et al. (2004), Comparison of seasonal and spatial variations ofLAI/FPAR from MODIS and common land model, J. Geophys. Res.,109, D01103, doi:10.1029/2003JD003777.
Williams, M., Y. Malhi, A. D. Nobre, E. B. Rastetter, J. Grace, and M. G. P.Pereira (1998), Seasonal variation in net carbon exchange and evapo-transpiration in a Brazilian rain forest: A modeling analysis, Plant CellEnviron., 21, 953–968.
�����������������������M. H. Costa and M. C. A. Senna, Department of Agricultural and
Environmental Engineering, Federal University of Vicosa (UFV), Av. P. H.Rolfs, s/n, CEP 36570-000, Vicosa, MG, Brazil. ([email protected])Y. E. Shimabukuro, Department of Remote Sensing, National Institute for
Space Research (INPE), Av. dos Astronautas, 1758, CEP 12227-010, SaoJose dos Campos, SP, Brazil.
Figure 11. Sensitivity of FAPAR to LAI and leavesorientation (c = �1, 1 and 0 indicate upright, horizontal,and random leaves, respectively).
G01008 SENNA ET AL.: AMAZON TROPICAL FOREST FAPAR
8 of 8
G01008