
microRNAs exhibit high frequency genomic alterations in human cancer
Upload
independentCategory
view
0download
0
�������� ����� ��
Effective detection and quantification of dietetically absorbed plant microR-NAs in human plasma
Hongwei Liang, Suyang Zhang, Zheng Fu, Yanbo Wang, Nan Wang,Yanqing Liu, Chihao Zhao, Jinhui Wu, Yiqiao Hu, Junfeng Zhang, Xi Chen,Ke Zen, Chen-Yu Zhang
PII: S0955-2863(15)00016-9DOI: doi: 10.1016/j.jnutbio.2014.12.002Reference: JNB 7294
To appear in: The Journal of Nutritional Biochemistry
Received date: 10 June 2014Revised date: 23 November 2014Accepted date: 2 December 2014
Please cite this article as: Liang Hongwei, Zhang Suyang, Fu Zheng, Wang Yanbo,Wang Nan, Liu Yanqing, Zhao Chihao, Wu Jinhui, Hu Yiqiao, Zhang Junfeng, Chen Xi,Zen Ke, Zhang Chen-Yu, Effective detection and quantification of dietetically absorbedplant microRNAs in human plasma, The Journal of Nutritional Biochemistry (2015), doi:10.1016/j.jnutbio.2014.12.002
This is a PDF file of an unedited manuscript that has been accepted for publication.As a service to our customers we are providing this early version of the manuscript.The manuscript will undergo copyediting, typesetting, and review of the resulting proofbefore it is published in its final form. Please note that during the production processerrors may be discovered which could affect the content, and all legal disclaimers thatapply to the journal pertain.

ACC
EPTE
D M
ANU
SCR
IPT
ACCEPTED MANUSCRIPT
1
Effective detection and quantification of dietetically absorbed plant microRNAs in human plasma
Hongwei Liang*, Suyang Zhang
*, Zheng Fu
*, Yanbo Wang, Nan Wang, Yanqing Liu, Chihao Zhao, Jinhui Wu,
Yiqiao Hu, Junfeng Zhang, Xi Chen†, Ke Zen
†, Chen-Yu Zhang
†,
Jiangsu Engineering Research Center for microRNA Biology and Biotechnology, State Key Laboratory of
Pharmaceutical Biotechnology, School of Life Sciences, Nanjing University, 22 Hankou Road, Nanjing,
Jiangsu 210093, China;
Running title: Detection of absorbed plant microRNAs in human plasma
Key words: extracellular microRNA; exogenous microRNA; plasma; watermelon juice; standard operation
procedure
*These authors contributed equally to this work.
†Correspondence: [email protected] (C. Zhang), [email protected] (K. Zen) and/or [email protected] (X.
Chen)

ACC
EPTE
D M
ANU
SCR
IPT
ACCEPTED MANUSCRIPT
2
Abstract
The detection of exogenous plant microRNAs in human/animal plasma/sera lies at the foundation of exploring
their cross-kingdom regulatory functions. It is necessary to establish a standard operation procedure (SOP) to
promote study in this nascent field. In this study, 18 plant miRNAs were assessed in watermelon juice and
mixed fruits by quantitative RT-PCR (qRT-PCR). CT values, no-template controls and standard curves for each
miRNA were used to evaluate the specificity and sensitivity of qRT-PCR and to obtain concentrations. Sixteen
miRNAs were selected and measured in human plasma from volunteers after drinking juice. The CT values of
6 plant miRNAs in human plasma fell outside the linear ranges of their standard curves. The remaining 10
miRNAs were present at high basal levels, and 6 of them showed a dynamic physiological pattern in plasma
(absorption rates of 0.04% to 1.31%). Northern blotting was used to confirm the qRT-PCR results. Critical
issues such as RNA extraction and internal controls were also addressed.

ACC
EPTE
D M
ANU
SCR
IPT
ACCEPTED MANUSCRIPT
3
Introduction
Recent studies by our group and others have shown that microRNAs (miRNAs), a class of 19–24
nucleotide-long non-coding RNAs acting as post-transcriptional regulators of gene expression in eukaryotes
[1-3], can circulate in the bloodstream and other bodily fluids in a stable, cell-free form [4-7]. Importantly,
because extracellular miRNAs are aberrantly expressed in plasma, serum and other bodily fluids during the
pathogenesis of many diseases, they may serve as promising noninvasive biomarkers to assess the
pathological status of the body [4-7]. Further analysis suggested that these miRNAs exist in extracellular
environment in a form that is enclosed in small membranous vesicles (e.g., exosomes, shedding vesicles and
microvesicles) [8-12] or packaged with RNA-binding proteins (e.g., Argonaute 2)[13, 14] or high-density
lipoproteins [15]. According to current knowledge, extracellular miRNAs may be actively secreted by donor
cells via membranous vesicles [8-12] or just merely by-products of cell death and released passively into the
outer space after the cell membranes lose integrity [13]. Although these exciting discoveries open up the new
research field of extracellular miRNAs, the measurement of extracellular miRNAs in circulation with
adequate sensitivity and precision comes with various challenges. 1) Because serum, plasma and other
cell-free samples contain low amounts of extracellular miRNAs, an amplification step is required for most
currently available quantification methods, such as the quantitative RT-PCR (qRT-PCR). Small variations in
sample processing and enzymatic efficiency can result in large quantification errors. 2) Standard methods for
cellular or tissue RNA extraction are inappropriate for extracellular RNA research. Because variations in RNA
extraction can introduce potential bias, the development of a standard method for RNA extraction is critical
for evaluating extracellular miRNAs. 3) To date, the systematic selection and validation of suitable internal
controls for the quantification of extracellular miRNAs remains rather empirical, and no commonly accepted
internal controls are yet available. These factors make it difficult to accurately detect the level of extracellular
miRNAs in circulation.
In the process of obtaining a genome-wide expression profile of extracellular miRNAs in human serum using
Solexa sequencing, we found not only endogenous human miRNAs but also a considerable quantity of plant
miRNAs. This discovery led to our further identification of the cross-kingdom regulation of plant MIR168a on
the expression of mouse liver low-density lipoprotein receptor adapter protein 1 (LDLRAP1) [16]. The

ACC
EPTE
D M
ANU
SCR
IPT
ACCEPTED MANUSCRIPT
4
presence of exogenous plant miRNAs and their kinetics in human and animal plasma/serum have been
rigorously studied by various investigators ever since this discovery. Although some follow-up studies have
detected plant miRNAs in human plasma [17], others have obtained contradictory results [18-20]. For
example, Witwer et al. selectively measured MIR160, MIR156, MIR166, MIR167, MIR168 and MIR172 in
the plasma of pigtailed macaques that received a plant miRNA-enriched substance by qRT-PCR and did not
observe any consistent and specific amplification of plant miRNAs [18]. Snow et al. tested three miRNAs,
MIR156a, MIR159a and MIR169a, and did not detect them in the plasma of healthy subjects after the intake
of miRNA-containing fruits [19]. These inconsistencies are likely derived from the common technical issues
in the extracellular miRNA research field, including the low concentration of miRNAs, the lack of a standard
method for RNA extraction and the lack of proper internal controls. There are some additional factors,
particularly the selection of plant miRNAs, that need to be considered in detecting exogenous plant miRNAs
in human and animal plasma/serum. According to our model, plant miRNAs in food were absorbed by mouse
epithelial cells in the gastrointestinal (GI) tract, re-packaged into MVs and released into circulation [16]. Our
previous results showed that among the several thousands of plant miRNAs detected in plants, only
approximately one dozen plant miRNAs were readily detected in human or animal plasma [16], suggesting
that the intake of plant miRNAs through the GI tract is likely selective. It cannot be assumed that a miRNA
enriched in plants will be present at a high level in plasma; therefore, randomly detecting plant miRNAs with
high abundance in humans or animals can easily fail. Furthermore, due to the nature of miRNAs, non-specific
signals can be high for certain miRNAs. Therefore, no-template controls must be assayed to reduce the
non-specificity of qRT-PCR.
In this study, we strove to solve the controversial issues of detecting human and animal uptake of plant
miRNAs from the diet. To establish a standard operation procedure (SOP) for measuring plant miRNAs in
humans and animals, we systematically measured the kinetics of fruit-derived plant miRNAs in the peripheral
blood of healthy volunteers after they drank watermelon juice or ate fruits. We also compared the methods
used by our group and other groups in assaying plant miRNAs in mammals and addressed additional technical
problems that may have previously caused inconsistent results in measuring exogenous plant miRNAs.
ACC
EPTE
D M
ANU
SCR
IPT
ACCEPTED MANUSCRIPT
5
Results
Detection of plant miRNAs in watermelon juice and mixed fruits by a qRT-PCR assay
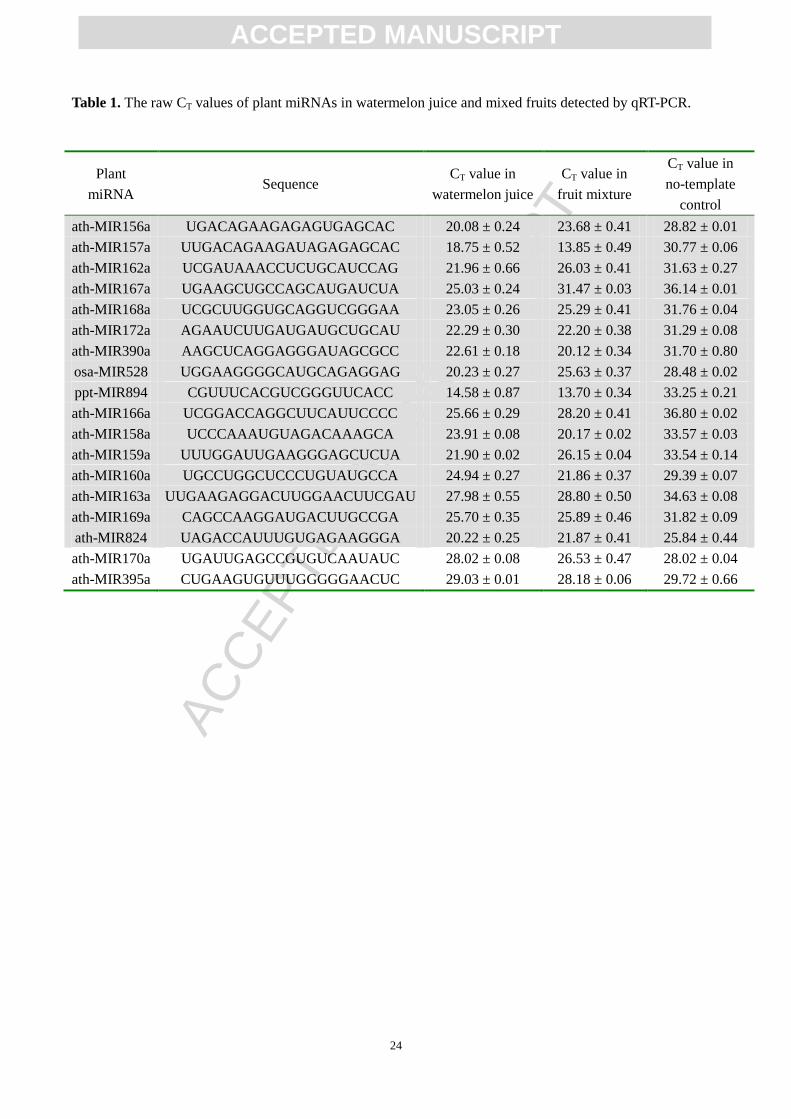
Twelve mL volumes of watermelon juice were used for RNA extraction, and 18 plant miRNAs (MIR156a,
MIR157a, MIR158a, MIR159a, MIR160a, MIR162a, MIR163a, MIR166a, MIR167a, MIR168a, MIR169a,
MIR170a, MIR172a, MIR390a, MIR395a, MIR528, MIR824 and MIR894) were assessed by a TaqMan
probe-based qRT-PCR assay. To determine the specificity of each primer set, no-template controls for each
miRNA were assessed simultaneously. All miRNAs except MIR170a and MIR395a were consistently and
efficiently amplified. The CT values of these miRNAs ranged from 14.58 to 27.98, while the CT values of the
respective no-template controls ranged from 25.84 to 36.80. The △CT values ranged from -4.45 to -12.02
(Table 1). The CT values of MIR170a and MIR395a could not be distinguished from the CT values of the
corresponding no-template controls (Table 1), suggesting that these miRNAs cannot be detected by the
qRT-PCR assay. The levels of these 18 plant miRNAs in mixed fruits were also measured, and the data
showed that all the miRNAs except MIR170a and MIR395a were detected (Table 1). Based on this analysis,
we selected the remaining 16 plant miRNAs as candidates and quantified their levels in human plasma after
the volunteers drank watermelon juice.
To obtain the concentrations of the 16 plant miRNAs in watermelon juice and mixed fruits, each synthetic
single-stranded miRNA was serially diluted and assessed using the qRT-PCR assay to generate a standard
curve. Each miRNA had a Pearson correlation coefficient (R) > 0.99 (Supplementary Figure 1). The
no-template controls amplified at a much higher cycle range than the miRNAs. For each miRNA, the linear
range of the CT value (e.g., 7.00 to 28.02 for MIR156a) and the dynamic quantification range of the
expression level (e.g., 0.01 amol to 100 fmol for MIR156a) are listed in Table 2. The concentrations of the
plant miRNAs in watermelon juice and mixed fruits were calculated based on reference to the standard curve
(Table 2). Both watermelon juice and mixed fruits carried some plant miRNAs. While MIR156a, MIR162a,
MIR167a, MIR528, MIR166a and MIR159a were more enriched in watermelon juice, the mixed fruits
contained relatively higher levels of MIR157a, MIR168a, MIR172a, MIR390a, MIR894, MIR158a, MIR160a,
MIR163a, MIR169a and MIR824.

ACC
EPTE
D M
ANU
SCR
IPT
ACCEPTED MANUSCRIPT
6
Detection of plant miRNAs in plasma after the oral administration of watermelon juice
Watermelon juice was orally administered to nine healthy volunteers following overnight fasting. Blood was
drawn at 0, 0.5, 1, 3, 6 and 9 h after drinking. One hundred microliters of plasma was used for RNA extraction
and qRT-PCR analysis. In total, 10 plant miRNAs (MIR156a, MIR157a, MIR162a, MIR167a, MIR168a,
MIR172a, MIR390a, MIR528, MIR894 and MIR166a) were consistently and specifically amplified.
Supplementary Figure 2 shows the individual CT-vs.-time curves for these 10 miRNAs. The CT values of
MIR156a, MIR157a, MIR162a, MIR168a, MIR172a, MIR390a, MIR528 and MIR894 were generally within
the linear range at all time points. The CT values of MIR167a were outside the linear range at the 0 h time
point but entered the linear range after administration. The CT values of MIR166a were in the linear range but
showed no changes during the experimental period. The CT values of the remaining 6 miRNAs (MIR158a,
MIR159a, MIR160a, MIR163a, MIR169a and MIR824) were outside the linear range (Supplementary Figure
3). As negative controls, the CT values of MIR170a and MIR395a were also outside the linear range
(Supplementary Figure 3).
The concentrations of the 10 detectable plant miRNAs in the plasma were calculated by referring to the
standard curves. MIR528 showed the highest basal level in plasma (8289.02 fM) and reached its peak
(16141.78 fM) three hours after juice administration (Figure 1A). MIR156a, MIR162a, MIR168a, MIR172a
and MIR390a had basal concentrations of 317.10, 33.45, 28.49, 82.24 and 10.38 fM, respectively, and peaked
at 1 or 3 h after juice administration at 933.12, 118.57, 56.62, 162.32 and 18.41 fM, respectively (Figures 1A
and 1B). The MIR166a level did not change after drinking (Figure 1B). Unexpectedly, the levels of MIR157a
and MIR894 increased consistently in the plasma after drinking the juice, and their concentrations changed
from 33.64 and 576.37 fM, respectively, at the basal level to 115.88 and 1753.44 fM, respectively, at the end
point (Figures 1A and 1B). Notably, the basal level of MIR167a in human plasma was negligible but
significantly increased after drinking, reaching 797.47 fM at the end point (Figure 1C). The basal level, peak
concentration and fold change of each plant miRNA after juice administration are listed in Table 3. Six plant
miRNAs (MIR156a, MIR162a, MIR168a, MIR172a, MIR390a and MIR528) showed typical kinetic
absorption curves and they were used to calculate the total amount of plant miRNA absorbed by the body.

ACC
EPTE
D M
ANU
SCR
IPT
ACCEPTED MANUSCRIPT
7
Based on our calculations of the concentrations of plant miRNAs in watermelon juice and the areas under the
plasma concentration-vs.-time curves (AUCs) of the plant miRNAs, we determined the total uptake amount,
total absorption amount and absorption rate of each plant miRNA. The absorption rates ranged from 0.04% to
1.31% (Table 3).
As controls, the levels of four endogenous miRNAs (miR-16, miR-21, miR-25 and miR-92a) were examined
during this process. The endogenous miRNAs did not change consistently in the volunteers’ plasma after the
administration of watermelon juice (Figure 1D and Supplementary Figure 3). This quantification also revealed
that some plant miRNAs are present in the plasma in a similar concentration range to endogenous miRNAs
(e.g., MIR894 vs. miR-16, MIR156a vs. miR-92a and MIR172a vs. miR-25). In agreement with our previous
study showing that the plant miRNAs detected in circulation are mainly encapsulated in microvesicles (MVs),
MIR156a, MIR162a and MIR168a were primarily detected in the MV fraction of human plasma and were
present in nearly negligible amounts in the MV-free fraction (Supplementary Figure 4). The endogenous
miRNAs (miR-16, miR-21 and miR-223) were detected in both the MV and the MV-free fractions of human
plasma (Supplementary Figure 4).
Validation of plant miRNAs in watermelon juice or plasma by northern blotting
Northern blotting was used to confirm the qRT-PCR results. In this assay, digoxigenin (DIG)-labeled
oligonucleotide probes containing locked nucleic acids (LNA) allow the sensitive and highly specific
detection of mature miRNAs [21]. First, synthetic single-stranded miRNAs (MIR156a, MIR162a and
MIR168a) were serially diluted and assessed using northern blotting. The results showed that plant miRNA
could not be detected at levels less than 100 amol (Supplementary Figure 5). Then five plant miRNAs
(MIR156a, MIR162a, MIR168a, MIR157a and MIR166a) in watermelon juice were assessed. Figure 2A
shows that plant miRNAs were readily detected in as little as 100 μL of watermelon juice. Furthermore, the
five plant miRNAs and an endogenous miRNA (miR-16) in the plasma were assessed. Figure 2B shows that
plant miRNAs were readily detected in 4 mL of human plasma and that the levels of MIR156a, MIR162a and
MIR168a increased after consumption, reached their peak levels and then dropped; MIR157a consistently
increased in the plasma after juice administration; MIR166a was present in human plasma at a low level

ACC
EPTE
D M
ANU
SCR
IPT
ACCEPTED MANUSCRIPT
8
(approximately 10 fM × 4 mL = 40 amol) and therefore undetectable by northern blotting; and, as a control,
miR-16 remained unchanged over time.
Detection of plant miRNAs in the plasma after eating mixed fruits
The kinetics of the plasma levels of plant miRNAs after the healthy volunteers ate mixed fruits was measured.
The experimental procedure was the same as the administration of watermelon. Supplementary Figure 6
shows the concentration-vs.-time curves for plant miRNAs in the plasma after the administration of mixed
fruits. As shown, the kinetics of the plant miRNAs after fruit administration appeared similar to the kinetics
after juice administration. The levels of MIR156a, MIR157a, MIR162a, MIR172a, MIR390a and MIR168a in
the plasma increased dramatically following fruit administration.
Analyses of RNA extraction methods, absolute plasma miRNA concentrations and internal controls
The recovery rate of RNA after extraction by phenol/chloroform-based (phenol/chloroform and Trizol LS) or
column-based (MirVana) methods was assessed by qRT-PCR analysis with a readout of CT values and
reproducibility. Samples extracted by the phenol/chloroform method showed the lowest CT values, and
samples extracted by the MirVana method showed the highest CT values (Figures 3A-3C and Supplementary
Figure 7). When comparing the reproducibility based on the standard error of the mean (SEM) of CT values,
the best method was the phenol/chloroform method, and the worst was the MirVana method (Figures 3A-3C).
When RNA was extracted using the phenol/chloroform and Trizol LS methods, alterations in the plant
miRNAs in the plasma were detected regardless of whether they were present in the plasma at high or low
levels (Figures 3A-3C and Supplementary Figure 7). In contrast, alterations in plant miRNAs were detected
for abundant miRNAs (e.g., MIR528) but not for miRNAs present at relatively low levels (e.g., MIR156a and
MIR168a) in RNA extracted using the MirVana method (Figures 3A-3C and Supplementary Figure 7).
However, even the most effective RNA isolation protocols cannot retain the entire small RNA fraction, and
therefore, the calculated plant miRNA concentration in the plasma may be underestimated. To estimate the
absolute levels of plant miRNAs in watermelon juice and plasma, synthetic MIR156a at a known
concentration was added to watermelon juice or plasma, and the RNA was then extracted and measured by a

ACC
EPTE
D M
ANU
SCR
IPT
ACCEPTED MANUSCRIPT
9
qRT-PCR assay. Figure 3D shows the new standard curve generated using extracted watermelon juice RNA at
a concentration range of five orders of magnitude. The linear range of the CT values shifted from 9.01–28.22
to 12.97–20.17 (Figure 3D). Based on the new standard curve, the absolute concentration of MIR156a in the
watermelon juice was approximately six times the previously calculated concentration. Figure 3E shows the
new standard curve generated using extracted plasma RNA at a concentration range of five orders of
magnitude. The linear range of the CT values shifted from 8.82–28.02 to 12.27–25.44 (Figure 3E), and the
absolute concentration of MIR156a in the plasma after juice administration was approximately four times the
previously calculated concentration (Figure 3F).
Using a correct control is critical for assessing alterations in extracellular RNA in circulation. Previous studies
have suggested that endogenous miR-16 and let-7d/g/i were suitable internal controls to correct for variations
in RNA recovery and amplification efficiency [22-24], and that the Caenorhabditis elegans miRNA
cel-miR-39 was ideal spike-in control [25, 26]. Thus, we selected miR-16 and let-7d/g/i as internal control and
cel-miR-39 as spike-in control. Figure 3G showed that the CT values of miR-16, let-7d/g/i and cel-miR-39 did
not change after juice administration. When assessing the levels of MIR156a and MIR168a in human plasma
after juice administration, there were no differences between the groups with and without normalization by
miR-16, let-7d/g/i or cel-miR-39 (Figure 3H). After normalization with miR-16 or let-7d/g/i, significant
inductions of MIR156a and MIR168a were observed in the plasma of mice after feeding with fresh rice
compared with feeding a chow diet; however, no difference was observed when the mouse plasma levels of
MIR156a and MIR168a were not normalized (Figure 3I).
Discussion
Accumulating evidence has demonstrated that miRNAs, once thought to be unstable molecules, are stable and
can be horizontally transferred across species and kingdoms 13,[27]
. However, to accurately detect the plasma or
serum levels of extracellular miRNAs, particularly exogenous plant miRNAs, various technical issues must
still be addressed. In this study, employing both qRT-PCR and northern blotting assays, we systematically
characterized the kinetics of plant miRNAs in human plasma after healthy volunteers drank watermelon juice.
To develop a SOP for assessing the level of dietetically absorbed plant miRNAs in human or animal plasma,

ACC
EPTE
D M
ANU
SCR
IPT
ACCEPTED MANUSCRIPT
10
we systematically analyzed the factors, such as the selection of plant miRNAs, the RNA extraction method
and the proper internal controls, that interfere with miRNA detection results.
The choice of plant miRNAs to be detected by qRT-PCR in human and animal plasma/serum can affect the
outcome. The selection of plant miRNAs involves at least two main factors: a) the concentration of the
miRNA in plants and the potential selective intake of the plant miRNA by human and animal GI tracts. To
obtain the concentration of a plant miRNA, a specific standard curve and a no-template control are both
required. Due to the limitation of TaqMan probe-based qRT-PCR, non-specific signals (e.g., CT value of
no-template control) are often obtained. For example, we found that among the 18 plant miRNAs tested,
MIR170a and MIR395a generated CT values that could not be distinguished from the values of the
corresponding no-template controls, indicating that these two miRNAs have high background noise and
cannot be correctly measured by qRT-PCR analysis. A specific standard curve for individual plant miRNAs in
plasma is key not only for calculating the concentration of plant miRNAs but also for showing the effective
quantification range. If the level of a miRNA is outside the linear working range of its standard curve, that
miRNA is not suitable for detection by a qRT-PCR assay. In this study, the CT values of 6 plant miRNAs
(MIR158a, MIR159a, MIR160a, MIR163a, MIR169a and MIR824) in plasma were outside the dynamic
quantification range, indicating that they had undetectable or unreliable levels in plasma and could not be
accurately assessed. This result agrees with the previous studies in which the authors reported negative results
in detecting MIR160a, MIR159a and MIR169a in human and animal plasma by qRT-PCR after the
administration of a plant-based food [18, 19].
Another factor that may affect the selection of plant miRNAs is the potential selective intake of the miRNA by
humans and animals. Our previous study suggested that food-derived plant miRNAs are probably absorbed by
the epithelial cells of the GI tract and then re-packaged into MVs and released into the circulation [16]. The
genome-wide plant miRNA expression profile detected by Solexa sequencing identified more than 1000
miRNAs in rice; however, fewer than 20 plant miRNAs were readily detected in animal plasma [16]. This
result suggests that food-derived miRNAs are selectively taken up by the animal GI tract. Therefore, miRNAs
with high concentrations in plants do not necessarily result in high levels in human or animal plasma. Along

ACC
EPTE
D M
ANU
SCR
IPT
ACCEPTED MANUSCRIPT
11
this line, the failure to detect 6 plant miRNAs (MIR158a, MIR159a, MIR160a, MIR163a, MIR169a and
MIR824) in human plasma, although they are all highly abundant in watermelon juice, may be due to their
poor absorption by the human GI tract. To find the “right” plant miRNAs in plasma to be detected by
qRT-PCR, a screening process by Solexa sequencing or a miRNA microarray may be required.
MVs are small vesicles that are shed from donor cells to mediate intercellular communication by transporting
bioactive molecules, including miRNAs, between cells. Unlike circulating endogenous miRNAs, which were
present both in MVs and the MV-free fractions [14], plant miRNAs were found to be largely encapsulated in
MVs and nearly undetectable in the MV-free fraction of human plasma. Furthermore, we showed that some
plant miRNAs are present in the plasma in a similar concentration range to endogenous miRNAs. Thus, like
endogenous miRNAs, plant miRNAs are present in human plasma in a form that can be easily delivered to
other cells and at a concentration that is biologically relevant. Therefore, plant miRNAs in circulation fulfill
the requirements for a miRNA to exert a physiological function and may be as important as endogenous
miRNAs.
The process of extraction of RNA from the plasma or serum greatly affects the outcome of the quantitative
detection of plant miRNAs. We found that column-based RNA extraction, a highly sensitive method recently
used by many investigators in RNA extraction from plasma samples, cannot thoroughly break MVs and
separate binding proteins from miRNAs. This technique would result in substantial losses of small RNAs.
Instead, our results showed that the phenol/chloroform extraction method had the best RNA recovery rate and
reproducibility for the quantitative detection of plant miRNAs in human plasma. Therefore, a suitable RNA
isolation method must be selected to accurately detect plant miRNAs in human and animal plasma.
The accurate normalization of the detected RNA levels is another critical issue in accurately measuring
extracellular miRNAs. Due to the high sensitivity of qRT-PCR, any small variations in the experimental
process can be amplified and contribute to quantification errors. The development of an internal control is
indispensable for evaluating extracellular miRNAs. The miRNAs in tissues and cells are normalized by U6
[28-30]; however, this small RNA is degraded in the circulatory system [28-30]. Recently, it has been reported

ACC
EPTE
D M
ANU
SCR
IPT
ACCEPTED MANUSCRIPT
12
that miR-16 and let-7d/g/i can serve as internal controls for the detection of circulating miRNAs [22-24]. Here,
we found that miR-16, let-7d/g/i and other endogenous miRNAs (miR-21, miR-25 and miR-92a) all
maintained constant levels during the experimental period. We therefore used miR-16 and let-7d/g/i as internal
controls, and our results suggested that a suitable internal control should be considered when plant miRNAs
are detected in plasma. As shown in the mouse experiments, given the low volume of plasma obtained from a
mouse and the relatively low levels of MIR156a and MIR168a in the plasma, normalization by miR-16 and
let-7d/g/i is necessary. Indeed, after normalization, a significant induction of MIR156a and MIR168a was
observed in the plasma of mice after feeding with fresh rice compared with feeding a chow diet, whereas there
was no difference without normalization. Therefore, the internal control is an essential factor and should be
carefully considered when a low concentration of plant miRNAs is detected in a small volume of plasma.
In this study, after addressing various factors that may interfere with the outcome of the quantitative detection
of plant miRNAs in human plasma, we effectively and quantitatively measured the kinetics of plant miRNAs
in plasma after healthy volunteers drank watermelon juice. The qRT-PCR results were further validated by a
northern blot analysis using LNA-modified oligonucleotide probes. This study clearly demonstrates that plant
miRNAs in human plasma can be efficiently detected and reliably compared by qRT-PCR and also provides a
SOP for measuring plant miRNAs in human and animal plasma. By serving as a guideline, this SOP may
clarify the controversial issues in the quantification of exogenous plant miRNAs in plasma, serum and other
bodily fluids of humans and animals.
Materials & Methods
Subjects
Nine male volunteers were recruited into this study. All the subjects were healthy and had no history of
disease. The subject characteristics (means ± SD) included weight of 60 ± 12 kg and age of 22 ± 5 years. The
study protocol was approved by the ethics committee of Nanjing University. Written informed consent was
obtained from all participants prior to the study.
Fruits and juice

ACC
EPTE
D M
ANU
SCR
IPT
ACCEPTED MANUSCRIPT
13
The fruits used in this study were purchased from local supermarkets. Watermelon juice was prepared fresh
from watermelon pulp (seeds removed) using an electric juice extractor without any addition of water.
Because the expression levels of plant miRNAs are significantly different in different types of fruits and
because some plant miRNAs may be especially abundant in a specific fruit, the fruits (watermelon, apple,
banana, orange, grape, mango and cantaloupe) were also assembled into a fruit mixture to balance the levels
of plant miRNAs.
Reagents
The MirVana RNA isolation kits were purchased from Life Technologies. Synthetic miRNA standards were
obtained from Invitrogen. The Total Exosome Isolation (from plasma) kits were purchased from Invitrogen
(Catalog Number: 4484450). The miRCURY LNA miRNA detection probes were obtained from Exiqon. The
DIG luminescent detection kit was purchased from Roche Applied Science (Indianapolis, IN, USA).
Study design
The juice-drinking study and the fruit-eating study were performed on separate days. In the juice-drinking
study, juice was extracted from watermelon pulp 1 h before ingestion, and each subject drank 2.5 L of juice. In
the fruit eating study, each subject ate an equal portion of watermelon, apple, banana, orange, grape, mango
and cantaloupe (2.5 kg in total). The subjects ingested the juice or fruit within 1 h at the study site the morning
after an overnight fast. The subjects were not allowed to eat or drink again until the end point. The baseline
blood samples were obtained 10 min before the administration of juice or fruit. The blood samples were
collected into vacuum tubes containing EDTA at 0.5, 1, 3, 6 and 9 h after the juice and fruit were consumed.
RNA isolation
Venous blood samples (approximately 5 mL) were collected from each donor and placed in plasma separator
tubes. The plasma was separated by centrifugation at 800 ×g for 10 min at room temperature, followed by a 15
min high-speed centrifugation at 10,000 ×g at room temperature to completely remove the cell debris. The
supernatant plasma was recovered, and the RNA was isolated simultaneously to avoid the introduction of bias.

ACC
EPTE
D M
ANU
SCR
IPT
ACCEPTED MANUSCRIPT
14
The total RNA was extracted from 100 μL of plasma using a phenol/chloroform purification protocol. Briefly,
100 μL of plasma was mixed with 300 μL of RNase-free water, then with 200 μL of acid phenol. The mixture
was vortexed vigorously and incubated at room temperature for 5 min. The mixture was then mixed with 200
μL of chloroform and vortexed vigorously and incubated at room temperature for 10 min. After phase
separation, the aqueous layer was mixed with 1.5 volumes of isopropyl alcohol and 0.1 volumes of 3 M
sodium acetate (pH 5.3). This solution was stored at -20°C for 1 h. The RNA pellet was collected by
centrifugation at 16,000 ×g for 20 min at 4°C. The resulting RNA pellet was washed once with 75% ethanol
and dried for 10 min at room temperature. Finally, the pellet was dissolved in 20 μL of RNase-free water and
stored at -80°C until further analysis. The RNA concentration and quality (OD260/OD280 ratio) were
measured using a Qubit fluorometer (Invitrogen) and a Quant-iT RNA Assay Kit (Invitrogen) according to the
manufacturer’s instructions. For comparison, the total RNA was also extracted from 100 μL of plasma with
Trizol LS and a MirVana RNA isolation kit according to the manufacturer’s instructions.
qRT-PCR assay
The qRT-PCR procedure was carried out using TaqMan® MicroRNA Assays (Applied Biosystems, Foster
City, CA, USA) according to the manufacturer’s instructions. Briefly, 5 μL of total RNA was
reverse-transcribed to cDNA using AMV reverse transcriptase (TaKaRa, Dalian, China) and stem-loop RT
primers (Applied Biosystems). The reaction conditions were as follows: 16°C for 30 min, 42°C for 30 min and
85°C for 5 min. Real-time PCR was performed using TaqMan miRNA probes (Applied Biosystems) on the
Applied Biosystems 7300 Sequence Detection System (Applied Biosystems). The reactions were incubated in
a 96-well optical plate at 95°C for 10 min, followed by 40 cycles of 95°C for 15 s and 60°C for 1 min. All
reactions, including the no-template controls, were run in triplicate. After the reaction, the cycle threshold (CT)
values were determined using the fixed threshold settings, and the mean CT values were determined from the
triplicate PCR reactions. To calculate the expression levels of the target miRNAs, a series of synthetic miRNA
oligonucleotides at known concentrations in water were also reverse-transcribed and amplified. The quantity
of each miRNA was then calculated by referring to the standard curve. Based on the calculations of the
concentrations of plant miRNAs in watermelon juice, the total uptake amount of each plant miRNA was
determined. Based on the calculation of the area under the plasma concentration-time curve (AUC) of each

ACC
EPTE
D M
ANU
SCR
IPT
ACCEPTED MANUSCRIPT
15
plant miRNA, the total absorption amount was determined. The AUC was calculated using the trapezoid
method. The absorption rate is the ratio of the total absorption amount to the total uptake amount.
Northern blot analysis
A sensitive non-radioactive northern blot method to detect miRNAs was performed [21]. The total RNA
(including miRNAs) was collected from 100 μL of watermelon juice or 4 mL of plasma using the
phenol/chloroform purification protocol. The northern blot analysis was carried out using miRCURY LNA™
microRNA Detection Probes with DIG-labeling (Exiqon) and a DIG luminescent detection kit (Roche)
according to the manufacturer’s instructions. Briefly, the total RNA isolated from 100 μL of watermelon juice
or 4 mL of plasma was dissolved in Gel Loading Buffer II (Ambion), heated at 95°C for 5 min, loaded onto a
15% TBE-Urea denaturing gel and transferred to a Zeta Probe plus membrane (Bio-Rad, Hercules, CA). After
UV-crosslinking at an energy of 1200 mJ, the membranes were equilibrated with 2 × SSC and prehybridized
at 42°C for 1 h in ULTRAhyb-Oligo buffer (Ambion). Prior to hybridization, miRCURY™ LNA detection
probes were labeled using a DIG Oligonucleotide Tailing Kit 2nd Generation (Roche Applied Science,
Indianapolis, IN). DIG-labeled LNA probes were hybridized to the membranes overnight at 37°C in
ULTRAhyb-Oligo buffer (Ambion). Following hybridization, the membranes were washed twice for 30 min
in NorthernMax Low Stringency wash solution no. 1 (Ambion) at 42°C, rinsed for 5 min in the 1 × Wash
Buffer from the DIG wash and Block Buffer Set (Roche), blocked for 1 h in 1 × Blocking Solution (Roche),
incubated for 1 h in antibody solution (Anti-DIG-AP 1: 10,000 in 1 × Blocking solution, Roche), washed
twice for 15 min in 1 × Wash Buffer and equilibrated by rinsing twice for 5 min each with 1 × Detection
Buffer (Roche). Then, following the instructions from the DIG Luminescent Detection Kit (Roche), the blots
were incubated with the chemiluminescent substrate for alkaline phosphatase CSPD (Roche) and exposed to
Amersham Hyperfilm ECL (GE Healthcare Life Sciences, Piscataway, NJ).
MV isolation
Venous blood samples (approximately 5 mL) were collected from each donor and placed in plasma separator
tubes. The plasma was separated by centrifugation at 800 ×g for 10 min at room temperature, followed by a 15
min centrifugation at 10,000 ×g at room temperature to completely remove the cell debris. The supernatant

ACC
EPTE
D M
ANU
SCR
IPT
ACCEPTED MANUSCRIPT
16
plasma was recovered, and the MV isolation was performed using the Total Exosome Isolation (from plasma)
kit according to the manufacturer’s instructions.
Data analysis
The data shown are presented as the mean ± SEM of at least three independent experiments. The statistical
analyses were performed with SPSS 15.0 statistical software, and a p-value < 0.05 using a t-test was
considered significant.

ACC
EPTE
D M
ANU
SCR
IPT
ACCEPTED MANUSCRIPT
17
Acknowledgment
This work was supported by grants from the National Basic Research Program of China (973 Program) (no.
2014CB542300), the National Natural Science Foundation of China (Nos. 81101330, 31271378 and
81250044), the Natural Science Foundation of Jiangsu Province (No. BK2012014) and the Research Special
Fund for Public Welfare Industry of Health (No. 201302018).
Conflict of Interest Statement
None declared.

ACC
EPTE
D M
ANU
SCR
IPT
ACCEPTED MANUSCRIPT
18
References
[1] Bartel DP. MicroRNAs: genomics, biogenesis, mechanism, and function. Cell. 2004;116:281-97.
[2] Ambros V. The functions of animal microRNAs. Nature. 2004;431:350-5.
[3] He L, Hannon GJ. MicroRNAs: small RNAs with a big role in gene regulation. Nat Rev Genet.
2004;5:522-31.
[4] Chen X, Ba Y, Ma L, Cai X, Yin Y, Wang K, et al. Characterization of microRNAs in serum: a novel class
of biomarkers for diagnosis of cancer and other diseases. Cell Res. 2008;18:997-1006.
[5] Mitchell PS, Parkin RK, Kroh EM, Fritz BR, Wyman SK, Pogosova-Agadjanyan EL, et al. Circulating
microRNAs as stable blood-based markers for cancer detection. P Natl Acad Sci USA. 2008;105:10513-8.
[6] Park NJ, Zhou H, Elashoff D, Henson BS, Kastratovic DA, Abemayor E, et al. Salivary microRNA:
discovery, characterization, and clinical utility for oral cancer detection. Clin Cancer Res. 2009;15:5473-7.
[7] Hanke M, Hoefig K, Merz H, Feller AC, Kausch I, Jocham D, et al. A robust methodology to study urine
microRNA as tumor marker: microRNA-126 and microRNA-182 are related to urinary bladder cancer. Urol
Oncol. 2010;28:655-61.
[8] Valadi H, Ekstrom K, Bossios A, Sjostrand M, Lee JJ, Lotvall JO. Exosome-mediated transfer of mRNAs
and microRNAs is a novel mechanism of genetic exchange between cells. Nat Cell Biol. 2007;9:654-U72.
[9] Zhang Y, Liu D, Chen X, Li J, Li L, Bian Z, et al. Secreted monocytic miR-150 enhances targeted
endothelial cell migration. Mol Cell. 2010;39:133-44.
[10] Skog J, Wurdinger T, van Rijn S, Meijer DH, Gainche L, Sena-Esteves M, et al. Glioblastoma
microvesicles transport RNA and proteins that promote tumour growth and provide diagnostic biomarkers.
Nat Cell Biol. 2008;10:1470-U209.
[11] Mittelbrunn M, Gutierrez-Vazquez C, Villarroya-Beltri C, Gonzalez S, Sanchez-Cabo F, Gonzalez MA, et

ACC
EPTE
D M
ANU
SCR
IPT
ACCEPTED MANUSCRIPT
19
al. Unidirectional transfer of microRNA-loaded exosomes from T cells to antigen-presenting cells. Nat
Commun. 2011;2.
[12] Kosaka N, Iguchi H, Yoshioka Y, Takeshita F, Matsuki Y, Ochiya T. Secretory Mechanisms and
Intercellular Transfer of MicroRNAs in Living Cells. J Biol Chem. 2010;285:17442-52.
[13] Turchinovich A, Weiz L, Langheinz A, Burwinkel B. Characterization of extracellular circulating
microRNA. Nucleic Acids Res. 2011;39:7223-33.
[14] Arroyo JD, Chevillet JR, Kroh EM, Ruf IK, Pritchard CC, Gibson DF, et al. Argonaute2 complexes carry
a population of circulating microRNAs independent of vesicles in human plasma. P Natl Acad Sci USA.
2011;108:5003-8.
[15] Vickers KC, Palmisano BT, Shoucri BM, Shamburek RD, Remaley AT. MicroRNAs are transported in
plasma and delivered to recipient cells by high-density lipoproteins. Nat Cell Biol. 2011;13:423-33.
[16] Zhang L, Hou DX, Chen X, Li DH, Zhu LY, Zhang YJ, et al. Exogenous plant MIR168a specifically
targets mammalian LDLRAP1: evidence of cross-kingdom regulation by microRNA. Cell Research.
2012;22:107-26.
[17] Wang K, Li H, Yuan Y, Etheridge A, Zhou Y, Huang D, et al. The Complex Exogenous RNA Spectra in
Human Plasma: An Interface with Human Gut Biota? Plos One. 2012;7.
[18] Witwer KW, McAlexander MA, Queen SE, Adams RJ. Real-time quantitative PCR and droplet digital
PCR for plant miRNAs in mammalian blood provide little evidence for general uptake of dietary miRNAs
Limited evidence for general uptake of dietary plant xenomiRs. Rna Biol. 2013;10:1080-6.
[19] Snow JW, Hale AE, Isaacs SK, Baggish AL, Chan SY. Ineffective delivery of diet-derived microRNAs to
recipient animal organisms. Rna Biol. 2013;10:1107-16.
[20] Dickinson B, Zhang YJ, Petrick JS, Heck G, Ivashuta S, Marshall WS. Lack of detectable oral

ACC
EPTE
D M
ANU
SCR
IPT
ACCEPTED MANUSCRIPT
20
bioavailability of plant microRNAs after feeding in mice. Nat Biotechnol. 2013;31:965-7.
[21] Kim SW, Li ZH, Moore PS, Monaghan AP, Chang Y, Nichols M, et al. A sensitive non-radioactive
northern blot method to detect small RNAs. Nucleic Acids Res. 2010;38.
[22] Huang ZH, Huang D, Ni SJA, Peng ZL, Sheng WQ, Du X. Plasma microRNAs are promising novel
biomarkers for early detection of colorectal cancer. Int J Cancer. 2010;127:118-26.
[23] Liu CJ, Kao SY, Tu HF, Tsai MM, Chang KW, Lin SC. Increase of microRNA miR-31 level in plasma
could be a potential marker of oral cancer. Oral Dis. 2010;16:360-4.
[24] Chen X, Liang HW, Guan DP, Wang C, Hu XY, Cui L, et al. A Combination of Let-7d, Let-7g and Let-7i
Serves as a Stable Reference for Normalization of Serum microRNAs. Plos One. 2013;8.
[25] Fichtlscherer S, De Rosa S, Fox H, Schwietz T, Fischer A, Liebetrau C, et al. Circulating microRNAs in
patients with coronary artery disease. Circ Res. 2010;107:677-84.
[26] Kroh EM, Parkin RK, Mitchell PS, Tewari M. Analysis of circulating microRNA biomarkers in plasma
and serum using quantitative reverse transcription-PCR (qRT-PCR). Methods. 2010;50:298-301.
[27] LaMonte G, Philip N, Reardon J, Lacsina JR, Majoros W, Chapman L, et al. Translocation of Sickle Cell
Erythrocyte MicroRNAs into Plasmodium falciparum Inhibits Parasite Translation and Contributes to Malaria
Resistance. Cell Host Microbe. 2012;12:187-99.
[28] Choong ML, Yang HH, McNiece I. MicroRNA expression profiling during human cord blood-derived
CD34 cell erythropoiesis. Exp Hematol. 2007;35:551-64.
[29] Corney DC, Flesken-Nikitin A, Godwin AK, Wang W, Nikitin AY. MicroRNA-34b and MicroRNA-34c
are targets of p53 and cooperate in control of cell proliferation and adhesion-independent growth. Cancer Res.
2007;67:8433-8.
[30] Wang XH, Tang S, Le SY, Lu R, Rader JS, Meyers C, et al. Aberrant Expression of Oncogenic and

ACC
EPTE
D M
ANU
SCR
IPT
ACCEPTED MANUSCRIPT
21
Tumor-Suppressive MicroRNAs in Cervical Cancer Is Required for Cancer Cell Growth. Plos One. 2008;3.

ACC
EPTE
D M
ANU
SCR
IPT
ACCEPTED MANUSCRIPT
22
Figure Legends
Figure 1. Kinetics of the appearance of plant miRNAs in the plasma after the administration of
watermelon juice. (A) Mean concentration-vs.-time curves for MIR156a, MIR528 and MIR894 in the plasma
of healthy subjects after a single administration of watermelon juice. (B) Mean concentration-vs.-time curves
for MIR157a, MIR162a, MIR166a, MIR168a, MIR172a and MIR390a in the plasma of healthy subjects after
a single administration of watermelon juice. (C) Mean concentration-vs.-time curves for MIR167a in the
plasma of healthy subjects after a single administration of watermelon juice. (D) Mean concentration-vs.-time
curves for miR-16, miR-21, miR-223 and let-7d/g/i in the plasma of healthy subjects after a single
administration of watermelon juice. The values are presented as the mean ± SE.
Figure 2. Northern blot analysis to detect the accumulation of plant miRNAs in watermelon juice and in
the plasma after the administration of watermelon juice.
Figure 3. Analyses of RNA extraction methods, absolute plasma miRNA concentrations and internal
controls. (A-C) Selection of a suitable method for plant miRNA extraction from plasma. Mean CT-vs.-time
curves for MIR156a, MIR168a and MIR528 in plasma samples extracted by different RNA extraction
methods. RNA in the plasma samples of healthy subjects after the administration of watermelon juice was
isolated by our optimized phenol/chloroform extraction method, the Trizol LS method and the MirVana
method, and the levels of MIR156a, MIR168a and MIR528 were quantified using a qRT-PCR assay. (D-F)
Evaluation of the absolute concentrations of plant miRNAs in watermelon juice and plasma. (D) Theoretical
and absolute standard curves of MIR156a were generated by adding synthetic MIR156a at a known
concentration to water or watermelon juice before RNA isolation and then quantifying using a qRT-PCR assay.
The resulting CT values were plotted against the input MIR156 amounts. (E) Theoretical and absolute standard
curves of MIR156a were generated by adding synthetic MIR156a at a known concentration to water or plasma
before RNA isolation and then quantifying using a qRT-PCR assay. The resulting CT values were plotted
against the input MIR156 amounts. (F) Absolute concentration of MIR156a in human plasma by referring to
the absolute standard curve. (G-I) Effect of normalization on the levels of plant miRNAs in plasma. (G) Mean
CT-vs.-time curves for miR-16, let-7d/g/i and cel-miR-39 in plasma of healthy subjects after a single

ACC
EPTE
D M
ANU
SCR
IPT
ACCEPTED MANUSCRIPT
23
administration of watermelon juice. The values are the means ± SE. (H) The levels of MIR156a in the plasma
of healthy subjects after a single administration of watermelon juice were measured by a qRT-PCR assay and
were directly calculated or normalized to miR-16, let-7d/g/i or cel-miR-39. The relative levels were calculated
using the 2-△△CT
method and are presented as mean fold changes ± standard errors. (I) The levels of MIR156a
in the plasma of mice after feeding with a control diet or rice were measured by qRT-PCR and either directly
calculated or normalized to miR-16 or let-7d/g/i. The relative levels were calculated using the 2-△△CT
method
and are presented as mean fold changes ± standard errors. Significance was assessed by t-tests.
ACC
EPTE
D M
ANU
SCR
IPT
ACCEPTED MANUSCRIPT
24
Table 1. The raw CT values of plant miRNAs in watermelon juice and mixed fruits detected by qRT-PCR.
Plant
miRNA Sequence
CT value in
watermelon juice
CT value in
fruit mixture
CT value in
no-template
control
ath-MIR156a UGACAGAAGAGAGUGAGCAC 20.08 ± 0.24 23.68 ± 0.41 28.82 ± 0.01
ath-MIR157a UUGACAGAAGAUAGAGAGCAC 18.75 ± 0.52 13.85 ± 0.49 30.77 ± 0.06
ath-MIR162a UCGAUAAACCUCUGCAUCCAG 21.96 ± 0.66 26.03 ± 0.41 31.63 ± 0.27
ath-MIR167a UGAAGCUGCCAGCAUGAUCUA 25.03 ± 0.24 31.47 ± 0.03 36.14 ± 0.01
ath-MIR168a UCGCUUGGUGCAGGUCGGGAA 23.05 ± 0.26 25.29 ± 0.41 31.76 ± 0.04
ath-MIR172a AGAAUCUUGAUGAUGCUGCAU 22.29 ± 0.30 22.20 ± 0.38 31.29 ± 0.08
ath-MIR390a AAGCUCAGGAGGGAUAGCGCC 22.61 ± 0.18 20.12 ± 0.34 31.70 ± 0.80
osa-MIR528 UGGAAGGGGCAUGCAGAGGAG 20.23 ± 0.27 25.63 ± 0.37 28.48 ± 0.02
ppt-MIR894 CGUUUCACGUCGGGUUCACC 14.58 ± 0.87 13.70 ± 0.34 33.25 ± 0.21
ath-MIR166a UCGGACCAGGCUUCAUUCCCC 25.66 ± 0.29 28.20 ± 0.41 36.80 ± 0.02
ath-MIR158a UCCCAAAUGUAGACAAAGCA 23.91 ± 0.08 20.17 ± 0.02 33.57 ± 0.03
ath-MIR159a UUUGGAUUGAAGGGAGCUCUA 21.90 ± 0.02 26.15 ± 0.04 33.54 ± 0.14
ath-MIR160a UGCCUGGCUCCCUGUAUGCCA 24.94 ± 0.27 21.86 ± 0.37 29.39 ± 0.07
ath-MIR163a UUGAAGAGGACUUGGAACUUCGAU 27.98 ± 0.55 28.80 ± 0.50 34.63 ± 0.08
ath-MIR169a CAGCCAAGGAUGACUUGCCGA 25.70 ± 0.35 25.89 ± 0.46 31.82 ± 0.09
ath-MIR824 UAGACCAUUUGUGAGAAGGGA 20.22 ± 0.25 21.87 ± 0.41 25.84 ± 0.44
ath-MIR170a UGAUUGAGCCGUGUCAAUAUC 28.02 ± 0.08 26.53 ± 0.47 28.02 ± 0.04
ath-MIR395a CUGAAGUGUUUGGGGGAACUC 29.03 ± 0.01 28.18 ± 0.06 29.72 ± 0.66

ACC
EPTE
D M
ANU
SCR
IPT
ACCEPTED MANUSCRIPT
25
Table 2. The dynamic quantification range for plant miRNA measurement and the concentration of plant
miRNAs in watermelon juice and fruits.
Plant
miRNA
Linear range of
CT values
Dynamic
quantification range
of expression levels
Concentration
in
watermelon
juice (pM)
Concentration
in fruit
mixture
(pmol/kg)
ath-MIR156a [7.00-28.02] [0.01amol-100fmol] 310.82 204.89
ath-MIR157a [8.34-30.02] [0.01amol-10fmol] 1207.03 11315.29
ath-MIR162a [6.46-28.47] [0.001amol-100fmol] 20.54 6.59
ath-MIR167a [10.71-32.18] [0.001amol-10fmol] 25.33 2.06
ath-MIR168a [10.33-29.35] [0.001amol-10fmol] 34.84 56.33
ath-MIR172a [8.05-29.84] [0.01amol-100fmol] 191.5 496.06
ath-MIR390a [6.60-27.85] [0.001amol-100fmol] 41.83 65.18
osa-MIR528 [10.23-26.88] [0.1amol-10fmol] 1048.01 298.11
ppt-MIR894 [10.21-32.51] [0.01amol-10fmol] 39846.54 55192.46
ath-MIR166a [11.17-30.47] [0.01amol-10fmol] 30.42 0.01
ath-MIR158a [8.82-29.43] [0.01amol-10fmol] 39.88 4782.72
ath-MIR159a [7.96-27.01] [0.1amol-100fmol] 347.49 169.8
ath-MIR160a [9.23-26.57] [1amol-100fmol] 373.54 1850.46
ath-MIR163a [11.23-30.95] [0.01amol-10fmol] 6.66 37.49
ath-MIR169a [8.48-28.59] [0.01amol-100fmol] 12.99 112.72
ath-MIR824 [6.40-22.83] [0.1amol-100fmol] 107.52 275.1
ath-MIR170a [8.47-23.93] [1amol-100fmol] UD UD
ath-MIR395a [7.39-23.85] [0.1amol-100fmol] UD UD

ACC
EPTE
D M
ANU
SCR
IPT
ACCEPTED MANUSCRIPT
26
Table 3. The basal level, peak level and absorption rate of plant miRNAs in plasma following watermelon
juice administration.
Plant
miRNA
Basal
level in
plasma
(fM)
Peak
level in
plasma
(fM)
Total
uptake
amount
(pmol)
Total
absorption
amount
(pmol)
Absorption
rate (%)
ath-MIR156a 317.1 933.12 777.05 2.59 0.33
ath-MIR162a 33.45 118.57 51.35 0.43 0.84
ath-MIR168a 28.49 56.62 87.1 0.18 0.21
ath-MIR172a 82.24 162.32 478.75 0.34 0.07
ath-MIR390a 10.38 18.41 104.58 0.04 0.04
osa-MIR528 8289.02 16141.78 2620.02 34.37 1.31

ACC
EPTE
D M
ANU
SCR
IPT
ACCEPTED MANUSCRIPT
27
Fig. 1

ACC
EPTE
D M
ANU
SCR
IPT
ACCEPTED MANUSCRIPT
28
Fig. 2

ACC
EPTE
D M
ANU
SCR
IPT
ACCEPTED MANUSCRIPT
29
Fig. 3
Copyright © 2022 FDOKUMEN