
Fourier transform coupled to tryptophan-scanning mutagenesis: Lessons from its application to the...
8
Fourier transform coupled to tryptophan-scanning mutagenesis: Lessons from its application to the prediction of secondary structure in the acetylcholine receptor lipid-exposed transmembrane domains José David Otero-Cruz a , David Abner Torres-Núñez b , Carlos Alberto Báez-Pagán a , José Antonio Lasalde-Dominicci c , ⁎ a Department of Chemistry, University of Puerto Rico, Río Piedras Campus, San Juan, P.R. 00931, Puerto Rico b Department of Mathematics, University of Puerto Rico, Río Piedras Campus, San Juan, P.R. 00931, Puerto Rico c Department of Biology, University of Puerto Rico, Río Piedras Campus, P.O. Box 23360, San Juan, P.R. 00931-3360, Puerto Rico article info abstract Article history: Received 22 October 2007 Received in revised form 17 January 2008 Accepted 22 January 2008 Available online 20 February 2008 Although Fourier transform (FT) and tryptophan-scanning mutagenesis (TrpScanM) have been extremely useful for predicting secondary structures of membrane proteins, they are deemed to be low-resolution techniques. Herein, we describe the combined use of FT and TrpScanM (FT-TrpScanM) as a more reliable approach for the prediction of secondary structure. Five TrpScanM studies of the acetylcholine receptor lipid- exposed transmembrane domains (LETMDs) were revisited and analyzed by FT-TrpScanM. FT analysis of the raw data from the aforementioned TrpScanM studies supports and validates the conclusions derived from their tryptophan-periodicity profiles. Furthermore, by FT-TrpScanM, we were able to determine the minimum number of consecutive tryptophan substitutions necessary for more robust prediction of α-helical secondary structures and evaluate the quality of structure predictions by α-helical character curves. Finally, this study encourages future utilization of FT-TrpScanM to more reliably predict secondary structures of the membrane protein LETMDs. © 2008 Elsevier B.V. All rights reserved. Keywords: Tryptophan-scanning mutagenesis Fourier transform Ligand-gated ion channel Lipid-exposed transmembrane domain Secondary structure Two-electrode voltage clamp 1. Introduction Unlike globular proteins, high-resolution three-dimensional struc- tures of membrane proteins as determined by X-ray crystallography are seldom found in protein structure databases, reflecting the difficulties associated with their crystallization. As preferred alternatives to X-ray crystallography for structural assessment, NMR and cryo-electron microscopy have been typically used; however, they are limited by protein size and reachable resolution, respectively. In this scenario, the tryptophan-scanning mutagenesis (TrpScanM) has emerged as another option for predicting the secondary structure and packing arrangement of the lipid-exposed transmembrane domains (LETMDs), which can then be used to model their overall spatial orientation [1]. Although TrpScanM has been successfully applied to several ion-channel proteins such as nicotinic acetylcholine receptor (nAChR) channels [1–5], inward rectifier potassium channels [6–8], voltage-activated potassium chan- nels [9–15], glutamate receptor channels [16], γ-aminobutyric acid type A (GABA A ) receptor channels [17,18], voltage-gated sodium channels [19], N-methyl-D-aspartate (NMDA) receptor channels [20], P2X 4 receptor channels [21] mechanosensitive channels MscL [22,23], human ether-a-go-go-related gene (HERG) K + channels [24], and epithelial Na + channels [25]; the TrpScanM is, nevertheless, deemed a low-resolution method for predicting the secondary structure and packing arrangement because it does not provide direct structural information. The rationale for choosing TrpScanM is that tryptophan systematic substitutions in the transmembrane domain of the ion- channel protein should result in a loss of function and/or functional expression when facing the interior of the protein. Conversely, when the tryptophan substitution faces the lipid environment the mutation could be tolerated; thus, the tryptophan systematic substitutions give rise to periodic patterns of perturbations in ion-channel function and func- tional expression. Herein, we coupled Fourier transform (FT) to TrpScanM (FT-TrpScanM) to predict reliable secondary structures of the AChR LETMDs. The focus of the present study is not to determine the secondary structure of the AChR LETMDs because these have already been determined. Indeed, the main objective of this study is to convey the use of FT-TrpScanM as a valuable alternate tool to make reliable predictions of secondary structures of the membrane protein LETMDs for which high-resolution structures are not yet available. It is noteworthy that we took advantage of the recently reported structure of the Torpedo AChR, which was determined at 4 Å resolution using cryo- electron microscopy in order to corroborate our predictions [26]. Interestingly, the TrpScanM predicted α-helical structures for the Biochimica et Biophysica Acta 1784 (2008) 1200–1207 Abbreviations: AChR, acetylcholine (ACh) receptor; FT, Fourier transform; FT- TrpScanM, Fourier transform coupled to tryptophan-scanning mutagenesis; LETMDs, lipid-exposed transmembrane domains; TrpPPs, tryptophan-periodicity profiles; TrpScanM, tryptophan-scanning mutagenesis ⁎ Corresponding author. Tel.: +1787 764 0000x1 2765 or 1 4887; fax: +1787 753 3852. E-mail addresses: [email protected], [email protected] (J.A. Lasalde-Dominicci). 1570-9639/$ – see front matter © 2008 Elsevier B.V. All rights reserved. doi:10.1016/j.bbapap.2008.01.020 Contents lists available at ScienceDirect Biochimica et Biophysica Acta journal homepage: www.elsevier.com/locate/bbapap
-
Upload
independent -
Category
Documents
-
view
0 -
download
0
Transcript of Fourier transform coupled to tryptophan-scanning mutagenesis: Lessons from its application to the...

Biochimica et Biophysica Acta 1784 (2008) 1200–1207
Contents lists available at ScienceDirect
Biochimica et Biophysica Acta
j ourna l homepage: www.e lsev ie r.com/ locate /bbapap
Fourier transform coupled to tryptophan-scanning mutagenesis: Lessons from itsapplication to the prediction of secondary structure in the acetylcholinereceptor lipid-exposed transmembrane domains
José David Otero-Cruz a, David Abner Torres-Núñez b,Carlos Alberto Báez-Pagán a, José Antonio Lasalde-Dominicci c,⁎a Department of Chemistry, University of Puerto Rico, Río Piedras Campus, San Juan, P.R. 00931, Puerto Ricob Department of Mathematics, University of Puerto Rico, Río Piedras Campus, San Juan, P.R. 00931, Puerto Ricoc Department of Biology, University of Puerto Rico, Río Piedras Campus, P.O. Box 23360, San Juan, P.R. 00931-3360, Puerto Rico
a r t i c l e i n f o
Abbreviations: AChR, acetylcholine (ACh) receptoTrpScanM, Fourier transform coupled to tryptophan-sclipid-exposed transmembrane domains; TrpPPs, tryTrpScanM, tryptophan-scanning mutagenesis⁎ Corresponding author. Tel.: +1787 764 0000x1 2765
E-mail addresses: [email protected], [email protected]
1570-9639/$ – see front matter © 2008 Elsevier B.V. Aldoi:10.1016/j.bbapap.2008.01.020
a b s t r a c t
Article history:Received 22 October 2007Received in revised form 17 January 2008Accepted 22 January 2008Available online 20 February 2008
Although Fourier transform (FT) and tryptophan-scanning mutagenesis (TrpScanM) have been extremelyuseful for predicting secondary structures of membrane proteins, they are deemed to be low-resolutiontechniques. Herein, we describe the combined use of FT and TrpScanM (FT-TrpScanM) as a more reliableapproach for the prediction of secondary structure. Five TrpScanM studies of the acetylcholine receptor lipid-exposed transmembrane domains (LETMDs) were revisited and analyzed by FT-TrpScanM. FT analysis of theraw data from the aforementioned TrpScanM studies supports and validates the conclusions derived fromtheir tryptophan-periodicity profiles. Furthermore, by FT-TrpScanM, wewere able to determine the minimumnumber of consecutive tryptophan substitutions necessary for more robust prediction of α-helical secondarystructures and evaluate the quality of structure predictions by α-helical character curves. Finally, this studyencourages future utilization of FT-TrpScanM to more reliably predict secondary structures of the membraneprotein LETMDs.
© 2008 Elsevier B.V. All rights reserved.
Keywords:Tryptophan-scanning mutagenesisFourier transformLigand-gated ion channelLipid-exposed transmembrane domainSecondary structureTwo-electrode voltage clamp
1. Introduction
Unlike globular proteins, high-resolution three-dimensional struc-tures of membrane proteins as determined by X-ray crystallography areseldom found in protein structure databases, reflecting the difficultiesassociated with their crystallization. As preferred alternatives to X-raycrystallography for structural assessment, NMR and cryo-electronmicroscopy have been typically used; however, they are limited byprotein size and reachable resolution, respectively. In this scenario, thetryptophan-scanning mutagenesis (TrpScanM) has emerged as anotheroption for predicting the secondary structure and packing arrangementof the lipid-exposed transmembrane domains (LETMDs), which canthen be used to model their overall spatial orientation [1]. AlthoughTrpScanM has been successfully applied to several ion-channel proteinssuch as nicotinic acetylcholine receptor (nAChR) channels [1–5], inwardrectifier potassium channels [6–8], voltage-activated potassium chan-nels [9–15], glutamate receptor channels [16], γ-aminobutyric acid typeA (GABAA) receptor channels [17,18], voltage-gated sodium channels
r; FT, Fourier transform; FT-anning mutagenesis; LETMDs,ptophan-periodicity profiles;
or 14887; fax: +1787 753 3852.om (J.A. Lasalde-Dominicci).
l rights reserved.
[19], N-methyl-D-aspartate (NMDA) receptor channels [20], P2X4
receptor channels [21] mechanosensitive channels MscL [22,23],human ether-a-go-go-related gene (HERG) K+ channels [24], andepithelial Na+ channels [25]; the TrpScanM is, nevertheless, deemed alow-resolution method for predicting the secondary structure andpacking arrangement because it does not provide direct structuralinformation. The rationale for choosing TrpScanM is that tryptophansystematic substitutions in the transmembrane domain of the ion-channel protein should result in a loss of function and/or functionalexpressionwhen facing the interior of the protein. Conversely, when thetryptophan substitution faces the lipid environment themutation couldbe tolerated; thus, the tryptophan systematic substitutions give rise toperiodic patterns of perturbations in ion-channel function and func-tional expression. Herein, we coupled Fourier transform (FT) toTrpScanM (FT-TrpScanM) to predict reliable secondary structures ofthe AChR LETMDs. The focus of the present study is not to determine thesecondary structure of the AChR LETMDs because these have alreadybeen determined. Indeed, the main objective of this study is to conveythe use of FT-TrpScanM as a valuable alternate tool to make reliablepredictions of secondary structures of the membrane protein LETMDsfor which high-resolution structures are not yet available. It isnoteworthy that we took advantage of the recently reported structureof theTorpedoAChR,whichwasdetermined at 4Å resolution using cryo-electron microscopy in order to corroborate our predictions [26].Interestingly, the TrpScanM predicted α-helical structures for the

1201J.D. Otero-Cruz et al. / Biochimica et Biophysica Acta 1784 (2008) 1200–1207
LETMDs [1–5] even when a lower-resolution cryo-electron microscopystructure mistakenly predicted the LETMDs to be arranged as β-sheets[27]. Thus, the AChR serves as an excellent model to test the validity ofthe FT-TrpScanM approach and provides reassurance on its capacity togenerate trustworthy predictions for the secondary structures ofmembrane protein LETMDs in general. Furthermore, FT-TrpScanMsupports and validates the conclusions from previous TrpScanM [1–5]and biochemical [28–30] studies, which predicted that the LETMDs arearranged as α-helical structures. In addition, using this approach, wewere able to provide additional structural information, estimate meanperiodicities, determine the minimum number of consecutive trypto-phan substitutions required to reliably predict α-helical structures, andassess the quality of structure predictions.
2. Materials and methods
2.1. General experimental procedures
Xenopus laevis oocytes were microinjected with complementary RNAs from mousemuscle adult-type or Torpedo californica AChR (see also Refs. [1–5]). Mutations wereengineered with the QuikChange® Site-Directed Mutagenesis kit (Stratagene, La Jolla,CA, USA) and were confirmed by automated DNA sequencing. All mutagenic primerswere designed with the tryptophan codon (TGG) instead of the wild-type (WT) codonat the desired position. Muscle-type or Torpedo AChR cRNA transcripts weresynthesized with the mMESSAGE mMACHINE® kit (Ambion, Inc., Austin, TX, USA).Oocytes were incubated for 3–5 days with fresh liquid medium at 19 °C.
2.2. Voltage clamp
Macroscopic ACh-induced currentswere recorded at room temperaturewith awhole-cell two-electrode voltage clamp configuration using a Gene Clamp 500B amplifier (AxonInstruments, Inc., Union City, CA, USA). Electrodes were filled with 3 M KCl and hadresistances of b2 MΩ. Impaled oocytes were automatically perfused with a MOR-2 buffer[82.5mMNaCl, 2.5mMKCl, 5mMMgCl2,1mMNa2HPO4, 0.2mMCaCl2, 5mMHEPES, and0.5 mM EGTA (pH 7.4)] at a rate of 0.43 mL/s and a solution exchange of b3 s using aPerfusion Valve Controller VC-8 (Warner Instruments, Inc., Hamden, CT, USA). Membranepotential was held at −70mV.Membrane currents were filtered at 100 Hz and digitized at1 kHz using Gene Clamp 500B amplifier and DigiData 1322A interface (Axon Instruments,Inc., Union City, CA, USA), respectively. Data acquisition was conducted through theClampex 9.2 program (Axon Instruments, Inc., Union City, CA, USA). Dose–response curveswere generated using macroscopic peak currents (I) obtained from seven different AChconcentrations (1, 3, 10, 30, 55, 100, and 300 μM ACh). Dose–response curves were fittedthrougha sigmoidaldose–response equationwithvariable slopeusing theGraphPadPrism4 program (GraphPad Software, Inc., San Diego, CA, USA),
I nAð Þ ¼ Imin þ lmax � lmin
1þ 10 LogEC50 � Log ACh½ �� �� Hill Slope
ð1Þ
where I is the macroscopic peak ionic current at a given ACh concentration, Imin and Imax
are the smallest and the largest currentsobserved, respectively, EC50 is the concentrationofacetylcholine that provokes a response halfway between Imin and Imax, and the Hill Slope isthe steepness of the dose–response curve [31].
2.3. Periodicity profiles
The oscillation patterns of the TrpPPs were generated with the reported ACh EC50values from five LETMDs (αM4, βM3, γM4, and two αM3 domains). TrpPPs wereplotted with ACh EC50 values as a function of the tryptophan substitution positions.TrpPP curves were fitted through a cubic spline method with 3000 segments tointerpolate the points using the GraphPad Prism 4 program. The number of residues perhelical turn of the periodicity profiles was estimated as the number of amino acidsbetween adjacent maximum and minimum peaks (see Fig. 1A–E).
2.4. Fourier transform
The FT power spectra from ACh EC50 data were generated using a least-squaresdiscrete FT equation [13,21,32–36]. The FT power spectrum P(ω) was plotted as a functionof angular frequency ω (rotation angle between residue around a helical axis) using,
P xð Þ ¼ RNj¼1 Vj � hVji
� �cos jxð Þ
h i2þ RN
j¼1 Vj � hVji� �
sin jxð Þh i2
ð2Þ
where Vj is the ACh EC50 values at a given position j, bVjN is the mean value of Vj inthe sliding window, and N is the number of ACh EC50 values in the sliding window (seeFig. 1F–J). The sliding windows of the ACh EC50 values must follow the order presentedin the original sequence. For instance, the FTanalysis of a sequence of values from an idealα-helical pattern (3.6 residues/turn) should give a prominent peak at ~100° in the FTpower spectrum, given that theω parameter is related to the number of residues/turn (d)by the expression ω=360°/d. The mean periodicities of the sequences of ACh EC50 values
were estimated from the peak localized in the vicinity of the rotation angle as indicated bythe mean periodicities of their TrpPPs. The expected rotation angles (ω) of the TrpPPs'mean periodicities were calculated by the abovementioned equation, ω=360°/d. Thereliability of the sequences of ACh EC50 values for predicting α-helical periodicities wasevaluated by calculating the ratio of P(ω) in theα-helical range (85°≤ω≤115°) relative to P(ω) over the whole spectrum using,
Peak ratio ¼ 1=30ð ÞZ 115-
85-P xð Þdx
" #= 1=180ð Þ
Z 180-
0-P xð Þdx
" #ð3Þ
where P(ω) is the FT power spectrum. Peak ratio values greater than 2, which represent atleast 33%of thewholepower spectrum, havebeenconsideredasaverygood indicatorof anα-helical secondary structure [21,32–34,36]. The algorithm templates developed to plotthe FT power spectra and calculate the peak ratio values were generated using theMATLAB® 7.4 program (TheMathWorks, Inc., Natick, MA, USA)with a precision of 1×10⁻⁴.The algorithm templates are available in the Appendix 1.
2.5. α-Helical character curves
To generate theα-helical character curves, different sequences of ACh EC50 valueswerepartitioned as a squared triangle to form the slidingwindows of different sizes. The numberof sliding windowswas determined using a triangular number equation; number of slidingwindows=n(n+1)/2, where n is the number of values in the sequence. The partitions ofsequences, as triangular numbers, satisfy the condition that the sub-sequences generatedshould be unique and also follow the consecutive order of the original sequences. The FTpower spectra generated from different sliding windows were evaluated to determine thepercent of FT power spectra per sliding window size that fulfilled two characteristicparameters of α-helical secondary structures: (i) peak ratio N2 and (ii) prominent peakinside several frequency intervals such as 102.9°≤prominent peak≤97.3° for 3.5–3.7periodicities; 105.9°≤prominent peak≤94.7° for 3.4–3.8 periodicities; 109.1°≤prominentpeak≤92.3° for 3.3–3.9 periodicities; or 112.5°≤prominent peak≤90° for 3.2–4.0 periodi-cities. Thepercentof the FT power spectra that fulfilled the aforementioned parameterswasplotted as a function of sliding window size to generate α-helical character curves of thedifferent frequency intervals (seeFig.1K–O). For instance, avalueof 100%α-helical characterfor a slidingwindow size of 12 residues implies that each one of the seven FT power spectra(see Fig. 1K; blue curve), which were generated from seven partitions composed of 12consecutive anddifferent values, has a peak ratio value N2 and a prominent peakmaximuminside the range90°–112.5°. In this example, theslidingwindowsizeof 12valueswasmovedseven times along a sequence of 18 values in total to generate the seven different partitionsthat were used to create the seven FT power spectra (see Appendix 2; Table A2).
3. Results and discussion
In this study, we revisited the reported TrpScanM from five LETMDs(αM4,βM3, γM4, and twoαM3domains) of two different AChR species(Table 1). The raw data of these studies, which predicted helicalstructures with diverse periodicities and packing arrangements forthe LETMDs [1–5], were used to generate the FT power spectra and theα-helical character curves. By coupling FT to TrpScanM, we achieve amore reliable prediction for the secondary structures of the LETMDs andprovide initial support for this valuable alternative tool.
3.1. Tryptophan-periodicity profiles of the αM4, βM3, γM4, and two αM3domains
We used TrpScanM to predict the secondary structures andpacking arrangements of the LETMDs. The periodic patterns of thefunctional consequences due to the tryptophan substitutions weredisplayed in the TrpPPs (Fig. 1A–E). The TrpPPs were plotted with AChEC50 values derived from dose–response curves of the mutationsgenerated in the AChR LETMDs [1–5]. The TrpPPs, which have beenpreviously reported, display different oscillation patterns and differ-ent frequencies, indicating that LETMDs form helical structures withdifferent periodicities and different helical packings. These findingshave been supported by a refined structure of the Torpedo marmoratanAchR at 4 Å resolution determined by cryo-electron microscopymethod [26].
3.2. Fourier transform power spectra of the αM4, βM3, γM4, and twoαM3 domains
Generally, the discrete Fourier transform analysis is used to converta sequence of values into a frequency spectrum; and thus, it may be

Fig.1. Tryptophan-periodicity profiles, Fourier transform power spectra, andα-helical character curves generated with tryptophan-scanningmutagenesis data from AChR lipid-exposed transmembrane domains. (A–E) are TrpPPs. Values alongthe lines indicate the number of residues per helical turn between adjacent maximum andminimum peaks. The black dashed lines indicate the ACh EC50 value of the wild-type AChR. (F–J) are FT power spectra from entire sequences of the AChEC50 values shown in the TrpPPs (A–E). The black headed arrows indicate the peaks that correspond tomean periodicities of the TrpPPs (A–E). Grey shadings demarcate the region 85°≤ω≤115° that is used to calculate peak ratio values. (K–O) areα-helical character curves of different periodicity intervals as a function of the number of residues in the sliding window; red line (3.5–3.7) residues/turn; yellow line (3.4–3.8) residues/turn; green line (3.3–3.9) residues/turn; or blue line (3.2–4.0) residues/turn.
1202J.D
.Otero-Cruz
etal./
Biochimica
etBiophysica
Acta
1784(2008)
1200–1207

Table 2Secondary structure parameters of AChR LETMDs determined by TrpPPs and FT powerspectra
AchR type No.residues
TrpPPs FT power spectra
Periodicity Expectedrotation angle
Rotationangle
Peakratio
Meanperiodicity
Residues/turn
Degree Degree Residues/turn
αM3 muscle-type
18 3.24±0.70 111.11 102.25 2.94 3.52
αM3 Torpedo 13 3.17±1.04 113.56 115.00 0.53 3.13αM4 Torpedo 11 3.28±0.74 109.76 100.76 3.15 3.57βM3 Torpedo 15 2.61±0.74 137.93 138.06 0.75 2.61γM4 Torpedo 12 3.19±0.45 112.85 108.88 2.67 3.31
Given values correspond to analysis performed on the entire sequence of ACh EC50
values from the AChR LETMDs. Periodicities of the TrpPPs are given as mean±SD.Expected rotation angles of the TrpPPs and the mean periodicities of the peaks thatcorrespond to mean periodicities of the TrpPPs were calculated using periodicity(residues/turn)=360°/rotation angle.
1203J.D. Otero-Cruz et al. / Biochimica et Biophysica Acta 1784 (2008) 1200–1207
used todetectperiodic variations in the sequence. Therefore,we coupledFT toTrpScanM to estimate themeanperiodicities and peak ratios of thesequences of ACh EC50 values from LETMDs that are displayed in theTrpPPs (Fig.1A–E). Using FTequation (Eq. (2)), the sequences of AChEC50values were decomposed into multiple peaks with different frequenciesand abundances at the FT power spectra, suggesting that TrpPPsmay bedivided aswell into several periodicitieswithdiverseoscillationpatterns(Fig. 1F–J). The similarities in the periodicity values from the meanperiodicities determined by rotation angle of the peaks and the meanperiodicities of the TrpPPs reveal that FT supports and validatesTrpScanM data (see Table 2). Interestingly, the prominent peaks of theTorpedo αM3 and βM3 AChRs were not found in the expected vicinityof the rotation angle indicated by themeanperiodicities of their TrpPPs.The unexpected location of these prominent peaks could be due to thecontribution of anomalous oscillations in their TrpPPs. For instance, theanomalous amplitudes displayed by the values in the 278 and 284–287positions in the TrpPPs (Fig. 1B and D, respectively), have considerableweight on the fitting of the sequences of values, causing a bias on theabundance of the peaks. Therefore, these anomalous oscillations popu-late peaks at frequencieswhich arenot characteristic of theperiodicityofan α-helical structure. A notorious example of this is the above-mentioned value in the 278 position. The value in the 278 positioncontributes extensively to delocalizing the prominent peak from the α-helical frequency intervals (see Appendix 2; Fig. A1 A, B, and D).However, this contribution is not reflected in the FT power spectragenerated from sub-series (partitions) that do not bear the value of the278 position (see Appendix 2; Fig. A1 C, E, and F).
3.3.α-helical character curves of theαM4,βM3,γM4, and twoαM3domains
We used α-helical character curves as complementary tool to theprediction of secondary structure by TrpScanM. The peak ratio from FTpower spectra has been used as a parameter of reliability forpredicting α-helical structures; however, it is not enough for a clearprediction because the maximum of the prominent peak could belocated outside the α-helical frequency interval (85°≤ω≤115°) andyet have a peak ratio N2. In order to avoid this problem and to makemore reliable predictions of secondary structures, we have generatedthe α-helical character curves (Fig. 1K–O). The α-helical charactercurves provide us a tracking quality map of structure predictions. Theα-helical character curves of the muscle-type αM3 domain, and theTorpedo αM4 and γM4 domains show that the α-helical structurespredicted by FT-TrpScanM method were more reliable than those ofthe Torpedo αM3 and βM3 domains because they maintain a level of100% α-helical characters even while reducing the size of the slidingwindows at different periodicity intervals. A level of 100% α-helicalcharacter indicates that all the FT power spectra, generated fromTrpScanM data, for a given sliding window size and periodicityinterval fulfill both parameters that characterize an α-helix structure(see “2. Materials and methods”). The Torpedo αM3 and βM3 domainsdisplayed low percents in the α-helical character curves, presumablydue to two factors: (i) insufficient amount of tryptophan substitutionsto predict an α-helix structure and/or (ii) the sequence of valuespredicted a mixture of α- and 310-helix structures or a 310-helixstructure. The size of the smallest sliding window displaying a level of100%α-helical character can be considered indicative of theminimum
Table 1Amino acid sequences of the studied AChR LETMDs
AchR type Sequence
αM3 muscle-type L F T M V F V I AαM3 Torpedo M L F T M I F V IαM4 Torpedo M L I C I I G T VβM3 Torpedo R Y L M F I M I LγM4 Torpedo C F W I A L L L FPosition 1 2 3 4 5 6 7 8 9
number of consecutive tryptophan substitutions necessary to predictreliable α-helical structures at a given periodicity interval. Forinstance, the amount of 12 residues is suitable to predict a reliableα-helix structure that would have periodicities between 3.2 and 4.0residues/turn (Fig. 1K; blue curve), whereas in the Fig. 1L moreresidues are required to predict a reliable α-helix structure using thestudied periodicity intervals (Appendix 2; Tables A1 and A2). Also,from theα-helical character graphs, it is evident that the prediction ofextremely reliable α-helical structures requires shorter periodicityintervals and larger sliding windows. In addition, the predictions ofthe LETMDs could be ranked according to the following order: αM3muscle-typeNαM4 Torpedo≈γM4 TorpedoNαM3 TorpedoNNβM3Torpedo through the use of the α-helical character curves. In essence,the quality of structure predictions by TrpScanM could be examinedby α-helical character curves at different periodicity intervals.
4. Conclusions
FT-TrpScanM may be a useful tool for predicting reliable secondarystructures of membrane protein LETMDs, shedding light into theiroverall spatial orientation. Theα-helical character curvesmaybeused tofingerprint the quality of structure predictions and determine theminimum of substitutions required for reliable structure predictions.Finally, this work corroborates the predictions from previous TrpScanMstudies, demonstrates that similar results could have been reachedwith even fewer substitutions and encourages future utilization of FT-TrpScanM as a means of predicting the secondary structure of LETMDs.
Acknowledgements
We especially thank Dr. Kenton J. Swartz and Dr. Shai D. Silberbergfor kindly providing the program used to generate the Fouriertransform power spectra. This work was supported by the NIH grants2RO1GM56371-10, GM08102-27, and the University of Puerto RicoInstitutional Funds for Research grant (to J.A.L.-D.), and the NIH-NIGMS-MBRS-Research Initiative for Scientific Enhancement fellow-ship 2R25GM61151 (to J.D.O.-C. and C.A.B.-P.).
Ref.
S I I I T V I V I [1]S S I I [3]S V [2]V A F S V I [4]S I G [5]10 11 12 13 14 15 16 17 18
1204 J.D. Otero-Cruz et al. / Biochimica et Biophysica Acta 1784 (2008) 1200–1207
Appendix 1
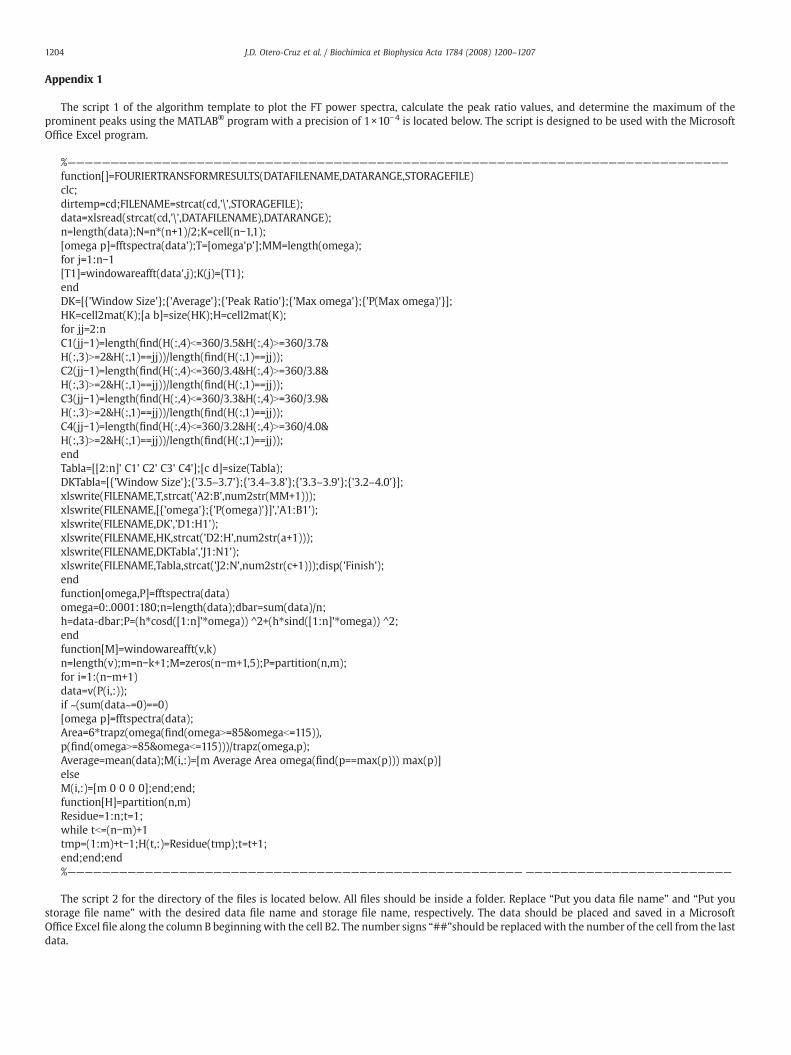
The script 1 of the algorithm template to plot the FT power spectra, calculate the peak ratio values, and determine the maximum of theprominent peaks using the MATLAB® program with a precision of 1×10⁻⁴ is located below. The script is designed to be used with the MicrosoftOffice Excel program.
%—————————————————————————————————————————————————————————————————————————————
function[]=FOURIERTRANSFORMRESULTS(DATAFILENAME,DATARANGE,STORAGEFILE)clc;dirtemp=cd;FILENAME=strcat(cd,'\',STORAGEFILE);data=xlsread(strcat(cd,'\',DATAFILENAME),DATARANGE);n=length(data);N=n⁎(n+1)/2;K=cell(n−1,1);[omega p]=fftspectra(data');T=[omega'p'];MM=length(omega);for j=1:n−1[T1]=windowareafft(data',j);K(j)={T1};endDK=[{'Window Size'};{'Average'};{'Peak Ratio'};{'Max omega'};{'P(Max omega)'}];HK=cell2mat(K);[a b]=size(HK);H=cell2mat(K);for jj=2:nC1(jj−1)=length(find(H(:,4)b=360/3.5&H(:,4)N=360/3.7&H(:,3)N=2&H(:,1)==jj))/length(find(H(:,1)==jj));C2(jj−1)=length(find(H(:,4)b=360/3.4&H(:,4)N=360/3.8&H(:,3)N=2&H(:,1)==jj))/length(find(H(:,1)==jj));C3(jj−1)=length(find(H(:,4)b=360/3.3&H(:,4)N=360/3.9&H(:,3)N=2&H(:,1)==jj))/length(find(H(:,1)==jj));C4(jj−1)=length(find(H(:,4)b=360/3.2&H(:,4)N=360/4.0&H(:,3)N=2&H(:,1)==jj))/length(find(H(:,1)==jj));endTabla=[[2:n]' C1' C2' C3' C4'];[c d]=size(Tabla);DKTabla=[{'Window Size'};{'3.5–3.7'};{'3.4–3.8'};{'3.3–3.9'};{'3.2–4.0'}];xlswrite(FILENAME,T,strcat('A2:B',num2str(MM+1)));xlswrite(FILENAME,[{'omega'};{'P(omega)'}]','A1:B1');xlswrite(FILENAME,DK','D1:H1');xlswrite(FILENAME,HK,strcat('D2:H',num2str(a+1)));xlswrite(FILENAME,DKTabla','J1:N1');xlswrite(FILENAME,Tabla,strcat('J2:N',num2str(c+1)));disp('Finish');endfunction[omega,P]=fftspectra(data)omega=0:.0001:180;n=length(data);dbar=sum(data)/n;h=data-dbar;P=(h⁎cosd([1:n]'⁎omega)) ^2+(h⁎sind([1:n]'⁎omega)) ^2;endfunction[M]=windowareafft(v,k)n=length(v);m=n−k+1;M=zeros(n−m+1,5);P=partition(n,m);for i=1:(n−m+1)data=v(P(i,:));if ~(sum(data~=0)==0)[omega p]=fftspectra(data);Area=6⁎trapz(omega(find(omegaN=85&omegab=115)),p(find(omegaN=85&omegab=115)))/trapz(omega,p);Average=mean(data);M(i,:)=[m Average Area omega(find(p==max(p))) max(p)]elseM(i,:)=[m 0 0 0 0];end;end;function[H]=partition(n,m)Residue=1:n;t=1;while tb=(n−m)+1tmp=(1:m)+t−1;H(t,:)=Residue(tmp);t=t+1;end;end;end%————————————————————————————————————————————————————— ————————————————————————
The script 2 for the directory of the files is located below. All files should be inside a folder. Replace “Put you data file name” and “Put youstorage file name” with the desired data file name and storage file name, respectively. The data should be placed and saved in a MicrosoftOffice Excel file along the column B beginningwith the cell B2. The number signs “##”should be replacedwith the number of the cell from the lastdata.

Fig. A1. Extract of the Fourier transform power spectra data from αM3 Torpedo AChR. (A–F) are FT power spectra generated from sub-series 1→13, 1→12, 2→13, 1→11, 2→12, and3→13 of the αM3 Torpedo data. Asterisks indicate the localization of the prominent peaks. Different intensities of green shadings demarcate the different frequency intervals; darkgreen (97.3°–102.9°); green; (94.7°–105.9°); bright green (92.3°–109.1°); light green (90.0°–112.5°). Red shadings demarcate the region 85°≤ω≤115° that is used to calculate peak ratiovalues. (For interpretation of the references to color in this figure legend, the reader is referred to the web version of this article.)
1205J.D. Otero-Cruz et al. / Biochimica et Biophysica Acta 1784 (2008) 1200–1207
%—————————————————————————————————————————————————————————————————————————————
DATAFILENAME='Put you data file name.xls';DATARANGE='B2:B##';
STORAGEFILE='Put you storage file name.xls';FTRESULTS(DATAFILENAME,DATARANGE,STORAGEFILE)%—————————————————————————————————————————————————————————————————————————————
Table A1Extract of the α-helical character data from αM3 Torpedo AChRTable A1Extract of the α-helical character data from αM3 Torpedo AChR

Table A2Extract of the α-helical character from αM3 muscle-type AChRTable A2Extract of the α-helical character from αM3 muscle-type AChR
1206 J.D. Otero-Cruz et al. / Biochimica et Biophysica Acta 1784 (2008) 1200–1207

1207J.D. Otero-Cruz et al. / Biochimica et Biophysica Acta 1784 (2008) 1200–1207
Appendix 2
In this appendix,we illustrate extracts of theFourier transformpowerspectra data from αM3 Torpedo AChR and the α-helical character datafrom αM3 Torpedo and αM3 muscle-type AChRs for a clear com-prehensionof theFT-TrpScanMmethod. In Fig. A1,we showthe FTpowerspectra of the slidingwindow sizes 11 through 13.When the value of the278position is includedon thepartition togenerate a FTpower spectrum(i.e. the sub-series 1→13, 1→12, and 1→11), the prominent peak is notlocalized inside α-helical frequency intervals nor in peak ratio interval85°≤ω≤115° (see Fig. A1 A, B, and D). In Table A1, we show thecontributionof the value in the278position of theαM3Torpedo to theα-helical character curves. The contribution of the value in the 278 positionto the α-helical character curves at the sliding window sizes of 11 to 13residues is shown by the sub-series 1→13, 1→12, and 1→11 (see redshaded boxes; Table A1). In these sub-series the value of the 278 positionis included to generate their respective FT power spectrum. From theseFT power spectra, the peak ratio value and rotation angle of theprominent peak were determined resulting on FT power spectra notcharacteristics of anα-helix structure (see 0=No; Table A1). Hence, thesesub-series do not contribute positively to α-helical character from theirsliding window size. Overall, the anomalous oscillations in the TrpPPstake more notoriety in sliding window sizes that are composed of fewsub-series (e.g. the sub-series 1→13, 1→12, and 1→11 from αM3 Tor-pedo; see Table A1) because these sub-series individually represent aportion larger than in sliding windows of many sub-series (i.e. theincrease in the number of sub-series decrease the proportion that iscontributed by each sub-series in the calculation of α-helical characterfor a particular sliding window). In the Table A2, we show theminimumnumber of substitutions that are required to predict a reliable α-helixstructure at a level of 100% α-helical character. The αM3 muscle-typedata show that to predict an α-helix structure of mean periodicitiesbetween3.2 and4.0 residues/turn at a level of 100%α-helical character atleast 12 substitutions arenecessary,while formeanperiodicities between3.3 and 3.9, 3.4 and 3.8, or 3.5 and 3.7 at least 13, 14, or 15 substitutions,respectively, are necessary (see red shaded boxes; Table A2).
Note: Sub-series are partitions from the sequence of values. Out orIn represents whether the localization of the maximum of theprominent peak is outside or inside of the frequency interval. 0=Noor 1=Yes represents if the FT power spectrum generated from the sub-series fulfill the two characteristic parameters of an α-helix structure:i) Peak ratio valueN2 and ii) Localization of the maximum of theprominent peak is inside frequency interval. 0=No represents that oneof the two parameters is not fulfilled. 1=Yes represents that bothparameters are fulfilled (see gray shaded boxes; Tables A1 and A2). % isthe percent of α-helical character per sliding window, which iscalculated as the percent of sub-series per sliding window that fulfillsthe two characteristic parameters of an α-helix structure.
References
[1] J.D. Otero-Cruz, C.A. Báez-Pagán, I.M. Caraballo-González, J.A. Lasalde-Dominicci,Tryptophan-scanning mutagenesis in the αM3 transmembrane domain of themuscle-type acetylcholine receptor. A spring model revealed, J. Biol. Chem. 282(2007) 9162–9171.
[2] S. Tamamizu, G.R. Guzmán, J. Santiago, L.V. Rojas, M.G. McNamee, J.A. Lasalde-Dominicci, Functional effects of periodic tryptophan substitutions in the αM4transmembrane domain of the Torpedo californica nicotinic acetylcholine receptor,Biochemistry 39 (2000) 4666–4673.
[3] G.R. Guzmán, J. Santiago, A. Ricardo, R. Martí-Arbona, L.V. Rojas, J.A. Lasalde-Dominicci, Tryptophan scanning mutagenesis in the αM3 transmembrane domainof the Torpedo californica acetylcholine receptor: functional and structuralimplications, Biochemistry 42 (2003) 12243–12250.
[4] J. Santiago, G.R. Guzmán, K. Torruellas, L.V. Rojas, J.A. Lasalde-Dominicci,Tryptophan scanning mutagenesis in the TM3 domain of the Torpedo californicaacetylcholine receptor beta subunit reveals an α-helical structure, Biochemistry43 (2004) 10064–10070.
[5] A. Ortiz-Acevedo, M. Meléndez, A.M. Asseo, N. Biaggi, L.V. Rojas, J.A. Lasalde-Dominicci, Tryptophan scanning mutagenesis of the γM4 transmembrane domainof the acetylcholine receptor from Torpedo californica, J. Biol. Chem. 279 (2004)42250–42257.
[6] S. Choe, C.F. Stevens, J.M. Sullivan, Three distinct structural environments of atransmembrane domain in the inwardly rectifying potassium channel ROMK1defined by perturbation, Proc. Natl. Acad. Sci. U. S. A. 92 (1995) 12046–12049.
[7] A. Collins, H. Chuang, Y.N. Jan, L.Y. Jan, Scanning mutagenesis of the putativetransmembrane segments of Kir2.1, an inward rectifier potassium channel, Proc.Natl. Acad. Sci. U. S. A. 94 (1997) 5456–5460.
[8] C.A. Cukras, I. Jeliazkova, C.G. Nichols, Structural and functional determinants ofconserved lipid interaction domains of inward rectifying Kir6.2 channels, J. Gen.Physiol. 119 (2002) 581–591.
[9] S.A. Monks, D.J. Needleman, C. Miller, Helical structure and packing orientation ofthe S2 segment in the shaker K+ channel, J. Gen. Physiol. 113 (1999) 415–423.
[10] K.H. Hong, C. Miller, The lipid–protein interface of a shaker K(+) channel, J. Gen.Physiol. 115 (2000) 51–58.
[11] Y. Li-Smerin, D.H. Hackos, K.J. Swartz, A localized interaction surface for voltage-sensing domains on the pore domain of a K+ channel, Neuron 25 (2000) 411–423.
[12] Y. Li-Smerin, D.H. Hackos, K.J. Swartz, alpha-Helical structural elements within thevoltage-sensing domains of a K(+) channel, J. Gen. Physiol. 115 (2000) 33–50.
[13] Y. Li-Smerin, K.J. Swartz, Helical structure of the COOH terminus of S3 and itscontribution to the gating modifier toxin receptor in voltage-gated ion channels,J. Gen. Physiol. 117 (2001) 205–218.
[14] D.H. Hackos, T.H. Chang, K.J. Swartz, Scanning the intracellular S6 activation gate inthe shaker K+ channel, J. Gen. Physiol. 119 (2002) 521–532.
[15] S.N. Irizarry, E. Kutluay, G. Drews, S.J. Hart, L. Heginbotham, Opening the KcsA K+channel: tryptophan scanning and complementation analysis lead to mutantswith altered gating, Biochemistry 41 (2002) 13653–13662.
[16] V.A. Panchenko, C.R. Glasser, M.L. Mayer, Structural similarities between glutamatereceptor channels and K(+) channels examined by scanning mutagenesis, J. Gen.Physiol. 117 (2001) 345–360.
[17] S. Ueno, A. Lin, N. Nikolaeva, J.R. Trudell, S.J. Mihic, R.A. Harris, N.L. Harrison,Tryptophan scanning mutagenesis in TM2 of the GABA(A) receptor alpha subunit:effects on channel gating and regulation by ethanol, Br. J. Pharmacol. 131 (2000)296–302.
[18] A. Jenkins, A. Andreasen, J.R. Trudell, N.L. Harrison, Tryptophan scanningmutagenesis in TM4 of the GABA(A) receptor alpha1 subunit: implications formodulation by inhaled anesthetics and ion channel structure, Neuropharmacology43 (2002) 669–678.
[19] S.Y.Wang, K. Bonner, C. Russell, G.K.Wang, Tryptophan scanning of D1S6 and D4S6C-termini in voltage-gated sodium channels, Biophys. J. 85 (2003) 911–920.
[20] Y. Honse, H. Ren, R.H. Lipsky, R.W. Peoples, Sites in the fourth membrane-associated domain regulate alcohol sensitivity of the NMDA receptor, Neurophar-macology 46 (2004) 647–654.
[21] S.D. Silberberg, T.H. Chang, K.J. Swartz, Secondary structure and gating rearrange-ments of transmembrane segments in rat P2X4 receptor channels, J. Gen. Physiol.125 (2005) 347–359.
[22] A.M. Powl, J.N. Wright, J.M. East, A.G. Lee, Identification of the hydrophobicthickness of a membrane protein using fluorescence spectroscopy: studies withthe mechanosensitive channel MscL, Biochemistry 44 (2005) 5713–5721.
[23] A.M. Powl, J.M. East, A.G. Lee, Heterogeneity in the binding of lipidmolecules to thesurface of a membrane protein: hot spots for anionic lipids on the mechan-osensitive channel of large conductance MscL and effects on conformation,Biochemistry 44 (2005) 5873–5883.
[24] R.N. Subbiah, M. Kondo, T.J. Campbell, J.I. Vandenberg, Tryptophan scanningmutagenesis of the HERGK+ channel: the S4 domain is loosely packed and likely tobe lipid exposed, J. Physiol. 569 (2005) 367–379.
[25] O.B. Kashlan, A.B. Maarouf, C. Kussius, R.M. Denshaw, K.M. Blumenthal, T.R.Kleyman, Distinct structural elements in the first membrane-spanning segment ofthe epithelial sodium channel, J. Biol. Chem. 281 (2006) 30455–30462.
[26] N. Unwin, Refined structure of the nicotinic acetylcholine receptor at 4 Aresolution, J. Mol. Biol. 346 (2005) 967–989.
[27] N. Unwin, Nicotinic acetylcholine receptor at 9 A resolution, J. Mol. Biol. 229 (1993)1101–1124.
[28] M.P. Blanton, J.B. Cohen, Mapping the lipid-exposed regions in the Torpedocalifornica nicotinic acetylcholine receptor, Biochemistry 31 (1992) 3738–3750.
[29] M.P. Blanton, J.B. Cohen, Identifying the lipid-protein interface of the Torpedonicotinic acetylcholine receptor: secondary structure implications, Biochemistry33 (1994) 2859–2872.
[30] M.P. Blanton, L.J. Dangott, S.K. Raja, A.K. Lala, J.B. Cohen, Probing the structure ofthe nicotinic acetylcholine receptor ion channel with the uncharged photoacti-vable compound [3H]diazofluorene, J. Biol. Chem. 273 (1998) 8659–8668.
[31] H.J. Motulsky, A. Christopoulos, Fitting Models to Biological Data Using Linear andNonlinear Regression: a Practical Guide to Curve Fitting, Oxford University Press,Oxford; New York, 2004.
[32] J.L. Cornette, K.B. Cease, H. Margalit, J.L. Spouge, J.A. Berzofsky, C. DeLisi,Hydrophobicity scales and computational techniques for detecting amphipathicstructures in proteins, J. Mol. Biol. 195 (1987) 659–685.
[33] H. Komiya, T.O. Yeates, D.C. Rees, J.P. Allen, G. Feher, Structure of the reaction centerfrom Rhodobacter sphaeroides R-26 and 2.4.1: symmetry relations and sequencecomparisons between different species, Proc. Natl. Acad. Sci. U. S. A. 85 (1988)9012–9016.
[34] Y. Li-Smerin, D.H. Hackos, K.J. Swartz, α-Helical structural elements within thevoltage-sensing domains of a K+ channel, J. Gen. Physiol. 115 (2000) 33–50.
[35] D.C. Rees, L. DeAntonio, D. Eisenberg, Hydrophobic organization of membraneproteins, Science 245 (1989) 510–513.
[36] D.C. Rees, H. Komiya, T.O. Yeates, J.P. Allen, G. Feher, The bacterial photosyntheticreaction center as a model for membrane proteins, Annu. Rev. Biochem. 58 (1989)607–633.