Long-range electron exchange measured in proteins by quenching of tryptophan phosphorescence
Biochemistry
London, E., & Feigenson, G. W. (1978) FEBS Lett. 96,51. London, E., & Feigenson, G. W. (1981a) Biochemistry 20,
London, E., & Feigenson, G. W. (1 98 1 b) Biochim. Biophys.
Marcus, R. A. (1956) J. Chem. Phys. 24, 966. Marcus, R. A., & Sutin, N. (1985) Biochim. Biophys. Acta
811, 265. Matko, J., Tron, L., Balazs, M., Hevessy, J., Somogyi, B., &
Damjanovich, S. (1980) Biochemistry 19, 5782. Matko, J., Szollosi, J., Tron, L., & Damjanovich, S. (1988)
Q. Rev. Biophys. 21, 479. Matko, J., Ohki, K., & Edidin, M. (1991) Biophys. J. 59,
126a. Meares, C. F., Yeh, S., & Stryer, L. (1981) J. Am. Chem.
SOC. 103, 1607. Meares, C. F., McCall, M. J., Reardan, D. T., Goodwin, D.
A., Diamanti, C. I., & McTigue, M. (1984) Anal. Biochem. 142, 68.
Mersol, J. V., Steel, D. G., & Gafni, A. (1991) Biochemistry 30, 668.
1932.
Acta 649, 89.
711 1992, 31, 711-716
Miller, J. R., Peeples, J. A., Schmitt, M. J., & Closs, G. L.
Mukerjee, P., Ramachandran, C., & Pyter, R. A. (1982) J .
Owen, C. S., & Vanderkooi, J. M. (1991) Biophys. J. 59,38a. Puskin, J. S., Vistnes, A. I., & Coene, M. T. (1981) Arch.
Biochem. Biophys. 206, 164. Robinson, G. W., & Frosch, R. P. (1962) J. Chem. Phys. 37,
1962. Stryer, L., & Haugland, R. P. (1967) Proc. Natl. Acad. Sci.
U.S.A. 58, 719. Turro, N. (1978) in Modern Molecular Photochemistry, pp
296-361, BenjaminlCumming, San Francisco, CA. Vanderkooi, J. M., & Berger, J. W. (1989) Biochim. Biophys.
Acta 976, 1. Vanderkooi, J. M., Englander, S. W., Papp, S., Wright, W.
W., & Owen, C. S. (1990) Proc. Natl. Acad. Sci. U.S.A. 87, 5009.
Wier, M. L., & Edidin, M. (1986) J. Cell Biol. 103, 215. Yeager, M. D., & Feigenson, G. W. (1990) Biochemistry 29,
(1982) J. Am. Chem. SOC. 104,6488.
Phys. Chem. 86, 3186.
4380.
Determination of the Excited-State Lifetimes of the Tryptophan Residues in Barnase, via Multifrequency Phase Fluorometry of Tryptophan Mutants?
K. Willaert,* R. Loewentha1,B J. Sancho,BgII M. Froeyen,* A. Fersht,8 and Y. Engelborghs*.t Laboratory of Chemical and Biological Dynamics, University of Leuven, Celestijnenlaan 200 D, B-3001 Lmven, Belgium, and
Chemical Laboratory, Cambridge Center for Protein Engineering, Cambridge University, Lensfield Road, Cambridge CB2 I E W, England
Received July I O , 1991; Revised Manuscript Received October 11, 1991
ABSTRACT: A multifrequency phase fluorometric study is described for wild-type barnase and engineered mutant proteins in which tryptophan residues have been replaced by less fluorescent residues which do not interfere with the determination of the tryptophan emission spectra and lifetimes. The lifetimes of the three tryptophans in the wild-type protein have been resolved. Trp-35 has a single fluorescence lifetime, which varies in the different proteins between 4.3 and 4.8 ns and is pH-independent between pH 5.8 and 8.9. Trp-71 and Trp-94 behave as an energy-transfer couple with both forward and reverse energy transfer. The couple shows two fluorescence lifetimes: 2.42 (10.2) and 0.74 (fO.l) ns a t pH 8.9, and 0.89 (f0.05) and 0.65 (10.05) ns at pH 5.8. In the mutant Trp-94 - Phe the lifetime of Trp-71 is 4.73 (f0.008) ns at high pH and 4.70 (10.004) ns at low pH. In the mutant Trp-71 - Tyr, the lifetime of Trp-94 is 1.57 (f0.03) ns at high pH and 0.82 (f0.025) ns a t low pH. From these lifetimes, one-way energy-transfer efficiencies can be calculated according to Porter [Porter, G. B. (1972) Theor. Chim. Acta 24, 265-2701. At pH 8.9, a 71% efficiency was found for forward transfer (from Trp-71 to Trp-94) and 36% for reverse transfer. At pH 5.8 the transfer efficiency was 86% for forward and 4% for reverse transfer (all f2%). These transfer efficiencies correspond fairly well with the ones calculated according to the theory of Forster [ Forster, T. (1948) Ann. Phys. (Leipzig) 2, 55-75]. The fluorescence lifetime of Trp-94, as determined in a mutant which lacks Trp-7 1, is heavily quenched by the neighboring imidazole group of His-1 8.
Fluorescence spectroscopy has been used extensively in the study of the time dependence of conformational changes in proteins. An interpretation of these fluorescence changes at
'This work is supported by the Belgian State Prime Minister's Office Science Policy Programming. K.W. was supported by this program and by the IWONL. Y.E. is research director of the Belgian National Fund for Scientific Research. R.L. is an Elmore student at Gonville and Caius College, J.S. was supported by the EC.
* To whom correspondence should be addressed. University of Leuven.
5 Cambridge University. 11 Present address: Department Bioquimica y Biologia Molecular y
Cellular, Faculty Ciencas, University of Zaragoza, Zaragoza, Spain.
the molecular level is passible only when they can be correlated with the environment of the fluorescent probe which is used. The fluorescence of proteins is usually dominated by the contribution of tryptophan residues. A correlation of the tryptophan environment to the fluorescence properties of the protein is possible when the structure of the protein is known (Longworth, 1983) and there is just one tryptophan residue. The same is true for proteins containing several tryptophan residues if the fluorescence lifetimes of the individual residues are resolved. In the present study, the fluorescence properties of barnase, an extracellular ribonuclease from Bacillus amy- loliquefaciens, were determined by multifrequency phase fluorescence spectroscopy. The method relies on excitation
0006-2960/92/0431-7 11$03.00/0 0 1992 American Chemical Society
712 Biochemistry, Vol. 31, No. 3, 1992 Willaert et al.
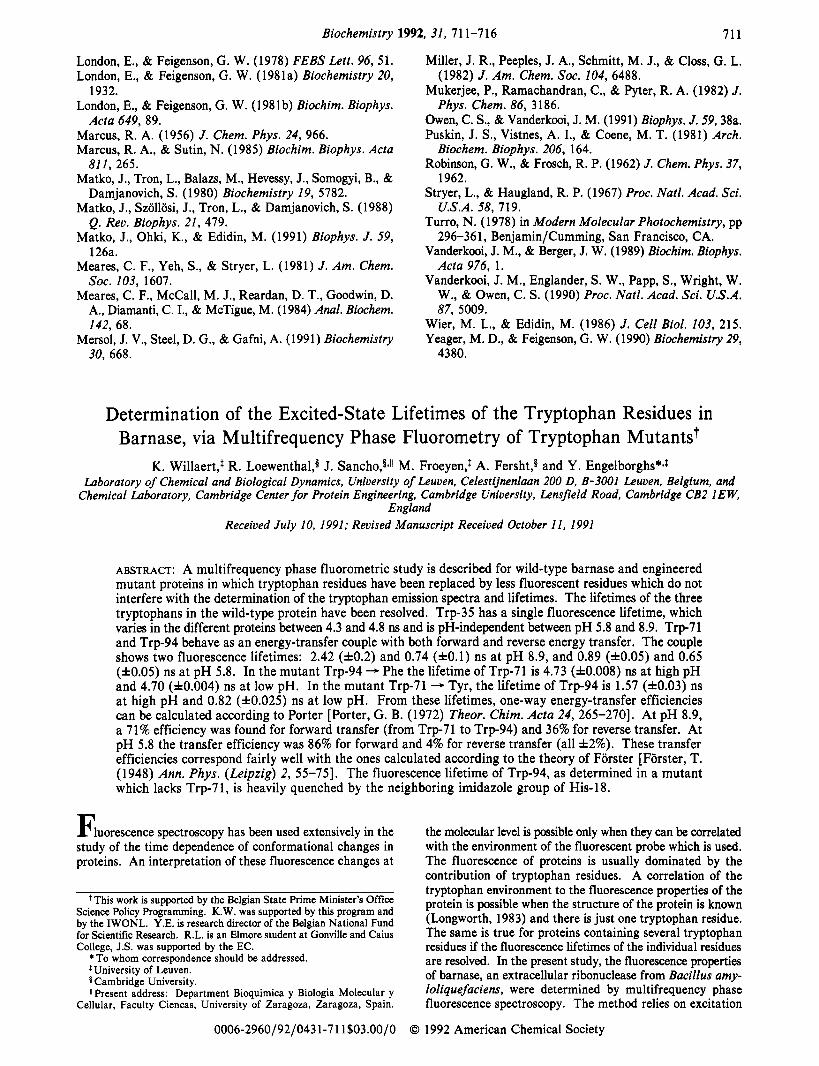
FIGURE 1: Projection of the three tryptophan residues of barnase in the plane containing their centers. The surface of a slice of the protein of thickness 6 A is projected in the same plane and is shown as dots.
with light the intensity of which is modulated sinusoidally. The fluorescence lifetimes can be calculated from the delay in phase and demodulation of the emitted light relative to the light used for excitation (Spencer & Weber, 1969). The lifetimes of individual tryptophans can be determined by applying the technique to wild-type enzyme and mutants lacking one or more of the tryptophans.
Barnase is a small, monomeric, single-domain enzyme formed by a five-stranded twisted antiparallel P-sheet and two major a-helices (residues 6-18 and 26-34), the first of which packs against the P-sheet (Mauguen et al., 1982). The three tryptophan residues in barnase are at positions 35,71, and 94 (Figure 1). Trp-35 is near the C-terminal end of the second a-helix and relatively far away (22-25 A) from the two other tryptophans. Trp-71 is in a hydrophobic region, at the be- ginning of the second strand of the P-sheet l l A away from Trp-94. Trp-94 lies at the beginning of the fourth strand of the P-sheet and is close to the imidazole ring of a histidine residue in position 18. Tryptophans 35 and 71 are almost completely unexposed to solvent. The exposure of Trp-94 is more pronounced.
In a previous study of steady-state fluorescence of barnase (Loewenthal et al., 1991), the spectrum was shown to be dominated by the contribution of Trp-35. The fluorescence intensity was found to be pH-dependent, following the ioni- zation curve of His-18 because of quenching of the fluorescence of Trp-94 by this residue. Three mutant proteins were made so that in each a single tryptophan residue was replaced by Phe or Tyr with negligible contribution to the protein fluorescence. An excited-state lifetime study using multifre- quency phase fluorometry of each of the four proteins is now performed. We show that the fluorescence lifetimes of the proteins can be resolved and, in most cases, unambiguously attributed to single tryptophan groups. The presence, and state of protonation, of the histidine residue at position 18 affects several of these fluorescence lifetimes. We also show that both forward and reverse energy transfer occurs between Trp-7 1 and Trp-94.
MATERIALS AND METHODS
Materials Tris [ tris( hydroxymethy1)aminomethanel and Bis-Tris
[ [ bis(2-hydroxyethy1)aminol tris(hydroxymethy1)methanel were analytical grade from Janssen Chimica (Beerse, Belgi- um). Scintillation grade 1,4-diphenylbenzene was obtained from Sigma. All other reagents were of analytical grade and were from either Sigma or Amersham.
Met hods Mutagenesis, Expression, and Purification of Proteins. The
mutagenesis of the wild-type barnase gene was described by Loewenthal et al. (1991). Purification of the proteins was performed as described (Serrano et al., 1990). Extinction coefficients of the native proteins were determined by the method of Gill and von Hippel (1989). Protein concentrations were determined from the UV absorbance at 280 nm and the appropriate extinction coefficients (Loewenthal et al., 1991). Protein solutions were prepared by overnight dialysis of a 30 pM protein stock solution in H 2 0 against 5 L of either (a) Tris-HC1, pH 8.87 (ionic strength 10 mM), or (b) Bis-Tris- HCl, pH 5.82 (ionic strength 10 mM). These pH values will be referred to as high and low pH, respectively. All mutant enzymes had activities within 50% of the wild-type barnase.
Multifrequency Phase Fluorometry. An automated la- ser-based multifrequency phase fluorometer was built for the determination of fluorescence lifetimes (Clays et al., 1989). The instrument is comparable to the one described by La- kowicz et al., (1986), except for the substitution of a high-gain photomultiplier in this study (Philips XP2233B) for a mi- crochannel plate in the latter. The value of the phase shift was measured five times to allow the standard deviation to be calculated. In this instrument, the phase shift can be measured with greater accuracy than the demodulation. We performed, therefore, for each protein, phase measurements at 50 different modulation frequencies between 0.4 and 200 MHz. Several statistical techniques were used in the data analysis. The mean, standard deviation, and percentage in the interval (-2, +2) of the weighted residuals were compared with the predicted values of 0, 1, and 95.5, respectively. An additional parameter reporting on the quality of the fit, the so-called Q value, was also calculated (Clays et al., 1989). The spreading of the weighted residuals and their autocorrelation function were used as final visual tests of the quality of the fitting. Data analysis was performed on a MicroVax 2000 minicomputer using a nonlinear least-squares algorithm (Bevington, 1969). We also performed global analysis, which has been reported to be helpful in the resolution of difficult systems with closely spaced lifetimes and/or small contributions of some components (Beechem et al., 1983). Phase data collected at a set of dif- ferent emission wavelengths were fitted using the modified Levenberg-Marquardt algorithm (More & Sorensen, 1983) assuming that the fluorescent lifetimes are independent of the wavelength. This procedure allows the recovery of the frac- tional intensities with good accuracy. Multiplying the steady-state fluorescence spectra with these fractional inten- sities allowed the construction of the decay-associated spectra.
Fluorescence Lifetime Measurements. Phase measurements were performed at 25 (fO.l) OC at two pH values (5.82 and 8.87), close to the two extremes of the fluorescence titration of barnase. The excitation wavelength was 295 nm to ensure that the recorded emission could be exclusively attributed to tryptophan residues. The emission was monitored from 320 to 380 nm. 1,4-diphenylbenzene in ethanol was used as a reference with a lifetime of 1.04 ns at 25 OC (Desie et al., 1986).
Calculation of the Absorption and Fluorescence Emission Spectra of the Individual Tryptophans. Absorption and corrected emission spectra were obtained on the Kontron
Lifetimes of Tryptophans in Barnase
spectrophotometer (Uvikon 8 10) and a Spex fluorimeter (Fluorolog 169 l) , respectively. The absorption spectrum of Trp-35 was determined by subtracting the spectrum of the mutant Trp-35 - Phe from that of the wild-type protein at an identical concentration (the contribution of Phe-35 to the absorption spectrum of Trp-35 - Phe was neglected). The spectrum of Trp7 1 was obtained by subtracting the spectrum of Trp-35 from that of the mutant Trp-94 - Phe. The ab- sorption spectrum of Trp-94 was determined from the dif- ference between the spectra of the mutant Trp-71 - Tyr and Trp-35 and was corrected for the contribution of the tyrosine residue (Wetlaufer, 1962).
The emission spectra of the individual indole groups were determined similarly from the emission spectra of wild-type and mutant proteins. The pKa of His-18, as determined by fluorescence, is 7.75 (Loewenthal et al., 1991). At pH 8.87, therefore, about 8% of His-18 is still protonated, and at pH 5.82 less than 1% of His-18 is unprotonated. The spectra at high pH are therefore corrected by subtraction of a contri- bution of 8% of the spectra of the same protein in acid medium.
Calculations of the Forster Energy Transfer. The distance at which 50% energy transfer occurs (& in cm) was calculated from (FBrster, 1948)
Ro6 = (8.8 x lo-25)(JADn-4KZ$D)6 (1)
Where JAD (in cm6 mol - ' ) is the overlap integral, calculated from the absorption and fluorescence emission spectra of the individual tryptophan groups according to the classical equation. The refractive index of the medium ( n ) was taken as 1.5 (Desie et al., 1986). The geometric orientation factor ( K ) has been calculated from
K2 = (cos 8, - 3 cos OD cos 8A)' (2)
where 8, is the angle between the emission dipole of the donor and the absorption dipole of the acceptor and BD and 8A are the angle between these dipoles and the vector joining the midpoints of the CE2/CD2 bond of the donor and the ac- ceptor, respectively. Indole has two excited states termed 'L, and 'Lb (Valeur & Weber, 1977). Since the absorption of indole in the region of 295 nm, where overlap with the emission spectra occurs, is mainly due to the 'La state, the 'Lb state was ignored in the calculation of the geometric orientation factors. The direction of transition moment of the 'La state was defined, according to Ichiye and Karplus (1983), as the line linking NE1 and a point one-fifth of the distance along the bond between the midpoints CE3 and CZ3.
The fluorescence quantum yield of the donor in the absence of acceptor r j ~ ~ was calculated from the determined lifetimes of the donors (in the absence of energy transfer) and the average natural lifetimes of 24 f 8 ns, obtained from 15 known pairs of quantum yields and lifetimes for tryptophan (Burstein et al., 1973). Finally, the efficiency of energy transfer (Ea) was calculted from
Biochemistry, Vol. 31, No. 3, 1992 713
(3)
When the acceptor is a fluorescent group identical or related to the donor, reverse transfer can occur. Porter (1972) worked out the coupled differential equations for this system and showed that the fluorescence decay is described by two life- times to which both the donor and the acceptor contribute. A similar calculation was done by Woolley et al. (1987) for intramolecular two-way energy transfer. The efficiencies of energy transfer in both directions can be calculated from the
wavelength (nm)
a , , a ? 0 9 0 6
I n 7 '
250 300 350 400 450 - wavelength (nm)
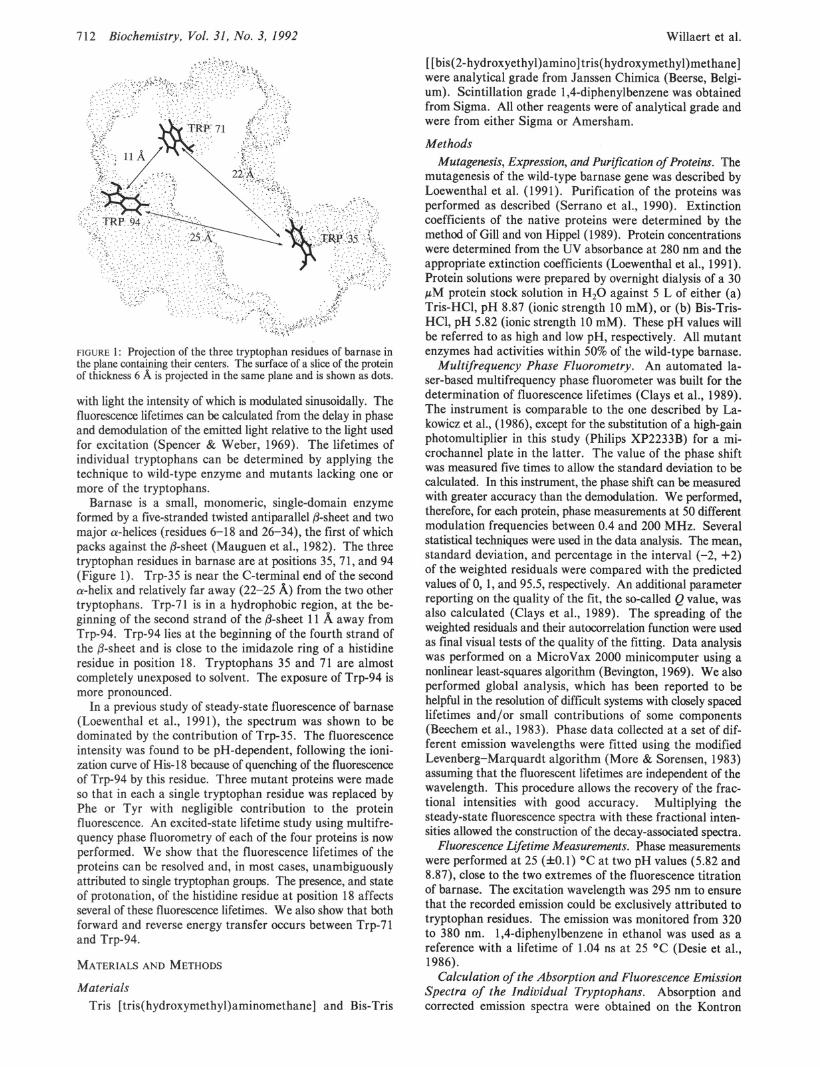
FIGURE 2: Absorption and emission spectra calculated for the in- dividual tryptophan residues, in the absence of energy transfer, at low pH (a, top) and high pH (b, bottom). The spectra are calculated by subtraction of different mutant spectra (see text).
lifetimes in the presence and absence of energy transfer, using the formulae 11 and 12 from Porter (1972):
(4) (AI - kl)(k, - A,)
(kl - k2) k12 =
and
(5)
where A1 (A,) is the inverse of the shortest (longest) lifetime observed in the presence of two-way energy tranfer, kl and k2 are the inverse lifetimes obtained in the absence of energy transfer, and kIz and kzl are the rate constants for forward and backward energy transfer. Efficiencies can then be cal- culated as follows:
and (6)
Whether kl is assigned the largest or smallest value, the calculated one-way efficiency is always the corresponding one.
RESULTS Absorption and Fluorescence Emission Spectra of the Three Tryptophan Residues
The calculated absorption spectra of the three tryptophan residues in barnase (Figure 2) show the typical three-peak structure of Trp absorption spectra (Valeur & Weber, 1977). The spectrum of Trp-94 is red-shifted with respect to the spectra of the two other tryptophan residues. The emission spectra of Trp-7 1 and Trp-94 (Figure 2) have been calculated from the emission spectra of proteins in which only one of the two residues was present and, therefore, represent the fluorescence emission spectra of these tryptophan residues in the absence of energy transfer between them (see below). Trp-71 shows the highest quantum yield and the most blue- shifted emission spectrum of the three tryptophan residues.
Elb = kI*/(kl + kI2) Ezb = k,l/(k* + kz1)
714 Biochemistry, Vol. 31, No. 3, 1992 Willaert et al.
L l K 0 0 P o 2 -lu 25
v) 2.7, I
I
1
I I 1 10 100 loo0
E -2.7 I 0.1
0.1 10 100 1 wo
FREQUENCY (MHz)
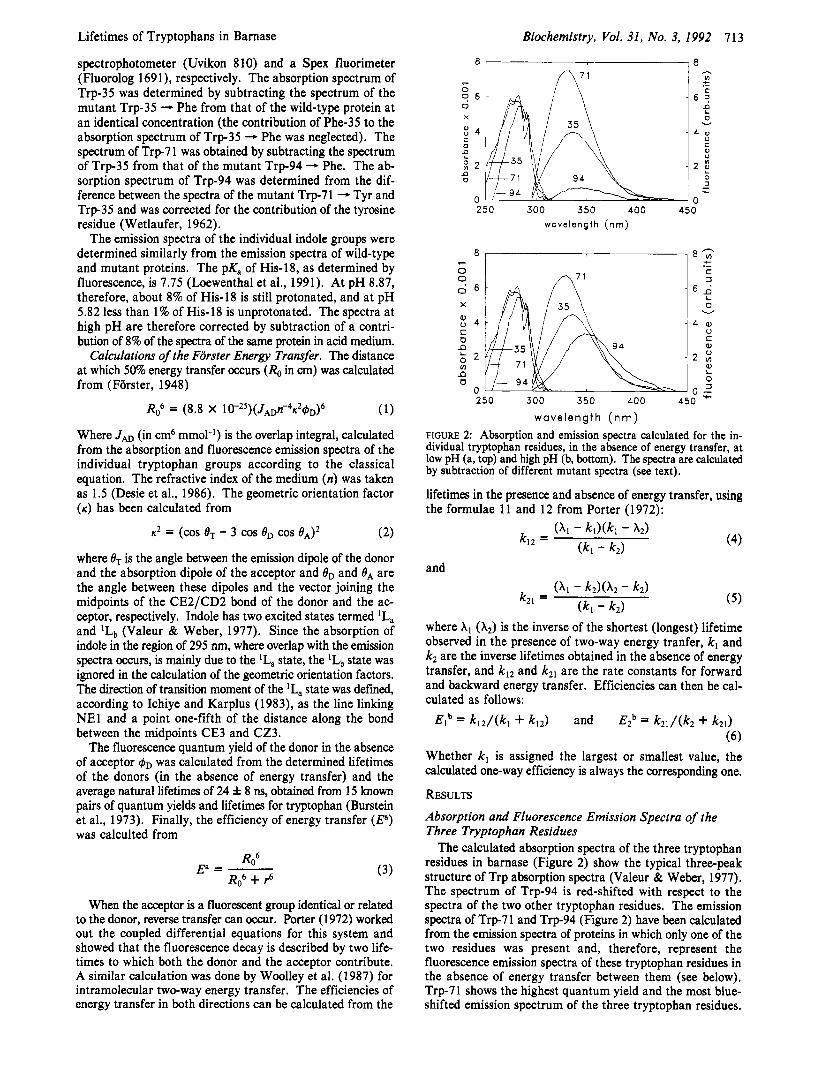
FIGURE 3: Phase measurement of wild-type bamase at pH 8.87 and graphical tests incorporated in the data analysis. (0) Phase angles versus frequency. (-) Fitted line for a sum of three exponentials. (Residuals) Plot of the weighted residuals as function of frequency. (Autocor.) Autocorrelation function of the weighted residuals. The resulting parameters are found in Table 11.
Trp-94 shows the lowest quantum yield and the most red- shifted spectrum at both low and high pH. Both the quantum yield and the wavelengths of maximum emission of Trp71 and Trp-35 are practically pH-independent. This does not apply to Trp94, which shows, at low pH, a lower quantum yield and a less red-shifted spectrum than at high pH.
Energy- Transfer Calculations Upper and lower limits of the overlap integrals were cal-
culated by assuming an absolute error of f l % in the molar absorptivity at the maximum of the absorbance spectra (Table I). The transfer efficiencies (Ea) were calculated using these overlap integrals and the other parameters shown in Table I. Our results indicate that there is energy transfer between Trp-71 and Trp-94. This energy-transfer process occurs in both directions, though it is greater from Trp-7 1 to Trp-94. The calculated one-way energy-transfer efficiencies are similar at high and low pH, except for the reverse transfer from Trp94 to Trp-71, which is of lower efficiency at low pH. Trp-35, however, is a lone tryptophan residue, not involved in energy transfer with the other two tryptophans. (The transfer effi- ciencies Eb were calculated from the lifetimes, as indicated above, and are discussed further on.)
Fluorescence Lifetimes Wild- Type Protein at High pH. A triple-exponential decay
fits best to the frequency dependence of the phase measure- ments at 340 nm (Figure 3). The calculated theoretical curve closely follows the experimentally measured phase shifts. The reduced x2 is near unity ( x ~ ~ = 0.73, ZXi = -2.37, and Q = 0.90). The weighted residuals do not show any systematic deviation. The autocorrelation function falls quickly to zero and remains close to it. However, the standard error estimates on the lifetimes are rather large ( T ~ = 5.16 f 1.40 ns, T~ = 3.15 f 1.09 ns, T~ = 1.01 f 0.25 ns). A global analysis on the emission data (see methods) gives good values for the reduced x2 and a better definition of the parameters (Table 11). The fractional intensities of the emitting species are retrieved with sufficient precision so that the emission spectra linked to the decay (DAS = decay associated spectra) can be obtained after multiplication of the obtained steady-state fractions by the total fluorescence intensity at each wavelength
Table I: Calculated Distances, (A) Overlap Integrals (X cm6 mmol-'), Donor Quantum Yields, Orientation Factors, Ro Values, and Calculated Transfer Efficiencies (Ea) for the Three Tryptophan Pairs in Barnase. at Low and High PH'
~~
tryptophan pairs 35+71 3 5 + 9 4 7 1 + 9 4 94-71
dist (A) 22.4 24.6 10.8 10.8 J A D low pH 0.2-0.98 0.5-1.2 0.6-1.5 0.004-0.6 J A D high pH 0.2-0.98 0.5-1.2 0.7-1.6 0.06-0.6 K2 0.17 1.21 1.73 1.73 '$D 10" PH 0.18 0.18 0.2 0.034 6~ high PH 0.18 0.18 0.2 0.065 Ro (A) low pH 6.9-8.9 11-13 12.5-14.5 4.4-9.3 I?,, (A) high pH 6.9-8.9 11-13 12.8-14.6 7.1-10.2 EB (%) low pH 0.09-0.4 0.5-2.0 70-85 0.5-29 Ea (46) high pH 0.09-0.4 0.5-2.0 73-86 7.2-41 Eb (5%) low pH 8 6 h 2 4 * 2 Eb (56) high pH 7 1 f 2 3 6 * 2 'Upper and lower limits are based on an absolute error of k l % of
the absorptivity at the maximum in the absorbance spectra. Eb is the transfer efficiency calculated from the observed lifetimes (see text).
200000
150000 ? 0 v
g 100000
P v1 Z
z 50000
0
I I I I I
I 0
0 . 0 0
8 I 8, - - -
320 340 360 380 400
WAVELENGTH (NM)
5oc I
I m I r - I 0 1
320 340 360 380 400
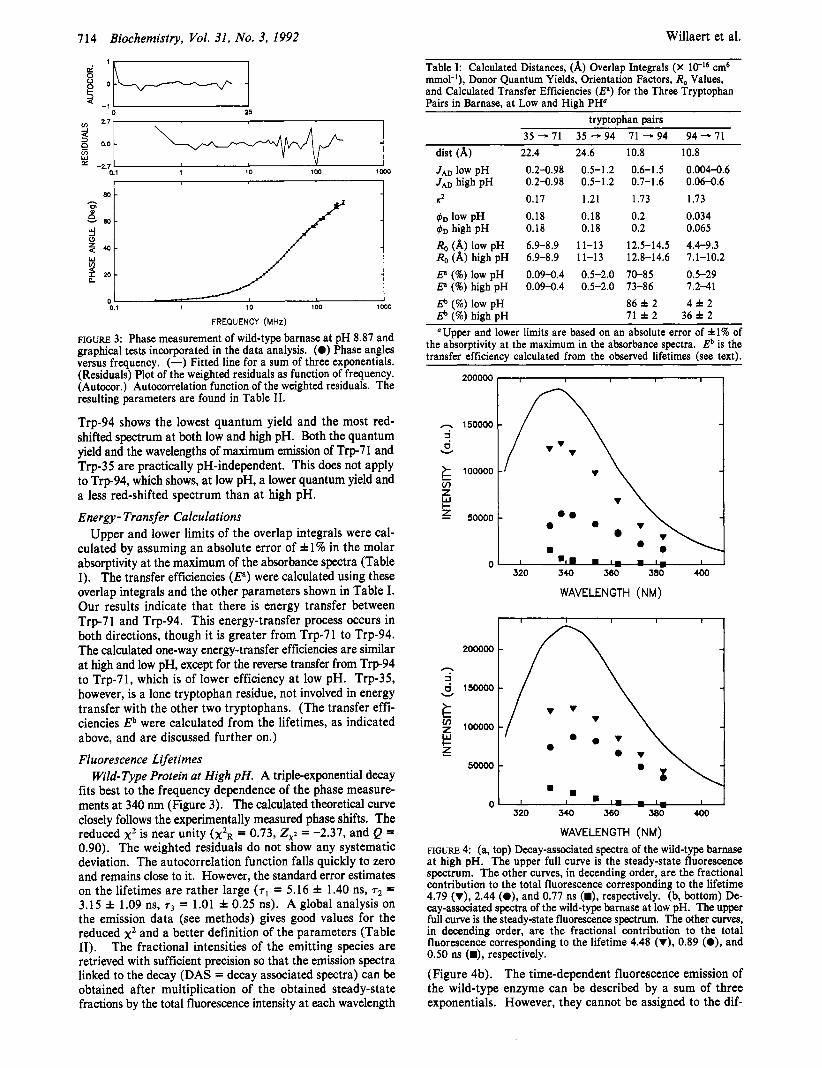
WAVELENGTH (NM) FIGURE 4: (a, top) Decay-associated spectra of the wild-type barnase at high pH. The upper full curve is the steady-state fluorescence spectrum. The other curves, in decending order, are the fractional contribution to the total fluorescence corresponding to the lifetime 4.79 (v), 2.44 (a), and 0.77 ns (m), respectively. (b, bottom) De- cay-associated spectra of the wild-type bamase at low pH. The upper full curve is the steady-state fluorescence spectrum. The other curves, in decending order, are the fractional contribution to the total fluorescence corresponding to the lifetime 4.48 (v), 0.89 (O), and 0.50 ns (B), respectively.
(Figure 4b). The time-dependent fluorescence emission of the wild-type enzyme can be described by a sum of three exponentials. However, they cannot be assigned to the dif-
Lifetimes of Tryptophans in Barnase Biochemistry, Vol. 31, No. 3, 1992 715
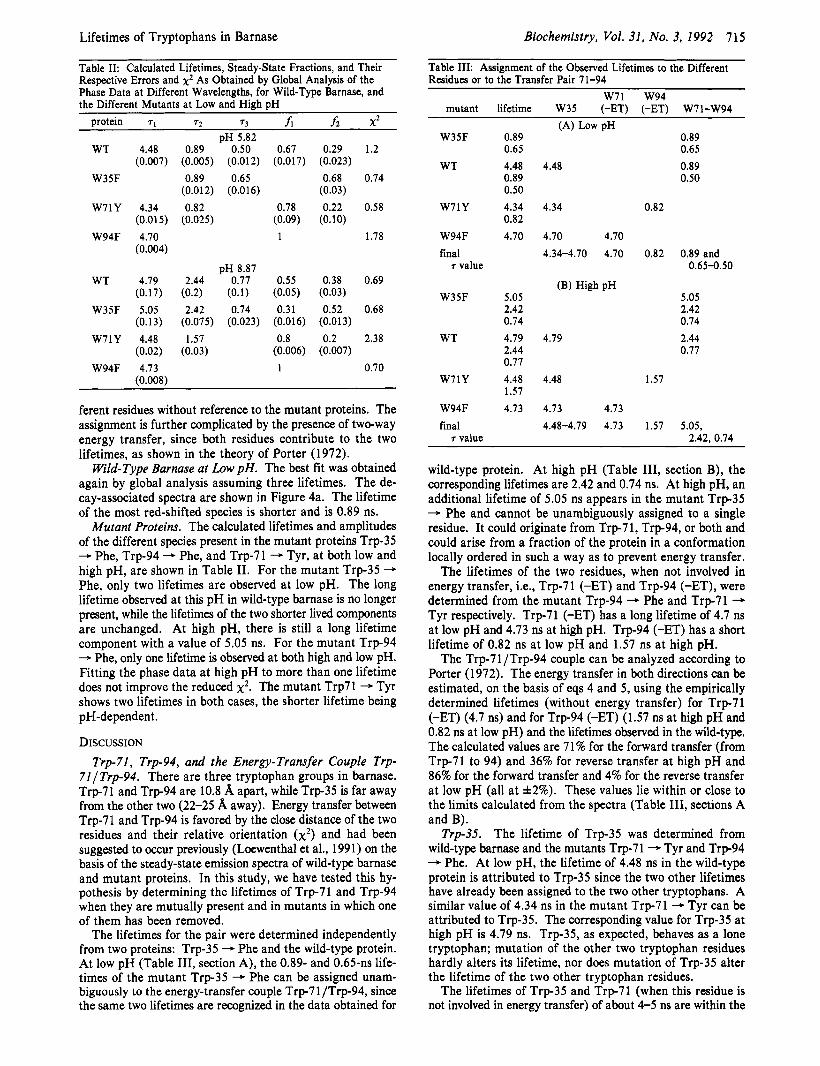
Table 11: Calculated Lifetimes, Steady-State Fractions, and Their Respective Errors and x2 As Obtained by Global Analysis of the Phase Data at Different Wavelengths, for Wild-Type Barnase, and the Different Mutants at Low and High pH
protein 7, 7 2 7 3 h f 2 x 2 pH 5.82
WT
W35F
W71Y
W94F
WT
W35F
W71Y
W94F
4.48 (0.007)
4.34
4.70 (0.004)
4.79 (0.17) 5.05
(0.13) 4.48
4.73 (0.008)
(0.015)
(0.02)
0.89 0.50 (0.005) (0.012) 0.89 0.65
(0.012) (0.016) 0.82
(0.025)
pH 8.87 2.44 0.77
2.42 0.74 (0.075) (0.023) 1.57
(0.03)
(0.2) (0.1)
0.67 (0.017)
0.78 (0.09)
1
0.55 (0.05) 0.31
(0.016) 0.8
(0.006) 1
0.29 (0.023) 0.68
(0.03) 0.22
(0.10)
0.38 (0.03) 0.52
(0.013) 0.2
(0.007)
1.2
0.74
0.58
1.78
0.69
0.68
2.38
0.70
ferent residues without reference to the mutant proteins. The assignment is further complicated by the presence of two-way energy transfer, since both residues contribute to the two lifetimes, as shown in the theory of Porter (1972).
Wild- Type Barnase at Low pH. The best fit was obtained again by global analysis assuming three lifetimes. The de- cay-associated spectra are shown in Figure 4a. The lifetime of the most red-shifted species is shorter and is 0.89 ns.
Mutant Proteins. The calculated lifetimes and amplitudes of the different species present in the mutant proteins Trp-35 - Phe, Trp-94 - Phe, and Trp-7 1 - Tyr, at both low and high pH, are shown in Table 11. For the mutant Trp-35 - Phe, only two lifetimes are observed at low pH. The long lifetime observed at this pH in wild-type barnase is no longer present, while the lifetimes of the two shorter lived components are unchanged. At high pH, there is still a long lifetime component with a value of 5.05 ns. For the mutant Trp-94 - Phe, only one lifetime is observed at both high and low pH. Fitting the phase data at high pH to more than one lifetime does not improve the reduced x2. The mutant Trp71 - Tyr shows two lifetimes in both cases, the shorter lifetime being pH-dependent . DISCUSSION
Trp-71, Trp-94, and the Energy-Transfer Couple Trp- 71/Trp-94. There are three tryptophan groups in barnase. Trp71 and Trp-94 are 10.8 A apart, while Trp35 is far away from the other two (22-25 A away). Energy transfer between Trp-71 and Trp-94 is favored by the close distance of the two residues and their relative orientation ( x 2 ) and had been suggested to occur previously (Loewenthal et al., 1991) on the basis of the steady-state emission spectra of wild-type barnase and mutant proteins. In this study, we have tested this hy- pothesis by determining the lifetimes of Trp-71 and Trp-94 when they are mutually present and in mutants in which one of them has been removed.
The lifetimes for the pair were determined independently from two proteins: Trp-35 - Phe and the wild-type protein. At low pH (Table 111, section A), the 0.89- and 0.65-ns life- times of the mutant Trp-35 - Phe can be assigned unam- biguously to the energy-transfer couple T r p 7 1 /Trp-94, since the same two lifetimes are recognized in the data obtained for
Table 111: Assignment of the Observed Lifetimes to the Different Residues or to the Transfer Pair 7 1-94
W71 W94 mutant lifetime W35 (-ET) (-ET) W11-W94
W35F
WT
W71Y
W94F final 7 value
W35F
WT
W71Y
W94F final
T value
(A) Low pH 0.89 0.65 4.48 4.48 0.89 0.50 4.34 4.34 0.82 4.70 4.70 4.70
4.34-4.70 4.70
(B) High pH 5.05 2.42 0.74 4.19 4.79 2.44 0.77 4.48 4.48 1.57 4.13 4.73 4.73
4.48-4.79 4.73
0.89 0.65 0.89 0.50
0.82
0.82 0.89 and 0.65-0.50
5.05 2.42 0.74 2.44 0.77
1.57
1.57 5.05, 2.42. 0.14
wild-type protein. At high pH (Table 111, section B), the corresponding lifetimes are 2.42 and 0.74 ns. At high pH, an additional lifetime of 5.05 ns appears in the mutant Trp-35 - Phe and cannot be unambiguously assigned to a single residue. It could originate from Trp71, Trp94, or both and could arise from a fraction of the protein in a conformation locally ordered in such a way as to prevent energy transfer.
The lifetimes of the two residues, when not involved in energy transfer, i.e., Trp-71 (-ET) and Trp-94 (-ET), were determined from the mutant Trp-94 - Phe and Trp-71 - Tyr respectively. Trp-71 (-ET) has a long lifetime of 4.7 ns at low pH and 4.73 ns at high pH. Trp94 (-ET) has a short lifetime of 0.82 ns at low pH and 1.57 ns at high pH.
The Trp-71/Trp-94 couple can be analyzed according to Porter (1972). The energy transfer in both directions can be estimated, on the basis of eqs 4 and 5, using the empirically determined lifetimes (without energy transfer) for Trp-7 1 (-ET) (4.7 ns) and for Trp-94 (-ET) (1.57 ns at high pH and 0.82 IIS at low pH) and the lifetimes observed in the wild-type. The calculated values are 7 1% for the forward transfer (from Trp-71 to 94) and 36% for reverse transfer at high pH and 86% for the forward transfer and 4% for the reverse transfer at low pH (all at f2%). These values lie within or close to the limits calculated from the spectra (Table 111, sections A and B).
Trp-35. The lifetime of Trp-35 was determined from wild-type bamase and the mutants Trp-7 1 - Tyr and Trp94 - Phe. At low pH, the lifetime of 4.48 ns in the wild-type protein is attributed to Trp-35 since the two other lifetimes have already been assigned to the two other tryptophans. A similar value of 4.34 ns in the mutant Trp-7 1 - Tyr can be attributed to Trp-35. The corresponding value for Trp-35 at high pH is 4.79 ns. Trp-35, as expected, behaves as a lone tryptophan; mutation of the other two tryptophan residues hardly alters its lifetime, nor does mutation of Trp-35 alter the lifetime of the two other tryptophan residues.
The lifetimes of Trp-35 and Trp-71 (when this residue is not involved in energy transfer) of about 4-5 ns are within the
716
range of lifetimes observed for tryptophan residues in proteins (Burnstein et al., 1973). The lifetime of Trp-94 is shorter, 0.8-1.6 ns, and is dependent on pH, indicating that this is a strongly quenched residue. In the crystal structure of bamase, Trp-94 is close to His-18. In a previous work (Loewenthal et al., 1991), the quantum yield of Trp-94 was shown to be lowered by His-18, the protonated form of this residue being the more efficient quenche;. The trajectory of a 120-ps mo- lecular dynamics simulation of barnase in water (Van Belle et al., 1989) shows that Trp94 and His-18 are often in close contact. The observatidns that the lifetime of Trp94 is halved at low pH while the lifetimes of the other two tryptophan residues are hardly changed strongly suggest that His- 18 is responsible for the short lifetime of Trp94. This is similar to other systems in which indole fluorescence is quenched by a neighboring histidine in a pH-dependent way (Sbinitzky & Goldman, 1967).
The spectral properties of the three tryptophan residues can be rationalized in terms of their environment in the barnase molecule. Trp-35 and Trp-71 are buried residues. The sol- vent-accessible areas for the indole rings, calculated with an analytical algorithm implemented in Brugel (Alard, 1991) are 10 and 7 A', respectively. Trp94 is a more exposed residue (58 A2 of exposed area). Accordingly, the maxima of emission of the three tryptophan residues (-ET) is progressively shifted to the red following the increase in solvent exposed area in the series Trp71, Trp-35, and Trp-94 (Figure 2a,b). Despite the fact that Trp35 and Trp71 (-ET) have a very similar lifetime, the fluorescence intensity of Trp-71 (-ET) is much higher than that of Trp-35, indicating that the latter may be decreased by static quenching.
Among the decay-associated spectra of the wild-type protein (Figure 4a,b), only the long lifetime spectrum can be assigned to Trp-35. The two other decay-associated spectra are asso- ciated with the transfer pair and contain contributions of both Trp-71 and Trp-94.
ACKNOWLEDGMENTS Calculations on the model were all done using Brugel in the
laboratory of Dr. S, Wodak, University of Brussels, who is gratefully acknowledged for making her computer facility available.
Biochemistry, Vol. 31, No. 3, 1992
Registry No. Trp, 73-22-3; barnase, 37300-74-6.
Willaert et al.
REFERENCES Alard, P. (1991) Ph.D. Thesis, Universite Libre de Bruxelles. Beechem, J. M., Knutson, J. R., Ross, J. €3. A., Tumer, B. W.,
Bevington, P. B. (1969) Data Reduction and Error Analysis
Burstein, E. A,, Vedenkina, N. S., & Ivkova, M. N. (1973)
Clays, K., Jannes, J., Engelborghs, Y., & Persoons, A. (1989)
Desie, G., Boens, N., & De Schryver, F. C. (1986) Biochem-
FBrster, T. (1948) Ann. Phys. (Leipzig) 2, 55-75. Gill, S. C., & Von Hippel, P. H. (1989) Anql. Biochem. 182,
Ichiye, T., & Karplus, M. (1983) Biochemistry 22,2884-2893. Lakowicz, J. R., Laczko, G., & Gryczynski, I. (1986) Rev.
Sci. Instrum. 57, 2499-2506. Loewenthal, R., Sancho, J., & Fersht, A. R. (1991) Bio-
chemistry 30, 6775-6779. Longworth, J. W. (1983) in Time-Resolved Fluorescence
Spectroscopy in Biochemistry and Biology (Cundall, R. B., & Dale, R. E., Eds.) pp 651-725, Nato AS1 Series Life Sciences 69, Plenum Press.
Mauguen, Y., Hartley, R. W., Dodson, E. J., Dodson, G. G., Bricogne, G., Chothia, C., & Jack, A. (1982) Nature 297, 162-164.
More, J. J., & Sorensen, D. C. (1983) SIAM J. Sci. Stat.
Porter, G. B. (1972) Theor. Chim. Acta 24, 265-270. Serrano, L., Horovitz, A., Avron, B., Bycroft, M., & Fersht,
Shinitzky, M., & Goldman, R. (1967) Eur. J. Biochem. 3,
Spencer, R. D., & Weber, G. (1969) Ann. N.Y. Acad. Sci.
Valeur, B., & Weber, G. (1977) Photochem. Photobiol. 25,
Van Belle, D., Provost, M., & Wodak, S. J. (1989) Chem. Scr.
Wetlaufer, D. B. (1962) Adu. Protein Chem. 17, 303-390. Woolley, P., Steinhauser, K. G., & Epe, P. (1987) Biophys.
& Brand, L. (1983) Biochemistry 22, 6054-6058.
for Physical Sciences, McGraw-Hill, New York.
Photochem. Photobiol. 18, 263-279.
J. Phys. E Sci. Instrum. 22, 297-305.
istry 25, 8301-8308.
319-326.
Comput. 4, 553-572.
A. R. (1990) Biochemistry 29, 9343-9352.
139-1 44.
158, 361-376.
441-444.
29A, 181-189.
Chem. 26, 367-374.
Copyright © 2022 FDOKUMEN