Decomposition of Protein Tryptophan Fluorescence Spectra into Log-Normal Components. II. The...
25
Decomposition of Protein Tryptophan Fluorescence Spectra into Log-Normal Components. II. The Statistical Proof of Discreteness of Tryptophan Classes in Proteins Yana K. Reshetnyak and Edward A. Burstein Institute of Theoretical and Experimental Biophysics, Russia Academy of Sciences, Pushchino, Moscow Region, Russia 142290 ABSTRACT The physical causes for wide variation of Stokes shift values in emission spectra of tryptophan fluorophores in proteins have been proposed in the model of discrete states (Burstein, E. A., N. S. Vedenkina, and M. N. Ivkova. 1973. Photochem. Photobiol. 18:263–279; Burstein, E. A. 1977a. Intrinsic Protein Luminescence (The Nature and Application). In Advances in Science and Technology (Itogi Nauki i Tekhniki), Biophysics Vol. 7. VINITI, Moscow [In Russian]; Burstein, E. A. 1983. Molecular Biology (Moscow) 17:455– 467 [In Russian; English translation]). It was assumed that the existence of the five most probable spectral classes of emitting tryptophan residues and differences among the classes were analyzed in terms of various combinations of specific and universal interactions of excited fluorophores with their environment. The develop- ment of stable algorithms of decomposition of tryptophan fluorescence spectra into log-normal components gave us an opportunity to apply two mathematically different algorithms, SImple fitting with Mean-Square criterion (SIMS) and PHase- plot-based REsolving with Quenchers (PHREQ) for the decomposition of a representative set of emission spectra of proteins. Here we present the results of decomposition of tryptophan emission spectra of .100 different proteins, some in various structural states (native and denatured, in complexes with ions or organic ligands, in various pH-induced conformations, etc.). Analysis of the histograms of occurrence of .300 spectral log-normal components with various maximum positions confirmed the statistical discreteness of several states of emitting tryptophan fluorophores in proteins. INTRODUCTION Tryptophan fluorescence is widely used to study the loca- tion, physical and dynamic properties of microenvironment of indole fluorophores, and the structural features and be- havior of the protein molecule as a whole (Burstein, 1976, 1977a, 1983; Lakowicz, 1983; Demchenko, 1986). Depend- ing on the environment of tryptophan residues in proteins, the maximum position (l m ) and quantum yield (q) of tryp- tophan fluorescence could vary widely, from 308 to 353 nm and from 0.4 to immeasurably low, respectively. In 1967 Konev put forward the hypothesis of the exis- tence of two main classes of tryptophan residues in proteins, which possess discrete values of fluorescent parameters l m and q (Konev, 1967; Volotovski and Konev, 1967). One of the classes included tryptophan fluorophores inside the pro- tein in a low-polar hydrophobic environment with a shorter- wavelength position of fluorescent maximum (l m of ;330 nm) and rather low quantum yield (0.04 to 0.07). The second class consisted of exposed tryptophan residues in a high-polar aqueous environment with long-wavelength po- sition of spectra (l m of ;350 nm) and quantum yield equal or higher than that of free aqueous tryptophan (;0.13– 0.17). This hypothesis had been based on the observation that protein spectrum shifts toward 350 –353 nm upon de- naturation by urea, and toward 330 –332 nm upon addition of anionic detergents in acidic solutions. However, this model could not explain the existence of proteins with a high quantum yield (for example, 0.20 – 0.27 for serum albumins (Longworth, 1971)) and intermediate spectral maximum positions (341.5 nm) for some single-tryptophan- containing proteins, such as human serum albumin (Ivkova et al., 1971). In 1973 one of us, with co-workers, revised and extended Konev’s hypothesis of discrete classes of tryptophan resi- dues in proteins and suggested a new model using some additional spectral parameters and approaches (Burstein et al., 1973). The spectral bandwidth at the half-maximal am- plitude Dl was taken as an additional parameter. The linear relationship was found between values of Dl and maximum position l m for tryptophan and other C-3-substituted indole derivatives in solvents of various polarities. These spectra could be regarded as a series of “elementary” components representing the emission bands of individual tryptophan residues in proteins. Existence of a spectral shift accompa- nying the quenching of protein fluorescence by ionic solutes (NO 3 2 ,I 2 , Cs 1 ) indicated the multicomponent character of a protein emission spectrum. It was demonstrated that the spectra of proteins, which are shifted upon quenching, pos- sess Dl values exceeding those of “elementary” compo- nents. The analysis of the differences between initial spectra of such proteins and those after 20% quenching revealed that the best-quenched components have the longest-wave- length position at ;340 nm in native proteins, which is ;10 nm shorter than that postulated in the two-state model. However, the tryptophans in proteins denatured by urea or guanidinium chloride have a spectrum with l m of ;350 nm. Received for publication 12 January 2001 and in final form 7 June 2001. Address reprint requests to (present address) Dr. Yana K. Reshetnyak, Department of Molecular Biology and Immunology, Institute for Cancer Research, University of North Texas Health Science Center, 3500 Camp Bowie Blvd., Fort Worth, TX 76107. Tel.: 817-735-5417; Fax: 817-735- 2133; E-mail: [email protected]. © 2001 by the Biophysical Society 0006-3495/01/09/1710/25 $2.00 1710 Biophysical Journal Volume 81 September 2001 1710 –1734
-
Upload
smansa-batam -
Category
Documents
-
view
1 -
download
0
Transcript of Decomposition of Protein Tryptophan Fluorescence Spectra into Log-Normal Components. II. The...

Decomposition of Protein Tryptophan Fluorescence Spectra intoLog-Normal Components. II. The Statistical Proof of Discreteness ofTryptophan Classes in Proteins
Yana K. Reshetnyak and Edward A. BursteinInstitute of Theoretical and Experimental Biophysics, Russia Academy of Sciences, Pushchino, Moscow Region, Russia 142290
ABSTRACT The physical causes for wide variation of Stokes shift values in emission spectra of tryptophan fluorophores inproteins have been proposed in the model of discrete states (Burstein, E. A., N. S. Vedenkina, and M. N. Ivkova. 1973.Photochem. Photobiol. 18:263–279; Burstein, E. A. 1977a. Intrinsic Protein Luminescence (The Nature and Application). InAdvances in Science and Technology (Itogi Nauki i Tekhniki), Biophysics Vol. 7. VINITI, Moscow [In Russian]; Burstein, E. A.1983. Molecular Biology (Moscow) 17:455–467 [In Russian; English translation]). It was assumed that the existence of the fivemost probable spectral classes of emitting tryptophan residues and differences among the classes were analyzed in termsof various combinations of specific and universal interactions of excited fluorophores with their environment. The develop-ment of stable algorithms of decomposition of tryptophan fluorescence spectra into log-normal components gave us anopportunity to apply two mathematically different algorithms, SImple fitting with Mean-Square criterion (SIMS) and PHase-plot-based REsolving with Quenchers (PHREQ) for the decomposition of a representative set of emission spectra of proteins.Here we present the results of decomposition of tryptophan emission spectra of .100 different proteins, some in variousstructural states (native and denatured, in complexes with ions or organic ligands, in various pH-induced conformations, etc.).Analysis of the histograms of occurrence of .300 spectral log-normal components with various maximum positionsconfirmed the statistical discreteness of several states of emitting tryptophan fluorophores in proteins.
INTRODUCTION
Tryptophan fluorescence is widely used to study the loca-tion, physical and dynamic properties of microenvironmentof indole fluorophores, and the structural features and be-havior of the protein molecule as a whole (Burstein, 1976,1977a, 1983; Lakowicz, 1983; Demchenko, 1986). Depend-ing on the environment of tryptophan residues in proteins,the maximum position (lm) and quantum yield (q) of tryp-tophan fluorescence could vary widely, from 308 to 353 nmand from 0.4 to immeasurably low, respectively.
In 1967 Konev put forward the hypothesis of the exis-tence of two main classes of tryptophan residues in proteins,which possess discrete values of fluorescent parameterslm
andq (Konev, 1967; Volotovski and Konev, 1967). One ofthe classes included tryptophan fluorophores inside the pro-tein in a low-polar hydrophobic environment with a shorter-wavelength position of fluorescent maximum (lm of ;330nm) and rather low quantum yield (0.04 to 0.07). Thesecond class consisted of exposed tryptophan residues in ahigh-polar aqueous environment with long-wavelength po-sition of spectra (lm of ;350 nm) and quantum yield equalor higher than that of free aqueous tryptophan (;0.13–0.17). This hypothesis had been based on the observationthat protein spectrum shifts toward 350–353 nm upon de-
naturation by urea, and toward 330–332 nm upon additionof anionic detergents in acidic solutions. However, thismodel could not explain the existence of proteins with ahigh quantum yield (for example, 0.20–0.27 for serumalbumins (Longworth, 1971)) and intermediate spectralmaximum positions (341.5 nm) for some single-tryptophan-containing proteins, such as human serum albumin (Ivkovaet al., 1971).
In 1973 one of us, with co-workers, revised and extendedKonev’s hypothesis of discrete classes of tryptophan resi-dues in proteins and suggested a new model using someadditional spectral parameters and approaches (Burstein etal., 1973). The spectral bandwidth at the half-maximal am-plitudeDl was taken as an additional parameter. The linearrelationship was found between values ofDl and maximumpositionlm for tryptophan and other C-3-substituted indolederivatives in solvents of various polarities. These spectracould be regarded as a series of “elementary” componentsrepresenting the emission bands of individual tryptophanresidues in proteins. Existence of a spectral shift accompa-nying the quenching of protein fluorescence by ionic solutes(NO3
2, I2, Cs1) indicated the multicomponent character ofa protein emission spectrum. It was demonstrated that thespectra of proteins, which are shifted upon quenching, pos-sessDl values exceeding those of “elementary” compo-nents. The analysis of the differences between initial spectraof such proteins and those after 20% quenching revealedthat the best-quenched components have the longest-wave-length position at;340 nm in native proteins, which is;10nm shorter than that postulated in the two-state model.However, the tryptophans in proteins denatured by urea orguanidinium chloride have a spectrum withlm of ;350 nm.
Received for publication 12 January 2001 and in final form 7 June 2001.
Address reprint requests to (present address) Dr. Yana K. Reshetnyak,Department of Molecular Biology and Immunology, Institute for CancerResearch, University of North Texas Health Science Center, 3500 CampBowie Blvd., Fort Worth, TX 76107. Tel.: 817-735-5417; Fax: 817-735-2133; E-mail: [email protected].
© 2001 by the Biophysical Society
0006-3495/01/09/1710/25 $2.00
1710 Biophysical Journal Volume 81 September 2001 1710–1734

These results allowed us to develop an extended model ofdiscrete states (classes) of tryptophan residues in proteins,which assumed the existence of five statistically most prob-able classes (Burstein et al., 1973; Burstein, 1977a, 1983).According to the model, the following discrete classes oftryptophan residues were predicted to be most probable inproteins (Burstein, 1977b, 1983):
1. Class A (lm 5 308 nm, structured spectra); the fluoro-phores, which do not form hydrogen-bound complexesin the excited state (exciplexes) (Hershberger et al.,1981) with solvent or neighboring protein groups;
2. Class S (lm 5 316 nm, structured spectra) includes theburied tryptophan residues that can form the exciplexeswith 1:1 stoichiometry;
3. Class I (lm 5 330–332 nm,Dl 5 48–50 nm) repre-sents the buried fluorophores that can form the exci-plexes with 2:1 stoichiometry;
4. Class II (lm 5 340–342 nm,Dl 5 53–55 nm) repre-sents the fluorophores exposed to the bound waterpossessing very long dipole relaxation time, which pre-cludes completing the relaxation-induced spectral shiftduring the excited-state lifetime;
5. Class III (lm 5 350–353 nm,Dl 5 59–61 nm) con-tains rather fully exposed fluorophores surrounded byhighly mobile water completely relaxing during theexcitation lifetime, which makes their spectra almostcoinciding with those of free aqueous tryptophan.
At that time, there was constructed and used the calibrateddiagramDl versuslm for estimating the contributions ofthree most frequent model classes (I, II, and III) of trypto-phan residues in the fluorescence spectrum of a protein(Burstein et al., 1973). The application of this hypothesiswas rather effective in the interpretation of protein trypto-phan fluorescence data in various biophysical and molecu-lar-biology studies. However, the idea of the existing ofdiscrete classes of tryptophans in proteins was based on theanalysis of very limited numbers of proteins. Now it seemsreasonable to reappraise the hypothesis of discrete statesapplying more recent analytic and computing methods tothe wide statistical database of protein spectra.
Such a reappraisal is possible now due to progress inprotein preparation techniques and methods of componentanalysis of protein emission spectra. It was shown that thefluorescence spectra of tryptophan and its derivatives maybe accurately described analytically by a log-normal func-tion (Burstein, 1976), proposed initially for the absorptionspectra by Siano and Metzler (1969). Thereupon, it wasfound that the shape of the emission spectra of tryptophanboth in solutions and in a protein depends only on thespectral maximum positionlm in a known manner (Bursteinand Emelyanenko, 1996). This fact allowed us to developeffective algorithms of reliable decomposition of tryptophanfluorescence spectra of proteins into individual “elementa-
ry” log-normal components (Abornev and Burstein, 1992;Burstein et al., 2001).
Here we present the results of such decomposition oftryptophan emission spectra of.100 different proteins,some in various structural states (native and denatured, incomplexes with ions or organic ligands, in various pH-induced conformations, etc.). The database of obtained log-normal components allowed us to check the hypothesis ofthe discrete classes of tryptophan residues on the basis of arepresentative set of proteins. Analysis of the histograms ofoccurrence of spectral components with various maximumpositions confirmed the statistical discreteness of severalstates of emitting tryptophan fluorophores in proteins. Thediscrete classes observed here are similar to those proposedin the model of discrete states in 1973–1977.
MATERIALS AND METHODS
Fluorescence spectra
The large majority of protein fluorescence spectra used in this work andlisted in Table 1 were taken from the archive of experimental data of theLaboratory of Functional Biophysics of Proteins (Institute of Theoreticaland Experimental Biophysics of the Russia Academy of Sciences). Thespectra have been published and/or analyzed in various special publicationscited in the column “References.” These publications also contain the dataabout protein preparations and techniques of fluorescence measurements. Ifthe spectra were measured elsewhere and given to us, they were recorrectedfor instrument spectral sensitivity curves using the emission spectra ofaqueous tryptophan solution as a standard. Such a recorrection was nec-essary because the component analysis algorithms were developed basedon the model spectra measured with our lab-made instrument (Burstein etal., 1973; Bukolova-Orlova et al., 1974) with a carefully estimated spectralsensitivity curve (Burstein and Emelyanenko, 1996).
The preparations of wheat germ agglutinin, inorganic pyrophosphatase(pyrophosphate phosphohydrolase) from baker’s yeast, monellin fromDi-oscoreophyllum cummensiifruits, Escherichia colialkaline phosphatase,and subtilisin BPN9 produced by Sigma (St. Louis, MO) were kindly givento us by Dr. J. Borejdo (University of North Texas Health Science Center,Fort Worth, TX). Human and bovine carbonic anhydrases II, staphylococ-cal serine protease, and subtilisin Carlsberg (Sigma) were a kind gift fromDr. S. S. Lehrer (Boston Biomedical Research Institute, Boston, MA). Thepreparation of bovine carboxypeptidase A was from Reanal (Hungary).The yeast 3-phosphoglycerate kinase was from Sigma. Porcine pancreaticlipase was from Serva. Hen egg white ovalbumin was from Reakhim(Olaine, Latvia). Actin from dog heart was prepared by one of us (Ya.K. R.) according to Pardee and Spudich (1982).
Fluorescence measurements
Fluorescence spectra of the several proteins marked in Table 1 (in the“References” column) as “Present work” were measured by us during thelast six years. Acrylamide, KCl, KI, CsCl, Tris, and ATP preparations usedin these experiments were ultra-pure grade of Russian or Soviet productionor Sigma.
Steady-state emission spectra were recorded on the lab-made spec-trofluorimeter (Burstein et al., 1973; Bukolova-Orlova et al., 1974) withcollection of emitted light from the cell front face, that allowed applicationof the strict correction function for screening and reabsorption inner filtereffects (Burstein, 1968). The fluorescence was excited with the mercury
Discrete States of Tryptophan Residues 1711
Biophysical Journal 81(3) 1710–1734

TA
BLE
1T
helis
to
fst
udie
dp
rote
ins,
thei
rco
nven
tio
nalc
od
ena
me,
cont
ent
of
tryp
top
han
resi
due
s,an
dre
fere
nces
cont
aini
ngth
ein
form
atio
nab
out
the
fluo
resc
ence
spec
tra
used
here
for
dec
om
po
siti
on
into
log
-no
rmal
com
po
nent
s
No.
Pro
tein
Nam
ean
dC
ondi
tions
Pro
tein
Cod
esN
o.of
Trp
sR
efer
ence
s
1A
cety
lcho
line
este
rase
(bov
ine
brai
n);
pH4.
9,pH
9.2
AC
H14
Bur
stei
net
al.,
1973
2F
-act
in(d
oghe
art
mus
cle)
;pH
7.5
AC
D.F
4P
rese
ntw
ork
3G
-act
in(d
oghe
art
mus
cle)
;pH
7.4
AC
D.G
4P
rese
ntw
ork
4F
-act
in,
(rab
bit
skel
etal
mus
cle)
;pH
7.8
AC
R.F
4B
urst
ein
etal
.,19
73;
Bur
stei
n,19
77a
5F
-act
in,
(ra
bb
itsk
ele
talm
usc
le);8
Mur
eaA
CR
.F.U
R4
Ved
enki
naet
al.,
1968
6G
-act
in,
(rab
bit
skel
etal
mus
cle)
;2
mM
AT
P,
2m
MC
aCl
2,
pH8.
0A
CR
.G4
Ved
enki
naet
al.,
1968
7A
ctom
yosi
n(r
abbi
tsk
elet
alm
uscl
e);
0.4–
0.5
MK
Cl
AC
M24
Bur
stei
net
al.,
1973
;B
urst
ein,
1977
a;V
eden
kina
etal
.,19
688
Act
om
yosi
n(r
ab
bit
ske
leta
lm
usc
le);8
Mur
eaA
CM
.UR
24B
urst
ein
etal
.,19
73;
Bur
stei
n,19
77a;
Ved
enki
naet
al.,
1968
9A
min
oacy
lase
-I(p
orci
neki
dney
s);
pH7.
5A
CY
8A
born
ev,
1993
10A
gglu
tinin
(whe
atge
rm);
pH7.
3A
WG
3P
rese
ntw
ork
11a
-1-A
ntitr
ypsi
n(h
uman
);pH
7.2
A1A
T2
Per
mya
kov
and
Dei
kus,
1995
12S
erum
albu
min
(bov
ine)
F-f
orm
;pH
3.0
AS
B.F
2B
urst
ein
etal
.,19
73;
Bur
stei
n,19
77a;
Ivko
vaet
al.,
1971
13S
erum
albu
min
(bov
ine)
N-f
orm
;pH
5.7–
6.0
AS
B.N
2B
urst
ein
etal
.,19
73;
Bur
stei
n,19
77a;
Ivko
vaet
al.,
1971
14S
erum
albu
min
(bov
ine)
N-f
orm
;0.
5M
isob
utan
ol,
pH5.
7A
SB
.N.IB
2B
urst
ein
etal
.,19
73;
Bur
stei
n,19
77a;
Ivko
vaet
al.,
1971
15S
erum
albu
min
(hum
an)
F-f
orm
;pH
3.1
AS
H.F
1B
urst
ein
etal
.,19
73;
Bur
stei
n,19
77a;
Ivko
vaet
al.,
1971
;N
yam
aaet
al.,
1985
16S
erum
albu
min
(hum
an)
N-f
orm
;pH
5.5
AS
H.N
1B
urst
ein
etal
.,19
73;
Bur
stei
n,19
77a;
Ivko
vaet
al.,
1971
;N
yam
aaet
al.,
1985
17S
erum
albu
min
(hum
an)
N-f
orm
;0.
5M
isob
utan
ol,
pH5.
5A
SH
.N.IB
1B
urst
ein
etal
.,19
73;
Bur
stei
n,19
77a;
Ivko
vaet
al.,
1971
18S
eru
ma
lbu
min
(hu
ma
n);4
.5an
d9
Mur
eaA
SH
.UR
1B
urst
ein
etal
.,19
73;
Bur
stei
n,19
77a;
Ivko
vaet
al.,
1971
19A
lcoh
olde
hydr
ogen
ase
(yea
st);
pH7.
5A
DY
2A
born
ev,
1993
20A
min
oacy
l-tR
NA
-syn
thas
e,tr
ypto
phan
yl,
A2
and
K2
form
s(
E.
coli)
AT
RN
.TR
PA
2-K
22
Bur
stei
net
al.,
1973
;V
eden
kina
and
Bur
stei
n,19
7021
Am
inoa
cyl-t
RN
A-s
ynth
ase,
tryp
toph
anyl
,E
11
E2
form
(E.
coli)
AT
RN
.TR
PE
11E
22
Bur
stei
net
al.,
1973
;V
eden
kina
and
Bur
stei
n,19
7022
Am
ino
acy
l-tR
NA
-syn
tha
se,
tryp
top
ha
nyl
,E
11
E2
form
(E.
coli)
;8M
urea
AT
RN
.TR
PU
R2
Bur
stei
net
al.,
1973
;V
eden
kina
and
Bur
stei
n,19
7023
Am
inoa
cyl-t
RN
A-s
ynth
ase,
tyro
syl(
bovi
neliv
er)
dim
er2
340
kDa;
pH7.
5A
TR
N.T
YR
.40
Klim
enko
etal
.,19
9124
Am
inoa
cyl-t
RN
A-s
ynth
ase.
tyro
syl(
bovi
neliv
er)
dim
er2
359
kDa;
pH7.
6A
TR
N.T
YR
.59
233
Klim
enko
etal
.,19
9125
a-A
myl
ase
(Asp
erg
illu
so
ryza
e);pH
7.5
AM
Y10
Abo
rnev
,19
9326
Ann
exin
VI*
(hum
an);
pH7.
0A
X6
10A
born
ev,
1993
27L-A
spar
agin
ase
(E.
coli
B);
pH4.
3A
SP
.AC
1B
urst
ein,
1977
a,b;
Bur
stei
n,19
8328
L-A
spar
agin
ase;
(E.
coli
B);
pH7.
8–8.
0,29
3K
and
77K
AS
P.N
1B
urst
ein,
1977
a,b;
Bur
stei
n,19
8329
Azu
rin,
(Pse
ud
om
on
as
ae
rug
ino
sa),ho
lo-f
orm
;77
KA
ZU
1B
urst
ein
etal
.,19
7730
Cal
cium
-bin
ding
prot
ein†(A
sta
cus
lep
tod
act
ylu
ssarc
opla
smic
retic
ulum
);pH
6.0,
pH8.
2C
BC
2V
.I.
Em
elya
nenk
o(t
his
lab)
31C
alde
smon
(chi
cken
gizz
ard)
;pH
7.4
CD
S5
Czu
rylo
etal
.,19
9132
Ca
lde
smo
n(c
hic
ken
giz
zard
),fr
ag
me
nt
25kD
aC
DS
.25
Czu
rylo
etal
.,19
9133
Cal
desm
on(c
hick
engi
zzar
d),
frag
men
t25
kDa
1ca
lmod
ulin
CD
S.2
5.C
AM
Czu
rylo
etal
.,19
9134
Car
boni
can
hydr
ase-
II(b
ovin
e);
pH7.
3C
AB
7P
rese
ntw
ork
35C
arbo
nic
anhy
dras
eII
(hum
an);
pH7.
3C
AH
7P
rese
ntw
ork
36C
arbo
xype
ptid
ase
A(b
ovin
e);1
MK
Cl,
pH7.
3C
PA
8P
rese
ntw
ork
37a
-Chy
mot
ryps
in(b
ovin
e);
inw
ater
;pH
7.3–
7.8,
pH5.
3C
HT
8B
urst
ein
etal
.,19
73;
Bur
stei
n,19
77a;
Ivko
vaet
al.,
1968
;R
eshe
tnya
kan
dB
urst
ein,
1997
b38
a-C
hym
otr
ypsi
n(b
ovi
ne
)in
35
%d
ioxa
ne
CH
T.D
35
8B
urst
ein
etal
.,19
73;
Bur
stei
n,19
77a;
Ivko
vaet
al.,
1968
39a
-Ch
ymo
tryp
sin
(bo
vin
e)
in6
0–
80
%d
ioxa
ne
CH
T.D
60
-80
8B
urst
ein
etal
.,19
73;
Bur
stei
n,19
77a;
Ivko
vaet
al.,
1968

No.
Pro
tein
Nam
ean
dC
ondi
tions
Pro
tein
Cod
esN
o.of
Trp
sR
efer
ence
s
40C
hym
otry
psin
ogen
A(b
ovin
e);
inw
ater
;pH
7.5
and
pH8.
6C
HG
8B
urst
ein
etal
.,19
73;
Bur
stei
n,19
77a;
Ivko
vaet
al.,
1968
;R
eshe
tnya
kan
dB
urst
ein,
1997
b41
Ch
ymo
tryp
sin
og
en
A(b
ovi
ne
)in
35
%d
ioxa
ne
CH
G.D
35
8B
urst
ein
etal
.,19
73;
Bur
stei
n,19
77a;
Ivko
vaet
al.,
1968
42C
hym
otr
ypsi
no
ge
nA
(bo
vin
e)
in6
0–
70
%d
ioxa
ne
CH
G.D
60
-70
8B
urst
ein
etal
.,19
73;
Bur
stei
n,19
77a;
Ivko
vaet
al.,
1968
43C
hym
otr
ypsi
no
ge
nA
(bo
vin
e);8
Mur
eaC
HG
.UR
8B
urst
ein
etal
.,19
73;
Bur
stei
n,19
77a;
Ivko
vaet
al.,
1968
44C
reat
ine
phos
phok
inas
e(r
abbi
tsk
elet
alm
uscl
e);
pH6.
0C
RK
23
4B
urst
ein
etal
.,19
73;
Bur
stei
n,19
77a
45E
last
ase
(hum
anne
utro
phils
)E
NH
3M
ely
etal
.,19
9746
Fib
rinog
en‡
(bov
ine)
,fr
agm
ent
E;
pH7.
5F
GE
V.
I.E
mel
yane
nko
(thi
sla
b)47
Fib
rone
ctin
;pH
8.0
FB
N39
Kot
elia
nsky
etal
.,19
8148
Fila
min
(hum
an);
pH7.
8F
IL17
Kot
elia
nsky
etal
.,19
8249
Glu
cago
nG
LG1
Aba
bou,
1998
50G
lyce
rald
ehyd
e-3-
phos
phat
ede
hydr
ogen
ase,
apo-
and
holo
-for
ms
(por
cine
skel
etal
mus
cle)
;A
TP
,pH
7.5,
pH8.
5G
PD
3B
urst
ein
etal
.,19
73;
Bur
stei
n,19
77a;
Ved
enki
naan
dB
urst
ein,
1970
51P
rote
inG
(Str
ep
toco
ccu
ssp.
)G
PS
1A
babo
u,19
9852
He
mo
glo
bin§
(hu
ma
n),
a-c
ha
ins,
red
uce
da
nd
carb
oxy
me
thyl
ate
d;
pH7.
5H
BA
.CM
3A
born
ev,
1993
53Im
mun
oglo
bulin
G(b
ovin
e);
pH6.
6IG
GB
urst
ein
etal
.,19
73;
Bur
stei
n,19
77a;
Sha
nin
etal
.,19
6854
Imm
un
og
lob
ulin
G(b
ovi
ne
);8M
urea
IGG
.UR
Bur
stei
net
al.,
1973
;B
urst
ein,
1977
a;S
hani
net
al.,
1968
55In
orga
nic
pyro
phos
phat
ase
(bak
er’s
yeas
t);
pH7.
3IO
P6
Pre
sent
wor
k56
a-L
acta
lbum
in(c
owm
ilk);
1m
MC
aCl
2,
pH7.
4LA
B4
Per
mya
kov
etal
.,19
8557
a-L
acta
lbum
in(h
uman
milk
);1
mM
CaC
l2,
pH7.
4LA
H3
Per
mya
kov
etal
.,19
9158
b-L
acto
glob
ulin
(cow
milk
);pH
2.4,
pH4.
6LG
B.A
C2
Bur
stei
net
al.,
1973
;B
urst
ein,
1977
a;K
apla
nas
etal
.,19
73,
1975
59b
-Lac
togl
obul
in(c
owm
ilk);
pH6.
4LG
B.N
2B
urst
ein
etal
.,19
73;
Bur
stei
n,19
77a;
Kap
lana
set
al.,
1973
,19
7560
b-L
acto
glob
ulin
(cow
milk
);pH
8.1
LGB
.AL
2B
urst
ein
etal
.,19
73;
Bur
stei
n,19
77a;
Kap
lana
set
al.,
1975
61b
-Lac
togl
obul
in¶(B
actr
ian
cam
elm
ilk);
0.01
Mgl
ycin
,pH
2.0–
3.0
LGC
.AC
3A
born
ev,
1993
62b
-Lac
togl
obul
in¶(B
actr
ian
cam
elm
ilk);
pH7.
0LG
C.N
3A
born
ev,
1993
63Li
pase
(por
cine
panc
reas
);pH
7.4
LPP
6P
rese
ntw
ork
64Li
pase
(whe
atge
rm);
pH7.
5LW
GA
born
ev,
1993
65Ly
sozy
me
(hen
egg
whi
te);
HC
l,pH
2.2;
glyc
in,
pH3.
5LZ
C.A
C6
Bur
stei
net
al.,
1973
;B
urst
ein,
1977
a66
Lyso
zym
e(h
eneg
gw
hite
);pH
7.4–
7.8
LZC
.N6
Bur
stei
net
al.,
1973
;B
urst
ein,
1977
a67
Lys
ozy
me
(he
ne
gg
wh
ite);8
Mur
ea,
pH2.
6,pH
8.0
LZ
C.U
R6
Bur
stei
net
al.,
1973
;B
urst
ein,
1977
a68
Mas
topa
ran
(was
pve
nom
)M
SP
1A
babo
u,19
9869
Mel
ittin
,\m
onom
er(A
pis
me
llife
rave
nom
);w
ater
MLT
.MO
N1
Per
mya
kov
and
Dei
kus,
1995
;R
eshe
tnya
kan
dB
urst
ein,
1997
a70
Mel
ittin
,\te
tram
er(A
pis
me
llife
rave
nom
);1.
5–1.
6M
KC
l,pH
7.4
MLT
.TE
TR
431
Per
mya
kov
and
Dei
kus,
1995
;R
eshe
tnya
kan
dB
urst
ein,
1997
a71
Mel
ittin
,\(A
pis
me
llife
rave
nom
)1ca
lmod
ulin
1C
aCl 2,
pH7.
5M
LT.C
AM
1or 43
1P
erm
yako
van
dD
eiku
s,19
95
72M
elitt
in,
mon
omer
(Ap
ism
elli
fera
veno
m)
with
lipos
omes;
2M
NaC
lM
LT.L
S1
Lado
khin
,19
9073
H-m
erom
yosi
n(r
abbi
tsm
ooth
mus
cle)
HM
M11
Vis
hnev
skay
aet
al.,
1976
74L-
mer
omyo
sin,
frac
tion
1,LM
M59
and
LMM
77(r
abbi
tsk
elet
alm
uscl
e)LM
M2
Vis
hnev
skay
aet
al.,
1976
;Z
hou
etal
.,19
9875
Mon
ellin
(Dio
sco
reo
ph
yllu
mcu
mm
en
sii
);pH
7.3
MO
N1
Pre
sent
wor
k76
Myo
glob
in**
(bea
ver
hear
t),
apo-
form
;pH
7.5
MG
B.A
PO
2A
born
ev,
1993
77M
yosi
n(r
abbi
tsk
elet
alm
uscl
e);
0.5
MK
Cl
MS
S20
Bur
stei
net
al.,
1973
;B
urst
ein,
1977
a78
Myo
sin
(ra
bb
itsk
ele
talm
usc
le);8
Mur
ea,
pH7.
8M
SS
.UR
20B
urst
ein
etal
.,19
73;
Bur
stei
n,19
77a
79M
yosi
nsu
bfra
gmen
t1††
(rab
bit
skel
etal
mus
cle)
;50
mM
KC
l,1
mM
MgC
l 2,
pH7.
5M
S1
5R
eshe
tnya
ket
al.,
2000
80M
yosi
nsu
bfra
gmen
t1††
(ske
leta
lmus
cle,
rabb
it);
50m
MK
Cl,
1m
MM
gCl 2
,0.
2m
MA
TP
,pH
7.5
MS
1.A
TP
5R
eshe
tnya
ket
al.,
2000
Biophysical Journal 81(3) 1710–1734

No.
Pro
tein
Nam
ean
dC
ondi
tions
Pro
tein
Cod
esN
o.of
Trp
sR
efer
ence
s
81N
euro
toxi
nI
(cob
raN
aja
na
jao
xia
nav
enom
);pH
4.6–
6.0
NO
12
Buk
olov
a-O
rlova
etal
.,19
74;
Buk
olov
a-O
rlova
etal
.,19
7682
Neu
roto
xin
II(c
obra
Na
jan
aja
oxi
an
aven
om);
pH6.
0N
O2
2B
ukol
ova-
Orlo
vaet
al.,
1974
;B
ukol
ova-
Orlo
vaet
al.,
1976
83N
ucle
ase
(Sta
ph
ylo
cocc
us
au
reu
s);
pH7.
5N
ST
1A
babo
u,19
9884
Nuc
leos
ide
diph
osph
ate
kina
sea‡
‡(r
at,
reco
mbi
nant
);pH
7.7–
9.3
ND
PK
.A.8
3Trp
1T
yrO
2
Orlo
vet
al.,
1997
;O
rlov
etal
.,19
99
85N
ucle
osid
edi
phos
phat
eki
nasea
‡‡
(rat
,re
com
bina
nt);
pH4.
0–5.
5N
DP
K.A
.5.L
IS3
Orlo
vet
al.,
1997
;O
rlov
etal
.,19
9986
Nuc
leos
ide
diph
osph
ate
kina
se a‡
‡(r
at,
reco
mbi
nant
);0.
5–1.
0M
KC
l,pH
4.0–
5.5
ND
PK
.A.5
.HIS
3O
rlov
etal
.,19
97;
Orlo
vet
al.,
1999
87N
ucle
osid
edi
phos
phat
eki
nase b
‡‡
(rat
,re
com
bina
nt);
pH7.
5–9.
5N
DP
K.B
.83
Orlo
vet
al.,
1997
;O
rlov
etal
.,19
9988
Nuc
leos
ide
diph
osph
ate
kina
se b‡
‡(r
at,
reco
mbi
nant
);pH
4.5–
5.2
ND
PK
.B.A
C3
Orlo
vet
al.,
1997
;O
rlov
etal
.,19
9989
Ova
lbum
in(h
eneg
gw
hite
);lo
wio
nic
stre
ngth
,pH
7.4
OV
H.L
IS3
Pre
sent
wor
k90
Ova
lbum
in(h
eneg
gw
hite
);hi
ghio
nic
stre
ngth
,pH
7.4
OV
H.H
IS3
Pre
sent
wor
k91
Pap
ain
(Ca
rica
pa
pa
ya);
glyc
in,
pH3.
1–4.
0P
AP
.AC
5B
urst
ein
etal
.,19
73;
Bur
stei
n,19
77a;
Ved
enki
naan
dB
urst
ein,
1970
;V
eden
kina
etal
.,19
7192
Pap
ain
(Ca
rica
pa
pa
ya);
wat
er,
pH6.
8–7.
0P
AP
.N5
Bur
stei
net
al.,
1973
;B
urst
ein,
1977
a;V
eden
kina
and
Bur
stei
n,19
70;
Ved
enki
naet
al.,
1971
93P
apai
n(Ca
rica
pa
pa
ya);
glyc
in,
pH9.
3–9.
8P
AP
.AL
5B
urst
ein
etal
.,19
73;
Bur
stei
n,19
77a;
Ved
enki
naan
dB
urst
ein,
1970
;V
eden
kina
etal
.,19
7194
Pa
pa
in(C
arica
pa
pa
ya);8
Mur
ea,
pH6.
2P
AP
.UR
5B
urst
ein
etal
.,19
73;
Bur
stei
n,19
77a;
Ved
enki
naan
dB
urst
ein,
1970
;V
eden
kina
etal
.,19
7195
Par
valb
umin
II§§
(cod
Ga
du
sm
orr
hu
a),ac
idfo
rm;
pH2.
0P
AC
.AC
1A
born
ev,
1993
96P
arva
lbum
inII§
§(c
odG
ad
us
mo
rrh
ua),
apo-
form
;pH
7.7
PA
C.A
PO
1A
born
ev,
1993
97P
arva
lbum
inII§
§(c
odG
ad
us
mo
rrh
ua),
Mg-
form
;1
mM
MgC
l 2,pH
7.7
PA
C.M
G1
Abo
rnev
,19
9398
Par
valb
umin
II§§
(cod
Ga
du
sm
orr
hu
a),C
a-fo
rm;
1m
MC
aCl 2,
pH7.
7P
AC
.CA
1A
born
ev,
1993
99P
arva
lbum
in(w
hitin
gGa
du
sm
erla
ng
us),
apo-
form
;pH
6.4
PA
M.A
PO
1P
erm
yako
vet
al.,
1980
100
Par
valb
umin
(whi
tingG
ad
us
me
rla
ng
us);
m0.
5M
,pH
8.8
PA
M1
Per
mya
kov
etal
.,19
8010
1P
arva
lbum
in§§
(Ala
ska
polla
ck,T
he
rag
rach
alc
og
ram
ma),
apo-
form
;pH
8.0
PM
T.A
PO
1V
.I.
Em
elya
nenk
o(t
his
lab)
102
Par
valb
umin§
§(A
lask
apo
llack
,Th
era
gra
cha
lco
gra
mm
a),C
a-fo
rm;
1m
MC
aCl 2,
pH8.
0P
MT
.CA
1V
.I.
Em
elya
nenk
o(t
his
lab)
103
Par
valb
umin§
§(A
lask
apo
llack
,Th
era
gra
cha
lco
gra
mm
a),M
g-fo
rm;
1m
MM
gCl 2,
pH8.
0P
MT
.MG
1V
.I.
Em
elya
nenk
o(t
his
lab)
104
Par
valb
umin§
§(P
acifi
cna
vaga
,Ele
gin
us
gra
cilis),
apo-
form
;pH
8.0
PA
N.A
PO
1V
.I.
Em
elya
nenk
o(t
his
lab)
105
Par
valb
umin§
§(P
acifi
cna
vaga
,Ele
gin
us
gra
cilis),
Ca-
form
;1
mM
CaC
l 2,pH
8.0
PA
N.C
A1
V.
I.E
mel
yane
nko
(thi
sla
b)
106
Par
valb
umin§
§(P
acifi
cna
vaga
,Ele
gin
us
gra
cilis),
Mg-
form
,1
mM
MgC
l 2,pH
8.0
PA
N.M
G1
V.
I.E
mel
yane
nko
(thi
sla
b)
107
Pep
sin
(bov
ine)
;pH
1.3–
2.8
PE
B.1
-35
Bur
stei
net
al.,
1973
;B
urst
ein,
1977
a10
8P
epsi
n(b
ovin
e);
wat
eror
pH4.
0–5.
2P
EB
.4-5
5B
urst
ein
etal
.,19
73;
Bur
stei
n,19
77a
109
Pe
psi
n(b
ovi
ne
);pH
5.2–
9.0
PE
B.6
-95
Bur
stei
net
al.,
1973
;B
urst
ein,
1977
a11
0P
ep
sin
(bo
vin
e);8
Mur
ea,
pH5.
2P
EB
.UR
5B
urst
ein
etal
.,19
73;
Bur
stei
n,19
77a
111
Pho
spha
tase
alka
line
(E
.co
li);
pH7.
1P
HA
233
Pre
sent
wor
k11
23-
Pho
spho
glyc
erat
eki
nase
(yea
st);
pH7.
4P
GK
2P
rese
ntw
ork
113
Pho
spho
lipas
eA 2(b
ovin
epa
ncre
as);
pH6.
0,pH
7.4
PLB
1P
erm
yako
van
dD
eiku
s,19
9511
4P
hosp
holip
ase
A 2(p
orci
nepa
ncre
as);
pH7.
4P
LS1
Per
mya
kov
and
Dei
kus,
1995
Biophysical Journal 81(3) 1710–1734

No.
Pro
tein
Nam
ean
dC
ondi
tions
Pro
tein
Cod
esN
o.of
Trp
sR
efer
ence
s
115
Pho
spho
lipas
eA 2(c
obra
Na
jan
aja
oxi
an
aven
om);
low
ioni
cst
reng
th,
pH7.
5P
AO
.LIS
3O
rlova
,19
79
116
Pho
spho
lipas
eA 2(c
obra
Na
jan
aja
oxi
an
aven
om);
high
ioni
cst
reng
th,
pH7.
5P
AO
.HIS
3O
rlova
,19
79
117
Ph
osp
ho
lipa
seA 2
(co
bra
Na
jan
aja
oxi
an
ave
no
m);6
MG
dnH
Cl,
pH7.
5P
AO
.GD
N3
Orlo
va,
1979
118
Pho
spho
lipas
eC
,ph
osph
atid
ylch
olin
e-sp
ecifi
c,ho
lo-f
orm
(B
ac.
cere
us);
pH7.
1P
LC9
D.
B.
Vep
rints
ev(t
his
lab)
119
Pro
lact
in(b
ovin
e);
pH8.
5P
RL
2P
erm
yako
vet
al.,
1997
120
Pro
pion
ylch
olin
ees
tera
se(h
uman
);pH
7.5
PC
EA
born
ev,
1993
121
HIV
-1pr
otea
se;
low
ioni
cst
reng
th,
T5
202
67°C
,0–
50%
glyc
erol
,pH
8.0
PR
H.L
IS2
12
A.
I.K
orne
lyuk
¶¶
122
HIV
-1pr
otea
se;
high
ioni
cst
reng
th,
pH8.
0P
RH
.HIS
21
2A
.I.
Kor
nely
uk¶¶
123
HIV
-1pr
otea
sew
ithpe
psta
tin,
pH8.
0P
RH
.PS
T2
12
A.
I.K
orne
lyuk
¶¶
124
Ser
ine
prot
ease
(S
tap
hyl
oco
ccu
sa
ure
us
);pH
7.5
PR
S2
Pre
sent
wor
k12
5P
rote
ase
K(Tritir
ach
ium
alb
um
Lim
ber)
;pH
7.5
PR
K2
Res
hetn
yak
and
Bur
stei
n,19
97a
126
Pyr
uvat
eki
nase
(rab
bit
skel
etal
mus
cle)
;pH
7.5
PY
K3
Abo
rnev
,19
9312
7P
yruv
ate
kina
se(r
abbi
tsk
elet
alm
uscl
e)P
EG
conj
ugat
eP
YK
.PE
G3
Abo
rnev
,19
9312
8R
ecov
erin
MP
26,
apo-
form
;pH
8.1
RE
C.A
PO
3S
.E
.P
erm
yako
v(t
his
lab)
129
Rec
over
inM
P26
1C
aCl 2,
pH8.
1R
EC
.CA
3S
.E
.P
erm
yako
v(t
his
lab)
130
Red
cells
ghos
ts(h
uman
);pH
7.8
RC
GO
rlova
,19
7913
1R
ibon
ucle
ase
C 2(A
spe
rgill
us
cla
vatu
s);0–
20%
glyc
erol
,pH
4.0,
pH6.
0,pH
8.0–
8.4
RN
C1
Bur
stei
n,19
77a;
Bur
stei
n,19
83;
Gris
hche
nko
etal
.,19
76
132
Rib
onuc
leas
ein
trac
ellu
lar
\\(A
spe
rgill
us
cla
vatu
s);pH
8.0
RN
IV
.M
.G
rishc
henk
o(t
his
lab)
133
RN
Ase
T 1**
*(
Asp
erg
illu
so
ryza
e);20
%gl
ycer
ol,
pH7–
8R
NT
1B
urst
ein,
1977
a;B
urst
ein,
1983
;G
rishc
henk
oet
al.,
1976
134
Rib
osom
alpr
otei
nS
4†
††
(E.
coli)
;pH
7.0
RS
41
T.
L.B
ushu
eva
(thi
sla
b)13
5R
ibos
omal
prot
ein
S7
††
†(E
.co
li);
pH7.
0R
S7
2B
urst
ein
etal
.,19
73;
Bur
stei
n,19
77a
136
Rib
osom
e-in
activ
atin
gpr
otei
n‡
‡‡
(ric
inag
glut
inin
,Ric
inu
sco
mm
un
is);pH
4.0–
7.0
RIP
T.
L.B
ushu
eva§§
§
137
Ric
inch
ain
A(R
icin
us
com
mu
nis);
pH4.
0–7.
0R
CA
1B
ushu
eva
and
Ton
evits
ky,
1987
a,b;
Bus
huev
aan
dT
onev
itsky
,19
88;
Bus
huev
aet
al.,
1990
138
Ric
inch
ain
B(R
icin
us
com
mu
nis);
pH4.
0R
CB
.49
Bus
huev
aan
dT
onev
itsky
,19
87a,
b;B
ushu
eva
and
Ton
evits
ky,
1988
;B
ushu
eva
etal
.,19
9013
9R
icin
chai
nB
(Ric
inu
sco
mm
un
is);pH
5.0–
7.0
RC
B.5
-79
Bus
huev
aan
dT
onev
itsky
,19
87a,
b;B
ushu
eva
and
Ton
evits
ky,
1988
;B
ushu
eva
etal
.,19
9014
0R
icin
chai
nB
(Ric
inu
sco
mm
un
is)1
lact
ose;
pH4.
0R
CB
.4.L
AC
9B
ushu
eva
and
Ton
evits
ky,
1987
a,b;
Bus
huev
aan
dT
onev
itsky
,19
88;
Bus
huev
aet
al.,
1990
141
Ric
in(R
icin
us
com
mu
nis)
(cha
inA
1ch
ain
B)
with
and
with
out
lact
ose;
pH4.
0–7.
0R
CC
119
Bus
huev
aan
dT
onev
itsky
,19
87a,
b;B
ushu
eva
and
Ton
evits
ky,
1988
;B
ushu
eva
etal
.,19
9014
2S
omat
otro
pin,
grow
thho
rmon
e(h
uman
);pH
8.2
ST
P1
Per
mya
kov
and
Dei
kus,
1995
143
Spe
ctrin
,a-c
hain
andb
-cha
inS
PC
42142
T.
L.B
ushu
eva§§
§
144
Sub
tilis
inB
PN9
;pH
7.3
BP
N3
Pre
sent
wor
k14
5S
ubtil
isin
Car
lsbe
rg;
pH7.
5S
LC1
Pre
sent
wor
k14
6T
elok
inK
RP
,m
yosi
nlig
ht-c
hain
kina
se(c
hick
engi
zzar
d)K
RP
1B
ushu
eva
etal
.,19
9914
7T
ob
acc
om
osa
icvi
rus,
pro
tein
A;8M
urea
TM
V.U
R3
Bur
stei
net
al.,
1973
;B
urst
ein,
1977
a;V
eden
kina
and
Bur
stei
n,19
7014
8T
ropo
nin
T(r
abbi
tsk
elet
alm
uscl
e);
pH6.
8T
NT
2M
oroz
ova
etal
.,19
8814
9T
ryps
in(b
ovin
e);
wat
er,
pH7.
3,pH
8.7
TR
Y4
Bur
stei
net
al.,
1973
;B
urst
ein,
1977
a;V
eden
kina
and
Bur
stei
n,19
70;
Ivko
vaet
al.,
1968
;R
eshe
tnya
kan
dB
urst
ein,
1997
b
Biophysical Journal 81(3) 1710–1734

No.
Pro
tein
Nam
ean
dC
ondi
tions
Pro
tein
Cod
esN
o.of
Trp
sR
efer
ence
s
150
Try
psi
n(b
ovi
ne
)in
35
%d
ioxa
ne
TR
Y.D
35
4B
urst
ein
etal
.,19
73;
Bur
stei
n,19
77a;
Ved
enki
naan
dB
urst
ein,
1970
;Iv
kova
etal
.,19
6815
1T
ryp
sin
(bo
vin
e)
in6
0–
70
%d
ioxa
ne
TR
Y.D
60
-70
4B
urst
ein
etal
.,19
73;
Bur
stei
n,19
77a;
Ved
enki
naan
dB
urst
ein,
1970
;Iv
kova
etal
.,19
6815
2T
ryps
inog
en(b
ovin
e);
pH7.
4T
RG
4R
eshe
tnya
kan
dB
urst
ein,
1997
b15
3V
incu
lin¶¶¶(h
uman
)V
IN10
Bus
huev
a§§
§
154
Vin
culin
¶¶¶
(hu
ma
n);
8M
urea
VIN
.UR
10B
ushu
eva§§
§
155
Vip
oxin
,pr
otei
nA
(Vip
era
am
mo
dyt
es
am
mo
dyt
es
);pH
3.8–
4.8
VT
A.A
C1
Buk
olov
a-O
rlova
etal
.,19
79;
Buk
olov
a-O
rlova
etal
.,19
80;
Tch
orba
nov
etal
.,19
7715
6V
ipox
in,
prot
ein
A(V
ipe
raa
mm
od
yte
sa
mm
od
yte
s);
high
ioni
cst
reng
th,
pH7.
2–8.
0V
TA
.HIS
231
Buk
olov
a-O
rlova
etal
.,19
79;
Buk
olov
a-O
rlova
etal
.,19
80;
Tch
orba
nov
etal
.,19
7715
7V
ipox
in,
prot
ein
A(V
ipe
raa
mm
od
yte
sa
mm
od
yte
s);
low
ioni
cst
reng
th,
pH7.
2–8.
0V
TA
.LIS
1B
ukol
ova-
Orlo
vaet
al.,
1979
;B
ukol
ova-
Orlo
vaet
al.,
1980
;T
chor
bano
vet
al.,
1977
158
Vip
oxin
,pr
otei
nB
(Vip
era
am
mo
dyt
es
am
mo
dyt
es
);pH
3.6,
pH6.
2–8.
1V
TB
2B
ukol
ova-
Orlo
vaet
al.,
1979
;B
ukol
ova-
Orlo
vaet
al.,
1980
;T
chor
bano
vet
al.,
1977
159
Vip
oxin
,co
mpl
exA
1B
(Vip
era
am
mo
dyt
es
am
mo
dyt
es
);pH
4.8,
pH8.
0V
TC
112
Buk
olov
a-O
rlova
etal
.,19
79;
Buk
olov
a-O
rlova
etal
.,19
80;
Tch
orba
nov
etal
.,19
7716
0V
iscu
min
(le
ctin
ML
-1;
mis
leto
eV
iscu
ma
lbu
m);pH
4.0
VS
C.A
C21
9B
ushu
eva
and
Ton
evits
ky,
1988
;B
ushu
eva
etal
.,19
8816
1V
iscu
min
(lect
inM
L-1;
mis
leto
eVis
cum
alb
um)
;pH
5.0–
7.5
VS
C.5
-721
9B
ushu
eva
and
Ton
evits
ky,
1988
;B
ushu
eva
etal
.,19
8816
2V
iscu
min
(le
ctin
ML
-1;
mis
leto
eV
iscu
ma
lbu
m),
mo
difi
ed
by
eth
yla
mm
on
ium
nitr
ate
;pH4.
0,pH
7.0
VS
C.M
OD
219
Bus
huev
aan
dT
onev
itsky
,19
88;
Bus
huev
aet
al.,
1988
163
Vis
cum
in(le
ctin
ML
-1;
mis
leto
eV
iscu
ma
lbu
m),
mo
difi
ed
by
eth
yla
mm
on
ium
nitr
ate
;8M
urea
,pH
4.0,
pH7.
0V
SC
.UR
219
Bus
huev
aan
dT
onev
itsky
,19
88;
Bus
huev
aet
al.,
1988
Den
atur
edpr
otei
nco
des
appe
arin
italic
s.*P
rese
nted
byD
r.A
ndrz
ejS
obot
a,N
.N
enck
iIns
titut
eof
Exp
erim
enta
lBio
logy
,W
arsa
w,
Pol
and
(Ban
doro
wic
zet
al.,
1992
;S
obot
aet
al.,
1993
).†P
repa
red
and
pres
ente
dby
Dr.
G.
Ben
zona
na(B
enzo
nana
etal
.,19
74;
Cox
etal
.,19
76).
‡P
rese
nted
byD
r.L.
V.
Med
ved,
Inst
itute
ofB
ioch
emis
try,
Ukr
aine
Aca
dem
yof
Sci
ence
,K
iev.
§P
repa
red
and
pres
ente
dby
Dr.
L.V
.A
batu
rov,
Inst
itute
ofM
olec
ular
Bio
logy
,R
AS
,M
osco
w.
¶ Pre
pare
dby
Dr.
L.P
.K
alin
iche
nko
(thi
sla
b)fr
omca
mel
milk
pres
ente
dby
Dr.
D.
Nya
maa
,In
stitu
teof
Bio
tech
nolo
gy,
Mon
golia
nA
cade
my
ofS
cien
ce,
Ul
anB
aata
r,M
ongo
lia.
\ Pre
sent
edby
Dr.
A.
P.
Dem
chen
ko,
Inst
itute
ofB
ioch
emis
try,
Nat
iona
lAca
dem
yof
Sci
ence
ofU
krai
ne,
Kie
v.**
Pre
sent
edby
Dr.
R.
I.A
rtyu
khan
dD
r.E
.A
.S
hlya
pnik
ova,
Inst
itute
ofT
heor
etic
alan
dE
xper
imen
talB
ioph
ysic
s,R
AS
,P
ushc
hino
.†
† Pre
pare
dby
Dr.
O.
And
reev
,U
nive
rsity
ofN
orth
Tex
as,
For
tW
orth
,T
exas
.‡
‡ Pre
pare
dan
dpr
esen
ted
byD
r.N
.Y
a.O
rlov,
this
lab.
§§ P
repa
red
byD
r.L.
P.
Kal
inic
henk
o(t
his
lab)
,us
ing
mod
ified
Hai
ech
met
hod
(Hai
ech
etal
.,19
79).
¶¶ P
rese
nted
byA
.I.
Kor
nely
uk,
Inst
itute
ofM
olec
ular
Bio
logy
and
Gen
etic
s,N
atio
nalA
cade
my
ofS
cien
ceof
Ukr
aine
,K
iev.
\\P
repa
red
byD
r.S
.I.
Bez
boro
dova
and
co-w
orke
rs,
Inst
itute
ofB
ioch
emis
try
and
Phy
siol
ogy
ofM
icro
orga
nism
s,A
cade
my
ofS
cien
ceU
SS
R,
Pus
hchi
no.
***P
rese
nted
byD
r.C
.A
.G
hiro
n.†
†† P
repa
red
and
pres
ente
dby
Dr.
A.
T.
Gud
kov,
Inst
itute
ofP
rote
inR
esea
rch,
Aca
dem
yof
Sci
ence
US
SR
,P
ushc
hino
.‡
‡‡ P
repa
red
byD
r.A
.G
.T
onev
itsky
(Ton
evits
kyet
al.,
1996
).§
§§ S
pect
ram
easu
red
byD
r.T
.L.
Bus
huev
a,C
ardi
olog
yR
esea
rch
Cen
ter,
Rus
sian
Aca
dem
yof
Med
ical
Sci
ence
,M
osco
w.
¶¶¶ P
repa
red
byD
r.V
.E
.K
otel
yans
ky(W
elle
ret
al.,
1990
);sp
ectr
aw
ere
mea
sure
dby
Dr.
T.
L.B
ushu
eva,
Car
diol
ogy
Res
earc
hC
ente
r,R
ussi
anA
cade
my
ofM
edi
calS
cien
ce,
Mos
cow
.
Biophysical Journal 81(3) 1710–1734

line 296.7 nm from an SVD-120A mercury lamp isolated with a mono-chromator. The use of the mercury lamp with narrow spectral lines inemission provided the possibility of rather simple correction for the straylight presented in the registered emission spectra. The spectral width ofslits for excitation and emission did not exceed 2 nm. After correction forthe instrument spectral sensitivity (Burstein and Emelyanenko, 1996), theintensities were proportional to the number of photons emitted per unitwavelength interval during a unit time interval. Spectra of almost everyprotein were measured in the presence of varying concentrations of exter-nal quenchers (acrylamide, KI, CsCl, and/or NaNO3). When using ionicquenchers (I2, Cs1, or NO3
2) the total ionic strength was kept constant(from 0.4 to 0.6 M in various experiments) by addition of KCl. Inexperiments with acrylamide the intensities in fluorescence spectra werecorrected for the screening inner filter effect of this quencher at theexcitation wavelength (Burstein, 1968).
Analysis and representation of spectral data
The decomposition of tryptophan fluorescence spectra of proteins intolog-normal components was performed for sets of spectra measured atvarying concentrations of quenchers using two algorithms: SIMS (SImplefitting with Mean-Square criterion) (Abornev and Burstein, 1992; Bursteinet al., 2001) and PHREQ (PHase-plot-basedREsolving with Quenchers,for two-component decomposition) (Burstein et al., 2001). For the decom-position of a single spectrum (without quenchers) the modified SIMSalgorithm was applied (Burstein et al., 2001). Using SIMS, the spectrawere independently fitted by one, two, or three components. The criterionof attaining the solution (a minimal sufficient number of componentsdescribing the spectra) was the minimal root-mean-square differences(residuals) between theoretical and experimental spectra multiplied by thenumber of parameters under fitting. For several proteins two solutions withdifferent numbers of components, which had the similar values of thiscriterion, were selected as the best ones.
The fact that the components of composite tryptophan emission spectraof proteins are wide (;30–60 nm at half-maximal level) compared withthe differences between the values of their maximum positions (from 5 to;50 nm), might considerably reduce the reliability of decomposition.Therefore, we present in Table 2 the averaged results (values of themaximum position,lm(i) and the contribution into the area under spectrum,S(i) and the standard deviations of averaging) obtained separately with themathematically different algorithms: PHREQ and SIMS. The good agree-ment between the parameters that were obtained with these two methodsdemonstrate the reliability of a result. We can note that for the absolutemajority of proteins the results obtained with these two methods differ lessthan by errors of means. It allowed us to present unified results of thecomponent analysis for individual proteins independent of the decompo-sition method.
Moreover, the majority of protein spectra were measured in the pres-ence of various quenchers, in most cases more than once, using prepara-tions from different sources or varying solvent conditions. To extractunified values of the parameters for any given protein or its conformer, twoaveraging schemes were applied to the sets of decomposition results:“Averaging” and “Mean Best Fit” (Table 2). According to the first scheme,the parameters of components were calculated as averages of all solutionsobtained for all individual experiments, independent of the quality of thedecomposition. Within the second scheme, only the data obtained withminimal values of the decomposition functional for each experiment wereaveraged.
RESULTS
In Table 2 we present the results of decomposition oftryptophan fluorescence spectra of.100 different proteins,some in various structural states (native and denatured, in
complexes with ions or organic ligands, and in variouspH-induced states), obtained by the above-mentioned algo-rithms, SIMS and PHREQ, and different averaging schemesof the obtained solutions, averaging and mean best fit. TheSIMS algorithm was used to the log-normal decompositionof 163 sets of tryptophan emission spectra. The PHREQalgorithm was applied to the 105 sets of fluorescence spec-tra because the other 58 spectra of proteins were measuredwithout quenchers, and only the modified SIMS algorithmcould be applied to decompose them. The results obtainedwith both SIMS and PHREQ methods for absolute majorityof proteins differ less than errors of means presented in thelm(i) and S(i) columns. It allows presenting the unifiedresults of the component analysis independent of the de-composition method. Besides the results of log-normalcomponent analysis, Table 2 contains the maximum posi-tion values of whole, non-decomposed fluorescence spectraof proteins (“lm total,” the third column). The denaturedproteins are italicized in the tables.
The database of log-normal components of protein tryp-tophan fluorescence spectra shown in Table 2 may be re-garded as a generalized representative database of fluores-cence spectra of individual tryptophan residues in proteins.It allowed us to perform statistical testing of the hypothesisof discrete states, i.e., the existence of the set of severalclasses of tryptophan residues in proteins discretely differ-ing in their fluorescence spectral maximum positions, whichwas put forward as early as 1973–1977 (Burstein et al.,1973; Burstein, 1977a, b, 1983). Such a test is performedhere by constructing and analyzing the histograms of oc-currence of log-normal components presented in the data-base of Table 2.
Before examining histograms of occurrence of individuallog-normal components, it seems reasonable to considerhow randomly are distributed spectral maximum positionsof whole, non-decomposed emission spectra of proteins ofour database. The histograms of occurrence oflm values ofwhole spectra are shown in Fig. 1,A andB for native anddenatured proteins, respectively, constructed using the “lm
total” values from Table 2. It is seen that the histogram oflm for native proteins is rather well fitted by normal distri-bution with the peak at 336.76 0.4 nm ands 5 6.0 6 0.9nm, which is a good confirmation of random character ofthe excerpt of native proteins. A worse fitting by the normaldistribution was obtained for the maximum positions offluorescence spectra of denatured proteins (the peak at346.56 0.6 nm;s 5 4.16 1.3 nm); however, it is expecteddue to the small number of proteins and, mainly, due toessentially different structural features of protein statesformed under various denaturing effectors used (urea, diox-ane, extreme pH, etc.).
The canonical histograms of occurrence of maximumposition values of log-normal components (with the 2-nmsteps) of emission spectra of native proteins are presented inFig. 2. PanelsA and B represent the distributionslm(i)
1717Biophysical Journal Volume 81 September 2001 1710–1734

TA
BLE
2T
hed
atab
ase
of
par
amet
ers
of
log
-no
rmal
com
po
nent
so
bta
ined
asre
sult
of
dec
om
po
siti
on
of
tryp
top
han
fluo
resc
ence
spec
tra
of
pro
tein
sus
ing
the
SIM
San
dP
HR
EQ
alg
ori
thm
s
No.
Pro
tein
Cod
el
mto
tal(
nm)
PH
RE
QS
IMS
Ave
rage
Mea
nB
est
Fit
No.
lm
(i)
(nm
)S(
i)(%
)N
o.l
m(i
)(n
m)
S(i)
(%)
No.
lm
(i)
(nm
)S(
i)(%
)N
o.l
m(i
)(n
m)
S(i)
(%)
1A
CH
335.
460.
51
324.
860.
239
.26
3.5
132
1.66
6.0
46.7
618
.31
322.
664.
936
.66
4.0
132
2.66
3.7
36.8
66.
92
344.
860.
260
.86
3.5
234
2.56
0.7
53.3
618
.32
342.
961.
063
.46
4.0
234
3.06
1.6
63.2
66.
92
AC
D.F
329.
760.
61
317.
962.
548
.46
0.1
132
6.06
5.0
78.4
624
.41
325.
065.
479
.86
21.7
132
7.86
1.6
88.4
67.
02
335.
862.
751
.66
0.1
234
2.76
5.8
21.6
624
.42
341.
965.
920
.26
21.7
234
2.56
2.0
11.6
67.
03
AC
D.G
329.
960.
91
328.
361.
210
060
132
9.96
1.0
1006
01
329.
461.
310
060
132
9.26
1.0
1006
04
AC
R.F
330.
560.
51
329.
864.
510
060
133
0.26
0.5
1006
01
330.
360.
410
060
133
0.56
0.5
1006
05
AC
R.F
.UR
35
0.06
0.5
13
48
.56
3.2
10
060
13
49
.96
0.4
10
060
13
49
.66
1.0
10
060
13
50
.06
0.5
10
060
6A
CR
.G32
9.66
0.5
132
1.06
5.3
47.9
61.
91
320.
960.
535
.16
2.0
132
1.06
0.1
41.5
69.
11
320.
960.
535
.16
2.0
233
5.56
4.5
52.1
61.
62
332.
860.
564
.96
4.0
233
4.06
1.0
58.5
69.
12
332.
860.
564
.96
4.0
7A
CM
334.
761.
21
325.
666.
451
.26
14.9
132
5.26
5.6
53.8
610
.71
325.
465.
650
.76
11.0
132
6.06
6.2
52.2
68.
22
343.
261.
748
.86
14.9
234
3.06
2.5
46.2
610
.72
343.
462.
149
.36
11.0
234
4.46
2.6
47.8
68.
28
AC
M.U
R3
47
.860
.91
33
3.4
61
0.3
15
.76
2.1
13
39
.66
9.6
37
.26
9.9
13
36
.56
8.9
26
.56
13
.71
33
7.7
61
0.5
25
.26
16
.52
35
1.3
60
.28
4.4
62
.12
35
3.7
61
.46
2.8
69
.92
35
2.5
61
.67
3.5
61
3.7
23
51
.76
0.9
74
.86
16
.59
AC
Y33
5.56
0.5
133
0.06
2.9
60.6
60.
11
332.
960.
684
.26
5.2
133
1.36
1.8
70.6
614
.11
331.
862.
970
.66
14.1
234
5.66
3.1
39.4
60.
22
353.
362.
915
.86
5.2
234
8.46
4.0
29.4
614
.12
348.
463.
129
.46
14.1
10A
WG
(1-c
omp.
)34
9.06
0.3
134
9.16
0.2
1006
01
349.
160.
310
060
134
9.16
0.2
1006
01
349.
160.
210
060
(2-c
omp.
)1
333.
462.
25.
560.
81
330.
666.
48.
667.
41
331.
465.
57.
366.
31
330.
467.
14.
361.
42
350.
060.
394
.56
0.8
235
0.66
1.0
91.4
67.
42
350.
460.
892
.46
6.3
234
9.96
0.1
95.7
61.
411
A1A
T33
4.86
0.5
——
132
4.46
0.1
38.9
60.
21
324.
460.
138
.96
0.2
132
4.46
0.1
38.9
60.
22
340.
160.
161
.16
0.2
234
0.16
0.1
61.1
60.
22
340.
160.
161
.16
0.2
12A
SB
.F33
3.06
0.5
131
4.76
2.8
15.3
60.
41
319.
960.
520
.76
1.0
131
7.36
3.7
18.0
63.
81
314.
762.
815
.36
0.4
233
5.16
3.0
84.7
60.
12
335.
660.
579
.36
3.0
233
5.46
0.4
82.0
63.
82
335.
163.
084
.76
0.1
13A
SB
.N34
2.86
0.2
134
2.36
0.5
1006
01
342.
960.
210
060
134
2.76
0.4
1006
01
342.
860.
210
060
14A
SB
.N.IB
338.
660.
51
338.
563.
610
060
133
6.66
1.8
1006
01
337.
661.
710
060
133
8.56
3.6
1006
015
AS
H.F
334.
860.
51
323.
863.
742
.66
0.6
132
8.66
0.5
31.3
62.
01
326.
263.
455
.76
18.5
132
3.86
3.7
42.6
60.
62
342.
563.
657
.46
0.5
234
8.56
0.5
68.7
62.
02
345.
564.
244
.36
18.5
234
2.56
3.6
57.4
60.
516
AS
H.N
341.
360.
51
328.
762.
920
.06
0.1
132
5.76
5.4
19.4
615
.31
326.
764.
225
.16
7.2
132
8.76
2.9
20.0
60.
12
344.
863.
180
.06
0.1
234
5.16
1.8
80.6
615
.32
345.
061.
374
.96
7.2
234
4.86
3.1
80.0
60.
117
AS
H.N
.IB33
8.56
0.5
132
6.26
3.4
40.6
60.
41
327.
160.
546
.16
1.0
132
6.76
0.6
43.4
63.
91
326.
263.
440
.66
0.4
234
6.86
3.2
59.4
60.
32
347.
360.
553
.96
2.0
234
7.16
0.4
56.6
63.
92
346.
863.
259
.46
0.3
18
AS
H.U
R3
45
.663
.81
32
3.1
64
.92
1.5
66
.91
32
5.4
60
.53
5.2
61
.01
32
3.8
63
.72
6.0
69
.31
32
6.0
60
.82
5.9
61
3.2
23
50
.56
4.9
78
.56
6.9
23
48
.46
0.5
64
.86
1.0
23
49
.86
3.7
74
.06
9.3
23
52
.16
4.0
74
.16
13
.219
AD
Y34
4.16
0.5
133
1.16
2.9
55.7
60.
51
330.
861.
635
.76
6.4
133
0.96
1.1
42.4
612
.41
331.
162.
955
.76
0.5
235
6.26
3.2
44.3
60.
52
356.
661.
264
.36
6.4
235
6.46
0.9
57.6
612
.42
356.
263.
244
.36
0.5
20A
TR
N.T
RP
.33
8.16
0.1
133
0.06
1.0
47.5
67.
91
333.
063.
857
.06
30.2
133
2.36
3.0
55.7
629
.71
332.
363.
055
.76
29.7
A2-
K2
(2-
com
p.)
234
4.76
1.5
52.5
67.
92
345.
763.
843
.06
30.2
234
4.46
3.3
44.3
629
.72
344.
463.
344
.36
29.7
(3-c
omp.
)—
—1
318.
460.
55.
063.
01
317.
761.
16.
061.
41
318.
460.
55.
063.
02
336.
360.
552
.06
6.0
233
7.06
0.9
66.1
619
.92
336.
360.
552
.06
6.0
334
1.96
0.5
43.0
610
.03
345.
765.
327
.96
21.4
334
1.96
0.5
43.0
610
.021
AT
RN
.TR
P.
338.
460.
51
330.
363.
341
.06
0.7
133
1.76
4.0
47.4
633
.81
331.
262.
945
.16
24.4
133
0.36
3.3
41.0
60.
7E
11E
22
343.
963.
259
.06
0.7
234
4.76
4.9
52.6
633
.82
344.
463.
554
.96
24.4
234
3.96
3.2
59.0
60.
72
2A
TR
N.T
RP
.UR
35
0.36
0.5
13
16
.56
3.1
0.4
69
.41
34
0.0
60
.51
4.7
67
.01
33
2.4
61
3.8
8.9
61
2.0
13
16
.56
3.1
0.4
69
.42
35
0.4
63
.19
9.6
60
.12
35
2.6
61
.58
5.3
67
.02
35
1.9
61
.39
1.1
61
2.0
23
50
.46
3.1
99.6
60.
1

No.
Pro
tein
Cod
el
mto
tal(
nm)
PH
RE
QS
IMS
Ave
rage
Mea
nB
est
Fit
No.
lm
(i)
(nm
)S(
i)(%
)N
o.l
m(i
)(n
m)
S(i)
(%)
No.
lm
(i)
(nm
)S(
i)(%
)N
o.l
m(i
)(n
m)
S(i)
(%)
23A
TR
N.T
YR
.40
338.
161.
01
326.
563.
235
.86
3.5
132
8.86
3.5
41.6
64.
31
328.
063.
538
.76
4.8
132
6.76
3.0
37.3
65.
22
345.
061.
464
.26
3.5
234
6.46
2.5
58.4
64.
32
345.
962.
261
.36
4.8
234
5.16
1.3
62.7
65.
224
AT
RN
.TY
R.5
933
8.46
0.3
132
7.76
2.6
27.0
68.
51
328.
364.
731
.76
19.1
132
8.06
3.5
29.3
613
.91
324.
767.
629
.66
17.1
234
1.96
0.6
73.0
68.
52
344.
362.
468
.36
19.1
234
2.76
1.9
70.7
613
.92
342.
463.
470
.46
17.1
25A
MY
333.
46
1.4
132
7.96
1.2
63.0
613
.61
330.
561.
779
.16
5.4
132
9.66
1.9
72.5
613
.61
327.
961.
263
.06
13.6
235
0.46
6.9
37.0
613
.62
354.
364.
320
.96
5.4
235
2.86
5.3
27.5
613
.62
350.
466.
937
.06
13.6
26A
X6
(2-c
omp.
)33
1.36
0.5
132
5.56
2.9
67.7
60.
11
326.
060.
574
.06
1.0
132
5.86
0.4
70.9
64.
51
325.
562.
967
.76
0.1
234
6.56
3.1
32.3
60.
12
347.
760.
526
.06
2.0
234
7.16
0.8
29.1
64.
52
346.
563.
132
.36
0.1
(3-c
omp.
)—
—1
317.
260.
510
.36
3.0
131
7.26
0.5
10.3
63.
01
317.
260.
510
.36
3.0
232
9.46
0.5
75.6
63.
02
329.
460.
575
.66
3.0
232
9.46
0.5
75.6
63.
03
356.
360.
514
.26
2.0
335
6.36
0.5
14.2
62.
03
356.
360.
514
.26
2.0
27A
SP
.AC
329.
461.
0—
—1
327.
261.
491
.76
7.8
132
7.26
1.4
91.7
67.
81
327.
261.
491
.76
7.8
235
5.46
3.9
8.36
7.8
235
5.46
3.9
8.36
7.8
235
5.46
3.9
8.36
7.8
28A
SP
.N32
4.76
1.6
132
5.26
1.2
1006
01
324.
561.
810
060
132
4.56
1.7
1006
01
323.
961.
810
060
29A
ZU
.77K
307.
963.
6—
—1
307.
964.
410
060
130
7.96
4.4
1006
01
307.
964.
410
060
30C
BC
338.
360.
21
327.
863.
939
.06
11.4
132
3.36
1.6
27.3
63.
91
325.
663.
633
.16
10.0
132
3.36
1.6
27.3
63.
9(2
-com
p.)
234
4.46
1.7
61.0
611
.42
342.
360.
672
.76
3.9
234
3.36
1.7
66.7
610
.02
342.
360.
672
.76
3.9
(3-c
omp.
)—
—1
315.
565.
514
.96
4.7
131
5.56
5.5
14.9
64.
71
315.
565.
514
.96
4.7
233
7.26
1.9
61.0
63.
22
337.
261.
961
.06
3.2
233
7.26
1.9
61.0
63.
23
347.
861.
124
.16
7.1
334
7.86
1.1
24.1
67.
13
347.
861.
124
.16
7.1
31C
DS
349.
360.
51
348.
663.
210
060
134
9.46
0.1
1006
01
349.
160.
510
060
134
9.36
0.5
1006
03
2C
DS
.25
35
1.26
0.5
——
13
51
.26
1.0
10
060
13
51
.26
1.0
10
060
13
51
.26
1.0
10
060
33C
DS
.25.
CA
M34
2.36
3.7
——
132
6.96
4.0
40.5
619
.11
326.
964.
040
.56
19.1
132
8.56
6.5
42.7
619
.32
348.
162.
859
.56
19.1
234
8.16
2.8
59.5
619
.12
348.
063.
557
.36
19.3
34C
AB
339.
560.
61
339.
860.
610
060
133
9.86
0.7
1006
01
339.
760.
610
060
133
9.86
0.1
1006
035
CA
H(2
-com
p.)
332.
860.
41
325.
963.
349
.86
24.9
132
0.56
4.6
26.4
615
.51
322.
364.
943
.36
19.2
132
5.96
3.3
49.8
624
.92
338.
663.
150
.26
24.9
233
5.96
1.9
73.6
615
.52
336.
862.
656
.86
19.2
233
8.66
3.1
50.2
624
.9(3
-com
p.)
——
131
7.16
3.8
15.3
64.
71
317.
163.
815
.36
4.7
131
7.16
3.8
15.3
64.
72
333.
161.
460
.06
18.2
233
3.16
1.4
60.0
618
.22
333.
161.
460
.06
18.2
334
0.36
4.7
24.7
613
.53
340.
364.
724
.76
13.5
334
0.36
4.7
24.7
613
.536
CP
A(2
-com
p.)
331.
060.
31
327.
761.
677
.56
8.4
132
5.76
1.6
66.5
612
.81
326.
461.
870
.26
12.0
132
6.26
1.5
69.1
612
.42
347.
464.
422
.56
8.4
234
1.76
3.0
33.5
612
.82
343.
664.
229
.86
12.0
234
2.66
3.1
30.9
612
.4(3
-com
p.)
——
130
4.46
11.9
18.6
611
.31
304.
4611
.918
.66
11.3
130
4.46
11.9
18.6
611
.32
330.
761.
673
.26
12.7
233
0.76
1.6
73.2
612
.72
330.
761.
673
.26
12.7
335
1.56
2.9
8.26
1.7
335
1.56
2.9
8.26
1.7
335
1.56
2.9
8.26
1.7
37C
HT
333.
761.
31
329.
362.
257
.66
14.6
133
0.36
2.5
64.6
621
.21
330.
663.
464
.86
17.6
132
8.26
2.7
54.9
617
.02
341.
663.
342
.46
14.6
234
2.16
3.5
35.4
621
.22
342.
463.
635
.26
17.6
234
1.06
2.9
45.1
617
.03
8C
HT
.D3
53
39
.262
.41
32
8.8
60
.12
6.1
62
6.4
13
24
.26
12
.83
4.8
62
0.6
13
26
.16
9.6
32
.36
23
.21
32
4.2
61
2.8
34
.86
20
.62
34
2.5
61
.37
3.9
62
6.4
23
40
.76
2.5
65
.26
20
.62
34
1.6
62
.06
7.7
62
3.2
23
40
.76
2.5
65
.26
20
.63
9C
HT
.D6
0-8
03
39
.860
.11
32
7.8
61
.33
4.0
61
.91
32
8.9
62
.04
4.0
61
0.3
13
28
.56
1.8
35
.36
1.9
13
27
.86
1.3
34
.06
1.9
23
43
.76
1.6
66
.06
1.9
23
43
.96
1.1
56
.06
10
.32
34
4.3
61
.46
4.7
61
.92
34
3.7
61
.66
6.0
61
.940
CH
G(1
-com
p.)
331.
760.
21
332.
060.
510
060
133
1.96
0.4
1006
01
331.
960.
410
060
133
2.26
0.7
1006
0(2
-com
p.)
132
7.56
1.5
61.5
613
.91
327.
963.
150
.06
29.4
132
7.76
2.3
55.7
622
.81
327.
561.
358
.56
19.2
233
9.16
1.9
38.5
613
.92
338.
766.
550
.06
29.4
233
8.96
4.6
44.3
622
.82
339.
464.
041
.56
19.2
41
CH
G.D
35
33
3.26
0.5
13
22
.76
2.9
33
.36
0.2
13
16
.76
4.5
35
.96
11
.11
31
8.7
64
.73
0.7
63
.71
32
2.7
62
.93
3.3
–0
.22
33
6.2
63
.06
6.7
60
.12
33
5.6
60
.16
4.1
61
1.1
23
35
.86
0.4
69
.36
3.7
23
36
.26
3.0
66
.76
0.1
Biophysical Journal 81(3) 1710–1734
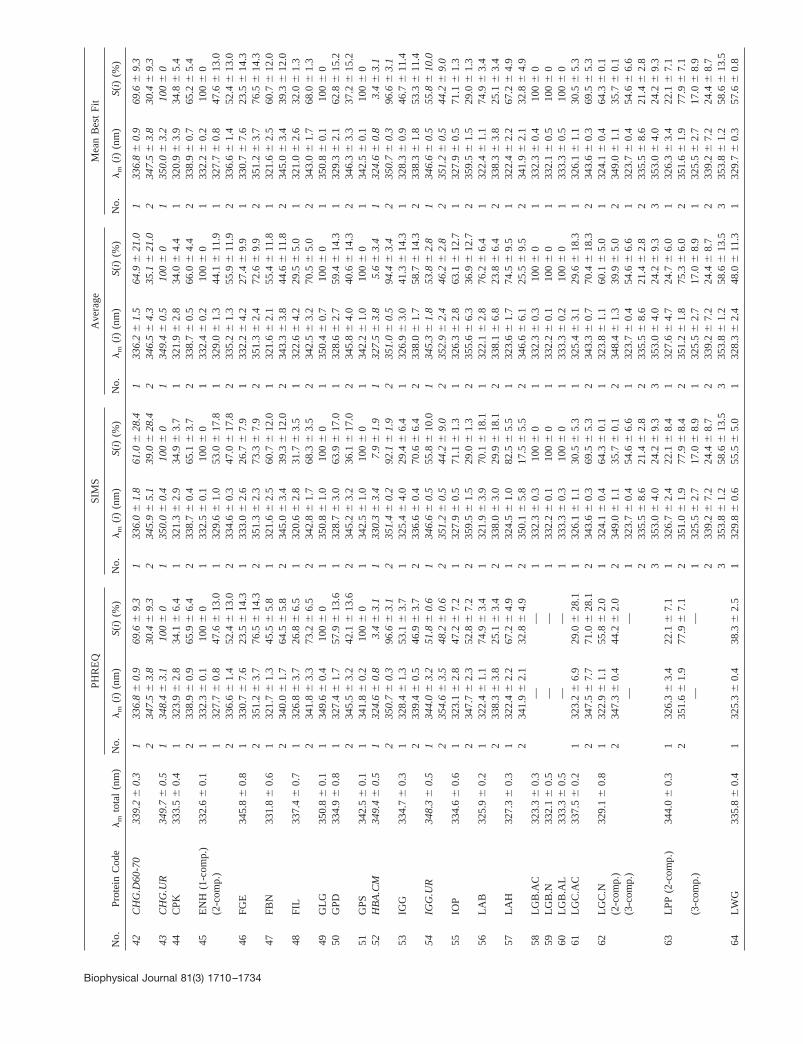
No.
Pro
tein
Cod
el
mto
tal(
nm)
PH
RE
QS
IMS
Ave
rage
Mea
nB
est
Fit
No.
lm
(i)
(nm
)S(
i)(%
)N
o.l
m(i
)(n
m)
S(i)
(%)
No.
lm
(i)
(nm
)S(
i)(%
)N
o.l
m(i
)(n
m)
S(i)
(%)
42
CH
G.D
60
-70
33
9.26
0.3
13
36
.86
0.9
69
.66
9.3
13
36
.06
1.8
61
.06
28
.41
33
6.2
61
.56
4.9
62
1.0
13
36
.86
0.9
69
.66
9.3
23
47
.56
3.8
30
.46
9.3
23
45
.96
5.1
39
.06
28
.42
34
6.5
64
.33
5.1
62
1.0
23
47
.56
3.8
30
.46
9.3
43
CH
G.U
R3
49
.760
.51
34
8.4
63
.11
006
01
35
0.0
60
.41
006
01
34
9.4
60
.51
006
01
35
0.0
63
.21
006
044
CP
K33
3.56
0.4
132
3.96
2.8
34.1
66.
41
321.
362.
934
.96
3.7
132
1.96
2.8
34.0
64.
41
320.
963.
934
.86
5.4
233
8.96
0.9
65.9
66.
42
338.
760.
465
.16
3.7
233
8.76
0.5
66.0
64.
42
338.
960.
765
.26
5.4
45E
NH
(1-c
omp.
)33
2.66
0.1
133
2.36
0.1
1006
01
332.
560.
110
060
133
2.46
0.2
1006
01
332.
260.
210
060
(2-c
omp.
)1
327.
760.
847
.66
13.0
132
9.66
1.0
53.0
617
.81
329.
061.
344
.16
11.9
132
7.76
0.8
47.6
613
.02
336.
661.
452
.46
13.0
233
4.66
0.3
47.0
617
.82
335.
261.
355
.96
11.9
233
6.66
1.4
52.4
613
.046
FG
E34
5.86
0.8
133
0.76
7.6
23.5
614
.31
333.
062.
626
.76
7.9
133
2.26
4.2
27.4
69.
91
330.
767.
623
.56
14.3
235
1.26
3.7
76.5
614
.32
351.
362.
373
.36
7.9
235
1.36
2.4
72.6
69.
92
351.
263.
776
.56
14.3
47F
BN
331.
860.
61
321.
761.
345
.56
5.8
132
1.66
2.5
60.7
612
.01
321.
662.
155
.46
11.8
132
1.66
2.5
60.7
612
.02
340.
061.
764
.56
5.8
234
5.06
3.4
39.3
612
.02
343.
363.
844
.66
11.8
234
5.06
3.4
39.3
612
.048
FIL
337.
460.
71
326.
863.
726
.86
6.5
132
0.66
2.8
31.7
63.
51
322.
664.
229
.56
5.0
132
1.06
2.6
32.0
61.
32
341.
863.
373
.26
6.5
234
2.86
1.7
68.3
63.
52
342.
563.
270
.56
5.0
234
3.06
1.7
68.0
61.
349
GLG
350.
860.
11
349.
660.
410
060
135
0.86
1.0
1006
01
350.
460.
710
060
135
0.86
0.1
1006
050
GP
D33
4.96
0.8
132
7.46
1.7
57.9
613
.61
328.
763.
063
.96
17.0
132
8.66
2.7
59.4
614
.31
329.
362.
162
.86
15.2
234
5.56
3.2
42.1
613
.62
345.
263.
236
.16
17.0
234
5.86
4.0
40.6
614
.32
346.
363.
337
.26
15.2
51G
PS
342.
560.
11
341.
860.
210
060
134
2.56
1.0
1006
01
342.
261.
010
060
134
2.56
0.1
1006
05
2H
BA
.CM
34
9.46
0.5
13
24
.66
0.8
3.4
63
.11
33
0.3
63
.47
.96
1.9
13
27
.56
3.8
5.6
63
.41
32
4.6
60
.83
.46
3.1
23
50
.76
0.3
96
.66
3.1
23
51
.46
0.2
92
.16
1.9
23
51
.06
0.5
94
.46
3.4
23
50
.76
0.3
96
.66
3.1
53IG
G33
4.76
0.3
132
8.46
1.3
53.1
63.
71
325.
464.
029
.46
6.4
132
6.96
3.0
41.3
614
.31
328.
360.
946
.76
11.4
233
9.46
0.5
46.9
63.
72
336.
660.
470
.66
6.4
233
8.06
1.7
58.7
614
.32
338.
361.
853
.36
11.4
54
IGG
.UR
34
8.36
0.5
13
44
.06
3.2
51
.86
0.6
13
46
.66
0.5
55.8
610
.01
34
5.3
61
.85
3.8
62
.81
34
6.6
60
.55
5.8
61
0.0
23
54
.66
3.5
48
.26
0.6
23
51
.26
0.5
44
.26
9.0
23
52
.96
2.4
46
.26
2.8
23
51
.26
0.5
44
.26
9.0
55IO
P33
4.66
0.6
132
3.16
2.8
47.2
67.
21
327.
960.
571
.16
1.3
132
6.36
2.8
63.1
612
.71
327.
960.
571
.16
1.3
234
7.76
2.3
52.8
67.
22
359.
561.
529
.06
1.3
235
5.66
6.3
36.9
612
.72
359.
561.
529
.06
1.3
56LA
B32
5.96
0.2
132
2.46
1.1
74.9
63.
41
321.
963.
970
.16
18.1
132
2.16
2.8
76.2
66.
41
322.
461.
174
.96
3.4
233
8.36
3.8
25.1
63.
42
338.
063.
029
.96
18.1
233
8.16
6.8
23.8
66.
42
338.
363.
825
.16
3.4
57LA
H32
7.36
0.3
132
2.46
2.2
67.2
64.
91
324.
561.
082
.56
5.5
132
3.66
1.7
74.5
69.
51
322.
462.
267
.26
4.9
234
1.96
2.1
32.8
64.
92
350.
165.
817
.56
5.5
234
6.66
6.1
25.5
69.
52
341.
962.
132
.86
4.9
58LG
B.A
C32
3.36
0.3
——
133
2.36
0.3
1006
01
332.
360.
310
060
133
2.36
0.4
1006
059
LGB
.N33
2.16
0.5
——
133
2.26
0.1
1006
01
332.
260.
110
060
133
2.16
0.5
1006
060
LGB
.AL
333.
360.
5—
—1
333.
360.
310
060
133
3.36
0.2
1006
01
333.
360.
510
060
61LG
C.A
C33
7.56
0.2
132
3.26
6.9
29.0
628
.11
326.
161.
130
.56
5.3
132
5.46
3.1
29.6
618
.31
326.
161.
130
.56
5.3
234
7.56
7.7
71.0
628
.12
343.
660.
369
.56
5.3
234
3.36
0.7
70.4
618
.32
343.
660.
369
.56
5.3
62LG
C.N
329.
160.
81
322.
961.
155
.86
2.0
132
4.16
0.4
64.3
60.
11
323.
861.
160
.16
5.0
132
4.16
0.4
64.3
60.
1(2
-com
p.)
234
7.36
0.4
44.2
62.
02
349.
061.
135
.76
0.1
234
8.46
1.3
39.9
65.
02
349.
061.
135
.76
0.1
(3-c
omp.
)—
—1
323.
760.
454
.66
6.6
132
3.76
0.4
54.6
66.
61
323.
760.
454
.66
6.6
233
5.56
8.6
21.4
62.
82
335.
568.
621
.46
2.8
233
5.56
8.6
21.4
62.
83
353.
064.
024
.26
9.3
335
3.06
4.0
24.2
69.
33
353.
064.
024
.26
9.3
63LP
P(2
-com
p.)
344.
060.
31
326.
363.
422
.16
7.1
132
6.76
2.4
22.1
68.
41
327.
664.
724
.76
6.0
132
6.36
3.4
22.1
67.
12
351.
661.
977
.96
7.1
235
1.06
1.9
77.9
68.
42
351.
261.
875
.36
6.0
235
1.66
1.9
77.9
67.
1(3
-com
p.)
——
132
5.56
2.7
17.0
68.
91
325.
562.
717
.06
8.9
132
5.56
2.7
17.0
68.
92
339.
267.
224
.46
8.7
233
9.26
7.2
24.4
68.
72
339.
267.
224
.46
8.7
335
3.86
1.2
58.6
613
.53
353.
861.
258
.66
13.5
335
3.86
1.2
58.6
613
.564
LWG
335.
860.
41
325.
360.
438
.36
2.5
132
9.86
0.6
55.5
65.
01
328.
362.
448
.06
11.3
132
9.76
0.3
57.6
60.
8
Biophysical Journal 81(3) 1710–1734

No.
Pro
tein
Cod
el
mto
tal(
nm)
PH
RE
QS
IMS
Ave
rage
Mea
nB
est
Fit
No.
lm
(i)
(nm
)S(
i)(%
)N
o.l
m(i
)(n
m)
S(i)
(%)
No.
lm
(i)
(nm
)S(
i)(%
)N
o.l
m(i
)(n
m)
S(i)
(%)
234
3.86
0.2
61.7
62.
52
345.
961.
344
.56
5.0
234
5.26
1.5
52.0
611
.32
346.
460.
642
.46
0.8
65LZ
C.A
C33
7.26
0.2
133
0.06
1.2
44.5
65.
71
329.
961.
445
.86
7.7
132
9.96
1.2
42.9
66.
81
330.
061.
244
.56
5.7
(2-c
omp.
)2
346.
460.
855
.56
5.7
234
5.66
12.2
54.2
67.
72
345.
861.
857
.16
6.8
234
6.46
0.8
55.5
65.
7(3
-com
p.)
——
131
7.46
0.3
8.76
2.8
131
7.46
0.3
8.76
2.8
131
7.46
0.3
8.76
2.8
233
3.66
1.7
41.4
60.
32
333.
661.
741
.46
0.3
233
3.66
1.7
41.4
60.
33
345.
761.
949
.96
2.4
334
5.76
1.9
49.9
62.
43
345.
761.
949
.96
2.4
66LZ
C.N
338.
360.
2—
—1
313.
960.
55.
061.
01
313.
960.
55.
061.
01
313.
960.
55.
061.
02
334.
860.
567
.56
5.0
233
4.86
0.5
67.5
65.
02
334.
860.
567
.56
5.0
334
3.06
0.5
27.5
68.
03
343.
060.
527
.56
8.0
334
3.06
0.5
27.5
68.
06
7L
ZC
.UR
34
5.26
3.7
13
33
.26
4.5
30
.26
34
.11
34
0.6
66
.65
0.6
62
.61
33
7.6
66
.64
0.0
62
2.7
13
42
.36
8.3
53
.16
1.8
23
50
.16
2.1
69
.86
34
.12
34
9.0
61
.14
9.4
62
.62
34
9.4
61
.36
0.0
62
2.7
23
50
.76
1.3
46
.96
1.8
68M
SP
349.
860.
21
349.
660.
110
060
135
0.06
0.2
1006
01
349.
060.
210
060
134
9.96
0.2
1006
069
MLT
.MO
N34
9.86
0.5
——
134
9.26
0.5
1006
01
349.
260.
510
060
134
9.86
0.5
1006
070
MLT
.TE
TR
336.
961.
71
331.
364.
956
.66
21.9
132
9.46
4.1
38.5
611
.11
330.
064.
147
.36
17.9
132
9.56
4.5
48.7
613
.92
348.
066.
543
.46
21.9
234
2.36
1.8
61.5
611
.12
344.
264.
552
.76
17.9
234
3.96
3.3
51.3
613
.971
MLT
.CA
M33
8.3
60.
5—
—1
332.
361.
971
.56
12.2
133
2.36
1.9
71.5
612
.21
330.
960.
562
.86
2.0
235
2.86
3.3
28.5
612
.22
352.
863.
328
.56
12.2
235
0.56
0.5
37.2
62.
072
MLT
.LS
332.
260.
51
327.
362.
965
.26
0.1
132
3.26
3.0
50.0
624
.71
324.
563.
242
.56
31.2
132
4.56
3.2
42.5
631
.22
343.
563.
034
.86
0.1
233
5.76
0.2
50.0
624
.72
338.
364.
557
.56
31.2
233
8.36
4.5
57.5
631
.273
HM
M33
7.56
0.5
132
4.06
5.2
17.6
62.
81
323.
660.
513
.06
2.0
132
3.86
0.3
15.2
63.
11
323.
660.
513
.06
2.0
234
0.16
3.1
82.4
60.
62
339.
360.
587
.06
3.0
234
1.16
2.5
84.8
63.
12
339.
360.
587
.06
3.0
74LM
M33
9.4
60.
51
337.
463.
110
060
133
9.46
0.6
1006
01
339.
160.
910
060
133
9.46
0.6
1006
075
MO
N(1
-com
p.)
340.
760.
41
341.
160.
510
060
134
1.16
0.5
1006
01
340.
261.
310
060
134
0.36
1.5
1006
0(2
-com
p.)
133
1.06
3.4
28.3
610
.91
323.
967.
122
.76
8.2
132
5.66
7.2
22.9
68.
81
327.
566.
625
.96
8.6
234
4.86
1.1
71.7
610
.92
344.
161.
377
.36
8.2
234
4.36
1.3
77.1
68.
82
344.
161.
574
.16
8.6
76M
GB
.AP
O33
6.46
0.5
131
9.16
7.8
22.5
619
.21
325.
663.
228
.36
8.6
132
3.46
5.4
24.4
613
.01
325.
363.
722
.56
19.2
234
0.56
2.7
77.5
619
.22
340.
260.
671
.76
8.6
234
0.36
1.3
75.6
613
.02
340.
360.
777
.56
19.2
77M
SS
336.
960.
41
327.
069.
641
.16
28.2
132
8.66
4.8
24.4
626
.21
328.
066.
328
.06
23.1
132
3.46
6.6
12.3
62.
72
342.
265.
559
.96
28.2
233
9.46
1.7
75.6
626
.22
340.
562.
772
.06
23.1
233
8.66
0.6
87.7
62.
77
8M
SS
.UR
34
5.16
0.5
13
38
.26
3.3
31
.96
1.1
13
40
.36
0.5
38
.76
6.0
13
40
.56
2.5
35
.36
4.8
13
38
.26
3.3
31
.96
1.1
23
48
.76
3.3
68
.16
0.6
23
48
.46
0.1
61
.36
5.0
23
48
.56
0.2
64
.86
4.8
23
48
.76
3.3
68
.16
0.6
79M
S1
335.
760.
4—
—1
318.
861.
320
.76
3.0
131
8.86
1.3
20.7
63.
01
318.
861.
320
.76
3.0
233
1.86
0.9
23.0
60.
52
331.
860.
923
.06
0.5
233
1.86
0.9
23.0
60.
53
342.
560.
556
.36
2.5
334
2.56
0.5
56.3
62.
53
342.
560.
556
.36
2.5
80M
S1.
AT
P33
5.56
0.3
——
131
7.46
1.8
13.8
63.
01
317.
461.
813
.86
3.0
131
7.46
1.8
13.8
63.
02
330.
362.
428
.86
5.7
233
0.36
2.4
28.8
65.
72
330.
362.
428
.86
5.7
333
9.26
0.5
57.5
68.
73
339.
260.
557
.56
8.7
333
9.26
0.5
57.5
68.
781
NO
1(1
-com
p.)
346.
160.
21
346.
660.
410
060
134
6.56
0.6
1006
01
346.
560.
610
060
134
6.66
0.4
1006
0(2
-com
p.)
132
9.16
4.4
4.96
1.3
133
5.66
6.8
28.1
620
.11
332.
866.
519
.56
20.3
132
9.16
4.4
4.96
1.3
234
7.46
0.3
95.1
61.
32
350.
162.
371
.96
20.1
234
8.96
2.2
80.5
620
.32
347.
460.
395
.16
1.3
82N
O2
344.
560.
21
344.
163.
110
060
134
4.56
0.3
1006
01
344.
460.
310
060
134
4.46
0.2
1006
083
NS
T33
6.06
0.1
133
0.96
0.8
45.7
65.
71
327.
067.
241
.76
44.1
132
8.36
6.1
33.3
614
.21
330.
960.
845
.76
5.7
234
0.76
0.4
54.9
65.
72
339.
461.
058
.36
44.1
233
9.86
1.0
66.7
614
.22
340.
760.
454
.96
5.7
84N
DP
K.A
.834
0.56
0.4
134
0.26
0.4
1006
01
340.
460.
410
060
134
0.46
0.4
1006
01
340.
460.
310
060
85N
DP
K.A
.5.L
IS33
7.36
0.8
——
132
6.46
4.7
25.9
622
.61
326.
464.
725
.96
22.6
132
7.06
5.0
17.9
611
.72
340.
062.
174
.16
22.6
234
0.06
2.1
74.1
622
.62
340.
062.
382
.16
11.7
Biophysical Journal 81(3) 1710–1734

No.
Pro
tein
Cod
el
mto
tal(
nm)
PH
RE
QS
IMS
Ave
rage
Mea
nB
est
Fit
No.
lm
(i)
(nm
)S(
i)(%
)N
o.l
m(i
)(n
m)
S(i)
(%)
No.
lm
(i)
(nm
)S(
i)(%
)N
o.l
m(i
)(n
m)
S(i)
(%)
86N
DP
K.A
.5.H
IS33
6.56
0.3
132
9.16
0.4
39.4
61.
71
323.
864.
520
.06
10.9
132
5.56
4.4
26.5
613
.01
325.
164.
524
.36
12.6
234
2.26
0.6
60.6
61.
72
339.
061.
380
.06
10.9
234
0.16
1.9
73.5
613
.02
339.
061.
875
.76
12.6
87N
DP
K.B
.833
5.56
0.3
133
5.36
0.8
1006
01
335.
560.
310
060
133
5.46
0.3
1006
01
335.
460.
510
060
88N
DP
K.B
.AC
334.
260.
8—
—1
334.
760.
710
060
133
4.76
0.7
1006
01
334.
461.
110
060
(1-c
omp.
)(2
-com
p.)
——
133
0.06
0.7
78.9
66.
11
330.
060.
778
.96
6.1
133
0.06
0.7
78.9
66.
12
353.
964.
921
.16
6.1
235
3.96
4.9
21.1
66.
12
353.
964.
921
.16
6.1
89O
VH
.LIS
334.
460.
51
325.
862.
617
.66
0.2
132
7.56
0.2
23.0
60.
41
326.
961.
020
.46
4.0
132
5.86
2.6
17.6
60.
22
336.
962.
782
.46
0.1
233
7.06
0.4
77.0
60.
42
336.
960.
379
.66
4.0
233
6.96
2.7
82.4
60.
190
OV
H.H
IS33
4.96
0.1
133
5.16
0.2
1006
01
335.
260.
210
060
133
5.16
0.2
1006
01
334.
960.
110
060
91P
AP
.AC
340.
261.
91
326.
868.
343
.16
16.7
132
3.56
5.4
44.9
617
.81
324.
666.
439
.76
15.3
132
3.86
7.3
37.7
613
.4(2
-com
p.)
234
9.76
3.2
56.9
616
.72
349.
863.
755
.16
17.8
234
9.86
3.4
60.3
615
.32
348.
563.
262
.36
13.4
(3-c
omp.
)—
—1
304.
266.
614
.06
5.4
130
4.26
6.6
14.0
65.
41
304.
266.
614
.06
5.4
233
1.96
5.5
39.5
613
.52
331.
965.
539
.56
13.5
233
1.96
5.5
39.5
613
.53
351.
163.
746
.56
17.5
335
1.16
3.7
46.5
617
.53
351.
163.
746
.56
17.5
92P
AP
.N34
3.36
0.8
132
4.86
4.0
19.3
68.
31
327.
464.
429
.56
13.7
132
6.56
4.2
20.3
66.
41
324.
864.
019
.36
8.3
(2-c
omp.
)2
348.
561.
380
.76
8.3
234
9.16
0.9
70.5
613
.72
348.
961.
079
.76
6.4
234
8.56
1.3
80.7
68.
3(3
-com
p.)
——
131
7.76
6.9
17.5
65.
91
317.
766.
917
.56
5.9
131
7.76
6.9
17.5
65.
92
341.
063.
920
.16
13.0
234
1.06
3.9
20.1
613
.02
341.
063.
920
.16
13.0
334
9.66
4.0
62.4
615
.73
349.
664.
062
.46
15.7
334
9.66
4.0
62.4
615
.793
PA
P.A
L34
8.26
0.6
134
9.06
1.2
1006
01
348.
761.
010
060
134
8.46
1.0
1006
01
348.
561.
210
060
(1-c
omp.
)(2
-com
p.)
133
3.66
8.8
10.3
68.
51
337.
766.
823
.26
28.6
133
6.16
7.3
21.7
626
.31
333.
668.
810
.36
8.5
234
9.66
0.4
89.7
68.
52
350.
660.
676
.86
28.6
235
0.26
0.7
78.3
626
.32
349.
660.
489
.76
8.5
94
PA
P.U
R3
44
.060
.51
31
6.8
64
.31
8.4
60
.71
32
0.7
63
.52
1.8
65
.81
31
9.4
63
.31
8.1
60
.51
31
8.2
60
.51
7.7
61
.02
34
6.5
63
.18
1.6
60
.72
34
6.1
60
.17
8.2
65
.82
34
6.2
60
.38
1.9
60
.52
34
6.0
60
.58
2.3
61
.095
PA
C.A
C34
1.56
0.5
——
131
0.16
0.6
8.66
3.5
131
0.16
0.6
8.66
3.5
130
9.66
2.0
6.16
3.0
(2-c
omp.
)2
342.
660.
491
.46
3.5
234
2.66
0.4
91.4
63.
52
342.
362.
093
.96
3.0
(3-c
omp.
)—
—1
309.
662.
06.
163.
01
309.
662.
06.
163.
01
309.
662.
06.
163.
02
338.
860.
566
.76
3.0
233
8.86
0.5
66.7
63.
02
338.
860.
566
.76
3.0
335
0.86
0.5
27.2
64.
03
350.
860.
527
.26
4.0
335
0.86
0.5
27.2
64.
096
PA
C.A
PO
348.
060.
5—
—1
308.
9612
.017
.06
6.2
130
8.96
12.0
17.0
66.
21
300.
464.
022
.16
7.8
234
9.46
0.6
83.0
66.
22
349.
460.
683
.06
6.2
234
9.06
0.5
77.8
61.
097
PA
C.M
G33
1.16
0.5
——
131
8.16
0.5
55.3
62.
01
318.
160.
555
.36
2.0
131
8.16
0.5
55.3
62.
02
341.
160.
544
.76
2.0
234
1.16
0.5
44.7
62.
02
341.
160.
544
.76
2.0
98P
AC
.CA
325.
860.
5—
—1
326.
560.
710
060
132
6.56
0.7
1006
01
326.
560.
710
060
99P
AM
.AP
O33
6.66
0.5
132
6.96
2.9
43.9
60.
11
327.
762.
654
.96
17.5
132
7.46
1.9
43.2
61.
01
326.
962.
943
.96
0.1
(2-c
omp.
)2
345.
763.
156
.16
0.1
234
1.76
3.4
45.1
617
.52
346.
662.
556
.86
1.0
234
5.76
3.1
56.1
60.
1(3
-com
p.)
——
131
0.66
0.5
8.86
1.0
131
0.66
0.5
8.86
1.0
131
0.66
0.5
8.86
1.0
233
2.46
0.5
58.4
61.
02
332.
460.
558
.46
1.0
233
2.46
0.5
58.4
61.
03
349.
560.
532
.86
3.0
334
9.56
0.5
32.8
63.
03
349.
560.
532
.86
3.0
100
PA
M(2
-com
p.)
336.
460.
51
328.
564.
130
.16
1.3
131
8.96
1.5
36.3
63.
31
322.
165.
632
.16
2.8
131
7.96
0.5
34.0
62.
02
340.
463.
469
.96
0.6
234
1.76
0.2
63.7
63.
32
341.
260.
767
.96
2.8
234
1.56
0.5
66.0
62.
0(3
-com
p.)
——
131
7.26
0.5
32.1
63.
01
317.
260.
532
.16
3.0
131
7.26
0.5
32.1
63.
02
333.
260.
56.
562.
02
333.
260.
56.
562.
02
333.
260.
56.
562.
03
341.
860.
561
.46
7.0
334
1.86
0.5
61.4
67.
03
341.
860.
561
.46
7.0
Biophysical Journal 81(3) 1710–1734

No.
Pro
tein
Cod
el
mto
tal(
nm)
PH
RE
QS
IMS
Ave
rage
Mea
nB
est
Fit
No.
lm
(i)
(nm
)S(
i)(%
)N
o.l
m(i
)(n
m)
S(i)
(%)
No.
lm
(i)
(nm
)S(
i)(%
)N
o.l
m(i
)(n
m)
S(i)
(%)
101
PM
T.A
PO
349.
960.
5—
—1
349.
860.
110
060
134
9.86
0.1
1006
01
349.
860.
510
060
(1-c
omp.
)(2
-com
p.)
——
133
1.26
0.5
9.56
2.0
133
1.26
0.5
9.56
2.0
133
1.26
0.5
9.56
2.0
235
1.76
0.5
90.5
62.
02
351.
760.
590
.56
2.0
235
1.76
0.5
90.5
62.
010
2P
MT
.CA
324.
860.
5—
—1
324.
461.
110
060
132
4.56
0.8
1006
01
324.
860.
510
060
(1-c
omp.
)—
—1
313.
061.
518
.36
2.0
131
3.06
1.5
18.3
62.
01
313.
061.
518
.36
2.0
(2-c
omp.
)2
326.
060.
581
.76
5.0
232
6.06
0.5
81.7
65.
02
326.
060.
581
.76
5.0
103
PM
T.M
G32
.26
0.5
——
133
2.06
0.2
1006
01
332.
060.
210
060
133
1.86
0.5
1006
0(1
-com
p.)
(2-c
omp.
)—
—1
325.
160.
574
.16
1.0
132
5.16
0.5
74.1
61.
01
325.
160.
574
.16
1.0
235
1.36
0.5
25.9
61.
02
351.
360.
525
.96
1.0
235
1.36
0.5
25.9
61.
010
4P
AN
.AP
O34
8.66
0.5
——
132
1.46
2.5
6.56
0.8
132
1.46
2.5
6.56
0.8
132
3.16
0.5
7.16
1.0
234
9.96
0.2
93.5
60.
82
349.
960.
293
.56
0.8
235
0.06
0.5
92.9
61.
010
5P
AN
.CA
324.
760.
5—
—1
324.
760.
110
060
132
4.76
0.1
1006
01
324.
760.
510
060
106
PA
N.M
G33
2.66
0.5
——
131
7.06
1.8
42.4
63.
51
317.
061.
842
.46
3.5
131
8.26
0.5
44.8
62.
02
339.
260.
857
.66
3.5
233
9.26
0.8
57.6
63.
52
339.
760.
855
.26
2.0
107
PE
B.1
-334
0.26
0.4
133
4.46
1.4
52.0
613
.81
332.
064.
944
.06
21.9
133
2.86
4.1
38.3
617
.51
330.
866.
241
.96
23.0
(2-c
omp.
)2
347.
462.
448
.06
13.8
234
3.96
1.5
56.0
621
.92
345.
162.
461
.76
17.5
234
5.96
3.4
58.1
623
.0(3
-com
p.)
——
131
9.46
4.2
12.1
66.
81
319.
464.
212
.16
6.8
131
9.46
4.2
12.1
66.
82
340.
760.
851
.46
12.6
234
0.76
0.8
51.4
612
.62
340.
760.
851
.46
12.6
334
4.36
2.2
36.5
66.
63
344.
362.
236
.56
6.6
334
4.36
2.2
36.5
66.
610
8P
EB
.4-5
342.
560.
81
327.
567.
022
.06
15.6
132
7.46
4.6
20.6
66.
51
327.
465.
219
.06
11.0
132
5.56
6.0
15.7
67.
2(2
-com
p.)
234
7.16
4.8
78.0
615
.62
345.
762.
179
.46
6.5
234
6.26
3.2
81.0
611
.02
345.
161.
684
.36
7.2
(3-c
omp.
)—
—1
317.
564.
112
.06
6.0
131
7.56
4.1
12.0
66.
01
317.
564.
112
.06
6.0
233
8.76
4.6
14.8
66.
02
338.
764.
614
.86
6.0
233
8.76
4.6
14.8
66.
03
345.
962.
973
.26
2.1
334
5.96
2.9
73.2
62.
13
345.
962.
973
.26
2.1
10
9P
EB
.6-9
34
2.56
0.5
13
43
.46
0.4
10
060
13
42
.96
0.6
10
060
13
43
.16
0.6
10
060
13
42
.36
0.4
10
060
(1-c
om
p.)
(2-c
om
p.)
13
37
.262
.34
4.2
61
0.4
13
35
.26
3.3
36
.26
11
.41
33
6.2
62
.74
2.4
61
0.3
13
36
.56
2.8
48
.56
10
.22
34
8.6
62
.05
5.8
61
0.4
23
46
.96
0.6
63
.86
11
.42
34
7.6
61
.55
7.6
61
0.3
23
49
.76
1.0
51
.56
10
.21
10
PE
B.U
R3
48
.160
.51
32
6.2
63
.11
0.3
60
.51
32
7.6
67
.51
2.5
66
.91
32
7.1
65
.41
3.9
65
.01
32
6.2
63
.11
0.3
60
.52
35
0.0
63
.18
9.7
60
.12
34
9.9
61
.18
7.5
66
.92
34
9.9
60
.88
6.1
65
.02
35
0.0
63
.18
9.7
60
.111
1P
HA
327.
360.
51
320.
260.
761
.06
5.2
132
3.36
1.5
81.1
64.
71
322.
562.
074
.86
11.7
132
2.86
2.1
76.2
613
.52
337.
562.
339
.06
5.2
234
6.56
2.5
18.9
64.
72
345.
267.
125
.26
11.7
234
5.86
9.9
23.8
613
.511
2P
GK
335.
860.
21
323.
763.
241
.06
3.1
132
3.76
0.4
53.8
60.
11
323.
762.
047
.26
7.5
132
3.06
0.8
48.7
68.
72
344.
661.
759
.06
3.1
234
8.16
1.5
46.2
60.
12
346.
362.
452
.86
7.5
234
6.66
1.1
51.3
68.
711
3P
LB34
4.36
0.5
133
1.86
2.4
21.6
617
.71
330.
064.
835
.56
4.7
133
0.56
4.1
30.4
612
.21
331.
764.
536
.76
2.7
234
9.06
3.7
79.4
617
.72
351.
561.
565
.56
4.7
235
0.86
2.3
69.6
612
.22
352.
361.
563
.36
2.7
114
PLS
343.
560.
11
323.
7613
.728
.76
22.6
132
5.56
4.7
21.2
68.
91
324.
967.
224
.76
14.2
132
3.76
8.5
27.3
616
.12
350.
665.
671
.36
22.6
234
8.36
1.5
78.8
68.
92
349.
063.
075
.36
14.2
234
9.46
3.6
72.7
616
.111
5P
AO
.LIS
337.
160.
4—
—1
320.
164.
735
.36
10.6
132
0.16
4.7
35.3
610
.61
322.
462.
540
.96
7.9
234
3.46
2.9
64.7
610
.62
343.
462.
964
.76
10.6
234
4.76
2.8
59.1
67.
911
6P
AO
.HIS
344.
060.
21
329.
062.
321
.96
6.9
133
0.36
2.8
28.3
611
.91
329.
962.
529
.76
9.8
133
1.46
1.1
26.9
610
.02
349.
961.
278
.16
6.9
235
0.86
2.3
71.8
611
.92
350.
561.
970
.36
9.8
235
1.66
1.3
73.1
610
.01
17
PA
O.G
DN
34
6.56
0.5
——
13
46
.66
0.2
10
060
13
46
.66
0.2
10
060
13
46
.56
0.5
10
060
Biophysical Journal 81(3) 1710–1734

No.
Pro
tein
Cod
el
mto
tal(
nm)
PH
RE
QS
IMS
Ave
rage
Mea
nB
est
Fit
No.
lm
(i)
(nm
)S(
i)(%
)N
o.l
m(i
)(n
m)
S(i)
(%)
No.
lm
(i)
(nm
)S(
i)(%
)N
o.l
m(i
)(n
m)
S(i)
(%)
118
PLC
(1-c
omp.
)34
3.36
0.3
——
134
2.96
0.6
1006
01
342.
960.
610
060
134
3.06
0.2
1006
0(2
-com
p.)
——
132
7.66
2.6
8.46
0.4
132
7.66
2.6
8.46
0.4
132
7.66
2.6
8.46
0.4
234
4.36
0.1
91.6
60.
42
344.
360.
191
.66
0.4
234
4.36
0.1
91.6
60.
411
9P
RL*
(1-c
omp.
)33
6.96
0.3
——
133
7.36
0.4
1006
01
337.
360.
410
060
133
6.96
0.4
1006
0(2
-com
p.)
——
133
4.06
1.2
79.7
69.
21
334.
061.
279
.76
9.2
133
3.66
0.5
83.2
62.
02
352.
264.
220
.26
9.2
235
2.26
4.2
20.2
69.
22
354.
861.
516
.86
4.0
120
PC
E33
5.36
0.1
132
3.56
1.4
46.3
62.
21
329.
960.
075
.26
0.7
132
6.76
3.8
60.7
616
.81
327.
464.
365
.06
17.6
234
8.46
0.5
53.7
62.
22
355.
660.
124
.86
0.7
235
7.06
9.9
39.3
616
.82
359.
7610
.135
.06
17.7
121
PR
H.L
IS34
5.06
1.0
134
4.96
0.5
1006
01
345.
260.
910
060
134
5.06
0.9
1006
01
345.
460.
710
060
122
PR
H.H
IS34
2.86
0.7
132
8.86
3.5
23.3
63.
21
332.
261.
739
.16
3.7
133
1.16
2.7
30.8
69.
01
328.
863.
523
.36
3.2
234
8.56
1.9
76.7
63.
22
350.
761.
660
.96
3.7
234
9.96
1.9
69.2
69.
02
348.
561.
976
.76
3.2
123
PR
H.P
ST
344.
361.
11
344.
460.
510
060
134
4.66
1.1
1006
01
344.
6,1.
010
060
134
4.96
0.9
1006
012
4P
RS
333.
960.
11
333.
060.
910
060
133
3.96
0.2
1006
01
333.
660.
610
060
133
3.96
0.1
1006
012
5P
RK
332.
960.
61
323.
762.
933
.96
8.4
132
8.06
1.6
72.5
69.
81
326.
463.
058
.46
21.4
132
6.96
2.9
59.3
622
.22
337.
861.
466
.16
8.4
234
7.16
3.7
27.5
69.
82
343.
765.
541
.66
21.4
234
4.26
6.5
40.7
622
.212
6P
YK
338.
761.
31
328.
265.
432
.06
12.7
133
1.26
3.8
44.9
614
.41
330.
564.
533
.06
10.9
132
8.26
5.4
32.0
612
.72
344.
564.
168
.06
12.7
234
6.06
2.3
55.1
614
.42
345.
563.
067
.06
10.9
234
4.56
4.1
68.0
612
.712
7P
YK
.PE
G33
9.96
0.5
132
1.16
2.9
25.2
60.
11
325.
661.
845
.36
8.6
132
4.16
2.9
32.2
69.
91
321.
162.
925
.26
0.1
234
6.26
3.1
74.8
60.
02
350.
061.
754
.76
8.6
234
8.76
2.5
67.8
69.
92
346.
263.
174
.86
0.0
128
RE
C.A
PO
*32
9.96
0.5
——
131
9.46
0.5
51.3
61.
01
319.
460.
551
.36
1.0
131
9.46
0.5
51.3
61.
02
336.
760.
548
.76
3.0
233
6.76
0.5
48.7
63.
02
336.
760.
548
.76
3.0
129
RE
C.C
A*
336.
660.
5—
—1
326.
060.
550
.66
1.0
132
6.06
0.5
50.6
61.
01
326.
060.
550
.66
1.0
234
5.26
0.5
49.4
62.
02
345.
260.
549
.46
2.0
234
5.26
0.5
49.4
62.
013
0R
CG
339.
160.
71
325.
663.
333
.56
6.1
133
2.36
2.5
64.2
616
.51
330.
064.
253
.86
22.6
133
0.56
3.8
65.0
618
.32
346.
862.
266
.56
6.1
235
1.86
1.1
35.8
616
.52
348.
863.
246
.26
22.6
235
9.26
12.9
35.0
618
.313
1R
NC
(1-c
omp.
)32
7.46
0.4
132
7.56
0.6
1006
01
327.
560.
710
060
132
7.46
0.6
1006
01
327.
460.
610
060
(2-c
omp.
)1
324.
561.
669
.96
16.2
132
5.86
1.6
74.7
618
.51
325.
361.
764
.56
21.9
132
3.76
3.1
73.4
616
.12
335.
163.
530
.16
16.2
233
4.06
4.3
25.3
618
.52
334.
663.
935
.56
21.9
233
5.16
3.6
26.6
616
.113
2R
NI
334.
660.
51
318.
662.
928
.86
0.1
132
8.16
0.6
67.1
66.
31
324.
965.
550
.26
30.2
132
8.56
0.5
71.5
61.
02
342.
063.
071
.26
0.1
235
7.66
1.7
32.9
66.
32
352.
469.
149
.86
30.2
235
8.86
0.5
28.5
61.
013
3R
NT
325.
660.
61
325.
161.
010
060
132
4.66
1.9
1006
01
324.
561.
810
060
132
5.16
0.8
1006
013
4R
S4
(2-c
omp.
)33
6.16
0.1
133
0.06
1.8
57.1
64.
21
329.
660.
159
.16
4.6
132
9.86
1.0
58.1
63.
81
330.
061.
857
.16
4.2
234
5.16
0.1
42.9
64.
22
345.
261.
640
.96
4.6
234
5.16
0.9
41.9
63.
82
345.
160.
142
.96
4.2
(3-c
omp.
)—
—1
324.
660.
718
.56
2.5
132
4.66
0.7
18.5
62.
51
324.
660.
718
.56
2.5
233
5.06
0.8
61.6
611
.12
335.
060.
861
.66
11.1
233
5.06
0.8
61.6
611
.13
350.
863.
919
.96
8.7
335
0.86
3.9
19.9
68.
73
350.
863.
919
.96
8.7
135
RS
734
1.96
0.7
132
9.66
3.4
33.1
611
.91
324.
965.
326
.66
7.4
132
6.56
5.1
31.2
68.
01
329.
663.
431
.86
10.1
235
1.16
2.8
66.9
611
.92
349.
061.
673
.46
7.4
234
9.76
2.1
69.8
68.
02
351.
162.
868
.26
10.1
136
RIP
(1-c
omp.
)34
0.66
0.5
134
1.86
0.8
1006
01
342.
761.
910
060
134
2.06
1.5
1006
01
341.
961.
210
060
137
RC
A(2
-com
p.)
330.
561.
41
325.
863.
056
.46
20.8
132
6.96
1.1
83.1
66.
01
326.
261.
767
.66
18.6
132
4.96
1.8
62.7
621
.22
343.
764.
843
.66
20.8
235
3.46
6.4
16.9
66.
02
351.
267.
132
.46
18.6
234
5.56
4.9
37.3
621
.2(3
-com
p.)
——
132
4.06
3.3
44.7
625
.91
324.
063.
344
.76
25.9
132
4.06
3.3
44.7
625
.92
330.
361.
743
.96
23.7
233
0.36
1.7
43.9
623
.72
330.
361.
743
.96
23.7
335
9.06
3.8
11.4
63.
93
359.
063.
811
.46
3.9
335
9.06
3.8
11.4
63.
913
8R
CB
.433
6.16
1.3
133
1.76
1.9
48.9
612
.71
331.
561.
463
.76
11.0
133
1.66
1.4
60.3
614
.81
330.
161.
761
.06
12.0
234
5.96
3.2
51.1
612
.72
351.
064.
536
.36
11.0
234
8.36
6.5
39.7
614
.82
349.
765.
039
.06
12.0
Biophysical Journal 81(3) 1710–1734

No.
Pro
tein
Cod
el
mto
tal(
nm)
PH
RE
QS
IMS
Ave
rage
Mea
nB
est
Fit
No.
lm
(i)
(nm
)S(
i)(%
)N
o.l
m(i
)(n
m)
S(i)
(%)
No.
lm
(i)
(nm
)S(
i)(%
)N
o.l
m(i
)(n
m)
S(i)
(%)
139
RC
B.4
.LA
C33
0.96
0.9
132
6.16
0.4
54.9
610
.51
326.
360.
874
.76
6.2
132
6.26
0.5
64.8
613
.41
326.
060.
477
.86
1.7
234
0.66
7.3
45.1
610
.52
349.
761.
325
.36
6.2
234
5.16
6.8
39.2
613
.42
348.
263.
522
.26
1.7
140
RC
B.5
-733
1.46
0.9
132
2.86
3.7
41.7
618
.31
326.
660.
962
.56
10.4
132
5.56
2.6
55.3
619
.11
324.
263.
258
.76
15.2
(2-c
omp.
)2
343.
166.
258
.36
18.3
234
4.96
3.2
37.5
610
.42
343.
863.
844
.76
19.1
234
4.56
4.6
41.3
615
.2(3
-com
p.)
——
132
7.06
1.0
54.9
611
.21
327.
061.
054
.96
11.2
132
7.06
1.0
54.9
611
.22
333.
761.
729
.06
11.1
233
3.76
1.7
29.0
611
.12
333.
761.
729
.06
11.1
335
6.06
2.7
16.2
61.
93
356.
062.
716
.26
1.9
335
6.06
2.7
16.2
61.
914
1R
CC
331.
461.
21
320.
562.
940
.66
11.4
132
7.26
1.1
67.8
612
.31
324.
964.
058
.36
20.1
132
4.16
3.7
58.4
620
.52
339.
863.
359
.46
11.4
234
6.06
5.0
32.2
612
.32
342.
867.
541
.76
20.1
234
5.66
6.8
41.6
620
.514
2S
TP
333.
560.
5—
—1
335.
661.
010
060
133
5.66
1.0
1006
01
335.
060.
510
060
143
SP
C(2
-com
p.)
341.
760.
11
324.
960.
413
.46
3.0
132
6.36
7.7
33.3
626
.91
326.
266.
018
.36
8.8
132
5.66
1.3
18.3
68.
82
344.
760.
186
.66
3.0
234
5.56
2.0
66.7
626
.92
345.
261.
581
.76
8.8
234
5.46
1.2
81.7
68.
8(3
-com
p.)
——
132
2.06
6.0
352.
262.
81
322.
066.
035
2.26
2.8
132
2.06
6.0
352.
262.
82
342.
163.
658
.66
14.7
234
2.16
3.6
58.6
614
.72
342.
163.
658
.66
14.7
335
2.26
2.8
24.4
60.
93
352.
262.
824
.46
0.9
335
2.26
2.8
24.4
60.
914
4B
PN
345.
760.
71
346.
260.
610
060
134
5.76
0.7
1006
01
346.
260.
710
060
134
6.26
0.6
1006
014
5S
LC35
0.06
2.0
131
5.86
8.6
17.5
65.
81
319.
864.
922
.06
4.6
131
8.46
6.5
20.4
65.
81
315.
868.
617
.56
5.8
235
3.06
1.0
82.5
65.
82
354.
561.
778
.06
4.6
235
4.06
1.6
79.6
65.
82
353.
061.
082
.56
5.8
146
KR
P33
2.46
0.5
133
2.46
3.1
1006
01
332.
960.
510
060
133
2.66
0.4
1006
01
332.
460.
510
060
14
7T
MV
.UR
35
2.26
3.3
13
52
.26
3.3
10
060
13
52
.26
0.1
10
060
13
52
.26
0.1
10
060
13
52
.56
0.5
10
060
148
TN
T34
1.86
0.5
134
3.56
3.1
1006
01
343.
562.
410
060
134
3.26
1.8
1006
01
343.
961.
910
060
149
TR
Y33
4.56
1.3
132
9.56
2.4
55.8
622
.71
330.
762.
172
.66
16.4
133
0.36
2.2
63.1
619
.91
328.
863.
059
.96
20.4
234
6.16
4.6
44.2
622
.72
347.
064.
323
.46
16.4
234
6.66
4.3
36.9
619
.92
346.
864.
840
.16
20.4
15
0T
RY
.D3
53
39
.060
.51
33
3.8
63
.06
5.8
60
.11
33
1.2
64
.25
4.9
62
5.9
13
32
.16
3.4
51
.26
20
.61
33
3.8
63
.06
5.8
60
.12
34
9.9
63
.13
4.2
60
.12
34
7.8
64
.54
5.1
62
5.9
23
48
.56
3.4
48
.86
20
.62
34
9.9
63
.13
4.2
60
.11
51
TR
Y.D
60
-70
33
8.06
0.9
13
29
.06
4.2
32
.96
19
.41
33
2.1
63
.03
1.5
62
3.6
13
30
.86
3.6
37
.56
22
.91
32
9.0
64
.23
2.9
61
9.4
23
42
.16
3.0
67
.16
19
.42
34
1.7
63
.66
8.5
62
3.6
23
41
.86
3.3
62
.66
22
.92
34
2.1
63
.06
7.1
61
9.4
152
TR
G(1
-com
p.)
332.
660.
41
332.
060.
910
060
133
2.56
0.4
1006
01
332.
360.
610
060
133
2.36
0.5
1006
0(2
-com
p.)
132
7.56
4.2
44.8
629
.71
327.
661.
448
.06
18.9
132
7.66
2.1
48.5
624
.21
327.
063.
149
.46
24.9
233
8.96
3.9
55.2
629
.72
337.
262.
852
.06
18.9
233
7.36
2.8
51.5
624
.22
337.
763.
350
.66
24.9
153
VIN
338.
460.
51
333.
861.
655
.76
11.5
133
3.36
3.4
61.0
63.
21
333.
562.
563
.76
15.1
133
3.86
1.6
55.7
611
.52
346.
161.
444
.36
11.2
234
5.66
0.5
39.0
63.
22
345.
860.
836
.36
15.1
234
6.16
1.4
44.3
611
.21
54
VIN
.UR
34
5.36
0.6
13
41
.86
2.1
51
.26
26
.71
34
3.3
60
.15
7.9
61
3.4
13
42
.56
1.7
54
.56
17
.71
34
1.8
62
.15
1.2
62
6.7
23
51
.76
2.6
48
.86
26
.72
35
0.6
61
.14
2.1
61
3.4
23
51
.16
1.8
45
.56
17
.72
35
1.7
62
.64
8.8
62
6.7
155
VT
A.A
C33
9.46
1.7
——
133
3.96
0.9
74.3
66.
81
333.
960.
974
.36
6.8
133
3.76
0.7
75.5
68.
72
357.
368.
325
.76
6.8
235
7.36
8.3
25.7
66.
82
353.
768.
424
.56
8.7
156
VT
A.H
IS33
9.96
2.6
132
1.16
1.9
13.8
64.
21
321.
664.
625
.36
12.7
132
1.56
3.9
23.1
611
.51
323.
663.
430
.66
17.6
234
5.66
1.8
86.2
64.
22
345.
363.
274
.76
12.7
234
5.36
2.8
76.9
611
.52
346.
262.
169
.46
17.6
157
VT
A.L
IS34
8.26
0.8
134
9.16
4.0
1006
01
348.
960.
510
060
134
9.36
0.7
1006
01
349.
160.
710
060
158
VT
B(1
-com
p.)
343.
260.
81
343.
863.
210
060
134
3.86
1.0
1006
01
343.
760.
910
060
134
4.06
0.7
1006
0(2
-com
p.)
133
1.76
3.2
23.2
60.
31
336.
464.
945
.46
38.0
133
5.96
4.8
47.2
632
.81
336.
264.
348
.46
33.4
234
7.56
3.1
76.8
60.
22
353.
5610
.954
.66
38.0
235
2.96
10.5
52.8
632
.82
351.
269.
051
.66
33.4
159
VT
C33
4.36
0.3
——
133
4.36
0.3
1006
01
334.
360.
310
060
133
4.26
0.3
1006
01
60
VS
C.A
C3
44
.460
.51
33
6.2
65
.84
0.3
64
.11
32
9.6
63
.33
8.3
61
3.5
13
31
.86
4.5
39
.06
9.7
13
31
.96
0.5
47
.96
1.0
23
50
.36
6.4
59
.76
3.2
23
58
.66
3.3
41
.76
13
.62
35
5.8
65
.36
1.0
69
.72
36
0.9
60
.55
2.1
61
.016
1V
SC
.N33
2.56
1.9
132
4.66
2.9
45.1
616
.61
325.
161.
559
.56
10.7
132
4.96
2.0
54.6
616
.51
325.
261.
664
.06
10.6
Biophysical Journal 81(3) 1710–1734

obtained with two decomposition algorithms, SIMS (375components) and PHREQ (249 components), respectively.PanelsC and D reflect the results obtained using twoschemes of averaging (“Average” and “Mean Best Fit” inTable 2), respectively. All four histograms have the well-expressed deep minimum at 335–337 nm as a commonfeature. This feature seems to clearly demonstrate the exis-tence of a statistical discreteness of at least two large spec-tral classes of tryptophan residues in native proteins. More-over, panelsA–D demonstrate reproducible dips at 3296 1and 3476 1 nm, which may also mark the frontiers betweenoverlapping discrete classes of tryptophans in proteins.
However, the canonical form of histogram, constructedfrom columns, cannot reflect the accuracy of calculatedmaximum position values and of relative contributions ofcomponents in the whole emission spectrum. Therefore, weconstructed a new kind of histogram accounting for thesefactors (Figs. 3-5). In such histograms, each element (theindividual ith spectral component) is represented by thelittle Gauss distributiony(lm(i)) with maximum atlm(i),s(i) equal to the standard (root-mean-square one) error ofthe meanlm(i) value (see Table 2), and the maximal am-plitude of Gauss curves proportional to the relative contri-bution S(i) of the ith component to the total protein emis-sion. Such a histogram is a sum of these elements:
y~lm! 5 a~i!OiHS~i!
s~i!expFl 2 l~i!
s~i! G2JHere, S(i) is expressed in decimal fractions anda(i) is amultiplier equal to 1 if only one decomposition result isselected for a protein spectrum, or to 0.5 in the cases whentwo solutions with similar functional values are taken.
In such a representation, the histograms of Fig. 2 acquirethe view seen in Fig. 3 (curves N). In this case, theS(i)values are taken to be 1, ands 5 1.0 for every spectralcomponent. One can see that the main features of thecanonical histograms are retained in the new, Gauss-curve-based representation. Besides the histograms for compo-nents of spectra of native proteins, Fig. 3 also contains thecurves obtained for proteins denatured under various influ-ences (see Table 2). The shorter-wavelength “continua”reflect the fact that denaturation is not completed in somecases and the emission spectra possess components belong-ing to the retained populations of native and/or partly un-folded molecules. However, the highest peak at;350 nmand peaks or shoulders at 340–347 nm are due to thecomponents belonging to tryptophans in proteins denaturedby urea or guanidinium chloride and by dioxane, pH andother less unfolding denaturing factors. It is interesting thatthe histograms for denatured proteins also have the minimaat 335–340 nm, which position coincides with the deepminima of histograms for native proteins.
We constructed two more Gauss-curve-based histo-grams with values ofs(i) and S(i) varying according toN
o.P
rote
inC
ode
lm
tota
l(nm
)
PH
RE
QS
IMS
Ave
rage
Mea
nB
est
Fit
No.
lm
(i)
(nm
)S(
i)(%
)N
o.l
m(i
)(n
m)
S(i)
(%)
No.
lm
(i)
(nm
)S(
i)(%
)N
o.l
m(i
)(n
m)
S(i)
(%)
(2-c
omp.
)2
341.
967.
354
.96
16.6
234
5.96
4.4
40.5
610
.72
344.
665.
645
.46
16.5
234
7.66
4.2
36.0
610
.6(3
-com
p.)
——
132
4.16
2.1
43.2
621
.41
324.
162.
143
.26
21.4
132
4.16
2.1
43.2
621
.42
333.
766.
434
.86
15.2
233
3.76
6.4
34.8
615
.22
333.
766.
434
.86
15.2
335
0.86
3.6
22.0
67.
63
350.
863.
622
.06
7.6
335
0.86
3.6
22.0
67.
616
2aV
SC
.MO
D34
1.76
0.2
132
8.26
2.3
25.7
66.
91
330.
161.
232
.26
6.1
132
9.56
1.7
31.4
67.
81
328.
262.
325
.76
6.9
(2-c
omp.
)2
350.
760.
574
.36
6.9
235
5.16
2.9
67.8
66.
12
353.
363.
268
.66
7.8
235
0.76
0.5
74.3
66.
91
62
bV
SC
.MO
D—
—1
32
9.7
61
.62
7.3
63
.01
32
9.7
61
.62
7.3
63
.01
32
9.7
61
.62
7.3
63
.0(3
-co
mp
.)2
34
4.76
1.3
42
.16
5.2
23
44
.76
1.3
42
.16
5.2
23
44
.76
1.3
42
.16
5.2
33
61
.16
4.0
30
.66
2.2
33
61
.16
4.0
30
.66
2.2
33
61
.16
4.0
30
.66
2.2
16
3V
SC
.UR
34
9.56
0.5
13
31
.26
3.2
9.6
60
.11
33
8.6
60
.91
9.6
64
.51
33
6.1
64
.41
6.2
69
.21
33
1.2
63
.29
.66
0.1
23
53
.56
3.4
90
.46
0.1
23
54
.86
0.1
80
.46
4.5
23
54
.36
0.7
83
.86
9.2
23
53
.56
3.4
90
.46
0.1
Info
rmat
ion
onde
natu
red
prot
eins
appe
ars
inita
lics.
*Flu
ores
cenc
ew
asex
cite
dat
280
nm.
1726 Biophysical Journal Volume 81 September 2001 1710–1734
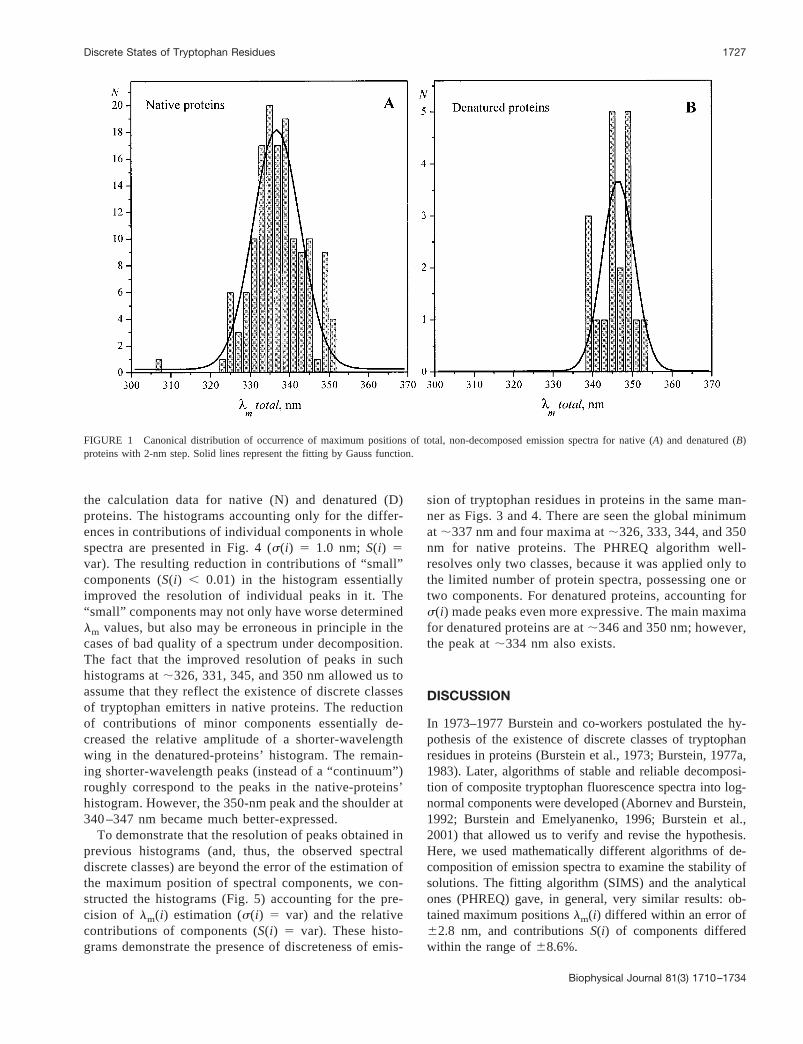
the calculation data for native (N) and denatured (D)proteins. The histograms accounting only for the differ-ences in contributions of individual components in wholespectra are presented in Fig. 4 (s(i) 5 1.0 nm; S(i) 5var). The resulting reduction in contributions of “small”components (S(i) , 0.01) in the histogram essentiallyimproved the resolution of individual peaks in it. The“small” components may not only have worse determinedlm values, but also may be erroneous in principle in thecases of bad quality of a spectrum under decomposition.The fact that the improved resolution of peaks in suchhistograms at;326, 331, 345, and 350 nm allowed us toassume that they reflect the existence of discrete classesof tryptophan emitters in native proteins. The reductionof contributions of minor components essentially de-creased the relative amplitude of a shorter-wavelengthwing in the denatured-proteins’ histogram. The remain-ing shorter-wavelength peaks (instead of a “continuum”)roughly correspond to the peaks in the native-proteins’histogram. However, the 350-nm peak and the shoulder at340 –347 nm became much better-expressed.
To demonstrate that the resolution of peaks obtained inprevious histograms (and, thus, the observed spectraldiscrete classes) are beyond the error of the estimation ofthe maximum position of spectral components, we con-structed the histograms (Fig. 5) accounting for the pre-cision of lm(i) estimation (s(i) 5 var) and the relativecontributions of components (S(i) 5 var). These histo-grams demonstrate the presence of discreteness of emis-
sion of tryptophan residues in proteins in the same man-ner as Figs. 3 and 4. There are seen the global minimumat ;337 nm and four maxima at;326, 333, 344, and 350nm for native proteins. The PHREQ algorithm well-resolves only two classes, because it was applied only tothe limited number of protein spectra, possessing one ortwo components. For denatured proteins, accounting fors(i) made peaks even more expressive. The main maximafor denatured proteins are at;346 and 350 nm; however,the peak at;334 nm also exists.
DISCUSSION
In 1973–1977 Burstein and co-workers postulated the hy-pothesis of the existence of discrete classes of tryptophanresidues in proteins (Burstein et al., 1973; Burstein, 1977a,1983). Later, algorithms of stable and reliable decomposi-tion of composite tryptophan fluorescence spectra into log-normal components were developed (Abornev and Burstein,1992; Burstein and Emelyanenko, 1996; Burstein et al.,2001) that allowed us to verify and revise the hypothesis.Here, we used mathematically different algorithms of de-composition of emission spectra to examine the stability ofsolutions. The fitting algorithm (SIMS) and the analyticalones (PHREQ) gave, in general, very similar results: ob-tained maximum positionslm(i) differed within an error of62.8 nm, and contributionsS(i) of components differedwithin the range of68.6%.
FIGURE 1 Canonical distribution of occurrence of maximum positions of total, non-decomposed emission spectra for native (A) and denatured (B)proteins with 2-nm step. Solid lines represent the fitting by Gauss function.
Discrete States of Tryptophan Residues 1727
Biophysical Journal 81(3) 1710–1734

First of all, we showed that the distribution of maximumpositions of total, nondecomposed spectra (“lm total” inTable 2) for native proteins is rather well-fitted by a Gaussequation with the maximum at;337 nm and dispersion of;12 nm (Fig. 1A), which demonstrated the randomnessand, thus, representativeness of the set of the proteins understudy. Then, we analyzed the distributions of the maximumposition of log-normal components taking into consider-
ation the experimental deviations of maximum position andthe contributions of components to spectra of native anddenatured proteins (Figs. 2–5). All obtained data confirmedthe existence of several statistically discrete classes of emit-ting tryptophan fluorophores in proteins. The discreteclasses observed here are in approximate agreement withthose proposed in 1973–1977 in the model of discrete states.A very important point is that there was no a priori assump-
FIGURE 2 Canonical distribution of occurrence of maximum positions of log-normal components obtained by applying SIMS (A), PHREQ (B)algorithms, and different schemes of averaging of the results: “Average” (C) and “Mean Best Fit” (D) for native proteins with 2-nm step.
1728 Reshetnyak and Burstein
Biophysical Journal 81(3) 1710–1734

tion about the discreteness in any algorithm used for compo-nent analysis of fluorescence spectra (Burstein et al., 2001).
It is evident that to find the causes for so widely differingand discrete Stokes shifts in the emission spectra of trypto-phan fluorophores in proteins one has to look in a variety ofcombinations of interactions of individual fluorophores withtheir environment, occurring mainly during the lifetime of
the fluorescent excited state. The physical causes for thedifferences among the spectroscopic classes can be ana-lyzed in terms of various combinations of Bakhsiev’s theoryof specific and universal interactions of the excited fluoro-phores with their environment (Bakhshiev, 1972). Bothkinds of interactions are induced by essential redistributionof electronic density on the atoms and chemical bonds of
FIGURE 3 Distribution of occurrence of maximum positions of log-normal components obtained by applying SIMS (A), PHREQ (B) algorithms, anddifferent schemes of averaging of the results: “Average” (C) and “Mean Best Fit” (D) with 1-nm step. Each curve is a sum of Gauss function (seeexplanation in the text) for each spectral component of native (N) and denatured (D) proteins withs(i) 5 1.0 andS(i) 5 1.0.
Discrete States of Tryptophan Residues 1729
Biophysical Journal 81(3) 1710–1734

fluorophore after its electronic excitation. The specific in-teractions include changes in the nearest range interactionswith neighboring groups and/or solvent molecules, i.e., re-solvation, hydrogen bond formation, or other noncovalentcomplexing (Bakhshiev, 1972; Mataga et al., 1955). Theuniversal interactions occur due to the dipole relaxation of
surrounding dielectric continuum in response to the changesin direction and magnitude of fluorophore dipole moment atthe excitation (Bakhshiev, 1972; Bilot and Kawski, 1962;Lippert, 1957; Liptay, 1965;. Mataga et al., 1956).
The formation of stoichiometric complexes (most proba-bly hydrogen-bonded ones) of excited indole fluorophore
FIGURE 4 Distribution of occurrence of maximum positions of log-normal components obtained by applying SIMS (A), PHREQ (B) algorithms, anddifferent schemes of averaging of the results: “Average” (C) and “Mean Best Fit” (D) with 1-nm step. Each curve is a sum of Gauss function (seeexplanation in the text) for each spectral component of native (N) and denatured (D) proteins withs(i) 5 1.0 andS(i) equal the relative contribution ofthe component in the total protein emission (see Table 2).
1730 Reshetnyak and Burstein
Biophysical Journal 81(3) 1710–1734

with alcohols was demonstrated experimentally (Walker etal., 1967; Lumry and Hershberger, 1978; Hershberger et al.,1981). Such complexes with alcohols in apolar cyclohep-tane had discrete positions of fluorescence spectral maximadependent on the stoichiometric ratios of alcohol/fluoro-phore: the maximum was at 316 nm for the 1:1 ratio and at
;330 nm at the 2:1 ratio compared with the central peak at307 nm in the structured spectrum obtained in the absenceof any polar co-solvents. The authors interpreted these ex-cited-state complexes (exciplexes) as a result of H-p-bond-ing of alcohol hydroxyls with indolic N- and Cg-atoms asthose possessing maximal electronic density in the excited
FIGURE 5 Distribution of occurrence of maximum positions of log-normal components obtained by applying SIMS (A), PHREQ (B) algorithms, anddifferent schemes of averaging of the results: “Average” (C) and “Mean Best Fit” (D) with 1-nm step. Each curve is a sum of Gauss function (seeexplanation in the text) for each spectral component of native (N) and denatured (D) proteins withs(i) equal to the standard (root-mean-square one) errorof the meanlm(i) value andS(i) equal to the relative contribution of the component in the total protein emission (see Table 2).
Discrete States of Tryptophan Residues 1731
Biophysical Journal 81(3) 1710–1734

state. Such a location of H-bonds may be revised in the lightof recent quantum-mechanical calculations of electronicdensity distribution in the excited indole and tryptophanfluorophores, which revealed that maximal densities arelocated at the Ce3, Cz2, and Cd2 atoms in the main fluo-rescent1La state of the indolic ring (Callis, 1997).
In proteins, the structured fluorescence bands coincidingwith those of nonexciplexed indole fluorophores occur inazurin (Burstein et al., 1977) and in bacteriorhodopsin pur-ple membranes suspended in 2 M CsCl (Permyakov andShnyrov, 1983). Such tryptophan residues were attributed toclass A in the hypothesis of discrete states. The structuredspectra similar to those of the exciplexes 1:1 occurring inseveral single-tryptophan-containing proteins were assignedto class S (Burstein, 1977a, b, 1983). Emission spectra ofclasses A and S do not undergo any spectral shift underfreezing the protein solutions down to2196°C, i.e., thedipole moments of these fluorophores practically do notchange at the excitation. In the histograms obtained in thiswork, classes A and S are reflected by peaks and/or shoul-ders at 305–308 and 316–318 nm, respectively (see Figs.3–5).
In the model experiments (Walker et al., 1967; Lumryand Hershberger, 1978; Hershberger et al., 1981), the max-imum position of the exciplex 2:1 spectrum was not con-stant under increasing alcohol concentration, which re-flected the rise of Stokes shift induced by the solvent dipolerelaxation in response to the change of fluorophore dipolemoment in the excited state of the exciplex. Therefore, theflorescence of protein tryptophan residues possessing thespectra with maxima at;330 nm and longer were assignedto the emission of exciplexes with stoichiometry not,2:1in the model of discrete classes (Burstein, 1977a, b, 1983).The model provided three discrete classes (I–III) for suchexciplexes with stoichiometry$2:1, differed in their acces-sibility to extrinsic quenchers (vanishing accessibility forclass I,lm at ;330 nm, and the accessibility of.30% ofthat of free tryptophan for classes II and III). The differencebetween two accessible classes was assumedly interpretedas a result of different dipole relaxation rates in their envi-ronments.
The histograms (Figs. 3–5) contain peaks reflecting allthree discrete classes. However, the class I band in thehistograms splits up into two peaks, at;325 and 332 nm.Almost all histograms contain the global minimum at 336–337 nm and two evident maxima at 344–345 and 349–351nm, which correspond to the emission of exposed trypto-phan residues of classes II and III, respectively. In themodel of discrete classes, it was suggested that exposedtryptophan residues in native proteins should emit at 340–342 nm, and emission at 350–353 nm is due to tryptophanresidues of denatured proteins (Burstein et al., 1973). How-ever, the extended set of proteins investigated here indicatesthat tryptophans in native proteins also can have spectrawith maxima at;350 nm.
Tryptophan residues of denatured proteins (italicized inTables 1 and 2) have the main peak positions at 340–345and 351 nm. The longest-wavelength peak corresponds tothe completely unfolded proteins in urea or guanidiniumchloride solutions. However, the peak at 340–345 nm be-longs mainly to the fluorophores in proteins denatured byextreme pH values (e.g., pepsin at pH 6–9; see Table 2) orhigh dioxane concentrations (chymotrypsin, chymotrypsin-ogen, and trypsin; see Table 2). It is possible that suchmaximum positions of fluorescence spectra are characteris-tic of tryptophan residues in such intermediate unfoldingstates of proteins as molten globule (Ptitsyn, 1995). Theshorter-wavelength peaks (lm , 337 nm) in histograms fordenatured proteins belong, most probably, to the fluoro-phores in molecules retained native or partly unfolded indenaturing conditions.
The model of discrete states reflects the existence inproteins of the five most manifested classes of tryptophanresidues. The discreteness of fluorescence parameters has tohave a probabilistic nature. The histograms obtained in thiswork reflected all these classes and can be regarded as astatistical confirmation of the hypothesis of discrete classesof tryptophan residues in proteins. It could be assumed thatsuch a situation might be realized because tryptophan resi-dues are located in a few kinds of physically preferredenvironments in protein structures that provide realizationof different combinations of specific and universal interac-tions of excited fluorophore with its environment.
There were a lot of papers published during the lastseveral last years where it was demonstrated that tryptophanresidues could have various fluorescence parameters de-pending on their environment in proteins (Callis, 1997;Callis and Burgess, 1997; Reshetnyak and Burstein, 1997a,b; Chen and Barkley, 1998; Kuznetsova and Turoverov,1998; Meagher et al., 1998). Because highly resolved x-rayand NMR structures of many proteins are now available, wedeveloped a system of describing physical and structuralcharacteristics of the microenvironment of tryptophan resi-dues and examined the existence of discreteness of struc-tural parameters of the microenvironment of tryptophanresidues in proteins. Moreover, that work allowed us toelucidate the main physical and structural factors determin-ing the class of an individual tryptophan residue. The nextpaper of this series contains the results of that study.
The authors are thankful to all colleagues from the Laboratory of ProteinFunctional Biophysics of the Institute of Theoretical and Experimental Bio-physics (Pushchino) for everyday help and discussions. We thank Drs. K. K.Turoverov and R. V. Polozov for fruitful discussions. We are especiallygrateful to Drs. V. M. Grishchenko, L. P. Kalinichenko, and T. G. Orlova forthe help in experimental work and to Drs. D. B. Veprintsev and D. S. Rykunovfor valuable consultations and maintaining the function of the computers andnets. We are much obliged to all colleagues who placed protein preparationsand/or fluorescence spectra at our disposal.
This work was supported in part by Grants 95-04-12935, 97-04-49449, and00-04-48127 from the Russia Foundation of Basic Research.
1732 Reshetnyak and Burstein
Biophysical Journal 81(3) 1710–1734

REFERENCES
Ababou, A. 1998. Contribution to the study of temporal fluorescence: studyof the fluorescence decay heterogeneity of the single tryptophan con-taining proteins. Ph.D. thesis, Louis Pasteur University, Strasbourg,France. 238 pp.
Abornev, S. M. 1993. Resolution of the composed tryptophan fluorescencespectra of proteins. Phys. and Math. Sci. Candidate thesis, Institute ofTheoretical and Experimental Biophysics, RAS, Pushchino. 122 pp.
Abornev, S. M., and E. A. Burstein. 1992. Resolution of protein tryptophanfluorescence spectra into elementary components.Molecular Biology(Moscow).26:890–987.
Bakhshiev, N. G. 1972. Spectroscopy of Intermolecular Interactions.Nauka, Leningrad [in Russian].
Bandorowicz, J., S. Pikula, and A. Sobota. 1992. Annexins IV (p32) and VI(p68) interact with erythrocyte membrane in a calcium-dependent man-ner.Biochim. Biophys. Acta.1105:201–206.
Benzonana, G., L. Kohler, and E. A. Stein. 1974. Regulatory proteins ofcrayfish tail muscle.Biochim. Biophys. Acta.368:247–258.
Bilot, L., and A. Kawski. 1962. Zur Theorie des Einfl 252 sses von L 246sungsmitteln auf die Elektronenspektren der Molek 252 le.Z. Naturfor-sch.17a:621–627.
Bukolova-Orlova, T. G., E. A. Burstein, B. P. Tchorbanov, B. V. Alexiev,and B. P. Atanasov. 1979. Study of some physico-chemical properties ofthe neurotoxic complex and its components from the venom of Bulgar-ian sand viper,Vipera ammodytes ammodytes.I. Luminescence oftryptophan residues.Biochim. Biophys. Acta.577:44–51.
Bukolova-Orlova, T. G., E. A. Burstein, and L. Ya. Yukelson. 1974.Fluorescence of neurotoxins from Middle-Asian cobra venom.Biochim.Biophys. Acta.342:275–280.
Bukolova-Orlova, T. G., N. Y. Orlov, E. A. Burstein, B. P. Tchorbanov,and B. V. Alexiev. 1980. Study of the neurotoxic complex and itscomponents from the venom of Bulgarian sand viper,Vipera ammodytesammodytes. Arch. Biochem. Biophys.200:216–222.
Bukolova-Orlova, T. G., E. A. Permyakov, E. A. Burstein, and L. Ya.Yukelson. 1976. Reinterpretation of luminescence properties of neuro-toxins from the venom of Middle-Asian cobra,Naja oxiana. Biochim.Biophys. Acta.439:426–431.
Burstein, E. A. 1968. Quenching of protein fluorescence. I. Principles ofthe method. Solutions of tryptophan, tyrosine and denatured proteins.Biophysics (Moscow).13:433–442 [in Russian; English translation].
Burstein, E. A. 1976. Luminescence of protein chromophores (modelstudies).In Advances in Science and Technology (Itogi Nauki i Tekh-niki), ser. Biophysics, vol. 6. VINITI, Moscow [In Russian].
Burstein, E. A. 1977a. Intrinsic protein luminescence (the nature andapplication). In Advances in Science and Technology (Itogi Nauki iTekhniki) ser. Biophysics, vol. 7. VINITI, Moscow [In Russian].
Burstein, E. A., editor. 1977b. The study of fast dynamics of proteinstructure using the intrinsic fluorescence methods.In Equilibrium Dy-namics of Native Protein Structure. Center of Biological Research, RAS,Pushchino. 60–83 [In Russian].
Burstein, E. A. 1983. The intrinsic luminescence of proteins is a method forstudies of the fast structural dynamics.Molecular Biology (Moscow).17:455–467 [In Russian; English translation].
Burstein, E. A., S. M. Abornev, and Ya. K. Reshetnyak. 2001. Decompo-sition of protein tryptophan fluorescence spectra into log-normal com-ponents. I. Decomposition algorithms.Biophys. J.81:1699–1709.
Burstein, E. A., and V. I. Emelyanenko. 1996. Log-normal description offluorescence spectra of organic fluorophores.Photochem. Photobiol.64:316–320.
Burstein, E. A., E. A. Permyakov, V. A. Yashin, S. A. Burkhanov, and A.Finazzi Agro. 1977. The fine structure of luminescence spectra of azurin.Biochim. Biophys. Acta.491:155–159.
Burstein, E. A., N. S. Vedenkina, and M. N. Ivkova. 1973. Fluorescenceand the location of tryptophan residues in protein molecules.Photochem.Photobiol.18:263–279.
Bushueva, T. L., M. V. Teplova, V. N. Bushuev, D. S. Kudryashov, A. V.Vorotnikov, and V. P. Shirinsky. 1999. The structure stability of KPR(Kinase Related Protein).Molecular Biology (Moscow).33:227–236.
Bushueva, T. L., and A. G. Tonevitsky. 1987a. The effect of pH on theconformation and stability of the structure of plant toxin ricin.MolecularBiology (Moscow).21:414–420 [In Russian; English translation].
Bushueva, T. L., and A. G. Tonevitsky. 1987b. The effect of pH on theconformation and stability of the structure of plant toxin-ricin.FEBSLett. 215:155–159.
Bushueva, T. L., and A. G. Tonevitsky. 1988. Similarity of protein con-formation at low pH and high temperature observed for B-chains of twoplant toxins: ricin and mistletoe lectin 1.FEBS Lett.229:119–122.
Bushueva, T. L., A. G. Tonevitsky, and E. A. Burstein. 1990. The structureof ricin: the study by the fluorescence quenching method.MolecularBiology (Moscow).24:614–620 [In Russian; English translation].
Bushueva, T. L., A. G. Tonevitsky, A. Kindt, and H. Franz. 1988. Thestructure of toxic protein: the mistletoe lectin at different pH. The studyby intrinsic fluorescence methods.Molecular Biology (Moscow).22:628–634 [In Russian; English translation].
Callis, P. R. 1997.1La and 1Lb transitions of tryptophan: applications oftheory and experimental observations to fluorescence of proteins.Meth-ods Enzymol.278:113–151.
Callis, P. R., and B. K. Burgess. 1997. Tryptophan fluorescence shifts inproteins from hybrid simulations: an electrostatic approach.J. Phys.Chem. B.101:9429–9432.
Chen, Yu, and M. D. Barkley. 1998. Toward understanding tryptophanfluorescence in proteins.Biochemistry.37:9976–9982.
Cox, J. A., W. Wnuk, and E. A. Stein. 1976. Isolation and properties of asarcoplasmic calcium-binding protein from crayfish.Biochemistry.15:2613–2617.
Czurylo, E. A., V. I. Emelyanenko, E. A. Permyakov, and R. Dabrowska.1991. Spectrofluorimetric studies on C-terminal 34 kDa fragment ofcaldesmon.Biophys. Chem.40:181–188.
Demchenko, A. P. 1986. Ultraviolet Spectroscopy of Proteins. Springer-Verlag, Berlin.
Grishchenko, V. M., S. I. Bezborodova, V. I. Emelyanenko, M. N. Ivkova,and E. A. Burstein. 1976. Fluorescence studies of extracellular guanyl-specific ribonuclease C2 fromAspergillus clavatus. Bioorg. Chem.(Moscow).2:207–216 [In Russian; English translation].
Haiech, J., J. Derancourt, J.-F. Peche`re, and J.G. Demaille. 1979. A newlarge-scale purification procedure for muscular parvalbumins.Bio-chimie.61:583–587.
Hershberger, M. V., R. Lumry, and R. Verrall. 1981. The 3-methylindole/n-butanol exciplexes evidence for two exciplex sites in indole com-pounds.Photochem. Photobiol.33:609–617.
Ivkova, M. N., V. V. Mosolov, and E. A. Burstein. 1968. Fluorescence ofsome proteins in water-dioxane solutions.Molecular Biology (Moscow).2:839–850. [In Russian; English translation].
Ivkova, M. N., N. S. Vedenkina, and E. A. Burstein. 1971. Tryptophanfluorescence of serum albumins.Molecular Biology (Moscow).5:214–224. [In Russian; English translation].
Kaplanas, R. I., T. G. Bukolova, and E. A. Burstein. 1973. Fluorescence ofb-lactalbumin AB under various physico-chemical conditions. I. Influ-ences of pH and binding of sodium dodecyl sulfate.Molecular Biology(Moscow).7:753–759 [In Russian; English translation].
Kaplanas, R. I., T. G. Bukolova, and E. A. Burstein. 1975. Fluorescence ofb-lactalbumin AB under various physico-chemical conditions. II. Dena-turation by urea and various organic solvents.Molecular Biology (Mos-cow).9:795–804 [In Russian; English translation].
Klimenko, I. V., T. O. Gushcha, and A. I. Korneliuk. 1991. Tryptophanfluorescence properties of two forms of the tyrosyl-aminoacyl-tRNA-synthase (bovine liver).Biopolymers and Cells (Kiev).7:83–88 [InRussian; English translation].
Konev, S. V. 1967. Fluorescence and Phosphorescence of Proteins andNucleic Acids. Plenum Press, New York.
Koteliansky, V. E., T. L. Bushueva, M. V. Betanyan, M. A. Glukhova, andV. N. Smirnov. 1981. The intrinsic fluorescence study of the structure of
Discrete States of Tryptophan Residues 1733
Biophysical Journal 81(3) 1710–1734

fibronectin. Dokl. AN SSSR (Proc. USSR Acad. Sci; Moscow).258:1485–1488. [In Russian; English translation].
Koteliansky, V. E., M. A. Glukhova, V. P. Shirinsky, V. N. Smirnov, T. L.Bushueva, V. K. Filimonov, and S. Y. Venyaminov. 1982. A structuralstudy of filamin, a high-molecular-weight actin-binding protein fromchicken gizzard.Eur. J. Biochem.121:553–559.
Kuznetsova, I. M., and K. K. Turoverov. 1998. What determines the charac-teristics of the intrinsic UV-fluorescence of proteins? Analysis of the prop-erties of the microenvironment and features of the localization of theirtryptophan residues.Cytology (St. Petersburg).40:747–62. [In Russian].
Ladokhin, A. S. 1990. Equilibrium dynamics of proteins. Intrinsic fluorescencestudy of melittin.Biopolymers and Cells (Kiev).6:84–91. [In Russian].
Lakowicz, J. R. 1983. Principles of Fluorescence Spectroscopy. PlenumPress, New York.
Lippert, E. 1957. Spektroskopische Bestimmungen des Dipolmomentesaromatischer Verbindungen im ersten angeregten Singulettzustand.Z. Elektrochem.61:962.
Liptay, W. 1965. Die Lo¨sungsmittelabha¨gigkeit der Wellenzahl von Ele-ktronenbanden und chemisch-physikalischen Grundlagen.Z. Naturfor-sch.20a:1441–1471
Longworth, J. W. 1971. Excited States of Proteins and Nucleic Acids. R. F.Steiner and I. Weinryb, editors. Plenum Press, New York.
Lumry, R., and M. Hershberger. 1978. Status of indole photochemistrywith special reference to biological application.Photochem. Photobiol.27:819–840.
Mataga, N., Y. Kaifu, and M. Koizumi. 1955. The solvent effect on fluores-cence spectrum. Change of solute-solvent interaction during the lifetime ofexcited solute molecule.Bull. Chem. Soc. Japan.28:690–691.
Mataga, N., Y. Kaifu, and M. Koizumi. 1956. Solvent effects upon fluo-rescence spectra and the dipole-moments of excited molecules.Bull.Chem. Soc. Japan.29:465–470.
Meagher, J. L., J. M. Beechem, S. T. Olson, and P. G. Gettins. 1998.Deconvolution of the fluorescence emission spectrum of human anti-thrombin and identification of the tryptophan residues that are respon-sive to heparin binding.J. Biol. Chem.273:23283–23289.
Mely, Y., M. Cadene, I. Sylte, and J. G. Breth. 1997. Mapping of suramin-binding sites of human neutrophil elastase: investigation by fluorescenceenergy transfer and molecular modeling.Biochemistry. 36:15624–15631.
Morozova, L. A., N. B. Gusev, V. L. Shnyrov, and E. A. Permyakov. 1988.Study of the physico-chemical properties of troponins I and T from theheart and skeletal muscles using protein fluorescence and calorimetricmethods.Biochemistry (Moscow).53:531–540 [In Russian; Englishtranslation].
Nyamaa, D., O. Bat-Erdene, and E. A. Burstein. 1985. Solvent effects onthe functional and structural properties of serum albumins. III. Temper-ature and ionic strength dependencies of human serum albumin N-F1,F1-F2 and F2-E transitions.Molecular Biology (Moscow).19:833–840.
Orlov, N. Y., T. G. Orlova, Ya. K. Reshetnyak, E. A. Burstein, and N. Kimura.1997. Interaction of recombinant rat nucleoside diphosphate kinase alphawith bleached bovine retinal rod outer segment membranes: a possiblemode of pH and salt effects.Biochem. Mol. Biol. Int.41:189–198.
Orlov, N. Ya., T. G. Orlova, Ya. K. Reshetnyak, E. A. Burstein, and N.Kimura. 1999. Comparative study of recombinant rat nucleoside diphos-phate kinases alpha and beta by intrinsic protein fluorescence.J. Biomol.Struct. Dyn.16:955–968.
Orlova, T. G. 1979. The study of toxic proteins of snake venom by intrinsicprotein fluorescence techniques. Biol. Science Candidate thesis, Instituteof Photobiology, Byelorus Acad. Sci., Minsk [In Russian].
Pardee, J. D., and J. A. Spudich. 1982. Purification of muscle actin.Methods Enzymol.85(Pt. B):164–181.
Permyakov, E. A., and G. Y. Deikus. 1995. Analytical description ofelectron-vibrational spectra of proteins.Molecular Biology (Moscow).29:159–167. [In Russian].
Permyakov, E. A., V. M. Grishchenko, L. P. Kalinichenko, N. Y. Orlov, K.Kuwajima, and S. Sugai. 1991. Calcium-regulated interactions of humanalpha-lactalbumin with bee venom melittin.Biophys. Chem.39:111–117.
Permyakov, E. A., L. A. Morozova, and E. A. Burstein. 1985. Cationbinding effects on the pH, thermal and urea denaturation transitions inalpha-lactalbumin.Biophys. Chem.21:21–23.
Permyakov, E. A., and V. L. Shnyrov. 1983. A spectrofluorimetric study ofthe environment of tryptophans in bacteriorhodopsin.Biophys. Chem.18:145–152.
Permyakov, E. A., D. B. Veprintsev, G. Y. Deikus, S. E. Permyakov, L. P.Kalinichenko, V. M. Grishchenko, and C. L. Brooks. 1997. pH-inducedtransition and Zn21-binding properties of bovine prolactin.FEBS Lett.405:273–276.
Permyakov, E. A., V. V. Yarmolenko, V. I. Emelyanenko, E. A. Burstein, J.Closset, and C. Gerday. 1980. Fluorescence studies of the calcium bindingto whiting (Gadus merlangus) parvalbumin.Eur. J. Biochem.109:307–315.
Ptitsyn, O. B. 1995. Molten globule and protein folding.Adv. ProteinChem.47:83–229.
Reshetnyak, Ya. K., O. A. Andreev, J. Borejdo, D. D. Toptygin, L. Brand,and E. A. Burstein. 2000. The identification of tryptophan residuesresponsible for ATP-induced increase in intrinsic fluorescence of myo-sin subfragment 1.J. Biomol. Struct. Dyn.18:113–125.
Reshetnyak, Ya. K., and E. A. Burstein. 1997a. Assignment of log-normalcomponents of protein fluorescence spectra to individual tryptophan resi-dues using their microenvironment properties in three-dimensional struc-ture.Biophysics (Moscow).42:293–300 [In Russian; English translation].
Reshetnyak, Ya. K., and E. A. Burstein. 1997b. Assignment of components offluorescence spectra of serine proteases to clusters of tryptophan residues.Biophysics (Moscow).42:785–795 [In Russian; English translation].
Shanin, S. S., I. A. Tarkhanova, A. Y. Kulberg, and E. A. Burstein. 1968.Conformational changes ofgG-globulin under dissociation on peptides.Molecular Biology (Moscow).2:587–593 [In Russian; English translation].
Siano, D. B., and D. E. Metzler. 1969. Band shapes of the electronicspectra of complex molecules.J. Chem. Phys.51:1856–1861.
Sobota, A., J. Bandorowicz, A. Jezierski, and A. F. Sikorski. 1993. Theeffect of annexins IV and VI on the fluidity of phosphatidylserine/phosphatidylcholine bilayers studied with the use of 5-deoxylstearatespin label.FEBS Lett.315:178–182.
Tchorbanov, B. P., B. V. Alexiev, T. G. Bukolova, E. A. Burstein, andB. P. Atanasov. 1977. Subfractionation and recombination of a neuro-toxic complex of Bulgarian viper (Vipera ammodytes ammodytes). FEBSLett. 76:266–268.
Tonevitsky, A. G., D. E. Temyakov, E. C. Sweeney, N. V. Konareva, A. N.Kornev, R. A. Palmer, and A. M. Mikhailov. 1996. Structural features ofricin agglutinin from Ricinus communis. Crystallography (Moscow).41:1018–1023 [In Russian; English translation].
Vedenkina, N. S., T. G. Bukolova, M. N. Ivkova, and E. A. Burstein. 1971.Fluorescence and states of tryptophan in papain.Molecular Biology(Moscow).5:809–816 [In Russian; English translation].
Vedenkina, N. S., and E. A. Burstein. 1970. Tryptophan fluorescence ofproteins in solutions. The spectral maxima positions.Molecular Biology(Moscow).4:743–748 [In Russian; English translation].
Vedenkina, N. S., M. N. Ivkova, V. N. Leonova, and E. A. Burstein. 1968.The fluorescence of actin and actomyosin in various structural states.Biophysics (Moscow).13:847–852 [In Russian; English translation].
Vishnevskaya, Z. I., N. S. Vedenkina, and M. V. Georgadze. 1976. Fluo-rescence study of myosin and its fragments, heavy and light meromyo-sins, in concentrated solutions of neutral salts.Molecular Biology (Mos-cow).10:799–805 [In Russian; English translation].
Volotovski, I. D., and S. V. Konev. 1967. The relation between confor-mation and UV luminescence of proteins.Biophysics (Moscow).12:200–205 [In Russian; English translation].
Walker, M. S., T. W. Bednar, and R. Lumry. 1967. Exciplex studies. II.Indole and indole derivatives.J. Chem. Phys.47:1020–1028.
Weller, P. A., E. P. Ogryzko, E. B. Corben, N. I. Zhidkova, B. Patel, G. J.Price, N. K. Spurr, V. E. Koteliansky, and D. R. Gritchley. 1990.Complete sequence of human vinculin and assignment of the gene tochromosome 10.Proc. Natl. Acad. Sci. U.S.A.87:5667–5671.
Zhou, X., Y. Maeda, K. Mabuchi, and S. S. Lehrer. 1998. Unfoldingdomains and tryptophan accessibility of a 59 kDa coiled-coil lightmeromyosin.J. Mol. Biol. 276:829–838.
1734 Reshetnyak and Burstein
Biophysical Journal 81(3) 1710–1734