
Maximization of fructose esters synthesis by response surface methodology
ARTICLES
Optimization of Tryptophan Production in Bacteria. Design of aStrategy for Genetic Manipulation of the Tryptophan Operon forTryptophan Flux Maximization
Alberto Marın-Sanguino and Nestor V. Torres*
Grupo Tecnologıa Bioquımica y Control Metabolico, Departamento de Bioquımica y Biologıa Molecular,Facultad de Biologıa, Universidad de La Laguna, 38206 La Laguna, Tenerife, Islas Canarias, Spain
In the present work we have applied the indirect optimization method (Torres, N. V.et al. Biotechnol. Bioeng. 1996, 49, 247-258) to the maximization of tryptophanbiosynthesis in Escherichia coli. The optimization procedure is applied to an updatedmodel of this biochemical system (Xiu, Z-L et al., J. Biotechnol. 1997, 58, 125-140)and thus extended to a problem that includes the processes of transcription andtranslation. The model representation used by these authors is first translated intothe corresponding S-system version. Then, to guarantee cell viability, we impose aset of constraints on some variable and parameter values, all of which are able to bemodulated by available techniques. Our results show that it is possible to attain astable and robust steady state with a rate of tryptophan production increased morethan 4 times. This is achieved by changing four key parameters related to the effluxof tryptophan, the growth rate, the inhibition constant, and the tryptophan repressorlevel. Moreover, it is demonstrated that we can reach this optimum state in a sequentialmanner, each step leading us to a better situation in relation to the previous one.Thus, only by doubling the tryptophan excretion we can triplicate the rate of tryptophanproduction. A further, although lesser, improvement can be attained by increasing4-fold the rate of growth and subsequently by weakening the inhibitory feedbackinteraction of tryptophan on the enzymes leading to its synthesis. Finally, a significantjump in the rate of production can be obtained if the level of the trp operon could bedecreased. When a second approach was considered, in which the growth rate is keptconstant in the optimized profile, we found out that by modulation of the parametersit is possible to increase more than 2-fold the rate of tryptophan production.
Introduction
Tryptophan is an essential amino acid that is usedmedically and would be used as a feed additive if it couldbe made cheaply enough. Tryptophan, as other aminoacids, is generally made by chemical synthesis, which hasthe disadvantage of being expensive and particularlyinefficient because it makes a mixture of both D- andL-isomers. Microbiological production yields only a bio-logically active L-isomer and has therefore been intro-duced on a large scale. However, the productivity oftryptophan remains low when compared to the microbialproduction of other amino acids. Accordingly, efforts frommolecular biology have made to improve the process (3),but the results are still limited. This illustrates very wellthe current situation in many biotechnological processes.There are many cases in which a detailed knowledge ofthe system, together with state of the art techniques ofrecombinant DNA, is not enough to significantly improve
the productivity of the system. The new paradigm ofmetabolic engineering (4) provides what is lacking inthese situations by stressing the utility of mathematicalmodeling as a tool that helps to analyze data andoptimize the flux distribution to enhance productivity.
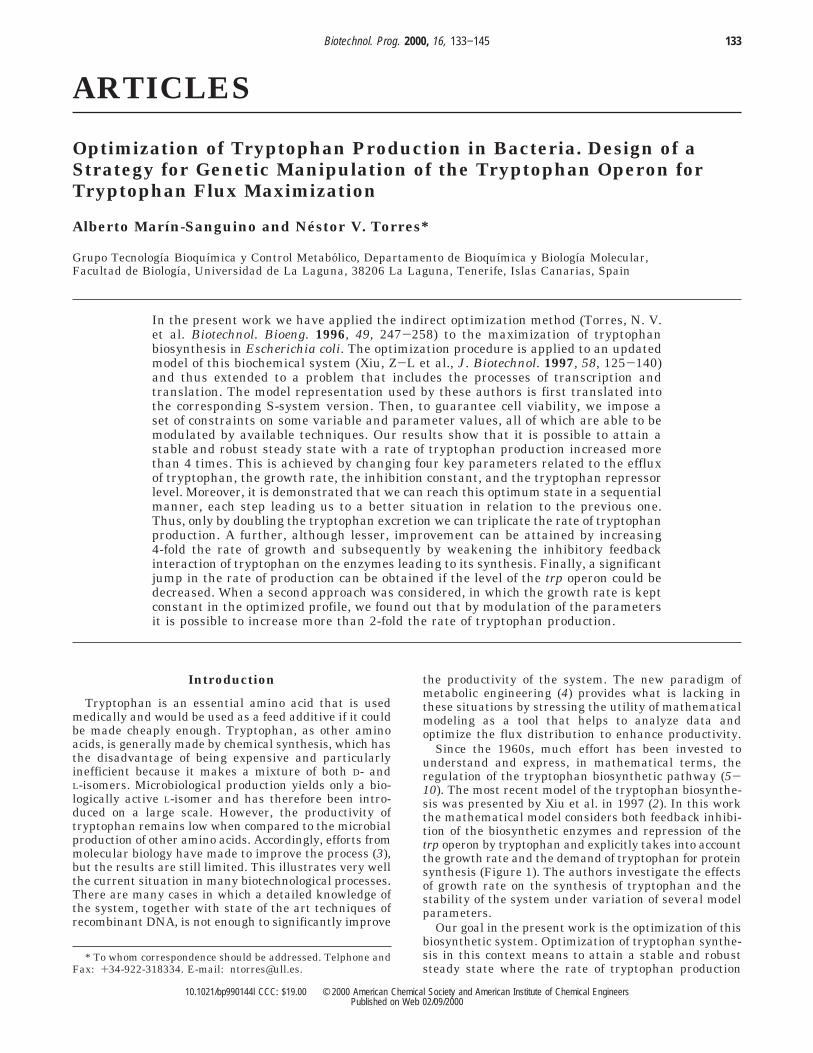
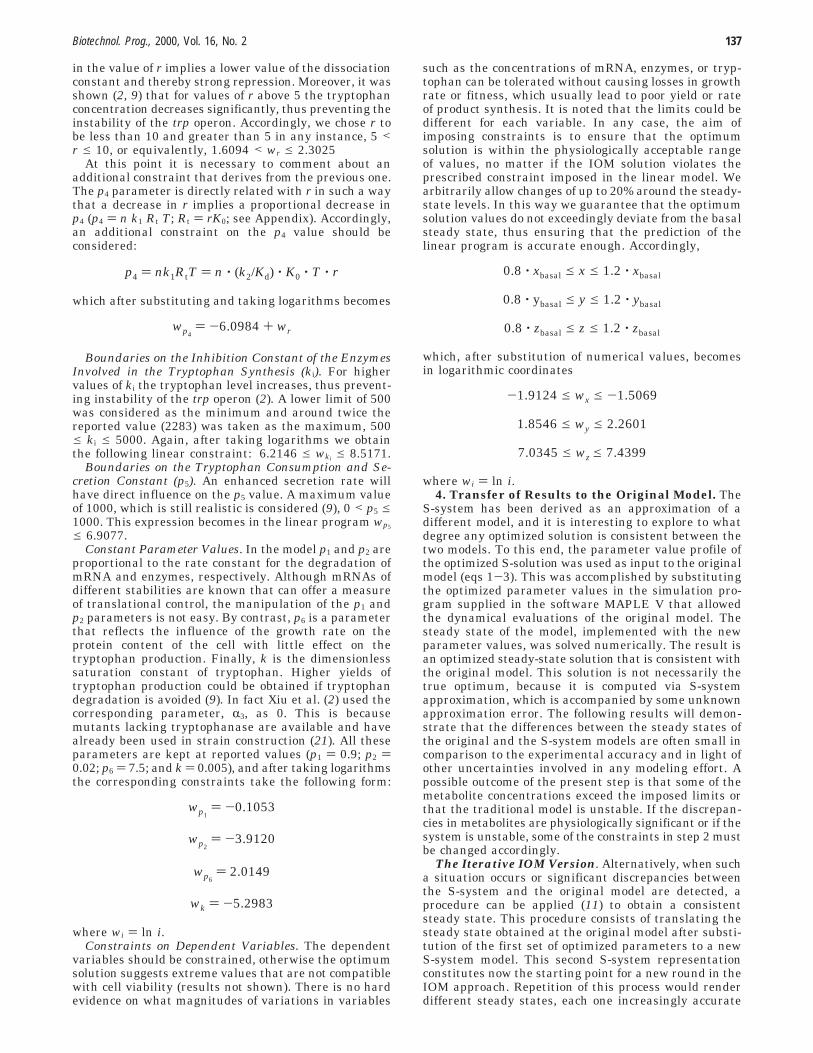
Since the 1960s, much effort has been invested tounderstand and express, in mathematical terms, theregulation of the tryptophan biosynthetic pathway (5-10). The most recent model of the tryptophan biosynthe-sis was presented by Xiu et al. in 1997 (2). In this workthe mathematical model considers both feedback inhibi-tion of the biosynthetic enzymes and repression of thetrp operon by tryptophan and explicitly takes into accountthe growth rate and the demand of tryptophan for proteinsynthesis (Figure 1). The authors investigate the effectsof growth rate on the synthesis of tryptophan and thestability of the system under variation of several modelparameters.
Our goal in the present work is the optimization of thisbiosynthetic system. Optimization of tryptophan synthe-sis in this context means to attain a stable and robuststeady state where the rate of tryptophan production
* To whom correspondence should be addressed. Telphone andFax: +34-922-318334. E-mail: [email protected].
133Biotechnol. Prog. 2000, 16, 133−145
10.1021/bp990144l CCC: $19.00 © 2000 American Chemical Society and American Institute of Chemical EngineersPublished on Web 02/09/2000
would be the highest possible. Xiu et al. (2) concludedthat for an effective production of tryptophan the growthrate of the cell should be kept as low as possible. Underthis condition, the tryptophan concentration is highenough to prevent instability, which is required forongoing operation with improved production. However,a high rate of tryptophan demand will reduce theintracellular tryptophan concentration, thus causinginstability. We have thus two conflicting effects whentrying to maximize the rate of tryptophan production. Onone hand, we have to increase the efflux of tryptophan,but on the other hand, we have to keep the tryptophanconcentration as high as possible to guarantee a stablesystem. Xiu et al. (2) also observed that in a state ofstability the strain level of repressor and the strength offeedback inhibition affect the key variable, tryptophanconcentration (and also the enzyme concentrations). Itwould thus be interesting to know the constellation ofparameter values that yields a steady state of the systemthat is stable and compatible with the cell viabilityrequirements and at the same time gives the theoreticallyachievable maximum rate of tryptophan production.
For this purpose we have made use of the indirectoptimization method (IOM) that was recently proposedelsewhere (1, 11, 12) and subsequently refined by Petkovand Maranas (13). In this approach, the mathematicalmodel developed within the power law formalism (14) isoptimized by using standard linear programming tech-niques. The optimum configuration of parameter values,all of them suitable for manipulation by the standardtechniques of microbiology, biochemistr,y or recombinantDNA technology, yields a new stable steady state wherethe concentrations of mRNA, enzymes, and tryptophanare within physiologically feasible ranges. It will beshown that in this state, the rate of tryptophan produc-tion is more than 4 times the “basal” production. More-over, a step by step procedure is presented in which eachparameter modification increases the performance of thesystem for tryptophan production. In this way we set upthe pathway that, beginning with the wild strain, willguide the system through a sequence of modificationstoward increasingly better strains for tryptophan produc-tion.
Application of the Indirect OptimizationMethod (IOM)
The implementation of the method takes four steps.1. Translation to the S-system Form. The applica-
tion of the IOM approach in the present case begins withthe translation of the existing model to the correspondingS-system form and its subsequent quality assessment(12). In an S-system model, each rate law for synthesisand degradation is represented by a product of power-law functions of all variables that have a direct influenceupon the rate law in question. The rate of a given processVi
+ is written as
where Xj are variables that affect the rate in question.The indices j ) 1, ..., n refer to dependent variables, andj ) n + 1, ..., n + m refer to independent variables. Thoseprocesses that characterize reactions forming an inter-mediate Xi are aggregated to give a single rate law forsynthesis, Vi
+. Similarly, those rate laws that character-ize reactions removing an intermediate Xi are aggregatedto give a single rate law for degradation, Vi
-. Thedescriptive equations for a biochemical system can thenbe written in terms of power-law functions as follows:
The parameters Ri and gi,j are the rate constants andkinetic orders associated with the rate law for synthesisof Xi. Similarly âi and hi,j are associated with the ratelaw for degradation of Xi. The kinetic order parametersgi,j and hi,j are defined as
where the additional index 0 indicates that a quantity isevaluated at the steady-state level of metabolite concen-tration.
Figure 1. Schematic representation of the transformations and reactions represented in the model of the trp operon in E. coli.Arrows appear together with the process or parameter represented in the model. Thin dotted lines represent regulatory interactions,heavy lines represent reactions, and heavy dotted lines represent expansion fluxes. See text for discussion.
Vi+ ) Ri ∏
j)1
n+m
Xjgi,j
dXi
dt) Ri ∏
j)1
n+m
Xjgi,j - âi ∏
j)1
n+m
Xjhi,j, i ) 1, ..., n
gi,j ) (∂Vi
∂Xj
Xj
Vi)
0hi,j ) (∂V-i
∂Xj
Xj
V-i)
0
134 Biotechnol. Prog., 2000, Vol. 16, No. 2
After transformation of the original model (see Ap-pendix) and substitution of the numerical values ofvariables and parameters, the numerical reference sys-tem for the S-system representation at the chosen steadystate is the following:
At the steady state, the right-hand terms in eqs 1-3can be equated to 0. Taking logarithms, we get a set oflinear equations relating the steady-state values of thedependent variables to the independent ones. To includethe system parameters in these equations, we will treatthem as independent variables. The steady-state solutioncan be obtained by analytical methods (14-17), and thesteady-state flux through any variable is directly ob-tained as a product of power-law functions in the knownconcentrations at steady state
2. Quality Assessment of the Original Model inthe S-system Form. The S-system representation fa-cilitates the analytical and numerical quality assess-ments. First, it allows us to check the stability of thesteady state, which is a fundamental prerequisite for anymodel of an actual experimental system. The localstability of the nominal steady state can be ascertainedby an examination of the eigenvalues for the localrepresentation of the system. If all real parts of theeigenvalues are negative, the nominal steady state islocally stable and the system will return to this steadystate following small perturbations.
Second, the robustness of the model can be analyzed,indicating whether the model is able to tolerate smallstructural changes. System sensitivity theory providesimportant methods for characterizing the quality of amodel. There are two types of parameters for analyzingthe system sensitivity in a S-system, the rate constantsand kinetic orders. Accordingly there are two types ofsensitivity coefficients, the rate constant sensitivities andthe kinetic order sensitivities, which are defined asfollows.
Rate Constant Sensitivities. A rate constant sensi-tivity coefficient is defined as the ratio of a relativechange in a dependent concentration Xi to a relativechange in a rate constant, Rj or âj. They can be deter-mined by differentiation of the explicit steady-statesolution:
These sensitivities are equal in magnitude but negativein sign. Similarly, the ratio of a relative change in adependent flux to relative change in a rate-constantparameter is defined as
Rate constant sensitivities are systemic properties thatin general depend on all of the kinetic orders of a system,i.e., they are properties of the integrated system and notjust of its isolated components.
Kinetic Order Sensitivities. A kinetic order sensitiv-ity coefficient is defined as the ratio of a relative changein a dependent concentration Xi to a relative change in akinetic order parameter, gjk or hjk. It can be determinedby differentiation of the explicit steady-state solution,with respect to the parameter in question. The corre-sponding expressions are
The ratio of a relative change in a dependent flux to arelative change in a kinetic order is similarly defined as
Like the rate constant sensitivities, these sensitivitiesare properties of the integrated system and not of itsisolated components, but here the sensitivities are afunction of both rate constants and kinetic orders. Thekinetic order sensitivities can be calculated by dif-ferentiation of the explicit solution. In all cases sensitivitywith a magnitude greater than 1 implies amplificationof the original alteration; a magnitude less than 1indicates attenuation. A positive sign for the sensitivityindicates that the changes are in the same direction, i.e.,both increase in value or both decrease. A negative signindicates that the changes are in the opposite direction.In a good model the parameter sensitivities are small.Even with slightly altered parameters, the model willcontinue to exhibit essentially the same structure andbehavior. On the contrary, models with unusually highparameter sensitivities are ill-determined, and the pat-tern of the sensitivity profile can be used to suggestportions of the model that need further attention.
Logarithmic Gains. It is also pertinent here to recallthe definition and meaning of the logarithmic gains,which are specific types of sensitivity coefficients that willbe used throughout. There are two main kinds of loga-rithmic gains, concentration logarithmic gains and theflux logarithmic gains. The first are defined as
where Xi stands for a dependent variable (the metaboliteconcentration), and Xk stands for an independent variable(usually an enzyme activity or transport step). In a
dxdτ
) 0.64026 ‚ z-5.86×10⁻⁴‚ r-0.8322 -
1.0232 ‚ p10.9965 ‚ u-0.0034 ‚ x (1)
dydτ
) x - 1.4854 ‚ p20.8650 ‚ u0.1349 ‚ y (2)
dzdτ
) 0.5534 ‚ y ‚ ki0.5572 ‚ z-0.5572 -
1.7094 ‚ p40.0041 ‚ p5
0.2274 ‚ p6-5.45×10⁻³
‚
z0.7684 ‚ k-0.8×10⁻⁶‚ u0.9903 (3)
S(Xi,âj) ) (∂Xi
∂âj
âj
Xi) )
∂(log Xi)
∂(log âj)
S(Xi,Rj) ) (∂Xi
∂Rj
Rj
Xi) )
∂(log Xi)
∂(log Rj)
S(Vi,âj) ) (∂Vi
∂âj
âj
Vi) )
∂(log Vi)
∂(log âj)
S(Vi,Rj) ) (∂Vi
∂Rj
Rj
Vi) )
∂(log Vi)
∂(log Rj)
S(Xi,gjk) ) (∂Xi
∂gjk
gjk
Xi) )
∂(log Xi)
∂(log gjk)
S(Xi,hjk) ) (∂Xi
∂hjk
hjk
Xi) )
∂(log Xi)
∂(log hjk)
S(Vi,gjk) ) (∂Vi
∂gjk
gjk
Vi) )
∂(log Vi)
∂(log gjk)
S(Vi,hjk) ) (∂Vi
∂hjk
hjk
Vi) )
∂(log Vi)
∂(log hjk)
L(Xi, Xk) ) (∂Xi
∂Xk
Xk
Xi)
0)
∂(log Xi)
∂(log Xk)
Biotechnol. Prog., 2000, Vol. 16, No. 2 135
similar fashion, one obtains the logarithmic gains in thedependent fluxes through the pools of the system:
where Vi represents a given flux and Xi and Xk aredefined as before. In both cases, the subscript 0 refers tothe steady state. These sensitivity coefficients representthe finite percentage change in a dependent concentra-tion Xi or flux Vi, resulting from an infinitesimal changein an independent concentration Xk while all otherindependent concentrations and parameters are heldconstant. A logarithmic gain with a magnitude greaterthan 1 implies amplification of the original signal; amagnitude less than 1 indicates attenuation. A positivesign for the logarithmic gain indicates that the changesare in the same direction,i.e., both increase in value orboth decrease. A negative sign indicates that the changesare in the opposite direction. The influence of a givenindependent variable on a particular dependent variableis given by the magnitude of the corresponding logarith-mic gain, |L(Vi,Xj)| or |L(Xi,Xj)|.
Third, we can consider the dynamic features thatcharacterize the transient responses to temporary per-turbations or permanent alterations. These analysesoften pinpoint problems of consistency and reliability ofthe mathematical representation (18, 19).
3. Linear Programming and Optimization. Thethird step in the present IOM approach is the formulationof the linear equations derived from the S-system formof the model. Although S-system models are nonlinear,the steady-state equations are linear when the variablesare expressed in logarithmic coordinates. Utilizing thefact that a function and its logarithm assume theirmaxima for the same argument, yields or fluxes can thusbe optimized with linear programs expressed in termsof the logarithms of the original variables. Also, typicalconstraints that the optimized system has to satisfyreduce to linear equations in a logarithmic coordinatesystem. For instance, the flux between two pools isrepresented in the S-system model by a product of power-law functions, and a constraint requiring that this fluxbe within a given physiological range reduces to twolinear inequalities in logarithmic coordinates. Similarly,the equality of two fluxes becomes linear, and so doesthe constraint that the concentration of an intermediateshould not exceed some physiologically tolerable thres-hold. The new variables in these equations will be thelogarithms of the former ones. We will refer to them aswi, i being the name of the old variable. Transportingthe steady-state system and the constraints into alogarithmic space thus reduces the nonlinear optimiza-tion problem to a problem of straightforward linearprogramming.
Objective Function for the Maximization of Tryp-tophan Production. As stated before, our aim here isthe maximization of the tryptophan rate production. Theoriginal model used in this study does not explicitlyaccount for the tryptophan secretion, but the model’sauthors claim (2) that the last term of the right-hand sideof eqs 1-3 can be regarded as an accumulative termaccounting for both consumption and secretion:
Accordingly, an enhanced secretion rate would be ac-companied by a rise in the value of p5. The above
expression, after transformation in the S-system formbecomes
In eq 4 the fi terms stands for the kinetic orders, and γprepresents the corresponding rate constant. From the fluxat the reference steady state it is a straightforwardprocess to calculate the rate constant, γp, and the kineticorders, fi. As a result we obtain the following expression:
It should be stressed that at the low growth ratesconsidered in this study the tryptophan intracellularlevels (z) are always high. Therefore, all processesinvolved in tryptophan demand are saturated. Thissaturation makes some processes present in the objectivefunction, Vproduction, insensitive to changes in z. Thisinsensitivity to z is evident also in the power lawexpressions (eqs 4 and 5) as indicated by the low valueof the fz kinetic order. The objective function for thislinear program in logarithmic coordinates thus reads
where wi ) ln i.Steady-State Constraints. The steady-state con-
straints are also expressed in terms of the logarithms ofthe variable. These constraints ensure that the optimizedsystem is in a steady state, no matter how altered theparameters are. In the present case these constraintstake the form
where wi ) ln i.Constraints on Parameter Values. We allow the
optimization parameters to vary between the followinglimits:
Boundaries on the Growth Rate Constant (u). Foreffective production the growth rate should be controlledat a very low level (2). Our purpose is thus to determinethe higher value of u among the low ones that guaranteeeffective production of tryptophan. Accordingly, a maxi-mum value of 0.2 was allowed, 0 < u e 0.2, and thecorresponding logarithmic constraint is wu e -1.6094.
Boundaries on the Strain Level of the trp operonrepressor (r). The strain level r is considered one of theeffective genetic approaches in strain improvement fortryptophan production (9, 20). A typical value of a wild-type strain of E. coli is r ) 10. The value r contains inits definition the dissociation constant of the holorepres-sor-operator binding (r ) Rt/Ko; where Rt is the totalrepressor concentration and Ko is the dissociation ho-lorepressor-operator binding constant). Thus, an increase
L(Vi, Xj) ) (∂Vi
∂Xj
Xj
Vi)
0)
∂(log Xi)
∂(log Xj)
Vproduction ) p5‚(1 + p6‚u)‚u zz + k
Vproduction ) γ ‚ p5fp5 ‚ p6
fp6 ‚ ufu ‚ z
fz ‚ k
fk (4)
Vproduction )
0.8925 ‚ p5 ‚ p6-0.0239 ‚ u0.9760 ‚ z3.5×10-6
‚ k-3.5×10⁻⁶
(5)
-0.1136 + wp5 - 0.0239 wp6 + 0.9760 wu + 3.5 ×10⁻⁶ wz - 3.5 × 10⁻⁶ wk
-0.4689 - 0.0005 wz - 0.8332 wr - 0.9965 wp1+
0.0034 wu - wx ) 0
0.3956 + 0.8650 wp2+ 0.1349 wu + wy - wx ) 0
-1.1278 + wy + 0.5572 wki- 0.5572 wz -
0.0041 wp4- 0.2274 wp5
+ 0.0054 wp6- 0.7684 wz +
8.01 × 10⁻⁷ wk - 0.9903 wu ) 0
136 Biotechnol. Prog., 2000, Vol. 16, No. 2
in the value of r implies a lower value of the dissociationconstant and thereby strong repression. Moreover, it wasshown (2, 9) that for values of r above 5 the tryptophanconcentration decreases significantly, thus preventing theinstability of the trp operon. Accordingly, we chose r tobe less than 10 and greater than 5 in any instance, 5 <r e 10, or equivalently, 1.6094 < wr e 2.3025
At this point it is necessary to comment about anadditional constraint that derives from the previous one.The p4 parameter is directly related with r in such a waythat a decrease in r implies a proportional decrease inp4 (p4 ) n k1 Rt T; Rt ) rK0; see Appendix). Accordingly,an additional constraint on the p4 value should beconsidered:
which after substituting and taking logarithms becomes
Boundaries on the Inhibition Constant of the EnzymesInvolved in the Tryptophan Synthesis (ki). For highervalues of ki the tryptophan level increases, thus prevent-ing instability of the trp operon (2). A lower limit of 500was considered as the minimum and around twice thereported value (2283) was taken as the maximum, 500e ki e 5000. Again, after taking logarithms we obtainthe following linear constraint: 6.2146 e wki e 8.5171.
Boundaries on the Tryptophan Consumption and Se-cretion Constant (p5). An enhanced secretion rate willhave direct influence on the p5 value. A maximum valueof 1000, which is still realistic is considered (9), 0 < p5 e1000. This expression becomes in the linear program wp5
e 6.9077.Constant Parameter Values. In the model p1 and p2 are
proportional to the rate constant for the degradation ofmRNA and enzymes, respectively. Although mRNAs ofdifferent stabilities are known that can offer a measureof translational control, the manipulation of the p1 andp2 parameters is not easy. By contrast, p6 is a parameterthat reflects the influence of the growth rate on theprotein content of the cell with little effect on thetryptophan production. Finally, k is the dimensionlesssaturation constant of tryptophan. Higher yields oftryptophan production could be obtained if tryptophandegradation is avoided (9). In fact Xiu et al. (2) used thecorresponding parameter, R3, as 0. This is becausemutants lacking tryptophanase are available and havealready been used in strain construction (21). All theseparameters are kept at reported values (p1 ) 0.9; p2 )0.02; p6 ) 7.5; and k ) 0.005), and after taking logarithmsthe corresponding constraints take the following form:
where wi ) ln i.Constraints on Dependent Variables. The dependent
variables should be constrained, otherwise the optimumsolution suggests extreme values that are not compatiblewith cell viability (results not shown). There is no hardevidence on what magnitudes of variations in variables
such as the concentrations of mRNA, enzymes, or tryp-tophan can be tolerated without causing losses in growthrate or fitness, which usually lead to poor yield or rateof product synthesis. It is noted that the limits could bedifferent for each variable. In any case, the aim ofimposing constraints is to ensure that the optimumsolution is within the physiologically acceptable rangeof values, no matter if the IOM solution violates theprescribed constraint imposed in the linear model. Wearbitrarily allow changes of up to 20% around the steady-state levels. In this way we guarantee that the optimumsolution values do not exceedingly deviate from the basalsteady state, thus ensuring that the prediction of thelinear program is accurate enough. Accordingly,
which, after substitution of numerical values, becomesin logarithmic coordinates
where wi ) ln i.4. Transfer of Results to the Original Model. The
S-system has been derived as an approximation of adifferent model, and it is interesting to explore to whatdegree any optimized solution is consistent between thetwo models. To this end, the parameter value profile ofthe optimized S-solution was used as input to the originalmodel (eqs 1-3). This was accomplished by substitutingthe optimized parameter values in the simulation pro-gram supplied in the software MAPLE V that allowedthe dynamical evaluations of the original model. Thesteady state of the model, implemented with the newparameter values, was solved numerically. The result isan optimized steady-state solution that is consistent withthe original model. This solution is not necessarily thetrue optimum, because it is computed via S-systemapproximation, which is accompanied by some unknownapproximation error. The following results will demon-strate that the differences between the steady states ofthe original and the S-system models are often small incomparison to the experimental accuracy and in light ofother uncertainties involved in any modeling effort. Apossible outcome of the present step is that some of themetabolite concentrations exceed the imposed limits orthat the traditional model is unstable. If the discrepan-cies in metabolites are physiologically significant or if thesystem is unstable, some of the constraints in step 2 mustbe changed accordingly.
The Iterative IOM Version. Alternatively, when sucha situation occurs or significant discrepancies betweenthe S-system and the original model are detected, aprocedure can be applied (11) to obtain a consistentsteady state. This procedure consists of translating thesteady state obtained at the original model after substi-tution of the first set of optimized parameters to a newS-system model. This second S-system representationconstitutes now the starting point for a new round in theIOM approach. Repetition of this process would renderdifferent steady states, each one increasingly accurate
p4 ) nk1RtT ) n ‚ (k2/Kd) ‚ K0 ‚ T ‚ r
wp4) -6.0984 + wr
wp1) -0.1053
wp2) -3.9120
wp6) 2.0149
wk ) -5.2983
0.8 ‚ xbasal e x e 1.2 ‚ xbasal
0.8 ‚ ybasal e y e 1.2 ‚ ybasal
0.8 ‚ zbasal e z e 1.2 ‚ zbasal
-1.9124 e wx e -1.5069
1.8546 e wy e 2.2601
7.0345 e wz e 7.4399
Biotechnol. Prog., 2000, Vol. 16, No. 2 137
and closer to the true optimum. Eventually, this iterativeprocess will finish when detected discrepancies betweenthe S-system solution and the IOM solution become smallenough to be considered satisfactory. This approach hasbeen applied in the present case.
ResultsQuality Assessment of the Basal Steady-State
Model Representation. In the optimization procedurethe first step is the analysis of stability, robustness, anddynamic behavior of the model used as the basis for theoptimization. It is evident that if the model constitutesa poor representation of the system we should discard itas an instrument for predicting an optimized set ofparameters.
At the reference steady state the system is locallystable, as indicated by the negative values of the eigen-values for x, y, and z, which are respectively -0.903,-0.0231, and -5.38 × 10⁻³. We note here that theimaginary part is always 0, which prevents the possibilityof damped oscillatory responses to perturbations in thedependent variables. The numerical values of the realparts of each eigenvalue indicate the relative time scalesof the responses involved. The smallest values are relatedto the slowest processes, and the largest values areassociated with the faster processes. These considerationswill be illustrated when we investigate the dynamics ofthe system.
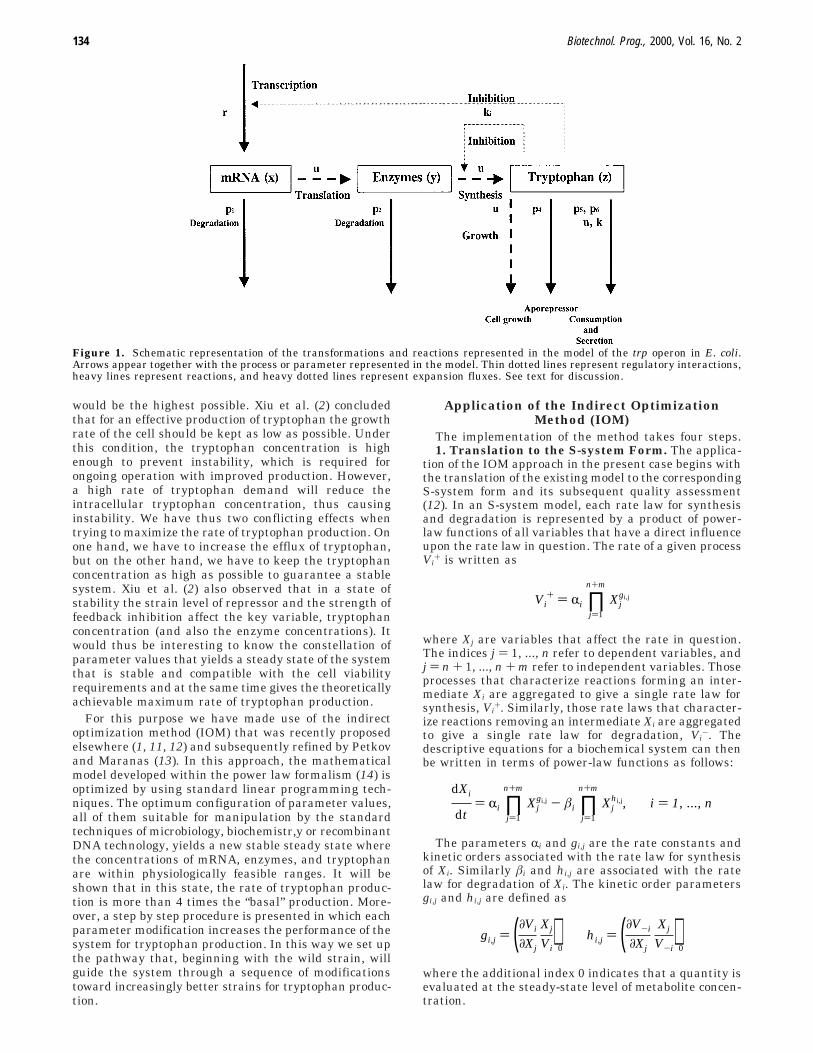
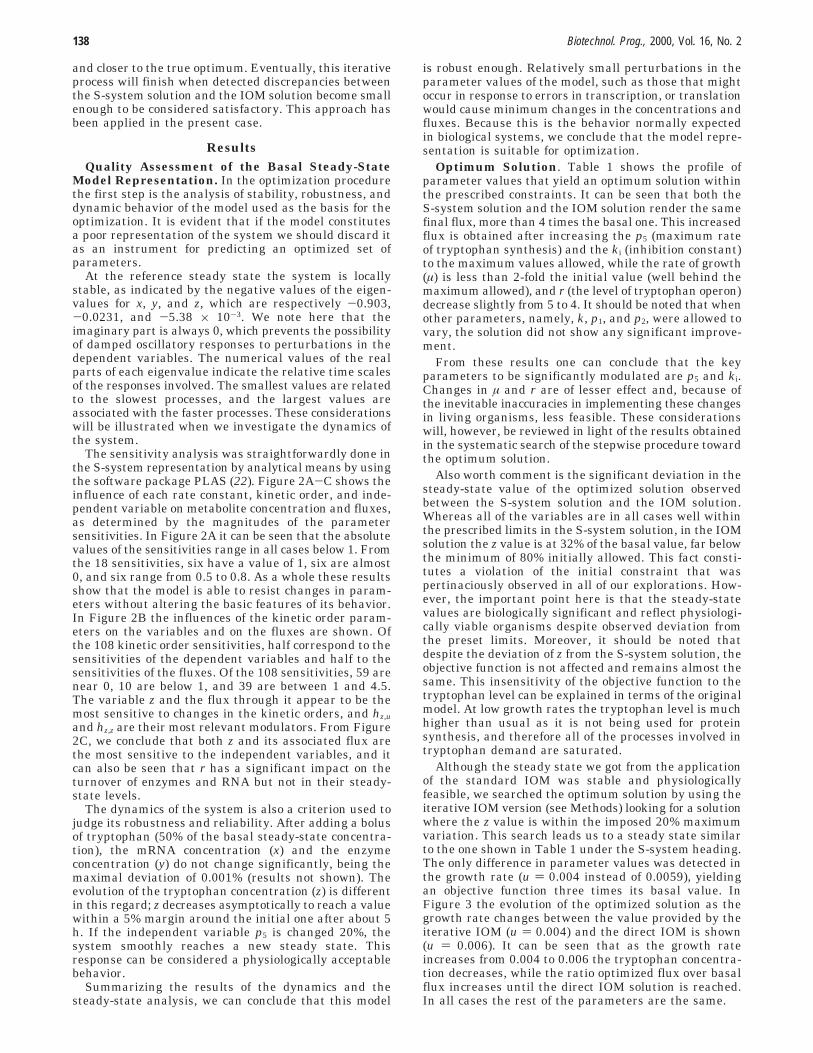
The sensitivity analysis was straightforwardly done inthe S-system representation by analytical means by usingthe software package PLAS (22). Figure 2A-C shows theinfluence of each rate constant, kinetic order, and inde-pendent variable on metabolite concentration and fluxes,as determined by the magnitudes of the parametersensitivities. In Figure 2A it can be seen that the absolutevalues of the sensitivities range in all cases below 1. Fromthe 18 sensitivities, six have a value of 1, six are almost0, and six range from 0.5 to 0.8. As a whole these resultsshow that the model is able to resist changes in param-eters without altering the basic features of its behavior.In Figure 2B the influences of the kinetic order param-eters on the variables and on the fluxes are shown. Ofthe 108 kinetic order sensitivities, half correspond to thesensitivities of the dependent variables and half to thesensitivities of the fluxes. Of the 108 sensitivities, 59 arenear 0, 10 are below 1, and 39 are between 1 and 4.5.The variable z and the flux through it appear to be themost sensitive to changes in the kinetic orders, and hz,uand hz,z are their most relevant modulators. From Figure2C, we conclude that both z and its associated flux arethe most sensitive to the independent variables, and itcan also be seen that r has a significant impact on theturnover of enzymes and RNA but not in their steady-state levels.
The dynamics of the system is also a criterion used tojudge its robustness and reliability. After adding a bolusof tryptophan (50% of the basal steady-state concentra-tion), the mRNA concentration (x) and the enzymeconcentration (y) do not change significantly, being themaximal deviation of 0.001% (results not shown). Theevolution of the tryptophan concentration (z) is differentin this regard; z decreases asymptotically to reach a valuewithin a 5% margin around the initial one after about 5h. If the independent variable p5 is changed 20%, thesystem smoothly reaches a new steady state. Thisresponse can be considered a physiologically acceptablebehavior.
Summarizing the results of the dynamics and thesteady-state analysis, we can conclude that this model
is robust enough. Relatively small perturbations in theparameter values of the model, such as those that mightoccur in response to errors in transcription, or translationwould cause minimum changes in the concentrations andfluxes. Because this is the behavior normally expectedin biological systems, we conclude that the model repre-sentation is suitable for optimization.
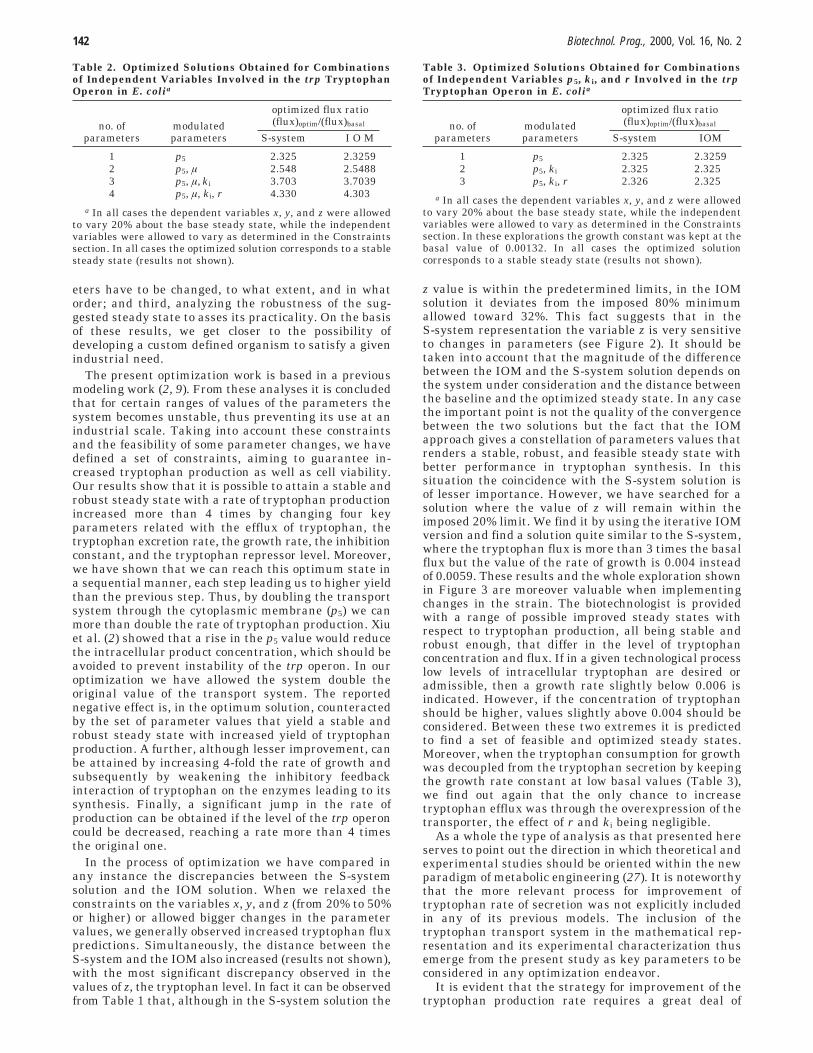
Optimum Solution. Table 1 shows the profile ofparameter values that yield an optimum solution withinthe prescribed constraints. It can be seen that both theS-system solution and the IOM solution render the samefinal flux, more than 4 times the basal one. This increasedflux is obtained after increasing the p5 (maximum rateof tryptophan synthesis) and the ki (inhibition constant)to the maximum values allowed, while the rate of growth(µ) is less than 2-fold the initial value (well behind themaximum allowed), and r (the level of tryptophan operon)decrease slightly from 5 to 4. It should be noted that whenother parameters, namely, k, p1, and p2, were allowed tovary, the solution did not show any significant improve-ment.
From these results one can conclude that the keyparameters to be significantly modulated are p5 and ki.Changes in µ and r are of lesser effect and, because ofthe inevitable inaccuracies in implementing these changesin living organisms, less feasible. These considerationswill, however, be reviewed in light of the results obtainedin the systematic search of the stepwise procedure towardthe optimum solution.
Also worth comment is the significant deviation in thesteady-state value of the optimized solution observedbetween the S-system solution and the IOM solution.Whereas all of the variables are in all cases well withinthe prescribed limits in the S-system solution, in the IOMsolution the z value is at 32% of the basal value, far belowthe minimum of 80% initially allowed. This fact consti-tutes a violation of the initial constraint that waspertinaciously observed in all of our explorations. How-ever, the important point here is that the steady-statevalues are biologically significant and reflect physiologi-cally viable organisms despite observed deviation fromthe preset limits. Moreover, it should be noted thatdespite the deviation of z from the S-system solution, theobjective function is not affected and remains almost thesame. This insensitivity of the objective function to thetryptophan level can be explained in terms of the originalmodel. At low growth rates the tryptophan level is muchhigher than usual as it is not being used for proteinsynthesis, and therefore all of the processes involved intryptophan demand are saturated.
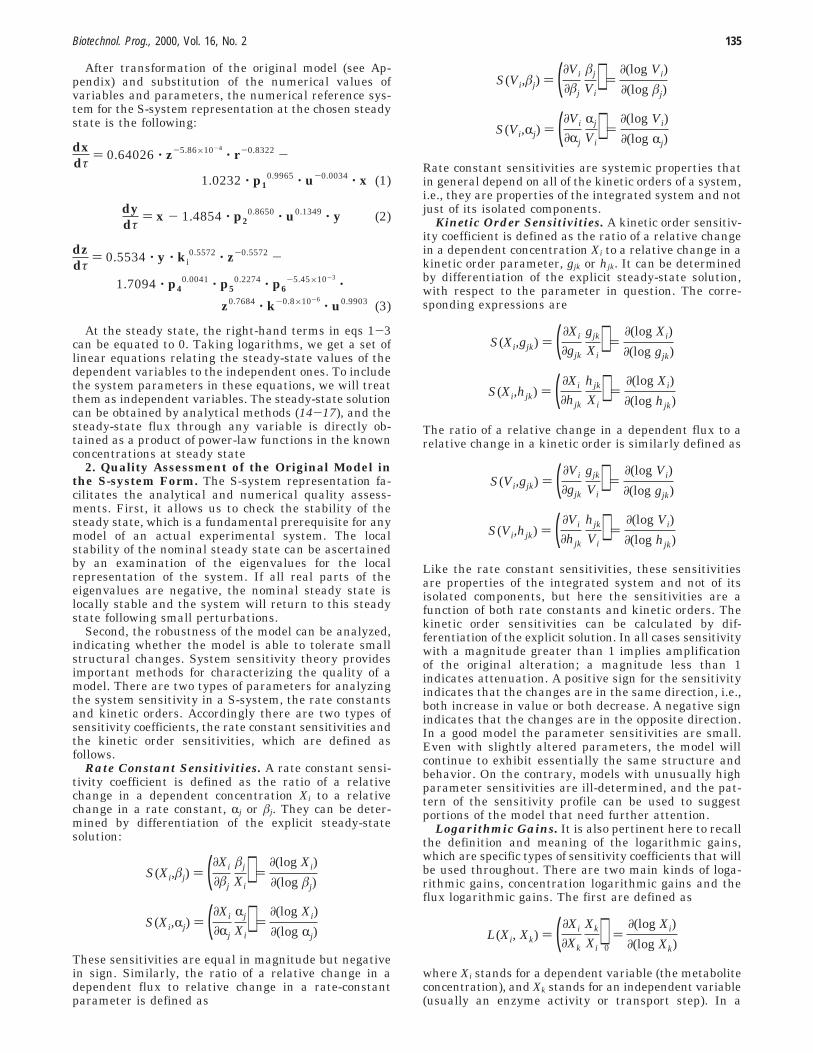
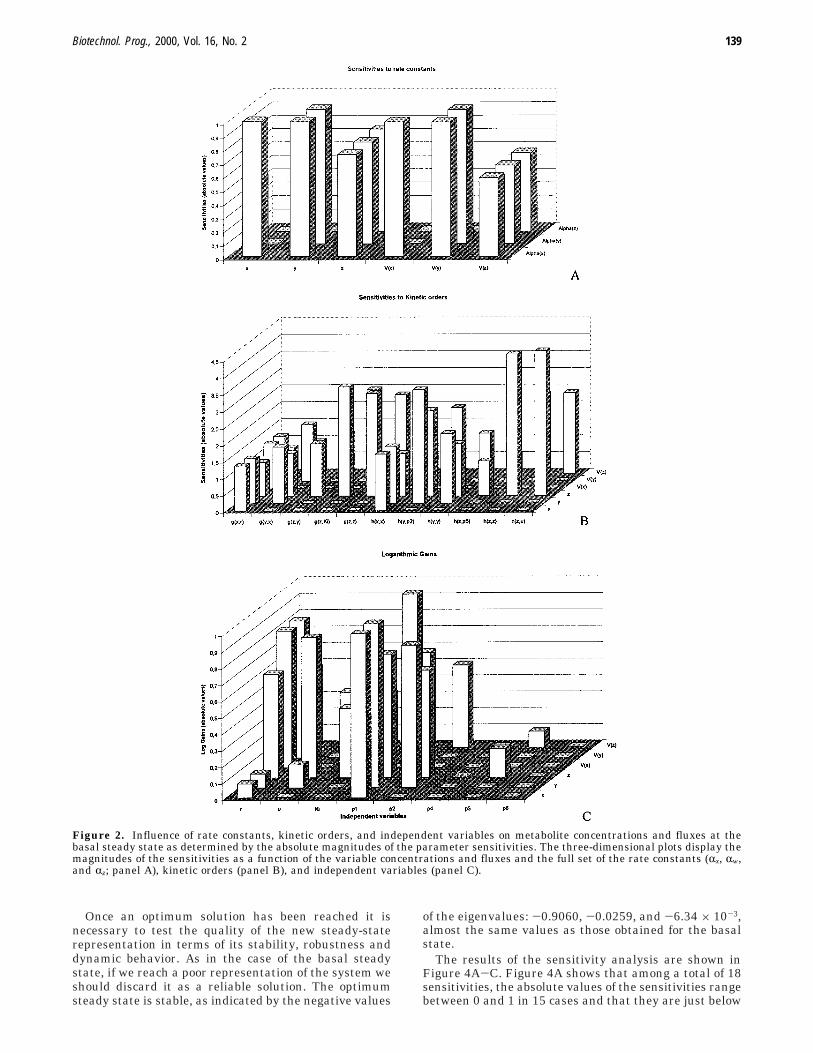
Although the steady state we got from the applicationof the standard IOM was stable and physiologicallyfeasible, we searched the optimum solution by using theiterative IOM version (see Methods) looking for a solutionwhere the z value is within the imposed 20% maximumvariation. This search leads us to a steady state similarto the one shown in Table 1 under the S-system heading.The only difference in parameter values was detected inthe growth rate (u ) 0.004 instead of 0.0059), yieldingan objective function three times its basal value. InFigure 3 the evolution of the optimized solution as thegrowth rate changes between the value provided by theiterative IOM (u ) 0.004) and the direct IOM is shown(u ) 0.006). It can be seen that as the growth rateincreases from 0.004 to 0.006 the tryptophan concentra-tion decreases, while the ratio optimized flux over basalflux increases until the direct IOM solution is reached.In all cases the rest of the parameters are the same.
138 Biotechnol. Prog., 2000, Vol. 16, No. 2
Once an optimum solution has been reached it isnecessary to test the quality of the new steady-staterepresentation in terms of its stability, robustness anddynamic behavior. As in the case of the basal steadystate, if we reach a poor representation of the system weshould discard it as a reliable solution. The optimumsteady state is stable, as indicated by the negative values
of the eigenvalues: -0.9060, -0.0259, and -6.34 × 10⁻³,almost the same values as those obtained for the basalstate.
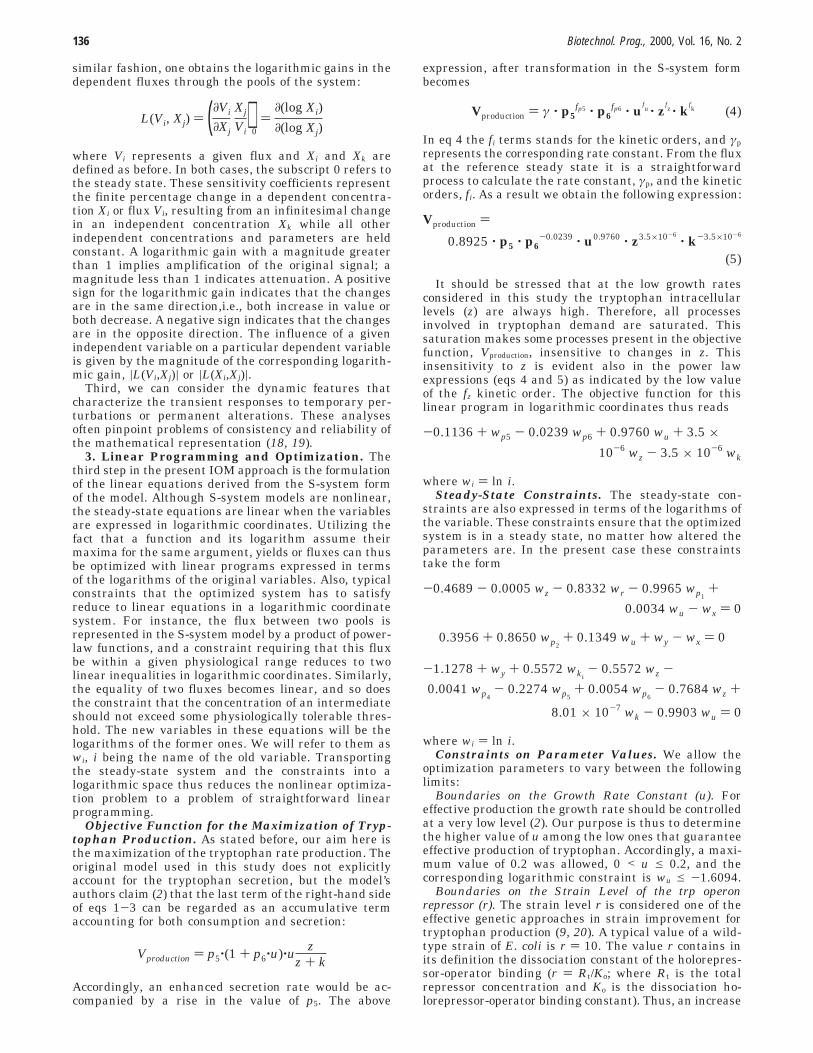
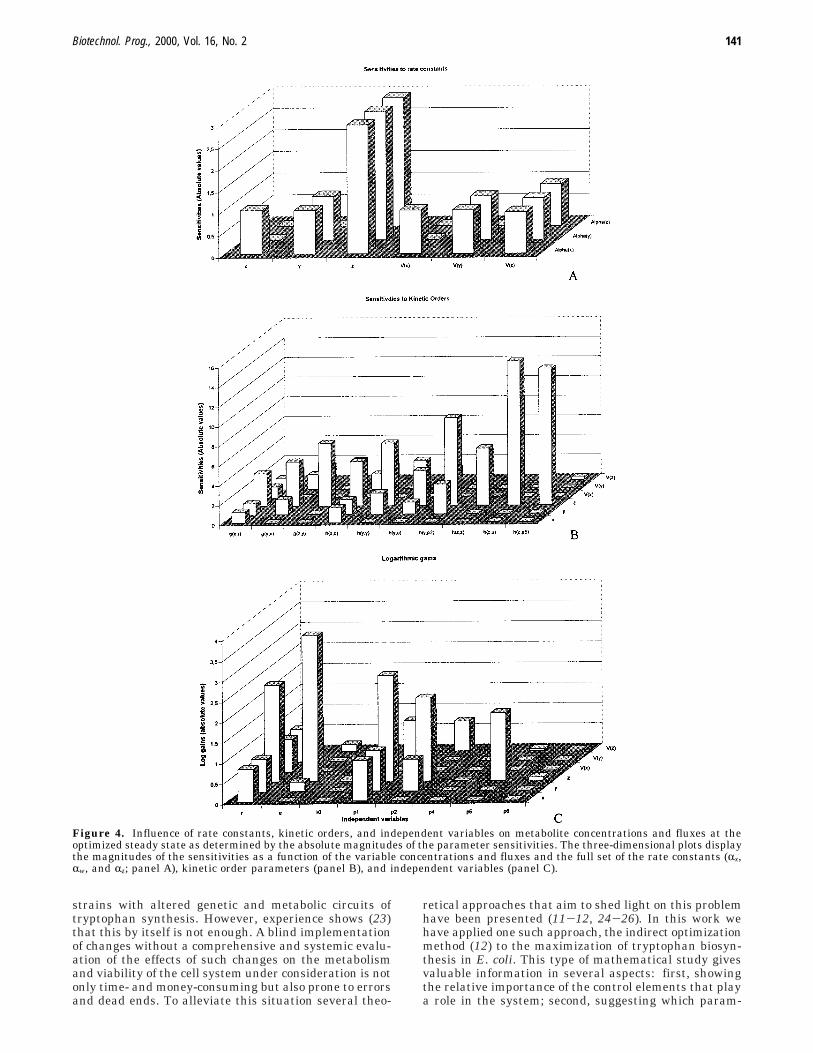
The results of the sensitivity analysis are shown inFigure 4A-C. Figure 4A shows that among a total of 18sensitivities, the absolute values of the sensitivities rangebetween 0 and 1 in 15 cases and that they are just below
Figure 2. Influence of rate constants, kinetic orders, and independent variables on metabolite concentrations and fluxes at thebasal steady state as determined by the absolute magnitudes of the parameter sensitivities. The three-dimensional plots display themagnitudes of the sensitivities as a function of the variable concentrations and fluxes and the full set of the rate constants (Rx, Rw,and Rz; panel A), kinetic orders (panel B), and independent variables (panel C).
Biotechnol. Prog., 2000, Vol. 16, No. 2 139
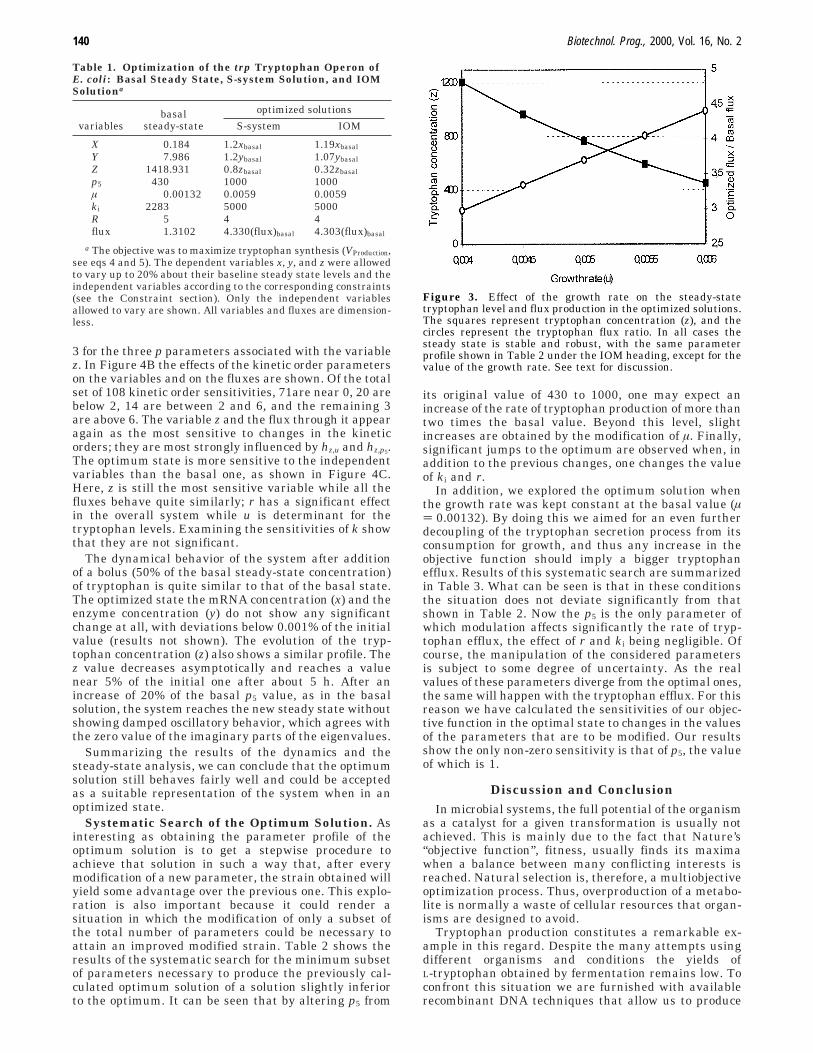
3 for the three p parameters associated with the variablez. In Figure 4B the effects of the kinetic order parameterson the variables and on the fluxes are shown. Of the totalset of 108 kinetic order sensitivities, 71are near 0, 20 arebelow 2, 14 are between 2 and 6, and the remaining 3are above 6. The variable z and the flux through it appearagain as the most sensitive to changes in the kineticorders; they are most strongly influenced by hz,u and hz,p5.The optimum state is more sensitive to the independentvariables than the basal one, as shown in Figure 4C.Here, z is still the most sensitive variable while all thefluxes behave quite similarly; r has a significant effectin the overall system while u is determinant for thetryptophan levels. Examining the sensitivities of k showthat they are not significant.
The dynamical behavior of the system after additionof a bolus (50% of the basal steady-state concentration)of tryptophan is quite similar to that of the basal state.The optimized state the mRNA concentration (x) and theenzyme concentration (y) do not show any significantchange at all, with deviations below 0.001% of the initialvalue (results not shown). The evolution of the tryp-tophan concentration (z) also shows a similar profile. Thez value decreases asymptotically and reaches a valuenear 5% of the initial one after about 5 h. After anincrease of 20% of the basal p5 value, as in the basalsolution, the system reaches the new steady state withoutshowing damped oscillatory behavior, which agrees withthe zero value of the imaginary parts of the eigenvalues.
Summarizing the results of the dynamics and thesteady-state analysis, we can conclude that the optimumsolution still behaves fairly well and could be acceptedas a suitable representation of the system when in anoptimized state.
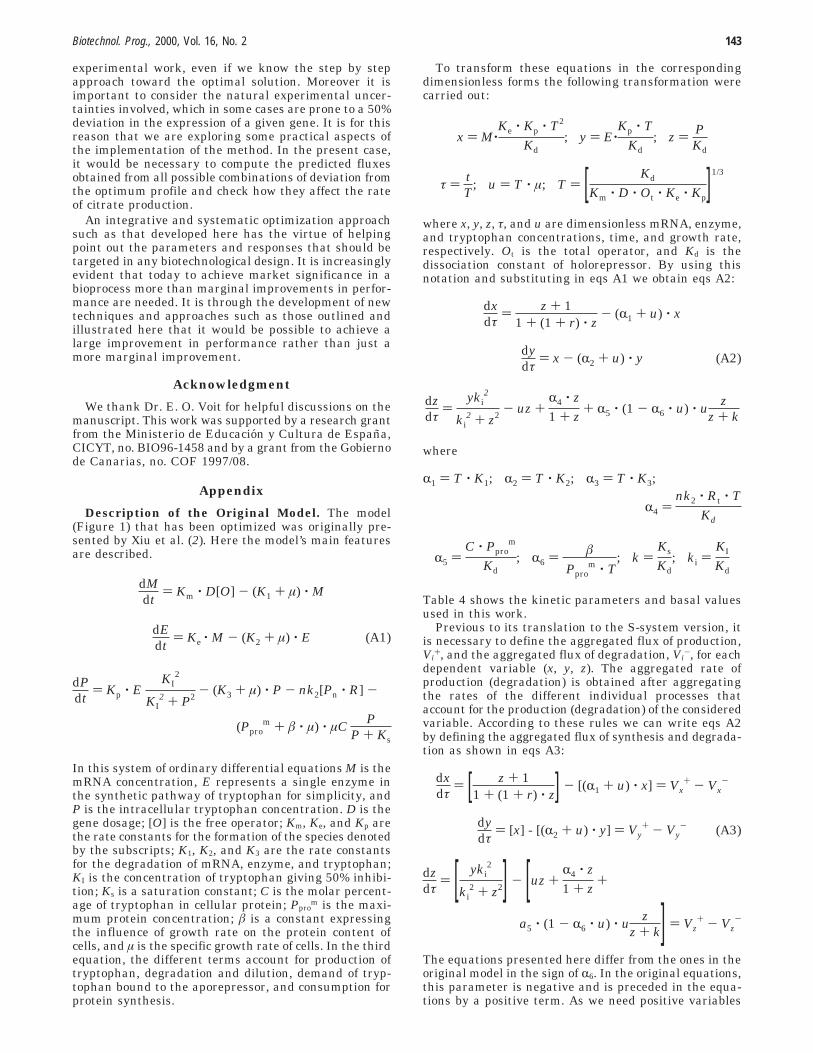
Systematic Search of the Optimum Solution. Asinteresting as obtaining the parameter profile of theoptimum solution is to get a stepwise procedure toachieve that solution in such a way that, after everymodification of a new parameter, the strain obtained willyield some advantage over the previous one. This explo-ration is also important because it could render asituation in which the modification of only a subset ofthe total number of parameters could be necessary toattain an improved modified strain. Table 2 shows theresults of the systematic search for the minimum subsetof parameters necessary to produce the previously cal-culated optimum solution of a solution slightly inferiorto the optimum. It can be seen that by altering p5 from
its original value of 430 to 1000, one may expect anincrease of the rate of tryptophan production of more thantwo times the basal value. Beyond this level, slightincreases are obtained by the modification of µ. Finally,significant jumps to the optimum are observed when, inaddition to the previous changes, one changes the valueof ki and r.
In addition, we explored the optimum solution whenthe growth rate was kept constant at the basal value (µ) 0.00132). By doing this we aimed for an even furtherdecoupling of the tryptophan secretion process from itsconsumption for growth, and thus any increase in theobjective function should imply a bigger tryptophanefflux. Results of this systematic search are summarizedin Table 3. What can be seen is that in these conditionsthe situation does not deviate significantly from thatshown in Table 2. Now the p5 is the only parameter ofwhich modulation affects significantly the rate of tryp-tophan efflux, the effect of r and ki being negligible. Ofcourse, the manipulation of the considered parametersis subject to some degree of uncertainty. As the realvalues of these parameters diverge from the optimal ones,the same will happen with the tryptophan efflux. For thisreason we have calculated the sensitivities of our objec-tive function in the optimal state to changes in the valuesof the parameters that are to be modified. Our resultsshow the only non-zero sensitivity is that of p5, the valueof which is 1.
Discussion and ConclusionIn microbial systems, the full potential of the organism
as a catalyst for a given transformation is usually notachieved. This is mainly due to the fact that Nature’s“objective function”, fitness, usually finds its maximawhen a balance between many conflicting interests isreached. Natural selection is, therefore, a multiobjectiveoptimization process. Thus, overproduction of a metabo-lite is normally a waste of cellular resources that organ-isms are designed to avoid.
Tryptophan production constitutes a remarkable ex-ample in this regard. Despite the many attempts usingdifferent organisms and conditions the yields ofL-tryptophan obtained by fermentation remains low. Toconfront this situation we are furnished with availablerecombinant DNA techniques that allow us to produce
Table 1. Optimization of the trp Tryptophan Operon ofE. coli: Basal Steady State, S-system Solution, and IOMSolutiona
optimized solutions
variablesbasal
steady-state S-system IOM
X 0.184 1.2xbasal 1.19xbasal
Y 7.986 1.2ybasal 1.07ybasal
Z 1418.931 0.8zbasal 0.32zbasal
p5 430 1000 1000µ 0.00132 0.0059 0.0059ki 2283 5000 5000R 5 4 4flux 1.3102 4.330(flux)basal 4.303(flux)basal
a The objective was to maximize tryptophan synthesis (VProduction,see eqs 4 and 5). The dependent variables x, y, and z were allowedto vary up to 20% about their baseline steady state levels and theindependent variables according to the corresponding constraints(see the Constraint section). Only the independent variablesallowed to vary are shown. All variables and fluxes are dimension-less.
Figure 3. Effect of the growth rate on the steady-statetryptophan level and flux production in the optimized solutions.The squares represent tryptophan concentration (z), and thecircles represent the tryptophan flux ratio. In all cases thesteady state is stable and robust, with the same parameterprofile shown in Table 2 under the IOM heading, except for thevalue of the growth rate. See text for discussion.
140 Biotechnol. Prog., 2000, Vol. 16, No. 2
strains with altered genetic and metabolic circuits oftryptophan synthesis. However, experience shows (23)that this by itself is not enough. A blind implementationof changes without a comprehensive and systemic evalu-ation of the effects of such changes on the metabolismand viability of the cell system under consideration is notonly time- and money-consuming but also prone to errorsand dead ends. To alleviate this situation several theo-
retical approaches that aim to shed light on this problemhave been presented (11-12, 24-26). In this work wehave applied one such approach, the indirect optimizationmethod (12) to the maximization of tryptophan biosyn-thesis in E. coli. This type of mathematical study givesvaluable information in several aspects: first, showingthe relative importance of the control elements that playa role in the system; second, suggesting which param-
Figure 4. Influence of rate constants, kinetic orders, and independent variables on metabolite concentrations and fluxes at theoptimized steady state as determined by the absolute magnitudes of the parameter sensitivities. The three-dimensional plots displaythe magnitudes of the sensitivities as a function of the variable concentrations and fluxes and the full set of the rate constants (Rx,Rw, and Rz; panel A), kinetic order parameters (panel B), and independent variables (panel C).
Biotechnol. Prog., 2000, Vol. 16, No. 2 141
eters have to be changed, to what extent, and in whatorder; and third, analyzing the robustness of the sug-gested steady state to asses its practicality. On the basisof these results, we get closer to the possibility ofdeveloping a custom defined organism to satisfy a givenindustrial need.
The present optimization work is based in a previousmodeling work (2, 9). From these analyses it is concludedthat for certain ranges of values of the parameters thesystem becomes unstable, thus preventing its use at anindustrial scale. Taking into account these constraintsand the feasibility of some parameter changes, we havedefined a set of constraints, aiming to guarantee in-creased tryptophan production as well as cell viability.Our results show that it is possible to attain a stable androbust steady state with a rate of tryptophan productionincreased more than 4 times by changing four keyparameters related with the efflux of tryptophan, thetryptophan excretion rate, the growth rate, the inhibitionconstant, and the tryptophan repressor level. Moreover,we have shown that we can reach this optimum state ina sequential manner, each step leading us to higher yieldthan the previous step. Thus, by doubling the transportsystem through the cytoplasmic membrane (p5) we canmore than double the rate of tryptophan production. Xiuet al. (2) showed that a rise in the p5 value would reducethe intracellular product concentration, which should beavoided to prevent instability of the trp operon. In ouroptimization we have allowed the system double theoriginal value of the transport system. The reportednegative effect is, in the optimum solution, counteractedby the set of parameter values that yield a stable androbust steady state with increased yield of tryptophanproduction. A further, although lesser improvement, canbe attained by increasing 4-fold the rate of growth andsubsequently by weakening the inhibitory feedbackinteraction of tryptophan on the enzymes leading to itssynthesis. Finally, a significant jump in the rate ofproduction can be obtained if the level of the trp operoncould be decreased, reaching a rate more than 4 timesthe original one.
In the process of optimization we have compared inany instance the discrepancies between the S-systemsolution and the IOM solution. When we relaxed theconstraints on the variables x, y, and z (from 20% to 50%or higher) or allowed bigger changes in the parametervalues, we generally observed increased tryptophan fluxpredictions. Simultaneously, the distance between theS-system and the IOM also increased (results not shown),with the most significant discrepancy observed in thevalues of z, the tryptophan level. In fact it can be observedfrom Table 1 that, although in the S-system solution the
z value is within the predetermined limits, in the IOMsolution it deviates from the imposed 80% minimumallowed toward 32%. This fact suggests that in theS-system representation the variable z is very sensitiveto changes in parameters (see Figure 2). It should betaken into account that the magnitude of the differencebetween the IOM and the S-system solution depends onthe system under consideration and the distance betweenthe baseline and the optimized steady state. In any casethe important point is not the quality of the convergencebetween the two solutions but the fact that the IOMapproach gives a constellation of parameters values thatrenders a stable, robust, and feasible steady state withbetter performance in tryptophan synthesis. In thissituation the coincidence with the S-system solution isof lesser importance. However, we have searched for asolution where the value of z will remain within theimposed 20% limit. We find it by using the iterative IOMversion and find a solution quite similar to the S-system,where the tryptophan flux is more than 3 times the basalflux but the value of the rate of growth is 0.004 insteadof 0.0059. These results and the whole exploration shownin Figure 3 are moreover valuable when implementingchanges in the strain. The biotechnologist is providedwith a range of possible improved steady states withrespect to tryptophan production, all being stable androbust enough, that differ in the level of tryptophanconcentration and flux. If in a given technological processlow levels of intracellular tryptophan are desired oradmissible, then a growth rate slightly below 0.006 isindicated. However, if the concentration of tryptophanshould be higher, values slightly above 0.004 should beconsidered. Between these two extremes it is predictedto find a set of feasible and optimized steady states.Moreover, when the tryptophan consumption for growthwas decoupled from the tryptophan secretion by keepingthe growth rate constant at low basal values (Table 3),we find out again that the only chance to increasetryptophan efflux was through the overexpression of thetransporter, the effect of r and ki being negligible.
As a whole the type of analysis as that presented hereserves to point out the direction in which theoretical andexperimental studies should be oriented within the newparadigm of metabolic engineering (27). It is noteworthythat the more relevant process for improvement oftryptophan rate of secretion was not explicitly includedin any of its previous models. The inclusion of thetryptophan transport system in the mathematical rep-resentation and its experimental characterization thusemerge from the present study as key parameters to beconsidered in any optimization endeavor.
It is evident that the strategy for improvement of thetryptophan production rate requires a great deal of
Table 2. Optimized Solutions Obtained for Combinationsof Independent Variables Involved in the trp TryptophanOperon in E. colia
optimized flux ratio(flux)optim/(flux)basalno. of
parametersmodulatedparameters S-system I O M
1 p5 2.325 2.32592 p5, µ 2.548 2.54883 p5, µ, ki 3.703 3.70394 p5, µ, ki, r 4.330 4.303
a In all cases the dependent variables x, y, and z were allowedto vary 20% about the base steady state, while the independentvariables were allowed to vary as determined in the Constraintssection. In all cases the optimized solution corresponds to a stablesteady state (results not shown).
Table 3. Optimized Solutions Obtained for Combinationsof Independent Variables p5, ki, and r Involved in the trpTryptophan Operon in E. colia
optimized flux ratio(flux)optim/(flux)basalno. of
parametersmodulatedparameters S-system IOM
1 p5 2.325 2.32592 p5, ki 2.325 2.3253 p5, ki, r 2.326 2.325
a In all cases the dependent variables x, y, and z were allowedto vary 20% about the base steady state, while the independentvariables were allowed to vary as determined in the Constraintssection. In these explorations the growth constant was kept at thebasal value of 0.00132. In all cases the optimized solutioncorresponds to a stable steady state (results not shown).
142 Biotechnol. Prog., 2000, Vol. 16, No. 2
experimental work, even if we know the step by stepapproach toward the optimal solution. Moreover it isimportant to consider the natural experimental uncer-tainties involved, which in some cases are prone to a 50%deviation in the expression of a given gene. It is for thisreason that we are exploring some practical aspects ofthe implementation of the method. In the present case,it would be necessary to compute the predicted fluxesobtained from all possible combinations of deviation fromthe optimum profile and check how they affect the rateof citrate production.
An integrative and systematic optimization approachsuch as that developed here has the virtue of helpingpoint out the parameters and responses that should betargeted in any biotechnological design. It is increasinglyevident that today to achieve market significance in abioprocess more than marginal improvements in perfor-mance are needed. It is through the development of newtechniques and approaches such as those outlined andillustrated here that it would be possible to achieve alarge improvement in performance rather than just amore marginal improvement.
Acknowledgment
We thank Dr. E. O. Voit for helpful discussions on themanuscript. This work was supported by a research grantfrom the Ministerio de Educacion y Cultura de Espana,CICYT, no. BIO96-1458 and by a grant from the Gobiernode Canarias, no. COF 1997/08.
Appendix
Description of the Original Model. The model(Figure 1) that has been optimized was originally pre-sented by Xiu et al. (2). Here the model’s main featuresare described.
In this system of ordinary differential equations M is themRNA concentration, E represents a single enzyme inthe synthetic pathway of tryptophan for simplicity, andP is the intracellular tryptophan concentration. D is thegene dosage; [O] is the free operator; Km, Ke, and Kp arethe rate constants for the formation of the species denotedby the subscripts; K1, K2, and K3 are the rate constantsfor the degradation of mRNA, enzyme, and tryptophan;KI is the concentration of tryptophan giving 50% inhibi-tion; Ks is a saturation constant; C is the molar percent-age of tryptophan in cellular protein; Ppro
m is the maxi-mum protein concentration; â is a constant expressingthe influence of growth rate on the protein content ofcells, and µ is the specific growth rate of cells. In the thirdequation, the different terms account for production oftryptophan, degradation and dilution, demand of tryp-tophan bound to the aporepressor, and consumption forprotein synthesis.
To transform these equations in the correspondingdimensionless forms the following transformation werecarried out:
where x, y, z, τ, and u are dimensionless mRNA, enzyme,and tryptophan concentrations, time, and growth rate,respectively. Ot is the total operator, and Kd is thedissociation constant of holorepressor. By using thisnotation and substituting in eqs A1 we obtain eqs A2:
where
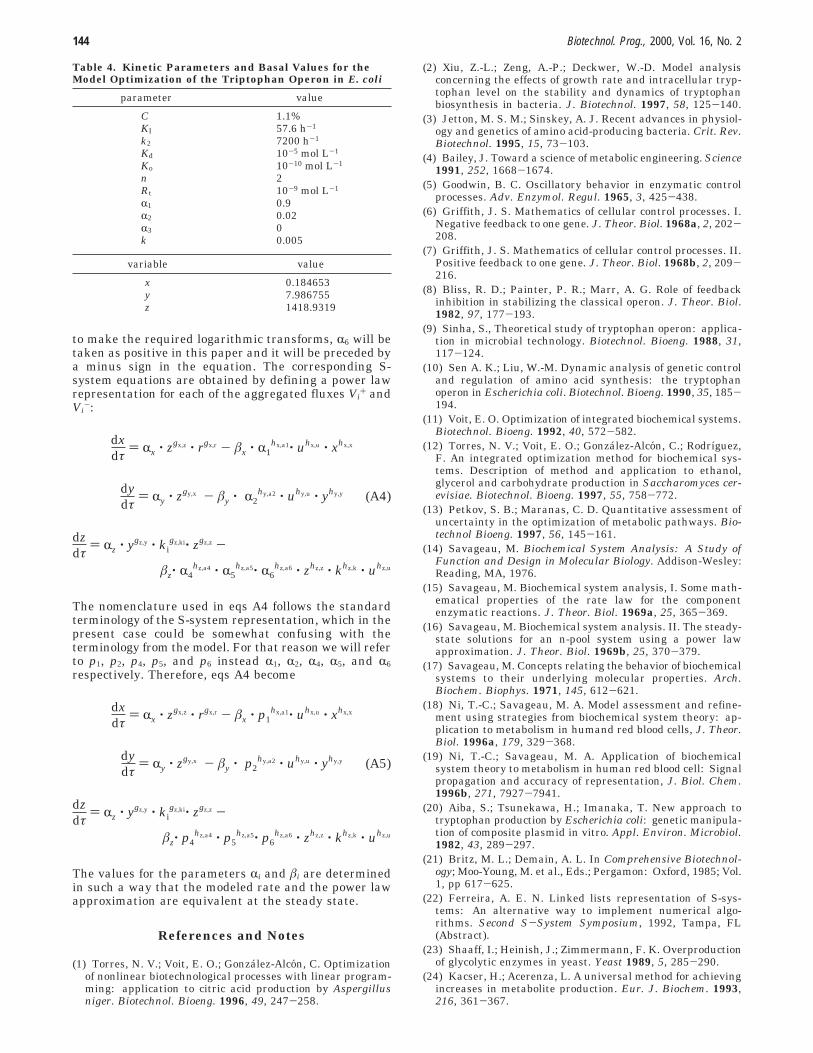
Table 4 shows the kinetic parameters and basal valuesused in this work.
Previous to its translation to the S-system version, itis necessary to define the aggregated flux of production,Vi
+, and the aggregated flux of degradation, Vi-, for each
dependent variable (x, y, z). The aggregated rate ofproduction (degradation) is obtained after aggregatingthe rates of the different individual processes thataccount for the production (degradation) of the consideredvariable. According to these rules we can write eqs A2by defining the aggregated flux of synthesis and degrada-tion as shown in eqs A3:
The equations presented here differ from the ones in theoriginal model in the sign of R6. In the original equations,this parameter is negative and is preceded in the equa-tions by a positive term. As we need positive variables
dMdt
) Km ‚ D[O] - (K1 + µ) ‚ M
dEdt
) Ke ‚ M - (K2 + µ) ‚ E (A1)
dPdt
) Kp ‚ EKI
2
KI2 + P2
- (K3 + µ) ‚ P - nk2[Pn ‚ R] -
(Pprom + â ‚ µ) ‚ µC P
P + Ks
x ) M‚Ke ‚ Kp ‚ T2
Kd; y ) E‚
Kp ‚ TKd
; z ) PKd
τ ) tT
; u ) T ‚ µ; T ) [ Kd
Km ‚ D ‚ Ot ‚ Ke ‚ Kp]1/3
dxdτ
) z + 11 + (1 + r) ‚ z
- (R1 + u) ‚ x
dydτ
) x - (R2 + u) ‚ y (A2)
dzdτ
)yki
2
ki2 + z2
- uz +R4 ‚ z1 + z
+ R5 ‚ (1 - R6 ‚ u) ‚ u zz + k
R1 ) T ‚ K1; R2 ) T ‚ K2; R3 ) T ‚ K3;
R4 )nk2 ‚ Rt ‚ T
Kd
R5 )C ‚ Ppro
m
Kd; R6 ) â
Pprom ‚ T
; k )Ks
Kd; ki )
KI
Kd
dxdτ
) [ z + 11 + (1 + r) ‚ z] - [(R1 + u) ‚ x] ) Vx
+ - Vx-
dydτ
) [x] - [(R2 + u) ‚ y] ) Vy+ - Vy
- (A3)
dzdτ
) [ yki2
ki2 + z2] - [uz +
R4 ‚ z1 + z
+
a5 ‚ (1 - R6 ‚ u) ‚ u zz + k] ) Vz
+ - Vz-
Biotechnol. Prog., 2000, Vol. 16, No. 2 143
to make the required logarithmic transforms, R6 will betaken as positive in this paper and it will be preceded bya minus sign in the equation. The corresponding S-system equations are obtained by defining a power lawrepresentation for each of the aggregated fluxes Vi
+ andVi
-:
The nomenclature used in eqs A4 follows the standardterminology of the S-system representation, which in thepresent case could be somewhat confusing with theterminology from the model. For that reason we will referto p1, p2, p4, p5, and p6 instead R1, R2, R4, R5, and R6respectively. Therefore, eqs A4 become
The values for the parameters Ri and âi are determinedin such a way that the modeled rate and the power lawapproximation are equivalent at the steady state.
References and Notes
(1) Torres, N. V.; Voit, E. O.; Gonzalez-Alcon, C. Optimizationof nonlinear biotechnological processes with linear program-ming: application to citric acid production by Aspergillusniger. Biotechnol. Bioeng. 1996, 49, 247-258.
(2) Xiu, Z.-L.; Zeng, A.-P.; Deckwer, W.-D. Model analysisconcerning the effects of growth rate and intracellular tryp-tophan level on the stability and dynamics of tryptophanbiosynthesis in bacteria. J. Biotechnol. 1997, 58, 125-140.
(3) Jetton, M. S. M.; Sinskey, A. J. Recent advances in physiol-ogy and genetics of amino acid-producing bacteria. Crit. Rev.Biotechnol. 1995, 15, 73-103.
(4) Bailey, J. Toward a science of metabolic engineering. Science1991, 252, 1668-1674.
(5) Goodwin, B. C. Oscillatory behavior in enzymatic controlprocesses. Adv. Enzymol. Regul. 1965, 3, 425-438.
(6) Griffith, J. S. Mathematics of cellular control processes. I.Negative feedback to one gene. J. Theor. Biol. 1968a, 2, 202-208.
(7) Griffith, J. S. Mathematics of cellular control processes. II.Positive feedback to one gene. J. Theor. Biol. 1968b, 2, 209-216.
(8) Bliss, R. D.; Painter, P. R.; Marr, A. G. Role of feedbackinhibition in stabilizing the classical operon. J. Theor. Biol.1982, 97, 177-193.
(9) Sinha, S., Theoretical study of tryptophan operon: applica-tion in microbial technology. Biotechnol. Bioeng. 1988, 31,117-124.
(10) Sen A. K.; Liu, W.-M. Dynamic analysis of genetic controland regulation of amino acid synthesis: the tryptophanoperon in Escherichia coli. Biotechnol. Bioeng. 1990, 35, 185-194.
(11) Voit, E. O. Optimization of integrated biochemical systems.Biotechnol. Bioeng. 1992, 40, 572-582.
(12) Torres, N. V.; Voit, E. O.; Gonzalez-Alcon, C.; Rodrıguez,F. An integrated optimization method for biochemical sys-tems. Description of method and application to ethanol,glycerol and carbohydrate production in Saccharomyces cer-evisiae. Biotechnol. Bioeng. 1997, 55, 758-772.
(13) Petkov, S. B.; Maranas, C. D. Quantitative assessment ofuncertainty in the optimization of metabolic pathways. Bio-technol Bioeng. 1997, 56, 145-161.
(14) Savageau, M. Biochemical System Analysis: A Study ofFunction and Design in Molecular Biology. Addison-Wesley:Reading, MA, 1976.
(15) Savageau, M. Biochemical system analysis, I. Some math-ematical properties of the rate law for the componentenzymatic reactions. J. Theor. Biol. 1969a, 25, 365-369.
(16) Savageau, M. Biochemical system analysis. II. The steady-state solutions for an n-pool system using a power lawapproximation. J. Theor. Biol. 1969b, 25, 370-379.
(17) Savageau, M. Concepts relating the behavior of biochemicalsystems to their underlying molecular properties. Arch.Biochem. Biophys. 1971, 145, 612-621.
(18) Ni, T.-C.; Savageau, M. A. Model assessment and refine-ment using strategies from biochemical system theory: ap-plication to metabolism in humand red blood cells, J. Theor.Biol. 1996a, 179, 329-368.
(19) Ni, T.-C.; Savageau, M. A. Application of biochemicalsystem theory to metabolism in human red blood cell: Signalpropagation and accuracy of representation, J. Biol. Chem.1996b, 271, 7927-7941.
(20) Aiba, S.; Tsunekawa, H.; Imanaka, T. New approach totryptophan production by Escherichia coli: genetic manipula-tion of composite plasmid in vitro. Appl. Environ. Microbiol.1982, 43, 289-297.
(21) Britz, M. L.; Demain, A. L. In Comprehensive Biotechnol-ogy; Moo-Young, M. et al., Eds.; Pergamon: Oxford, 1985; Vol.1, pp 617-625.
(22) Ferreira, A. E. N. Linked lists representation of S-sys-tems: An alternative way to implement numerical algo-rithms. Second S-System Symposium, 1992, Tampa, FL(Abstract).
(23) Shaaff, I.; Heinish, J.; Zimmermann, F. K. Overproductionof glycolytic enzymes in yeast. Yeast 1989, 5, 285-290.
(24) Kacser, H.; Acerenza, L. A universal method for achievingincreases in metabolite production. Eur. J. Biochem. 1993,216, 361-367.
Table 4. Kinetic Parameters and Basal Values for theModel Optimization of the Triptophan Operon in E. coli
parameter value
C 1.1%KI 57.6 h-1
k2 7200 h-1
Kd 10-5 mol L-1
Ko 10-10 mol L-1
n 2Rt 10-9 mol L-1
R1 0.9R2 0.02R3 0k 0.005
variable value
x 0.184653y 7.986755z 1418.9319
dxdτ
) Rx ‚ zgx,z ‚ rgx,r - âx ‚ R1hx,a1‚ uhx,u ‚ xhx,x
dydτ
) Ry ‚ zgy,x - ây ‚ R2hy,a2 ‚ uhy,u ‚ yhy,y (A4)
dzdτ
) Rz ‚ ygz,y ‚ kigz,ki‚ zgz,z -
âz‚ R4hz,a4 ‚ R5
hz,a5‚ R6hz,a6 ‚ zhz,z ‚ khz,k ‚ uhz,u
dxdτ
) Rx ‚ zgx,z ‚ rgx,r - âx ‚ p1hx,a1‚ uhx,u ‚ xhx,x
dydτ
) Ry ‚ zgy,x - ây ‚ p2hy,a2 ‚ uhy,u ‚ yhy,y (A5)
dzdτ
) Rz ‚ ygz,y ‚ kigz,ki‚ zgz,z -
âz‚ p4hz,a4 ‚ p5
hz,a5‚ p6hz,a6 ‚ zhz,z ‚ khz,k ‚ uhz,u
144 Biotechnol. Prog., 2000, Vol. 16, No. 2

(25) Regan, L.; Bogle, I. D. L.; Dunnill, P. Simulation andoptimization of metabolic pathways. Comput. Chem. Eng.1993, 175-6, 627-637.
(26) Stephanoupoulos, G.; Simpson, T. W. Flux amplificationin complex metabolic networks. Chem. Eng. Sci. 1997, 52,2607-2627.
(27) Stephanopoulos G. N.; Aristidou, A. A.; Nielsen, J. Meta-bolic Engineering. Principles and Methodologies; AcademicPress: New York, 1998.
Accepted December 10, 1999.
BP990144L
Biotechnol. Prog., 2000, Vol. 16, No. 2 145
Copyright © 2022 FDOKUMEN