Specificity of Transmembrane Protein Palmitoylation in Yeast
Upload
independentCategory
view
3download
0
1
Multiple Alignment of Transmembrane Protein Sequences
Walter Pirovano, Sanne Abeln, K. Anton Feenstra and Jaap Heringa Centre for Integrative Bioinformatics, VU University Amsterdam, The Netherlands
Abstract Multiple sequence alignment remains one of the most powerful tools for assessing evolutionary sequence relationships and the identification of structurally and functionally important protein regions. Membrane-bound proteins represent a special class of proteins. The regions that insert into the cell-membrane have a profoundly different hydrophobicity pattern as compared with soluble proteins. Multiple alignment techniques employing scoring schemes tailored for sequences of soluble proteins are therefore in principle not optimal to align membrane-bound proteins. In this chapter we describe some of the characteristics leading transmembrane proteins to display differences at the sequence level. We will also cover computational strategies and methods developed over the years for aligning this special class of proteins, discuss some current bottlenecks, and suggest some avenues for improvement.
Introduction Over the past years, integral membrane proteins have received a great deal of attention. They carry out essential functions in many cellular and physiological processes, such as signal transduction, cell-cell recognition and molecular transport. Membrane proteins are likely to constitute 20-30% of all ORFs contained in genomes (Jones 1998; Wallin and von Heijne 1998). Unfortunately, the number of determined transmembrane (TM)* structures in the PDB is still very low: 1.7% (1139 of more than 64000) are transmembrane (Tusnády et al. 2005). Despite a solid growth of the number of membrane protein structures (White 2004), and a steadily increasing fraction in the total PDB (up from ~1.4% in 2003), their determination remains a difficult task, such that they will continue to lag behind the number of experi-mentally solved soluble protein structures. Given the biomedical importance of TM proteins and the large and growing gap between the number of solved TM protein structures and the number of TM protein sequences, sequence analysis techniques are crucial. The simultaneous alignment of three or more nucleotide or amino acid sequences is one of the most common tasks in bioinformatics. Multiple sequence alignment (MSA) is an essential pre-requisite to many further modes of analysis into protein families such as homology modelling, secondary structure prediction, phylogenetic recon-struction, or the delineation of conserved and variable sites within a family. Alignments may be further used to derive profiles (Gribskov et al. 1987) or hidden Markov models (Bucher et al. 1996; Eddy 1998; Karplus et al. 1998) that can be used to scour databases for distantly related members of the family. The automatic generation of an accurate multiple alignment is potentially a daunting task. Ideally, one would make use of an in-depth knowledge of the evolutionary and structural relationships within the family but this information is often lacking or difficult to use. General empirical models of protein evolution (Dayhoff 1978; Henikoff and Henikoff 1992) are widely used instead but these can be difficult to apply when the sequences are less than 30% identical (Sander and Schneider 1991). Further, mathematically sound methods for carrying out alignments, using these models, can be extremely demanding in computer resources for more than a handful of sequences (Carrillo and Lipman 1988; Stoye 1998). To be able to cope with practical dataset sizes, heuristics have been developed that are used for all but the smallest data sets. The most commonly used heuristic methods are based on the progressive alignment strategy (Hogeweg and Hesper 1984; Feng and Doolittle 1987; Thompson et al. 1994, Heringa 1999).
* Abbreviations: TM transmembrane, MSA multiple sequence alignment, SP sum of pairs (score), TC total column (score)

The idea is to establish an initial order for joining the sequences, and to follow this order in gradually building up the alignment. Many implementations use an approximation of a phylogenetic tree between the sequences as a guide tree that dictates the alignment order. Although appropriate for many alignment problems, the progressive strategy suffers from its greediness. Errors made in the first alignments during the progressive protocol cannot be corrected later as the remaining sequences are added in. Attempts to minimize such alignment errors have generally been targeted at global sequence weighting (Altschul et al. 1989; Thompson et al. 1994), where the contribution of individual sequences are weighted during the alignment process. However, such global sequence weighting schemes carry the risk of propagating rather than reducing error when used in progressive multiple alignment strategies (Heringa 1999).
Factors influencing the alignment of transmembrane proteins. Transmembrane regions have a modified amino acid composition and different conservation patterns as compared to soluble proteins. Most current MSA techniques have been built, and optimised, to align homologous soluble proteins. Even though many such techniques are still applicable to transmembrane regions, yielding a somewhat lower alignment accuracy than for soluble proteins (Forrest et al. 2006), there are some specific differences that should be taken into consideration when creating a multiple sequence alignment for TM proteins. The lipid environment of transmembrane regions influences the folding properties of the pro-tein backbone and side chains, which can be observed in a different amino acid composition, but also in different evolutionary substitutions and different structural conservation. The hydrophobic nature of lipid tails of the membrane do not allow for H-bonding with the backbone or side chains of the peptide as water does. Therefore, backbone H-bonds of a TM region are typically satisfied through secondary structure: membrane spanning helices or beta barrels. The amino acid composition of TM regions is predominantly hydrophobic. These conditions are not dissimilar to the buried regions of soluble protein. TM regions nevertheless show some characteristic quite different from buried regions. Donnelly et al. noted that transmembrane helices, though mostly hydrophobic, had an alternating pattern of conserved and non-conserved amino acids; the conserved amino acids form the core of the protein structure, while the non-conserved hydrophobic amino acids point out towards the lipids (Donnelly et al. 1993). Furthermore regions facing other protein parts within the lipid are typically enriched in phenylalanine and tyrosine (Langosch and Heringa 1998; Bordner 2009). Jones et al. noted that polar regions are highly conserved within TM regions; this may be explained by charges or H-bonds needing to be satisfied by the protein itself, making polar residues in the membrane highly specific (Jones et al. 1994).
Transmembrane substitution rates Conventional scoring matrices such as PAM (Dayhoff et al. 1978) or BLOSUM (Henikoff and Henikoff 1992), routinely used for sequence retrieval and alignment, are therefore not optimal to align TM regions. Several groups have made attempts to capture the evolutionary trends specific to TM regions in an amino acids substitution matrix, e.g. the JTT matrix (Jones et al. 1994), the PHAT matrix (Ng et al. 2000) , the asymmetric SLIM matrices (Müller et al. 2001) and the bbTM matrix specialised for TM β-barrels (Jimenez-Morales et al. 2008). Substitution scores, sij, are generally based on the frequency of amino acid substitutions, qij, in a set of aligned homologous sequences, according to:
⎟⎟⎠
⎞⎜⎜⎝
⎛=
ji
ijij ff
qs ln1
λ (11.1)
where λ is a constant, and fi are the background frequencies of amino acids. For the JTT matrix the qij and fi were both calculated from aligned transmembrane regions. The PHAT matrix calculates the observed substitutions in a similar fashion, but takes the expected number of substitutions (fifj) from general hydrophobic areas; in this way the background expectancy is
2

based on TM as well as buried regions from soluble proteins. PHAT was shown to outperform the JTT matrix on database homology searches; this may be rationalised through background noise in alignments being similar to hydrophobic regions (Ng et al. 2000). Table 11.1 shows the major differences in substitution rates between TM regions and soluble proteins, by subtracting the normalised PHAT matrix from the normalised BLOSUM62 matrix (Henikoff and Henikoff 1992). It can be observed that the polar residues have large positive self substitution scores, i.e. the substitution scores is PHAT are higher than those in BLOSUM62, indicating that polar residues are more conserved in TM regions. Table 11.1 also shows that hydrophobic residues are less conserved, and that proline is particularly conserved in TM regions. The high proline conservation may be explained by the special role of proline residues forming kinks in transmembrane regions (von Heijne 1991).
C F L W V I M H Y A G P N T S R Q D K E C -7.1 F 4.0 -2.7 L -1.1 1.6 -1.8 W -2.2 -2.0 -0.7 -4.9 V -1.1 0.4 -0.4 -0.2 -1.8 I -2.7 0.0 -0.9 -0.2 -1.3 -0.2
M -1.1 0.0 -0.9 -4.2 -0.4 2.7 -0.7 H -4.9 -1.1 -0.2 -0.7 -1.8 -1.8 -2.2 1.1 Y 2.4 0.2 -1.1 -2.4 -2.7 -2.7 -1.1 0.7 3.1 A 1.6 2.4 0.4 -0.2 1.6 2.0 0.4 -0.7 -0.7 -0.2 G 2.9 2.9 4.9 -3.8 2.9 4.9 4.4 -2.2 1.3 1.6 2.0 P -6.5 0.2 -1.8 -1.4 -2.2 -0.2 -3.8 -5.4 -1.8 -2.7 -0.7 6.3 N 2.9 4.4 1.3 0.2 1.3 1.3 0.9 4.2 7.1 0.9 -1.6 -2.2 5.1 T 0.4 0.9 0.4 -6.9 0.0 0.4 2.0 -2.2 -0.7 0.0 2.4 -4.2 -1.6 -5.3 S 3.6 0.9 0.9 -1.8 0.9 0.9 -1.1 -1.1 0.9 1.1 1.6 -2.7 -0.4 -0.4 1.4 R -6.5 -4.9 -5.4 -4.9 -4.9 -3.4 -7.4 -6.2 -5.4 -7.4 -3.8 -6.9 -4.7 -7.4 -7.4 4.0 Q -1.8 2.9 -0.7 5.6 -0.7 1.3 -1.6 3.1 2.0 -2.7 0.9 -2.7 3.1 -2.7 -1.6 -5.1 4.0 D -4.9 -1.8 0.2 -2.9 -1.8 -1.8 -1.8 0.4 -0.2 -3.8 -1.1 -5.8 1.1 -5.8 -6.2 -6.9 0.0 6.7K -9.6 -4.9 -6.9 -6.5 -8.5 -4.9 -7.4 -5.8 -2.2 -8.9 -3.8 -4.2 -3.1 -7.4 -7.8 -5.6 -3.6 -5.8 -2.2E -2.9 -1.8 -1.8 -4.9 -3.8 -1.8 -3.8 -1.6 0.9 -5.8 -0.7 -5.8 0.0 -5.8 -4.7 -9.4 -2.4 5.4 -8.2 8.7
Table 11.1 Difference between the PHAT and BLOSUM substitution matrices, expressed as PHAT75-73 - BLOSUM62 (see text for details). Negative values are on a grey background, largest scores (>5 or <-5) are in bold.
Transmembrane alignment gaps Not only amino acid substitution rates, but also amino acid insertions and deletions show different patterns in TM proteins. Generally speaking the TM regions are much more conserved than their interconnecting loops (e.g. Forrest et al. 2006). These connecting loops may be very long, change considerably in size between homologs and they also show great structural flexibility or variability. Long loops are quite typical for TM proteins, and may be used for fly-casting (Dafforn and Smith 2004) or possibly to prevent aggregation of the highly hydrophobic TM regions (Abeln and Frenkel 2008); however, they pose a particular problem for MSA techniques. Typically gap open penalties should be higher for transmembrane regions, as is shown for the PRALINE-TM example below (Pirovano et al. 2008a).
Overview of TM MSA methods Not many techniques have been developed to improve the alignment of TM proteins. The method STAM (Shafrir and Guy 2004) represents an early attempt to improve alignment
3

accuracy by combining different substitution matrices. A more recent study by Forrest et al. (Forrest et al. 2006) reported that the use of a bipartite scheme (consisting of BLOSUM62 and PHAT) does not significantly improve membrane protein sequence alignments. They suggest that the previously reported progress is more likely to depend on the separation of the TM blocks or on the settings of specific gap penalties. We have recently investigated the effects of incorporating TM specific information into the mul-tiple alignment tool PRALINE, dubbed PRALINE-TM (Pirovano et al. 2008a). This information is integrated in a ‘soft’ way, compared to the STAM approach where TM segments are first chopped and then aligned separately. In the PRALINE-TM approach the choice of the matrix depends on consistent TM predictions over a column and is determined dynamically during the alignment procedure. By applying the PHAT substitution matrix on consistently predicted TM regions, we show that it is possible to significantly improve the alignment quality.
TM-aware multiple sequence alignment by the Praline method The strategy adopted by Praline for TM protein alignment, includes three basic techniques: 1) profile preprocessing, 2) a bipartite alignment scheme and 3) tree-based iteration of the alignment.
Profile preprocessing The profile preprocessing strategy in the PRALINE method (Heringa 1999) is a position-specific weighting scheme aimed at incorporating into each sequence, trusted information from other sequences. As such, it works contrary to the early weighting schemes mentioned above (Altschul et al. 1989; Thompson et al. 1994) which attempt to up-weight sequences according to their divergence. In principle it is a good idea to perform global weighting aimed at increasing the contribution of more distant sequences as they carry more information at each alignment position. However, when sequence weighting is used in progressive multiple alignment, the increased chance of mistakes when aligning distant sequences can well lead to error propagation (Heringa, 2002). Vogt et al. (1995) compared local and global alignments of pair-wise sequences with a data bank of structure-based alignments (Pascarella and Argos 1992) and included a set of over 30 substitution matrices with optimised gap-penalties. The best global alignments were achieved with the Gonnet residue exchange matrix (Gonnet et al. 1992), resulting in 15% incorrect residue matching when sequences with 30% residue identity were aligned. The error rate quickly increased to 45% incorrect matches at 20% residue identity of the aligned sequences, and to 73% error at 15% sequence identity. Rost (1999) stressed the same point and reported even higher pairwise alignment error rates in the twilight zone (below 30% identity). These statistics clearly demonstrate that increasing the global weight for distant sequences is likely to lead to misalignment and error propagation during progressive multiple alignment. This is why the Praline pre-processing strategy tends to upweight 'trusted' sequences. For each sequence, a multiple alignment is created by stacking other sequences (master-slaves alignment) that score beyond a user-specified threshold after pair-wise alignment with the sequence considered: A low threshold would result in a pre-processed alignment for each sequence comprising many or all other sequences (where the chance for alignment error is large), while higher thresholds would allow the information from fewer sequences into the alignment (with lesser alignment error). For each of the thus formed pre-processed alignments, a profile is constructed. The PRALINE method then performs progressive multiple alignment using the thus constructed pre-processed profiles. Each input sequence is now represented by its associated pre-processed profile, which incorporates knowledge about other 'trusted' sequences (in particular similar sequences) and comprises position-specific gap penalties. This enables increased matching of distant sequences and appropriate placement of gaps outside ungapped core regions during progressive alignment, thereby avoiding errors early on in the progressive alignment.
4

5
Bipartite alignment scheme The PRALINE bipartite strategy for TM proteins was implemented following the scheme devised for the alignment of soluble protein sequences for which 3-state secondary structure, i.e. α-helix, β-strand and coil, is delineated (Heringa,1999). The PRALINE-TM tool first predicts the TM topology for each input sequence, using the state-of-the-art TM topology predictor Phobius (Käll et al. 2004). Next, the profile-scoring scheme simply applies TM-specific substitution scores from the PHAT matrix to consistently predicted TM positions, during the progressive alignment stage of PRALINE. In Fig. 11.1 an overview of this bipartite alignment strategy as implemented in PRALINE-TM is given. An alternative way of looking at the bipartite alignment strategy is to consider the TM info to be appended to residue types, thereby effectively doubling the number of residue types and quadrupling the size of the substitution matrix.
Figure 11.1 Overview of the PRALINE-TM bipartite alignment strategy. The current PRALINE profile-scoring scheme uses the following equation to score a pair of profile columns x and y:
∑∑= =
=20
1
20
1),(),(
i jji jiMyxS βα (11.2)
where αi and βj are the frequencies with which residues i and j appear in columns x and y, respectively, and M(i,j) is the exchange weight for residues i and j provided by the selected substitution matrix M. By default profile columns are aligned using the BLOSUM62 matrix. Two profile columns will be matched using the PHAT matrix only in case each residue in the column is predicted to be member of a TM segment (see Fig 11.1). This is done to guarantee that inconsistently predicted positions do not negatively influence the alignment quality. As a result, and contrary to the STAM method (Shafrir and Guy 2004), PRALINE-TM potentially allows TM segments to be aligned to non-TM segments (Pirovano et al. 2008a). The BLOSUM62 and PHAT substitution matrices are normalized using their diagonal elements as described by Abagyan and Batalov (1997). The 'soft' bipartite scheme of Praline is less sensitive to errors in the delineation of the TM regions, as compared with 'hard' bipartite schemes such as adopted in the STAM method. In fact, in the latter hard approaches the exact definition of the TM segment is critical because TM segments can not be aligned with non-TM segments. Incorrectly delineated TM regions are likely to lead to misaligned TM and soluble segments, and no provision can be made for variable numbers of TM segments within families.
Tree-based consistency iteration As a third and last step, the PRALINE-TM method employs an additional iterative strategy based on tree-dependent consistency iteration, which is similar to the tree-dependent strategy proposed by Hirosawa et al. (1995) and its implementation in the MUSCLE method (Edgar 2004). In this scenario, each edge of the phylogenetic (guide) tree is used to divide the
TTTTT
TTTTTTTTTTT
TTTTT4
21
3
Predict transmembrane toplogies
NDRAGLPWYSSTNDRAGLSST---TTTTTT------TTT---
TTTTT
H-H-R-K-ATITPTVTK-Q-C-
BLOSUM
PHAT
...
Progressive align using BLOSUM and PHAT

alignment in two subalignments, which are successively realigned. The new alignment is retained only if an improved Sum-of-Pairs score is achieved. In the case of PRALINE-TM, this score is obtained by summing the substitution values of both the BLOSUM62 and PHAT matrix (depending on the TM topology of the amino acid pair). For the tree-based consistency strategy one iterative cycle implies that each edge of the tree is visited once. The maximum number of iterations is set to 20 by default to keep computations within bounds.
Bipartite MSA compared to standard MSA It is important to know whether a bipartite scheme can improve alignment quality by including TM-specific information during the alignment procedure. Our recent work compares the PRALINE and (bipartite) PRALINE-TM strategies with three state-of-the-art TM topology predictors. The results are summarized in Table 11.2. and are based upon a standard progressive alignment strategy (which we refer to as "basic") to make a first comparison between an alignment method excluding and including the TM bipartite scheme. Accuracy is measured by comparing the alignment produced with the reference alignment. For BAliBASE, the BAliBASE ‘testing’ program is provided that implements two scoring schemes: the sum of pairs (SP) score measures the fraction of correctly aligned residue pairs while the total column (TC) score expresses the fraction of correctly aligned columns. The TC score is the stricter of the two. (Note the distinction with the Sum-of-Pairs scoring used during alignment, which is based on a sum of substitution scores as explained in the previous section.)
METHOD SP score TC score PRALINE basic 0.646 0.231 PRALINE-TM basic – HMMTOP 0.679 0.264 PRALINE-TM basic – TMHMM 0.725 0.254 PRALINE-TM basic – Phobius 0.737 0.268
Table 11.2 Performance of the PRALINE and PRALINE-TM basic strategies (without pre-profiling) on reference set 7 of BAliBASE (at gap-open and gap-extension penalties of 15.0 and 1.0 for both the soluble and the transmembrane regions).
Figure 11.2 Contributions of the PHAT matrix and the gap open penalty to the alignment quality. The PRALINE-TM — Phobius method is evaluated at different TM gap-open penalties. In the first analysis (BLOSUM62/PHAT) the PHAT matrix is applied to the transmembrane regions. In the two control analyses either BLOSUM62 (BLOSUM62/BLOSUM62) or PHAT (PHAT/PHAT) is applied to the entire sequence. In a) the average SP score is plotted, in b) the average TC score, as function of the TM gap open penalty. Note that PRALINE-TM here includes the preprocessing strategy.
6

A notable increase can be observed for all three TM predictors, albeit Phobius gives the best performance overall. Phobius has shown to be one of the most accurate TM topology predict-tors, especially on sequences that also contain a signal peptide (Jones 2007; Käll et al. 2004). Independent contributions to the alignment quality coming from the PHAT matrix and TM specific gap-open penalties were also investigated. The results in Fig. 11.2 clearly show that the combination of BLOSUM62 / PHAT matrices yields optimal results, while using only BLOSUM62 or only PHAT does not, even when optimised gap penalties are used (Pirovano et al. 2008a). Using only BLOSUM62, a small improvement can also be obtained by optimizing the TM gap-open penalty; these influences however are much less pronounced than the use of the bipartite scheme. The most striking observation to be made from Table 11.2 and Fig. 11.2 is the positive effect on the alignment quality of the PHAT matrix applied to reliably predicted TM regions. In Table 11.2 the results are shown at an arbitrary gap-open penalty of 15.0 and gap-extension penalty of 1.0 for both the soluble and the TM regions. Fig. 11.2 shows that the positive effect of using the PHAT matrix on TM regions is consistent over the whole range of gap-open penalties.
Comparing PRALINE-TM with non-TM MSA methods Table 11.3 compares PRALINE-TM (gap-open penalty 15.0; TM gap-open penalty 16.5; pre-profile cut-off 11.0) with other widely-used multiple alignment methods, which are designed for aligning soluble proteins. The default PRALINE method, i.e. ‘prepro’ without TM information, with optimised parameter settings over this dataset is included for reference (gap-open penalty 15.0; pre-profile cut-off 8.5). Generally, methods reach average SP scores about 10% lower than for soluble proteins (Pirovano 2010). All methods reach SP scores that are twice as high as corresponding TC scores. PRALINE-TM achieves the highest SP score for two datasets and the highest TC score for four datasets. Concerning the averages over all eight datasets, ProbCons slightly outperforms MAFFT and PRALINE-TM on the SP score. On the more critical TC score PRALINE-TM clearly scores best. ClustalW and MUSCLE score considerably lower on almost all datasets. The standard PRALINE method achieves a SP score comparable to ClustalW, but can be placed between MAFFT and ProbCons with respect to the TC score. Importantly, inclusion of TM information in PRALINE-TM improves overall SP and TC scores compared to standard PRALINE.
SP score Set ClustalW MUSCLE MAFFT ProbCons PRALINE PRALINE-TM 7tm 0.847 0.836 0.835 0.882 0.816 0.860 acr 0.906 0.946 0.937 0.935 0.930 0.936 dtd 0.786 0.855 0.844 0.877 0.824 0.863 ion 0.354 0.520 0.509 0.527 0.346 0.543 msl 0.864 0.870 0.845 0.849 0.813 0.874 Nat 0.630 0.738 0.766 0.745 0.720 0.713 photo 0.887 0.902 0.934 0.913 0.915 0.933 ptga 0.461 0.551 0.729 0.716 0.404 0.683 AVG. 0.717 0.777 0.800 0.806 0.721 0.801 TC score Set ClustalW MUSCLE MAFFT ProbCons PRALINE PRALINE-TM 7tm 0.410 0.340 0.320 0.410 0.310 0.430 acr 0.580 0.670 0.620 0.670 0.690 0.620 dtd 0.250 0.310 0.210 0.340 0.360 0.390 ion 0.000 0.000 0.030 0.090 0.000 0.000 msl 0.610 0.630 0.610 0.600 0.580 0.660 Nat 0.020 0.130 0.120 0.180 0.220 0.140 photo 0.490 0.460 0.550 0.490 0.570 0.730 ptga 0.010 0.060 0.180 0.150 0.000 0.080 AVG. 0.296 0.325 0.330 0.366 0.341 0.381
Table 11.3 Comparison between PRALINE-TM and five widely-used multiple alignment methods. Indivi-dual and average SP and TC scores are given; for each set the best scoring method is highlighted in bold.
7

It should be mentioned that the PRALINE and PRALINE-TM methods were optimized on the TM dataset, whereas the other methods were run at default settings. It is noteworthy in this respect that an increased pre-profile cut-off value of 11.0 for PRALINE-TM worked best, in contrast to the cut-off value of 8.5 that was found to be optimal for soluble protein sequences. The ‘tighter’ pre-profiles with fewer but more similar sequences yielded improved TM predictions, leading in turn to improved alignments. Concerning this training scenario, both MAFFT and ProbCons are relatively robust on TM sequences. Nonetheless, the results show clearly that a TM-based strategy can significantly improve the quality of TM protein sequence alignments, and should be considered a promising avenue for other applications as well.
Benchmarking transmembrane alignments Due to the underrepresentation of solved crystal TM structures in the PDB database, it is a difficult task to assess the quality of TM protein sequence alignments based on structural comparisons. To date, out of the many alignment benchmarks available for standard proteins, only BAliBASE (Bahr et al. 2001) has devoted a special reference set to TM proteins, ref7. This set contains 8 accurately aligned TM families and consists of in total 435 sequences with an average length of 567 residues. The number of TM α-helices per sequence varies from 2 to 14. For BAliBASE the SP and TC scores explained above are used. Other general benchmark sets use different names (the PREFAB ‘Q score’ and SABmark fD score are equivalent to the SP score), or different scores (SABmark fM score is the total number of correctly aligned pairs from the test alignment, and is also stricter than the SP score). It is however not trivial to select the biologically most meaningful scoring scheme, as even gold-standard structure derived alignments can show high variability (Pirovano et al. 2008b). In particular, this can be a serious problem for the strongly variable TM loop regions. Despite the efforts that are being made to cover a significant part of the TM structure space (i.e. by taking families that display different evolutionary distances and a different number of TM helices), the number of sequences is rather low for robust testing of alignment methods. Particularly, only 15% of TM proteins in the PDB are porin-like β-barrel TM protein structures (Tusnády et al. 2005), so that a general benchmark set for β-TM alignments is currently lack-ing. Moreover, for a number of benchmark sequences the TM segments are determined from structure prediction, leading to a circular problem between TM alignment construction and prediction. The scarcity of reference data creates a problem for optimizing any MSA technique for TM proteins, as overfitting of variables is unavoidable on such small and biased datasets. The HOMEP dataset of homologous membrane proteins (Forrest et al. 2006) provides an alternative possibility for evaluating TM alignment accuracy. The set consists of 36 TM proteins with solved crystal structures which can be grouped into 11 SCOP families of similar topology. By making pairwise structural superpositions within the families a set of 94 homologous comparative models has been compiled. For each pair of structures the TM location is determined both manually and using TMDET (Tusnády et al. 2005). This set has been the basis for the comparison of different sequence alignment algorithms as applied to membrane proteins by Forrest et al. (2006). Another way of testing the quality of TM alignments may also be to indirectly test the perfor-mance of TM prediction methods. It should be stressed that many of these use multiple align-ments as an input for deriving prediction rules and paradoxically the quality of the alignment turns out to be a crucial factor here (Cserzö et al. 1994, 1997; Käll et al. 2005; Jones 2007). A scenario thus could be to select TM sequences for which corresponding crystal structures are available and retrieve for each of them homologous sequences using PSI-BLAST (Altschul et al. 1997). Subsequently, these sequence sets can be aligned by the competing alignment methods and serve as input for a TM prediction method. The prediction quality can be assessed using information on TM segment topologies and locations derived from the crystal structures, as routinely done for TM prediction method comparison (e.g. Nugent and Jones 2009).
Defining TM regions A related and important issue is the definition of the membrane-bound region of the protein itself. In addition to the membrane-bound region, that strictly consists of the membrane-
8
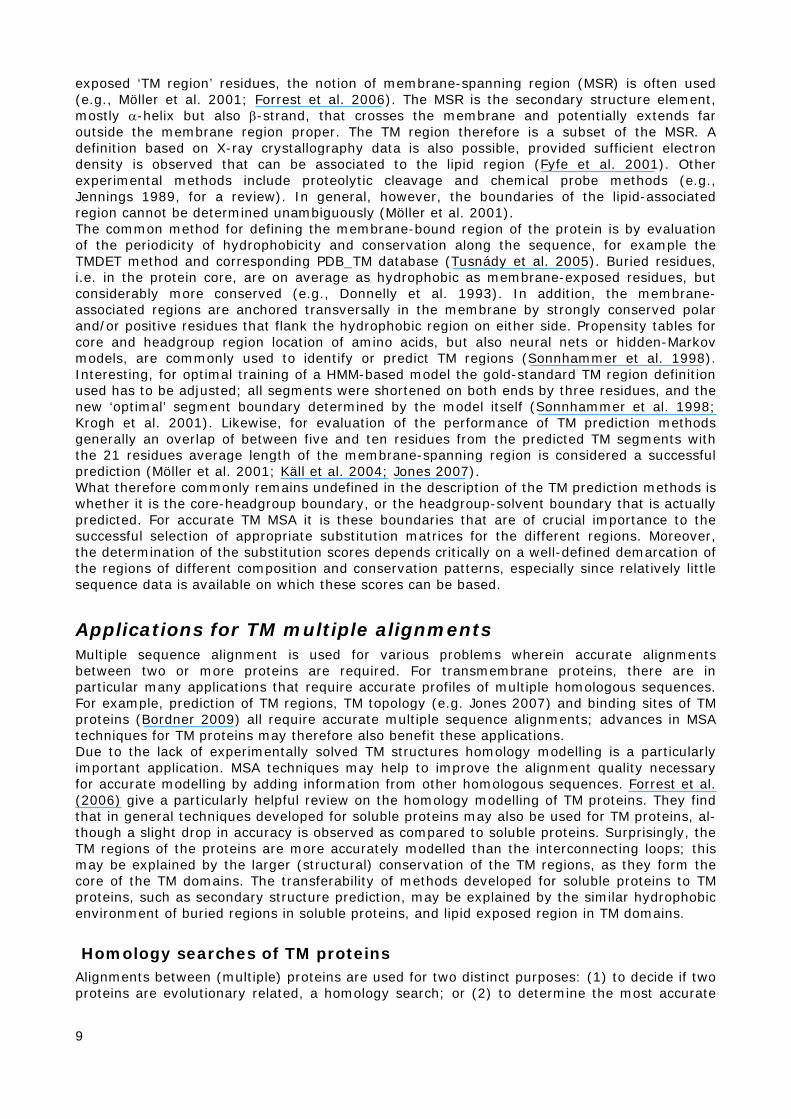
exposed ‘TM region’ residues, the notion of membrane-spanning region (MSR) is often used (e.g., Möller et al. 2001; Forrest et al. 2006). The MSR is the secondary structure element, mostly α-helix but also β-strand, that crosses the membrane and potentially extends far outside the membrane region proper. The TM region therefore is a subset of the MSR. A definition based on X-ray crystallography data is also possible, provided sufficient electron density is observed that can be associated to the lipid region (Fyfe et al. 2001). Other experimental methods include proteolytic cleavage and chemical probe methods (e.g., Jennings 1989, for a review). In general, however, the boundaries of the lipid-associated region cannot be determined unambiguously (Möller et al. 2001). The common method for defining the membrane-bound region of the protein is by evaluation of the periodicity of hydrophobicity and conservation along the sequence, for example the TMDET method and corresponding PDB_TM database (Tusnády et al. 2005). Buried residues, i.e. in the protein core, are on average as hydrophobic as membrane-exposed residues, but considerably more conserved (e.g., Donnelly et al. 1993). In addition, the membrane-associated regions are anchored transversally in the membrane by strongly conserved polar and/or positive residues that flank the hydrophobic region on either side. Propensity tables for core and headgroup region location of amino acids, but also neural nets or hidden-Markov models, are commonly used to identify or predict TM regions (Sonnhammer et al. 1998). Interesting, for optimal training of a HMM-based model the gold-standard TM region definition used has to be adjusted; all segments were shortened on both ends by three residues, and the new ‘optimal’ segment boundary determined by the model itself (Sonnhammer et al. 1998; Krogh et al. 2001). Likewise, for evaluation of the performance of TM prediction methods generally an overlap of between five and ten residues from the predicted TM segments with the 21 residues average length of the membrane-spanning region is considered a successful prediction (Möller et al. 2001; Käll et al. 2004; Jones 2007). What therefore commonly remains undefined in the description of the TM prediction methods is whether it is the core-headgroup boundary, or the headgroup-solvent boundary that is actually predicted. For accurate TM MSA it is these boundaries that are of crucial importance to the successful selection of appropriate substitution matrices for the different regions. Moreover, the determination of the substitution scores depends critically on a well-defined demarcation of the regions of different composition and conservation patterns, especially since relatively little sequence data is available on which these scores can be based.
Applications for TM multiple alignments Multiple sequence alignment is used for various problems wherein accurate alignments between two or more proteins are required. For transmembrane proteins, there are in particular many applications that require accurate profiles of multiple homologous sequences. For example, prediction of TM regions, TM topology (e.g. Jones 2007) and binding sites of TM proteins (Bordner 2009) all require accurate multiple sequence alignments; advances in MSA techniques for TM proteins may therefore also benefit these applications. Due to the lack of experimentally solved TM structures homology modelling is a particularly important application. MSA techniques may help to improve the alignment quality necessary for accurate modelling by adding information from other homologous sequences. Forrest et al. (2006) give a particularly helpful review on the homology modelling of TM proteins. They find that in general techniques developed for soluble proteins may also be used for TM proteins, al-though a slight drop in accuracy is observed as compared to soluble proteins. Surprisingly, the TM regions of the proteins are more accurately modelled than the interconnecting loops; this may be explained by the larger (structural) conservation of the TM regions, as they form the core of the TM domains. The transferability of methods developed for soluble proteins to TM proteins, such as secondary structure prediction, may be explained by the similar hydrophobic environment of buried regions in soluble proteins, and lipid exposed region in TM domains.
Homology searches of TM proteins Alignments between (multiple) proteins are used for two distinct purposes: (1) to decide if two proteins are evolutionary related, a homology search; or (2) to determine the most accurate
9

alignment between (a set of) evolutionary related proteins. The latter problem is usually addressed with multiple sequence alignment techniques. The two problems are strongly related, therefore techniques improving the alignment quality may also improve database search specificity and vice versa. For example, it has been shown that the PHAT substitution matrix, originally developed to improve homology searches, can also substantially improve the quality of multiple sequence alignments (Pirovano and Heringa 2008). This is not surprising as both problems are heavily dependent on substitution rates between amino acids. On a similar note, profiles created by homology searches may be used to improve multiple sequence alignment (Simossis et al 2005). Some particular issues have been observed for homology searches of membrane proteins; generally methods developed for soluble protein are used, such as PSI-BLAST (Altschul et al. 1997) or HMMER (Eddy 1998). However, it has been noted that false positive rates may go up considerably as compared to database searches for soluble proteins. Homology searches for TM proteins in general protein databases using BLAST may be improved by employing TM specific substitution matrices (e.g. Ng et al. 2000; Müller et al. 2001; Jimenez-Morales et al. 2008). The compositional bias of TM proteins may be overcome with corrections to scoring (Schäffer et al. 2001), or substitution matrices (Altschul et al. 2005). However, to our knowledge, it has not been verified whether such compositional bias corrections indeed improve homology searches for TM proteins. In addition, homology searches may be improved by adding information about the predicted TM regions and their topology; this information is in particular valuable for the search of more remote homologs (Bernsel et al. 2008).
Current Bottlenecks A few significant problems concerning MSA method development are holding back progress in accurate alignment of TM proteins:
1. Benchmark sets are limited in quantity and quality, and are severely biased towards TM helices. This limits tuning of method parameters, accurate determination of substitution rates and proper cross-validated testing of the MSA methods.
2. Homology searches are known to yield relatively large numbers of false positives for TM proteins. It is unclear to what extent recent method developments have improved this issue. A thorough investigation of these false positive rates is necessary for current homology detection methods. Accurate homology detection, especially a low false positive rate, is crucial for generation of high quality profiles to guide alignment and TM topology prediction.
3. The very definition of membrane regions remains highly ambiguous, both theoretically and practically. This poses potentially severe problems for accurate determination of substitution rates for the different regions (core, headgroup and soluble). The optimal performance of a TM alignment method depends on a strict correspondence of the regions on which the substitution matrices have been calculated, and the predicted regions used in the bipartite alignment scheme.
Avenues for Improvement In contrast to the bottlenecks identified above, several feasible and practical adjustments are worth considering to improve alignment accuracy of TM proteins. We list them in approximate order of expected return on investment:
1. Current TM-specific substitution matrices have been determined about a decade ago. The increase in experimental TM protein data will allow better estimates for the exchange parameters, in particular for the β-barrel TM regions. Moreover the current substitution matrices were developed specifically for accurate homology searches, which will not necessarily yield the best results for alignment methods.
2. TM region prediction depends on accurate profiles, and is used in creating the TM multiple alignment. During the MSA procedure the profile quality progressively increases, which gives the opportunity to iteratively improve TM predictions and thereby the TM multiple alignment.
10

3. A known feature of TM loops is their flexibility and variation in length. The bipartite scheme implies separate gap penalty settings for the TM and non-TM regions, but does not distinguish between TM loops and non-TM domains.
4. Particular features of the TM regions, such as the ‘positive inside’ rule, TM topology, location of the head groups which are also predicted by the TM prediction methods, are not explicitly used in current alignment schemes. For homology detection, inclusion of TM topology has significant positive effect (Bernsel et al. 2008). For example, penalties for misaligned regions may be included.
5. A more fine-grained approach for region-specific substitution matrices, as well as misalignment penalties mentioned above, could be beneficial. Particularly, the amino acid composition and substitution rates of β-barrels are known to differ from current values for α-helical TM regions. Also (protein) buried versus lipid exposed TM residues show significantly different conservation patterns. Finally, the polar headgroup region imposes particular constraints on the amino acid composition.
6. Apparently, allowing predicted TM regions to be aligned with non-TM regions is necessary for accurate alignment of TM proteins; either due to inaccuracies in the TM prediction, flexibility in the length or number of TM regions between homologs. To optimize the TM to non-TM alignment one needs to correct for the compositional bias between these regions, for example by non-symmetrical substitution matrices.
7. Further method improvements might come from more balanced and comprehensive benchmarks, not only containing alignments, but for instance also including validation of TM prediction methods based on different alignment inputs (from different alignment strategies).
Conclusions MSA methods, trained on soluble proteins, in general do a reasonable job at aligning TM protein sequences; we approximate a difference of 10% in accuracy. Alignment quality can be improved significantly using a transmembrane-specific substitution matrix and proper gap penalty settings, as shown by the PRALINE-TM example. In our view the improvement is mainly attributed by the fact that the bipartite scheme, using BLOSUM62 and PHAT, is applied in a flexible manner to undivided sequences during each step of the alignment procedure. Attempts where TM and soluble regions were aligned independently did not succeed in making significantly better alignments (Forrest et al. 2006). Strict gap penalty-settings for TM regions improve the overall performance, however, these effects should not be overestimated; the optimal TM gap-open penalty was only slightly higher than the standard penalty. Overall we conclude that TM-awareness is an important concept for optimizing multiple sequence alignment quality, yielding an increased performance of about 10%. However, none of the methods included here was able to align more than 40% of the reference alignment columns on average (TC score), so that further optimization remains a challenging task. Nevertheless, the difficulty of experimentally determining TM protein structures makes this a worthwhile effort.
References Abagyan RA, Batalov S (1997) Do aligned sequences share the
same fold? J Mol Biol 273:355-68 Abeln S, Frenkel D (2008) Disordered flanks prevent peptide
aggregation. PLoS Comput Biol 4:e1000241 Altschul SF, Carroll RJ, Lipman DJ (1989) Weights for data
related by a tree. J Mol Biol 207:647-53 Altschul SF, Madden TL, Schäffer AA, Zhang J, Zhang Z, Miller W,
Lipman DJ (1997) Gapped BLAST and PSI-BLAST: a new generation of protein database search programs. Nucleic Acids Res 25:3389-402
Altschul SF, Wootton JC, Gertz EM, Agarwala R, Morgulis A, Schäffer AA, Yu YK (2005) Protein database searches using compositionally adjusted substitution matrices. FEBS J, 272:5101-9
Bahr A, Thompson JD, Thierry JC, Poch O (2001) BaliBASE (Benchmark Alignment dataBASE): enhancements for repeats,
transmembrane sequences and circular permutations. Nucleic Acids Res 29:323-6
Bucher P, Karplus K, Moeri N, Hofmann K (1996) A flexible motif search technique based on generalized profiles. Comput Chem 20:3-23
Bernsel A, Viklund H, Elofsson A (2008) Remote homology detection of integral membrane proteins using conserved sequence features. Proteins 71:1387-99
Bordner AJ (2009) Predicting protein-protein binding sites in membrane proteins. BMC Bioinf 10:312
Carrillo H, Lipman D (1988) The Multiple Sequence Alignment Problem in Biology. SIAM J Appl Math 48:1073-82
Cserzö M, Bernassau JM, Simon I, Maigret B (1994) New alignment strategy for transmembrane proteins. J Mol Biol 243:388-96
Cserzö M, Wallin E, Simon I, Von Heijne G, Elofsson A (1997) Prediction of transmembrane alpha-helices in prokaryotic
11

membrane proteins: the dense alignment surface method. Protein Eng 10:673-6
Krogh A, Larsson B, von Heijne G, Sonnhammer EL (2001) Predicting transmembrane protein topology with a hidden Markov model: application to complete genomes. J Mol Biol 305:567-80
Dafforn TR, Smith CJ (2004) Natively unfolded domains in endocytosis: hooks, lines and linkers. EMBO Rep 5:1046-52
Dayhoff, MO, Schwart, RM, Orcutt, BC (1978) A model of evolutionary change in proteins. In Dayhoff M (ed), Atlas of Protein Sequence and Structure, National Biomedical Research Foundation, Washington DC, 345-52
Langosch D, Heringa J (1998) Interaction of transmembrane helices by a knobs-into-holes packing characteristic of soluble coiled coils. Proteins 31:150-9
Müller T, Rahmann S, Rehmsmeier M (2001) Non-symmetric score matrices and the detection of homologous transmembrane proteins. Bioinformatics 17 Suppl 1:S182-9
Donnelly D, Overington JP, Ruffle SV, Nugent JH, Blundell TL (1993) Modeling alpha-helical transmembrane domains: the calculation and use of substitution tables for lipid-facing residues. Protein Sci 2:55-70
Möller S, Croning MDR, Apweiler R, (2001) Evaluation of methods for the prediction of membrane spanning regions. Bioinformatics 17:646–53 Eddy SR (1998) Profile Hidden Markov Models. Bioinformatics
14:755-63 Ng PC, Henikoff JG, Henikoff S (2000) PHAT: a transmembrane-specific substitution matrix. Predicted hydrophobic and transmembrane. Bioinf 16:760-6
Edgar RC (2004) MUSCLE: a multiple sequence alignment method with reduced time and space complexity. BMC Bioinf 5:113 Nugent T, Jones DT (2009) Transmembrane protein topology
prediction using support vector machines. BMC Bioinf 10:159 Feng DF, Doolittle RF (1987) Progressive sequence alignment as a prerequisite to correct phylogenetic trees. J Mol Evol 25:351-60
Pascarella S, Argos P (1992) A data bank merging related protein structures and sequences. Prot Eng 5:121-37
Forrest, LR, Tang, CL, Honig, B (2006) On the accuracy of homology modeling and sequence alignment methods applied to membrane proteins. Biophys J 91:508-17
Pirovano W, Feenstra KA, Heringa J (2008a) PRALINETM: a strategy for improved multiple alignment of transmembrane proteins. Bioinformatics 24:492-7
Fyfe PK, McAuley KE, Roszak AW, Isaacs NW, Cogdell RJ, Jones MR (2001) Probing the interface between membrane proteins and membrane lipids by X-ray crystallography. Trends Bioch Sci 26:106-12
Pirovano W, Feenstra KA, Heringa J (2008b) The meaning of alignment: lessons from structural diversity. BMC Bioinf 23:556
Pirovano W, Heringa J (2008) Multiple sequence alignment. Methods Mol Biol 452:143-61
Gribskov M, McLachlan AD, Eisenberg D (1987) Profile analysis: detection of distantly related proteins. Proc Natl Acad Sci USA 84:4355-8
Pirovano WA (2010) Comparing building blocks of life - Sequence alignment and evaluation of predicted structural and functional features, PhD thesis, VU University Amsterdam, ISBN 978-90-8659-419-1 Gonnet GH, Cohen MA, Benner SA (1992) Exhaustive matching of
the entire protein sequence database. Science 256:1443-5 Rost B (1999) Twilight zone of protein sequence alignment. Protein Eng 12:85–94 von Heijne G, (1991) Proline kinks in transmembrane alpha-
helices, J Mol Biol, 218:499-503 Sander C, Schneider R (1991) Database of homology-derived protein structures and the structural meaning of sequence alignment. Proteins 9:56-68
Henikoff S, Henikoff JG (1992) Amino acid substitution matrices from protein blocks. Proc Natl Acad Sci USA 89:10915-9
Heringa J (1999) Two strategies for sequence comparison: profile-preprocessed and secondary structure-induced multiple alignment. Computer Chem 23:341-64
Schäffer AA, Aravind L, Madden TL, Shavirin S, Spouge JL, Wolf YI, Koonin EV, Altschul SF (2001) Improving the accuracy of PSI-BLAST protein database searches with composition-based statistics and other refinements. Nucleic Acids Res 29:2994-3005
Heringa J (2002) Local weighting schemes for protein multiple sequence alignment. Computers Chem 26:459–77
Hirosawa M, Totoki Y, Hoshida M, Ishikawa M (1995) Comprehensive study on iterative algorithms of multiple sequence alignment. Comput Appl Biosci 11:13-8
Shafrir Y, Guy HR (2004) STAM: simple transmembrane alignment method. Bioinformatics 20:758-69
Simossis VA, Kleinjung J, Heringa J (2005) Homology-extended sequence alignment. Nucleic Acids Res 33:816-24 Hogeweg P, Hesper B(1984) The alignment of sets of sequences
and the construction of phylogenetic trees. An integrated method. J Mol Evol 20:175–86
Sonnhammer EL, von Heijne G, Krogh A (1998) A hidden Markov model for predicting transmembrane helices in protein sequences. Proc Int Conf Intell Syst Mol Biol 6:175-82 Jimenez-Morales D, Adamian L, Liang J (2008) Detecting remote
homologues using scoring matrices calculated from the estimation of amino acid substitution rates of beta-barrel membrane proteins. Conf Proc IEEE Eng Med Biol Soc 2008:1347-50
Stoye J (1998) Multiple Sequence Alignment with the Divide-and-Conquer Method. Gene 211:GC45-56
Thompson JD, Higgins DG, Gibson TJ (1994) CLUSTAL W: impro-ving the sensitivity of progressive multiple sequence alignment through sequence weighting, positions-specific gap penalties and weight matrix choice. Nucleic Acids Res 22:4673–80
Jennings MJ (1989) Topography of membrane proteins. Annu Rev Biochem 58:999-1027
Jones DT (1998) Do transmembrane protein superfolds exist? FEBS Lett 423:281-5
Tusnády, GE, Dosztányi, Zs, Simon, I (2005) PDB_TM: selection and membrane localization of transmembrane proteins in the Protein Data Bank. Nucleic Acids Res 33:D275-8 Jones DT (2007) Improving the accuracy of transmembrane
protein topology prediction using evolutionary information. Bioinformatics 23:538-44
Vogt G, Etzold T, Argos P (1995) An assessment of amino acid exchange matrices in aligning protein sequences: the twilight zone revisited. J Mol Biol 249:816-31 Jones DT, Taylor WR, Thornton JM (1994) A mutation matrix for
transmembrane proteins. FEBS 339:269-75 Wallin E, von Heijne G (1998) Genome-wide analysis of integral membrane proteins from eubacterial, archaean, and eukaryotic organisms. Protein Sci 7:1029-38
Käll L, Krogh A, Sonnhammer EL (2004) A combined transmembrane topology and signal peptide prediction method. J Mol Biol 338:1027-36 White SH (2004) The progress of membrane protein structure
determination. Protein Sci 13:1948-9 Käll L, Krogh A, Sonnhammer EL (2005) An HMM posterior decoder for sequence feature prediction that includes homology information. Bioinformatics 21 (Suppl 1):i251-7
Karplus K, Barrett C, Hughey R (1998) Hidden Markov models for detecting remote protein homologies. Bioinformatics 14:846-56
White SH, Wimley WC (1998) Hydrophobic interactions of peptides with membrane interfaces. Bioch Bioph Acta 1376:339-52
12

Table of ContentsChapter 11. Multiple Alignment of Transmembrane Protein Sequences ..........................................................1
Abstract...............................................................................................................................................................1 Introduction.........................................................................................................................................................1 Factors influencing the alignment of transmembrane proteins. .........................................................................2
Transmembrane substitution rates.....................................................................................................................2 Transmembrane alignment gaps........................................................................................................................3
Overview of TM MSA methods...........................................................................................................................3 TM-aware multiple sequence alignment by the Praline method ........................................................................4 Profile preprocessing..........................................................................................................................................4 Bipartite alignment scheme................................................................................................................................5 Tree-based consistency iteration .......................................................................................................................5
Bipartite MSA compared to standard MSA.........................................................................................................6 Comparing PRALINE-TM with non-TM MSA methods ......................................................................................7 Benchmarking transmembrane alignments........................................................................................................8
Defining TM regions ...........................................................................................................................................8 Applications for TM multiple alignments.............................................................................................................9
Homology searches of TM proteins....................................................................................................................9 Current Bottlenecks ..........................................................................................................................................10 Avenues for Improvement ................................................................................................................................10 Conclusions ......................................................................................................................................................11 References .......................................................................................................................................................11
Index Table alignment, 1
bipartite scheme, 5 gap, 4 gap penalty settings, 7
BAliBASE, 8 bipartite alignment scheme, 5
comparison, 6 ClustalW, 7 defining TM regions, 8 HOMEP, 8 homology detection, 9 loops, 4 multiple sequence alignment, 1
applications for TM, 9
benchmarking, 8 bottlenecks, 10 improvements, 10 non-TM methods, 7 progressive alignment, 2
PDB_TM, 9 PHAT matrix, 3 PRALINE, 4 profile preprocessing, 4 sequence evolution, 2 substitution matrix, 3 substitution rates, 2 tree-based consistency iteration, 5
13
Copyright © 2022 FDOKUMEN