Simultaneous alignment and structure prediction of three RNA sequences
16
230 Int. J. Bioinformatics Research and Applications, Vol. 1, No. 2, 2005 Copyright © 2005 Inderscience Enterprises Ltd. Simultaneous alignment and structure prediction of three RNA sequences Beeta Masoumi and Marcel Turcotte* School of Information Technology and Engineering, University of Ottawa, 800 King Edward, Ottawa, Ontario, K1N 6N5, Canada E-mail: [email protected] E-mail: [email protected] *Corresponding author Abstract: Comparative RNA sequence analyses have contributed remarkably accurate predictions. The recent determination of the 30S and 50S ribosomal subunits bringing more supporting evidence. Several inference tools are combining free energy minimisation and comparative analysis to improve the quality of secondary structure predictions. This paper investigates the following hypotheses: • The use of three input sequences improves the average accuracy compared to predictions based on two input sequences • The worse prediction (minimum accuracy) for any sequence should be more accurate when three input sequences are used rather than two • Finally, the consensus structure of three sequences is probably less representative of the individual sequences. The average coverage should be less. Keywords: RNA; secondary structure; sequence alignment; dynamic programming. Reference to this paper should be made as follows: Masoumi, B. and Turcotte, M. (2005) ‘Simultaneous alignment and structure prediction of three RNA sequences’, Int. J. Bioinformatics Research and Applications, Vol. 1, No. 2, pp.230–245. Biographical notes: Beeta Masoumi is working toward her MSc Degree in Computer Science at the University of Ottawa. Marcel Turcotte received his PhD in Computer Science and Operations Research in 1995 from the Université de Montréal, Montréal, Canada. He is an Assistant Professor in the School of Information Technology and Engineering at the University of Ottawa, Canada. 1 Introduction The repertoire of known non-protein-coding RNAs (ncRNAs) is growing rapidly (Storz, 2002). The housekeeping roles of RNAs, such as those of the tRNA, rRNA, RNAseP, snRNA and snoRNA, were established early. In the recent years, it has become clear that RNAs also have important regulatory functions. Examples include microRNAs,
-
Upload
independent -
Category
Documents
-
view
1 -
download
0
Transcript of Simultaneous alignment and structure prediction of three RNA sequences
230 Int. J. Bioinformatics Research and Applications, Vol. 1, No. 2, 2005
Copyright © 2005 Inderscience Enterprises Ltd.
Simultaneous alignment and structure prediction of three RNA sequences
Beeta Masoumi and Marcel Turcotte* School of Information Technology and Engineering, University of Ottawa, 800 King Edward, Ottawa, Ontario, K1N 6N5, Canada E-mail: [email protected] E-mail: [email protected] *Corresponding author
Abstract: Comparative RNA sequence analyses have contributed remarkably accurate predictions. The recent determination of the 30S and 50S ribosomal subunits bringing more supporting evidence. Several inference tools are combining free energy minimisation and comparative analysis to improve the quality of secondary structure predictions. This paper investigates the following hypotheses: • The use of three input sequences improves the average accuracy compared
to predictions based on two input sequences • The worse prediction (minimum accuracy) for any sequence should be
more accurate when three input sequences are used rather than two • Finally, the consensus structure of three sequences is probably less
representative of the individual sequences. The average coverage should be less.
Keywords: RNA; secondary structure; sequence alignment; dynamic programming.
Reference to this paper should be made as follows: Masoumi, B. and Turcotte, M. (2005) ‘Simultaneous alignment and structure prediction of three RNA sequences’, Int. J. Bioinformatics Research and Applications, Vol. 1, No. 2, pp.230–245.
Biographical notes: Beeta Masoumi is working toward her MSc Degree in Computer Science at the University of Ottawa.
Marcel Turcotte received his PhD in Computer Science and Operations Research in 1995 from the Université de Montréal, Montréal, Canada. He is an Assistant Professor in the School of Information Technology and Engineering at the University of Ottawa, Canada.
1 Introduction
The repertoire of known non-protein-coding RNAs (ncRNAs) is growing rapidly (Storz, 2002). The housekeeping roles of RNAs, such as those of the tRNA, rRNA, RNAseP, snRNA and snoRNA, were established early. In the recent years, it has become clear that RNAs also have important regulatory functions. Examples include microRNAs,
Simultaneous alignment and structure prediction of three RNA sequences 231
which regulate the expression of protein genes by targeting a complementary region of their mRNAs. MicroRNAs constitute one of the most abundant classes of regulatory molecules, and are key to many developmental processes (Bartel, 2004). Several discoveries collectively demonstrate that untranslated messenger RNAs can sense the level of metabolites, and modulate the expression of certain genes accordingly. Those RNAs are referred to as RNA sensors and riboswitches (Nudler and Mironov, 2004; Lai, 2003). Post transcriptional regulation of gene expression often involves secondary structure elements located in the untranslated regions of mRNAs (Mignoe et al., 2003). Consequently, detailed knowledge of RNA secondary and tertiary structure is essential to help understand RNA functions.
RNA secondary structure prediction methods have been thoroughly evaluated. In particular, Gardner and Giegerich (2004) have performed a comprehensive evaluation of comparative RNA structure prediction methods. Doshi et al. (2004) reviewed specifically free energy minimisation methods that are using the nearest neighbour model. One of their main conclusions is that free energy minimisation methods based on the nearest neighbour model work best for shorter sequences, such as tRNA or 5S rRNA, for which they reported an average accuracy for predictions of 69% and 71% respectively.
Recently, Mathews and Turner developed and published a software system combining free energy minimisation and comparative sequence analysis for finding the minimum free energy structure common to two input sequences (Mathews and Turner, 2002). The computer system, called Dynalign, greatly improves the accuracy of secondary structure predictions compared to free energy minimisation alone.
Herein, we extend this algorithm to use three input sequences rather than two, and investigate the performance of the new computer program. We called this software system eXtended-Dynalign, or X-Dynalign for short, to emphasise its origin.
This paper is organised as follows. Section 2 outlines the algorithm. In Section 3, the main hypotheses to be empirically evaluated are laid out, the datasets are described, and the evaluation measures are defined. Section 4 presents the results. Section 5 concludes and discusses the results.
2 Algorithm
Dynalign is a pragmatic implementation of the algorithm proposed by Sankoff for solving simultaneously the RNA folding and alignment problems (Sankoff, 1985). Dynalign is restricted to two input sequences, while the original proposal was formulated for an arbitrary set of N input sequences. Also, Dynalign introduces a constraint on the maximum distance between aligned nucleotides so as to reduce the execution time. This is analogous to the banding technique that is used for sequence alignment.
X-Dynalign is a direct extension of Dynalign. It takes as input, three sequences and produces a three way sequence alignment as well as a common secondary structure. The objective function consists of a linear combination of the free energy of each sequence, given the common secondary structure, and an empirical term for gap penalties.
total sequence 1 sequence 2 sequence 3 gapsG G G G G° ° ° ° °∆ = ∆ + ∆ + ∆ + ∆
232 B. Masoumi and M. Turcotte
where sequence iG°∆ for i ∈ {1, 2, 3} represents the conformational free energy of the
sequence i when folded onto the common secondary structure, according to the nearest neighbour model.
The algorithm has two steps: fill and traceback. Three sets of recurrence equations define the objective function: W, V and W9. Equations of the form W(i, j; k, l; m, n) represent the minimum free energy for the optimal alignment and structure prediction of S1[i..j], S2[k..l] and S3[m..n], when i, k and m are aligned, and j, l and n are also aligned, where Si denotes the sequence i and Si[a..b] represents the fragment of Si comprising the nucleotides a, a + 1, ..., b. Equations of the form V(i, j; k, l; m, n) represent the minimum free energy assuming that i and j, k and l, and m and n are simultaneously aligned but also that i : j forms a base pair, k : l forms a base pair and m : n forms a base pair. Finally, W9(i, k, m) represents the minimum free energy for the prefix alignment of S1[1..i], S2[1..k] and S3[1..m].
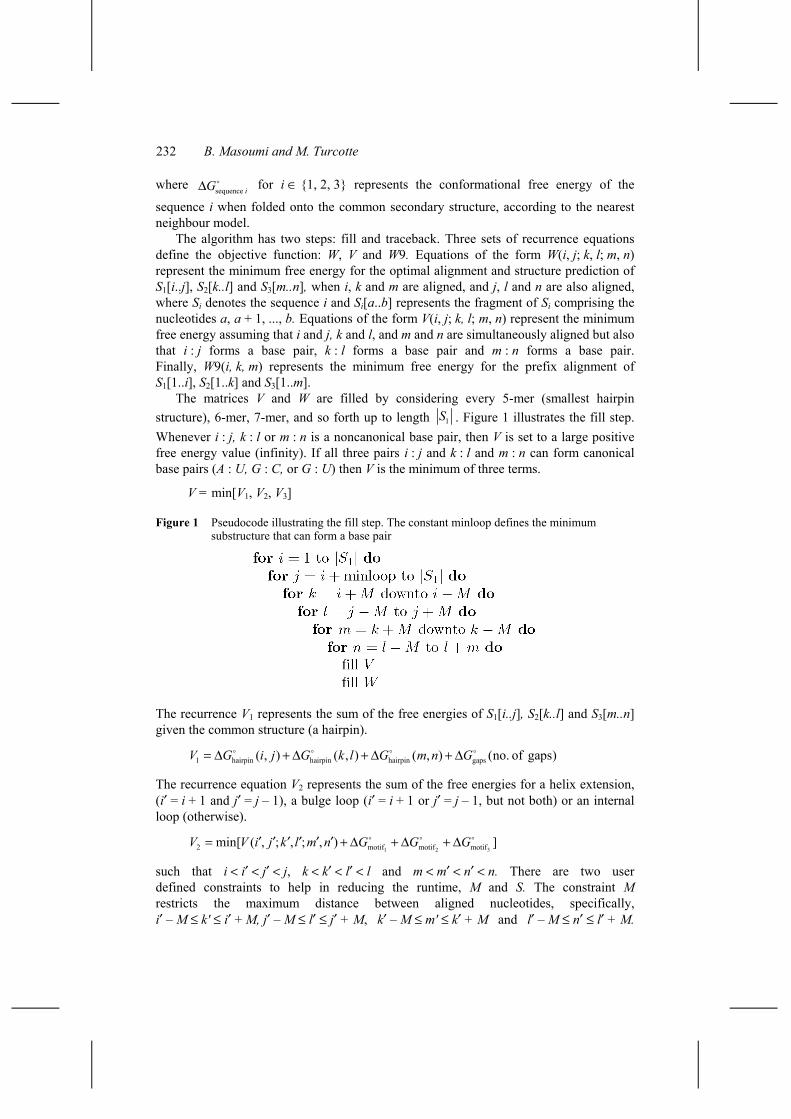
The matrices V and W are filled by considering every 5-mer (smallest hairpin structure), 6-mer, 7-mer, and so forth up to length 1S . Figure 1 illustrates the fill step. Whenever i : j, k : l or m : n is a noncanonical base pair, then V is set to a large positive free energy value (infinity). If all three pairs i : j and k : l and m : n can form canonical base pairs (A : U, G : C, or G : U) then V is the minimum of three terms.
V = min[V1, V2, V3]
Figure 1 Pseudocode illustrating the fill step. The constant minloop defines the minimum substructure that can form a base pair
The recurrence V1 represents the sum of the free energies of S1[i..j], S2[k..l] and S3[m..n] given the common structure (a hairpin).
1 hairpin hairpin hairpin gaps( , ) ( , ) ( , ) (no. of gaps)V G i j G k l G m n G° ° ° °= ∆ + ∆ + ∆ + ∆ The recurrence equation V2 represents the sum of the free energies for a helix extension, (i′ = i + 1 and j′ = j – 1), a bulge loop (i′ = i + 1 or j′ = j – 1, but not both) or an internal loop (otherwise).
1 2 32 motif motif motifmin[ ( , ; , ; , ) ]V V i j k l m n G G G° ° °= ′ ′ ′ ′ ′ ′ + ∆ + ∆ + ∆ such that i < i′ < j′ < j, k < k′ < l′ < l and m < m′ < n′ < n. There are two user defined constraints to help in reducing the runtime, M and S. The constraint M restricts the maximum distance between aligned nucleotides, specifically, i′ – M ≤ k' ≤ i′ + M, j′ – M ≤ l′ ≤ j′ + M, k′ – M ≤ m' ≤ k′ + M and l′ – M ≤ n′ ≤ l′ + M.
Simultaneous alignment and structure prediction of three RNA sequences 233
Finally, S limits the size of internal loops, i < i′ ≤ i + S, j – S ≤ j′ < j, k < k′ ≤ k + S, l – S ≤ l′ < l, m < m′ ≤ m + S and n – S ≤ n′ < n. Herein, S is set to 20. The term 1motifG°∆ is the free energy of a hairpin closed by i : j and i′ : j′. The terms 2motifG°∆ and 3motifG°∆ are defined similarly with respect to sequences 2 and 3.
The recurrence V3 describes the lowest sum of free energies for a multibranch loop structure closed by the pairs i : j, k : l and m : n. There are 64 cases representing all possible dangling ends situations. The general form of these 64 equations (κ) is as follows.
3 3( , ; , ; , ) ( 1, ; 1, ; 1, )V W a i b k c m W i d k e m f Gκ κ°
− −= ′ ′ ′ + ′ + ′ + ′ + + ∆
where °3G κ−∆ is a specific term for each equation that takes into account the free energies
of the dangling ends, multibranch loop closure, helix terminating in a multibranch loop, unpaired nucleotides and gaps. The value of a is i + 1 or i + 2 depending on the particular case (equation), similarly, b is k + 1 or k + 2, c is m + 1 or m + 2, d is j – 1 or j – 2, e is l – 1 or l – 2, and f is n – 1 or n – 2 depending on the particular situation modelled by equation. The parameters i′, k′ and m′, are restricted to i < i′ < j, k < k′ < l and m < m′ < n.
W is defined as follows.
W = min[W1,W2,W3]
The recurrence W1 represents all 64 ways of adding unpaired nucleotides to a multibranch loop.
° °1 unpaired nucleotides in MBL loop gap( , ; , ; , )W W a b c d e f x G y G= + ∆ + ∆
The value of a = i or i + 1 depending on the particular case (equation), similarly, b = j or j – 1, c = k or k + 1, d = l or l – 1, e = m or m + 1, and f = n or n – 1 depending on the particular situation modelled by equation. The number of gaps is y.
W2 models the free energy of helix termini. The values of a, b, c, d, e and f are defined as above.
° ° °2 unpaired nucleotides in MBL loop MBL closure gap( , ; , ; ; ) 3W V a b c d e f x G G y G= + ∆ + ∆ + ∆
Multibranch loops consisting of three or more branching helices are modelled by W3.
W3 = min[W(i, i′; k, k′, m, m′) + W(i′ + 1, j; k′ + 1, l; m′ + 1, n)]
where, i < i′ < j, k < k′ < l, m < m′ < n, i′ – M ≤ k' ≤ i′ + M and k′ – M ≤ m' ≤ k′ + M. Finally, W9 stands for the free energy for the prefix alignment of S1[1..i], S2[1..k] and
S3[1..n].
1,...,89 min 9W W κκ∈
=
Cases κ ∈1, …, 7 represent all the ways for adding one or two gaps.
234 B. Masoumi and M. Turcotte
°1 gap
°2 gap
°3 gap
°4 gap
°5 gap
°6 gap
°7 gap
8
9 9( , 1, 1)
9 9( 1, , 1)
9 9( 1, 1, )
9 9( , , 1) 2
9 9( , 1, ) 2
9 9( 1, , ) 2
9 9( 1, 1, 1) 2
9 9( , , ) ( ', ; ', ; ', )
W W i k m G
W W i k m G
W W i k m G
W W i k m G
W W i k m G
W W i k m G
W W i k m G
W W a b c V i d k e m f +
= − − + ∆
= − − + ∆
= − − + ∆
= − + ∆
= − + ∆
= − + ∆
= − − − + ∆
= + °unpaired nucleotides in MBL loop
° ° °MBL closure gap dangling ends3
x G
G y G G
∆
+ ∆ + ∆ +
where i′ < i, k′ < k, m′ < m, a is i′ – 1 or i′ – 2, b is k′ – 1 or k′ – 2, c is m′ – 1 or m′ – 2, d = i or i – 1, e = k or k – 1 and f = m or m – 1.
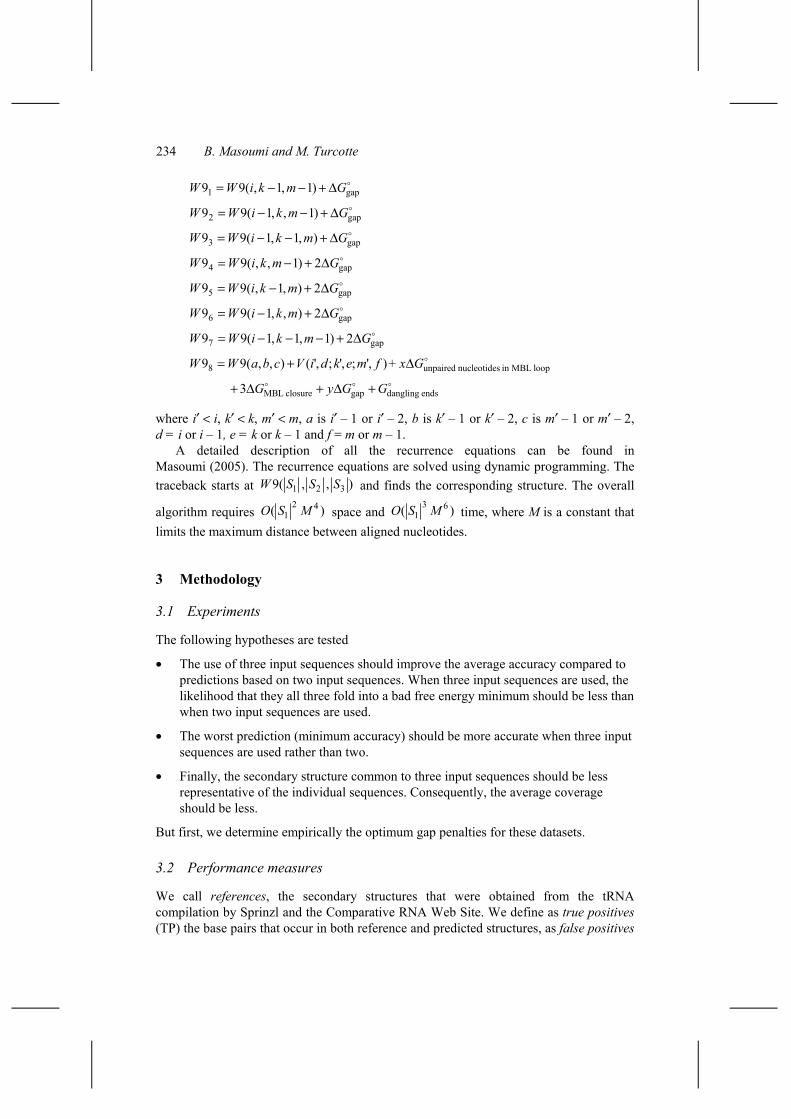
A detailed description of all the recurrence equations can be found in Masoumi (2005). The recurrence equations are solved using dynamic programming. The traceback starts at 1 2 39( , , )W S S S and finds the corresponding structure. The overall
algorithm requires 2 4
1( )O S M space and 3 6
1( )O S M time, where M is a constant that limits the maximum distance between aligned nucleotides.
3 Methodology
3.1 Experiments
The following hypotheses are tested
• The use of three input sequences should improve the average accuracy compared to predictions based on two input sequences. When three input sequences are used, the likelihood that they all three fold into a bad free energy minimum should be less than when two input sequences are used.
• The worst prediction (minimum accuracy) should be more accurate when three input sequences are used rather than two.
• Finally, the secondary structure common to three input sequences should be less representative of the individual sequences. Consequently, the average coverage should be less.
But first, we determine empirically the optimum gap penalties for these datasets.
3.2 Performance measures
We call references, the secondary structures that were obtained from the tRNA compilation by Sprinzl and the Comparative RNA Web Site. We define as true positives (TP) the base pairs that occur in both reference and predicted structures, as false positives

Simultaneous alignment and structure prediction of three RNA sequences 235
(FP), the base pairs that occur in the predicted structure but not in the reference one, and as false negatives (FN), the base pairs that are occurring in the reference structure but not in the predicted one. Offsets were not allowed.
The positive predictive value (sometimes called PPV, specificity or accuracy) is defined as the fraction of the predicted base pairs that are also present in the reference structure, TP/(TP + FP). The sensitivity (coverage) is defined as the fraction of the base pairs from the reference structure that are correctly predicted, TP/(TP + FN). Finally, we also measured the Matthews Correlation Coefficient, as defined by Gorodkin et al. (2001):
TP TP .TP + FN TP + FP
×
3.3 Datasets
Input sequences were selected to be challenging cases for MFOLD (Zuker and Stiegler, 1981; Zuker, 1989), a widely used computer program for the determination of RNA secondary structure using a single sequence as input, see Tables 1–4. Furthermore, the sequences were selected so that they could be aligned optimally with a small value of M. Obviously this information would not be known in advance in most cases. Also, the input sequences were filtered so that the maximum pairwise identity was less than 90%. A total of ten tRNA sequences from the original paper were used. Their pairwise sequence identity varies from 27.3% to 68.8%. The secondary structure assignments were taken from the compilation by Sprinzl et al. (1998) and Sprinzl and Vassilenko (2003). A set of 13 5S rRNA sequences was built using information obtained from the Comparative RNA Web Site (Gutell, 2004; Cannone et al., 2002a, 2002b). Their pairwise sequence identity varies from 47.2% to 88.2%.
Table 1 tRNA dataset
Id Length Description
RD0260 77 Asp Phage T5 (Virus)
RD0500 76 Asp Haloferax volcanii (Archae)
RD4800 71 Asp Aedes albopictus (Mitochondria, Animal)
RE2140 76 Glu Synechocystis sp. (Eubacteria)
RE6781 76 Glu Hordeum vulgare (Chloroplast)
RF6320 76 Phe Schizosaccharomyces pombe (Cytoplasm, Fungi)
RL0503 88 Leu Haloferax volcanii (Archae)
RL1141 89 Leu Mycoplasma capricolum (Eubacteria)
RS0380 88 Ser Halobacterium cutirubrum (Archae)
RS1141 92 Ser Mycoplasma capricolum (Eubacteria)
236 B. Masoumi and M. Turcotte
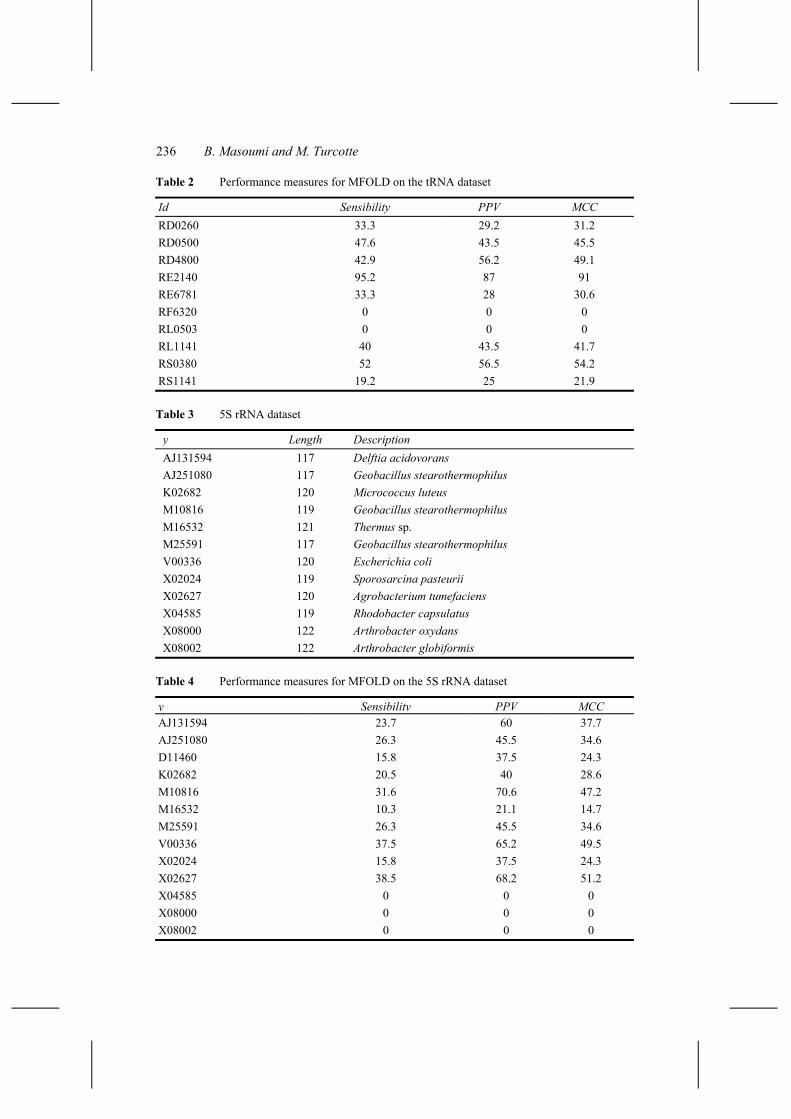
Table 2 Performance measures for MFOLD on the tRNA dataset
Id Sensibility PPV MCC RD0260 33.3 29.2 31.2 RD0500 47.6 43.5 45.5 RD4800 42.9 56.2 49.1 RE2140 95.2 87 91 RE6781 33.3 28 30.6 RF6320 0 0 0 RL0503 0 0 0 RL1141 40 43.5 41.7 RS0380 52 56.5 54.2 RS1141 19.2 25 21.9
Table 3 5S rRNA dataset
y Length Description AJ131594 117 Delftia acidovorans AJ251080 117 Geobacillus stearothermophilus K02682 120 Micrococcus luteus M10816 119 Geobacillus stearothermophilus M16532 121 Thermus sp. M25591 117 Geobacillus stearothermophilus V00336 120 Escherichia coli X02024 119 Sporosarcina pasteurii X02627 120 Agrobacterium tumefaciens X04585 119 Rhodobacter capsulatus X08000 122 Arthrobacter oxydans X08002 122 Arthrobacter globiformis
Table 4 Performance measures for MFOLD on the 5S rRNA dataset
y Sensibility PPV MCC AJ131594 23.7 60 37.7 AJ251080 26.3 45.5 34.6 D11460 15.8 37.5 24.3 K02682 20.5 40 28.6 M10816 31.6 70.6 47.2 M16532 10.3 21.1 14.7 M25591 26.3 45.5 34.6 V00336 37.5 65.2 49.5 X02024 15.8 37.5 24.3 X02627 38.5 68.2 51.2 X04585 0 0 0 X08000 0 0 0 X08002 0 0 0
Simultaneous alignment and structure prediction of three RNA sequences 237
4 Results
4.1 Calibrating gap penalties
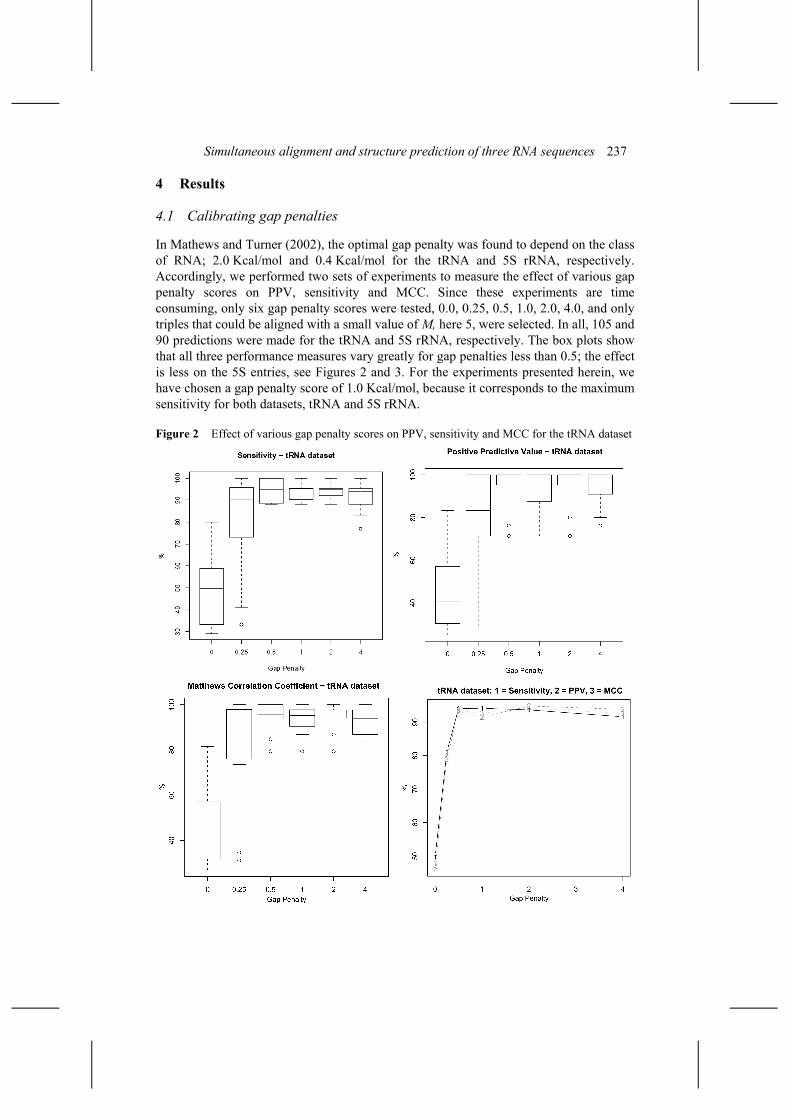
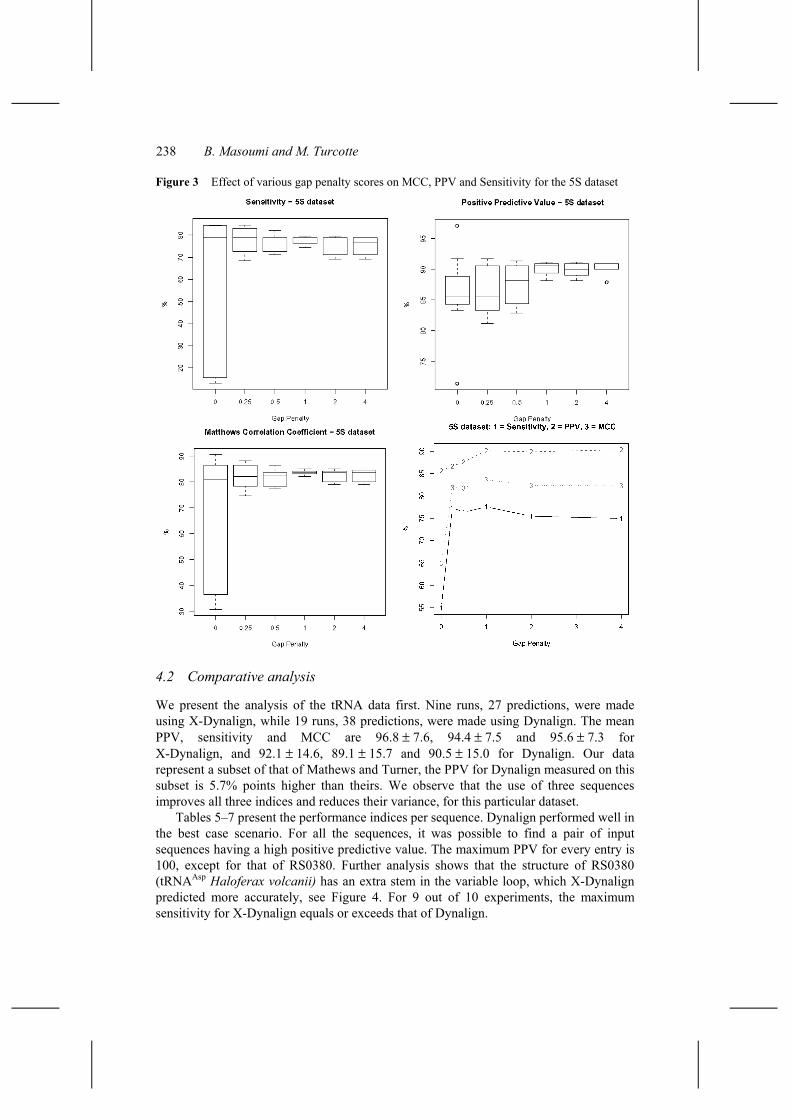
In Mathews and Turner (2002), the optimal gap penalty was found to depend on the class of RNA; 2.0 Kcal/mol and 0.4 Kcal/mol for the tRNA and 5S rRNA, respectively. Accordingly, we performed two sets of experiments to measure the effect of various gap penalty scores on PPV, sensitivity and MCC. Since these experiments are time consuming, only six gap penalty scores were tested, 0.0, 0.25, 0.5, 1.0, 2.0, 4.0, and only triples that could be aligned with a small value of M, here 5, were selected. In all, 105 and 90 predictions were made for the tRNA and 5S rRNA, respectively. The box plots show that all three performance measures vary greatly for gap penalties less than 0.5; the effect is less on the 5S entries, see Figures 2 and 3. For the experiments presented herein, we have chosen a gap penalty score of 1.0 Kcal/mol, because it corresponds to the maximum sensitivity for both datasets, tRNA and 5S rRNA.
Figure 2 Effect of various gap penalty scores on PPV, sensitivity and MCC for the tRNA dataset
238 B. Masoumi and M. Turcotte
Figure 3 Effect of various gap penalty scores on MCC, PPV and Sensitivity for the 5S dataset
4.2 Comparative analysis
We present the analysis of the tRNA data first. Nine runs, 27 predictions, were made using X-Dynalign, while 19 runs, 38 predictions, were made using Dynalign. The mean PPV, sensitivity and MCC are 96.8 ± 7.6, 94.4 ± 7.5 and 95.6 ± 7.3 for X-Dynalign, and 92.1 ± 14.6, 89.1 ± 15.7 and 90.5 ± 15.0 for Dynalign. Our data represent a subset of that of Mathews and Turner, the PPV for Dynalign measured on this subset is 5.7% points higher than theirs. We observe that the use of three sequences improves all three indices and reduces their variance, for this particular dataset.
Tables 5–7 present the performance indices per sequence. Dynalign performed well in the best case scenario. For all the sequences, it was possible to find a pair of input sequences having a high positive predictive value. The maximum PPV for every entry is 100, except for that of RS0380. Further analysis shows that the structure of RS0380 (tRNAAsp Haloferax volcanii) has an extra stem in the variable loop, which X-Dynalign predicted more accurately, see Figure 4. For 9 out of 10 experiments, the maximum sensitivity for X-Dynalign equals or exceeds that of Dynalign.
Simultaneous alignment and structure prediction of three RNA sequences 239
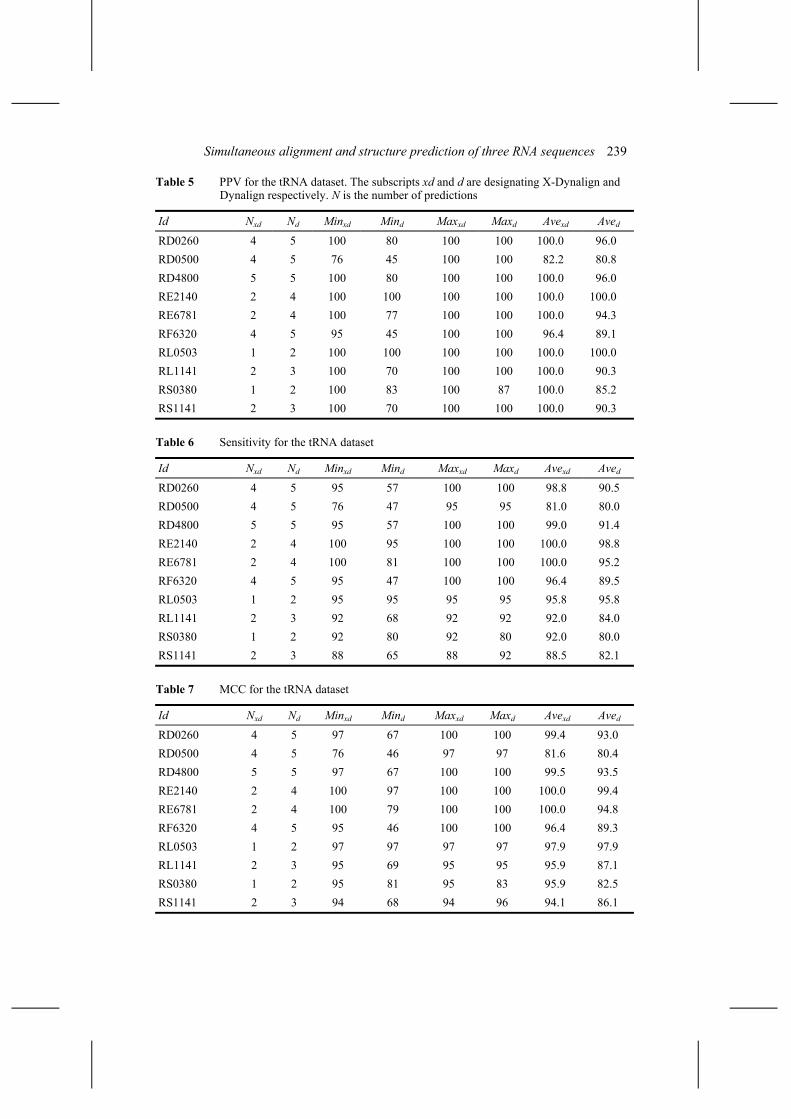
Table 5 PPV for the tRNA dataset. The subscripts xd and d are designating X-Dynalign and Dynalign respectively. N is the number of predictions
Id Nxd Nd Minxd Mind Maxxd Maxd Avexd Aved
RD0260 4 5 100 80 100 100 100.0 96.0 RD0500 4 5 76 45 100 100 82.2 80.8 RD4800 5 5 100 80 100 100 100.0 96.0 RE2140 2 4 100 100 100 100 100.0 100.0 RE6781 2 4 100 77 100 100 100.0 94.3 RF6320 4 5 95 45 100 100 96.4 89.1 RL0503 1 2 100 100 100 100 100.0 100.0 RL1141 2 3 100 70 100 100 100.0 90.3 RS0380 1 2 100 83 100 87 100.0 85.2 RS1141 2 3 100 70 100 100 100.0 90.3
Table 6 Sensitivity for the tRNA dataset
Id Nxd Nd Minxd Mind Maxxd Maxd Avexd Aved
RD0260 4 5 95 57 100 100 98.8 90.5 RD0500 4 5 76 47 95 95 81.0 80.0 RD4800 5 5 95 57 100 100 99.0 91.4 RE2140 2 4 100 95 100 100 100.0 98.8 RE6781 2 4 100 81 100 100 100.0 95.2 RF6320 4 5 95 47 100 100 96.4 89.5 RL0503 1 2 95 95 95 95 95.8 95.8 RL1141 2 3 92 68 92 92 92.0 84.0 RS0380 1 2 92 80 92 80 92.0 80.0 RS1141 2 3 88 65 88 92 88.5 82.1
Table 7 MCC for the tRNA dataset
Id Nxd Nd Minxd Mind Maxxd Maxd Avexd Aved
RD0260 4 5 97 67 100 100 99.4 93.0 RD0500 4 5 76 46 97 97 81.6 80.4 RD4800 5 5 97 67 100 100 99.5 93.5 RE2140 2 4 100 97 100 100 100.0 99.4 RE6781 2 4 100 79 100 100 100.0 94.8 RF6320 4 5 95 46 100 100 96.4 89.3 RL0503 1 2 97 97 97 97 97.9 97.9 RL1141 2 3 95 69 95 95 95.9 87.1 RS0380 1 2 95 81 95 83 95.9 82.5 RS1141 2 3 94 68 94 96 94.1 86.1
240 B. Masoumi and M. Turcotte
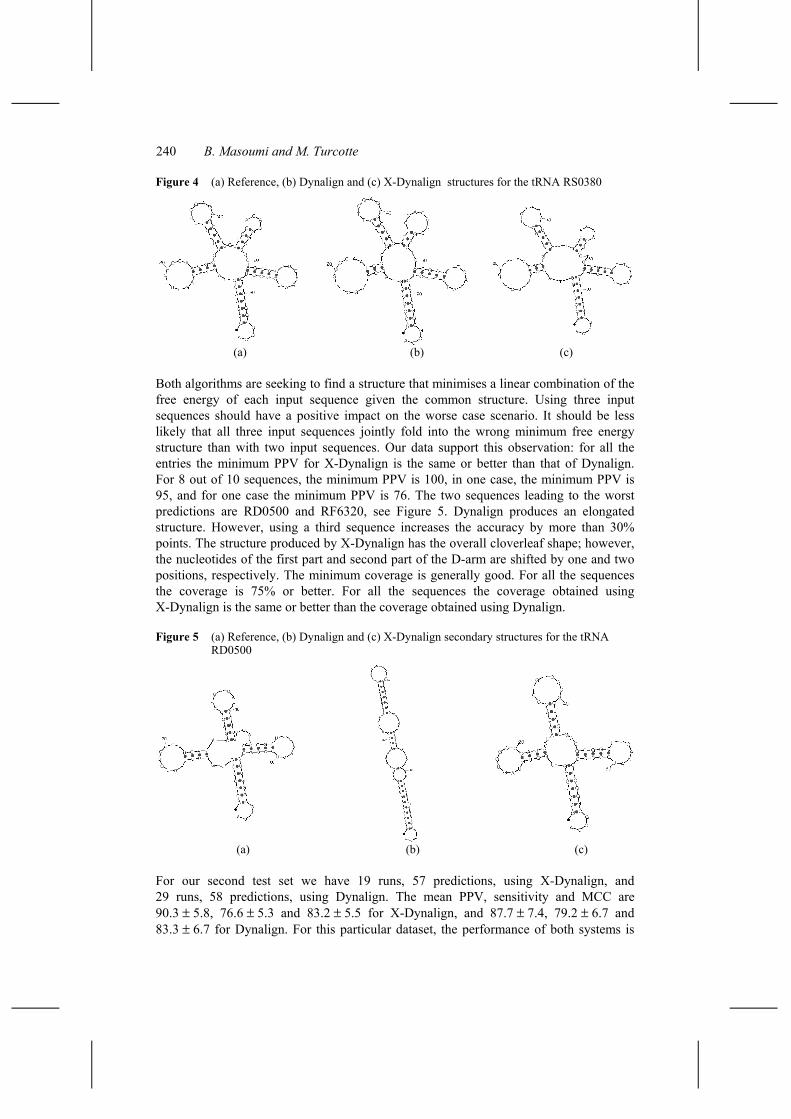
Figure 4 (a) Reference, (b) Dynalign and (c) X-Dynalign structures for the tRNA RS0380
(a) (b) (c)
Both algorithms are seeking to find a structure that minimises a linear combination of the free energy of each input sequence given the common structure. Using three input sequences should have a positive impact on the worse case scenario. It should be less likely that all three input sequences jointly fold into the wrong minimum free energy structure than with two input sequences. Our data support this observation: for all the entries the minimum PPV for X-Dynalign is the same or better than that of Dynalign. For 8 out of 10 sequences, the minimum PPV is 100, in one case, the minimum PPV is 95, and for one case the minimum PPV is 76. The two sequences leading to the worst predictions are RD0500 and RF6320, see Figure 5. Dynalign produces an elongated structure. However, using a third sequence increases the accuracy by more than 30% points. The structure produced by X-Dynalign has the overall cloverleaf shape; however, the nucleotides of the first part and second part of the D-arm are shifted by one and two positions, respectively. The minimum coverage is generally good. For all the sequences the coverage is 75% or better. For all the sequences the coverage obtained using X-Dynalign is the same or better than the coverage obtained using Dynalign.
Figure 5 (a) Reference, (b) Dynalign and (c) X-Dynalign secondary structures for the tRNA RD0500
(a) (b) (c)
For our second test set we have 19 runs, 57 predictions, using X-Dynalign, and 29 runs, 58 predictions, using Dynalign. The mean PPV, sensitivity and MCC are 90.3 ± 5.8, 76.6 ± 5.3 and 83.2 ± 5.5 for X-Dynalign, and 87.7 ± 7.4, 79.2 ± 6.7 and 83.3 ± 6.7 for Dynalign. For this particular dataset, the performance of both systems is
Simultaneous alignment and structure prediction of three RNA sequences 241
comparable on the basis of the Matthews correlation coefficient. What is gained in accuracy is lost in sensitivity.
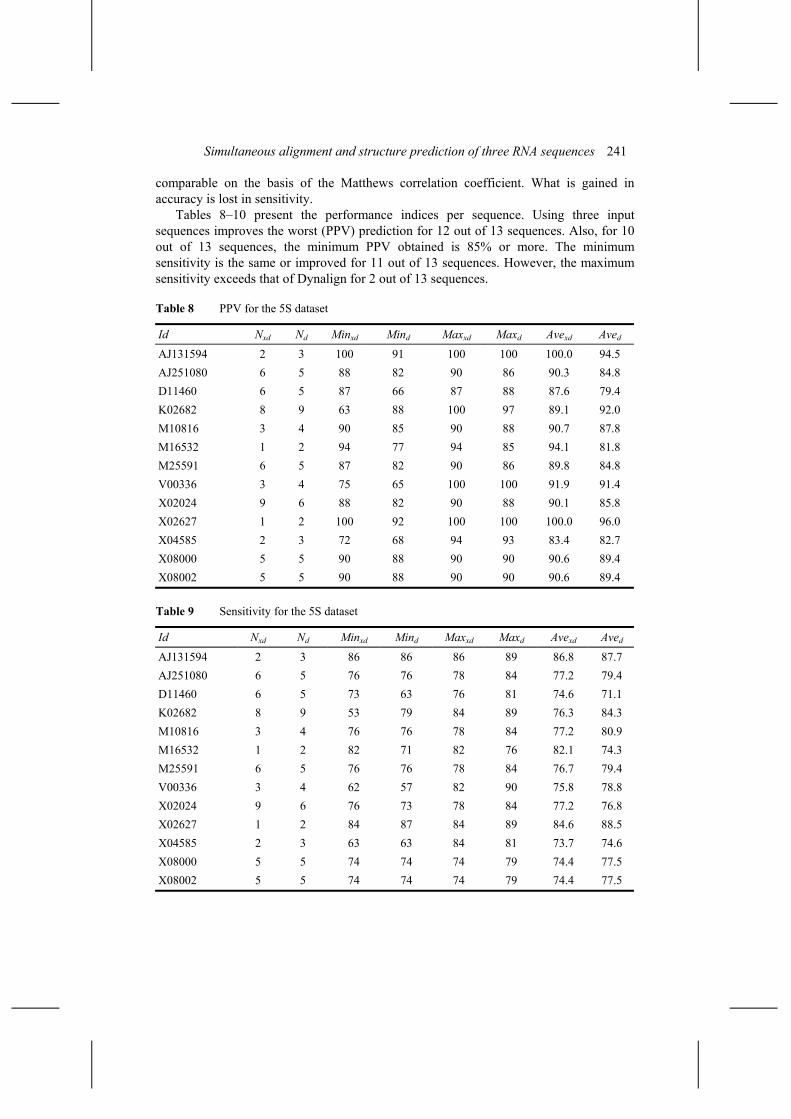
Tables 8–10 present the performance indices per sequence. Using three input sequences improves the worst (PPV) prediction for 12 out of 13 sequences. Also, for 10 out of 13 sequences, the minimum PPV obtained is 85% or more. The minimum sensitivity is the same or improved for 11 out of 13 sequences. However, the maximum sensitivity exceeds that of Dynalign for 2 out of 13 sequences.
Table 8 PPV for the 5S dataset
Id Nxd Nd Minxd Mind Maxxd Maxd Avexd Aved
AJ131594 2 3 100 91 100 100 100.0 94.5 AJ251080 6 5 88 82 90 86 90.3 84.8 D11460 6 5 87 66 87 88 87.6 79.4 K02682 8 9 63 88 100 97 89.1 92.0 M10816 3 4 90 85 90 88 90.7 87.8 M16532 1 2 94 77 94 85 94.1 81.8 M25591 6 5 87 82 90 86 89.8 84.8 V00336 3 4 75 65 100 100 91.9 91.4 X02024 9 6 88 82 90 88 90.1 85.8 X02627 1 2 100 92 100 100 100.0 96.0 X04585 2 3 72 68 94 93 83.4 82.7 X08000 5 5 90 88 90 90 90.6 89.4 X08002 5 5 90 88 90 90 90.6 89.4
Table 9 Sensitivity for the 5S dataset
Id Nxd Nd Minxd Mind Maxxd Maxd Avexd Aved
AJ131594 2 3 86 86 86 89 86.8 87.7 AJ251080 6 5 76 76 78 84 77.2 79.4 D11460 6 5 73 63 76 81 74.6 71.1 K02682 8 9 53 79 84 89 76.3 84.3 M10816 3 4 76 76 78 84 77.2 80.9 M16532 1 2 82 71 82 76 82.1 74.3 M25591 6 5 76 76 78 84 76.7 79.4 V00336 3 4 62 57 82 90 75.8 78.8 X02024 9 6 76 73 78 84 77.2 76.8 X02627 1 2 84 87 84 89 84.6 88.5 X04585 2 3 63 63 84 81 73.7 74.6 X08000 5 5 74 74 74 79 74.4 77.5 X08002 5 5 74 74 74 79 74.4 77.5
242 B. Masoumi and M. Turcotte
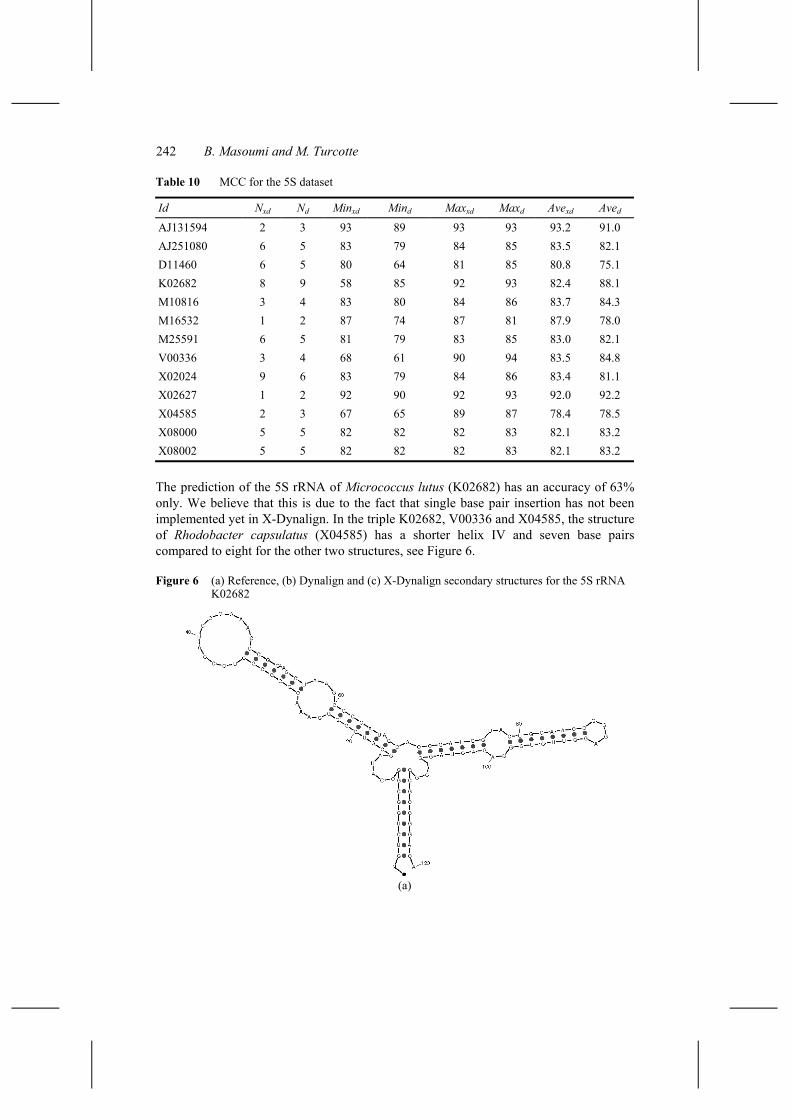
Table 10 MCC for the 5S dataset
Id Nxd Nd Minxd Mind Maxxd Maxd Avexd Aved
AJ131594 2 3 93 89 93 93 93.2 91.0 AJ251080 6 5 83 79 84 85 83.5 82.1 D11460 6 5 80 64 81 85 80.8 75.1 K02682 8 9 58 85 92 93 82.4 88.1 M10816 3 4 83 80 84 86 83.7 84.3 M16532 1 2 87 74 87 81 87.9 78.0 M25591 6 5 81 79 83 85 83.0 82.1 V00336 3 4 68 61 90 94 83.5 84.8 X02024 9 6 83 79 84 86 83.4 81.1 X02627 1 2 92 90 92 93 92.0 92.2 X04585 2 3 67 65 89 87 78.4 78.5 X08000 5 5 82 82 82 83 82.1 83.2 X08002 5 5 82 82 82 83 82.1 83.2
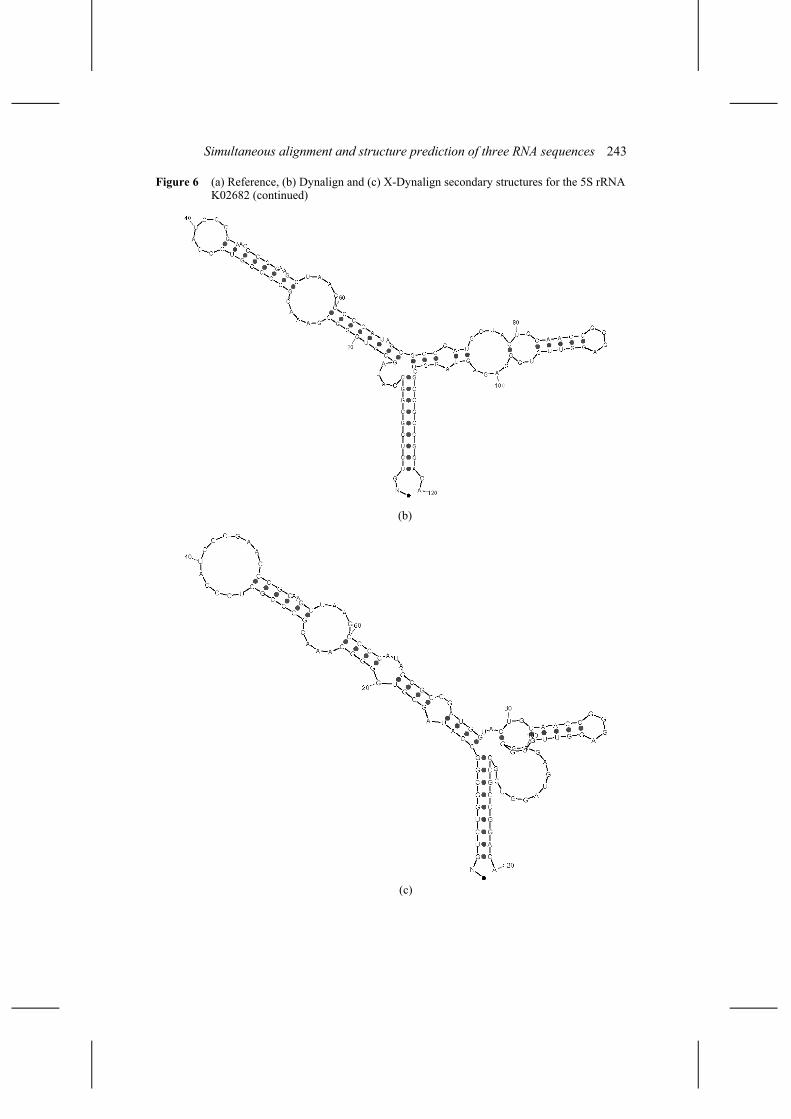
The prediction of the 5S rRNA of Micrococcus lutus (K02682) has an accuracy of 63% only. We believe that this is due to the fact that single base pair insertion has not been implemented yet in X-Dynalign. In the triple K02682, V00336 and X04585, the structure of Rhodobacter capsulatus (X04585) has a shorter helix IV and seven base pairs compared to eight for the other two structures, see Figure 6.
Figure 6 (a) Reference, (b) Dynalign and (c) X-Dynalign secondary structures for the 5S rRNA K02682
(a)
Simultaneous alignment and structure prediction of three RNA sequences 243
Figure 6 (a) Reference, (b) Dynalign and (c) X-Dynalign secondary structures for the 5S rRNA K02682 (continued)
(b)
(c)
244 B. Masoumi and M. Turcotte
5 Conclusion and discussion
We have extended the software system Dynalign to use three input sequences, rather than two. The resulting system is called eXtended-Dynalign (X-Dynalign for short). Its time/space complexity limits its application to:
• short sequences (say less than 200 nt)
• sequences that can be aligned optimally with a small value of M (less than 6), where M is the maximum distance of the aligned positions.
The strengths of Dynalign carry over to the new system. Namely, it improves the accuracy of secondary structure predictions compared to predictions based on a single input sequence. It requires no sequence homology.
It also shares some of its limitations. In particular, the gap penalties are treated as a separate term in the objective function. The optimal value has to be determined empirically. In Mathews and Turner, (2002), it was found that the optimal value for this term depends on the class of RNA studied. In our limited experiments, the dependency seems less important. It also seems that there is a large plateau where several gap penalty scores were leading to a nearly optimal solution; w.r.t. PPV, for example. Our key conclusions are:
• The lowest PPV for any prediction is generally improved when using three input sequences
• The average accuracy is improved
• The average sensitivity of the algorithm is slightly degrade for the 5S rRNA dataset. However, a ‘per sequence’ analysis shows that the majority of the lowest sensitivity scores are higher for X-Dyanlign than Dynalign.
• X-Dynalign is able to reproduce subtle details, such as the prediction of a stem in the variable region of certain tRNAs.
There are several obvious directions for extending this class of algorithms, such as handling pseudoknots and reporting suboptimal structures. However, one of the most urgent improvements is to reduce the time/space complexity. Several runs presented herein take up to week to compute on some of the fastest processors available today.
A detailed knowledge of the RNA secondary structure is essential for understanding the sequence-structure-function relationships. X-Dynalign takes advantage of the paramount of data that is accumulating in sequence databases. Because it requires no sequence homology, X-Dynalign should be useful in comparative RNA sequence analyses.
6 Availability
The source code, written in C++, as well as the scripts for calculating the performance indices are made available under the GNU General Public Licence from http://bio. site.uottawa. ca/software/x-dynalign. Supplementary material, including additional tables and figures, can be found on our website.
Simultaneous alignment and structure prediction of three RNA sequences 245
Acknowledgments
We would like to thank David Mathews, University of Rochester Medical Center, for answering our questions about Dynalign and his help in understanding the source code.
References Bartel, D.P. (2004) ‘MicroRNAs: Genomics, biogenesis, mechanism, and function’, Cell, Vol. 116,
pp.281–297. Cannone, J., Subramanian, S., Schnare, M., Collett, J., D’Souza, L., Du, Y., Feng, B., Lin, N.,
Madabusi, L., Muller, K., Pande, N., Shang, Z., Yu, N. and Gutell, R. (2002b) ‘The comparative RNA web (CRW) site: an online database of comparative sequence and structure information for ribosomal, intron, and other RNAs: Corrections’, BMC Bioinformatics, Vol. 3, No. 1, p.15, http://www.biomedcentral.com/1471-2105/3/15.
Cannone, J., Subramanian, S., Schnare, M., Collett, J., D’Souza, L., Du, Y., Feng, B., Lin, N., Madabusi, L., Muller, K., Pande, N., Shang, Z., Yu, N. and Gutell, R. (2002a) ‘The comparative RNA web (CRW) site: an online database of comparative sequence and structure information for ribosomal, intron, and other RNAs’, BMC Bioinformatics, Vol. 3, No. 1., p.1, http://www.biomedcentral.com/1471-2105/3/2.
Doshi, K, Cannone, J., Cobaugh, C. and Gutell, R. (2004) ‘Evaluation of the suitability of free-energy minimisation using mearest-neighbor energy parameters for RNA secondary structure prediction’, BMC Bioinformatics, Vol. 5, No. 1, p.105, http://www.biomedcentral.com/1471-2105/5/105.
Gardner, P. and Giegerich, R. (2004) ‘A comprehensive comparison of comparative RNA structure prediction approaches’, BMC Bioinformatics, Vol. 5, No. 1, p.140, http://www.biomedcentral.com/1471-2105/5/140.
Gorodkin, J., Stricklin, S.L. and Stormo, G.D. (2001) ‘Discovering common stem-loop motifs in unaligned RNA sequences’, Nucl. Acids Res., Vol. 29, No. 10, pp.2135–2144.
Gutell, R.R. (2004) Comparative RNA Web Site, http://www.rna.icmb.utexas.edu, July. Lai, E.C. (2003) ‘RNA sensors and riboswitches: self-regulating messages’, Current Biology,
Vol. 13, pp.R285–R291. Masoumi, B. (2005) A Dynamic Programming Algorithm for the Simultaneous Alignment and
Structure Prediction Of Three RNA Sequences, Master’s thesis, School of Information Technology and Engineering, Faculty of Engineering, University of Ottawa.
Mathews, D.H. and Turner, D.H. (2002) ‘Dynalign: an algorithm for finding the secondary structure common to two RNA sequences’, J. Mol. Biol., Vol. 317, pp.191–203.
Mignoe, F., Gissi, C., Liuni, S. and Pesole, G. (2003) ‘Untranslated regions of mRNAs’, Genome Biology, Vol. 3, No. 3, pp.0004.1–0004.10.
Nudler, E. and Mironov, A.X. (2004) ‘The riboswitch control of bacterial metabolism’, Trends Biol. Sci., Vol. 29, No. 1, pp.11–17.
Sankoff, D. (1985) ‘Simultaneous solution of RNA folding, alignment and protosequence problems’, SIAM J. Appl. Math., Vol. 45, No.5, pp.810–825.
Sprinzl, M. and Vassilenko, K.S. (2003) Compilation of tRNA Sequences and Sequences of tRNA Genes, http://www.uni-bayreuth.de/departments/biochemie/trna, August.
Sprinzl, M., Horn, C., Brown, M., Ioudovitch, A. and Steinberg, S. (1998) ‘Compilation of tRNA sequences and sequences of tRNA genes’, Nucl. Acids Res., Vol. 26, pp.148–153.
Storz, G. (2002) ‘An expanding universe of noncoding RNAs’, Science, Vol. 296, pp.1260–1263. Zuker, M. (1989) ‘On finding all suboptimal foldings of an RNA molecule’, Science, Vol. 244,
pp.48–52. Zuker, M. and Stiegler, P. (1981) ‘Optimal computer folding of large RNA sequences using
thermodynamics and auxiliary information’, Nucl. Acids Res., Vol. 9, pp.133–148.