Preparation and characterization of porous silica templated by a nonionic fluorinated systems
Upload
independentCategory
view
1download
0
Research ArticleFormulation and Characterization ofDrug Loaded Nonionic Surfactant Vesicles (Niosomes) forOral Bioavailability Enhancement
Sunil Kamboj, Vipin Saini, and Suman Bala
M.M. College of Pharmacy, Maharishi Markandeshwar University, Mullana, Ambala 133207, Haryana, India
Correspondence should be addressed to Sunil Kamboj; [email protected]
Received 11 August 2013; Accepted 22 October 2013; Published 2 February 2014
Academic Editors: T. Hatano and N. Yuksel
Copyright © 2014 Sunil Kamboj et al. This is an open access article distributed under the Creative Commons Attribution License,which permits unrestricted use, distribution, and reproduction in any medium, provided the original work is properly cited.
Nonionic surfactant vesicles (niosomes) were formulated with an aim of enhancing the oral bioavailability of tenofovir disoproxilfumarate (TDF), an anti-HIV drug. Niosomes were formulated by conventional thin film hydration technique with different molarratios of surfactant, cholesterol, and dicetyl phosphate. The formulated niosomes were found spherical in shape, ranging from2.95 𝜇m to 10.91 𝜇m in size. Vesicles with 1 : 1 : 0.1 ratios of surfactant : cholesterol : dicetyl phosphate with each grade of span werefound to have higher entrapment efficiencies, which were further selected for in vitro and in vivo studies. Vesicles formulated withsorbitan monostearate were found to have maximum drug release (99.091%) at the end of 24 hours and followed zero order releasekinetics. The results of in vivo study revealed that the niosomes significantly enhanced the oral bioavailability of TDF in rats after adose of 95mg/kg.The average relative bioavailability of niosomes in relation to plane drug solution was found to be 2.58, indicatingmore than twofold increase in oral bioavailability of TDF. Significant increase in mean residential time (MRT) was also found,reflecting release retarding efficacy of the vesicles. In conclusion, niosomes could be a promising delivery for TDF with improvedoral bioavailability and prolonged release profiles.
1. Introduction
Tenofovir disoproxil fumarate (TDF) is antiretroviral drug,acting by blocking the enzyme reverse transcriptase, which iscrucial to viral production inHIV-infected people. It has beenascertained a drug of choice in the treatment of HIV-1 infec-tion and hepatitis-B in humans either alone or in combina-tionwith other drugmolecules [1, 2].Themajor problemwiththe therapy of TDF is its poor bioavailability (25%), whichmay be due to its poor log𝑃 and poor permeability across thebiological membrane of gastrointestinal tract [3].
Several novel approaches, like prodrugs,microemulsions,liposomes, niosomes, bilosomes, and so forth, have been usedby the researchers for improving the gastric absorption of thecompounds, which have low permeability [4]. Out of all theapproaches, vesicles were found to have the distinct advan-tages over other approaches because these vesicles act as drugreservoirs and the rate of drug release can be controlled by
modification of their compositions [5]. Although liposomeshave been studied as an effective vesicular drug deliverysystem for oral as well as transdermal routes for improvingthe absorption of the drugs, niosomes are preferred over lipo-somes due to their higher chemical stability, economy, andsimple practical methods of preparation without the use ofpharmaceutically unaccepted solvents [6]. Niosomes are thesurfactant vesicles which have been prepared from differentnonionic surfactants. These are spherical lipid bilayers capa-ble of entrapping water soluble molecules within an aqueousdomain or alternatively lipid molecules within lipid bilayers.They may be unilamellar or multilamellar depending uponthe method used for their preparation. In recent years, nio-somes have been extensively studied for the potential to serveas carriers for delivery of drugs, antigens, hormones, andother bioactive agents for an extended period of time orto a specific organ of the body [7, 8]. In the present study,TDF loaded niosomes were prepared and evaluated for their
Hindawi Publishing Corporatione Scientific World JournalVolume 2014, Article ID 959741, 8 pageshttp://dx.doi.org/10.1155/2014/959741
2 The Scientific World Journal
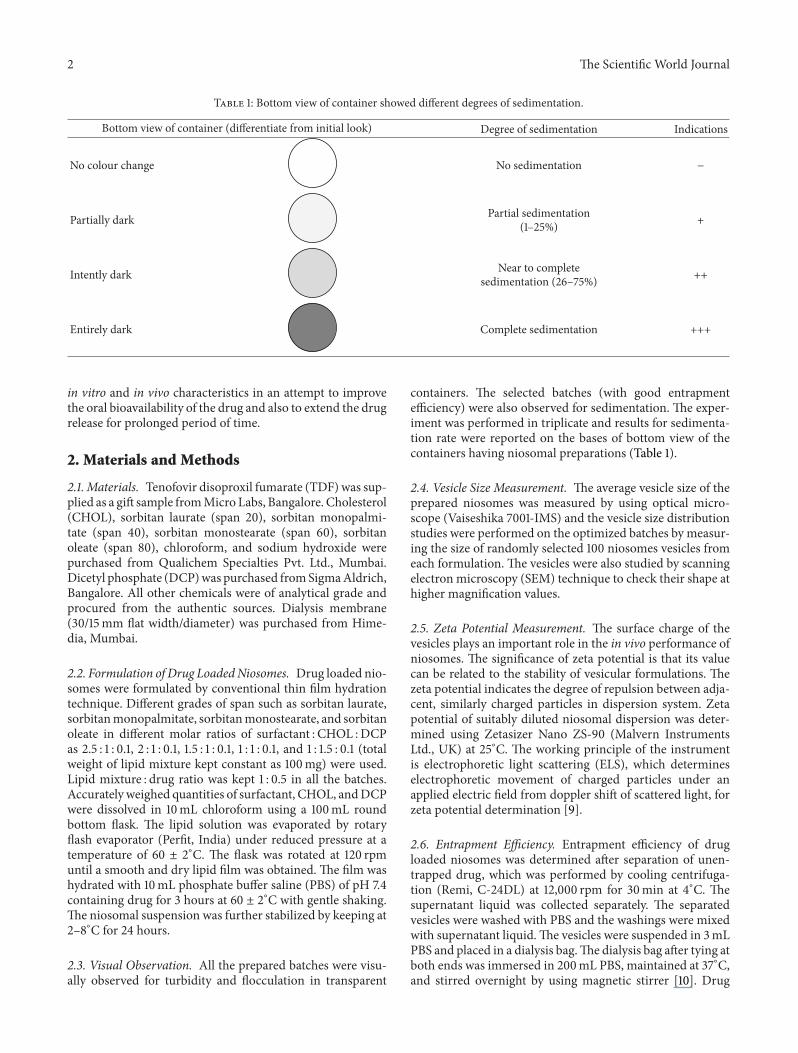
Table 1: Bottom view of container showed different degrees of sedimentation.
Bottom view of container (differentiate from initial look) Degree of sedimentation Indications
No colour change No sedimentation −
Partially dark Partial sedimentation(1–25%) +
Intently dark Near to completesedimentation (26–75%) ++
Entirely dark Complete sedimentation +++
in vitro and in vivo characteristics in an attempt to improvethe oral bioavailability of the drug and also to extend the drugrelease for prolonged period of time.
2. Materials and Methods
2.1. Materials. Tenofovir disoproxil fumarate (TDF) was sup-plied as a gift sample fromMicro Labs, Bangalore. Cholesterol(CHOL), sorbitan laurate (span 20), sorbitan monopalmi-tate (span 40), sorbitan monostearate (span 60), sorbitanoleate (span 80), chloroform, and sodium hydroxide werepurchased from Qualichem Specialties Pvt. Ltd., Mumbai.Dicetyl phosphate (DCP)was purchased fromSigmaAldrich,Bangalore. All other chemicals were of analytical grade andprocured from the authentic sources. Dialysis membrane(30/15mm flat width/diameter) was purchased from Hime-dia, Mumbai.
2.2. Formulation of Drug LoadedNiosomes. Drug loaded nio-somes were formulated by conventional thin film hydrationtechnique. Different grades of span such as sorbitan laurate,sorbitanmonopalmitate, sorbitanmonostearate, and sorbitanoleate in different molar ratios of surfactant : CHOL :DCPas 2.5 : 1 : 0.1, 2 : 1 : 0.1, 1.5 : 1 : 0.1, 1 : 1 : 0.1, and 1 : 1.5 : 0.1 (totalweight of lipid mixture kept constant as 100mg) were used.Lipid mixture : drug ratio was kept 1 : 0.5 in all the batches.Accurately weighed quantities of surfactant, CHOL, andDCPwere dissolved in 10mL chloroform using a 100mL roundbottom flask. The lipid solution was evaporated by rotaryflash evaporator (Perfit, India) under reduced pressure at atemperature of 60 ± 2∘C. The flask was rotated at 120 rpmuntil a smooth and dry lipid film was obtained. The film washydrated with 10mL phosphate buffer saline (PBS) of pH 7.4containing drug for 3 hours at 60 ± 2∘C with gentle shaking.The niosomal suspension was further stabilized by keeping at2–8∘C for 24 hours.
2.3. Visual Observation. All the prepared batches were visu-ally observed for turbidity and flocculation in transparent
containers. The selected batches (with good entrapmentefficiency) were also observed for sedimentation. The exper-iment was performed in triplicate and results for sedimenta-tion rate were reported on the bases of bottom view of thecontainers having niosomal preparations (Table 1).
2.4. Vesicle Size Measurement. The average vesicle size of theprepared niosomes was measured by using optical micro-scope (Vaiseshika 7001-IMS) and the vesicle size distributionstudies were performed on the optimized batches by measur-ing the size of randomly selected 100 niosomes vesicles fromeach formulation. The vesicles were also studied by scanningelectron microscopy (SEM) technique to check their shape athigher magnification values.
2.5. Zeta Potential Measurement. The surface charge of thevesicles plays an important role in the in vivo performance ofniosomes. The significance of zeta potential is that its valuecan be related to the stability of vesicular formulations. Thezeta potential indicates the degree of repulsion between adja-cent, similarly charged particles in dispersion system. Zetapotential of suitably diluted niosomal dispersion was deter-mined using Zetasizer Nano ZS-90 (Malvern InstrumentsLtd., UK) at 25∘C. The working principle of the instrumentis electrophoretic light scattering (ELS), which determineselectrophoretic movement of charged particles under anapplied electric field from doppler shift of scattered light, forzeta potential determination [9].
2.6. Entrapment Efficiency. Entrapment efficiency of drugloaded niosomes was determined after separation of unen-trapped drug, which was performed by cooling centrifuga-tion (Remi, C-24DL) at 12,000 rpm for 30min at 4∘C. Thesupernatant liquid was collected separately. The separatedvesicles were washed with PBS and the washings were mixedwith supernatant liquid.The vesicles were suspended in 3mLPBS and placed in a dialysis bag.The dialysis bag after tying atboth ends was immersed in 200mL PBS, maintained at 37∘C,and stirred overnight by using magnetic stirrer [10]. Drug
The Scientific World Journal 3
was estimated spectrophotometrically at 𝜆max of 261 nm,against PBS as blank. The percentage of entrapped drug wascalculated by applying the following equation:
% Entrapment =(𝐷𝐸× 100)
(𝐷𝐼), (1)
where 𝐷𝐸is the amount of entrapped drug and 𝐷
𝐼is the
initial amount of drug.The entrapped drug was also verified by estimating the
unentrapped drug in the supernatant liquid separated in theinitial step [11].
2.7. In Vitro Drug Release Study. In vitro release patternof niosomal suspension was carried out according to themethod reported by Attia et al. [12]. The formulations witheach grade of surfactant, which showed the better entrapmentefficiencies (F4, F9, F14, and F19), were further selected forcarrying out in vitro release studies. Buffers of different pHwere used for in vitro drug release studies to simulate stomachand blood pH and also to evaluate the effect of pH on drugrelease. Dialysis tube containing the measured amount ofdrug loaded niosomal dispersion was initially placed in mag-netically stirred 200mL of 0.1 NHCL at 37 ± 5∘C, and thenafter the completion of 2 hours of the study, the test mediawere replaced with PBS pH 7.4 and the test was continued fora total period of 24 hours. Aliquots of 5mL samples ofdialysate were withdrawn periodically at 0.5, 1, 2, 3, 4, 6,8, 10, 12, 18, and 24 hours and immediately replenishedwith the same volume of buffer medium. The drug contentwas determined spectrophotometrically at 𝜆max of 261 nm.Results are the mean of three runs.
2.8. Release KineticsModeling. For the characterization of therelease kinetics studies and to determine the release mecha-nism of drug, the results of in vitro studies were fitted withseveral kinetics models as follows.
Zero order rate equation:
𝑄𝑡= 𝑄0+ 𝐾0𝑡, (2)
where 𝑄𝑡is the amount of drug dissolved in time 𝑡, 𝑄
0is
initial amount of drug in solution, and𝐾0is zero order release
constant.First order rate equation:
log𝐶 = log𝐶0−𝐾𝑡
2.303, (3)
where 𝐶0is the initial concentration of drug, 𝐾 is first order
release constant, and 𝑡 is time.Higuchi’s model:
𝑄 = 𝐾𝐻𝑡1/2
, (4)
where𝑄 is the amount of drug released in time 𝑡 per unit area,𝐾𝐻is Higuchi dissolution constant.Hixson-Crowell model:
𝑊1/3
0
−𝑊1/3
𝑡
= 𝜅𝑡, (5)
where𝑊0is the initial amount of drug in the niosomes,𝑊
𝑡
is the remaining amount of drug in the niosomes at time 𝑡,and 𝜅 (kappa) is a constant incorporating the surface-volumerelation.
To find out the mechanism of drug release, the in vitrorelease data of all niosomal formulations were fitted intoKorsmeyer and Peppas equation [13]:
𝑀𝑡
𝑀∞
= 𝐾𝑡𝑛
, (6)
where𝑀𝑡/𝑀∞
is a fraction of drug release at time 𝑡, 𝐾 is therelease rate constant, and 𝑛 is the release exponent. The valueof exponent (𝑛) indicates the mechanism of drug release.
2.9. In Vivo Study. In vivo study was performed accordingto the method reported by Jadonetal. [14] and in accordancewith the protocol approved by the Institutional AnimalEthical Committee of M.M. College of Pharmacy, M.M.University, Mullana (protocol no. MMCP/IAEC/11/18).
Eighteenmale albino rats (Sprague-Dawely strain)weigh-ing 145 to 155 g were selected for study. The animals weredivided in to three groups, each group containing six animals.The animals were fasted overnight for 12 hours. On the studyday, the first group was fed with PBS of pH 7.4 orally. Secondand third groups were treated with plain TDF solution in PBSand TDF loaded niosomal formulation (equivalent to 95mgTDF per kilogramof bodyweight), respectively, by oral route.Blood samples were withdrawn from retro-orbital plexus ofeye at 0.5, 1, 1.5, 2, 4, 6, 8, 12, and 24 hours after dosing, ineppendorf tubes containing 1-2 drops of 10% EDTA solution.The blood samples were centrifuged by cooling centrifugeat 2000 rpm for 10min. The temperature was maintained4∘C during the centrifugation.The separated plasma sampleswere analyzed by double beamUV-visible spectrophotometerat 261 nm.
3. Results and Discussion
3.1. Visual Observation. All the prepared batches were visu-ally observed for turbidity and flocculation in transparentcontainers and were found to be turbid and whitish in colour.However, the selected batches (with good entrapment effi-ciencies) were also evaluated for sedimentationwhile keepingat 4∘C for 3 months in the transparent containers. The resultsrevealed that in all the batches, except F14, sedimentationstarted after 30 days of the storage but the niosomal formu-lation, formulated with sorbitan monostearate, was found ingood dispersible form indicating the good physical stability(Table 2).
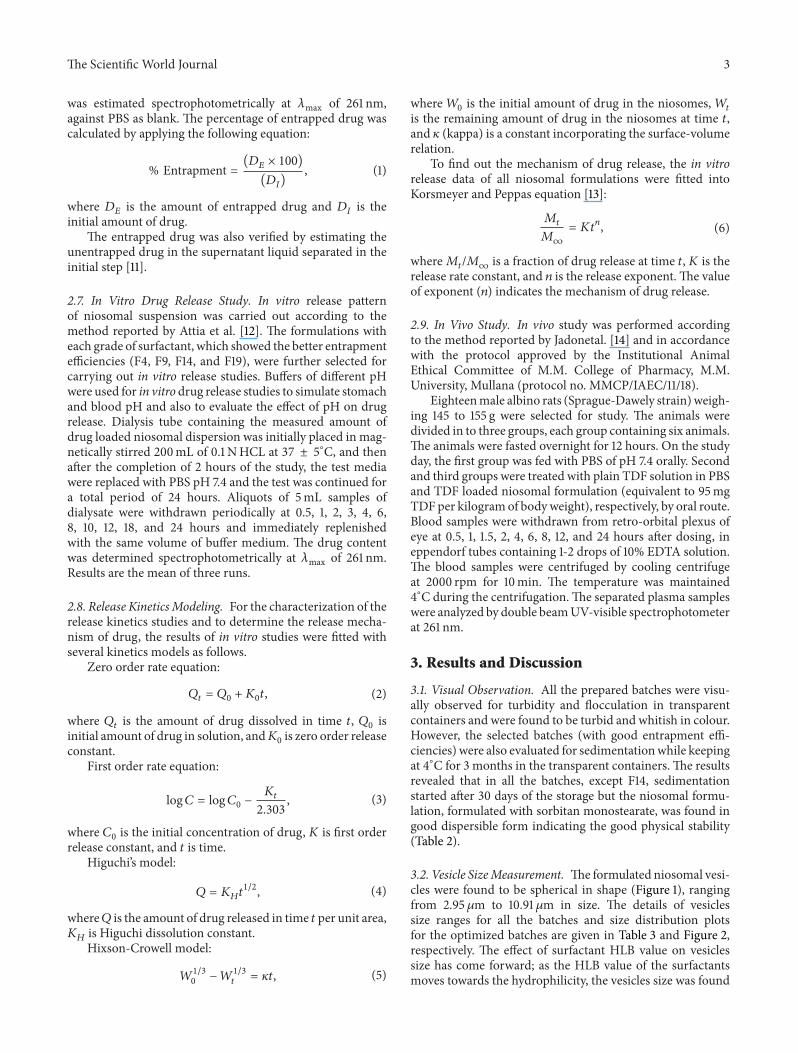
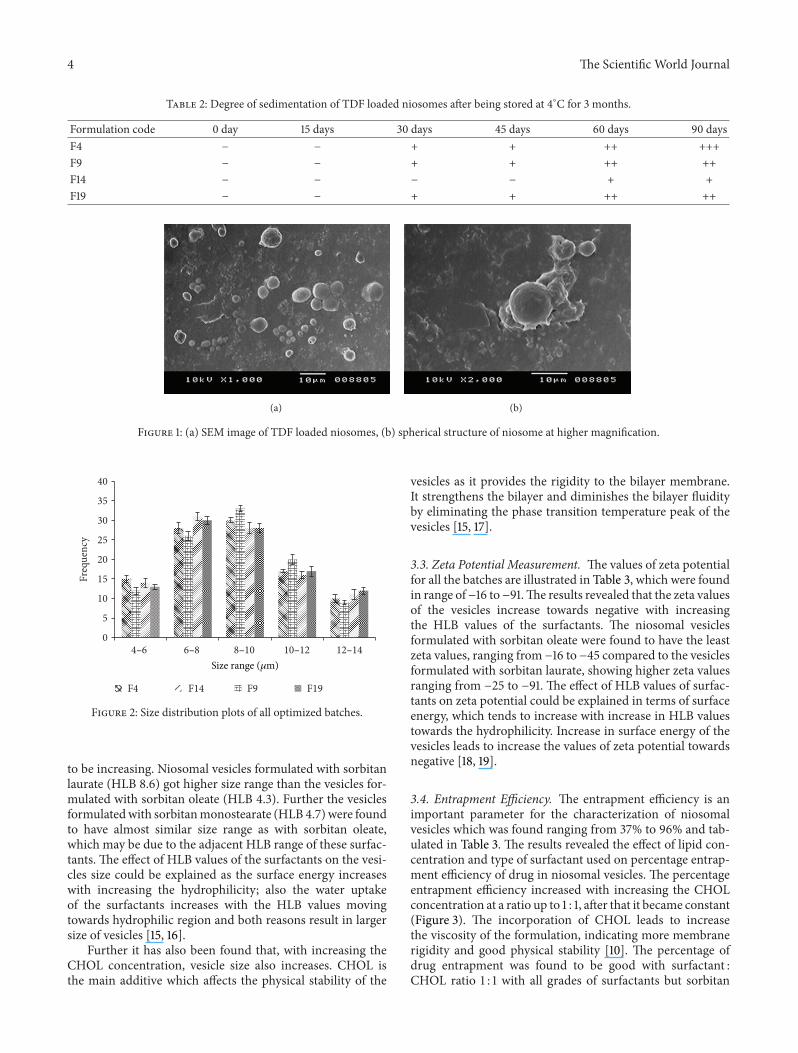
3.2. Vesicle SizeMeasurement. The formulated niosomal vesi-cles were found to be spherical in shape (Figure 1), rangingfrom 2.95 𝜇m to 10.91 𝜇m in size. The details of vesiclessize ranges for all the batches and size distribution plotsfor the optimized batches are given in Table 3 and Figure 2,respectively. The effect of surfactant HLB value on vesiclessize has come forward; as the HLB value of the surfactantsmoves towards the hydrophilicity, the vesicles size was found
4 The Scientific World Journal
Table 2: Degree of sedimentation of TDF loaded niosomes after being stored at 4∘C for 3 months.
Formulation code 0 day 15 days 30 days 45 days 60 days 90 daysF4 − − + + ++ +++F9 − − + + ++ ++F14 − − − − + +F19 − − + + ++ ++
(a) (b)
Figure 1: (a) SEM image of TDF loaded niosomes, (b) spherical structure of niosome at higher magnification.
0
5
10
15
20
25
30
35
40
4–6 6–8 8–10 10–12 12–14
Freq
uenc
y
F4 F9F14 F19
Size range (𝜇m)
Figure 2: Size distribution plots of all optimized batches.
to be increasing. Niosomal vesicles formulated with sorbitanlaurate (HLB 8.6) got higher size range than the vesicles for-mulated with sorbitan oleate (HLB 4.3). Further the vesiclesformulatedwith sorbitanmonostearate (HLB 4.7) were foundto have almost similar size range as with sorbitan oleate,which may be due to the adjacent HLB range of these surfac-tants. The effect of HLB values of the surfactants on the vesi-cles size could be explained as the surface energy increaseswith increasing the hydrophilicity; also the water uptakeof the surfactants increases with the HLB values movingtowards hydrophilic region and both reasons result in largersize of vesicles [15, 16].
Further it has also been found that, with increasing theCHOL concentration, vesicle size also increases. CHOL isthe main additive which affects the physical stability of the
vesicles as it provides the rigidity to the bilayer membrane.It strengthens the bilayer and diminishes the bilayer fluidityby eliminating the phase transition temperature peak of thevesicles [15, 17].
3.3. Zeta Potential Measurement. The values of zeta potentialfor all the batches are illustrated in Table 3, which were foundin range of−16 to−91.The results revealed that the zeta valuesof the vesicles increase towards negative with increasingthe HLB values of the surfactants. The niosomal vesiclesformulated with sorbitan oleate were found to have the leastzeta values, ranging from −16 to −45 compared to the vesiclesformulated with sorbitan laurate, showing higher zeta valuesranging from −25 to −91. The effect of HLB values of surfac-tants on zeta potential could be explained in terms of surfaceenergy, which tends to increase with increase in HLB valuestowards the hydrophilicity. Increase in surface energy of thevesicles leads to increase the values of zeta potential towardsnegative [18, 19].
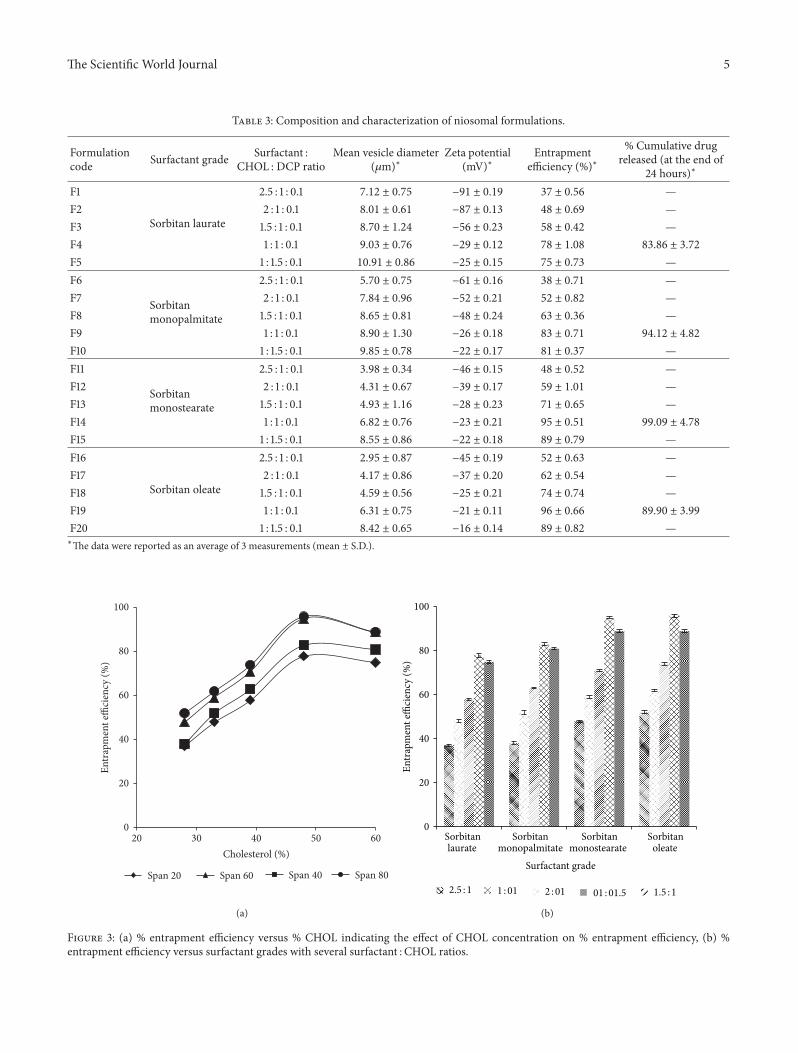
3.4. Entrapment Efficiency. The entrapment efficiency is animportant parameter for the characterization of niosomalvesicles which was found ranging from 37% to 96% and tab-ulated in Table 3. The results revealed the effect of lipid con-centration and type of surfactant used on percentage entrap-ment efficiency of drug in niosomal vesicles. The percentageentrapment efficiency increased with increasing the CHOLconcentration at a ratio up to 1 : 1, after that it became constant(Figure 3). The incorporation of CHOL leads to increasethe viscosity of the formulation, indicating more membranerigidity and good physical stability [10]. The percentage ofdrug entrapment was found to be good with surfactant :CHOL ratio 1 : 1 with all grades of surfactants but sorbitan
The Scientific World Journal 5
Table 3: Composition and characterization of niosomal formulations.
Formulationcode Surfactant grade Surfactant :
CHOL : DCP ratioMean vesicle diameter
(𝜇m)∗Zeta potential
(mV)∗Entrapment
efficiency (%)∗% Cumulative drug
released (at the end of24 hours)∗
F1
Sorbitan laurate
2.5 : 1 : 0.1 7.12 ± 0.75 −91 ± 0.19 37 ± 0.56 —F2 2 : 1 : 0.1 8.01 ± 0.61 −87 ± 0.13 48 ± 0.69 —F3 1.5 : 1 : 0.1 8.70 ± 1.24 −56 ± 0.23 58 ± 0.42 —F4 1 : 1 : 0.1 9.03 ± 0.76 −29 ± 0.12 78 ± 1.08 83.86 ± 3.72
F5 1 : 1.5 : 0.1 10.91 ± 0.86 −25 ± 0.15 75 ± 0.73 —F6
Sorbitanmonopalmitate
2.5 : 1 : 0.1 5.70 ± 0.75 −61 ± 0.16 38 ± 0.71 —F7 2 : 1 : 0.1 7.84 ± 0.96 −52 ± 0.21 52 ± 0.82 —F8 1.5 : 1 : 0.1 8.65 ± 0.81 −48 ± 0.24 63 ± 0.36 —F9 1 : 1 : 0.1 8.90 ± 1.30 −26 ± 0.18 83 ± 0.71 94.12 ± 4.82
F10 1 : 1.5 : 0.1 9.85 ± 0.78 −22 ± 0.17 81 ± 0.37 —F11
Sorbitanmonostearate
2.5 : 1 : 0.1 3.98 ± 0.34 −46 ± 0.15 48 ± 0.52 —F12 2 : 1 : 0.1 4.31 ± 0.67 −39 ± 0.17 59 ± 1.01 —F13 1.5 : 1 : 0.1 4.93 ± 1.16 −28 ± 0.23 71 ± 0.65 —F14 1 : 1 : 0.1 6.82 ± 0.76 −23 ± 0.21 95 ± 0.51 99.09 ± 4.78
F15 1 : 1.5 : 0.1 8.55 ± 0.86 −22 ± 0.18 89 ± 0.79 —F16
Sorbitan oleate
2.5 : 1 : 0.1 2.95 ± 0.87 −45 ± 0.19 52 ± 0.63 —F17 2 : 1 : 0.1 4.17 ± 0.86 −37 ± 0.20 62 ± 0.54 —F18 1.5 : 1 : 0.1 4.59 ± 0.56 −25 ± 0.21 74 ± 0.74 —F19 1 : 1 : 0.1 6.31 ± 0.75 −21 ± 0.11 96 ± 0.66 89.90 ± 3.99
F20 1 : 1.5 : 0.1 8.42 ± 0.65 −16 ± 0.14 89 ± 0.82 —∗The data were reported as an average of 3 measurements (mean ± S.D.).
0
20
40
60
80
100
20 30 40 50 60
Entr
apm
ent e
ffici
ency
(%)
Cholesterol (%)
Span 20 Span 40Span 60 Span 80
(a)
0
20
40
60
80
100
Sorbitanlaurate
Sorbitanmonopalmitate
Sorbitanmonostearate
Entr
apm
ent e
ffici
ency
(%)
Surfactant grade
Sorbitanoleate
2.5 : 1 2 : 011 : 01 1.5 : 101 : 01.5
(b)
Figure 3: (a) % entrapment efficiency versus % CHOL indicating the effect of CHOL concentration on % entrapment efficiency, (b) %entrapment efficiency versus surfactant grades with several surfactant : CHOL ratios.
6 The Scientific World Journal
0
20
40
60
80
100
0 3 6 9 12 15 18 21 24
% C
umul
ativ
e TD
F re
leas
ed
Time (hrs)
F4 F9F14 F19
0
20
40
60
80
100
0 3 6 9 12 15 18 21 24
% C
umul
ativ
e TD
F re
leas
ed
Time (hrs)
F4 F9F14 F19
y = 2.9949x + 28.555
R2 = 0.9961
R2 = 0.9974
R2 = 0.9992
R2 = 0.9978
y = 3.3437x + 31.592
y = 3.7528x + 28.119
y = 3.2823x + 27.857
0
0.5
1
1.5
2
0 3 6 9 12 15 18 21 24
Log
% T
DF
rem
aini
ng
Time (hrs)
F4 F9F14 F19
y = −0.036x + 1.9089
R2 = 0.8917
R2 = 0.9429
R2 = 0.9799
R2 = 0.953
y = −0.0553x + 1.937
y = −0.0521x + 1.9695
y = −0.0808x + 2.0468
0
20
40
60
80
100
0 1 2 3 4 5
% C
umul
ativ
e TD
F re
leas
ed
SQRT
R2 = 0.9905
R2 = 0.9869
R2 = 0.9825
R2 = 0.9897
y = 19.183x + 2.7485
y = 21.333x + 3.0072
y = 23.841x + 3.6858
y = 20.962x + 0.2576
F4 F9F14 F19
0
1
2
3
4
0 3 6 9 12 15 18 21 24
CRT
% T
DF
rem
aini
ng
Time (hrs)
F4 F9F14 F19
y = 0.0869x + 0.4408
y = 0.1188x + 0.4315
y = 0.1563x + 0.2287
y = 0.1027x + 0.3937
R2 = 0.8555
R2 = 0.899
R2 = 0.9636
R2 = 0.8926
0
0.5
1
1.5
2
2.5
00.5 1 1.5
Log
% cu
mul
ativ
e TD
F re
leas
ed
Log time
y = 0.5389x + 1.2689
y = 0.5315x + 1.3215
y = 0.6097x + 1.2472
y = 0.5823x + 1.2419
R2 = 0.9639
R2 = 0.9673
R2 = 0.9681
R2 = 0.9645
F4 F9F14 F19
(a) (b)
(d)(c)
(e) (f)
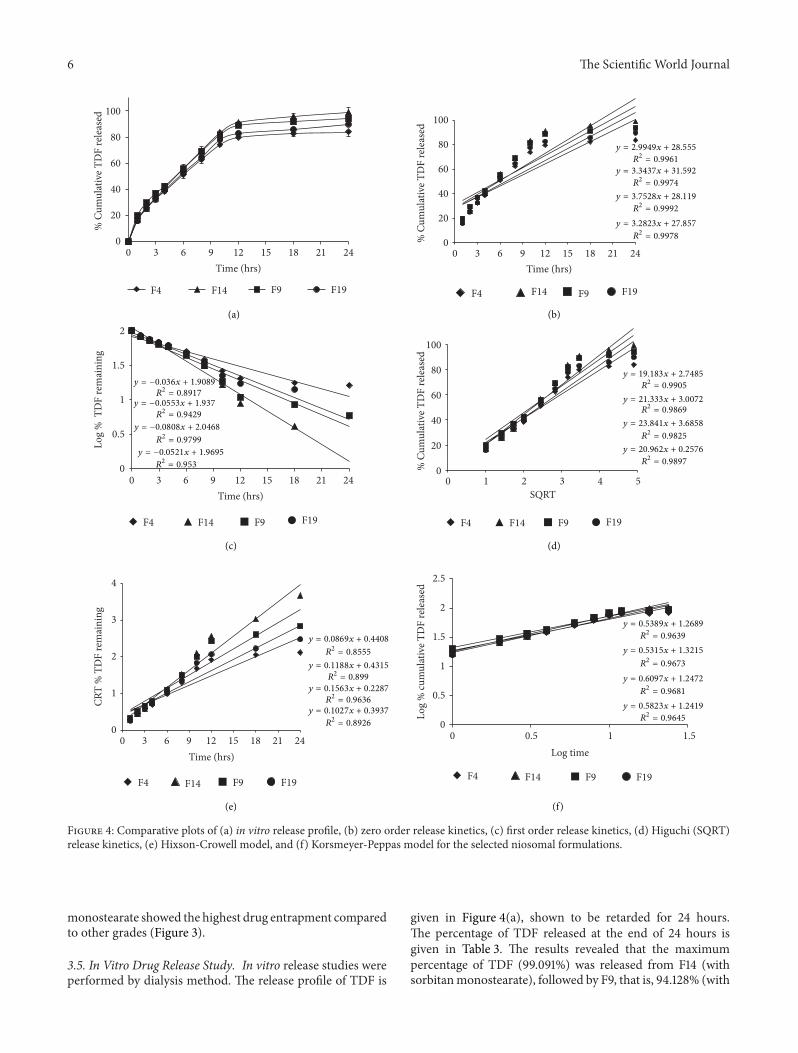
Figure 4: Comparative plots of (a) in vitro release profile, (b) zero order release kinetics, (c) first order release kinetics, (d) Higuchi (SQRT)release kinetics, (e) Hixson-Crowell model, and (f) Korsmeyer-Peppas model for the selected niosomal formulations.
monostearate showed the highest drug entrapment comparedto other grades (Figure 3).
3.5. In Vitro Drug Release Study. In vitro release studies wereperformed by dialysis method. The release profile of TDF is
given in Figure 4(a), shown to be retarded for 24 hours.The percentage of TDF released at the end of 24 hours isgiven in Table 3. The results revealed that the maximumpercentage of TDF (99.091%) was released from F14 (withsorbitanmonostearate), followed by F9, that is, 94.128% (with
The Scientific World Journal 7
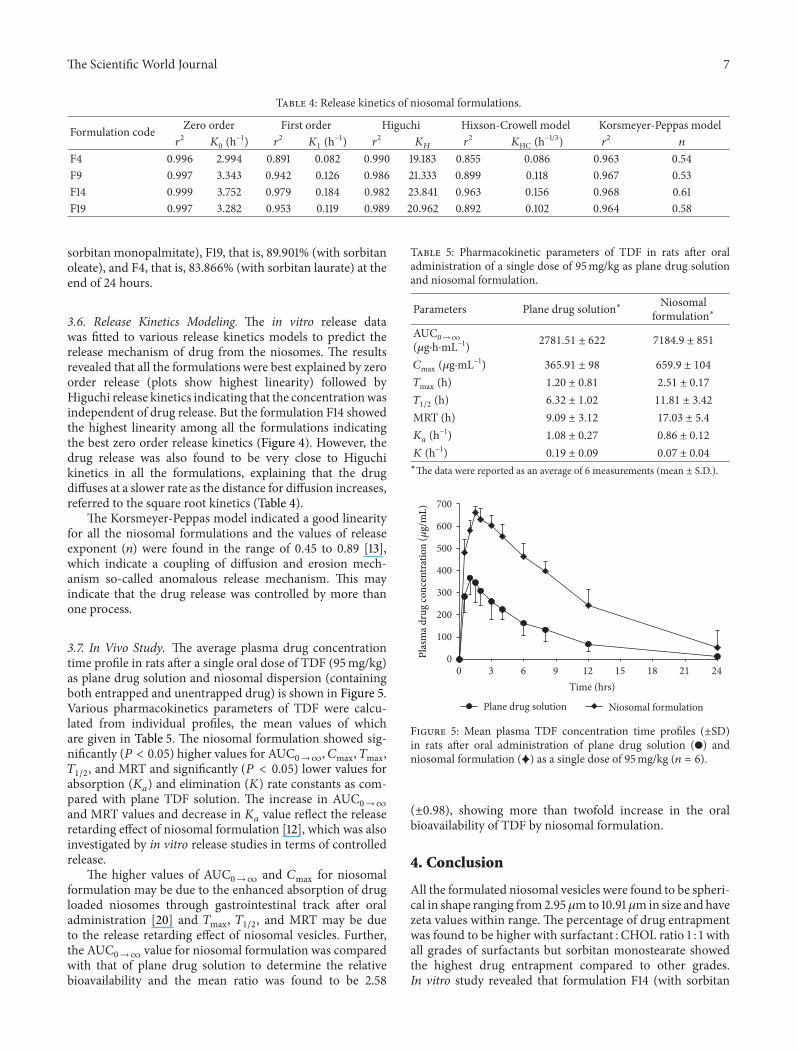
Table 4: Release kinetics of niosomal formulations.
Formulation code Zero order First order Higuchi Hixson-Crowell model Korsmeyer-Peppas model𝑟2
𝐾0
(h−1) 𝑟2
𝐾1
(h−1) 𝑟2
𝐾𝐻
𝑟2
𝐾HC (h−1/3) 𝑟2
𝑛
F4 0.996 2.994 0.891 0.082 0.990 19.183 0.855 0.086 0.963 0.54F9 0.997 3.343 0.942 0.126 0.986 21.333 0.899 0.118 0.967 0.53F14 0.999 3.752 0.979 0.184 0.982 23.841 0.963 0.156 0.968 0.61F19 0.997 3.282 0.953 0.119 0.989 20.962 0.892 0.102 0.964 0.58
sorbitan monopalmitate), F19, that is, 89.901% (with sorbitanoleate), and F4, that is, 83.866% (with sorbitan laurate) at theend of 24 hours.
3.6. Release Kinetics Modeling. The in vitro release datawas fitted to various release kinetics models to predict therelease mechanism of drug from the niosomes. The resultsrevealed that all the formulations were best explained by zeroorder release (plots show highest linearity) followed byHiguchi release kinetics indicating that the concentrationwasindependent of drug release. But the formulation F14 showedthe highest linearity among all the formulations indicatingthe best zero order release kinetics (Figure 4). However, thedrug release was also found to be very close to Higuchikinetics in all the formulations, explaining that the drugdiffuses at a slower rate as the distance for diffusion increases,referred to the square root kinetics (Table 4).
The Korsmeyer-Peppas model indicated a good linearityfor all the niosomal formulations and the values of releaseexponent (𝑛) were found in the range of 0.45 to 0.89 [13],which indicate a coupling of diffusion and erosion mech-anism so-called anomalous release mechanism. This mayindicate that the drug release was controlled by more thanone process.
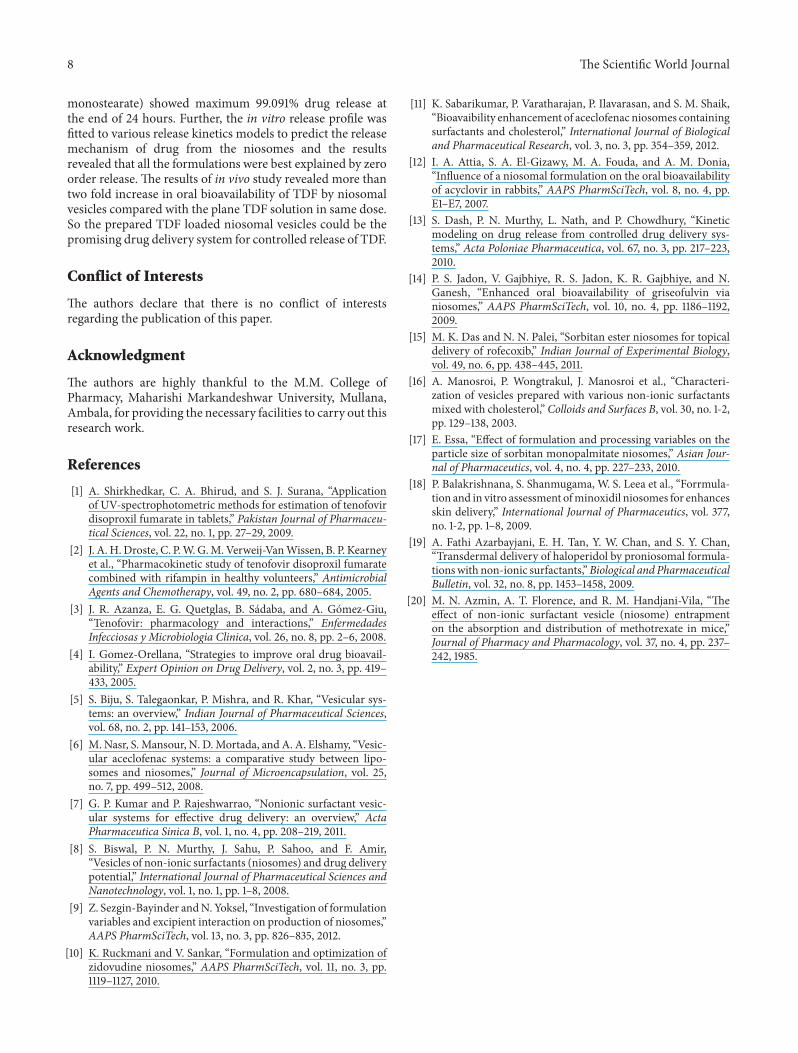
3.7. In Vivo Study. The average plasma drug concentrationtime profile in rats after a single oral dose of TDF (95mg/kg)as plane drug solution and niosomal dispersion (containingboth entrapped and unentrapped drug) is shown in Figure 5.Various pharmacokinetics parameters of TDF were calcu-lated from individual profiles, the mean values of whichare given in Table 5. The niosomal formulation showed sig-nificantly (𝑃 < 0.05) higher values for AUC
0→∞, 𝐶max, 𝑇max,
𝑇1/2
, and MRT and significantly (𝑃 < 0.05) lower values forabsorption (𝐾
𝑎) and elimination (𝐾) rate constants as com-
pared with plane TDF solution. The increase in AUC0→∞
and MRT values and decrease in 𝐾𝑎value reflect the release
retarding effect of niosomal formulation [12], which was alsoinvestigated by in vitro release studies in terms of controlledrelease.
The higher values of AUC0→∞
and 𝐶max for niosomalformulation may be due to the enhanced absorption of drugloaded niosomes through gastrointestinal track after oraladministration [20] and 𝑇max, 𝑇1/2, and MRT may be dueto the release retarding effect of niosomal vesicles. Further,the AUC
0→∞value for niosomal formulation was compared
with that of plane drug solution to determine the relativebioavailability and the mean ratio was found to be 2.58
Table 5: Pharmacokinetic parameters of TDF in rats after oraladministration of a single dose of 95mg/kg as plane drug solutionand niosomal formulation.
Parameters Plane drug solution∗ Niosomalformulation∗
AUC0→∞
(𝜇g⋅h⋅mL−1) 2781.51 ± 622 7184.9 ± 851
𝐶max (𝜇g⋅mL−1) 365.91 ± 98 659.9 ± 104
𝑇max (h) 1.20 ± 0.81 2.51 ± 0.17
𝑇1/2
(h) 6.32 ± 1.02 11.81 ± 3.42
MRT (h) 9.09 ± 3.12 17.03 ± 5.4
𝐾𝑎
(h−1) 1.08 ± 0.27 0.86 ± 0.12
𝐾 (h−1) 0.19 ± 0.09 0.07 ± 0.04
∗The data were reported as an average of 6 measurements (mean ± S.D.).
0
100
200
300
400
500
600
700
0 3 6 9 12 15 18 21 24Time (hrs)
Plane drug solution Niosomal formulation
Plas
ma d
rug
conc
entr
atio
n (𝜇
g/m
L)
Figure 5: Mean plasma TDF concentration time profiles (±SD)in rats after oral administration of plane drug solution (e) andniosomal formulation (Q) as a single dose of 95mg/kg (𝑛 = 6).
(±0.98), showing more than twofold increase in the oralbioavailability of TDF by niosomal formulation.
4. Conclusion
All the formulated niosomal vesicles were found to be spheri-cal in shape ranging from2.95𝜇mto 10.91 𝜇m in size and havezeta values within range. The percentage of drug entrapmentwas found to be higher with surfactant : CHOL ratio 1 : 1 withall grades of surfactants but sorbitan monostearate showedthe highest drug entrapment compared to other grades.In vitro study revealed that formulation F14 (with sorbitan
8 The Scientific World Journal
monostearate) showed maximum 99.091% drug release atthe end of 24 hours. Further, the in vitro release profile wasfitted to various release kinetics models to predict the releasemechanism of drug from the niosomes and the resultsrevealed that all the formulations were best explained by zeroorder release. The results of in vivo study revealed more thantwo fold increase in oral bioavailability of TDF by niosomalvesicles compared with the plane TDF solution in same dose.So the prepared TDF loaded niosomal vesicles could be thepromising drug delivery system for controlled release of TDF.
Conflict of Interests
The authors declare that there is no conflict of interestsregarding the publication of this paper.
Acknowledgment
The authors are highly thankful to the M.M. College ofPharmacy, Maharishi Markandeshwar University, Mullana,Ambala, for providing the necessary facilities to carry out thisresearch work.
References
[1] A. Shirkhedkar, C. A. Bhirud, and S. J. Surana, “Applicationof UV-spectrophotometric methods for estimation of tenofovirdisoproxil fumarate in tablets,” Pakistan Journal of Pharmaceu-tical Sciences, vol. 22, no. 1, pp. 27–29, 2009.
[2] J. A. H.Droste, C. P.W.G.M.Verweij-VanWissen, B. P. Kearneyet al., “Pharmacokinetic study of tenofovir disoproxil fumaratecombined with rifampin in healthy volunteers,” AntimicrobialAgents and Chemotherapy, vol. 49, no. 2, pp. 680–684, 2005.
[3] J. R. Azanza, E. G. Quetglas, B. Sadaba, and A. Gomez-Giu,“Tenofovir: pharmacology and interactions,” EnfermedadesInfecciosas y Microbiologia Clinica, vol. 26, no. 8, pp. 2–6, 2008.
[4] I. Gomez-Orellana, “Strategies to improve oral drug bioavail-ability,” Expert Opinion on Drug Delivery, vol. 2, no. 3, pp. 419–433, 2005.
[5] S. Biju, S. Talegaonkar, P. Mishra, and R. Khar, “Vesicular sys-tems: an overview,” Indian Journal of Pharmaceutical Sciences,vol. 68, no. 2, pp. 141–153, 2006.
[6] M. Nasr, S. Mansour, N. D.Mortada, and A. A. Elshamy, “Vesic-ular aceclofenac systems: a comparative study between lipo-somes and niosomes,” Journal of Microencapsulation, vol. 25,no. 7, pp. 499–512, 2008.
[7] G. P. Kumar and P. Rajeshwarrao, “Nonionic surfactant vesic-ular systems for effective drug delivery: an overview,” ActaPharmaceutica Sinica B, vol. 1, no. 4, pp. 208–219, 2011.
[8] S. Biswal, P. N. Murthy, J. Sahu, P. Sahoo, and F. Amir,“Vesicles of non-ionic surfactants (niosomes) and drug deliverypotential,” International Journal of Pharmaceutical Sciences andNanotechnology, vol. 1, no. 1, pp. 1–8, 2008.
[9] Z. Sezgin-Bayinder andN. Yoksel, “Investigation of formulationvariables and excipient interaction on production of niosomes,”AAPS PharmSciTech, vol. 13, no. 3, pp. 826–835, 2012.
[10] K. Ruckmani and V. Sankar, “Formulation and optimization ofzidovudine niosomes,” AAPS PharmSciTech, vol. 11, no. 3, pp.1119–1127, 2010.
[11] K. Sabarikumar, P. Varatharajan, P. Ilavarasan, and S. M. Shaik,“Bioavaibility enhancement of aceclofenac niosomes containingsurfactants and cholesterol,” International Journal of Biologicaland Pharmaceutical Research, vol. 3, no. 3, pp. 354–359, 2012.
[12] I. A. Attia, S. A. El-Gizawy, M. A. Fouda, and A. M. Donia,“Influence of a niosomal formulation on the oral bioavailabilityof acyclovir in rabbits,” AAPS PharmSciTech, vol. 8, no. 4, pp.E1–E7, 2007.
[13] S. Dash, P. N. Murthy, L. Nath, and P. Chowdhury, “Kineticmodeling on drug release from controlled drug delivery sys-tems,” Acta Poloniae Pharmaceutica, vol. 67, no. 3, pp. 217–223,2010.
[14] P. S. Jadon, V. Gajbhiye, R. S. Jadon, K. R. Gajbhiye, and N.Ganesh, “Enhanced oral bioavailability of griseofulvin vianiosomes,” AAPS PharmSciTech, vol. 10, no. 4, pp. 1186–1192,2009.
[15] M. K. Das and N. N. Palei, “Sorbitan ester niosomes for topicaldelivery of rofecoxib,” Indian Journal of Experimental Biology,vol. 49, no. 6, pp. 438–445, 2011.
[16] A. Manosroi, P. Wongtrakul, J. Manosroi et al., “Characteri-zation of vesicles prepared with various non-ionic surfactantsmixed with cholesterol,” Colloids and Surfaces B, vol. 30, no. 1-2,pp. 129–138, 2003.
[17] E. Essa, “Effect of formulation and processing variables on theparticle size of sorbitan monopalmitate niosomes,” Asian Jour-nal of Pharmaceutics, vol. 4, no. 4, pp. 227–233, 2010.
[18] P. Balakrishnana, S. Shanmugama, W. S. Leea et al., “Forrmula-tion and in vitro assessment ofminoxidil niosomes for enhancesskin delivery,” International Journal of Pharmaceutics, vol. 377,no. 1-2, pp. 1–8, 2009.
[19] A. Fathi Azarbayjani, E. H. Tan, Y. W. Chan, and S. Y. Chan,“Transdermal delivery of haloperidol by proniosomal formula-tionswith non-ionic surfactants,”Biological and PharmaceuticalBulletin, vol. 32, no. 8, pp. 1453–1458, 2009.
[20] M. N. Azmin, A. T. Florence, and R. M. Handjani-Vila, “Theeffect of non-ionic surfactant vesicle (niosome) entrapmenton the absorption and distribution of methotrexate in mice,”Journal of Pharmacy and Pharmacology, vol. 37, no. 4, pp. 237–242, 1985.
Copyright © 2022 FDOKUMEN