Forensic age estimation based on the trabecular bone changes of the pelvic bone using post-mortem...
10
Forensic age estimation based on the trabecular bone changes of the pelvic bone using post-mortem CT Chiara Villa a, *, Maria Normand Hansen a , Jo Buckberry b , Cristina Cattaneo c , Niels Lynnerup a a Laboratory of Biological Anthropology, Department of Forensic Medicine, University of Copenhagen, Denmark b Biological Anthropology Research Centre, Archaeological Sciences, University of Bradford, UK c LABANOF, Forensic Anthropology and Odontology Laboratory, Department of Human Morphology, University of Milan, Italy 1. Introduction Age estimation, combined with sex and ancestry assessment, is a key issue in forensic identification. The traditional methods evaluate macroscopically the morphological changes of the bones, such as cranial sutures [1], pubic symphyseal face [2], auricular surface [3,4], and the sternal end of the ribs [5]. Their use in forensic cases requires time-consuming preparation of the bone, since all remains of soft tissues must be removed. Conversely, it has been suggested that 3D visualization of the bones could be generated from CT scans and the methods could then be applied to them, but their application is unreliable: some papers report good agreement between the modalities [6], others suggest using the methods developed on dry bones with caution and refer to reduce accuracy [7,8]. CT scans allow investigation of subsurface features of the bone, including features of trabecular bone. The structure of the trabecular bone changes with increasing age due to the imbalance of bone remodeling processes: consequently, the bone density decreases, the trabeculae lose their interconnection until they disappear, and therefore the medullar space increases [9,10]. The first radiographic investigations of the trabecular bone were performed by Todd [11] who analyzed the pubic bone. Other bones have been investigated: the proximal epiphysis of the humerus [12], and the proximal epiphysis of the femur [13] used alone as the age indicator or combined with other bones [14]. X-rays of the clavicle and the calcaneus, together with the femur and the humerus, were investigated by Walker and Lovejoy [15]. The reliably of the method in forensic cases was tested by Lynnerup et al. [16], who obtained good results looking at X-rayed trabecular changes in the proximal femur of living individuals. Computed tomography (CT) was used to assess the trabecular structure changes on the pubic bone [17], the auricular surface [18] and the proximal epiphysis of the humerus and the femur [19]. Micro-CT scan, CT and X-ray were compared in a quantitative study of the trabecular changes in the pubic bone [20]. However, all these studies analyzed the trabecular bone of dry bones. The appearance of trabecular bone is different in post-mortem CT when the soft tissues are still in place: the sharpness of the images decreases and the fine trabecular structure can be seen with much less detail. The aim of this study was to develop a method to be applied directly on post-mortem CT, performed before the autopsy. We assessed the trabecular bone changes in the pubic bone (PB) and adjacent to the auricular surface (AS) using CT scans of cadavers without removing any tissue. We correlated the changes with increasing age and developed a scoring system to estimate the age-at-death using both areas independently and combined. Forensic Science International 233 (2013) 393–402 A R T I C L E I N F O Article history: Received 20 June 2013 Received in revised form 5 October 2013 Accepted 18 October 2013 Available online 27 October 2013 Keywords: Forensic anthropology Age estimation Trabecular bone Auricular surface Pubic bone Computed tomography (CT) A B S T R A C T We analyzed the trabecular bone changes in the pubic bone (PB) and in the auricular surface (AS) of the ilium using 319 CT scans of cadavers to estimate the age. Although the sharpness of the trabecular structure decreases in CT images when soft tissues are present, we identified four phases for the changes in PB and five in AS; a juvenile trait in PB and a senile trait in AS helped narrow the age range. High correlation with age was identified for both sexes in PB (F 0.89; M 0.75) and in AS (F 0.85; M 0.71) used independently or combined (F 0.91; M 0.78). The old adults (>60 years) could be evaluated with better accuracy and discriminated in several phases. We found low inter-observer error and low inaccuracy (about 6 years, mean for all age ranges). The method is robust with respect to slice thickness, display window and kernel within the tested ranges. ß 2013 Elsevier Ireland Ltd. All rights reserved. * Corresponding author. Tel.: +45 35 32 72 29. E-mail address: [email protected] (C. Villa). Contents lists available at ScienceDirect Forensic Science International jou r nal h o mep age: w ww.els evier .co m/lo c ate/fo r sc iin t 0379-0738/$ – see front matter ß 2013 Elsevier Ireland Ltd. All rights reserved. http://dx.doi.org/10.1016/j.forsciint.2013.10.020
-
Upload
independent -
Category
Documents
-
view
2 -
download
0
Transcript of Forensic age estimation based on the trabecular bone changes of the pelvic bone using post-mortem...
Forensic Science International 233 (2013) 393–402
Forensic age estimation based on the trabecular bone changes of thepelvic bone using post-mortem CT
Chiara Villa a,*, Maria Normand Hansen a, Jo Buckberry b, Cristina Cattaneo c,Niels Lynnerup a
a Laboratory of Biological Anthropology, Department of Forensic Medicine, University of Copenhagen, Denmarkb Biological Anthropology Research Centre, Archaeological Sciences, University of Bradford, UKc LABANOF, Forensic Anthropology and Odontology Laboratory, Department of Human Morphology, University of Milan, Italy
A R T I C L E I N F O
Article history:
Received 20 June 2013
Received in revised form 5 October 2013
Accepted 18 October 2013
Available online 27 October 2013
Keywords:
Forensic anthropology
Age estimation
Trabecular bone
Auricular surface
Pubic bone
Computed tomography (CT)
A B S T R A C T
We analyzed the trabecular bone changes in the pubic bone (PB) and in the auricular surface (AS) of the
ilium using 319 CT scans of cadavers to estimate the age. Although the sharpness of the trabecular
structure decreases in CT images when soft tissues are present, we identified four phases for the changes
in PB and five in AS; a juvenile trait in PB and a senile trait in AS helped narrow the age range. High
correlation with age was identified for both sexes in PB (F 0.89; M 0.75) and in AS (F 0.85; M 0.71) used
independently or combined (F 0.91; M 0.78). The old adults (>60 years) could be evaluated with better
accuracy and discriminated in several phases. We found low inter-observer error and low inaccuracy
(about 6 years, mean for all age ranges). The method is robust with respect to slice thickness, display
window and kernel within the tested ranges.
� 2013 Elsevier Ireland Ltd. All rights reserved.
Contents lists available at ScienceDirect
Forensic Science International
jou r nal h o mep age: w ww.els evier . co m/lo c ate / fo r sc i in t
1. Introduction
Age estimation, combined with sex and ancestry assessment, is akey issue in forensic identification. The traditional methodsevaluate macroscopically the morphological changes of the bones,such as cranialsutures [1], pubicsymphyseal face[2],auricular surface[3,4], and the sternal end of the ribs [5]. Their use in forensic casesrequires time-consuming preparation of the bone, since all remainsof soft tissues must be removed. Conversely, it has been suggestedthat 3D visualization of the bones could be generated from CT scansand the methods could then be applied to them, but their applicationis unreliable: some papers report good agreement between themodalities [6], others suggest using the methods developed on drybones with caution and refer to reduce accuracy [7,8].
CT scans allow investigation of subsurface features of the bone,including features of trabecular bone. The structure of thetrabecular bone changes with increasing age due to the imbalanceof bone remodeling processes: consequently, the bone densitydecreases, the trabeculae lose their interconnection until theydisappear, and therefore the medullar space increases [9,10]. Thefirst radiographic investigations of the trabecular bone were
* Corresponding author. Tel.: +45 35 32 72 29.
E-mail address: [email protected] (C. Villa).
0379-0738/$ – see front matter � 2013 Elsevier Ireland Ltd. All rights reserved.
http://dx.doi.org/10.1016/j.forsciint.2013.10.020
performed by Todd [11] who analyzed the pubic bone. Other boneshave been investigated: the proximal epiphysis of the humerus[12], and the proximal epiphysis of the femur [13] used alone as theage indicator or combined with other bones [14]. X-rays of theclavicle and the calcaneus, together with the femur and thehumerus, were investigated by Walker and Lovejoy [15]. Thereliably of the method in forensic cases was tested by Lynnerupet al. [16], who obtained good results looking at X-rayed trabecularchanges in the proximal femur of living individuals. Computedtomography (CT) was used to assess the trabecular structurechanges on the pubic bone [17], the auricular surface [18] and theproximal epiphysis of the humerus and the femur [19]. Micro-CTscan, CT and X-ray were compared in a quantitative study of thetrabecular changes in the pubic bone [20]. However, all thesestudies analyzed the trabecular bone of dry bones. The appearanceof trabecular bone is different in post-mortem CT when the softtissues are still in place: the sharpness of the images decreases andthe fine trabecular structure can be seen with much less detail. Theaim of this study was to develop a method to be applied directly onpost-mortem CT, performed before the autopsy. We assessed thetrabecular bone changes in the pubic bone (PB) and adjacent to theauricular surface (AS) using CT scans of cadavers without removingany tissue. We correlated the changes with increasing age anddeveloped a scoring system to estimate the age-at-death usingboth areas independently and combined.

Fig. 1. Sample age distribution by decades.
C. Villa et al. / Forensic Science International 233 (2013) 393–402394
2. Materials and methods
2.1. CT scans sample
We used a sample of 319 CT scans of cadavers (145 females and 174 males) with
an age range of 17–95 years (age distribution shown in Fig. 1). The bodies were
scanned within 3 days from the time of death and they showed no or very few signs
of decomposition. CT scans were performed as part of the routine investigation of
the Forensic Institute of the University of Copenhagen [21] during the period 2010–
2013. A Siemens Somatom Sensation 4 Multislice spiral scanner was used with the
following settings: 120 kV, 112 mAs (average value, Care Dose has been used).
Others settings (slice thickness, slice increment and kernel) varied between some of
the scans as follows: (1) 3 mm slice thickness, 2 mm slice increment, smooth kernel
B31f (N = 151); (2) 1 mm slice thickness, 1 mm slice increment, sharp kernel B60f
(N = 115); (3) 1 mm slice thickness, 1 mm slice increment, smooth kernel B30f
(N = 53).
We intentionally included scans with these different settings to test the variation
among them since there is no widely used standard protocol.
2.2. Description of the age determination system
A group of 50 males to represent decades from 20 to 70 years was randomly
selected in order to define the new scoring system. We selected subjects with the
same CT-scan settings (3 mm slice thickness, 2 mm slice increment, smooth kernel
B31f) and displayed them with a display window of [�150, +1000] Hounsfield Units
(HU). This specific window display was chosen because it highlighted the trabecular
bone in a visually adequate way. For all subjects, one or two slices were selected and
classified in several distinct phases based on the density of trabecular bone.
Presence of further features useful for age estimation was noted. The classifications
were performed without knowing the age of the subjects. We could identify four
phases for the changes of the trabecular bone in the pubic bone (PB) and five in the
auricular surface (AS). Moreover, we identified a juvenile trait in the pubic bones
and a senile trait for the auricular surface that helped in narrowing the age range in
the young and in the old individuals respectively. Left and right sides could not be
evaluated separately, since the observer could not exclude one during the
evaluation of the other. The more advanced phase for either left or right side was
selected in cases of disagreement. Having verified the relationship between the
phases and the age-at-death, we applied the new scoring system to a larger sample,
testing the applicability of the scoring when protocol settings varied (slice
thickness, kernel).
A set of unisex descriptions was formulated for each phase for both bones (PB
and AS) and a series of pictures (Figs. 3–6) were selected as the best representative
of each phase. Additional images with detailed explanation of the selected phase
can be found in Appendix A. All the figures show CT images of subjects scanned with
3 mm slice thickness, smooth kernel and displayed with a window of [�150, +1000]
HU.
2.2.1. Pubic bone
Region of interest: all slices in axial view of the pubic bone where both left and
right pubic symphyseal faces are present (Fig. 2); the ischiopubic ramus was not
considered. No suitable standard reference point could be identified for all subjects,
so a variable number between 10 and 20 slices (depending on slice thickness,
inclination and size of the pubic bone) have been evaluated. Each slice was
attributed a phase and the more frequent one was taken to be the phase of the
subject.
Final score: two elements need to be scored to determine the final score: the
phase and the presence of the juvenile trait. Thus, the final score is the sum of the
phase of the trabecular density (from 1 to 4) and a ‘‘�1’’ point if the juvenile trait
was present.
Phase 1: the trabecular bone is very dense and homogenous; the interior of the
bone seems homogenously filled with trabecular bone. There is one dominant shade
of gray, lighter than the surrounding soft tissues (Fig. 3).
Phase 2: the trabecular bone is still predominantly dense and homogenous, but
there are some areas (less than 20%) showing a less dense structure. There are two
shades of gray, but the lighter one is dominant.
Phase 3: the trabecular bone further decreases in density; the trabecular bone is
less dense than phase 2; furthermore, there are some areas with very large
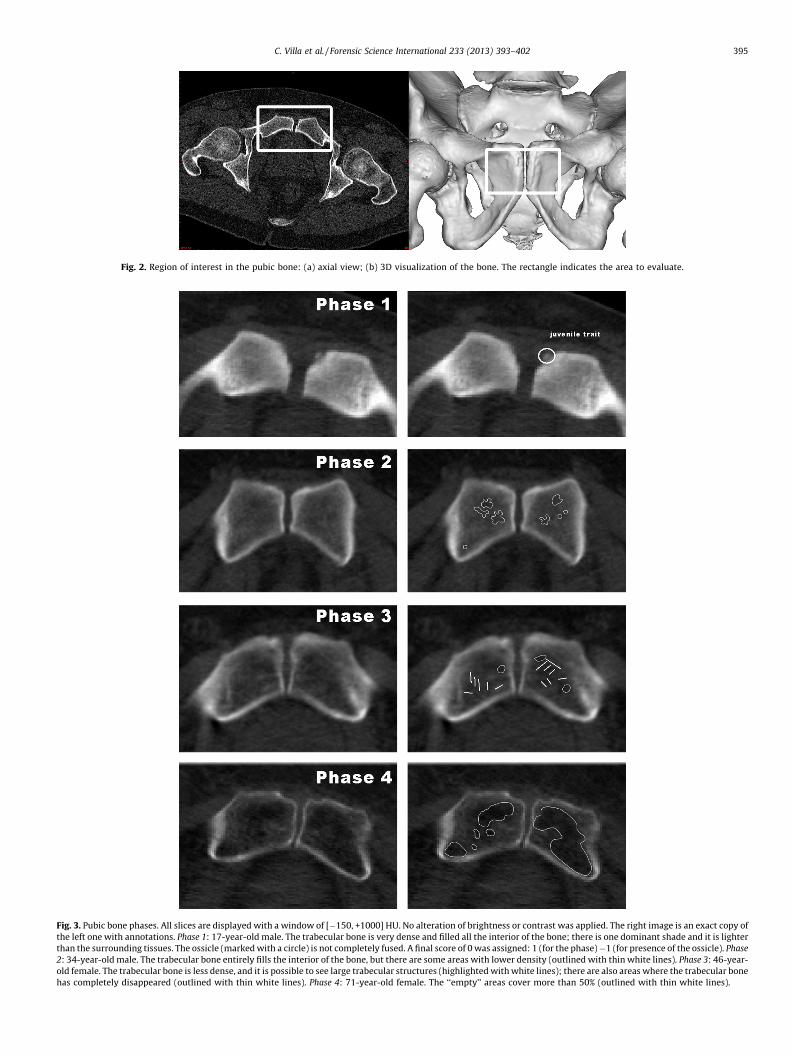
Fig. 3. Pubic bone phases. All slices are displayed with a window of [�150, +1000] HU. No alteration of brightness or contrast was applied. The right image is an exact copy of
the left one with annotations. Phase 1: 17-year-old male. The trabecular bone is very dense and filled all the interior of the bone; there is one dominant shade and it is lighter
than the surrounding tissues. The ossicle (marked with a circle) is not completely fused. A final score of 0 was assigned: 1 (for the phase) �1 (for presence of the ossicle). Phase
2: 34-year-old male. The trabecular bone entirely fills the interior of the bone, but there are some areas with lower density (outlined with thin white lines). Phase 3: 46-year-
old female. The trabecular bone is less dense, and it is possible to see large trabecular structures (highlighted with white lines); there are also areas where the trabecular bone
has completely disappeared (outlined with thin white lines). Phase 4: 71-year-old female. The ‘‘empty’’ areas cover more than 50% (outlined with thin white lines).
Fig. 2. Region of interest in the pubic bone: (a) axial view; (b) 3D visualization of the bone. The rectangle indicates the area to evaluate.
C. Villa et al. / Forensic Science International 233 (2013) 393–402 395

Fig. 4. Juvenile trait in the pubic bone: (left) the superior ossific nodule is visible in an 18-year-old male; (right) the superior ossific nodule partially fused and in a 21-year-old
male.
C. Villa et al. / Forensic Science International 233 (2013) 393–402396
trabecular structure or areas where the trabecular bone is completely disappeared.
Those areas cover less than 50% of the surface. There is no single dominant shade of
gray.
Phase 4: the impression is that the majority (more than >50%) of the area is
‘‘empty’’. There are only few areas with remains of trabecular bone. The dominant
shade is dark.
Juvenile trait (�1 point if present): the superior ossific nodule is visible, and is
either unfused or partially fused (Fig. 4). An unfused or partially fused superior
ossific nodule was present in 6 females (4.14% of the sample; mean: 21 years; SD 3
years; range 17–26 years) and in 9 males (5.17%; mean 19.8 years, SD 2.2 years,
range 17–24 years).
2.2.2. Auricular surface of the ilium
Region of interest: axial view of the auricular surface of the ilium at the level of the
1st and 2nd sacral vertebrae (Fig. 5); a single slice was analyzed, since a suitable
reference point could be identified in all individuals.
Final score: two elements need to be scored to determine the final score: the
phase and the presence of the senile trait. Thus, the final score is the sum of the
phase of the trabecular density (from 1 to 5) and a ‘‘+1’’ point if the senile trait was
present.
Phase 1: the trabecular bone is very dense and homogenous; the interior of the
bone seems homogenously filled with trabecular bone. There is one dominant shade
of gray, lighter than the surrounding soft tissues. No difference in density is present
(Fig. 6).
Phase 2: the trabecular bone is still predominantly dense and homogenous as in
phase 1, but there are some areas (less than 20%) showing a less dense structure.
There are two shades of gray, but the lighter one is dominant.
Phase 3: the trabecular bone loses the appearance of density typical of the first
two phases and the general impression is that the trabecular structure is less dense;
areas with very large trabeculae are present, covering less than 50% of the surface.
There is not a single dominant shade of gray.
Phase 4: the trabecular bone further decreases in density; the difference from
phase 3 is the increasing number of areas with very large trabecular structure or
areas where the trabecular bone has completely disappeared. These areas cover
more than 50%. There is no dominant shade of gray.
Phase 5: the trabecular bone is present in only a few areas and the general
impression is that the majority of the region of interest is ‘‘empty’’. The dominant
shade is dark gray.
Senile trait: at least one of the sacroiliac joints is fused (fused accessory facets
alone are not considered as presence of senile trait) and/or the ossification of the
anterior sacroiliac ligament (Fig. 7). The fusion of the sacroiliac joint and/or the
ossification of the anterior sacroiliac ligament (senile trait) were present in 7
females (4.8%; mean 76 years; SD 12 years; range 57–90 years) and 21 males
(12.1%; mean 70.3 years; SD 12.2 years; range 50–94 years).
Fig. 5. Region of interest in the auricular su
2.3. Statistical analyses
Statistical analysis was performed using SPSS. Shapiro–Wilk test (W) was used to
verify the normal distribution of the sample, considering the males and females
both together and separately. Student t-test was used to calculate the differences of
the mean ages of males and females in each phase, for both the PB and the AS. Paired
t-test was applied to determine the effect of slice thickness on a sample of 30
individuals who had been scanned with both settings; we scored the two groups
with at least 1 month interval. Paired t-test was again used to investigate
differences between display windows on 61 auricular surfaces; we used a bone
window [�1024, +1650] and custom windows [�150, +1000] HU. The evaluations
again were performed with at least 1 month interval. Finally, independent sample t-
test was used to determine difference between kernels (smooth kernel versus sharp
kernel) on 50 individuals. Individuals scanned with a protocol different only in
kernel were not available, thus we calculated the difference using the age error
(estimated age–known age) both for the PS and the AS. All samples were randomly
selected and the evaluations of AS and PB were carried out at different times to
allow for independence of the results and to avoid bias.
Spearman correlation was calculated to measure the relationship between age-
at-death and the final score. Scatter plots of the final scores against age-at-death
were used to visualize the results. We calculated mean, standard deviation (SD) and
range (min–max values) for each final score.
Intra- and inter-observer agreements were expressed with weighted kappa (wk),
specific for ordinal data, to give different weights to disagreements according to the
magnitude of the discrepancy [22]. The wk values were interpreted following the
indication of Landis and Koch [23]. The intra-observer test is based on the results of
a person with 5 years of anthropological experience (CV); the second observer was a
young student with experience in using CT scans for age estimation (MNH). The
evaluations of AS and PB were again carried out at different times to allow for
independence of the results and to avoid bias. Weighted kappa was calculated using
MATLAB software.
New specimens, not included in the sample used for developing the method,
were randomly selected for a validation test: 30 females (age range 23–9 years) and
28 males (age range 17–9 years). We calculated bias and inaccuracy using the
following formula:
Inaccuracy ¼X jestimated � knownj
N; Bias ¼
X jestimated � knownjN
3. Results
Shapiro–Wilk normality test showed that the sample used inthis study had a normal distribution, both when considering males
rface: (a) axial view; (b) sagittal view.
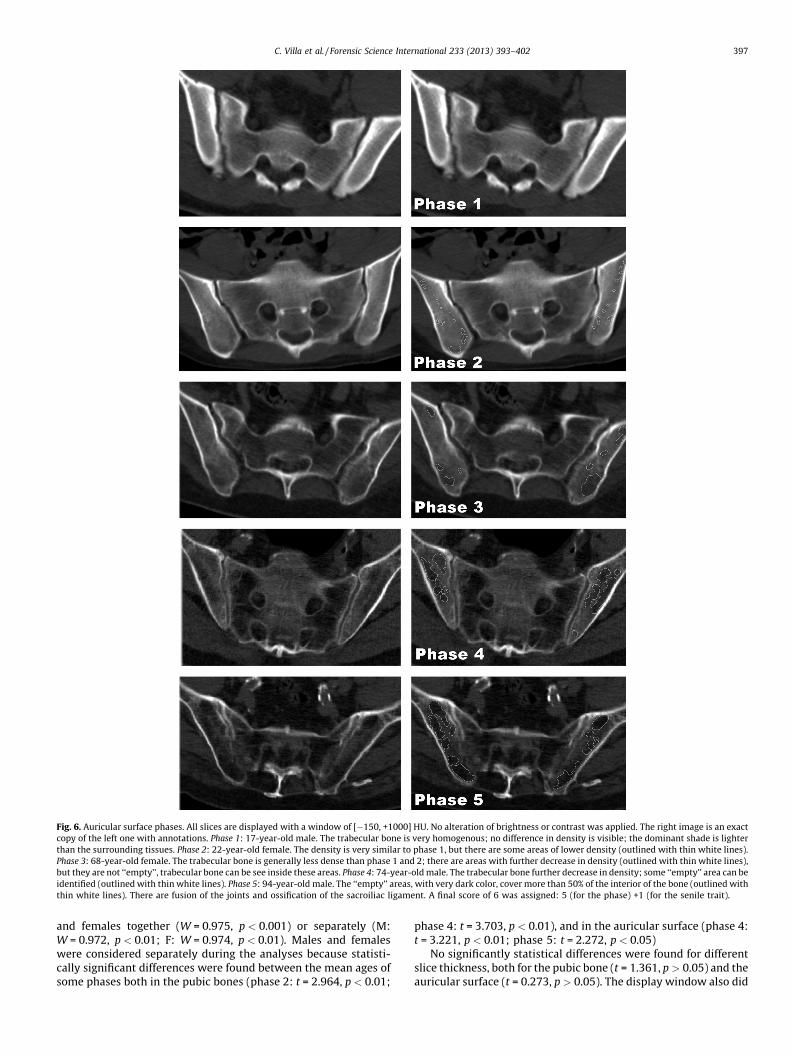
Fig. 6. Auricular surface phases. All slices are displayed with a window of [�150, +1000] HU. No alteration of brightness or contrast was applied. The right image is an exact
copy of the left one with annotations. Phase 1: 17-year-old male. The trabecular bone is very homogenous; no difference in density is visible; the dominant shade is lighter
than the surrounding tissues. Phase 2: 22-year-old female. The density is very similar to phase 1, but there are some areas of lower density (outlined with thin white lines).
Phase 3: 68-year-old female. The trabecular bone is generally less dense than phase 1 and 2; there are areas with further decrease in density (outlined with thin white lines),
but they are not ‘‘empty’’, trabecular bone can be see inside these areas. Phase 4: 74-year-old male. The trabecular bone further decrease in density; some ‘‘empty’’ area can be
identified (outlined with thin white lines). Phase 5: 94-year-old male. The ‘‘empty’’ areas, with very dark color, cover more than 50% of the interior of the bone (outlined with
thin white lines). There are fusion of the joints and ossification of the sacroiliac ligament. A final score of 6 was assigned: 5 (for the phase) +1 (for the senile trait).
C. Villa et al. / Forensic Science International 233 (2013) 393–402 397
and females together (W = 0.975, p < 0.001) or separately (M:W = 0.972, p < 0.01; F: W = 0.974, p < 0.01). Males and femaleswere considered separately during the analyses because statisti-cally significant differences were found between the mean ages ofsome phases both in the pubic bones (phase 2: t = 2.964, p < 0.01;
phase 4: t = 3.703, p < 0.01), and in the auricular surface (phase 4:t = 3.221, p < 0.01; phase 5: t = 2.272, p < 0.05)
No significantly statistical differences were found for differentslice thickness, both for the pubic bone (t = 1.361, p > 0.05) and theauricular surface (t = 0.273, p > 0.05). The display window also did
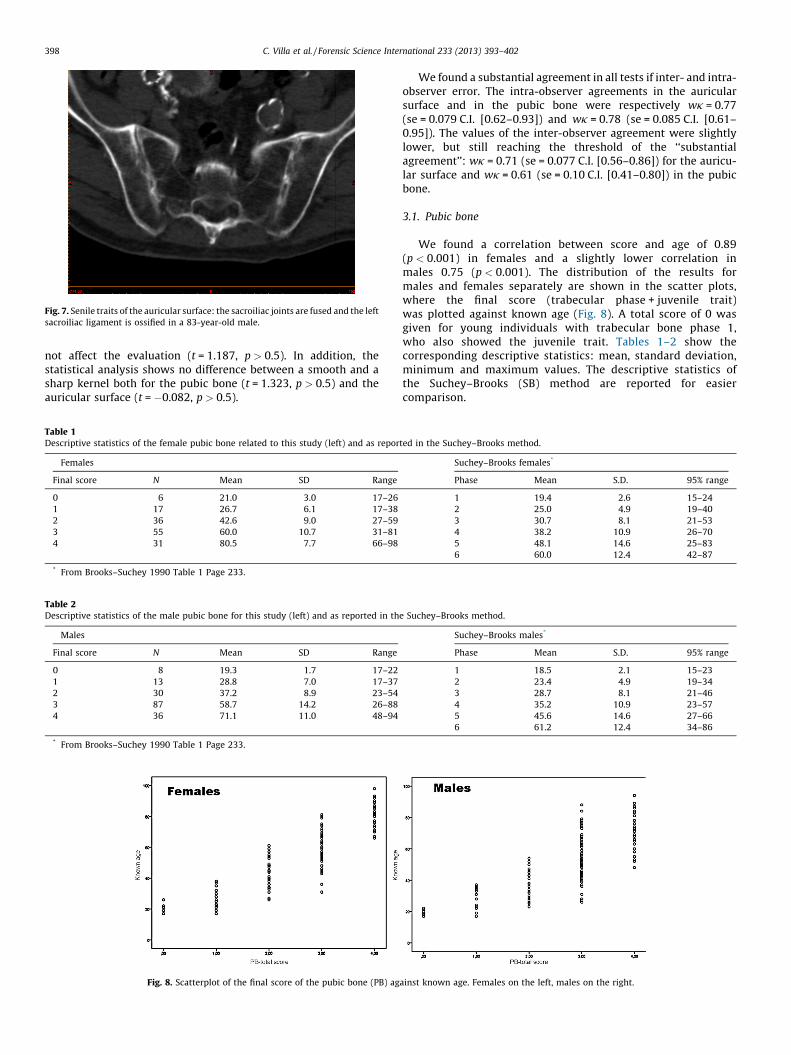
Fig. 7. Senile traits of the auricular surface: the sacroiliac joints are fused and the left
sacroiliac ligament is ossified in a 83-year-old male.
C. Villa et al. / Forensic Science International 233 (2013) 393–402398
not affect the evaluation (t = 1.187, p > 0.5). In addition, thestatistical analysis shows no difference between a smooth and asharp kernel both for the pubic bone (t = 1.323, p > 0.5) and theauricular surface (t = �0.082, p > 0.5).
Table 1Descriptive statistics of the female pubic bone related to this study (left) and as repor
Females
Final score N Mean SD Range
0 6 21.0 3.0 17–26
1 17 26.7 6.1 17–38
2 36 42.6 9.0 27–59
3 55 60.0 10.7 31–81
4 31 80.5 7.7 66–98
* From Brooks–Suchey 1990 Table 1 Page 233.
Table 2Descriptive statistics of the male pubic bone for this study (left) and as reported in th
Males
Final score N Mean SD Range
0 8 19.3 1.7 17–22
1 13 28.8 7.0 17–37
2 30 37.2 8.9 23–54
3 87 58.7 14.2 26–88
4 36 71.1 11.0 48–94
* From Brooks–Suchey 1990 Table 1 Page 233.
Fig. 8. Scatterplot of the final score of the pubic bone (PB) ag
We found a substantial agreement in all tests if inter- and intra-observer error. The intra-observer agreements in the auricularsurface and in the pubic bone were respectively wk = 0.77(se = 0.079 C.I. [0.62–0.93]) and wk = 0.78 (se = 0.085 C.I. [0.61–0.95]). The values of the inter-observer agreement were slightlylower, but still reaching the threshold of the ‘‘substantialagreement’’: wk = 0.71 (se = 0.077 C.I. [0.56–0.86]) for the auricu-lar surface and wk = 0.61 (se = 0.10 C.I. [0.41–0.80]) in the pubicbone.
3.1. Pubic bone
We found a correlation between score and age of 0.89(p < 0.001) in females and a slightly lower correlation inmales 0.75 (p < 0.001). The distribution of the results formales and females separately are shown in the scatter plots,where the final score (trabecular phase + juvenile trait)was plotted against known age (Fig. 8). A total score of 0 wasgiven for young individuals with trabecular bone phase 1,who also showed the juvenile trait. Tables 1–2 show thecorresponding descriptive statistics: mean, standard deviation,minimum and maximum values. The descriptive statistics ofthe Suchey–Brooks (SB) method are reported for easiercomparison.
ted in the Suchey–Brooks method.
Suchey–Brooks females*
Phase Mean S.D. 95% range
1 19.4 2.6 15–24
2 25.0 4.9 19–40
3 30.7 8.1 21–53
4 38.2 10.9 26–70
5 48.1 14.6 25–83
6 60.0 12.4 42–87
e Suchey–Brooks method.
Suchey–Brooks males*
Phase Mean S.D. 95% range
1 18.5 2.1 15–23
2 23.4 4.9 19–34
3 28.7 8.1 21–46
4 35.2 10.9 23–57
5 45.6 14.6 27–66
6 61.2 12.4 34–86
ainst known age. Females on the left, males on the right.

Fig. 9. Scatterplot of the final score of the auricular surface against age at death. Females on the left, males on the right.
Table 3Descriptive statistics of the auricular surface for this study divided by sex (left) and as reported in the Buckberry–Chamberlain method.
Females Males Buckberry–Chamberlain
Final score N Mean SD Range Final score N Mean SD Range Stage N Mean S.D. Range
1 13 23.8 5.4 17–33 1 16 24.0 5.8 17–35 I 3 17.33 1.5 16–19
2 26 35.4 11.0 21–64 2 17 34.1 7.8 19–46 II 6 29.33 6.7 21–38
3 54 52.1 11.0 27–75 3 56 49.3 16.0 18–77 III 22 37.86 13.1 16–65
4 38 72.3 11.0 45–87 4 55 63.5 14.0 36–89 IV 32 51.41 14.5 29–81
5 11 80.0 13.0 57–98 5 25 67.4 10.0 48–87 V 64 59.94 13.0 29–88
6 3 83.0 6.1 79–90 6 5 82.4 9.1 71–94 VI 41 66.71 11.9 39–91
VII 12 72.25 12.7 53–92
Buckberry and Chamberlain, 2002, Table 12 pag 237.
C. Villa et al. / Forensic Science International 233 (2013) 393–402 399
3.2. Auricular surface of the ilium
A correlation of 0.85 (p < 0.001) was found in females, and of0.71 (p < 0.001) in males. The distribution of the results for malesand females separately are shown in the scatter plots, where thefinal score (trabecular phase + senile trait) was plotted againstknown age (Fig. 9). A total score of 6 was attributed for individualswith a phase 5 for the trabecular bone and fusion of the sacroiliacjoint or ossification of the sacroiliac ligament (senile trait). Themean, standard deviation and range for males and femalesseparately are shown in Table 3. The descriptive statistics of theBuckberry–Chamberlain method are also given in Table 3, for abetter comparison of the results.
3.3. Pubic bone and auricular surface: composite score
A composite score was obtained summarizing the score of thepubic bone and the auricular surface. We produced nine classes of
Fig. 10. Scatterplot of the composite score (PB + AS) again
age (total scores 9–10 were combined due to small sample size andcompletely overlapping of age ranges). We found a very highcorrelation in females (0.91; p < 0.001), slightly lower in the males(0.78; p < 0.001). Fig. 10 shows the distribution of the total scoreversus the known age. In females, there is a very clear trend withage: the age intervals increased with known age, both for the meanand for age ranges (Table 4). In contrast, in males there was muchmore overlap of known age ranges between the total scores,especially between total scores of 4 and 5, where score 4 has aslightly higher mean age than score 5 (Table 4).
3.4. Validation test
Table 5 summarizes bias and inaccuracy for the completesample (all ages) and for decades in males and females obtained inthe validation test. The estimated age of the majority of thespecimens fell within the interval of 1 SD: using the pubic bone 77%of females and 87% of males; using the auricular surface 73% of
st know age. Females on the left, males on the right.

Table 4Descriptive statistics of the composite score.
Composite score Females Males
N Mean SD Range N Mean S.D. Range
1 4 19.8 2.2 17–22 5 19.2 1.9 17–22
2 10 24.4 4.6 17–32 8 24.3 6.4 17–35
3 10 29 6.4 21–38 12 29.3 6.3 18–37
4 12 37.8 6.2 26–48 9 37.1 8.1 26–46
5 25 46.6 9.6 27–64 14 35.3 7.4 23–45
6 32 56 10.4 31–75 41 54.5 13.5 26–77
7 20 65.9 8.3 52–81 40 60.3 13.3 36–88
8 19 79.4 6.9 57–89 28 70 9.4 53–89
9 13 82.5 10.1 67–98 17 72.8 12.3 48–94
C. Villa et al. / Forensic Science International 233 (2013) 393–402400
females and 83% of males. Using the composite score (AS + PB),known age fell in the 1 SD interval in 80% of females and in 77% ofmales.
4. Discussion
In this study to estimate age-at-death, we found that thetrabecular bone changes of the pubic bone and the auricularsurface could be evaluated in post-mortem CT, even though thepresence of soft tissues decreased the sharpness of the CT imagesand thus blurred the trabecular microarchitectures. We distin-guished some phases in the trabecular structure changes anddeveloped a new method that be applied directly on post-mortemCT scans of fresh cadavers. In agreement with Lynnerup et al. [16],we demonstrated that the changes of the trabecular structure canbe assessed without removing soft tissues, thus avoiding the time-consuming maceration process. We included CT scans with diverseslice thickness, display window and kernel to assess the impact ofthe machine settings and to verify how applicable our method was.Although statistical tests showed that the scoring systemdeveloped in this study is robust with respect to these settings,we suggest our method should be used on CT scans of freshcadavers, scanned at 120 kV with slice thickness between 1 and3 mm, a smooth kernel and a display window of [�150, +1000] HU.
Table 5Inaccuracy and bias.
Known age (years) Females
N AS PB Composit
<29 5
Inacc. 5 2.54 2.48
Bias 2.84 1.1 0.64
30–39 8
Inacc. 3.8 5.29 3.55
Bias �2 1.84 �3.35
40–49 5
Inacc. 9.6 7.52 8.48
Bias 4.16 4.96 4
50–59 6
Inacc. 3.1 4.8 1.2
Bias �3.1 4.8 0.8
60–69 3
Inacc. 8.9 1 5
Bias �8.9 �1 �5
>70 3
Inacc. 8.9 6.67 5.43
Bias �8.03 �6.67 �5.43
All ages 30
Inacc. 6.33 5 4.52
Bias �2.16 0.21 �1.54
Slice thickness outside these ranges could have an influence on ourmethod: larger slice thickness could cause loss of information, i.e.juvenile or senile traits may not be seen; lower slice thicknesscould increase the noise and make it difficult to distinguish amongthe phases. The same effect could result from too sharp a kernel.Another important aspect to consider is the state of decompositionof the body: we used only cadavers with no or very few signs ofdecomposition, since the presence of gas could alter the structureof the trabecular bone, creating bubbles on the bones [24].
A merit of our new method seems to be the possibility toestimate age-at-death in old adults (60+ years) more accuratelythan the macroscopic methods applied to the pubic bone and theauricular surface. Looking at the morphological changes of thepubic bone, it is possible to attribute a maximum age of +50 usingthe method of Todd [25], an age of 60 � 12.4 for females and61.2 � 12.4 for males using the Suchey–Brooks method [2]. Incontrast, we could estimate an age of 80.5 � 7.7 for females and71.1 � 11 for males (Tables 1–2). One of the advantages of theBuckberry–Chamberlain method [3] over that of Lovejoy et al. [4] inevaluating the changes of the auricular surface is the greater accuracyin estimating age of older adults [26], indeed the age interval of thelast stage (VII) is 72.25 � 12.7, versus the range 60+ years. We definedtwo older scores (5–6) in females with age ranges of 80 � 13 yearsand 83 � 6.1 years; in males only the final score 6 (82.4 � 9.1 years)
Males
e score N AS PB Composite score
2
9.05 8.25 8.15
9.05 8.25 8.15
3
2.9 1.4 1.37
�2.9 0.2 0.1
9
6.06 8.98 7.92
3.86 1.42 1.48
8
7.64 3.43 5.16
�2.16 3.2 1.66
6
2.98 6.76 5.63
�1.68 �5.07 �2.3
0
– – –
– – –
28
5.73 6.05 5.96
0.6 0.9 1.05
C. Villa et al. / Forensic Science International 233 (2013) 393–402 401
performed better than the Buckberry–Chamberlain method. Usingthe composite score (Table 4), three classes are over 60 years for thefemales, two for the males. However the classes of the compositescore have to be tested on a larger sample, since some are based onfew specimens and some have similar ranges of age, especially in themales.
Comparing our method with those based on X-ray investiga-tion, we noticed that only a small number of phases have beenidentified in our method: four in the pubic bone, and five in theauricular surface. In contrast, Walker and Lovejoy [15] describedeight phases of change in the clavicle and the femur, and Acsadiand Nemeskeri [14] described six classes for the proximal end ofthe humerus and the femur. A reason of the low number of phasescould be that the structure of the trabecular bone cannot bedistinctly viewed in post mortem CT scans, due to the presence ofsoft tissue. Similarly, Todd [11] and Lynnerup et al. [16], whostudied bones surrounded by soft tissues, identified only fourphases. Nevertheless, our method performed better than theseradiological methods in estimating the age of older individuals(60+ years): the last phase of the Walker and Lovejoy [15] methodestimates an age of 60+ years, the last phase of the Acsadi andNemeskeri [14] method provides an age estimate of 67.8 � 3.64years, but with an actual range of 25–85 years. On the contrary, thelowest age in the last phase of our method is 48 years in males and 57years in females.
The reliability of a method depends on different factors:variation between observers and among populations, accuracyand bias. In our test, the intra- and inter-observer agreementswere substantial in the evaluation of the pubic bone and of theauricular surface and we concluded that our method could beapplied in a consistent manner independently from the level ofexperience of the observers. Good results for bias and inaccuracywere obtained when we tested 60 new individuals: aninaccuracy of less than 10 years was found for the completesample of males and females (all ages) and for each decade. Aspreviously noted by Saunders et al. [27] and Martrille et al. [28],the combined method did not perform better than the singlebone independently. In males, the best results were obtainedusing a single trait. In females, the PB results had the lowestinaccuracy in the decades 40–49, 60–69. In contrast to the resultsof inaccuracy obtained by Lovejoy et al. [29] and Martrille et al.[28], the inaccuracy of our method did not increase withincreasing age. For our method, high inaccuracy was evident forthe decade 40–49 in females and in the age range <29 in malesusing auricular surface and in the decade 40–49 for both sexesusing the pubic symphysis. Our results are more similar to thoseobtained by Walker and Lovejoy [15], who tested radiologicalmethod. Although the results of inaccuracy and bias for ourmethod seemed better than those in the literature, especially forolder adults, they need to be confirmed using a larger sample andtested on different populations. Finally, we need to incorporateour scoring method in the ‘‘transitional analysis’’ procedure [30]to estimate the probability of age distribution associated witheach final score.
A possible limit of the method presented in this study is thatagain is based only on visual scoring of the criterion useful for ageestimation, although we had access to digital data, and again thesubjectivity and the experience play an important role. Futureresearch will involve implementing our method and supportingthe results with quantitative data. Previous studies have testedquantitative approaches in the quantification of the variation of thetrabecular bone in femur [31] and humerus [32] and pubic bone[20]. Trabecular bone changes could be also investigated using thevariation of the Hounsfield Units (HU), although particularattention has to be paid to factors such as the position and thedimension of the region of interest, the model and the setting of the
CT scanner [33], that can influence the reliability and thereproducibility of any resultant method.
5. Conclusion
In conclusion, we developed a method for age estimation thatcan be applied directly on post-mortem CT scans of fresh cadavers.The method was robust with respect to slice thickness, displaywindow and kernel within the tested ranges. From the validationtest, age-at-death could be evaluated with a low inaccuracy (about6 years) using the trabecular bone changes of both the auricularsurface and the pubic bone and old adults could be discriminatedwith better accuracy than with the classic methods. However, themethod should be validated on a larger sample to confirminaccuracy and bias and should be tested for variation betweenpopulations.
Ethical issues
No formal ethical consent is needed from Danish Ethicalcommittees to work with CT images of dead humans. Medico-legal autopsies are mandated by the police and CT scans are partof the routine investigation at the Department of ForensicMedicine (University of Copenhagen). The Department ofForensic Medicine adheres to Danish Standards Accreditationregarding data security. No personalized data can be exportedfrom the systems. All personal data are removed from all images,as they have no use in the project; only age and sex data wereretained.
Acknowledgements
The authors would like to thank the Forensic Technicians at theSection of Forensic Pathology, (University of Copenhagen) forhelping with the data collection during the daily routine. We thank,also, the anonymous reviewers for their constructive commentsthat helped us to improve the manuscript.
Appendix A. Supplementary data
Supplementary data associated with this article can be found,
in the online version, at http://dx.doi.org/10.1016/j.forsciint.2013.
10.020.
References
[1] R.S. Meindl, C.O. Lovejoy, Ectocranial suture closure: a revised method for thedetermination of skeletal age at death based on the lateral-anterior sutures, Am. J.Phys. Anthropol. 68 (1985) 57–66.
[2] S. Brooks, J. Suchey, Skeletal age determination based on the Os Pubis: a compari-son of the Acsadi-Nemeskeri and Suchey-Brooks methods, J. Hum. Evol. (1990)1990.
[3] J.L. Buckberry, A.T. Chamberlain, Age estimation from the auricular surface of theilium: a revised method, Am. J. Phys. Anthropol. 119 (2002) 231–239.
[4] C.O. Lovejoy, R.S. Meindl, T.R. Pryzbeck, R.P. Mensforth, Chronological metamor-phosis of the auricular surface of the ilium: a new method for the determination ofadult skeletal age at death, Am. J. Phys. Anthropol. 68 (1985) 15–28.
[5] M.Y. Is can, S.R. Loth, R.K. Wright, Metamorphosis at the sternal rib end: a newmethod to estimate age at death in white males, Am. J. Phys. Anthropol. 65 (1984)147–156.
[6] N. Telmon, A. Gaston, P. Chemla, A. Blanc, F. Joffre, D. Rouge, Application of theSuchey–Brooks method to three-dimensional imaging of the pubic symphysis, J.Forensic Sci. 50 (2005) 507–512.
[7] N. Lottering, D.M. MacGregor, M. Meredith, C.L. Alston, L.S. Gregory, Evaluation ofthe Suchey–Brooks method of age estimation in an Australian subpopulationusing computed tomography of the pubic symphyseal surface, Am. J. Phys.Anthropol. 150 (2013) 386–399.
[8] C. Villa, J. Buckberry, C. Cattaneo, N. Lynnerup, Technical note: reliability ofSuchey–Brooks and Buckberry–Chamberlain methods on 3D visualizations fromCT and laser scans, Am. J. Phys. Anthropol. 151 (2013) 158–163.

C. Villa et al. / Forensic Science International 233 (2013) 393–402402
[9] A.M. Parfitt, Age-related structural changes in trabecular and cortical bone:cellular mechanisms and biomechanical consequences, Calcif. Tissue Int. 36(Suppl 1) (1984) S123–S128.
[10] L. Mosekilde, Age-related changes in vertebral trabecular bone architecture –assessed by a new method, Bone 9 (1988) 247–250.
[11] T.W. Todd, Age changes in the pubic bone. VIII. Roentgenographic differentiation,Am. J. Phys. Anthropol. 14 (1930) 255–271.
[12] D. Schranz, Age determination from the internal structure of the humerus, Am. J.Phys. Anthropol. 17 (1959) 273–277.
[13] M. Singh, A.R. Nagrath, P.S. Maini, Changes in trabecular pattern of the upper endof the femur as an index of osteoporosis, J. Bone Joint Surg. 52 (1970) 457–467.
[14] G. Acsadi, J. Nemesker, History of Human Life Span and Mortality, AkademiaiKiado, Budapest, 1970.
[15] R.A. Walker, C.O. Lovejoy, Radiographic changes in the clavicle and proximalfemur and their use in the determination of skeletal age at death, Am. J. Phys.Anthropol. 68 (1985) 67–78.
[16] N. Lynnerup, I. Thomsen, B. Frohlich, A non-invasive technique for age at deathdetermination, Med. Sci. Law 30 (1990) 317–320.
[17] E. Pasquier, L. De Saint Martin Pernot, V. Burdin, C. Mounayer, C. Le Rest, D. Colin,et al., Determination of age at death: assessment of an algorithm of age predictionusing numerical three-dimensional CT data from pubic bones, Am. J. Phys.Anthropol. 108 (1999) 261–268.
[18] P. Barrier, F. Dedouit, J. Braga, F. Joffre, D. Rouge, H. Rousseau, et al., Age at deathestimation using multislice computed tomography reconstructions of the poste-rior pelvis, J. Forensic Sci. 54 (2009) 773–778.
[19] S. de Froidmont, S. Grabherr, P. Vaucher, M. De Cesare, C. Egger, C. Papageorgo-poulou, et al., Virtual anthropology: a comparison between the performance ofconventional X-ray and MDCT in investigating the trabecular structure of longbones, Forensic Sci. Int. 225 (2013) 53–59.
[20] A. Wade, A. Nelson, G. Garvin, D.W. Holdsworth, Preliminary radiological assess-ment of age-related change in the trabecular structure of the human os pubis, J.Forensic Sci. 56 (2011) 312–319.
[21] K. Poulsen, J. Simonsen, Computed tomography as routine in connection withmedico-legal autopsies, Forensic Sci. Int. 171 (2007) 190–197.
[22] D.G. Altman, Practical Statistics for Medical Research, Chapman and Hall, London,1991.
[23] J.R. Landis, G.G. Koch, Application of hierarchical kappa-type statistics in assess-ment of majority agreement among multiple observers, Biometrics 33 (1977)363–374.
[24] C. Egger, P. Vaucher, F. Doenz, C. Palmiere, P. Mangin, S. Grabherr, Developmentand validation of a postmortem radiological alteration index: the RA-Index, Int. J.Legal Med. 126 (2012) 559–566.
[25] T.W. Todd, Age changes in the pubic bone. I. The male white pubis, Am. J. Phys.Anthropol. 3 (1920) 285–334.
[26] D.M. Mulhern, E.B. Jones, Test of revised method of age estimation from theauricular surface of the ilium, Am. J. Phys. Anthropol. 126 (2005) 61–65.
[27] S.R. Saunders, C. Fitzgerald, T. Rogers, C. Dudar, H. McKillop, Test of severalmethods of skeletal age estimation using a documented archaeological sample,Can. Soc. Forensic Sci. J. 25 (1992) 97–118.
[28] L. Martrille, D.H. Ubelaker, C. Cattaneo, F. Seguret, M. Tremblay, E. Baccino,Comparison of four skeletal methods for the estimation of age at death on whiteand black adults, J. Forensic Sci. 52 (2007) 302–307.
[29] C.O. Lovejoy, R.S. Meindl, R.P. Mensforth, T.J. Barton, Multifactorial determinationof skeletal age at death: a method and blind tests of its accuracy, Am. J. Phys.Anthropol. 68 (1985) 1–14.
[30] J.L. Boldsen, G.R. Milner, L.W. Konigsberg, J.W. Wood, Transition analysis: a newmethod for estimating age from skeletons, in: R.D. Hoppa, J.W. Vaupel (Eds.),Paleodemography: Age Distributions from Skeletal Samples, Cambridge Univer-sity Press, New York, 2002.
[31] R.F. Castillo, C. Ruiz Mdel, Assessment of age and sex by means of DXA bonedensitometry: application in forensic anthropology, Forensic Sci. Int. 209 (2011)53–58.
[32] L. Zydek, M. Barzdo, E. Meissner, J. Berent, Assessment of bone age based onmorphometric study of the upper end of the humerus, J. Forensic Sci. 56 (2011)1416–1423.
[33] T.D. Ruder, Y. Thali, S.A. Bolliger, S. Somaini-Mathier, M.J. Thali, G.M. Hatch, et al.,Material differentiation in forensic radiology with single-source dual-energycomputed tomography, Forensic Sci. Med. Pathol. 9 (2013) 163–169.