Magnetic resonance imaging of normal and osteoarthritic trabecular bone structure in the human knee
13
AKTHKllIS iy. KHEUMATISM Vol. 41, No. 6, June 1998. pp 963-975 0 1998, American College of Rhcumatolo,g 963 REVIEW MAGNETIC RESONANCE IMAGING OF NORMAL AND OSTEOARTHRITIC CARTILAGE DAMIEN LOEUILLE, PIERRE OLIVIER, DIDIER MAINARD, PIERRE GILLET. PATRICK NETTER, and ALAIN BLUM Cartilage is the first structure affected in many rheumatic diseases, particularly in osteoarthritis (OA). Because of a lack of early specific signs, OA can be recognized with certainty only relatively late in its course. A firm early diagnosis is desirable, however, because the sooner “chondroprotective” treatment is prescribed, the more effective it is likely to be. Since a firm diagnosis requires precise identification of the cartilaginous lesions, an accurate, sensitive, specific, reproducible, and noninvasive method of identifying such lesions is needed. The only imaging technique currently used to diagnose OA is standard radiography, which permits indirect evaluation of articular cartilage degeneration based on joint space narrowing that is seen on plain films. Although this techniquc has been refined, it still gives false-positive and false-negative findings. Bone sclerosis and osteophytes (1) are more specific signs, but they cannot be used as early diagnostic criteria because they occur later in the course of the disease. Thus, radiography, although widely used in long- term evaluation of OA, is of limited value in clinical trials for early detection of OA and assessment of its short-term progression (2). Arthroscopy is the standard of reference for the evaluation of cartilage, accurately depicting swelling and ulcerations of the hyaline carti- lage. However, this technique is invasive and does not show the deepest cartilage or subchondral bone alter- ations. It therefore cannot be used routinely for longi- tudinal evaluation of OA. Magnetic resonance imaging Supported by grants from Projet Hospitalier de Recherche Clinique (9937 PHRC 1994. CHU Nancy). Damien Loeuille, MD. RSc, Pierre Olivier, MD, BSc, Didier Mainard. MD, Picrre Gillet, MD, Patrick Netter. MD, Alain Blum, MD: Universitk Henri Poincare, Nancy, France. Address rcprint rcquests to Patrick Netter, MD. UMR 7561 CNRS-UHP, Nancy 1, Physiopathologie et Pharmacology Articulaires, FlicultC de MCdecine, Avenue de la forst de IIaye, BP 184; 4 505 Vandoeuvre les Nancy, France. Submitted for publication October 17, 1997; accepted in revised form January 8, 1998. (MRI) has been slow to gain acceptance for cartilage evaluation because of its limited spatial resolution and because of the poor contrast between cartilage and adjacent structures. Continual improvement in gradient performance and coil design and the development of more efficient pulse sequences have overcome many of the early limitations of MIU. These improvements make possible high-resolution multiplanar and 3-dimensional (3-D) images with a wide variety of contrast. In this article, we present recent refinements in MRI of carti- lage and offer a key for interpreting the wide range of images that are produced. Technical factors in MRI The pattern of cartilage as seen on MRT depends on spatial resolution and contrast. These factors are related to the choice of sequence and can be modified in various ways by the addition of pulses and contrast agents. In some cases, artifacts can greatly affect the quality of the images of hyaline cartilage. Spatial resolution and signal-to-noise ratio. “Spatial resolution” refers to the smallest size of detail that is visible. “Signal-to-noiseratio” is the ratio between the intensities of the signals from tissue and background. “Contrast” is the difference between the signal intensi- ties of different tissues. The spatial resolution is deter- mined by the thickness of the slice and the size of the smallest element of the image, the pixel. The pixel size, in turn, is determined by the height and width of the field of view divided by the number of lines and columns, respectively, of the matrix that forms the image. For example, the use of a field of view measuring 12 X 12 cm with a matrix of 2.56 X 192 units will give a pixel size of 470 X 62.5 pm’. Spatial resolution improves as slice thickness or pixel s i x decreases. Until now, a slice thickness of less than 3 mm could only be obtained with volume acquisitions (3-D Fourier transform). Spatial resolution and signal-to-noisc ratio are
-
Upload
independent -
Category
Documents
-
view
0 -
download
0
Transcript of Magnetic resonance imaging of normal and osteoarthritic trabecular bone structure in the human knee

AKTHKllIS iy. KHEUMATISM Vol. 41, No. 6, June 1998. pp 963-975 0 1998, American College of Rhcumatolo,g 963
REVIEW
MAGNETIC RESONANCE IMAGING OF NORMAL AND OSTEOARTHRITIC CARTILAGE
DAMIEN LOEUILLE, PIERRE OLIVIER, DIDIER MAINARD, PIERRE GILLET. PATRICK NETTER, and ALAIN BLUM
Cartilage is the first structure affected in many rheumatic diseases, particularly in osteoarthritis (OA). Because of a lack of early specific signs, OA can be recognized with certainty only relatively late in its course. A firm early diagnosis is desirable, however, because the sooner “chondroprotective” treatment is prescribed, the more effective it is likely to be. Since a firm diagnosis requires precise identification of the cartilaginous lesions, an accurate, sensitive, specific, reproducible, and noninvasive method of identifying such lesions is needed. The only imaging technique currently used to diagnose OA is standard radiography, which permits indirect evaluation of articular cartilage degeneration based on joint space narrowing that is seen on plain films. Although this techniquc has been refined, it still gives false-positive and false-negative findings. Bone sclerosis and osteophytes (1) are more specific signs, but they cannot be used as early diagnostic criteria because they occur later in the course of the disease.
Thus, radiography, although widely used in long- term evaluation of OA, is of limited value in clinical trials for early detection of OA and assessment of its short-term progression (2). Arthroscopy is the standard of reference for the evaluation of cartilage, accurately depicting swelling and ulcerations of the hyaline carti- lage. However, this technique is invasive and does not show the deepest cartilage or subchondral bone alter- ations. It therefore cannot be used routinely for longi- tudinal evaluation of OA. Magnetic resonance imaging
Supported by grants from Projet Hospitalier de Recherche Clinique (9937 PHRC 1994. CHU Nancy).
Damien Loeuille, MD. RSc, Pierre Olivier, MD, BSc, Didier Mainard. MD, Picrre Gillet, MD, Patrick Netter. MD, Alain Blum, MD: Universitk Henri Poincare, Nancy, France.
Address rcprint rcquests to Patrick Netter, MD. UMR 7561 CNRS-UHP, Nancy 1, Physiopathologie et Pharmacology Articulaires, FlicultC de MCdecine, Avenue de la forst de IIaye, BP 184; 4 505 Vandoeuvre les Nancy, France.
Submitted for publication October 17, 1997; accepted in revised form January 8, 1998.
(MRI) has been slow to gain acceptance for cartilage evaluation because of its limited spatial resolution and because of the poor contrast between cartilage and adjacent structures. Continual improvement in gradient performance and coil design and the development of more efficient pulse sequences have overcome many of the early limitations of MIU. These improvements make possible high-resolution multiplanar and 3-dimensional (3-D) images with a wide variety of contrast. In this article, we present recent refinements in MRI of carti- lage and offer a key for interpreting the wide range of images that are produced.
Technical factors in MRI
The pattern of cartilage as seen on MRT depends on spatial resolution and contrast. These factors are related to the choice of sequence and can be modified in various ways by the addition of pulses and contrast agents. In some cases, artifacts can greatly affect the quality of the images of hyaline cartilage.
Spatial resolution and signal-to-noise ratio. “Spatial resolution” refers to the smallest size of detail that is visible. “Signal-to-noise ratio” is the ratio between the intensities of the signals from tissue and background. “Contrast” is the difference between the signal intensi- ties of different tissues. The spatial resolution is deter- mined by the thickness of the slice and the size of the smallest element of the image, the pixel. The pixel size, in turn, is determined by the height and width of the field of view divided by the number of lines and columns, respectively, of the matrix that forms the image. For example, the use of a field of view measuring 12 X 12 cm with a matrix of 2.56 X 192 units will give a pixel size of 470 X 62.5 pm’. Spatial resolution improves as slice thickness or pixel s i x decreases. Until now, a slice thickness of less than 3 mm could only be obtained with volume acquisitions (3-D Fourier transform).
Spatial resolution and signal-to-noisc ratio are

964 LOEUILLE ET AL
inversely proportional: improving one degrades the other. The best compromise depends on the apparatus and the acquisition sequences. The equipment helps to determine the quality of the image, since a high mag- netic field strength (1.5T) improves the signal-to-noise ratio (which is about 3 times as high at 1.5T than at 0.5T). The quality of the coil receiving the signal also affects the signal-to-noise ratio, and therefore affects the spatial resolution. These technical factors explain why in clinical studies of the knee, the best results are obtained on the femoropatellar joint, which can be examined with a small field of view using a surface coil, whereas a larger field of view must be used for the other compartments of the knee.
MR sequences. Tl-weighted spin-echo (SE) se- quences. In this sequence, the contrast between tissues depends on the differences between their respective T1 relaxation times. The T1 relaxation time depends on the interaction between the spins of the excited nuclei and the surrounding molecular lattice. This type of sequence is characterized by a good signal-to-noise ratio and good spatial resolution, but poor contrast between cartilage and joint fluid (Figure 1A).
Proton-density and T2-weighted spin-echo (SE) sequences. The T2 relaxation time is related to interac- tions between neighboring nuclei which cause their progressive loss of coherence, and thus of magnetization of the excited region. Proton density refers to the concentration of protons in the tissue. Proton-density and T2-weighted images can be obtained either simul- taneously or separately. These sequences are character- ized by a good contrast between the cartilage (relatively hypointense) and joint fluid (hyperintense). A new SE technique known as filst spin-echo (FSE) provides both a good signal-to-noise ratio and good spatial resolution. Moreover, superimposition of a magnetization transfer effect (see below) intrinsic to the above sequence im- proves the delineation of the cartilage surface (Figure 1B). Finally, this sequence allows volume acquisition with very thin slices, though some blurring may alter the visibility of the cartilage interfaces (Figure 1C).
Gradient-echo (GRE) sequences. GRE sequences offer a wide choice of contrasts and allow volume (3-D) acquisition (Figures 1E and F). Volume acquisition makes it possible to acquire very thin slices, thus improv- ing the spatial resolution and pcrmitting images to be reformatted into multiple plancs. The signal-to-noise ratio for a given slice thickness is better with GRE than with SE sequences. FISP (fast imaging with steady-state precession) or GRASS (gradient-recalled acquisition in the steady state) sequences used with small flip angles
produce T2 ’-weighted images, in which cartilage is hyperintense and the joint fluid even more so (T2* is the T2 relaxation time with the added effect of the inhomo- geneity of the field strength). Spoiled GRASS (SPGR) or fast low-angle shot (FLASH) sequences provide T1-weighted images in which the intraarticular fluid is less intense than the cartilage (3) (Figures 1D-F).
Tissue contrast, which depends upon the type of sequence, can also be modified in various ways by the addition of pulses or of contrast agents. These modifi- cations are essential to improving both the quality and the accuracy of the above-mentioned sequences.
Fat suppression (FS). FS is compatible with all sequences. This improves the contrast between cartilage and fluid in T1-weighted sequences (4-7). When FS is combined with 3-D SPGR sequences (8,9), cartilage is the only bright articular structure. Other sequences, such as inversion-recovery turbo spin-echo sequences or gradient-echo out-of-phase images, can be used to sup- press fat signal, but they are not applied routinely in cartilage imaging in clinical practice.
Injecting a paramagnetic contra y t agent (gadolini- um) into the joint. Injection of a paramagnetic contrast agent into the joint (10) combines the advantages of T1 -weighted sequences with the excellent contrast re- sulting from the hyperintensity of intraarticular fluid. This technique, termed “MR arthrography” (ll), has been advocated for detecting early chondral lesions (12). Though many studies have attested to the excellent results of the technique, it is not routinely used because of its (minimally) invasive nature and because the intra- articular injection of gadolinium is not currently ap- proved.
Intravenous injection of a paramagnetic contrast agent (gadolinium). Intravenous injection of gadolinium can also enhance the intraarticular fluid signal. This enhancement, which can be by as much as 26096, improves the visibility of the cartilage surface (13,14). Gadolinium is also used to improve visualization of synovial inflammation (15,16).
Magnetization transfer (MT). The MT approach is based on a saturation-transfer approach, where satura- tion is transferred from the macromolecular proton pool to the water proton pool, when the two pools are coupled by means of dipolar interactions or chemical exchange. Applying MT results in a signal decrease of the free water protons magnetically or chemically cou- pled to the protons bound to macromolecules (17J8). The addition of MT to T2”-weighted or T2-weighted images markedly lessens the intensity of articular carti- lage and synovium, but affects the intensity of the fluid
MRI OF NORMAL AND OA CARTILAGE
Figure 1 . Comparison of A, a T1-wcighted fast spin-echo (FSE) axial image, B, a T2-weighted FSE axial image with fat suppression (FS), C, a 3-dimensional (3-D) T2-weighted FSE axial image with FS, D, a 2-D fast multiplanar spoiled grass (spoiled gradient-recalled acquisition in the steady state) (2-D FMP-SPGK)) axial image with FS, E, a 3-D SPGR axial image with FS, and F, a 3-D fast SPGR axial image with FS o f the femoropatellar joint from a 3-month-old calf (pixel size 310 X 410 pm’) on a clinical imager (1 .ST). A 1 mm-deep puncture was made at the cartilage surface. Note the plurilaminar aspect of the cartilage on the FSE and 3-D FSE images.
965

966 LOEUILLE ET AL
signal much less, thereby improving contrast at the cartilage-fluid interface.
Pitfalls and artifacts in MRI. Interpretation of cartilage lesions must take into account 5 major artifacts: the partial-volume effect, chemical shift, the “magic- angle” effect, truncation, and the susceptibility effect.
The partial-volume effect. The partial-volume ef- fect results from the averaging of the signal intensities of different structures within the smallest unit of volume imaged, the so-called voxel. Characteristics of objects smaller than a voxel are not seen. This effect can give a false appearance of lesions, hide small cartilaginous changes, or lead to errors in estimates of cartilage thickness. This artifact is seen especially when the cartilage is not examined in slices perpendicular to its surface. Thus, the partial-volume effect explains why the axial plane is most suitable for analyzing patellar carti- lage, but sagittal or coronal images depict abnormalities of the femorotibial joint cartilage more accurately. The partial-volume effect is directly related to the thickness of the slice, and can therefore be minimized with volume acquisitions or with FSE T2-weighted images which allow thin slices to be obtained.
Chemical shift. This refers to the difference in resonance of protons in fat and water as a result of their micromagnetic environment. Protons in water resonate at a slightly higher frequency than the corresponding protons in fat. This artifact may cause overestimation of the thickness of the cartilage and underestimation of the subchondral bone on one side of the joint, and the converse on the other side of the joint. The best method for avoiding this artifact is the FS technique.
The magic-angle phenomenon. The magic-angle phenomenon increases the cartilage signal when its orientation is about 55” with respect to the axis of the main magnetic field (19). This effect is related to variations in the orientation of the collagen fibers within the cartilage layers. This artifact is especially visible with proton-density-weighted SE images and GRE se- quences and is less pronounced with TZweighted SE sequences.
Truncation artifacts. Truncation artifacts appear as a series of ripples propagating away from any sharp discontinuity in signal intensity. Truncation interfer- ences, which are due to the presence of 2 interfaces of sharp discontinuity, alter the appearance of the ripples. The phenomenon is summed to a maximum when the distance between the 2 interfaces is 4 pixels. The ripples are most likely to be evident in the direction of lowest resolution (larger pixels). The number of truncation
Figure 2. Demonstration of a plurilaminar aspect of the cartilage due to the truncation artifact on axial slices obtained at different levels (A and B) of the patella of a normal volunteer. With identical resolution (470 X 940 pnz in-plane resolution). the number of layerb depends on the cartilage thickness. When the cartilage thickness increases, the number of identified layers varies from 4 to 6.
lines increases with decreasing pixel size or with increas- ing cartilage thickness (20) (Figure 2).
Susceptibility arlifact. The susceptibility artifact is due to differences in magnetic susceptibilities between two tissues. These different susceptibilities can produce field nonuniformity at their interface, leading to subtle image distortions and altering the shape and location of the resolved voxels.
MRI patterns of normal cartilage
Articular cartilage is a remarkable connective tissue that endows joints with both the friction and the lubrication that make normal motion possible. It also absorbs mechanical shocks and distributes the load over underlying bone. The hyaline articular cartilage consists of chondrocytes within an extracellular matrix that is

MRI OF NORMAL AND OA CARTILAGE 967
composed mainly of water, collagen, and proteoglycans (21). This matrix contains pericellular, territorial, and interterritorial regions, as defined by their proximity to the chondrocytes. These 3 regions differ in proteoglycan concentration and in the content, organization, and diameter of their collagen fibers. Water is the most abundant component of articular cartilage, with concen- trations ranging from 80% in the superficial zone (22) to 65% in the deepest zone.
The proteoglycans, which are entrapped within the collagen network, are molecules with high concen- trations of (negativcly chargcd) anions, which interact with the mobile (positively charged) cations in thc tissue water. Most of the water is thus located in thc spaces between proteoglycans and provides a swelling pressure that is restrained by the stiffness and tensile forces of the collagen fibers. Because these spaces (“pores”) are very small, the water encounters resistance in passing through them, giving cartilage a good deal of resistance to joint loading. With aging, the water and functional aggregates decreases because the fixed charge density becomes lower, thereby reducing the water-binding capacity of the proteoglycans (23). This phenomenon leads to thinning and stiffening of the
Figure 3. T2-weighted fast spin-echo axial image with fat suppression of the patella of a nornial volunteer, showing a laminar appearance of the hyaline cartilage, with a thin superficial hypointense layer (curved arrow), an intermediate hyperintense layer with a deep dark striation perpendicular to the subchondral line, and a hypointense deep layer correspondiiig to the dccp calcified zone of the cartilage and the subchondral bone.
- - articular cartilage (24). An increase in collagen crosslinks and interactions also contributes to cartilage stiffness. The chondrocytec’ metabolic response to bio- mechanical stimuli diminishes (25).
The articular cartilage is composed of 4 histologic zones or layers. The most superficial (zone I. or the tangential zone) has thin collagen fibers whose long axes are parallel to the cartilage surface. This surface layer is fundamental to the fluid pressurization mechanism of load bearing by articular cartilage (26). The middle zone (zone 11, or thc transitional zone) has thicker, more randomly oriented collagen fibers. The zone below this (zone 111, or the radial zone) contains the lowest water content and the highest proteoglycaii concentration. Here, the collagen fibers are pcrpendicular to the sur- face of the cartilagc. The deepest layer of cartilage (zone TV, or thc calcified layer), constituting -6-896 of the total thickness, is calcified and serves to anchor the extcnsivc network of collagen fibrils (27,28). The junc- tion between the noncalcificd and calcified articular cartilage is visible as a line, or “tidemark.”
MR pattern of normal cartilage. MRI allows direct evaluation of the cartilage from its surface to its deepest zone. The great variety of methods (typcs of MR units or sequences, diagnostic criteria used, popu- lations studied, and use of cadavers or animals) accounts for the diversity of the published results. The appear-
ance of cartilage varieq greatly according to the pulse sequences. It may appear as I, 2,3, or even more layers (Figure 3). In conventional T1- and T2-weighted SE images and in some GRE sequences, cartilage appears as a single, homogeneous layer. On T1-weighted images, the articular cartilage shows a moderate signal intensity, whereas synovial fluid, synovial tissue, and subchondral bone show a low-intensity signal. Due to the prcscnce of fat in honc marrow, thc trabecular bone prcscnts a high signal intensity. On T2-weighted images, the cartilage signal is of low intensity, whereas synovial fluid and synovial tissue are of high intensity.
On these 2 sequences, the cartilage-bone inter- face is visible as a dark line corresponding to the subchondral bone and the calcified zone of the cartilage. IIowever, distingukhing the cartilage-bone interface can be difficult with T2-weighted SE irnageq. As T2- weighting increases, the signal intensity of normal carti- lage decreases, improving the contrast at the fluid- cartilage interface but obscuring the cartilage-bone interface. On GRE sequences, cartilage may appear bright or dark with a high contrast to fluid, while subchondral and trabecular bone, owing to the suscep- tibility effect, remains in low or intermediate signal.
Many studies have demonstrated a plurilaminar

968 LOEUILLE ET AL
appearance of the normal hyaline cartilage. The number of layers and their corresponding signal depend on the specific pulse sequence used. Using strongly T1- weighted (inversion recovery) and T2-weighted images, Lehner et a1 (29) demonstrated a bilaminar appearance of the cartilage. The superficial lamina was in low signal on T1-weighted images and in high signal on T2- weighted images, and the signal of the deeper lamina in the two instances was the reverse. Histologic correlation showed that the superficial lamina corresponded to the tangential and transitional zones of the cartilage, and the deep lamina corresponded to the radial and calcified layers of cartilage.
Mod1 et al (30) described 3 layers in articular cartilage using high-resolution T1- and T2-weighted SE images. The thin superficial lamina and the decpest lamina had a low signal intensity on both T1- and T2-weighted images. The intermediate lamina had a high or a moderate signal intensity on T1- and T2- weighted images, respectively. Histologic analysis indi- cated that the superficial lamina corresponded in loca- tion but not precisely in thickness to the tangential layer. The intermediate lamina corresponded to thc transi- tional layer, and the deepest lamina corresponded to the deep radial and calcified zones of cartilage and adjacent subchondral bone.
Using a fat-suppressed 3-D SPGR sequence, Recht et a1 (8) confirmed a trilaminar appearance of the cartilage, although the signal patterns were different from those previously described: the superficial and deep laminae had a high signal intensity, whereas the intermediate lamina had a low signal intensity. The superficial lamina represents the tangential and transi- tional layers and the most superficial part of the radial laycr. The deep lamina corresponds to the deepest part of the radial layer, and the intermediate lamina is thought to be a part of the radial layer. A fourth layer of low signal intensity therefore corresponds to a zone of calcified cartilage and subchondral bone.
In studies of normal bovine patellar specimens, Rubenstein et a1 (31) described a hyperintense superfi- cial lamina, a hypointense middle lamina, and an inter- mediate deep lamina on T1-weighted, proton-density, and T2-weighted SE images. A distinct, hypointense fourth lamina, which subsequently proved to represent the calcified cartilage and subchondral bone, separated the 3 cartilage laminae from the hyperintense signal of the bone marrow. Finally, using high-resolution MRI, Waldschmidt et al (32) demonstrated a superficial hy- pointense cartilage layer and a deep layer consisting of
dark striation perpendicular to the subchondral surface (Figure 3).
Why the appearance of normal cartilage varies with different sequences is unclear. The layers observed on MR images, though probably reflecting histologic variations in the cartilage, do not correspond exactly to the histologic layers. The thicknesses of the different MR layers vary with the spatial resolution and the sequence parameters. In Cole and colleagues’ study, the thickness of the superficial layer for human patellar cartilage was -250 pm (33). Therefore, the depiction of this lamina requires high spatial resolution and minimal partial volume averaging, which could not be obtained in early MR evaluation of the cartilage (34). Besides, the demonstration of this layer requires a good contrast with the synovial fluid, accounting for the fact that this layer is not visible on 3-D SPGR or T1-weighted images. This limitation can be partially overcome by gadolinium injection.
Erickson et a1 (35) recently showed that the trilaminar appearance of hyaline cartilage on MR im- ages obtained with an FS 3-D SPGR sequence is mainly due to a truncation artifact rather than to histologic zonal anatomy. The number of truncation lines increases with decreasing pixel size. Moreover, for a given spatial resolution, the appearance of the “lamina” varies with the thickness of the cartilage (see the Truncation Arti- facts section above and Figure 2). Nevertheless, the absence of modifications of cartilage pattern with matrix size using FSE T2 sequences suggests that the plurilami- nar pattern cannot be attributed to the truncation arti- fact alone (Erickson SJ: personal communication). Le- hner thought that the modification of signal intensity is due to the variation of water content, which ranges from 80% to 65% (surface to deep zone). However, the gradual variation of water content does not correlate with the sharp discontinuity of signal intensity of the different cartilage layers. Paul et a1 (36) proposed that the signal intensity of cartilage was primarily determined by proteoglycan concentration. Those investigators based their hypothesis on a comparison of plots of MRI signal intensity across the thickness of the cartilage from the knees of normal subjects with published values of proteoglycan concentration measured as a function of cartilage depth. However, the deplction of proteoglycans in the rat hyaline cartilage does not modify this trilam- inar pattern in proton-density SE images (37).
Rubenstein et a1 (31) argued that the appearance of the cartilage depends greatly on the orientation of the collagen fibrils. They observed that the trilaminar aspect is most apparent along the portions of the articular

MRT OF NORMAL AND OA CARTILAGE 969
surface aligncd at 0" or 90" with respect to the axis of the main magnetic field, and tend to disappear at a 55" angle, making the cartilage look homogeneous (the "magic angle" phenomenon). Rubenstein et al. and recently Xia et a1 (38), stated that the disappearance of the trilaminar pattern at 55" is due to the minimal dipolar coupling between the free water molecules and the water molecules bound to the collagen fibrils.
All these data suggest that the MR pattern of the cartilage is probably due to a combination of different factors. In clinical practicc, TZ-weighted FSE sequences with FS, which are available on most MRI machines, represent the most efficient sequence for routinely dcpict- ing the laminar appearance of articular cartilage (Figure IB). Although the MR layers do not prccisely reflect the different histologic layers, the MR appearance is un- doubtedly affected by the various structures of the cartilage. The disappearance of this pattern could also suggest histologic and structural modifications of the cartilage over time, reflecting an aging process. There- fore, it is not surprising that MRI of cartilage reveals a great variability in the intensity and regularity of some of the layers, which can even be completely missing (39).
Thickness of normal articular cartilage. Mea- surement of cartilage thickness presupposes clear recog- nition of both bonc-cartilage and fluid-cartilage inter- faces, a high spatial resolution, and a limitation of some artifacts (40). Moreover, a longitudinal evaluation of the cartilage thickness requires the recognition of the pre- cise topography of each portion of the cartilage.
The appearance of the bone-cartilage and fluid- cartilage interfaces varies with the type of sequence. The superficial layer or the deep layer might be hardly distinguishable. Therefore, the measurements of the cartilage thickness reflect the visible cartilagc, not the whole cartilage. In fact, the calcified zone is indistin- guishable from the subchondral bone, and with optimal contrast, the cartilage-bone interface at best corre- sponds to the tidemark region. With conventional T2- weighted SE images, as TZ-weighting increases, the contrast increases at the water-cartilage interface but decreases at the bone-cartilage interface, resulting in an apparent reduction of the cartilage thickness. Magneti- zation transfer imaging also improves the delineation of the water-cartilage interface but obscures the bone- cartilage interface. On the other hand, T1-weighted SE images and SPGR sequences clearly demonstrate the bone-cartilage interface, but the superficial layer is not visible. No sequence used thus far clearly depicts both interfaces. However, the cartilage can be more precisely identified by injecting an intraarticular contrast agent or
by acquiring 2 different sequences, one delineating the cartilage-bone interface and the other the water- cartilage interface (41). By matching the images from the 2 sets and automatically extracting the cartilage, this method gives more accurate measurements of thickness. In routine evaluation, since the superficial layer repre- sents <S% of the total cartilage thickness, FS 3-D SPGR sequences offer the best compromise for determining articular cartilage thickness (Figures 1E and F).
Moreover, high spatial resolution is necessary for accurate cartilage measurements. For a given spatial resolution, the error of measurement incrcases when the articular cartilage thickness decreases. Thcrcfore, it is not surprising that the accuracy of articular cartilage thickness measurements is greater in the fcmoropatellar joint (mean thickness 4 mm) than in the shoulder (mean thickness 1.23 nim) (42) or the hip (mean thickness 1.3 mm) (43). Most of the studies performed on the knee show that the mean crror of cartilage mcasurcment is <12%. In contrast, Hodler et a1 (42) found a difference of 35% betwccn the measurements made on MRI and those made on anatomic sections of hunicral head. Using a dedicated coil and a very high spatial resolution for the evaluation of the interphalangeal cartilage, Rob- son et a1 (44) found a measurement error of <lo%.
Actually, in clinical studies, higher gradient per- formances and efficient sequences allow a significant improvement of the spatial resolution, with a pixel size of 270 X 540 pm2. These improvements should lead to better precision and reproducibility in cartilage thick- ness measurements. Finally, a longitudinal cvaluation of articular cartilage thickness requires identical experi- mental conditions and especially, identical sequences and spatial resolution.
Three-dimensional display and quantification of normal articular cartilage. The absence of specific landmarks could limit the reproducibility of cartilage thickness measurements. Thus, 3-D quantification may be a more robust and reproducible method for evaluat- ing the cartilage over time. Because 3-D images and volume calculations are obtained by matching and inter- polating the data of the original acquisition slices, their quality depends mainly on the slice thinness, and there- fore are usually obtained from volume acquisition (3-D acquisition) with GRE sequences. Another advantage of 3-D acquisition is that it allows images to be reformatted in the plane best suited for evaluation of the individual structure.
Volume determination, like measurements of cartilage thickness, requires high contrast at interfaces (44-46). Accurate 3-D analysis and precise quantifica-

970 LOEUILLE ET AL
Figure 4. Early osteoarthritis of the femorotibial joint of a 49-year-old patient. A, Antero- posterior view of the knee, showing mild osteophytosis of the medial femorotibial joint and mild joint space narrowing. B, T2-weighted fast spin-echo coronal image with fat suppres- sion, showing a type 3 chondral lesion (curved arrow). C, Arthroscopy confirmed a type 3 ulceration of the medial femoral condyle.
tion of the volume of articular structures in the knee can be obtained with high intraobserver reproducibility (co- efficient of variation range 3.6-6.4%) and interobserver agreement (44). In Piplany and colleagues’ study, the percentage of error of the calculated volumes com- pared with the surgically removed articular cartilage was 6.53% (47).
This technique overcomes the limitation imposed on measurements of cartilage thickness by the lack of precise landmarks, but because of variations of cartilage thickness from one region to another, cartilage volume measurements do not reflect the precise cartilage mod- ifications. To some extent, if the cartilage is thinner in one region and thicker in another, the cartilage volume might not even be modified. However, by subdividing 3-D reconstructions of the articular cartilage into several
smaller regions (e.g., a grid of 10 voxels), the cartilage volume can be evaluated at specific sites, such as the weight-bearing surfaces of the femoral condyles (48). Therefore, this method allows an evaluation of cartilage modifications in specific locations over time.
Anatomic alterations of articular cartilage accessible to imaging
In the early stages of cartilage degeneration, matrix is not depleted, since its turnover increases. Later, a net depletion of matrix aggrecans induces imbibition of water (49). The alterations observed in the early stages of OA include important changes in the subchondral bone, stressing the close relationship be- tween articular cartilage and this tissue. Later, failure of

MRI OF NORMAL AND OA CARTILAGE 971
the repair process results in mechanical damage of the extracellular matrix through destruction of the fibrous collagen network. In advanced stages, fragmentation progresses, with small ulcerations extending first to the transitional layer, and then to the radial layer (50). Irregular fissures, ulcerations, and broad erosions are well depicted with arthroscopy. These alterations can be classified into 5 stages: stage 0 = normal cartilage; stage 1 = cartilage swelling; stage 2 = superficial fragmen- tation and fissuring; stage 3 = deep fragmentation and fissuring; and stage 4 = erosion of cartilage down to the bone (51). Later still, tears in the meniscus, large defects of the cartilage, exposure of subchondral bone, and the formation of cysts and osteophytes can be detccted (52).
Morphologic cartilage alterations. Morphologic changes of the cartilage in OA that are accessible to MRT include signal modification of the cartilage, ero- sions, and ulcerations, as well as focal thinning or thickening of the cartilage (Figures 4 and 5). Focal defects are seen as surface irregularity or circumscribed thinning. The severity of OA changes on MRI is graded on a 5-point scale similar to that used for arthroscopy, in order to facilitate correlation between the 2 methods: grade 0 = normal; grade 1 = abnormal intrachondral signal with a normal chondral surface (corresponding to the swelling observed on arthroscopy); grade 2 = mild surface irregularity or focal loss of <SO% of the cartilage thickness; grade 3 = severe surface irregularities with focal loss of >50% but <loo% of the cartilage thick- ness; and grade 4 = complete loss of articular cartilage with exposure of subchondral bone (7).
The depiction of chondral ulcerations depends mainly on their size and on the conditions of the examination. FS 3-D SPGR (or FLASH) and T2- weighted FSE sequences with FS seem to be the most useful sequences for depicting these cartilage alter- ations. Recht et a1 (8) found a sensitivity and a specific- ity of 96% and 95%, respectively, of FS 3-D FLASH sequences in the detection of abnormal articular carti- lage of the patellar joint in 10 cadaver knees. Their experimental study was performed under optimal con- ditions: lack of motion artifact, high surface cartilage contrast due to the injection of saline solution, and predominance of severe cartilage alterations. Broderick et a1 (7) evaluated T2-weighted FSE images with fat suppression in 13 knees of patients with OA. The pixel size was 500 X 500 pm2. MRI findings of 78 joint surfaces (medial and lateral condyles, medial and lateral tibia1 plateaus, femoral subpatella and patella) were correlated with arthroscopic findings. The following results were obtained by MRI: grade 1 lesions overesti-
mated in 40% of cases and underestimated in 60%; grade 2 lesions correctly graded in 25%, underestimated in 50576, and overestimated in 25%; grade 3 lesions correct in 6%, underestimated in 2476, and overesti- mated in 70%; and grade 4 lesions correct in 70% and underestimated in 30%. This study demonstrated the accuracy of MRI in depicting severe focal chondral alterations as well as the inability of MRI to precisely quantify the alterations.
Signal modifications in OA cartilage. Signal ab- normalities of the cartilage are among the earliest signs of cartilage alterations, since they reflect changes in structure and water content. The signal abnormalities are mostly visible on T2-weighted im- ages and are mostly associated with changes in the cartilage T2 relaxation time. Signal abnormalities may be visible as eithcr a focal increase or a focal decrease in signal intensity.
A focal increase may be superficial or transmural, but may also appear as a deep, linear zone. In a spontaneous model of OA in rhesus monkeys, MR quantitative analysis of these regions demonstrated longer Tl and 1’2 relaxation times compared with nor- mal cartilage. The superficial and transmural modifica- tions were due to cartilaginous edema related to rupture of collagen fibers and loss of proteoglycans. Gahunia et a1 (53) showed that these alterations are also associated with the presence of hypertrophic and proliferating chondrocytes. Modification of the deepest zone of the cartilage may also be present as a sign of OA. In this case, signal alterations reflect basal delamination of the cartilage at the calcified layer. This abnormality is not specific to OA; it can be seen in young patients after trauma.
A focal decrease in signal intensity on T2- weighted images as well as on FLASH sequences is related to condensed collagen and decreased cellularity (54). In these regions, T1 and T2 relaxation times are shorter lhan those of the natural cartilage.
Thickness and volume quantifications. A global assessment of cartilagc alterations can be obtained with cartilage thickncss and volume measurement. As stated earlier, longitudinal evaluation of the cartilage requires optimal spatial resolution and a reproducible methodol- ogy. Thc 3-D-reconstructed images derived from thin- slice MRI could be useful as an additional MRI tool for monitoring changes in cartilage volume over time and for determining the distribution and severity of cartilage abnormalities in OA patients. An alternative 3-D ap- proach is to determine the volume of the cartilage lesions. Using an FS 3-D SPGR sequence, Lavid et al
972 LOEUILLE ET AL
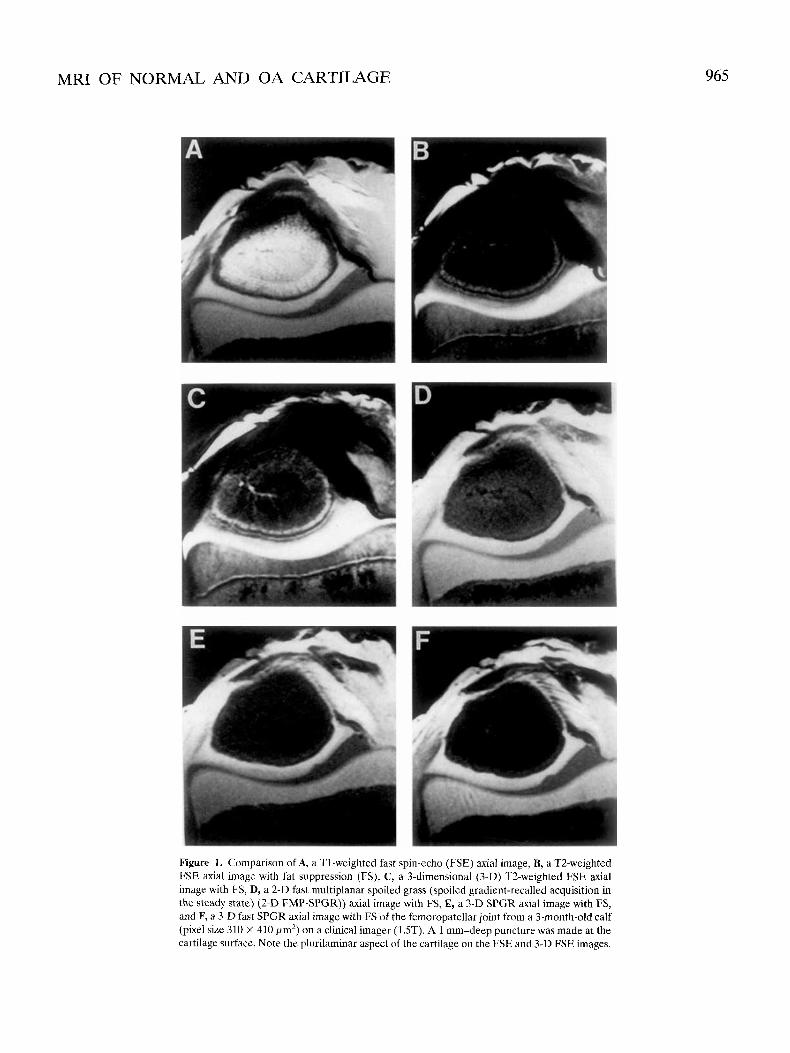
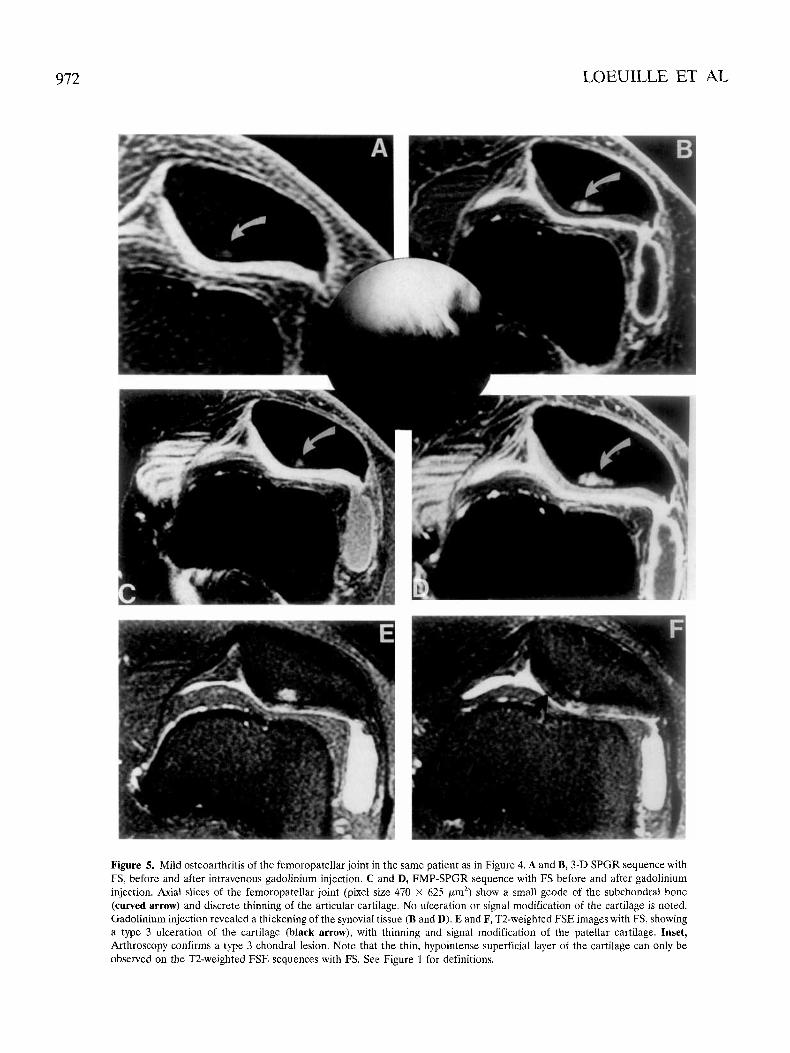
Figure 5. Mild osteoarthriiis of the femoropatellar joint in the same patient as in Figure 4. A and B, 3-D SPGR sequence with FS, before and after intravenous gadolinium injection. C and D, FMP-SPGR sequence with FS hefore and after gadolinium injection. Axial slices of the femoropatellar ,joint (pixel size 470 X 625 pm2) show a small geode of the subchondral bone (curved arrow) and discrete thinning of the articular cartilage. No ulceration or signal modification of the cartilage is noted. Gadolinium injection revealed a thickening of the synovial tissue (B and D). E and F, T2-weighted FSE images with FS, showing a type 3 ulceration of the cartilage (black arrow), with thinning and signal modification of the patellar cartilage. Inset, Arthroscopy confirms a type 3 chondral lesion. Note that the thin, hypointense superficial layer of the cartilage can only be observed on the T2-weighted FSE sequences with FS. See Figure 1 for definitions.

MRI OF NORMAL AND OA CARTILAGE 973
(55) determined the length, width, and depth of grade 2 and grade 3 cartilage lesions, with an average percentage of error of only 8-12%. Cartilage volume can be evalu- ated at specific sites, such as the weight-bearing surfaces of the femoral condyles (48). Therefore, these methods allow a quantitative evaluation of cartilage modifications in specific locations.
Associated morphologic changes. MRI can very accurately depict sclerosis and fracture of the subchon- dral bone, small geodes and large cysts, bone marrow edema, osteophytes, synovial inflammation, joint effu- sion, and meniscal degeneration (56).
Narrowing of the joint space. Joint space narrow- ing reflects thinning of the cartilage. When sequences providing high bone-cartilage contrasts are used, MRT allows measurements of the joint space between oppos- ing structures, thus avoiding the limitation of superim- posed structures on standard radiography. However, these measurements are of limited value in detecting joint space narrowing in the knee, because MRI cannot be carried out with thc knecs in a weight-bearing position.
Sclerosis. Sclerosis appears as a wide, subchon- dral hypointense layer in weight-bearing areas in all sequences and can look thicker on T2*-weighted GRE images due to susceptibility effects. Some authors have argued that alterations in the subchondral bone seem to be related to the severity of OA and precede cartilage alterations (57). In studies of a model of spontaneous OA in guinea pigs, Watson et a1 (58) showed that the subchondral bone plates of the tibia and femur increased in thickness over time. We obtained similar findings in iodoacetate-induced OA in rat knees (37). The irregular appearance of the subchondral bone was predominant under zones of eroded cartilage and was confirmed by histologic evaluation of tissue Yections. Subchondral bone sclerosis can induce biomechanical alterations of the bones and provoke the formation of subchondral geodes.
Geodes. Geodes are usually due to pulsation of synovial fluid through a bone defect or to hyperpressure. They appear very early in zones free of overlying carti- lage, such as the tibial plateau near the tibial eminences (58). Such centrally located geodes, which may lead to large synovial cysts, are not depicted on plain films in their early stages. MRI, however, depicts them early, because it suppresse5 the superimposed bony structures. In weight-bearing areas, gcodeb may occur with or without fractures of the subchondral bone. These alter- ations of the trabecular pattern are the consequence of modification of the dynamic loading characteristics of both the overlying subchondral plate and the articular
cartilage. The signal intensity of these lesions is low on T1 -weighted images. On T2-weighted images, the signal intensity is high and increases with time as the lesions form the foci of extensive pseudocysts (Figure 5).
Bone marrow edema. Bone marrow edema in the subchondral bone is neither a specific nor a sensitive sign of OA, but it is a reliable sign of bone alterations. It appears as a region of low signal intensity on T1- weighted images and of high signal intensity on T2- weighted images. T1-weighted SE images and fat- suppressed T2-weighted FSE images show such lesions very sensitively.
Osteophytes. Due to its multiplanar capability and the absence of bone superimposition, MRI depicts os- teophytes clearly. Moreover, this technique reveals os- teophytes before their trabecular bone-like appearance occurs and permits evaluation of their progression over time (58). We have developed an experimental model of rat knee OA in which “chondrophytic” remodeling causing outward displacement of the patella is not visible on standard radiography but is clearly seen with MRI (37). In guinea pigs, the development of tibial chondro- phytes begins with protrusion of the cartilage on the medial tibial plateau and leads to displacement of the collateral ligament (58). The chondrophytes gradually take on the appearance of a well-defined osteophyte with a trabecular bone-like appearance in the center.
Synovial injlummatiun. Synovial inflammation is a secondary event, occurring as a consequence of the release and phagocytosis of cartilage breakdown prod- ucts in the joint. MRI offers the opportunity to define the extent, location, and thickness of synovial membrane involvement early during OA. Fernandez-Madrid et a1 (56) noted anatomic abnormalities compatible with syno- vial thickening in 73% of OA patients but in none of the normal reference group. Classically, the synovial thick- ening typically appeared in or near the intercondylar region of the knee, in the infrapatcllar fat pad, or in the posterior joint margin. In OA, synovial proliferation is well depicted on T2-weighted images, appearing as a thin layer of high signal intensity, although less intense than the joint fluid. This synovial proliferation is more regular and thinner than that seen in rheumatoid arthri- tis. This tissue is also well demonstrated on T1 -weighted SE images or SPGR sequences after intravenous gado- linium injection. Images obtained immediately after intravenous injection demonstrate intense enhancement of the synovial tissue (Figure 5) .
Meniscd degeneration. MRl showed a high prev- alence of meniscal degeneration in OA (2,59), which suggests a strong relationship between meniscal abnor- malities and degenerative joint disease. Degeneration is

974 LOEUILLE ET AL
seen more frequently in the medial than in the lateral meniscus. Finally, subluxation of the meniscus is fre- quent in OA and seems to be related to the severity of the disease.
Conclusion
The normal articular cartilage is a complex 3-dimensional structurc composed of cells and an extra- cellular matrix formed of collagen fibers, proteoglycans, and water. Standard radiography has been used for many years in the diagnostic imaging of cartilage disease, especially OA. Because of the lack of early specific signs, an accurate, noninvasive method is still needed for longitudinal studies. MRI can demonstrate a plurilami- nar appearance of the hyaline cartilage. This appear- ance, though not perfectly understood, probably reflects the compositional variation of the cartilage through its depth. MRT can detect erosions and ulcerations of the cartilage before the joint space narrows, although the most subtle abnormalities of the cartilage surface cannot be detected accurately. MRI can also highlight changes in the signal from the cartilage substance, which are thought to reflect structural alterations and which are some of the earliest signs of OA. MRI allows quantita- tive evaluation of the cartilage (thickness, volume, and relaxation times). In addition. this technique clearly demonstrates the abnormalities associated with OA (subchondral bone sclerosis, edema, geodes, osteophyto- sis, meniscal lesions, joint effusion, and synovial inflam- mation).
This technique could be used not only to probe the early structural and compositional changes of carti- lage, but also to study the interactions between an altered articular cartilage and the osseous, synovial, or meniscal tissues. To date, no work has been published using this tool as a probe to evaluate the efficiency of chondroprotective drug5 in experimental or clinical stud- ies of OA. However, the accuracy of the most recent MRI refinements (gradients, coils, sequences) will allow, in the very near future, new applications of this tech- nique as a tool for the detection and followup of the progression of OA (60) as well as the influence of cartilage-protective agcnts.
ACKNOWLEDGMENTS
Thanks are due to Prof. A. Gaucher for his thoughtful review of the manuscript, Ms M. Koufany and Ms S. Etienne for technical assistance, and Ms S. Miller for English editing of thc manuscript.
REFERENCES 1. Kindynis PK, Haller J. Kang HS. Kesnick D, Sartoris DJ, Trudell
D, et al. Osteophytosls of the knee: anatomic, radiologic and pathologic investigations. Radiology 1990;147:841-6.
2. Chan WP, Lang P, Stevens MP, Sack K, Majumdar S, Stoller DW, et al. Osteoarthritis of the knee, comparison of radiography, CT and MR imaging to assess extent and severity. Am J Roentgenol 1991;157:799-806.
3. Yao L, Sinha S, Seeger LL. MRI of joints: analytic optimization of GRE techniques at 1.5T. Am J Roentgenol 1992;158:339-45.
4. Peterfy CG, Majumdar S, Lang P, van Digke, Sack K, Genant HK. MR imaging of the arthritic knee: improved discrimination of cartilage, synovium and effusion with pulsed saturation transfer and fat suppressed T I weighted sequences. Radiology 1994;191:
5. Chandnani VP, Ho C, Chu P, Trudell D, Resnick D. Knee hyaline cartilage evaluated with MR imaging: a cadaveric study involving multiple imaging sequcnces and intraarticular injection of gado- linium and saline solution. Radiology 1991;178:557-61.
6. Konig H, Sauter R, Demling M, Vogt M. Cartilage disorders: comparison of spin-echo, chess, and FLASH sequence MR im- ages. Radiology 1987;164:753-8.
7. Broderick LS, Turner UA, Renfrew DL, Schnitzer TJ, Huff JP, Harris C. Severity of articular cartilage abnormality in patients with osteoarthritis: evaluation with fast spin-echo MR vs arthros- copy. Am J Roentgenol 1994;162:99-103.
8. Recht MP, Kramer 5, Marcelis S, Pathria MN, Trudell D, Haghighi P, et al. Abnormalities of articular cartilage in the knee: analysis of available MR techniques. Radiology 1993;187:473-8.
9. Disler DG, Peters TI., Muscoreil SJ, Ratner LM, Wagle WA, Cousins JP, et al. Fat suppressed spoiled GRASS imaging of knee hyaline cartilage: technique optimization and comparison with conventional MR imaging. Am J Roentgenol 1994;163:887-92.
10. Gagliardi JA, Chung EM, Chandnani VP, Kesling KL, Christensen KP, Null RN, et al. Detection and staging of chondromalacia patellae: relative efficacies of conventional MR imaging, MR arthrography, and CT arthrography. Am J Roentgenol 1994163:
11. Hajek PC, Sartoris DJ, Neumann CH, Resnick D. Potential contrast agents for MI< arthrography: in vitro evaluation and practical observation. Am J Roentgenol 1987;104:97-104.
12. Kramer J, Recht MP, Imhof H, Stiglhauer R, Engel A. Post contrast MR arthrography in assessment of cartilage lesions. J Comput Assist Tomogr 1994;18:218-24.
13. Drape JL, Thelen P, Gay-Depassier P, Silberman 0, Benaceraf R. Intra-articular diffusion of Gd DOTA after intravenous injection in the knee: MR imaging evaluation. Radiology 1993;188:227-34.
14. Winalski CS, Aliabadi P, Wright RJ, Shortkroff S, Sledge CB, Wcissman B. Enhancement of joint fluid with intravenously ad- ministered gadopentatc dimegluminc: technique, rationale and implications. Radiology 1993;187: 179-85.
15. Bjorkengren AG, Geborek P, Rydholm U, Holtas S, Petterson H. MR imaging of the knee in acute rheumatoid arthritis: synovial uptake of gadolinium-DOTA. Am J Roentgenol 1990;155:329-32.
16. Tamai K, Yamato M, Yamaguchi T, Ohno W. Dynamic magnetic resonance imaging for the evaluation of synovitis in patients with rheumatoid synovitis. Arthritis Rheum 1994;37:1151-7.
17. Balaban RS, Ceckler TL. Magnetization transfer contrast in magnetic resonance imaging. Magn Reson Q 1992;8:116-37.
18. Wolff SD, Chesnick S, Franck JA, Lim KO, Balaban RS. Magne- tization transfer contrast: MR imaging of the knee. Radiology 1991;179:623-8.
19. Erickson SJ, Prost RW, Timins ME. The “magic angle” effect: background, physics and clinical relevance. Radiology 1993;188: 23-5.
20. Henkelman RM. Image artifacts. In: Stark DD7 Bradley WG, editors. Magnetic resonance imaging. St. Louis: Mosby-Yearbook;
21. Kuettner KS, Aydelotte MG, Thonar EJM. Articular cartilage matrix and structure: a minireview. J Rheumatol 1991;lS Suppl
22. Buckwalter TA, Rosenberg LL, Hunziker EB. Articular cartilage: composition, structure, response to injury, and methods of facili-
413-9.
629-36.
1992. p. 235-7.
27:46-8.

MRI OF NORMAL AND OA CARTILAGE 975
23.
24.
25.
26.
27.
28.
29.
30.
31.
32.
33.
34.
35.
36.
37.
38.
39.
40.
41.
tating repair. In: Ewing J W , editor. Articular cartilage and knee joint function: basic science and arthroscopy. New York: Raven;
Hardingham ‘I,, Bayliss M. Protcoglycans of articular cartilage: changes in aging and in joint disease. Semin Arthritis Rheum 1990;20 Suppl 1:12-33. Tammi M, Paukkonen K, Kiviranta 1, Juivelin J, Saamanen AM, Helminen HJ. Joint loading-induced alterations in articular carti- lage. In: Helminen HJ, Kiviranta 1, Tammi M, Saanianen AM, Paukkonen K, Jurvelin J, editors. Joint loading. Bristol: Wright: 1987. p. 64-88. Heinegard D, Pinientcl ER. Cartilage matrix proteins. In: Kuett- ner KE, Schleyerbach R, Peyron J, Hascall VC, editors. Articular cartilage osteoarthritis. New York: Raven Press; 1902. p. 195-211. Mow VC, Ratcliffe A, Poole AR. Cartilage and di-arthrodial joints as paradigms for hierarchical materials and structures. Riomateri- als 1992;13:07-97. Oegema ‘IX, Thompson RC. Cartilage-bone surface (tidemark). In: Brandt KD, editor. Cartilage images in osteoarthritis. India- napolis: Indiana University School of Medicine; 1990. p. 43-52. Schenck RK. Eggli PS, Hunziker EB. Articular cartilage morphol- ogy. In: Kuettner KE, Schleyerbach R. Hascall VC, editors. Articular cartilage biochemistry. New York: Raven Presx; 10x6. p. 3-22. Ixhner KB, Rechl HP, Gmeinwieser JK, Hcuk AF, Lukas HP, Kohn HP. Structure, function and degeneration cif bovine hyaline cartilage: assessment with biK imaging in vitro. Radiology 198%
Mod1 JM, Sether LA, IIaughlon VM. Kneeliind JR. Articular cartilage corrclation of histologic zoncs with signal intensity at MR imaging. Radiology 1991;181:853-5. Kubenstein JD, Kim JK, Mozava-Protznrr I, Stanchev PL, Hen- kelman RM. Effects of collagen orientation on MR imaging characteristics of bovine articular cartilage. Radiology 1993;188:
Waldschmidt JG, Rilling RJ, Kajd y-Balla AA. High resolution MR imaging of hyaline cartilage: normal anatomy, diagnostic pitfalls and pathology [abstract]. Radiology 1997;201:535. Cole PR, Jasani MK, Wood B, Freemont AJ; Morrib GA. High resolution, high field magnetic resonance imaging of joints: unex- pected features in proton images of cartilage. Br J Radiol 1990: 63:907-8. Rubenstein JD, Kim JK, Henkelrnan RM. Effects o f compression and recovery on bovine articular cartilagc: appearance on MK images. Radiology 1996;201:843-SO. Erickson SJ, Waldschinidt JG, Czervionke LF, Prost RW. Hyaline cartilage: truncation artifact as a cause of trilaminar appearance with fat-suppressed three-dimensional spoiled gradient-rccallcd scqucnces. Radiology 1996;201:260-4. Paul PK, Jasani MK, Sebok I). Kakhit A, Dunton AW; Douglas FL. Variation in MR signal intensity across normal human kncc cartilage. J Magn Reson Imaging 1993;3:569-74. Loeuille D, Gonord P, Guingamp C, Gillct P, Blum A, Sauzade M, et al. In vitro magnetic resonance microimaging of experimental osteoarthritis in the rat knee joint. J Rhcumatol 1997;24133-9. Xia Y, Farquhar T, Burton-Wursler N, Lust G. Origin of cartilage laminae in MKI. J Magn Reson Imaging 1997;7:887-94. Mlynarik V? Degrassi A, Toffanin R, Vittur F, Cova M, Pozzi- Mucelli RS. Investigation of laminar appearance of articular cartilage by means of magnetic resonance microscopy. Magn Reson Imaging 1996;14:435-42. Hodler J, Loredo RA, Longo C. Trudell D, Yu JS. Resnick D. Assessment of articular cartilage thickness of the femoral head: MR-anatomic correlation in cadavers. Am J Roentgenol 1995;165: 615-20. Robson MD, Hodgson RJ, Herrod NJ, Tyler JA, Hall LD. A
1990. p. 19-56,
170~495-9.
219-28.
computerised automatic measuremcnt of cartilage thickness in the distal interphalangeal joint. Magn Keson Iiiiaging 1995;13:709-18.
42. Hodler J, L,oredo KA. Longo c‘. Trudell D, Yu JS, Resnick D. Assessment of articular cartilagc thickness of the humeral head: MR-anatomic correlation in cadavers. Am J Koeiitgenol 1995; 165: 61 5-20.
43. Fiodler J, ‘Trudell D. Pathria MN, Kcsnick D. Width of thc articular cartilage of the hip: quantification by using fat suppres- sion spin-echo MR imaging. Am J Roentgenol 1992;159:351-S.
44. Peterfy CG, van Dijke CF> Janzen DI,, Glker CC, Namba R, Majumdar S. et al. QuantiCication of articular cartilage in the knee with pulsed saluration transfer subtraction and fat suppresed MR imaging: optimization and validation. Radiology 1994;192:485-41.
45. Paul PK, Wang JZ. Mezrich KS, Kakhit A, Dunton AW, Furst D, ct al. 3D-MKI: a novcl approach to quantification of articular cartilage [abstract]. Arthritis Rheum 1990;33 Suppl 9:S91.
46. Rubin RA, Dolecki M, Lehand P. Tate F, Rubash IIE, IIerndori JH. 3D graphical reconstruction of articular cartilage of the hip and knee joint with GRASS MRI. Proceedings of the 9th Annual Scientific Meeting of the Society of Magnetic Resonance in Medicine; 1990 Aug 18-24: New York.
47. Piplany MA. Disler DG. McCauley TR. Holnies TJ, Cousins JP. Articular cartilage volume in the knee: semiautomated detei mi- nation from three-dimensional reformations of MR images. Radi- ohgy 1996;198:855-9.
48. Pilch I,, Stewart C, Gordon D, Inman R, Parsons K, Pataki I, et al. Assessment of cartilage volume in the femorotihial joint with magnetic resonance imaging and 3D computer reconstruction. J Rhcumatol 1994;21:2307-19.
40. Hamerman D. The biology of osteoarthritis. N Engl J Med
50. Ilodler J, Berthiaunie MJ, Schweit~er ME, Reanick D. Knee joint a comparative study of MR and anatomic t Tomogr 1992; l6:597-603.
51. Outerhridge RE. The etiology of chondromalacia patella. J Bone Joint Surg Rr 1961;43B:752-7.
52. Sabiston CP, A d a m ME. Li DKB. Magnctic resonance imaging of osteoarthritis: correlation of gross pathology using an experimen- tal model. J Orthop Res 1987;5:164-72.
53. Gahunia HK, Lemaire C, Babyn P, Cross AR, Kessler MJ, Pritzker K. Osteoarthritis in rhcsus macaques knee joint: quantitative magnetic resonance imaging tissue characterization of articular cartilage. J Rheuniatol 1995;22:47-56.
54. Konig H. Sauter R, Deimling M: Vogt M. Cartilage di5orders: comparison of spin echo. chess and flash sequence MR images. Radiology 1987:164:753-8.
55. Lavid NE, Depaolis DC, Pope TW, Hinson GW, Mums SW, Batnitziky S, et al. Analysis of three-dimensional computerized representations of articular cartilage lesions. Invest Radiol 1996; 9577-85.
56. Fernandez-Madrid F, Karvonen R, Teitge R, Miller P, Negendank W. MR features of osteoarthritis of the knee. Magn Reson lmaging 1994; 12:703-9.
57. Radin EL, Rose RM. Role o f the subchondral bone in the initiation and progression of cartilage damage. Clin Orthop Re1 Res 1986;213:34-40.
58. Watson PJ, IIall LD. Malcolm A, Tyler JA. Degenerative joint diseasc in thc guinea pig: use of magnetic resonance imaging to monitor progression of hone pathology. Arthritis Rheum 1996;39:
59. Tyrell RL, Gluckert K; Pathria M, Modic MT. Fa51 three- dimensional MR imaging of the knee: comparison with arthros- copy. Radiology 1988:166:865-72.
60. Jiang Y, White D, Zhao J, Peterfy C. Genant HK. Mcniscectomy- induced osteoarthritis m d e l in rabbits: MRI and radiograllhic
1089;32:1322-30.
1327-37.
combined analysis and magnctic resonance imaging technique for asscssments [abstract]. Arthritis Rheum 1997;40 Suppl 9:<8Y.’