Trabecular bone loss after administration of the second-generation antipsychotic risperidone is...
20
Trabecular bone loss after administration of the second- generation antipsychotic risperidone is independent of weight gain Katherine J. Motyl a,*,1 , Ingrid Dick-de-Paula a,1,2 , Ann E. Maloney a,3 , Sutada Lotinun b , Sheila Bornstein a , Francisco J. A. de Paula a,2 , Roland Baron b , Karen L. Houseknecht c , and Clifford J. Rosen a a Maine Medical Center Research Institute, 81 Research Drive, Scarborough, ME 04074 USA b Harvard Medical School and School of Dental Medicine, Oral Medicine, Infection & Immunity REB 313, 188 Longwood Ave, Boston, MA 02115 USA c College of Pharmacy, University of New England, 716 Stevens Ave, Portland, ME 04103 USA Abstract Second generation antipsychotics (SGAs) have been linked to metabolic and bone disorders in clinical studies, but the mechanisms of these side effects remain unclear. Additionally, no studies have examined whether SGAs cause bone loss in mice. Using in vivo and in vitro modeling we examined the effects of risperidone, the most commonly prescribed SGA, on bone in C57BL6/J (B6) mice. Mice were treated with risperidone orally by food supplementation at a dose of 1.25 mg/kg daily for 5 and 8 weeks, starting at 3.5 weeks of age. Risperidone reduced trabecular BV/ TV, trabecular number and percent cortical area. Trabecular histomorphometry demonstrated increased resorption parameters, with no change in osteoblast number or function. Risperidone also altered adipose tissue distribution such that white adipose tissue mass was reduced and liver had significantly higher lipid infiltration. Next, in order to tightly control risperidone exposure, we administered risperidone by chronic subcutaneous infusion with osmotic minipumps (0.5 mg/kg daily for 4 weeks) in 7 week old female B6 mice. Similar trabecular and cortical bone differences were observed compared to the orally treated groups (reduced trabecular BV/TV, and connectivity density, and reduced percent cortical area) with no change in body mass, percent body fat, glucose tolerance or insulin sensitivity. Unlike in orally treated mice, risperidone infusion reduced bone formation parameters (serum P1NP, MAR and BFR/BV). Resorption parameters were elevated, but this increase did not reach statistical significance. To determine if risperidone could directly affect bone cells, primary bone marrow cells were cultured with osteoclast or osteoblast differentiation media. Risperidone was added to culture medium in clinically relevant doses of 0, 2.5 or 25 ng/ml. The number of osteoclasts was significantly increased by addition in vitro of risperidone while osteoblast differentiation was not altered. These studies indicate that risperidone © 2011 Elsevier Inc. All rights reserved. * Corresponding Author: Katherine J. Motyl, Maine Medical Center Research Institute, 81 Research Drive, Scarborough, ME 04074 USA, [email protected], Office: (207) 396-8004, Fax: (207) 885-8174. 1 Authors contributed equally to the experimental design, the phenotyping and the interpretation. 2 Permanent Address: Department of Internal Medicine, School of Medicine of Ribeirão Preto, USP, Av. Bandeirantes, 3900, 14049-900, Ribeirão Preto, SP, Brazil 3 Permanent Address: University of Massachusetts Medical School, Department of Psychiatry, Biotech One, 365 Plantation Street, Worcester MA 01605 Publisher's Disclaimer: This is a PDF file of an unedited manuscript that has been accepted for publication. As a service to our customers we are providing this early version of the manuscript. The manuscript will undergo copyediting, typesetting, and review of the resulting proof before it is published in its final citable form. Please note that during the production process errors may be discovered which could affect the content, and all legal disclaimers that apply to the journal pertain. NIH Public Access Author Manuscript Bone. Author manuscript; available in PMC 2013 February 1. Published in final edited form as: Bone. 2012 February ; 50(2): 490–498. doi:10.1016/j.bone.2011.08.005. NIH-PA Author Manuscript NIH-PA Author Manuscript NIH-PA Author Manuscript
-
Upload
hms-harvard -
Category
Documents
-
view
4 -
download
0
Transcript of Trabecular bone loss after administration of the second-generation antipsychotic risperidone is...

Trabecular bone loss after administration of the second-generation antipsychotic risperidone is independent of weightgain
Katherine J. Motyla,*,1, Ingrid Dick-de-Paulaa,1,2, Ann E. Maloneya,3, Sutada Lotinunb, SheilaBornsteina, Francisco J. A. de Paulaa,2, Roland Baronb, Karen L. Houseknechtc, andClifford J. Rosena
aMaine Medical Center Research Institute, 81 Research Drive, Scarborough, ME 04074 USAbHarvard Medical School and School of Dental Medicine, Oral Medicine, Infection & ImmunityREB 313, 188 Longwood Ave, Boston, MA 02115 USAcCollege of Pharmacy, University of New England, 716 Stevens Ave, Portland, ME 04103 USA
AbstractSecond generation antipsychotics (SGAs) have been linked to metabolic and bone disorders inclinical studies, but the mechanisms of these side effects remain unclear. Additionally, no studieshave examined whether SGAs cause bone loss in mice. Using in vivo and in vitro modeling weexamined the effects of risperidone, the most commonly prescribed SGA, on bone in C57BL6/J(B6) mice. Mice were treated with risperidone orally by food supplementation at a dose of 1.25mg/kg daily for 5 and 8 weeks, starting at 3.5 weeks of age. Risperidone reduced trabecular BV/TV, trabecular number and percent cortical area. Trabecular histomorphometry demonstratedincreased resorption parameters, with no change in osteoblast number or function. Risperidonealso altered adipose tissue distribution such that white adipose tissue mass was reduced and liverhad significantly higher lipid infiltration. Next, in order to tightly control risperidone exposure, weadministered risperidone by chronic subcutaneous infusion with osmotic minipumps (0.5 mg/kgdaily for 4 weeks) in 7 week old female B6 mice. Similar trabecular and cortical bone differenceswere observed compared to the orally treated groups (reduced trabecular BV/TV, and connectivitydensity, and reduced percent cortical area) with no change in body mass, percent body fat, glucosetolerance or insulin sensitivity. Unlike in orally treated mice, risperidone infusion reduced boneformation parameters (serum P1NP, MAR and BFR/BV). Resorption parameters were elevated,but this increase did not reach statistical significance. To determine if risperidone could directlyaffect bone cells, primary bone marrow cells were cultured with osteoclast or osteoblastdifferentiation media. Risperidone was added to culture medium in clinically relevant doses of 0,2.5 or 25 ng/ml. The number of osteoclasts was significantly increased by addition in vitro ofrisperidone while osteoblast differentiation was not altered. These studies indicate that risperidone
© 2011 Elsevier Inc. All rights reserved.*Corresponding Author: Katherine J. Motyl, Maine Medical Center Research Institute, 81 Research Drive, Scarborough, ME 04074USA, [email protected], Office: (207) 396-8004, Fax: (207) 885-8174.1Authors contributed equally to the experimental design, the phenotyping and the interpretation.2Permanent Address: Department of Internal Medicine, School of Medicine of Ribeirão Preto, USP, Av. Bandeirantes, 3900,14049-900, Ribeirão Preto, SP, Brazil3Permanent Address: University of Massachusetts Medical School, Department of Psychiatry, Biotech One, 365 Plantation Street,Worcester MA 01605Publisher's Disclaimer: This is a PDF file of an unedited manuscript that has been accepted for publication. As a service to ourcustomers we are providing this early version of the manuscript. The manuscript will undergo copyediting, typesetting, and review ofthe resulting proof before it is published in its final citable form. Please note that during the production process errors may bediscovered which could affect the content, and all legal disclaimers that apply to the journal pertain.
NIH Public AccessAuthor ManuscriptBone. Author manuscript; available in PMC 2013 February 1.
Published in final edited form as:Bone. 2012 February ; 50(2): 490–498. doi:10.1016/j.bone.2011.08.005.
NIH
-PA Author Manuscript
NIH
-PA Author Manuscript
NIH
-PA Author Manuscript

treatment can have negative skeletal consequences by direct activation of osteoclast activity andby indirect non-cell autonomous mechanisms. Our findings further support the tenet that thenegative side effects of SGAs on bone mass should be considered when weighing potential risksand benefits, especially in children and adolescents who have not yet reached peak bone mass.
IntroductionSecond-generation antipsychotics (SGAs) are used to treat major psychiatric disorders inpart due to their lower incidence of extrapyrimidal side effects compared to first-generationantipsychotics (FGAs) [1]. Risperidone is one such SGA that is currently indicated for use inadolescents (as young as 10) and adults with schizophrenia and bipolar disorders, although itis widely used for attention deficit disorders. Risperidone is also approved for use inchildren as young as 5 years old for treatment of irritability associated with autism. Eventhough SGAs are highly prescribed, they have been linked to metabolic disorders includingobesity, hyperglycemia and dyslipidemia [2–4]. The mechanism of metabolic changesassociated with antipsychotics is unknown, but it is clear that a single dose (intravenous orintracerebroventricular) of certain SGAs (olanzapine, clozapine, and to a lesser degreerisperidone) can dramatically reduce insulin sensitivity in the liver and this effect continuesafter multiple doses [5]. Additionally, SGA-linked obesity and type 2 diabetes mellitus ismore prevalent in children and adolescents [6–8].
The relationship among energy metabolism, insulin signaling and bone remodeling isbecoming more apparent, so it is likely that drugs that alter energy metabolism willultimately affect bone mineral density [9]. Indeed, clinical studies demonstrate reduced bonemineral density and increased fracture risk in patients treated with risperidone and otherSGAs, although these studies are confounded by indication (since the underlying disorderstreated with antipsychotic medication can be associated with reduced bone mineral densityin some cohorts) [10–16]. Risperidone can induce hyperprolactinemia by dopamine receptorblockade and this can lead to hypothalamic hypogonadism, which has been suggested as apossible mechanism of bone loss [11, 12, 15, 17]. However, a recent study demonstrated thatless than half of the patients using risperidone developed hyperprolactinemia [11]. Inaddition, the increase in prolactin serum levels due to risperidone treatment is often atemporary event [18]. Moreover, unlike FGAs that bind mainly dopamine (D2) receptors,SGAs bind to multiple targets, including serotonin (5-HT), histamine, and D2 receptors, andtherefore can affect additional organ systems that indirectly impact skeletal remodeling.
Despite some evidence that SGAs have a deleterious effect on bone, rodent studiesinvolving SGA administration have focused on prolactin and the major metabolicconsequences including weight gain, fat redistribution and glucose intolerance. However, nostudies have examined whether risperidone is capable of causing direct deleterious effectson bone, nor have any studies been reported in mice. Here, we examined the effects ofrisperidone on bone and adipose tissue metabolism, and found significant trabecular andcortical bone loss independent of weight gain and overt metabolic dysfunction using twomethods of risperidone administration (orally in food and by subcutaneous infusion).Reduced trabecular bone mass in mice fed a diet containing risperidone was due to increasedresorption, an effect that can be recapitulated by direct risperidone administration to primarybone marrow derived osteoclasts in vitro. On the other hand, chronic infusion of risperidonesuppressed bone formation, and showed a trend toward increased resorption, indicating thatthe mode of delivery and age of mice are important variables. Despite these differences, wehave clearly established a negative role for risperidone on bone metabolism through bothdirect and indirect mechanisms.
Motyl et al. Page 2
Bone. Author manuscript; available in PMC 2013 February 1.
NIH
-PA Author Manuscript
NIH
-PA Author Manuscript
NIH
-PA Author Manuscript

Materials and MethodsThe experimental protocols were approved by the Institutional Animal Care and UseCommittee of the Maine Medical Center Research Institute. The animals were maintainedon 12 h light/12 h dark cycles. The mice had free access to water and food.
Mice – oral risperidone administrationMale C57BL/6J (B6) mice were obtained from The Jackson Laboratory (Bar Harbor, ME) at3 weeks of age. Mice were fed normal laboratory chow until 3.5 weeks of age, when theywere switched to wet mash supplemented with risperidone such that the dose delivered was1.25 mg/kg/day or control wet mash. Food intake was monitored twice per week to ensurecorrect dosing. Mice were maintained on risperidone or control diet for five (n=8 control, 8risperidone) or eight weeks (n=8 control, 8 risperidone), at which time mice were euthanizedand tissues were collected after an overnight fast. Livers were stained for lipid depositionwith Oil Red O.
Mice – risperidone infusionFemale C57BL6/J mice were purchased from The Jackson Laboratory (Bar Harbor, ME) at6 weeks of age. At 7 weeks of age, mice were implanted with Alzet Osmotic Minipumps(Durect Corporation, Cupertino, CA) containing either 0.5 mg/kg/day risperidone (Sigma,St. Louis, MO) or vehicle in the subcutaneous region dorsal to the right hip. Concentrationof risperidone was based on the average weight of C57BL/6 female mice from 7–11 weeksof age. After four weeks of risperidone or vehicle infusion mice were euthanized and tissuescollected after an overnight fast.
Dual-energy X-ray absorptiometry (DXA)Control and risperidone treated mice were measured at the time of harvest for lean musclemass, fat, and bone mineral density using the PIXImus dual-energy X-ray densitometer (GE-Lunar, Madison, WI, USA). The PIXImus was calibrated daily with a mouse phantomprovided by the manufacturer. Mice were placed ventral side down with each limb and tailpositioned away from the body. Full body scans were obtained, and X-ray absorptiometrydata were gathered and processed with the manufacturer's supplied software (LunarPIXImus 2, version 2.1). The head was specifically excluded from all analyses due toconcentrated mineral in skull and teeth.
Micro-computed tomography (µCT)Micro-architecture of the distal trabecular bone and midshaft cortical bone of the femur wereanalyzed by µCT (resolution 10 µm, VivaCT-40, Scanco Medical AG, Bassersdorf,Switzerland). Bones were scanned at energy level of 55kVp, and intensity of 145 µA. TheVivaCT-40 is calibrated weekly using a phantom provided by Scanco. Trabecular bonevolume fraction and micro-architecture were evaluated in the secondary spongiosa, startingproximately at 0.6 mm proximal to the distal femoral growth plate, and extendingproximally 1.5 mm. Approximately 230 consecutive slices were made at 10.5 um interval atthe distal end of the growth plate and extending in a proximal direction, and 180 contiguousslices were selected for analysis. Measurements included bone volume/total volume (BV/TV), trabecular number (Tb.N.), trabecular thickness (Tb.Th.) and trabecular separation(Tb.Sp.). Scans for the cortical region were measured at the mid-point of each femur, withan isotropic pixel size of 21 µm and slice thickness of 21 µm, and used to calculate theaverage bone area (BA), total cross-sectional area (TA), bone area/total area (BA/TA), andcortical thickness (Ct.Th.). For mid-shaft analysis, the cortical shell was contoured by user-
Motyl et al. Page 3
Bone. Author manuscript; available in PMC 2013 February 1.
NIH
-PA Author Manuscript
NIH
-PA Author Manuscript
NIH
-PA Author Manuscript

defined threshold and iterated across the 50 slices. All scans were analyzed usingmanufacturer software (Scanco, version 4.05).
Histology and Quantitative HistomorphometryQualitative histologic analysis and quantitative static and dynamic histomorphometry wereperformed as described previously [19]. To examine bone-formation rates, calcein label (20mg/kg) and demeclocycline label (20 mg/kg) were injected intraperitoneally at 9 and 2 daysprior to euthanization, respectively. Immediately after euthanization, tibias forhistomorphometry were placed in 70% ethanol and maintained in the dark at 4°C.Histomorphometric measurements were performed on the secondary spongiosa of theproximal tibia metaphysis using an OsteoMeasure morphometry system (Osteometrics,Atlanta, GA, USA). For dynamic histomorphometry, mineralizing surface per bone surface(MS/BS, %) and mineral apposition rate (MAR, µm/day) were measured in unstainedsections under ultraviolet (UV) light and used to calculate bone-formation rate with asurface referent (BFR/BS, µm3/µm2/year), volume referent (BFR/BV, %/year) and tissuereferent (BFR/TV, %/year). Static measurements included BV/TV (%), trabecular thickness(Tb.Th, µm), trabecular number (Tb.N, /mm), trabecular separation (Tb.Sp, µm), erodedsurface per bone surface (ES/BS, %), osteoid surface per bone surface (OS/BS, %), osteoidvolume per tissue volume (OV/TV, %), osteoid thickness (O.Th, µm), osteoblast surface perbone surface (Ob.S/BS, %), osteoclast surface per bone surface (Oc.S/BS, %), osteoblastnumber per bone perimeter (N.Ob/B.Pm, /mm), osteoblast number per tissue area (N.Ob/T.Ar, /mm2), osteoclast number per bone perimeter (N.Oc/B.Pm, /mm), osteoclast numberper tissue area (N.Oc/T.Ar, /mm2), and adipocytes per total area (/mm2). Terminology andunits followed the recommendations of the Histomorphometry Nomenclature Committee ofthe American Society for Bone and Mineral Research [20].
Magnetic Resonance ImagingAxial and coronal images were acquired in a 7.0T Bruker PharmaScan magnet. The animalswere anesthetized with inhaled isoflurane 1%, 0.4 l/min. The infused volume was adjusted,occasionally, depending on animal respiration frequency. The acquisition method used forbody fat was: TR 600 ms, TE 87 ms, FOV 40×40×10 mm, matrix size 256×256×32, slicethickness10 mm, 1 slice, no fat suppression, 4 average, with total scan time of about 11minutes. For single pulse spectroscopy: TR 1000 ms, no fat suppression, 400 averages, withtotal scan time of about 7 min. Spectroscopy was carried out by using the followingparameters: TR= 2500 msec, TE= 20 msec, voxel= 0.75×7×0.75 mm, no fat suppression,400 averages, with total scan time about 17 minutes.
Serum MeasurementsSerum adiponectin was measured with the Mouse Adiponectin Assay Kit (Meso ScaleDiscovery, Gaithersburg, MD). Serum prolactin was measured with the Mouse/Rat ProlactinKit (Calbiotech, Spring Valley, CA). Serum P1NP and CTx were measured with the Rat/Mouse P1NP EIA and the RatLaps EIA, respectively (Immunodiagnostic Systems,Scottsdale, AZ).
Insulin and Glucose ToleranceFor the insulin tolerance test (ITT), mice were fed ad libitum and injected I.P. with insulin ata dose of 1 U/kg. Glucose levels were then measured at 0, 20, 40, 60, 100, 120 and 150 minpost injection. For the glucose tolerance test (GTT), mice were placed in a clean cage withwater and fasted overnight (16 hr). A 1 g/kg dose of glucose was administered I.P. and bloodglucose levels were measured at 0, 20, 40, 60, 80, 100, 120, 150 and 180 min post injection.
Motyl et al. Page 4
Bone. Author manuscript; available in PMC 2013 February 1.
NIH
-PA Author Manuscript
NIH
-PA Author Manuscript
NIH
-PA Author Manuscript

Glucose levels were measured using the OneTouch Ultra Glucometer (LifeScan, Inc.,Milpitas, California, USA) per manufacturer's instructions.
Mass SpectrometryRisperidone and the active metabolite 9-OH risperidone levels were measured by massspectrometry in serum as previously shown [21].
Osteoclast CultureWhole bone marrow was isolated from 8 week old female C57BL6/J mice and plated in 96-well plates at a density of 2 × 10⁶ cells/well and cultured in the presence of RANKL and M-CSF as previously described [22]. Five replicates were performed per experiment.Risperidone (0, 2.5 or 25 ng/ml) was added with each media change at day 0, 3 and 6.Osteoclasts were harvested at day 7 by fixation with 2.5% glutaraldehyde and stained forTRAP (Sigma Kit, St. Louis, MO). TRAP positive osteoclasts with three or more nucleiwere counted.
Statistical AnalysesAll data is presented as mean ± standard error. Statistical significance was determined usinga two-tailed Student’s t-test (alpha = 0.05) with Microsoft Excel (Microsoft, Redmond,WA).
ResultsOral Risperidone Administration
Risperidone was administered to male 3.5 week old B6 mice at a dose of 1.25 mg/kg per dayin the food to examine its effects on bone metabolism. Risperidone fed mice hadsignificantly lower body weights and lower body fat compared to controls after five weeksof treatment (Figure 1). After eight weeks, the lower body fat remained statisticallysignificant but there was no significant difference in body mass. Although there was nodetectable difference in total aBMD by DXA at either time point, risperidone-fed mice hadsignificantly lower femur aBMD after eight weeks of treatment compared to untreatedcontrols.
After eight weeks of risperidone administration, distal femur trabecular bone volumefraction (BV/TV) was 23% lower (p<0.01) than that of untreated control mice (Figure 2,Table I). At this time point, trabecular number and connectivity density were significantlylower while trabecular separation was significantly higher than control. By the fifth week oftreatment, risperidone treated mice had reduced femur midshaft cortical thickness, whichcan be attributed to a reduction in periosteal circumference compared to controls (Table I).After eight weeks, however, the difference in periosteal circumference was no longerevident, although risperidone-treated mice continued to have significantly lower percentCt.Ar/T.Ar (Table I).
Static and dynamic histomorphometry was performed on trabecular bone of the proximaltibia in order to determine how risperidone altered remodeling. Consistent with femur µCTresults, after eight weeks of treatment, trabecular BV/TV and trabecular number weresignificantly lower in the risperidone treated group compared to untreated controls (TableII). Additionally, the reduction in BV/TV was also statistically significant in the tibia by 5weeks of treatment, which was not apparent in the femur µCT. Neither treatment periodsignificantly altered measurements of mineralization, bone formation, or osteoblastnumbers. However, risperidone treated mice did have significantly elevated bone resorptionparameters, at both five and eight weeks of treatment, including percent of bone surface in
Motyl et al. Page 5
Bone. Author manuscript; available in PMC 2013 February 1.
NIH
-PA Author Manuscript
NIH
-PA Author Manuscript
NIH
-PA Author Manuscript

contact with osteoclasts and number of osteoclasts per unit bone surface. Erosion surfacewas also 2.5-fold higher in mice treated with risperidone for five weeks compared to controlmice. This difference was not statistically detectable at the eight-week time point. Bonemarrow adipocyte number was not significantly different after five or eight weeks of oralrisperidone administration vs control treated animals (not shown).
In order to further investigate adipose tissue changes observed by DXA, we examinedabdominal and subcutaneous fat by MRI. Representative MR images demonstrate that bothsubcutaneous and visceral fat was reduced after five weeks of risperidone treatment (Figure3A). This reduction in mass of normal white adipose tissue depots was coupled with anincrease in liver adiposity as measured by Oil Red O staining and by weight measurements(Figure 3B).
Given the potential variability due to food supplementation, we measured risperidone and 9-OH risperidone levels in the serum of mice at each time point. Although risperidone levelswere low to undetectable by mass spectrometry (likely due to the overnight fast andtherefore no new drug exposure), the more stable 9-OH risperidone was detectable at levelsof 7.9 ± 3.5 ng/ml (range 1.6–24.1 ng/ml) for the five week treatment and 6.0 ± 0.8 ng/ml(range 4.6–9.3 ng/ml) for the eight week treatment, which are within the range obtained inhuman patients [23–25].
Subcutaneous Risperidone InfusionDue to variability in the amount of risperidone delivered per mouse by foodsupplementation, we administered risperidone (0.5 mg/kg per day) to 7-week old C57BL/6Jmice via subcutaneous osmotic minipumps for 28 days. In the literature, female mice aremore likely to have a weight-gain side effect of SGA administration; therefore we usedfemale mice instead of males to try to exclude weight loss as a confounding factor in thebone effects we observed with male mice. At two and four weeks after pump implantation,serum risperidone concentration was 5.9 ± 0.7 ng/ml (range 5.0–7.9 ng/ml) and 1.3 ± 0.3 ng/ml (range 0.8–2.3 ng/ml), respectively. The concentration of 9-OH risperidone was 3.8 ± 0.5ng/ml (range 2.8–5.7 ng/ml) at two weeks and 2.4 ± 0.3 ng/ml (range 1.5–3.1 ng/ml) at fourweeks, which was considerably less variable than levels measured during oraladministration.
Mice did not have significantly altered body mass, fat mass or lean mass after infusion ofrisperidone (Figure 4A). Additionally, insulin tolerance (Figure 4B) and glucose tolerance(Figure 4C) were not different between treatment groups. Similar to oral administration,whole body aBMD was not different between groups. Despite the shortened treatmentduration and lower dose, femur aBMD was lower in mice treated with risperidone comparedto control (Figure 4D). Both distal femur trabecular BV/TV and connectivity density weresignificantly reduced (44% and 64%, respectively) (Table III). Cortical thickness, corticalarea and percent of the total area were also lower in the femur of risperidone treated micecompared to control.
Serum P1NP, a marker of bone formation, was lower in risperidone treated mice while therewas no difference in CTx, a marker of resorption (Figure 4E). Consistent with these data,histomorphometric analysis of the tibia in 7 week old mice treated with subcutaneousrisperidone infusion revealed significantly suppressed MAR (decreased 18%) and BFR/BV(decreased 34%). In addition, osteoblast number was markedly reduced (p=0.05) and therewas a 53% increased in osteoclast number although it did not reach statistical significance(p=0.12) (Table IV).
Motyl et al. Page 6
Bone. Author manuscript; available in PMC 2013 February 1.
NIH
-PA Author Manuscript
NIH
-PA Author Manuscript
NIH
-PA Author Manuscript

Direct effect of risperidone on osteoclast differentiationIn order to determine whether the effects of risperidone on resorption parameters could bedue to direct interaction with osteoclasts, we cultured primary osteoclasts from bone marrowin the presence or absence of risperidone. Addition of both 2.5 and 25 ng/ml risperidonewith each media change increased TRAP positive osteoclast number in a dose dependentmanner (Figure 5). On the other hand, when bone marrow stromal cells were exposed torisperidone in vitro, there were no differences in osteoblast proliferation or differentiationcompared to untreated cells (data not shown).
DiscussionIn this paper we have clearly established that risperidone has a negative impact on bonemass in mice and that this effect may be due to both direct and indirect mechanisms. Usingboth male and female mice, and both oral administration and subcutaneous infusion, wefound that risperidone reduces both trabecular and cortical bone mass, and that this effect islikely due to imbalanced bone remodeling (Table II). Interestingly, both modes ofadministration of risperidone reduced bone mass but histomorphometric analyses revealedthere were different mechanisms of action for risperidone. For example, oral risperidonetreatment was associated with a primary increase in bone resorption with little change inbone formation, whereas subcutaneous infusion of risperidone resulted in a reduction inP1NP (Figure 4B) and suppression of both bone formation and mineral apposition rates.These data suggest there may be both cell autonomous (i.e. on osteoclasts) and non-cellautonomous effects (i.e. on osteoblasts) since in vitro studies could not demonstratesignificant changes in the pace of osteoblast differentiation in response to risperidone.
However, it should be noted that only 7-week-old female mice were administeredsubcutaneous risperidone whereas only 3.5-week-old male mice were treated with the oralform. At 7 weeks of age, females B6 mice are near their peak in trabecular number andtrabecular BV/TV in the distal femur [26]. Thereafter, trabecular BV/TV in the distal femurdeclines due to enhanced resorption relative to formation. Risperidone treatment acceleratedtrabecular bone loss in B6 females by further suppressing bone formation. Male B6 micegain trabecular BV/TV and number up to 8 weeks of age, thus during the first treatmentperiod (3.5 to 8.5 weeks of age) normal modeling favors bone formation, whereas during thesecond period (8.5 to 11. 5 weeks of age) modeling tends to favor resorption [26]. Therefore,from 3.5 to 8.5 weeks of age, trabecular bone mass in the risperidone treated animals islikely unable to reach its peak due to elevated resorption compared to B6 controls. Duringthe remainder of the treatment time (i.e. 8.5 to 11.5 weeks), formation and resorption beginto decrease, but resorption in the risperidone treated mice does not decrease to the level ofthe control mice. This effect, coupled to the inability of risperidone administered mice toreach peak trabecular bone mass, contributes to the greater % trabecular BV/TV reductionobserved in the mice with longer risperidone exposure. Thus, gender differences, agedifferences, levels of risperidone achieved, as well as the direct and indirect effects of thedrug on bone cells contribute to the skeletal response to this drug. Notwithstanding theseconfounding variables, it is clear that bone loss occurs with risperidone treatment of mice,independent of weight gain.
At a first glance, hyperprolactinemia would be another mechanism of bone loss secondary torisperidone, which is a dopamine receptor antagonist [11, 12]. However, there is controversyabout risperidone-induced hyperprolactinemia and we were unable to show an elevation inserum prolactin with either type of risperidone administration. Furthermore, female micesubjected to risperidone treatment did not show uterine atrophy that would be expected withhypogonadism (not shown). While there are data suggesting that high PRL levels are a long-term complication of risperidone treatment [27, 28], others indicate that its occurrence is a
Motyl et al. Page 7
Bone. Author manuscript; available in PMC 2013 February 1.
NIH
-PA Author Manuscript
NIH
-PA Author Manuscript
NIH
-PA Author Manuscript
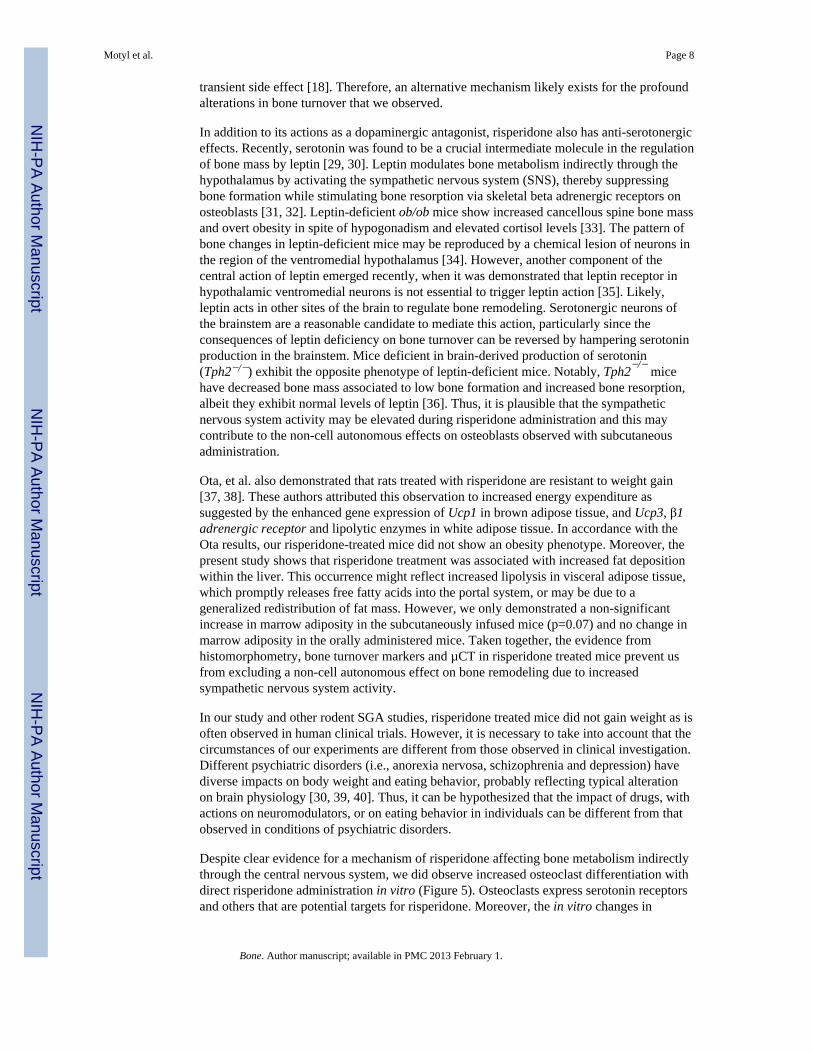
transient side effect [18]. Therefore, an alternative mechanism likely exists for the profoundalterations in bone turnover that we observed.
In addition to its actions as a dopaminergic antagonist, risperidone also has anti-serotonergiceffects. Recently, serotonin was found to be a crucial intermediate molecule in the regulationof bone mass by leptin [29, 30]. Leptin modulates bone metabolism indirectly through thehypothalamus by activating the sympathetic nervous system (SNS), thereby suppressingbone formation while stimulating bone resorption via skeletal beta adrenergic receptors onosteoblasts [31, 32]. Leptin-deficient ob/ob mice show increased cancellous spine bone massand overt obesity in spite of hypogonadism and elevated cortisol levels [33]. The pattern ofbone changes in leptin-deficient mice may be reproduced by a chemical lesion of neurons inthe region of the ventromedial hypothalamus [34]. However, another component of thecentral action of leptin emerged recently, when it was demonstrated that leptin receptor inhypothalamic ventromedial neurons is not essential to trigger leptin action [35]. Likely,leptin acts in other sites of the brain to regulate bone remodeling. Serotonergic neurons ofthe brainstem are a reasonable candidate to mediate this action, particularly since theconsequences of leptin deficiency on bone turnover can be reversed by hampering serotoninproduction in the brainstem. Mice deficient in brain-derived production of serotonin(Tph2−/−) exhibit the opposite phenotype of leptin-deficient mice. Notably, Tph2−/− micehave decreased bone mass associated to low bone formation and increased bone resorption,albeit they exhibit normal levels of leptin [36]. Thus, it is plausible that the sympatheticnervous system activity may be elevated during risperidone administration and this maycontribute to the non-cell autonomous effects on osteoblasts observed with subcutaneousadministration.
Ota, et al. also demonstrated that rats treated with risperidone are resistant to weight gain[37, 38]. These authors attributed this observation to increased energy expenditure assuggested by the enhanced gene expression of Ucp1 in brown adipose tissue, and Ucp3, β1adrenergic receptor and lipolytic enzymes in white adipose tissue. In accordance with theOta results, our risperidone-treated mice did not show an obesity phenotype. Moreover, thepresent study shows that risperidone treatment was associated with increased fat depositionwithin the liver. This occurrence might reflect increased lipolysis in visceral adipose tissue,which promptly releases free fatty acids into the portal system, or may be due to ageneralized redistribution of fat mass. However, we only demonstrated a non-significantincrease in marrow adiposity in the subcutaneously infused mice (p=0.07) and no change inmarrow adiposity in the orally administered mice. Taken together, the evidence fromhistomorphometry, bone turnover markers and µCT in risperidone treated mice prevent usfrom excluding a non-cell autonomous effect on bone remodeling due to increasedsympathetic nervous system activity.
In our study and other rodent SGA studies, risperidone treated mice did not gain weight as isoften observed in human clinical trials. However, it is necessary to take into account that thecircumstances of our experiments are different from those observed in clinical investigation.Different psychiatric disorders (i.e., anorexia nervosa, schizophrenia and depression) havediverse impacts on body weight and eating behavior, probably reflecting typical alterationon brain physiology [30, 39, 40]. Thus, it can be hypothesized that the impact of drugs, withactions on neuromodulators, or on eating behavior in individuals can be different from thatobserved in conditions of psychiatric disorders.
Despite clear evidence for a mechanism of risperidone affecting bone metabolism indirectlythrough the central nervous system, we did observe increased osteoclast differentiation withdirect risperidone administration in vitro (Figure 5). Osteoclasts express serotonin receptorsand others that are potential targets for risperidone. Moreover, the in vitro changes in
Motyl et al. Page 8
Bone. Author manuscript; available in PMC 2013 February 1.
NIH
-PA Author Manuscript
NIH
-PA Author Manuscript
NIH
-PA Author Manuscript

osteoclast differentiation are consistent with the in vivo histomorphometric data when miceare administered oral risperidone. However, as noted, we cannot exclude that there is a non-cell autonomous effect of risperidone on osteoblasts that stimulates RANKL andsubsequently causes increased bone resorption. One possibility is that this is sympatheticallymediated. Another possible mechanism is that risperidone activates PPARγ which cansuppress bone formation and enhance osteoclastogenesis. Interestingly, in the mice treatedby minipump, there was a four-fold increase in marrow adipocytes (p=0.07) that was notseen with oral administration.
In conclusion, the present data show that risperidone impacts bone remodeling in mice byacting on resorption and formation in both a cell autonomous and non-cell autonomousmanner. Consequently, we observed decreased bone mass and altered bonemicroarchitecture. In addition to reduced fat mass, risperidone therapy was associated withenlarged fatty liver. Thus, in addition to risperidone therapy creating conditions that couldaffect the central regulation of bone mass, the present study mandates that further clinicalstudies be focused on its direct effects on bone turnover, particularly in adolescents whenpeak bone mass is being acquired.
Highlights
• Risperidone reduced trabecular and cortical bone mass in mice
• Risperidone elevated bone resorption and suppressed bone formation
• Risperidone induced osteoclast (but not osteoblast) differentiation in vitro
• Weight gain did not contribute to risperidone-induced bone loss
AcknowledgmentsThe authors thank Phuong Le, Victoria DeMambro, Deborah Barlow, Marilena Preda and Terry Henderson fortechnical assistance. This work was funded by Grant Number F32AR061932 to K.J.M from the National InstituteOf Arthritis And Musculoskeletal And Skin Diseases; Grant Number 0102-09-1 to I.D.P. from CAPES, Brazil;MMCRI Intramural Award to A.E.M.; Grant Number 201650/2008-8 to F.J.A.P. from the National Council forScientific and Technological Development (CNPq), Brazil; and ARRA Grant Number AR054604 to C.J.R. fromthe National Institute Of Arthritis And Musculoskeletal And Skin Diseases. The content is solely the responsibilityof the authors and does not necessarily represent the official views of the funding agencies. This work wassupported by NIH grants P20 RR18789 and P20 RR15555 to Don M. Wojchowski and P30 RR030927 to RobertFriesel, and by institutional support from Maine Medical Center.
REFERENCES1. Kane JM, Correll CU. Past and present progress in the pharmacologic treatment of schizophrenia. J
Clin Psychiatry. 2010; 71:1115–1124. [PubMed: 20923620]2. Calarge CA, Acion L, Kuperman S, Tansey M, Schlechte JA. Weight gain and metabolic
abnormalities during extended risperidone treatment in children and adolescents. J Child AdolescPsychopharmacol. 2009; 19:101–109. [PubMed: 19364288]
3. Komossa K, Rummel-Kluge C, Schwarz S, Schmid F, Hunger H, Kissling W, Leucht S.Risperidone versus other atypical antipsychotics for schizophrenia. Cochrane Database Syst Rev.2011 CD006626.
4. Patel JK, Buckley PF, Woolson S, Hamer RM, McEvoy JP, Perkins DO, Lieberman JA. Metabolicprofiles of second-generation antipsychotics in early psychosis: findings from the CAFE study.Schizophr Res. 2009; 111:9–16. [PubMed: 19398192]
5. Houseknecht KL, Robertson AS, Zavadoski W, Gibbs EM, Johnson DE, Rollema H. Acute effectsof atypical antipsychotics on whole-body insulin resistance in rats: implications for adversemetabolic effects. Neuropsychopharmacology. 2007; 32:289–297. [PubMed: 17035934]
Motyl et al. Page 9
Bone. Author manuscript; available in PMC 2013 February 1.
NIH
-PA Author Manuscript
NIH
-PA Author Manuscript
NIH
-PA Author Manuscript

6. Correll CU, Manu P, Olshanskiy V, Napolitano B, Kane JM, Malhotra AK. Cardiometabolic risk ofsecond-generation antipsychotic medications during first-time use in children and adolescents.JAMA. 2009; 302:1765–1773. [PubMed: 19861668]
7. Goeb JL, Marco S, Duhamel A, Kechid G, Bordet R, Thomas P, Delion P, Jardri R. Metabolic sideeffects of risperidone in early onset schizophrenia. Encephale. 2010; 36:242–252. [PubMed:20620267]
8. Newcomer JW. Second-generation (atypical) antipsychotics and metabolic effects: a comprehensiveliterature review. CNS Drugs. 2005; 19 Suppl 1:1–93. [PubMed: 15998156]
9. Clemens TL, Karsenty G. The osteoblast: an insulin target cell controlling glucose homeostasis. JBone Miner Res. 2011; 26:677–680. [PubMed: 21433069]
10. Halbreich U. Osteoporosis, schizophrenia and antipsychotics: the need for a comprehensivemultifactorial evaluation. CNS Drugs. 2007; 21:641–657. [PubMed: 17630817]
11. Calarge CA, Zimmerman B, Xie D, Kuperman S, Schlechte JA. A cross-sectional evaluation of theeffect of risperidone and selective serotonin reuptake inhibitors on bone mineral density in boys. JClin Psychiatry. 2010; 71:338–347. [PubMed: 20331935]
12. Becker D, Liver O, Mester R, Rapoport M, Weizman A, Weiss M. Risperidone, but notolanzapine, decreases bone mineral density in female premenopausal schizophrenia patients. J ClinPsychiatry. 2003; 64:761–766. [PubMed: 12934975]
13. Liperoti R, Onder G, Lapane KL, Mor V, Friedman JH, Bernabei R, Gambassi G. Conventional oratypical antipsychotics and the risk of femur fracture among elderly patients: results of a case-control study. J Clin Psychiatry. 2007; 68:929–934. [PubMed: 17592919]
14. Dore DD, Trivedi AN, Mor V, Friedman JH, Lapane KL. Atypical antipsychotic use and risk offracture in persons with Parkinsonism. Mov Disord. 2009; 24:1941–1948. [PubMed: 19645066]
15. Meaney AM, O'Keane V. Bone mineral density changes over a year in young females withschizophrenia: relationship to medication and endocrine variables. Schizophr Res. 2007; 93:136–143. [PubMed: 17467954]
16. Kishimoto T, Watanabe K, Shimada N, Makita K, Yagi G, Kashima H. Antipsychotic-inducedhyperprolactinemia inhibits the hypothalamo-pituitary-gonadal axis and reduces bone mineraldensity in male patients with schizophrenia. J Clin Psychiatry. 2008; 69:385–391. [PubMed:18278991]
17. Bushe C, Yeomans D, Floyd T, Smith SM. Categorical prevalence and severity ofhyperprolactinaemia in two UK cohorts of patients with severe mental illness during treatmentwith antipsychotics. J Psychopharmacol. 2008; 22:56–62. [PubMed: 18477621]
18. Findling RL, Kusumakar V, Daneman D, Moshang T, De Smedt G, Binder C. Prolactin levelsduring long-term risperidone treatment in children and adolescents. J Clin Psychiatry. 2003;64:1362–1369. [PubMed: 14658952]
19. de Paula FJ, Dick-de-Paula I, Bornstein S, Rostama B, Le P, Lotinun S, Baron R, Rosen CJ. VDRHaploinsufficiency Impacts Body Composition and Skeletal Acquisition in a Gender-SpecificManner. Calcif Tissue Int. 2011
20. Parfitt AM, Drezner MK, Glorieux FH, Kanis JA, Malluche H, Meunier PJ, Ott SM, Recker RR.Bone histomorphometry: standardization of nomenclature, symbols, and units. Report of theASBMR Histomorphometry Nomenclature Committee. J Bone Miner Res. 1987; 2:595–610.[PubMed: 3455637]
21. Cabovska B, Cox SL, Vinks AA. Determination of risperidone and enantiomers of 9-hydroxyrisperidone in plasma by LC-MS/MS. J Chromatogr B Analyt Technol Biomed Life Sci.2007; 852:497–504.
22. Kawai M, Green CB, Lecka-Czernik B, Douris N, Gilbert MR, Kojima S, Ackert-Bicknell C, GargN, Horowitz MC, Adamo ML, Clemmons DR, Rosen CJ. A circadian-regulated gene, Nocturnin,promotes adipogenesis by stimulating PPAR-gamma nuclear translocation. Proc Natl Acad Sci US A. 2010; 107:10508–10513. [PubMed: 20498072]
23. Knegtering R, Baselmans P, Castelein S, Bosker F, Bruggeman R, van den Bosch RJ. Predominantrole of the 9-hydroxy metabolite of risperidone in elevating blood prolactin levels. Am JPsychiatry. 2005; 162:1010–1012. [PubMed: 15863810]
Motyl et al. Page 10
Bone. Author manuscript; available in PMC 2013 February 1.
NIH
-PA Author Manuscript
NIH
-PA Author Manuscript
NIH
-PA Author Manuscript

24. Riedel M, Schwarz MJ, Strassnig M, Spellmann I, Muller-Arends A, Weber K, Zach J, Muller N,Moller HJ. Risperidone plasma levels, clinical response and side-effects. Eur Arch Psychiatry ClinNeurosci. 2005; 255:261–268. [PubMed: 15565299]
25. Verma SK, Tan CH, Chan YH, Chong SA. Plasma risperidone levels and clinical response inpatients with first-episode psychosis. J Clin Psychopharmacol. 2005; 25:609–611. [PubMed:16282849]
26. Glatt V, Canalis E, Stadmeyer L, Bouxsein ML. Age-related changes in trabecular architecturediffer in female and male C57BL/6J mice. J Bone Miner Res. 2007; 22:1197–1207. [PubMed:17488199]
27. Kinon BJ, Ahl J, Liu-Seifert H, Maguire GA. Improvement in hyperprolactinemia and reproductivecomorbidities in patients with schizophrenia switched from conventional antipsychotics orrisperidone to olanzapine. Psychoneuroendocrinology. 2006; 31:577–588. [PubMed: 16488084]
28. Roke Y, van Harten PN, Boot AM, Buitelaar JK. Antipsychotic medication in children andadolescents: a descriptive review of the effects on prolactin level and associated side effects. JChild Adolesc Psychopharmacol. 2009; 19:403–414. [PubMed: 19702492]
29. Yadav VK, Oury F, Tanaka KF, Thomas T, Wang Y, Cremers S, Hen R, Krust A, Chambon P,Karsenty G. Leptin-dependent serotonin control of appetite: temporal specificity, transcriptionalregulation, and therapeutic implications. Exp Med. 2011; 208:41–52.
30. Kumar KK, Tung S, Iqbal J. Bone loss in anorexia nervosa: leptin, serotonin, and the sympatheticnervous system. Ann N Y Acad Sci. 2010; 1211:51–65. [PubMed: 21062295]
31. Russell M, Mendes N, Miller KK, Rosen CJ, Lee H, Klibanski A, Misra M. Visceral fat is anegative predictor of bone density measures in obese adolescent girls. J Clin Endocrinol Metab.2010; 95:1247–1255. [PubMed: 20080853]
32. Zhang Y, Proenca R, Maffei M, Barone M, Leopold L, Friedman JM. Positional cloning of themouse obese gene and its human homologue. Nature. 1994; 372:425–432. [PubMed: 7984236]
33. Hamrick MW, Della-Fera MA, Choi YH, Pennington C, Hartzell D, Baile CA. Leptin treatmentinduces loss of bone marrow adipocytes and increases bone formation in leptin-deficient ob/obmice. J Bone Miner Res. 2005; 20:994–1001. [PubMed: 15883640]
34. Takeda S, Elefteriou F, Levasseur R, Liu X, Zhao L, Parker KL, Armstrong D, Ducy P, KarsentyG. Leptin regulates bone formation via the sympathetic nervous system. Cell. 2002; 111:305–317.[PubMed: 12419242]
35. Balthasar N, Coppari R, McMinn J, Liu SM, Lee CE, Tang V, Kenny CD, McGovern RA, ChuaSC Jr, Elmquist JK, Lowell BB. Leptin receptor signaling in POMC neurons is required for normalbody weight homeostasis. Neuron. 2004; 42:983–991. [PubMed: 15207242]
36. Yadav VK, Oury F, Suda N, Liu ZW, Gao XB, Confavreux C, Klemenhagen KC, Tanaka KF,Gingrich JA, Guo XE, Tecott LH, Mann JJ, Hen R, Horvath TL, Karsenty G. A serotonin-dependent mechanism explains the leptin regulation of bone mass, appetite, and energyexpenditure. Cell. 2009; 138:976–989. [PubMed: 19737523]
37. Ota M, Mori K, Nakashima A, Kaneko YS, Fujiwara K, Itoh M, Nagasaka A, Ota A. Peripheralinjection of risperidone, an atypical antipsychotic, alters the bodyweight gain of rats. Clin ExpPharmacol Physiol. 2002; 29:980–989. [PubMed: 12366389]
38. Ota M, Mori K, Nakashima A, Kaneko YS, Takahashi H, Ota A. Resistance to excessivebodyweight gain in risperidone-injected rats. Clin Exp Pharmacol Physiol. 2005; 32:279–287.[PubMed: 15810992]
39. Baranowska B, Baranowska-Bik A, Bik W, Martynska L. The role of leptin and orexins in thedysfunction of hypothalamo-pituitary-gonadal regulation and in the mechanism of hyperactivity inpatients with anorexia nervosa. Neuro Endocrinol Lett. 2008; 29:37–40. [PubMed: 18283238]
40. Saarni SE, Saarni SI, Fogelholm M, Heliovaara M, Perala J, Suvisaari J, Lonnqvist J. Bodycomposition in psychotic disorders: a general population survey. Psychol Med. 2009; 39:801–810.[PubMed: 18713488]
Motyl et al. Page 11
Bone. Author manuscript; available in PMC 2013 February 1.
NIH
-PA Author Manuscript
NIH
-PA Author Manuscript
NIH
-PA Author Manuscript

Figure 1.Reduced body fat and femur areal bone mineral density after risperidone administration.Risperidone was administered to male B6 mice orally in the food for five or eight weeks,starting at 3.5 weeks of age. Lean mass, fat mass, total and femur areal BMD were measuredby DXA. Bars represent mean ± standard error of untreated (white) and risperidone treatedmice (black). N=8. *p<0.05 by Student’s t-test.
Motyl et al. Page 12
Bone. Author manuscript; available in PMC 2013 February 1.
NIH
-PA Author Manuscript
NIH
-PA Author Manuscript
NIH
-PA Author Manuscript

Figure 2.Reduced trabecular and cortical bone mass in the femur after eight weeks of risperidoneadministration. Shown are representative three-dimensional µCT images from control andrisperidone treated mice.
Motyl et al. Page 13
Bone. Author manuscript; available in PMC 2013 February 1.
NIH
-PA Author Manuscript
NIH
-PA Author Manuscript
NIH
-PA Author Manuscript

Figure 3.Reduced white adipose tissue and increased liver adiposity after five weeks of risperidonetreatment. (A) Representative abdominal MR images and epididymal fat mass. (B) Liver OilRed O staining (red stain indicates presence of lipids) and liver mass. Bars represent mean ±standard error of untreated (white) and risperidone treated mice (black). N=8. *p<0.05 byStudent’s t-test.
Motyl et al. Page 14
Bone. Author manuscript; available in PMC 2013 February 1.
NIH
-PA Author Manuscript
NIH
-PA Author Manuscript
NIH
-PA Author Manuscript

Figure 4.Subcutaneous infusion of risperidone did not alter total body, lean or fat mass, but didreduce femur areal BMD and serum P1NP. Risperidone was administered to female B6 miceby subcutaneously implanted osmotic minipump for four weeks, starting at 8 weeks of age.(A) Lean mass and fat mass were measured by DXA. (B) serumInsulin tolerance test. (C)Glucose tolerance test. (D) Total and femur aBMD were measured by DXA. (E) SerumP1NP and CTx were measured after an overnight fast. Bars represent mean ± standard errorof untreated (white) and risperidone treated mice (black). N=5. *p<0.05 by Student’s t-test.
Motyl et al. Page 15
Bone. Author manuscript; available in PMC 2013 February 1.
NIH
-PA Author Manuscript
NIH
-PA Author Manuscript
NIH
-PA Author Manuscript

Figure 5.Risperidone induces osteoclastogenesis in vitro. Whole bone marrow was cultured in thepresence of M-CSF and RANKL to induce osteoclastogenesis. From day 0, wells were alsotreated with 0, 2.5 or 25 ng/ml risperidone with each media change. Cells were fixed on day6 and stained for TRAP. Osteoclasts (positive for TRAP and containing 3 or more nuclei)were counted. Bars represent mean ± standard error. N=3. *p<0.05 by Student’s t-test.
Motyl et al. Page 16
Bone. Author manuscript; available in PMC 2013 February 1.
NIH
-PA Author Manuscript
NIH
-PA Author Manuscript
NIH
-PA Author Manuscript

NIH
-PA Author Manuscript
NIH
-PA Author Manuscript
NIH
-PA Author Manuscript
Motyl et al. Page 17
Table I
Male femur µCT after five and eight weeks of risperidone treatment.
Five Week Treatment Eight Week Treatment
Control (n=8) Risperidone (n=8) Control (n=8) Risperidone (n=8)
Trabecular
BV/TV (%) 8.1 ± 0.6 7.7 ± 0.8 9.5 ± 0.4 7.3 ± 0.6**
Tb.N (1/mm) 4.5 ± 0.1 4.3 ± 0.2 4.6 ± 0.1 4.2 ± 0.1*
Tb.Th (mm) 0.0379 ± 0.0010 0.0378 ± 0.0012 0.0401 ± 0.0007 0.0383 ± 0.0005
Tb.Sp (mm) 0.219 ± 0.007 0.233 ± 0.011 0.207 ± 0.004 0.232 ± 0.007*
Conn.D (1/mm3) 100 ± 12 92 ± 15 130 ± 12 82 ± 12*
Cortical
Tt.Ar (mm2) 1.96 ± 0.03 1.84 ± 0.02** 1.95 ± 0.02 1.98 ± 0.04
Ma.Ar (mm2) 1.12 ± 0.02 1.07 ± 0.01 1.05 ± 0.01 1.09 ± 0.02
Ct.Ar (mm2) 0.84 ± 0.02 0.77 ± 0.01** 0.90 ± 0.01 0.89 ± 0.02
Ct.Ar/Tt.Ar (%) 42.9 ± 0.3 41.7 ± 0.5* 46.1 ± 0.3 44.9 ± 0.4*
Ct.Th (mm) 0.191 ± 0.003 0.180 ± 0.002** 0.204 ± 0.002 0.201 ± 0.002
*p<0.05,
**p<0.01 compared to age-matched control by two-tailed Student’s t-test.
Abbreviations: BV/TV, bone volume/total volume; Tb., trabecular; N, number; Th, thickness; Sp, separation; Conn.D, connectivity density; Tt.,total; Ar, area; Ma, medullary; Ct., cortical.
Bone. Author manuscript; available in PMC 2013 February 1.

NIH
-PA Author Manuscript
NIH
-PA Author Manuscript
NIH
-PA Author Manuscript
Motyl et al. Page 18
Tabl
e II
Mal
e st
atic
and
dyn
amic
tibi
a hi
stom
orph
omet
ry a
fter f
ive
and
eigh
t wee
ks o
f ris
perid
one
treat
men
t.
Five
Wee
k Tr
eatm
ent
Eigh
t Wee
k Tr
eatm
ent
Con
trol
(n=6
–8)
Ris
peri
done
(n=8
)p
valu
eC
ontr
ol(n
=7–8
)R
ispe
rido
ne(n
=8)
p va
lue
BV
/TV
(%)
8.8
± 0.
47.
3 ±
0.5*
0.03
9.9
± 1.
16.
9 ±
0.7*
0.03
Tb.T
h (µ
m)
29.9
± 1
.227
.2 ±
1.0
0.10
31.3
± 1
.228
.5 ±
0.9
0.09
Tb.N
(/m
m)
2.95
± 0
.12
2.66
± 0
.12
0.11
3.12
± 0
.22
2.38
± 0
.19*
0.03
Tb.S
p (µ
m)
313
± 15
353
± 16
0.09
301
± 24
415
± 42
*0.
03
MS/
BS
(%)
27.7
± 4
.223
.2 ±
2.1
0.32
26.3
± 2
.527
.6 ±
2.3
0.71
MA
R (µ
m/d
ay)
2.03
± 0
.09
2.11
± 0
.18
0.72
1.18
± 0
.08
1.02
± 0
.07
0.15
BFR
/BS
(µm
3 /µm
2 /yea
r)19
9 ±
2418
0 ±
220.
5711
3 ±
1410
3 ±
130.
61
BFR
/BV
(%/y
ear)
1301
± 1
5012
73 ±
146
0.90
706
± 61
741
± 11
30.
78
BFR
/TV
(%/y
ear)
117
± 17
92 ±
10
0.21
76 ±
14
49 ±
70.
13
Ob.
S/B
S (%
)5.
2 ±
1.1
6.5
± 1.
30.
432.
3 ±
0.6
3.0
± 1.
00.
53
N.O
b/T.
Ar (
/mm
2 )26
.2 ±
4.9
28.9
± 4
.90.
7012
.2 ±
3.2
11.2
± 3
.00.
81
N.O
b/B
.Pm
(/m
m)
4.6
± 1.
05.
4 ±
0.8
0.57
2.1
± 0.
52.
4 ±
0.7
0.78
OV
/TV
(%)
0.04
4 ±
0.01
10.
047
± 0.
011
0.89
0.01
2 ±
0.00
40.
015
± 0.
006
0.63
OS/
BS
(%)
3.2
± 0.
83.
3 ±
0.7
0.89
0.8
± 0.
31.
6 ±
0.6
0.24
O.T
h (µ
m)
2.1
± 0.
32.
5 ±
0.2
0.35
2.7
± 0.
41.
6 ±
0.4
0.08
Oc.
S/B
S (%
)2.
5 ±
0.6
5.7
± 0.
9*0.
011.
5 ±
0.3
2.9
± 0.
5*0.
02
N.O
c/T.
Ar (
/mm
2 )6.
4 ±
1.6
11.8
± 1
.2*
0.02
3.3
± 0.
65.
2 ±
0.9
0.11
N.O
c/B
.Pm
(/m
m)
1.1
± 0.
32.
3 ±
0.3*
0.01
0.6
± 0.
11.
1 ±
0.1*
0.01
ES/B
S (%
)0.
98 ±
0.2
02.
56 ±
0.3
8*<0
.01
0.53
± 0
.14
0.93
± 0
.27
0.21
* p<0.
05 b
y tw
o-ta
iled
Stud
ent’s
t-te
st.
Abbr
evia
tions
: BV
, bon
e vo
lum
e; T
V, t
issu
e vo
lum
e; T
b., t
rabe
cula
r; N
, num
ber;
Th, t
hick
ness
; Sp,
sepa
ratio
n; M
S, m
iner
aliz
ing
surf
ace;
BS,
bon
e su
rfac
e; M
AR
, min
eral
app
ositi
on ra
te; B
FR, b
one
form
atio
n ra
te; O
b.S,
ost
eobl
ast s
urfa
ce; N
.Ob,
num
ber o
f ost
eobl
asts
; T.A
r, tis
sue
area
; B.P
m, b
one
perim
eter
; OV
, ost
eoid
vol
ume;
OS,
ost
eoid
surf
ace;
O.T
h, o
steo
id th
ickn
ess;
Oc.
S, o
steo
clas
t sur
face
;N
.Oc,
num
ber o
f ost
eocl
asts
; ES,
ero
ded
surf
ace.
Bone. Author manuscript; available in PMC 2013 February 1.

NIH
-PA Author Manuscript
NIH
-PA Author Manuscript
NIH
-PA Author Manuscript
Motyl et al. Page 19
Table III
Female tibia µCT after four weeks of risperidone infusion.
Osmotic Minipumpsp
valueSaline(n=5)
Risperidone(n=5)
Trabecular
BV/TV (%) 4.3 ± 0.6 2.4 ± 0.3* 0.02
Tb.N (1/mm) 3.1 ± 0.2 2.9 ± 0.1 0.07
Tb.Th (mm) 0.036 ± 0.002 0.033 ± 0.001 0.15
Tb.Sp (mm) 0.322 ± 0.017 0.359 ± 0.007 0.08
Conn.D (1/mm3) 28 ± 7 10 ± 2* 0.03
Cortical
Tt.Ar (mm2) 1.73 ± 0.01 1.67 ± 0.03 0.14
Ma.Ar (mm2) 0.98 ± 0.01 0.99 ± 0.02 0.56
Ct.Ar (mm2) 0.75 ± 0.01 0.68 ± 0.02* 0.03
Ct.Ar/Tt.Ar (%) 43.2 ± 0.5 40.6 ± 0.5* 0.02
Ct.Th (mm) 0.182 ± 0.003 0.168 ± 0.004* 0.02
*p<0.05 by two-tailed Student’s t-test.
Abbreviations: BV/TV, bone volume fraction; Tb., trabecular; N, number; Th, thickness; Sp, separation; Conn.D, connectivity density; Tt., total;Ar, area; Ma, medullary; Ct., cortical.
Bone. Author manuscript; available in PMC 2013 February 1.

NIH
-PA Author Manuscript
NIH
-PA Author Manuscript
NIH
-PA Author Manuscript
Motyl et al. Page 20
Table IV
Female static and dynamic histomorphometry after four weeks of risperidone infusion.
Osmotic Minipumps
Saline(n=4–5)
Risperidone(n=4–5)
p value
BV/TV (%) 5.1 ± 1.1 3.7 ± 0.9 0.34
Tb.Th (µm) 32.7 ± 2.5 30.4 ± 1.9 0.49
Tb.N (/mm) 1.50 ± 0.26 1.15 ± 0.24 0.34
Tb.Sp (µm) 775 ± 217 1230 ± 494 0.42
MS/BS (%) 30.4 ± 3.1 27.4 ± 2.8 0.49
MAR (µm/day) 2.96 ± 0.04 2.42 ± 0.10* <0.01
BFR/BS (µm3/µm2/year) 329 ± 32 241 ± 25 0.08
BFR/BV (%/year) 2181 ± 241 1436 ± 167* 0.04
BFR/TV (%/year) 95 ± 20 58 ± 18 0.22
Ob.S/BS (%) 6.6 ± 1.5 2.0 ± 1.4 0.05
N.Ob/T.Ar (/mm2) 15.5 ± 5.2 4.8 ± 3.1 0.12
N.Ob/B.Pm (/mm) 5.4 ± 1.4 1.5 ± 1.0 0.05
OV/TV (%) 0.003 ± 0.003 0.002 ± 0.001 0.82
OS/BS (%) 0.26 ± 0.26 0.46 ± 0.29 0.62
O.Th (µm) 0.69 ± 0.69 0.75 ± 0.46 0.95
Oc.S/BS (%) 2.9 ± 0.7 4.4 ± 0.9 0.19
N.Oc/T.Ar (/mm2) 3.1 ± 0.8 4.2 ± 1.1 0.43
N.Oc/B.Pm (/mm) 1.1 ± 0.2 1.7 ± 0.2 0.12
ES/BS (%) 1.49 ± 0.42 1.86 ± 0.39 0.53
N.Ad/T.Ar (/mm2) 7.9 ± 1.5 32.5 ± 10.0 0.07
*p<0.05 by two-tailed Student’s t-test.
Abbreviations: BV, bone volume; TV, tissue volume; Tb., trabecular; N, number; Th, thickness; Sp, separation; MS, mineralizing surface; BS,bone surface; MAR, mineral apposition rate; BFR, bone formation rate; Ob.S, osteoblast surface; N.Ob, number of osteoblasts; T.Ar, tissue area;B.Pm, bone perimeter; OV, osteoid volume; OS, osteoid surface; O.Th, osteoid thickness; Oc.S, osteoclast surface; N.Oc, number of osteoclasts;ES, eroded surface; N.Ad, number of adipocytes.
Bone. Author manuscript; available in PMC 2013 February 1.