FNP 2019 Proceedings of the Second Financial Narrative ...
87
FNP 2019 Proceedings of the Second Financial Narrative Processing Workshop (FNP 2019) 30 September, 2019 Turku University Turku, Finland
-
Upload
khangminh22 -
Category
Documents
-
view
6 -
download
0
Transcript of FNP 2019 Proceedings of the Second Financial Narrative ...

FNP 2019
Proceedings of the Second Financial Narrative ProcessingWorkshop (FNP 2019)
30 September, 2019Turku UniversityTurku, Finland

c©2019 The Association for Computational Linguistics
Order copies of this and other ACL proceedings from:
Association for Computational Linguistics (ACL)209 N. Eighth StreetStroudsburg, PA 18360USATel: +1-570-476-8006Fax: [email protected]
ISBN 978-1-950737-19-2
Preface
Welcome to the Second Financial Narrative Processing Workshop (FNP 2019) held at NoDaLiDa 2019 in Turku, Finland. Following the success of the First FNP 2018 at LREC’18, Japan, we have had a great deal of positive feedback and interest in continuing the development of the financial narrative processing field. This prompted us to hold a training workshop in textual analysis methods for financial narratives that was oversubscribed showing that there is an increasing interest in the subject. As a result, we were motivated to organise the Second Financial Narrative Processing Workshop, FNP 2019. The workshop will focus on the use of Natural Language Processing (NLP), Machine Learning (ML), and Corpus Linguistics (CL) methods related to all aspects of financial text mining and financial narrative processing (FNP). There is a growing interest in the application of automatic and computer-aided approaches for extracting, summarising, and analysing both qualitative and quantitative financial data. In recent years, previous manual small-scale research in the Accounting and Finance literature has been scaled up with the aid of NLP and ML methods, for example to examine approaches to retrieving structured content from financial reports, and to study the causes and consequences of corporate disclosure and financial reporting outcomes. One focal point of the proposed workshop is to develop a better understanding of the determinants of financial disclosure quality and the factors that influence the quality of information disclosed to investors beyond the quantitative data reported in the financial statements. The workshop will also encourage efforts to build resources and tools to help advance the work on financial narrative processing (including content retrieval and classification) due to the dearth of publicly available datasets and the high cost and limited access of content providers. The workshop aims to advance research on the lexical properties and narrative aspects of corporate disclosures, including glossy (PDF) annual reports, US 10-K and 10-Q financial documents, corporate press releases (including earning announcements), conferencecalls, media articles, social media, etc.
For FNP 2019 we collaborated with Fortia Financial Solutions, a French based company specialised in Financial Investment and Risk management who will work with us on organising a shared task on automatic detection of financial documents structure as part of FNP 2019. http://fortia.fr/
We accepted 11 submissions of which are 5 main workshop papers and 6 shared task papers, all papers accepted for oral presentation in the workshop. The papers cover a diverse set of topics in financial narratives processing reporting work on financial reports from different stock markets around the globe presenting analysis of financial reports. The quantity and quality of the contributions to the workshop are strong indicators that there is a continued need for this kind of dedicated Financial Narrative Processing workshop. We would like to acknowledge all the hard work of the submitting authors and thank the reviewers for the valuable feedback they provided. We hope these proceedings will serve as a valuable reference for researchers and practitioners in the field of financial narrative processing and NLP in general.
Dr Mahmoud El-Haj, General Chair, on behalf of the organizers of the workshop September 2019

Organising Committee
• Mahmoud El-Haj, Lancaster University, UK
• Paul Rayson, Lancaster University, UK
• Steven Young, Lancaster University, UK
• Houda Bouamor, Carnegie Mellon University in Qatar, Qatar
• Sira Ferradans, Fortia Financial Solutions, France
• Catherine Salzedo, Lancaster University, UK
iv
Program Committee
• Antonio Moreno Sandoval (UAM, Spain)
• Catherine Salzedo (LUMS, Lancaster University, UK)
• Denys Proux (Naver Labs, Switzerland)
• Djamé Seddah (INRIA-Paris, France)
• Eshrag Refaee (Jazan University, Saudi Arabia)
• George Giannakopoulos (SKEL Lab – NCSR Demokritos, Greece)
• Haithem Afli (Cork Institute of Technology, Ireland)
• Houda Bouamor (Carnegie Mellon University in Qatar, Qatar)
• Mahmoud El-Haj (SCC, Lancaster University, UK)
• Marina Litvak (Sami Shamoon College of Engineering, Israel)
• Martin Walker (University of Manchester, UK)
• Paul Rayson (SCC, Lancaster University, UK)
• Simonetta Montemagni (Istituto di Linguistica Computazionale – ILC, Italy)
• Sira Ferradans (Fortia Financial Solutions, France)
• Steven Young (LUMS, Lancaster University, UK)
v

Programme
09:00 09:15 Opening Remarks and Introduction to FNP
Session 1 Financial Narrative Processing Papers
09:15 09:40 Introduction to Financial Narrative Processing Tools and Resources Mahmoud El-Haj
09:40 10:05 Tone Analysis in Spanish Financial Reporting Narratives Antonio Moreno-Sandoval, Ana Gisbert, Pablo Alfonso Haya, Marta Guerrero and Helena Montoro
10:05 10:30 Coffee Break
10:30 10:55 Automated Stock Price Prediction Using Machine Learning Mariam Mokalled, Wassim El-Hajj and Mohamad Jaber
10:55 11:20 Utilizing Pre-Trained Word Embeddings to Learn Classification Lexicons with Little Supervision
Frederick Blumenthal and Ferdinand Graf
11:20 11:45 Towards Unlocking the Narrative of the United States Income Tax Forms with Natural Language Processing
Esme Manandise
11:45 12:10 Active learning for financial investment reports Sian Gooding and Ted Briscoe
12:10 13:30 Lunch Break
Session 2 FinTOC Shared Task
13:30 13:45 The FinTOC-2019 Shared Task: Financial Document Structure Extraction Remi Juge, Imane Bentabet and Sira Ferradans
13:45 14:00 UWB@FinTOC-2019 Shared Task: Financial Document Title Detection Tomas Hercig and Pavel Král
14:00 14:15 FinTOC-2019 Shared Task: Finding Title in Text Blocks Hanna Abi Akl, Anubhav Gupta and Dominique Mariko
14:15 14:30 FinDSE@FinTOC-2019 Shared Task Carla Abreu, Henrique Cardoso and Eugénio Oliveira

14:30 14:45 Daniel@FinTOC-2019 Shared Task : TOC Extraction and Title Detection Emmanuel Giguet and Gaël Lejeune
14:45 15:00 Finance document Extraction Using Data Augmented and Attention Ke Tian and Zi Jun Peng
15:00 15:05 Closing Remarks

Table of Contents
Finance document Extraction Using Data Augmentation and Attention . . . . . . . . . . . . 1Ke Tian and Zi Jun Peng
Utilizing Pre-Trained Word Embeddings to Learn Classification Lexicons with Little Super-vision . . . . . . . . . . . . . . . . . . . . . . . . . . . . . . . . . . . . . . . . . 5
Frederick Blumenthal and Ferdinand Graf
Automated Stock Price Prediction Using Machine Learning . . . . . . . . . . . . . . . . . . 16Mariam Mokalled, Wassim El-Hajj and Mohamad Jaber
Active Learning for Financial Investment Reports . . . . . . . . . . . . . . . . . . . . . . . 25Sian Gooding and Ted Briscoe
Towards Unlocking the Narrative of the United States Income Tax Forms . . . . . . . . . . 33Esme Manandise
Tone Analysis in Spanish Financial Reporting Narratives . . . . . . . . . . . . . . . . . . . 42Antonio Moreno-Sandoval, Ana Gisbert, Pablo Alfonso Haya, Marta Guerrero and Helena Montoro
The FinTOC-2019 Shared Task: Financial Document Structure Extraction . . . . . . . . . . 51Remi Juge, Imane Bentabet and Sira Ferradans
FinTOC-2019 Shared Task: Finding Title in Text Blocks . . . . . . . . . . . . . . . . . . . 58Hanna Abi Akl, Anubhav Gupta and Dominique Mariko
Daniel@FinTOC-2019 Shared Task : TOC Extraction and Title Detection . . . . . . . . . . 63Emmanuel Giguet and Gaël Lejeune
FinDSE@FinTOC-2019 Shared Task . . . . . . . . . . . . . . . . . . . . . . . . . . . . . 69Carla Abreu, Henrique Cardoso and Eugénio Oliveira
UWB@FinTOC-2019 Shared Task: Financial Document Title Detection . . . . . . . . . . . 74Tomas Hercig, Pavel Král
viii

Finance document Extraction Using Data Augmentation and Attention
Ke TianOPT Inc, Tokyo, Japan
Zijun PengHarbin Institute of Technology (Weihai),China
AbstractThis paper mainly describes the aiai that theteam submitted to the FinToc-2019 sharedtask. There are two tasks. One is the titledetection task from non-titles in the financedocuments. Another one is the TOC (tableof contents) prediction from the finance PDFdocument. The data augmented and attention-based LSTM and BiLSTM models are appliedto tackle the title-detection task. The experi-ment has shown that our methods perform wellin predicting titles in finance documents. Theresult achieved the 1st ranking score on the ti-tle detection leaderboard.
1 Introduction
In the finance field, a great number of finan-cial documents are published in machine-readableformats such as PDF file format for reportingfirms’ activities and financial situations or reveal-ing potential investment plans to shareholders, in-vestors, and the financial market. Official finan-cial prospectus PDF documents are the documentsthat describe precisely the characteristics and in-vestment modalities of investment funds. Mostprospectuses are published without a table of con-tents (TOC) to help readers navigate within thedocument by following a simple outline of head-ers and page numbers and assist legal teams inchecking if all the contents required are fully in-cluded. Thus, automatic analyses of prospectusesby which to extract their structure are becomingincreasingly more vital to many firms across theworld. Therefore, the second Financial narrativeprocessing (FNP) workshop is the first proposal ofthe FinTOC-2019 shared task to focus on the fi-nancial document structure extraction (Rmi Juge,2019). Two tasks are contained in the FinTOC-2019 task.
Title detection (task 1): This is a two-label clas-sifications task that detects text block as titles or
non-titles in the financial prospectuses document.For example, in the training data, there are about 9fields:
(1) text blocks: a list of strings computed bya heuristic algorithm; the algorithm segments thedocuments into homogeneous text regions accord-ing to given rules.
(2) begins with numbering : 1 if the text blockbegins with a numbering such as 1., A, b), III.,etc.; 0 otherwise
(3) is bold: 1 if the title appears in bold in thePDF document; 0 otherwise
(4) is italic: 1 if the title is in italic in the pdfdocument; 0 otherwise
(5) is all caps: 1 if the title is all composed ofcapital letters; 0 otherwise
(6) begins with cap: 1 if the title begins with acapital letter; 0 otherwise
(7) xmlfile: the xmlfile from which the abovefeatures have been derived
(8) page nb: the page number in the PDF whereappears the text bock
(9) label: 1 if text line is a title, 0 otherwiseThere are eight fields, which are the same as the
training data in the test data except the label field.The goal of this task is to detect the text blocks astitles or non-titles.
TOC generation (task2): this subtask will pre-dict the TOC from the PDF document. There areannotated TOCs in the XML format in the docu-ment structure as well as PDFs. The XML file iscomposed of TOC-titles with three attributes:
(1) title: a title of the document(2) page: the page number of the title(3) matter attrib: whether the title appears on
the front page, the body, or the back matter of thedocuments.
There are about five levels of titles that can beinferred from the hierarchy of the XML file. Thetraining documents are the same as those for the
1
title detection sub-task. The test documents arethe same as the training data with the title labels.The PDF and XML documents are provided in thetest data. The goal of this task is to generate theTOC XML file of the test data.
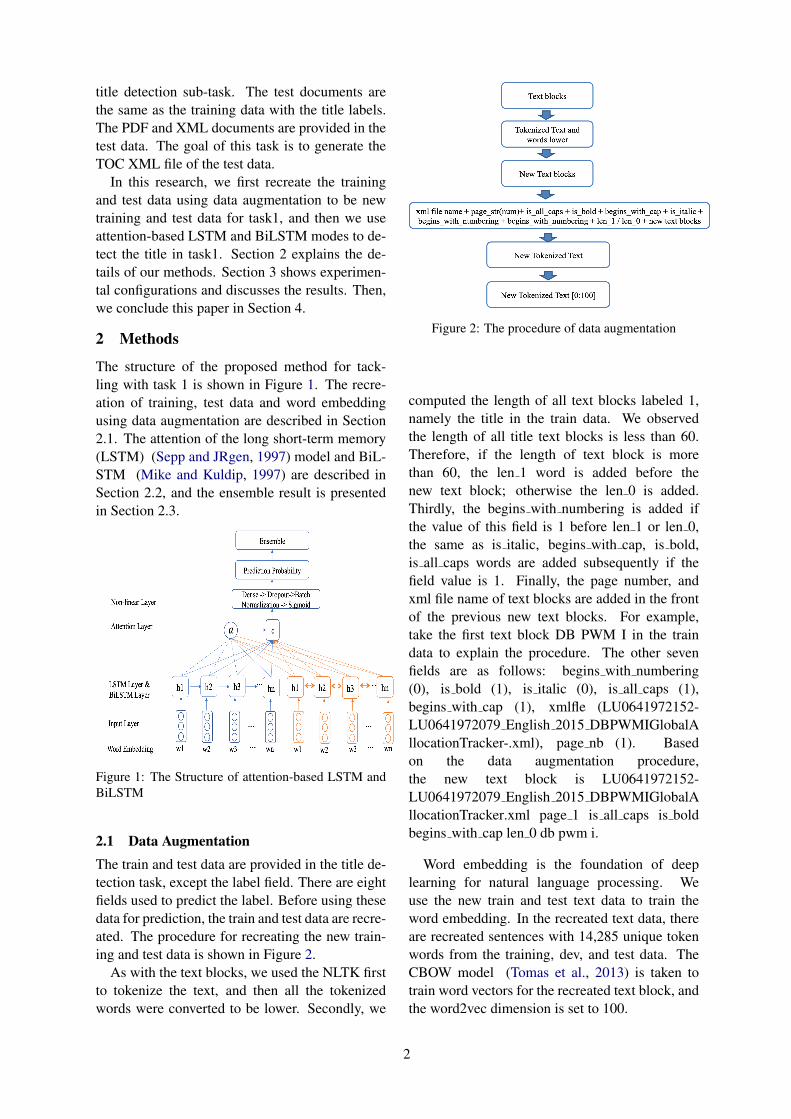
In this research, we first recreate the trainingand test data using data augmentation to be newtraining and test data for task1, and then we useattention-based LSTM and BiLSTM modes to de-tect the title in task1. Section 2 explains the de-tails of our methods. Section 3 shows experimen-tal configurations and discusses the results. Then,we conclude this paper in Section 4.
2 Methods
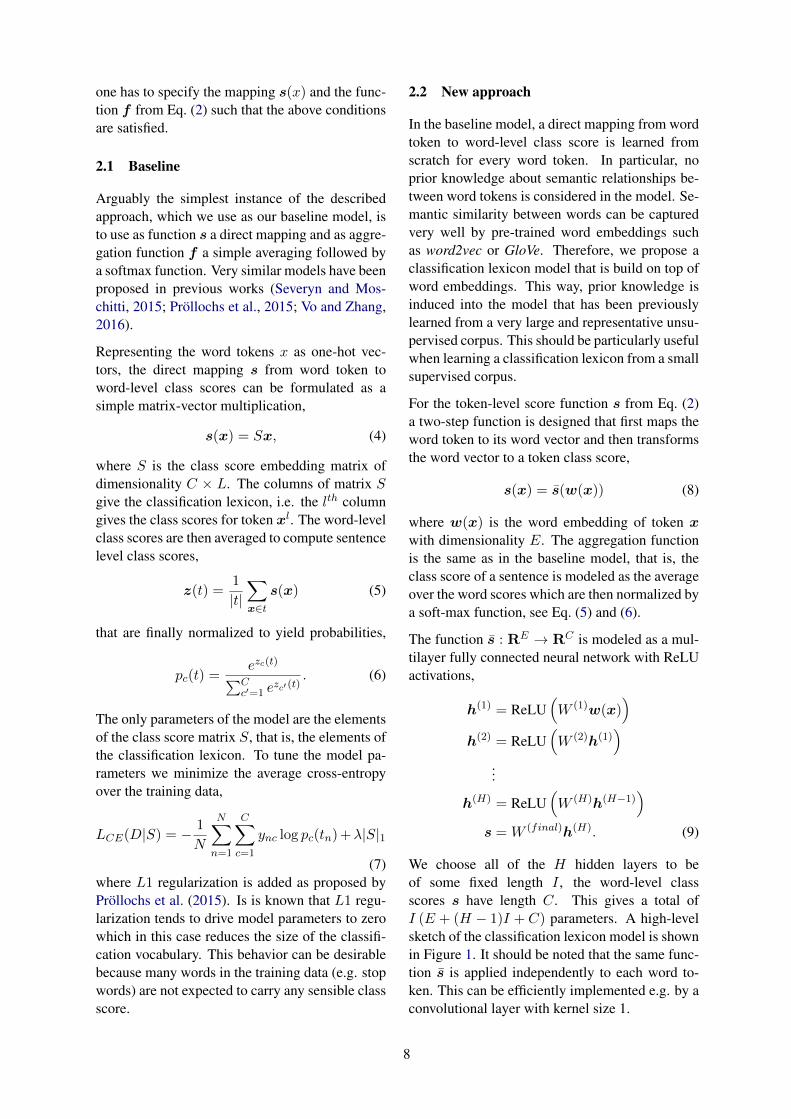
The structure of the proposed method for tack-ling with task 1 is shown in Figure 1. The recre-ation of training, test data and word embeddingusing data augmentation are described in Section2.1. The attention of the long short-term memory(LSTM) (Sepp and JRgen, 1997) model and BiL-STM (Mike and Kuldip, 1997) are described inSection 2.2, and the ensemble result is presentedin Section 2.3.
Figure 1: The Structure of attention-based LSTM andBiLSTM
2.1 Data AugmentationThe train and test data are provided in the title de-tection task, except the label field. There are eightfields used to predict the label. Before using thesedata for prediction, the train and test data are recre-ated. The procedure for recreating the new train-ing and test data is shown in Figure 2.
As with the text blocks, we used the NLTK firstto tokenize the text, and then all the tokenizedwords were converted to be lower. Secondly, we
Figure 2: The procedure of data augmentation
computed the length of all text blocks labeled 1,namely the title in the train data. We observedthe length of all title text blocks is less than 60.Therefore, if the length of text block is morethan 60, the len 1 word is added before thenew text block; otherwise the len 0 is added.Thirdly, the begins with numbering is added ifthe value of this field is 1 before len 1 or len 0,the same as is italic, begins with cap, is bold,is all caps words are added subsequently if thefield value is 1. Finally, the page number, andxml file name of text blocks are added in the frontof the previous new text blocks. For example,take the first text block DB PWM I in the traindata to explain the procedure. The other sevenfields are as follows: begins with numbering(0), is bold (1), is italic (0), is all caps (1),begins with cap (1), xmlfle (LU0641972152-LU0641972079 English 2015 DBPWMIGlobalAllocationTracker-.xml), page nb (1). Basedon the data augmentation procedure,the new text block is LU0641972152-LU0641972079 English 2015 DBPWMIGlobalAllocationTracker.xml page 1 is all caps is boldbegins with cap len 0 db pwm i.
Word embedding is the foundation of deeplearning for natural language processing. Weuse the new train and test text data to train theword embedding. In the recreated text data, thereare recreated sentences with 14,285 unique tokenwords from the training, dev, and test data. TheCBOW model (Tomas et al., 2013) is taken totrain word vectors for the recreated text block, andthe word2vec dimension is set to 100.
2
2.2 Attention-based LSTM and BiLSTMModel
After the data augmentation is completed, we onlytake the previous 120 words of each text block asthe input sentence. In the structure of the pro-posed model as shown in Fig. 1, the LSTM andBiLSTM layer, the embedding dimension and maxword length of word embedding are set to be 100and 120, respectively, as the embedding dimen-sion. The embedding layer of the word embeddingmatrix is an input layer of LSTM, and the size ofthe output dimension is 300.
Through the task train data, we observe thatsome keywords could help indicate the label ofthe text block. For example, most of title textblocks have the following features: len 0, be-gins with cap, is bold, is all caps. hus, some key-words in the new data have more importance topredict the label of the text block. Since the at-tention mechanism can enable the neural model tofocus on the relevant part of your input, such asthe words of the input text (Tian and Peng, 2019),attention mechanism is used to solve the task. Inthis paper, we mainly use the feed-forward atten-tion mechanism (Colin and Daniel, 2015). Theattention mechanism can be formulated with thefollowing mathematical formulation:
et = a(ht), αt =exp(et)∑T
k=1−exp(ek), c =
T∑
k=1
αtht
(1)In the above mathematical formulation, a is a
learnable function and only depend on ht. Thefixed length embedding c of the input sequencecomputes with an adaptive weighted average ofthe state sequence h to produce the attention value.
As the non-linear layer, the activation functionis to dense the output of the attention layer to be256 dimensions, and by using the dropout rate of0.25, the output result after the dropout rate willbe batch normalization. Finally, the sigmoid ac-tivation function that will dense the dimension ofbatch normalization input will be the length of thelabel as the final output layer.
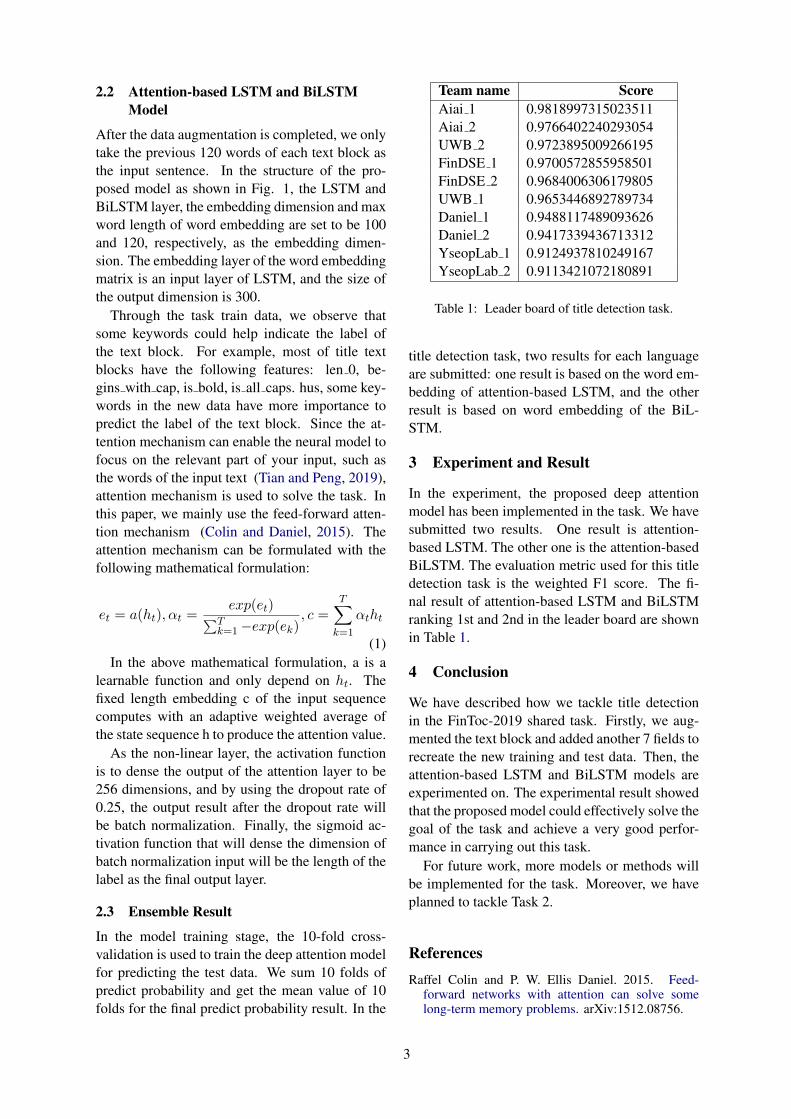
2.3 Ensemble Result
In the model training stage, the 10-fold cross-validation is used to train the deep attention modelfor predicting the test data. We sum 10 folds ofpredict probability and get the mean value of 10folds for the final predict probability result. In the
Team name ScoreAiai 1 0.9818997315023511Aiai 2 0.9766402240293054UWB 2 0.9723895009266195FinDSE 1 0.9700572855958501FinDSE 2 0.9684006306179805UWB 1 0.9653446892789734Daniel 1 0.9488117489093626Daniel 2 0.9417339436713312YseopLab 1 0.9124937810249167YseopLab 2 0.9113421072180891
Table 1: Leader board of title detection task.
title detection task, two results for each languageare submitted: one result is based on the word em-bedding of attention-based LSTM, and the otherresult is based on word embedding of the BiL-STM.
3 Experiment and Result
In the experiment, the proposed deep attentionmodel has been implemented in the task. We havesubmitted two results. One result is attention-based LSTM. The other one is the attention-basedBiLSTM. The evaluation metric used for this titledetection task is the weighted F1 score. The fi-nal result of attention-based LSTM and BiLSTMranking 1st and 2nd in the leader board are shownin Table 1.
4 Conclusion
We have described how we tackle title detectionin the FinToc-2019 shared task. Firstly, we aug-mented the text block and added another 7 fields torecreate the new training and test data. Then, theattention-based LSTM and BiLSTM models areexperimented on. The experimental result showedthat the proposed model could effectively solve thegoal of the task and achieve a very good perfor-mance in carrying out this task.
For future work, more models or methods willbe implemented for the task. Moreover, we haveplanned to tackle Task 2.
ReferencesRaffel Colin and P. W. Ellis Daniel. 2015. Feed-
forward networks with attention can solve somelong-term memory problems. arXiv:1512.08756.
3
Schuster Mike and K. Paliwal Kuldip. 1997. Bidirec-tional recurrent neural networks. IEEE TRANSAC-TIONS ON SIGNAL PROCESSING, 45:2673–2681.
Sira Ferradans Rmi Juge, Najah-Imane Bentabet. 2019.The fintoc-2019 shared task: Financial documentstructure extraction. In The Second Workshop onFinancial Narrative Processing of NoDalida 2019,Turku, Finland.
Hochreite Sepp and A Schmidhuber JRgen. 1997.Long short-term memory. Neural Computation,9:1735–1780.
Ke Tian and Zijun Peng. 2019. aiai at finnum task:Financial numeral tweets fine-grained classificationusing deep word and character embedding-based at-tention model. In The 14th NTCIR Conference.
Mikolov Tomas, Sutskever Ilya, Chen Kai, CorradoGreg, and Dean Jeffrey. 2013. Distributed represen-tations of words and phrases and their composition-ality. arXiv:1310.4546.
4
Utilizing Pre-Trained Word Embeddings to Learn Classification Lexiconswith Little Supervision
Frederick Blumenthald-fine GmbH
Ferdinand Grafd-fine GmbH
AbstractA lot of the decision making in financial insti-tutions, regarding particularly investments andrisk management, is data-driven. An importanttask to effectively gain insights from unstruc-tured text documents is text classification andin particular sentiment analysis. Sentimentlexicons, i.e. lists of words with correspondingsentiment orientations, are a very valuable re-source to build strong baseline models for sen-timent analysis that are easy to interpret andcomputationally efficient. We present a novelmethod to learn classification lexicons from alabeled text corpus that incorporates word sim-ilarities in the form of pre-trained word em-beddings. We show on two sentiment analy-sis tasks that utilizing pre-trained word embed-dings improves the accuracy over the baselinemethod. The accuracy improvement is partic-ularly large when labeled data is scarce, whichis often the case in the financial domain. More-over, the new method can be used to generatesensible sentiment scores for words outside thelabeled training corpus.
1 Introduction
A vast amount of information in business and es-pecially in the finance area is only available inthe form of unstructured text documents. Auto-matic text analysis algorithms are increasingly be-ing used to effectively and efficiently gain insightsfrom this type of data. A particularly importanttext analytics task is document classification, i.e.the task to assign a document to a category withina set of pre-defined categories. For example, an-nual reports, news articles and social media ser-vices like twitter provide textual information thatcan be used in conjunction with structured datato quantify the creditworthiness of a debtor. Togive another example, intelligent process automa-tion may require the categorization of documents
to determine the process flow. In both cases, soundtext classification algorithms help saving costs andefforts.
To tackle the problem of document classification,classical methods combine hand-engineered fea-tures, e.g. word-count based features, n-grams,part-of-speech tags or negations features, with anon-linear classification algorithm such as SupportVector Machine (Joachims, 1998). A detailed sur-vey of classical sentiment analysis models, a spe-cial case of text classification, has been compiledby Pang et al. (2008) and Liu (2012).
Since the reign of deep learning, various neuralnetwork architectures such as convolutional neu-ral networks (CNN) (Kim, 2014; dos Santos andGatti, 2014), character level CNNs (Zhang et al.,2015), recursive neural networks (Socher et al.,2013), recurrent neural network (RNN) (Wanget al., 2015; Liu et al., 2016) and transformers(Vaswani et al., 2017) have been utilized in textclassification models to yield state-of-the-art re-sults.
Recently, a steep performance increase has beenachieved by very large pre-trained neural lan-guage models such as ELMo (Peters et al., 2018),BERT (Devlin et al., 2018), XLNet (Yang et al.,2019) and more (Howard and Ruder, 2018; Rad-ford et al., 2018; Akbik et al., 2018). These mod-els generate powerful text representations that canbe either used as context-aware word embeddingsor the models can be directly fine tuned to specifictasks.
One disadvantage of these pre-trained languagemodels, however, is the high demand of mem-ory and computing power, e.g. a sufficiently largeGPU to load the large models. In finance, manydocuments that can be the subject of text classi-fication applications (e.g. annual reports or leg-
5
islative documents), are very large, so that thecomputational cost becomes very relevant. An-other disadvantage is that because of their com-plexity, many state-of-the-art deep learning mod-els are hard to interpret and it is very difficult to re-trace the model predictions. Model interpretabil-ity, however, seems to be particularly importantfor many financial institutions and interpretablemodels with transparent features are often favoredover more complex models even if the complexmodels are more accurate.
A powerful resource for building interpretabletext classification models are classification lexi-cons and in particular sentiment lexicons. A senti-ment lexicon is a list of words (or n-grams) whereeach word is assigned a sentiment orientation. Thesentiment orientation can be binary, i.e. each wordin the lexicon is labeled as positive or negative, orcontinuous where a continuous sentiment score isassigned to the words (e.g. in the interval [-1, 1]).More generally, a classification lexicon is a list ofwords where each word is assigned a vector withone score for each class.
Sentiment lexicons have been an integral part ofmany classical sentiment analysis classifiers (Mo-hammad et al., 2013; Vo and Zhang, 2015). Ap-proaches based on sentiment lexicons seem to beparticularly popular in the finance domain (Kear-ney and Liu, 2014). In addition, it has beenshown that even modern neural network modelscan profit from incorporating sentiment lexiconfeatures (Teng et al., 2016; Qian et al., 2016; Shinet al., 2016). Using classification lexicon featurescan be thought of as a way of inducing externalinformation that has been learned from differentdata sets or compiled by experts.
Three approaches to sentiment lexicon generationare usually distinguished in the literature, namelythe manual approach, the dictionary-based ap-proach and the corpus-based approach, see forexample (Liu, 2012, Chapter 6). A popularfinance specific lexicon has been compiled byLoughran and McDonald (2011) from 10-K fill-ings , but see also the General Inquirer (Stoneet al., 1962) and the Subjectivity Lexicon (Wilsonet al., 2005).
Fairly recently, models have been designed to gen-erate sentiment lexicons from a labeled text cor-pus. In many cases distant supervision approaches
are employed to generate large amounts of labeleddata. For example, Mohammad and Turney (2013)compiled a large twitter corpus where noisy labelsare inferred from emoticons and hashtags. Count-based methods such as pointwise mutual informa-tion (PMI) generate sentiment scores for wordsbased on their frequency in positive and negativetraining sentences (Mohammad and Turney, 2013;Kiritchenko et al., 2014).
A more direct approach to learn sentiment lexi-cons from labeled corpora is to use supervised ma-chine learning. The basic idea is to design a textclassification model that contains a parametrizedmapping from word token to sentiment score andan aggregation of word-level sentiment scoresto document scores. The parametrized mappingwhich yields the sentiment lexicon is learned dur-ing training. Severyn and Moschitti (2015) pro-posed a linear SVM model and showed that themachine learning approach outperforms count-based approaches. A simple linear neural networkmodel has been proposed by Vo and Zhang (2016).A similar model with a slightly more complex neu-ral network architecture is used by Li and Shah(2017). They use data from StockTwits, a socialmedia platform designed for sharing ideas aboutstocks, which they also use to generate sentiment-specific word embeddings.1 Prollochs et al. (2015)design a linear model and add L1 regularizationto optimally control the size of the sentiment lexi-cons.
We see two main challenges for the generation ofnew domain specific classification lexicons via apure supervised learning approach.
• The generation of robust classification lex-icons requires large amounts of supervisedtraining data. Manual labeling of data is veryexpensive and a distant (or weak) labeling ap-proach may not be possible for all applica-tions.
• Using small or medium size supervised train-ing data, one may encounter many words atprediction time that are not part of the train-ing corpus.
1The objective of sentiment-specific word embeddings,first proposed by Maas et al. (2011), is to map words (orphrases) close to each other if they are both semantically sim-ilar and have similar sentiment. A sentiment lexicon could beconsidered as one-dimensional or two-dimensional word em-beddings.
6
To tackle these problems, we propose a novel su-pervised method to generate classification lexi-cons by utilizing unsupervised data in the formof pre-trained word embeddings. This approachallows to build classification lexicons with verysmall amounts of supervised data. In particular,it allows extending the classification lexicon towords outside the training corpus, namely to allwords in the vocabulary of the pre-trained wordembedding.
The remainder of this paper is structured as fol-lows. Section 2 gives a short introduction tosupervised learning of classification lexicons ingeneral and then introduces the novel model ex-tension to utilize pre-trained word embeddings.We show empirically in Section 3 that the useof pre-trained word embeddings improves predic-tion accuracy and generates better classificationlexicons. The accuracy improvement is partic-ularly large for small training data sets. In ad-dition, we show that the model generates sensi-ble word-level class scores for words that are notpart of the training data. For the experiments weuse the popular SST-2 sentiment analysis datasetwhich is part of the GLUE benchmark and a newdataset of manually labeled financial newspaperheadlines. In Section 4 we describe how a mod-ification of the proposed method can be applied tohierarchical (multi-level) document classificationand supervised sentence highlighting in large doc-uments.
2 Methodology
The goal is to learn a classification lexicon, thatis, for a given set of word tokens (or n-grams)D = {x(l)}Ll=1, the task is to learn a domain spe-cific function s : D → RC that assigns each to-ken a vector of class scores. The resulting clas-sification lexicon L is then defined as the set oftuples consisting of tokens x(l) and correspondingC-dimensional class scores sl,
L = {(x(1), s1), . . . , (x(L), sL)}. (1)
In the specific case of sentiment analysis, thefunction s may be two-dimensional with chan-nels for positive and negative sentiment or higher-dimensional in order to represent fine-grained nu-ances of sentiment.
For supervised learning of the classification lexi-con, a data set with labeled text sentences is used,i.e. a data set D = {(tn, yn)}Nn=1 that consists ofsentences (or other pieces of text) tn with corre-sponding class label yn ∈ {1, . . . , C}. In this set-ting, the overall idea is to design a classificationmodel that consists of an elementwise mapping sfrom word token to word-level class scores and afunction f that aggregates the word class scores tosentence-level class probabilities,
p(t) = f(s(x1), s(x2), . . . , s(x|t|)
), (2)
with p ∈ [0, 1]C and |t| denotes the number ofwords in sentence t. The objective is to learn thefunctions s and f such that the model as accu-rately as possible predicts the sentence class labelsof the training data. The learned function s thenyields the mapping to generate the classificationlexicon.
Note that this is a special case of a more generalclass of hierarchical (multi-level) text classifica-tion models that generate class scores for low-levelsegments and then aggregate these scores to pro-duce document-level classifications. This is dis-cussed in more detail in Section 4.
In order to assure that the learned function s ac-tually produces sensible word-level class scores,the following two conditions have to be ful-filled.
• The function s(x) that maps a token to a classscore must not depend on context, i.e. eachword token in the lexicon must be mapped toa unique class score value. If the mappingwas context dependent, then a single wordmight be assigned to multiple class scores.
• The aggregation function f must be designedsuch that the predicted sentence-level classprobabilities have a clear dependence on theword-level class scores. In particular, anincrease in a certain word-level class scoremust ceteris paribus increase the sentence-level probability for this class (more than forany other class). That is, for each sentencet, each class c′ 6= c ∈ {1, . . . , C} and eachtoken x ∈ t,
∂pc(t)
∂sc(x)>∂pc′(t)
∂sc(x). (3)
To design a model instance in this general setting
7
one has to specify the mapping s(x) and the func-tion f from Eq. (2) such that the above conditionsare satisfied.
2.1 Baseline
Arguably the simplest instance of the describedapproach, which we use as our baseline model, isto use as function s a direct mapping and as aggre-gation function f a simple averaging followed bya softmax function. Very similar models have beenproposed in previous works (Severyn and Mos-chitti, 2015; Prollochs et al., 2015; Vo and Zhang,2016).
Representing the word tokens x as one-hot vec-tors, the direct mapping s from word token toword-level class scores can be formulated as asimple matrix-vector multiplication,
s(x) = Sx, (4)
where S is the class score embedding matrix ofdimensionality C × L. The columns of matrix Sgive the classification lexicon, i.e. the lth columngives the class scores for token xl. The word-levelclass scores are then averaged to compute sentencelevel class scores,
z(t) =1
|t|∑
x∈ts(x) (5)
that are finally normalized to yield probabilities,
pc(t) =ezc(t)
∑Cc′=1 e
zc′ (t). (6)
The only parameters of the model are the elementsof the class score matrix S, that is, the elements ofthe classification lexicon. To tune the model pa-rameters we minimize the average cross-entropyover the training data,
LCE(D|S) = − 1
N
N∑
n=1
C∑
c=1
ync log pc(tn) +λ|S|1(7)
where L1 regularization is added as proposed byProllochs et al. (2015). Is is known that L1 regu-larization tends to drive model parameters to zerowhich in this case reduces the size of the classifi-cation vocabulary. This behavior can be desirablebecause many words in the training data (e.g. stopwords) are not expected to carry any sensible classscore.
2.2 New approach
In the baseline model, a direct mapping from wordtoken to word-level class score is learned fromscratch for every word token. In particular, noprior knowledge about semantic relationships be-tween word tokens is considered in the model. Se-mantic similarity between words can be capturedvery well by pre-trained word embeddings suchas word2vec or GloVe. Therefore, we propose aclassification lexicon model that is build on top ofword embeddings. This way, prior knowledge isinduced into the model that has been previouslylearned from a very large and representative unsu-pervised corpus. This should be particularly usefulwhen learning a classification lexicon from a smallsupervised corpus.
For the token-level score function s from Eq. (2)a two-step function is designed that first maps theword token to its word vector and then transformsthe word vector to a token class score,
s(x) = s(w(x)) (8)
where w(x) is the word embedding of token xwith dimensionality E. The aggregation functionis the same as in the baseline model, that is, theclass score of a sentence is modeled as the averageover the word scores which are then normalized bya soft-max function, see Eq. (5) and (6).
The function s : RE → RC is modeled as a mul-tilayer fully connected neural network with ReLUactivations,
h(1) = ReLU(W (1)w(x)
)
h(2) = ReLU(W (2)h(1)
)
...
h(H) = ReLU(W (H)h(H−1)
)
s = W (final)h(H). (9)
We choose all of the H hidden layers to beof some fixed length I , the word-level classscores s have length C. This gives a total ofI (E + (H − 1)I + C) parameters. A high-levelsketch of the classification lexicon model is shownin Figure 1. It should be noted that the same func-tion s is applied independently to each word to-ken. This can be efficiently implemented e.g. by aconvolutional layer with kernel size 1.
8
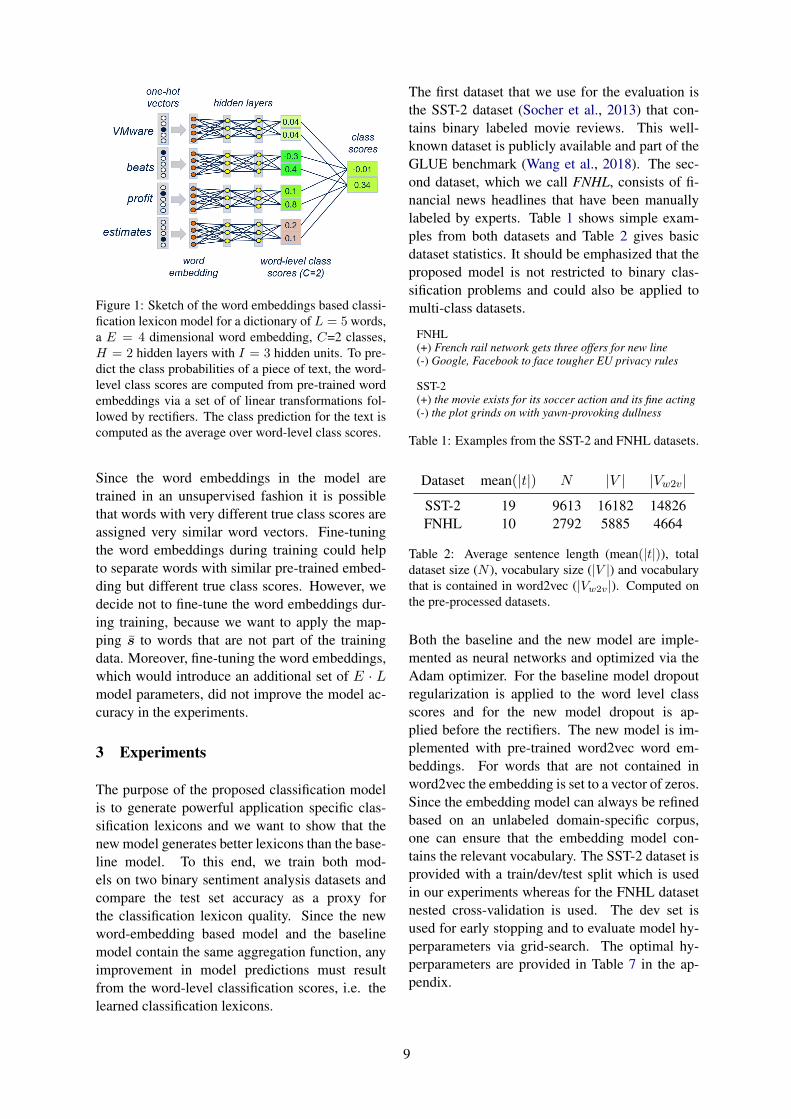
Figure 1: Sketch of the word embeddings based classi-fication lexicon model for a dictionary of L = 5 words,a E = 4 dimensional word embedding, C=2 classes,H = 2 hidden layers with I = 3 hidden units. To pre-dict the class probabilities of a piece of text, the word-level class scores are computed from pre-trained wordembeddings via a set of of linear transformations fol-lowed by rectifiers. The class prediction for the text iscomputed as the average over word-level class scores.
Since the word embeddings in the model aretrained in an unsupervised fashion it is possiblethat words with very different true class scores areassigned very similar word vectors. Fine-tuningthe word embeddings during training could helpto separate words with similar pre-trained embed-ding but different true class scores. However, wedecide not to fine-tune the word embeddings dur-ing training, because we want to apply the map-ping s to words that are not part of the trainingdata. Moreover, fine-tuning the word embeddings,which would introduce an additional set of E · Lmodel parameters, did not improve the model ac-curacy in the experiments.
3 Experiments
The purpose of the proposed classification modelis to generate powerful application specific clas-sification lexicons and we want to show that thenew model generates better lexicons than the base-line model. To this end, we train both mod-els on two binary sentiment analysis datasets andcompare the test set accuracy as a proxy forthe classification lexicon quality. Since the newword-embedding based model and the baselinemodel contain the same aggregation function, anyimprovement in model predictions must resultfrom the word-level classification scores, i.e. thelearned classification lexicons.
The first dataset that we use for the evaluation isthe SST-2 dataset (Socher et al., 2013) that con-tains binary labeled movie reviews. This well-known dataset is publicly available and part of theGLUE benchmark (Wang et al., 2018). The sec-ond dataset, which we call FNHL, consists of fi-nancial news headlines that have been manuallylabeled by experts. Table 1 shows simple exam-ples from both datasets and Table 2 gives basicdataset statistics. It should be emphasized that theproposed model is not restricted to binary clas-sification problems and could also be applied tomulti-class datasets.
FNHL(+) French rail network gets three offers for new line(-) Google, Facebook to face tougher EU privacy rules
SST-2(+) the movie exists for its soccer action and its fine acting(-) the plot grinds on with yawn-provoking dullness
Table 1: Examples from the SST-2 and FNHL datasets.
Dataset mean(|t|) N |V | |Vw2v|SST-2 19 9613 16182 14826FNHL 10 2792 5885 4664
Table 2: Average sentence length (mean(|t|)), totaldataset size (N ), vocabulary size (|V |) and vocabularythat is contained in word2vec (|Vw2v|). Computed onthe pre-processed datasets.
Both the baseline and the new model are imple-mented as neural networks and optimized via theAdam optimizer. For the baseline model dropoutregularization is applied to the word level classscores and for the new model dropout is ap-plied before the rectifiers. The new model is im-plemented with pre-trained word2vec word em-beddings. For words that are not contained inword2vec the embedding is set to a vector of zeros.Since the embedding model can always be refinedbased on an unlabeled domain-specific corpus,one can ensure that the embedding model con-tains the relevant vocabulary. The SST-2 dataset isprovided with a train/dev/test split which is usedin our experiments whereas for the FNHL datasetnested cross-validation is used. The dev set isused for early stopping and to evaluate model hy-perparameters via grid-search. The optimal hy-perparameters are provided in Table 7 in the ap-pendix.
9

3.1 Model Accuracy
Table 3 shows that the new model outperformsthe baseline model on both datasets which meansthat the new model generates better sentiment lex-icons. As an additional experiment we implementthe new model with ELMo embeddings which fur-ther increases the accuracy on the SST-2 datasetby 3.7%. Since ELMo embeddings are context-dependent this model does not yield a fixed sen-timent lexicon but instead yields a mapping fromsentence-token pair to sentiment scores.
To put the accuracy of the baseline modeland the new classification lexicon model intoperspective, we show in Table 3 the accu-racy on SST-2 for several GLUE benchmarkmodels as well as recent state-of-the-art mod-els as reported on the official GLUE web-site, see https://gluebenchmark.com/leaderboard. CBoW denotes an averagebag-of-words model using GloVe embeddings,GenSen (Subramanian et al., 2018) denotes theGLUE benchmark sentence representation modelwith best overall score and InferSent (Conneauet al., 2017) denotes the GLUE benchmark sen-tence representation model with best SST-2 score.For these models a mapping from sentence rep-resentation to class scores was trained. Our newclassification lexicon model outperforms the base-line models CBoW and GenSen whereas InferSentachieves slightly better accuracy.
The BiLSTM model with ELMo embeddings andattention (BiLSTM+ELMo+Attn) achieves only2.6% higher accuracy than NewElmo, i.e. a simplemapping from ELMo to token level class scores.As expected, the popular BERT model and XL-Net, the currently best performing model on theSST-2 task, achieve much better accuracy than ourproposed classification lexicon model. It shouldbe emphasized, however, that the purpose of theproposed model is not to achieve state-of-the-artaccuracy but to generate powerful sentiment lex-icons. Therefore, the most relevant result is thatthe proposed model outperforms the baseline clas-sification lexicon model which shows that the newmodel generates better sentiment lexicons.
To evaluate the dependency between training setsize and model accuracy, the experiments are re-peated with subsampled SST-2 training sets, seeFigure 2. For small training sets, the new model
FNHL SST-2
Baseline 77.4 (75.0, 78.4) 82.5New 82.8 (82.1, 83.9) 84.1NewElmo - 87.8
CBoW - 80.0GenSen - 83.1InferSent - 85.1BiLSTM+ELMo+Attn - 90.4BERT - 94.9XLNet - 96.8
Table 3: Accuracy of the baseline and new classifi-cation lexicon models. NewElmo denotes the imple-mentation of the new model with ELMo embeddings(which does not yield a lexicon). For comparison, theaccuracy on the SST-2 task are shown for the GLUEbaseline models CBoW, GenSen, InferSent and BiL-STM+ELMo+Attn as well as the popular BERT modeland the currently best performing model XLNet.
outperforms the baseline model by a large mar-gin. For example, with 1% of training samples(69 samples) the new model achieves 69% accu-racy compared to 54% for the baseline model andwith 5% of training samples (346 samples) thenew model yields an accuracy of 79% comparedto 66% for the baseline model.
Figure 2: Prediction accuracy on the SST-2 dataset withtraining set subsampled to different sizes. For smalltraining set sizes the new model significantly outper-forms the baseline model.
3.2 Sentiment Lexicons
After a quantitative comparison of the new andbaseline classification lexicon models, we nowwant to take a qualitative look at the generatedlexicons. Table 4 shows the tails of the senti-ment lexicons as generated by the new model onthe FNHL and SST-2 datasets. The well-known
10

domain-specific character of sentiment lexicons isapparent.
Positive words Negative words
SST-2melds, combines, mar-velously, enhances, hearts,sublimely, breathtaking,wonderfully, engagingly,supple, winningly, searing,enables, heartwarming,integrates, captures,mesmerizing, infuses,masterly, explores
charmless, ineffective, gar-bled, misfire, itis, use-less, uncreative, dumped,uninspiring, overinflated,unimaginative, unfocused,incoherent, drowned, un-ambitious, pointless, half-hearted, suffers, faulty,squandering
FNHLwins, bt, topping, air-show, turbines, awarded,selected, supercomputer,clinch, debut, paves,beats, tops, inks, secures,buoyed, success, boosted,driverless
violated, violations, falls,lapses, delisted, underre-porting, violating, fined,plummet, threatened, mis-led, sues, fining, drags,infringe, delisting, halts,breaches, fines, censures
Table 4: Example of words in the sentiment lexiconstrained on the FNHL and SST-2 datasets using theword-embedding based model.
Table 5 shows the largest word-level senti-ment score differences between baseline and newmodel. Qualitatively, the new model seems to gen-erate more sensible sentiment scores. For the com-parison, the two-channel word-level scores arefirst transformed to a scalar score, spos−sneg
spos+sneg, and
normalized to [−1, 1].
Table 5: Largest differences between sentiment lexi-cons generated by the baseline and new model.
3.3 Lexicon Extension
By design, the baseline model can only generateword-level class scores for words that are con-tained in the training corpus. The new model onthe other hand learns an application specific map-ping from word embedding to word-level class
scores. This makes it straight forward to gen-erate class-scores for words outside the trainingcorpus. To evaluate this property we apply thelearned mapping (from SST-2 dataset) to a subsetof the pre-trained word vectors in word2vec. Theword2vec set is filtered to lowercase 1-grams, i.e.phrases are excluded. This leaves a total of 180000words which is more than 10 times the number ofwords in the SST-2 training set vocabulary.
Table 6 shows the most positive and most nega-tive sentiment words when applied to the 180000tokens in word2vec. Most of the words look sen-sible, which shows that it is possible to gener-ate sentiment scores for words that are not con-tained in the training corpus. Arguably, this abil-ity to generate scores for unseen words is the rea-son why the new model significantly outperformsthe baseline model on very small training sizes asshown in Figure 2. Of course, the extension ofthe lexicons also generates poor scores for somewords. Qualitatively unplausible words are under-lined in Table 6. In general during all sentimentlexicon model evaluations we got the impressionthat negative words have better quality than posi-tive words.
Positive wordsequips, revolutionizing, amazes, reconnects, delighting,soothes, optimizes, prayerfully, backflip, accelerations,empowers, nourishes, maximizes, flyby, centenarians,transfixing, juxtaposes, exhilaratingly, purifies, frugally,caresses, predeceased, glistened, livability, centenarian,policyowners, gratified, securityholders, astound, elec-trifying, sacraments, equanimity, synchronizes
Negative wordsuncompetitive, unproductive, overstocking, misaligned,misconfigured, mistyped, spams, fritz, untargeted,scrapyard, clunked, uninformative, slouching, unwork-able, knockoffs, unmarketable, mixup, ineffectively,misdirected, forlornly, misspell, polluter, overlever-aged, overwrites, dumper, plagiarized, unemployable,unimpressive, defective, overloaded, flunky, laminitis
Table 6: Words in the word2vec set (filtered for low-ercase 1-grams) with most positive and most negativesentiment as generated by the proposed model that hasbeen trained on the SST-2 training set. Most wordsentiments are plausible, unplausible words are under-lined.
4 Hierarchical DocumentClassification
In some document classification tasks in the fi-nance domain one deals with very long docu-
11

ments, such as annual reports or legislative docu-ments, that may consist of more than 100 pages.In order to make model predictions more inter-pretable it would be desirable that the predic-tions on document level can be retraced to thesentence (or paragraph) level. One advanced ap-proach to achieve this level of locality is to incor-porate sentence-level attention in the document-level model, see for example (Yang et al., 2016).For each sentence the attention function indicateshow relevant the sentence is for the document-level model prediction. This makes the model pre-dictions more interpretable, i.e. the analyst couldbetter understand the model predictions by look-ing at the most relevant sentences.
A somewhat simpler approach is to build a modelthat generates class scores per sentence and thenaggregates these scores to document-level classscores. By designing the aggregation such that thedocument-level scores are in a direct relationshipto the sentence-level scores, one can train a jointmodel for document-level classification that – atthe same time – generates sentence-level predic-tions. This approach is analogous to the classifi-cation lexicon model where word-embeddings arereplaced by sentence representations. See Figure 3for a sketch of the model. The sentence represen-tation model is arbitrary and could be for examplea pre-trained language model such as BERT or ajointly trained BiLSTM pooling of ELMo embed-dings.
Figure 3: Sketch of a basic architecture for hierarchi-cal document classification. Sentence representationscan be computed for example by average pooling allword embeddings in the sentence. Sentence represen-tations are mapped by a parametric function to yieldthe sentence score for each class. Finally, aggrega-tion (e.g. simple averaging) of the sentence-level classscores yields the document level scores.
The described approach localizes model predic-tions to the sentence level and thereby makes pre-dictions on large documents interpretable. In addi-
tion, the approach can be utilized as a supervisedmethod to highlight important sentences in a docu-ment. For example, a financial institution that hasto process a large number of annual reports or fundreports can employ such methods to point the ana-lyst to the important parts of the document. In suchan application the final document prediction maynot be relevant primarily, but the highlighting viasentence level scores is important. Highlightingapproaches that we currently see in practice aremostly based on unsupervised text-summarizationalgorithms such as LexRank (Erkan and Radev,2004) , which also determines an importance scoreon sentence-level based on non-parametrical sim-ilarity measures and graph-methods, and can alsobe used in conjunction with our approach.
During our literature review on hierarchical doc-ument classification, no model was found thatis comparable to the approach described above.However, the general idea to design a joint modelfor document-level classification that generatessentence-level predictions as a byproduct is notnew and has been proposed for example by Yesse-nalina et al. (2010).
5 Conclusion
This paper presents a novel supervised method togenerate classification lexicons that utilizes unsu-pervised learning in the form of pre-trained wordembeddings. The method allows to build classifi-cation lexicons, e.g. sentiment lexicons, from verysmall amounts of labeled data and the model al-lows to extend the lexicons to words that are notcontained in the training corpus. This is very rel-evant for applications in the financial and compli-ance area, where labeled data is very sparse andusually very unbalanced. In addition, in these ar-eas cross-institutional data pooling is usually notpossible for data protection reasons, and data en-cryption would render the data useless.
It was shown that using the proposed methodwith context-dependent word embeddingssuch as ELMo yields powerful word-levelfeatures.2
To improve the overall classification lexicon2Implementing the approach with context-dependent
word-embeddings yields a context-dependent mapping fromwords to class scores and thus does not produce a classifica-tion lexicon.
12
model the knowledge distillation approach (Baand Caruana, 2014; Hinton et al., 2015) could beused where a simple model is trained on the rawpredictions of a more complex model. In ourcase the new classification lexicon model could betrained for example on the class scores (scores be-fore softmax function) of BERT or XLNet. Thepotential improvements of distilling knowledgefrom BERT to simple neural networks has beendemonstrated recently by Tang et al. (2019). Theclassification lexicon model could be further im-proved, e.g. by using phrases or n-grams, and es-caping named entities.
In Section 4 a modified version of the classifica-tion lexicon model is described that can be usedfor supervised sentence highlighting in large doc-uments. We would like to investigate the perfor-mance of this model in future work.
References
Alan Akbik, Duncan Blythe, and Roland Vollgraf.2018. Contextual string embeddings for sequence la-beling. In Proceedings of the 27th International Con-ference on Computational Linguistics, pages 1638–1649.
Jimmy Ba and Rich Caruana. 2014. Do deep nets reallyneed to be deep? In Advances in neural informationprocessing systems, pages 2654–2662.
Alexis Conneau, Douwe Kiela, Holger Schwenk,Loic Barrault, and Antoine Bordes. 2017. Super-vised learning of universal sentence representationsfrom natural language inference data. arXiv preprintarXiv:1705.02364.
Jacob Devlin, Ming-Wei Chang, Kenton Lee, andKristina Toutanova. 2018. Bert: Pre-training of deepbidirectional transformers for language understanding.arXiv preprint arXiv:1810.04805.
Gunes Erkan and Dragomir R. Radev. 2004. Lexrank:Graph-based lexical centrality as salience in text sum-marization. Journal of Artificial Intelligence Research,22:457–479.
Geoffrey Hinton, Oriol Vinyals, and Jeff Dean. 2015.Distilling the knowledge in a neural network. arXivpreprint arXiv:1503.02531.
Jeremy Howard and Sebastian Ruder. 2018. Universallanguage model fine-tuning for text classification. InProceedings of the 56th Annual Meeting of the Associ-ation for Computational Linguistics (Volume 1: LongPapers), volume 1, pages 328–339.
Thorsten Joachims. 1998. Text categorization withsupport vector machines: Learning with many relevant
features. In European conference on machine learning,pages 137–142. Springer.
Colm Kearney and Sha Liu. 2014. Textual sentimentin finance: A survey of methods and models. Interna-tional Review of Financial Analysis, 33:171–185.
Yoon Kim. 2014. Convolutional neural net-works for sentence classification. arXiv preprintarXiv:1408.5882.
Svetlana Kiritchenko, Xiaodan Zhu, and Saif M Mo-hammad. 2014. Sentiment analysis of short infor-mal texts. Journal of Artificial Intelligence Research,50:723–762.
Quanzhi Li and Sameena Shah. 2017. Learning stockmarket sentiment lexicon and sentiment-oriented wordvector from stocktwits. In Proceedings of the 21st Con-ference on Computational Natural Language Learning(CoNLL 2017), pages 301–310.
Bing Liu. 2012. Sentiment analysis and opinion min-ing. Synthesis lectures on human language technolo-gies, 5(1):1–167.
Pengfei Liu, Xipeng Qiu, and Xuanjing Huang. 2016.Recurrent neural network for text classification withmulti-task learning. arXiv preprint arXiv:1605.05101.
Tim Loughran and Bill McDonald. 2011. When is aliability not a liability? textual analysis, dictionaries,and 10-ks. The Journal of Finance, 66(1):35–65.
Andrew L Maas, Raymond E Daly, Peter T Pham, DanHuang, Andrew Y Ng, and Christopher Potts. 2011.Learning word vectors for sentiment analysis. In Pro-ceedings of the 49th annual meeting of the associa-tion for computational linguistics: Human languagetechnologies-volume 1, pages 142–150. Association forComputational Linguistics.
Saif M Mohammad, Svetlana Kiritchenko, and Xiao-dan Zhu. 2013. Nrc-canada: Building the state-of-the-art in sentiment analysis of tweets. arXiv preprintarXiv:1308.6242.
Saif M Mohammad and Peter D Turney. 2013. Crowd-sourcing a word–emotion association lexicon. Compu-tational Intelligence, 29(3):436–465.
Bo Pang, Lillian Lee, et al. 2008. Opinion mining andsentiment analysis. Foundations and Trends R© in In-formation Retrieval, 2(1–2):1–135.
Matthew E Peters, Mark Neumann, Mohit Iyyer, MattGardner, Christopher Clark, Kenton Lee, and LukeZettlemoyer. 2018. Deep contextualized word repre-sentations. arXiv preprint arXiv:1802.05365.
Nicolas Prollochs, Stefan Feuerriegel, and Dirk Neu-mann. 2015. Generating domain-specific dictionariesusing bayesian learning. In ECIS.
Qiao Qian, Minlie Huang, Jinhao Lei, and XiaoyanZhu. 2016. Linguistically regularized lstms for senti-ment classification. arXiv preprint arXiv:1611.03949.
13

Alec Radford, Karthik Narasimhan, Tim Salimans,and Ilya Sutskever. 2018. Improving language under-standing by generative pre-training. URL https://s3-us-west-2. amazonaws. com/openai-assets/research-covers/language-unsupervised/language understand-ing paper. pdf.
Cicero dos Santos and Maira Gatti. 2014. Deep convo-lutional neural networks for sentiment analysis of shorttexts. In Proceedings of COLING 2014, the 25th In-ternational Conference on Computational Linguistics:Technical Papers, pages 69–78.
Aliaksei Severyn and Alessandro Moschitti. 2015. Onthe automatic learning of sentiment lexicons. In Pro-ceedings of the 2015 Conference of the North Ameri-can Chapter of the Association for Computational Lin-guistics: Human Language Technologies, pages 1397–1402.
Bonggun Shin, Timothy Lee, and Jinho D Choi. 2016.Lexicon integrated cnn models with attention for senti-ment analysis. arXiv preprint arXiv:1610.06272.
Richard Socher, Alex Perelygin, Jean Wu, JasonChuang, Christopher D Manning, Andrew Ng, andChristopher Potts. 2013. Recursive deep models for se-mantic compositionality over a sentiment treebank. InProceedings of the 2013 conference on empirical meth-ods in natural language processing, pages 1631–1642.
Philip J. Stone, Robert F. Bales, J. Zvi Namenwirth,and Daniel M. Ogilvie. 1962. The general inquirer:A computer system for content analysis and retrievalbased on the sentence as a unit of information. Behav-ioral Science, 7(4):484–498.
Sandeep Subramanian, Adam Trischler, Yoshua Ben-gio, and Christopher J Pal. 2018. Learning gen-eral purpose distributed sentence representations vialarge scale multi-task learning. arXiv preprintarXiv:1804.00079.
Raphael Tang, Yao Lu, Linqing Liu, Lili Mou, OlgaVechtomova, and Jimmy Lin. 2019. Distilling task-specific knowledge from bert into simple neural net-works. arXiv preprint arXiv:1903.12136.
Zhiyang Teng, Duy Tin Vo, and Yue Zhang. 2016.Context-sensitive lexicon features for neural sentimentanalysis. In Proceedings of the 2016 Conference onEmpirical Methods in Natural Language Processing,pages 1629–1638.
Ashish Vaswani, Noam Shazeer, Niki Parmar, JakobUszkoreit, Llion Jones, Aidan N Gomez, ŁukaszKaiser, and Illia Polosukhin. 2017. Attention is all youneed. In Advances in Neural Information ProcessingSystems, pages 5998–6008.
Duy-Tin Vo and Yue Zhang. 2015. Target-dependenttwitter sentiment classification with rich automatic fea-tures. In IJCAI, pages 1347–1353.
Duy Tin Vo and Yue Zhang. 2016. Don’t count, pre-dict! an automatic approach to learning sentiment lex-icons for short text. In Proceedings of the 54th Annual
Meeting of the Association for Computational Linguis-tics (Volume 2: Short Papers), volume 2, pages 219–224.
Alex Wang, Amapreet Singh, Julian Michael, Fe-lix Hill, Omer Levy, and Samuel R Bowman. 2018.Glue: A multi-task benchmark and analysis platformfor natural language understanding. arXiv preprintarXiv:1804.07461.
Xin Wang, Yuanchao Liu, SUN Chengjie, BaoxunWang, and Xiaolong Wang. 2015. Predicting polaritiesof tweets by composing word embeddings with longshort-term memory. In Proceedings of the 53rd AnnualMeeting of the Association for Computational Linguis-tics and the 7th International Joint Conference on Nat-ural Language Processing (Volume 1: Long Papers),volume 1, pages 1343–1353.
Theresa Wilson, Janyce Wiebe, and Paul Hoffmann.2005. Recognizing contextual polarity in phrase-levelsentiment analysis. Proc. of HLT-EMNLP-2005.
Zhilin Yang, Zihang Dai, Yiming Yang, Jaime Car-bonell, Ruslan Salakhutdinov, and Quoc V Le.2019. Xlnet: Generalized autoregressive pretrain-ing for language understanding. arXiv preprintarXiv:1906.08237.
Zichao Yang, Diyi Yang, Chris Dyer, Xiaodong He,Alex Smola, and Eduard Hovy. 2016. Hierarchical at-tention networks for document classification. In Pro-ceedings of the 2016 Conference of the North Ameri-can Chapter of the Association for Computational Lin-guistics: Human Language Technologies, pages 1480–1489.
Ainur Yessenalina, Yisong Yue, and Claire Cardie.2010. Multi-level structured models for document-level sentiment classification. In Proceedings of the2010 Conference on Empirical Methods in NaturalLanguage Processing, pages 1046–1056. Associationfor Computational Linguistics.
Xiang Zhang, Junbo Zhao, and Yann LeCun. 2015.Character-level convolutional networks for text classi-fication. In Advances in neural information processingsystems, pages 649–657.
A Hyperparameters
The optimal model hyperparameters, see Table 7,are determined via grid search with evaluation onthe respective dev set. The batch size is fixed to100 and each model is trained until no further devset accuracy is observed.
14
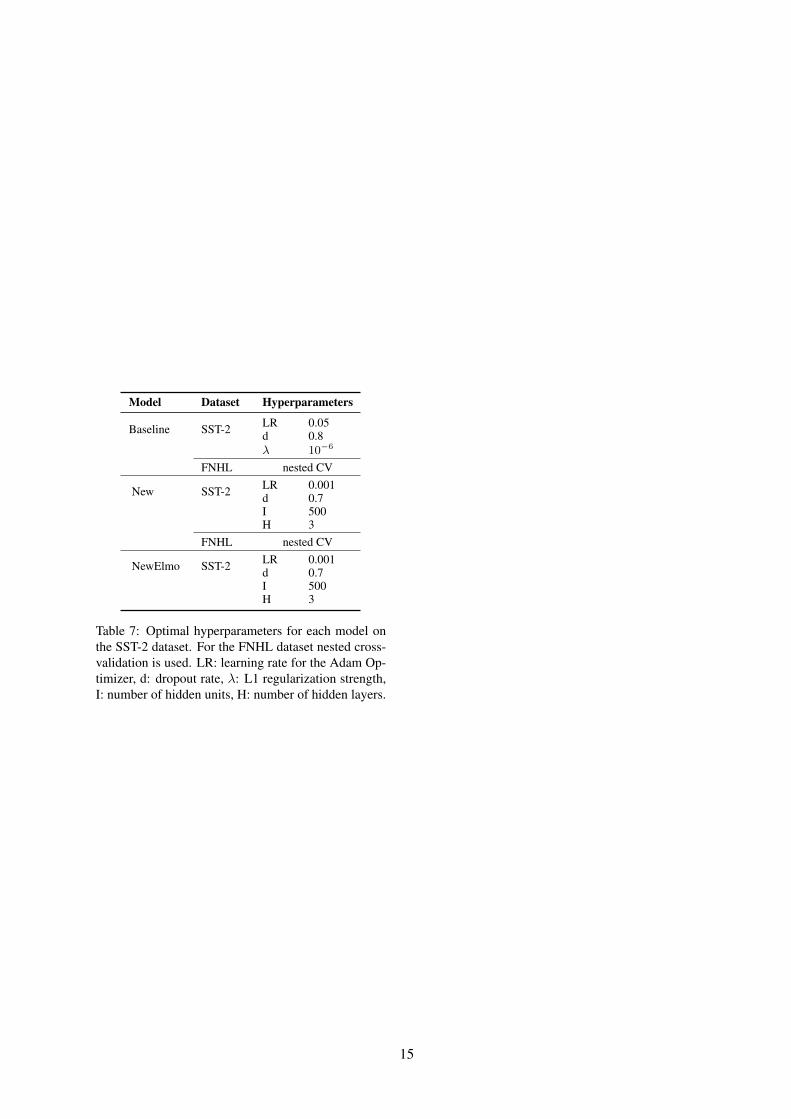
Model Dataset Hyperparameters
Baseline SST-2 LR 0.05d 0.8λ 10−6
FNHL nested CV
New SST-2 LR 0.001d 0.7I 500H 3
FNHL nested CV
NewElmo SST-2 LR 0.001d 0.7I 500H 3
Table 7: Optimal hyperparameters for each model onthe SST-2 dataset. For the FNHL dataset nested cross-validation is used. LR: learning rate for the Adam Op-timizer, d: dropout rate, λ: L1 regularization strength,I: number of hidden units, H: number of hidden layers.
15

Abstract
Traditionally and in order to predict market
movement, investors used to analyze the
stock prices and stock indicators in addition
to the news related to these stocks. Hence,
the importance of news on the stock price
movement. Most of the previous work in
this industry focused on either classifying
the released market news as (positive,
negative, neutral) and demonstrating their
effect on the stock price or focused on the
historical price movement and predicted
their future movement. In this work, we
propose an automated trading system that
integrates mathematical functions, machine
learning, and other external factors such as
news’ sentiments for the purpose of
achieving better stock prediction accuracy
and issuing profitable trades. Particularly,
we aim to determine the price or the trend
of a certain stock for the coming end-of-day
considering the first several trading hours
of the day. To achieve this goal, we trained
traditional machine learning algorithms
and created/trained multiple deep learning
models taking into consideration the
importance of the relevant news. Various
experiments were conducted, the highest
accuracy (82.91%) of which was achieved
using SVM for Apple Inc. (AAPL) stock
1 Introduction
The financial market is a dynamic and composite
system where people can buy and sell currencies,
stocks, equities and derivatives over virtual
platforms supported by brokers. The stock market
allows investors to own shares of public companies
through trading either by exchange or over-the-
counter markets. This market has given investors
the chance of gaining money and having a
prosperous life through investing small initial
amounts of money, low risk compared to the risk
of opening new business or the need of high salary
career (Investopedia, July 2008). Stock markets are
affected by many factors causing the uncertainty
and high volatility in the market.
Although humans can take orders and submit
them to the market, automated trading systems
(ATS) that are operated by the implementation of
computer programs can perform better and with
higher momentum in submitting orders than any
human. However, to evaluate and control the
performance of ATSs, the implementation of risk
strategies and safety measures applied based on
human judgements are required. Many factors are
incorporated and considered when developing an
ATS, for instance, trading strategy to be adopted,
complex mathematical functions that reflect the
state of a specific stock, machine learning
algorithms that enable the prediction of the future
stock value, and specific news related to the stock
being analyzed.
Several studies have been done on the topic of
predicting stock price trends mainly for a daily
timeframe, where models have been built
integrating different sources of data such as news
articles, twitter data, google and Wikipedia data.
All these external factors when integrated with
stock prices and stock technical indicators have
shown the effect on stock price movements.
The stock market is considered a volatile market
due to the external factors affecting its movements,
dynamicity of the market and complexity of
dimensionality which makes the prediction task of
the trend/price of the stock a difficult and
challenging task even with deep learning models
(Singh, Aishwarya 2019). These external factors
can be grouped into fundamental factors, technical
factors and market sentiments as follows:
Supply and demand. For example, if traders
tend to buy this stock more than selling it, this
will affect the price probably by rising since
the demand will be more than the supply.
Automated Stock Price Prediction Using Machine Learning
Mariam Moukalled Wassim El-Hajj Mohamad Jaber
Computer Science Department
American University of Beirut {mim23,we07,mj54}@aub.edu.lb
16
Stock prices can have unexpected moves
because of a single news which keeps a stock
artificially high or low. Hence, investors
cannot predict what will happen with a stock
on a day-to-day basis. This is called market
sentiment factors and they include company
news, economy, and world events.
Global economy. The flow of money and
transactions is based on the economy of the
traders which is affected by the economy of
the country.
Stock historical prices. Each stock has a range
which tick data moves within, when looking
into chart patterns and behavior of investors.
Public sentiments and social media. A tweet
from a president or an article release affects
the price of the related stock(s). For example,
an unofficial resignation of a CEO on twitter.
Natural disasters. For example, the “haiti
earthquake” that killed around 316,000
people affected the S&P index by going down
6.6% after 18 trading days.
Earnings per share (EPS) is a fundamental
factor that affects stock price. Investors tend
to purchase stocks with high EPS since they
know that they will gain substantial profits.
The demand on this stock, the company
management, the market sector dominance
and the cyclical industry performance result
in the movement of the stock price.
Inflation and deflation are technical factors.
Inflation means higher buy price and thus
higher interest rates. This will result in a
decrease of stock price. On the contrary,
deflation means lower buy prices and thus
lower profits and interest rate.
All these diverse factors and others affect price
movements, leading to a difficulty in stock
prediction. Researchers assume that market
prediction does not exhibit random behavior
(Schumaker, R. et al. 2009). Many publications
have been done on the topic attempting to increase
the accuracy of future price predictions. Mark L. et
al. (1994) studied the influence of public
information reported by Dow Jones and concluded
that a direct relation does exists between released
news articles and stock market activities.
News released related to an activity of a
company results in assumptions for traders that
will affect price movement. For instance, when
positive news is released, traders tend to buy
resulting in stock price increase. On the contrary,
when negative news is released, traders tend to sell
and thus pushing stock price to decrease. Although
there is no doubt that news affect traders’ actions,
only few studies use the news factor in predicting
price movement.
Different machine learning algorithms can be
applied on stock market data to predict future stock
price movements, in this study we applied different
AI techniques using market and news data. This
paper is arranged as follows. Section 2 provides
literature review on stock market prediction.
Section 3 details the data collection process, data
+cleaning, and the ML models’ design. Section 4
provides the experimental results, and section 5
concludes the paper and presents future work.
2 Related work and background
In the early research related to stock market
prediction, Fama, E. F. (1970) proposed the
Efficient Market Hypothesis (EMH) and Horne, J.
C., & Parker, G. G. (1967) proposed the Random
Walk theory. These theories proposed that market
prices are affected by information other than
historical prices and thus market price cannot be
predicted.
The EMH theory suggests that the price of a
stock depends completely on market information
and thus any new information will lead to a price
change as a reaction of the newly released
information. This theory also claimed that stocks
are always traded on their fair value, where traders
cannot buy nor sell stocks in a special price
undervalued or inflated and therefore the only way
a trader can increase her profits is by increasing her
risk. EMH discusses three different variations that
affect market price: Weak Form, where only
historical data is considered, semi- Strong Form,
which incorporates current public data in addition
to historical data, and Strong Form, which goes
farther to incorporate private data. EMH states that
any price movement is either a result of new
released information or a random move that would
prevent prediction models from success.
The Random Walk Hypothesis by Horne, J. C.,
& Parker, G. G. (1967) states that the stock prices
are randomly changed and argue that past price
movements are independent of current movements.
This is slightly different from EMH as it focuses on
short-term pattern of stock market.
Based on the above two hypotheses by Horne, J.
C. et al. (1967) and Fama, E. F. (1970), the stock
market will follow a random move and the
17
accuracy of predicting such movement cannot
exceeds 50%.
As opposed to these theories, many recent
studies have shown that stock market price
movement can be predicted to some degree. These
studies depend on two different types of financial
analysis to predict stock market prices:
Fundamental Analysis: it is based on the
health of the company and this includes
qualitative and quantitative factors such as
interest rate, return on assets, revenues,
expenses and price to earnings among others.
The aim of this analysis is to check the long-
term sustainability and strength of the
company for the purpose of long-term
investment.
Technical analysis: It is based on time series
data. Traders analyze historical price
movements and chart patterns and consider
time as a crucial parameter in the prediction.
Technical analysis can rely on three main
keys: stock prices movement although many
times the movement seems to be random,
historical trends which are assumed to repeat
as time passes, and all relevant information
about a stock.
In most recent studies, different machine
learning techniques have been used to predict stock
prices. Machine learning was proven to be a good
tool used in price predictions tasks due to the
techniques it uses in analyzing data to drawing
generalized pattern. Different machine learning
models and risk strategies have been applied to
stock market prediction task trying to predict
mainly the direction of the price for different time
frames and using different features that would
affect market prices.
Arévalo, A. et al. (2016) used four main features
as input to a Depp Neural Network (DNN) model.
These features can be considered as technical
analysis features for the stock market as they are
based on mathematical calculations as described
below:
Log return: a finance term that represents the
logarithmic difference between the close
price at time t and close price at time t-1
Pseudo-log-return: the logarithmic difference
between average prices of consecutive
minutes
Trend Indicator: a linear model applied on 1-
minute tick data to generate a linear equation
with a certain slope. A negative slope implies
a decrease in the price while a positive slope
implies an increase and a slope close to zero
implies that the price is almost stable.
Arévalo, A. et al. 2016 formalize the input data
as follows: the time feature which is included in the
inputs as minutes and hours parameters, and a
variable window size (n) which is used for the
other inputs. Thus, the input file will include last n
pseudo-log-return, last n standard deviations and
last n trend indicators. The output of the model was
“next one-minute pseudo-log-ret. Then after
having the input data file ready, it was given to a
DNN with one input layer, five hidden layers and
one output layer. The data was fragmented into
training and testing data. The model was trained
during 50 epochs with different window sizes and
the results show that window size 3 can show the
best performance of the model with accuracy 66%
and 0.07 MSE.
Weng, B. et al. (2017) attempted to predict one-
day ahead price movement using disparate sources
of data, where combining data from online sources
with prices and indicators can enhance the
prediction of the stock market state. This study was
tested on Apple Inc. (APPL) stock information
gathered over 3 years with multiple inputs and
different output targets. The target was a binary
value (0 or 1) which represent a fall or rise of
variation between prices. Four datasets were
gathered from disparate sources: first dataset
includes the public information available at yahoo
finance online for stock prices; second dataset
includes number of unique page visits to Wikipedia
per visitor per day; third dataset includes count of
data published on google related to a company on
a specific date; forth dataset includes three
technical indicators (Stochastic Oscillator, Larry
William, Relative Strength index) that represent
the variation of stock price over time. Additional
features were generated from the four datasets to
provide a meaningful parameter for the model.
Twenty features were selected as input. A common
observation was drawn, that for any target, all the
datasets were represented by at least one feature.
Different AI techniques: Artificial Neural Network
(ANN), Support Vector Machines (SVM) and
Decision Trees (DT) were applied to predict stock
price movement and compared to each other. After
the evaluation on the three different models listed
above, the output comparing open price of day
i+1 to open price of day i achieves the best
18

prediction accuracy with around 85% using SVM
model.
Schumaker, R. P. et al. (2009) tried to predict
direction of the price movement based on financial
news. The study was done in 2009 as market
prediction was and still facing difficulties due to
the ill-defined parameters. In order to use the
financial news articles in the prediction model,
news should be represented as numerical value.
Several techniques have been known to analyze
articles related to certain stock to label these
articles with sentiments or use them as vectors for
the input features. These techniques could be bag
of words, noun phrases, named entities and proper
nouns. Proper noun technique is a combination of
noun phrases and named entities. The proposed
technique outperformed other techniques based on
a comparison study.
AZFin Text is another system built by
(Schumaker, R. P. et al 2009) that predicts price
changes after 20 minutes of news release. The main
component of this system is the financial news
articles collected from yahoo finance and
represented as noun phrases; all the collected noun
phrases are represented as vector of binary values
indicating the presence or absence of a phrase in
the article. The second main component of this
system is the stock price data collected in one-
minute time frame. Then, the final major task after
collecting the data and formalizing the inputs was
building and training the AI model. To finalize the
input of the model, stock price quotation at the
same minute news was released, have been added
to the input matrix, in addition to that +20 minutes
price which will be the output of the system. The
data was then fed to different models. Support
Vector Regression (SVR) model was built to
predict the price after 20 minutes of news release.
Only the data during market time was included
leaving 1 hour for opening of the market to show
the effect of news released during the closure of the
market. Moreover, a new constraint was added to
the model where only one article could be used for
20 minutes. If two articles were released during the
same 20-minute period, both will be discarded. The
results show that the average directional accuracy
established was 71.18%.
It is evident that released news and published
articles affect the market. Most of the existing
studies analyzing news rely on shallow features
such as bag-of-words, named entities and noun
phrases. A newer representation was introduced by
(Ding, X. et al. 2014) which represents news as
structured events to predict the daily stock price
movement. Unlike the previous approaches, this
representation can show the relation between
events since representing phrases as vectors or bag
of words cannot show the actor, action, and the
actor which the action was applied on, thus trivial
representations cannot show the relation between
event and stock. To evaluate the performance of
this new representation, news articles data were
collected from Reuters and Bloomberg, in addition
to the daily close prices of S&P index.
Two different models were built to test the
representation: a linear SVM model which have
news document as input and +1 or -1 as output
indicating increase or decrease in the price for
different time frames (1 day, 1 week and 1 month).
A non-linear Deep neural network model is also
implemented to learn hidden relations between
events.
Input features for both linear and nonlinear
models were the same: bag-of-words features
which use the trivial TFIDF representation after
removing stop words and event features
represented by different combination of the tuple
(𝑜1, P, 𝑜2, 𝑜1+ P, P +𝑜2, 𝑜1+ P + 𝑜2 ) where 𝑜1 is
the first object to the left of extracted sentence
above and 𝑜2 is the nearest object to the right, and
P represents the verb. This feature representation is
used to reduce the sparseness of the representation
in addition to verb classes.
To evaluate the models, different scenarios were
applied. When comparing the results of the models
with the bag-of-words articles representation,
structured events showed a better performance.
From another perspective, when comparing the
models, DNN performed better than SVM due to
its ability to learn hidden relationships. Moreover,
it was distinguished from different timeframes
used (1 day, 1 week, 1 month); the shorter the
frame the better the results. Thus, the best model
was DNN with structured event features for daily
prediction with accuracy around 60%.
As shown from the above recent studies based
on machine learning, stock price movement can be
predicted with an accuracy more than 50% which
opposed the EMH and Random walk theory using
different timeframes, features, and models. In the
next section, we detail our proposed prediction
models and highlight its improved performance
over the existing models.
19
3 Proposed Method
The proposed approach is divided into multiple
steps, each detailed in this section as follows:
Section 3.1 describes the information sources that
we have used to build our system. Section 3.2
presents the processing of the data sources. Section
3.3 presents the way news and prices were aligned.
Section 3.4 presents the input features. Section 3.5
shows the way data was normalized, and section
3.6 discusses the proposed models.
3.1 Data Sources
Two sources of information are needed for our
study: (1) news sentiments and (2) historical prices.
Ten years tick data and news data were collected
from Reuters platform from January-01-2008 to
December 31-2017 for five different stocks AAPL
for shared of apple company, GOOGL for google
shares, AMZN for amazon shares, FB for
Facebook shares. Hence, a tick is a measure of the
minimum upward or downward movement in the
price. In many cases, a one second timeframe
includes many ticks reaching 20 to 30 ticks.
Tick data was collected to include the following
details: open bid, close bid, high bid, and low bid,
in addition to the time stamp. This high frequency
data is collected to do intra-day short-term
prediction. Our model requires at least one tick to
be released every 1 hour, since we group our data
hourly. This huge data requires some preprocessing
that takes into consideration the big volume of data
(7 trading hours * 3600 = 25200 tick price per day)
and the difference in interval between tick data.
Tick data might have multiple prices released at the
same second and miss some ticks at other seconds.
In addition to tick data, we have collected news
sentiments. News data includes the stock symbol,
date and time issued, source, news headline,
sentiment (0 for neutral news, 1 for positive news
and -1 for negative news), polarity of negative
sentiment, polarity of positive sentiment and
polarity of neutral sentiment. The polarity of news
is based on the count of positive/negative words in
the news article.
3.2 Data Preprocessing
Due to the huge amount of Tick data and to ease
the manipulation of data, we have imported our
data to MySQL database where sorting data is done
when querying.
The initial step was to replace missing ticks.
Tick data have different time intervals in the data
collected between ticks. This is due to data not
being recorded over some time. For example, a
second might have four prices recorded and other
seconds might not have even one price recorded.
To fill missing ticks, we look for the nearest tick
data to fill our missing seconds. After importing
data to our database and fill missing ticks, we
group our data into one-minute time interval where
we get the last tick received for each minute
recorded in our data. Then, we store clean one-
minute data in a new table (no weekends, no ticks
outside market open time).
3.3 Aligning news with tick data
Unlike other approaches that filter news outside
trading hours and news released during the same
interval, we built different scenarios to handle
these cases. When generating our data, we give the
user an option to choose between one of the
following three news scenarios:
1. Last sentiment received on that day based on
time to be used: for example, if we want to get
the sentiment for 01-03-2010 at 14:00 we, get
the last sentiment received on 01-03-2010
before 14:00 and adopt it. If no sentiments
exist, we consider the sentiment as neutral.
2. Last sentiment during selected interval of
time: if we are grouping our data into hourly
time frame, we check the last sentiment
released during this hour and consider it as
dominant sentiment and if no news released,
we consider the sentiment is neutral.
3. Overall average for the day during selected
interval: if more than one sentiment is
released during the time frame, we calculate
the average for positive (𝑎𝑝), negative (𝑎𝑛)
and neutral (𝑎𝑛𝑢) news (i.e: 𝑎𝑝 = 𝑠𝑢𝑚(𝑝𝑜𝑠𝑖𝑡𝑖𝑣𝑒 𝑛𝑒𝑤𝑠)
𝑐𝑜𝑢𝑛𝑡(𝑎𝑙𝑙 𝑛𝑒𝑤𝑠)⁄
In case of equal sentiments, we sum the
polarity of sentiments (polarity of positive
sentiment, polarity of negative sentiment,
polarity of neutral sentiment features) and
check which of these features have the
highest summation and consider it the
dominant sentiment. In case of equal polarity,
we consider neutral sentiment. In this
scenario we apply the above formulas on
weekend data for Monday sentiment label.
As for the tick data, data features were generated
from our one-minute and tick database tables based
20
on hour interval. As such, the input to the machine
learning algorithm will be hour data features with
one sentiment feature based on one of the above
scenarios and the output of the trained model will
be the close price of the day.
3.4 Features Generation
Different window sizes have been tested in our
models, i.e. how many hours you want to go back
when you want to train the models. This will
generate our input data in the following format
(window size * features).
The features used in our models are as follows:
Maximum: Maximum price received during
the selected hour
Minimum: Minimum price received during
the selected hour
Average: Average price received during the
selected hour
Standard Deviation: Standard deviation of
prices received during the selected hour
√1
𝑁∑(𝑥𝑖 −
∑ 𝑝𝑖
𝑐𝑜𝑢𝑛𝑡(𝑝𝑖))2
𝑁
𝑖=1
Pseudo Log Return: logarithmic difference
between average prices of two consecutive
hours.
ln (𝑝𝑡
𝑝𝑡−1)
where 𝑝𝑡 𝑖𝑠 𝑡ℎ𝑒 𝑎𝑣𝑒𝑟𝑎𝑔𝑒 𝑝𝑟𝑖𝑐𝑒 𝑎𝑡 𝑡𝑖𝑚𝑒 𝑡
Trend indicator: slope of linear model applied
on tick data of the respective hour, which
gives an idea about the trend during the last
hour.
Price: Last tick received at selected hour
Sentiment: News sentiment analysis
calculated based on chosen scenario
illustrated in section 3.3.
Hence, our input data have 8 features, the formula
of number of features is the following: Features=8n where n is window size
The output of our model is end of day price.
3.5 Data Normalization
Since the features extracted from the input data are
of different units and scale, normalization is
needed to scale the data between 0 and 1, which
will also help in faster convergence. To normalize
our data, we use the minmaxscaler function
provided by scikit-learn framework. This function
gets the max and the min values of each column
and performs the following formula:
𝑥𝑖 − min(𝑥)
max(𝑥) − min(𝑥)
Next, we experiment with various models, namely:
Recurrent neural network, Deep neural Network,
Support vector Machine and Support vector
Regression.
3.6 Models
In this section, we trained different models and
compared the effectiveness of recurrent neural
network (RNN), feed forward neural network
(FFNN), support vector machines (SVM) and
support vector regression (SVR) in predicting the
direction of today close price with respect to
yesterday close price based on the features
presented in section 3.4. We tested with the
following stocks: AAPL, GOOGL, AMZN and FB
for the data collected over 10 years.
For each model, we tried different combinations
of window sizes and sentiment scenarios. Window
size is a variable, which decides the different
number of trading hours during the day; to train our
model, we generate data for day d based on first
{4,5,6} trading hours of the day. The data was
normalized and split into two sets: training data of
90% and testing data of 10% for RNN, SVM and
SVR models. However, for FFNN we applied the
same structure presented in (Arévalo, A. et al.
2016) without data normalization and two data
sets: training of 85% and testing of 15%.
FFNN is widely used nowadays for different
problems such as classification, regression and
pattern recognition in various industries such as
financial operations, trading business, analytics
and product maintenance. In (Arévalo, A. et al.
2016), the network was formed of 5 layers each
with I, 4I/5, 3I/5, 2I/5, I/5 and 1 neuron where I
represent the number of inputs. Tanh was the
activation function used for all hidden layers and
linear function for output layer. This network was
applied on H2O platform (Arora, A., et al. 2015); a
leading open source data science platform. This
platform includes the implementation of deep
learning algorithms. After splitting the data into
85% training and 15% testing, we trained the
model for 50 epochs and applied ADADELTA
(Zeiler, M.D 2012) optimization algorithm to
improve learning rate learning process.
ADADELTA is a per-dimension adaptive learning
rate method for gradient descent, where it is not
21
necessary to search parameters for gradient descent
manually and is robust to large gradients and noise.
RNN is used for sequence data and differs from
DNN by its ability to keep data from previous
steps. The memory of RNN could be represented
by different cell types: Vanilla RNN (for short term
memory), LSTM and GRU (enhance short-term
memory of Vanilla RNN using gates mechanism).
In our RNN model, we have tried different
network structures with different number of
neurons at each layer. We tried different network
structure through varying the number of layers
between 3 and 7 while varying the number of
neurons at each layer between 250 and 5 neurons.
We tested the implemented networks to get the best
results for -layers and 4-layers networks.
We have trained and tested this model on
training and testing datasets generated after
normalization. The output is the actual price at end
of day. Moreover, we have tried different RNN
cells provided by TensorFlow. We trained our
model on Basic RNN cell, LSTM cell and GRU
cell. We trained the model for 100 epochs and
applied ADAMOptimizer as our optimization
algorithm to get the best learning rate for our
model.
SVM, a supervised machine learning algorithm,
can be used for both regression and classification
problems. This algorithm uses a kernel trick
technique that transforms the data and then finds
the optimal boundary between outputs. Moreover,
SVM shows that it can perform well on non-linear
dataset problems, based on the kernel we choose in
training SVM model. SVM have been widely used
for stock market prediction. In our SVM model, we
have tried different kernel algorithms tuning
parameters for each model: Linear, Polynomial and
RBF. We have trained and tested this model on our
training and testing datasets generated. The output
is the binary value, 0 when yesterday close price
goes down with respect to today close price and 1
when the price goes up. We used scikit-learn
library to build this model and we have trained the
model and applied GridSearchCV to choose the
best parameters to fit our model.
SVR is the same as SVM, however it is used for
regression instead of classification. It uses same
terms and functionalities as SVM to predict
continuous value. In this model, we follow the
same process of SVM except for the output, which
is not a class, rather end-of-day price.
4 Results and Discussion
In this section, we show the results obtained for the
models defined in section 3.6 on the various stocks.
The evaluation metrics are (1) directional accuracy,
which analyzes the direction of the predicted value
with respect to yesterday close price, (2) Precision,
which measures the relevancy of the result, (3)
Recall, which measures how many true relevant
results returned, and (4) F-measure, which
measures the weighted average of precision and
recall. Based on the directional accuracy metric
(table 2), SVM outperforms RNN, SVR and DNN
for different tested stocks. In table 1. We describe
the input data.
According to Table 2, it is very clear that our SVM
model is able to achieve accuracies way above the
50%. When looking at Table 3, it also clear that
SVM outperforms SVR, DNN, and RNN. All
achieved accuracies are above 75% and in the case
Table 1. Stock Data Details
Stock
Name
Total Data
points
Total
Articles
output direction
AAPL 19,243 78,036 1,478 positives
1,271 negatives
FB 11,515 30,198 886 positives
759 negatives
GOOGL 8,225 19,829 625 positives
550 negatives
AMZN 19,243 37,265 1,450 positives
1,299 negatives
Table 2. SVM Directional Accuracy Results
Sentim
ent-
Windo
w
Directional Accuracy
AAPL GOOG
L
AMZN FB
S1-4 78.18% 70.94% 75.27
%
68.9%
S1-5 83.36% 80.34% 74.91
%
73.17%
S1-6 81.73% 79.62% 65.82
%
74.66%
S2-4 79.27% 70.94% 74.18
%
73.17%
S2-5 82.64% 77.78% 74.18
%
74.01%
S2-6 81.09% 79.76% 68.36
%
73.27%
S3-4 79.27% 70.09% 75.64
%
75%
S3-5 82.91% 76.92% 70.18
%
73.78%
S3-6 81.64% 76.62% 68.73
%
60.74%
22

of APPL, the achieved accuracy is around 83%. All
our models achieved better results than those
reported in literature as indicated in Table 4.
Based on the reported results, we summarize our
contributions as follows:
We highlighted the effect of news sentiments
on the stock price movement
We identified best time interval for stock
price prediction.
We identified best news scenario and that
each stock is affected differently by news.
Our model analysis indicates that close price
or trend with respect to yesterday close price
can be predicted using various AI models.
Our proposed model can be used in different
ways. Firstly, our model can be used by
traders without programing information.
These traders can use our model either to only
predict the variation in price and help traders
in their analysis. Also they can use our
automated trading system without any
monitoring, where the system opens and
closes trades based on the predictions.
Finally, our code can be easily deployed to do
short-term trading.
5 Conclusion and Future Work
In this paper, we developed a stock price trend
prediction system. To build these models we have
gathered data from two sources (i) Historical stock
market data from Reuters and (ii) news sentiment
released on a certain stock; this data was collected
for 4 different stocks over 10 years. Technical
features have been calculated and used as input
data for our model in addition to 3 scenarios
considered when adding sentiments to the
calculated features. Our AI framework mainly
incorporate DNN, RNN, SVR and SVM for
prediction. We tested our proposed prediction
model on APPL, AMZN, GOOGL and FB stock
shares, for the data collected from (January 1, 2008
to December 31,2017), resulting in a 82.91%
accuracy. According to our knowledge, this is the
best accuracy achieved in literature so far.
After developing our model, and to show its
performance we would implement a risk strategy
to check the profits we would gain based on our
predictions and a few enhancements can be done
and studied for our prediction model. One direction
is to add extra technical indicators used in stock
market. Another direction would be trying different
time-frames for grouping our data. Finally, we
could try to enhance the prediction of the exact
price.
References
Weng, B., Ahmed, M. A., & Megahed, F. M. (2017).
Stock market one-day ahead movement prediction
using disparate data sources. Expert Systems with
Applications,79, 153-163.
doi:10.1016/j.eswa.2017.02.041
Li, X., Huang, X., Deng, X., & Zhu, S. (2014).
Enhancing quantitative intra-day stock return
prediction by integrating both market news and
stock prices information. Neurocomputing, 142,
228-238. doi:10.1016/j.neucom.2014.04.043
Arévalo, A., Niño, J., Hernández, G., & Sandoval, J.
(2016). High-Frequency Trading Strategy Based on
Deep Neural Networks. Intelligent Computing
Methodologies Lecture Notes in Computer Science,
424436. doi:10.1007/978-3-319-42297-8_40
Horne, J. C., & Parker, G. G. (1967). The Random-
Walk Theory: An Empirical Test. Financial Analysts
Journal, 23(6), 87-92. doi:10.2469/faj.v23.n6.87
Fama, E. F. (1970). Efficient Capital Markets: A
Review of Theory and Empirical Work. The Journal
of Finance, 25(2), 383. doi:10.2307/2325486
Schumaker, R. P., & Chen, H. (2009). A quantitative
stock prediction system based on financial news.
Information Processing & Management, 45(5), 571-
583. doi:10.1016/j.ipm.2009.05.001
Ding, X., Zhang, Y., Liu, T., & Duan, J. (2014). Using
Structured Events to Predict Stock Price Movement:
An Empirical Investigation. Proceedings of the
Table 3. All Models Directional Accuracy
SVM SVR DNN RNN
APPL 82.91% 79.2% 81.32% 81.3%
AMZN 75.27% 72.26% 74.03%
74.56
%
GOOGL 80.34% 66.38% 80.1%
68.38
%
FB 75% 68.71% 72.68%
72.39
%
Table 4. Related Work Accuracies
Paper Metric Value
Arévalo, A. et al.
(2016)
Directional
Accuracy
66%
Schumaker, R. P.
et al. (2009)
Directional
Accuracy
71.18%
Ding, X. et al.
(2014)
Accuracy 60%
23

2014 Conference on Empirical Methods in Natural
Language Processing (EMNLP).
doi:10.3115/v1/d14-1148
Schumaker, R. P., & Chen, H. (2009). A quantitative
stock prediction system based on financial news.
Information Processing & Management, 45(5), 571-
583. doi:10.1016/j.ipm.2009.05.001
Bollen, J., & Mao, H. (2011). Twitter Mood as a Stock
Market Predictor. Computer,44(10), 91-94.
doi:10.1109/mc.2011.323
Arora, A., et al.: Deep Learning with H2O (2015)
learning process 20. Zeiler, M.D.: ADADELTA: An
Adaptive Learning Rate Method, 6 (2012)
learning process 20. Zeiler, M.D.: ADADELTA: An
Adaptive Learning Rate Method, 6 (2012)
Investopedia. “World's Greatest Investors.”
Investopedia, Investopedia, 9 July 2008,
www.investopedia.com/slide-show/worlds-
greatest-investors/.
Singh, Aishwarya. “Predicting the Stock Market Using
Machine Learning and Deep Learning.” Analytics
Vidhya, 26 July 2019,
www.analyticsvidhya.com/blog/2018/10/predicting
-stock-price-machine-learningnd-deep-learning-
techniques-python/.
Mark L. Mitchell and J. Harold Mulherin The Journal
of Finance Vol. 49, No. 3, Papers and Proceedings
Fifty-Fourth Annual Meeting of the American
Finance Association, Boston, Massachusetts,
January 3-5, 1994 (Jul., 1994), pp. 923-950
24
Active Learning for Financial Investment Reports
Sian Gooding and Ted BriscoeDept of Computer Science and Technology
University of Cambridge{shg36|ejb}@cam.ac.uk
Abstract
Investment reports contain qualitative infor-mation from numerous sources. Due to thehuge volume of online business information,it is increasingly difficult for financial analyststo track and read all relevant texts. In this pa-per, we develop a novel tool to assist finan-cial analysts when writing an investment re-port. We perform multi-class classification onbusiness texts to categorise them into informa-tive investment topics. Using active learningwe show that we can obtain the same F1-scoreof 0.74 with 58% less data.
1 Introduction
Financial analysts guide investors and asset man-agers in their investment choices (Knorr Cetinaand Preda, 2012) by providing investment researchinformation, recommendations, advice or marketdecisions (Bauman and Dowen, 1988). Such in-formation is typically presented in report formatand used by investors to inform portfolio decisions(Baker and Haslem, 1973).
Investment reports contain information fromnumerous sources and aim to present facts in acoherent and readily intelligible manner (Grahamet al., 1934). As well as quantitative measures, in-vestment reports cover a wide range of qualitativetopics such as customer satisfaction, brand recog-nition, and corporate social responsibility (Huanget al., 2014).
Due to the rise of online resources, the avail-ability and accessibility of business informationhas rapidly increased (Fogarty and Rogers, 2005).Owing to this, it is often infeasible for a financialanalyst to keep track of, let alone read, all avail-able information on a given company (Seo et al.,2004).
In this paper we present an automated pipelineto identify and categorise pertinent investment in-
formation. We incorporate our models into an ac-tive learning framework, allowing financial ana-lysts to train the system with a minimal numberof annotated examples. We envision our systembeing used to assist financial analysts in acquiringand categorising relevant company information.
2 Background
2.1 Financial Text Mining
Prior work on textual classification in the invest-ment domain has extensively focused on the pre-diction of financial markets (Nassirtoussi et al.,2014). More specifically, algorithms are trainedto predict stock price movements using text infor-mation from a range of online sources, e.g., the Fi-nancial Times, Reuters, or the Wall Street Journal(Cho et al., 1999).
A review by Mittermayer and Knolmayer(2006) compares eight text mining prototypesused for predicting short-term market trends. Allprototypes rely exclusively on text-based fea-tures. The systems opted for either expertly hand-crafted features or features automatically inferredby models. Most of the financial performancesobtained by the systems are moderate; Mitter-mayer and Knolmayer (2006) argue that this isdue, in part, to the systems not considering quan-titative information. However, they acknowledgethat qualitative information is highly informative.For example, when a company reports that it re-ceived a ‘takeover bid’ the crucial data is not in anumerical format.
A further application of financial text mining,similar to the production of investment reports, isthat of automated portfolio management. Portfoliomanagement involves the monitoring of current in-vestments by finding, filtering and evaluating rel-evant information. Warren is a multi-agent sys-tem for intelligent portfolio management by Seo
25

et al. (2004). This system enables users to keeptrack of both quantitative (e.g., stock price, per-formance history) and qualitative information inthe form of online financial news reports. Thetext mining component of Warren, referred to asTextMiner (Seo et al., 2002), performs text clas-sification on financial articles. TextMiner usesa combination of word feature sets and a vari-ant of the weighted majority algorithm to classifynews articles. Articles are classified into one offive classes, each class aims to represent the fi-nancial performance of the company based on thearticle, for instance good, good-uncertain, neu-tral. TextMiner achieves a 75% average accuracyacross all classes. One difficulty the authors noteis that the system struggles when presented withphrases from multiple classes, for example ‘Com-pany B shares rose 5% contrasting with A whereshares fell by 7%’. Warren uses sets of words asfeatures e.g., ‘shares rose’,‘shares fell’, but is un-able to link these to relevant entities.
Unlike the previous systems presented in Mit-termayer and Knolmayer (2006), we do not aim topredict the impact of relevant business informationdirectly on stock prices. Neither do we attemptto classify text according to the financial impactlike the Warren system. Instead, our system is de-signed to present useful and targeted informationfrom a financial analyst’s perspective. To the bestof our knowledge this is the first system designedfor this task.
2.2 Active Learning
Figure 1: Active learning cycle
Annotated data is hard and expensive to obtain,notably in specialised domains where only expertscan provide reliable labels (Konyushkova et al.,2017). Active learning allows machine learningclassifiers to achieve higher accuracies with fewertraining instances by enabling the classifier to in-teractively query data points. Active learning is
well-motivated in many modern machine learningproblems where data may be abundant but labelsare scarce or expensive to acquire (Settles, 2009).
Figure 1 shows a classic active learning sce-nario; whereby a machine learning model has ac-cess to an unlabelled pool of data and an uncer-tainty sampling strategy is used to select the mostinformative instances for labelling. Once the mostinformative instances have been labelled they areadded to the training set and the model is then re-trained.
Our motivation for incorporating an activelearning framework into the system is two-fold:
1. Annotator ResourceGathering labelled data for this task is time-consuming and requires the expertise of ex-perienced financial analysts. Maximising theutility of the labelled data allows for bettermodels with fewer labelled instances, savingvaluable resources.
2. Category IntroductionWhen writing financial reports the relevantqualitative categories are subject to changeover time. Since new labels may be intro-duced by financial analysts it is important thatthe model is able to prioritise acquiring labelsfor new topics.
3 Data
The data set used in this project was collected byAll Street Research1 (“All Street”), who specialisein creating intelligent tools for financial analysis.It was created using online business resources an-notated by financial analysts. Analysts were askedto select information that they would consider use-ful when writing an investment report. This se-lected text was then labelled according to the cat-egory of the investment report it was relevant to.An example of annotated text from the data set isshown in Table 1.
The total data set collected contained 3097 in-stances, with individual categories defined by ana-lysts. However, several categories contained lessthan 100 examples which meant they were notlarge enough to train and test our framework. Wetherefore limit the data set to topics that have atleast 100 instances. The resulting data set consistsof 1824 examples and 11 categories; a breakdownof the categories is shown in Table 2. The category
1https://www.allstreet.org
26

Source: Pfizer 2016 Annual ReviewHOSuN fuses our global physical supply chain with a global information supply chain, enabling completevisibility into the status of products at all times. This makes our management of the supply process moreefficient. Through HOSuN, we can also use predictive analytics to anticipate future demand patterns.This knowledge is crucial for the efficient production and cost reduction of biologic and vaccine products.
Artificial Intelligence Cost Reduction Supply Chain Not Labelled
Table 1: Example of analyst annotated text
with most examples (340) was Artificial Intelli-gence, with samples of text covering many areassuch as ‘data mining’, ‘machine learning’ and ‘bigdata’. The smallest category was Wellbeing con-sisting of 196 examples. The mean word lengthacross examples in each topic is reported; the cate-gory Human Capital had the highest average wordcount (575) and Culture the lowest (380).
Category TotalMeanLength
Artificial Intelligence 340 430Business Process Innovation 137 426Climate Action 228 557Cost Reduction 120 416Culture 106 380Customer Service 160 555Enterprise Solutions 129 425Human Capital 119 575Quality Education 109 532Supply Chain Management 180 393Wellbeing 196 476
Table 2: Data set categories alongside the total numberof examples and the mean word length
4 Method
Our classification pipeline consists of three steps,which are embedded into an active learning frame-work. The classification pipeline is outlined inSection 4.1, and the active learning settings are de-scribed in Section 4.2.
4.1 Topic Classification Pipeline4.1.1 PreprocessingThe first stage of classification involves pre-processing the text. In the samples providedwe initially remove any corporate named entities,names of people and stop words using spaCy.2 Inthe wild, our system is provided with the URLs
2https://github.com/explosion/spaCy
of relevant web pages; text is then scraped fromthe page and the pre-processing is performed onparagraph content. Irrelevant content such as pageheadings are disregarded at this stage.
4.1.2 Feature SelectionOur system relies on word features as it aims toidentify terms or bigrams that are highly indica-tive of a given class. We use functions from thescikit-learn3 library to transform the total vocabu-lary of our training set to a matrix of token counts.We then apply a scikit-learn transformer in orderto produce a normalized tf-idf representation ofcontent. This technique is a common term weight-ing scheme used in information retrieval and doc-ument classification. The goal of using tf-idf in-stead of raw word frequencies is to minimise theimpact of highly frequent tokens across a cor-pus, thereby maximising the importance of class-discriminative terms. Using this technique we areable to investigate which terms are most discrimi-native for a given class. Examples of the most in-formative terms for the Artificial Intelligence andClimate Action classes are shown in Figure 2.
4.1.3 Model SelectionWe tested a range of multi-class models usingstratified 5-fold cross-validation. The averagemacro F1-score across all classes is reported forthe top three performing classifiers in Table 3.
Classifier F1-scoreLinear SVC (calibrated) 0.74Linear SVC 0.72Logistic Regression 0.71Random Forest 0.69
Table 3: Results
The best performance on this data set was bythe linear support vector (SVC) model. Cali-
3https://scikit-learn.org
27
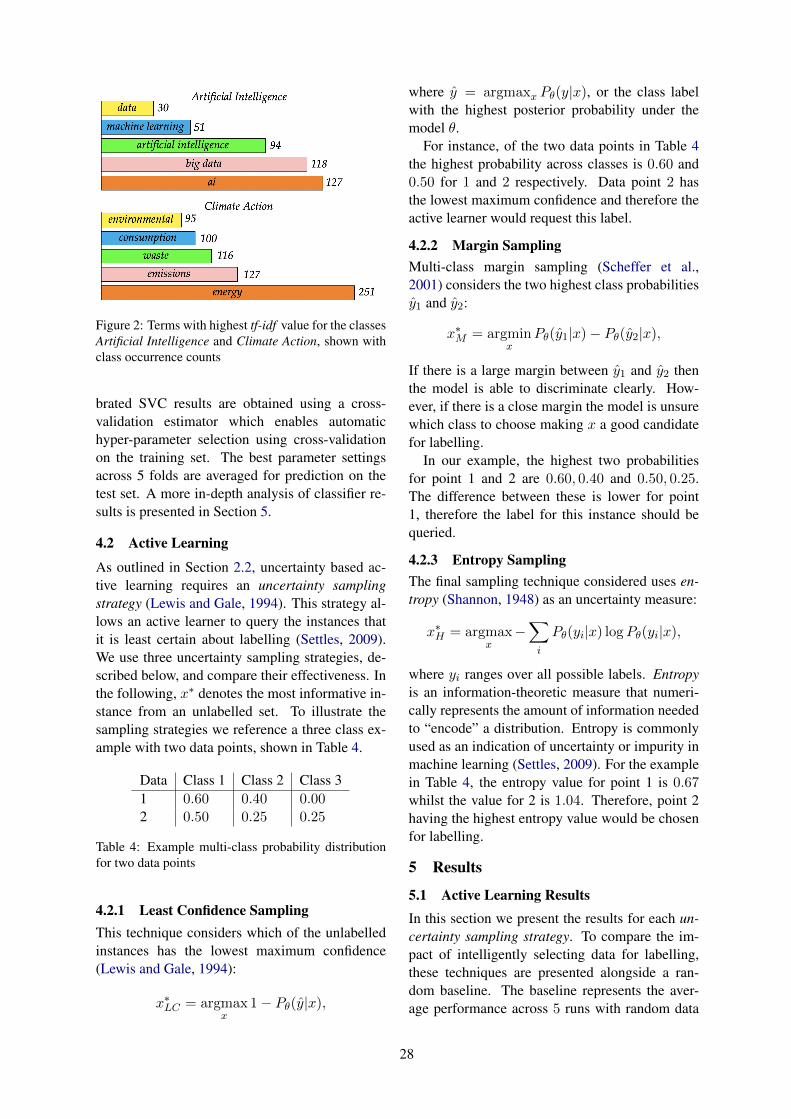
Figure 2: Terms with highest tf-idf value for the classesArtificial Intelligence and Climate Action, shown withclass occurrence counts
brated SVC results are obtained using a cross-validation estimator which enables automatichyper-parameter selection using cross-validationon the training set. The best parameter settingsacross 5 folds are averaged for prediction on thetest set. A more in-depth analysis of classifier re-sults is presented in Section 5.
4.2 Active Learning
As outlined in Section 2.2, uncertainty based ac-tive learning requires an uncertainty samplingstrategy (Lewis and Gale, 1994). This strategy al-lows an active learner to query the instances thatit is least certain about labelling (Settles, 2009).We use three uncertainty sampling strategies, de-scribed below, and compare their effectiveness. Inthe following, x∗ denotes the most informative in-stance from an unlabelled set. To illustrate thesampling strategies we reference a three class ex-ample with two data points, shown in Table 4.
Data Class 1 Class 2 Class 31 0.60 0.40 0.002 0.50 0.25 0.25
Table 4: Example multi-class probability distributionfor two data points
4.2.1 Least Confidence SamplingThis technique considers which of the unlabelledinstances has the lowest maximum confidence(Lewis and Gale, 1994):
x∗LC = argmaxx
1− Pθ(y|x),
where y = argmaxx Pθ(y|x), or the class labelwith the highest posterior probability under themodel θ.
For instance, of the two data points in Table 4the highest probability across classes is 0.60 and0.50 for 1 and 2 respectively. Data point 2 hasthe lowest maximum confidence and therefore theactive learner would request this label.
4.2.2 Margin SamplingMulti-class margin sampling (Scheffer et al.,2001) considers the two highest class probabilitiesy1 and y2:
x∗M = argminx
Pθ(y1|x)− Pθ(y2|x),
If there is a large margin between y1 and y2 thenthe model is able to discriminate clearly. How-ever, if there is a close margin the model is unsurewhich class to choose making x a good candidatefor labelling.
In our example, the highest two probabilitiesfor point 1 and 2 are 0.60, 0.40 and 0.50, 0.25.The difference between these is lower for point1, therefore the label for this instance should bequeried.
4.2.3 Entropy SamplingThe final sampling technique considered uses en-tropy (Shannon, 1948) as an uncertainty measure:
x∗H = argmaxx
−∑
i
Pθ(yi|x) logPθ(yi|x),
where yi ranges over all possible labels. Entropyis an information-theoretic measure that numeri-cally represents the amount of information neededto “encode” a distribution. Entropy is commonlyused as an indication of uncertainty or impurity inmachine learning (Settles, 2009). For the examplein Table 4, the entropy value for point 1 is 0.67whilst the value for 2 is 1.04. Therefore, point 2having the highest entropy value would be chosenfor labelling.
5 Results
5.1 Active Learning ResultsIn this section we present the results for each un-certainty sampling strategy. To compare the im-pact of intelligently selecting data for labelling,these techniques are presented alongside a ran-dom baseline. The baseline represents the aver-age performance across 5 runs with random data
28
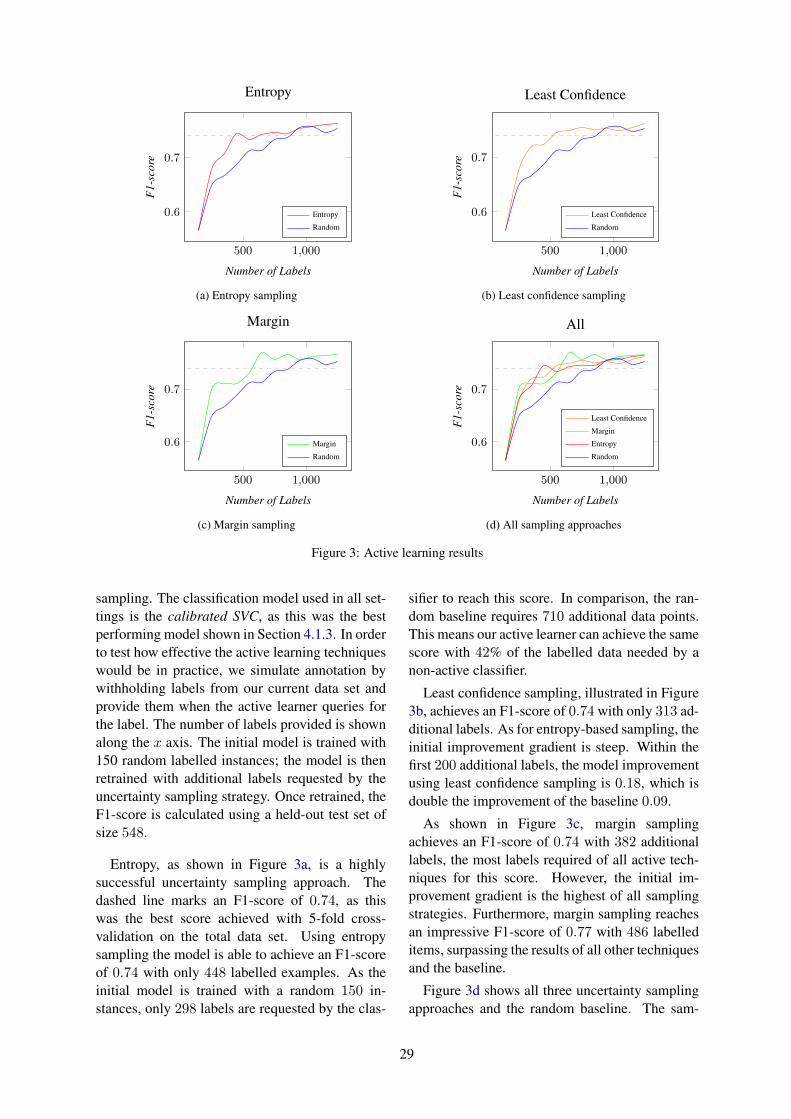
500 1,000
0.6
0.7
Number of Labels
F1-
scor
e
Entropy
Entropy
Random
(a) Entropy sampling
500 1,000
0.6
0.7
Number of Labels
F1-
scor
e
Least Confidence
Least Confidence
Random
(b) Least confidence sampling
500 1,000
0.6
0.7
Number of Labels
F1-
scor
e
Margin
Margin
Random
(c) Margin sampling
500 1,000
0.6
0.7
Number of Labels
F1-
scor
e
All
Least Confidence
Margin
Entropy
Random
(d) All sampling approaches
Figure 3: Active learning results
sampling. The classification model used in all set-tings is the calibrated SVC, as this was the bestperforming model shown in Section 4.1.3. In orderto test how effective the active learning techniqueswould be in practice, we simulate annotation bywithholding labels from our current data set andprovide them when the active learner queries forthe label. The number of labels provided is shownalong the x axis. The initial model is trained with150 random labelled instances; the model is thenretrained with additional labels requested by theuncertainty sampling strategy. Once retrained, theF1-score is calculated using a held-out test set ofsize 548.
Entropy, as shown in Figure 3a, is a highlysuccessful uncertainty sampling approach. Thedashed line marks an F1-score of 0.74, as thiswas the best score achieved with 5-fold cross-validation on the total data set. Using entropysampling the model is able to achieve an F1-scoreof 0.74 with only 448 labelled examples. As theinitial model is trained with a random 150 in-stances, only 298 labels are requested by the clas-
sifier to reach this score. In comparison, the ran-dom baseline requires 710 additional data points.This means our active learner can achieve the samescore with 42% of the labelled data needed by anon-active classifier.
Least confidence sampling, illustrated in Figure3b, achieves an F1-score of 0.74 with only 313 ad-ditional labels. As for entropy-based sampling, theinitial improvement gradient is steep. Within thefirst 200 additional labels, the model improvementusing least confidence sampling is 0.18, which isdouble the improvement of the baseline 0.09.
As shown in Figure 3c, margin samplingachieves an F1-score of 0.74 with 382 additionallabels, the most labels required of all active tech-niques for this score. However, the initial im-provement gradient is the highest of all samplingstrategies. Furthermore, margin sampling reachesan impressive F1-score of 0.77 with 486 labelleditems, surpassing the results of all other techniquesand the baseline.
Figure 3d shows all three uncertainty samplingapproaches and the random baseline. The sam-
29
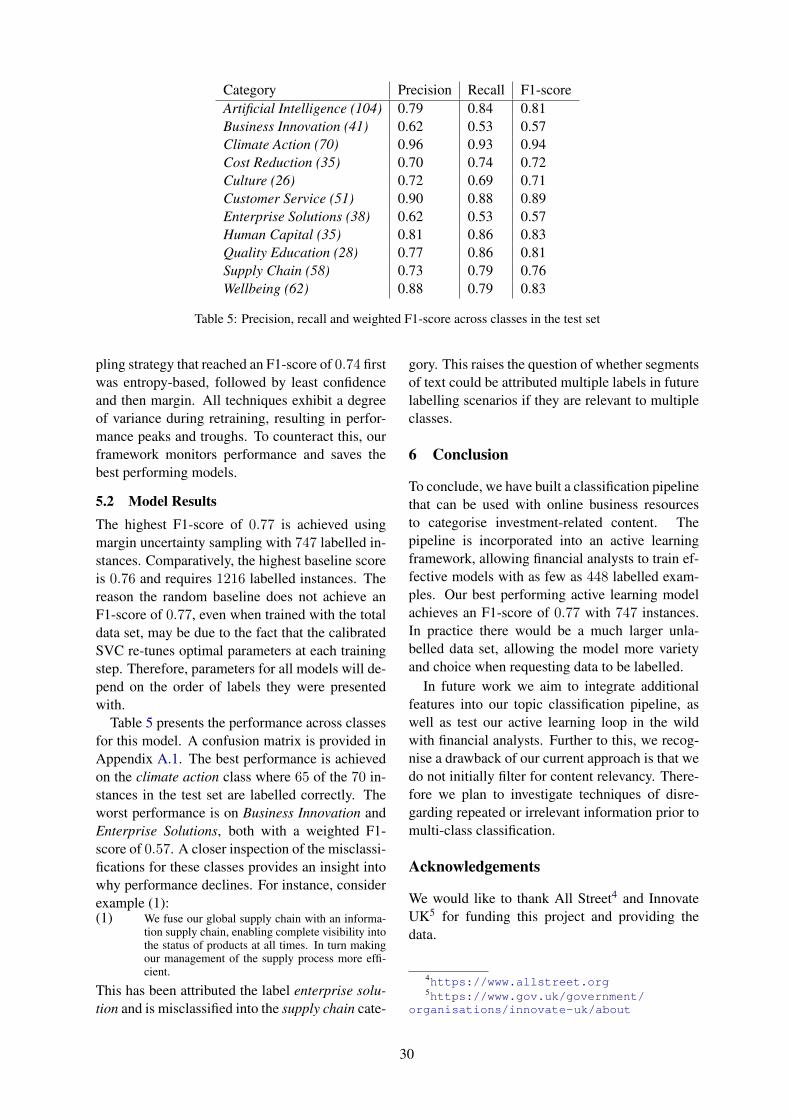
Category Precision Recall F1-scoreArtificial Intelligence (104) 0.79 0.84 0.81Business Innovation (41) 0.62 0.53 0.57Climate Action (70) 0.96 0.93 0.94Cost Reduction (35) 0.70 0.74 0.72Culture (26) 0.72 0.69 0.71Customer Service (51) 0.90 0.88 0.89Enterprise Solutions (38) 0.62 0.53 0.57Human Capital (35) 0.81 0.86 0.83Quality Education (28) 0.77 0.86 0.81Supply Chain (58) 0.73 0.79 0.76Wellbeing (62) 0.88 0.79 0.83
Table 5: Precision, recall and weighted F1-score across classes in the test set
pling strategy that reached an F1-score of 0.74 firstwas entropy-based, followed by least confidenceand then margin. All techniques exhibit a degreeof variance during retraining, resulting in perfor-mance peaks and troughs. To counteract this, ourframework monitors performance and saves thebest performing models.
5.2 Model ResultsThe highest F1-score of 0.77 is achieved usingmargin uncertainty sampling with 747 labelled in-stances. Comparatively, the highest baseline scoreis 0.76 and requires 1216 labelled instances. Thereason the random baseline does not achieve anF1-score of 0.77, even when trained with the totaldata set, may be due to the fact that the calibratedSVC re-tunes optimal parameters at each trainingstep. Therefore, parameters for all models will de-pend on the order of labels they were presentedwith.
Table 5 presents the performance across classesfor this model. A confusion matrix is provided inAppendix A.1. The best performance is achievedon the climate action class where 65 of the 70 in-stances in the test set are labelled correctly. Theworst performance is on Business Innovation andEnterprise Solutions, both with a weighted F1-score of 0.57. A closer inspection of the misclassi-fications for these classes provides an insight intowhy performance declines. For instance, considerexample (1):(1) We fuse our global supply chain with an informa-
tion supply chain, enabling complete visibility intothe status of products at all times. In turn makingour management of the supply process more effi-cient.
This has been attributed the label enterprise solu-tion and is misclassified into the supply chain cate-
gory. This raises the question of whether segmentsof text could be attributed multiple labels in futurelabelling scenarios if they are relevant to multipleclasses.
6 Conclusion
To conclude, we have built a classification pipelinethat can be used with online business resourcesto categorise investment-related content. Thepipeline is incorporated into an active learningframework, allowing financial analysts to train ef-fective models with as few as 448 labelled exam-ples. Our best performing active learning modelachieves an F1-score of 0.77 with 747 instances.In practice there would be a much larger unla-belled data set, allowing the model more varietyand choice when requesting data to be labelled.
In future work we aim to integrate additionalfeatures into our topic classification pipeline, aswell as test our active learning loop in the wildwith financial analysts. Further to this, we recog-nise a drawback of our current approach is that wedo not initially filter for content relevancy. There-fore we plan to investigate techniques of disre-garding repeated or irrelevant information prior tomulti-class classification.
Acknowledgements
We would like to thank All Street4 and InnovateUK5 for funding this project and providing thedata.
4https://www.allstreet.org5https://www.gov.uk/government/
organisations/innovate-uk/about
30
ReferencesH Kent Baker and John A Haslem. 1973. Information
needs of individual investors. Journal of accoun-tancy, pages 64–69.
W Scott Bauman and Richard Dowen. 1988. Growthprojections and commin stock returns. FinancialAnalysts Journal, 44(4):79.
V Cho, B Wuthrich, and J Zhang. 1999. Text process-ing for classification. Journal of Computational In-telligence in Finance, 7(2):6–22.
Timothy J Fogarty and Rodney K Rogers. 2005. Fi-nancial analysts’ reports: an extended institutionaltheory evaluation. Accounting, Organizations andSociety, 30(4):331–356.
Benjamin Graham, David Le Fevre Dodd, Sidney Cot-tle, et al. 1934. Security analysis. McGraw-HillNew York.
Allen H Huang, Amy Y Zang, and Rong Zheng. 2014.Evidence on the information content of text in an-alyst reports. The Accounting Review, 89(6):2151–2180.
Karin Knorr Cetina and Alex Preda. 2012. The Oxfordhandbook of the sociology of finance. Oxford Uni-versity Press.
Ksenia Konyushkova, Raphael Sznitman, and PascalFua. 2017. Learning active learning from data.In Advances in Neural Information Processing Sys-tems, pages 4225–4235.
David D Lewis and William A Gale. 1994. A sequen-tial algorithm for training text classifiers. In SI-GIR94, pages 3–12. Springer.
Marc-Andre Mittermayer and Gerhard Knolmayer.2006. Text mining systems for market response tonews: A survey. Institut fur Wirtschaftsinformatikder Universitat Bern.
Arman Khadjeh Nassirtoussi, Saeed Aghabozorgi,Teh Ying Wah, and David Chek Ling Ngo. 2014.Text mining for market prediction: A system-atic review. Expert Systems with Applications,41(16):7653–7670.
Tobias Scheffer, Christian Decomain, and Stefan Wro-bel. 2001. Active hidden markov models for infor-mation extraction. In International Symposium onIntelligent Data Analysis, pages 309–318. Springer.
Young-Woo Seo, Joseph Giampapa, and Katia Sycara.2002. Text classification for intelligent portfoliomanagement. Technical report, Carnegie-MellonUniversity Pittsburgh PA Robotics Institute.
Young-Woo Seo, Joseph Giampapa, and Katia Sycara.2004. Financial news analysis for intelligent portfo-lio management. Technical report, Carnegie-MellonUniversity Pittsburgh PA Robotics Institute.
Burr Settles. 2009. Active learning literature survey.Technical report, University of Wisconsin-MadisonDepartment of Computer Sciences.
Claude E Shannon. 1948. A note on the concept ofentropy. Bell System Tech. J, 27(3):379–423.
31
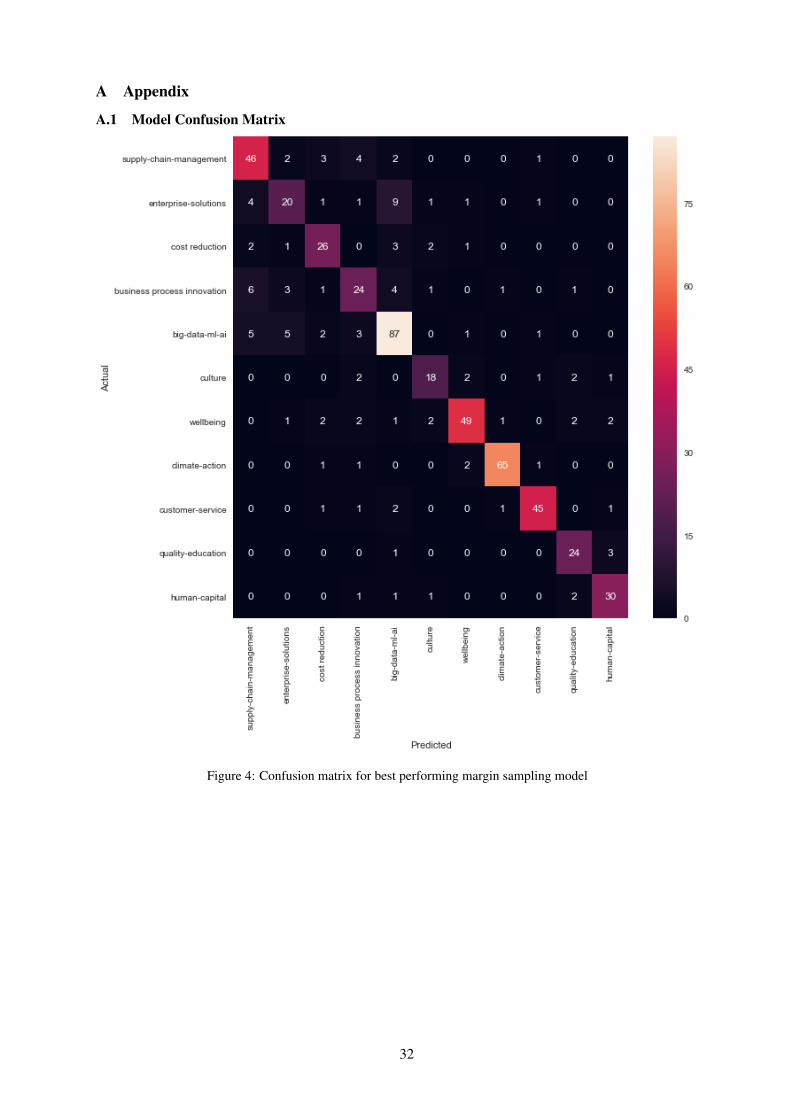
A Appendix
A.1 Model Confusion Matrix
Figure 4: Confusion matrix for best performing margin sampling model
32

Abstract
The present study contributes to the literature on the language of the tax-and-regulations domain in the context of highly-formatted tax forms published by a federal agency. Content and form analyses rely on a methodology that looks for meaning and patterns in connection to the main purpose of income tax filing, i.e. figuring out calculations to determine whether taxes were overpaid or owed to the United States Internal Revenue Service. Profiling the income-tax forms by spelling out language regularities across the set has at least two advantages. Firstly, profiling contributes to the understanding of how the 2010 Plain Writing Act mandate of ‘clear and simple’ writing is being achieved—if at all. Secondly, profiling a small, unannotated corpus can help determine the Natural Language Processing approach best fitted to extract, represent, and execute automatically tax calculations expressed as arithmetic word problems.
1 Introduction
The term “narratives” refers to accounts of ideas or connected ‘events’, whether factual or not, through oral or written communication. Narrative understanding and qualitative content analysis are related tasks as they study the practices, beliefs, needs, and values of groups of individuals. Other than eliciting universal lamentation—independently of one’s moral view on the necessity of taxation for a civil society, the tax-and-regulations domain on the communication dimension is not popular with practitioners of discourse analysis, narrative exploration, or natural language automation. Narratives are stories and, to most, there isn’t much storytelling in the tax-and-regulations domain—though a 1040 tax-return form the size of a postcard made a good yarn.
In the most literal sense, tax forms consist of embedded stories with words, phrases, sentences, fragments and tables through which run threads to output dollar amounts—as input to tax-form lines or as the final amount (refundable to taxpayer or owed to the Internal Revenue Service (IRS)). Tax forms, and their associated schedules and worksheets, provide instructions and clarifications as well as prompt taxpayers for qualitative and quantitative personal information. In addition, distributed throughout a form and across forms, are arithmetic word problems of varying complexity. To solve them, filers must understand content and handle amounts as input
Towards Unlocking the Narrative of the United States Income Tax Forms
Esme Manandise Intuit Futures
Mountain View, California, USA [email protected]
Forms Segments F4868 Late filing penalty is usually
charged if your return is filed after the due date. The penalty is usually 5% of the amount due for each month or part of a month your return is late. The maximum penalty is 25%. If your return is more than 60 days late, the minimum penalty is $210 (adjusted for inflation) or the balance of the tax due on your return, whichever is smaller
F8829 Line C times line D divided by 12 times $5.00 times line E
F1041 If line 25 is larger than the total of lines 23 and 26, enter amount overpaid.
F2441 Add the amounts on lines 12 and 13 and subtract from that total the amount on line 14.
F8941WKS If the result is not a multiple of $1,000, round the result down to the next lowest multiple of $1,000
F8949 Add the amounts in columns (d), (e), (g), and (h) (subtract negative amounts)
Table 1: Calculations as Raw Text
33
1 2 3 4 5 6 7 8 9 10 11 12 13 14 15 16 17 18 19 20 21 22 23 24 25 26 27 28 29 30 31 32 33 34 35 36 37 38 39 40 41 42 43 44 45 46 47 48 49 50
51 52 53 54 55 56 57 58 59 60 61 62 63 64 65 66 67 68 69 70 71 72 73 74 75 76 77 78 79 80 81 82 83 84 85 86 87 88 89 90 91 92 93 94 95 96 97 98 99 100
to basic operations (addition, subtraction, multiplication, division, percentage conversion, rounding). Sometimes, to complete the calculation, they must make the arithmetic operation explicit. With stacked operations, they must apply the operations in their correct order. Consider the examples in Table 1 above.
Tax forms are published by the IRS which, as a federal government agency, complies with the Plain Writing Act of 2010. The language in tax forms is supposedly ‘clear and simple’ to help with content understanding. Simplicity should encourage filers to comply1 with the Tax Law.
For natural language processing (NLP) tasks which consume raw text as input, the mandate ‘clear and simple’ is an ideal convenience. Can we discover how ‘clear and simple’ is instantiated in tax forms? Has ‘clear and simple’ turned the language of tax forms, schedules, and worksheets into an unequivocally-specific language register? Does ‘clear and simple’ remove semantic and syntactic ambiguities? One of our goals in referencing the notion of ‘clear and simple’ is to gain exploratory insight into the language of tax forms with the ultimate purpose of using raw text as input to the automatic (no human-in-the-loop.) detection and execution of calculations by an NLP system.
In this paper, we describe a preprocessing implementation for detecting and labeling executable calculations in raw text. More specifically, we concentrate on feature-based classifications to build a profile of the United States income-tax forms set as a whole rather than per-document profiles. Ultimately, our investigation may help to assess whether ‘clear and simple’ is measurable or merely a matter of opinion2.
2 Related Work
To the best of our knowledge, there are no publications in English that detail the language and discourse of the income-tax forms in the tax-and-regulations domain. However, glossaries of tax terms are aplenty; they are made available online and/or are published by government agencies3, private outfits4 and international organizations5; some glossaries are integrated in tax and
1 According to the IRS (Blank et al. (2017)), 56% of filers use third-party advisors, 34% rely on tax preparation software, and 10% of individuals file without assistance. 2 Tax forms have a readership of around 140,000 million filers with no uniformity in educational background or English-language literacy.
accounting software6. While tax terms are important as they correspond to concepts and entities in the domain, tax-and-regulations texts do not consist merely of a collection of terms. The reductionist view that to learn the tax language is to learn its terms considers the tax language a Toki Pona—a pidgin of sort. Terms need to be connected by relations for tax text to be coherent.
Recently, some Tax Law scholars have shown an interest in the language of taxes as it appears in IRS publications. They have focused on the federal government agency mandate to output text in a ‘clear and simple’ language. Most noticeably, Blank et al. (2017) discuss instances where the IRS transformed ‘complex, often ambiguous tax law into seemingly simple statements’. Achieving language simplicity can cause a loss of information and make content less accurate. The authors summarize their findings in three categories: (1) ‘contested tax law presented through language simplification as clear tax rules’, (2) ‘failure to explain the tax law with possible exceptions’, (3) tax law rewording by IRS. They discuss concrete language examples. How the change from the adverb ‘materially’ in Treasury regulations to the adverb ‘significantly’ in IRS publications can create uncertainty in filers when determining exclusions from taxable income of gain from the sale of a principal residence.
3 Income Tax Form Set
To build the profile, we use 234 IRS tax forms, schedules, and worksheets (individual and fiduciary) for the 2017 tax year. These are published in English in PDF format (see sample in Figure 1.) The forms have a visually-complex structure consisting of a mix of raw text as free-standing paragraphs and of tables with rows and columns, headers, instructions, cautionary notes, line labels, checkboxes, input fields, etc. (see Figure 1 below.)
We use a machine-learning-based algorithm to extract raw text from the PDF-formatted files. The context of raw text (occurrence in original layout) is recorded because the text ‘position’, in
3 For instance, IRS.gov, efile.com, psu.instructure.com 4 For instance, law and accounting practitioners (Taxman.com or taxWorld.com) 5 For instance, Organisation for Economic Co-operation and Development 6 For instance, TurboTax
34
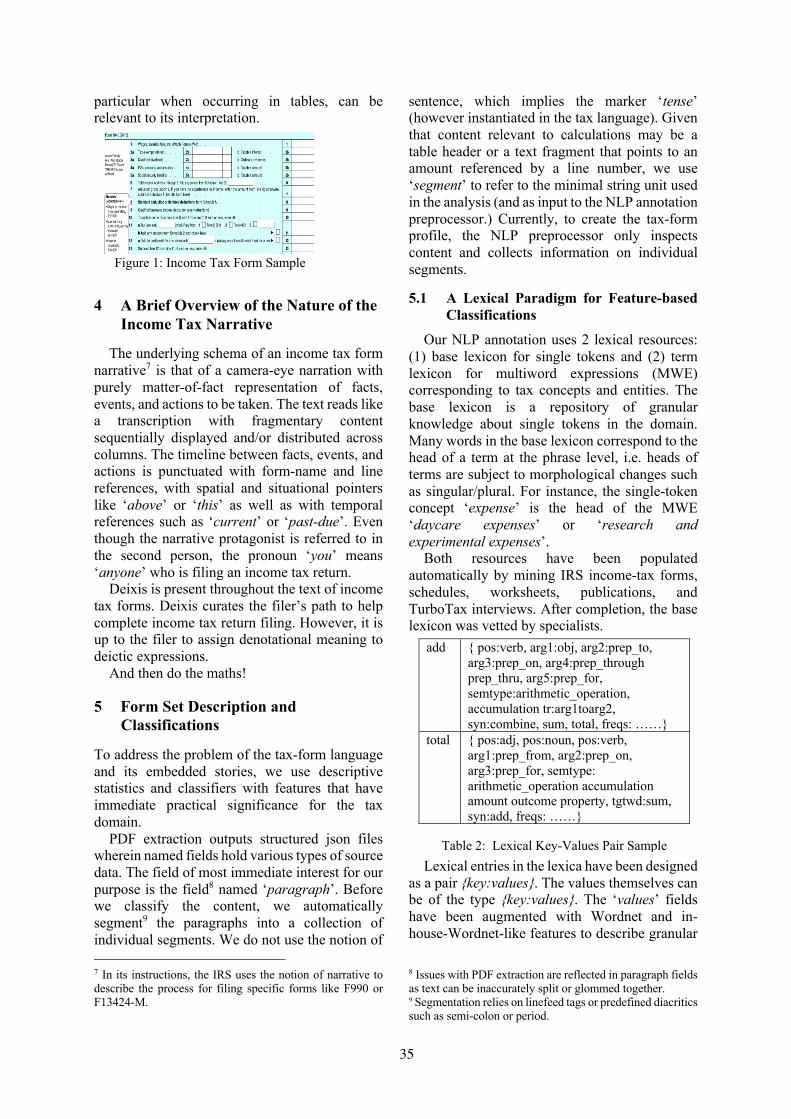
particular when occurring in tables, can be relevant to its interpretation.
4 A Brief Overview of the Nature of the Income Tax Narrative
The underlying schema of an income tax form narrative7 is that of a camera-eye narration with purely matter-of-fact representation of facts, events, and actions to be taken. The text reads like a transcription with fragmentary content sequentially displayed and/or distributed across columns. The timeline between facts, events, and actions is punctuated with form-name and line references, with spatial and situational pointers like ‘above’ or ‘this’ as well as with temporal references such as ‘current’ or ‘past-due’. Even though the narrative protagonist is referred to in the second person, the pronoun ‘you’ means ‘anyone’ who is filing an income tax return.
Deixis is present throughout the text of income tax forms. Deixis curates the filer’s path to help complete income tax return filing. However, it is up to the filer to assign denotational meaning to deictic expressions.
And then do the maths!
5 Form Set Description and Classifications
To address the problem of the tax-form language and its embedded stories, we use descriptive statistics and classifiers with features that have immediate practical significance for the tax domain.
PDF extraction outputs structured json files wherein named fields hold various types of source data. The field of most immediate interest for our purpose is the field8 named ‘paragraph’. Before we classify the content, we automatically segment9 the paragraphs into a collection of individual segments. We do not use the notion of
7 In its instructions, the IRS uses the notion of narrative to describe the process for filing specific forms like F990 or F13424-M.
sentence, which implies the marker ‘tense’ (however instantiated in the tax language). Given that content relevant to calculations may be a table header or a text fragment that points to an amount referenced by a line number, we use ‘segment’ to refer to the minimal string unit used in the analysis (and as input to the NLP annotation preprocessor.) Currently, to create the tax-form profile, the NLP preprocessor only inspects content and collects information on individual segments.
5.1 A Lexical Paradigm for Feature-based Classifications
Our NLP annotation uses 2 lexical resources: (1) base lexicon for single tokens and (2) term lexicon for multiword expressions (MWE) corresponding to tax concepts and entities. The base lexicon is a repository of granular knowledge about single tokens in the domain. Many words in the base lexicon correspond to the head of a term at the phrase level, i.e. heads of terms are subject to morphological changes such as singular/plural. For instance, the single-token concept ‘expense’ is the head of the MWE ‘daycare expenses’ or ‘research and experimental expenses’.
Both resources have been populated automatically by mining IRS income-tax forms, schedules, worksheets, publications, and TurboTax interviews. After completion, the base lexicon was vetted by specialists.
Lexical entries in the lexica have been designed
as a pair {key:values}. The values themselves can be of the type {key:values}. The ‘values’ fields have been augmented with Wordnet and in-house-Wordnet-like features to describe granular
8 Issues with PDF extraction are reflected in paragraph fields as text can be inaccurately split or glommed together. 9 Segmentation relies on linefeed tags or predefined diacritics such as semi-colon or period.
Figure 1: Income Tax Form Sample
add { pos:verb, arg1:obj, arg2:prep_to, arg3:prep_on, arg4:prep_through prep_thru, arg5:prep_for, semtype:arithmetic_operation, accumulation tr:arg1toarg2, syn:combine, sum, total, freqs: ……}
total { pos:adj, pos:noun, pos:verb, arg1:prep_from, arg2:prep_on, arg3:prep_for, semtype: arithmetic_operation accumulation amount outcome property, tgtwd:sum, syn:add, freqs: ……}
Table 2: Lexical Key-Values Pair Sample
Table 2: Lexical key-value pair sample
35
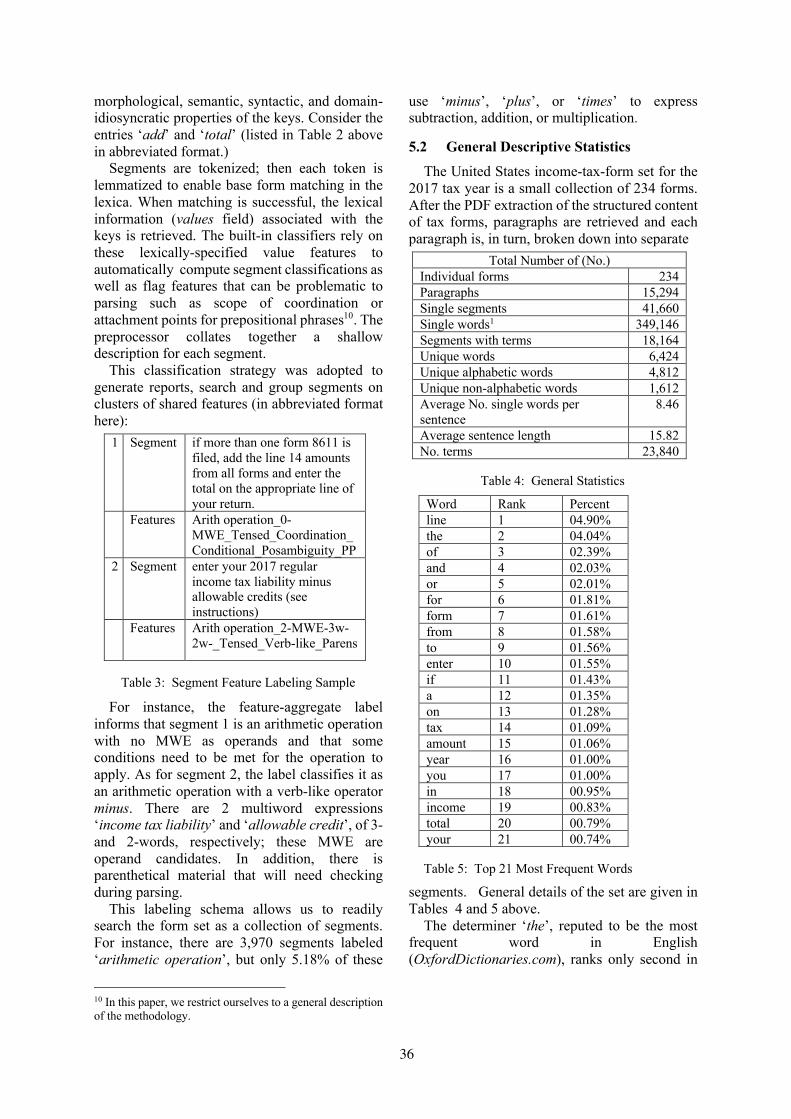
morphological, semantic, syntactic, and domain-idiosyncratic properties of the keys. Consider the entries ‘add’ and ‘total’ (listed in Table 2 above in abbreviated format.)
Segments are tokenized; then each token is lemmatized to enable base form matching in the lexica. When matching is successful, the lexical information (values field) associated with the keys is retrieved. The built-in classifiers rely on these lexically-specified value features to automatically compute segment classifications as well as flag features that can be problematic to parsing such as scope of coordination or attachment points for prepositional phrases10. The preprocessor collates together a shallow description for each segment.
This classification strategy was adopted to generate reports, search and group segments on clusters of shared features (in abbreviated format here):
For instance, the feature-aggregate label
informs that segment 1 is an arithmetic operation with no MWE as operands and that some conditions need to be met for the operation to apply. As for segment 2, the label classifies it as an arithmetic operation with a verb-like operator minus. There are 2 multiword expressions ‘income tax liability’ and ‘allowable credit’, of 3- and 2-words, respectively; these MWE are operand candidates. In addition, there is parenthetical material that will need checking during parsing.
This labeling schema allows us to readily search the form set as a collection of segments. For instance, there are 3,970 segments labeled ‘arithmetic operation’, but only 5.18% of these
10 In this paper, we restrict ourselves to a general description of the methodology.
use ‘minus’, ‘plus’, or ‘times’ to express subtraction, addition, or multiplication.
5.2 General Descriptive Statistics
The United States income-tax-form set for the 2017 tax year is a small collection of 234 forms. After the PDF extraction of the structured content of tax forms, paragraphs are retrieved and each paragraph is, in turn, broken down into separate
segments. General details of the set are given in Tables 4 and 5 above.
The determiner ‘the’, reputed to be the most frequent word in English (OxfordDictionaries.com), ranks only second in
1 Segment if more than one form 8611 is filed, add the line 14 amounts from all forms and enter the total on the appropriate line of your return.
Features Arith operation_0-MWE_Tensed_Coordination_Conditional_Posambiguity_PP
2 Segment enter your 2017 regular income tax liability minus allowable credits (see instructions)
Features Arith operation_2-MWE-3w-2w-_Tensed_Verb-like_Parens
Table 3: Segment Feature Labeling Sample
Total Number of (No.) Individual forms 234 Paragraphs 15,294 Single segments 41,660 Single words1 349,146 Segments with terms 18,164 Unique words 6,424 Unique alphabetic words 4,812 Unique non-alphabetic words 1,612 Average No. single words per sentence
8.46
Average sentence length 15.82 No. terms 23,840
Table 4: General Statistics
Word Rank Percent line 1 04.90% the 2 04.04% of 3 02.39% and 4 02.03% or 5 02.01% for 6 01.81% form 7 01.61% from 8 01.58% to 9 01.56% enter 10 01.55% if 11 01.43% a 12 01.35% on 13 01.28% tax 14 01.09% amount 15 01.06% year 16 01.00% you 17 01.00% in 18 00.95% income 19 00.83% total 20 00.79% your 21 00.74%
Table 5: Top 21 Most Frequent Words
36
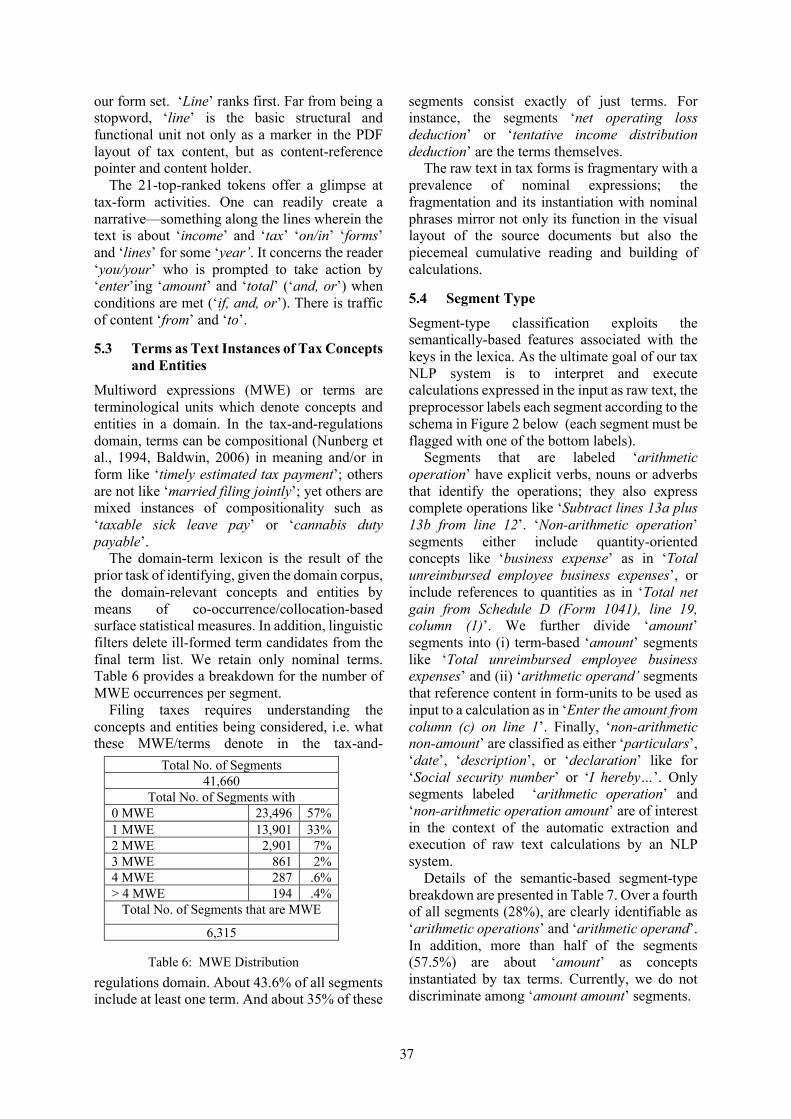
our form set. ‘Line’ ranks first. Far from being a stopword, ‘line’ is the basic structural and functional unit not only as a marker in the PDF layout of tax content, but as content-reference pointer and content holder.
The 21-top-ranked tokens offer a glimpse at tax-form activities. One can readily create a narrative—something along the lines wherein the text is about ‘income’ and ‘tax’ ‘on/in’ ‘forms’ and ‘lines’ for some ‘year’. It concerns the reader ‘you/your’ who is prompted to take action by ‘enter’ing ‘amount’ and ‘total’ (‘and, or’) when conditions are met (‘if, and, or’). There is traffic of content ‘from’ and ‘to’.
5.3 Terms as Text Instances of Tax Concepts and Entities
Multiword expressions (MWE) or terms are terminological units which denote concepts and entities in a domain. In the tax-and-regulations domain, terms can be compositional (Nunberg et al., 1994, Baldwin, 2006) in meaning and/or in form like ‘timely estimated tax payment’; others are not like ‘married filing jointly’; yet others are mixed instances of compositionality such as ‘taxable sick leave pay’ or ‘cannabis duty payable’.
The domain-term lexicon is the result of the prior task of identifying, given the domain corpus, the domain-relevant concepts and entities by means of co-occurrence/collocation-based surface statistical measures. In addition, linguistic filters delete ill-formed term candidates from the final term list. We retain only nominal terms. Table 6 provides a breakdown for the number of MWE occurrences per segment.
Filing taxes requires understanding the concepts and entities being considered, i.e. what these MWE/terms denote in the tax-and-
regulations domain. About 43.6% of all segments include at least one term. And about 35% of these
segments consist exactly of just terms. For instance, the segments ‘net operating loss deduction’ or ‘tentative income distribution deduction’ are the terms themselves.
The raw text in tax forms is fragmentary with a prevalence of nominal expressions; the fragmentation and its instantiation with nominal phrases mirror not only its function in the visual layout of the source documents but also the piecemeal cumulative reading and building of calculations.
5.4 Segment Type
Segment-type classification exploits the semantically-based features associated with the keys in the lexica. As the ultimate goal of our tax NLP system is to interpret and execute calculations expressed in the input as raw text, the preprocessor labels each segment according to the schema in Figure 2 below (each segment must be flagged with one of the bottom labels).
Segments that are labeled ‘arithmetic operation’ have explicit verbs, nouns or adverbs that identify the operations; they also express complete operations like ‘Subtract lines 13a plus 13b from line 12’. ‘Non-arithmetic operation’ segments either include quantity-oriented concepts like ‘business expense’ as in ‘Total unreimbursed employee business expenses’, or include references to quantities as in ‘Total net gain from Schedule D (Form 1041), line 19, column (1)’. We further divide ‘amount’ segments into (i) term-based ‘amount’ segments like ‘Total unreimbursed employee business expenses’ and (ii) ‘arithmetic operand’ segments that reference content in form-units to be used as input to a calculation as in ‘Enter the amount from column (c) on line 1’. Finally, ‘non-arithmetic non-amount’ are classified as either ‘particulars’, ‘date’, ‘description’, or ‘declaration’ like for ‘Social security number’ or ‘I hereby…’. Only segments labeled ‘arithmetic operation’ and ‘non-arithmetic operation amount’ are of interest in the context of the automatic extraction and execution of raw text calculations by an NLP system.
Details of the semantic-based segment-type breakdown are presented in Table 7. Over a fourth of all segments (28%), are clearly identifiable as ‘arithmetic operations’ and ‘arithmetic operand’. In addition, more than half of the segments (57.5%) are about ‘amount’ as concepts instantiated by tax terms. Currently, we do not discriminate among ‘amount amount’ segments.
Total No. of Segments 41,660
Total No. of Segments with 0 MWE 23,496 57% 1 MWE 13,901 33% 2 MWE 2,901 7% 3 MWE 861 2% 4 MWE 287 .6% > 4 MWE 194 .4%
Total No. of Segments that are MWE
6,315
Table 6: MWE Distribution
37
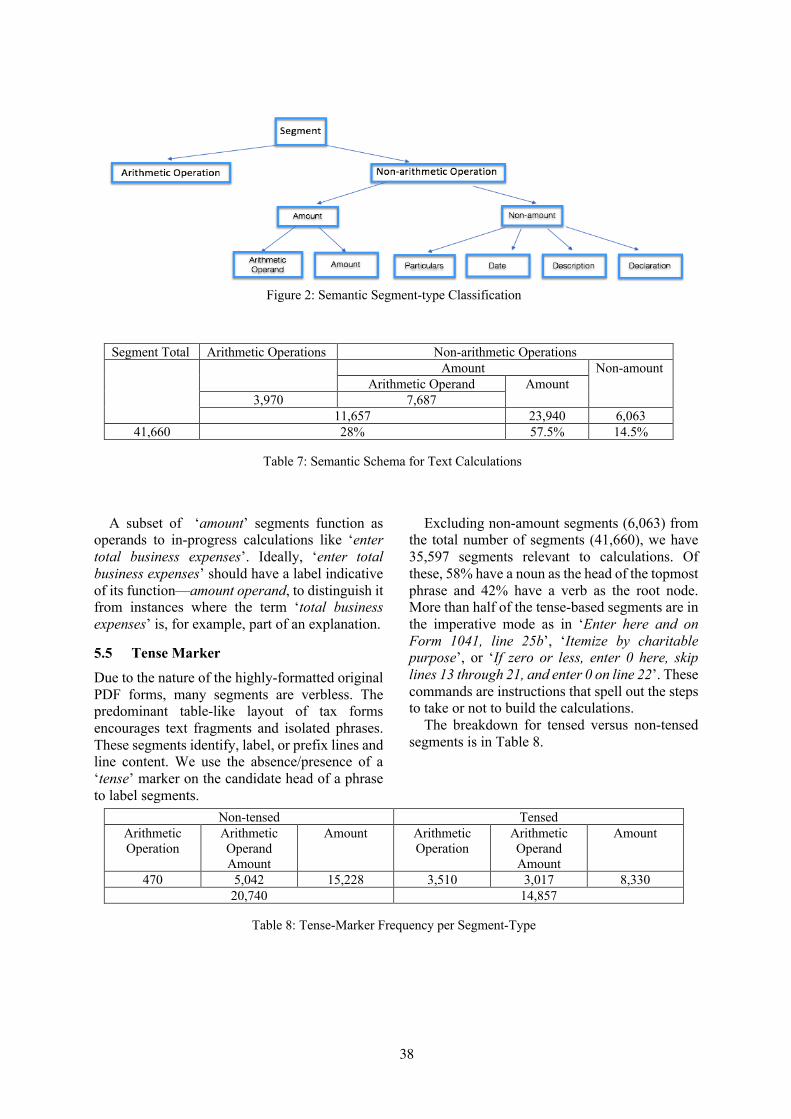
A subset of ‘amount’ segments function as operands to in-progress calculations like ‘enter total business expenses’. Ideally, ‘enter total business expenses’ should have a label indicative of its function—amount operand, to distinguish it from instances where the term ‘total business expenses’ is, for example, part of an explanation.
5.5 Tense Marker
Due to the nature of the highly-formatted original PDF forms, many segments are verbless. The predominant table-like layout of tax forms encourages text fragments and isolated phrases. These segments identify, label, or prefix lines and line content. We use the absence/presence of a ‘tense’ marker on the candidate head of a phrase to label segments.
Excluding non-amount segments (6,063) from the total number of segments (41,660), we have 35,597 segments relevant to calculations. Of these, 58% have a noun as the head of the topmost phrase and 42% have a verb as the root node. More than half of the tense-based segments are in the imperative mode as in ‘Enter here and on Form 1041, line 25b’, ‘Itemize by charitable purpose’, or ‘If zero or less, enter 0 here, skip lines 13 through 21, and enter 0 on line 22’. These commands are instructions that spell out the steps to take or not to build the calculations.
The breakdown for tensed versus non-tensed segments is in Table 8.
Figure 2: Semantic Segment-type Classification
Segment Total Arithmetic Operations Non-arithmetic Operations Amount Non-amount
Arithmetic Operand Amount 3,970 7,687
11,657 23,940 6,063 41,660 28% 57.5% 14.5%
Table 7: Semantic Schema for Text Calculations
Non-tensed Tensed Arithmetic Operation
Arithmetic Operand Amount
Amount Arithmetic Operation
Arithmetic Operand Amount
Amount
470 5,042 15,228 3,510 3,017 8,330 20,740 14,857
Table 8: Tense-Marker Frequency per Segment-Type
38

5.6 The Structural Flavor of Segments
Automated phrase- and word-frequency lists based on the denotative classifications of parts of speech (POS) and lexical information in our lexica point to structural choices, which are used to label segments into smaller functional groups. The set of structural and functional labels that correspond to structural-syntactic instantiations in the collection of segments is shown in Figure 3. Before any deeper parsing, the labels serve as a precursor indication of the segment overall configuration.
For example, parenthetical material occurs in segments regardless of whether the segments are non-tensed as in ‘ordinary income (loss) for schedule E’, or tensed as in ‘if you were a real estate professional, enter the net income or (loss) you reported.’ Arithmetic operations (in full or in part) can be contained inside parenthetical material like ‘enter the result as a decimal (rounded to at least three places)’ or ‘Add amounts in column (i), line 26’. The intent of the parenthetical material needs to be weighed as it may or may not be relevant to calculations as in ‘Other taxable disability income (see Help)’. 16% of all segments have text in parentheses.
6 Can You Read Me Now?
A way of determining whether the language of income-tax forms is clear and simple is to measure the text set against readability indexes. Readability measures rely on various standardized writing components like sentence length (the shorter the better), word length (the shorter the better), concrete everyday language,
active voice, no legalese or jargon, tabular presentation of complex information, etc.
Conveniently, Microsoft Word (version 16.27) comes with a readability tool. Running our text set as a collection of segments abstracted away from their position in the original highly-structured PDF yields a Flesch Reading Ease of 53.5 or a Flesch-Kincaid Grade Level of 8.8. With a grade of 8-9, the text set should be understood by 13- to 15-year-old individuals. In isolation, the language of tax-form segments appears on average clear and simple. Substantially, the language complies with Plain Writing principles.
However, readability measures and Plain Writing principles largely ignore the questions of how filers make sense of fragmented texts, of how each line relates to other lines in a cumulative reading process. More importantly, while they focus on lexes and the structures of phrases, these measures and Plain Writing principles disregard meaning and interpretation, i.e. to understand the text the filer must determine what the terms denote in the domain. Not a trivial reading task as 43% of all segments include at least one multiword term. For instance, the structure of and each of the words in the segment ’tax on lump-sum distributions’ are common, everyday language but what does ‘lump-sum distributions’ denotes in the tax world?
One of the recommendations for writing clearly and simply is to use tabular presentation of complex information. Such display result in compressing content into fragments that can be displayed in table rows and headers. Such compression results in noun compounds and nominal phrases of varying complexity (58% in our set), which can make content less explicit. Nominalizations may be efficient for readers who
Figure 3: Linguistic Shared Features
39
are expert on or familiar with the tax-and-regulations domain, i.e. readers who can infer non-overt relations among concepts (and their token instantiations). These readers may be able to keep up (from line to line, from tax form to tax form) with the story on how to figure out their taxable income.
Finally, while the language of arithmetic operations expressed as text reads on average clearly and easily, understanding what the calculations consist in (operations and operands) can be challenging. Consider the following sequential segments; ‘If line 27 is $186,300 or less ($93,150 or less if married filing separately for 2016), multiply line 27 by 26% (0.26). Otherwise, multiply line 27 by 28% (0.28) and subtract $3,726 ($1,863 if married filing separately for 2016) from the result.’ The Flesch-Kincaid Grade Level puts the above paragraph at 19.5, which is a level for skilled readers.
The complexity of some arithmetic operations along with concept and entity denotation in the tax domain may explain why only 10% of taxpayers file without any type of assistance.
7 Conclusion and Additional Questions
In this paper, we offer a first attempt at describing the language of income-tax forms. We viewed the task through a language analysis lens with no attempt at more logic-oriented semantic modeling. This approach also helps with the discovery of content and form that are idiosyncratic to the domain.
We discuss some basic syntactic and semantic patterns discovered through various statistical regularities across the segment set. The tabular presentation of content in the original PDF files has the effect of compressing the language resulting in a high number of noun compounds or multiword expressions wherein the relationships among concepts remain implicit as it is the case, for instance, with missing prepositions (‘living expenses’ with implicit preposition ‘of’ versus ‘distribution expenses’ with implicit preposition ‘from’.) Noun compounding can also introduce adjectival scope ambiguity. For example, is ‘tentative’ a modifier of ‘income’ or ‘deduction’ in the expression ‘tentative income distribution deduction’ as ‘tentative income’ itself appears enough times across the tax-form set to be considered a MWE or tax concept?
11 A topic worthy of some psycholinguistic experiments.
Various labeling schemata, that incorporate our observations from descriptive statistics about income-tax forms, have been implemented to annotate raw segments automatically. This type of automatic annotation makes it easy to poke around segment sets (or any tax-form set, from tax year to tax year.)
A language-oriented description of how calculations or arithmetic word problems are displayed in the source PDF documents and expressed in raw text can help decide on the NLP approach and the level of analytic granularity best fitted to extract and to represent calculations so as to have these automatically interpreted and executed by downstream NLP components. For instance, is tense a linguistic feature necessary for the interpretation of calculations? What about modals? Should the structure of noun compounds and nominal phrases, a subset of which are instantiated by domain multiterm expressions, be made transparent? Is this level of granularity necessary for an automatic processing of calculations? While it may matter to human readers to have relations among members of complex nominal expressions explicitly stated to help understand tax-term-based calculations11, it may be sufficient, i.e. ‘clear and simple’, for an NLP implementation to output accurate calculations by treating these expressions as opaque nominal singletons with no internal structure.
Acknowledgments
We thank Saikat Mukherjee and two anonymous reviewers for helpful comments.
References Joo Jung An and Ned Wilson. 2016. Tax Knowledge
Adventure: Ontologies that Analyze Corporate Tax Transactions, in Proceedings of the 17th International Digital Government Research Conference on Digital Government Research, Shanghai, China. June 08 2016. ACM, pages 303-311.
Timothy, Baldwin. 2006 . Compositionality and multiword Expressions: Six of One, Half a Dozen of the Other? In Proceedings of the Workshop on Multiword Expressions: Identifying and Exploiting Underlying Properties. Sydney, Australia. Association for Computational Linguistics, page 1. https://www.aclweb.org/anthology/W06-1201
40
Joshua Blank and Leigh Osofsky. 2017. Simplexity: Plain Language and the Tax Law. In 66 Emory Law Journal 189, pages 1-77. NYU Law and Economics Research Paper No. 16-17; University of Miami Legal Studies Research Paper No. 16-20
Stephen Cohen. 2005. Words, Words, Words!!! Teaching the Language of Tax. In Georgetown Law Faculty Publications and Other Works. 579. Pages 600-605. https://scholarship.law.georgetown.edu/facpub/579
Michael Curlotti and Eric McCreath. 2011. A Corpus of Australian Contract Language: Description, Profiling and Analysis. In Proceedings of the 13th International Conference on Artificial Intelligence and Law. ACM, 2011. http://dx.doi.org/10.2139/ssrn.2304652
Isabella Distinto, Nicola Guarina and Claudio Masolo. 2013. A well-founded ontological framework for modeling personal income tax. In Proceedings of the Fourteenth International Conference on Artificial Intelligence and Law. Rome, Italy. pages 33-42.
Ioannis Korkontzelos and Suresh Manandhar. 2010. Can recognising multiword expressions improve shallow parsing? In Human Language Technologies: The 2010 Annual Conference of the North American Chapter of the Association for Computational Linguistics, pages 636–644, Los Angeles, California, Association for Computational Linguistics
Geoffrey Nunberg, Ivan A. Sag, and Thomas Wasow. 1994. Idioms. In Stephen Everson, editor, Language, pages 491–538. Cambridge University Press.
Plain Writing Act Compliance Report, Internal Revenue Service. 2016. https://www.irs.gov/pub/irs-pdf/p5206.pdf
Rachel Stabler. 2014. What We've Got Here is Failure to Communicate: The Plain Writing Act of 2010. In Journal of Legislation, Vol. 40, No. 2, pp. 280-323, 2014. https://ssrn.com/abstract=2574207
The Oxford English Corpus: Facts about the language. OxfordDictionaries.com. Oxford University Press. Archived from the original on December 26, 2011. Retrieved June 22, 2011.
41

1
This paper analyzes the tone (including polarity and semantic orientations) in a corpus of financial reports in Spanish. Specifically, we look at the Letter to Shareholders section of the Annual Reports, which focuses on an analysis of the financial performance, corporate strategies and other aspects relevant to investors. We use FinT-esp, a semantic analysis tool developed for Spanish narratives, based on lexicons and phrase-structure information. We divide the corpus in four subgroups based on the net earnings figure as a benchmark, to identify differences in tone between profit firms and loss firms. This paper confirms that Spanish financial narratives suffers a communicative bias towards positive terms (Pollyanna effect). Additionally, we provide a gold standard of financial narratives, based on a random selection of 1% of the sentences of the corpus of Letters. We run a first evaluation of three different sentiment analysis tools (Azure, Watson and FinT-esp) compared to the GS and observe that tone analysis in the financial narratives domain breaks with classical sentiment analysis (based on subjective feelings, value judgments, emotions). Financial narratives tone is linked to measurable facts and figures (financial results) and investors' expectations about the future performance of the firm.
1 Introduction
The last decade presents a unique scenario to extend new techniques in computational linguistics to understand financial narratives. The open access to a wide set of electronic resources of financial texts and the release of additional non-regulated disclosures (i.e. annual reports, earnings press-releases, conferences calls,
earnings announcements) creates the perfect scenario to understand how managers make use of the language when communicating with stakeholders. Researchers in accounting and finance need to go beyond the use of manual textual analysis, traditional measures of readability and tone, or “bag-of-words”. Computational linguistics and accounting academics must work aligned to advance in domain specific lists and new text mining techniques to understand the semantic orientation of sentences (Malo et al., 2014) and the use of the language to guide users’ interpretations of financial texts (Malo et al., 2014; Loughran and McDonald, 2016).
Financial narratives are a central component of the companies’ reporting package (Beattie, 2014). However, whereas quantitative disclosures (i.e. Financial Statements) are mostly regulated and subject to periodic controls by auditors and enforcement institutions, other financial and non-financial narratives (i.e. earnings press releases or environmental reports) are unregulated, unaudited and offer a wide degree of discretion to managers. The exponential increase of qualitative disclosures in the last decade has raised a wide debate on whether financial narratives really offer incremental information content on top of the traditionally regulated financial information (Boudt, Thewissen and Torsin, 2018; Plumlee et al., 2015). Managers choose between the use of narratives to increase transparency and reduce information asymmetry or intentionally bias investors’ perceptions to obfuscate the reality about firm’s performance (Merkl-Davis and Brennan, 2007; Arslan-Ayaydin et al., 2016).
Evidence shows that narratives are indeed value relevant, contribute to the company’s reputation (Craig and Brennan, 2012) and investors and analysts decision making process (Boudt et al., 2018; Arslan-Ayayding et al., 2016; Yekini, et al., 2016). Therefore, computational linguistics can
Tone Analysis in Spanish Financial Reporting Narratives
Antonio Moreno-Sandoval†,*, Ana Gisbert‡, Pablo A. Haya*, Marta Guerrero* and Helena Montoro*,†
†Laboratorio de Lingüística Informática, Autonomous University of Madrid ‡Accounting Department, Autonomous University of Madrid
*Instituto de Ingeniería del Conocimiento, Autonomous University of Madrid {antonio.msandoval, ana.gisbert}@uam.es
{pablo.haya, marta.guerrero, helena.montoro}@iic.uam.es
42
2
play a crucial role in supporting the accounting and finance field to discern about the use and orientation of financial narratives.
The first motivation for this study relies on the idea that company’s earnings trend affects the tone of financial narratives. Particularly, for our research question, we investigate whether there are differences in the language orientation (opinion) of the letter to shareholders across benchmark vs. non-benchmark beating companies. We focus the empirical analysis on the letter to shareholders as a document with “enormous rhetorical importance” to build credibility and confidence about the company (Hyland, 1998) and influence investors’ decisions (Baird and Zelin, 2000; Breton and Taffler, 2001).
Managers’ choice to bias or enrich financial information depends on a set of incentives. Previous literature document significant capital market rewards (penalties) for benchmark (non-benchmark) beating companies (Graham et al. 2005). We consider these capital markets’ rewards and potential penalties a clear incentive to manage upwards the tone of narrative disclosures, avoid negative messages and therefore, affect investors’ perceptions about the performance of the firm. Previous literature in the US document that managers structure their narratives to manage investors’ perceptions about the company performance (Alee and Deangelis, 2015). Li (2008) finds that firms with lower reported earnings have less readable annual reports (10-K) and more recently, Iatridis (2016), Davis and Tama-Sweet (2012) or Feldman et al. (2010), finds that benchmark beating, and high-growth firms tend to use less pessimistic language.
For a final sample of 76 companies listed in the Spanish Stock Exchange, we apply NLP techniques for tone analysis, and we measure the degree of accuracy of the use of these techniques in the domain of financial narratives.
The performance of current sentiment analysis (SA) systems seems less accurate when used in the financial domain compared to other narrative contexts as social media messages. We posit that the underperformance of the different tools is linked to the specific language complexity of financial narratives due to its impact on users’ decisions that may affect the company’s market value.
In spite of the caveats and limitations, this study is one of the first attempts to identify automatically
the tone and semantic orientations of financial narratives in the Spanish language.
2 Characteristics of the corpus
The potential sample consists of 125 companies listed in the Madrid Stock Exchange. For each company, we accessed the corporate website in order to retrieve all the publicly available Annual Reports for the four-year period 2014-2017. However, the Spanish accounting regulation does not require the preparation of this document and therefore it is not available for all companies. We finally retrieved the Annual Reports dataset files in PDF format for a final sample of 76 reports.
Annual Reports have not a standardized format across companies, its content and structure vary significantly and therefore, they are rarely comparable documents. One of the few comparable sections across companies is the Letter to shareholders.
Due to the relevance of the “letter to shareholders”, we focus the analysis on this specific and relevant section of the Annual Report. The letter to shareholders it is not subject to accounting regulation and it offers managers with a great opportunity to use their writing style to change investors’ perceptions about the past, present and future performance of the company (Hooghiemstra, 2010). Previous literature documents that investors decisions are clearly influenced by the information presented in the letter to shareholders (Baird and Zelin, 2000; Breton and Taffler, 2001).
In order to identify differences in the language style across benchmark vs. non-benchmark beating companies, we group companies in groups based on the company’s financial performance. For this purpose, we download financial data from ORBIS, a Bureau Van Dijk database with financial information for over 300 million companies across the Globe. ORBIS is key source of financial data for professional and academic use. More specifically, we download the net income figure (NIit) for each sample company across the time-period 2013-2017 to classify firms in the following four groups as follows:
• Group 1: Companies reporting positive earnings (profits) (NIit > 0) and improving past performance. That is, increasing earnings compared to the preceding year [(NIit - NIi,t-1 )/ |NIit| > 0].
43
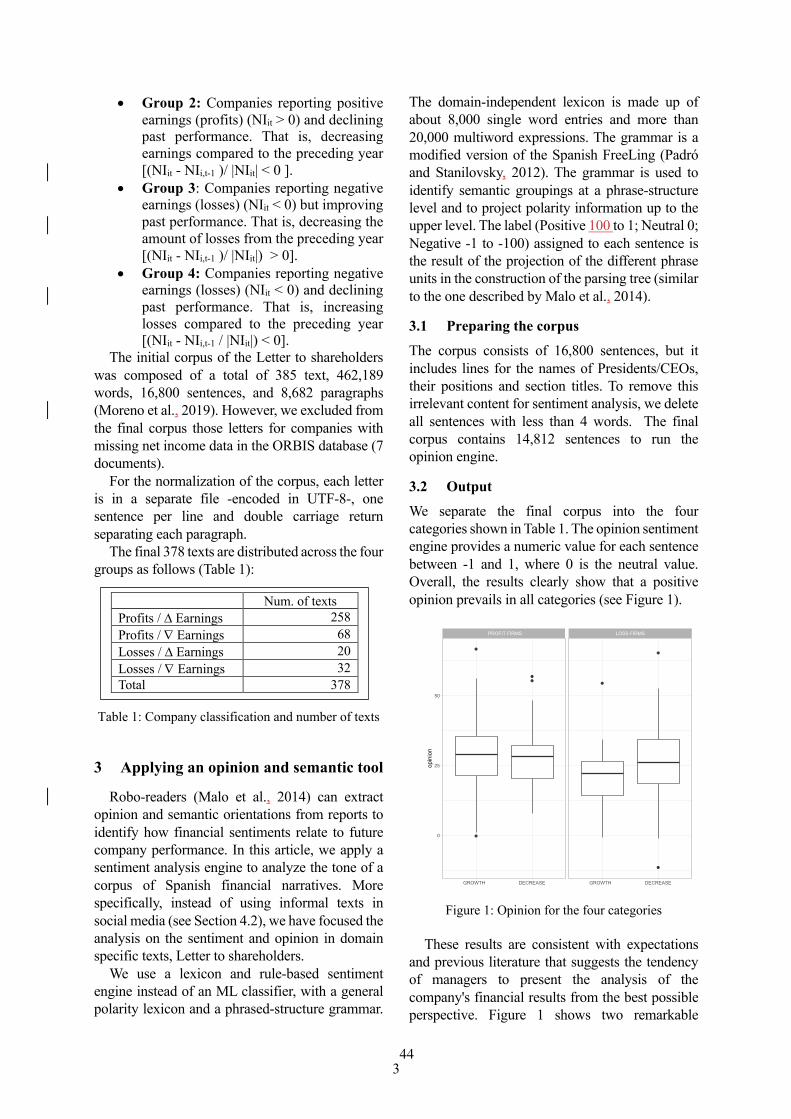
3
• Group 2: Companies reporting positive earnings (profits) (NIit > 0) and declining past performance. That is, decreasing earnings compared to the preceding year [(NIit - NIi,t-1 )/ |NIit| < 0 ].
• Group 3: Companies reporting negative earnings (losses) (NIit < 0) but improving past performance. That is, decreasing the amount of losses from the preceding year [(NIit - NIi,t-1 )/ |NIit|) > 0].
• Group 4: Companies reporting negative earnings (losses) (NIit < 0) and declining past performance. That is, increasing losses compared to the preceding year [(NIit - NIi,t-1 / |NIit|) < 0].
The initial corpus of the Letter to shareholders was composed of a total of 385 text, 462,189 words, 16,800 sentences, and 8,682 paragraphs (Moreno et al., 2019). However, we excluded from the final corpus those letters for companies with missing net income data in the ORBIS database (7 documents).
For the normalization of the corpus, each letter is in a separate file -encoded in UTF-8-, one sentence per line and double carriage return separating each paragraph.
The final 378 texts are distributed across the four groups as follows (Table 1):
Table 1: Company classification and number of texts
3 Applying an opinion and semantic tool
Robo-readers (Malo et al., 2014) can extract opinion and semantic orientations from reports to identify how financial sentiments relate to future company performance. In this article, we apply a sentiment analysis engine to analyze the tone of a corpus of Spanish financial narratives. More specifically, instead of using informal texts in social media (see Section 4.2), we have focused the analysis on the sentiment and opinion in domain specific texts, Letter to shareholders.
We use a lexicon and rule-based sentiment engine instead of an ML classifier, with a general polarity lexicon and a phrased-structure grammar.
The domain-independent lexicon is made up of about 8,000 single word entries and more than 20,000 multiword expressions. The grammar is a modified version of the Spanish FreeLing (Padró and Stanilovsky, 2012). The grammar is used to identify semantic groupings at a phrase-structure level and to project polarity information up to the upper level. The label (Positive 100 to 1; Neutral 0; Negative -1 to -100) assigned to each sentence is the result of the projection of the different phrase units in the construction of the parsing tree (similar to the one described by Malo et al., 2014).
3.1 Preparing the corpus
The corpus consists of 16,800 sentences, but it includes lines for the names of Presidents/CEOs, their positions and section titles. To remove this irrelevant content for sentiment analysis, we delete all sentences with less than 4 words. The final corpus contains 14,812 sentences to run the opinion engine.
3.2 Output
We separate the final corpus into the four categories shown in Table 1. The opinion sentiment engine provides a numeric value for each sentence between -1 and 1, where 0 is the neutral value. Overall, the results clearly show that a positive opinion prevails in all categories (see Figure 1).
Figure 1: Opinion for the four categories
These results are consistent with expectations
and previous literature that suggests the tendency of managers to present the analysis of the company's financial results from the best possible perspective. Figure 1 shows two remarkable
●
●
●
●
●
●
●
PROFIT FIRMS LOSS FIRMS
GROWTH DECREASE GROWTH DECREASE
0
25
50
opinion
Num. of texts Profits / D Earnings 258 Profits / Ñ Earnings 68 Losses / D Earnings 20 Losses / Ñ Earnings 32 Total 378
44
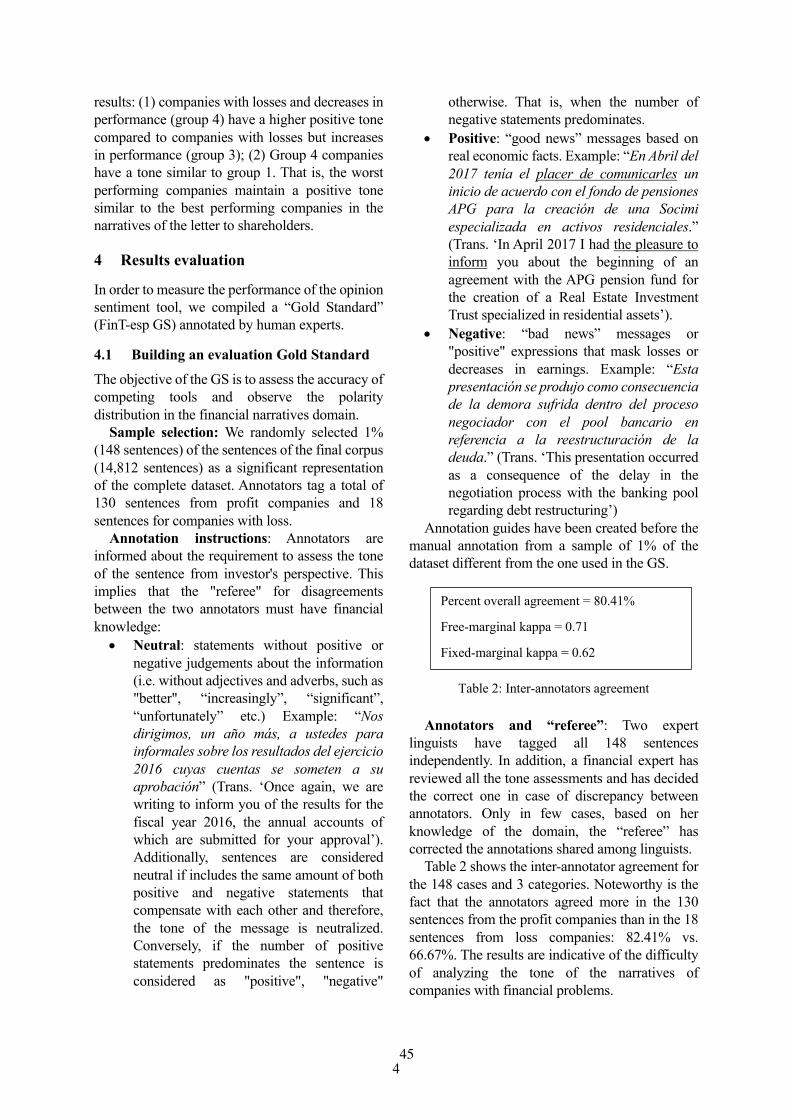
4
results: (1) companies with losses and decreases in performance (group 4) have a higher positive tone compared to companies with losses but increases in performance (group 3); (2) Group 4 companies have a tone similar to group 1. That is, the worst performing companies maintain a positive tone similar to the best performing companies in the narratives of the letter to shareholders.
4 Results evaluation
In order to measure the performance of the opinion sentiment tool, we compiled a “Gold Standard” (FinT-esp GS) annotated by human experts.
4.1 Building an evaluation Gold Standard
The objective of the GS is to assess the accuracy of competing tools and observe the polarity distribution in the financial narratives domain.
Sample selection: We randomly selected 1% (148 sentences) of the sentences of the final corpus (14,812 sentences) as a significant representation of the complete dataset. Annotators tag a total of 130 sentences from profit companies and 18 sentences for companies with loss.
Annotation instructions: Annotators are informed about the requirement to assess the tone of the sentence from investor's perspective. This implies that the "referee" for disagreements between the two annotators must have financial knowledge: • Neutral: statements without positive or
negative judgements about the information (i.e. without adjectives and adverbs, such as "better", “increasingly”, “significant”, “unfortunately” etc.) Example: “Nos dirigimos, un año más, a ustedes para informales sobre los resultados del ejercicio 2016 cuyas cuentas se someten a su aprobación” (Trans. ‘Once again, we are writing to inform you of the results for the fiscal year 2016, the annual accounts of which are submitted for your approval’). Additionally, sentences are considered neutral if includes the same amount of both positive and negative statements that compensate with each other and therefore, the tone of the message is neutralized. Conversely, if the number of positive statements predominates the sentence is considered as "positive", "negative"
otherwise. That is, when the number of negative statements predominates.
• Positive: “good news” messages based on real economic facts. Example: “En Abril del 2017 tenía el placer de comunicarles un inicio de acuerdo con el fondo de pensiones APG para la creación de una Socimi especializada en activos residenciales.” (Trans. ‘In April 2017 I had the pleasure to inform you about the beginning of an agreement with the APG pension fund for the creation of a Real Estate Investment Trust specialized in residential assets’).
• Negative: “bad news” messages or "positive" expressions that mask losses or decreases in earnings. Example: “Esta presentación se produjo como consecuencia de la demora sufrida dentro del proceso negociador con el pool bancario en referencia a la reestructuración de la deuda.” (Trans. ‘This presentation occurred as a consequence of the delay in the negotiation process with the banking pool regarding debt restructuring’)
Annotation guides have been created before the manual annotation from a sample of 1% of the dataset different from the one used in the GS.
Table 2: Inter-annotators agreement
Annotators and “referee”: Two expert linguists have tagged all 148 sentences independently. In addition, a financial expert has reviewed all the tone assessments and has decided the correct one in case of discrepancy between annotators. Only in few cases, based on her knowledge of the domain, the “referee” has corrected the annotations shared among linguists.
Table 2 shows the inter-annotator agreement for the 148 cases and 3 categories. Noteworthy is the fact that the annotators agreed more in the 130 sentences from the profit companies than in the 18 sentences from loss companies: 82.41% vs. 66.67%. The results are indicative of the difficulty of analyzing the tone of the narratives of companies with financial problems.
Percent overall agreement = 80.41%
Free-marginal kappa = 0.71
Fixed-marginal kappa = 0.62
45

5
Following Fleiss's rule of thumb, kappa values from 0.40 to 0.75 are considered “intermediate – good.” Therefore, the values obtained for the annotation procedure are quite satisfactory.
Finally, the financial expert's revision of the linguists' annotation makes the GS highly reliable for assessing the accuracy of the opinion analysis tools.
4.2 Semantic tone of the GS
Considering the GS a representative sample of the financial reporting domain, we focus on the distribution of polarity values. Results in Figure 2 show that the positive tone (70%) prevails over the others, with very few negative messages (8%).
These results contrast with the distribution of negative vs. positive tone in other highly studied domain: social media. Taking as a reference the TASS competition1 developed between 2012 and 2017 for Sentiment Analysis in Spanish datasets, the InterTass2017 reports the following distribution for a Twitter GS with 1,625 tuits: 13% (neutral), 47% (+) and 40% (-) (see Figure 3). (Martínez-Cámara et al., 2017).
In Twitter, negative messages are close in number to positive messages. This great difference in polarity distribution forces sentiment systems to make a strong adaptation. The next section explains differences in performance across the three sentiment analysis tools: Watson, Azure, and our FinT-esp. Most tools are usually applied in sentiment analysis in social media (i.e. Twitter). Therefore, we could use to the values of the last competition InterTASS2017 as a reference for the state-of-the-art in Spanish (see Table 3)2.
Table 3: Best systems in InterTASS 2017
1 http://www.sepln.org/workshops/tass/ 2 All the systems participating in TASS 2017 "are based on the use of deep learning techniques as the state-of-the-art in SA in Twitter" (Martínez-Cámara et al. 2017).
5. Performance comparison of three sentiment tools
We have chosen two professional applications to evaluate their performance in an unusual domain.
Microsoft Azure Sentiment Analysis is included in the Text Analytics API service. It is based on machine learning algorithms and does not require training data. Azure uses neural network technology and word embeddings. The evaluation of each sentence has been done from the demo page3 copying the results into a spreadsheet.
Figure 2: Polarity distribution in the Financial narratives
Figure 3: Polarity distribution in Twitter
IBM Watson NLU is a collection of APIs that offer text analysis through NLP4. We haven’t created a custom model to get specific results that are tailored to the financial domain. In this way, we have maintained the same level of domain adaptation in all three systems. In the case of our lexicon-based system, we have not developed a specific one for financial terms.
3 https://azure.microsoft.com/es-es/services/cognitive-services/text-analytics/ 4 https://natural-language-understanding-demo.ng.bluemix.net/
13%
47%
40%
INTERTASS 2017 GOLD STANDARD
Neutral Positive Negative
Best systems M-F1 Acc. ELiRF-UPV-run1 0.493 0.607
RETUYT-svm 0.471 0.596 ELiRF-UPV-run3 0.466 0.597
22%
70%
8%
FINT-ESP GOLD STANDARD
Neutral Positive Negative
46
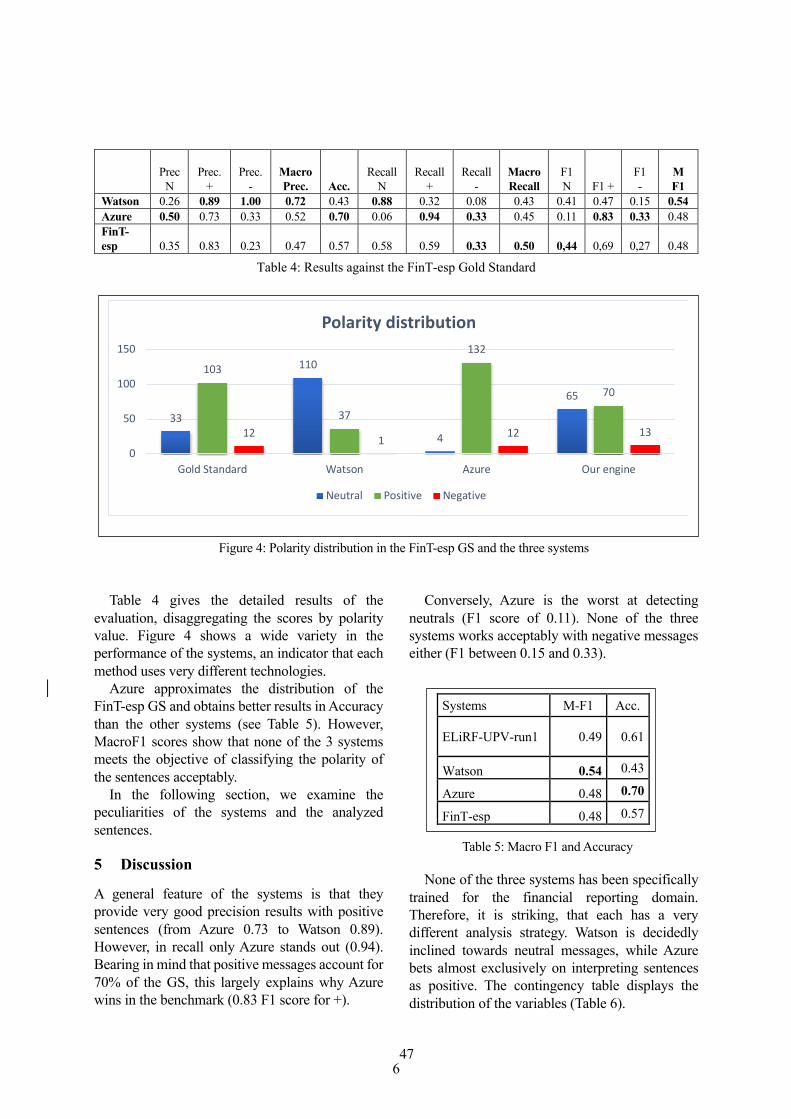
6
Figure 4: Polarity distribution in the FinT-esp GS and the three systems
Table 4 gives the detailed results of the evaluation, disaggregating the scores by polarity value. Figure 4 shows a wide variety in the performance of the systems, an indicator that each method uses very different technologies.
Azure approximates the distribution of the FinT-esp GS and obtains better results in Accuracy than the other systems (see Table 5). However, MacroF1 scores show that none of the 3 systems meets the objective of classifying the polarity of the sentences acceptably.
In the following section, we examine the peculiarities of the systems and the analyzed sentences.
5 Discussion
A general feature of the systems is that they provide very good precision results with positive sentences (from Azure 0.73 to Watson 0.89). However, in recall only Azure stands out (0.94). Bearing in mind that positive messages account for 70% of the GS, this largely explains why Azure wins in the benchmark (0.83 F1 score for +).
Conversely, Azure is the worst at detecting neutrals (F1 score of 0.11). None of the three systems works acceptably with negative messages either (F1 between 0.15 and 0.33).
Table 5: Macro F1 and Accuracy
None of the three systems has been specifically trained for the financial reporting domain. Therefore, it is striking, that each has a very different analysis strategy. Watson is decidedly inclined towards neutral messages, while Azure bets almost exclusively on interpreting sentences as positive. The contingency table displays the distribution of the variables (Table 6).
Prec
N Prec.
+ Prec.
-
Macro Prec. Acc.
Recall N
Recall +
Recall -
Macro Recall
F1 N F1 +
F1 -
M F1
Watson 0.26 0.89 1.00 0.72 0.43 0.88 0.32 0.08 0.43 0.41 0.47 0.15 0.54 Azure 0.50 0.73 0.33 0.52 0.70 0.06 0.94 0.33 0.45 0.11 0.83 0.33 0.48 FinT-esp 0.35 0.83 0.23
0.47 0.57 0.58 0.59 0.33 0.50 0,44 0,69 0,27 0.48
Table 4: Results against the FinT-esp Gold Standard
33
110
4
65
103
37
132
70
12 1 12 13
0
50
100
150
Gold Standard Watson Azure Our engine
Polarity distribution
Neutral Positive Negative
Systems M-F1 Acc.
ELiRF-UPV-run1 0.49 0.61
Watson 0.54 0.43
Azure 0.48 0.70
FinT-esp 0.48 0.57
47

7
Watson and Azure are based on ML technology, whereas FinT-esp is based on a general polarity lexicon and phrase rules. In the test results, the distribution of positives and neutrals is similar. In all three systems, the focus is on the subjective part of the texts and not on the description of the facts. Something that escapes all the tools evaluated here.
Table 6: Contingency tables
Next, we will show an example of each polarity, where none of the three systems has been able to analyze correctly. • Negative: “Seguimos siendo líderes, pero
nuestro mercado ha quedado reducido al 20% del total.” (trans. ‘We are still leaders, but our market has been reduced to 20% of the total’). From the investor's point of view, the strong reduction in the market share is considered as bad news. Azure and the Fin-tesp system classified the sentence as positive, probably because of the presence of "leaders.”
• Positive: “La deuda a diciembre de 2016 se redujo en los últimos doce meses de 305 millones a 188 millones de euros, es decir, hemos bajado 117 millones de euros en un año.” (Trans. ‘Debt at December 2016 was reduced in the last twelve months from 305 million euros to 188 million euros, in other words, we have reduced 117 million euros in one year’). Although "debt" is an inherently negative word, the message is positive for investors, as the debt has been drastically reduced. Watson and the FinT-esp tool classified the sentence as neutral; Azure as negative.
• Neutral: “A pesar de todo ello, la eficiencia de la actividad en una sola planta se fue poniendo de manifiesto a lo largo del año.” (Trans. ‘In spite of all this, the efficiency of the activity in a single plant became evident throughout the year’). In this sentence two opposite movements are neutralized, expressed by "in spite of" and by "efficiency". Azure and the FinT-esp tool classified the sentence as positive. Watson as neutral.
These examples reflect the argumentative complexity of financial narratives. It is common for two opposing ideas to appear in the same sentence. In some cases, they are neutralized but in others one is stronger than the other.
6 Conclusions and future work
Financial narratives have boosted across the last decade, offering a unique setting to test different computational linguistics methodologies for sentiment analysis across a specific language domain: financial reporting texts. Additionally, whereas most of the current studies have been centered in English financial narratives, the access to non-English financial and non-financial qualitative disclosures offers a great opportunity for sentiment analysis in other languages.
This paper confirms that the Spanish financial narrative suffers the Pollyanna effect (Rutherford 2005). That is, a communicative bias towards positive terms. This bias is consistent with the managers’ aversion to communicate bad news that may affect the company’s capital market value or the company’s reputation. The positive bias in the narratives affects the accuracy of the different semantic analysis tools. Compared to the use of SA techniques in other narrative contexts as the social media, differences in the performance of the three tested systems suggests that the specific language complexity of these texts requires more domain-specific methods for tone analysis. Particularly, across bad-performing companies where sentences including words such as “debt” or “restructuring” can be misclassified as “negative” whereas the overall context of the message is positive. Or bad news related to decreases in performance can be masked with the use of positive expressions (i.e. we are still leaders, although our market has been reduced to 20% of the total).
Additionally, the different distribution of polarity in two gold standards is consistent with
48
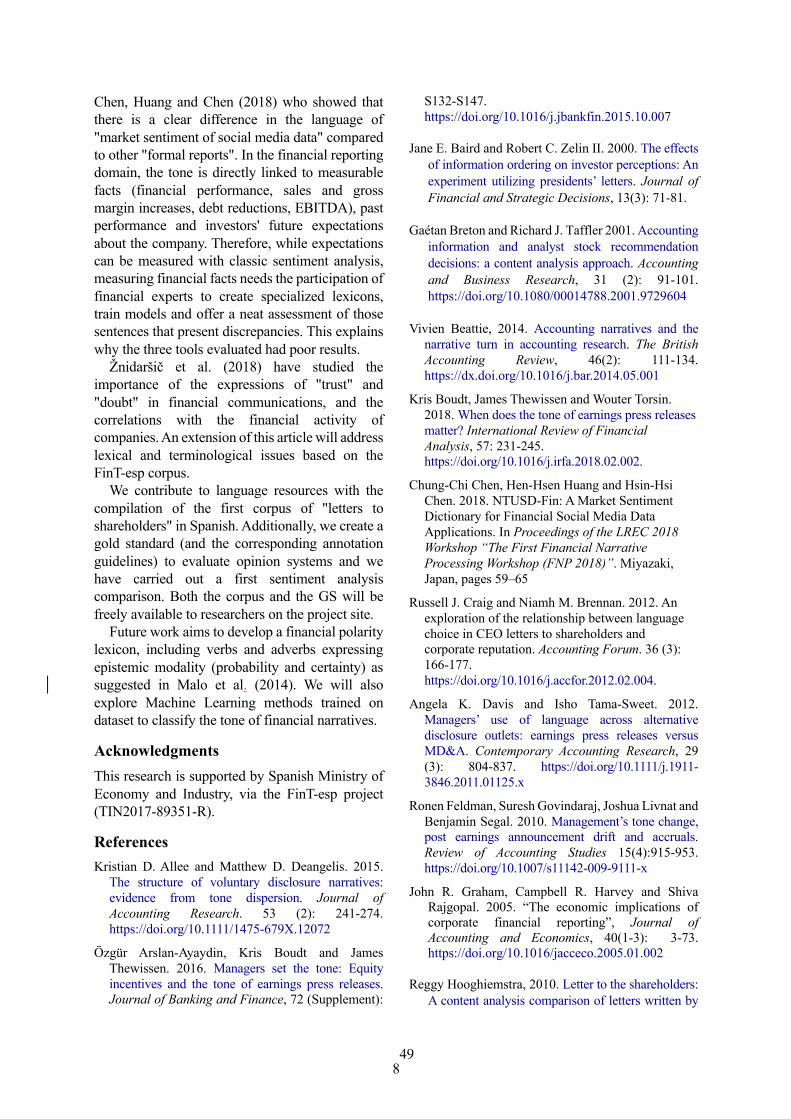
8
Chen, Huang and Chen (2018) who showed that there is a clear difference in the language of "market sentiment of social media data" compared to other "formal reports". In the financial reporting domain, the tone is directly linked to measurable facts (financial performance, sales and gross margin increases, debt reductions, EBITDA), past performance and investors' future expectations about the company. Therefore, while expectations can be measured with classic sentiment analysis, measuring financial facts needs the participation of financial experts to create specialized lexicons, train models and offer a neat assessment of those sentences that present discrepancies. This explains why the three tools evaluated had poor results.
Žnidaršič et al. (2018) have studied the importance of the expressions of "trust" and "doubt" in financial communications, and the correlations with the financial activity of companies. An extension of this article will address lexical and terminological issues based on the FinT-esp corpus.
We contribute to language resources with the compilation of the first corpus of "letters to shareholders" in Spanish. Additionally, we create a gold standard (and the corresponding annotation guidelines) to evaluate opinion systems and we have carried out a first sentiment analysis comparison. Both the corpus and the GS will be freely available to researchers on the project site.
Future work aims to develop a financial polarity lexicon, including verbs and adverbs expressing epistemic modality (probability and certainty) as suggested in Malo et al. (2014). We will also explore Machine Learning methods trained on dataset to classify the tone of financial narratives.
Acknowledgments This research is supported by Spanish Ministry of Economy and Industry, via the FinT-esp project (TIN2017-89351-R).
References Kristian D. Allee and Matthew D. Deangelis. 2015.
The structure of voluntary disclosure narratives: evidence from tone dispersion. Journal of Accounting Research. 53 (2): 241-274. https://doi.org/10.1111/1475-679X.12072
Özgür Arslan-Ayaydin, Kris Boudt and James Thewissen. 2016. Managers set the tone: Equity incentives and the tone of earnings press releases. Journal of Banking and Finance, 72 (Supplement):
S132-S147. https://doi.org/10.1016/j.jbankfin.2015.10.007
Jane E. Baird and Robert C. Zelin II. 2000. The effects of information ordering on investor perceptions: An experiment utilizing presidents’ letters. Journal of Financial and Strategic Decisions, 13(3): 71-81.
Gaétan Breton and Richard J. Taffler 2001. Accounting information and analyst stock recommendation decisions: a content analysis approach. Accounting and Business Research, 31 (2): 91-101. https://doi.org/10.1080/00014788.2001.9729604
Vivien Beattie, 2014. Accounting narratives and the narrative turn in accounting research. The British Accounting Review, 46(2): 111-134. https://dx.doi.org/10.1016/j.bar.2014.05.001
Kris Boudt, James Thewissen and Wouter Torsin. 2018. When does the tone of earnings press releases matter? International Review of Financial Analysis, 57: 231-245. https://doi.org/10.1016/j.irfa.2018.02.002.
Chung-Chi Chen, Hen-Hsen Huang and Hsin-Hsi Chen. 2018. NTUSD-Fin: A Market Sentiment Dictionary for Financial Social Media Data Applications. In Proceedings of the LREC 2018 Workshop “The First Financial Narrative Processing Workshop (FNP 2018)”. Miyazaki, Japan, pages 59–65
Russell J. Craig and Niamh M. Brennan. 2012. An exploration of the relationship between language choice in CEO letters to shareholders and corporate reputation. Accounting Forum. 36 (3): 166-177. https://doi.org/10.1016/j.accfor.2012.02.004.
Angela K. Davis and Isho Tama-Sweet. 2012. Managers’ use of language across alternative disclosure outlets: earnings press releases versus MD&A. Contemporary Accounting Research, 29 (3): 804-837. https://doi.org/10.1111/j.1911-3846.2011.01125.x
Ronen Feldman, Suresh Govindaraj, Joshua Livnat and Benjamin Segal. 2010. Management’s tone change, post earnings announcement drift and accruals. Review of Accounting Studies 15(4):915-953. https://doi.org/10.1007/s11142-009-9111-x
John R. Graham, Campbell R. Harvey and Shiva Rajgopal. 2005. “The economic implications of corporate financial reporting”, Journal of Accounting and Economics, 40(1-3): 3-73. https://doi.org/10.1016/jacceco.2005.01.002
Reggy Hooghiemstra, 2010. Letter to the shareholders: A content analysis comparison of letters written by
49
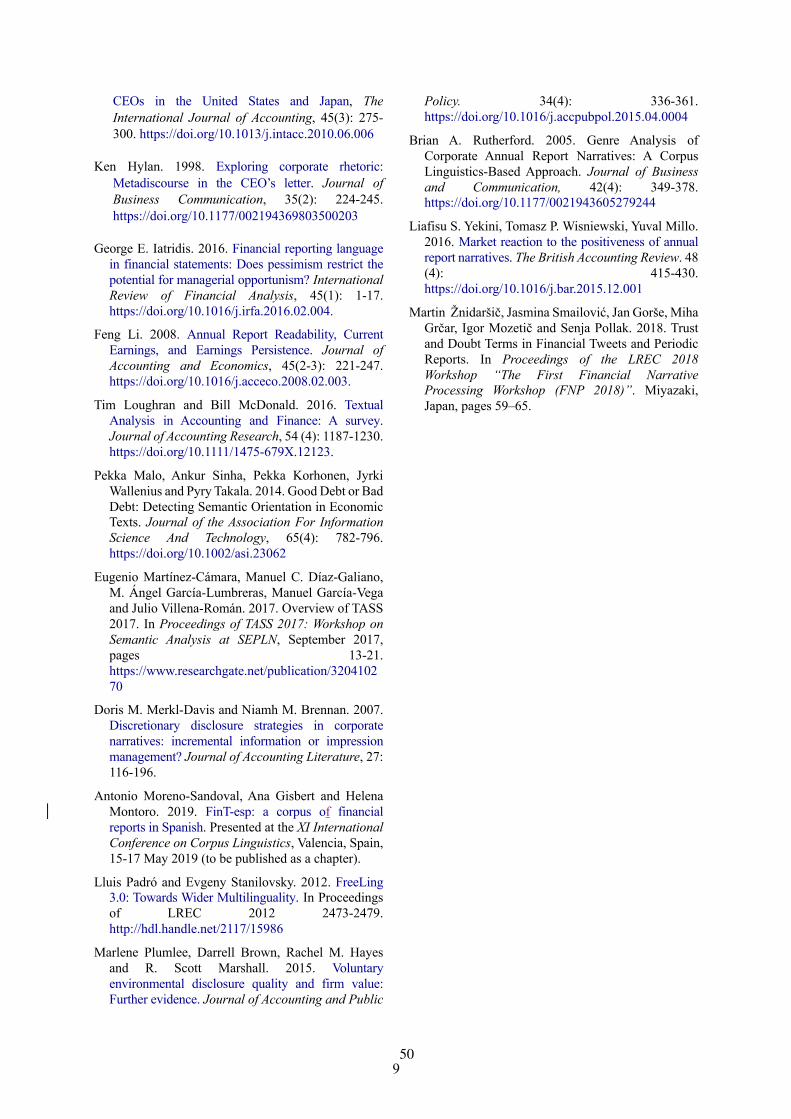
9
CEOs in the United States and Japan, The International Journal of Accounting, 45(3): 275-300. https://doi.org/10.1013/j.intacc.2010.06.006
Ken Hylan. 1998. Exploring corporate rhetoric: Metadiscourse in the CEO’s letter. Journal of Business Communication, 35(2): 224-245. https://doi.org/10.1177/002194369803500203
George E. Iatridis. 2016. Financial reporting language in financial statements: Does pessimism restrict the potential for managerial opportunism? International Review of Financial Analysis, 45(1): 1-17. https://doi.org/10.1016/j.irfa.2016.02.004.
Feng Li. 2008. Annual Report Readability, Current Earnings, and Earnings Persistence. Journal of Accounting and Economics, 45(2-3): 221-247. https://doi.org/10.1016/j.acceco.2008.02.003.
Tim Loughran and Bill McDonald. 2016. Textual Analysis in Accounting and Finance: A survey. Journal of Accounting Research, 54 (4): 1187-1230. https://doi.org/10.1111/1475-679X.12123.
Pekka Malo, Ankur Sinha, Pekka Korhonen, Jyrki Wallenius and Pyry Takala. 2014. Good Debt or Bad Debt: Detecting Semantic Orientation in Economic Texts. Journal of the Association For Information Science And Technology, 65(4): 782-796. https://doi.org/10.1002/asi.23062
Eugenio Martínez-Cámara, Manuel C. Díaz-Galiano, M. Ángel García-Lumbreras, Manuel García-Vega and Julio Villena-Román. 2017. Overview of TASS 2017. In Proceedings of TASS 2017: Workshop on Semantic Analysis at SEPLN, September 2017, pages 13-21. https://www.researchgate.net/publication/320410270
Doris M. Merkl-Davis and Niamh M. Brennan. 2007. Discretionary disclosure strategies in corporate narratives: incremental information or impression management? Journal of Accounting Literature, 27: 116-196.
Antonio Moreno-Sandoval, Ana Gisbert and Helena Montoro. 2019. FinT-esp: a corpus of financial reports in Spanish. Presented at the XI International Conference on Corpus Linguistics, Valencia, Spain, 15-17 May 2019 (to be published as a chapter).
Lluis Padró and Evgeny Stanilovsky. 2012. FreeLing 3.0: Towards Wider Multilinguality. In Proceedings of LREC 2012 2473-2479. http://hdl.handle.net/2117/15986
Marlene Plumlee, Darrell Brown, Rachel M. Hayes and R. Scott Marshall. 2015. Voluntary environmental disclosure quality and firm value: Further evidence. Journal of Accounting and Public
Policy. 34(4): 336-361. https://doi.org/10.1016/j.accpubpol.2015.04.0004
Brian A. Rutherford. 2005. Genre Analysis of Corporate Annual Report Narratives: A Corpus Linguistics-Based Approach. Journal of Business and Communication, 42(4): 349-378. https://doi.org/10.1177/0021943605279244
Liafisu S. Yekini, Tomasz P. Wisniewski, Yuval Millo. 2016. Market reaction to the positiveness of annual report narratives. The British Accounting Review. 48 (4): 415-430. https://doi.org/10.1016/j.bar.2015.12.001
Martin Žnidaršič, Jasmina Smailović, Jan Gorše, Miha Grčar, Igor Mozetič and Senja Pollak. 2018. Trust and Doubt Terms in Financial Tweets and Periodic Reports. In Proceedings of the LREC 2018 Workshop “The First Financial Narrative Processing Workshop (FNP 2018)”. Miyazaki, Japan, pages 59–65.
50
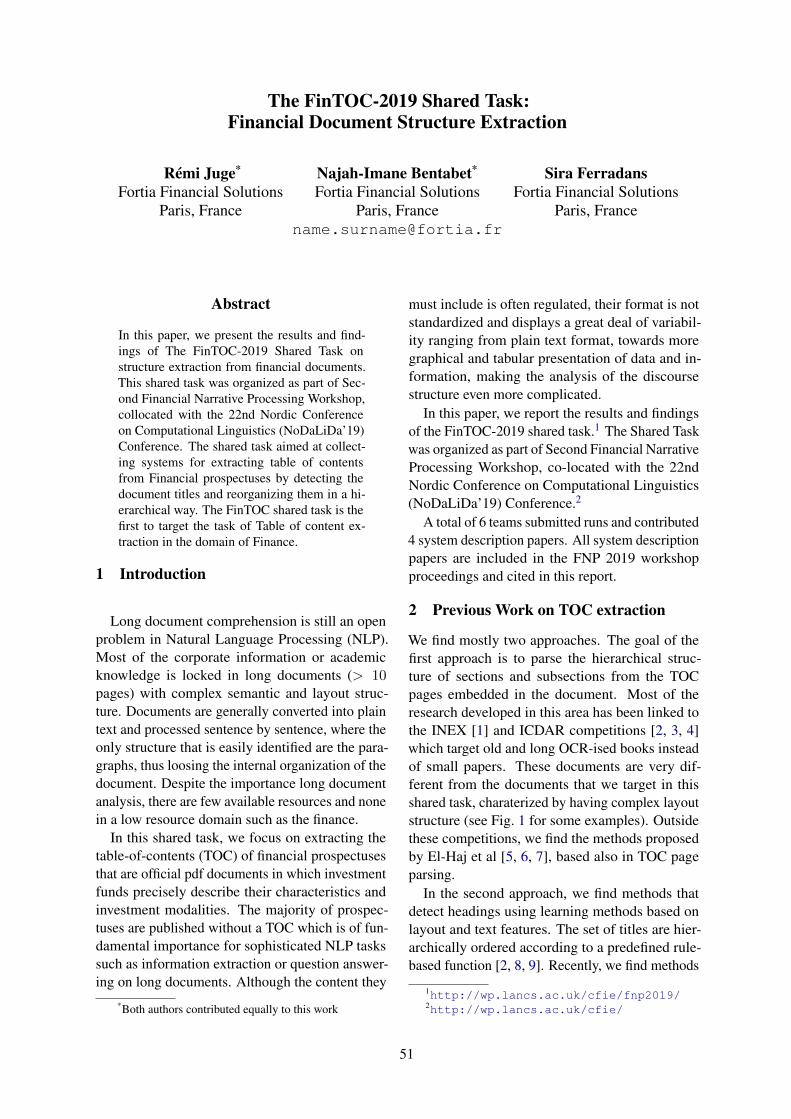
The FinTOC-2019 Shared Task:Financial Document Structure Extraction
Rémi Juge*
Fortia Financial SolutionsParis, France
Najah-Imane Bentabet*
Fortia Financial SolutionsParis, France
Sira FerradansFortia Financial Solutions
Paris, France
Abstract
In this paper, we present the results and find-ings of The FinTOC-2019 Shared Task onstructure extraction from financial documents.This shared task was organized as part of Sec-ond Financial Narrative Processing Workshop,collocated with the 22nd Nordic Conferenceon Computational Linguistics (NoDaLiDa’19)Conference. The shared task aimed at collect-ing systems for extracting table of contentsfrom Financial prospectuses by detecting thedocument titles and reorganizing them in a hi-erarchical way. The FinTOC shared task is thefirst to target the task of Table of content ex-traction in the domain of Finance.
1 Introduction
Long document comprehension is still an openproblem in Natural Language Processing (NLP).Most of the corporate information or academicknowledge is locked in long documents (> 10pages) with complex semantic and layout struc-ture. Documents are generally converted into plaintext and processed sentence by sentence, where theonly structure that is easily identified are the para-graphs, thus loosing the internal organization of thedocument. Despite the importance long documentanalysis, there are few available resources and nonein a low resource domain such as the finance.
In this shared task, we focus on extracting thetable-of-contents (TOC) of financial prospectusesthat are official pdf documents in which investmentfunds precisely describe their characteristics andinvestment modalities. The majority of prospec-tuses are published without a TOC which is of fun-damental importance for sophisticated NLP taskssuch as information extraction or question answer-ing on long documents. Although the content they
*Both authors contributed equally to this work
must include is often regulated, their format is notstandardized and displays a great deal of variabil-ity ranging from plain text format, towards moregraphical and tabular presentation of data and in-formation, making the analysis of the discoursestructure even more complicated.
In this paper, we report the results and findingsof the FinTOC-2019 shared task.1 The Shared Taskwas organized as part of Second Financial NarrativeProcessing Workshop, co-located with the 22ndNordic Conference on Computational Linguistics(NoDaLiDa’19) Conference.2
A total of 6 teams submitted runs and contributed4 system description papers. All system descriptionpapers are included in the FNP 2019 workshopproceedings and cited in this report.
2 Previous Work on TOC extraction
We find mostly two approaches. The goal of thefirst approach is to parse the hierarchical struc-ture of sections and subsections from the TOCpages embedded in the document. Most of theresearch developed in this area has been linked tothe INEX [1] and ICDAR competitions [2, 3, 4]which target old and long OCR-ised books insteadof small papers. These documents are very dif-ferent from the documents that we target in thisshared task, charaterized by having complex layoutstructure (see Fig. 1 for some examples). Outsidethese competitions, we find the methods proposedby El-Haj et al [5, 6, 7], based also in TOC pageparsing.
In the second approach, we find methods thatdetect headings using learning methods based onlayout and text features. The set of titles are hier-archically ordered according to a predefined rule-based function [2, 8, 9]. Recently, we find methods
1http://wp.lancs.ac.uk/cfie/fnp2019/2http://wp.lancs.ac.uk/cfie/
51

Figure 1: Random pages from the investment document data set. We observe that the title organization and, ingeneral, the layout is complex.
that address TOC extraction as a sequence labellingtask to which deep learning methods can be ap-plied [10].
3 Task Description
As part of the Financial Narrative Processing Work-shop, we present a shared task on Financial Docu-ment Structure Extraction.
Systems participating in this shared task weregiven a sample collection of financial prospectuseswith a wide variety of document structures andsizes. The goal was to automatically process themto extract their document structure. In fact the taskwas decomposed into two subtasks:
• Title detection: The document is splitted intotext blocks (a text block regroup lines thathave the same layout and that are spatiallyclose to each others) extracted from financialprospectuses by our in-house parser. Each textblock needs to be classified as a ‘title’ or ‘non-title’. As shown in Fig. 2 the titles can havedifferent layouts (marked with red and greenboxes) and they have to be distinguished fromthe regular text (‘non-title’ with grey boxes).
• TOC extraction: In this subtask, the goal isto (i) identify the hierarchical level of the titles,for instance, in Fig. 2, the text in green bound-ing boxes are hierarchically at the same leveland at a different level than the title in red,(ii) organize the titles of the document accord-ing to the hierarchical structure to producethe final TOC. Again in Fig. 2, the systemneeds to identify that the red tagged headingis hierarchically above than the green ones.
It is important to note that two titles, with thesame layout and the same text can have dif-ferent hierarchical levels depending on theirlocation in the document.
All participating teams were provided a commontraining data set for subtask 1 which included theoriginal pdfs, the xml versions of the pdfs obtainedusing the Poppler3 library, and a csv file containing,for each text block, a set of layout features andbinary labels indicating if the text block is a titleor not. For the second subtask, the training dataset also included a TOC of the documents in thexml format proposed by ICDAR competitions[2].A blind test set was used to evaluate the output ofthe participating teams.
As stated in Section 2, most of the previous re-search on TOC generation has been confined toshort papers such as research publications (Arxivdatabase), or standard documents such as digital-ized books. However, the task of extracting theTOC of commercial documents with a complexlayout structure in the domain of finance is notmuch explored in the literature.
4 Shared Task Data
Next, we discuss the corpora used for the title de-tection and TOC extraction subtasks.
4.1 Corpus annotation
Financial prospectuses are available online in apdf format and are also made available from assetmanagers. We compiled a list of 58 prospectusesfrom Luxembourg written in English to create the
3poppler.freedesktop.org
52

Figure 2: Screenshot of the annotation tool developed internally.
data sets of the subtasks. We chose prospectuseswith a wide variety of layouts and styles.
Xerox F1 Inex08 F1tagger 1 & tagger 2 93.8% 87.5%tagger 1 & reviewer 96.7% 92%tagger 2 & reviewer 96.8% 93.5%
Table 1: Agreement scores between different annota-tors of the investment document data set.
We provided three annotators with the originalpdfs and an internally developed web tool that pro-duces a hierarchical json file containing each TOC-entry together with some features (title, starting-page, ending-page and children). Each annotatorwas ask to:
1. Identify the title: Locate a title inside the pdfdocument.
2. Associate the entry level in the TOC: Everytitle must have an entry level in the TOC ofthe document with the following constraints1) high level entries cannot be inside lowerlevel entries (i.e. a Part cannot be inside aChapter), 2) the entries levels must be succes-sive (i.e. after a chapter we have a section nota subsection).
3. Add title: Copy-paste the title text directlyinto a web form, see Fig. 2 label Title
The predefined type of entry levels for the TOCwere Part, Chapter, section, subsection or para-
graph, that could be inside the Front matter, Bodymatter or Back matter. Therefore, the maximumTOC level was 5.
Each document was annotated independently bytwo people and a third person would review theannotations to resolve the possible conflicts. Theagreement scores between annotators are depictedin Table 1. We can observe high agreement scores,allowing us to be confident enough about the qual-ity of our data set.
Annotation Challenge: Headings identificationInvestment prospectuses are commercial docu-ments whose complex layout aims at highlightingspecific information such that a potential investorcan identify it quickly. Hence, annotating a titleand its level in the TOC hierarchy is a difficult taskas one cannot rely on the visual appearance of thetitle to do so. Some examples can be observed inFig. 3 and Fig. 4.
Annotation Challenge: Tagging pdf documents.The annotation of pdf documents is not evidentsince they are meant to be used for display. Thetool we developed for the annotations does notallow annotators to directly annotate on the pdf andthus they had to manage two different platformsat the same time. Working this way is prone tomistakes.
Annotation Challenge: Matching annotationsand text blocks. Our internal tool uses a copy-paste mechanism to create the TOC entries, intro-
53

Figure 3: Page from a prospectus with the titles se-lected coloured boxes. An example where title identi-fication is not evident because titles can have the samestyle as regular text.
Figure 4: Page from a prospectus with the titles se-lected coloured boxes. An example where title identi-fication is not evident because titles may expand a partof a line.
ducing some noise at the string level. On the otherhand, we extract text from the pdf using an auto-matic pdf to xml process. For the data set creation,each title annotation had to be matched to a textblock. This pipeline introduces noise in the finalcsv.
4.2 Corpus DescriptionIn the following, we provide an analysis of thedata used for the shared task. For both sub-tasks, the released training sets were the same ex-cepted that for subtask 2, an additional xml file(groundtruth[...]max_depth=5.icdar2013.xml) atthe ICDAR format was given. The reason for itis twofold: it gave to the participants the outputformat that they had to respect for the submissionsand allowed them to participate in subtask 2 with-out having a title extraction system from subtask1.
In the csv files available to the participants,each text block came with a set of layout features:is_bold, is_italic, is_all_caps, begins_with_cap, be-
gins_with_numbering and page_number and itssource xml file. Some statistics on this data set arepresented in Table 2.
number of documents 58average number of pages 90
number of text blocks 90441number of titles (% of text blocks) 14%
begin_with_numbering (% of text blocks) 20%is_bold (% of text blocks) 18%is_italic (% of text blocks) 1.3%
is_all_caps (% of text blocks) 20%begins_with_cap (% of text blocks) 68%
level 1 (% of titles) 7%level 2 (% of titles) 26%level 3 (% of titles) 33%level 4 (% of titles) 30%level 5 (% of titles) 4%
Table 2: Statistics on the investment document data set.
5 Participants and Systems
# teams # std runssubtask 1 5 10subtask 2 2 3papers 5 -
Table 3: Statistics on the participation in the two sub-atsks.
A total of 24 teams registered in the shared taskfrom 18 different institutions, and 6 teams partici-pated with standard runs and 5 submitted a paperwith the description of their method, see Table 4 formore information about their affiliation. In Table 3,we show the details on the submissions per task. Itis important to note that not all the participants thatsubmitted a standard run, sent a paper describing
Team Affiliation TasksDaniel [11] STIH, Sorbonne Université 1 and 2
FinDSE [12]Faculdade de Engenhariada Universidade do Porto
1
UWB [13] University of West Bohemia 1YseopLab [14] Yseop 1IHSMarkit IHS Markit 2Aiai OPT, Inc 1
Table 4: List of the 6 teams that participated in Sub-tasks of the FinTOC Shared Task.
54
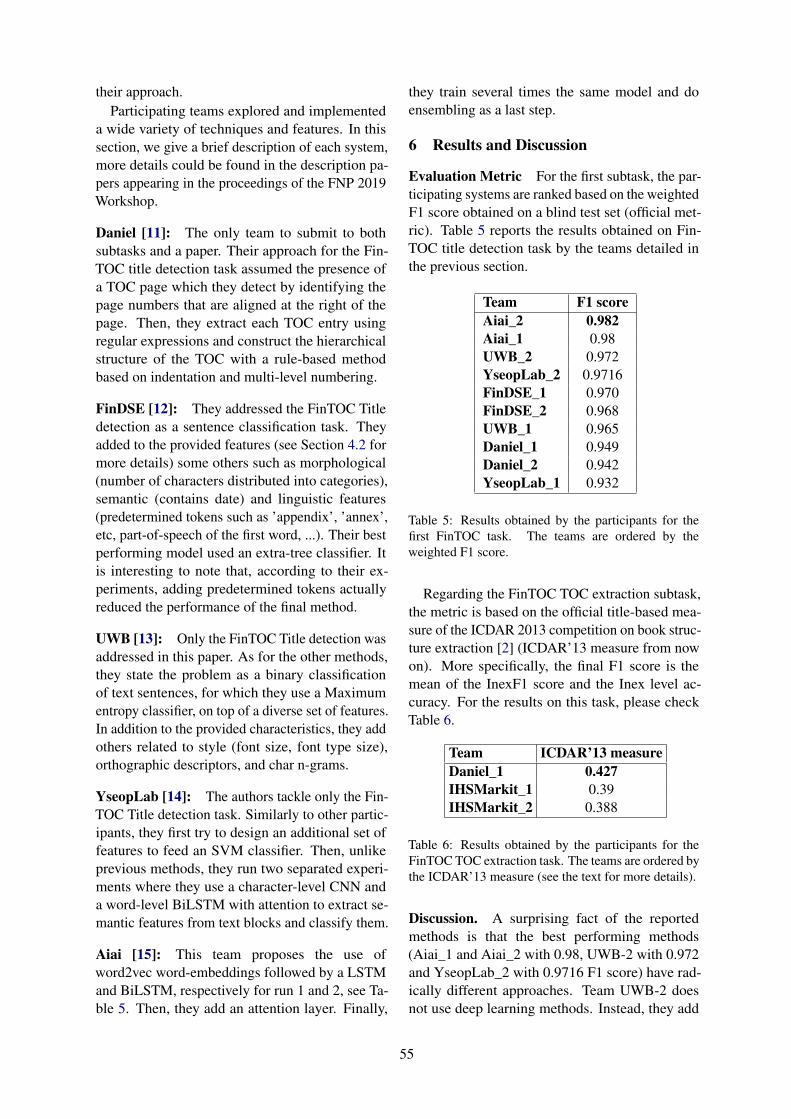
their approach.Participating teams explored and implemented
a wide variety of techniques and features. In thissection, we give a brief description of each system,more details could be found in the description pa-pers appearing in the proceedings of the FNP 2019Workshop.
Daniel [11]: The only team to submit to bothsubtasks and a paper. Their approach for the Fin-TOC title detection task assumed the presence ofa TOC page which they detect by identifying thepage numbers that are aligned at the right of thepage. Then, they extract each TOC entry usingregular expressions and construct the hierarchicalstructure of the TOC with a rule-based methodbased on indentation and multi-level numbering.
FinDSE [12]: They addressed the FinTOC Titledetection as a sentence classification task. Theyadded to the provided features (see Section 4.2 formore details) some others such as morphological(number of characters distributed into categories),semantic (contains date) and linguistic features(predetermined tokens such as ’appendix’, ’annex’,etc, part-of-speech of the first word, ...). Their bestperforming model used an extra-tree classifier. Itis interesting to note that, according to their ex-periments, adding predetermined tokens actuallyreduced the performance of the final method.
UWB [13]: Only the FinTOC Title detection wasaddressed in this paper. As for the other methods,they state the problem as a binary classificationof text sentences, for which they use a Maximumentropy classifier, on top of a diverse set of features.In addition to the provided characteristics, they addothers related to style (font size, font type size),orthographic descriptors, and char n-grams.
YseopLab [14]: The authors tackle only the Fin-TOC Title detection task. Similarly to other partic-ipants, they first try to design an additional set offeatures to feed an SVM classifier. Then, unlikeprevious methods, they run two separated experi-ments where they use a character-level CNN anda word-level BiLSTM with attention to extract se-mantic features from text blocks and classify them.
Aiai [15]: This team proposes the use ofword2vec word-embeddings followed by a LSTMand BiLSTM, respectively for run 1 and 2, see Ta-ble 5. Then, they add an attention layer. Finally,
they train several times the same model and doensembling as a last step.
6 Results and Discussion
Evaluation Metric For the first subtask, the par-ticipating systems are ranked based on the weightedF1 score obtained on a blind test set (official met-ric). Table 5 reports the results obtained on Fin-TOC title detection task by the teams detailed inthe previous section.
Team F1 scoreAiai_2 0.982Aiai_1 0.98UWB_2 0.972YseopLab_2 0.9716FinDSE_1 0.970FinDSE_2 0.968UWB_1 0.965Daniel_1 0.949Daniel_2 0.942YseopLab_1 0.932
Table 5: Results obtained by the participants for thefirst FinTOC task. The teams are ordered by theweighted F1 score.
Regarding the FinTOC TOC extraction subtask,the metric is based on the official title-based mea-sure of the ICDAR 2013 competition on book struc-ture extraction [2] (ICDAR’13 measure from nowon). More specifically, the final F1 score is themean of the InexF1 score and the Inex level ac-curacy. For the results on this task, please checkTable 6.
Team ICDAR’13 measureDaniel_1 0.427IHSMarkit_1 0.39IHSMarkit_2 0.388
Table 6: Results obtained by the participants for theFinTOC TOC extraction task. The teams are ordered bythe ICDAR’13 measure (see the text for more details).
Discussion. A surprising fact of the reportedmethods is that the best performing methods(Aiai_1 and Aiai_2 with 0.98, UWB-2 with 0.972and YseopLab_2 with 0.9716 F1 score) have rad-ically different approaches. Team UWB-2 doesnot use deep learning methods. Instead, they add
55

meaningful features to a maximum entropy classi-fier and they show through ablation tests that allfeatures are important to attain their result. On theother hand, the best performing system of Yseo-pLab_2 implements character-level CNN with nohand-engineered features. Finally, both methods ofAiai use (Bi-)LSTMs with attention mechanismson top of word embeddings. For the second task,only one paper was submitted describing Daniel_1team’s method, which proposed a rule-based ap-proach to title hierarchization.
In their paper [12], the team FinDSE performsa set of experiments with a wide variety of fea-tures. An interesting conclusion is that the usageof common first words from titles such as Annexor Appendix can be counter productive. This con-tradicts the methods commonly used in the liter-ature [16, 17, 18, 19]. Moreover, it shows thedifficulty of transferring state-of-the-art methodstrained on public datasets to commercial docu-ments such as financial prospectuses.
7 Conclusions
In this paper we presented the setup and resultsfor the FinTOC-2019 Shared Task:Financial Docu-ment Structure Extraction, organized as part of theSecond Financial Narrative Processing Workshop,collocated with the 22nd Nordic Conference onComputational Linguistics (NoDaLiDa’19) Con-ference. A total of 24 people registered from 18different institutions. 6 teams participated in theshared task with a wide variety of techniques.
We introduced a new data set on the TOC extrac-tion problem in text automatically extracted frompdf files in English. This scenario is very real-istic in everyday applications which may explainthe participation of public universities and profitorganizations from the financial domain.
Acknowledgments
We would like to thank our dedicated annotatorswho contributed to the building of the corpora usedin this Shared Task: Anais Koptient, Aouataf Djil-lani, and Lidia Duarte.
References[1] Bodin Dresevic, Aleksandar Uzelac, Bogdan
Radakovic, and Nikola Todic. Book layout analysis:Toc structure extraction engine. In Shlomo Geva,Jaap Kamps, and Andrew Trotman, editors, Ad-
vances in Focused Retrieval, pages 164–171, Berlin,Heidelberg, 2009. Springer Berlin Heidelberg.
[2] Antoine Doucet, Gabriella Kazai, Sebastian Colutto,and Günter Mühlberger. Icdar 2013 competition onbook structure extraction. In Document Analysisand Recognition (ICDAR), 2013 12th InternationalConference on, pages 1438–1443. IEEE, 2013.
[3] Thomas Beckers, Patrice Bellot, Gianluca Demar-tini, Ludovic Denoyer, Christopher M. De Vries,Antoine Doucet, Khairun Nisa Fachry, NorbertFuhr, Patrick Gallinari, Shlomo Geva, Wei-CheHuang, Tereza Iofciu, Jaap Kamps, Gabriella Kazai,Marijn Koolen, Sangeetha Kutty, Monica Lan-doni, Miro Lehtonen, Véronique Moriceau, RichiNayak, Ragnar Nordlie, Nils Pharo, Eric Sanjuan,Ralf Schenkel, Xavier Tannier, Martin Theobald,James A. Thom, Andrew Trotman, and Arjen P.De Vries. Report on INEX 2009. Sigir Forum,44(1):38–57, June 2010. Article disponible en ligne :http://www.cs.otago.ac.nz/homepages/andrew/papers/2010-4.pdf.
[4] Thi Tuyet Hai Nguyen, Antoine Doucet, and Mick-ael Coustaty. Enhancing table of contents extractionby system aggregation. In Proceedings of the In-ternational Conference on Document Analysis andRecognition, ICDAR, 2018.
[5] Mahmoud El Haj, Paul Rayson, Steven Young, andMartin Walker. Detecting document structure in avery large corpus of UK financial reports. LREC’14Ninth International Conference on Language Re-sources and Evaluation. Proceedings of the NinthInternational Conference on Language Resourcesand Evaluation (LREC-2014) . European LanguageResources Association (ELRA), Reykjavik, Iceland,pp. 1335-1338, 2014.
[6] Mahmoud El Haj, Paul Edward Rayson, Steven EricYoung, Paulo Alves, and Carlos Herrero Zorita. Mul-tilingual Financial Narrative Processing: AnalysingAnnual Reports in English, Spanish and Portuguese.World Scientific Publishing, 2 2019.
[7] Mahmoud El-Haj, Paulo Alves, Paul Rayson, Mar-tin Walker, and Steven Young. Retrieving, clas-sifying and analysing narrative commentary in un-structured (glossy) annual reports published as pdffiles. Accounting and Business Research, pages 1–29, 2019.
[8] Caihua Liu, Jiajun Chen, Xiaofeng Zhang, Jie Liu,and Yalou Huang. Toc structure extraction from ocr-ed books. In International Workshop of the Initiativefor the Evaluation of XML Retrieval, pages 98–108.Springer, 2011.
[9] Abhijith Athreya Mysore Gopinath, Shomir Wilson,and Norman Sadeh. Supervised and unsupervisedmethods for robust separation of section titles andprose text in web documents. In Proceedings of the2018 Conference on Empirical Methods in NaturalLanguage Processing, pages 850–855, 2018.
56
[10] Najah-Imane Bentabet, Rémi Juge, and Sira Fer-radans. Table-of-contents generation on contempo-rary documents. In Proceedings of ICDAR 2019.
[11] Gael Lejeune Emmanuel Giguet. Daniel fintoc-2019 shared task: Toc extraction and title detec-tion. In The Second Workshop on Financial Narra-tive Processing of NoDalida 2019, 2019.
[12] Henrique Cardoso Carla Abreu and EugénioOliveira. Findsefintoc-2019 shared task. In The Sec-ond Workshop on Financial Narrative Processing ofNoDalida 2019, 2019.
[13] Tomas Hercig and Pavel Král. Uwbfintoc-2019shared task: Financial document title detection. InThe Second Workshop on Financial Narrative Pro-cessing of NoDalida 2019, 2019.
[14] Anubhav Gupta Hannah Abi-Akl and DominiqueMariko. Fintoc-2019 shared task: Finding title intext blocks. In The Second Workshop on FinancialNarrative Processing of NoDalida 2019, 2019.
[15] Ke Tian and Zi Jun Peng. Finance document ex-traction using data augmented and attention. In TheSecond Workshop on Financial Narrative Process-ing of NoDalida 2019, 2019.
[16] Anoop M Namboodiri and Anil K Jain. Documentstructure and layout analysis. In Digital DocumentProcessing, pages 29–48. Springer, 2007.
[17] Alan Conway. Page grammars and page parsing. asyntactic approach to document layout recognition.In Document Analysis and Recognition, 1993., Pro-ceedings of the Second International Conference on,pages 761–764. IEEE, 1993.
[18] Florendia Fourli-Kartsouni, Kostas Slavakis, Geor-gios Kouroupetroglou, and Sergios Theodoridis. Abayesian network approach to semantic labellingof text formatting in xml corpora of documents.In International Conference on Universal Accessin Human-Computer Interaction, pages 299–308.Springer, 2007.
[19] Koji Nakagawa, Akihiro Nomura, and MasakazuSuzuki. Extraction of logical structure from arti-cles in mathematics. In International Conference onMathematical Knowledge Management, pages 276–289. Springer, 2004.
57
FinTOC-2019 Shared Task: Finding Title in Text Blocks
Hanna Abi AklYseop
Anubhav GuptaYseop
Dominique MarikoYseop
Abstract
As part of FNP Workshop Series, “Title Detec-tion” is one of the two shared tasks proposedon Financial Document Structure Extraction.The objective of the task was to classify agiven text block, that had been extracted fromfinancial prospectuses in pdf format, as a title.Our DNN-based approach scored a weightedF1 of 97.16% on the test data.
1 Introduction
The Portable Document Format, also known aspdf, is an electronic document format from AdobeInc. Launched in early 1990s, this format has nowbecome the de-facto means of sharing informa-tion across the Internet. However, given the lackof ”basic high level logical structure information”(Chao and Fan, 2004), the process of layout andcontent extraction from a pdf is difficult. The ob-stacles in extracting information from a pdf, asenumerated by Hu and Liu (2014), are:
• absence of information regarding structure
• disagreement of the render order with the“reading order”
• overlap of object blocks
• myriad layouts and fonts
Consider the process of automating the infor-mation extraction from financial documents. Notbeing able to recognize where a paragraph beginsor ends in a financial report can be a strain onmany levels: a) it not only blurs important infor-mation, but b) can also be misleading in decisionstaken based on said report. Though a number ofopen-source and commercial tools are available,the goal of establishing correctly a semantic unit(paragraphs, tables) and ascertaining its role (title,
header) is far from being complete (Bast and Ko-rzen, 2017).
The FinTOC-2019 Shared Task: “FinancialDocument Structure Extraction” (Juge et al.,2019) of Financial Narrative Processing Work-shop comprises two shared-tasks:
• Title detection
• TOC structure extraction
In this paper, we propose and evaluate threemethods to detect titles (Shared Task 1). Since textcomes in many different formats, this problem canbecome exponentially heavy to treat. For that pur-pose, our experiment is concerned with identifyingonly titles in pdf reports.
2 Experiments
Our first approach was to use a standard SVMclassifier (Cortes and Vapnik, 1995) to understandthe data and evaluate their non-linearity. The sec-ond and third approaches are based on deep learn-ing classifiers. The second design is inspired by aBiLSTM recurrent neural network (RNN) modelwith attention (Zhou et al., 2016). The third modelis a convolutional neural network (CNN) withcharacter embedding (Zhang et al., 2015).
2.1 Data
The training data was extracted from 44 docu-ments using the Poppler utility libraries (poppler-utils) and converted into xml files. The con-tents of the xml were transformed into a csv filewith the help of various heuristics by the organ-isers. The resulting file had 75 625 text blocksand 7 features describing each of them. Sincethese features were automatically generated theywere noisy. For example, some of the text blocksthat begin with determiner such as ‘a’, dates
58
and addresses were erroneously marked as be-gins with numbering. Even though the originalpdf files were provided we decided to work onlywith the provided xml and csv files because a) theresult needed to be submitted in the provided csvformat and b) the heuristic to transform xml intotext blocks (as presented in csv) was unknown.
2.2 Approach
The first model we evaluated was a SVM classifier.It was trained on a combination of features, com-piled from the existing features presented withinthe original csv file as well as additional featuresextracted from pre-processing work on the xmlfiles (similar to format and linguistic features ofHu et al. (2006)). These features capture layoutand form of the text, which can play a decidingpart in the classification. In addition to the pro-vided features, we computed:
1. top: integer indicating the placement of thetext with respect to the top of the documentpage
2. left: integer indicating the placement of thetext with respect to the left of the documentpage
3. width: integer indicating the horizontalspace occupied by the text
4. height: integer indicating the vertical spaceoccupied by the text
5. font: integer indicating the size of the text
6. number of dots: integer indicating the totalnumber of dots in the text
7. is last character dot: binary indicating if thetext ends with a dot (1) or not (0)
8. count of capital letters: integer indicatingthe total number of capital characters in thetext
9. character count: integer indicating the totalnumber of characters in the text
10. word count: integer indicating the totalnumber of words in the text
11. average word length: float indicating the av-erage number of characters per word in thetext
12. number count: integer indicating the totalnumber of digits in the text
13. count of words in capital: integer indicatingthe total number of capitalized words in thetext
14. similarly avg word length: integer indicat-ing average token length
15. cnn output binary prediction provided by theCNN model (described later).
The observed variance and results were veryclose with and without the CNN outputs added asinput features, so after evaluation of the noise inthe features (as predictors), we decided to fostertwo deep learning approaches based on raw textentries and to focus on regularisation methodsto prevent high variance observed in the SVMresults.
The second model is a BiLSTM–Attentionmodel relying on word embedding. It has 2 denselayers, each composed of 64 neurons and is de-ployed with a batch size of 256 and 100 epochs.The purpose of this method is to evaluate the pos-sible semantic composition of sentences (as pre-dictors) and how relevant they are for the task. Itcontains five components:
1. Input layer: inputs text to the model
2. Embedding layer: parses text into wordsand maps each word into a low dimensionvector
3. LSTM layer: makes use of BiLSTM to gethigh-level features from the previous step
4. Attention layer: produces a weight vector,and merges word-level features from eachtime step into a sentence-level feature vector,by multiplying the weight vector
5. Output layer: uses the sentence-level fea-ture vector for classification
The aim of this architecture is to make use ofthe attention mechanism, which can automaticallyfocus on the words that have a decisive effect onclassification (in this case, the heavy constituentsof a title), to capture the most important seman-tic information in a text block, circumventingthe question of noise in the feature set. The
59

ExperimentModel
BiLSTM-ATTENTION CNN SVM
Hardware
Intel Core i7 2.20GHz16GB RAM
NVIDIA GeForce GTX 1050 Ti 4Go
Intel Core i7 2.20GHz16GB RAM
NVIDIA GeForce GTX 1070 8Go
Intel Xeon 3.70GHz64GB RAM8 CPU cores
F1 (home)(%)
F1 (lboard)(%)
RunTime(hrs)
F1 (home)(%)
F1 (lboard)(%)
RunTime(hrs)
F1 (home)(%)
F1 (lboard)(%)
RunTime(hrs)
Experiment 1 96.02 91.24 7-9 - - - 95.96 91.13 2-4Experiment 2 94.04 93.18 7-9 95.03 97.16 1-2 - - -
Table 1: Comparative table of results provided for leaderboard
hyper-parameter selection follows the findings of(Zhou et al., 2016) for the neural network. Thenumber of layers, batch size, number of epochs,and learning rate have all been picked from areferenced model which achieved competitiveresults against state-of-the-art networks. Thesequence length has been chosen to match thenumber of characters in the longest sentence. Wealso used dropout to regularize the network andalleviate over-fitting. Between experiments 1 and2, we increased the number of hidden units from32 to 64 to improve the accuracy of the model.
The third model is a CNN classifier. The pur-pose of this method is to evaluate the combina-torics of characters at word level (as predictors)and how relevant they are for the task. A state-of-the-art competitive word-level character embed-ded convolution network is used. The model fol-lows the conclusion of Zhang et al. (2015) fortackling small dimensional problems: integratingboth upper-case and lower-case letters in set ofpredictors might improve the results in case thedata set is small (AG news case). This consider-ation was reinforced by the intuition that identify-ing both small and capital characters was relevantfor the Title detection task, which was confirmedby comparing between the results driven from dif-ferentiating between upper and lower cases andthe those driven by lower-case only. From a dic-tionary of all characters included in the trainingset, a character embedding operation is performedon all sentences. Word-level character embeddingsize of 175 is chosen for this transformation andsentences are turned into a matrix of embeddedcharacters. This matrix is then fed to the CNN,which has the following characteristics:
1. Convolution layers: 2D convolution (4 con-volution layers)
2. Pooling layers: 1D convolution reducing di-
mensions
3. Fully connected layers: transformation pro-viding the prediction from softmax probabil-ities.
4. Parameters selection: In order to reducethe variance while training, we used a stan-dard dropout of 0.5 at each epoch. Aug-menting or reducing the dropout has showedworse results. We also added a cross vali-dation step from a set of 1500 individuals,evaluated every ten epoch, the best epoch inthis evaluation range was then chosen to be-come the warm start for the next 10 epochs.The number of layers chosen is the best tradeoff we found between a deeper network, ourGPU computational capacity and runtime.The model was trained on 100 epochs, butconverges quickly towards epoch 40, whicheventually provided the best results.
2.3 EvaluationFor the given training data set, approximately 1 in6 text blocks was a title. Thus, it was a case ofclass imbalance. A classifier which labels everytext block as ‘non-title’ scored a weighted F1 of80.12 %. Our objective was to improve this score.
The performance of the three models on trainand leaderboard sets are listed in Table 1. In thisTable, the scores we obtained locally (F1 (home))are compared with the final score on competitiontest set (F1 (lboard)). The experiment 1 corre-sponds to the results sent by the first deadline andthe second one refers to the extended deadline sub-mission. As the Deep Learning models originallyhad been trained on different GPU, we also addeda comparative table on the model with best perfor-mances (CNN) with same architecture and param-eters as the one provided for leaderboard results,so the influence of the architecture is clarified (Ta-ble 2).
60
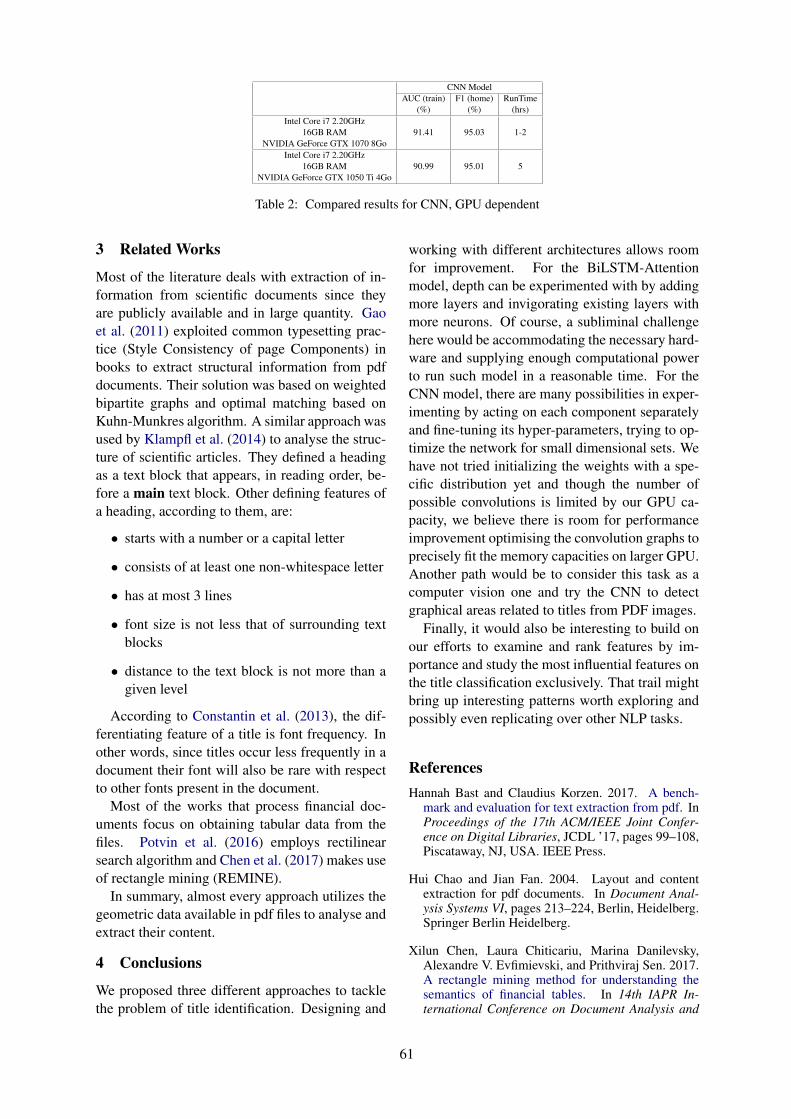
CNN ModelAUC (train)
(%)F1 (home)
(%)RunTime
(hrs)Intel Core i7 2.20GHz
16GB RAMNVIDIA GeForce GTX 1070 8Go
91.41 95.03 1-2
Intel Core i7 2.20GHz16GB RAM
NVIDIA GeForce GTX 1050 Ti 4Go90.99 95.01 5
Table 2: Compared results for CNN, GPU dependent
3 Related Works
Most of the literature deals with extraction of in-formation from scientific documents since theyare publicly available and in large quantity. Gaoet al. (2011) exploited common typesetting prac-tice (Style Consistency of page Components) inbooks to extract structural information from pdfdocuments. Their solution was based on weightedbipartite graphs and optimal matching based onKuhn-Munkres algorithm. A similar approach wasused by Klampfl et al. (2014) to analyse the struc-ture of scientific articles. They defined a headingas a text block that appears, in reading order, be-fore a main text block. Other defining features ofa heading, according to them, are:
• starts with a number or a capital letter
• consists of at least one non-whitespace letter
• has at most 3 lines
• font size is not less that of surrounding textblocks
• distance to the text block is not more than agiven level
According to Constantin et al. (2013), the dif-ferentiating feature of a title is font frequency. Inother words, since titles occur less frequently in adocument their font will also be rare with respectto other fonts present in the document.
Most of the works that process financial doc-uments focus on obtaining tabular data from thefiles. Potvin et al. (2016) employs rectilinearsearch algorithm and Chen et al. (2017) makes useof rectangle mining (REMINE).
In summary, almost every approach utilizes thegeometric data available in pdf files to analyse andextract their content.
4 Conclusions
We proposed three different approaches to tacklethe problem of title identification. Designing and
working with different architectures allows roomfor improvement. For the BiLSTM-Attentionmodel, depth can be experimented with by addingmore layers and invigorating existing layers withmore neurons. Of course, a subliminal challengehere would be accommodating the necessary hard-ware and supplying enough computational powerto run such model in a reasonable time. For theCNN model, there are many possibilities in exper-imenting by acting on each component separatelyand fine-tuning its hyper-parameters, trying to op-timize the network for small dimensional sets. Wehave not tried initializing the weights with a spe-cific distribution yet and though the number ofpossible convolutions is limited by our GPU ca-pacity, we believe there is room for performanceimprovement optimising the convolution graphs toprecisely fit the memory capacities on larger GPU.Another path would be to consider this task as acomputer vision one and try the CNN to detectgraphical areas related to titles from PDF images.
Finally, it would also be interesting to build onour efforts to examine and rank features by im-portance and study the most influential features onthe title classification exclusively. That trail mightbring up interesting patterns worth exploring andpossibly even replicating over other NLP tasks.
ReferencesHannah Bast and Claudius Korzen. 2017. A bench-
mark and evaluation for text extraction from pdf. InProceedings of the 17th ACM/IEEE Joint Confer-ence on Digital Libraries, JCDL ’17, pages 99–108,Piscataway, NJ, USA. IEEE Press.
Hui Chao and Jian Fan. 2004. Layout and contentextraction for pdf documents. In Document Anal-ysis Systems VI, pages 213–224, Berlin, Heidelberg.Springer Berlin Heidelberg.
Xilun Chen, Laura Chiticariu, Marina Danilevsky,Alexandre V. Evfimievski, and Prithviraj Sen. 2017.A rectangle mining method for understanding thesemantics of financial tables. In 14th IAPR In-ternational Conference on Document Analysis and
61
Recognition, ICDAR 2017, Kyoto, Japan, November9-15, 2017, pages 268–273.
Alexandru Constantin, Steve Pettifer, and AndreiVoronkov. 2013. Pdfx: Fully-automated pdf-to-xmlconversion of scientific literature. In Proceedings ofthe 2013 ACM Symposium on Document Engineer-ing, DocEng ’13, pages 177–180, New York, NY,USA. ACM.
Corinna Cortes and Vladimir Vapnik. 1995. Support-vector networks. Machine Learning, 20(3):273–297.
Liangcai Gao, Zhi Tang, Xiaofan Lin, Ying Liu,Ruiheng Qiu, and Yongtao Wang. 2011. Struc-ture extraction from pdf-based book documents.In Proceedings of the 11th Annual InternationalACM/IEEE Joint Conference on Digital Libraries,JCDL ’11, pages 11–20, New York, NY, USA.ACM.
Jianying Hu and Ying Liu. 2014. Analysis of Docu-ments Born Digital, pages 775–804. Springer Lon-don, London.
Yunhua Hu, Hang Li, Yunbo Cao, Li Teng, DmitriyMeyerzon, and Qinghua Zheng. 2006. Automaticextraction of titles from general documents usingmachine learning. Information Processing Manage-ment, 42(5):1276 – 1293.
Remi Juge, Najah-Imane Bentabet, and Sira Ferradans.2019. The fintoc-2019 shared task: Financial doc-ument structure extraction. In The Second Work-shop on Financial Narrative Processing of NoDal-ida 2019.
Stefan Klampfl, Michael Granitzer, Kris Jack, and Ro-man Kern. 2014. Unsupervised document structureanalysis of digital scientific articles. InternationalJournal on Digital Libraries, 14(3):83–99.
Benoit Potvin, Roger Villemaire, and Ngoc-Tan Le.2016. A position-based method for the extractionof financial information in PDF documents. In Pro-ceedings of the 21st Australasian Document Com-puting Symposium, ADCS 2016, Caulfield, VIC,Australia, December 5-7, 2016, pages 9–16.
Xiang Zhang, Junbo Zhao, and Yann LeCun. 2015.Character-level convolutional networks for text clas-sification. In Advances in neural information pro-cessing systems, pages 649–657.
Peng Zhou, Wei Shi, Jun Tian, Zhenyu Qi, BingchenLi, Hongwei Hao, and Bo Xu. 2016. Attention-based bidirectional long short-term memory net-works for relation classification. In Proceedings ofthe 54th Annual Meeting of the Association for Com-putational Linguistics (Volume 2: Short Papers),pages 207–212, Berlin, Germany. Association forComputational Linguistics.
62
Daniel@FinTOC-2019 Shared Task : TOC Extraction and Title Detection
Emmanuel GiguetNormandie Univ, UNICAEN,ENSICAEN, CNRS, GREYC
14000 Caen, [email protected]
Gael LejeuneSTIH, EA 4509
Sorbonne University75006 Paris, France
AbstractWe present different methods for the two tasksof the 2019 FinTOC challenge: Title Detec-tion and Table of Contents Extraction. For theTitle Detection task we present different ap-proaches using various features : visual char-acteristics, punctuation density and charactern-grams. Our best approach achieved an offi-cial F-measure score of 94.88%, ranking 6 onthis task. For the TOC extraction task, we pre-sented a method combining visual characteris-tics of the document layout. With this methodwe ranked first on this task with 42.72%.
1 Introduction
This paper describe our participation to theFinTOC-2019 Shared Task dedicated to Finan-cial Document Structure Extraction (Remi Juge,2019). We submitted results for the two sub tasks:Title detection, a binary classification task focus-ing on detecting titles in financial prospectuses,and TOC structure extraction aiming at identify-ing and organizing the headers of the documentaccording to its hierarchical structure.
Title detection and Table of Content (ToC)extraction are two important tasks for NaturalLanguage Processing and Document Analysis, inparticular in the context of digital libraries andscanned books. ToC extraction aims to retrieveor create a ToC in documents where the logicalstructure is not explicitly marked, difficult to de-tect or “computationnaly opaque” (de Busser andMoens, 2006). ToC extraction enriches the accessto searchable text, in particular in the domain ofdigital humanities in which the texts are usuallylonger than in other domains involving Informa-tion retrieval (IR) and Natural language Process-ing (NLP). Rich logical structures is exploited forinstance for document classification and cluster-ing (Doucet and Lehtonen, 2007; Ait Elhadj et al.,2012).
Title detection can be a preliminary task for ToCextraction since it will help to detect a page withan existing ToC or it can help to find the bricks toreconstruct the ToC. It can also help classificationsystems which rely on titles and text structure todetect salient information in textual data(Lejeuneet al., 2015). Salient sentences detection can aswell be improved via text structure information(Denil et al., 2014).
In section 2 we will give a brief presentation ofexisting techniques for ToC extraction and title de-tection tasks. We will present our systems1 in sec-tion 3 and Section 4 will be dedicated to conclu-sion and perspectives.
2 State of the Art
Textual data is often described as “unstructureddata” as opposed to structured data like databasesor XML data for instance. However, it is probablymore accurate to describe textual data as “com-putationnaly opaque” so that only the file formatcan be qualified structured, unstructured or semi-structured. The logical structure of natural lan-guage data is probably more important for humanunderstanding than the syntactic structure. For in-stance, in press articles important information isfound in the titles and subtitles, making the de-tection of titles important for improving web in-dexation (Changuel et al., 2009) or downstreamNLP tasks (Huttunen et al., 2011; Daille et al.,2016; Tkaczyk et al., 2018). Regarding title detec-tion task itself, (Xue et al., 2007) showed that forweb pages, the size of the characters is not enoughto detect titles but (Beel et al., 2013) showed tothe contrary that for PDF document it is the bestheuristic (70% accuracy).
Visual and textual information can be combined
1Code source available online : https://github.com/rundimeco/daniel_fintoc2019
63
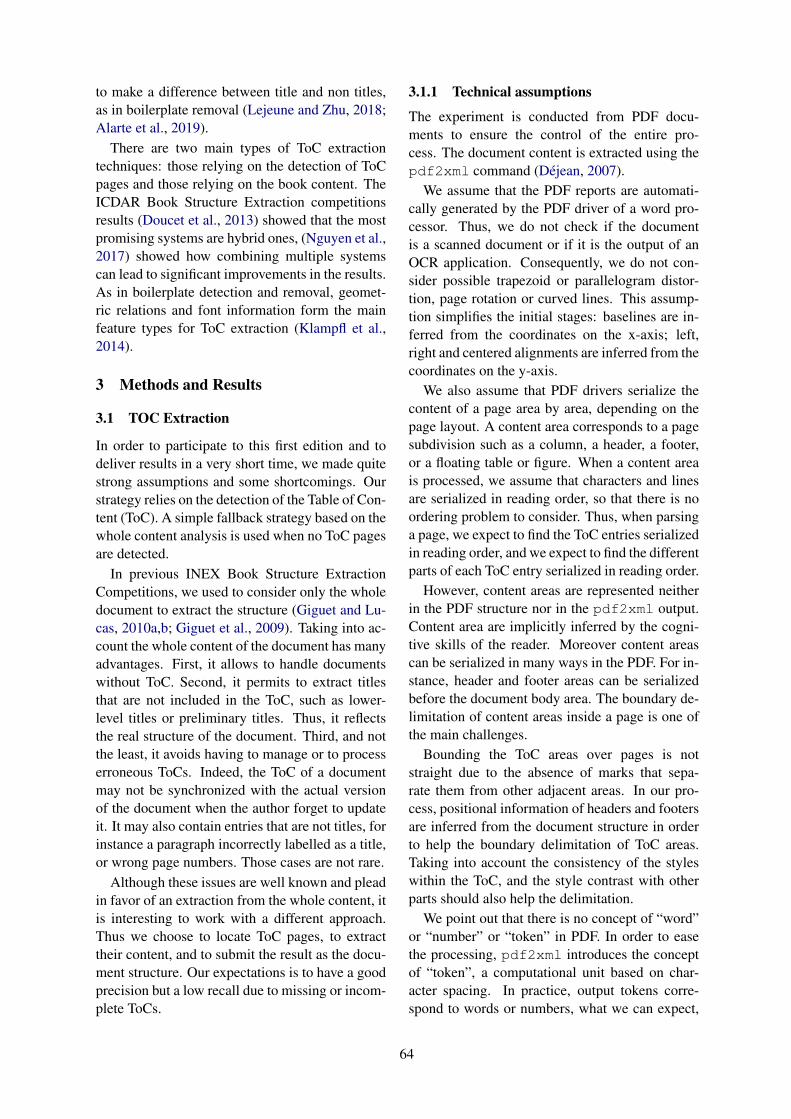
to make a difference between title and non titles,as in boilerplate removal (Lejeune and Zhu, 2018;Alarte et al., 2019).
There are two main types of ToC extractiontechniques: those relying on the detection of ToCpages and those relying on the book content. TheICDAR Book Structure Extraction competitionsresults (Doucet et al., 2013) showed that the mostpromising systems are hybrid ones, (Nguyen et al.,2017) showed how combining multiple systemscan lead to significant improvements in the results.As in boilerplate detection and removal, geomet-ric relations and font information form the mainfeature types for ToC extraction (Klampfl et al.,2014).
3 Methods and Results
3.1 TOC Extraction
In order to participate to this first edition and todeliver results in a very short time, we made quitestrong assumptions and some shortcomings. Ourstrategy relies on the detection of the Table of Con-tent (ToC). A simple fallback strategy based on thewhole content analysis is used when no ToC pagesare detected.
In previous INEX Book Structure ExtractionCompetitions, we used to consider only the wholedocument to extract the structure (Giguet and Lu-cas, 2010a,b; Giguet et al., 2009). Taking into ac-count the whole content of the document has manyadvantages. First, it allows to handle documentswithout ToC. Second, it permits to extract titlesthat are not included in the ToC, such as lower-level titles or preliminary titles. Thus, it reflectsthe real structure of the document. Third, and notthe least, it avoids having to manage or to processerroneous ToCs. Indeed, the ToC of a documentmay not be synchronized with the actual versionof the document when the author forget to updateit. It may also contain entries that are not titles, forinstance a paragraph incorrectly labelled as a title,or wrong page numbers. Those cases are not rare.
Although these issues are well known and pleadin favor of an extraction from the whole content, itis interesting to work with a different approach.Thus we choose to locate ToC pages, to extracttheir content, and to submit the result as the docu-ment structure. Our expectations is to have a goodprecision but a low recall due to missing or incom-plete ToCs.
3.1.1 Technical assumptions
The experiment is conducted from PDF docu-ments to ensure the control of the entire pro-cess. The document content is extracted using thepdf2xml command (Dejean, 2007).
We assume that the PDF reports are automati-cally generated by the PDF driver of a word pro-cessor. Thus, we do not check if the documentis a scanned document or if it is the output of anOCR application. Consequently, we do not con-sider possible trapezoid or parallelogram distor-tion, page rotation or curved lines. This assump-tion simplifies the initial stages: baselines are in-ferred from the coordinates on the x-axis; left,right and centered alignments are inferred from thecoordinates on the y-axis.
We also assume that PDF drivers serialize thecontent of a page area by area, depending on thepage layout. A content area corresponds to a pagesubdivision such as a column, a header, a footer,or a floating table or figure. When a content areais processed, we assume that characters and linesare serialized in reading order, so that there is noordering problem to consider. Thus, when parsinga page, we expect to find the ToC entries serializedin reading order, and we expect to find the differentparts of each ToC entry serialized in reading order.
However, content areas are represented neitherin the PDF structure nor in the pdf2xml output.Content area are implicitly inferred by the cogni-tive skills of the reader. Moreover content areascan be serialized in many ways in the PDF. For in-stance, header and footer areas can be serializedbefore the document body area. The boundary de-limitation of content areas inside a page is one ofthe main challenges.
Bounding the ToC areas over pages is notstraight due to the absence of marks that sepa-rate them from other adjacent areas. In our pro-cess, positional information of headers and footersare inferred from the document structure in orderto help the boundary delimitation of ToC areas.Taking into account the consistency of the styleswithin the ToC, and the style contrast with otherparts should also help the delimitation.
We point out that there is no concept of “word”or “number” or “token” in PDF. In order to easethe processing, pdf2xml introduces the conceptof “token”, a computational unit based on char-acter spacing. In practice, output tokens corre-spond to words or numbers, what we can expect,
64
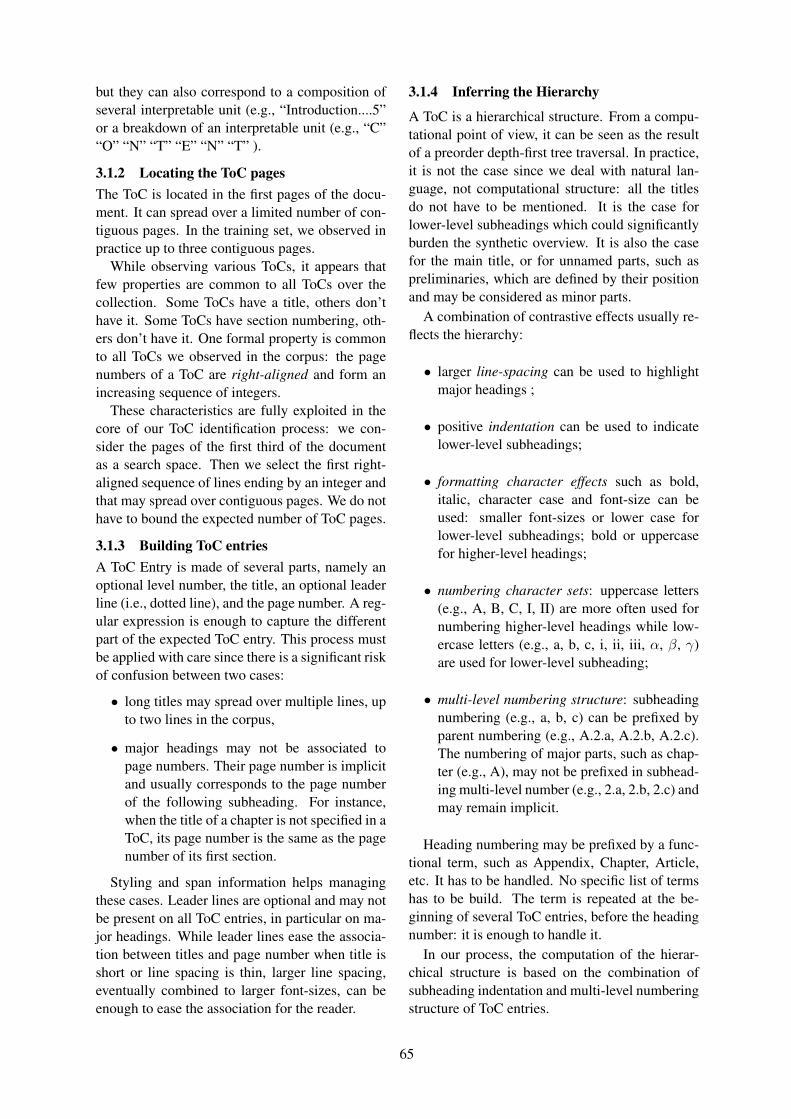
but they can also correspond to a composition ofseveral interpretable unit (e.g., “Introduction....5”or a breakdown of an interpretable unit (e.g., “C”“O” “N” “T” “E” “N” “T” ).
3.1.2 Locating the ToC pagesThe ToC is located in the first pages of the docu-ment. It can spread over a limited number of con-tiguous pages. In the training set, we observed inpractice up to three contiguous pages.
While observing various ToCs, it appears thatfew properties are common to all ToCs over thecollection. Some ToCs have a title, others don’thave it. Some ToCs have section numbering, oth-ers don’t have it. One formal property is commonto all ToCs we observed in the corpus: the pagenumbers of a ToC are right-aligned and form anincreasing sequence of integers.
These characteristics are fully exploited in thecore of our ToC identification process: we con-sider the pages of the first third of the documentas a search space. Then we select the first right-aligned sequence of lines ending by an integer andthat may spread over contiguous pages. We do nothave to bound the expected number of ToC pages.
3.1.3 Building ToC entriesA ToC Entry is made of several parts, namely anoptional level number, the title, an optional leaderline (i.e., dotted line), and the page number. A reg-ular expression is enough to capture the differentpart of the expected ToC entry. This process mustbe applied with care since there is a significant riskof confusion between two cases:
• long titles may spread over multiple lines, upto two lines in the corpus,
• major headings may not be associated topage numbers. Their page number is implicitand usually corresponds to the page numberof the following subheading. For instance,when the title of a chapter is not specified in aToC, its page number is the same as the pagenumber of its first section.
Styling and span information helps managingthese cases. Leader lines are optional and may notbe present on all ToC entries, in particular on ma-jor headings. While leader lines ease the associa-tion between titles and page number when title isshort or line spacing is thin, larger line spacing,eventually combined to larger font-sizes, can beenough to ease the association for the reader.
3.1.4 Inferring the Hierarchy
A ToC is a hierarchical structure. From a compu-tational point of view, it can be seen as the resultof a preorder depth-first tree traversal. In practice,it is not the case since we deal with natural lan-guage, not computational structure: all the titlesdo not have to be mentioned. It is the case forlower-level subheadings which could significantlyburden the synthetic overview. It is also the casefor the main title, or for unnamed parts, such aspreliminaries, which are defined by their positionand may be considered as minor parts.
A combination of contrastive effects usually re-flects the hierarchy:
• larger line-spacing can be used to highlightmajor headings ;
• positive indentation can be used to indicatelower-level subheadings;
• formatting character effects such as bold,italic, character case and font-size can beused: smaller font-sizes or lower case forlower-level subheadings; bold or uppercasefor higher-level headings;
• numbering character sets: uppercase letters(e.g., A, B, C, I, II) are more often used fornumbering higher-level headings while low-ercase letters (e.g., a, b, c, i, ii, iii, α, β, γ)are used for lower-level subheading;
• multi-level numbering structure: subheadingnumbering (e.g., a, b, c) can be prefixed byparent numbering (e.g., A.2.a, A.2.b, A.2.c).The numbering of major parts, such as chap-ter (e.g., A), may not be prefixed in subhead-ing multi-level number (e.g., 2.a, 2.b, 2.c) andmay remain implicit.
Heading numbering may be prefixed by a func-tional term, such as Appendix, Chapter, Article,etc. It has to be handled. No specific list of termshas to be build. The term is repeated at the be-ginning of several ToC entries, before the headingnumber: it is enough to handle it.
In our process, the computation of the hierar-chical structure is based on the combination ofsubheading indentation and multi-level numberingstructure of ToC entries.
65

Run F-measureDaniel 1 42.72IHSMarkit 1 39.41
Table 1: Results for the ToC Generation Task (test set)
Xrx-measure Links TitleDoc Prec Rec F1 Acc book id0 97.7 48.6 64.9 84.5 12528232621 87.2 51.9 65.1 96.5 11399202652 22.2 40.0 28.6 91.9 08818177863 90.5 12.3 21.7 85.7 11502629104 100 10.4 18.9 42.4 09926260505 83.3 2.9 5.6 59.7 09492504596 100 12.4 22.1 94.6 1151059737
Table 2: Results for the ToC Generation Task on thetest set
3.1.5 Computing the PDF Page NumbersOnce the ToC is built, each header is associatedto a page number. This page number refers to theprint version. The PDF page number we have tosubmit is slightly different: a page shift may ap-pear if the first page of the PDF is not “page 1”.It is the case when the document contains a ti-tle page, which might be unnumbered, or includespreliminary pages which might also be not num-bered or might use a different numbering alphabet.
In order to get the appropriate PDF page num-bers, we choose to compute the shift between PDFpage numbers and printed page numbers. In or-der to extract printed page numbers, we select asample of PDF pages. We then look for a seriesof integers located at the same position on differ-ent pages. Once we found this series, we get thepage shift by calculating the difference betweenthe first printed page number of the series and itscorresponding PDF page number.
3.1.6 Results and discussionThe official results of our system Daniel on thetest set are given in table 1. The detailed results ofour system are given in table 2. As expected, thesystem always has a good precision and a lowerrecall. We point out that low precision for book 2is due to the fact that the ToC of the prospectus ismore detailed than the ToC of the groundtruth.
Good precision and low recall are linked to ourmethod which is based on locating and parsing theToCs. ToCs does not reflect the true structure ofthe prospectuses. They are generally less detailed:
lower level headers are not included. Moreover, ifno ToC is present or found, the system relies on asimple fallback.
Due to lack of time for implementation, we onlyhandled ToC located on one-column page layout,which is the most common case for this kind ofdocument. We did not handle the difference ofpage format for odd and even pages. Simple im-provements can be done to cover these two cases.
As said at the beginning of this section the mainimprovements would come from taking into ac-count the whole content of the document. We didnot have enough time to handle it properly. Itwould allow the handling of documents withoutToC and would permit the extraction of titles thatare not included in the ToC. It would be particu-larly useful for these financial documents wherefine-grain subdivisions are present but not repre-sented in the ToC.
3.2 Title DetectionThe very first feature one can think about is thelength of the segment, titles are shorter segmentsand are seldom longer than a line. The second fea-ture that came to our mind is that titles are likelyto be nonverbal sentences and in general exhibit asimpler syntactical structure. Other features likethose provided with the dataset can be useful: be-gins with numbering, material aspect (bold/italic),capitalization (begin with capitals, all caps). Weadvocate that these differences are related to style,therefore the different baselines and systems wepropose rely on stylistic features. We used the ba-sic set of features given with the dataset and weadded three other types of features:
basic features : Provided in the dataset (Beginswith Numbering, Is Bold, Is Italic, Is AllCaps, begin With Cap, Page Number)
length The length of the segment in characters
stylo Relative frequency of each punctuation sign,numbers and capitalized letters
Our other approach relies on character basedfeatures, used in particular in autorship attribution(Brixtel, 2015). We chose character n-grams be-cause of their simplicity to compute. We try dif-ferent possible values of n: nmin ≤ n ≤ nmax
with all possible nmin and nmax values between 1and 10 (and nmin ≤ nmax). We computed a rela-tive frequency for each n-gram in each example to
66

Cross-valid Test-setB1 (basic features) 80.1 91.1B2 (basic + length) 71.1 61.2B3 (stylo) 75.5 87.6B4 (stylo+basic) 72.2 84.2B5 (stylo+length) 69.9 67.8B6 (stylo+basic+length) 63.4 61.7n-grams (1 ≤ n ≤ 1) 81.5 91.1n-grams (1 ≤ n ≤ 2) 81.5 91.1n-grams (1 ≤ n ≤ 3) 82.4 91.9n-grams (1 ≤ n ≤ 4) 82.0 91.5n-grams (1 ≤ n ≤ 5) 81.8 91.3
Table 3: Results for the title detection task for theMultinomial naive Bayes Classifier
classify in order to take into account their varioussize. In fact, with absolute frequencies the resultswere significantly worse. We will only report re-sults obtained with the Multinomial Naive Bayes(MNB) and the DT10 classifier since other clas-sifiers did not offer better results than the DT10.SVM (with linear and non-linear kernels) had dif-ficulties to converge with our baseline features dueto their insufficent number.
In order to evaluate our methods and baselineswe performed for each of them a ten-fold crossvalidation on the train set. The results on the trainand test set are presented in Table 3 for the MNBclassifier and Table 4 for the DT10 classifier. Thefirst thing one can see is that the DT10 classifieroutperforms the MNB in particular because theMNB classifier is not better with the stylometricfeatures. The baselines with stylometric featuresworked well and our first submission was but thebest method on the training data was the n-grammethod (with 1 ≤ n ≤ 3). However, we chose tosubmit the classifier trained with with 1 ≤ n ≤ 4because we believed it would be less prone to over-fitting. With nmin > 1 or nmax > 5 the resultsdrop significantly.
What we did not expect is that our best base-line performed much better on the test-set and waseven better than our other submission. However,it is very interesting result since our experimentson the train set seemed to show that 1-grams weresufficient to build a reasonably efficient classifier.
3.3 Results and Discussion
We showed that very simple features can be ofgreat interest, in particular in cases of training data
Cross-valid Test-setB1 (basic features) 83.2 92.9B2 (basic + length) 85.4 93.6B3 (stylo) 85.4 93.2B4 (stylo+basic) 90.4 94.2B5 (stylo+length) 90.0 93.7B6 (stylo+basic+length) 90.6 95.1n-grams (1 ≤ n ≤ 1) 94.0 94.6n-grams (1 ≤ n ≤ 2) 94.2 94.5n-grams (1 ≤ n ≤ 3) 94.3 94.8n-grams (1 ≤ n ≤ 4) 93.5 95.0n-grams (1 ≤ n ≤ 5) 93.1 95.1
Table 4: Results for the title detection task for the DT10Decision Tree Classifier (in bold our two submissions)
scarcity. The methods we proposed can be im-proved in two different directions, regarding thefeatures exploitation or exploring other featuresregarding the style of titles VS the style of non-titles. First, for improving a character-based ap-proach it seems that LSTM architectures can beof great interest. The second option would be toextract syntactic patterns since sentence structuresare quite different in titles.
4 Conclusion
Title detection and Table of Content (ToC) extrac-tion are two important tasks for Document Analy-sis, in particular in the context of digital librariesand scanned books.
We proposed two types of features for the Ti-tle Detection task, we used a naive Bayses clas-sifier as a baseline and a decision tree (DT10).We showed that simple stylometric features (fre-quency of punctuation, numbers and capitalizedletters) combined with visual characteristics (bold,italic. . . ) achieve better results than the best char-acter n-gram approach (1-4 grams). Although thissystem did not achieved state-of-the-art perfor-mances, the results shows that simple and easy-to-compute features can provide very reliable results.
Regarding the ToC Extraction task, we chooseto extract the structure from the ToC of theprospectuses. We are pleased to see that are ourexpectations are confirmed. Our system obtains agood precision and lower recall. For a next edi-tion, we would like to focus on the extraction ofthe structure from the whole document content.
67
ReferencesAli Ait Elhadj, Mohand Boughanem, Mohamed
Mezghiche, and Fatiha Souam. 2012. Using struc-tural similarity for clustering XML documents.Knowledge and Information Systems, 32(1):109–139.
Julian Alarte, Josep Silva, and Salvador Tamarit. 2019.What web template extractor should i use? a bench-marking and comparison for five template extrac-tors. ACM Trans. Web, 13(2):9:1–9:19.
Joeran Beel, Stefan Langer, Marcel Genzmehr, andChristoph Muller. 2013. Docear’s pdf inspector: Ti-tle extraction from pdf files. In Proceedings of the13th ACM/IEEE-CS Joint Conference on Digital Li-braries, JCDL ’13, pages 443–444, New York, NY,USA. ACM.
Romain Brixtel. 2015. Maximal repeats enhancesubstring-based authorship attribution. In Pro-ceedings of the International Conference RecentAdvances in Natural Language Processing, pages63–71, Hissar, Bulgaria. INCOMA Ltd. Shoumen,BULGARIA.
Rik de Busser and Marie-Francine Moens. 2006. In-formation extraction and information technology,pages 1–22. Springer, Berlin, Heidelberg.
Sahar Changuel, Nicolas Labroche, andBernadette Bouchon-Meunier. 2009. A gen-eral learning method for automatic titleextrac-tion from html pages. In Machine Learningand Data Mining in Pattern Recognition, pages704–718, Berlin, Heidelberg. Springer BerlinHeidelberg.
Beatrice Daille, Evelyne Jacquey, Gael Lejeune,Luis Felipe Melo, and Yannick Toussaint. 2016.Ambiguity Diagnosis for Terms in Digital Human-ities. In Language Resources and Evaluation Con-ference, Portoroz, Slovenia.
Herve Dejean. 2007. pdf2xml open source software.Last access on July 31, 2019.
Misha Denil, Alban Demiraj, and Nando de Freitas.2014. Extraction of salient sentences from labelleddocuments. CoRR, abs/1412.6815.
Antoine Doucet, Gabriella Kazai, Sebastian Colutto,and Gunter Muhlberger. 2013. Overview of the IC-DAR 2013 Competition on Book Structure Extrac-tion. In Proc. of the 12th International Confer-ence on Document Analysis and Recognition (IC-DAR’2013), pages 1438–1443, Washington DC,USA.
Antoine Doucet and Miro Lehtonen. 2007. Unsu-pervised classification of text-centric xml documentcollections. In Comparative Evaluation of XMLInformation Retrieval Systems, 5th InternationalWorkshop of the Initiative for the Evaluation of XMLRetrieval, INEX, volume 4518 of Lecture Notes inComputer Science, pages 497–509. Springer.
Emmanuel Giguet, Alexandre Baudrillart, and NadineLucas. 2009. Resurgence for the book structure ex-traction competition. In INEX 2009 Workshop Pre-Proceedings, pages 136–142.
Emmanuel Giguet and Nadine Lucas. 2010a. The bookstructure extraction competition with the resurgencesoftware at caen university. In Focused Retrievaland Evaluation, pages 170–178, Berlin, Heidelberg.Springer Berlin Heidelberg.
Emmanuel Giguet and Nadine Lucas. 2010b. The bookstructure extraction competition with the resurgencesoftware for part and chapter detection at caen uni-versity. In Comparative Evaluation of Focused Re-trieval - 9th International Workshop INEX, Vugh,The Netherlands, Revised Selected Papers, volume6932 of Lecture Notes in Computer Science, pages128–139. Springer.
Silja Huttunen, Arto Vihavainen, Peter von Etter, andRoman Yangarber. 2011. Relevance prediction ininformation extraction using discourse and lexicalfeatures. In Proceedings of the 18th Nordic Con-ference of Computational Linguistics (NODALIDA2011), pages 114–121.
Stefan Klampfl, Michael Granitzer, Kris Jack, and Ro-man Kern. 2014. Unsupervised document structureanalysis of digital scientific articles. Int. J. Digit.Libr., 14(3-4):83–99.
Gael Lejeune, Romain Brixtel, Antoine Doucet, andNadine Lucas. 2015. Multilingual event extractionfor epidemic detection. Artificial Intelligence inMedicine, 65(2):131 – 143. Intelligent healthcareinformatics in big data era.
Gael Lejeune and Lichao Zhu. 2018. A new pro-posal for evaluating web page cleaning tools. Com-putacion y Sistemas, 22(4).
Thi-Tuyet-Hai Nguyen, Antoine Doucet, and MickaelCoustaty. 2017. Enhancing table of contents extrac-tion by system aggregation. In 2017 14th IAPR In-ternational Conference on Document Analysis andRecognition (ICDAR), volume 01, pages 242–247.
Sira Ferradans Remi Juge, Najah-Imane Bentabet.2019. The fintoc-2019 shared task: Financial doc-ument structure extraction. In The Second Work-shop on Financial Narrative Processing of NoDal-ida 2019.
Dominika Tkaczyk, Andrew Collins, and Joeran Beel.2018. Who did what?: Identifying author contribu-tions in biomedical publications using naıve bayes.In Proceedings of the 18th ACM/IEEE on Joint Con-ference on Digital Libraries, JCDL ’18, pages 387–388, New York, NY, USA. ACM.
Yewei Xue, Yunhua Hu, Guomao Xin, Ruihua Song,Shuming Shi, Yunbo Cao, Chin-Yew Lin, and HangLi. 2007. Web page title extraction and its ap-plication. Information Processing & Management,43(5):1332 – 1347. Patent Processing.
68
FinDSE@FinTOC-2019 Shared Task
Carla Abreu1,2, Henrique Lopes Cardoso1,2, Eugenio Oliveira1,2
Faculdade de Engenharia da Universidade do Porto1, LIACC2
Rua Dr. Roberto Frias, s/n, Porto, Portugal(ei08165, hlc, eco)@fe.up.pt
Abstract
We present the approach developed at the Fac-ulty of Engineering of the University of Portoto participate in FinTOC-2019 Financial Doc-ument Structure Extraction – Detection of ti-tles sub-task. Several financial documents areproduced in machine-readable format. Due tothe poor structure of these documents, it is anarduous task to retrieve the desired informa-tion from them. The aim of this sub-task isto detect titles in this kind of documents. Wepropose a supervised learning approach mak-ing use of linguistic, semantic and morpholog-ical features to classify a text block as title ornon title. The proposed methodology got a F1score of 97.01%.
1 Introduction
Several financial documents are produced, everyday, for different financial applications. Someof these documents are mandatory by law, how-ever they are not created following the same stan-dard and sometimes have a poor structure, mak-ing it difficult to retrieve the desired informa-tion. These documents are usually published inmachine-readable format (such as Portable Docu-ment Format (PDF) files) but unfortunately, theyremain untagged – they have no tags for identi-fying layout items such as paragraphs, columns,or tables. Document structuring has clear bene-fits to users, enabling them to gain direct accessto the relevant part of the document (which can belengthy), improving also search performance.
Financial Prospectuses are financial documentswhere investment funds are described, and havea non-standard content format. These documentsneed to be consulted by distinct persons and fastretrievals of data are desired.
A lot of effort has already been put to labelthe structure of documents. Some known projectsare the Million Book project (Linke, 2003), the
Open Content Alliance (OCA) (Suber, 2005), orthe digitisation of Google (Coyle, 2006) (Doucetet al., 2011). Projects that have aim at automati-cally recognizing document structure take, as in-put, a document in PDF format, or its content ob-tained via Optical Character Recognition (OCR).
Document structure extraction is a well studiedproblem in document analysis, and has been ap-plied in distinct types of documents and in differ-ent domains. Works on this matter go from scien-tific articles (Klampfl et al., 2014) (Bast and Ko-rzen, 2017) to books (Linke, 2003).
Rangoni et al. (Rangoni et al., 2012) makeuse of three types of features: geometrical (width,height, X position, among others), morphological(the font and other characteristics, such as italics,bold, and so on) and semantic (language, is nu-meric, and so on). Bitew (Bitew, 2018) also in-cludes three distinct categories: textual features(similar to semantic), markup features (similar tomorphological) and linguistic (related with Part ofSpeech). As described, some authors groups fea-tures in categories; however, some studies use onlyone category, including Kim et al. (Kim et al.,2017), who make use of morphological elementsonly for logical structured extraction.
The methodologies used to address this prob-lem include rule-based and machine learning ap-proaches (Klampfl and Kern, 2013) (He, 2017).
In this paper we present a supervised approachto automatically classify a text block as title ornon title (a binary classification problem), mak-ing use of linguistic, semantic and morphologicalfeatures. In Section 2, we describe the FinTOCSub-Task on title detection, and in Section 3 weanalyze the provided data. In Section 4 we presentour approach, followed by the experimental setupin Section 5. Results are discussed in Section 6. InSection 7 we conclude.
69
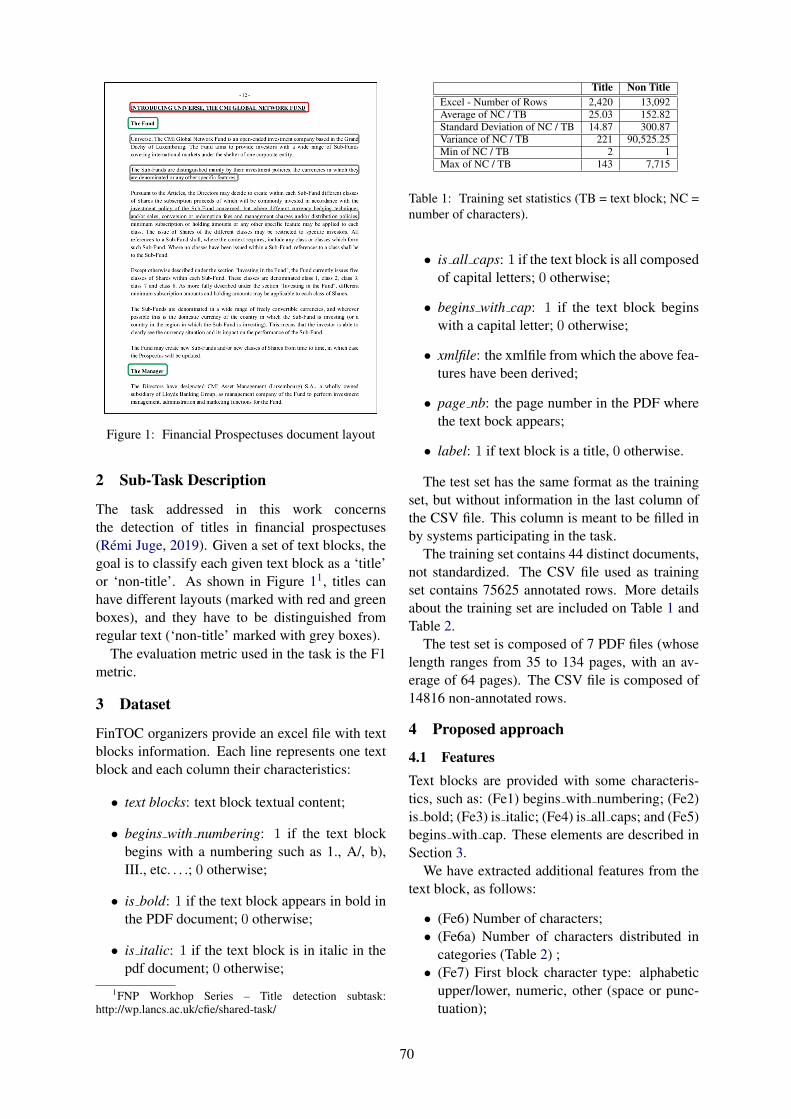
Figure 1: Financial Prospectuses document layout
2 Sub-Task Description
The task addressed in this work concernsthe detection of titles in financial prospectuses(Remi Juge, 2019). Given a set of text blocks, thegoal is to classify each given text block as a ‘title’or ‘non-title’. As shown in Figure 11, titles canhave different layouts (marked with red and greenboxes), and they have to be distinguished fromregular text (‘non-title’ marked with grey boxes).
The evaluation metric used in the task is the F1metric.
3 Dataset
FinTOC organizers provide an excel file with textblocks information. Each line represents one textblock and each column their characteristics:
• text blocks: text block textual content;
• begins with numbering: 1 if the text blockbegins with a numbering such as 1., A/, b),III., etc. . . .; 0 otherwise;
• is bold: 1 if the text block appears in bold inthe PDF document; 0 otherwise;
• is italic: 1 if the text block is in italic in thepdf document; 0 otherwise;
1FNP Workhop Series – Title detection subtask:http://wp.lancs.ac.uk/cfie/shared-task/
Title Non TitleExcel - Number of Rows 2,420 13,092Average of NC / TB 25.03 152.82Standard Deviation of NC / TB 14.87 300.87Variance of NC / TB 221 90,525.25Min of NC / TB 2 1Max of NC / TB 143 7,715
Table 1: Training set statistics (TB = text block; NC =number of characters).
• is all caps: 1 if the text block is all composedof capital letters; 0 otherwise;
• begins with cap: 1 if the text block beginswith a capital letter; 0 otherwise;
• xmlfile: the xmlfile from which the above fea-tures have been derived;
• page nb: the page number in the PDF wherethe text bock appears;
• label: 1 if text block is a title, 0 otherwise.
The test set has the same format as the trainingset, but without information in the last column ofthe CSV file. This column is meant to be filled inby systems participating in the task.
The training set contains 44 distinct documents,not standardized. The CSV file used as trainingset contains 75625 annotated rows. More detailsabout the training set are included on Table 1 andTable 2.
The test set is composed of 7 PDF files (whoselength ranges from 35 to 134 pages, with an av-erage of 64 pages). The CSV file is composed of14816 non-annotated rows.
4 Proposed approach
4.1 FeaturesText blocks are provided with some characteris-tics, such as: (Fe1) begins with numbering; (Fe2)is bold; (Fe3) is italic; (Fe4) is all caps; and (Fe5)begins with cap. These elements are described inSection 3.
We have extracted additional features from thetext block, as follows:
• (Fe6) Number of characters;• (Fe6a) Number of characters distributed in
categories (Table 2) ;• (Fe7) First block character type: alphabetic
upper/lower, numeric, other (space or punc-tuation);
70

IDCategory Range TSTitle TSNonTitle
0 0 0 01 1 - 3 2 3342 4 - 9 80 483 10 - 16 695 2034 17 - 21 553 1605 22 - 30 400 876 31 - 40 366 737 41 - 50 164 488 51 - 70 129 1089 71 - 100 23 157
10 101 - 150 8 17811 151 - 200 0 18112 201 - 400 0 52313 401 - 600 0 17214 601 - 1000 0 11415 1001 - 1500 0 3016 >1501 0 4
Table 2: Number of characters distributed in categoriesand in the training set (TS)
• (Fe8) Last block character type: alphabeticupper/lower, numeric, other (space or punc-tuation);
• (Fe9) Number of tokens;• (Fe10) Number of sentences contained in the
block text;• (Fe11) Part Of Speech of the first token in the
block text;• (Fe12) Contains date;• (Fe13) Title suggestion word - if the first
token belongs to one of these words: ap-pendix’, ’annex’, and others;
• (Fe14) Tense block - check if the text blockis written in the past, present or future.
The enunciated features belong to three differ-ent types: morphological (Fe2, Fe3, Fe4, Fe5, Fe6,Fe6a, Fe7, Fe8), semantic (Fe1, Fe12), and lin-guistic (Fe11, Fe13, Fe14). Tense, part of speech,title suggestion words and contains date are lan-guage dependent features applied only to Englishlanguage.
4.2 Classification Algorithms
Supervised learning techniques create a model thatpredicts the value of a target variable based on aset of input variables. One challenge is to selectthe most appropriate algorithm for the task of clas-sifying as ‘title’ or ‘non-title’ a given text block.We have compared the following algorithms: De-cision Tree (DT), Extra-tree classifier (EXT), andGradient Boosting (GBC).
As shown in Table 3, different configurationswere attempted for each algorithm. Implemen-tations of these algorithms are provided by the
AlgID Algorithm ConfigurationDT 1 DT random state=0DTC 1 DT max depth=None
min samples split=2random state=0
EXT 1 EXT n estimators=10max depth=Nonemin samples split=2random state=0
GBC 1 GBC loss=’exponential’GBC 2 GBC n estimators=2000
learning rate=0.75max depth=5
Table 3: List of algorithm configurations
E 1 E 2 E 3 E 4 E 5Fe1 x x x xFe2 x x x x xFe3 x x xFe4 x x x xFe5 x x x xFe6 x x xFe6a xFe7 x x xFe8 x x x xFe9 x x x xFe10 x x xFe11 x x x xFe12 x xFe13 xFe14 x
Table 4: List of features used in each experimentalsetup.
Python library scikit-learn library2.
5 Experimental Setup
The set of features used in each experimental setupis shown in Table 4. Experiment 5 (E 5) is ourbaseline, as this setup includes all the featuresavailable in the dataset. We combine all the avail-able features with all extracted by us in Experi-ment 2 (E 2). We create a model based on E 2 andselect all the features with an importance above0.03 to compose Experiment 3 (E 3) and above0.07 to include in Experiment 4 (E 4).
Experiment 1 (E 1) was based in our analysisregarding text blocks number of characters cate-gories distribution, such as presented in Table 2.
6 Experimental Evaluation
Several combinations of features (Table 4) and al-gorithms (Table 3) were applied to solve the titleclassification problem. The results obtained areshown in Table 5.
2sklearn: https://scikit-learn.org
71
Exp Alg ID TN FP FN TP F1 title F1 nonE 1 DT 1 18,882 756 705 2,345 76.25 96.28E 1 DTC 1 18,882 756 705 2345 76,25 96,28E 1 EXT 1 18,932 706 684 2,366 77.30 96.46E 1 GBC 1 14,954 4,684 629 2,421 47.68 84.92E 1 GBC 2 18,829 809 1,192 1,858 65.00 94.95E 2 DT 1 18,851 787 747 2,303 75.02 96.09E 2 DTC 1 18,851 787 747 2,303 75.02 96.09E 2 EXT 1 18,891 747 741 2,309 75.63 96.21E 2 GBC 1 18,856 782 737 2,313 75.28 96.13E 2 GBC 2 18,816 822 1,214 1,836 64.33 94.87E 3 DT 1 18,850 788 794 2,256 74.04 95.97E 3 DTC 1 18,850 788 794 2,256 74.04 95.97E 3 EXT 1 18,880 758 786 2,264 74.57 96.07E 3 GBC 1 18,735 903 770 2,280 73.16 95.73E 3 GBC 2 18,813 825 1,225 1,825 64.04 94.83E 4 DT 1 18,801 837 848 2,202 72.33 95.71E 4 DTC 1 18,801 837 848 2,202 72.33 95.71E 4 EXT 1 18,810 828 847 2,203 72.46 95.74E 4 GBC 1 18,798 840 877 2,173 71.68 95.63E 4 GBC 2 18,739 899 1,208 1,842 63.62 94.68E 5 DT 1 19,280 358 2,328 722 34.96 93.49E 5 DTC 1 19,280 358 2,328 722 34.96 93.49E 5 EXT 1 19,280 358 2,328 722 34.96 93.49E 5 GBC 1 19,280 358 2,328 722 34.96 93.49E 5 GBC 2 19,280 358 2,329 721 34.96 93.49
Table 5: Results
E 5 is the experiment that has as feature setall the features available upfront with the dataset.This experiment got similar results using distinctsupervised learning algorithms. The results ob-tained indicate that this set of features are notenough to classify block text titles, showing a highnumber of false negatives and a low number of truepositives.
The DT 1 and DTC 1 algorithms have distinctconfigurations, however they presented the sameresults when exposed to the same feature set. TheGBC 1 algorithm configuration was more sensiblewhen exposed to a specific feature set – in E 1, thisalgorithm has shown the higher number of falsepositives obtained in our experiments. GBC 2 wasthe worst configuration algorithm used in this clas-sification, having the lowest value of true posi-tives.
The feature set used in E 1 includes all featuresprovided by the competition organizers. Other fea-tures were added, some of them related to how thetext appears in the text block (such as number ofcharacters or sentences), and also language depen-dent features (such as the case of F11). Except forGBC 1, all other algorithm configurations reachedtheir best result. EXT 1 got the best performancein the task of title classification.
FinTOC-2019 received two submissions foreach participant, on which we achieved F1 scoreof 97.01% on E 1 with EXT 1 reaching the fifthposition and the sixth position with F1 score of96.84% on E 1 with DT 1.
7 Conclusion
It is difficult to retrieve the desired informationfrom lengthy documents when the Table Of Con-tent (TOC) is missing. TOC helps the reader toidentify what is written in each section, enablingan oriented reading. The aim of this study is toclassify each text block into title or non-title, a steptowards identifying each section in a document.
In this work we propose a supervised learningstrategy to classify text blocks. We also proposedan extension of the provided feature set based onrecognizing new characteristics of text blocks (re-lated with the text block composition and the useof linguistic resources). The dataset available inthis competition was composed by five features.We experimented the use of these features but theresults obtained point out that these are not enoughto the envisaged classification task.
We recognize more features in text blocks, someof them related with the text composition and oth-ers related with linguistic resources. Not all ofthese features have shown to be essential for titleclassification.
Title detection got an high performance us-ing Extra-Tree classifier with the followingfeatures: the five ones available on the dataset(begings with numbering, is bold, is italic,is all caps, begin with cap) and six more (num-ber of characters, first sentence character, lastsentence character, number of tokens, numberof sentences, Part of speech of the first sentenceelement).
References
Hannah Bast and Claudius Korzen. 2017. A bench-mark and evaluation for text extraction from pdf.In Proceedings of the 17th ACM/IEEE Joint Con-ference on Digital Libraries, pages 99–108. IEEEPress.
Semere Kiros Bitew. 2018. Logical structure extrac-tion of electronic documents using contextual infor-mation. Master’s thesis, University of Twente.
Karen Coyle. 2006. Mass digitization of books. TheJournal of Academic Librarianship, 32(6):641–645.
Antoine Doucet, Gabriella Kazai, and Jean-Luc Me-unier. 2011. Icdar 2011 book structure extractioncompetition. In 2011 International Conference onDocument Analysis and Recognition, pages 1501–1505. IEEE.
72
Yi He. 2017. Extracting document structure of a textwith visual and textual cues. Master’s thesis, Uni-versity of Twente.
Tae-young Kim, Suntae Kim, Sangchul Choi, Jeong-Ah Kim, Jae-Young Choi, Jong-Won Ko, Jee-HuongLee, and Youngwha Cho. 2017. A machine-learningbased approach for extracting logical structure of astyled document. TIIS, 11(2):1043–1056.
Stefan Klampfl, Michael Granitzer, Kris Jack, and Ro-man Kern. 2014. Unsupervised document structureanalysis of digital scientific articles. Internationaljournal on digital libraries, 14(3-4):83–99.
Stefan Klampfl and Roman Kern. 2013. An unsu-pervised machine learning approach to body textand table of contents extraction from digital scien-tific articles. In International Conference on Theoryand Practice of Digital Libraries, pages 144–155.Springer.
Erika C Linke. 2003. Million book project. Encyclo-pedia of Library and Information Science: Lib-Pub,page 1889.
Yves Rangoni, Abdel Belaıd, and Szilard Vajda. 2012.Labelling logical structures of document images us-ing a dynamic perceptive neural network. Interna-tional Journal on Document Analysis and Recogni-tion (IJDAR), 15(1):45–55.
Sira Ferradans Remi Juge, Najah-Imane Bentabet.2019. The fintoc-2019 shared task: Financial doc-ument structure extraction. In The Second Work-shop on Financial Narrative Processing of NoDal-ida 2019.
Peter Suber. 2005. The open content alliance. SPARCOpen Access Newsletter.
73
UWB@FinTOC-2019 Shared Task: Financial Document Title Detection
Tomas HercigNTIS – New Technologiesfor the Information Society,Faculty of Applied Sciences,University of West Bohemia,
Technicka 8, 306 14 PlzenCzech Republic
Pavel KralDepartment of ComputerScience and Engineering,
Faculty of Applied SciencesUniversity of West Bohemia,Univerzitnı 8, 306 14 Plzen
Czech [email protected]
Abstract
This paper describes our system created forthe Financial Document Structure ExtractionShared Task (FinTOC-2019) Task A: Title De-tection. We rely on the XML representation ofthe financial prospectuses for additional layoutinformation about the text (font type, font size,etc.). Our constrained system uses only theprovided training data without any additionalexternal resources. Our system is based on theMaximum Entropy classifier and various fea-tures including font type and font size. Oursystem achieves F1 score 97.2% and is ranked#3 among 10 submitted systems.
1 Introduction
Financial documents are used to report activities,financial situation, investment plans, and opera-tional information to shareholders, investors, andfinancial markets. These reports are usually cre-ated on an annual basis in machine-readable for-mats often only with minimal structure informa-tion.
The goal of the Financial Document Struc-ture Extraction Shared Task (FinTOC-2019) (Jugeet al., 2019) is to analyse these financial prospec-tuses1 and automatically extract their structuresimilarly to Doucet et al. (2013).
The majority of prospectuses are publishedwithout a table of content (TOC), which is usuallyneeded to help readers navigate within the docu-ment.
2 Task
The goal of FinTOC-2019 shared task is to extractthe table of content from the financial prospec-tuses. The shared task consists of two subtasks:
1Official PDF documents in which investment funds pre-cisely describe their characteristics and investment modali-ties.
• Subtask A classifies given text blocks as titlesor non-titles.
• Subtask B organizes provided headers into ahierarchical table of content.
We participated only in subtask A. For addi-tional information (e.g. about subtask B) see thetask description paper (Juge et al., 2019).
Systems participating in this shared task weregiven a sample collection of financial prospec-tuses with different level of structure and differentlengths as training data.
We approached the title detection subtask asa binary classification task. For all experimentswe use Maximum Entropy classifier with de-fault settings from Brainy machine learning library(Konkol, 2014).
Data statistics for the title detection subtask areshown in Table 1.
Label Test TrainNon-title 13 928 (94.0%) 65 354 (86.4%)Title 888 (6.0%) 10 271 (13.6%)
Table 1: Data statistics for Subtask A.
3 Dataset
The provided training collection of documentscontains:
• PDF format of the documents
• XML representation of the PDFs as givenby the Poppler utility libraries; this repre-sentation contains the text of the documentsas well as layout information about the text(font, bold, italic, and coordinates).
• CSV file with gold labels.
74
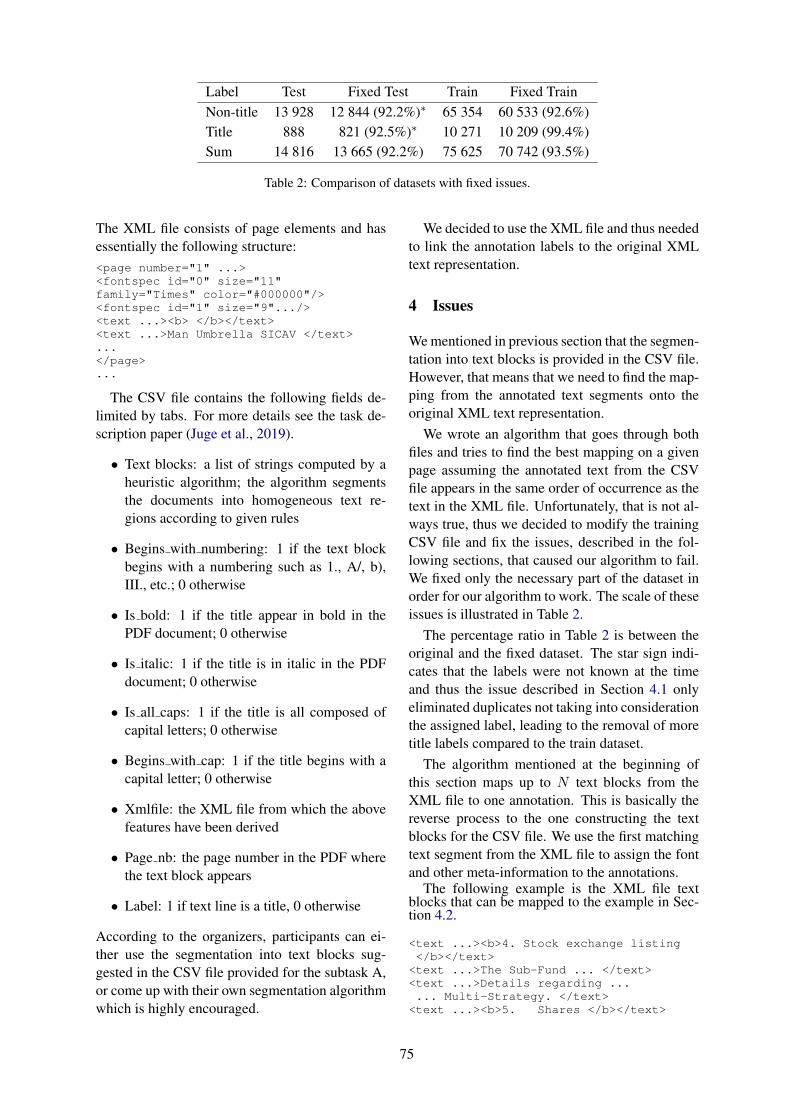
Label Test Fixed Test Train Fixed TrainNon-title 13 928 12 844 (92.2%)∗ 65 354 60 533 (92.6%)Title 888 821 (92.5%)∗ 10 271 10 209 (99.4%)Sum 14 816 13 665 (92.2%) 75 625 70 742 (93.5%)
Table 2: Comparison of datasets with fixed issues.
The XML file consists of page elements and hasessentially the following structure:<page number="1" ...><fontspec id="0" size="11"family="Times" color="#000000"/><fontspec id="1" size="9".../><text ...><b> </b></text><text ...>Man Umbrella SICAV </text>...</page>...
The CSV file contains the following fields de-limited by tabs. For more details see the task de-scription paper (Juge et al., 2019).
• Text blocks: a list of strings computed by aheuristic algorithm; the algorithm segmentsthe documents into homogeneous text re-gions according to given rules
• Begins with numbering: 1 if the text blockbegins with a numbering such as 1., A/, b),III., etc.; 0 otherwise
• Is bold: 1 if the title appear in bold in thePDF document; 0 otherwise
• Is italic: 1 if the title is in italic in the PDFdocument; 0 otherwise
• Is all caps: 1 if the title is all composed ofcapital letters; 0 otherwise
• Begins with cap: 1 if the title begins with acapital letter; 0 otherwise
• Xmlfile: the XML file from which the abovefeatures have been derived
• Page nb: the page number in the PDF wherethe text block appears
• Label: 1 if text line is a title, 0 otherwise
According to the organizers, participants can ei-ther use the segmentation into text blocks sug-gested in the CSV file provided for the subtask A,or come up with their own segmentation algorithmwhich is highly encouraged.
We decided to use the XML file and thus neededto link the annotation labels to the original XMLtext representation.
4 Issues
We mentioned in previous section that the segmen-tation into text blocks is provided in the CSV file.However, that means that we need to find the map-ping from the annotated text segments onto theoriginal XML text representation.
We wrote an algorithm that goes through bothfiles and tries to find the best mapping on a givenpage assuming the annotated text from the CSVfile appears in the same order of occurrence as thetext in the XML file. Unfortunately, that is not al-ways true, thus we decided to modify the trainingCSV file and fix the issues, described in the fol-lowing sections, that caused our algorithm to fail.We fixed only the necessary part of the dataset inorder for our algorithm to work. The scale of theseissues is illustrated in Table 2.
The percentage ratio in Table 2 is between theoriginal and the fixed dataset. The star sign indi-cates that the labels were not known at the timeand thus the issue described in Section 4.1 onlyeliminated duplicates not taking into considerationthe assigned label, leading to the removal of moretitle labels compared to the train dataset.
The algorithm mentioned at the beginning ofthis section maps up to N text blocks from theXML file to one annotation. This is basically thereverse process to the one constructing the textblocks for the CSV file. We use the first matchingtext segment from the XML file to assign the fontand other meta-information to the annotations.
The following example is the XML file textblocks that can be mapped to the example in Sec-tion 4.2.
<text ...><b>4. Stock exchange listing</b></text>
<text ...>The Sub-Fund ... </text><text ...>Details regarding ...... Multi-Strategy. </text>
<text ...><b>5. Shares </b></text>
75
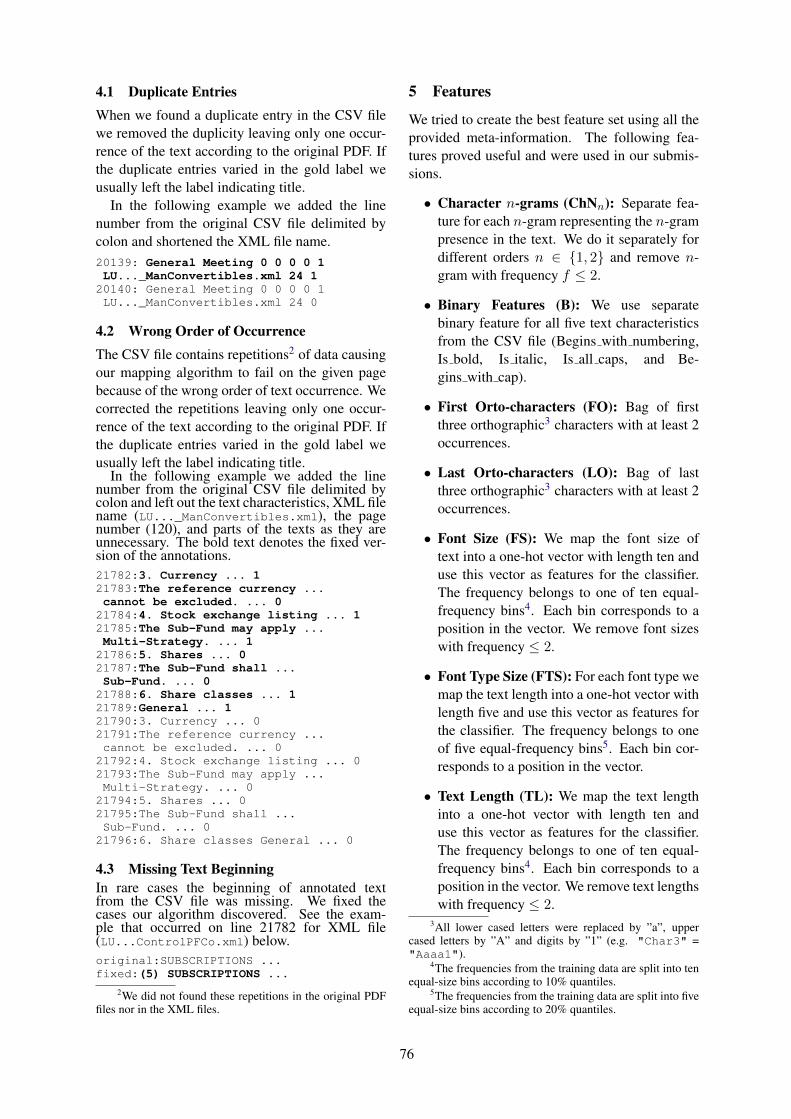
4.1 Duplicate EntriesWhen we found a duplicate entry in the CSV filewe removed the duplicity leaving only one occur-rence of the text according to the original PDF. Ifthe duplicate entries varied in the gold label weusually left the label indicating title.
In the following example we added the linenumber from the original CSV file delimited bycolon and shortened the XML file name.20139: General Meeting 0 0 0 0 1LU..._ManConvertibles.xml 24 1
20140: General Meeting 0 0 0 0 1LU..._ManConvertibles.xml 24 0
4.2 Wrong Order of OccurrenceThe CSV file contains repetitions2 of data causingour mapping algorithm to fail on the given pagebecause of the wrong order of text occurrence. Wecorrected the repetitions leaving only one occur-rence of the text according to the original PDF. Ifthe duplicate entries varied in the gold label weusually left the label indicating title.
In the following example we added the linenumber from the original CSV file delimited bycolon and left out the text characteristics, XML filename (LU..._ManConvertibles.xml), the pagenumber (120), and parts of the texts as they areunnecessary. The bold text denotes the fixed ver-sion of the annotations.21782:3. Currency ... 121783:The reference currency ...cannot be excluded. ... 0
21784:4. Stock exchange listing ... 121785:The Sub-Fund may apply ...Multi-Strategy. ... 1
21786:5. Shares ... 021787:The Sub-Fund shall ...Sub-Fund. ... 0
21788:6. Share classes ... 121789:General ... 121790:3. Currency ... 021791:The reference currency ...cannot be excluded. ... 0
21792:4. Stock exchange listing ... 021793:The Sub-Fund may apply ...Multi-Strategy. ... 0
21794:5. Shares ... 021795:The Sub-Fund shall ...Sub-Fund. ... 0
21796:6. Share classes General ... 0
4.3 Missing Text BeginningIn rare cases the beginning of annotated textfrom the CSV file was missing. We fixed thecases our algorithm discovered. See the exam-ple that occurred on line 21782 for XML file(LU...ControlPFCo.xml) below.original:SUBSCRIPTIONS ...fixed:(5) SUBSCRIPTIONS ...
2We did not found these repetitions in the original PDFfiles nor in the XML files.
5 Features
We tried to create the best feature set using all theprovided meta-information. The following fea-tures proved useful and were used in our submis-sions.
• Character n-grams (ChNn): Separate fea-ture for each n-gram representing the n-grampresence in the text. We do it separately fordifferent orders n ∈ {1, 2} and remove n-gram with frequency f ≤ 2.
• Binary Features (B): We use separatebinary feature for all five text characteristicsfrom the CSV file (Begins with numbering,Is bold, Is italic, Is all caps, and Be-gins with cap).
• First Orto-characters (FO): Bag of firstthree orthographic3 characters with at least 2occurrences.
• Last Orto-characters (LO): Bag of lastthree orthographic3 characters with at least 2occurrences.
• Font Size (FS): We map the font size oftext into a one-hot vector with length ten anduse this vector as features for the classifier.The frequency belongs to one of ten equal-frequency bins4. Each bin corresponds to aposition in the vector. We remove font sizeswith frequency ≤ 2.
• Font Type Size (FTS): For each font type wemap the text length into a one-hot vector withlength five and use this vector as features forthe classifier. The frequency belongs to oneof five equal-frequency bins5. Each bin cor-responds to a position in the vector.
• Text Length (TL): We map the text lengthinto a one-hot vector with length ten anduse this vector as features for the classifier.The frequency belongs to one of ten equal-frequency bins4. Each bin corresponds to aposition in the vector. We remove text lengthswith frequency ≤ 2.
3All lower cased letters were replaced by ”a”, uppercased letters by ”A” and digits by ”1” (e.g. "Char3" ="Aaaa1").
4The frequencies from the training data are split into tenequal-size bins according to 10% quantiles.
5The frequencies from the training data are split into fiveequal-size bins according to 20% quantiles.
76
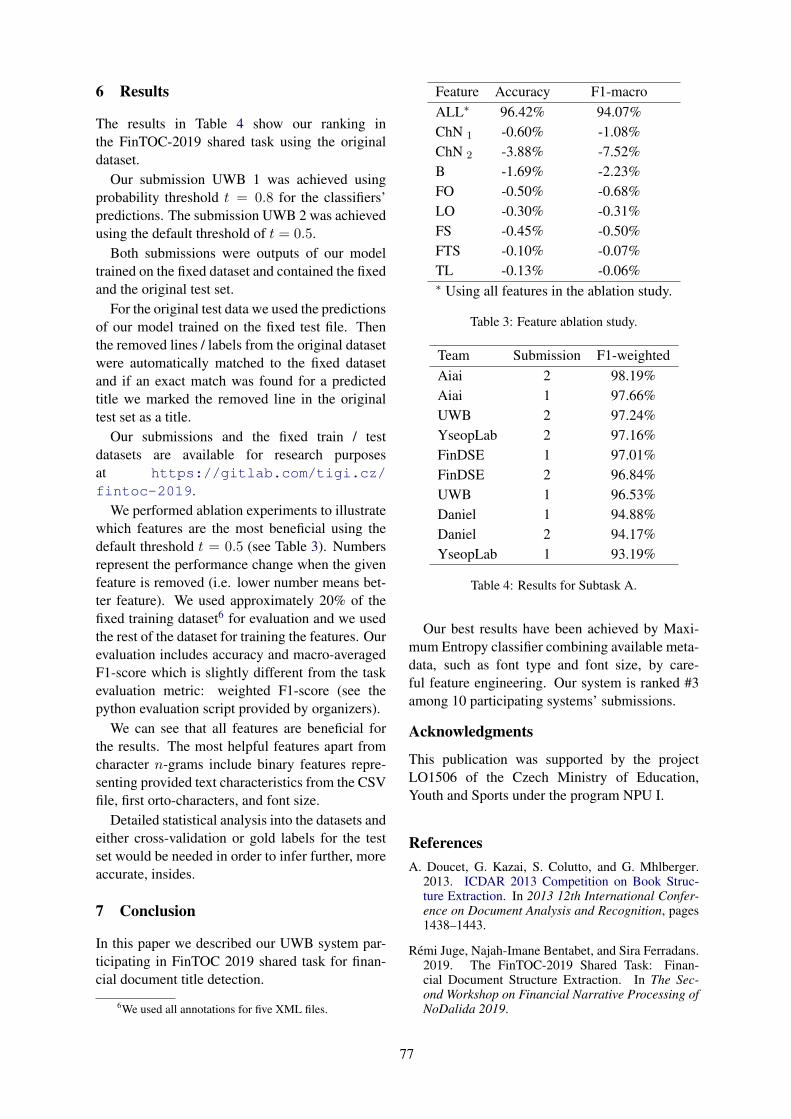
6 Results
The results in Table 4 show our ranking inthe FinTOC-2019 shared task using the originaldataset.
Our submission UWB 1 was achieved usingprobability threshold t = 0.8 for the classifiers’predictions. The submission UWB 2 was achievedusing the default threshold of t = 0.5.
Both submissions were outputs of our modeltrained on the fixed dataset and contained the fixedand the original test set.
For the original test data we used the predictionsof our model trained on the fixed test file. Thenthe removed lines / labels from the original datasetwere automatically matched to the fixed datasetand if an exact match was found for a predictedtitle we marked the removed line in the originaltest set as a title.
Our submissions and the fixed train / testdatasets are available for research purposesat https://gitlab.com/tigi.cz/fintoc-2019.
We performed ablation experiments to illustratewhich features are the most beneficial using thedefault threshold t = 0.5 (see Table 3). Numbersrepresent the performance change when the givenfeature is removed (i.e. lower number means bet-ter feature). We used approximately 20% of thefixed training dataset6 for evaluation and we usedthe rest of the dataset for training the features. Ourevaluation includes accuracy and macro-averagedF1-score which is slightly different from the taskevaluation metric: weighted F1-score (see thepython evaluation script provided by organizers).
We can see that all features are beneficial forthe results. The most helpful features apart fromcharacter n-grams include binary features repre-senting provided text characteristics from the CSVfile, first orto-characters, and font size.
Detailed statistical analysis into the datasets andeither cross-validation or gold labels for the testset would be needed in order to infer further, moreaccurate, insides.
7 Conclusion
In this paper we described our UWB system par-ticipating in FinTOC 2019 shared task for finan-cial document title detection.
6We used all annotations for five XML files.
Feature Accuracy F1-macroALL∗ 96.42% 94.07%ChN 1 -0.60% -1.08%ChN 2 -3.88% -7.52%B -1.69% -2.23%FO -0.50% -0.68%LO -0.30% -0.31%FS -0.45% -0.50%FTS -0.10% -0.07%TL -0.13% -0.06%∗ Using all features in the ablation study.
Table 3: Feature ablation study.
Team Submission F1-weightedAiai 2 98.19%Aiai 1 97.66%UWB 2 97.24%YseopLab 2 97.16%FinDSE 1 97.01%FinDSE 2 96.84%UWB 1 96.53%Daniel 1 94.88%Daniel 2 94.17%YseopLab 1 93.19%
Table 4: Results for Subtask A.
Our best results have been achieved by Maxi-mum Entropy classifier combining available meta-data, such as font type and font size, by care-ful feature engineering. Our system is ranked #3among 10 participating systems’ submissions.
Acknowledgments
This publication was supported by the projectLO1506 of the Czech Ministry of Education,Youth and Sports under the program NPU I.
ReferencesA. Doucet, G. Kazai, S. Colutto, and G. Mhlberger.
2013. ICDAR 2013 Competition on Book Struc-ture Extraction. In 2013 12th International Confer-ence on Document Analysis and Recognition, pages1438–1443.
Remi Juge, Najah-Imane Bentabet, and Sira Ferradans.2019. The FinTOC-2019 Shared Task: Finan-cial Document Structure Extraction. In The Sec-ond Workshop on Financial Narrative Processing ofNoDalida 2019.
77

Michal Konkol. 2014. Brainy: A Machine Learn-ing Library. In Leszek Rutkowski, Marcin Kory-tkowski, Rafal Scherer, Ryszard Tadeusiewicz, LotfiZadeh, and Jacek Zurada, editors, Artificial Intel-ligence and Soft Computing, volume 8468 of Lec-ture Notes in Computer Science, pages 490–499.Springer International Publishing.
78