Influence of Rock and Fluid Properties on Immiscible Fluid ...

(2006) 252–284www.elsevier.com/locate/chemgeo
Chemical Geology 231
Fluid sources for the La Guitarra epithermal deposit(Temascaltepec district, Mexico): Volatile and helium isotope
analyses in fluid inclusions
Antoni Camprubí a,⁎, Beverly A. Chomiak b,c, Ruth E. Villanueva-Estrada d,Àngels Canals e, David I. Norman b, Esteve Cardellach f, Martin Stute g
a Centro de Geociencias, Universidad Nacional Autónoma de México, Campus Juriquilla, Carretera Querétaro-San Luís Potosí km 15.5,Apartado Postal 1-742, 76230 Santiago de Querétaro, Qro., Mexico
b Department of Earth and Environmental Science, New Mexico Institute of Mining and Technology, Socorro, New Mexico 87801, USAc Department of Physics, Astronomy, and Geophysics, Connecticut College, 270 Mohegan Avenue, New London, Connecticut 06320-4196, USA
d Posgrado en Ciencias de la Tierra, Universidad Nacional Autónoma de México, Ciudad Universitaria, Delegación Coyoacán,04510 México, D.F., Mexico
e Departament de Cristal·lografia, Mineralogia i Dipòsits Minerals, Facultat de Geologia, Universitat de Barcelona,Carrer de Martí i Franquès s/n, 08028 Barcelona, Spain
f Departament de Geologia, Facultat de Ciències, Universitat Autònoma de Barcelona, 08193 Bellaterra, Spaing Lamont-Doherty Earth Observatory, Columbia University, 61 Rte. 9W, 45 Geochemistry Building, Palisades, New York 10964, USA
Received 11 January 2005; received in revised form 20 December 2005; accepted 1 February 2006
Abstract
The La Guitarra deposit (Temascaltepec district, South-Central Mexico), belongs to the low/intermediate sulfidation epithermaltype, has a polymetallic character although it is currently being mined for Ag and Au. The mineralization shows a polyphasiccharacter and formed through several stages and sub-stages (named I, IIA, IIB, IIC, IID, and III). The previous structural,mineralogical, fluid inclusion and stable isotope studies were used to constrain the selection of samples for volatile and heliumisotope analyses portrayed in this study. The N2/Ar overall range obtained from analytical runs on fluid inclusion volatiles, bymeans of Quadrupole Mass Spectrometry (QMS), is 0 to 2526, and it ranges 0 to 2526 for stage I, 0 to 1264 for stage IIA, 0 to 1369for stage IIB, 11 to 2401 for stage IIC, 19 to 324 for stage IID, and 0 to 2526 for stage III. These values, combined with the CO2/CH4 ratios, and N2–He–Ar and N2–CH4–Ar relationships, suggest the occurrence of fluids from magmatic, crustal, and shallowmeteoric sources in the forming epithermal vein deposit. The helium isotope analyses, obtained by means of Noble Gas MassSpectrometry, display R/Ra average values between 0.5 and 2, pointing to the occurrence of mantle-derived helium that wasrelatively diluted or “contaminated” by crustal helium. These volatile analyses, when correlated with the stable isotope data fromprevious works and He isotope data, show the same distribution of data concerning sources for mineralizing fluids, especially thosecorresponding to magmatic and crustal sources. Thus, the overall geochemical data from mineralizing fluids are revealed asintrinsically consistent when compared to each other.
The three main sources for mineralizing fluids (magmatic, and both deep and shallow meteoric fluids) are accountable at anyscale, from stages of mineralization down to specific mineral associations. The volatile and helium isotope data obtained in thispaper suggest that the precious metal-bearing mineral associations formed after hydrothermal pulses of predominantly oxidized
⁎ Corresponding author. Tel.: +52 55 5623 4116x138; fax: +52 55 5623 4104 to 5623 4119x161.E-mail address: [email protected] (A. Camprubí).
0009-2541/$ - see front matter © 2006 Elsevier B.V. All rights reserved.doi:10.1016/j.chemgeo.2006.02.002
253A. Camprubí et al. / Chemical Geology 231 (2006) 252–284
magmatic fluids, and thus it is likely that precious metals were carried by fluids with such origin. Minerals from base-metal sulfideassociations record both crustal and magmatic sources for mineralizing fluids, thus suggesting that base metals could be derivedfrom deep leaching of crustal rocks. At the La Guitarra epithermal deposit there is no evidence for an evolution of mineralizingfluids towards any dominant source. Rather than that, volatile analyses in fluid inclusions suggest that this deposit formed as apulsing hydrothermal system where each pulse or set of pulses accounts for different compositions of mineralizing fluids.
The positive correlation between the relative content of magmatic fluids (high N2/Ar ratios) and H2S suggests that the necessarysulfur to carry mostly gold as bisulfide complexes came essentially from magmatic sources. Chlorine necessary to carry silver andbase metals was found to be abundant in inclusion fluids and although there is no evidence about its source, it is plausible that itmay come from magmatic sources as well.© 2006 Elsevier B.V. All rights reserved.
Keywords: Epithermal; Low/intermediate sulfidation; Fluid inclusions; Gas chemistry; Volatiles; N2/Ar ratio; He isotopes; Magmatic fluids; Crustalfluids; Meteoric water; La Guitarra; Temascaltepec district; Mexico
1. Introduction: the use of volatile and heliumisotope data to trace the sources for mineralizingfluids
Mineralizing fluids involved in the formation ofepithermal deposits may be classified by their distinctsources: magmatic fluids, deeply circulated meteoricwaters (also named “crustal” waters), sedimentarybrines, and shallow meteoric waters (Albinson et al.,2001). Although stable isotope geochemistry is the mostused technique to study the contribution of each fluidtype in a mineral deposit, the combined analyses ofvolatiles and helium isotopic ratios in inclusion fluids isa powerful tool to further characterize the origin offluids in a hydrothermal system or deposit (Hedenquistand Aoki, 1991; Norman and Musgrave, 1994;Albinson et al., 2001; Moore et al., 2001).
The magmatic fluids involved in hydrothermalmineral deposits can be characterized as rhyolite- ormid-ocean ridge basalt-derived. All these fluid types andtheir mixtures occupy characteristic “regions” in N2–He–Ar ternary plots (Norman and Musgrave, 1994;Moore et al., 2001). Meteoric waters have N2–He–Arcompositions between that of air-saturated and crustalwaters, and meteoric waters that acquired volatiles froma cooling intrusive body have N2–He–Ar compositionsbetween those of air-saturated waters and magmaticfluids. As noble gases and N2 are chemically inert, evenwhen there are inputs or outputs of hydrothermal fluids,a conservative record of their ratios is preserved by thefluids (Ballantine et al., 2002), unless boiling occurs andno vapor-rich fluid inclusions are trapped.
The relative concentrations of N2–Ar–He in gassamples from active volcanoes associated with hotspots, ocean ridges and convergent plate margins definetwo different mixing trends between basaltic andandesitic fluids with meteoric waters (Giggenbach,1992b). The andesitic and basaltic fluids are character-
ized, respectively, by N2/He values between 1700 and5000, and between 10 and 220 (Simmons, 1995). TheHe/Ar values of these gases are close to the “mantle”value≈3. The air-saturated meteoric waters, with N2/Arvalues between 36 and 50 reflecting the atmosphericinfluence (N2/Ar=84), are usually the end-member ofboth andesitic and basaltic fluids. The recharge fluids ofan active hydrothermal system may have variableamounts of air, and boiling processes can also modifythe original N2/Ar values of hydrothermal fluids. Asnone of the considered gases (N2, He, Ar) is reactive ingeothermal fluids, their relative concentrations may beuseful to complete the He isotope compositions astracers of the occurrence of deep fluids of magmaticorigin (Giggenbach, 1992b; Norman and Musgrave,1994; Moore et al., 2001), and their analysis can displaya clearer approach to the sources of fluids. The data ofvolatiles from felsic volcanoes (Giggenbach, 1992a),magmatic glass inclusions (Norman et al., 1997a), andfluid inclusions in porphyry copper deposits (Normanand Musgrave, 1994), indicate that magmatic volatilesare characterized by N2/Ar ratios higher than air.Moreover, the positive correlation between the N2/Arratios and O and H stable isotopes revealing a magmaticsource for hydrothermal fluids indicates a magmaticorigin for N2 (Hedenquist and Aoki, 1991).
In epithermal deposits, like Fresnillo in Mexico(Benton, 1991; Norman and Musgrave, 1994; Simmons,1995), the compositions of gases contained in fluidinclusions are mostly found in the field limited bymeteoric and magmatic end-members in the N2–He–Arternary plot. The systematic study of the volatilescontained in fluid inclusions from several Mexican lowand intermediate sulfidation epithermal deposits (Nor-man et al., 1997b; Albinson et al., 2001) suggests that(1) the occurrence of magmatic fluids is manifested inmost of them, (2) the contribution of magmatic fluidsseems to be more important during the formation of ore-
254 A. Camprubí et al. / Chemical Geology 231 (2006) 252–284
bearing than barren associations, and (3) the sulfurcontribution as H2S by magmatic fluids is a key factorfor the transport of gold and the occurrence of metallicmineralizations. However, support from more conven-tional techniques, such as O and H stable isotopestudies, is still fundamental to trace water to rockinteractions and to determine fluid sources or processesassociated with the upwelling of hydrothermal fluids.For instance, in N2–He–Ar or N2–CH4–Ar ternaryplots, the regions where metamorphic waters occur arestill to be determined (Norman and Musgrave, 1994).
The differences between the helium isotope compo-sitions in the atmosphere, the upper mantle, thecontinental crust, and radiogenic sources, allow theiruse as tracers of the sources for volcanic and geothermalvolatiles (Giggenbach and Poreda, 1993; Giggenbach etal., 1994; Moore et al., 2001). The volatiles ingeothermal fields from the Circum-Pacific Rim haveR/Ra values between 4.3 and 8.2, pointing to theoccurrence of important contributions of mantle-derivedhelium (Torgersen et al., 1982; Poreda and Craig, 1989;Giggenbach and Poreda, 1993; Giggenbach et al., 1994;Patterson et al., 1997, among many others). Thesevalues are very similar to those found in phenocrystalsand xenoliths from lavas of volcanic arcs, where R/Rarange between <1 and 8.5 (Tolstikhin et al., 1974;Hilton and Craig, 1989; Poreda and Craig, 1989; Hiltonet al., 1993; Patterson et al., 1994, 1997). In theepithermal deposits of Fresnillo in Mexico and Anta-mok-Acupan in the Philippines were obtained R/Ravalues of 1 to 2 and 6 to 7, respectively (Simmons et al.,1988; Cooke and Bloom, 1990). These data display theoccurrence of mantle-derived helium that was “diluted”by crustal helium, and were interpreted in the sense thathelium was probably transported to the crust byupwelling magmas, and migrated to the upper crustwithin the hydrothermal mineralizing fluids.
The relationship between magmatic fluids and baseand precious metal mineralization during the formationof the La Guitarra deposit was already suggested byCamprubí et al. (2001b) from fluid inclusion, stable andradiogenic isotope data. The vein formation was theresult of complex processes during which fluids ofseveral origins were involved, and some ambiguousstable isotope data did not allow to clearly recognize theorigin and evolution of fluids involved in each stage ofvein formation.
The aim of the present study is twofold: (1) to obtaincomplementary data in order to characterize themineralizing fluid sources for the La Guitarra Ag–Auepithermal deposit through the analysis of volatiles andHe isotopes trapped in fluid inclusions, and (2) to
determine the role of fluid origin in the transport anddeposition of base and precious metals in the veinsystem.
2. The La Guitarra epithermal deposit: previouswork
The Temascaltepec district is located 150 km SW ofMexico City, in México state, and is formed by severalsets of Ag–Au bearing epithermal veins. Although thesedeposits were formerly assigned to a low sulfidationtype (Albinson et al., 2001; Camprubí et al., 2001a,b),recent reclassification of epithermal deposits by Einaudiet al. (2003) and Sillitoe and Hedenquist (2003)suggests the Temascaltepec district vein deposits havecharacteristics of both low and intermediate sulfidationtypes. For this distinction, the reader is encouraged tocompare the T/ƒ(S2) diagrams in Einaudi et al. (2003)and Camprubí et al. (2001a).
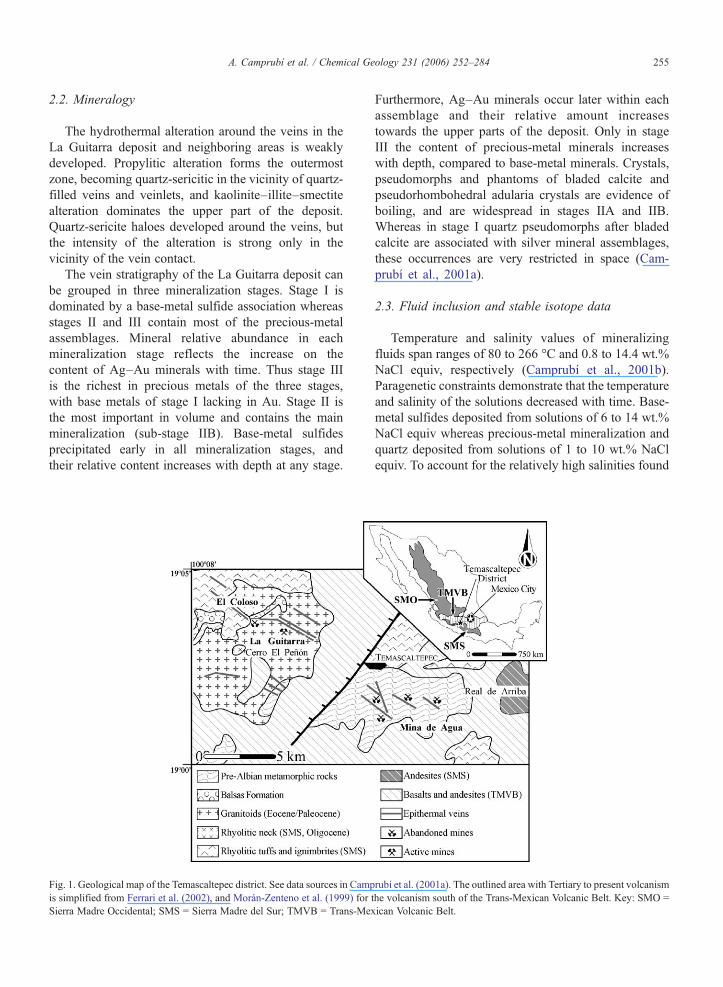
In the Temascaltepec area, three main vein sets occurfrom NW to SE: El Coloso, La Guitarra, and Mina deAgua (Fig. 1) which, based on geological evidence, areassumed to have formed from a single major epithermalvein set (Camprubí et al., 2001a). The outcropping strikelength of the vein deposit formed by La Guitarra and ElColoso veins zones altogether is more than 3.5 km, withan observable vertical extent of about 500 m. Themaximum vein thickness is about 15 to 20 m, averaging5 m. The results from previous studies are summarizedin Table 1.
2.1. Geology
The veins were mineralized during hydrothermalactivity associated with the Tertiary volcanism of theSierra Madre del Sur (SMS). Host rocks (Fig. 1)comprise the pre-Albian Taxco Schists of the TierraCaliente metamorphic complex, an early Eocenemolasse of the Balsas formation, a middle Eocenebiotitic quartz-monzonite stock, and an upper Eocene toOligocene rhyolitic and andesitic tuff unit of the SMS.The latter includes the rhyolitic feeder neck of Cerro ElPeñón, dated at 34.87±0.15 Ma by the 40Ar/39Armethod (Blatter et al., 2001). The La Guitarra deposit ishosted by the late-Laramide granitic suite, whilst theveins of El Coloso area are hosted by all the lithologicalunits mentioned above. These units are covered bybasalt and andesite flows of the Trans-Mexican VolcanicBelt (TMVB), which range in age from late Miocene tothe present. The epithermal veins were dated at 32.9±0.1 and 33.3±0.1 Ma by the 40Ar/39Ar method onadularia samples (Camprubí et al., 2003).
255A. Camprubí et al. / Chemical Geology 231 (2006) 252–284
2.2. Mineralogy
The hydrothermal alteration around the veins in theLa Guitarra deposit and neighboring areas is weaklydeveloped. Propylitic alteration forms the outermostzone, becoming quartz-sericitic in the vicinity of quartz-filled veins and veinlets, and kaolinite–illite–smectitealteration dominates the upper part of the deposit.Quartz-sericite haloes developed around the veins, butthe intensity of the alteration is strong only in thevicinity of the vein contact.
The vein stratigraphy of the La Guitarra deposit canbe grouped in three mineralization stages. Stage I isdominated by a base-metal sulfide association whereasstages II and III contain most of the precious-metalassemblages. Mineral relative abundance in eachmineralization stage reflects the increase on thecontent of Ag–Au minerals with time. Thus stage IIIis the richest in precious metals of the three stages,with base metals of stage I lacking in Au. Stage II isthe most important in volume and contains the mainmineralization (sub-stage IIB). Base-metal sulfidesprecipitated early in all mineralization stages, andtheir relative content increases with depth at any stage.
Fig. 1. Geological map of the Temascaltepec district. See data sources in Campis simplified from Ferrari et al. (2002), and Morán-Zenteno et al. (1999) for tSierra Madre Occidental; SMS = Sierra Madre del Sur; TMVB = Trans-Mex
Furthermore, Ag–Au minerals occur later within eachassemblage and their relative amount increasestowards the upper parts of the deposit. Only in stageIII the content of precious-metal minerals increaseswith depth, compared to base-metal minerals. Crystals,pseudomorphs and phantoms of bladed calcite andpseudorhombohedral adularia crystals are evidence ofboiling, and are widespread in stages IIA and IIB.Whereas in stage I quartz pseudomorphs after bladedcalcite are associated with silver mineral assemblages,these occurrences are very restricted in space (Cam-prubí et al., 2001a).
2.3. Fluid inclusion and stable isotope data
Temperature and salinity values of mineralizingfluids span ranges of 80 to 266 °C and 0.8 to 14.4 wt.%NaCl equiv, respectively (Camprubí et al., 2001b).Paragenetic constraints demonstrate that the temperatureand salinity of the solutions decreased with time. Base-metal sulfides deposited from solutions of 6 to 14 wt.%NaCl equiv whereas precious-metal mineralization andquartz deposited from solutions of 1 to 10 wt.% NaClequiv. To account for the relatively high salinities found
rubí et al. (2001a). The outlined area with Tertiary to present volcanismhe volcanism south of the Trans-Mexican Volcanic Belt. Key: SMO =ican Volcanic Belt.
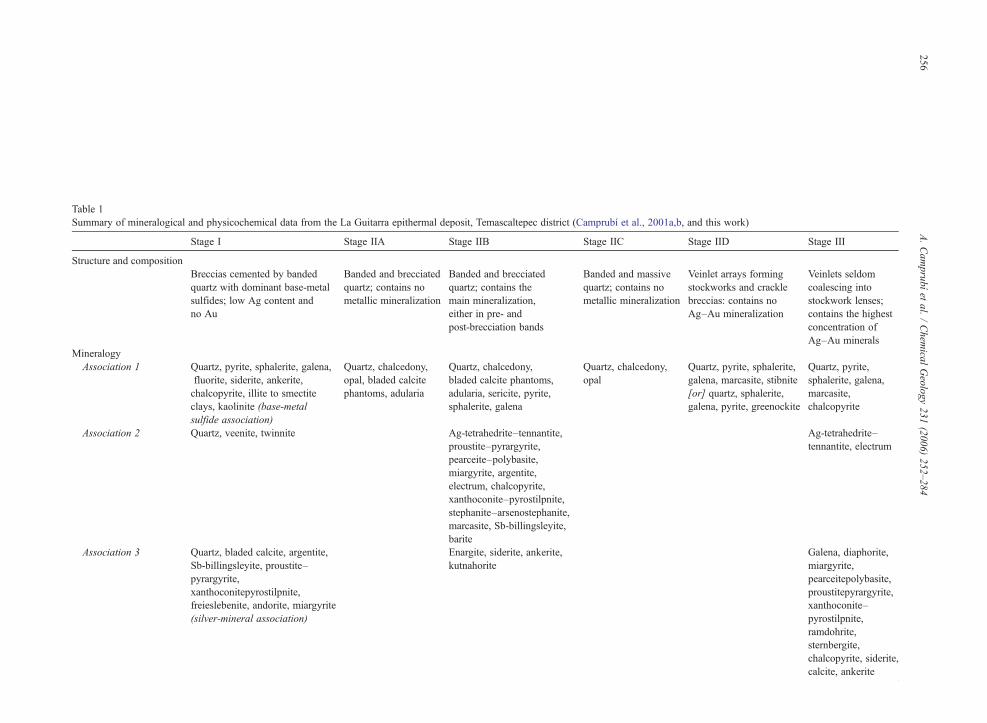
Table 1Summary of mineralogical and physicochemical data from the La Guitarra epithermal deposit, Temascaltepec district (Camprubí et al., 2001a,b, and this work)
Stage I Stage IIA Stage IIB Stage IIC Stage IID Stage III
Structure and compositionBreccias cemented by bandedquartz with dominant base-metalsulfides; low Ag content andno Au
Banded and brecciatedquartz; contains nometallic mineralization
Banded and brecciatedquartz; contains themain mineralization,either in pre- andpost-brecciation bands
Banded and massivequartz; contains nometallic mineralization
Veinlet arrays formingstockworks and cracklebreccias: contains noAg–Au mineralization
Veinlets seldomcoalescing intostockwork lenses;contains the highestconcentration ofAg–Au minerals
MineralogyAssociation 1 Quartz, pyrite, sphalerite, galena,
fluorite, siderite, ankerite,chalcopyrite, illite to smectiteclays, kaolinite (base-metalsulfide association)
Quartz, chalcedony,opal, bladed calcitephantoms, adularia
Quartz, chalcedony,bladed calcite phantoms,adularia, sericite, pyrite,sphalerite, galena
Quartz, chalcedony,opal
Quartz, pyrite, sphalerite,galena, marcasite, stibnite[or] quartz, sphalerite,galena, pyrite, greenockite
Quartz, pyrite,sphalerite, galena,marcasite,chalcopyrite
Association 2 Quartz, veenite, twinnite Ag-tetrahedrite–tennantite,proustite–pyrargyrite,pearceite–polybasite,miargyrite, argentite,electrum, chalcopyrite,xanthoconite–pyrostilpnite,stephanite–arsenostephanite,marcasite, Sb-billingsleyite,barite
Ag-tetrahedrite–tennantite, electrum
Association 3 Quartz, bladed calcite, argentite,Sb-billingsleyite, proustite–pyrargyrite,xanthoconitepyrostilpnite,freieslebenite, andorite, miargyrite(silver-mineral association)
Enargite, siderite, ankerite,kutnahorite
Galena, diaphorite,miargyrite,pearceitepolybasite,proustitepyrargyrite,xanthoconite–pyrostilpnite,ramdohrite,sternbergite,chalcopyrite, siderite,calcite, ankerite
256A.Cam
prubíet
al./Chem
icalGeology
231(2006)
252–284
FeS content in sp(mole fraction)
0.01 (association 1)0.01–0.25 (association 3)
– Up to 0.17 – 0.01 0.01
Evidence of boiling? Yes Yes Yes No No NoFluid inclusions (in parentheses, number of fluid inclusions where Th and TmI were measured, respectively)Minerals sp, qz, fl qz qz qz qz pr–pgTh (°C) 102 to 273 (447) 80 to 256 (391) 103 to 228 (249) 98 to 208 (86) 118 to 197 (22) Some day…TmI (°C) −1.2 to −10.4 (601) −0.6 to −6.1 (499) −1.5 to −3.9 (295) −0.5 to −3.3 (105) −1.6 to −3.5 (27) Some day…Wt.% NaCl eq 2.0 to 14.4 1.1 to 9.3 2.6 to 6.2 0.8 to 5.3 2.6 to 5.6 –Mineral geothermometers (in parentheses, number of samples where mineral assemblages suitable for geothermometry were found)Assemblage ag, mi, pg, pr, ps, xt – ag, bl, mi, pg, pr, ps, st, xt – – ag, mi, pg, pr, ps, xtT range (°C) ≥170 to 197 (5) – ≥120 to 197 (7) – – ≥180 to ≥240 (5)Stable isotopes (in parentheses, number of samples analyzed)δ18Oquartz (‰) 14.8 to 19.0 (8) 15.6 to 19.2 (8) 10.6 to 18.7 (15) 17.1 (1) 15.6 (1) 19.1 (1)δ18Owater (‰) 1.8 to 5.8 0.7 to 6.4 −1.5 to 6.9 3.2 2.1 7.3δDwater (‰) −32 (1) −60 to −28 (3) −49 to −20 (3) −23 (1) −103 (1) –δ34Ssulfide (‰) −12.7 to −1.9 (15) – −6.0 (1) – −36.6 to −1.2 (6) −0.5 (1)QMS analyses (in parentheses, number of samples analyzed plus total number of analyses)Minerals sp, qz, fl qz qz, and mixed qz and sulfides qz qz Mixed qz and
sulfosaltsN2/Ar range 0 to 2526 (4 and 42) 0 to 1264 (2 and 21) 0 to 1369 (5 and 51) 11 to 2401 (1 and 10) 19 to 324 (1 and 10) 0 to 2526 (1 and 15)
Abbreviations: ag = argentite, bl = Sb-billingsleyite, fl = fluorite, mi = miargyrite, pg = pyrargyrite, pr = proustite, ps = pyrostilpnite, qz = quartz, sp = sphalerite, st = stephanite, xt = xanthoconite.
257A.Cam
prubíet
al./Chem
icalGeology
231(2006)
252–284

258 A. Camprubí et al. / Chemical Geology 231 (2006) 252–284
in La Guitarra, Camprubí et al. (2001b) argued that thesewere probably related to magmatic exhalations, as noconnate brines or evaporites can be inferred from theregional geology.
δ18O, δD and δ34S values span compositional rangesof <−1.5‰ to >7.3‰, −103‰ to −20‰, and −36.6‰to −0.5‰, respectively (Camprubí et al., 2001b). Thelowest values of δD and δ34S belong to stage IID,pointing to processes and sources for chemical compo-nents that are different from those recorded in the othermineralization stages. Stage IID reveals the occurrenceof meteoric fluids that have undergone extensive water–rock interaction and possibly bacteriogenic reduction ofdissolved sulfate to H2S during a lull of the hydrother-mal activity in the deposit. The general values from thestages other than IID point to magmatic and meteoricsources for mineralizing fluids. The occurrence of bothmagmatic and meteoric fluid end-members can beinferred in all stages, but the presence of hydrocarbonsin late fluid inclusions of stages IIA and IIB probablyindicates some interaction between hydrothermal fluidsand sedimentary-metamorphic rocks. δ34S values ofstages other than IID also account for both magmaticand meteoric-sedimentary sources in different propor-tions. Stage III reveals the strongest influence ofmagmatic sources for water and sulfur, as it recordsthe highest δ18Owater and δ34S values of the deposit.
As stated above, evidence was noted for boiling instages I, IIA and IIB. Although petrographic evidencefor boiling in ore bands of stage IIB rarely occur in thesame place, the coincident space distribution of thesefeatures and the highest Ag and Au grades indicate thatmetallic mineral deposition during stage IIB was likelyinduced by boiling. Ore bands of stage IIB generallydeposited at higher temperatures than earlier and laterbarren bands, and δ18O values are higher in ore bandsthan in barren bands, possibly indicating a highermagmatic contribution in ore-bearing bands. Mineralprecipitation in stages IIC and IID may have occurred bythe mixing of upwelling fluids with descending meteoricwaters. Mineral precipitation during stage III couldeither occur by fluid mixing or conductive cooling ofhydrothermal fluids. Although hydrothermal flowduring stage IID was favored by faulting, the relativelyscarce mineralization displayed suggests that thehydrothermal activity was waning. Thus, the key factorthat lead to metallic mineral deposition at La Guitarraduring any stage of mineralization may more likely havebeen the occurrence of pulses of magmatic fluidsbearing metals in solution, rather than the occurrenceof any specific precipitation mechanism at the site ofdeposition.
3. Sampling and analytical procedure
Volatiles contained in fluid inclusions from fourteenrepresentative samples were analyzed. The analyzedsamples were selected from the different stages of veinformation and the most representative mineral associa-tions following paragenetic, fluid inclusion, and stableisotope constraints (Camprubí et al., 2001a,b). Foursamples are from stage I: two sphalerite and one fluoritesample from the base-metal sulfide association(BMSA), and one quartz sample that grew interstitiallyto bladed calcite crystals from the silver mineralassociation (SMA). Two quartz samples were usedfrom stage IIA, both from post-brecciation bands. Fivesamples are from stage IIB: two from pre-brecciationquartz bands, one from mineralized bands with mixedquartz, sulfides and sulfosalts, and two from quartz vugsof post-brecciation bands. Two quartz samples were alsoused from the latest precipitates of stages IIC and IID,and one sample from stage III, containing both the earlyassociation of Ag-tetrahedrite with base-metal sulfidesand electrum, and a late association of Ag and Ag–Pbsulfosalts.
Volatile analyses were done in a Balzers QMS 420quadrupole mass spectrometer at the Earth and Envi-ronmental Science Department of the New MexicoInstitute of Mining and Technology (Socorro, NM). Allthe analyses were performed using the crush-fast-scan(CFS) method described by Norman et al. (1997a) andMoore et al. (2001). Samples were crushed undervacuum, and the volatiles released were extracted with ahigh-vacuum pump, ionized by low-energy electrons,and immediately measured by the quadrupole massspectrometer. During the analysis, the vacuum condi-tions within the spectrometer and the extraction linewere about 1×10⁻⁷ to 4×10⁻⁷Torr and 6×10⁻⁸ to1×10−7Torr, respectively. The signal counting peranalysis was of 100–120 cycles at 10–20ms/cycle.The results are reported as mole per cent in theAppendix. In this case the thermal decrepitation–cryogenic separation method (TDCS) was not used,although such method provides the greatest precision.See a comparison of the TDCS and CFS extraction andscan methods with their advantages and limitations inMoore et al. (2001). The crushing method releasesvolatiles from far less inclusions than those released bydecrepitation, but each crush-and-scan cycle analyzesdifferent groups of inclusions, although it does not allowto know the petrographic type of the groups ofinclusions that are crushed. The main advantages ofthe CFS method are that it allows to obtain severalanalyses from small amounts of a sample and it may also
259A. Camprubí et al. / Chemical Geology 231 (2006) 252–284
potentially help to explain processes as fluid mixing orboiling using data from a single sample. Then, theTDCS and CFS methods are the quality versus quantityversions of the QMS technique.
Four samples were selected for helium isotopeanalyses: one sphalerite sample from the base-metalsulfide assemblage of stage I, and three quartz samplesfrom stages I, IIB and IIC. Helium isotopes weremeasured using the method of Nier and Schlutter(1985), in a VG 5400 noble gas mass spectrometer, atthe Lamont–Doherty Earth Observatory of the ColumbiaUniversity (Palisades, NY). Gas extraction from fluid
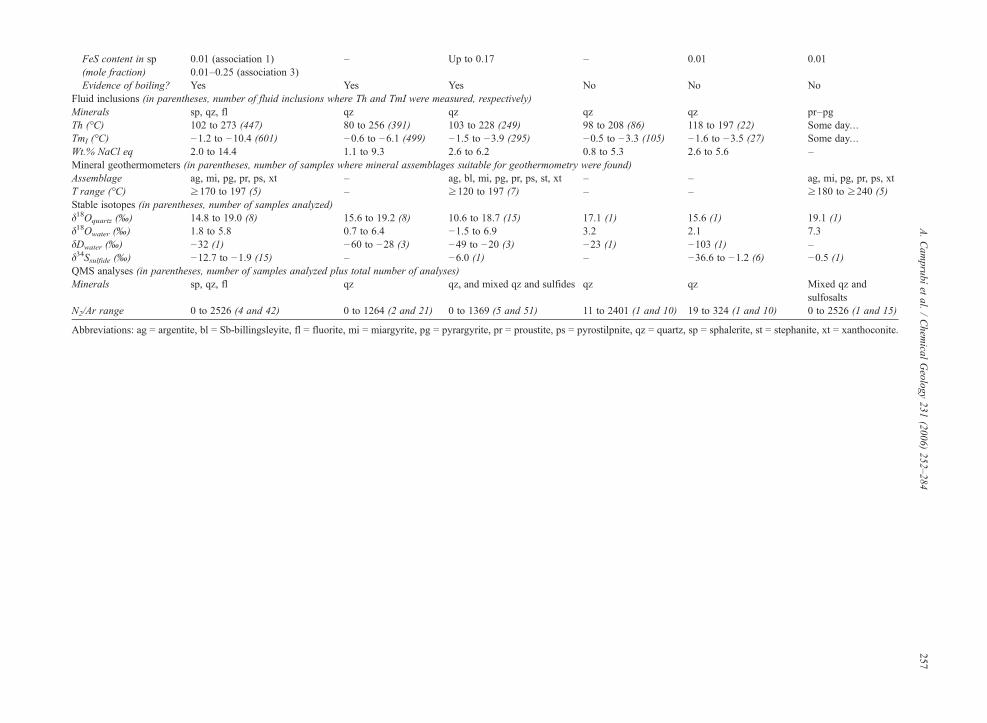
Fig. 2. (A) N2–He–Ar and N2–CH4–Ar ternary plots, (B) correlation diagramN2/Ar and CO2/CH4 ratios, after the compositional analyses of volatiles contamining are found at the following elevations above the sea level: San Francisc(average elevation).
inclusions was performed by crushing the samples usingan electromagnet-driven piston under vacuum. Beforeand after each analysis a blank and a referenceatmospheric standard were measured using the samedevice. The atmospheric standard analyzed determinedthe Ra value used as a reference for the R values obtainedin the samples. The crushing device consists of anelectromagnet-driven piston. The integration time ofanalysis was 1h, doing five crushing cycles per sample.For each cycle the detector was positioned in thedeuterium mass, which is the most similar to that ofhelium, making the piston work during 30s, and then
between N2/Ar and H2S/Ar ratios, and (C) correlation diagram betweenined in fluid inclusions from stage I. The named levels of undergroundo level at 2250 m, Amelia level at 2175 m, San Rafael ramp at 2070 m
260 A. Camprubí et al. / Chemical Geology 231 (2006) 252–284
leaving the electromagnet to cool during 10min. Thehelium released this way is kept in a helium+carbon trapat ∼16K, that is heated up to 45K to release thecumulated helium, and then driven towards the massspectrometer. This process is done ten times during eachcrushing cycle. The high-precision helium isotopeanalysis needs a filament current of about 800 μA. TheVG 5400 mass spectrometer uses an ion source ofelectron impact. The electrons emitted by the filament areforced to follow a circular path induced by the sourcemagnets to increase the ionization probability of the gas
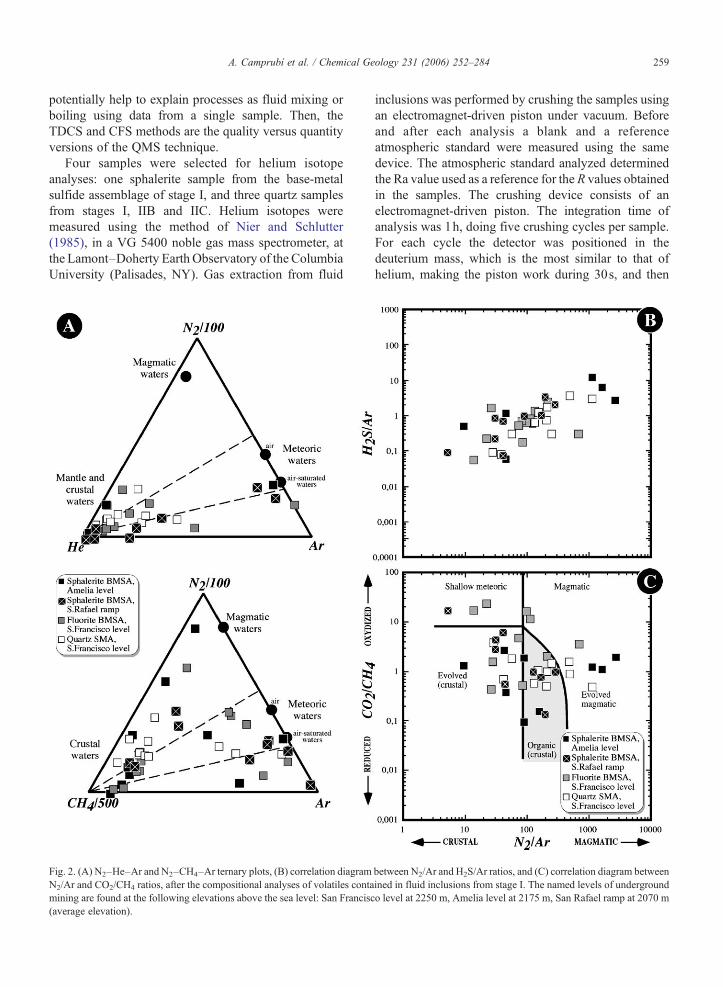
Fig. 3. (A) N2–He–Ar and N2–CH4–Ar ternary plots, (B) correlation diagramN2/Ar and CO2/CH4 ratios, after the compositional analyses of volatilesunderground mining are found at the following elevations above the sea lev
atoms inside the ionization chamber. Then, the ions areextracted from the ionization chamber, accelerated at4.5 keV, and differentially deviated by a separationmagnet.
4. Results and discussion
4.1. Volatiles (N2, He, Ar, CH4, CO2)
The obtained relative contents of various volatilespecies are displayed in the Appendix. The N2–He–Ar,
between N2/Ar and H2S/Ar ratios, and (C) correlation diagram betweencontained in fluid inclusions from stage IIA. The named levels ofel: El Garambullo level at 2425 m, Amelia level at 2175 m.
261A. Camprubí et al. / Chemical Geology 231 (2006) 252–284
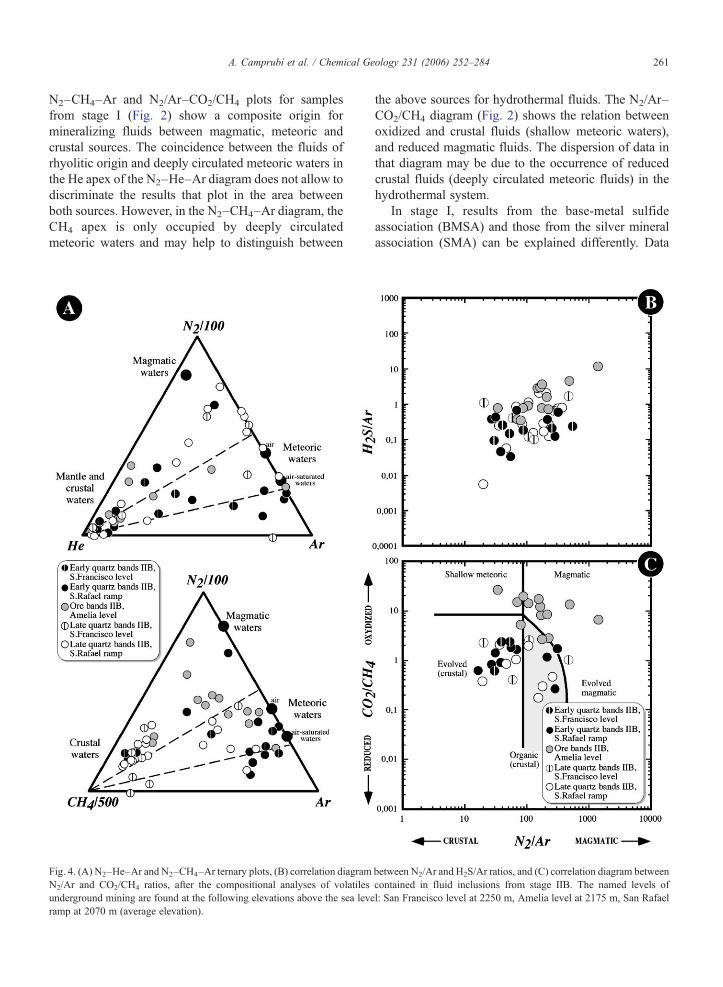
N2–CH4–Ar and N2/Ar–CO2/CH4 plots for samplesfrom stage I (Fig. 2) show a composite origin formineralizing fluids between magmatic, meteoric andcrustal sources. The coincidence between the fluids ofrhyolitic origin and deeply circulated meteoric waters inthe He apex of the N2–He–Ar diagram does not allow todiscriminate the results that plot in the area betweenboth sources. However, in the N2–CH4–Ar diagram, theCH4 apex is only occupied by deeply circulatedmeteoric waters and may help to distinguish between
Fig. 4. (A) N2–He–Ar and N2–CH4–Ar ternary plots, (B) correlation diagramN2/Ar and CO2/CH4 ratios, after the compositional analyses of volatilesunderground mining are found at the following elevations above the sea leveramp at 2070 m (average elevation).
the above sources for hydrothermal fluids. The N2/Ar–CO2/CH4 diagram (Fig. 2) shows the relation betweenoxidized and crustal fluids (shallow meteoric waters),and reduced magmatic fluids. The dispersion of data inthat diagram may be due to the occurrence of reducedcrustal fluids (deeply circulated meteoric fluids) in thehydrothermal system.
In stage I, results from the base-metal sulfideassociation (BMSA) and those from the silver mineralassociation (SMA) can be explained differently. Data
between N2/Ar and H2S/Ar ratios, and (C) correlation diagram betweencontained in fluid inclusions from stage IIB. The named levels ofl: San Francisco level at 2250 m, Amelia level at 2175 m, San Rafael
262 A. Camprubí et al. / Chemical Geology 231 (2006) 252–284
from fluorite of the BMSA show a marked influencefrom meteoric waters, as most of them are found in thecompositional field of crustal waters, although someanalyses also indicate a magmatic component. On theother side, the data from sphalerite of the BMSA maysuggest a stronger influence frommagmatic fluids. In theN2–He–Ar diagram, data from sphalerite mostly plotclose to the He apex, thus pointing to a stronger influenceof fluids associated with rhyolitic melts and deeplycirculated meteoric waters. The data from quartz of theSMA show the occurrence of fluids predominantly from
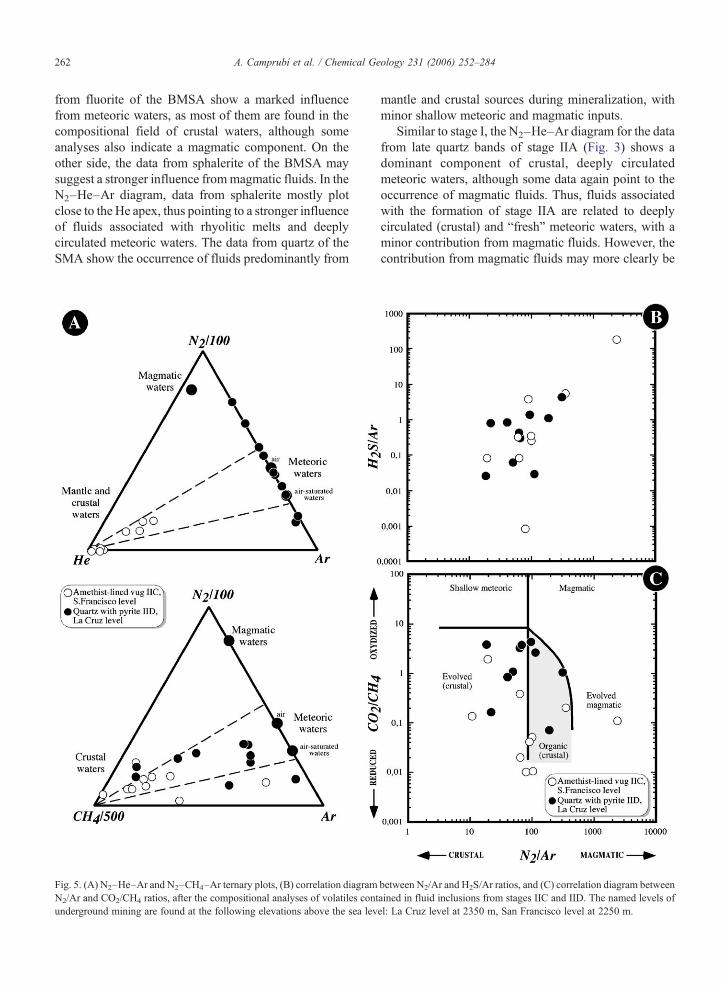
Fig. 5. (A) N2–He–Ar and N2–CH4–Ar ternary plots, (B) correlation diagramN2/Ar and CO2/CH4 ratios, after the compositional analyses of volatiles contunderground mining are found at the following elevations above the sea lev
mantle and crustal sources during mineralization, withminor shallow meteoric and magmatic inputs.
Similar to stage I, the N2–He–Ar diagram for the datafrom late quartz bands of stage IIA (Fig. 3) shows adominant component of crustal, deeply circulatedmeteoric waters, although some data again point to theoccurrence of magmatic fluids. Thus, fluids associatedwith the formation of stage IIA are related to deeplycirculated (crustal) and “fresh” meteoric waters, with aminor contribution from magmatic fluids. However, thecontribution from magmatic fluids may more clearly be
between N2/Ar and H2S/Ar ratios, and (C) correlation diagram betweenained in fluid inclusions from stages IIC and IID. The named levels ofel: La Cruz level at 2350 m, San Francisco level at 2250 m.
263A. Camprubí et al. / Chemical Geology 231 (2006) 252–284
recognized in N2–CH4–Ar and N2/Ar–CO2/CH4
diagrams.Data from samples of stage IIB in N2–He–Ar, N2–
CH4–Ar and N2/Ar–CO2/CH4 diagrams (Fig. 4) suggestthe occurrence of fluid of different origin for the differentsets of banded mineralization: (a) barren pre-brecciation,(b) ore-bearing, and (c) barren post-brecciation bands.Although all the analyzed samples record the same fluidsources as in stages I and IIA, it is observed that: (1) thefluids associated with barren pre-brecciation bandsrecord the strongest influence of meteoric and crustal
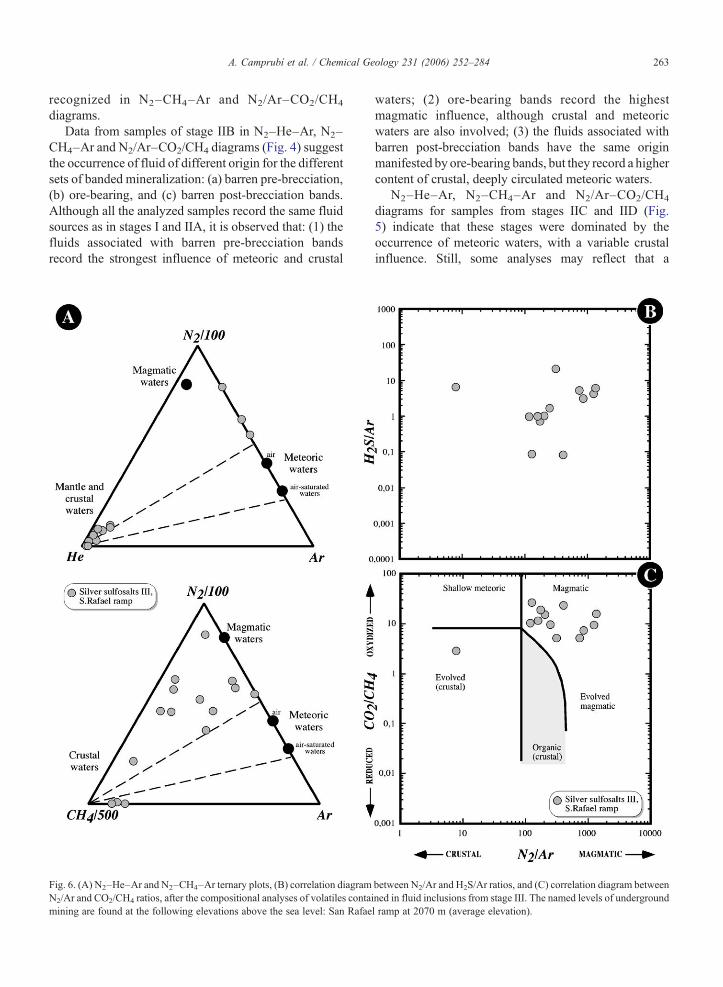
Fig. 6. (A) N2–He–Ar and N2–CH4–Ar ternary plots, (B) correlation diagramN2/Ar and CO2/CH4 ratios, after the compositional analyses of volatiles contaimining are found at the following elevations above the sea level: San Rafae
waters; (2) ore-bearing bands record the highestmagmatic influence, although crustal and meteoricwaters are also involved; (3) the fluids associated withbarren post-brecciation bands have the same originmanifested by ore-bearing bands, but they record a highercontent of crustal, deeply circulated meteoric waters.
N2–He–Ar, N2–CH4–Ar and N2/Ar–CO2/CH4
diagrams for samples from stages IIC and IID (Fig.5) indicate that these stages were dominated by theoccurrence of meteoric waters, with a variable crustalinfluence. Still, some analyses may reflect that a
between N2/Ar and H2S/Ar ratios, and (C) correlation diagram betweenned in fluid inclusions from stage III. The named levels of undergroundl ramp at 2070 m (average elevation).
264 A. Camprubí et al. / Chemical Geology 231 (2006) 252–284
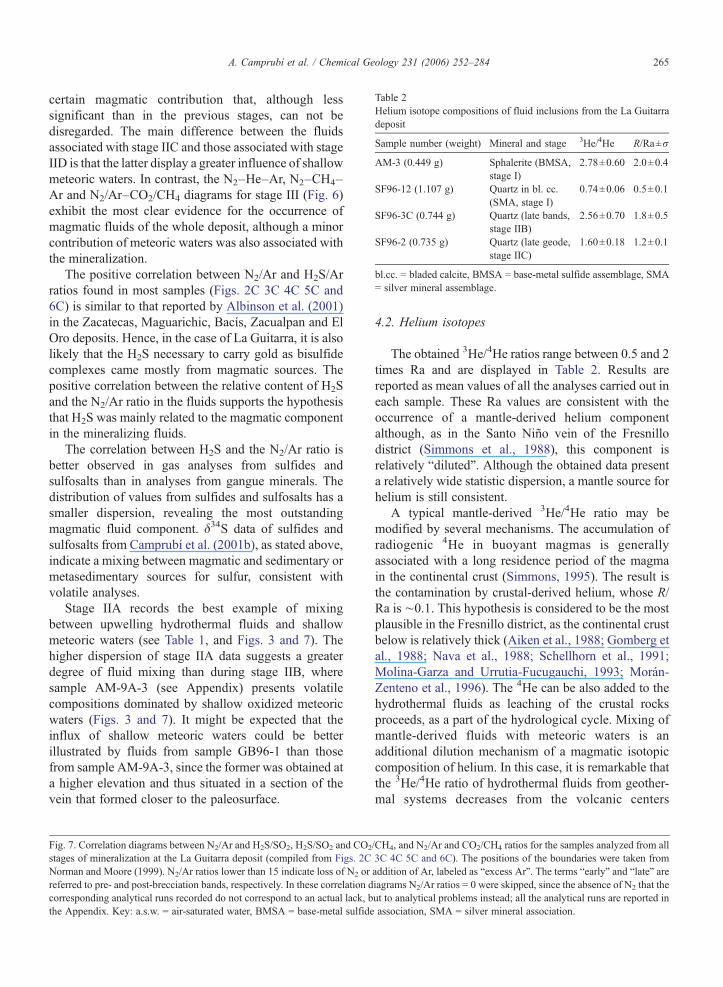
Table 2Helium isotope compositions of fluid inclusions from the La Guitarradeposit
Sample number (weight) Mineral and stage 3He/4He R/Ra±σ
AM-3 (0.449 g) Sphalerite (BMSA,stage I)
2.78±0.60 2.0±0.4
SF96-12 (1.107 g) Quartz in bl. cc.(SMA, stage I)
0.74±0.06 0.5±0.1
SF96-3C (0.744 g) Quartz (late bands,stage IIB)
2.56±0.70 1.8±0.5
SF96-2 (0.735 g) Quartz (late geode,stage IIC)
1.60±0.18 1.2±0.1
bl.cc. = bladed calcite, BMSA = base-metal sulfide assemblage, SMA= silver mineral assemblage.
265A. Camprubí et al. / Chemical Geology 231 (2006) 252–284
certain magmatic contribution that, although lesssignificant than in the previous stages, can not bedisregarded. The main difference between the fluidsassociated with stage IIC and those associated with stageIID is that the latter display a greater influence of shallowmeteoric waters. In contrast, the N2–He–Ar, N2–CH4–Ar and N2/Ar–CO2/CH4 diagrams for stage III (Fig. 6)exhibit the most clear evidence for the occurrence ofmagmatic fluids of the whole deposit, although a minorcontribution of meteoric waters was also associated withthe mineralization.
The positive correlation between N2/Ar and H2S/Arratios found in most samples (Figs. 2C 3C 4C 5C and6C) is similar to that reported by Albinson et al. (2001)in the Zacatecas, Maguarichic, Bacís, Zacualpan and ElOro deposits. Hence, in the case of La Guitarra, it is alsolikely that the H2S necessary to carry gold as bisulfidecomplexes came mostly from magmatic sources. Thepositive correlation between the relative content of H2Sand the N2/Ar ratio in the fluids supports the hypothesisthat H2S was mainly related to the magmatic componentin the mineralizing fluids.
The correlation between H2S and the N2/Ar ratio isbetter observed in gas analyses from sulfides andsulfosalts than in analyses from gangue minerals. Thedistribution of values from sulfides and sulfosalts has asmaller dispersion, revealing the most outstandingmagmatic fluid component. δ34S data of sulfides andsulfosalts from Camprubí et al. (2001b), as stated above,indicate a mixing between magmatic and sedimentary ormetasedimentary sources for sulfur, consistent withvolatile analyses.
Stage IIA records the best example of mixingbetween upwelling hydrothermal fluids and shallowmeteoric waters (see Table 1, and Figs. 3 and 7). Thehigher dispersion of stage IIA data suggests a greaterdegree of fluid mixing than during stage IIB, wheresample AM-9A-3 (see Appendix) presents volatilecompositions dominated by shallow oxidized meteoricwaters (Figs. 3 and 7). It might be expected that theinflux of shallow meteoric waters could be betterillustrated by fluids from sample GB96-1 than thosefrom sample AM-9A-3, since the former was obtained ata higher elevation and thus situated in a section of thevein that formed closer to the paleosurface.
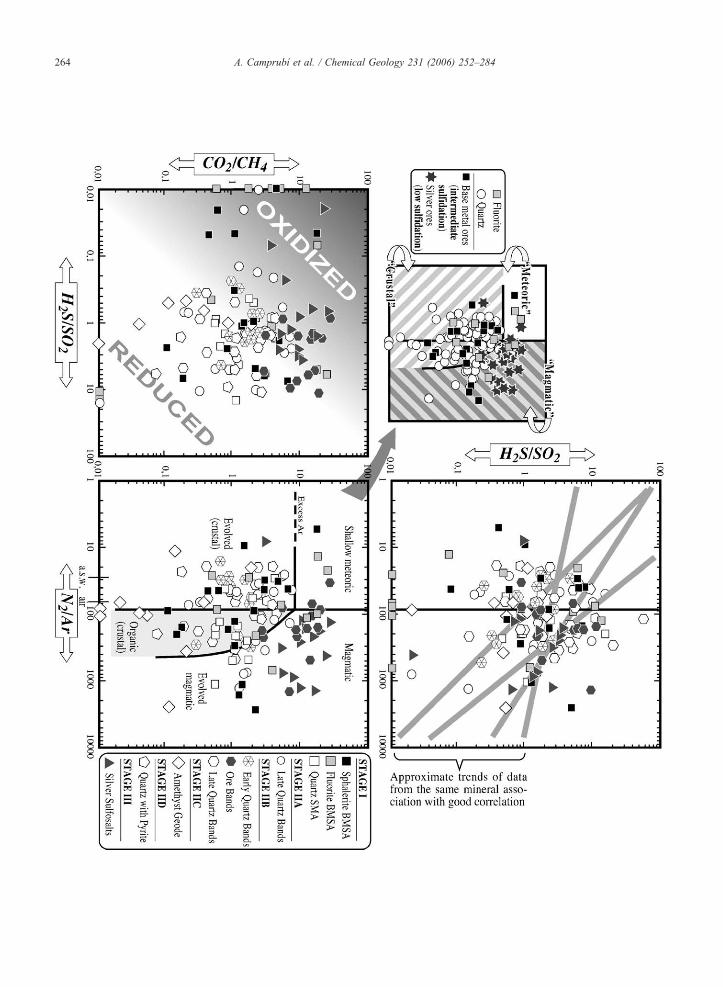
Fig. 7. Correlation diagrams between N2/Ar and H2S/SO2, H2S/SO2 and CO2
stages of mineralization at the La Guitarra deposit (compiled from Figs. 2CNorman and Moore (1999). N2/Ar ratios lower than 15 indicate loss of N2 orreferred to pre- and post-brecciation bands, respectively. In these correlation dcorresponding analytical runs recorded do not correspond to an actual lack, bthe Appendix. Key: a.s.w. = air-saturated water, BMSA = base-metal sulfide
4.2. Helium isotopes
The obtained 3He/4He ratios range between 0.5 and 2times Ra and are displayed in Table 2. Results arereported as mean values of all the analyses carried out ineach sample. These Ra values are consistent with theoccurrence of a mantle-derived helium componentalthough, as in the Santo Niño vein of the Fresnillodistrict (Simmons et al., 1988), this component isrelatively “diluted”. Although the obtained data presenta relatively wide statistic dispersion, a mantle source forhelium is still consistent.
A typical mantle-derived 3He/4He ratio may bemodified by several mechanisms. The accumulation ofradiogenic 4He in buoyant magmas is generallyassociated with a long residence period of the magmain the continental crust (Simmons, 1995). The result isthe contamination by crustal-derived helium, whose R/Ra is ∼0.1. This hypothesis is considered to be the mostplausible in the Fresnillo district, as the continental crustbelow is relatively thick (Aiken et al., 1988; Gomberg etal., 1988; Nava et al., 1988; Schellhorn et al., 1991;Molina-Garza and Urrutia-Fucugauchi, 1993; Morán-Zenteno et al., 1996). The 4He can be also added to thehydrothermal fluids as leaching of the crustal rocksproceeds, as a part of the hydrological cycle. Mixing ofmantle-derived fluids with meteoric waters is anadditional dilution mechanism of a magmatic isotopiccomposition of helium. In this case, it is remarkable thatthe 3He/4He ratio of hydrothermal fluids from geother-mal systems decreases from the volcanic centers
/CH4, and N2/Ar and CO2/CH4 ratios for the samples analyzed from all3C 4C 5C and 6C). The positions of the boundaries were taken fromaddition of Ar, labeled as “excess Ar”. The terms “early” and “late” areiagrams N2/Ar ratios = 0 were skipped, since the absence of N2 that theut to analytical problems instead; all the analytical runs are reported inassociation, SMA = silver mineral association.
266 A. Camprubí et al. / Chemical Geology 231 (2006) 252–284
outwards, due to the increasing water/rock interaction(Hilton et al., 1993). This is also due to a greaterincorporation of meteoric water to the hydrothermalconvection cells, containing helium of atmosphericisotopic composition. The 3He/4He data of the LaGuitarra deposit thus reflect the incorporation of mantle-derived helium, suggesting that the ultimate source ofpart of the volatiles contained by mineralizing fluidswere cooling magmas. The R/Ra values that are lowerthan those considered to be mantle-derived may beexplained by (1) a higher crustal contribution by magmaassimilation or deep water/rock interaction, or (2)mixing of the upwelling fluids with air-saturatedmeteoric waters.
Another process that may mask the occurrence ofmantle-derived helium is the fractionation of 3He to thevapor phase due to boiling. Among the analyzedsamples, only one can be considered to be under theinfluence of boiling: the quartz sample within theinterstices of bladed calcite from the stage I silvermineral association. The other samples correspond to(1) mineral associations where boiling was notrecorded, as the sphalerite from the base-metal sulfideassociation of stage I, and the quartz-amethyst fromstage IIC late vug lining, or to (2) paragenetic sectionsthat are relatively separated enough in time fromevidence of boiling to record the chemical influence of
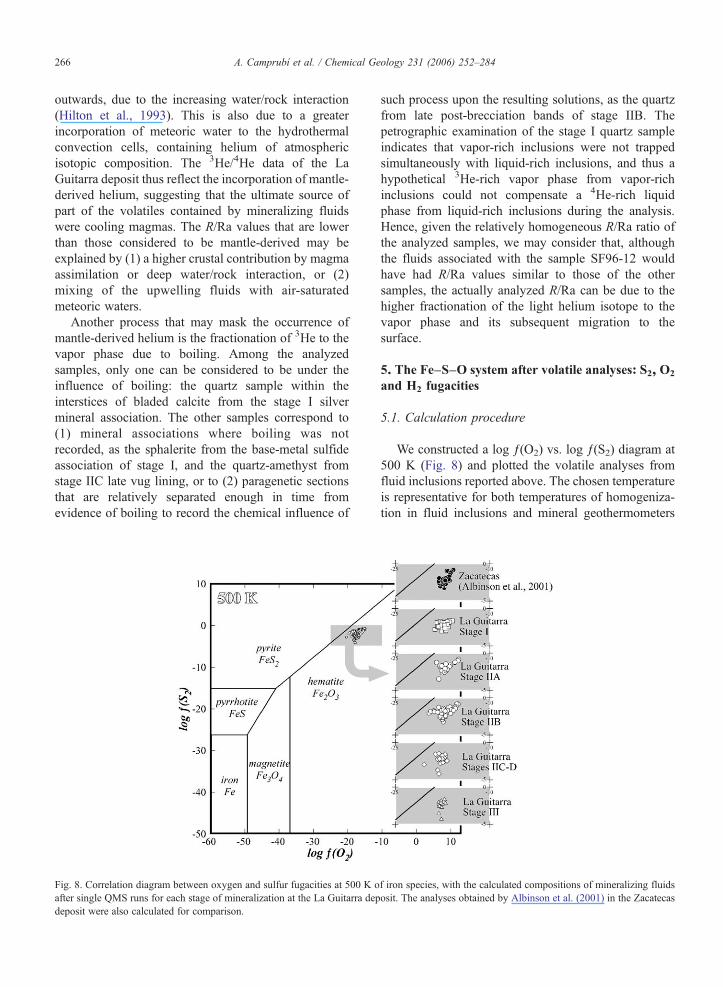
Fig. 8. Correlation diagram between oxygen and sulfur fugacities at 500 K oafter single QMS runs for each stage of mineralization at the La Guitarra depdeposit were also calculated for comparison.
such process upon the resulting solutions, as the quartzfrom late post-brecciation bands of stage IIB. Thepetrographic examination of the stage I quartz sampleindicates that vapor-rich inclusions were not trappedsimultaneously with liquid-rich inclusions, and thus ahypothetical 3He-rich vapor phase from vapor-richinclusions could not compensate a 4He-rich liquidphase from liquid-rich inclusions during the analysis.Hence, given the relatively homogeneous R/Ra ratio ofthe analyzed samples, we may consider that, althoughthe fluids associated with the sample SF96-12 wouldhave had R/Ra values similar to those of the othersamples, the actually analyzed R/Ra can be due to thehigher fractionation of the light helium isotope to thevapor phase and its subsequent migration to thesurface.
5. The Fe–S–O system after volatile analyses: S2, O2
and H2 fugacities
5.1. Calculation procedure
We constructed a log ƒ(O2) vs. log ƒ(S2) diagram at500 K (Fig. 8) and plotted the volatile analyses fromfluid inclusions reported above. The chosen temperatureis representative for both temperatures of homogeniza-tion in fluid inclusions and mineral geothermometers
f iron species, with the calculated compositions of mineralizing fluidsosit. The analyses obtained by Albinson et al. (2001) in the Zacatecas
267A. Camprubí et al. / Chemical Geology 231 (2006) 252–284
(Camprubí et al., 2001a,b). To do so we considered thefollowing reactions and equilibrium constants:
2Fe þ S2ðgÞ⇔2FeS Log Keq ¼ −logPS2 ðgÞ
3FeS þ 2O2ðgÞ⇔Fe3O4 þ 3=2S2ðgÞ
Log Keq ¼ 32logPS2−2logPO2
3=2Fe þ O2ðgÞ⇔1=2Fe3O4 Log Keq ¼ −logPO2
2Fe3O4 þ 1=2O2ðgÞ⇔3Fe2O3 Log Keq ¼ −12logPO2
2FeS þ S2ðgÞ⇔2FeS2 Log Keq ¼ −logPS2 ðgÞ
3FeS2 þ 2O2⇔Fe3O4 þ 3S2ðgÞ Log Keq ¼ 3logPS2−2logPO2
Log Keq ¼ 2logPS2−32logPO2
The expression of equilibrium constants wereobtained after
DGr ¼ −RT lnKeq ð1Þ
where R is the constant of gases (8.314 J/mol K), and Tis temperature (500 K). ΔGr was calculated using theequation
DGr ¼ DG products−DG reactants ð2Þ
and the free Gibbs energy data at 500 K were obtainedfrom Robie et al. (1928).
We also constructed a log ƒ(H2) vs. log ƒ(S2)diagram adding to the above the reaction of waterdissociation
2H2O⇔O2 þ 2H2
and proceeded the same way as to construct the log ƒ(O2) vs. log ƒ(S2) diagram. The log ƒ(H2) vs. log ƒ(S2) diagram is not shown because the calculatedfugacity values from the volatile data plotted withinthe magnetite stability field and that does notcorrespond to the observed mineralogy of any metallicmineral association from the La Guitarra deposit (seeFig. 15 in Camprubí et al., 2001a). The reason for thatdiscrepancy probably lies in a deficient detection ofH2 during QMS runs.
The sulfur and oxygen fugacities for the analyzedfluid inclusion samples, plotted onto the constructed log
ƒ(O2) vs. log ƒ(S2) diagram, were calculated from QMSruns after Henry's law
fgas ¼ KHgasTXgas ð3Þ
where ƒgas = gas fugacity, KHgas= Henry's constant for
the gas, Xgas = molar fraction of the gas. The gasconcentration values are expressed as mole percents(%mol), defined as
%mol ¼ gas moltotal gas mol
T100: ð4Þ
At 500 K, Henry's constants (KH) for H2 and H2S are
KHðH2Þ¼ 106:057
KHðH2SÞ¼ 103:688
and, although the KH for O2 at that temperature was notfound in the literature, it was deduced from the equation
KHðO2Þð500KÞ ¼ KHðO2Þð298KÞe−DH-
500KR
1298−
1Tð Þ ð5Þ
where the KH for O2 at 298 K is 38800 atm. Thereaction heat (ΔH°) for O2 at 500 K was calculated with
DH-500K ¼ DH-
298K þZ 500K
298KD Cp-dT : ð6Þ
Following the reaction of water dissociation, if the ΔH°for the formation of water is 241.81 kJ/mol, then theΔH° for oxygen is −241.81 kJ/mol. Then, we substitutethe calorific capacity for each chemical species by anexpression that is a function of temperature, and Eq. (8)turns to
DH-ð500KÞ ¼ 241:81 kJ=molK
þ R
�1:39645
Z 500
298dT−4:77� 10−4
�Z 500
298T dT−1:48� 10−7
Z 500
298T2 dT
�
ð7Þ
From Eq. (9) we may calculate the KH for O2 at500 K:
KHðO2Þ¼ 10−12:676:
As shown in Eq. (3), we may then calculate the res-pective gas fugacities using Henry's constants at 500 K.
268 A. Camprubí et al. / Chemical Geology 231 (2006) 252–284
Fig. 8 shows that there are no significant variations inthe fugacities of O2 and S2 in mineralizing fluids at anystage, and that these are similar to mineralizing fluids in
the deposits of the Zacatecas district (Albinson et al.,2001; calculated here for comparison), as all theanalyses plot within the same compositional region,
269A. Camprubí et al. / Chemical Geology 231 (2006) 252–284
within the hematite stability field and very close to thepyrite stability field. Thus, the mineralizing fluids at theLa Guitarra deposit had practically the same “macro-chemical” characteristics, and the different styles ofmineralization, and the lack or presence of oreassociations actually is due to contrasting “micro-chemical” characteristics.
6. Discussion and conclusions
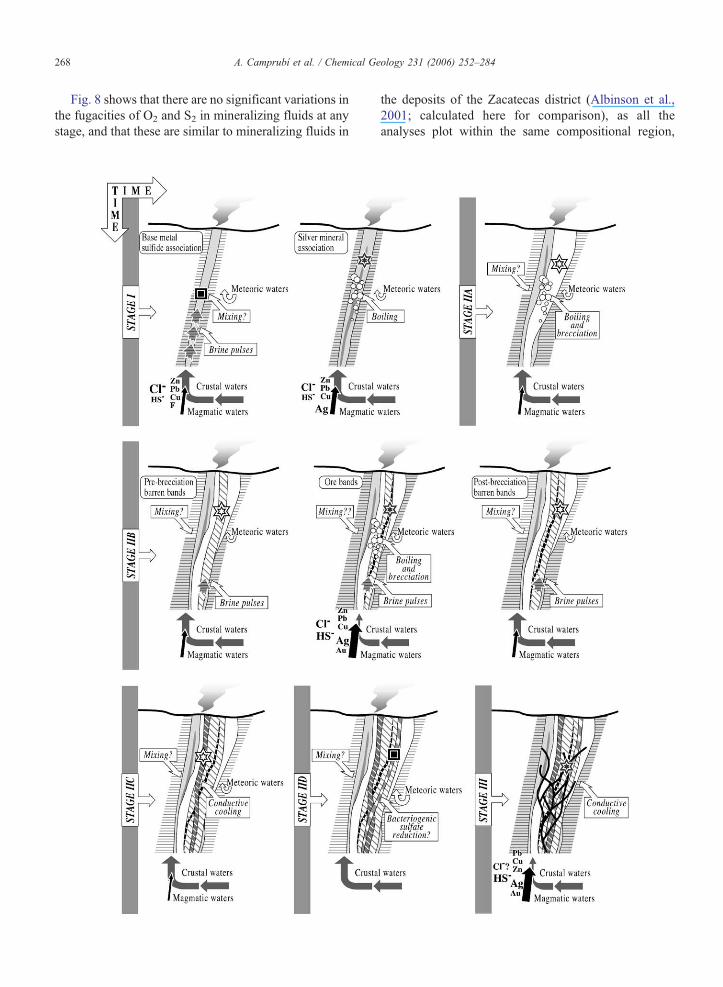
The sources of mineralizing fluids and the proposedmechanisms of precipitation for the identified mineralassociations at the La Guitarra epithermal deposit aresummarized in Fig. 9. The conceptual model is inaccordance with that proposed by Camprubí et al.(2001b) after petrographic, microthermometric andstable isotope studies. Ore precipitation mechanismsinvolved boiling, shallow mixing of fluids, conductivecooling and, at a much lesser extent (restricted to stageIID), bacteriogenic sulfate reduction.
Gas analyses from inclusion fluids show theoccurrence of three fluid types in all mineralizationstages: magmatic, deeply circulated meteoric (crustalwaters), and shallow meteoric waters. Volatile composi-tions that indicate the occurrence of magmatic fluidscorrelates with He, O and H isotope compositions thatalso indicate or suggest the occurrence of such sourcefor mineralizing fluids (Fig. 10). Generally speaking, allthe analyzed fluids display N2/Ar ratios suggesting ageneral composite origin between andesite or rhyolite-derived fluids, and meteoric fluids of any kind. Resultsfrom volatile analyses show that shallow waters invadedthe system during the waning stages of some hydro-thermal pulses, thus confirming the conclusions byCamprubí et al. (2001b) from fluid inclusion and stableisotope data.
The most significant magmatic contributions werefound in fluids trapped in sphalerites from the BMSA ofstage I (Figs. 2, 7, and 10), in ore-bearing quartz bandsof stage IIB (Figs. 4, 7, and 10), and in the sulfosaltsfrom stage III (Figs. 6, 7, and 10). These results arecomparable to those found in the study of several
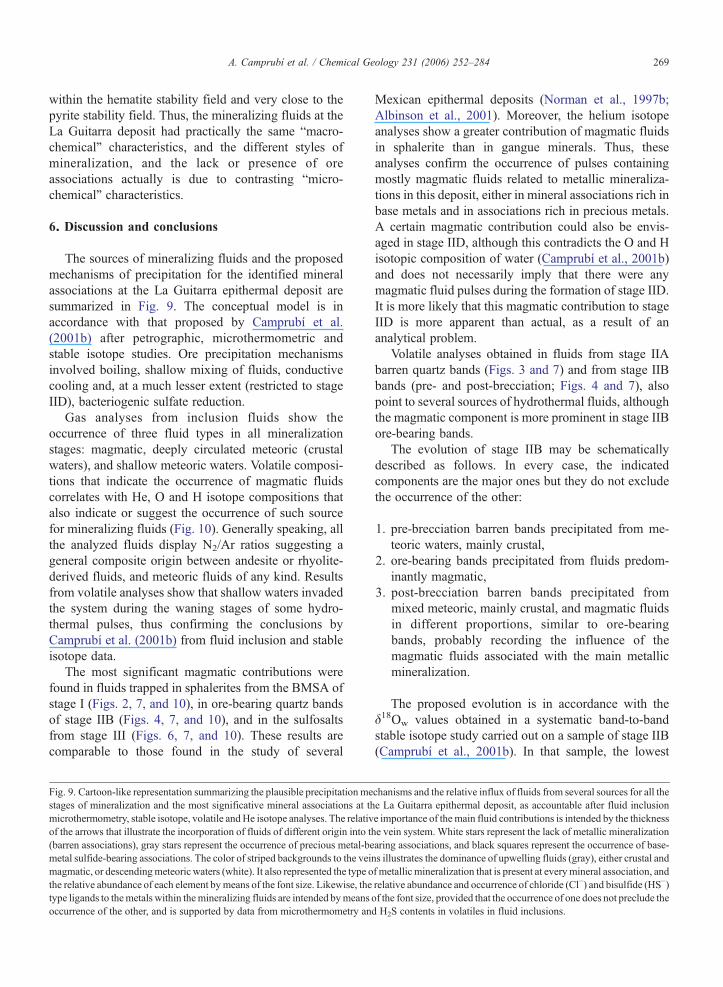
Fig. 9. Cartoon-like representation summarizing the plausible precipitation mestages of mineralization and the most significative mineral associations at thmicrothermometry, stable isotope, volatile andHe isotope analyses. The relativof the arrows that illustrate the incorporation of fluids of different origin into th(barren associations), gray stars represent the occurrence of precious metal-bemetal sulfide-bearing associations. The color of striped backgrounds to the veimagmatic, or descendingmeteoric waters (white). It also represented the type othe relative abundance of each element bymeans of the font size. Likewise, thetype ligands to themetals within themineralizing fluids are intended bymeansoccurrence of the other, and is supported by data from microthermometry an
Mexican epithermal deposits (Norman et al., 1997b;Albinson et al., 2001). Moreover, the helium isotopeanalyses show a greater contribution of magmatic fluidsin sphalerite than in gangue minerals. Thus, theseanalyses confirm the occurrence of pulses containingmostly magmatic fluids related to metallic mineraliza-tions in this deposit, either in mineral associations rich inbase metals and in associations rich in precious metals.A certain magmatic contribution could also be envis-aged in stage IID, although this contradicts the O and Hisotopic composition of water (Camprubí et al., 2001b)and does not necessarily imply that there were anymagmatic fluid pulses during the formation of stage IID.It is more likely that this magmatic contribution to stageIID is more apparent than actual, as a result of ananalytical problem.
Volatile analyses obtained in fluids from stage IIAbarren quartz bands (Figs. 3 and 7) and from stage IIBbands (pre- and post-brecciation; Figs. 4 and 7), alsopoint to several sources of hydrothermal fluids, althoughthe magmatic component is more prominent in stage IIBore-bearing bands.
The evolution of stage IIB may be schematicallydescribed as follows. In every case, the indicatedcomponents are the major ones but they do not excludethe occurrence of the other:
1. pre-brecciation barren bands precipitated from me-teoric waters, mainly crustal,
2. ore-bearing bands precipitated from fluids predom-inantly magmatic,
3. post-brecciation barren bands precipitated frommixed meteoric, mainly crustal, and magmatic fluidsin different proportions, similar to ore-bearingbands, probably recording the influence of themagmatic fluids associated with the main metallicmineralization.
The proposed evolution is in accordance with theδ18Ow values obtained in a systematic band-to-bandstable isotope study carried out on a sample of stage IIB(Camprubí et al., 2001b). In that sample, the lowest
chanisms and the relative influx of fluids from several sources for all thee La Guitarra epithermal deposit, as accountable after fluid inclusione importance of the main fluid contributions is intended by the thicknesse vein system. White stars represent the lack of metallic mineralizationaring associations, and black squares represent the occurrence of base-ns illustrates the dominance of upwelling fluids (gray), either crustal andf metallic mineralization that is present at everymineral association, andrelative abundance and occurrence of chloride (Cl−) and bisulfide (HS−)of the font size, provided that the occurrence of one does not preclude thed H2S contents in volatiles in fluid inclusions.
270 A. Camprubí et al. / Chemical Geology 231 (2006) 252–284
271A. Camprubí et al. / Chemical Geology 231 (2006) 252–284
δ18Ow value was obtained in one of the pre-brecciationbarren bands (<−2.2‰) and the highest one in theearliest ore-bearing band (+6.3‰), whilst intermediatevalues were obtained in post-brecciation barren bands.
Data obtained in inclusion fluids from stage IIIsulfosalts plot within the field of fluids recording somedegree of magmatic influence, thus confirming the resultsobtained in the stable isotope study (Camprubí et al.,2001b). Then, even assuming that mixing betweenupwelling hydrothermal fluids and shallow meteoricwaters occurred, such process was not efficient enoughas to induce the ore precipitation during stage III.Considering the specific characteristics of the minerali-zation of stage III, which is not found in the upper part ofthe deposit and is apparently confined to the deeperportions of the veins and, furthermore, lacks evidence forboiling, it is proposed that themainmechanism ofmineralprecipitation during stage III was conductive cooling.
Fig. 7 further illustrates the chemical nature ofmineralizing fluids, through the mutual correlationsbetween the H2S/SO2, CO2/CH4, and N2/Ar ratios,showing that:
1. ore-bearing associations formed after more oxidizedfluids than barren associations (H2S/SO2 vs. CO2/CH4),
2. the more oxidized fluids are, the more likely is thatthey come from a magmatic source (N2/Ar vs. H2S/SO2),
3. and ore-bearing associations formed more likely aftermagmatic fluids (N2/Ar vs. CO2/CH4).
Then, ore-bearing associations preferentially formedafter magmatic relatively oxidized fluids whereas barrenor poorly mineralized associations preferentially formedafter crustal relatively reduced fluids.
The helium isotope analyses display R/Ra valuesbetween 0.5 and 2, indicating the occurrence of amantle-derived helium component relatively diluted or“contaminated” by crustal helium. The contribution ofmagmatic fluids during the precipitation of sphalerite
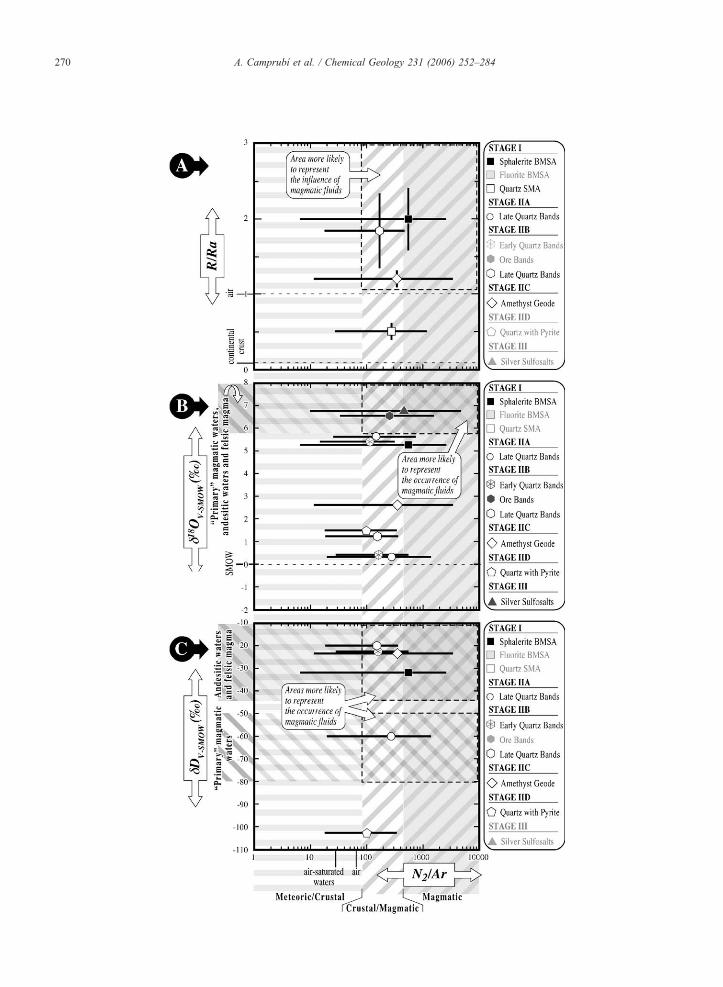
Fig. 10. Correlation diagrams between N2/Ar and (A) R/Ra, (B) δ18O, and (C)
represented O and H stable isotope values were obtained by Camprubí et al. (samples in every case. The mineral associations that are not correlated in the diwithin the diagrams represent, (1) for the N2/Ar ratios, the whole range of dstandard deviation (2σ) as reported in Table 2. The symbols used to representin the diagrams using the statistical mean value for N2/Ar ratios, although thatas an orientative value. In these correlation diagrams N2/Ar ratios = 0 were srecorded do not correspond to an actual lack, but to analytical problems insteaand H stable isotopes representing magmatic compositions come from Shepmagmatic waters, from Taylor (1992) for felsic magmatic waters, and fromwater, BMSA = base-metal sulfide association, SMA = silver mineral assoc
was higher than during the formation of barrenassociations.
Volatile and helium isotope data are consistent withthe conclusions obtained from microthermometric andstable isotope studies by Camprubí et al. (2001b), andsuggest that the precious metal-bearing associations atLa Guitarra formed after the occurrence of hydrothermalpulses that contained mostly magmatic fluids, and thus itis likely that precious metals were carried by fluids fromthat source. This does not necessarily mean that preciousmetals came from the mineralizing fluids exsolved fromcooling magmas, as these metals could have beenleached at depth by magmatic vapors that condensedand eventually mixed with upwelling magmatic brines.Minerals from base-metal sulfide associations, partic-ularly those in stage I, record both crustal andmagmatic sources for mineralizing fluids, thus sug-gesting that base metals could be derived from deepleaching of crustal rocks.
The positive correlation between an increasing contentof magmatic fluids and an increasing relative content ofH2S, similar to other Mexican epithermal deposits withsimilar mineralogical and geochemical characteristics(Albinson et al., 2001), through N2/Ar and H2S/Ar ratios,respectively, suggests that the H2S necessary to carry gold(and eventually silver) preferentially as bisulfide com-plexes mostly came frommagmatic sources. The chlorinenecessary to carry silver and base metals is relativelyabundant in inclusion fluids and there is no evidence aboutits source, although it is plausible that it may also comefrom magmatic sources, since there are no evaporites orconnate brines in the region nearby.
There is no tendency towards either the occurrence ofmore crustal, more meteoric, nor more magmatic fluids inthe formation of the La Guitarra epithermal deposit. Thisis evidence against any “linear evolution” of the paleo-hydrothermal system and, alternatively, it is evidence for apulsing hydrothermal system where each pulse or set ofpulses accounts for different compositions ofmineralizingfluids. Moreover, these pulses may account for the influxof fluids from distinct reservoirs.
δD of mineralizing fluids. The R/Ra values are listed in Table 2, and the2001b). The correlated values came from different aliquots of the sameagrams are indicated in grey in the respective key boxes. The black barsata dispersion obtained after single runs, (2) for the R/Ra values, theeach analyzed sample from a certain mineral association are positionedmean value does not have any statistical significance and it is used onlykipped, since the absence of N2 that the corresponding analytical runsd; all the analytical runs are reported in the Appendix. The ranges of Opard et al. (1969), Taylor (1974), and Sheppard (1986) for “primary”Giggenbach (1992b,c) for andesitic waters. Key: a.s.w. = air-saturatediation.
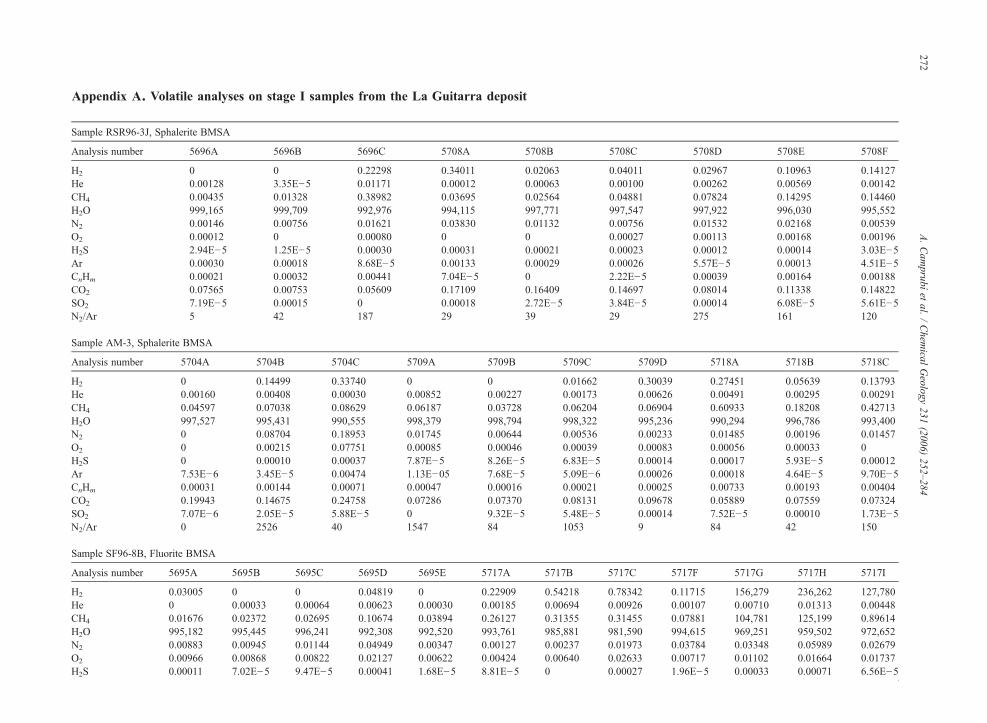
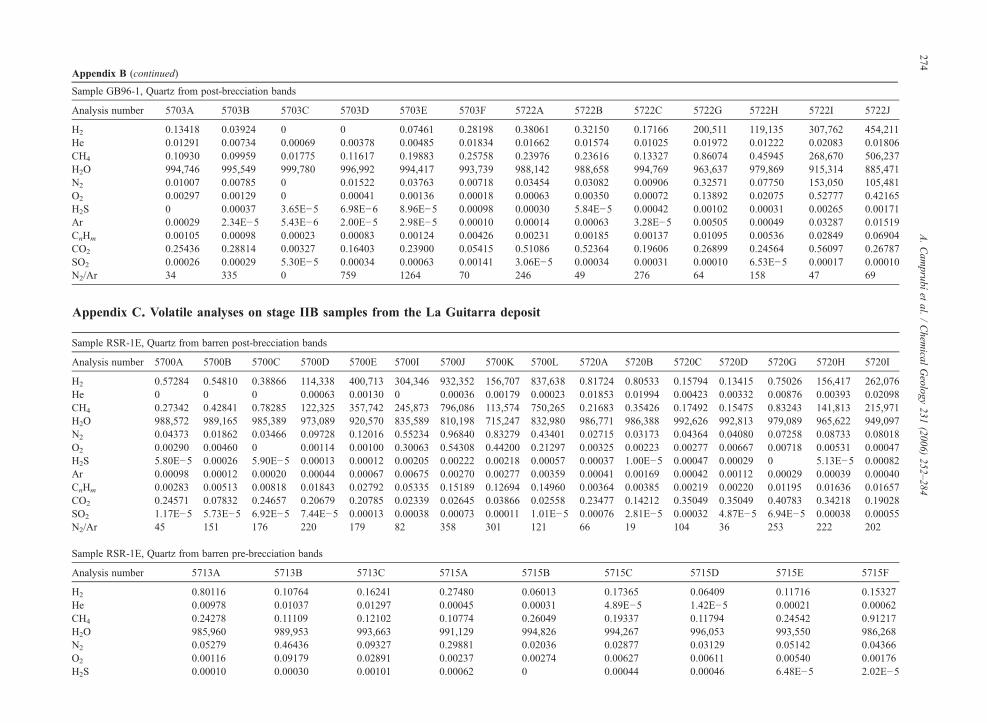
Appendix A. Volatile analyses on stage I samples from the La Guitarra deposit
Sample RSR96-3J, Sphalerite BMSA
Analysis number 5696A 5696B 5696C 5708A 5708B 5708C 5708D 5708E 5708F
H2 0 0 0.22298 0.34011 0.02063 0.04011 0.02967 0.10963 0.14127He 0.00128 3.35E−5 0.01171 0.00012 0.00063 0.00100 0.00262 0.00569 0.00142CH4 0.00435 0.01328 0.38982 0.03695 0.02564 0.04881 0.07824 0.14295 0.14460H2O 999,165 999,709 992,976 994,115 997,771 997,547 997,922 996,030 995,552N2 0.00146 0.00756 0.01621 0.03830 0.01132 0.00756 0.01532 0.02168 0.00539O2 0.00012 0 0.00080 0 0 0.00027 0.00113 0.00168 0.00196H2S 2.94E−5 1.25E−5 0.00030 0.00031 0.00021 0.00023 0.00012 0.00014 3.03E−5Ar 0.00030 0.00018 8.68E−5 0.00133 0.00029 0.00026 5.57E−5 0.00013 4.51E−5CnHm 0.00021 0.00032 0.00441 7.04E−5 0 2.22E−5 0.00039 0.00164 0.00188CO2 0.07565 0.00753 0.05609 0.17109 0.16409 0.14697 0.08014 0.11338 0.14822SO2 7.19E−5 0.00015 0 0.00018 2.72E−5 3.84E−5 0.00014 6.08E−5 5.61E−5N2/Ar 5 42 187 29 39 29 275 161 120
Sample AM-3, Sphalerite BMSA
Analysis number 5704A 5704B 5704C 5709A 5709B 5709C 5709D 5718A 5718B 5718C
H2 0 0.14499 0.33740 0 0 0.01662 0.30039 0.27451 0.05639 0.13793He 0.00160 0.00408 0.00030 0.00852 0.00227 0.00173 0.00626 0.00491 0.00295 0.00291CH4 0.04597 0.07038 0.08629 0.06187 0.03728 0.06204 0.06904 0.60933 0.18208 0.42713H2O 997,527 995,431 990,555 998,379 998,794 998,322 995,236 990,294 996,786 993,400N2 0 0.08704 0.18953 0.01745 0.00644 0.00536 0.00233 0.01485 0.00196 0.01457O2 0 0.00215 0.07751 0.00085 0.00046 0.00039 0.00083 0.00056 0.00033 0H2S 0 0.00010 0.00037 7.87E−5 8.26E−5 6.83E−5 0.00014 0.00017 5.93E−5 0.00012Ar 7.53E−6 3.45E−5 0.00474 1.13E−05 7.68E−5 5.09E−6 0.00026 0.00018 4.64E−5 9.70E−5CnHm 0.00031 0.00144 0.00071 0.00047 0.00016 0.00021 0.00025 0.00733 0.00193 0.00404CO2 0.19943 0.14675 0.24758 0.07286 0.07370 0.08131 0.09678 0.05889 0.07559 0.07324SO2 7.07E−6 2.05E−5 5.88E−5 0 9.32E−5 5.48E−5 0.00014 7.52E−5 0.00010 1.73E−5N2/Ar 0 2526 40 1547 84 1053 9 84 42 150
Sample SF96-8B, Fluorite BMSA
Analysis number 5695A 5695B 5695C 5695D 5695E 5717A 5717B 5717C 5717F 5717G 5717H 5717I
H2 0.03005 0 0 0.04819 0 0.22909 0.54218 0.78342 0.11715 156,279 236,262 127,780He 0 0.00033 0.00064 0.00623 0.00030 0.00185 0.00694 0.00926 0.00107 0.00710 0.01313 0.00448CH4 0.01676 0.02372 0.02695 0.10674 0.03894 0.26127 0.31355 0.31455 0.07881 104,781 125,199 0.89614H2O 995,182 995,445 996,241 992,308 992,520 993,761 985,881 981,590 994,615 969,251 959,502 972,652N2 0.00883 0.00945 0.01144 0.04949 0.00347 0.00127 0.00237 0.01973 0.03784 0.03348 0.05989 0.02679O2 0.00966 0.00868 0.00822 0.02127 0.00622 0.00424 0.00640 0.02633 0.00717 0.01102 0.01664 0.01737H2S 0.00011 7.02E−5 9.47E−5 0.00041 1.68E−5 8.81E−5 0 0.00027 1.96E−5 0.00033 0.00071 6.56E−5
272A.Cam
prubíet
al./Chem
icalGeology
231(2006)
252–284

Ar 0.00042 0.00010 0.00011 0.00071 0.00027 4.99E−5 9.16E−5 9.90E−5 5.91E−5 0.00044 0.00048 0.00034CnHm 0.00034 0.00053 0.00023 0.00070 0.00081 0.00208 0.00382 0.00327 0.00246 0.01817 0.01986 0.01407CO2 0.41563 0.41264 0.32818 0.53547 0.69773 0.12388 0.53623 0.68375 0.29392 0.39416 0.31497 0.49809SO2 1.86E−5 1.40E−5 0 0 0.00023 0.00019 0.00043 0.00032 1.72E−5 3.09E−5 5.35E−5 2.28E−5N2/Ar 21 92 106 69 13 25 26 199 640 77 126 79
Sample SF96-12, Quartz with bladed calcite SMA
Analysis number 5897A 5897B 5697C 5697E 5697F 5697G 5697H 5697L 5697M 5697N 5697N'
H2 0.11500 0.74569 0.09037 0.27682 0.02623 0.29089 0.14159 0.06665 0.08793 0.07580 0.37227He 0.00320 0.00841 0.00106 0.00158 0.00150 0.00188 0.00108 0.00031 0.00390 0.00065 0.00231CH4 0.10138 0.63741 0.12158 0.40428 0.10824 0.36181 0.20933 0.14031 0.19834 0.17429 0.40218H2O 992,955 980,258 995,311 990,694 996,743 991,282 994,090 995,542 994,865 995,337 989,437N2 0.05620 0.09666 0.01785 0.03190 0.00422 0.02043 0.01259 0.01213 0.02868 0.01014 0.02291O2 0.00706 0.01020 0 0.00110 0.00059 0.00162 0.00101 0.00160 0.00161 0.00091 0.00061H2S 0.00021 0.00021 0.00011 0.00010 0 8.82E−5 0.00012 1.76E−5 0.00025 9.66E−5 0.00013Ar 0.00206 0.00250 0.00033 3.05E−5 9.39E−6 0.00011 6.37E−5 5.20E−5 6.21E−5 7.10E−5 0.00019CnHm 0.00140 0.01021 0.00125 0.00465 0.00119 0.00443 0.00265 0.00216 0.00267 0.00296 0.00782CO2 0.41788 0.46279 0.23615 0.21007 0.18367 0.19055 0.22265 0.22260 0.18996 0.20144 0.24797SO2 0.00012 0.00014 0.00022 9.75E−5 6.59E−5 9.75E−5 8.01E−6 4.00E−5 9.48E−5 2.22E−5 5.58E−5N2/Ar 27 39 54 1047 450 192 198 233 462 143 122
Appendix B. Volatile analyses on stage IIA samples from the La Guitarra deposit
Sample AM-9A-3, Quartz from post-brecciation bands
Analysis number 5706A 5706B 5706C 5706D 5706E 5706F 5706J 5706K
H2 0.02279 0.11413 0.04731 0.14028 0.21047 0.01395 0 0.03562He 0.00160 0.00179 0.00134 0.00248 0.00246 0.00158 0.00216 0.00637CH4 0.03945 0.02619 0.06219 0.07047 0.06942 0.05099 0.04260 0.02663H2O 998,911 993,480 995,403 993,648 992,385 995,187 998,728 998,150N2 0.00102 0.29977 0.09468 0.03956 0.07674 0.04137 0.01593 0.01050O2 0 0.02690 0.00750 0.00391 0.00575 0.00586 0.00147 0.00150H2S 0.00016 0.00040 0.00012 0.00016 0.00063 7.94E−5 4.97E−5 5.37E−5Ar 2.25E−5 0.00226 0.00080 0.00150 0.00310 0.00099 2.16E−5 0.00023CnHm 8.34E−5 0.00070 0.00060 0.00092 0.00117 0.00044 0.00045 0.00028CO2 0.04374 0.17956 0.24510 0.37566 0.39154 0.36597 0.06445 0.10359SO2 4.89E−5 0.00026 7.65E−5 0.00028 0.00023 3.41E−5 3.35E−5 0.00025N2/Ar 45 132 118 26 25 42 738 45
(continued on next page)
273A.Cam
prubíet
al./Chem
icalGeology
231(2006)
252–284
Sample GB96-1, Quartz from post-brecciation bands
Analysis number 5703A 5703B 5703C 5703D 5703E 5703F 5722A 5722B 5722C 5722G 5722H 5722I 5722J
H2 0.13418 0.03924 0 0 0.07461 0.28198 0.38061 0.32150 0.17166 200,511 119,135 307,762 454,211He 0.01291 0.00734 0.00069 0.00378 0.00485 0.01834 0.01662 0.01574 0.01025 0.01972 0.01222 0.02083 0.01806CH4 0.10930 0.09959 0.01775 0.11617 0.19883 0.25758 0.23976 0.23616 0.13327 0.86074 0.45945 268,670 506,237H2O 994,746 995,549 999,780 996,992 994,417 993,739 988,142 988,658 994,769 963,637 979,869 915,314 885,471N2 0.01007 0.00785 0 0.01522 0.03763 0.00718 0.03454 0.03082 0.00906 0.32571 0.07750 153,050 105,481O2 0.00297 0.00129 0 0.00041 0.00136 0.00018 0.00063 0.00350 0.00072 0.13892 0.02075 0.52777 0.42165H2S 0 0.00037 3.65E−5 6.98E−6 8.96E−5 0.00098 0.00030 5.84E−5 0.00042 0.00102 0.00031 0.00265 0.00171Ar 0.00029 2.34E−5 5.43E−6 2.00E−5 2.98E−5 0.00010 0.00014 0.00063 3.28E−5 0.00505 0.00049 0.03287 0.01519CnHm 0.00105 0.00098 0.00023 0.00083 0.00124 0.00426 0.00231 0.00185 0.00137 0.01095 0.00536 0.02849 0.06904CO2 0.25436 0.28814 0.00327 0.16403 0.23900 0.05415 0.51086 0.52364 0.19606 0.26899 0.24564 0.56097 0.26787SO2 0.00026 0.00029 5.30E−5 0.00034 0.00063 0.00141 3.06E−5 0.00034 0.00031 0.00010 6.53E−5 0.00017 0.00010N2/Ar 34 335 0 759 1264 70 246 49 276 64 158 47 69
Appendix C. Volatile analyses on stage IIB samples from the La Guitarra deposit
Sample RSR-1E, Quartz from barren post-brecciation bands
Analysis number 5700A 5700B 5700C 5700D 5700E 5700I 5700J 5700K 5700L 5720A 5720B 5720C 5720D 5720G 5720H 5720I
H2 0.57284 0.54810 0.38866 114,338 400,713 304,346 932,352 156,707 837,638 0.81724 0.80533 0.15794 0.13415 0.75026 156,417 262,076He 0 0 0 0.00063 0.00130 0 0.00036 0.00179 0.00023 0.01853 0.01994 0.00423 0.00332 0.00876 0.00393 0.02098CH4 0.27342 0.42841 0.78285 122,325 357,742 245,873 796,086 113,574 750,265 0.21683 0.35426 0.17492 0.15475 0.83243 141,813 215,971H2O 988,572 989,165 985,389 973,089 920,570 835,589 810,198 715,247 832,980 986,771 986,388 992,626 992,813 979,089 965,622 949,097N2 0.04373 0.01862 0.03466 0.09728 0.12016 0.55234 0.96840 0.83279 0.43401 0.02715 0.03173 0.04364 0.04080 0.07258 0.08733 0.08018O2 0.00290 0.00460 0 0.00114 0.00100 0.30063 0.54308 0.44200 0.21297 0.00325 0.00223 0.00277 0.00667 0.00718 0.00531 0.00047H2S 5.80E−5 0.00026 5.90E−5 0.00013 0.00012 0.00205 0.00222 0.00218 0.00057 0.00037 1.00E−5 0.00047 0.00029 0 5.13E−5 0.00082Ar 0.00098 0.00012 0.00020 0.00044 0.00067 0.00675 0.00270 0.00277 0.00359 0.00041 0.00169 0.00042 0.00112 0.00029 0.00039 0.00040CnHm 0.00283 0.00513 0.00818 0.01843 0.02792 0.05335 0.15189 0.12694 0.14960 0.00364 0.00385 0.00219 0.00220 0.01195 0.01636 0.01657CO2 0.24571 0.07832 0.24657 0.20679 0.20785 0.02339 0.02645 0.03866 0.02558 0.23477 0.14212 0.35049 0.35049 0.40783 0.34218 0.19028SO2 1.17E−5 5.73E−5 6.92E−5 7.44E−5 0.00013 0.00038 0.00073 0.00011 1.01E−5 0.00076 2.81E−5 0.00032 4.87E−5 6.94E−5 0.00038 0.00055N2/Ar 45 151 176 220 179 82 358 301 121 66 19 104 36 253 222 202
Sample RSR-1E, Quartz from barren pre-brecciation bands
Analysis number 5713A 5713B 5713C 5715A 5715B 5715C 5715D 5715E 5715F
H2 0.80116 0.10764 0.16241 0.27480 0.06013 0.17365 0.06409 0.11716 0.15327He 0.00978 0.01037 0.01297 0.00045 0.00031 4.89E−5 1.42E−5 0.00021 0.00062CH4 0.24278 0.11109 0.12102 0.10774 0.26049 0.19337 0.11794 0.24542 0.91217H2O 985,960 989,953 993,663 991,129 994,826 994,267 996,053 993,550 986,268N2 0.05279 0.46436 0.09327 0.29881 0.02036 0.02877 0.03129 0.05142 0.04366O2 0.00116 0.09179 0.02891 0.00237 0.00274 0.00627 0.00611 0.00540 0.00176H2S 0.00010 0.00030 0.00101 0.00062 0 0.00044 0.00046 6.48E−5 2.02E−5
Appendix B (continued)274
A.Cam
prubíet
al./Chem
icalGeology
231(2006)
252–284
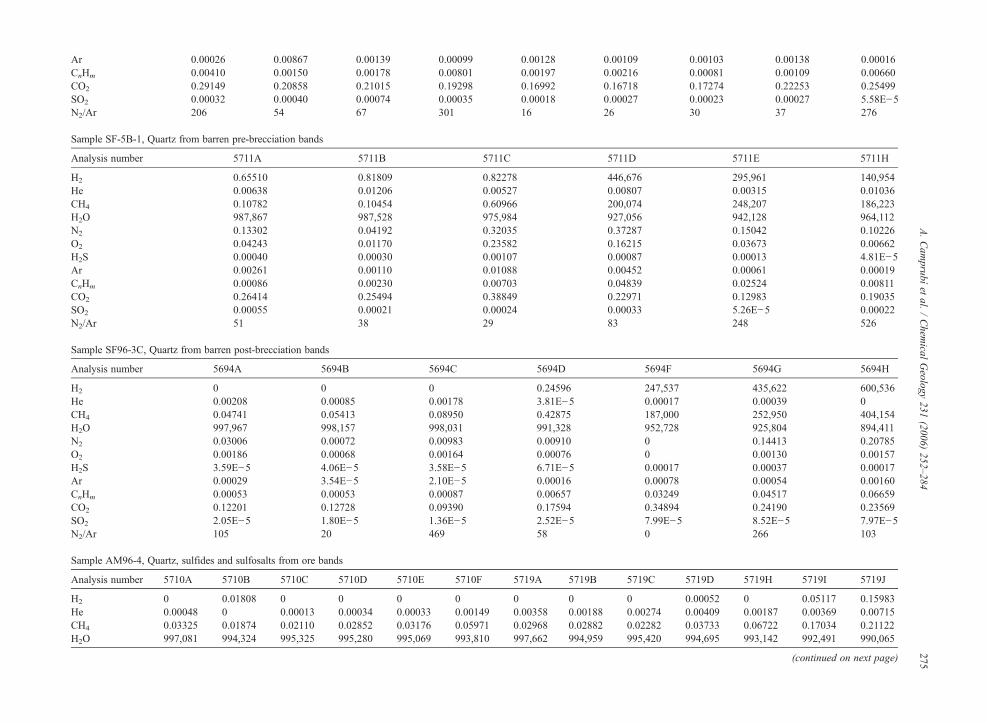
Ar 0.00026 0.00867 0.00139 0.00099 0.00128 0.00109 0.00103 0.00138 0.00016CnHm 0.00410 0.00150 0.00178 0.00801 0.00197 0.00216 0.00081 0.00109 0.00660CO2 0.29149 0.20858 0.21015 0.19298 0.16992 0.16718 0.17274 0.22253 0.25499SO2 0.00032 0.00040 0.00074 0.00035 0.00018 0.00027 0.00023 0.00027 5.58E−5N2/Ar 206 54 67 301 16 26 30 37 276
Sample SF-5B-1, Quartz from barren pre-brecciation bands
Analysis number 5711A 5711B 5711C 5711D 5711E 5711H
H2 0.65510 0.81809 0.82278 446,676 295,961 140,954He 0.00638 0.01206 0.00527 0.00807 0.00315 0.01036CH4 0.10782 0.10454 0.60966 200,074 248,207 186,223H2O 987,867 987,528 975,984 927,056 942,128 964,112N2 0.13302 0.04192 0.32035 0.37287 0.15042 0.10226O2 0.04243 0.01170 0.23582 0.16215 0.03673 0.00662H2S 0.00040 0.00030 0.00107 0.00087 0.00013 4.81E−5Ar 0.00261 0.00110 0.01088 0.00452 0.00061 0.00019CnHm 0.00086 0.00230 0.00703 0.04839 0.02524 0.00811CO2 0.26414 0.25494 0.38849 0.22971 0.12983 0.19035SO2 0.00055 0.00021 0.00024 0.00033 5.26E−5 0.00022N2/Ar 51 38 29 83 248 526
Sample SF96-3C, Quartz from barren post-brecciation bands
Analysis number 5694A 5694B 5694C 5694D 5694F 5694G 5694H
H2 0 0 0 0.24596 247,537 435,622 600,536He 0.00208 0.00085 0.00178 3.81E−5 0.00017 0.00039 0CH4 0.04741 0.05413 0.08950 0.42875 187,000 252,950 404,154H2O 997,967 998,157 998,031 991,328 952,728 925,804 894,411N2 0.03006 0.00072 0.00983 0.00910 0 0.14413 0.20785O2 0.00186 0.00068 0.00164 0.00076 0 0.00130 0.00157H2S 3.59E−5 4.06E−5 3.58E−5 6.71E−5 0.00017 0.00037 0.00017Ar 0.00029 3.54E−5 2.10E−5 0.00016 0.00078 0.00054 0.00160CnHm 0.00053 0.00053 0.00087 0.00657 0.03249 0.04517 0.06659CO2 0.12201 0.12728 0.09390 0.17594 0.34894 0.24190 0.23569SO2 2.05E−5 1.80E−5 1.36E−5 2.52E−5 7.99E−5 8.52E−5 7.97E−5N2/Ar 105 20 469 58 0 266 103
Sample AM96-4, Quartz, sulfides and sulfosalts from ore bands
Analysis number 5710A 5710B 5710C 5710D 5710E 5710F 5719A 5719B 5719C 5719D 5719H 5719I 5719J
H2 0 0.01808 0 0 0 0 0 0 0 0.00052 0 0.05117 0.15983He 0.00048 0 0.00013 0.00034 0.00033 0.00149 0.00358 0.00188 0.00274 0.00409 0.00187 0.00369 0.00715CH4 0.03325 0.01874 0.02110 0.02852 0.03176 0.05971 0.02968 0.02882 0.02282 0.03733 0.06722 0.17034 0.21122H2O 997,081 994,324 995,325 995,280 995,069 993,810 997,662 994,959 995,420 994,695 993,142 992,491 990,065
(continued on next page)
275A.Cam
prubíet
al./Chem
icalGeology
231(2006)
252–284
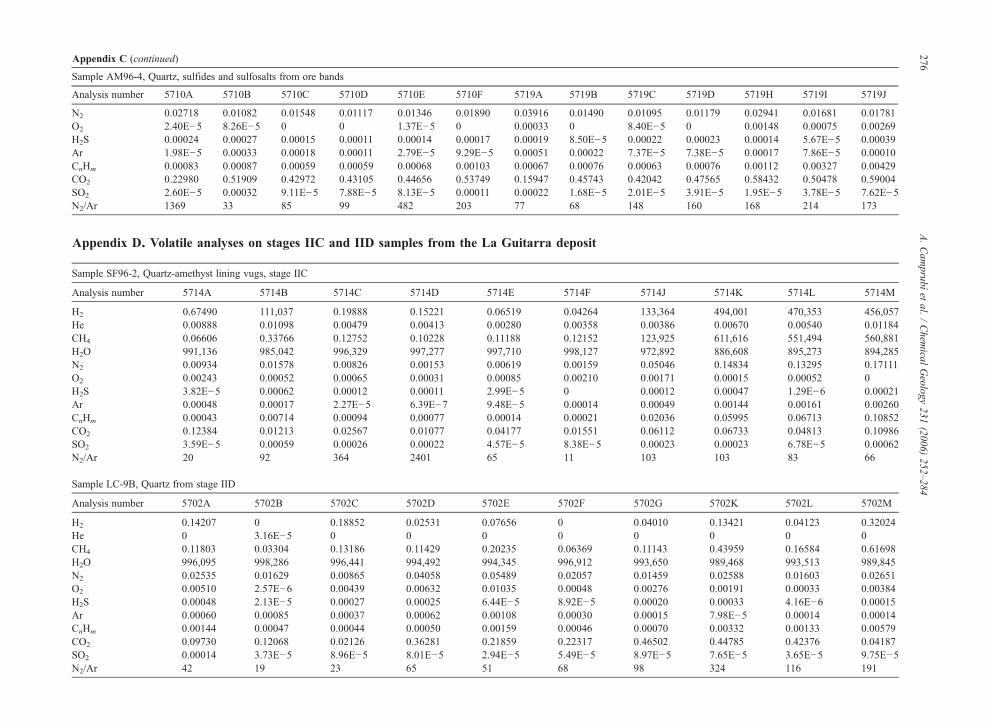
Appendix C (continued)
Sample AM96-4, Quartz, sulfides and sulfosalts from ore bands
Analysis number 5710A 5710B 5710C 5710D 5710E 5710F 5719A 5719B 5719C 5719D 5719H 5719I 5719J
N2 0.02718 0.01082 0.01548 0.01117 0.01346 0.01890 0.03916 0.01490 0.01095 0.01179 0.02941 0.01681 0.01781O2 2.40E−5 8.26E−5 0 0 1.37E−5 0 0.00033 0 8.40E−5 0 0.00148 0.00075 0.00269H2S 0.00024 0.00027 0.00015 0.00011 0.00014 0.00017 0.00019 8.50E−5 0.00022 0.00023 0.00014 5.67E−5 0.00039Ar 1.98E−5 0.00033 0.00018 0.00011 2.79E−5 9.29E−5 0.00051 0.00022 7.37E−5 7.38E−5 0.00017 7.86E−5 0.00010CnHm 0.00083 0.00087 0.00059 0.00059 0.00068 0.00103 0.00067 0.00076 0.00063 0.00076 0.00112 0.00327 0.00429CO2 0.22980 0.51909 0.42972 0.43105 0.44656 0.53749 0.15947 0.45743 0.42042 0.47565 0.58432 0.50478 0.59004SO2 2.60E−5 0.00032 9.11E−5 7.88E−5 8.13E−5 0.00011 0.00022 1.68E−5 2.01E−5 3.91E−5 1.95E−5 3.78E−5 7.62E−5N2/Ar 1369 33 85 99 482 203 77 68 148 160 168 214 173
Appendix D. Volatile analyses on stages IIC and IID samples from the La Guitarra deposit
Sample SF96-2, Quartz-amethyst lining vugs, stage IIC
Analysis number 5714A 5714B 5714C 5714D 5714E 5714F 5714J 5714K 5714L 5714M
H2 0.67490 111,037 0.19888 0.15221 0.06519 0.04264 133,364 494,001 470,353 456,057He 0.00888 0.01098 0.00479 0.00413 0.00280 0.00358 0.00386 0.00670 0.00540 0.01184CH4 0.06606 0.33766 0.12752 0.10228 0.11188 0.12152 123,925 611,616 551,494 560,881H2O 991,136 985,042 996,329 997,277 997,710 998,127 972,892 886,608 895,273 894,285N2 0.00934 0.01578 0.00826 0.00153 0.00619 0.00159 0.05046 0.14834 0.13295 0.17111O2 0.00243 0.00052 0.00065 0.00031 0.00085 0.00210 0.00171 0.00015 0.00052 0H2S 3.82E−5 0.00062 0.00012 0.00011 2.99E−5 0 0.00012 0.00047 1.29E−6 0.00021Ar 0.00048 0.00017 2.27E−5 6.39E−7 9.48E−5 0.00014 0.00049 0.00144 0.00161 0.00260CnHm 0.00043 0.00714 0.00094 0.00077 0.00014 0.00021 0.02036 0.05995 0.06713 0.10852CO2 0.12384 0.01213 0.02567 0.01077 0.04177 0.01551 0.06112 0.06733 0.04813 0.10986SO2 3.59E−5 0.00059 0.00026 0.00022 4.57E−5 8.38E−5 0.00023 0.00023 6.78E−5 0.00062N2/Ar 20 92 364 2401 65 11 103 103 83 66
Sample LC-9B, Quartz from stage IID
Analysis number 5702A 5702B 5702C 5702D 5702E 5702F 5702G 5702K 5702L 5702M
H2 0.14207 0 0.18852 0.02531 0.07656 0 0.04010 0.13421 0.04123 0.32024He 0 3.16E−5 0 0 0 0 0 0 0 0CH4 0.11803 0.03304 0.13186 0.11429 0.20235 0.06369 0.11143 0.43959 0.16584 0.61698H2O 996,095 998,286 996,441 994,492 994,345 996,912 993,650 989,468 993,513 989,845N2 0.02535 0.01629 0.00865 0.04058 0.05489 0.02057 0.01459 0.02588 0.01603 0.02651O2 0.00510 2.57E−6 0.00439 0.00632 0.01035 0.00048 0.00276 0.00191 0.00033 0.00384H2S 0.00048 2.13E−5 0.00027 0.00025 6.44E−5 8.92E−5 0.00020 0.00033 4.16E−6 0.00015Ar 0.00060 0.00085 0.00037 0.00062 0.00108 0.00030 0.00015 7.98E−5 0.00014 0.00014CnHm 0.00144 0.00047 0.00044 0.00050 0.00159 0.00046 0.00070 0.00332 0.00133 0.00579CO2 0.09730 0.12068 0.02126 0.36281 0.21859 0.22317 0.46502 0.44785 0.42376 0.04187SO2 0.00014 3.73E−5 8.96E−5 8.01E−5 2.94E−5 5.49E−5 8.97E−5 7.65E−5 3.65E−5 9.75E−5N2/Ar 42 19 23 65 51 68 98 324 116 191
276A.Cam
prubíet
al./Chem
icalGeology
231(2006)
252–284
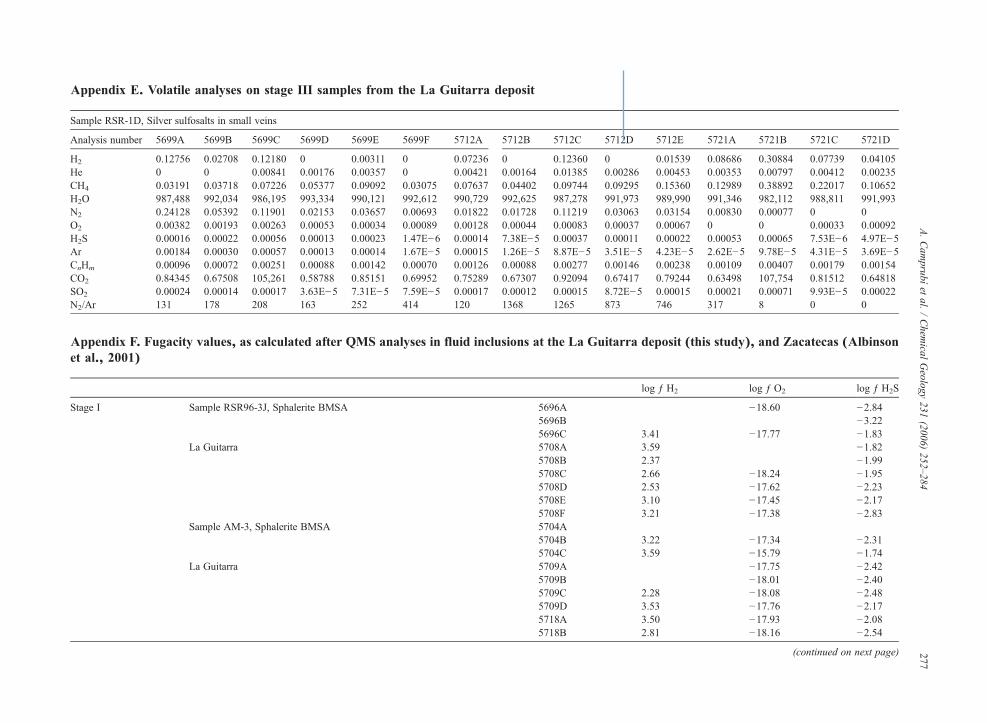
Appendix E. Volatile analyses on stage III samples from the La Guitarra deposit
Sample RSR-1D, Silver sulfosalts in small veins
Analysis number 5699A 5699B 5699C 5699D 5699E 5699F 5712A 5712B 5712C 5712D 5712E 5721A 5721B 5721C 5721D
H2 0.12756 0.02708 0.12180 0 0.00311 0 0.07236 0 0.12360 0 0.01539 0.08686 0.30884 0.07739 0.04105He 0 0 0.00841 0.00176 0.00357 0 0.00421 0.00164 0.01385 0.00286 0.00453 0.00353 0.00797 0.00412 0.00235CH4 0.03191 0.03718 0.07226 0.05377 0.09092 0.03075 0.07637 0.04402 0.09744 0.09295 0.15360 0.12989 0.38892 0.22017 0.10652H2O 987,488 992,034 986,195 993,334 990,121 992,612 990,729 992,625 987,278 991,973 989,990 991,346 982,112 988,811 991,993N2 0.24128 0.05392 0.11901 0.02153 0.03657 0.00693 0.01822 0.01728 0.11219 0.03063 0.03154 0.00830 0.00077 0 0O2 0.00382 0.00193 0.00263 0.00053 0.00034 0.00089 0.00128 0.00044 0.00083 0.00037 0.00067 0 0 0.00033 0.00092H2S 0.00016 0.00022 0.00056 0.00013 0.00023 1.47E−6 0.00014 7.38E−5 0.00037 0.00011 0.00022 0.00053 0.00065 7.53E−6 4.97E−5Ar 0.00184 0.00030 0.00057 0.00013 0.00014 1.67E−5 0.00015 1.26E−5 8.87E−5 3.51E−5 4.23E−5 2.62E−5 9.78E−5 4.31E−5 3.69E−5CnHm 0.00096 0.00072 0.00251 0.00088 0.00142 0.00070 0.00126 0.00088 0.00277 0.00146 0.00238 0.00109 0.00407 0.00179 0.00154CO2 0.84345 0.67508 105,261 0.58788 0.85151 0.69952 0.75289 0.67307 0.92094 0.67417 0.79244 0.63498 107,754 0.81512 0.64818SO2 0.00024 0.00014 0.00017 3.63E−5 7.31E−5 7.59E−5 0.00017 0.00012 0.00015 8.72E−5 0.00015 0.00021 0.00071 9.93E−5 0.00022N2/Ar 131 178 208 163 252 414 120 1368 1265 873 746 317 8 0 0
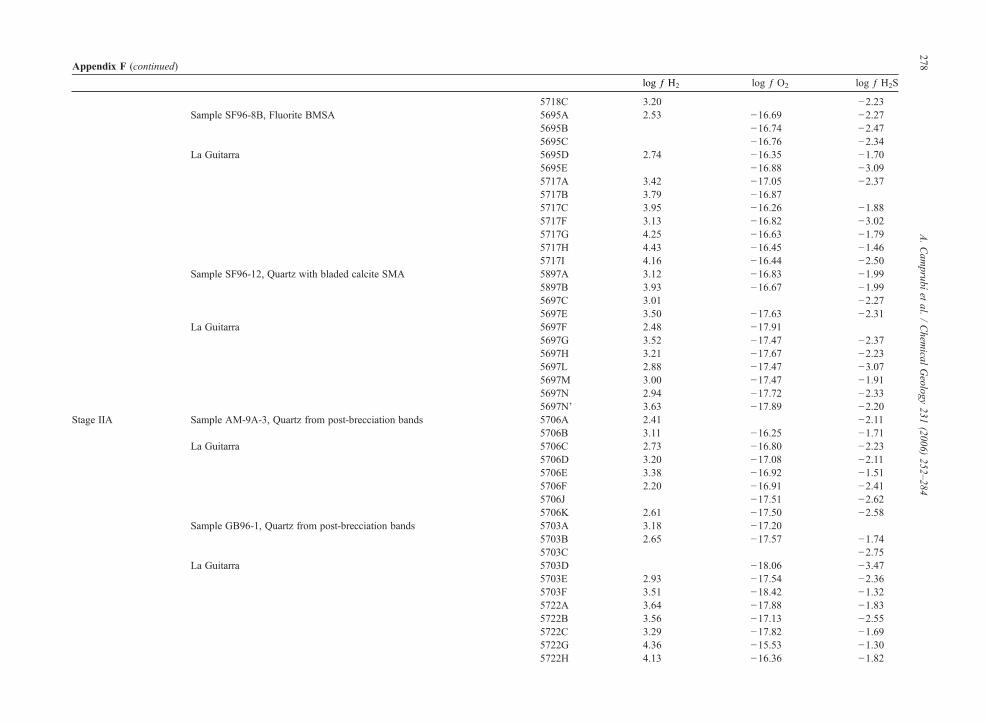
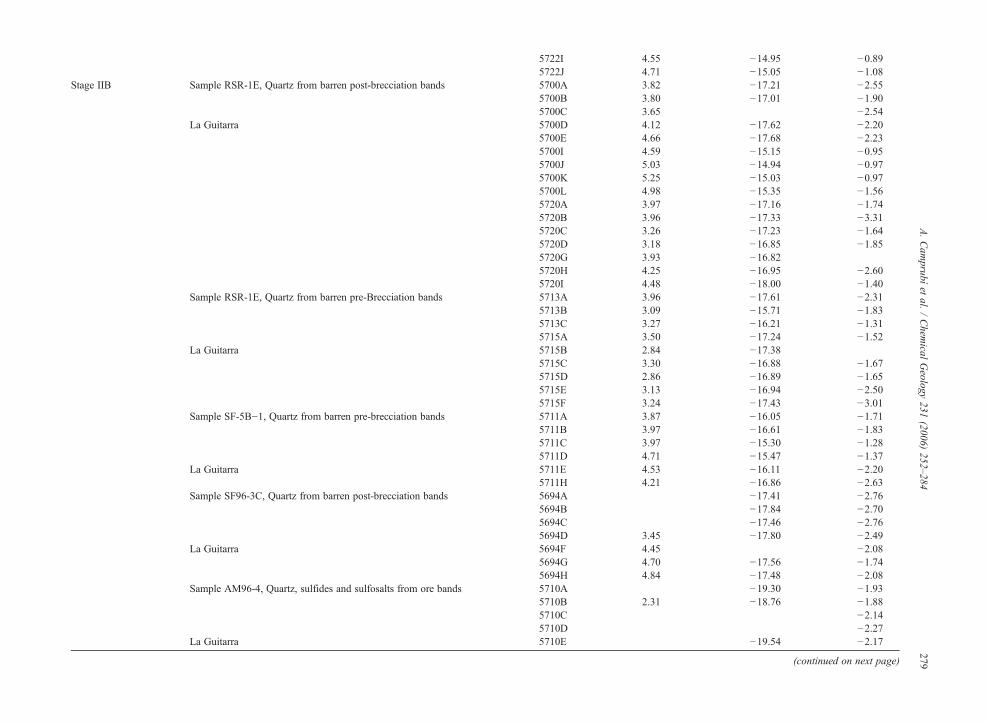
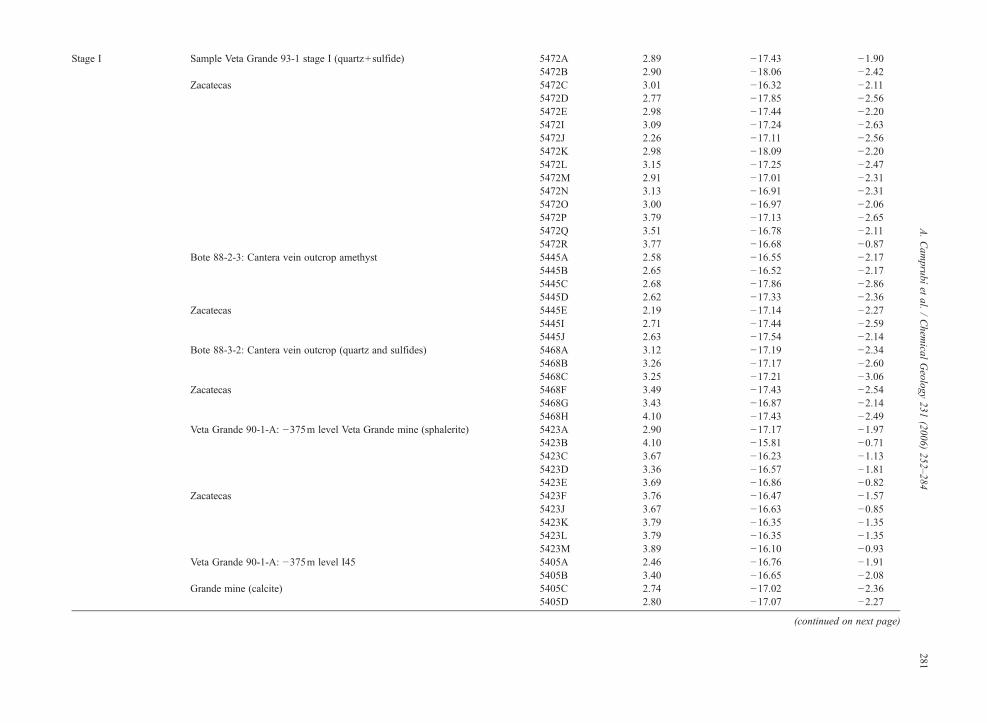
Appendix F. Fugacity values, as calculated after QMS analyses in fluid inclusions at the La Guitarra deposit (this study), and Zacatecas (Albinsonet al., 2001)
log ƒ H2 log ƒ O2 log ƒ H2S
Stage I Sample RSR96-3J, Sphalerite BMSA 5696A −18.60 −2.845696B −3.225696C 3.41 −17.77 −1.83
La Guitarra 5708A 3.59 −1.825708B 2.37 −1.995708C 2.66 −18.24 −1.955708D 2.53 −17.62 −2.235708E 3.10 −17.45 −2.175708F 3.21 −17.38 −2.83
Sample AM-3, Sphalerite BMSA 5704A5704B 3.22 −17.34 −2.315704C 3.59 −15.79 −1.74
La Guitarra 5709A −17.75 −2.425709B −18.01 −2.405709C 2.28 −18.08 −2.485709D 3.53 −17.76 −2.175718A 3.50 −17.93 −2.085718B 2.81 −18.16 −2.54
(continued on next page) 277A.Cam
prubíet
al./Chem
icalGeology
231(2006)
252–284
5718C 3.20 −2.23Sample SF96-8B, Fluorite BMSA 5695A 2.53 −16.69 −2.27
5695B −16.74 −2.475695C −16.76 −2.34
La Guitarra 5695D 2.74 −16.35 −1.705695E −16.88 −3.095717A 3.42 −17.05 −2.375717B 3.79 −16.875717C 3.95 −16.26 −1.885717F 3.13 −16.82 −3.025717G 4.25 −16.63 −1.795717H 4.43 −16.45 −1.465717I 4.16 −16.44 −2.50
Sample SF96-12, Quartz with bladed calcite SMA 5897A 3.12 −16.83 −1.995897B 3.93 −16.67 −1.995697C 3.01 −2.275697E 3.50 −17.63 −2.31
La Guitarra 5697F 2.48 −17.915697G 3.52 −17.47 −2.375697H 3.21 −17.67 −2.235697L 2.88 −17.47 −3.075697M 3.00 −17.47 −1.915697N 2.94 −17.72 −2.335697N' 3.63 −17.89 −2.20
Stage IIA Sample AM-9A-3, Quartz from post-brecciation bands 5706A 2.41 −2.115706B 3.11 −16.25 −1.71
La Guitarra 5706C 2.73 −16.80 −2.235706D 3.20 −17.08 −2.115706E 3.38 −16.92 −1.515706F 2.20 −16.91 −2.415706J −17.51 −2.625706K 2.61 −17.50 −2.58
Sample GB96-1, Quartz from post-brecciation bands 5703A 3.18 −17.205703B 2.65 −17.57 −1.745703C −2.75
La Guitarra 5703D −18.06 −3.475703E 2.93 −17.54 −2.365703F 3.51 −18.42 −1.325722A 3.64 −17.88 −1.835722B 3.56 −17.13 −2.555722C 3.29 −17.82 −1.695722G 4.36 −15.53 −1.305722H 4.13 −16.36 −1.82
Appendix F (continued)
log ƒ H2 log ƒ O2 log ƒ H2S
278A.Cam
prubíet
al./Chem
icalGeology
231(2006)
252–284
5722I 4.55 −14.95 −0.895722J 4.71 −15.05 −1.08
Stage IIB Sample RSR-1E, Quartz from barren post-brecciation bands 5700A 3.82 −17.21 −2.555700B 3.80 −17.01 −1.905700C 3.65 −2.54
La Guitarra 5700D 4.12 −17.62 −2.205700E 4.66 −17.68 −2.235700I 4.59 −15.15 −0.955700J 5.03 −14.94 −0.975700K 5.25 −15.03 −0.975700L 4.98 −15.35 −1.565720A 3.97 −17.16 −1.745720B 3.96 −17.33 −3.315720C 3.26 −17.23 −1.645720D 3.18 −16.85 −1.855720G 3.93 −16.825720H 4.25 −16.95 −2.605720I 4.48 −18.00 −1.40
Sample RSR-1E, Quartz from barren pre-Brecciation bands 5713A 3.96 −17.61 −2.315713B 3.09 −15.71 −1.835713C 3.27 −16.21 −1.315715A 3.50 −17.24 −1.52
La Guitarra 5715B 2.84 −17.385715C 3.30 −16.88 −1.675715D 2.86 −16.89 −1.655715E 3.13 −16.94 −2.505715F 3.24 −17.43 −3.01
Sample SF-5B−1, Quartz from barren pre-brecciation bands 5711A 3.87 −16.05 −1.715711B 3.97 −16.61 −1.835711C 3.97 −15.30 −1.285711D 4.71 −15.47 −1.37
La Guitarra 5711E 4.53 −16.11 −2.205711H 4.21 −16.86 −2.63
Sample SF96-3C, Quartz from barren post-brecciation bands 5694A −17.41 −2.765694B −17.84 −2.705694C −17.46 −2.765694D 3.45 −17.80 −2.49
La Guitarra 5694F 4.45 −2.085694G 4.70 −17.56 −1.745694H 4.84 −17.48 −2.08
Sample AM96-4, Quartz, sulfides and sulfosalts from ore bands 5710A −19.30 −1.935710B 2.31 −18.76 −1.885710C −2.145710D −2.27
La Guitarra 5710E −19.54 −2.17
(continued on next page)
279A.Cam
prubíet
al./Chem
icalGeology
231(2006)
252–284

5710F −2.085719A −18.16 −2.035719B −2.385719C −18.75 −1.975719D 0.77 −1.955719H −17.51 −2.175719I 2.77 −17.80 −2.565719J 3.26 −17.25 −1.72
Stage IICD Sample SF96-2, Quartz−amethyst lining vugs, stage IIC 5714A 3.89 −17.29 −2.735714B 4.10 −17.96 −1.52
La Guitarra 5714C 3.36 −17.86 −2.235714D 3.24 −18.18 −2.275714E 2.87 −17.75 −2.845714F 2.69 −17.355714J 4.18 −17.44 −2.235714K 4.75 −18.50 −1.645714L 4.73 −17.96 −4.205714M 4.72 −1.99
Sample LC-9B, Quartz from stage IID 5702A 3.21 −16.97 −1.635702B −20.27 −2.985702C 3.33 −17.03 −1.88
La Guitarra 5702D 2.46 −16.88 −1.915702E 2.94 −16.66 −2.505702F −17.99 −2.365702G 2.66 −17.24 −2.015702K 3.18 −17.39 −1.795702L 2.67 −18.16 −3.695702M 3.56 −17.09 −2.14
Stage III Sample RSR-1D, Silver sulfosalts in small veins 5699A 3.16 −17.09 −2.115699B 2.49 −17.39 −1.97
La Guitarra 5699C 3.14 −17.26 −1.565699D −17.95 −2.205699E 1.55 −18.14 −1.955699F −17.73 −4.145712A 2.92 −17.57 −2.175712B −18.03 −2.445712C 3.15 −17.76 −1.745712D −18.11 −2.275712E 2.24 −17.85 −1.975721A 3.00 −1.595721B 3.55 −1.505721C 2.95 −18.16 −3.445721D 2.67 −17.71 −2.62
Appendix F (continued)
log ƒ H2 log ƒ O2 log ƒ H2S
280A.Cam
prubíet
al./Chem
icalGeology
231(2006)
252–284
Stage I Sample Veta Grande 93-1 stage I (quartz+sulfide) 5472A 2.89 −17.43 −1.905472B 2.90 −18.06 −2.42
Zacatecas 5472C 3.01 −16.32 −2.115472D 2.77 −17.85 −2.565472E 2.98 −17.44 −2.205472I 3.09 −17.24 −2.635472J 2.26 −17.11 −2.565472K 2.98 −18.09 −2.205472L 3.15 −17.25 −2.475472M 2.91 −17.01 −2.315472N 3.13 −16.91 −2.315472O 3.00 −16.97 −2.065472P 3.79 −17.13 −2.655472Q 3.51 −16.78 −2.115472R 3.77 −16.68 −0.87
Bote 88-2-3: Cantera vein outcrop amethyst 5445A 2.58 −16.55 −2.175445B 2.65 −16.52 −2.175445C 2.68 −17.86 −2.865445D 2.62 −17.33 −2.36
Zacatecas 5445E 2.19 −17.14 −2.275445I 2.71 −17.44 −2.595445J 2.63 −17.54 −2.14
Bote 88-3-2: Cantera vein outcrop (quartz and sulfides) 5468A 3.12 −17.19 −2.345468B 3.26 −17.17 −2.605468C 3.25 −17.21 −3.06
Zacatecas 5468F 3.49 −17.43 −2.545468G 3.43 −16.87 −2.145468H 4.10 −17.43 −2.49
Veta Grande 90-1-A: −375m level Veta Grande mine (sphalerite) 5423A 2.90 −17.17 −1.975423B 4.10 −15.81 −0.715423C 3.67 −16.23 −1.135423D 3.36 −16.57 −1.815423E 3.69 −16.86 −0.82
Zacatecas 5423F 3.76 −16.47 −1.575423J 3.67 −16.63 −0.855423K 3.79 −16.35 −1.355423L 3.79 −16.35 −1.355423M 3.89 −16.10 −0.93
Veta Grande 90-1-A: −375m level I45 5405A 2.46 −16.76 −1.915405B 3.40 −16.65 −2.08
Grande mine (calcite) 5405C 2.74 −17.02 −2.365405D 2.80 −17.07 −2.27
(continued on next page)
281A.Cam
prubíet
al./Chem
icalGeology
231(2006)
252–284
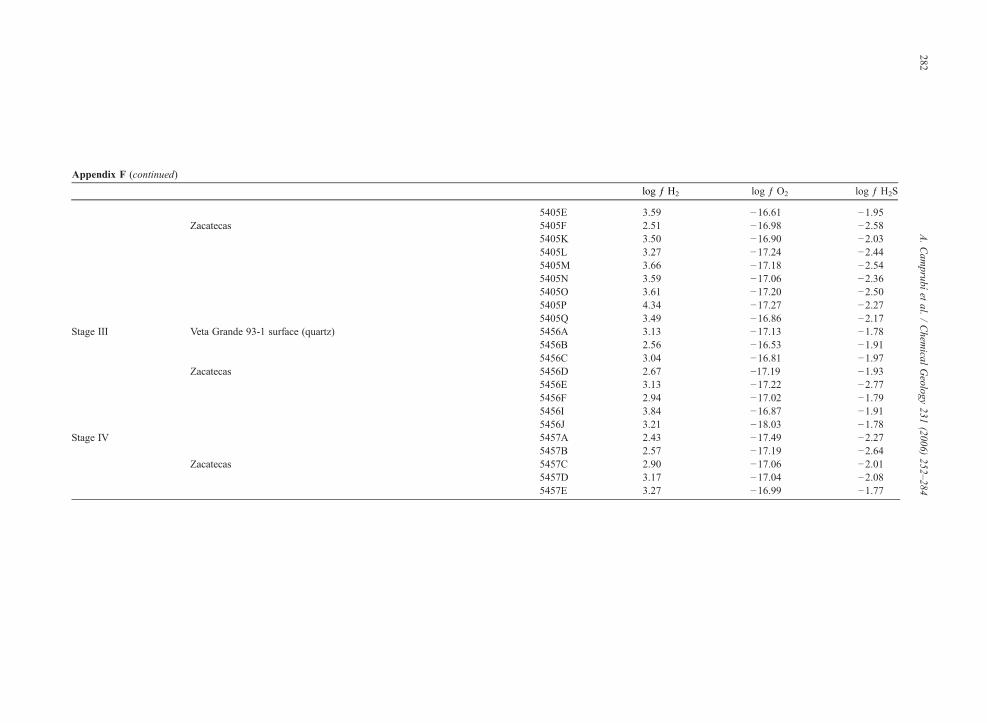
5405E 3.59 −16.61 −1.95Zacatecas 5405F 2.51 −16.98 −2.58
5405K 3.50 −16.90 −2.035405L 3.27 −17.24 −2.445405M 3.66 −17.18 −2.545405N 3.59 −17.06 −2.365405O 3.61 −17.20 −2.505405P 4.34 −17.27 −2.275405Q 3.49 −16.86 −2.17
Stage III Veta Grande 93-1 surface (quartz) 5456A 3.13 −17.13 −1.785456B 2.56 −16.53 −1.915456C 3.04 −16.81 −1.97
Zacatecas 5456D 2.67 −17.19 −1.935456E 3.13 −17.22 −2.775456F 2.94 −17.02 −1.795456I 3.84 −16.87 −1.915456J 3.21 −18.03 −1.78
Stage IV 5457A 2.43 −17.49 −2.275457B 2.57 −17.19 −2.64
Zacatecas 5457C 2.90 −17.06 −2.015457D 3.17 −17.04 −2.085457E 3.27 −16.99 −1.77
Appendix F (continued)
log ƒ H2 log ƒ O2 log ƒ H2S
282A.Cam
prubíet
al./Chem
icalGeology
231(2006)
252–284
283A. Camprubí et al. / Chemical Geology 231 (2006) 252–284
Acknowledgements
Most of this paper and the conclusions therein arepart of the Ph.D. research of A. Camprubí. Financialsupport for this study was initially received from theEuropean Union Research Fund through contractcI1⁎-ct94-0075 (dg 12 hsmu). Further support wasreceived through Mexico funded projects J32506-Tand 46473-F (CONACyT) and IN122604 (PAPIIT-DGAPA). Logistic assistance during field work wasprovided by the mining company formerly known asLuismin S.A. de C.V., fundamentally through RománTorres, Ricardo Flores and Jesús Rosales and thestaff at Temascaltepec (1995–1998). A. Camprubíalso thanks Robert Nartey for his hospitality atSocorro during the QMS analyses. Some QMS runswere actually assisted by Erika Maschmeyer. RosaM. Prol-Ledesma kindly assisted us in this paper andfrom the very beginning of our research, and herhelp has been fundamental during the last stages ofthe elaboration of this manuscript. The manuscripthas also greatly benefited from the critical reviewsand suggestions of two anonymous referees, and ananonymous editor. [DR]
References
Aiken, C.L.V., Schellhorn, R.W., de la Fuente, M.F., 1988. Gravity ofnorthern Mexico. In: Clark, K.F., Goodell, P.C., Hoffer, J.M.(Eds.), Stratigraphy, Tectonics, and Resources of Parts of SierraMadre Occidental Province. El Paso Geological Society, FieldConference Guidebook, pp. 119–133.
Albinson, T., Norman, D.I., Cole, D., Chomiak, B.A., 2001. Controlson formation of low-sulfidation epithermal deposits in Mexico:constraints from fluid inclusion and stable isotope data. In:Albinson, T., Nelson, C.E. (Eds.), New Mines and Discoveries inMexico and Central America. Society of Economic GeologistsSpecial Publication Series, vol. 8, pp. 1–32.
Ballantine, C.J., Burgess, R., Marty, B., 2002. Tracing fluid origin,transport and interaction in the crust. In: Porcelli, D., Ballantine, C.J., Wieler, R. (Eds.), Noble Gases In Geochemistry andComochemistry. . Reviews in Mineralogy and Geochemistry, 47.Mineralogical Society of America, pp. 539–614.
Benton, L.D., 1991. Composition and source of the hydrothermalfluids of the Santo Niño vein, Fresnillo, Mexico, as determinedfrom 87Sr/86Sr, stable isotope, and gas analyses: M.Sc. thesis, NewMexico Institute of Mining and Technology, Socorro NM. 55 pp.
Blatter, D.L., Carmichael, I.S.E., Deino, A.L., Renne, P.R., 2001.Neogene volcanism at the front of the central Mexican volcanicbelt: basaltic andesites to dacites, with contemporaneous shosho-nites and high-TiO2 lava. Geologic Society of America Bulletin113, 1324–1342.
Camprubí, A., Canals, À., Cardellach, E., Prol-Ledesma, R.M., Rivera,R., 2001a. The La Guitarra Ag–Au low sulfidation epithermaldeposit, Temascaltepec district, Mexico: vein structure, mineral-ogy, and sulfide–sulfosalt chemistry. In: Albinson, T., Nelson, C.E.
(Eds.), New Mines and Discoveries in Mexico and CentralAmerica. Society of Economic Geologists Special PublicationSeries, vol. 8, pp. 133–158.
Camprubí, A., Cardellach, E., Canals, À., Lucchini, R., 2001b. The LaGuitarra Ag–Au low sulfidation epithermal deposit, Temascalte-pec district, Mexico: fluid inclusion and stable isotope data. In:Albinson, T., Nelson, C.E. (Eds.), New Mines and Discoveries inMexico and Central America. Society of Economic GeologistsSpecial Publication Series, vol. 8, pp. 159–186.
Camprubí, A., Ferrari, L., Cosca, M.A., Cardellach, E., Canals, À.,2003. Ages of epithermal deposits in Mexico: regional significanceand links with the evolution of Tertiary volcanism. EconomicGeology 98 (5), 1029–1037.
Cooke, D.R., Bloom, M.S., 1990. Epithermal and subjacent porphyrymineralization, Acupan, Baguio District, Philippines: a fluid-inclusion and paragenetic study. In: Hedenquist, J.W., White, N.C.,Siddeley, G. (Eds.), Epithermal Gold Mineralization of theCircum-Pacific: Geology, Geochemistry, Origin and Exploration,I. Journal of Geochemical Exploration, vol. 35, pp. 297–340.
Einaudi, M.T., Hedenquist, J.W., Inan, E.E., 2003. Sulfidation state offluids in active and extinct hydrothermal systems: transitions fromporphyry to epithermal environments. In: Simmons, S.F., Graham,I. (Eds.), Volcanic, Geothermal, and Ore-Forming Fluids: Rulersand Witnesses of Processes within the Earth. Society of EconomicGeologists, Special Publication Series, vol. 10, pp. 285–313.
Ferrari, L., López-Martínez, M., Rosas-Elguera, J., 2002. Ignimbriteflare up and deformation in the southern Sierra Madre Occidental,western Mexico: implications for the late subduction history of theFarallon plate. Tectonics 21, 17-1/24.
Giggenbach, W.F., 1992a. The composition of gases in geothermal andvolcanic systems as a function of tectonic setting. Proceedings 7thInternational Symposium on Water–Rock Interaction (WRI-7). A.A. Balkema, Rotterdam, pp. 873–878.
Giggenbach, W.F., 1992b. Magma degassing and mineral deposition inhydrothermal systems along convergent plate boundaries. Eco-nomic Geology 87, 1927–1944.
Giggenbach, W.F., 1992c. Isotopic shifts in waters from geothermaland volcanic systems along convergent plate boundaries and theirorigin. Earth and Planetary Science Letters 113, 495–510.
Giggenbach, W.F., Poreda, R.J., 1993. Helium isotopic and chemicalcomposition of gases from volcanic–hydrothermal systems in thePhilippines. Geothermics 22, 369–380.
Giggenbach, W.F., Sano, Y., Wakita, H., 1994. Isotopic composition ofhelium and CO2 and CH4 contents in gases produced along theNew Zealand part of a convergent plate boundary. Geochimica etCosmochimica Acta 57, 3427–3455.
Gomberg, J., Priestley, K.F., Masters, T.G., Brune, J.N., 1988. Thestructure of the crust and upper mantle of northern Mexico.Geophysical Journal of the Royal Astronomical Society 94, 1–20.
Hedenquist, J.W., Aoki, M., 1991. Meteoric interaction with magmaticdischarges in Japan and the significance of mineralization.Geology 19, 1041–1044.
Hilton, D.R., Craig, H., 1989. A helium isotope transect along theIndonesian archipelago. Nature 342, 906–908.
Hilton, D.R., Hammerschmidt, K., Teufel, S., Friedrichsen, H., 1993.Helium isotope characteristics of Andean geothermal fluids andlavas. Earth and Planetary Science Letters 120, 265–282.
Molina-Garza, R., Urrutia-Fucugauchi, J., 1993. Deep crustal structureof central Mexico derived from interpretation of Bouguer gravityanomaly data. Journal of Geodynamics 17, 181–201.
Moore, J.N., Norman, D.I., Kennedy, B.M., 2001. Fluid inclusion gascompositions from an active magmatic–hydrothermal system: a
284 A. Camprubí et al. / Chemical Geology 231 (2006) 252–284
case study of The Geysers geothermal fluids, USA. ChemicalGeology 173, 3–30.
Morán-Zenteno, D.J., Corona-Chávez, P., Tolson, G., 1996. Uplift andsubduction erosion in southwestern Mexico since the Oligocene:pluton geobarometry constraints. Earth and Planetary ScienceLetters 141, 51–65.
Morán-Zenteno, D.J., Tolson, G., Martínez-Serrano, R.G., Martiny, B.,Schaaf, P., Silva-Romo, G., Macías-Romo, C., Alba-Aldave, L.,Hernández-Bernal, M.S., Solís-Pichardo, G.N., 1999. Tertiary arc-magmatism of the Sierra Madre del Sur, Mexico, and its transitionto the volcanic activity of the Trans-Mexican Volcanic Belt.Journal of South American Earth Sciences 12, 513–535.
Nava, A., Núñez-Cornú, F., Córdoba, D., Mena, M., Ansorge, J.,González, J., Rodríguez, M., Banda, M., Mueller, S., Udías, M.,García-García, M., Calderón, G., 1988. Structure of the MiddleAmerica trench in Oaxaca, Mexico. Tectonophysics 154, 541–553.
Nier, A.O., Schlutter, D.J., 1985. High-performance double focusingmass spectrometer. Review of Scientific Instruments 56, 214–219.
Norman, D.I., Musgrave, J.A., 1994. N2–Ar–He compositions in fluidinclusions: indicators of fluid source. Geochimica et Cosmochi-mica Acta 58, 1119–1131.
Norman, D.I, Moore, J.N., Musgrave, J.A., 1997a. Gaseous species astracers in geothermal systems. Proceedings 22nd Workshop onGeothermal Reservoir Engineering, Stanford University, Califor-nia, Jan. 27–29.
Norman, D.I, Chomiak, B., Albinson, T., Moore, J.N., 1997b. Volatilesin epithermal systems: the big picture. GSA 1997 Annual Meeting,Abstracts with Programs, vol. A-206.
Patterson, D.B., Honda, M., McDougall, I., 1994. Noble gases in maficphenocrysts and xenoliths from New Zealand. Geochimica etCosmochimica Acta 58, 4411–4427.
Patterson, D.B., Farley, K.A., McInnes, B.I.A., 1997. Helium isotopiccomposition of the Tabar-Lihir-Tanga-Feni island arc, Papua NewGuinea. Geochimica et Cosmochimica Acta 61, 2485–2496.
Poreda, R., Craig, H., 1989. Helium isotope ratios in Circum-Pacificvolcanic arcs. Nature 338, 473–478.
Robie, R.A., Hemingway, B.S., Fisher, J.R., 1928. Thermodynamicproperties of minerals and related substances at a 1 bar (105
pascals) pressure and at higher temperatures. U.S. GeologicalSurvey Bulletin 1452 (456 pp.).
Schellhorn, R.W., Aiken, C.L.V., de la Fuente, M.F., 1991. Bouguergravity anomalies and crustal structure in northwestern Mexico. In:
Dauphin, J.P., Simonet, B.R.T. (Eds.), The Gulf and PeninsularProvince of the Californias. AAPG Memoir, vol. 47, pp. 197–215.
Sheppard, S.M.F., 1986. Characterization and isotopic variation innatural waters. In: Ribbe, P.H. (Ed.), Stable Isotopes in HighTemperature Geological Processes. Mineralogical Society ofAmerica, vol. 16, pp. 1–40.
Sheppard, S.M.F., Nielsen, R.L., Taylor Jr., H.P., 1969. Oxygen andhydrogen isotope ratios of clay minerals from porphyry copperdeposits. Economic Geology 64, 755–777.
Sillitoe, R.H., Hedenquist, J.W., 2003. Linkages between volcanotec-tonic settings, ore-fluid compositions, and epithermal preciousmetal deposits. In: Simmons, S.F., Graham, I. (Eds.), Volcanic,Geothermal, and Ore-Forming Fluids: Rulers and Witnesses ofProcesses within the Earth. Society of Economic Geologists,Special Publication Series, vol. 10, pp. 315–343.
Simmons, S.F., 1995. Magmatic contributions to low-sulfidationepithermal deposits. In: Thompson, J.F.H. (Ed.), Magmas, Fluidsand Ore Deposits. Mineralogical Association of Canada ShortCourse Series, vol. 23, pp. 455–477.
Simmons, S.F., Gemmell, J.B, Sawkins, F.J., 1988. The Santo Niñosilver–lead–zinc vein, Fresnillo District, Zacatecas, Mexico: PartII. Physical and chemical nature of ore-forming solutions.Economic Geology 83, 1619–1641.
Taylor Jr., H.P., 1974. The application of oxygen and hydrogen isotopestudies to the problem of hydrothermal alteration and oredeposition. Economic Geology 69, 843–883.
Taylor, B.E., 1992. Degassing of H2O from rhyolite magma duringeruption and shallow intrusion, and the isotopic composition ofmagmatic water in hydrothermal systems. In: Hedenquist, J.W.(Ed.), Extended Abstracts, Japan–U.S. Symposium on MagmaticContributions to Hydrothermal Systems. Reports of the GeologicalSurvey of Japan, vol. 279, pp. 190–194.
Tolstikhin, I.N., Mamyrin, B.A., Khabarin, L.V., Erlikh, E.N., 1974.Isotope composition of helium in ultrabasic xenoliths fromvolcanic rocks of Kamchatka. Earth and Planetary Science Letters22, 75–84.
Torgersen, T., Lupton, J.E., Sheppard, D.S., Giggenbach, W.F., 1982.Helium isotope variations in the thermal areas of New Zealand.Journal of Volcanology and Geothermal Research 12, 283–298.
Copyright © 2022 FDOKUMEN