PTV experiments of subcooled boiling flow through a vertical rectangular channel
Upload
independentCategory
view
0download
0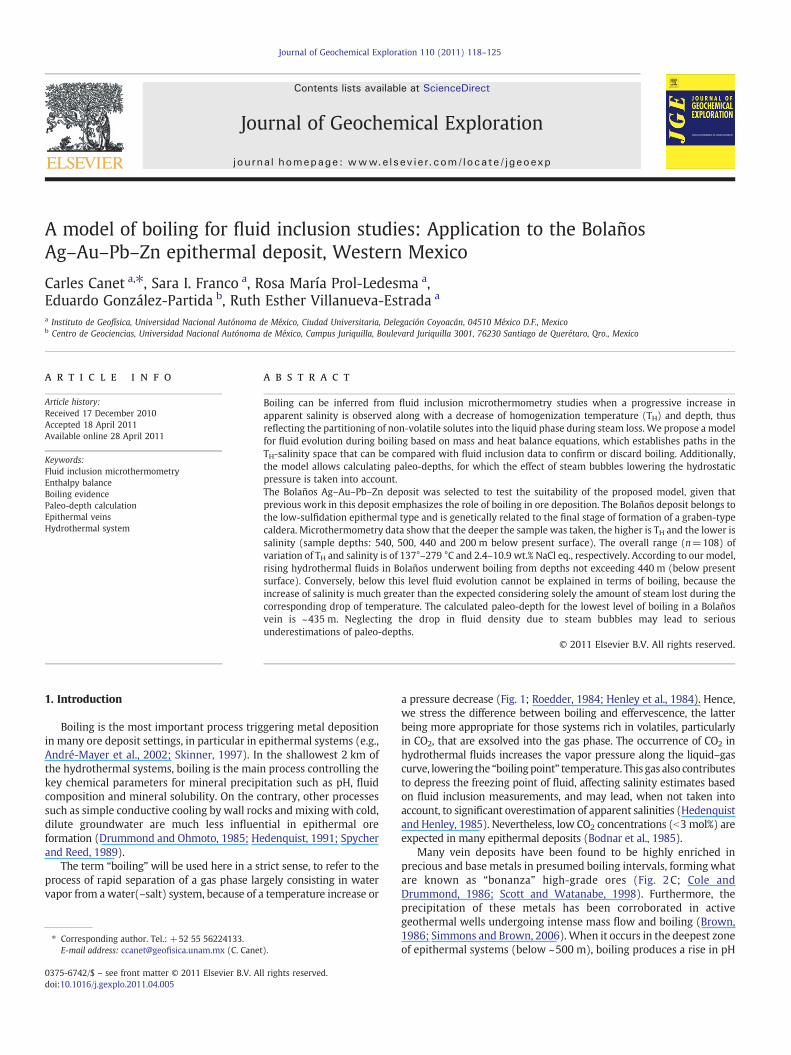
Journal of Geochemical Exploration 110 (2011) 118–125
Contents lists available at ScienceDirect
Journal of Geochemical Exploration
j ourna l homepage: www.e lsev ie r.com/ locate / jgeoexp
A model of boiling for fluid inclusion studies: Application to the BolañosAg–Au–Pb–Zn epithermal deposit, Western Mexico
Carles Canet a,⁎, Sara I. Franco a, Rosa María Prol-Ledesma a,Eduardo González-Partida b, Ruth Esther Villanueva-Estrada a
a Instituto de Geofísica, Universidad Nacional Autónoma de México, Ciudad Universitaria, Delegación Coyoacán, 04510 México D.F., Mexicob Centro de Geociencias, Universidad Nacional Autónoma de México, Campus Juriquilla, Boulevard Juriquilla 3001, 76230 Santiago de Querétaro, Qro., Mexico
⁎ Corresponding author. Tel.: +52 55 56224133.E-mail address: [email protected] (C. Cane
0375-6742/$ – see front matter © 2011 Elsevier B.V. Adoi:10.1016/j.gexplo.2011.04.005
a b s t r a c t
a r t i c l e i n f oArticle history:Received 17 December 2010Accepted 18 April 2011Available online 28 April 2011
Keywords:Fluid inclusion microthermometryEnthalpy balanceBoiling evidencePaleo-depth calculationEpithermal veinsHydrothermal system
Boiling can be inferred from fluid inclusion microthermometry studies when a progressive increase inapparent salinity is observed along with a decrease of homogenization temperature (TH) and depth, thusreflecting the partitioning of non-volatile solutes into the liquid phase during steam loss. We propose a modelfor fluid evolution during boiling based on mass and heat balance equations, which establishes paths in theTH-salinity space that can be compared with fluid inclusion data to confirm or discard boiling. Additionally,the model allows calculating paleo-depths, for which the effect of steam bubbles lowering the hydrostaticpressure is taken into account.The Bolaños Ag–Au–Pb–Zn deposit was selected to test the suitability of the proposed model, given thatprevious work in this deposit emphasizes the role of boiling in ore deposition. The Bolaños deposit belongs tothe low-sulfidation epithermal type and is genetically related to the final stage of formation of a graben-typecaldera. Microthermometry data show that the deeper the sample was taken, the higher is TH and the lower issalinity (sample depths: 540, 500, 440 and 200 m below present surface). The overall range (n=108) ofvariation of TH and salinity is of 137°–279 °C and 2.4–10.9 wt.% NaCl eq., respectively. According to our model,rising hydrothermal fluids in Bolaños underwent boiling from depths not exceeding 440 m (below presentsurface). Conversely, below this level fluid evolution cannot be explained in terms of boiling, because theincrease of salinity is much greater than the expected considering solely the amount of steam lost during thecorresponding drop of temperature. The calculated paleo-depth for the lowest level of boiling in a Bolañosvein is ~435 m. Neglecting the drop in fluid density due to steam bubbles may lead to seriousunderestimations of paleo-depths.
t).
ll rights reserved.
© 2011 Elsevier B.V. All rights reserved.
1. Introduction
Boiling is the most important process triggering metal depositionin many ore deposit settings, in particular in epithermal systems (e.g.,André-Mayer et al., 2002; Skinner, 1997). In the shallowest 2 km ofthe hydrothermal systems, boiling is the main process controlling thekey chemical parameters for mineral precipitation such as pH, fluidcomposition and mineral solubility. On the contrary, other processessuch as simple conductive cooling by wall rocks andmixing with cold,dilute groundwater are much less influential in epithermal oreformation (Drummond and Ohmoto, 1985; Hedenquist, 1991; Spycherand Reed, 1989).
The term “boiling” will be used here in a strict sense, to refer to theprocess of rapid separation of a gas phase largely consisting in watervapor from awater(–salt) system, because of a temperature increase or
a pressure decrease (Fig. 1; Roedder, 1984; Henley et al., 1984). Hence,we stress the difference between boiling and effervescence, the latterbeing more appropriate for those systems rich in volatiles, particularlyin CO2, that are exsolved into the gas phase. The occurrence of CO2 inhydrothermal fluids increases the vapor pressure along the liquid–gascurve, lowering the “boilingpoint” temperature. This gas also contributesto depress the freezing point of fluid, affecting salinity estimates basedon fluid inclusion measurements, and may lead, when not taken intoaccount, to significant overestimation of apparent salinities (Hedenquistand Henley, 1985). Nevertheless, low CO2 concentrations (b3 mol%) areexpected in many epithermal deposits (Bodnar et al., 1985).
Many vein deposits have been found to be highly enriched inprecious and base metals in presumed boiling intervals, forming whatare known as “bonanza” high-grade ores (Fig. 2C; Cole andDrummond, 1986; Scott and Watanabe, 1998). Furthermore, theprecipitation of these metals has been corroborated in activegeothermal wells undergoing intense mass flow and boiling (Brown,1986; Simmons and Brown, 2006).When it occurs in the deepest zoneof epithermal systems (below ~500 m), boiling produces a rise in pH
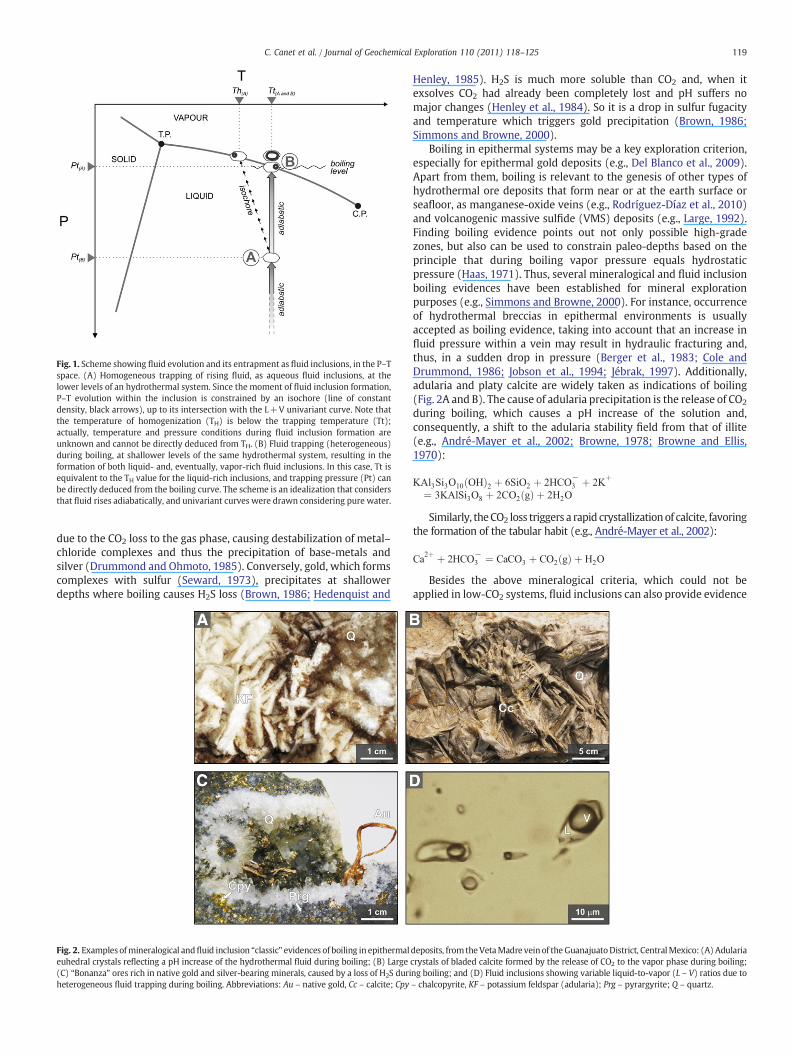
Fig. 1. Scheme showing fluid evolution and its entrapment as fluid inclusions, in the P–Tspace. (A) Homogeneous trapping of rising fluid, as aqueous fluid inclusions, at thelower levels of an hydrothermal system. Since the moment of fluid inclusion formation,P–T evolution within the inclusion is constrained by an isochore (line of constantdensity, black arrows), up to its intersection with the L+V univariant curve. Note thatthe temperature of homogenization (TH) is below the trapping temperature (Tt);actually, temperature and pressure conditions during fluid inclusion formation areunknown and cannot be directly deduced from TH. (B) Fluid trapping (heterogeneous)during boiling, at shallower levels of the same hydrothermal system, resulting in theformation of both liquid- and, eventually, vapor-rich fluid inclusions. In this case, Tt isequivalent to the TH value for the liquid-rich inclusions, and trapping pressure (Pt) canbe directly deduced from the boiling curve. The scheme is an idealization that considersthat fluid rises adiabatically, and univariant curves were drawn considering pure water.
119C. Canet et al. / Journal of Geochemical Exploration 110 (2011) 118–125
due to the CO2 loss to the gas phase, causing destabilization of metal–chloride complexes and thus the precipitation of base-metals andsilver (Drummond and Ohmoto, 1985). Conversely, gold, which formscomplexes with sulfur (Seward, 1973), precipitates at shallowerdepths where boiling causes H2S loss (Brown, 1986; Hedenquist and
Fig. 2. Examples ofmineralogical andfluid inclusion “classic” evidences of boiling in epithermaleuhedral crystals reflecting a pH increase of the hydrothermal fluid during boiling; (B) Large(C) “Bonanza” ores rich in native gold and silver-bearing minerals, caused by a loss of H2S duriheterogeneous fluid trapping during boiling. Abbreviations: Au – native gold, Cc – calcite; Cpy
Henley, 1985). H2S is much more soluble than CO2 and, when itexsolves CO2 had already been completely lost and pH suffers nomajor changes (Henley et al., 1984). So it is a drop in sulfur fugacityand temperature which triggers gold precipitation (Brown, 1986;Simmons and Browne, 2000).
Boiling in epithermal systems may be a key exploration criterion,especially for epithermal gold deposits (e.g., Del Blanco et al., 2009).Apart from them, boiling is relevant to the genesis of other types ofhydrothermal ore deposits that form near or at the earth surface orseafloor, as manganese-oxide veins (e.g., Rodríguez-Díaz et al., 2010)and volcanogenic massive sulfide (VMS) deposits (e.g., Large, 1992).Finding boiling evidence points out not only possible high-gradezones, but also can be used to constrain paleo-depths based on theprinciple that during boiling vapor pressure equals hydrostaticpressure (Haas, 1971). Thus, several mineralogical and fluid inclusionboiling evidences have been established for mineral explorationpurposes (e.g., Simmons and Browne, 2000). For instance, occurrenceof hydrothermal breccias in epithermal environments is usuallyaccepted as boiling evidence, taking into account that an increase influid pressure within a vein may result in hydraulic fracturing and,thus, in a sudden drop in pressure (Berger et al., 1983; Cole andDrummond, 1986; Jobson et al., 1994; Jébrak, 1997). Additionally,adularia and platy calcite are widely taken as indications of boiling(Fig. 2A and B). The cause of adularia precipitation is the release of CO2
during boiling, which causes a pH increase of the solution and,consequently, a shift to the adularia stability field from that of illite(e.g., André-Mayer et al., 2002; Browne, 1978; Browne and Ellis,1970):
KAl3Si3O10ðOHÞ2 þ 6SiO2 þ 2HCO−3 þ 2K
þ
¼ 3KAlSi3O8 þ 2CO2ðgÞ þ 2H2O
Similarly, theCO2 loss triggers a rapid crystallizationof calcite, favoringthe formation of the tabular habit (e.g., André-Mayer et al., 2002):
Ca2þ þ 2HCO
−3 ¼ CaCO3 þ CO2ðgÞ þ H2O
Besides the above mineralogical criteria, which could not beapplied in low-CO2 systems, fluid inclusions can also provide evidence
deposits, from theVetaMadre vein of the GuanajuatoDistrict, CentralMexico: (A) Adulariacrystals of bladed calcite formed by the release of CO2 to the vapor phase during boiling;ng boiling; and (D) Fluid inclusions showing variable liquid-to-vapor (L – V) ratios due to– chalcopyrite, KF – potassium feldspar (adularia); Prg – pyrargyrite; Q – quartz.
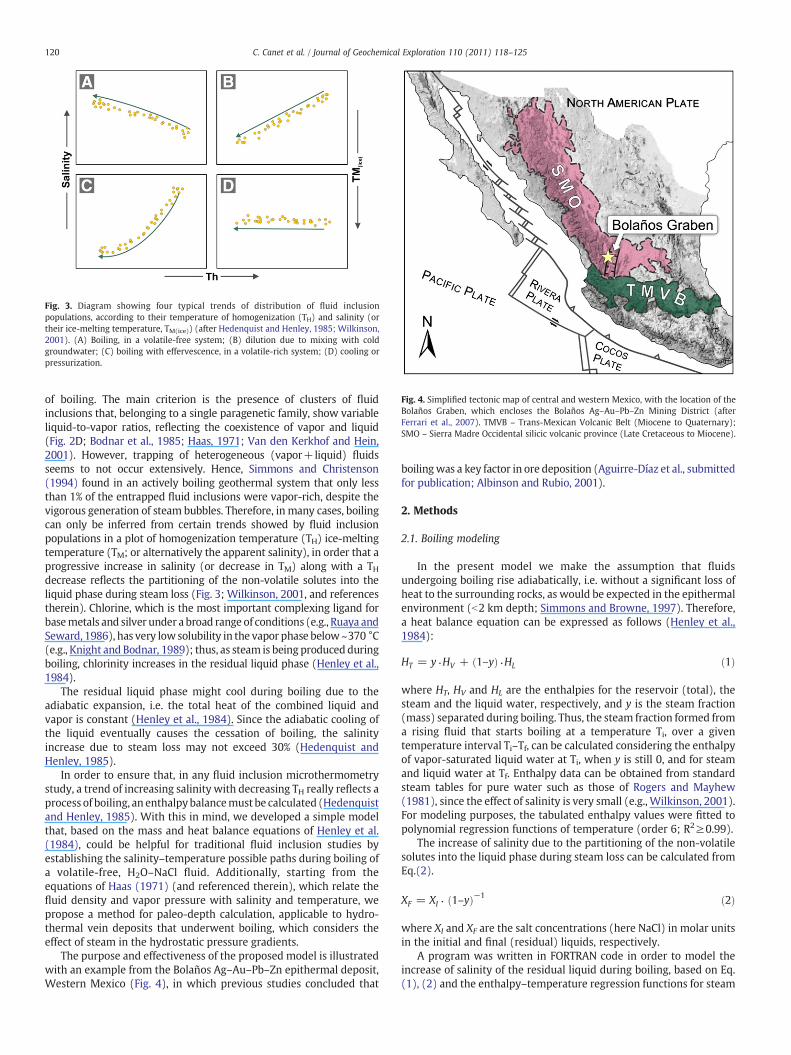
Fig. 3. Diagram showing four typical trends of distribution of fluid inclusionpopulations, according to their temperature of homogenization (TH) and salinity (ortheir ice-melting temperature, TM(ice)) (after Hedenquist and Henley, 1985; Wilkinson,2001). (A) Boiling, in a volatile-free system; (B) dilution due to mixing with coldgroundwater; (C) boiling with effervescence, in a volatile-rich system; (D) cooling orpressurization.
Fig. 4. Simplified tectonic map of central and western Mexico, with the location of theBolaños Graben, which encloses the Bolaños Ag–Au–Pb–Zn Mining District (afterFerrari et al., 2007). TMVB – Trans-Mexican Volcanic Belt (Miocene to Quaternary);SMO – Sierra Madre Occidental silicic volcanic province (Late Cretaceous to Miocene).
120 C. Canet et al. / Journal of Geochemical Exploration 110 (2011) 118–125
of boiling. The main criterion is the presence of clusters of fluidinclusions that, belonging to a single paragenetic family, show variableliquid-to-vapor ratios, reflecting the coexistence of vapor and liquid(Fig. 2D; Bodnar et al., 1985; Haas, 1971; Van den Kerkhof and Hein,2001). However, trapping of heterogeneous (vapor+liquid) fluidsseems to not occur extensively. Hence, Simmons and Christenson(1994) found in an actively boiling geothermal system that only lessthan 1% of the entrapped fluid inclusions were vapor-rich, despite thevigorous generation of steam bubbles. Therefore, in many cases, boilingcan only be inferred from certain trends showed by fluid inclusionpopulations in a plot of homogenization temperature (TH) ice-meltingtemperature (TM; or alternatively the apparent salinity), in order that aprogressive increase in salinity (or decrease in TM) along with a THdecrease reflects the partitioning of the non-volatile solutes into theliquid phase during steam loss (Fig. 3; Wilkinson, 2001, and referencestherein). Chlorine, which is the most important complexing ligand forbasemetals and silver under a broad range of conditions (e.g., Ruaya andSeward, 1986), has very lowsolubility in the vapor phase below~370 °C(e.g., Knight and Bodnar, 1989); thus, as steam is being produced duringboiling, chlorinity increases in the residual liquid phase (Henley et al.,1984).
The residual liquid phase might cool during boiling due to theadiabatic expansion, i.e. the total heat of the combined liquid andvapor is constant (Henley et al., 1984). Since the adiabatic cooling ofthe liquid eventually causes the cessation of boiling, the salinityincrease due to steam loss may not exceed 30% (Hedenquist andHenley, 1985).
In order to ensure that, in any fluid inclusion microthermometrystudy, a trend of increasing salinity with decreasing TH really reflects aprocess of boiling, an enthalpybalancemust be calculated (Hedenquistand Henley, 1985). With this in mind, we developed a simple modelthat, based on the mass and heat balance equations of Henley et al.(1984), could be helpful for traditional fluid inclusion studies byestablishing the salinity–temperature possible paths during boiling ofa volatile-free, H2O–NaCl fluid. Additionally, starting from theequations of Haas (1971) (and referenced therein), which relate thefluid density and vapor pressure with salinity and temperature, wepropose a method for paleo-depth calculation, applicable to hydro-thermal vein deposits that underwent boiling, which considers theeffect of steam in the hydrostatic pressure gradients.
The purpose and effectiveness of the proposed model is illustratedwith an example from the Bolaños Ag–Au–Pb–Zn epithermal deposit,Western Mexico (Fig. 4), in which previous studies concluded that
boilingwas a key factor in ore deposition (Aguirre-Díaz et al., submittedfor publication; Albinson and Rubio, 2001).
2. Methods
2.1. Boiling modeling
In the present model we make the assumption that fluidsundergoing boiling rise adiabatically, i.e. without a significant loss ofheat to the surrounding rocks, as would be expected in the epithermalenvironment (b2 km depth; Simmons and Browne, 1997). Therefore,a heat balance equation can be expressed as follows (Henley et al.,1984):
HT = y·HV + 1–yð Þ·HL ð1Þ
where HT, HV and HL are the enthalpies for the reservoir (total), thesteam and the liquid water, respectively, and y is the steam fraction(mass) separated during boiling. Thus, the steam fraction formed froma rising fluid that starts boiling at a temperature Ti, over a giventemperature interval Ti–Tf, can be calculated considering the enthalpyof vapor-saturated liquid water at Ti, when y is still 0, and for steamand liquid water at Tf. Enthalpy data can be obtained from standardsteam tables for pure water such as those of Rogers and Mayhew(1981), since the effect of salinity is very small (e.g., Wilkinson, 2001).For modeling purposes, the tabulated enthalpy values were fitted topolynomial regression functions of temperature (order 6; R2≥0.99).
The increase of salinity due to the partitioning of the non-volatilesolutes into the liquid phase during steam loss can be calculated fromEq.(2).
XF = XI · 1–yð Þ−1 ð2Þ
where XI and XF are the salt concentrations (here NaCl) in molar unitsin the initial and final (residual) liquids, respectively.
A program was written in FORTRAN code in order to model theincrease of salinity of the residual liquid during boiling, based on Eq.(1), (2) and the enthalpy–temperature regression functions for steam
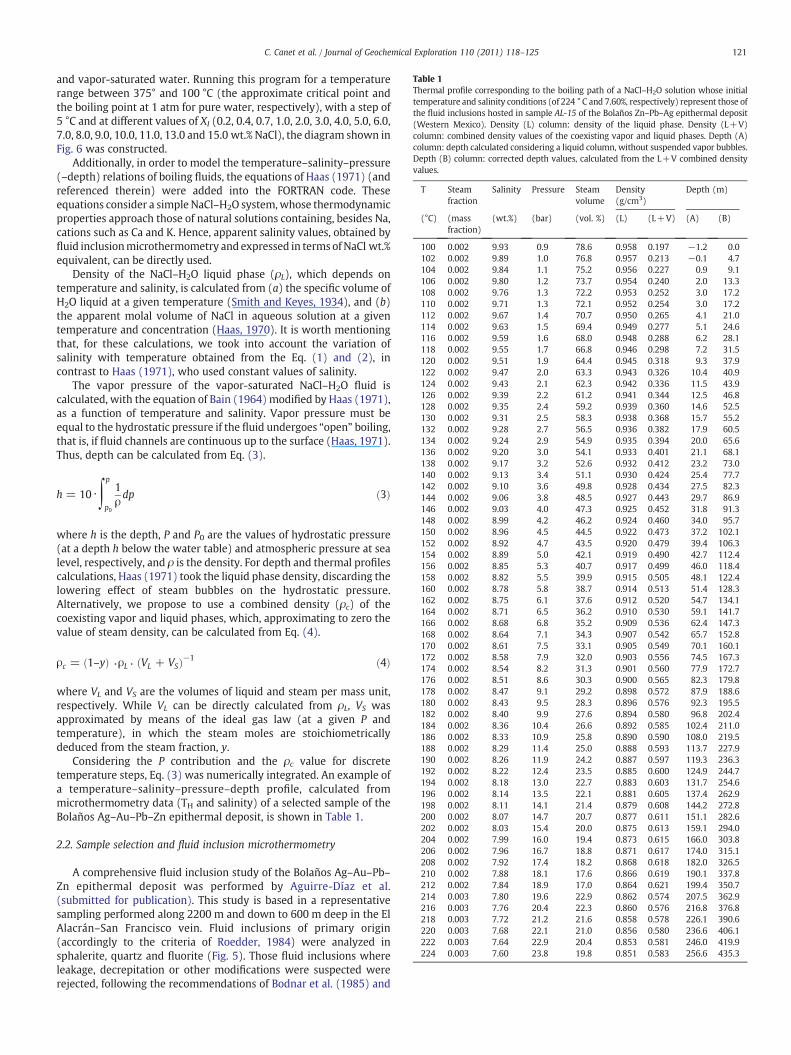
Table 1Thermal profile corresponding to the boiling path of a NaCl–H2O solution whose initialtemperature and salinity conditions (of 224 ° C and 7.60%, respectively) represent those ofthe fluid inclusions hosted in sample AL-15 of the Bolaños Zn–Pb–Ag epithermal deposit(Western Mexico). Density (L) column: density of the liquid phase. Density (L+V)column: combined density values of the coexisting vapor and liquid phases. Depth (A)column: depth calculated considering a liquid column, without suspended vapor bubbles.Depth (B) column: corrected depth values, calculated from the L+V combined densityvalues.
T Steamfraction
Salinity Pressure Steamvolume
Density(g/cm3)
Depth (m)
(°C) (massfraction)
(wt.%) (bar) (vol. %) (L) (L+V) (A) (B)
100 0.002 9.93 0.9 78.6 0.958 0.197 −1.2 0.0102 0.002 9.89 1.0 76.8 0.957 0.213 −0.1 4.7104 0.002 9.84 1.1 75.2 0.956 0.227 0.9 9.1106 0.002 9.80 1.2 73.7 0.954 0.240 2.0 13.3108 0.002 9.76 1.3 72.2 0.953 0.252 3.0 17.2110 0.002 9.71 1.3 72.1 0.952 0.254 3.0 17.2112 0.002 9.67 1.4 70.7 0.950 0.265 4.1 21.0114 0.002 9.63 1.5 69.4 0.949 0.277 5.1 24.6116 0.002 9.59 1.6 68.0 0.948 0.288 6.2 28.1118 0.002 9.55 1.7 66.8 0.946 0.298 7.2 31.5120 0.002 9.51 1.9 64.4 0.945 0.318 9.3 37.9122 0.002 9.47 2.0 63.3 0.943 0.326 10.4 40.9124 0.002 9.43 2.1 62.3 0.942 0.336 11.5 43.9126 0.002 9.39 2.2 61.2 0.941 0.344 12.5 46.8128 0.002 9.35 2.4 59.2 0.939 0.360 14.6 52.5130 0.002 9.31 2.5 58.3 0.938 0.368 15.7 55.2132 0.002 9.28 2.7 56.5 0.936 0.382 17.9 60.5134 0.002 9.24 2.9 54.9 0.935 0.394 20.0 65.6136 0.002 9.20 3.0 54.1 0.933 0.401 21.1 68.1138 0.002 9.17 3.2 52.6 0.932 0.412 23.2 73.0140 0.002 9.13 3.4 51.1 0.930 0.424 25.4 77.7142 0.002 9.10 3.6 49.8 0.928 0.434 27.5 82.3144 0.002 9.06 3.8 48.5 0.927 0.443 29.7 86.9146 0.002 9.03 4.0 47.3 0.925 0.452 31.8 91.3148 0.002 8.99 4.2 46.2 0.924 0.460 34.0 95.7150 0.002 8.96 4.5 44.5 0.922 0.473 37.2 102.1152 0.002 8.92 4.7 43.5 0.920 0.479 39.4 106.3154 0.002 8.89 5.0 42.1 0.919 0.490 42.7 112.4156 0.002 8.85 5.3 40.7 0.917 0.499 46.0 118.4158 0.002 8.82 5.5 39.9 0.915 0.505 48.1 122.4160 0.002 8.78 5.8 38.7 0.914 0.513 51.4 128.3162 0.002 8.75 6.1 37.6 0.912 0.520 54.7 134.1164 0.002 8.71 6.5 36.2 0.910 0.530 59.1 141.7166 0.002 8.68 6.8 35.2 0.909 0.536 62.4 147.3168 0.002 8.64 7.1 34.3 0.907 0.542 65.7 152.8170 0.002 8.61 7.5 33.1 0.905 0.549 70.1 160.1172 0.002 8.58 7.9 32.0 0.903 0.556 74.5 167.3174 0.002 8.54 8.2 31.3 0.901 0.560 77.9 172.7176 0.002 8.51 8.6 30.3 0.900 0.565 82.3 179.8178 0.002 8.47 9.1 29.2 0.898 0.572 87.9 188.6180 0.002 8.43 9.5 28.3 0.896 0.576 92.3 195.5182 0.002 8.40 9.9 27.6 0.894 0.580 96.8 202.4184 0.002 8.36 10.4 26.6 0.892 0.585 102.4 211.0186 0.002 8.33 10.9 25.8 0.890 0.590 108.0 219.5188 0.002 8.29 11.4 25.0 0.888 0.593 113.7 227.9190 0.002 8.26 11.9 24.2 0.887 0.597 119.3 236.3192 0.002 8.22 12.4 23.5 0.885 0.600 124.9 244.7194 0.002 8.18 13.0 22.7 0.883 0.603 131.7 254.6196 0.002 8.14 13.5 22.1 0.881 0.605 137.4 262.9198 0.002 8.11 14.1 21.4 0.879 0.608 144.2 272.8200 0.002 8.07 14.7 20.7 0.877 0.611 151.1 282.6202 0.002 8.03 15.4 20.0 0.875 0.613 159.1 294.0204 0.002 7.99 16.0 19.4 0.873 0.615 166.0 303.8206 0.002 7.96 16.7 18.8 0.871 0.617 174.0 315.1208 0.002 7.92 17.4 18.2 0.868 0.618 182.0 326.5210 0.002 7.88 18.1 17.6 0.866 0.619 190.1 337.8212 0.002 7.84 18.9 17.0 0.864 0.621 199.4 350.7214 0.003 7.80 19.6 22.9 0.862 0.574 207.5 362.9216 0.003 7.76 20.4 22.3 0.860 0.576 216.8 376.8218 0.003 7.72 21.2 21.6 0.858 0.578 226.1 390.6220 0.003 7.68 22.1 21.0 0.856 0.580 236.6 406.1222 0.003 7.64 22.9 20.4 0.853 0.581 246.0 419.9224 0.003 7.60 23.8 19.8 0.851 0.583 256.6 435.3
121C. Canet et al. / Journal of Geochemical Exploration 110 (2011) 118–125
and vapor-saturated water. Running this program for a temperaturerange between 375° and 100 °C (the approximate critical point andthe boiling point at 1 atm for pure water, respectively), with a step of5 °C and at different values of XI (0.2, 0.4, 0.7, 1.0, 2.0, 3.0, 4.0, 5.0, 6.0,7.0, 8.0, 9.0, 10.0, 11.0, 13.0 and 15.0 wt.% NaCl), the diagram shown inFig. 6 was constructed.
Additionally, in order to model the temperature–salinity–pressure(–depth) relations of boiling fluids, the equations of Haas (1971) (andreferenced therein) were added into the FORTRAN code. Theseequations consider a simple NaCl–H2O system,whose thermodynamicproperties approach those of natural solutions containing, besides Na,cations such as Ca and K. Hence, apparent salinity values, obtained byfluid inclusionmicrothermometry and expressed in terms of NaCl wt.%equivalent, can be directly used.
Density of the NaCl–H2O liquid phase (ρL), which depends ontemperature and salinity, is calculated from (a) the specific volume ofH2O liquid at a given temperature (Smith and Keyes, 1934), and (b)the apparent molal volume of NaCl in aqueous solution at a giventemperature and concentration (Haas, 1970). It is worth mentioningthat, for these calculations, we took into account the variation ofsalinity with temperature obtained from the Eq. (1) and (2), incontrast to Haas (1971), who used constant values of salinity.
The vapor pressure of the vapor-saturated NaCl–H2O fluid iscalculated, with the equation of Bain (1964) modified by Haas (1971),as a function of temperature and salinity. Vapor pressure must beequal to the hydrostatic pressure if the fluid undergoes “open” boiling,that is, if fluid channels are continuous up to the surface (Haas, 1971).Thus, depth can be calculated from Eq. (3).
h = 10·∫p
p0
1ρdp ð3Þ
where h is the depth, P and P0 are the values of hydrostatic pressure(at a depth h below the water table) and atmospheric pressure at sealevel, respectively, and ρ is the density. For depth and thermal profilescalculations, Haas (1971) took the liquid phase density, discarding thelowering effect of steam bubbles on the hydrostatic pressure.Alternatively, we propose to use a combined density (ρc) of thecoexisting vapor and liquid phases, which, approximating to zero thevalue of steam density, can be calculated from Eq. (4).
ρc = 1–yð Þ ·ρL · VL + VSð Þ−1 ð4Þ
where VL and VS are the volumes of liquid and steam per mass unit,respectively. While VL can be directly calculated from ρL, VS wasapproximated by means of the ideal gas law (at a given P andtemperature), in which the steam moles are stoichiometricallydeduced from the steam fraction, y.
Considering the P contribution and the ρc value for discretetemperature steps, Eq. (3) was numerically integrated. An example ofa temperature–salinity–pressure–depth profile, calculated frommicrothermometry data (TH and salinity) of a selected sample of theBolaños Ag–Au–Pb–Zn epithermal deposit, is shown in Table 1.
2.2. Sample selection and fluid inclusion microthermometry
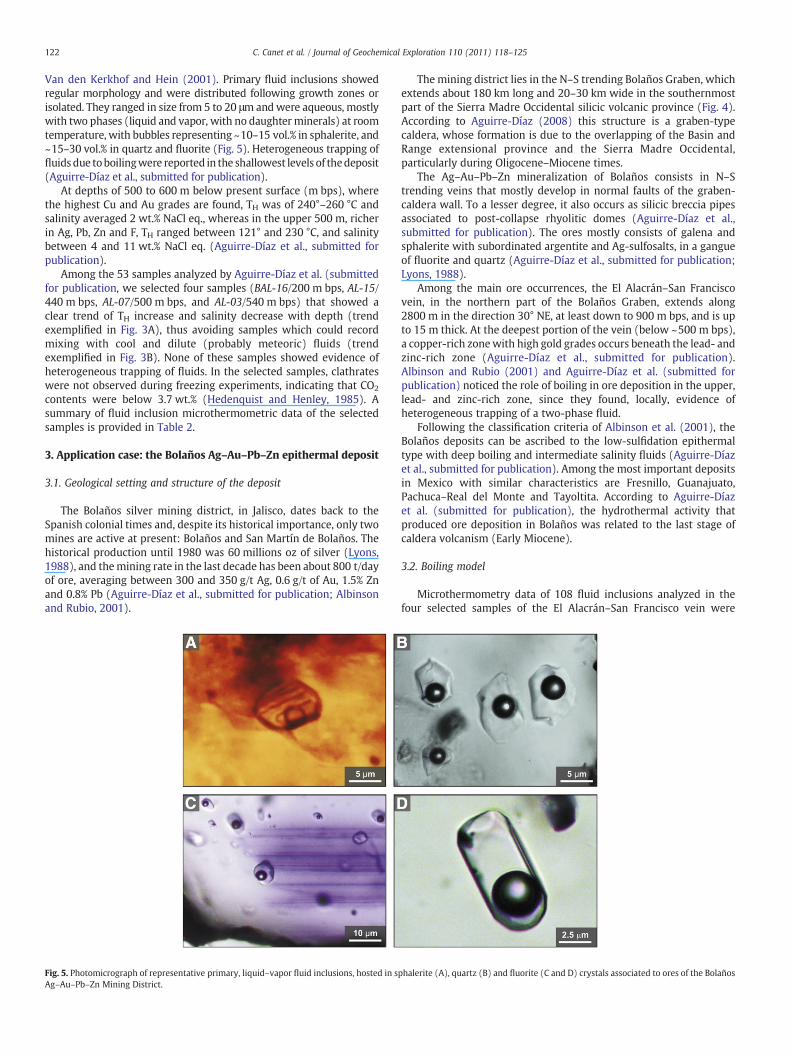
A comprehensive fluid inclusion study of the Bolaños Ag–Au–Pb–Zn epithermal deposit was performed by Aguirre-Díaz et al.(submitted for publication). This study is based in a representativesampling performed along 2200 m and down to 600 m deep in the ElAlacrán–San Francisco vein. Fluid inclusions of primary origin(accordingly to the criteria of Roedder, 1984) were analyzed insphalerite, quartz and fluorite (Fig. 5). Those fluid inclusions whereleakage, decrepitation or other modifications were suspected wererejected, following the recommendations of Bodnar et al. (1985) and
122 C. Canet et al. / Journal of Geochemical Exploration 110 (2011) 118–125
Van den Kerkhof and Hein (2001). Primary fluid inclusions showedregular morphology and were distributed following growth zones orisolated. They ranged in size from 5 to 20 μm andwere aqueous, mostlywith two phases (liquid and vapor, with no daughter minerals) at roomtemperature, with bubbles representing ~10–15 vol.% in sphalerite, and~15–30 vol.% in quartz and fluorite (Fig. 5). Heterogeneous trapping offluidsdue toboilingwere reported in the shallowest levels of thedeposit(Aguirre-Díaz et al., submitted for publication).
At depths of 500 to 600 m below present surface (m bps), wherethe highest Cu and Au grades are found, TH was of 240°–260 °C andsalinity averaged 2 wt.% NaCl eq., whereas in the upper 500 m, richerin Ag, Pb, Zn and F, TH ranged between 121° and 230 °C, and salinitybetween 4 and 11 wt.% NaCl eq. (Aguirre-Díaz et al., submitted forpublication).
Among the 53 samples analyzed by Aguirre-Díaz et al. (submittedfor publication, we selected four samples (BAL-16/200 m bps, AL-15/440 m bps, AL-07/500 m bps, and AL-03/540 m bps) that showed aclear trend of TH increase and salinity decrease with depth (trendexemplified in Fig. 3A), thus avoiding samples which could recordmixing with cool and dilute (probably meteoric) fluids (trendexemplified in Fig. 3B). None of these samples showed evidence ofheterogeneous trapping of fluids. In the selected samples, clathrateswere not observed during freezing experiments, indicating that CO2
contents were below 3.7 wt.% (Hedenquist and Henley, 1985). Asummary of fluid inclusion microthermometric data of the selectedsamples is provided in Table 2.
3. Application case: the Bolaños Ag–Au–Pb–Zn epithermal deposit
3.1. Geological setting and structure of the deposit
The Bolaños silver mining district, in Jalisco, dates back to theSpanish colonial times and, despite its historical importance, only twomines are active at present: Bolaños and San Martín de Bolaños. Thehistorical production until 1980 was 60 millions oz of silver (Lyons,1988), and themining rate in the last decade has been about 800 t/dayof ore, averaging between 300 and 350 g/t Ag, 0.6 g/t of Au, 1.5% Znand 0.8% Pb (Aguirre-Díaz et al., submitted for publication; Albinsonand Rubio, 2001).
Fig. 5. Photomicrograph of representative primary, liquid–vapor fluid inclusions, hosted in sAg–Au–Pb–Zn Mining District.
The mining district lies in the N–S trending Bolaños Graben, whichextends about 180 km long and 20–30 km wide in the southernmostpart of the Sierra Madre Occidental silicic volcanic province (Fig. 4).According to Aguirre-Díaz (2008) this structure is a graben-typecaldera, whose formation is due to the overlapping of the Basin andRange extensional province and the Sierra Madre Occidental,particularly during Oligocene–Miocene times.
The Ag–Au–Pb–Zn mineralization of Bolaños consists in N–Strending veins that mostly develop in normal faults of the graben-caldera wall. To a lesser degree, it also occurs as silicic breccia pipesassociated to post-collapse rhyolitic domes (Aguirre-Díaz et al.,submitted for publication). The ores mostly consists of galena andsphalerite with subordinated argentite and Ag-sulfosalts, in a gangueof fluorite and quartz (Aguirre-Díaz et al., submitted for publication;Lyons, 1988).
Among the main ore occurrences, the El Alacrán–San Franciscovein, in the northern part of the Bolaños Graben, extends along2800 m in the direction 30° NE, at least down to 900 m bps, and is upto 15 m thick. At the deepest portion of the vein (below ~500 m bps),a copper-rich zonewith high gold grades occurs beneath the lead- andzinc-rich zone (Aguirre-Díaz et al., submitted for publication).Albinson and Rubio (2001) and Aguirre-Díaz et al. (submitted forpublication) noticed the role of boiling in ore deposition in the upper,lead- and zinc-rich zone, since they found, locally, evidence ofheterogeneous trapping of a two-phase fluid.
Following the classification criteria of Albinson et al. (2001), theBolaños deposits can be ascribed to the low-sulfidation epithermaltype with deep boiling and intermediate salinity fluids (Aguirre-Díazet al., submitted for publication). Among the most important depositsin Mexico with similar characteristics are Fresnillo, Guanajuato,Pachuca–Real del Monte and Tayoltita. According to Aguirre-Díazet al. (submitted for publication), the hydrothermal activity thatproduced ore deposition in Bolaños was related to the last stage ofcaldera volcanism (Early Miocene).
3.2. Boiling model
Microthermometry data of 108 fluid inclusions analyzed in thefour selected samples of the El Alacrán–San Francisco vein were
phalerite (A), quartz (B) and fluorite (C and D) crystals associated to ores of the Bolaños

Table 2Summary of microthermometric data of fluid inclusions of the Bolaños Ag–Au–Pb–Zn epithermal deposit (Western Mexico).
Sample Deptha Ore zone Hostmineral
# TH (°C) TM(ice) (°C) Salinity(wt.% NaCl eq.)
min. aver. max. min. aver. max. min. aver. max.
BAL-16 200 Ag–Pb–Zn Sph 25 137 144 157 −7.3 −6.9 −6.0 9.2 10.4 10.9AL-15 440 Q 22 224 232 241 −6.0 −5.3 −4.8 7.6 8.3 9.2AL-07 500 Au (±Cu) Fl 28 234 244 259 −4.8 −3.8 −2.0 3.4 6.1 7.6AL-03 540 Fl 33 250 262 279 −1.8 −1.5 −1.4 2.4 2.6 3.1
Key: TH=temperature of homogenization, TM(ice)=temperature of ice melting (freezing point depression).# = number of analyzed inclusions, min. = minimum value; aver. = arithmetic mean; max. = maximum value.Abbreviations: Fl – fluorite; Q – quartz; Sph – sphalerite.
a Approximate; in m below present surface.
123C. Canet et al. / Journal of Geochemical Exploration 110 (2011) 118–125
plotted in Fig. 6, showing that the deeper the sample was taken, thehigher TH and the lower salinity (apparent) values were found. Thus,the overall range of variation of TH and salinity is constrained betweensample BAL-16 (taken from 200 m bps), with TH of 137º–157 °C andsalinity of 9.2–10.9 wt.% NaCl eq., and sample AL-03 (taken from540 m bps), with TH of 250°–279 ° C and salinity of 2.4–3.1 wt.% NaCleq. The general distribution of fluid inclusions in this plot follows atrend typical of boiling (Fig. 3A), with a progressive increase in salinityalong with a TH decrease owing to the partitioning of salts into theliquid phase during steam loss. However, according to the modeledsalinity–temperature paths, only the fluid evolution between samplesAL-15 (440 m bps) and BAL-16 (200 m bps) can be satisfactorilyexplained by boiling; in other words, the mineralizing fluids shouldhave underwent boiling from depths not greater than 440 m bps. Incontrast, the fluid variations from the deepest samples (AL-03,540 m bps; AL-07, 500 m bps) to AL-15 (440 m bps) cannot beexplained in terms of boiling, because the increase of salinity ismuch greater than the expected considering solely the steam fractionlost for the corresponding temperature drop. Individually, samplesAL-15 and AL-03 seem to show a dilution trend (exemplified inFig. 3B), probably reflecting intermittent, minor ingress of colderfluids into the hydrothermal system.
According to what has been stated above, a temperature–salinity–pressure–depth boiling profile was calculated from starting temper-ature and salinity conditions yield by sample AL-15 (224 °C and
Fig. 6. Diagram showing the feasible salinity–temperature boiling paths (arrows),modeled for the epithermal environment conditions using the mass and enthalpybalance equations of Henley et al. (1984). Individual fluid inclusions analyzed in foursamples representative of the Alacrán–San Francisco vein of the Bolaños deposit havebeen plotted by their ice-melting TM(ice) and homogenization temperatures (theapproximate depth below present surface of samples is: BAL-16, 180 m; AL-15, 420 m;AL-07, 480 m; AL-03, 520 m). The differences of temperature and salinity betweensamples AL-15 to BAL-16 is congruent with a boiling path of a rising fluid. On the otherhand, the fluid temperature and salinity variations from the deepest samples (AL-03and AL-07) to AL-15 cannot be explained in terms of boiling, but they could reflectpulses of high temperature and salinity.
7.6 wt.%). These conditions correspond to the fluid inclusion with thelowest TH, which was selected to avoid any effect on the TH due to anyvapor that may have been trapped, to some degree, if the inclusionsformed under boiling conditions (Taguchi and Hayashi, 1982). Thecomplete profile, with a temperature step of 2 °C, is presented inTable 1, and the corresponding curves for salinity, density andpressure are shown in Fig. 7. Additionally, the calculated thermalprofiles are plotted in Fig. 8.
Salinity shows an almost linear negative correlation (R2=0.999)with respect to temperature; so that for the TH range of sample BAL-16(137° to 157 °C), the expected salinity averages 9.0 wt.% and, if thefluid will eventually reach the surface, salinity would attain 9.9 wt.%.On the other hand, the vapor pressure vs. temperature curve fits apolynomial (2°) curve with a positive correlation (R2=0.999).
The resulting temperature–depth profile (Fig. 8) was constructedin two ways: (a) considering a liquid column without suspendedvapor bubbles, only taking into consideration the temperaturedecrease and the corresponding increase of salinity, and (b)calculating the effect of steam bubbles on fluid density and thereforeon the hydrostatic pressure. The calculated depth for sample AL-15,which marks the beginning of boiling for the rising fluid, is of 256 mconsidering a liquid column and of 435 m considering the effect ofsuspended bubbles, being the last value much closer to the samplingdepth (440 m bps).
4. Suitability of the model and concluding remarks
The proposedmodel for salinity–temperature evolution, as plottedin Fig. 6, permits to confirm or discard if a fossil hydrothermal systemunderwent boiling, simply by comparison between the modeledboiling paths and the trend of distribution of fluid inclusions from anensemble of samples taken at different depths of a vein.
We selected the Bolaños Ag–Au–Pb–Zn epithermal deposit to testthe suitability of themodel, since previous works (Albinson and RubioRamos Albinson and Rubio, 2001; Aguirre-Díaz et al., submitted forpublication) pointed out the prevalence of boiling during the activelife of this hydrothermal mineralization. The fluid evolution drawn bythe distribution of fluid inclusion data of Bolaños revealed that risingmineralizing fluids should have undergone boiling, but from (present)depths not exceeding 440 m bps (Fig. 6). Conversely, below this levelfluid evolution cannot be explained in terms of boiling and probablyaccounts for the episodic injection of brines. In principle, this factwould modify the previous deposit model for the Bolaños deposit,which was apparently consistent with the “deep-vein with boiling”type of Albinson et al. (2001). According to these authors, thiscategory, which would includemany of themajor epithermal depositsin Mexico (e.g., Fresnillo, Guanajuato, Pachuca–Real del Monte andTayoltita), is characterized by having boiling stages at depths of~1000 m or more and at temperatures of ~300 °C. However, ourresults cast doubt on boiling having occurred at depths greater than500 m, which must be taken into account for exploration purposes.

Fig. 7. Evolution curves for salinity, density of the liquid phase and pressure, calculatedfor a boiling path between the fluid conditions represented by samples (A) AL-15 and(B) BAL-16 (temperature from 224° to 137 ° C, salinity from 7.6 to 9.2%), from theAlacrán–San Francisco vein of the Bolaños deposit.
Fig. 8. Boling-point curves corresponding to a rising hydrothermal fluid whosetemperature and salinity conditions evolve from those represented by AL-15 to BAL-16samples (224° to 137 ° C, and 7.6 to 9.2%, respectively), of the Alacrán–San Franciscovein of the Bolaños deposit. Both curves (A and B) were constructed taking intoconsideration a progressive increase of salinity due to the steam loss during boiling, but,in curve (A), depth was calculated considering a liquid column, without suspendedvapor bubbles, whereas in curve (B) the effect of vapor bubbles on fluid density andtherefore on the hydrostatic pressure were considered (Table 2). The parallel changesin salinity, density and pressure are shown in Fig. 7. The calculated depth for sample AL-15 is of 256 m considering curve (A) and of 435 m considering curve (B), being the lastvalue much closer to the sampling depth (440 m bps). Thus, neglecting the effect ofbubbles in fluid density may lead an underestimation of depth of ~40%.
124 C. Canet et al. / Journal of Geochemical Exploration 110 (2011) 118–125
Once identified by the above procedure a sample representative ofthe beginning of boiling (or of the deepest level of the vein in whichboiling occurred), temperature–depth profiles can be calculatedtaking as starting conditions the TH and apparent salinity valuesobtained by fluid inclusion microthermometry in such sample(Table 2). In this case, TH of liquid-rich inclusions can be taken asthe real temperature of the fluid (trapping temperature, Tt), since wehave confirmed that boiling occurred during fluid inclusion entrap-ment (e.g. Wilkinson, 2001; Fig. 1). The resulting thermal profilesallow to establish paleo-depths (under the water table when thehydrothermal system was active) for the studied deposit (Table 1,Fig. 8). In this study,wehave shown that for paleo-depth calculation it isnecessary to consider the drop in fluid density that is caused by steambubbles. Neglecting this effect may lead to serious underestimations ofdepth (of ~40–50% for fluid temperatures of 200° to 225 ° C; Table 1,Fig. 8).
A difference between sampling depth (below the present surface)and paleo-depth calculated by the proposed method could indicatethe level of erosion that has affected the deposit. In the case ofBolaños, the calculated paleo-depth for the level in which boilingstarted is very similar to the sampling (present) depth, thus indicatingthat only the shallowest parts of the hydrothermal system may havebeen eroded. This agrees with the relatively young, Early Miocene-ageof the Bolaños deposit (~75% of the epithermal deposits in Mexico are
Eocene–Oligocene; Camprubí and Albinson, 2006), and with the factthat the host rocks of the mineralization are rhyolitic lavas andbreccias, very resistant to erosion.
Acknowledgements
Fluid inclusion microthermometry analyses were carried out inCentro de Geociencias, UNAM. Graciela Herrera Zamarrón is thankedfor her assistance in the mathematical aspects included in this work.Alfons M. Van den Kerkhof, Maria Luce Frezzotti and Pura Alfonso arethanked for their helpful comments and suggestions.
Appendix A. Supplementary data
Supplementary data to this article can be found online atdoi:10.1016/j.gexplo.2011.04.005.
References
Aguirre-Díaz, G.J., 2008. Types of collapse calderas. Reconstructing the Evolution ofcollapse calderas: magma storage, mobilization and eruption. Collapse CalderasWorkshop, IOP Conference Series: In: Gottsmann, J., Aguirre-Díaz, G.J. (Eds.), Earthand Environmental Science, 3. doi:10.1088/1755-1307/3/1/012021.
Aguirre-Díaz, G.J., González-Partida, E., Martí, J., Gutiérrez-Palomares, I., submitted forpublication. Graben type calderas of the Sierra Madre Occidental and associatedhydrothermal ore deposits: The Bolaños mining district case. Ore Geology Reviews.
Albinson, T., Rubio, M.A., 2001. Mineralogic and thermal structure of the Zuloaga vein,San Martín de Bolaños District, Jalisco, Mexico. Society of Economic GeologistsSpecial Publication Series 8, 115–132.
Albinson, T., Norman, D.I., Cole, D., Chomiak, B.A., 2001. Controls on formation of low-sulfidation epithermal deposits in Mexico: constraints from fluid inclusion andstable isotope data. Society of Economic Geologists Special Publication Series 8,1–32.
André-Mayer, A.-S., Leroy, J., Bailly, L., Chauvet, A., Marcoux, E., Grancea, L., Llosa, F.,Rosas, J., 2002. Boiling and vertical mineralization zoning: a case study from theApacheta low-sulfidation epithermal gold-silver deposit, south Peru. MineraliumDeposita 37, 452–464.
Bain, R.W., 1964. Steam tables 1964. Her Majesty's Stationery Office, Edinburgh,Scotland, UK.
125C. Canet et al. / Journal of Geochemical Exploration 110 (2011) 118–125
Berger, B.R., Eimon, P.I., 1983. Conceptual models of epithermal metal deposits.Cameron Volume on Unconventional Mineral Deposits. Am. Inst. Min. Metall. andPet. Eng., New York, USA, pp. 191–205.
Bodnar, R.J., Reynolds, T.J., Kuehn, C.A., 1985. Fluid inclusion systematics in epithermalsystems. Geology and geochemistry of epithermal systems: In: Berger, B.R., Bethke,P.M. (Eds.), Reviews in Economic Geology, 2, pp. 73–97.
Brown, K.L., 1986. Gold deposition from geothermal discharges in New Zealand.Economic Geology 81, 979–983.
Browne, P.R.L., 1978. Hydrothermal alteration in active geothermal fields. AnnualReview of Earth and Planetary Sciences 6, 229–248.
Browne, P.R.L., Ellis, A.J., 1970. The Ohaki-Broadlands hydrothermal area, New Zealand;mineralogy and related geochemistry. American Journal of Science 269, 97–131.
Camprubí, A., Albinson, T., 2006. Depósitos epitermales en México: actualización de suconocimiento y reclasificación empírica. Boletín de la Sociedad GeológicaMexicana, Volumen Conmemorativo del Centenario, LVIII. 27–81.
Cole, D.R., Drummond, S.E., 1986. The effect of transport and boiling on Ag/Au ratios inhydrothermal solutions: a preliminary assessment and possible implications forthe formation of epithermal precious-metal ore deposits. Journal of GeochemicalExploration 25, 45–79.
Del Blanco, M., Etcheverry, R., Marchionni, D., Tessone, M., Recio, C., 2009.Características de un yacimiento epitermal somero en el macizo del Deseado,Patagonia. Revista de la Asociación Geológica Argentina 64, 373–382.
Drummond, S.E., Ohmoto, H., 1985. Chemical evolution and mineral deposition inboiling hydrothermal systems. Economic Geology 80, 126–147.
Ferrari, L., Valencia-Moreno, M., Bryan, S., 2007. Magmatism and tectonics of the SierraMadre Occidental and its relation with the evolution of the western margin ofNorth America. Geology of Mexico: celebrating the centenary of the GeologicalSociety of Mexico: In: Alaniz-Álvarez, S.A., Nieto-Samaniego, Á.F. (Eds.), GeologicalSociety of America Special Paper, 422, pp. 1–39.
Haas Jr., J.L., 1970. An equation for the density of vapor-saturated NaC1-H2O solutionsfrom 75º to 325 °C. American Journal of Science 269, 489–493.
Haas, J.L., 1971. The effect of salinity on the maximum thermal gradient of ahydrothermal system at hydrostatic pressure. Economic Geology 1, 940–946.
Hedenquist, J.W., 1991. Boiling and dilution in the shallow portion of the Waiotapugeothermal system, New Zealand. Geochimica et Cosmochimica Acta 55,2753–2765.
Hedenquist, J., Henley, R., 1985. The importance of CO2 on freezing point measurementsof fluids inclusions: evidence from active geothermal systems and implications forepithermal ore deposition. Economic Geology 80, 1379–1406.
Henley, R.W., Truesdell, A.H., Barton, P.B., 1984. Fluid-mineral equilibria in hydrothermalsystems. Society of Economic Geologists, Reviews in Economic Geology 1, El Paso,Texas, USA.
Jébrak, M., 1997. Hydrothermal breccias in vein-type ore deposits: a review ofmechanisms, morphology and size distribution. Ore Geology Reviews 12, 111–134.
Jobson, D.H., Boulter, C.A., Foster, R.P., 1994. Structural controls and genesis ofepithermal gold-bearing breccias at the Lebong Tandai mine, Western Sumatra,Indonesia. Journal of Geochemical Exploration 50, 409–428.
Knight, C.L., Bodnar, R.J., 1989. Synthetic fluid inclusions: IX. Critical PVTX properties ofNaCl–H2O solutions. Geochimica et Cosmochimica Acta 53, 3–8.
Large, R.R., 1992. Australian volcanic-hosted massive sulfide deposits: features, styles,and genetic models. Economic Geology 87, 471–510.
Lyons, J.I., 1988. Geology and ore deposits of the Bolanos silver district, Jalisco, Mexico.Economic Geology 83, 1560–1582.
Rodríguez-Díaz, A.A., Blanco-Florido, D., Canet, C., Gervilla-Linares, F., González-Partida,E., Prol-Ledesma, R.M., Morales-Ruano, S., García-Vallès, M., 2010. Metalogenia deldepósito de manganeso Santa Rosa, Baja California Sur, México. Boletín de laSociedad Geológica Mexicana 62, 141–159.
Roedder, E., 1984. Fluid inclusions. In: Ribbe, P.H. (Ed.), Mineralogical Society ofAmerica. Reviews in Mineralogy, vol. 12, 644 p.
Rogers, G.F.C., Mayhew, Y.R., 1981. Thermodynamic and transport properties of fluids,third ed. Basil Blackwell, Oxford, UK.
Ruaya, J.R., Seward, T.M., 1986. The stability of chlorozinc(II) complexes inhydrothermal solutions up to 350 °C. Geochimica et Cosmochimica Acta 50,651–661.
Scott, A.-M., Watanabe, Y., 1998. “Extreme boiling” model for variable salinity of theHokko low-sulfidation epithermal Au prospect, southwestern Hokkaido, Japan.Mineralium Deposita 33, 568–578.
Seward, T.M., 1973. Thio complexes of gold and the transport of gold in hydrothermalore solutions. Geochimica et Cosmochimica Acta 37, 379–399.
Simmons, S.F., Brown, K.L., 2006. Gold in Magmatic hydrothermal solutions and therapid formation of a giant ore deposit. Science 314, 288–291.
Simmons, S.F., Browne, P.R.L., 1997. Saline fluid inclusions in sphalerite from theBroadlands-Ohaaki geothermal system: a coincidental trapping of fluids beingboiled toward dryness. Economic Geology 92, 485–489.
Simmons, S.F., Browne, P.R.L., 2000. Mineralogical indicators of boiling in two lowsulfidation epithermal environments: the Broadlands-Ohaaki and Waiotapugeothermal systems. In: Cluer, J.K., Price, J.G., Struhsacker, E.M., Hardyman, R.F.,Morris, C.L. (Eds.), Geology and Ore Deposits 2000: The Great Basin and Beyond.Geological Society of Nevada Symposium Proceedings, USA, pp. 683–690.
Simmons, S.F., Christenson, B.W., 1994. Origins of calcite in a boiling geothermalsystem. American Journal of Science 294, 361–400.
Skinner, B.J., 1997. Hydrothermal mineral deposits: what we do and don't know, In:Barnes, H.L. (Ed.), Geochemistry of Hydrothermal Ore Deposits, third ed. Wiley,New York, USA, pp. 1–29.
Smith, L.B., Keyes, F.G., 1934. The volumes of unit mass of liquid water and theircorrelation as a function of pressure and temperature. Part III. Steam researchprogram. American Academy of Arts and Sciences Proceedings 69, 285–312.
Spycher, N.F., Reed, M.H., 1989. Evolution of a Broadlands-type epithermal ore fluidalong alternative P-T paths: implications for the transport and deposition of base,precious, and volatile metals. Economic Geology 84, 328–359.
Taguchi, S., Hayashi, M., 1982. Application of the fluid inclusion thermometer to somegeothermal fields in Japan. Trans. Geother. Res. Counc. 6, 59–62.
Van den Kerkhof, A.M., Hein, U.F., 2001. Fluid inclusion petrography. Lithos 55, 27–47.Wilkinson, J.J., 2001. Fluid inclusions in hydrothermal ore deposits. Lithos 55, 229–272.
Copyright © 2022 FDOKUMEN