EXPERIMENTS ON DOMINANT FORCE REGIMES IN FLOW BOILING USING MINI-TUBES
8
1 EXPERIMENTS ON DOMINANT FORCE REGIMES IN FLOW BOILING USING MINI-TUBES Soumei Baba a,* , Nobuo Ohtani a , Osamu Kawanami b , Koichi Inoue c , Haruhiko Ohta a a Department of Aeronautics and Astronautics, Kyushu University, Fukuoka, Fukuoka 819-0395, Japan b Department of Mechanical and System Engineering, University of Hyogo, Himeji, Hyogo, 671-2201, Japan c Faculty of Environmental Engineering, Kitakyushu University, Kitakyushu, Fukuoka, 808-0157, Japan ABSTRACT Effects of tube orientation on flow boiling heat transfer coefficients were investigated for FC72 flowing in single mini-tubes with tube diameters of 0.13 and 0.51 mm to define boundaries on a dominant force regime map. For the tube diameter of 0.51 mm, when mass velocity and vapor quality was varied, heat transfer coefficients were influenced by tube orientation at Froude number Fr < 4, while the effect of tube orientation on heat transfer coefficients disappears at Fr > 4. The results indicated that the boundary between the body force dominated and the inertia dominated regimes was given by Fr 4. On the other hand, for tube diameter of 0.13 mm, almost no effect of tube orientation on heat transfer coefficients was observed for all combinations of mass velocity and vapor quality tested, where heat transfer coefficients were independent of mass velocity and vapor quality at Weber number We < 5, and vice versa. The results indicated that the boundary between the surface tension dominated and the inertia dominated regimes was represented by We 5. From the above results, the boundary between the surface tension dominated and the body force dominated regimes was existed between Bo = 0.51 and 0.033. Keywords: Flow boiling, Heat transfer, Minichannel, Dominant force regimes * Corresponding author. Email: [email protected] 1. INTRODUCTION Recent increase in the size of space platforms requires the management of larger amount of waste heat under high heat flux conditions and the transportation of it along a long distance to the radiator. Flow boiling applied to the thermal management system in space attracts much attention as a promising means to realize high-performance heat transfer and transport due to latent heat of vaporization. In microgravity two-phase flow phenomena are quite different from those under normal gravity conditions because buoyancy effects are significantly reduced and surface tension becomes dominant. By the similar reason, flow boiling characteristics in minichannels are not the same as those in channels of the normal sizes. In the present stage, however, the conditions at the boundary between the regimes of body force dominated and of surface tension dominated are not clear. The design of space thermal devices, operated under the conditions where no influence of gravity is expected, will improve the reliability of their ground tests. For this reason, the quantitative clarification of boundaries for dominant force regimes is required in advance. Although a number of experiments on flow boiling heat transfer in minichannels were conducted in the last decade, there is limited flow boiling heat transfer data obtained by a single circular heated tube due to the difficulty of precise measurement. Tran et al. (1996) measured local flow boiling heat transfer coefficients for R12 in a single circular tube with tube diameter of 2.46 mm. They reported that heat transfer coefficients were a function of heat flux, and that the effect of vapor quality and mass velocity was small. They concluded that nucleate boiling heat transfer dominated in a minichannel over wide vapor quality ranges of 0.20.8. Lazarek and Black (1982), Bao et al. (2000), Owhaib et al. (2004), and Saisorn et al. (2010) also obtained similar results by the experiments using a single circular tube with 0.833.1 mm. Yen et al. (2003, 2006) measured local heat transfer coefficient for FC72 and R123 flowing in single circular tubes with 0.190.51 mm. However, they observed only monotonically decreasing trend of heat transfer coefficient with increasing vapor quality. Lin et al. (2001) measured local heat transfer coefficient for R141b flowing upward in a vertical 1.1 mm circular tube. Unlike the aforementioned experiments, they observed a significant influence of vapor quality on heat transfer coefficient. At low heat fluxes, the heat transfer coefficient increased consistently with increasing vapor quality. At moderate heat fluxes, the heat transfer coefficient became independent of vapor quality. At high heat fluxes, the heat transfer coefficient took a peak value just after the initiation of nucleate boiling and followed by a consistent decrease. Shiferaw (2009) also obtained similar results by the experiments using a single circular tube with 1.1 mm. Saitoh et al. (2005) conducted flow boiling experiments of R134a flowing in single circular tubes with 0.513.1 mm. In the experiments using smaller tubes, they also observed a trend of increase in heat transfer coefficient with increasing vapor quality at lower vapor quality and a trend of decrease at high vapor quality. The decrease in heat transfer coefficient began at lower vapor quality for smaller tube. In and Jeong (2009) measured local heat transfer coefficient for R123 and R134a flowing upward in a 0.19 mm circular tube. They observed different trends between R123 and R134a in heat transfer coefficient. The flow boiling heat transfer of R123 shows that the heat transfer coefficients depend on mass velocity, heat flux and vapor quality. On the contrary, the heat transfer trends of R134a are similar to those of macro-channels. The heat transfer coefficients are strongly dependent on heat flux and saturation pressure at low and intermediate vapor quality, but the effects of mass velocity Frontiers in Heat and Mass Transfer Available at www.ThermalFluidsCentral.org
-
Upload
independent -
Category
Documents
-
view
4 -
download
0
Transcript of EXPERIMENTS ON DOMINANT FORCE REGIMES IN FLOW BOILING USING MINI-TUBES

1
EXPERIMENTS ON DOMINANT FORCE REGIMES IN FLOW BOILING
USING MINI-TUBES
Soumei Babaa,*
, Nobuo Ohtania, Osamu Kawanami
b, Koichi Inoue
c, Haruhiko Ohta
a
a Department of Aeronautics and Astronautics, Kyushu University, Fukuoka, Fukuoka 819-0395, Japan b Department of Mechanical and System Engineering, University of Hyogo, Himeji, Hyogo, 671-2201, Japan
c Faculty of Environmental Engineering, Kitakyushu University, Kitakyushu, Fukuoka, 808-0157, Japan
ABSTRACT
Effects of tube orientation on flow boiling heat transfer coefficients were investigated for FC72 flowing in single mini-tubes with tube diameters of
0.13 and 0.51 mm to define boundaries on a dominant force regime map. For the tube diameter of 0.51 mm, when mass velocity and vapor quality
was varied, heat transfer coefficients were influenced by tube orientation at Froude number Fr < 4, while the effect of tube orientation on heat
transfer coefficients disappears at Fr > 4. The results indicated that the boundary between the body force dominated and the inertia dominated
regimes was given by Fr 4. On the other hand, for tube diameter of 0.13 mm, almost no effect of tube orientation on heat transfer coefficients was
observed for all combinations of mass velocity and vapor quality tested, where heat transfer coefficients were independent of mass velocity and vapor
quality at Weber number We < 5, and vice versa. The results indicated that the boundary between the surface tension dominated and the inertia
dominated regimes was represented by We 5. From the above results, the boundary between the surface tension dominated and the body force
dominated regimes was existed between Bo = 0.51 and 0.033.
Keywords: Flow boiling, Heat transfer, Minichannel, Dominant force regimes
* Corresponding author. Email: [email protected]
1. INTRODUCTION
Recent increase in the size of space platforms requires the management
of larger amount of waste heat under high heat flux conditions and the
transportation of it along a long distance to the radiator. Flow boiling
applied to the thermal management system in space attracts much
attention as a promising means to realize high-performance heat
transfer and transport due to latent heat of vaporization. In microgravity
two-phase flow phenomena are quite different from those under normal
gravity conditions because buoyancy effects are significantly reduced
and surface tension becomes dominant. By the similar reason, flow
boiling characteristics in minichannels are not the same as those in
channels of the normal sizes. In the present stage, however, the
conditions at the boundary between the regimes of body force
dominated and of surface tension dominated are not clear. The design
of space thermal devices, operated under the conditions where no
influence of gravity is expected, will improve the reliability of their
ground tests. For this reason, the quantitative clarification of boundaries
for dominant force regimes is required in advance.
Although a number of experiments on flow boiling heat transfer in
minichannels were conducted in the last decade, there is limited flow
boiling heat transfer data obtained by a single circular heated tube due
to the difficulty of precise measurement. Tran et al. (1996) measured
local flow boiling heat transfer coefficients for R12 in a single circular
tube with tube diameter of 2.46 mm. They reported that heat transfer
coefficients were a function of heat flux, and that the effect of vapor
quality and mass velocity was small. They concluded that nucleate
boiling heat transfer dominated in a minichannel over wide vapor
quality ranges of 0.20.8. Lazarek and Black (1982), Bao et al. (2000),
Owhaib et al. (2004), and Saisorn et al. (2010) also obtained similar
results by the experiments using a single circular tube with 0.833.1
mm. Yen et al. (2003, 2006) measured local heat transfer coefficient for
FC72 and R123 flowing in single circular tubes with 0.190.51 mm.
However, they observed only monotonically decreasing trend of heat
transfer coefficient with increasing vapor quality. Lin et al. (2001)
measured local heat transfer coefficient for R141b flowing upward in a
vertical 1.1 mm circular tube. Unlike the aforementioned experiments,
they observed a significant influence of vapor quality on heat transfer
coefficient. At low heat fluxes, the heat transfer coefficient increased
consistently with increasing vapor quality. At moderate heat fluxes, the
heat transfer coefficient became independent of vapor quality. At high
heat fluxes, the heat transfer coefficient took a peak value just after the
initiation of nucleate boiling and followed by a consistent decrease.
Shiferaw (2009) also obtained similar results by the experiments using
a single circular tube with 1.1 mm. Saitoh et al. (2005) conducted flow
boiling experiments of R134a flowing in single circular tubes with
0.513.1 mm. In the experiments using smaller tubes, they also
observed a trend of increase in heat transfer coefficient with increasing
vapor quality at lower vapor quality and a trend of decrease at high
vapor quality. The decrease in heat transfer coefficient began at lower
vapor quality for smaller tube. In and Jeong (2009) measured local heat
transfer coefficient for R123 and R134a flowing upward in a 0.19 mm
circular tube. They observed different trends between R123 and R134a
in heat transfer coefficient. The flow boiling heat transfer of R123
shows that the heat transfer coefficients depend on mass velocity, heat
flux and vapor quality. On the contrary, the heat transfer trends of
R134a are similar to those of macro-channels. The heat transfer
coefficients are strongly dependent on heat flux and saturation pressure
at low and intermediate vapor quality, but the effects of mass velocity
Frontiers in Heat and Mass Transfer
Available at www.ThermalFluidsCentral.org

2
and vapor quality are insignificant. At high vapor quality, the mass
velocity effect is dominant while the effects of heat flux and saturation
pressure are small. Ong and Thome (2009) measured local heat transfer
coefficient for R134a, R236fa and R245fa flowing in a single circular
tube with 1.03 mm. They modified an isolated bubble (IB)/coalescing
bubble (CB)/annular flow map to investigate the influence of flow
pattern on the heat transfer coefficient. They observed the heat transfer
coefficients of R134a and R236fa increase with increasing heat flux in
the IB flow regime at low mass velocity conditions. On the other hand,
after a flow regime transition from CB to annular flow, the heat transfer
of R236fa and R245fa increases with vapor quality and converge
monotonically at higher vapor quality.
In flow boiling in mini-channels, back flow could be occurred
because of rapid growth of bubbles in a confined cross section area of
mini-tubes, resulting flow rate fluctuation. Flow boiling heat transfer
characteristics in minichannels can change considerably by the
existence of inlet flow rate fluctuation. Ohta et al. (2009) investigated
experimentally the effect of flow fluctuation at the heated section inlet
on flow boiling heat transfer and to clarify reasons for existing
deviation in the heat transfer data for minichannels. It is important to
pay attention to the experimental accuracy and to use a single circular
mini-tube to compare heat transfer characteristics with those for normal
size tubes.
The criteria for the classification of small channels have given by
the researchers. Kew and Cornwell (1997) introduced a Confinement
number Co which is based on the definition of the Laplace constant and
suggested the threshold criterion with limited data as
5.0
5.0
2
hvldg
Co
(1)
where, σ is surface tension, g is gravitational acceleration, ρl, and ρv are
liquid and vapor density and dh is hydraulic diameter of the channel. An
alternative criterion to discriminate between micro and macroscale heat
exchangers is that proposed by Mehendale et al. (2000) which is simply
based on the hydraulic diameter. The hydraulic diameter range from 1
to 100 m is micro-heat exchangers, the range from 100 m to 1 mm is
meso-heat exchangers, the range from 1 mm to 6 mm is compact heat
exchangers, and values above 6 mm being conventional heat
exchangers. Kandlikar (2002) employed the hydraulic diameter as an
important parameter for defining the channels as follows: the hydraulic
diameter range from 10 to 200 m is microchannels, the range from
200 m to 3 mm is minichannels and values above 3 mm being
macroscale channels. Ong and Thome (2011) conducted the flow
boiling experiment to clarify macro to microchannel transition in
horizontal mini-tubes with I.D. 1.03, 2.20 and 3.04 mm using R134a,
R236fa and R245fa as test fluid. They proposed the criteria depend on
the results from liquid film thickness measurements by using Co as
follow: Co < 0.3–0.4 is macroscale flow, while Co > 1 is symmetric
microscale flow and the transition criterion is 0.3–0.4 < Co <1.
In the present paper, effects of tube orientation on flow boiling
heat transfer characteristics were investigated for FC72 flowing in
single mini-tubes with tube diameters of 0.13 and 0.51 mm to define
boundaries on a dominant force regime map.
2. DOMINANT FORCE REGIME MAP
In order to clarify the influences of three major forces, following
dimensionless parameters; Bond number Bo, Weber number We and
Froude number Fr are defined here
σ
dg)ρ(ρBo
2
ivl
(2)
σρ
dG
σ
duρWe
m
i
2
i
2
mm (3)
ivlmdg)ρ(ρρ
G
Bo
WeFr
(4)
where, di: tube inner diameter, G: mass velocity, um: mean velocity, ρm=
1/[x/ρv+(1-x)/ρl]: mean density of liquid and vapor, x: vapor quality and
σ: surface tension. Therefore, Bo, We, Fr represent ratios of buoyancy to
surface tension, inertia to surface tension and inertia to buoyancy,
respectively. Fig. 1 shows the existing map for dominant force regimes
proposed by Reynolds et al. (1964) for the dynamic motion of a liquid-
gas system in low gravity. The influence of inertia is varied by the
change of vapor quality, i.e. ratio of vapor mass flow rate to the total,
under a constant mass velocity, where the velocity of liquid-vapor
mixtures is increased with increasing vapor quality
There are four points to be clarified concerning the present regime
map.
1. Boundaries of regimes are doubtful.
2. Definitions of parameters should be revised.
3. Parameters and boundaries should be changed by different
targets such as heat transfer coefficient, flow patterns,
pressure drop and critical heat flux.
4. Influence of vapor quality is unknown. Increase in vapor
quality increases inertia force due to the increase in liquid-
vapor mixture velocity despite of decrease in mixture density.
It is doubtful that the effect of gravity level is equivalent to the
effect of direction of the gravity vector on the definition of regime
boundary between the body force dominated and the surface tension
dominated through Bond number. The microgravity experiments are
useful for the verification of the effect of gravity level on these regimes.
In further studies, the results obtained under microgravity conditions
are to be reflected to confirm the effect of gravity level on the
boundaries at very low Bond numbers.
3. EXPERIMENTAL APPARATUS
The structure of experimental setup is shown in Fig.2. The system is
operated as an open system. Subcooled liquid is supplied from a syringe
pump through a conduit monitoring flow fluctuation and a filter before
the inlet of a test section. Flow fluctuation was minimized by
employing a high-powered syringe pump. In order to minimize the flow
fluctuation due to the flow resistance change resulting from the bubble
growth in a small diameter tube, a high-powered syringe pump is
Body force dominated
Surfacetension dominated
Inertia dominated
1
Fr =
1
1
Fig. 1 Existing dominant force regime map. (Reynolds et al., 1964)

3
connected. The liquid flow rate and its fluctuation at the inlet of test
section are monitored by the measurement of pressure drop across a
non-heated small circular tube with an inner diameter di = 0.51 mm and
a length l = 100 mm.
The test section is shown in Fig.3. To introduce electric current for
joule heating from a regulated DC power supply, copper electrodes are
soldered on the tube outer surfaces at both ends of the heated section.
To eliminate the effects of voltage drops at the junctions of electrodes
and at lead wires, two voltage taps are additionally soldered just inside
of the electrodes for electric current, and the heating rate is evaluated
with high accuracy based on the power input. In order to keep electrical
insulation, all tubes connected to the test section are made of Teflon.
Table 1 lists the dimensions of the two test tubes employed here.
The unheated section operates as a hydrodynamic entrance region, and
the fully developed flow is established at the inlet of the heated section.
Nineteen K-type bare thermocouples with a diameter of 0.08 mm are
directly soldered to the outer surface of the tube along the entire heated
section. The values of electromotive force of bare thermocouples are
obtained by subtracting the additional voltages, which is unavoidably
picked up due to the application of heating current directly to the tube
wall, from the measured values. Both ends of the test tube are
connected to small polycarbonate blocks with pressure taps, and K-type
sheathed thermocouples are inserted in them. To minimize the heat loss
from the heated tube and to establish steady state in a short time, the
test section is installed in an acrylic vacuum cylinder with an inside
diameter of 190 mm and a length of 350 mm. In all experimental
conditions tested, only a few minutes are required to obtain the data
regarded as that of steady-state condition, which is judged by
monitoring electromotive force of all thermocouples. The pressure
drops across the test section and across the section monitoring flow
fluctuation are measured by the differential pressure transducers. In the
present experiments, the pressure at the outlet of the test section is kept
at near atmospheric pressure, where the saturation temperature is 56 C
at 0.1MPa for fluorinert FC72 employed as a test fluid. The outlet
pressure of the test section is varied to some extent as 0.100.11 MPa,
depending on the pressure drop at downstream. Flow boiling heat
transfer of FC72 in a small diameter tube is influenced by dissolved air,
as mentioned in our previous report (Ohta et al., 2009). Test fluid in the
reservoir was initially degassed by vacuum deaeration for more than 10
minutes. Compressible gas was completely removed from the
components of the test loop. Then, the deaerated test fluid was filled
with the test loop from the reservoir. Experimental conditions are
shown in Table 2.
If the regime map is described by using Bond, Weber and Froude
numbers above mentioned, the boundary of dominant forces of body
force and inertia is examined by using the mini-tube of the larger
Fig. 2 Experimental setup.
Fig. 3 Test section.
Table 1 Dimension of test tubes.
Type of
tube
Inner
diameter
di mm
Outer
diameter
do mm
Heated
length mm
Unheated
length mm
A 0.51 0.81 200 37
B 0.13 0.31 100 30
Syringe pump
DP
DP
Filter
Vacuum pump
Acrylic vacuum cylinder
Flow fluctuation monitoring section
T T
DP : Differential pressure transducer
: Thermocouple
Outlet
tank
Valve (Filter)
P
P : Pressure transducer
T
T
Test section
Flow
Flow
K-type thermocouple
Standard resistanceRegulated DC power
Unheated section
z
Tube
Heated section
DP
TT
VV0
Flow
P
Fig. 4 The experimental condition in present study and existing
boundary for the classification of small channels proposed by
Kew and Cornwell (1997), Mehendale et al. (2000) and
Kandlikar (2002) on dominant force regime map for FC72.
Table 2 Experimental conditions.
Test fluid FC72(deaerated)
Inlet subcooling Tsub = 3233 K
Mass velocity G = 50200 kg/m2s
Heat flux q = 2.616.4 kW/m2
Outlet pressure Pout = 0.100.11 MPa
Flow direction Horizontal,
Vertical upward,
Vertical downward,
10-3 10-2 10-1 100 101 102 10310-3
10-2
10-1
100
101
102
103
We
Bo
g
I
Present study di = 0.51mm
G = 50 kg/m2s
G = 200 kg/m2s
di = 0.13mm G = 50 kg/m
2s
G = 200 kg/m2s
COPY: 16,8,180,118
Kew and Cornwell Micro-MacroMehendale et al. Compact-Conventional Meso-Compact Micro-MesoKandlikar Mini-Macro Micro-Mini
4
diameter employed here at a constant Bond number Bo = 5.110-1, and
the boundary of surface tension and inertia by using the mini-tube of
smaller diameter at Bo = 3.310-2. Figure 4 shows experimental
conditions in present study and existing boundary for the classification
of small channels proposed by Kew and Cornwell, Mehendale et al. and
Kandlikar on dominant force regime map.
4. DATA TREATMENT
The distribution of inner wall temperature, heat flux, fluid temperature,
vapor quality, and heat transfer coefficient along the heated section is
calculated as discrete values at each location of nineteen thermocouples
based on the measured values of outer wall temperatures, flow rate,
inlet liquid temperature, and pressures. The local heat generation rate is
calculated by using a value of electric current and local electric
resistance of stainless steel tube. The local electric resistance is
evaluated at the local temperature using the temperature coefficient of
stainless steel. Because the electric resistance increases with an increase
in temperature, the heat generation per unit length is slightly larger in
the downstream of the heated section by 1% at the highest heat flux
tested. The heat loss from the outer tube wall to the ambient is
evaluated by the difference between the outer wall temperature and
ambient temperature in the vacuum cylinder, which is calibrated in
advance. By the introduction of vacuum cylinder and thin
thermocouples, the heat loss is less than 50% of the heat input even at
the lowest heat flux tested. Because the ratio of the tube wall thickness
to the axial distance between the positions of neighboring
thermocouples is small, the heat transfer due to the axial conduction
across the tube wall is negligible to the heat transferred to test fluid.
The inner wall temperature and the inner wall heat flux at each
thermocouple location are evaluated by the radial heat conduction from
the measured outer wall temperature and the local heat generation rate,
taking into account the heat loss.
The inlet liquid temperature is measured by a K-type sheathed
thermocouple inserted in the inlet Teflon block. The mean local fluid
enthalpy h at each thermocouple location is calculated from the heat
balance equation. The local vapor quality x assuming thermal
equilibrium is calculated by
lv
l
hh
hhx
(5)
where hl and hv are enthalpies of saturated liquid and saturated vapor,
respectively, evaluated at the local value of pressure. The local heat
transfer coefficient α at the location of each thermocouple is defined by
fwΤΤ
qα
(6)
where, q: inner wall heat flux to fluid, Tw: inner wall temperature, Tf:
mean fluid temperature. Tf is evaluated from the heat balance equation.
The saturation temperature Tsat is used as Tf in the quality region x > 0.
A value of two-phase pressure drop in the quality region is obtained by
subtracting the value in the unheated section and the subcooled region
from the pressure drop across the entire test section. The single-phase
pressure drop is evaluated in the subcooled region, ignoring the
possibility of partial boiling. In the quality region, linear pressure drop
is assumed using the pressures at the end of the subcooled region and at
the outlet of the test section. Distribution of saturation temperature in
the quality region is obtained by the pressure distribution. All of the
instruments used are carefully calibrated. The uncertainty in
temperature measurement is ±0.15 K, pressure measurement 0.04 kPa,
and flow rate setting ±0.35%. The accuracy of heat transfer coefficients
is evaluated to be 20%.
5. EXPERIMENTAL RESULTS AND DISCUSSION
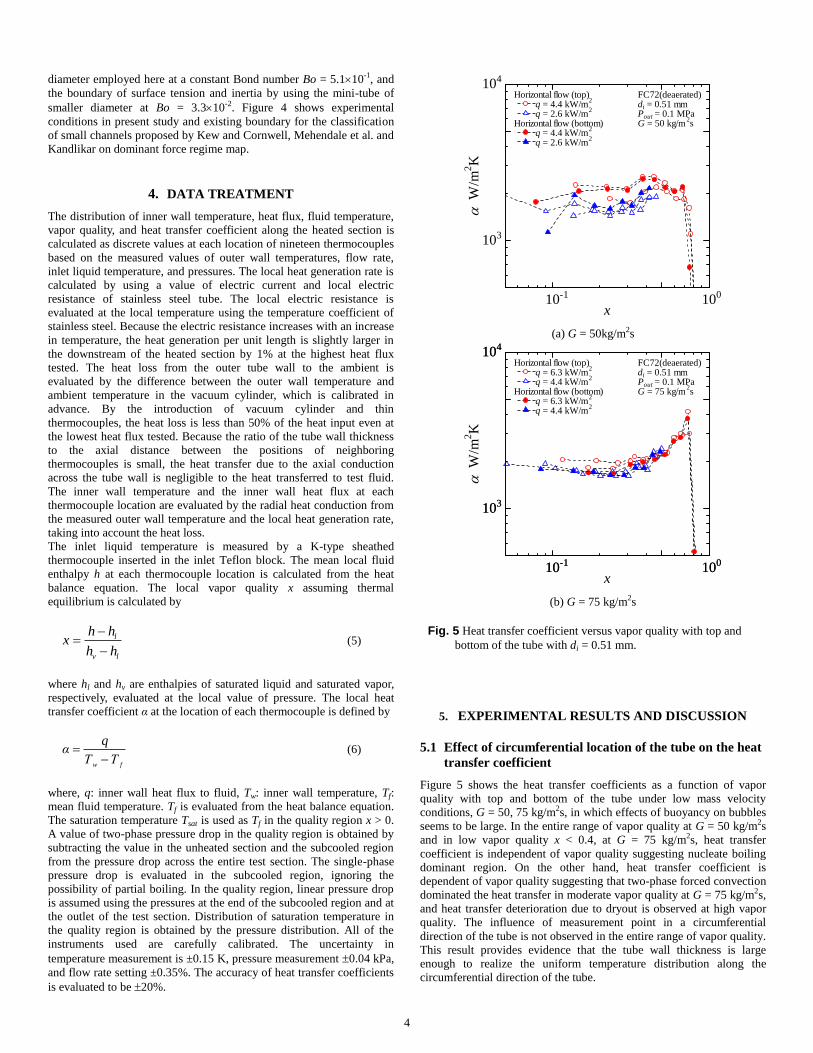
5.1 Effect of circumferential location of the tube on the heat
transfer coefficient
Figure 5 shows the heat transfer coefficients as a function of vapor
quality with top and bottom of the tube under low mass velocity
conditions, G = 50, 75 kg/m2s, in which effects of buoyancy on bubbles
seems to be large. In the entire range of vapor quality at G = 50 kg/m2s
and in low vapor quality x < 0.4, at G = 75 kg/m2s, heat transfer
coefficient is independent of vapor quality suggesting nucleate boiling
dominant region. On the other hand, heat transfer coefficient is
dependent of vapor quality suggesting that two-phase forced convection
dominated the heat transfer in moderate vapor quality at G = 75 kg/m2s,
and heat transfer deterioration due to dryout is observed at high vapor
quality. The influence of measurement point in a circumferential
direction of the tube is not observed in the entire range of vapor quality.
This result provides evidence that the tube wall thickness is large
enough to realize the uniform temperature distribution along the
circumferential direction of the tube.
10-1 100
103
104
FC72(deaerated)di = 0.51 mmPout = 0.1 MPaG = 50 kg/m
2s
Horizontal flow (top) q = 4.4 kW/m
2
q = 2.6 kW/m2
x
W/m
2K
Horizontal flow (bottom) q = 4.4 kW/m
2
q = 2.6 kW/m2
(a) G = 50kg/m2s
10-1 100
103
104
FC72(deaerated)di = 0.51 mmPout = 0.1 MPaG = 75 kg/m
2s
Horizontal flow (top) q = 6.3 kW/m
2
q = 4.4 kW/m2
x
W/m
2K
10-1 100
103
104
Horizontal flow (bottom) q = 6.3 kW/m
2
q = 4.4 kW/m2
(b) G = 75 kg/m2s
Fig. 5 Heat transfer coefficient versus vapor quality with top and
bottom of the tube with di = 0.51 mm.

5
5.2 Effect of tube orientation on the heat transfer coefficient
The relation between the heat transfer coefficient and vapor quality for
di = 0.51 mm at G = 50-200 kg/m2s is shown in Fig.6. In the entire
range of vapor quality at G = 50 kg/m2s and in low vapor quality x <
0.4, at G = 75 kg/m2s, heat transfer coefficients were influenced by tube
orientation, heat transfer coefficients in the horizontal tube are higher
than those in vertical tubes. Furthermore, heat transfer coefficients are
constant with vapor quality for the horizontal tube, while heat transfer
coefficients are increase with increasing vapor quality for the vertical
tube. On the other hand, the effect of tube orientation were decreased
under high vapor quality x > 0.3 at G = 75 kg/m2s and in the entire
range of vapor quality at G = 100, 200 kg/m2s. In the horizontal tube
under low vapor quality condition, the local liquid film thickness at the
tube top becomes thinner because the position of elongated bubbles is
influenced by buoyancy (Han and Shikazono, 2009). Because
enhancement of heat transfer at the top overcomes the deterioration at
the bottom, the heat transfer coefficients in the horizontal tube are
higher than those in vertical tubes. On the other hand, under high vapor
quality conditions, there is uniform distribution of liquid film thickness
for each tube orientation. The effect of mass velocity and heat flux is
not confirmed because the experiments were operated within narrow
range of heat flux to prevent the temperature excursion due to dryout
near the outlet of the tube. It is need to perform experiments under
higher heat flux conditions by altering tube length in further studies.
The relation between the heat transfer coefficient and Froude number
which represents ratio of inertia to buoyancy for di = 0.51 mm tube for
all mass velocity conditions is shown in Fig.7. Under low inertia
conditions at Froude number Fr < 4, the heat transfer coefficient is
independent on vapor quality in the horizontal tube. The results
indicated that the boundary between the body force dominated and the
inertia dominated regimes is given by Froude number as Fr ≈ 4 (shown
as red vertical dashed line in Fig. 6 and 7).
The relation between heat transfer coefficient and vapor quality for
di = 0.13 mm at G = 50-200 kg/m2s is shown in Fig.8. Although there is
scattering in the heat transfer data, almost no effect of tube orientation
on heat transfer coefficients is observed for all combinations of mass
velocity and vapor quality. Under low mass velocity conditions at G =
50, 75 kg/m2s, heat transfer coefficients are independent of mass
velocity and vapor quality, while the effect of vapor quality on heat
transfer coefficients are observed under high mass velocity conditions
at G = 200 kg/m2s. The relation between heat transfer coefficient and
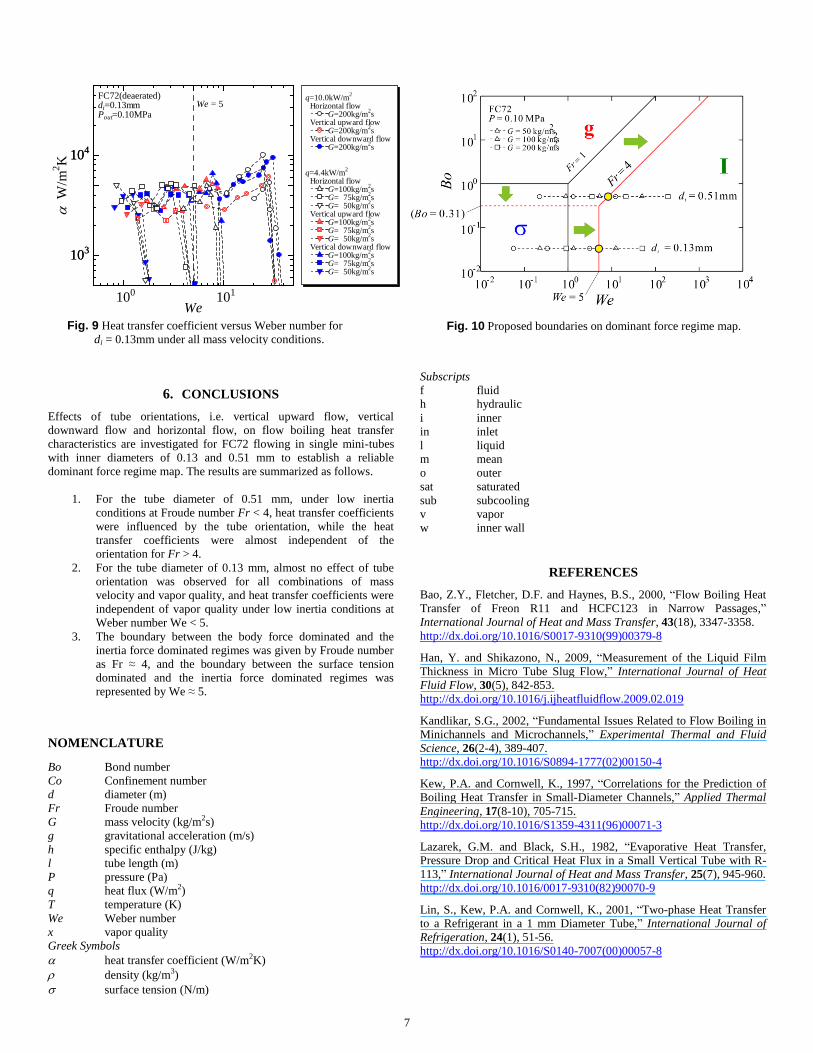
Weber number for di = 0.13 mm under all mass velocity conditions is
shown in Fig.9. Under low inertia conditions at Weber number We < 5,
heat transfer coefficients are independent of mass velocity and vapor
quality, while the effect of vapor quality on heat transfer coefficients are
observed for We > 5. The results implies the boundary between the
surface tension dominated and inertia dominated regimes is represented
by We ≈ 5 (shown as red vertical dashed line in Fig. 8 and 9).
The boundaries on the two-dimensional regime map reflecting
both results are shown in Fig.10. In addition, the boundary between the
surface tension dominated and the body force dominated regimes is
approximately evaluated as Bo ≈ 3.110-1 from the crossing point of the
two boundary lines. This value located in the range of 3.310-2 < Bo <
5.110-1 is consistent with the boundary between the surface tension
dominated and the body force dominated regimes which were
confirmed for the employed smaller mini-tube (Bo = 3.310-2) and the
larger mini-tube (Bo = 5.110-1), respectively, under low inertia
conditions.
Vertical upward q=4.4kW/m
2
q=2.6kW/m2
FC72(deaerated)di=0.51mmPout=0.1MPaG=50kg/m
2s
x
Vertical downward q=4.4kW/m
2
q=2.6kW/m2
10-2 10-1 100
103
104
W
/m2K
Horizontal q=4.4kW/m
2
q=2.6kW/m2
10-2 10-1 100
103
104
FC72(deaerated)di=0.51mmPout=0.1MPaG=75kg/m
2s
Horizontal q=6.3kW/m
2
q=4.4kW/m2
Vertical upward q=6.3kW/m
2
q=4.4kW/m2
Vertical downward q=6.3kW/m
2
q=4.4kW/m2
x
W/m
2K
(a) G = 50 kg/m2s (b) G = 75 kg/m2s
10-2 10-1 100
103
104
Horizontal q=8.0kW/m
2
q=6.3kW/m2
Vertical upward q=8.0kW/m
2
q=6.3kW/m2
x
W/m
2K
Vertical downward q=8.0kW/m
2
q=6.3kW/m2
FC72(deaerated)di=0.51mmPout=0.1MPaG=100kg/m
2s
10-2 10-1 100
103
104
FC72(deaerated)di=0.51mmPout=0.1MPaG=200kg/m
2s
Horizontal q=16.4kW/m
2
q=12.7kW/m2
W/m
2K
Vertical upward q=16.4kW/m
2
q=12.7kW/m2
x
Vertical downward q=16.4kW/m
2
q=12.7kW/m2
(c) G = 100 kg/m2s (d) G = 200 kg/m2s
Fig. 6 Heat transfer coefficient versus vapor quality for di = 0.51 mm.

6
Vertical upward q=4.4kW/m
2
q=2.6kW/m2
FC72(deaerated)di=0.51mmPout=0.1MPaG=50kg/m
2s
Fr
Vertical downward q=4.4kW/m
2
q=2.6kW/m2
100 101
103
104
W/m
2K
Horizontal q=4.4kW/m
2
q=2.6kW/m2
100 101
103
104
FC72(deaerated)di=0.51mmPout=0.1MPaG=75kg/m
2s
Horizontal q=6.3kW/m
2
q=4.4kW/m2
Vertical upward q=6.3kW/m
2
q=4.4kW/m2
Vertical downward q=6.3kW/m
2
q=4.4kW/m2
Fr
W/m
2K
(a) G = 50 kg/m2s (b) G = 75 kg/m2s
100 101
103
104
Horizontal q=8.0kW/m
2
q=6.3kW/m2
Vertical upward q=8.0kW/m
2
q=6.3kW/m2
Fr
W/m
2K
Vertical downward q=8.0kW/m
2
q=6.3kW/m2
FC72(deaerated)di=0.51mmPout=0.1MPaG=100kg/m
2s
100 101
103
104
FC72(deaerated)di=0.51mmPout=0.1MPaG=200kg/m
2s
Horizontal q=16.4kW/m
2
q=12.7kW/m2
W/m
2K
Vertical upward q=16.4kW/m
2
q=12.7kW/m2
Fr
Vertical downward q=16.4kW/m
2
q=12.7kW/m2
(c) G = 100 kg/m2s (d) G = 200 kg/m2s
Fig. 7 Heat transfer coefficient versus Froude number for di = 0.51 mm.
10-2 10-1 100
103
104
FC72(deaerated)di=0.13mmPout=0.1MPaG=50kg/m
2s
W/m
2K
x
FY2009(100126) q = 2.6 kW/m
2
FY2009(100128) q = 4.4 kW/m
2
q = 3.5 kW/m2
q = 2.6 kW/m2
Horizontal q=4.4kW/m
2
q=2.6kW/m2
FY2009(100126) q = 2.6 kW/m
2FY2009(091223) q = 4.4 kW/m
2
q = 3.5 kW/m2
q = 2.6 kW/m2
Vertical upward q=4.4kW/m
2
q=2.6kW/m2
FY2009(100129) q = 4.4 kW/m
2
q = 3.5 kW/m2
q = 2.6 kW/m2
FY2010(100330) q = 4.4 kW/m
2
q = 3.5 kW/m2
q = 2.6 kW/m2
Vertical downward q=4.4kW/m
2
q=2.6kW/m2
10-2 10-1 100
103
104
FC72(deaerated)di=0.13mmPout=0.1MPaG=75kg/m
2s
W/m
2K
x
FY2009(091211) q = 6.3 kW/m
2
q = 4.4 kW/m2
q = 3.5 kW/m2
q = 2.6 kW/m2
FY2009(100126) q = 6.3 kW/m
2
q = 4.4 kW/m2
q = 3.5 kW/m2
q = 2.6 kW/m2
Horizontal q=6.3kW/m
2
q=2.6kW/m2
FY2009(091224) q = 6.3 kW/m
2
q = 4.4 kW/m2
q = 3.5 kW/m2
FY2009(091226) q = 6.3 kW/m
2
q = 4.4 kW/m2
q = 3.5 kW/m2
q = 2.6 kW/m2
Vertical upward q=6.3kW/m
2
q=2.6kW/m2
FY2009(100308) q = 6.3 kW/m
2
q = 4.4 kW/m2
q = 3.5 kW/m2
q = 2.6 kW/m2
Vertical downward q=6.3kW/m
2
q=2.6kW/m2
FY2010(100330) q = 6.3 kW/m
2
q = 4.4 kW/m2
q = 3.5 kW/m2
q = 2.6 kW/m2
(a) G = 50 kg/m2s (b) G = 75 kg/m2s
10-2 10-1 100
103
104
FC72(deaerated)di=0.13mmPout=0.1MPaG=100kg/m
2s
x
FY2009(091209) q = 4.4 kW/m
2(非表示)
FY2009(100126) q = 6.3 kW/m
2
q = 4.4 kW/m2
Horizontal q=6.3kW/m
2
q=4.4kW/m2
W/m
2K
FY2009(091222) q = 6.3 kW/m
2
q = 4.4 kW/m2
Vertical upward q=6.3kW/m
2
q=4.4kW/m2
FY2009(100118) q = 6.3 kW/m
2
q = 4.4 kW/m2
FY2009(100129) q = 6.3 kW/m
2
q = 4.4 kW/m2(非表示)
Verttical downward q=6.3kW/m
2
q=4.4kW/m2
FY2009(100201) q = 6.3 kW/m
2
q = 4.4 kW/m2
FY2010(100330) q = 6.3 kW/m
2
q = 4.4 kW/m2
10-2 10-1 100
103
104
FC72(deaerated)di=0.13mmPout=0.1MPaG=200kg/m
2s
W/m
2K
x
FY2009(100202) q = 9.9 kW/m
2
q = 8.0 kW/m2
q = 6.3 kW/m2
q = 4.4 kW/m2(非表示)
Vertical downward q=9.9kW/m
2
q=6.3kW/m2
FY2010(100331) q = 9.9 kW/m
2
q = 8.0 kW/m2
q = 6.3 kW/m2
q = 4.4 kW/m2
q = 4.4 kW/m2
FY2009(091210) q = 9.9 kW/m
2
q = 8.0 kW/m2
q = 6.3 kW/m2
q = 4.4 kW/m2(非表示)
Horizontal q=9.9kW/m
2
q=6.3kW/m2
FY2009(100127) q = 9.9 kW/m
2
q = 9.0 kW/m2
q = 8.0 kW/m2
q = 6.3 kW/m2
FY2009(091225) q = 9.9 kW/m
2
q = 8.0 kW/m2
q = 6.3 kW/m2
q = 4.4 kW/m2(非表示)
Vertical upward q=9.9kW/m
2
q=6.3kW/m2
FY2009(100118) q = 8.0 kW/m
2
q = 6.3 kW/m2
q = 4.4 kW/m2(非表示)
(c) G = 100 kg/m2s (d) G = 200 kg/m2s
Fig. 8 Heat transfer coefficient versus vapor quality for di = 0.13 mm.
7
6. CONCLUSIONS
Effects of tube orientations, i.e. vertical upward flow, vertical
downward flow and horizontal flow, on flow boiling heat transfer
characteristics are investigated for FC72 flowing in single mini-tubes
with inner diameters of 0.13 and 0.51 mm to establish a reliable
dominant force regime map. The results are summarized as follows.
1. For the tube diameter of 0.51 mm, under low inertia
conditions at Froude number Fr < 4, heat transfer coefficients
were influenced by the tube orientation, while the heat
transfer coefficients were almost independent of the
orientation for Fr > 4.
2. For the tube diameter of 0.13 mm, almost no effect of tube
orientation was observed for all combinations of mass
velocity and vapor quality, and heat transfer coefficients were
independent of vapor quality under low inertia conditions at
Weber number We < 5.
3. The boundary between the body force dominated and the
inertia force dominated regimes was given by Froude number
as Fr ≈ 4, and the boundary between the surface tension
dominated and the inertia force dominated regimes was
represented by We ≈ 5.
NOMENCLATURE
Bo Bond number
Co Confinement number
d diameter (m)
Fr Froude number
G mass velocity (kg/m2s)
g gravitational acceleration (m/s)
h specific enthalpy (J/kg)
l tube length (m)
P pressure (Pa)
q heat flux (W/m2)
T temperature (K)
We Weber number
x vapor quality
Greek Symbols
heat transfer coefficient (W/m2K)
density (kg/m3)
surface tension (N/m)
Subscripts
f fluid
h hydraulic
i inner
in inlet
l liquid
m mean
o outer
sat saturated
sub subcooling
v vapor
w inner wall
REFERENCES
Bao, Z.Y., Fletcher, D.F. and Haynes, B.S., 2000, “Flow Boiling Heat
Transfer of Freon R11 and HCFC123 in Narrow Passages,”
International Journal of Heat and Mass Transfer, 43(18), 3347-3358.
http://dx.doi.org/10.1016/S0017-9310(99)00379-8
Han, Y. and Shikazono, N., 2009, “Measurement of the Liquid Film
Thickness in Micro Tube Slug Flow,” International Journal of Heat
Fluid Flow, 30(5), 842-853.
http://dx.doi.org/10.1016/j.ijheatfluidflow.2009.02.019
Kandlikar, S.G., 2002, “Fundamental Issues Related to Flow Boiling in
Minichannels and Microchannels,” Experimental Thermal and Fluid
Science, 26(2-4), 389-407.
http://dx.doi.org/10.1016/S0894-1777(02)00150-4
Kew, P.A. and Cornwell, K., 1997, “Correlations for the Prediction of
Boiling Heat Transfer in Small-Diameter Channels,” Applied Thermal
Engineering, 17(8-10), 705-715.
http://dx.doi.org/10.1016/S1359-4311(96)00071-3
Lazarek, G.M. and Black, S.H., 1982, “Evaporative Heat Transfer,
Pressure Drop and Critical Heat Flux in a Small Vertical Tube with R-
113,” International Journal of Heat and Mass Transfer, 25(7), 945-960.
http://dx.doi.org/10.1016/0017-9310(82)90070-9
Lin, S., Kew, P.A. and Cornwell, K., 2001, “Two-phase Heat Transfer
to a Refrigerant in a 1 mm Diameter Tube,” International Journal of
Refrigeration, 24(1), 51-56.
http://dx.doi.org/10.1016/S0140-7007(00)00057-8
Fig. 9 Heat transfer coefficient versus Weber number for
di = 0.13mm under all mass velocity conditions.
Fig. 10 Proposed boundaries on dominant force regime map.
100 101
103
104
FC72(deaerated)di=0.13mmPout=0.10MPa
W
/m2K
We
We = 5
FY2009(100308) q = 6.3 kW/m
2
q = 3.5 kW/m2
G=200kg/m2s, q= 3.5kW/m
2
G= 75kg/m2s
FY2010(100330)q = 8 kW/m
2
q = 8 kW/m2
G= 50kg/m2s
FY2010(100330)q = 8 kW/m
2
103
104
FY2010(100331)q = 14 kW/m
2
FY2009(100129) q = 6.3 kW/m
2
Vertical downward flow G=100kg/m
2s
FY2009(100201) q = 6.3 kW/m
2
FY2009(091225) q = 6.3 kW/m
2
Vertical upward flow G=200kg/m
2s
FY2009(091224) q = 6.3 kW/m
2
q = 3.5 kW/m2
FY2009(091226) q = 6.3 kW/m
2
q = 3.5 kW/m2
Vertical upward flow q = 6.3 kW/m
2
G= 75kg/m2s
FY2009(100113) q = 3.5 kW/m
2
FY2009(100126) q = 6.3 kW/m
2
Horizontal flow q = 6.3 kW/m
2
q=4.4kW/m2
Horizontal flow G=100kg/m
2s
FY2009(091222) q = 6.3 kW/m
2
Vertical upward flow G=100kg/m
2s
FY2009(100118) q = 6.3 kW/m
2
FY2009(100118) q = 6.3 kW/m
2
FY2009(100202) q = 6.3 kW/m
2
q = 6.3 kW/m2
Vertical downward flow G=200kg/m
2s
FY2009(091223) q = 3.5 kW/m
2
G= 50kg/m2s
FY2009(091211) q = 6.3 kW/m
2
q = 3.5 kW/m2
G= 75kg/m2s, q= 3.5kW/m
2
FY2009(100126) q = 6.3 kW/m
2
q = 3.5 kW/m2(非表示)
G= 75kg/m2s
FY2009(100128) q = 3.5 kW/m
2
G= 50kg/m2s
FY2009(100127) q = 10.0 kW/m
2
FY2009(091210) q = 10.0 kW/m
2
q=10.0kW/m2
Horizontal flow G=200kg/m
2s

8
Mehendale, S.S., Jacobi, A.M. and Shah, R.K., 2000, “Fluid Flow and
Heat Transfer at Micro- and Meso-Scales with Application to Heat
Exchanger Design,” Applied Mechanics Reviews, 53(7), 175-193.
http://dx.doi.org/10.1115/1.3097347
Ohta, H., Inoue, K., Ando, M. and Watanabe, K., 2009, “Experimental
Investigation on Observed Scattering in Heat Transfer Characteristics
for Flow Boiling in a Small Diameter Tube,” Heat transfer engineering,
30(1-2), 19-27.
http://dx.doi.org/10.1080/01457630802290080
Ong, C.L. and Thome, J.R., 2009, “Flow Boiling Heat Transfer of
R134a, R236fa and R245fa in a Horizontal 1.030 mm Circular
Channel,” Experimental Thermal and Fluid Science, 33(4), 651-663.
http://dx.doi.org/10.1016/j.expthermflusci.2009.01.002
Ong, C.L., and Thome, J.R., 2011, “Macro-to-Microchannel Transition
in Two-phase Flow: Part 1 – Two-phase Flow Patterns and Film
Thickness Measurements,” Experimental Thermal and Fluid Science,
35(1), 37-47.
http://dx.doi.org/10.1016/j.expthermflusci.2010.08.004
Owhaib, W., Martin-Callizo, C. and Palm, B., 2004, “Evaporative Heat
Transfer in Vertical Circular Microchannels,” Applied Thermal
Engineering, 24(8-9), 1241-1253.
http://dx.doi.org/10.1016/j.applthermaleng.2003.12.030
Reynolds, W.C., Saad, M.A. and Satterlee, H.M., 1964, “Capillary
Hydrostatics and Hydrodynamics at Low g”, Technical Report LG-3,
Dept. Mechanical Engineering, Stanford University.
Saisorn, S., Kaew-On, J. and Wongwises, S., 2010, “Flow Pattern and
Heat Transfer Characteristics of R-134a Refrigerant during Flow
Boiling in a Horizontal Circular Mini-channel,” International Journal
of Heat and Mass Transfer, 53(19-20), 4023-4038.
Saitoh, S., Daiguji, H. and Hihara, E., 2005, “Effect of Tube Diameter
on Boiling Heat Transfer of R-134a in Horizontal Small-Diameter
Tubes,” International Journal of Heat and Mass Transfer, 48(23-24),
4973-4984.
http://dx.doi.org/10.1016/j.ijheatmasstransfer.2005.03.035
In, S. and Jeong, S., 2009, “Flow Boiling Heat Transfer Characteristics
of R123 and R134a in a Micro-channel,” International Journal of
Multiphase Flow, 35(11), 987-1000.
http://dx.doi.org/10.1016/j.ijmultiphaseflow.2009.07.003
Shiferaw, D., Karayiannis, T.G. and Kenning, D.B.R., 2009, “Flow
Boiling in a 1.1 mm Tube with R134a: Experimental Results and
Comparison with Model,” International Journal of Thermal Sciences,
48(2), 331-341.
http://dx.doi.org/10.1016/j.ijthermalsci.2008.02.009
Tran, T.N., Wambsganss M.W. and France, D.M., 1996, “Small
Circular- and Rectangular-Channel Boiling with Two Refrigerants,”
International Journal of Multiphase Flow, 22(3), 485-498.
http://dx.doi.org/10.1016/0301-9322(96)00002-X
Yen, T., Kasagi, N. and Suzuki, Y., 2003, “Forced Convective Boiling
Heat Transfer in Microtubes at Low Mass and Heat Fluxes,”
International Journal of Multiphase Flow, 29(12), 1771-1792.
http://dx.doi.org/10.1016/j.ijmultiphaseflow.2003.09.004
Yen, T., Shoji, M., Takemura, F., Suzuki, Y. and Kasagi, N., 2006,
“Visualization of Convective Boiling Heat Transfer in Single
Microchannels with Different Shaped Cross-Sections,” International
Journal of Heat and Mass Transfer, 49(21-22), 3884-3894.
http://dx.doi.org/10.1016/j.ijheatmasstransfer.2005.12.024
http://dx.doi.org/10.1016/j.ijheatmasstransfer.2010.05.022