Flow of low viscosity Boger fluids through a microfluidic hyperbolic contraction
11
Flow of low viscosity Boger fluids through a microfluidic hyperbolic contraction Laura Campo-Deaño a,⇑ , Francisco J. Galindo-Rosales b , Fernando T. Pinho a , Manuel A. Alves b , Mónica S.N. Oliveira b a CEFT, Departamento de Engenharia Mecânica, Faculdade de Engenharia da Universidade do Porto, Rua Dr. Roberto Frias, 4200-465 Porto, Portugal b CEFT, Departamento de Engenharia Química, Faculdade de Engenharia da Universidade do Porto, Rua Dr. Roberto Frias, 4200-465 Porto, Portugal article info Article history: Received 24 March 2011 Received in revised form 29 July 2011 Accepted 11 August 2011 Available online 23 August 2011 Keywords: Boger fluids Rheology Microfluidics Relaxation time Extensional flow Contraction–expansion flow abstract In this work we focus on the development of low viscosity Boger fluids and assess their elasticity analyz- ing the flow through a microfluidic hyperbolic contraction. Rheological tests in shear and extensional flows were carried out in order to evaluate the effect of the addition of a salt (NaCl) to dilute aqueous solutions of polyacrylamide at 400, 250, 125 and 50 ppm (w/w). The rheological data showed that when 1% (w/w) of NaCl was added, a significant decrease of the shear viscosity curve was observed, and a nearly constant shear viscosity was found for a wide range of shear rates, indicating Boger fluid behavior. The relaxation times, measured using a capillary break-up extensional rheometer (CaBER), decreased for lower polymer concentrations, and with the addition of NaCl. Visualizations of these Boger fluids flowing through a planar microfluidic geometry containing a hyperbolic contraction, which promotes a nearly uniform extension rate at the centerline of the geometry, was important to corroborate their degree of elasticity. Additionally, the quantification of the vortex growth upstream of the hyperbolic contraction was used with good accuracy and reproducibility to assess the relaxation time for the less concentrated Boger fluids, for which CaBER measurements are difficult to perform. Ó 2011 Elsevier B.V. All rights reserved. 1. Introduction Microfluidics is the science and technology which deals with systems that process small amounts of fluid, using channels with dimensions of tens to hundreds of micrometers. This area of knowledge has been taking advantage of certain fundamental dif- ferences between the behavior of fluids moving in large channels and those flowing through micrometer-scale channels either for fundamental or practical applications [1]. Normally, when fluid properties in shear and elongational flow are measured using conventional rheometers, the characteristic length-scales are of the order of 1–10 mm and involve sample vol- umes around 1–10 ml [2,3]. In spite of the fact that these methods are well established and are good enough to study a vast number of fluids, there are situations when it is necessary to understand fluid rheology in smaller length-scale devices. Some of these cases are related with the study of the flow of fluids with surface active mol- ecules (like many biofluids), at interface conditions, experiments under very high deformation rates without inertial effects or flow properties with length-scales close to the fluid microstructure (e.g. blood flow in small capillaries, among others). The possibility of maintaining small Reynolds number (Re) flows when experi- menting with low viscosity elastic fluids at very high deformation rates is practically impossible in macroscale devices. In these de- vices, inertial flow effects severely interfere with the elastic re- sponse of fluids at high rates of deformation. However, the small length-scales typical of microfluidic devices reduce significantly the role of inertia and for this reason microfluidic devices consti- tute a valuable alternative for carrying out experiments at large deformation rates and low Reynolds numbers [4]. A consequence of the small length-scales used in microfluidic devices and the abil- ity to access a large range of deformation rates is that strong visco- elastic effects can be achieved in fluids that would otherwise behave essentially as Newtonian fluids in the equivalent macro- scale flows [4,5]. Thus, microfluidics is an excellent tool for the development of an extensional rheometer for dilute polymer solu- tions [6]. Furthermore, straightforward miniaturization of classical macroscale devices has been shown to be effective for measuring shear properties under certain conditions [7]. The use of microchannels with hyperbolic contractions induces nearly constant extension rates at the centerline of the micro-geometry, and constitutes an innovative technique for the determination of the extensional viscosity, allowing fluid flow experiments to be carried out under strong accelerations [6]. Fur- thermore, the possibility offered by this configuration of realizing a quasi-homogeneous elongational flow along the centerline is an important requirement to perform meaningful rheometric measurements. Non-Newtonian fluid flows at the microscale are complex to de- scribe mathematically due to their shear rate dependent viscosity 0377-0257/$ - see front matter Ó 2011 Elsevier B.V. All rights reserved. doi:10.1016/j.jnnfm.2011.08.006 ⇑ Corresponding author. Tel.: + 351 22 508 1079; fax: +351 22 508 1440. E-mail addresses: [email protected], [email protected] (Laura Campo- Deaño). Journal of Non-Newtonian Fluid Mechanics 166 (2011) 1286–1296 Contents lists available at SciVerse ScienceDirect Journal of Non-Newtonian Fluid Mechanics journal homepage: http://www.elsevier.com/locate/jnnfm
Transcript of Flow of low viscosity Boger fluids through a microfluidic hyperbolic contraction

Journal of Non-Newtonian Fluid Mechanics 166 (2011) 1286–1296
Contents lists available at SciVerse ScienceDirect
Journal of Non-Newtonian Fluid Mechanics
journal homepage: ht tp : / /www.elsevier .com/locate / jnnfm
Flow of low viscosity Boger fluids through a microfluidic hyperbolic contraction
Laura Campo-Deaño a,⇑, Francisco J. Galindo-Rosales b, Fernando T. Pinho a, Manuel A. Alves b,Mónica S.N. Oliveira b
a CEFT, Departamento de Engenharia Mecânica, Faculdade de Engenharia da Universidade do Porto, Rua Dr. Roberto Frias, 4200-465 Porto, Portugalb CEFT, Departamento de Engenharia Química, Faculdade de Engenharia da Universidade do Porto, Rua Dr. Roberto Frias, 4200-465 Porto, Portugal
a r t i c l e i n f o
Article history:Received 24 March 2011Received in revised form 29 July 2011Accepted 11 August 2011Available online 23 August 2011
Keywords:Boger fluidsRheologyMicrofluidicsRelaxation timeExtensional flowContraction–expansion flow
0377-0257/$ - see front matter � 2011 Elsevier B.V. Adoi:10.1016/j.jnnfm.2011.08.006
⇑ Corresponding author. Tel.: + 351 22 508 1079; fE-mail addresses: [email protected], laura@camp
Deaño).
a b s t r a c t
In this work we focus on the development of low viscosity Boger fluids and assess their elasticity analyz-ing the flow through a microfluidic hyperbolic contraction. Rheological tests in shear and extensionalflows were carried out in order to evaluate the effect of the addition of a salt (NaCl) to dilute aqueoussolutions of polyacrylamide at 400, 250, 125 and 50 ppm (w/w). The rheological data showed that when1% (w/w) of NaCl was added, a significant decrease of the shear viscosity curve was observed, and a nearlyconstant shear viscosity was found for a wide range of shear rates, indicating Boger fluid behavior. Therelaxation times, measured using a capillary break-up extensional rheometer (CaBER), decreased forlower polymer concentrations, and with the addition of NaCl. Visualizations of these Boger fluids flowingthrough a planar microfluidic geometry containing a hyperbolic contraction, which promotes a nearlyuniform extension rate at the centerline of the geometry, was important to corroborate their degree ofelasticity. Additionally, the quantification of the vortex growth upstream of the hyperbolic contractionwas used with good accuracy and reproducibility to assess the relaxation time for the less concentratedBoger fluids, for which CaBER measurements are difficult to perform.
� 2011 Elsevier B.V. All rights reserved.
1. Introduction rates is practically impossible in macroscale devices. In these de-
Microfluidics is the science and technology which deals withsystems that process small amounts of fluid, using channels withdimensions of tens to hundreds of micrometers. This area ofknowledge has been taking advantage of certain fundamental dif-ferences between the behavior of fluids moving in large channelsand those flowing through micrometer-scale channels either forfundamental or practical applications [1].
Normally, when fluid properties in shear and elongational floware measured using conventional rheometers, the characteristiclength-scales are of the order of 1–10 mm and involve sample vol-umes around 1–10 ml [2,3]. In spite of the fact that these methodsare well established and are good enough to study a vast number offluids, there are situations when it is necessary to understand fluidrheology in smaller length-scale devices. Some of these cases arerelated with the study of the flow of fluids with surface active mol-ecules (like many biofluids), at interface conditions, experimentsunder very high deformation rates without inertial effects or flowproperties with length-scales close to the fluid microstructure(e.g. blood flow in small capillaries, among others). The possibilityof maintaining small Reynolds number (Re) flows when experi-menting with low viscosity elastic fluids at very high deformation
ll rights reserved.
ax: +351 22 508 1440.odeano.com (Laura Campo-
vices, inertial flow effects severely interfere with the elastic re-sponse of fluids at high rates of deformation. However, the smalllength-scales typical of microfluidic devices reduce significantlythe role of inertia and for this reason microfluidic devices consti-tute a valuable alternative for carrying out experiments at largedeformation rates and low Reynolds numbers [4]. A consequenceof the small length-scales used in microfluidic devices and the abil-ity to access a large range of deformation rates is that strong visco-elastic effects can be achieved in fluids that would otherwisebehave essentially as Newtonian fluids in the equivalent macro-scale flows [4,5]. Thus, microfluidics is an excellent tool for thedevelopment of an extensional rheometer for dilute polymer solu-tions [6]. Furthermore, straightforward miniaturization of classicalmacroscale devices has been shown to be effective for measuringshear properties under certain conditions [7].
The use of microchannels with hyperbolic contractions inducesnearly constant extension rates at the centerline of themicro-geometry, and constitutes an innovative technique for thedetermination of the extensional viscosity, allowing fluid flowexperiments to be carried out under strong accelerations [6]. Fur-thermore, the possibility offered by this configuration of realizinga quasi-homogeneous elongational flow along the centerline isan important requirement to perform meaningful rheometricmeasurements.
Non-Newtonian fluid flows at the microscale are complex to de-scribe mathematically due to their shear rate dependent viscosity

L. Campo-Deaño et al. / Journal of Non-Newtonian Fluid Mechanics 166 (2011) 1286–1296 1287
and their elastic behavior, which are greatly enhanced given thetypically small residence times [8]. In some cases the nature ofthe flows changes from a simple shear flow to a complex exten-sional flow in which polymer chains can evolve from coiled tostretched configurations in very small time frames. The elasticityof the fluid, which is characterized via its relaxation time, is animportant property here. Since non-Newtonian fluids can haveelastic behavior and at the same time exhibit nonlinear viscous ef-fects like shear-thinning of the viscometric viscosity, it is particu-larly difficult to study viscoelastic flows in isolation from othereffects.
Most viscoelastic liquids are polymer melts or solutions andtherefore are inherently shear thinning. However, there is a classof viscoelastic fluids, known as Boger fluids, in which the viscosityis nearly independent of the shear rate [9]. Most Boger fluids areprepared using highly viscous solvents, as this minimizes the shearthinning effects introduced by the polymer additives. Boger fluidsare particularly important because they enable elastic effects tobe probed separately from shear thinning effects; by comparingthe results of Boger fluid flow with those of Newtonian fluid flowat the same Reynolds number allows one to assess the influenceof viscoelasticity. The ability to distinguish between elastic and vis-cous effects has significantly advanced the field of experimentaland computational rheology, because the influence of elasticity (al-ways a complex fluid property) can be isolated in a straightforwardway [10]. Several studies related with the extensional flow ofhighly viscous Boger fluids and shear thinning viscoelastic fluidshave been reported in the literature [4,11–17].
The fluids commonly used in microfluidics are not very viscousin order to guarantee the structural integrity of the chips, andtherefore typical Boger fluids are not very useful in this context.However, it would still be very interesting to be able to use low vis-cosity Boger fluids in order to isolate elastic effects in the contextof microfluidic applications. Amongst the most common viscoelas-tic non-Newtonian fluids used in microfluidics are aqueous solu-tions of polyacrylamide (PAA). Some experimental studies usingPAA solutions have shown complex behavior such as a significantpressure drop enhancement in porous media [18], mechanical deg-radation and macromolecular adsorption [19], development of var-ious elastic-driven instabilities at low Re [20], and even transitionto elastic turbulence [21]. However, the addition of these polymersto water, even at small concentrations, imparts significant shear-thinning and elasticity and the separation of both effects is a diffi-cult task.
Interestingly, an experimental study carried out by Aitkadi et al.[22] investigated the effect of adding salt on the viscoelastic prop-erties of PAA aqueous solutions and showed that NaCl had a stabi-lizing effect on the solution shear viscosity. In this way it would bepossible to obtain a Boger fluid, using PAA aqueous solutions, withsome degree of elasticity and a low nearly-constant shear viscosity.Also, several other authors analyzed the effect of polymer concen-tration [23,24] and the addition of NaCl [25–27], but we were un-able to find any studies focusing on the development of lowviscosity Boger fluids, and their application in microfluidic devices.
In this work the rheological effect of the addition of NaCl to di-lute PAA aqueous solutions with different concentrations is inves-tigated in order to obtain low viscosity Boger fluids, which areparticularly useful to investigate elastic effects in microfluidic de-vices. The combination of low viscosity Boger fluids with microflui-dics allows elastic effects to be observed (which at the macroscalewould likely be overwhelmed by fluid inertia) and to be distin-guished from other non-Newtonian effects like shear-thinning.Microfabricated geometries containing a hyperbolic contractionsection followed by an abrupt expansion are used and the flow ischaracterized using flow visualization and pressure drop measure-ments. This flow investigation is also used as an indirect method of
measuring the relaxation time of the Boger fluids through thequantification of vortex growth upstream of the hyperbolic con-traction, with the results subsequently compared with direct mea-surements using a CaBER device.
2. Materials and methods
2.1. Low viscosity Boger fluids
The polymer used to prepare the low viscosity Boger fluids wasPAA with a molecular weight Mw = 18 � 106 g mol�1 (Polyscienc-es). Solutions were prepared by mixing the polymer into the sol-vent (de-ionized water) at different weight concentrations (50,125, 250 and 400 ppm), utilizing magnetic stirrers at low speedsin order to prevent mechanical degradation of the polymer mole-cules. Additionally, to prevent degradation all solutions were keptin a refrigerator prior to their use. In order to obtain low viscosityBoger fluids, 1% (w/w) of NaCl was added to the solutions. Similarconcentrations were used in other works also using PAA solutions,but at higher solvent viscosities [14,28].
The fluid density (q) was measured at 20.0 �C using a 25 mlhydrometer and the solutions were shown to have similar densi-ties: 998.7, 998.8, 998.6 and 998.3 kg/m3 for 400, 250, 125 and50 ppm of PAA, respectively.
2.2. Rheological characterization of the fluids
The rheology of the fluids was measured in both extensionaland shear flows. For the shear measurements, experiments wereperformed on two stress-controlled shear rheometers: Anton Paar,model Physica MCR301; TA Instruments, model AR-G2. A prelimin-ary study to determine the most appropriate geometry was doneusing the solvent, distilled water, at 20 �C. The results allowed usto conclude that the most suitable geometry for measurementsat high shear-rates is the plate-plate configuration, with a diameterof 50 mm and a gap of 0.1 mm.
Steady shear flow measurements in the range of shear rates,0:1 6 _c=s�1
6 10;000, were carried out at different temperatures.For the extensional flow, a Haake CaBER-1 extensional rheometer(Thermo Haake GmbH) was used, equipped with circular plates6 mm in diameter and a laser micrometer in order to follow the fil-ament diameter evolution over time. In the present study the ini-tial and the final gap between plates were set to 3.0 and12.03 mm, respectively. Fluid samples were carefully loaded be-tween the plates using a syringe to ensure the absence of trappedair within the sample.
All rheological experiments were carried out at least in tripli-cate in order to corroborate reproducibility. Trends were deemedsignificant if the mean values of compared sets differed byp 6 0.05 (Student’s t-test).
2.3. Microchannel geometry
The channels were fabricated in polydimethylsiloxane, PDMS(Sylgard 184, Dow Corning), from an SU-8 photoresist mold usingstandard soft lithography techniques [29]. The microchannels usedare planar, i.e., they have a constant depth, and have a contractionwith a hyperbolic shape, followed by an abrupt expansion asshown in Fig. 1. This configuration provides a nearly constantstrain rate of the fluid flow along the centerline of the microgeom-etry [5,6,30]. The total width of the microchannel printed in thechrome mask is D1 = 400 lm, the minimum width of the contrac-tion is D2 = 54 lm and the hyperbolic contraction length isLc = 128 lm (Fig. 1). Therefore, the total Hencky strain defined aseH = ln(D1/D2), amounts to eH = 2. However, the final PDMS

Fig. 1. SEM image of the microchannel with the contour of the hyperbolicgeometry.
1288 L. Campo-Deaño et al. / Journal of Non-Newtonian Fluid Mechanics 166 (2011) 1286–1296
microchannels obtained by replication using the SU-8 mold pres-ent a slightly different shape from that projected initially. In fact,the real value of the depth (h) of the microchannels, h = 45 lm, islower than the projected value of 50 lm. Measurements of the realdimensions of the contraction were carried out with the Image Pro-cessing Toolbox™ of MatLab (Version 7.10.0.499-R2010a) using amicroscopy image of the contraction region. For this purpose, in or-der to determine the contour of the hyperbolic geometry, a Carte-sian coordinate system was placed as illustrated in Fig. 1 and thecontour of the channel walls was determined pixel by pixel consid-ering the distribution of intensities in an indexed or grayscaleimage.
Once the position of each pixel of the contour was determined,it was placed in the Cartesian coordinate system considering thecalculated ratio 0.927 lm/pixel for the optical set-up used. Theset of points corresponding to each hyperbolic wall fits accuratelyto the curve y = ± 200/[1 + 0.05(x + L⁄)], valid for �L⁄ 6 x 6 0. Thisfit (shown as a thick red1 line in Fig. 1) gives us a value ofL⁄ = 126 ± 1 lm. The corner features of the final geometries werenot as sharp as printed on the chrome mask, a limitation of the fab-rication techniques used, but had radius of curvature ofRa = 8 ± 1 lm, Rb = 8 ± 1 lm and Rc = 11 ± 1 lm as is shown inFig. 1, also determined using the Image Processing Toolbox™ ofMatLab.
2.4. Description of flow setup and measuring system
The flow visualizations were carried out using streak photogra-phy. The optical setup consists of an inverted epi-fluorescencemicroscope (DM IL LED, Leica Microsystems GmbH) equipped witha CCD camera (DFC350 FX, Leica Microsystems GmbH), a lightsource (100 W mercury lamp) and a filter cube (Leica
1 For interpretation of color in Figs. 1, 2, 4–11, the reader is referred to the webversion of this article.
Microsystems GmbH, excitation filter BP 530–545 nm, dichroic565 nm and barrier filter 610–675 nm). A syringe pump(PHD2000, Harvard Apparatus) was used to inject the fluid andcontrol the flow rate in the microchannel. Syringes with differentvolumes (50–100 ll) were used according to the desired flow rateand connected to the microgeometries using Tygon tubing of0.44 mm internal diameter. The fluids were seeded with 1 lm fluo-rescent tracer particles (Nile Red, Molecular Probes, Invitrogen, Ex/Em: 520/580 nm) and sodium dodecyl sulfate (SDS) (0.05 wt%, Sig-ma-Aldrich) was added in order to minimize adhesion of fluores-cent tracer particles to the channel walls. It has been shown in[31] that the addition of 0.05% SDS does not have any significanteffect in the shear viscosity of the PAA solutions with 1% of NaCl.The microgeometries containing the seeded fluid were continu-ously illuminated and the light emitted by the fluorescent tracerparticles was imaged through the microscope objective (10�,NA = 0.25) onto the CCD array of the camera using ’long’ exposuretimes (which were varied according to the flow rate) in order tocapture the particles’ pathlines.
The vortex length Lv, was also determined using the ImageProcessing Toolbox™ of MatLab (Version 7.10.0.499-R2010a), asindicated in Fig. 6c, with an experimental uncertainty of ±1 pixel.
The pressure drop (DP) at different flow rates was measuredusing Honeywell 26PC differential pressure sensors (26PCAFA6D) previously calibrated using a static column of water. Twopressure ports were located upstream and downstream of the con-traction at locations x = �2.8 mm and x = 2.8 mm, respectively. A12V DC power supply (Lascar electronics, PSU 206) was used topower the pressure sensors that were also connected to a com-puter via a data acquisition card (NI USB-6218, National Instru-ments) in order to record the output data using LabView v8.2software. The transient response of the pressure sensors was con-tinuously recorded until steady-state was reached.
3. Results and discussion
3.1. Rheological measurements
In this section, we compare the rheology of all polyacrylamideaqueous solutions with and without the addition of NaCl. The stea-dy shear viscosity of the four PAA solutions (400, 250, 125 and50 ppm) was measured at different temperatures between283.2 K and 298.2 K. Using the time–temperature superpositionprinciple, a master curve was obtained for each fluid at a referencetemperature (293.2 K). The corresponding shift factors aT, to makethe curves overlap, are given by [32]:
aT ¼gðTÞ
gðTref ÞTref
Tqref
q) aT ffi
gðTÞgðTref Þ
ð1Þ
where g(T) is the shear viscosity at temperature T and g(Tref) andqref are the shear viscosity and density at the reference temperatureTref. For the small range of temperatures used in the measurementsthe fluid density is approximately constant and the ratio Tref/T isalso close to unity. Then, the master curve, for the shear viscositycan be determined after reducing the viscosity and shear rateaccording to Eqs. (2) and (3), respectively:
gr ¼ gðTref Þ ¼gðTÞaT
ð2Þ
_cr ¼ _cðTref Þ ¼ aT _cðTÞ ð3Þ
where gr is the reduced shear viscosity and _cr is the reduced shearrate. In this way, if we represent all the master curves in a graph, wecan evaluate the effect of the polymer concentration in the shearviscosity curve. As shown in Fig. 2 all solutions without salt exhibita significant shear-thinning behavior, which is stronger at higherconcentrations, a very common behavior with dilute polymer

Fig. 2. Master viscosity curves for 400 ppm, 250 ppm, 125 ppm and 50 ppm PAA aqueous solutions with and without the addition of 1% of NaCl, carried out at 283.2 ðjÞ,288.2 (N), 293.2 (�) and 298.2 K (q). Different symbols correspond to different temperatures, however filled symbols represent samples without salt, and empty symbolsrepresent samples with NaCl.
L. Campo-Deaño et al. / Journal of Non-Newtonian Fluid Mechanics 166 (2011) 1286–1296 1289
solutions that has been reported by several authors [33,34]. Fur-thermore, the shear viscosity increases with increasing polymerconcentration as expected.
We should also point out that for the 400 and 250 ppm samplesa slight increase of shear viscosity values at high shear rates is ob-served, likely due to elastic instabilities.
The above variation of shear viscosity with shear rate, typicallyobserved for samples without salt, can be accurately describedusing a Carreau model:
Fig. 3. Steady viscosity curves at 20.0 �C for 50 ppm, 125 ppm, 250 ppm and400 ppm PAA aqueous solutions with 1% of NaCl obtained by a composition of themeasurements from cone plate and parallel plate geometries.
g ¼ g1 þg0 � g1
½1þ ðK _cÞ2�1�n
2ð4Þ
where g1 is the viscosity at infinitely large shear rates, g0 is the vis-cosity in the limit of zero shear rate, K is a time constant (approx-imately the reciprocal shear rate at which shear thinning effectsstart), and n is the power law exponent. In Fig. 2 we present the fit-tings of the Carreau model to the experimental measurements ofthe steady shear rheology.
Fig. 2 also shows the variation of the shear viscosity of the poly-meric solutions after the addition of NaCl. It is clear that adding saltleads to a decrease of the shear viscosity and additionally to a sig-nificantly less pronounced shear thinning behavior. This is due tothe ability of the NaCl to decrease the apparent size of the poly-acrylamide macromolecules and therefore the viscosity of thePAA solutions. In a PAA aqueous solution without salt, the amidegroups (NH2) of the PAA molecules are hydrolyzed to produce car-boxyl groups (COO�) and ammonia [25]. After the hydrolysis, thenegative charges in the chain of the polymer increase and the mol-ecules of PAA undergo a stretching process as a consequence of therepulsive forces attributed to these negative charges. So, the higherviscosity and the stronger shear-thinning are caused by the large
Table 1Power-law index (n) for all PAA concentrations with NaCl.
Polymer concentration (ppm) n
400 0.89 ± 0.01250 0.91 ± 0.01125 0.95 ± 0.01
50 0.97 ± 0.01

Fig. 4. Time evolution of filament diameter in CaBER experiments for 400 ppm,250 ppm, 125 ppm and 50 ppm PAA aqueous solutions, at 20.0 � C (to improvevisually the figure, only part of the experimental data are plotted)
Table 2Relaxation times determined from capillary break-up experiments for the differentPAA solutions, at 20 �C.
Polymer concentration (ppm) k (ms)
No salt 1% NaCl
400 105 ± 3 29 ± 2250 98 ± 3 18 ± 2125 59 ± 2 10 ± 2
50 10 ± 2 4 ± 1
1290 L. Campo-Deaño et al. / Journal of Non-Newtonian Fluid Mechanics 166 (2011) 1286–1296
hydrodynamic radii of PAA molecules in the solutions without salt.Adding NaCl to the solutions leads to an increase of the sodium cat-ion in the PAA solution, which neutralizes the charges on the poly-meric chain and this in turn reduces the repulsive forces between
Fig. 5. Flow patterns for distilled water at different fl
the chains [25]. In this way, the hydrodynamic radii of the PAAmolecules decrease resulting in a lower shear viscosity and lessmolecular interference, i.e., lower shear-thinning intensity.
It is clear that for the smallest concentrations, the viscositycurve is nearly constant in a range of shear rates from 40 s�1 (limitof the minimum resolution line corresponding to 10 times the min-imum torque) to 10,000 s�1. However, for the concentrations of400 and 250 ppm a slight shear-thinning behavior is still present.For _c < 40 s�1 we observe a slight shear-thinning tendency butsince the viscosities are below the acceptance line (marking 10times the minimum torque) its uncertainty is large. Note that toimprove accuracy at low shear rates, some measurements wereperformed using the more sensitive (at low shear rates) TA Instru-ments AR-G2 stress-controlled rheometer. In this case, a cone plategeometry was used to measure the viscosity of the four solutions
ow rates. The flow direction is from left to right.

Fig. 6. Flow patterns for the 50 ppm PAA aqueous solution with 1% NaCl at different flow rates. The flow direction is from left to right.
L. Campo-Deaño et al. / Journal of Non-Newtonian Fluid Mechanics 166 (2011) 1286–1296 1291
with salt. The data obtained at low shear rates are greatly im-proved when compared with the measurements obtained usingparallel plate geometry in the MCR301 rheometer. The composedflow curve from 0.3 to 10,000 s�1 shown in Fig. 3 uses data ob-tained from both rheometers revealing a nearly constant shear vis-cosity behavior for the four polymer solutions with salt.
For the PAA solutions with salt we do not observe the wellmarked viscosity regions with a low shear rate plateau followedby the power-law region and the high shear rate low viscosity pla-teau, hence the viscosity curves were fitted instead by a power-lawfit to the region where some shear thinning is observed, in order toquantify the variation of the shear viscosity with shear rate for allpolymer solutions. Table 1 presents the values of the index (n) ofthe power-law fit to the viscosity of the fluids with salt:
g ¼ K _cn�1 ð5Þ
The PAA sample of 50 ppm exhibits a minimum variation of theviscosity presenting a power-law index very close to 1. As the con-centration increases the values of n slightly decrease reachingn = 0.89 for the PAA sample of 400 ppm. We can consider thatthe 125 and 50 ppm PAA solutions with salt are Boger fluids sincethe viscosity curves are nearly constant over the whole range ofshear rates tested. For samples of PAA 400 and 250 ppm with salta slightly shear-thinning effect is still present and therefore thesesolutions are termed as Boger-like fluids. Based on this analysis,the viscosity values used for subsequent calculations (i.e. g1 forthe Reynolds number as defined in Eq. (7)) are taken as 1.00,1.05, 1.43 and 1.50 mPa s for samples of 50, 125, 250 and400 ppm, respectively. These values correspond to the shear vis-cosity at a shear rate of 10,000 s�1. This consideration relies on
the fact that the range of _c in the microfluidic experiments isP300 s�1, and in this interval of shear rates the shear viscosity ispractically constant for the four concentrations with NaCl. If wecompare the g1 value for samples without salt with the viscosityat high shear rates (10,000 s�1) for samples with 1% of NaCl, it isfound that the viscosity reduction due to salt is around 50% forPAA samples with 400, 250 and 125 ppm and 40% for the lowestpolymer concentration.
The filament thinning behavior of the different PAA solutionswas also investigated using the CaBER rheometer. Fig. 4 showsthe evolution of filament diameter with time for all the PAA solu-tions. In all cases the exponential decay of the filament diameter isobserved at a certain stage. In this regime, the dynamics of the fil-ament drainage is governed by a balance between surface tensionand elasticity forces, rather than by fluid viscosity, and follows thefollowing relation [35]:
DmidðtÞD0
¼ GD0
4r
� �1=3
exp½�t=3k� ð6Þ
Fitting the measured data (of time evolution of filament diam-eter) to Eq. (6) allows the determination of the relaxation time ofthe solutions, which are reported in Table 2.
The relaxation time of the polymer molecule reflects the timerequired for the chain to relax back to its equilibrium orientationand configuration following the application and subsequent re-moval of stress and is affected by the ability of the polymer to relaxgiven the constraints of adjacent molecules hindering free relaxa-tion, depending significantly on the viscosity of the suspendingmedium [36].

Fig. 7. Flow patterns for the 125 ppm PAA aqueous solution with 1% NaCl at different flow rates. The flow direction is from left to right.
1292 L. Campo-Deaño et al. / Journal of Non-Newtonian Fluid Mechanics 166 (2011) 1286–1296
Fig. 4 shows that break-up time decreases significantly bothwith a decrease in polymer concentration, and with the additionof NaCl. Therefore, a decrease in the relaxation times is also foundwith the addition of NaCl, as shown in Table 2.
The samples of PAA 400 and 250 ppm present the highest relax-ation times, showing a higher degree of elasticity. The addition ofsalt leads to a decrease of the relaxation time of around 80% insamples with higher concentration, and of around 60% for thePAA 50 ppm sample. The tendency is similar to the one observedfor the shear viscosity value, but the degree of reduction of k is lar-ger in relative terms.
It is worth saying that for samples at low polymer concentra-tions, the extensional experiments are more difficult to carry outand analyze due to their lower viscosities. In such conditions sig-nificant effects of fluid inertia are present, which reveals itselfthrough stronger oscillations in the end drops and the loss of axi-symmetry and of top–bottom symmetry of the filament until thefinal breaking point. All these changes lead to less reliable mea-surements of the relaxation time (in relative terms) for the poly-mer solutions at lower concentrations [37]. However, more than10 experiments were carried out for each polymer concentrationin order to reduce the random experimental uncertainty and pro-vide a better estimate of the total uncertainty, while providing amore reliable value for the relaxation time. In this way, in spiteof the difficulties of the measurements, their reproducibility wasacceptable and we estimate the total uncertainty as reported inTable 2.
3.2. Flow patterns and vortex length
Figs. 5–9 show the flow patterns of the flow through the hyper-bolic contraction/sudden expansion obtained with the Newtonian
fluid (de-ionized water) and the PAA aqueous solutions with 1%of NaCl, at concentrations of 50, 125, 250 and 400 ppm respec-tively, as a function of the Reynolds (Re) and Deborah numbers(De). These two dimensionless numbers are defined as:
Re ¼ qU2D2
g1¼ qQ
hg1ð7Þ
De ¼ k _� � kðU2 � U1ÞL�
¼ kQ
hL�1
D2� 1
D1
� �ð8Þ
where Q is the volumetric flow rate, h is the constant depth of themicrochannel, q is the fluid density, k is the relaxation time andL* is the length of the hyperbolic region. D1 and D2 are the widthsof the inlet channel and throat (Fig. 1) and the characteristic viscos-ity is taken as the high shear rate value g1 obtained from rheolog-ical experiments in Section 3.1.
In the definition of the Deborah number we consider a strainrate that assumes average transverse profiles of streamwise veloc-ity and its linear variation along the hyperbolic region with lengthL*. The centerline velocities for fully-developed flow in a rectangu-lar channel are higher than the bulk velocity (by a factor that mayvary between uc/u = 1.5 and 2.096 corresponding to a large aspectratio channel and a square channel, respectively), but we do nottake this effect into consideration to estimate the strain rate.
Converging entry flows show complex flow patterns combiningboth shear and extensionally dominated regions: while near thewalls shear effects dominate, along the centerline the flow is pri-marily extensional and essentially shear-free. Even laminar flowsof Newtonian fluids are highly complex, and can lead to the onsetof asymmetric flow patterns downstream of the expansion planeabove a critical Reynolds number [17,38]. In Fig. 5 we show thatfor the Newtonian fluid flow, at low Re the fluid is pushed towards
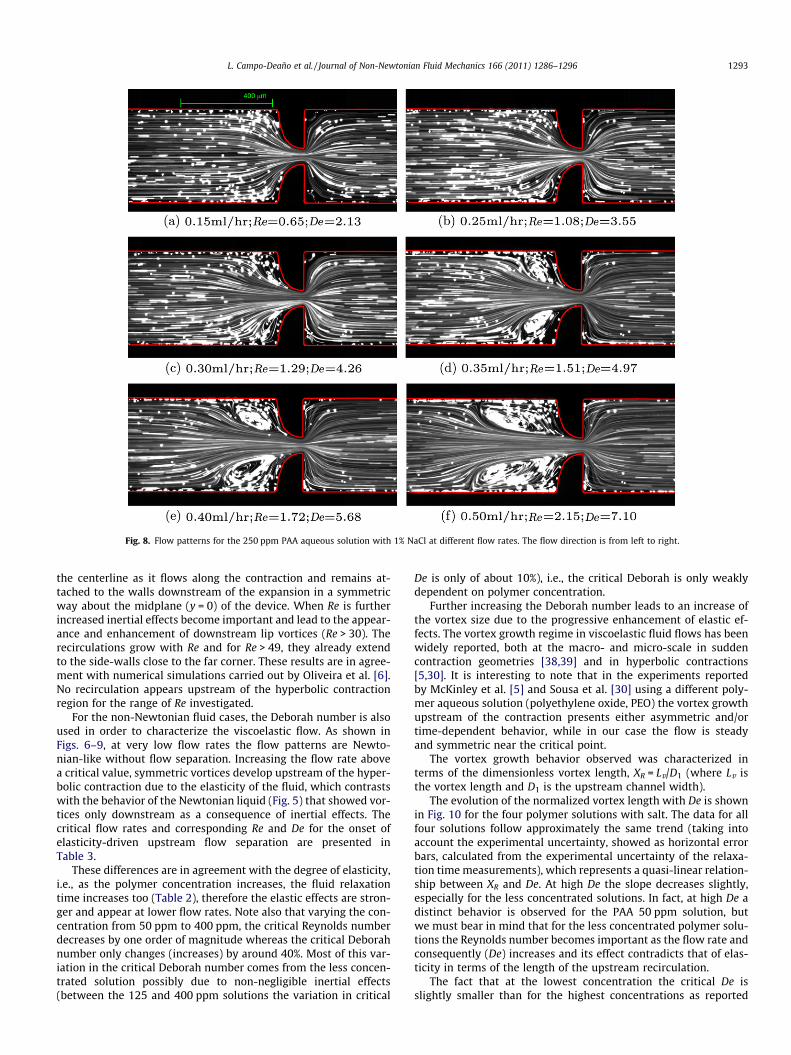
Fig. 8. Flow patterns for the 250 ppm PAA aqueous solution with 1% NaCl at different flow rates. The flow direction is from left to right.
L. Campo-Deaño et al. / Journal of Non-Newtonian Fluid Mechanics 166 (2011) 1286–1296 1293
the centerline as it flows along the contraction and remains at-tached to the walls downstream of the expansion in a symmetricway about the midplane (y = 0) of the device. When Re is furtherincreased inertial effects become important and lead to the appear-ance and enhancement of downstream lip vortices (Re > 30). Therecirculations grow with Re and for Re > 49, they already extendto the side-walls close to the far corner. These results are in agree-ment with numerical simulations carried out by Oliveira et al. [6].No recirculation appears upstream of the hyperbolic contractionregion for the range of Re investigated.
For the non-Newtonian fluid cases, the Deborah number is alsoused in order to characterize the viscoelastic flow. As shown inFigs. 6–9, at very low flow rates the flow patterns are Newto-nian-like without flow separation. Increasing the flow rate abovea critical value, symmetric vortices develop upstream of the hyper-bolic contraction due to the elasticity of the fluid, which contrastswith the behavior of the Newtonian liquid (Fig. 5) that showed vor-tices only downstream as a consequence of inertial effects. Thecritical flow rates and corresponding Re and De for the onset ofelasticity-driven upstream flow separation are presented inTable 3.
These differences are in agreement with the degree of elasticity,i.e., as the polymer concentration increases, the fluid relaxationtime increases too (Table 2), therefore the elastic effects are stron-ger and appear at lower flow rates. Note also that varying the con-centration from 50 ppm to 400 ppm, the critical Reynolds numberdecreases by one order of magnitude whereas the critical Deborahnumber only changes (increases) by around 40%. Most of this var-iation in the critical Deborah number comes from the less concen-trated solution possibly due to non-negligible inertial effects(between the 125 and 400 ppm solutions the variation in critical
De is only of about 10%), i.e., the critical Deborah is only weaklydependent on polymer concentration.
Further increasing the Deborah number leads to an increase ofthe vortex size due to the progressive enhancement of elastic ef-fects. The vortex growth regime in viscoelastic fluid flows has beenwidely reported, both at the macro- and micro-scale in suddencontraction geometries [38,39] and in hyperbolic contractions[5,30]. It is interesting to note that in the experiments reportedby McKinley et al. [5] and Sousa et al. [30] using a different poly-mer aqueous solution (polyethylene oxide, PEO) the vortex growthupstream of the contraction presents either asymmetric and/ortime-dependent behavior, while in our case the flow is steadyand symmetric near the critical point.
The vortex growth behavior observed was characterized interms of the dimensionless vortex length, XR = Lv/D1 (where Lv isthe vortex length and D1 is the upstream channel width).
The evolution of the normalized vortex length with De is shownin Fig. 10 for the four polymer solutions with salt. The data for allfour solutions follow approximately the same trend (taking intoaccount the experimental uncertainty, showed as horizontal errorbars, calculated from the experimental uncertainty of the relaxa-tion time measurements), which represents a quasi-linear relation-ship between XR and De. At high De the slope decreases slightly,especially for the less concentrated solutions. In fact, at high De adistinct behavior is observed for the PAA 50 ppm solution, butwe must bear in mind that for the less concentrated polymer solu-tions the Reynolds number becomes important as the flow rate andconsequently (De) increases and its effect contradicts that of elas-ticity in terms of the length of the upstream recirculation.
The fact that at the lowest concentration the critical De isslightly smaller than for the highest concentrations as reported

Fig. 9. Flow patterns for the 400 ppm PAA aqueous solution with 1% NaCl at different flow rates. The flow direction is from left to right.
Table 3Critical values of flow rate (Qcr), Reynolds (Recr) and Deborah (Decr) numbers for theonset of flow separation upstream of the hyperbolic contraction for polymer solutionswith 1% NaCl.
Polymer concentration (ppm) Qcr (ml/h) Recr Decr
50 0.95 5.8 2.8125 0.47 2.8 3.6250 0.27 1.2 4.0400 0.17 0.7 4.0
Fig. 10. Effect of Deborah number on the dimensionless vortex length in the steadysymmetric regime for the 50, 125, 250 and 400 ppm PAA aqueous solutions withsalt.
1294 L. Campo-Deaño et al. / Journal of Non-Newtonian Fluid Mechanics 166 (2011) 1286–1296
in Table 3, is confirmed in Fig. 10 (the curves in the low end regionof De). This difference can be traced back to the lack of accuracy inthe experimental determination of the relaxation times using theCaBER rheometer, which presents some difficulties with low vis-cosity solutions, as discussed in Section 3.1.
The development of these vortices upstream of the hyperboliccontraction and the onset of elastic effects are also evident in thepressure drop measurements between two points located up-stream and downstream of the contraction, respectively. Fig. 11shows the variation of pressure drop with flow rate for the four
Fig. 11. Pressure drop measurements as a function of the flow rate, for the 50, 125,250 and 400 ppm PAA aqueous solutions with salt at 20.0 �C.

L. Campo-Deaño et al. / Journal of Non-Newtonian Fluid Mechanics 166 (2011) 1286–1296 1295
polymer aqueous solutions, which exhibit a qualitatively similarbehavior. For water the variation of pressure drop with the flowrate is characterized by a unique slope across the whole range ofconditions, whereas for each polymer solution there is a dualbehavior. At low flow rates the pressure drop varies with the flowrate in a linear fashion characterized by a slope that depends onthe viscosity of the solution. When the flow rate is increased abovea critical value, an increase in the slope is observed, which can berelated with the onset of viscoelastic effects. The critical valuesdetermined in this way are in agreement with Decr obtained fromflow visualizations (as shown by the dashed lines Fig. 11). Forthe higher polymer concentration the increase of the pressure dropslope is not as significant due to the competing effects of the slightshear thinning viscosity at high flow rates.
Based on the previous results we propose as an alternativemethod to the CaBER experiment for the determination of therelaxation time of the dilute polymer solutions to do an extrapola-tion from the relaxation time obtained for the highest concentra-tions (400 and 250 ppm) and assuming that the critical De isessentially independent of the polymer concentration in the rangeunder consideration here. In this way assuming that Decr � 4 andby using Eq. (8), we can estimate the relaxation time for the50 ppm solution, obtaining the value k � 5 ms, which is in goodagreement with the CaBER measurement value, despite the inher-ent difficulties in obtaining this value.
4. Concluding remarks
This work analyzed the shear and elongational rheology ofaqueous solutions of PAA at different polymer concentrations.The addition of small amounts of NaCl resulted in a significant de-crease of shear viscosity and more interestingly in the degree ofshear-thinning. The low viscosity Boger fluids developed are par-ticularly useful to study elastic effects in microchannel devices,due to the characteristic reduction of inertial effects at the micro-scale. The visualizations of the flow patterns in the hyperbolic con-traction/abrupt expansion microfluidic channel was relevant inorder to corroborate the degree of elasticity of each Boger fluidand in the determination of the relaxation times for the solutionswith the lowest polymer concentrations. This assessment wasmade by a quantification of the normalized vortex length upstreamof the contraction and in particular by the determination of thecritical Deborah number for the onset of the upstream vortexwhich is assumed to be independent, or only weakly dependent,of polymer concentration in the absence of inertial effects. Thisweak dependency is corroborated by a universal XR vs. De curve.Pressure drop measurements are also useful, but in this case shearthinning effects can complicate the analysis.
The advances of this work are based on the fact that elastic ef-fects were isolated from viscous effects using low viscosity Bogerfluids and Boger-like fluids, adding 1% of NaCl to different concen-trations of PAA. The use of a microchannel with a hyperbolic con-traction with these fluids constitutes a potential tool to quantifythe relaxation time of low polymer concentration when CaBERmeasurements are not reliable.
Acknowledgements
Authors acknowledge financial support from Fundação para aCiência e a Tecnologia (FCT), COMPETE and FEDER through ProjectsPTDC/EQU-FTT/71800/2006, PTDC/EQU-FTT/70727/2006, PTDC/EME-MFE/099109/2008, PTDC/EME-MFE/114322/2009 REEQ/928/EME/2005 and REEQ/298/EME/2005. F.J. Galindo-Rosales wouldlike to acknowledge FCT for financial support (SFRH/BPD/69663/2010). M.A. Alves acknowledges the Chemical Engineering
Department of FEUP for conceding a sabbatical leave. The authorsacknowledge Prof. Pilar Gonçalves for using the TA InstrumentsAR-G2 rheometer. SEM images were taken at CEMUP, which isgrateful for the financial support to FCT through Projects REEQ/1062/CTM/2005 and REDE/1512/RME/2005.
References
[1] G.M. Whitesides, The origins and the future of microfluidics, Nature 442 (2006)368–373.
[2] C.W. Macosko, Rheology: Principles, Measurements and Applications, Wiley/VCH, Poughkeepsie, NY, 1994.
[3] C.J.S. Petrie, Extensional viscosity: a critical discussion, J. Non-Newton. FluidMech. 137 (2006) 15–23.
[4] L.E. Rodd, J.J. Cooper-White, D.V. Boger, G.H. McKinley, Role of the elasticitynumber in the entry flow of dilute polymer solutions in micro-fabricatedcontraction geometries, J. Non-Newton. Fluid Mech. 143 (2007) 170–191.
[5] G.H. McKinley, L.E. Rodd, M.S.N. Oliveira, J.J. Cooper-White, Extensional flowsof polymer solutions in microfluidic converging/diverging geometries, J.Central South Univ. Technol. 14 (2007) 6–9.
[6] M.S.N. Oliveira, M.A. Alves, F.T. Pinho, G.H. McKinley, Viscous flow throughmicrofabricated hyperbolic contractions, Exp. Fluids 43 (2007) 437–451.
[7] C. Clasen, B.P. Gearing, G.H. McKinley, The flexure-based microgap rheometer(FMR), J. Rheol. 50 (2006) 883–905.
[8] H.A. Barnes, A Handbook of Elementary Rheology, Intitute of Non-NewtonianFluid Mechanics, University of Wales, Aberystwyth, Wales, 2000.
[9] D.V. Boger, A highly elastic constant-viscosity fluid, J. Non-Newton. FluidMech. 3 (1977) 87–91.
[10] D.F. James, Boger fluids, Ann. Rev. Fluid Mech. 41 (2009) 129–142.[11] T. Nguyen, D.V. Boger, The kinematics and stability of die entry flows, J. Non-
Newton. Fluid Mech. 5 (1979) 353–368.[12] R.E. Evans, K. Walters, Flow characteristics associated with abrupt changes in
geometry in the case of highly elastic liquids, J. Non-Newton. Fluid Mech. 20(1986) 11–29.
[13] J.P. Rothstein, G.H. McKinley, Extensional flow of a polystyrene Boger fluidthrough a 4:1:4 axisymmetric contraction/expansion, J. Non-Newton. FluidMech. 86 (1998) 61–88.
[14] M.A. Alves, P.J. Oliveira, F.T. Pinho, Visualizations of Boger fluid flows in a 4:1square/square contraction, AIChE J. 51 (2005) 2908–2922.
[15] P.C. Sousa, P.M. Coelho, M.S.N. Oliveira, M.A. Alves, Three-dimensional flow ofNewtonian and Boger fluids in square–square contractions, J. Non-Newton.Fluid Mech. 160 (2009) 122–139.
[16] A. Groisman, S.R. Quake, A microfluidic rectifier: anisotropic flow resistance atlow Reynolds numbers, Phys. Rev. Lett. 92 (2004) 1–4.
[17] M.S.N. Oliveira, L.E. Rodd, G.H. McKinley, M.A. Alves, Simulations ofextensional flow in microrheometric devices, Microfluid. Nanofluid. 5 (2008)809–826.
[18] R.P. Chhabra, J. Comiti, I. Machac, Flow of non-Newtonian fluids in fixed andfluidised beds, Chem. Eng. Sci. 56 (2001) 1–27.
[19] I.G. Sedeva, D. Fornasiero, J. Ralston, D.A. Beattie, The influence of surfacehydrophobicity on polyacrylamide adsorption, Langmuir 25 (2009) 4514–4521.
[20] M.S.N. Oliveira, M.A. Alves, F.T. Pinho, Microfluidic Flows of Viscoelastic Fluids.Transport and Mixing in Laminar Flows. Reviews of Nonlinear Dynamics andComplexity, Wiley-VCH, 2011.
[21] A. Groisman, V. Steinberg, Elastic turbulence in a polymer solution flow,Nature 405 (2000) 53–55.
[22] A. Aitkadi, P. Carreau, G. Chauveteau, Rheological properties of partiallyhydrolyzed polyacrylamide solutions, J. Rheol. 31 (1987) 537–561.
[23] M.T. Ghannam, M.N. Esmail, Rheological properties of aqueous polyacrylamidesolutions, J. Appl. Polym. Sci. 69 (1998) 1587–1597.
[24] M.H. Yang, The rheological behavior of polyacrylamide solution, J. Polym. Eng.19 (1999) 371–381.
[25] M.T. Ghannam, Rheological properties of aqueous polyacrylamide/NaClsolutions, J. Appl. Polym. Sci. 72 (1999) 1905–1912.
[26] H.Q. Sun, K.L. Zhang, J. Chen, S.W. Zeng, Z.H. Ping, Y.Z. Xu, Effect of hydrophobicassociation on structure and rheological behaviors of polyacrylamide basedaqueous solutions, Acta Polym. Sin. 6 (2006) 810–814.
[27] L.H. Zhang, Z. D, B. Jiang, The rheological behavior of salt tolerantpolyacrylamide solutions, Chem. Eng. Technol. 29 (2006) 395–400.
[28] J.R. Stokes, L.J.W. Graham, N.J. Lawson, D.V. Boger, Swirling flow of viscoelasticfluids. Part 2. Elastic effects, J. Fluid Mech. 429 (2001) 117–153.
[29] J.C. McDonald, D.C. Duffy, J.R. Anderson, Fabrication of microfluidic systems inpoly(dimethylsiloxane), Electrophoresis 21 (2000) 27–40.
[30] P.C. Sousa, F.T. Pinho, M.S.N. Oliveira, M.A. Alves, Extensional flow of bloodanalogue solutions in microfluidic devices, Biomicrofluidics 5 (2011) 014108.
[31] V.B. Evelien, Microfluidic Flow in Porous Medium Analogues, Master Thesis.University of Porto, 2010.
[32] J. Dealy, D. Plazek, Time–temperature superposition – a users guide, Rheol.Bull. 78 (2009) 16–31.
[33] M.M. Cross, Relation between viscoelasticity and shear-thinning behavior inliquids, Rheol. Acta 18 (1979) 609–614.
[34] J.F. Ryder, J.M. Yeomans, Shear thinning in dilute polymer solutions, J. Chem.Phys. 125 (2006) 194906.

1296 L. Campo-Deaño et al. / Journal of Non-Newtonian Fluid Mechanics 166 (2011) 1286–1296
[35] G.H. McKinley, T. Sridhar, Filament-stretching rheometry of complex fluids,Ann. Rev. Fluids Mech. 34 (2002) 375–415.
[36] G. Harrison, G.V. Franks, V. Tirtaatmadja, D.V. Boger, Suspensions andpolymers – common links in rheology, Korea–Australia Rheol. J. 11 (1999)197–218.
[37] L. Campo-Deano, C. Clasen, The slow retraction method (SRM) for thedetermination of ultra-short relaxation times in capillary break-upextensional rheometry experiments, J. Non-Newton. Fluid Mech. 165 (2010)1688–1699.
[38] L.E. Rodd, T.P. Scott, D.V. Boger, J.J. Cooper-White, G.H. McKinley, The inertio-elastic planar entry flow of low-viscosity elastic fluids in micro-fabricatedgeometries, J. Non-Newton. Fluid Mech. 129 (2005) 1–22.
[39] J.P. Rothstein, G.H. McKinley, The axisymmetric contractionexpansion: the roleof extensional rheology on vortex growth dynamics and the enhancedpressure drop, J. Non-Newton. Fluid Mech. 98 (2001) 33–63.