Flow Assurance Study for a Waxy Crude Oil - SUST Repository
73
i Sudan University of Science & Technology College of Petroleum Engineering Department of Petroleum Engineering Flow Assurance Study for a Waxy Crude Oil A Case Study from Bara Field, Sudan نفطي شمعيلجريان لخامن اسة لضما درارا, السودانحقل با نموذج دراسي لA thesis Submitted to the College of Petroleum Engineering As requirement for the Degree of B.S.C. (Honors) By: Ahmed Fathi Ahmed Hadi Ahmed Ali Mohammed Ali Alaa Abd Alwahab Mohammed Alhassan Samaa Hassan Altahir Altayeb Supervisor: T. Mohanned Khiary Khartoum- October- 2018
-
Upload
khangminh22 -
Category
Documents
-
view
4 -
download
0
Transcript of Flow Assurance Study for a Waxy Crude Oil - SUST Repository
i
Sudan University of Science & Technology
College of Petroleum Engineering
Department of Petroleum Engineering
Flow Assurance Study for a Waxy Crude Oil
A Case Study from Bara Field, Sudan
دراسة لضمان الجريان لخام نفطي شمعي
نموذج دراسي لحقل بارا, السودان
A thesis
Submitted to the College of Petroleum Engineering
As requirement for the Degree of
B.S.C. (Honors)
By:
Ahmed Fathi Ahmed Hadi
Ahmed Ali Mohammed Ali
Alaa Abd Alwahab Mohammed Alhassan
Samaa Hassan Altahir Altayeb
Supervisor:
T. Mohanned Khiary
Khartoum- October- 2018

ii
This project is accepted by College of Petroleum Engineering and
Technology to Department of Petroleum Engineering.
Project Supervisor………...……………………………...................
Signature…….………………………………………………………
Head of Department………………………………………………...
Signature ………………………………………………....................
Dean of College …………...………………………….......................
Signature …………………………………………….......................
Date: / / 2018

iii
بسم هللا الرحمن الرحيم
الهذين آمنوا منكم والهذي} : قال تعالي [11 :المجادلة] درجات ن أوتوا العلم يرفع هللاه

iv
Dedication
We dedicate this work to each other's, to Ahmed's wife and our
supportive families.
We also dedicate it to Diana Hussein, Grandpa Abd-Allateef, Father Ali
Mohammed Ali and every dear person we lost along the way; we believe
you are watching us with pride. May Allah rest your souls in peace.

v
Acknowledgment
First of all we thank Allah for gracing us with the gift of Education, as
its one of his greatest blesses on earth. We thank him for putting us in this
path, for opening our eyes and minds with knowledge and finally we ask
him to give us the faith and strength to develop our country.
Secondly we want to express our deep gratitude to Teacher Muhanned
Khiary, we appreciate every moment he has devoted teaching, guiding and
supporting us, and we wouldn’t make it this far without his advices.
We are deeply thankful to every Teacher in Sudan University broadly,
especially in College of petroleum engineering for being candles lighting
up our lives.
Thanks also extended to Petroleum Laboratory Staff, and to everybody
honored us with his precious time.

vi
Abstract
Flow assurance is a relatively new term in oil and gas industry. It refers
to ensuring successful and economical flow of hydrocarbon from reservoir
to the point of sale. The term was considered by Petrobars in the early
1990s. Beside network modeling and transient multiphase simulation, flow
assurance involves effectively handling many solid deposits and also
includes thermal investigation of pipelines, making sure the temperature is
above the wax appearance temperature and hydrate's formation
temperature.
Crude oil flow in Bara filed is restricted by wax deposition during
production, resulting in complex production operations, pipelines
detraction and eventually complete well shut-down. This project aims to
improve production performance by guaranteeing flow assurance of crude
through well tubing, Flow lines and Trunk line.
In this study wax deposition problem was evaluated by laboratory
analysis of a crude sample from the field and analyzed in Central Petroleum
Laboratories; Field performance model constructed and studied using
Multi-Flash & OLGA Software.
Thermal treatment of crude above the Wax Appearance Temperature
using Down-Hole Heater found to be effective in preventing wax
accumulation and deposition and in improving production performance.
This is the first study of its kind to be applied in Bara field. In addition,
the network model by using OLGA software was created for the first time
for this field. Finally down-hole heaters application is relatively new
technique in Sudanese fields.
Down-hole heaters found to be very effective in solving wax deposition
problems both technically and economically. It is recommended to be used
to overcome flow assurance hindrances.

vii
تجريد
الى ضمان نجاح التدفق ضمان الجريان يعتبر مصطلح جديد في مجال الصناعة النفطية ويشير
تقنيا واقتصاديا من المكمن الى نقاط البيع وقد تم اطالق هذا المصطلح بواسطة شركة بتروبار في
ضمان ينطوي مجموعة االبار والمحاكاة متعددة االطوار, ةالى جانب نمذج .اوائل التسعينات
ضمان التدفق الفحص الحراري يشمل التدفق على التعامل الفعال مع العديد من الرواسب الصلبة.
من ان درجة الحرارة فوق درجه حرارة ظهور الشمع ودرجه حرارة والتأكد لخطوط االنابيب ,
تكوين الهيدريتات.
يل لالجريان في حقل بارا بسبب ترسب الشمع مما يؤدي إلى تعقيد عمليات األنتاج وتق ةيتم إعاق
إذا لم يتم تفادي الترسيب الشمعي. إغالق قطر األنبوبقطر األنبوب ,ممايؤدي إلى
من عمق البئر مرورا بأنبوب تحسين اداء االنتاج عن طريق ضمان التدفقهدفت هذه الدراسه ل
.االنتاج في البئر حتى أنابيب التدفق السطحية
تجارب مختبرية في مختبرات ترسب الشمع عن طريق اجراء شكلةفي هذه الدراسه تم تحليل م
و ال OLGAالبئر باستخدام برنامجي ال لعينة من الخام. تمت محاكاة ادائية النفط المركزية
Multi-Flash.
داخل حراري نزال سخانالمعالجة الحرارية للخام فوق درجة حرارة ظهور الشمع عن طريق إ
نتاج.رسب وتراكم الشمع وتحسين ادائية اإلالبئر اثبتت فعاليتها في منع ت
لتطبيق برنامج تم تطبيقها في حقل بارا, باالضافةولى من نوعها التي يألتعتبر هذه الدراسة هي ا
نسبيا إستخدام تقنية السخان داخل األبار هي تقنية جديدةلهذا الغرض. اخيرا ول مرةأل OLGAال
.في الحقول السودانية
التقنية واالقتصادية طريقةفعالة جدا من الناحية ان استخدام السخانات داخل البئر اثبتت الدراسة
الجريان.مشاكل إعاقة معالجةل الشمع. يوصي باستخدام هذه الطريقةتجمع في حل مشكلة
viii
Table of Contents
Dedication …………………………………………………….............iv
Acknowledgment………………………………………….……………v
Abstract……….……………………………………………….… vi
…………………………….……….…………………….....vii تجريد
CHAPTER 1 ......................................................................................... 1
1.1 About the field ……………………………..…………………...…. 2
1.2 Problem statement………………………………………………… 4
1.3 Project objectives ………………………………………………… 4
1.4 Limitation ………………………………………………..…….…..5
CHAPTER 2 …………………………...……………………..……….. 6
2.1 General back ground …………………………………………..... 6
2.2 Deposition Materials and Mechanism……………………………. 8
2.2.1 Hydrates …………………………………………………….......8
2.2.2 Wax Deposition …………………………………………......…10
2.2.3 Asphaltenes …………………………………….………..….12
2.2.4 Slugging ………………..………………………….……….13
2.2.5Naphthens ……………………………………………………14
2.2.6 Scales ……………………………………………….….......15
2.2.7 Corrosion………….………….…………………….……. 19
2.2.8 Emulation…………………………………………….…....... 21
ix
2.3 Treating Mechanisms ……….………………....................22
2.3.1 Thermal Treatment…………...………………………......23
2.3.2 Mechanical Treatment……………………………….…. 24
2.3.3 Chemical Treatment………………………………………. 25
2.3.4 Additional Treatment Methods…………………….…..........26
CHAPTER 3…………………………………………………..……. 27
3.1 Sample specifications……………..……….…………………27
3.2 Lab work……………………….………………….………......28
3.2.1 Gas chromatography……………..………...……….....…...28
3.2.2 DSC……………………………………….….……..………31
3.3 Data Analysis…………………………….……………………34
3.3.1 Multi-Flash..............................................................................34
3.3.2 Olga software………………………………………...…….35
CHAPTER 4…………….…………………………………….…… 39
4.1Multi-Flash Results…………………………………….…… 39
4.1.1 Phase Envelope…………………………….……………39
4.1.2 Wax Precipitation Curve…………………………………..39
4.2 OLGA SOFTWARE Results…………………..……………40
4.2.1First Scenario…………………………….…………………...40
4.2.2 Second scenario………………………….………………….42
4.2.3Third scenario...………………………………………………45
4.3 Economic Evaluation of Proposed Solutio……………...…..46

x
CHAPTER 5………………….……………………..………………50
5.1 Conclusion……………………….…………………..…..50
5.2 Recommendations…………………...…………………... 51
References ………………………………………………………… 52
xi
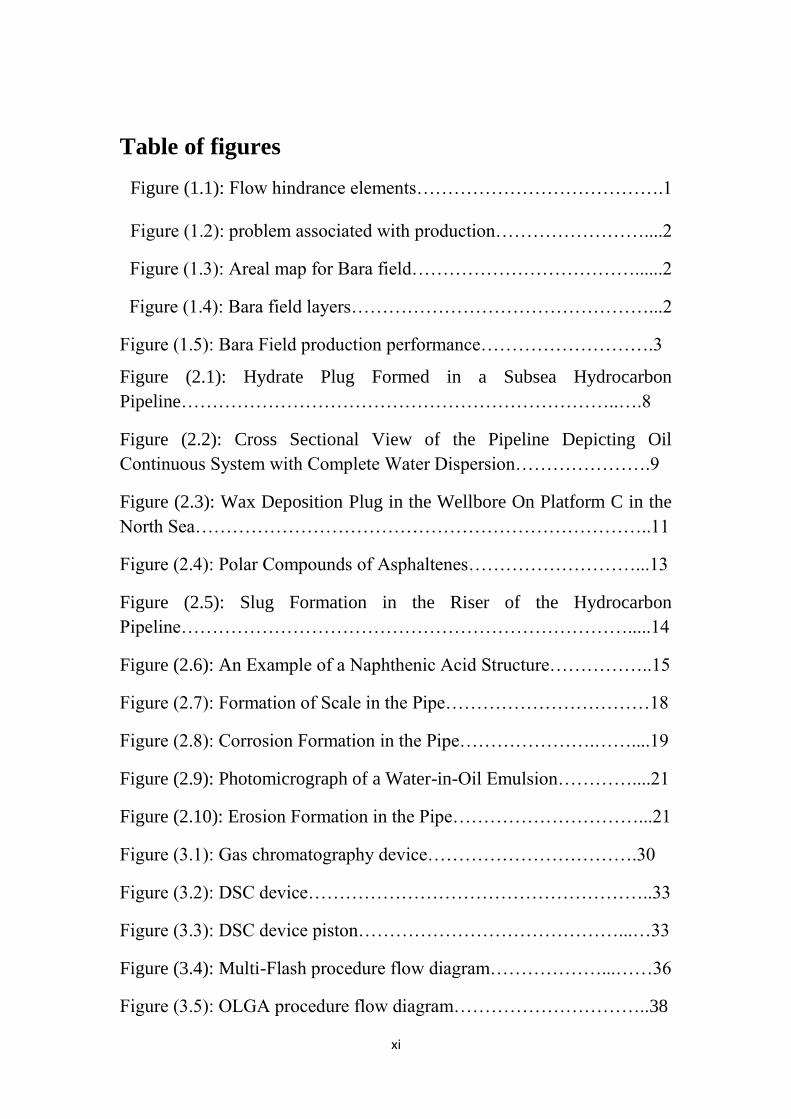
Table of figures
Figure (1.1): Flow hindrance elements………………………………….1
Figure (1.2): problem associated with production……………………....2
Figure (1.3): Areal map for Bara field………………………………......2
Figure (1.4): Bara field layers…………………………………………...2
Figure (1.5): Bara Field production performance……………………….3
Figure (2.1): Hydrate Plug Formed in a Subsea Hydrocarbon
Pipeline……………………………………………………………..….8
Figure (2.2): Cross Sectional View of the Pipeline Depicting Oil
Continuous System with Complete Water Dispersion………………….9
Figure (2.3): Wax Deposition Plug in the Wellbore On Platform C in the
North Sea………………………………………………………………..11
Figure (2.4): Polar Compounds of Asphaltenes………………………...13
Figure (2.5): Slug Formation in the Riser of the Hydrocarbon
Pipeline……………………………………………………………….....14
Figure (2.6): An Example of a Naphthenic Acid Structure……………..15
Figure (2.7): Formation of Scale in the Pipe……………………………18
Figure (2.8): Corrosion Formation in the Pipe………………….……....19
Figure (2.9): Photomicrograph of a Water-in-Oil Emulsion…………....21
Figure (2.10): Erosion Formation in the Pipe…………………………...21
Figure (3.1): Gas chromatography device…………………………….30
Figure (3.2): DSC device………………………………………………..33
Figure (3.3): DSC device piston……………………………………...…33
Figure (3.4): Multi-Flash procedure flow diagram………………...……36
Figure (3.5): OLGA procedure flow diagram…………………………..38
xii
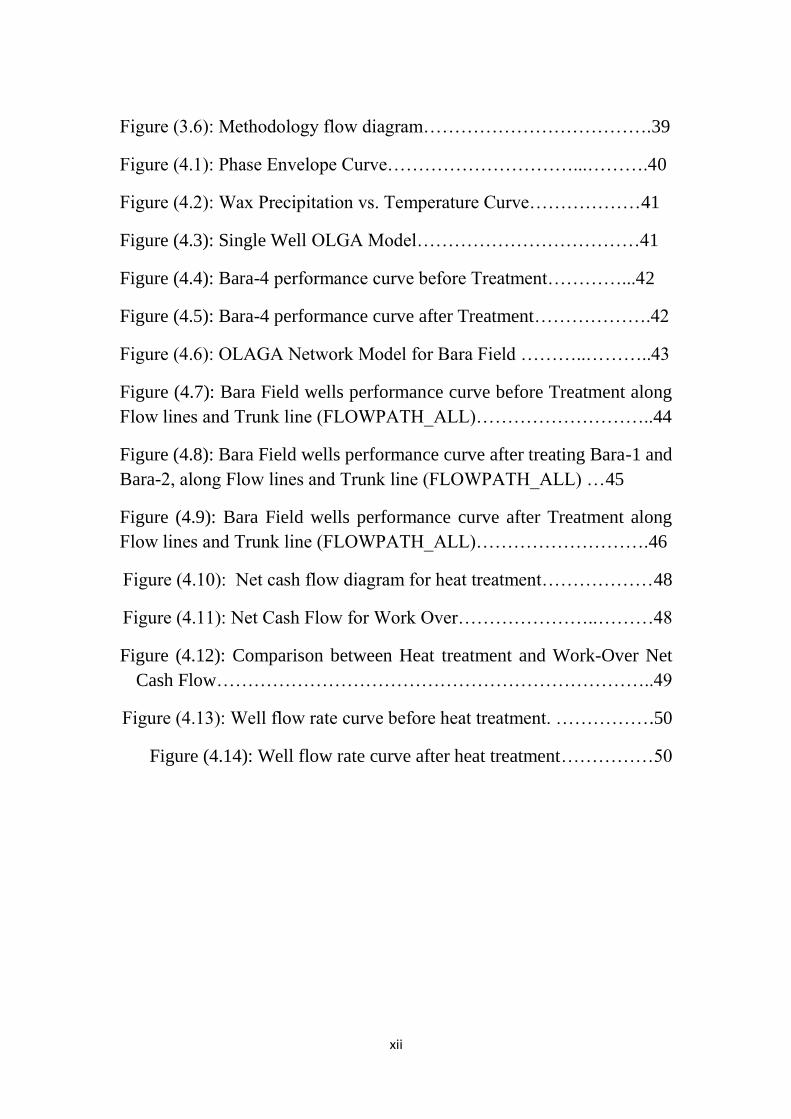
Figure (3.6): Methodology flow diagram……………………………….39
Figure (4.1): Phase Envelope Curve…………………………...……….40
Figure (4.2): Wax Precipitation vs. Temperature Curve………………41
Figure (4.3): Single Well OLGA Model………………………………41
Figure (4.4): Bara-4 performance curve before Treatment…………...42
Figure (4.5): Bara-4 performance curve after Treatment……………….42
Figure (4.6): OLAGA Network Model for Bara Field ………..………..43
Figure (4.7): Bara Field wells performance curve before Treatment along
Flow lines and Trunk line (FLOWPATH_ALL)………………………..44
Figure (4.8): Bara Field wells performance curve after treating Bara-1 and
Bara-2, along Flow lines and Trunk line (FLOWPATH_ALL) …45
Figure (4.9): Bara Field wells performance curve after Treatment along
Flow lines and Trunk line (FLOWPATH_ALL)……………………….46
Figure (4.10): Net cash flow diagram for heat treatment………………48
Figure (4.11): Net Cash Flow for Work Over…………………..………48
Figure (4.12): Comparison between Heat treatment and Work-Over Net
Cash Flow……………………………………………………………..49
Figure (4.13): Well flow rate curve before heat treatment. …………….50
Figure (4.14): Well flow rate curve after heat treatment……………50
xiii
List of tables
Table (3.1): Sample Specification……………………………………29
Table (4.1): Net Present Value for Heat treatment and Work over……49
List of Equations
Equation 1……………………………………………………………..37
Equation 2……………………………………………………………..37
Equation 3……………………………………………………………..37
Equation 4……………………………………………………………..38
Equation 5……………………………………………………………..3

- 1 -
CHAPTER 1
INTRODUCTION
Sudanese crudes mostly contain high content of wax, which result in poor
rheology and affect the flow assurance of this crude.
When the flow is restricted by the crystallization or deposition of organic
or non-organic components as a result of changing in flow conditions, flow
assurance term is introduced.
It's relatively a new term which means insuring successful and economical
flow of hydrocarbons from downstream to the upstream sections.
Figure (1.1): Flow hindrance elements.
Gas
Hydrates
Paraffin / Ashphaltenes
Scales
Liquid Slugging
Low Temperatures
Sand / Erosion
Corrosion
Emulsion/ Foam
Flow
Assurance
- 2 -
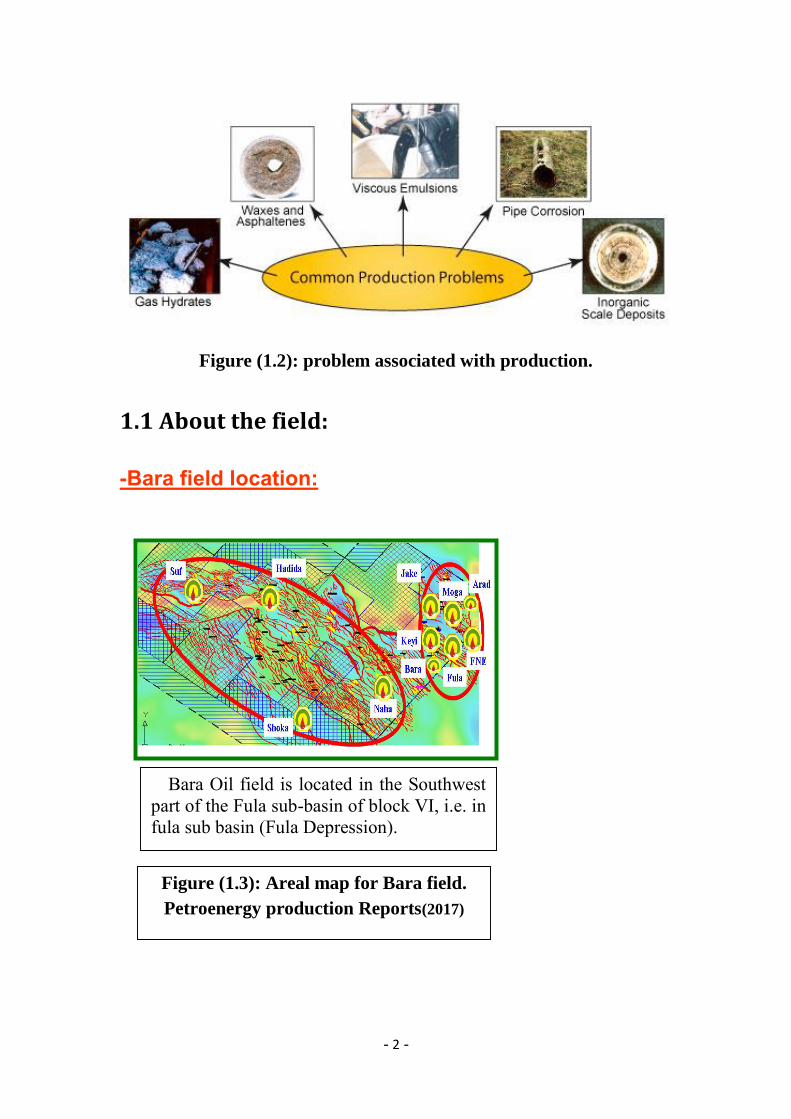
Figure (1.2): problem associated with production.
1.1 About the field:
-Bara field location:
Figure (1.3): Areal map for Bara field.
Petroenergy production Reports(2017)
Bara Oil field is located in the Southwest
part of the Fula sub-basin of block VI, i.e. in
fula sub basin (Fula Depression).
- 3 -
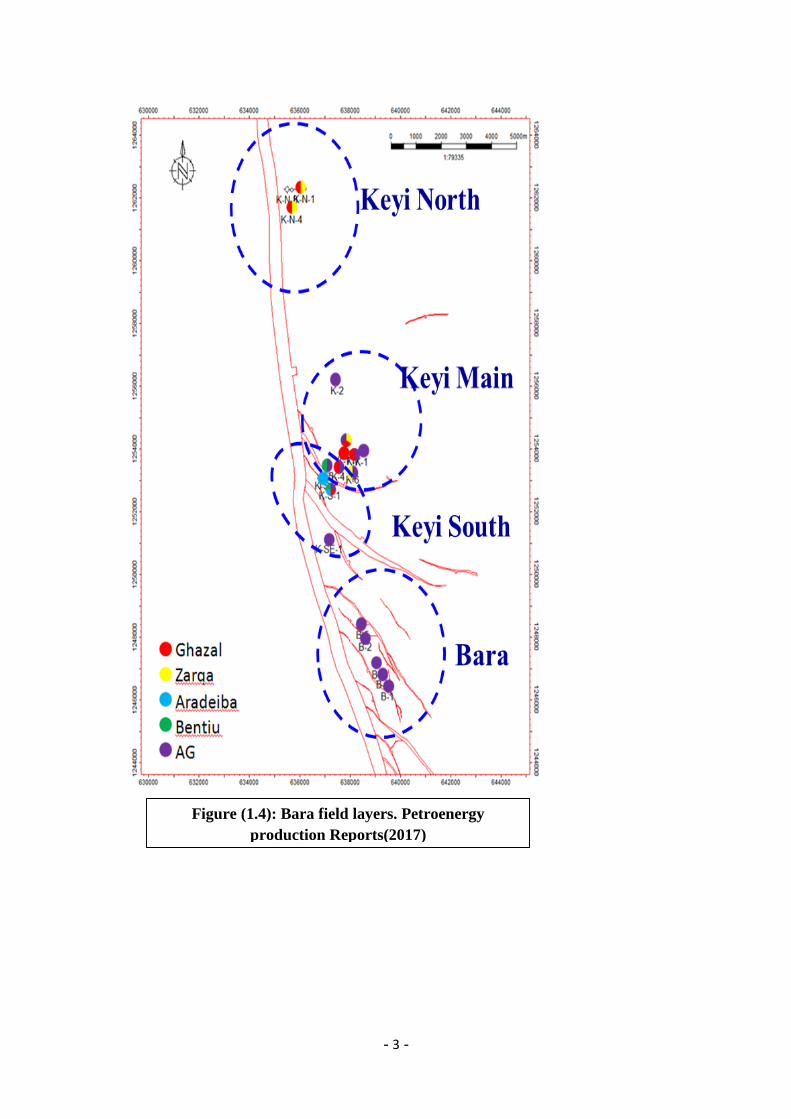
Figure (1.4): Bara field layers. Petroenergy
production Reports(2017)
- 4 -
Structure:
-In Bara field; faults are generally characterized as normal faults.
-The reservoir type is layered reservoir in Bara field.
-The major producing zone in Bara AG (sub-layers formations AG1a,
AG1b, AG1c &AG1d).
-OOIP accounted in AG1b and AG1d.
Pressure and Temperature System:
Normal pressure & temperature system:
-Pressure Gradient is 0.93 ~1.07 psi/100 m.
-Temperature gradient is 1.95 ~3.34ºC/100 m.
-The crude API is 35.8, with lower density of 0.835~0.851 g/cm3 in Abu-
Gabra formation.
-The oil in AG formation has high pour point (32-49 ℃).
-Low GOR &low acid number.
-Accordingly; the reservoir has good porosity (22%) and medium to low
permeability.
Production performance:
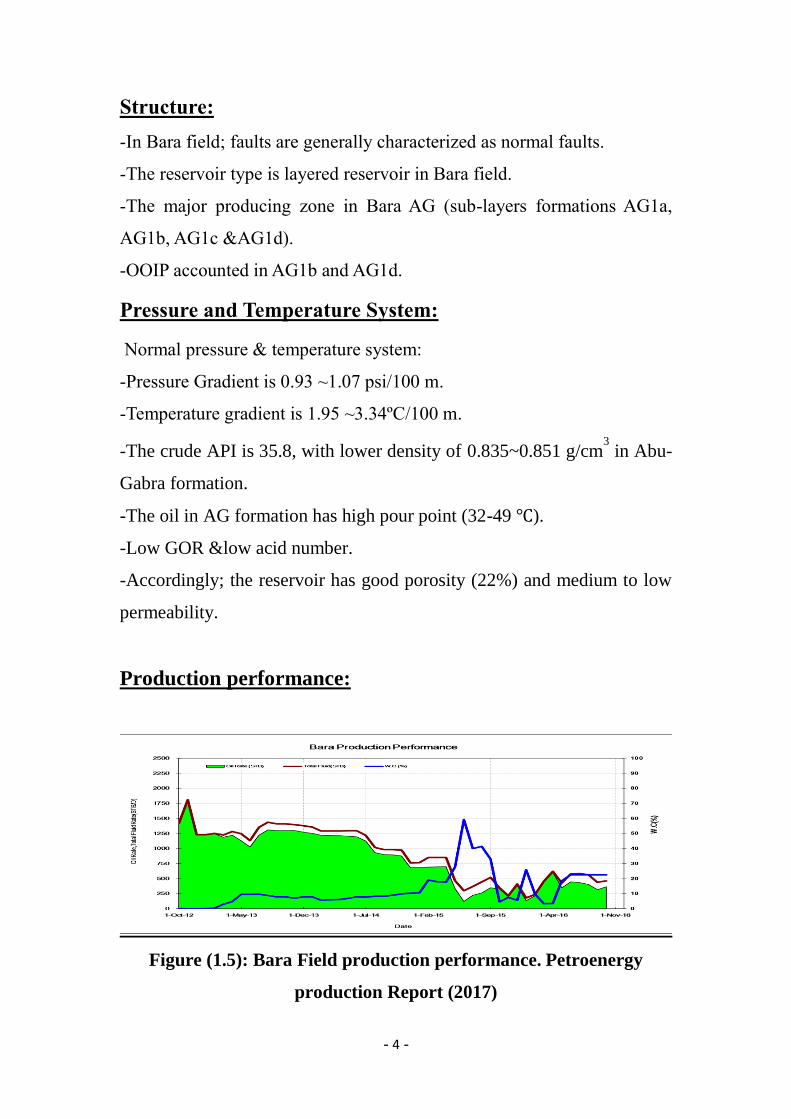
Figure (1.5): Bara Field production performance. Petroenergy
production Report (2017)
- 5 -
-Total number of wells is 7 (6 producers (3 active+ 3non active) +1 dry).
-B-5 completed in AG1b but it is not commissioned due to high pour point.
-B-7 has been commissioned successfully in last Aug.2015.
-There are 2 idle wells in Bara field out of 7 total wells.
-Bara field started production since Oct.2012.
-Bara oil field has been completed with single layer in the upper part of AG
formation.
-Currently, As per Oct.31st, 2016 Bara production is as below:
Cum Oil = 1.295 MMSTB, Ql= 465 STB/D, Qo= 367 STB/D, WC= 21%
-Sharply declined due to stop production (natural flow) from B-2 which is
the most important well in Bara Field.
1.2Problem statement:
Wax deposition in Bara field causes restriction of flow in well tubing,
flow-lines and trunk lines. As well as diameter reduction, equipment
damage, difficult production operations and higher cost of repair and
maintenance.
1.3 Project objectives:
To analyze wax effect on the flow and how best to treat it with
heating method according to laboratory measurement (PVT) data.
To build a model for Bara field using OLGA software.
To study and implement different heating scenarios to validate the
use of down-hole heaters in Bara field. To select the scenario which results in great reduction of wax
deposition in well tubing, flow lines and trunk line.
To conduct an economic study for the evaluation of the effectiveness
of heat treatment method in lowering of work-over and maintenance
costs.

- 6 -
1.4 Limitation:
Difficult data access.
DSC device not available.
Wax content measuring device not available.
- 7 -
CHAPTER 2
LITRETURE REVIEW
General back ground:
Flow assurance is the technical discipline that guarantees
accomplishment of lifting and transport system lifetime production targets
from the near wellbore to offloading tanks by forecasting, preventing and
solving problems instigated by the behavior of the transported material
(gases, liquids or solids) either separated or multiphase conditions. (Di
Lullo, 2012)
Flow assurance involves guaranteeing fluid flow in well, flow line and
trunk line. Transportation of heavy/waxy crude oils with high viscosity
makes flow through pipelines problematic and challenging. It has been
recognized that n-paraffin’s are principally responsible for this problem.
These solid elements deposit in production tubing, pipelines, processing
equipment and eventually cause plugging in the operations. Challenging
flow assurance and field development issues affect both well completion
design and production operation schemes. Flow assurance is a significant
area for multiphase flow of oil, gas and water to minimize economical loss
for the petroleum industry.
In the last decade Flow Assurance has emerged as a major technical
discipline and has gained attention due to its impact in the petroleum
industry. It has given rise to an inter disciplinary research wherein along
with the development in laboratory and use of various chemicals, emphasis
on modeling and simulating the pipeline under various conditions has been
studied at large. This has led to the development of real time data
monitoring software and Flow Assurance Advisory systems. These
systems rely on good model predictions and available sensor readings in
the production system. This software is still growing and various rigorous
and robust models for flow assurance issues have been customized based
on specific field characteristics. (Kondapi and Moe, 2013).
- 8 -
While flowing through a long pipeline, it is important to take an account
of viscosity, acidity and salt content for field operations. All these aspects
can affect pipeline dimensions. The process of ensuring a continuous flow
of oil despite different issues which can cause flow complications is known
as Flow Assurance.
Although Flow Assurance consists of a variety of issues, four main issues
are: corrosion, salts, asphaltenes and waxes. (Manafi et al., 1999)
Asphaltenes are the complex carbon-based molecules characterized by
groups of consistent aromatic rings. They can cause flow problems, mostly
in the wellhead itself as well as in the refinery lines. Asphaltene solubility
and precipitation needs extensive consideration.
In 1927 paraffins were informed as irritant to the upstream industry due
to their precipitation and buildup in the wall of the well, in the oil string
and on the face and in the pores of the sand, causing condensing of oil in
the transportation lines and in tank bottoms (Reistle Jr, 1927),
During flow through pipeline, wax may be deposited on pipe walls. A
thermal gradient between the outside ambient conditions and the internal
oil flow must exist for flow deposition. The internal wall temperature due
to the gradient must be beneath the initial wax appearance temperature. In
addition, internal shear forces in the flow must be low enough to allow
crystal growth. Wax deposits, can grow and restrict flow. While it is rare
for deposition to entirely shut down a pipeline, the loss in production
capacity is a foremost concern during waxy crude oil transportation
through pipelines(Gupta and Anirbid, 2015).
Flow assurance is successful operations that generate a controllable and
gainful flow of fluids from the reservoir to the sales point. The flow
assurance discipline that enables these operations is an integration of
disciplines, from operations to engineering to business to science.
The study based on a comprehensive review of fluid flow assurance
issues to show the risk of scale deposition associated to asphaltenes, and
wax precipitation in wellbores and pipelines that reduce production, and
presented hydrates and emulsion formation, corrosion and erosion and
identify the appropriate chemical strategy to guarantee the
production(Theyab, 2018).
- 9 -
Deposition Materials and Mechanism:
2.2.1 Hydrates:
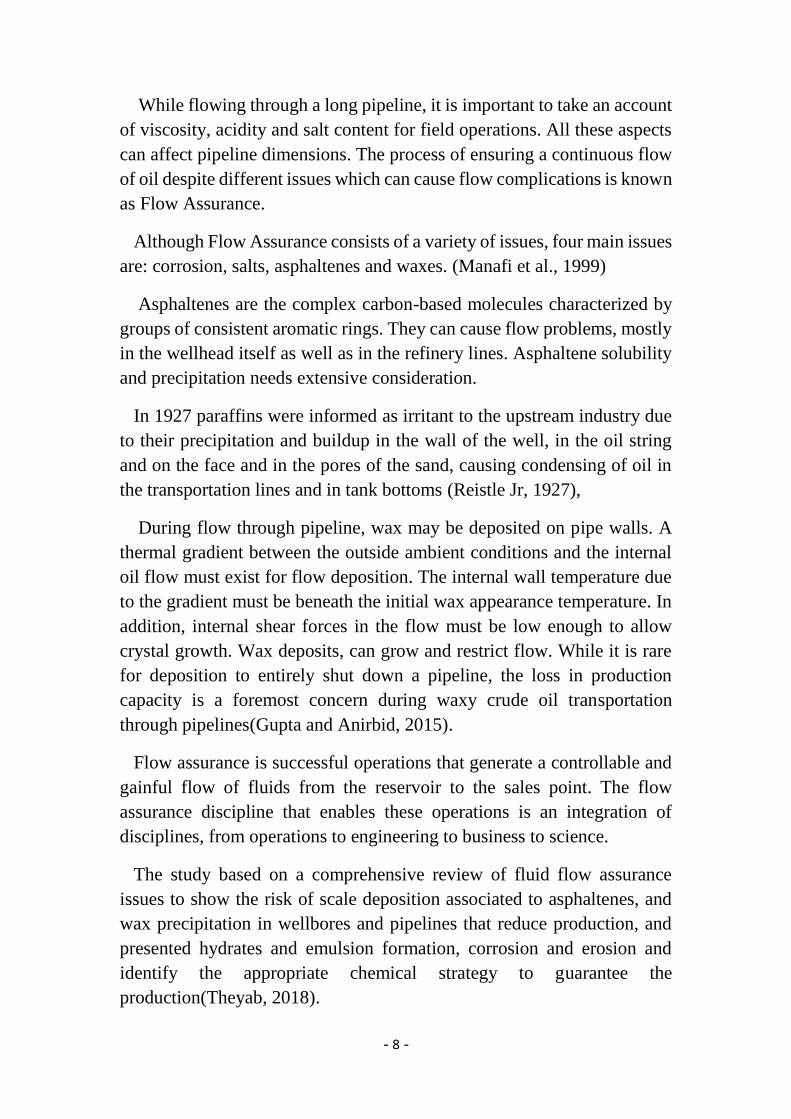
Hydrates are crystalline materials similar to ice in structure and form; at
high-pressure and low-temperature conditions when light hydrocarbons
(e.g. methane, ethane, propane, isobutene and inorganic molecules such as
CO₂ and H₂S) meet with water, resulting in crystalline molecular
complexes form that causes blockages in gas flow lines(Johal, 2012,
Larsen et al., 2003) as shown in figure.
Figure (2.1): Hydrate Plug Formed in a Subsea Hydrocarbon
Pipeline(Chaudhari, 2016, Bauck, 2013).
These crystalline composites of water and low boiling gases are creating a
singular form of molecular structure. Because of their hydrogen bonding
properties, the water molecules are able to form voids, which can house
low molecular weight molecules. The insertion of these gas molecules
stabilizes the metastable water matrix structure. There are different kinds
of common hydrate structure, which comprise numerous small and large
cavities. Only molecules of modest size and appropriate geometry are able
to enter the cavities(Dorstewitz and Mewes, 1995)
- 10 -
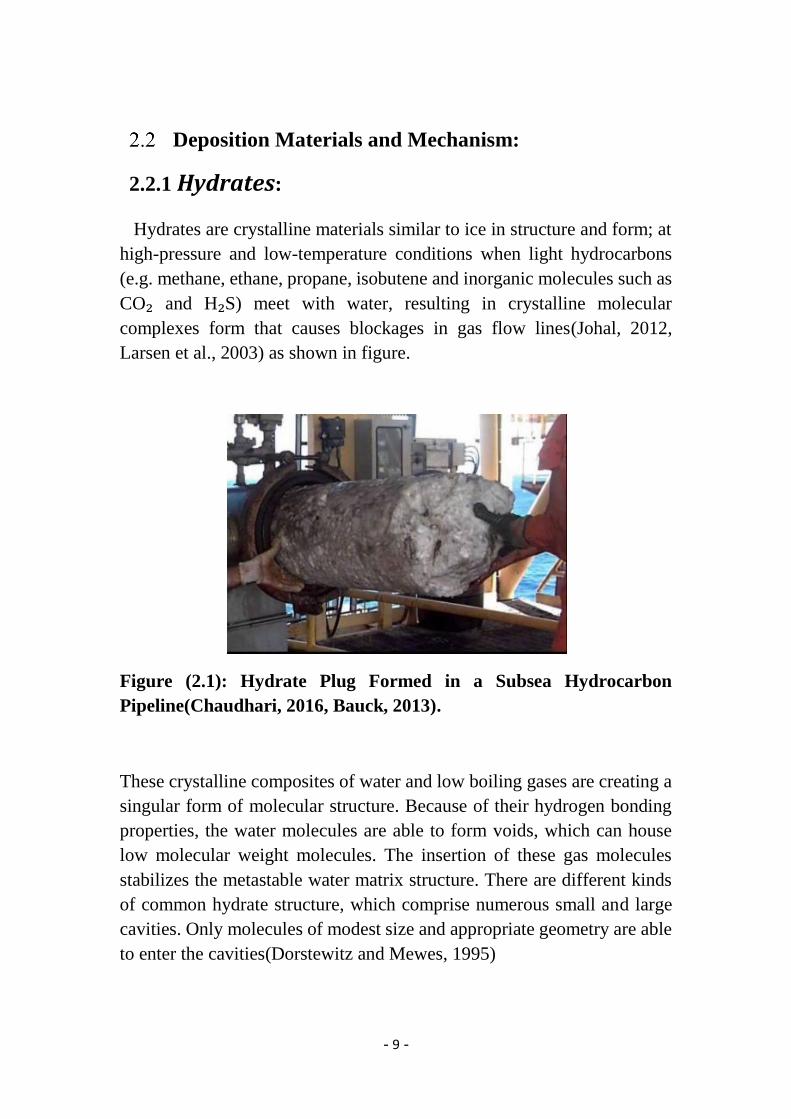
Oil dominated systems (i.e., water dispersed in the oil phase) as shown in
Figure (2.2) are commonly encountered through the initial periods of a
well’s life where the quantity of produced water is relatively little.
However, this kind of flow pattern is a function of oil properties, salt
content, temperature, surfactants present (natural or artificial), and flow
parameters associated with the system. Oil dominated flow lines are proven
to be disposed to hydrate formation at subsea low temperatures and high
pressure environments, thereby leading to hydrate-related flow assurance
concerns(Chaudhari, 2016).
Figure (2.2): Cross Sectional View of the Pipeline Depicting Oil
Continuous System with Complete Water Dispersion(Chaudhari,
2016).
As identified, in oil dominated systems, water is present in the form of
dispersed droplets along with a free gas phase. At high pressure and low
temperature conditions, hydrate shells are formed around the dispersed
water droplets therefore altering the water droplets to hydrate
particles(Theyab, 2018).
These partly converted and wholly changed particles can remain
homogeneously dispersed in the continuous oil phase depending on flow
conditions. When a certain hydrate concentration is reached, the chance of
the hydrate particles coming in contact with each other rises. As these
hydrate particles come in interaction, the cohesive force between hydrate
particles, via liquid capillary bridge, induces agglomeration. The
agglomeration process can result in the formation of a large hydrate bulk
in the flow line, therefore increasing the viscosity of the entire system. This
large hydrate bulk eventually may result in settling/accumulation and
- 11 -
formation of a moving and/or stationary bed thereby leading to the
formation of a hydrate plug in a pipeline(Chaudhari, 2016, Larsen et al.,
2003).
2.2.2 Wax Deposition:
Wax deposition is, a common problem, a serious operational challenge
and one of the main flow assurance problems in the oil industry around the
world including the offshore and onshore oil fields. Wax deposition occurs
when paraffin components in crude oil (alkanes with carbon numbers
greater than 20) precipitate and deposit on the cold pipeline wall when the
inner wall temperature drops below the wax appearance
temperature.(Singh et al., 2000)
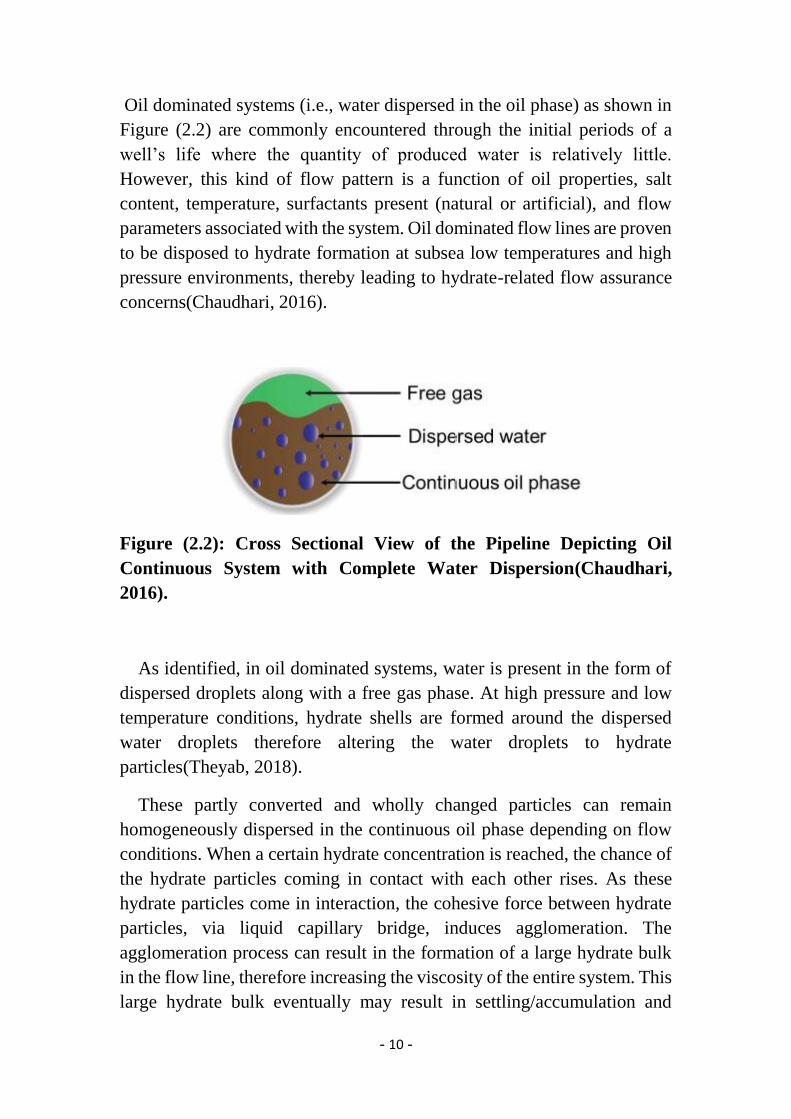
The formation of wax in the pipe during the fluid production from the
bottom hole of the well to the surface can restrict the flow of crude oil,
creating pressure irregularities and causing an artificial blockage, as shown
in figure 5, leading to the reduction or even termination of production
(Siljuberg, 2012, Bern et al., 1980, Trina and Johansen, 2015, Botne, 2012,
Kjøraas and Steinar, 2012, Tordal, 2006). Wax deposition also leads to
formation damage near the wellbore, reduction in permeability, changes in
the reservoir fluid composition and fluid rheology due to phase separation
as wax solid precipitates(Zhu et al., 2008).
Wax precipitation is impacted by several factors, such as: crude oil
composition(Singhal et al., 1991), flow rate, temperature gradient(Salam
et al., 2014), pipe wall temperature (inlet coolant temperature), crude oil
temperature, shear stress, recirculate time of oil in the rig (production time
in the field) and oil viscosity(Valinejad and Nazar, 2013).
- 12 -
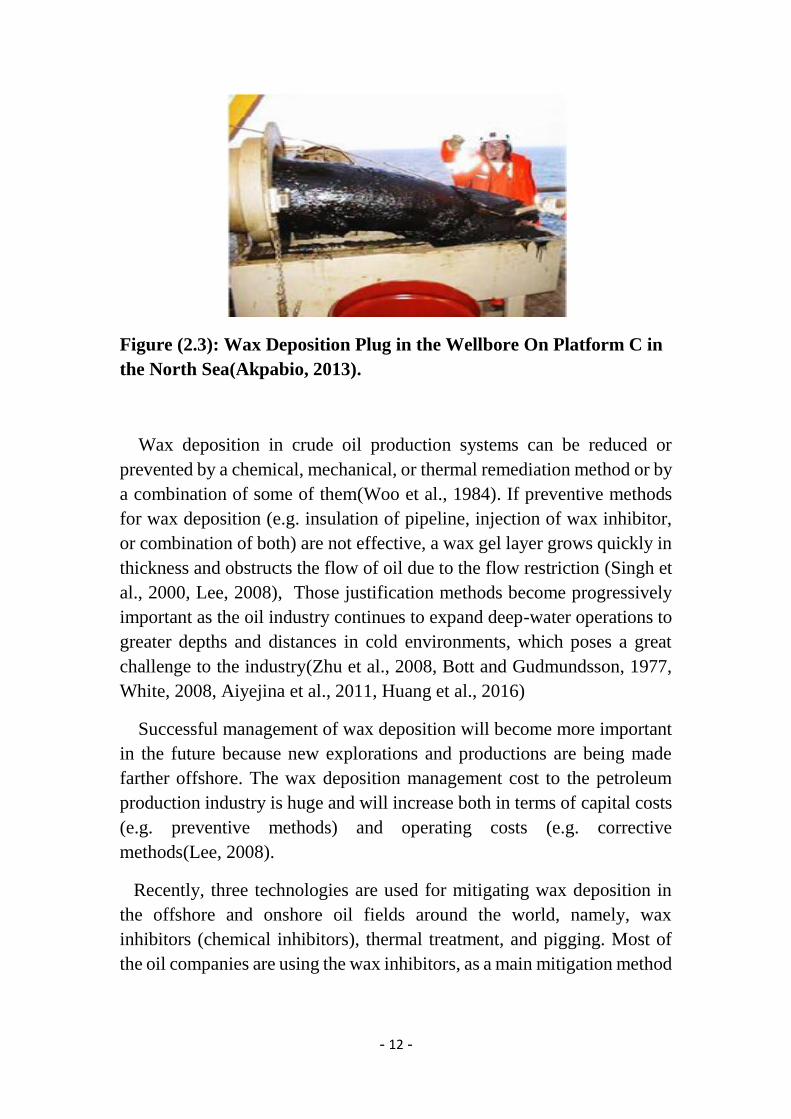
Figure (2.3): Wax Deposition Plug in the Wellbore On Platform C in
the North Sea(Akpabio, 2013).
Wax deposition in crude oil production systems can be reduced or
prevented by a chemical, mechanical, or thermal remediation method or by
a combination of some of them(Woo et al., 1984). If preventive methods
for wax deposition (e.g. insulation of pipeline, injection of wax inhibitor,
or combination of both) are not effective, a wax gel layer grows quickly in
thickness and obstructs the flow of oil due to the flow restriction (Singh et
al., 2000, Lee, 2008), Those justification methods become progressively
important as the oil industry continues to expand deep-water operations to
greater depths and distances in cold environments, which poses a great
challenge to the industry(Zhu et al., 2008, Bott and Gudmundsson, 1977,
White, 2008, Aiyejina et al., 2011, Huang et al., 2016)
Successful management of wax deposition will become more important
in the future because new explorations and productions are being made
farther offshore. The wax deposition management cost to the petroleum
production industry is huge and will increase both in terms of capital costs
(e.g. preventive methods) and operating costs (e.g. corrective
methods(Lee, 2008).
Recently, three technologies are used for mitigating wax deposition in
the offshore and onshore oil fields around the world, namely, wax
inhibitors (chemical inhibitors), thermal treatment, and pigging. Most of
the oil companies are using the wax inhibitors, as a main mitigation method
- 13 -
to reduce wax, combined with pigging or thermal insulation(Theyab,
2018).
2.2.3 Asphaltenes:
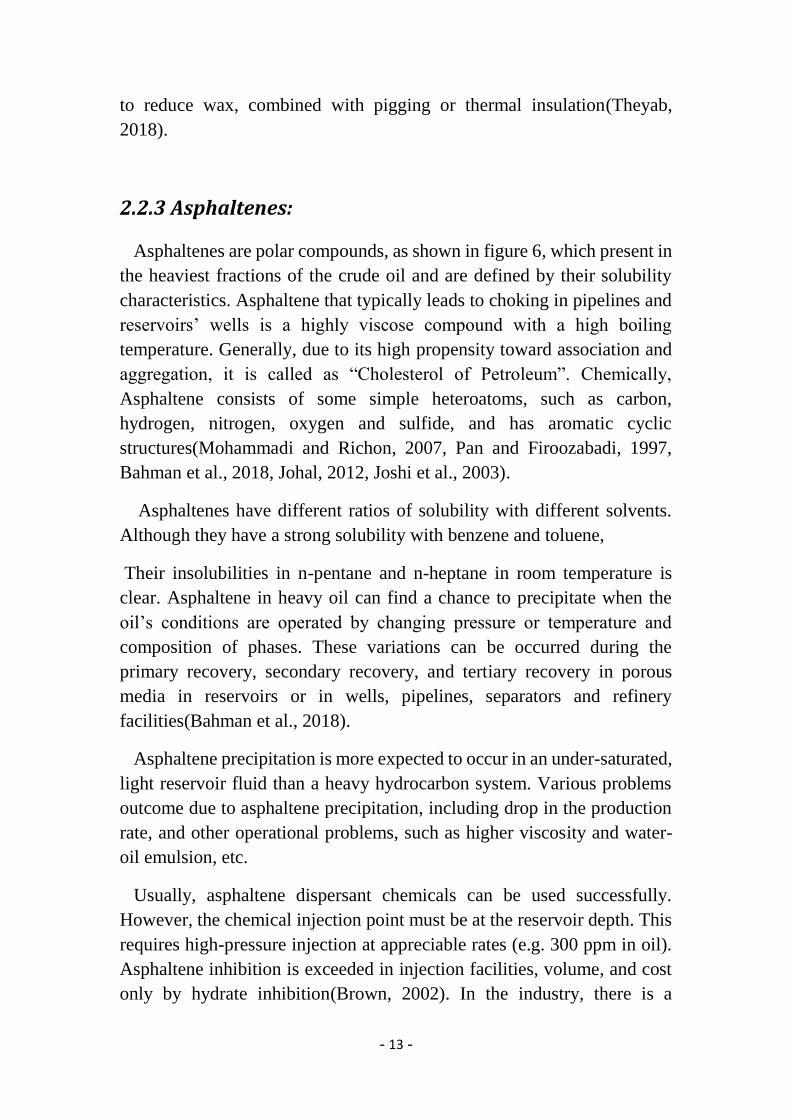
Asphaltenes are polar compounds, as shown in figure 6, which present in
the heaviest fractions of the crude oil and are defined by their solubility
characteristics. Asphaltene that typically leads to choking in pipelines and
reservoirs’ wells is a highly viscose compound with a high boiling
temperature. Generally, due to its high propensity toward association and
aggregation, it is called as “Cholesterol of Petroleum”. Chemically,
Asphaltene consists of some simple heteroatoms, such as carbon,
hydrogen, nitrogen, oxygen and sulfide, and has aromatic cyclic
structures(Mohammadi and Richon, 2007, Pan and Firoozabadi, 1997,
Bahman et al., 2018, Johal, 2012, Joshi et al., 2003).
Asphaltenes have different ratios of solubility with different solvents.
Although they have a strong solubility with benzene and toluene,
Their insolubilities in n-pentane and n-heptane in room temperature is
clear. Asphaltene in heavy oil can find a chance to precipitate when the
oil’s conditions are operated by changing pressure or temperature and
composition of phases. These variations can be occurred during the
primary recovery, secondary recovery, and tertiary recovery in porous
media in reservoirs or in wells, pipelines, separators and refinery
facilities(Bahman et al., 2018).
Asphaltene precipitation is more expected to occur in an under-saturated,
light reservoir fluid than a heavy hydrocarbon system. Various problems
outcome due to asphaltene precipitation, including drop in the production
rate, and other operational problems, such as higher viscosity and water-
oil emulsion, etc.
Usually, asphaltene dispersant chemicals can be used successfully.
However, the chemical injection point must be at the reservoir depth. This
requires high-pressure injection at appreciable rates (e.g. 300 ppm in oil).
Asphaltene inhibition is exceeded in injection facilities, volume, and cost
only by hydrate inhibition(Brown, 2002). In the industry, there is a
- 14 -
agreement that the prevention principle is the best way to solve the
problems caused by solids deposition(Johal, 2012, Joshi et al., 2003).
There is a confined area termed Asphaltene deposition enveloped (ADE)
region where provokes Asphaltenes of heavy oils to be agglomerated and
to be dropped down. So far, a large number of researchers have attempted
at identifying the ADE region for a specific crude oil by presenting an
effective manner, whereby Asphaltenes precipitation due to either gas
injection or pressure reduction can be quantitatively valued or even to be
inhibited(Bahman et al., 2018).
Figure (2.4): Polar Compounds of Asphaltenes(Theyab, 2018).
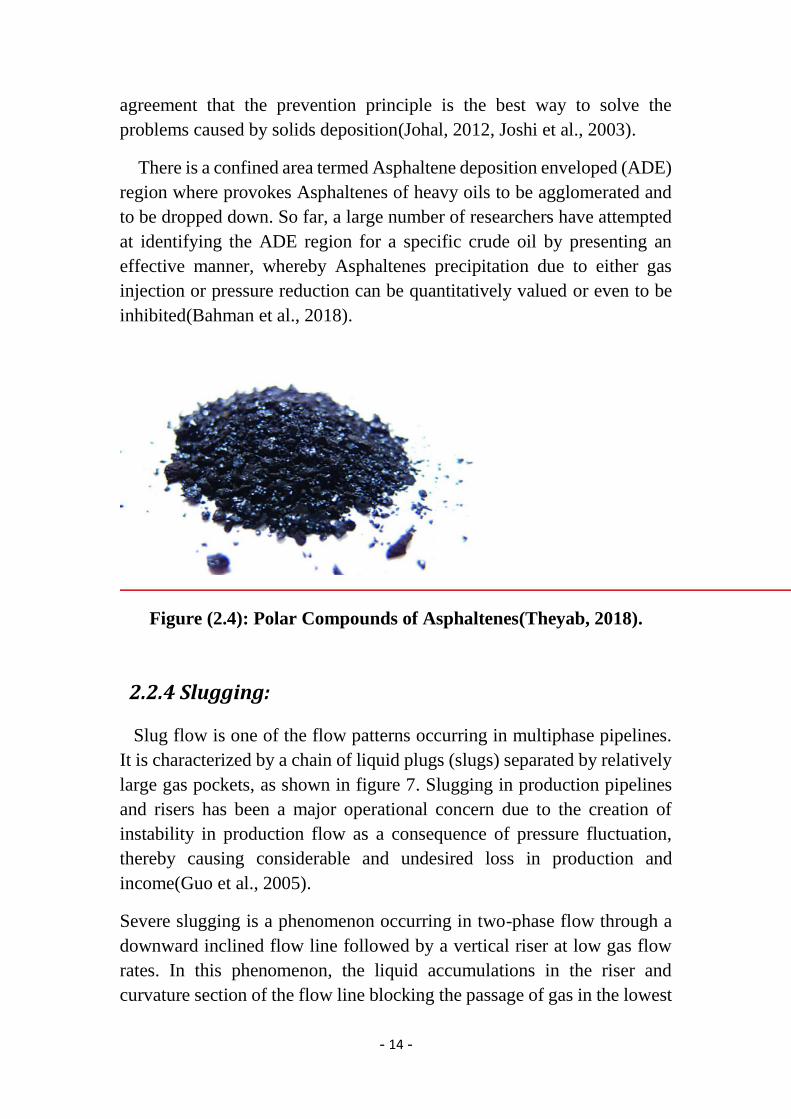
2.2.4 Slugging:
Slug flow is one of the flow patterns occurring in multiphase pipelines.
It is characterized by a chain of liquid plugs (slugs) separated by relatively
large gas pockets, as shown in figure 7. Slugging in production pipelines
and risers has been a major operational concern due to the creation of
instability in production flow as a consequence of pressure fluctuation,
thereby causing considerable and undesired loss in production and
income(Guo et al., 2005).
Severe slugging is a phenomenon occurring in two-phase flow through a
downward inclined flow line followed by a vertical riser at low gas flow
rates. In this phenomenon, the liquid accumulations in the riser and
curvature section of the flow line blocking the passage of gas in the lowest
- 15 -
point of the system. As a result, the gas front penetrates the liquid blockage
irregularly, causing tremendously large slug, severe fluctuations, and
flooding of downstream equipment(Barreto et al., 2017).
There are several procedures that can be used to prevent production
slugging, such as the riser base gas-lift system, complex detection and
control systems, use of large slug catchers, and intelligent slug mitigation
systems(Johal, 2012, Guo et al., 2005, Barreto et al., 2017, Malekzadeh,
2012).
Figure (2.5): Slug Formation in the Riser of the Hydrocarbon
Pipeline, Modified from (Johal, 2012).
2.2.5 Naphthens:
Over the previous two decades, many operators have faced the complex
deposition problem of naphthenate along with other higher organic and
inorganic scale. Such deposits can obstruct oil production in two potential
ways, formation of hard and sticky deposit, and creation of sludgy foam
contributing to forming tough emulsion. Naphthenates can cause serious
oilfield problems, such as the potential shutdown of the offshore facilities
due to naphthenate deposits, or the formation of tough micro Emulsion
contributes to a decline in oil quality and production rate(Mohamed et al.,
2016).
Naphthenates are formed from the salts of naphthenic acids when they
precipitate as acidic fractions resulting from the processing of petroleum
- 16 -
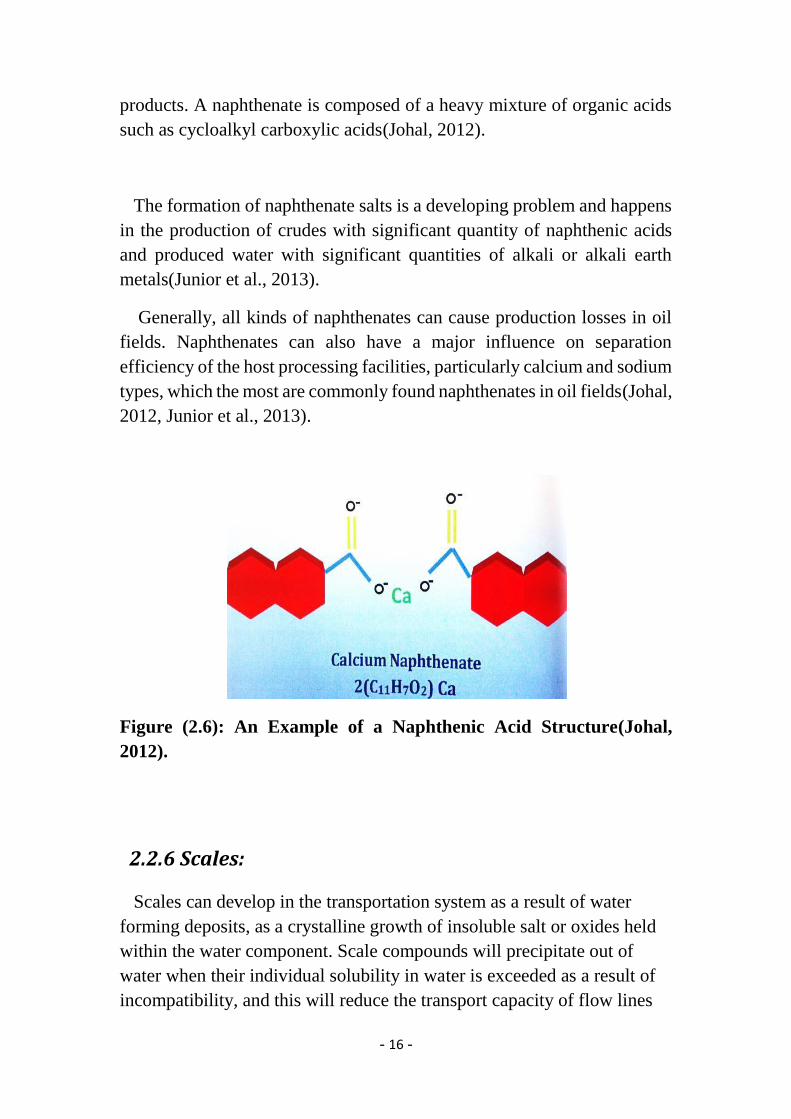
products. A naphthenate is composed of a heavy mixture of organic acids
such as cycloalkyl carboxylic acids(Johal, 2012).
The formation of naphthenate salts is a developing problem and happens
in the production of crudes with significant quantity of naphthenic acids
and produced water with significant quantities of alkali or alkali earth
metals(Junior et al., 2013).
Generally, all kinds of naphthenates can cause production losses in oil
fields. Naphthenates can also have a major influence on separation
efficiency of the host processing facilities, particularly calcium and sodium
types, which the most are commonly found naphthenates in oil fields(Johal,
2012, Junior et al., 2013).
Figure (2.6): An Example of a Naphthenic Acid Structure(Johal,
2012).
2.2.6 Scales:
Scales can develop in the transportation system as a result of water
forming deposits, as a crystalline growth of insoluble salt or oxides held
within the water component. Scale compounds will precipitate out of
water when their individual solubility in water is exceeded as a result of
incompatibility, and this will reduce the transport capacity of flow lines
- 17 -
and potentially cause plugging. The formation of scale deposits depends
on temperature, the concentration of scale forming species, pH, water
quality and hydrodynamic conditions(Abdel-Aal et al., 2015).
There are various types of scale inhibitors for preventing different kinds
of inorganic salt formation; including CaCO3 Scale inhibition mechanism
is based on the prevention of nucleation and salt crystal growth in the
Solution(Abdel-Aal et al., 2002, Khormali et al., 2017). Several existing
techniques are followed to reduce scale, such as mechanical means,
chemical dissolution and scale inhibitors(Khormali et al., 2017, Johal,
2012).
Deposition of inorganic salts such as calcium carbonate (CaCO3) can
cause formation damage and production equipment failure during the
development of a reservoir. In case of water flooding, complex
geochemical processes between the injection water, formation water and
rock happen and the concentration of ions increases.Major contribution of
scale control concentrates on understating the conditions of scale formation
and its inhibition(Khormali et al., 2016).
Inorganic salt precipitation can occur throughout the fluid flow in
reservoir and wellbore as well as the wellhead in petroleum operations. Salt
deposition could have enormously unwanted consequences such as
reduction of production rate, well productivity and the turnaround time of
electrical submersible pumps, as well as plugging the perforations,
premature failure of down-hole equipment and formation
damage(Khormali et al., 2016, Naseri et al., 2015, Yi et al., 2014). These
phenomena could result in a significant deterioration of development
process. The control of the inorganic salt formation is complicated due to
the complex reservoir fluid composition(Kelland, 2014). Calcium sulfate,
calcium carbonate, barium sulfate and magnesium carbonate are the most
common types of inorganic salts deposited in oil and gas industry.
A water system with a high concentration of salt-forming ions is
necessary for precipitation. Different circumstances and parameters affect
CaCO3 deposition throughout the oilfield operations. CaCO3 precipitation
can be determined by the loss of chemical equilibrium between ions, and
carbon dioxide (CO2) in water. The CO2 balance determines the
possibility of CaCO3 precipitation. When the pressure is below the
- 18 -
saturation pressure, gas releases from the liquid primarily in the reservoir
and on the walls of the production equipment. Therefore, multiple
interfaces are formed in phase separation. This condition is satisfactory for
the nucleation and crystal growth of CaCO3.
Salt deposits can also work as adsorbents to the heavy components of the
reservoir fluid and result in adhesion of solid particles to gas
bubbles(Abdel-Aal et al., 2015, Khormali et al., 2017).
Organic components, specifically naphthenic acids and their salts, have a
profound influence on scale formation. Aromatic compounds, unsaturated
hydrocarbons, sulfur compounds, asphaltenes, resins and paraffin are the
most public types of organic components, which affect the salt
precipitation. The effect of the inorganic components in CaCO3 scale
formation is explained by hydrophobization of the salt crystals due to
adsorption of a water-soluble organic material in porous media,
substantially naphthenic acids and their salts. Adhesion of CaCO3 particles
on the walls of down-hole tools is described solely by the hydrophobicity
of solid surfaces(Khormali et al., 2017).
Water flooding is the main method of secondary oil recovery. In this case,
complex geochemical processes of interaction between the injection water
and formation water and rock occur in the reservoir(Naseri et al., 2015).
These methods lead to formation of saturated solution with ions. Scale
formation depends on reservoir temperature, pressure, level of solution
saturation with ions in the mixture of injection and formation waters and
hydrodynamic behavior of fluid flow. These parameters control the amount
and morphology of salt crystals during water flooding. Hence, when
mixing two incompatible waters with high concentrations of bicarbonate
and calcium ions, CaCO3 crystallization and its precipitation occurs in the
near wellbore formation zones depending on the reservoir pressure and
temperature(Khormali et al., 2017).
Inhibitor injection into reservoirs is extensively used for reservoir and
equipment protection from salt deposits. This treatment offers a reliable
long-term protection against scaling(Khormali et al., 2017). The efficiency
of scale prevention relay on the processes which affect the formation of
inorganic salts in the saturated solution.
- 19 -
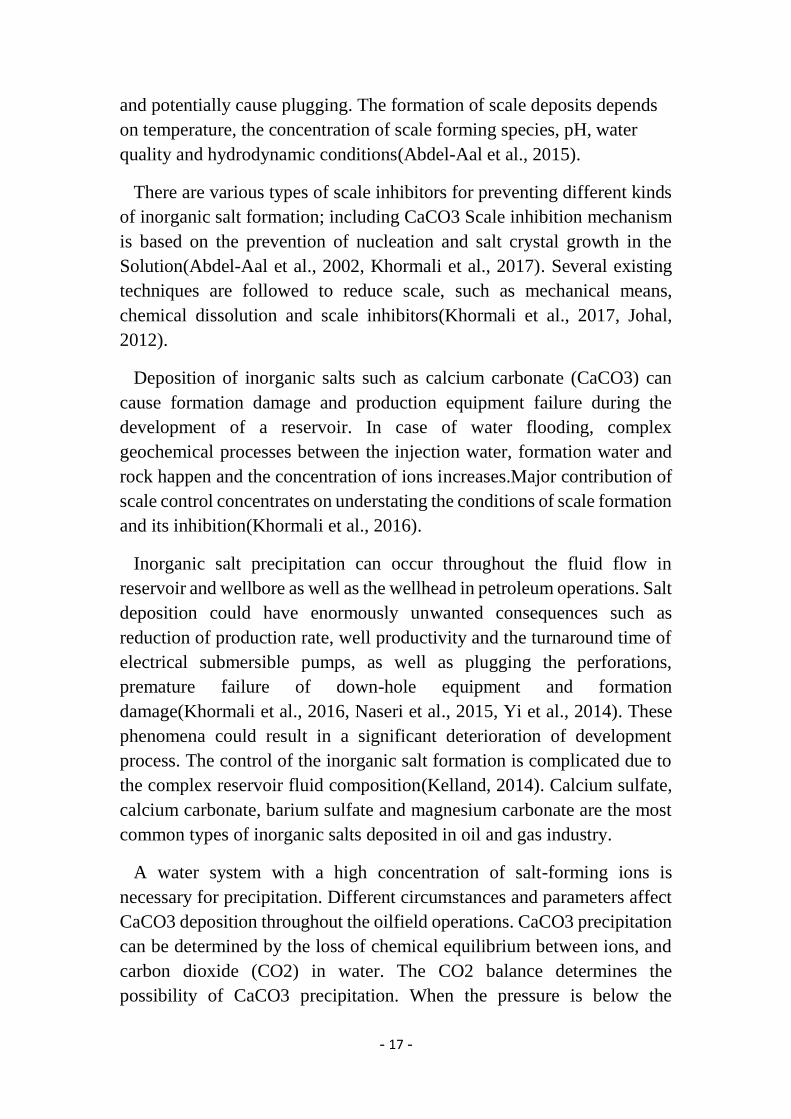
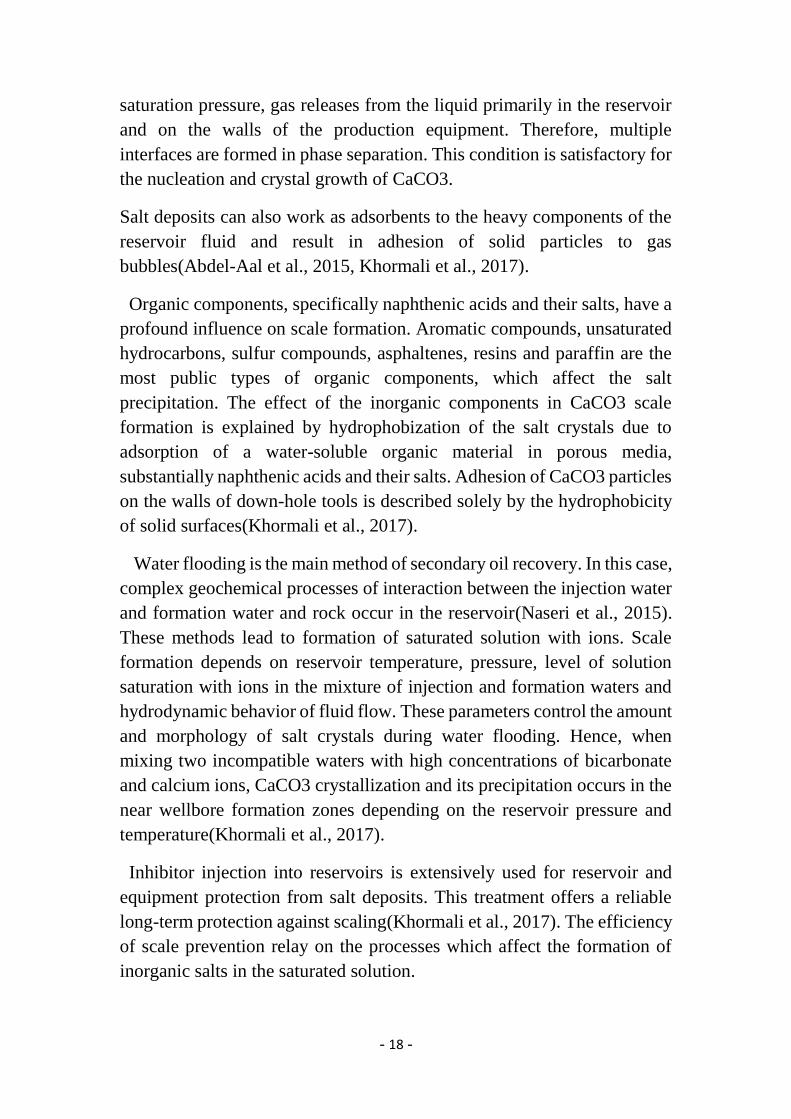
Figure (2.7): Formation of Scale in the Pipe(Theyab, 2018).
In current years the number of corrosion failures in onshore and offshore
pipelines has steadily decreased due to the introduction of corrosion
management strategies by pipeline operators. A vital component in
effective corrosion management is an accurate determination of corrosion
growth rates.
Pipeline corrosion is one of the main causes of subsea pipeline failure. It
is necessary to monitor and analyses pipeline condition to effectively
predict likely failure. Subsea pipeline corrosion weakens the resistance of
pipelines to internal and external forces, and it becomes the leading factor
that causes the integrity loss of the pipelines.
When carbon steel pipes are used in transporting oil and multiphase flow
containing a fraction of water, there is usually a high risk of corrosion. The
decision to use carbon steel is usually economic in order to reduce capital
expenditure and its use usually requires the application of a full internal
corrosion management strategy to control corrosion levels throughout the
system life.
Various mechanisms have been assumed for the corrosion process; all of
these involve the formation of a carbonic acid ion or bicarbonate when
CO2 is dissolved in water. This process can lead to corrosion, see figure
10, of the material at a rate that is larger than that from general acid
corrosion with the same pH value.
- 20 -
The mechanism of corrosion is reliant on the quantity of the CO2
dissolved in the water phase, and predictions of corrosion levels are
currently based on the knowledge of CO2 partial pressure and the use of
correlations such as De Waard Milliams(Johal, 2012, Yang et al., 2017).
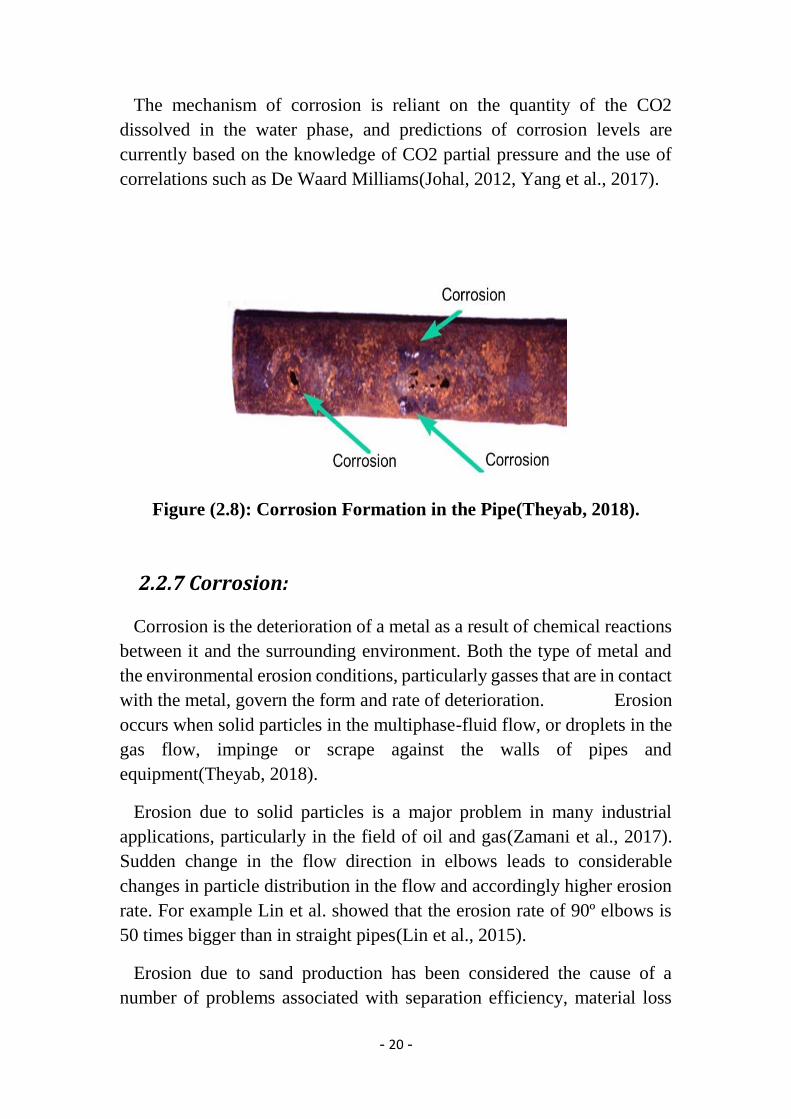
Figure (2.8): Corrosion Formation in the Pipe(Theyab, 2018).
2.2.7 Corrosion:
Corrosion is the deterioration of a metal as a result of chemical reactions
between it and the surrounding environment. Both the type of metal and
the environmental erosion conditions, particularly gasses that are in contact
with the metal, govern the form and rate of deterioration. Erosion
occurs when solid particles in the multiphase-fluid flow, or droplets in the
gas flow, impinge or scrape against the walls of pipes and
equipment(Theyab, 2018).
Erosion due to solid particles is a major problem in many industrial
applications, particularly in the field of oil and gas(Zamani et al., 2017).
Sudden change in the flow direction in elbows leads to considerable
changes in particle distribution in the flow and accordingly higher erosion
rate. For example Lin et al. showed that the erosion rate of 90º elbows is
50 times bigger than in straight pipes(Lin et al., 2015).
Erosion due to sand production has been considered the cause of a
number of problems associated with separation efficiency, material loss
- 21 -
and flow path blockages. Sand screens are mostly installed in the horizontal
sections of production well bores in order to reduce sand production. The
erosion predictive methods should include the mechanisms of kinetic
energy imparted by the sand particle velocity and size, and the angle of the
impact on the material should also be included in the erosion prediction
calculations in order to estimate an accurate erosion rate(Johal, 2012, Lin
et al., 2015, Zamani et al., 2017)
There are some proposals to reduce erosion on the pipes and equipment,
for example, the number of bends and twists should be limited. Moreover,
the bends and twists should also be as gradual as possible. Since
impingements happen when the flow domain changes, making a straighter
pipe will limit this variance in flow. For areas that are disposed to erosion,
for instance, engineers can change the material of the pipe or guarantee a
liquid film along the pipe. Since the rate of erosion is dependent on the
material properties of the pipe, stronger, harder pipes will practice less
erosion. The liquid film, however, acts as a shield slowing down the
particle impingement(Theyab, 2018).
2.2.8 Emulsions:
With a combination of low ambient sea temperature and high fluid
viscosity due to inversion water cut conditions, tight emulsions can occur
between the water and oil phases. This can weaken the separation
efficiency at the processing facility, and thus cause a loss in the production
of the asset. In system shutdown conditions, the rheology of the fluids may
change from Newtonian to non-Newtonian, exhibiting characteristics of
high yield stress during low shear rate production start-up operations. In
these conditions there may be a need to inject de-emulsifiers into the subsea
facilities and also to ensure that enough pressure is available to re-start the
system following an unintended shutdown(Johal, 2012, Zhang et al., 2017).
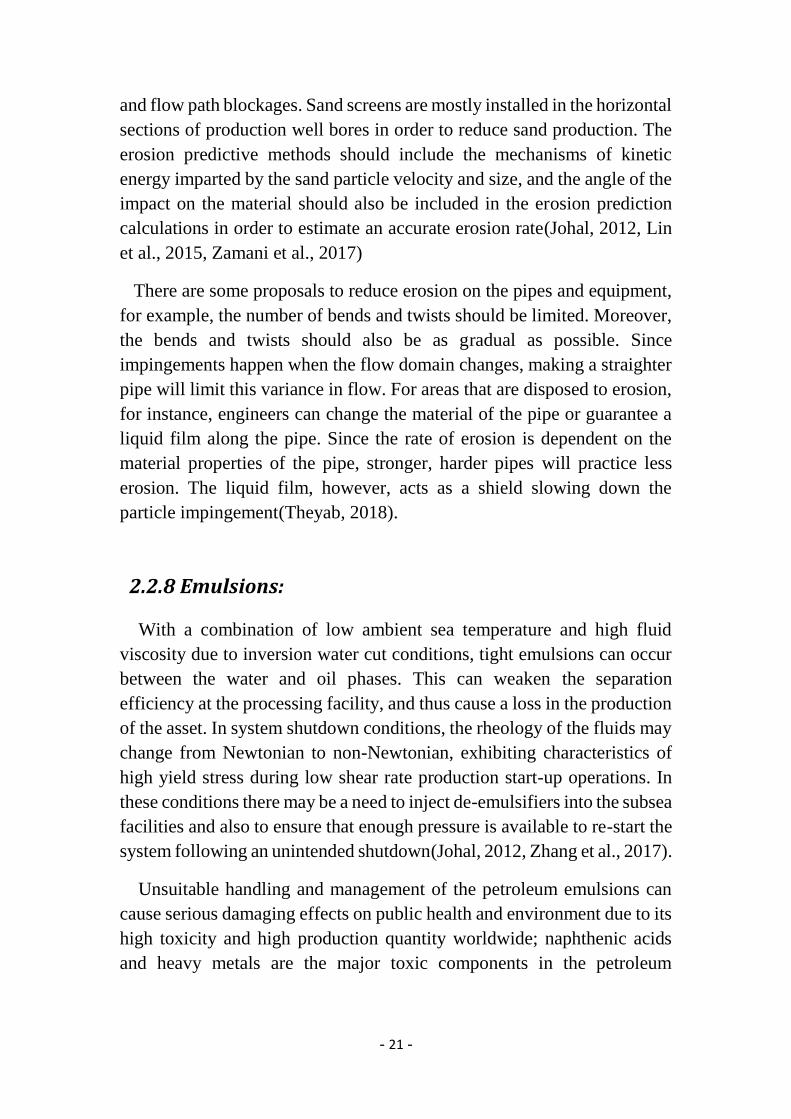
Unsuitable handling and management of the petroleum emulsions can
cause serious damaging effects on public health and environment due to its
high toxicity and high production quantity worldwide; naphthenic acids
and heavy metals are the major toxic components in the petroleum
- 22 -
emulsions, which are highly deadly for micro-organisms, aquatic algae and
aquatic organisms(Zhang et al., 2017).
Figure (2.9): Photomicrograph of a Water-in-Oil
Emulsion(PetroWiki, 1 July 2015).
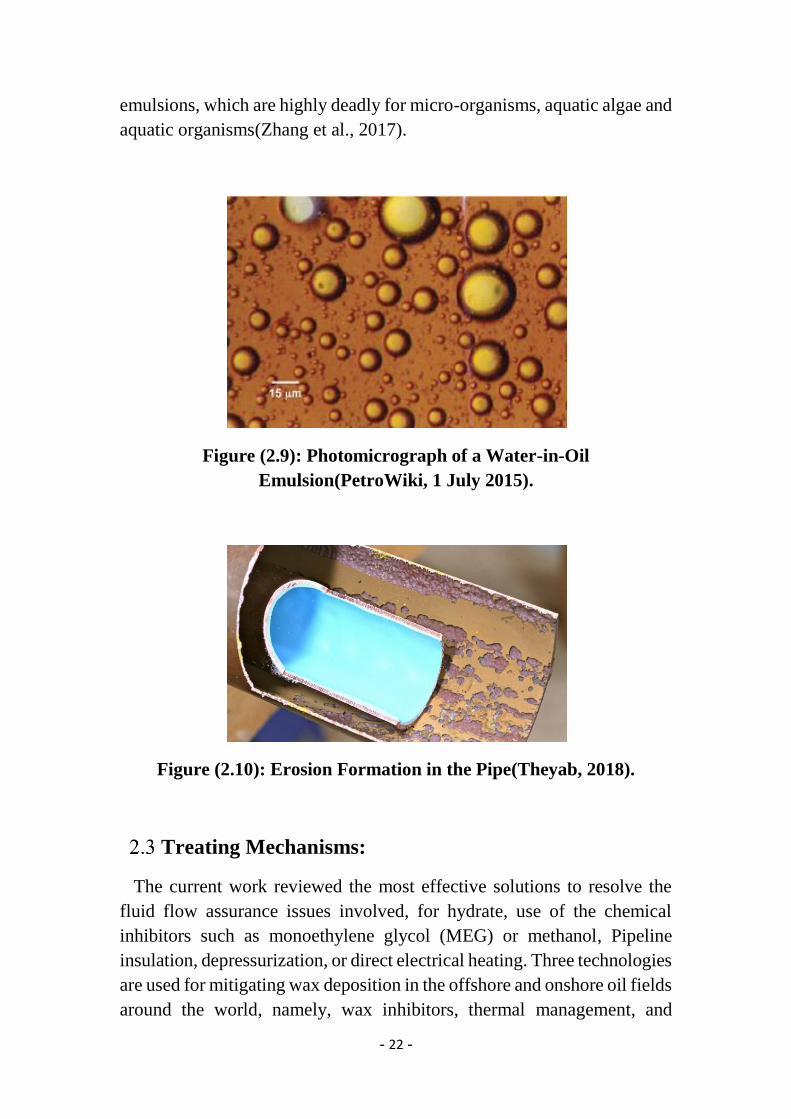
Figure (2.10): Erosion Formation in the Pipe(Theyab, 2018).
Treating Mechanisms:
The current work reviewed the most effective solutions to resolve the
fluid flow assurance issues involved, for hydrate, use of the chemical
inhibitors such as monoethylene glycol (MEG) or methanol, Pipeline
insulation, depressurization, or direct electrical heating. Three technologies
are used for mitigating wax deposition in the offshore and onshore oil fields
around the world, namely, wax inhibitors, thermal management, and
- 23 -
pigging. Usually, asphaltene dispersant chemicals can be used
successfully. However, the chemical injection point must be at the
reservoir depth. There are several techniques that can be used to mitigate
production slugging, such as the riser base gas-lift system, complex
detection and control systems, use of large slug catchers, and intelligent
slug mitigation systems. Inject de-emulsifiers to reduce emulsion and using
anti-corrosive and anti-scale chemical into the subsea facilities to ensure
the production.
2.3.1 Thermal Treatment:
The Cold Flow procedure claimed that, if solid slurry is formed in the
first segment of the pipe, it will be transported in a stable way without
further solid deposition. At the exit of the process, the oil is at the same
temperature as the external water and all potential waxes have been
precipitated. The idea of Cold Flow is based on the pioneering work of
(Coberly, 1942)
He showed that the presence of foreign elements decreased the tendency
of wax crystals to deposit. They acted as nucleation sites which made wax
solids precipitate in the bulk, limiting the quantity of solids that truly
adsorbed to the wall surface. (Merino-Garcia and Correra, 2008)claimed
that in order to validate the feasibility of Cold Flow, temperature gradient
between hot oil and cold wall should be eliminated. Also, all waxes have
precipitated and are transported as a solid dispersion.
During 1920-1930, most of the developments were in thermal methods
for the solution to paraffin problems. These treatment methods typically
consisted of minimizing radiation heat losses and addition of external
heat to the system. Insulation of flow lines and maintaining a higher
pressure in the flow lines that minimized cooling through dissolved gas
expansion were two examples of minimizing radiation losses. Methods
such as steaming the flow lines, installing bottom-hole heaters and
circulation of hot oil and hot water are examples of the application of heat
in an effort to melt or increase the solubility of the deposit. However, both
mechanical and thermal methods did not change the primary oil
wettability of the surfaces of pipelines and, therefore, could not prevent
- 24 -
additional deposition of waxes. As a result, the frequencies of such
measures generally required to be high(Gupta and Anirbid, 2015).
The use of unconventional energy in the upstream and midstream
industry is now possible. A Dynamic Simulator has been developed to
evaluate the pressure drop and temperature profile of a solar heated
pipeline which can compare it with a bare pipeline under average sunshine
conditions. This technology is an innovative and economically attractive
alternative to the conventional electric or steam heat tracing of pipelines or
utilization of Drag Reducing Agents (DRA’s) or pour point depressants.
Depending upon process requirements, this technology is specifically
suitable for tropical and mid-latitudes. This technology is also suitable for
vessels. (Lasich and Kaila, 2001)
2.3.2Mechanical Treatment:
The mechanical approaches used scrappers, cutters, pigs etc. and were
relatively economical but not entirely efficient. Running a scrapper that
mechanically cuts the deposit from the tubing was used widely and pigging
of pipelines was also frequently used.
The problems associated with these methods were the chances of
perforation plugging and an increase in oil-in-water emulsion stability.
One of the most frequently used remedial methods in the fields is
pigging. In pigging, a pig (a solid object with the diameter smaller than the
inner diameter of the pipe) passes through the pipeline to scrape off the
wax deposit.
However, the pigging method cannot efficiently be utilized without a
proper wax deposition prediction. For example, pigs at times get stuck
inside the pipeline in the presence of dense hard deposits making the
situation worse, which occurred in a Gulf of Mexico pipeline. In the worst
cases, production must be stopped in order to replace the plugged portion
of the line, which is estimated to cost approximately $40,000,000 per
incident (Huang et al., 2016)
- 25 -
2.3.3 Chemical Treatment:
The chemical strategy and choosing the optimum injection points are the
best way to avoid deposit build up and to avoid any future criticalities; and
allow re-establishing the anticipated production flow rate.
Till 1966 it was understood that the rate of deposition due to the
precipitation of wax could be controlled with addition of additives (Shock
et al., 1955, Jorda, 1966)Tests of various plastic coatings showed that most
smooth, non-paraffinic plastics were capable of reducing paraffin
deposition in oil wells, but flexible, highly polar, non-paraffinic plastics
were more suitable for providing long term resistance to paraffin
deposition in oil wells if the flow stream contained abrasive materials.
Paraffin deposition was studied in the laboratory under simulated
conditions in well tubing and it was proposed that paraffin deposits were
introduced by the precipitation of paraffin directly on or adjacent to the
pipe wall and grown by diffusion of paraffin from solution to the deposit
(Hunt Jr, 1962)
During 1950-1970 developments in laboratory scale technology were
carried out to identify and categorize wax as well as simulating the
conditions of paraffin deposition in the laboratory. Prediction of wax
deposition behavior in tubing /trunk line was also simulated in order to
understand the wax formation mechanism.
The chemical control methods may be classified as:
i) Those in which a solvent is used to dissolve the deposit once it has
formed.
ii) Those which inhibit wax crystal growth or inhibit its adherence to the
surface wells.
(Rose and Marsden Jr, 1970)made an effort to study the nature of low
temperature flow of Prudhoe Bay crude oil through pipeline (a long tubular
conduit or series of pipes, often underground, with pumps and valves for
flow control, used to transport crude oil, natural gas, water, etc.) and its
emulsions with synthetic brine. They found a significant lowering of
apparent viscosity and pressure drop through the flow resistance due to the
use of oil-water emulsions.
- 26 -
(Van Engelen et al., 1981) experiential that properties such as pour point,
plastic viscosity and yield value measurements are quick and helpful
methods for the initial screening of fluidity improvers.
Paraffin deposition can be prevented or greatly retarded by using
chemical surfactants called "dispersants”(McClaflin and Whitfill, 1984).
The choice of using batch or continuous treatment is ruled by the type and
number of wells demanding treatment.
(Woo et al., 1984)discussed the use of a blend of crystal modifiers in a
controlled-release matrix form and a commercially available ethylene-
vinyl acetate copolymer solid. Among the chemicals used, crystal
modifiers and paraffin/wax dispersants are quite common. The paraffin
crystal modifiers change the crystallization behavior of waxes. The
efficiency of the crystal modifier depends, to a large extent, on the type of
aggregate- forming waxes that are present in the oil. Thus, the choice of a
crystal modifier is a key to accomplishment for the treatment. They
perform well in water free or low-water content crude oil. These polymers
co-crystallize with paraffin crystals and thus paraffin crystals are kept in a
dispersed position in the crude oil. In this way,
The formation of a three dimensional network takes place at lower
temperatures which results in a considerable reduction in the viscosity and
pour point of the crude oil (Dobbs, 1999)
(Roenningsen et al., 1991)discussed three different techniques for
determination of Wax Precipitation Temperature (WPT), namely
Polarization Microscopy, Differential Scanning Calorimetry (DSC) and
Viscometry. The results gained by these methods were compared and it
emerged that Microscopy invariably gave the highest WPTs and probably
the most relevant values for predicting the onset of wax deposition on cold
surfaces.
Thermodynamic paraffin model and the complementary laboratory test
methods were described by (Erickson et al., 1993).The method consisting
of a periodical application of detergent designed to remove the deposit and
simultaneously destroy the water-in-oil emulsion were suggested by
(Bernadiner, 1993). (Chanda et al., 1998) used Poly Behenyl Acrylate
(PBA) with a range of molecular weights and their efficacy as Flow
Improver (FI)/Pour Point Depressant (PPD) were evaluated.
- 27 -
During the period of 1991-2000, laboratory progresses along with
modern chemical developments were remarked. It was established that
selection of chemical combinations was well specific and based upon
individual experience. Also many new solvents and additives were exposed
which case specific were(Gupta and Anirbid, 2015).
2.3.4 Additional Treatment Methods:
Since conventional methods like thermal application and chemical
injection are turning out to be expensive, an alternative approach has now
been developed. These method use application of magnetic, electric and
piezoelectric effect on crude oil to improve its rheological properties.
(Chow et al., 2000)made a successful use of Magnetic Fluid Conditioning
(MFC) technology to reduce the viscosity of crude oil. Their results
identified state of wax saturation as an important factor for undergoing
magnetic treatment. (Tung et al., 2001)found that the effects of magnetic
treatment were strongly depending on temperature, magnetic intensity and
time of exposition.
(Tao and Xu, 2006) studied the application of electric field pulse and
discovered significant decrease in viscosity of paraffin-base crude oil.
Although the viscosity reduction is not permanent, it would last several
hours.
(Ajienka, 2011) developed a tool that could control wax deposition using
of piezoelectric effect. The mechanism of semiprecious metals (Zinc,
Cobalt and Lead) quartz and were studied and found to be successful in
decreasing / eliminating wax deposit in the production system through the
generation of piezoelectric reaction.
(Karan et al., 2000) used a new High-Pressure Microscope (HPM) which
was developed for visual detection of organic solids precipitation during
isobaric cooling, isothermal de-pressurization and isothermal-isobaric
titration tests. The microscope was rated to 138 MPa (20,000 psi) and
200°C.
- 28 -
CHAPTER 3
METHODOLOGY
The main target of this project is to improve waxy crude flow
characteristics to run the well at the optimum production rate, in order to
accomplish this target a certain process was selected based on analyzing
waxy crude properties.
The process depends on heat treatment of oil by heating it to a certain
temperature using a down-hole heater.
Lab work performed on a sample from BARA field.
In order to accomplish our target, an oil crude sample brought from
Bara field and analyzed in Central Petroleum Laboratory (CPL) to
determine wax content, wax apparent temperature (WAT) and
carbon content using gas chromatography.
Resulting data was processed by Multi-flash calculation program, in
order to gain data file process-able by Olga software to design a well
model for testing different operating conditions and to evaluate the
wax parameters each time, then the single well model will be as a
part of a field network to evaluate how the surface facility will be
affected.
This model will be tested for inline heating as a possible solution for
the wax deposition problem.
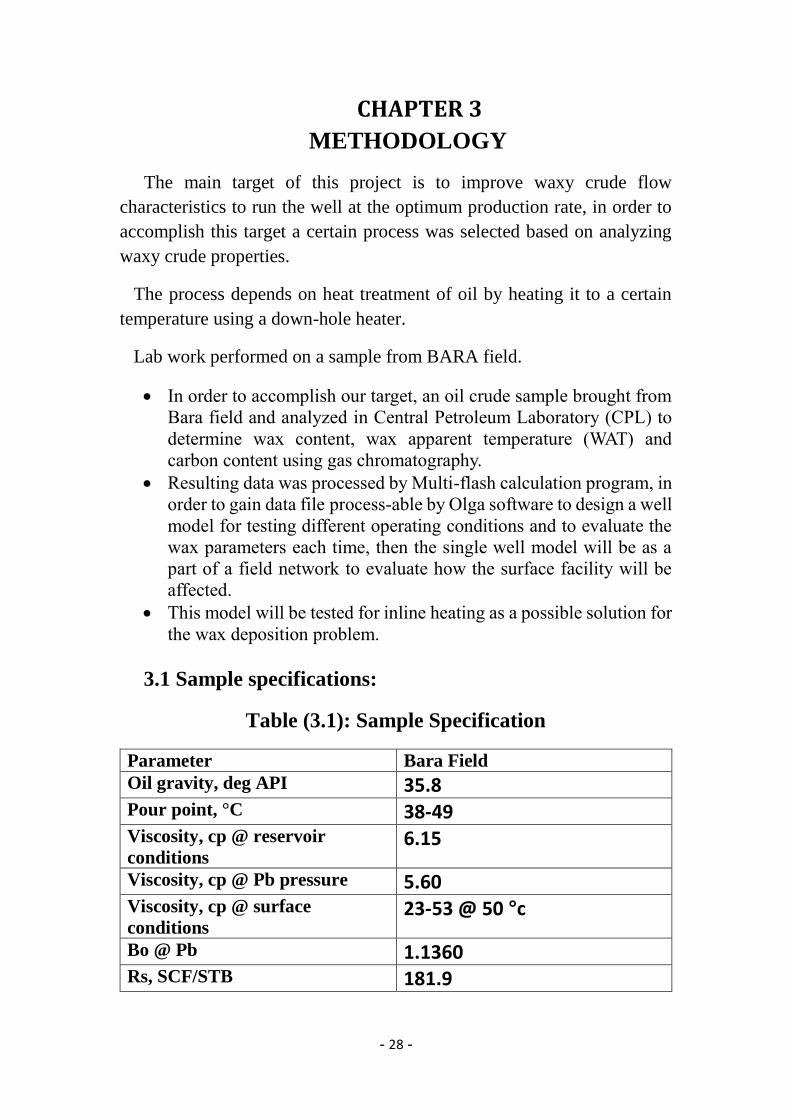
3.1 Sample specifications:
Table (3.1): Sample Specification
Parameter Bara Field
Oil gravity, deg API 35.8 Pour point, °C 38-49 Viscosity, cp @ reservoir
conditions 6.15
Viscosity, cp @ Pb pressure 5.60 Viscosity, cp @ surface
conditions 23-53 @ 50 °c
Bo @ Pb 1.1360 Rs, SCF/STB 181.9

- 29 -
3.2 Lab work:
All laboratory tests conducted in CPL and resulted in PVT data file.
Laboratory test devices:
3.2.1Gas chromatography:
Figure (3.1): Gas chromatography device.
AIM:
To analyze the sample of unknown concentrations using Gas
Chromatography.
- 30 -
APPARATUS:
1. Gas Chromatograph.
2. GC analyzer.
3. Normal syringes.
4. One micro syringe, Beakers, Sample bottles and Electronic weight.
CHEMICALS:
1. Methanol.
2. Isopropyl Alcohol.
3. Water.
THEORY:
A Gas Chromatograph is used to detect the components based on the
selective affinity of components towards the adsorbent materials. The
sample is introduced in the liquid/gas form with the help of GC syringe
into the injection port, it gets vaporized at injection port then passes
through column with the help of continuously flowing carrier stream
(mobile phase), mainly H2 (for TCD), and gets separated/detected at the
detection port with suitable temperature programming. We visualize this
on computer in the form of peaks. Different chemical constituents of the
sample travel through the column at different rates depending upon:
1. Physical properties
2. Chemical properties, and
3. Interaction with a specific column filling (stationary phase).
As the chemicals exit the end of the column, they are detected and
identified electronically. The function of the stationary phase in the column
is to separate different components, causing each one to exit the column at
a different time (retention time). Other parameters that can be used to alter
- 31 -
the order or time of retention are the carrier gas flow rate, and the
temperature.
Physical Components involve inlet port, Adsorption column, detector port,
flow controller (to control the flow of carrier gas), etc.
PROCEDURE:
The samples were prepared for calibration with various compositions.
The amount of Isopropyl alcohol was kept equal to 2 grams in each sample.
Started the apparatus by switching on the hydrogen supply and set the
parameters:
Oven temperature = 170 °C
TCD temperature = 150 °C
Injector temperature = 200 °C
Carrier Gas Pressure = 4 kg/cm2. START THE ISOTHERM.
Before injection of sample, waited till the base line of recorder became
perfectly horizontal; which indicated that GC is stabilized or conditioned
properly.
The sample was injected with a micro syringe at the injector port and
started the run.
After all the peaks attained, the run stopped and the integration results
were obtained. The retention time and area of peak of each of the
constituents for each sample were noted.
The calibration curves were plotted and the response factor (slope of the
calibration curve) was found out for each of the constituents with respect
to IPA. The curves were used for analysis of unknown samples.
- 32 -
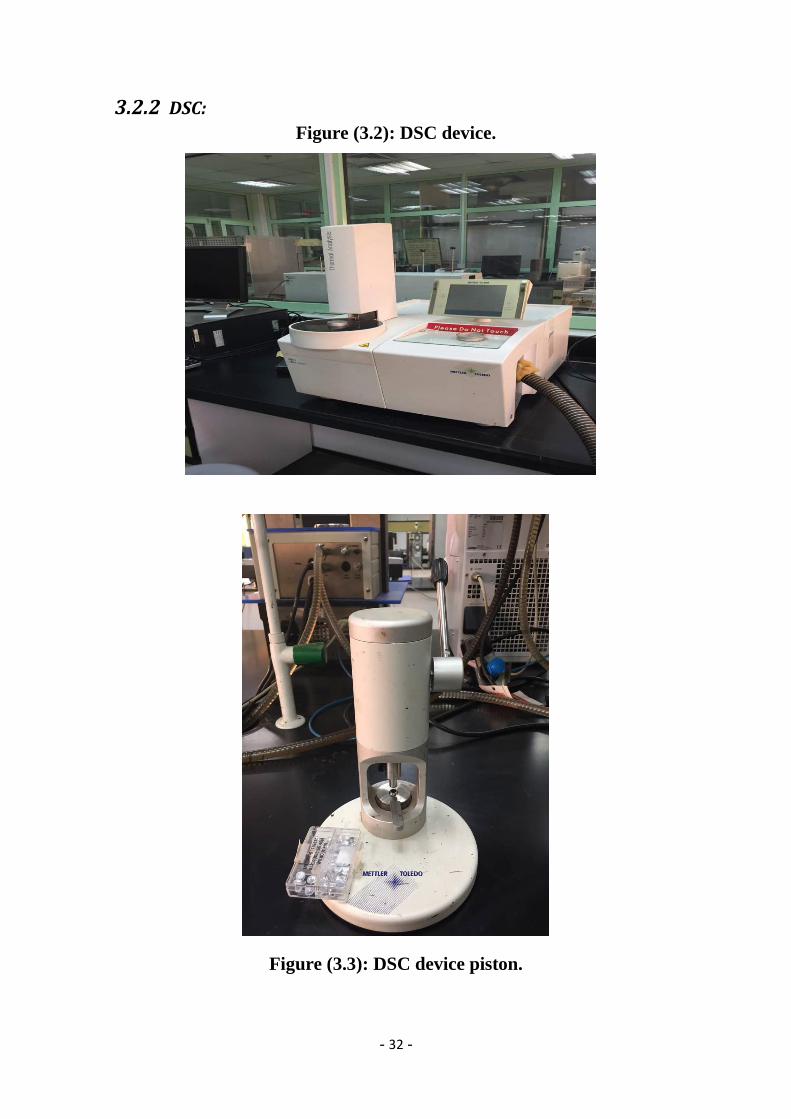
3.2.2 DSC:
Figure (3.2): DSC device.
Figure (3.3): DSC device piston.
- 33 -
Aim:
The DSC measures heat flow associated with thermal transitions of a
material such as glass transition, melting point, and crystallization
temperature.
Sample Preparation Procedure:
1. The sample was thoroughly dried in the solid state to avoid damaging
the equipment. The sample being tested was weighted (2-10 mg) in a Tzero
hermetic aluminum pan. The sample was directly placed in the pans,
transferring the sample from the weigh paper to the pan can lead to a loss
in material.
2. The lid was placed on the pan with the indention facing down.
3. The covered pan was putted in the blue holder. Assuring that the lid was
flushed with the top of the holder.
4. The holder was placed under the press. Again assuring that the lid is
flushed with the top of the holder.
5. The handle was pulled down; this sealed the pan and lid.
6. Repeated with an empty pan to be used as a reference.
Note that both the pans and the press are located in room 2182 next to the
weighing scale.
Procedure:
1. The sealed pan was placed in the sample tray. Slot number was noted.
2. The reference pan was placed in a reference slot. Slot number was noted.
3. The reference pan was an empty sealed pan.
4. Reference pan was kept so that multiple runs can be performed with it.
5. The power was turned on to the cooler. It was one eleven mode.
6. The software, TA Universal Analysis was opened on the desktop of the
computer.
7. In the Control tab, we scrolled down to event and pressed ‘On’. This
started the cooler. It may be necessary to press ‘Go to standby temp’ so
- 34 -
that the cell does not freeze. The temperature of the cell was shown in the
status bar.
8. The nitrogen gas tank was turned on, which was held at 20 psi, and the
sample purge flow was 50 ml min-1. If the sample purge flow (located in
the signal Value box in the upper right corner) shows no flow, it may be
necessary to open the smallest black knob on the gas tank.
9. On the program in the center panel we entered the data for the sample
that we were running. We filled out all the information including: sample
name, sample weight, sample slot number, reference slot number, and data
storage location. We also selected an operating procedure.
10. On the second tab, Procedure, the parameters for the operating
procedure were entered. Here we altered the method previously chosen in
the first tab. We also loaded a standard procedure that we have saved.
- We Clicked on Test to adjust the procedure type.
- Clicked on Editor to set the temperatures, ramp rates, holding times,
cycle names, etc. Note that the operating range of the equipment is -80 °C
to 400 °C.
- Clicked Ok to accept the parameters.
- At this time we saved a procedure to be used in further experiments
11. On the far right panel, Experiment, we added runs. We did this by
selecting the button. After a run has been added the appropriate data
information was added. Runs can also be deleted. The order of the runs can
also be adjusted on the panel by clicking and dragging the run to the
appropriate location.
12. Once all of the sample information has been entered and the runs are in
the appropriate order we began the program. There was an arrow next to
the run which began first. We clicked at the top of the window to start.
Note once you begin an experiment you cannot change the program.
13. When the program ended, the cooling system was automatically turned
off. However, the nitrogen tank needed to be turned off after the test.
3.3 Data Analysis:
1. The results were tabled in excel sheets.
2. Graphs were drawn.
3. Resultant PVT data processed by OLGA software.
- 35 -
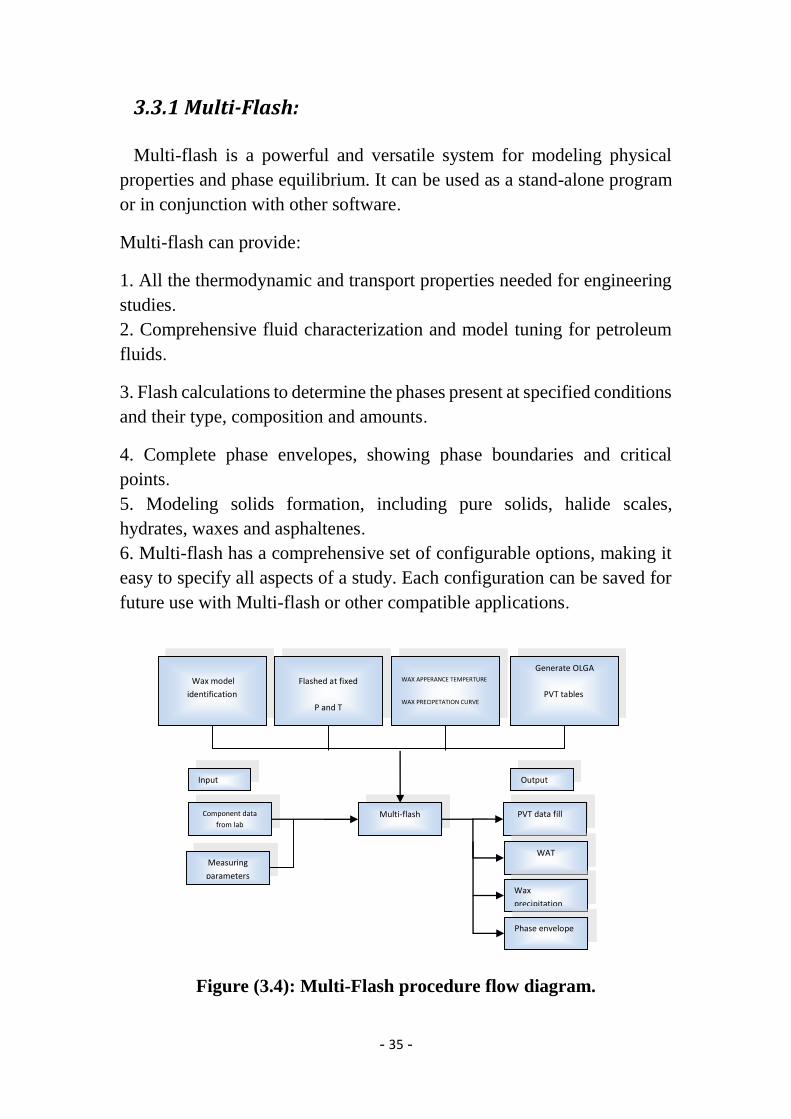
3.3.1 Multi-Flash:
Multi-flash is a powerful and versatile system for modeling physical
properties and phase equilibrium. It can be used as a stand-alone program
or in conjunction with other software.
Multi-flash can provide:
1. All the thermodynamic and transport properties needed for engineering
studies.
2. Comprehensive fluid characterization and model tuning for petroleum
fluids.
3. Flash calculations to determine the phases present at specified conditions
and their type, composition and amounts.
4. Complete phase envelopes, showing phase boundaries and critical
points.
5. Modeling solids formation, including pure solids, halide scales,
hydrates, waxes and asphaltenes.
6. Multi-flash has a comprehensive set of configurable options, making it
easy to specify all aspects of a study. Each configuration can be saved for
future use with Multi-flash or other compatible applications.
Figure (3.4): Multi-Flash procedure flow diagram.
Input
Multi-flash
Output
Component data
from lab
PVT data fill
WAT
Wax
precipitation
Wax model
identification
Flashed at fixed
P and T
WAX APPERANCE TEMPERTURE
WAX PRECIPETATION CURVE
Measuring
parameters
Generate OLGA
PVT tables
Phase envelope

- 36 -
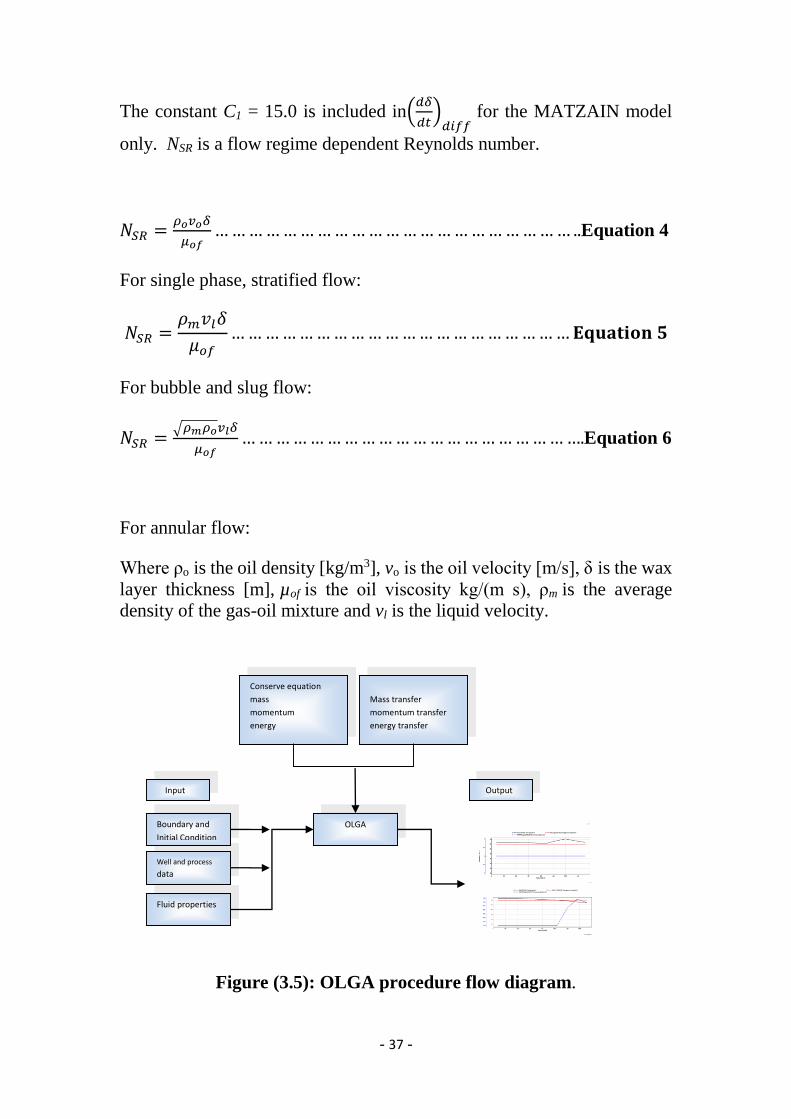
3.3.2 Olga software:
Wax deposition can occur in two ways, either by diffusion of dissolved
wax due to a temperature difference between fluid and wall, or by transfer
of precipitated wax due to shear.
The wax deposition rate due to molecular diffusion may be described by:
𝐺 = 𝐷𝜌oil (𝑚𝑓𝑟wax,bulk−𝑚𝑓𝑟wax,wall)
𝐿 ……………………………...Equation 1
Where G [kg/ (cm2s)] is the mass transfer rate of wax deposited and D
[cm2/s] is the molecular diffusion coefficient.
The deposition rate constant K* (=COEFSHEAR) determines the volume
rate of precipitated wax deposited due to shear by the following formula:
𝑣𝑜𝑙shear wax =𝐾∗ 𝐶wall 𝛾𝐴
𝜌wax [
𝑚3
𝑠]………………………..Equation 2
Where C wall is the volume fraction of precipitated wax in the oil at the
inner wall temperature, γ is the shear rate at the wall [1/s], A is the surface
area available for deposition [m2] and ρ wax is the average density of the
wax [kg/m3].
The equation for the rate of change in wax layer thickness is as follows:
𝑑𝜎
𝑑𝑡=
1
1+𝐶2𝑁𝑆𝑅𝐶3
(𝑑𝛿
𝑑𝑡)
𝑑𝑖𝑓𝑓… … … … … … … … … … … … … … … … . ..Equation 3
Where C2 and C3 are constants. Values: C2 = 0.055 and C3 = 1.4. (𝑑𝛿
𝑑𝑡)
𝑑𝑖𝑓𝑓is
the change rate due to diffusion, and porosity effects.
- 37 -
The constant C1 = 15.0 is included in(𝑑𝛿
𝑑𝑡)
𝑑𝑖𝑓𝑓 for the MATZAIN model
only. NSR is a flow regime dependent Reynolds number.
𝑁𝑆𝑅 =𝜌𝑜𝑣𝑜𝛿
𝜇𝑜𝑓… … … … … … … … … … … … … … … … … … … … … ..Equation 4
For single phase, stratified flow:
𝑁𝑆𝑅 =𝜌𝑚𝑣𝑙𝛿
𝜇𝑜𝑓… … … … … … … … … … … … … … … … … … … … 𝐄𝐪𝐮𝐚𝐭𝐢𝐨𝐧 𝟓
For bubble and slug flow:
𝑁𝑆𝑅 =√𝜌𝑚𝜌𝑜𝑣𝑙𝛿
𝜇𝑜𝑓… … … … … … … … … … … … … … … … … … … ….Equation 6
For annular flow:
Where ρo is the oil density [kg/m3], vo is the oil velocity [m/s], δ is the wax
layer thickness [m], µof is the oil viscosity kg/(m s), ρm is the average
density of the gas-oil mixture and vl is the liquid velocity.
Figure (3.5): OLGA procedure flow diagram.
Input
Conserve equation
mass
momentum
energy
Well and process
data
Fluid properties
OLGA
Output
Mass transfer
momentum transfer
energy transfer
Boundary and
Initial Condition
- 38 -
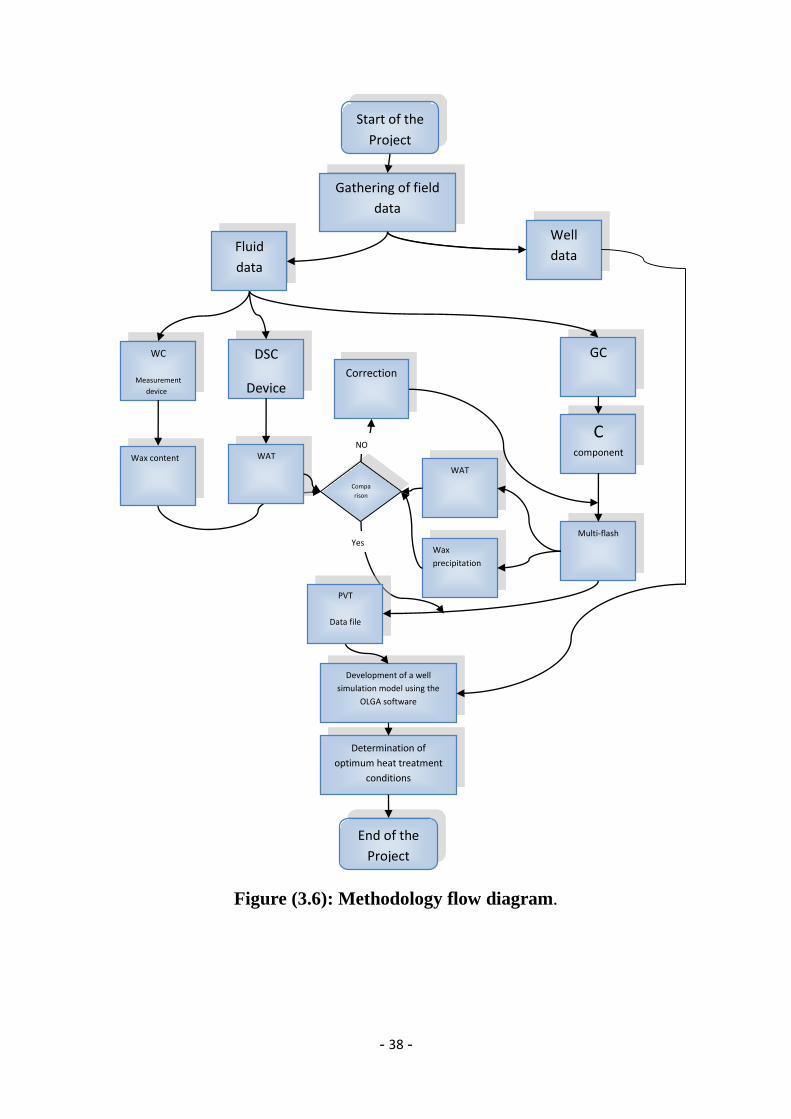
Figure (3.6): Methodology flow diagram.
Gathering of field
data
Development of a well
simulation model using the
OLGA software
DSC
Device
WAT
WC
Measurement
device
GC
C component
Multi-flash
Wax content
Determination of
optimum heat treatment
conditions
End of the
Project
Start of the
Project
WAT
Wax
precipitation
Compa
rison
Correction
Fluid
data
Well
data
PVT
Data file
Yes
NO
- 39 -
CHAPTER 4
RESULTS AND DISCUSSION
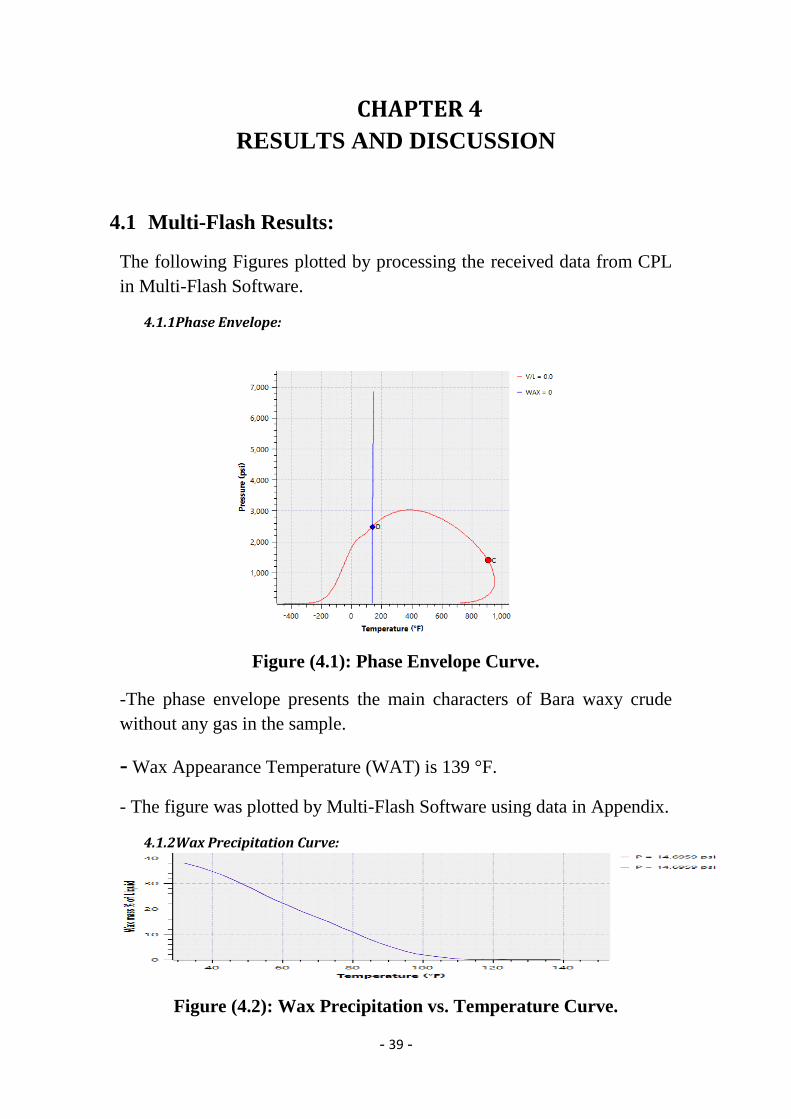
4.1 Multi-Flash Results:
The following Figures plotted by processing the received data from CPL
in Multi-Flash Software.
4.1.1Phase Envelope:
Figure (4.1): Phase Envelope Curve.
-The phase envelope presents the main characters of Bara waxy crude
without any gas in the sample.
- Wax Appearance Temperature (WAT) is 139 °F.
- The figure was plotted by Multi-Flash Software using data in Appendix.
4.1.2Wax Precipitation Curve:
Figure (4.2): Wax Precipitation vs. Temperature Curve.
- 40 -
-It was found that Wax precipitation starts at 139°F, and wax mass increase
as the temperature further decrease.
-The figure was plotted by Multi-Flash Software using data in Appendix.
4.2 OLGA SOFTWARE Results:
OLGA Software was used to model Bare Field wells performance before
and after the heat treatment for one hour.
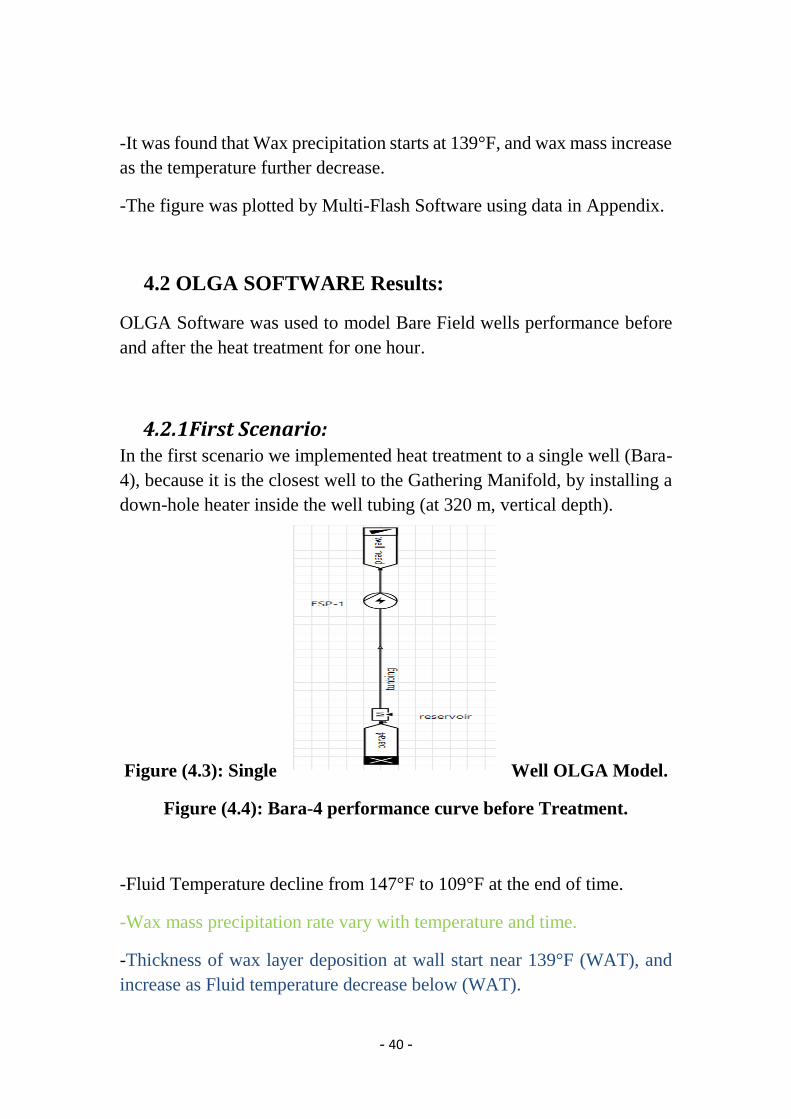
4.2.1 First Scenario: In the first scenario we implemented heat treatment to a single well (Bara-
4), because it is the closest well to the Gathering Manifold, by installing a
down-hole heater inside the well tubing (at 320 m, vertical depth).
Figure (4.3): Single Well OLGA Model.
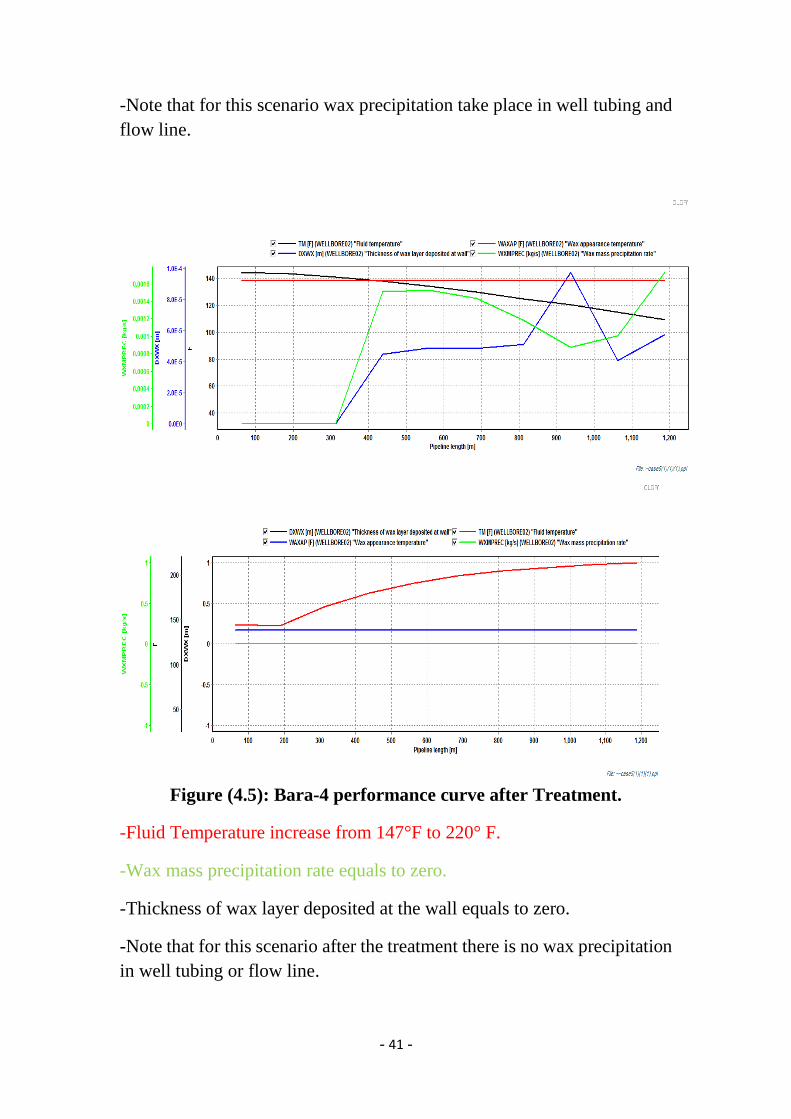
Figure (4.4): Bara-4 performance curve before Treatment.
-Fluid Temperature decline from 147°F to 109°F at the end of time.
-Wax mass precipitation rate vary with temperature and time.
-Thickness of wax layer deposition at wall start near 139°F (WAT), and
increase as Fluid temperature decrease below (WAT).
- 41 -
-Note that for this scenario wax precipitation take place in well tubing and
flow line.
Figure (4.5): Bara-4 performance curve after Treatment.
-Fluid Temperature increase from 147°F to 220° F.
-Wax mass precipitation rate equals to zero.
-Thickness of wax layer deposited at the wall equals to zero.
-Note that for this scenario after the treatment there is no wax precipitation
in well tubing or flow line.

- 42 -
4.2.2 Second scenario: In the second scenario we implemented heat treatment in two wells (Bara-
1and Bara-2), because they are the wells with longest pipelines, by
installing a down-hole heater inside the two wells tubing (at 300 m and 332
m, vertical depth respectively).
Figure (4.6): OLAGA Network Model for Bara Field.
- 43 -
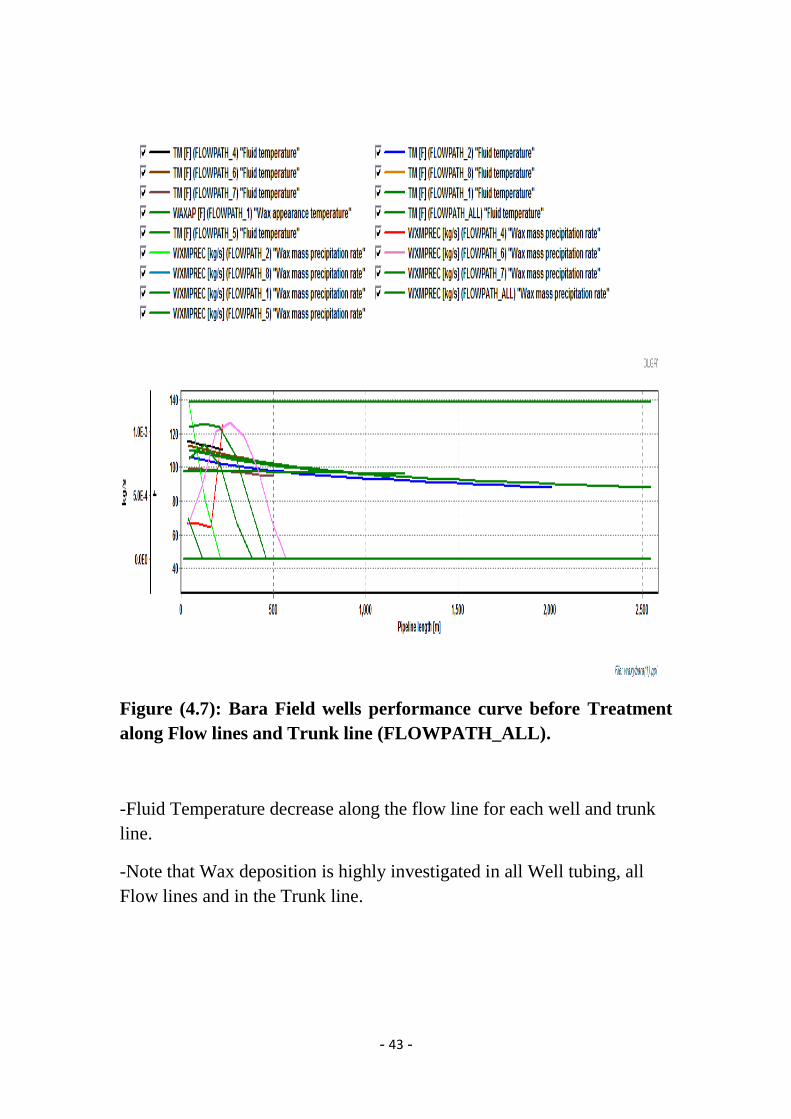
Figure (4.7): Bara Field wells performance curve before Treatment
along Flow lines and Trunk line (FLOWPATH_ALL).
-Fluid Temperature decrease along the flow line for each well and trunk
line.
-Note that Wax deposition is highly investigated in all Well tubing, all
Flow lines and in the Trunk line.
- 44 -
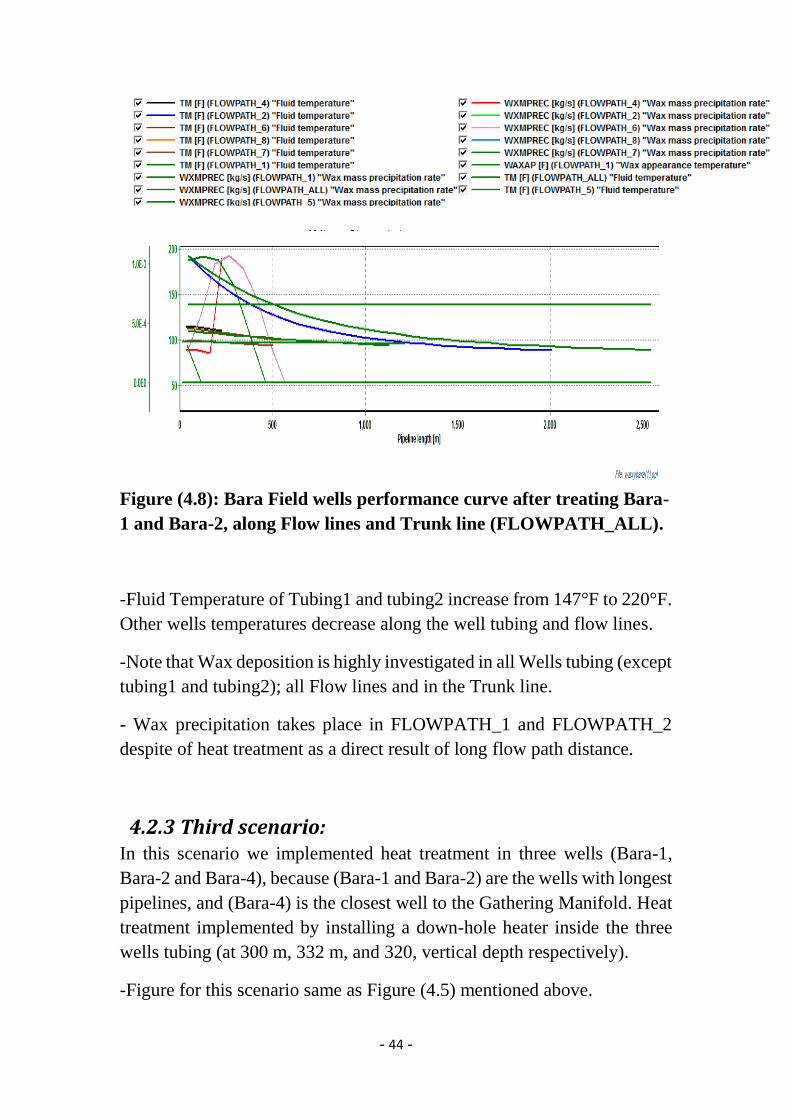
Figure (4.8): Bara Field wells performance curve after treating Bara-
1 and Bara-2, along Flow lines and Trunk line (FLOWPATH_ALL).
-Fluid Temperature of Tubing1 and tubing2 increase from 147°F to 220°F.
Other wells temperatures decrease along the well tubing and flow lines.
-Note that Wax deposition is highly investigated in all Wells tubing (except
tubing1 and tubing2); all Flow lines and in the Trunk line.
- Wax precipitation takes place in FLOWPATH_1 and FLOWPATH_2
despite of heat treatment as a direct result of long flow path distance.
4.2.3 Third scenario: In this scenario we implemented heat treatment in three wells (Bara-1,
Bara-2 and Bara-4), because (Bara-1 and Bara-2) are the wells with longest
pipelines, and (Bara-4) is the closest well to the Gathering Manifold. Heat
treatment implemented by installing a down-hole heater inside the three
wells tubing (at 300 m, 332 m, and 320, vertical depth respectively).
-Figure for this scenario same as Figure (4.5) mentioned above.
- 45 -
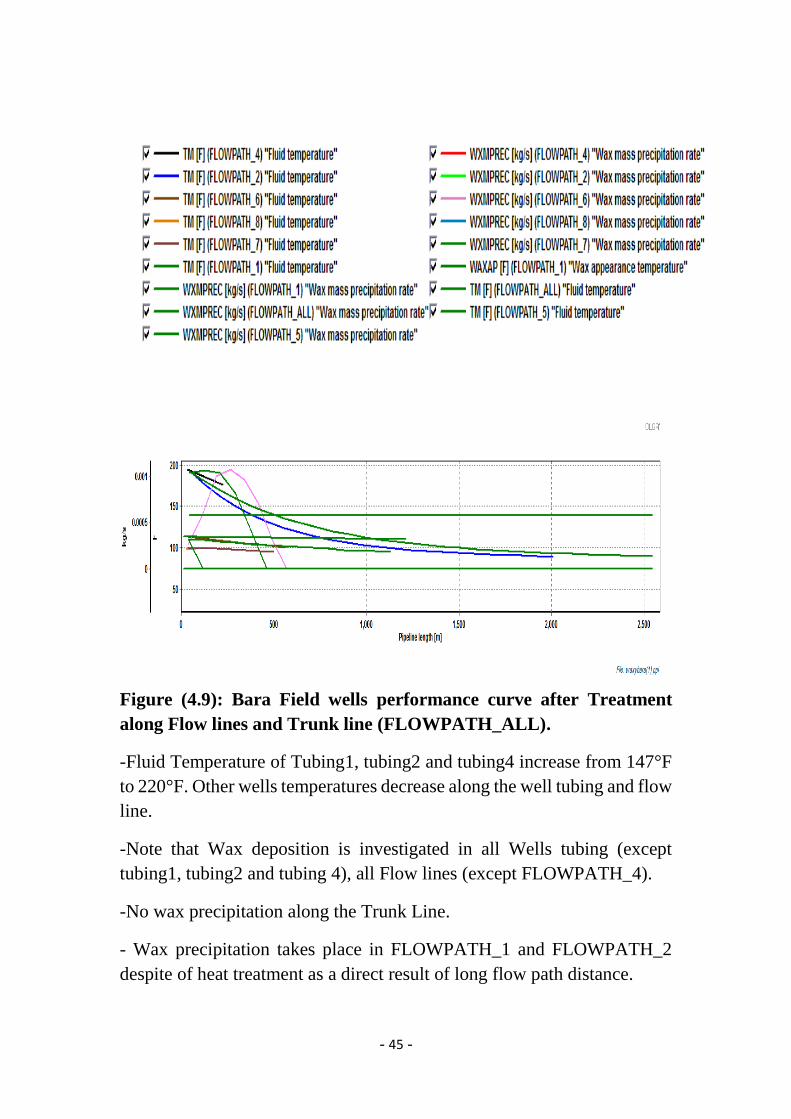
Figure (4.9): Bara Field wells performance curve after Treatment
along Flow lines and Trunk line (FLOWPATH_ALL).
-Fluid Temperature of Tubing1, tubing2 and tubing4 increase from 147°F
to 220°F. Other wells temperatures decrease along the well tubing and flow
line.
-Note that Wax deposition is investigated in all Wells tubing (except
tubing1, tubing2 and tubing 4), all Flow lines (except FLOWPATH_4).
-No wax precipitation along the Trunk Line.
- Wax precipitation takes place in FLOWPATH_1 and FLOWPATH_2
despite of heat treatment as a direct result of long flow path distance.
- 46 -
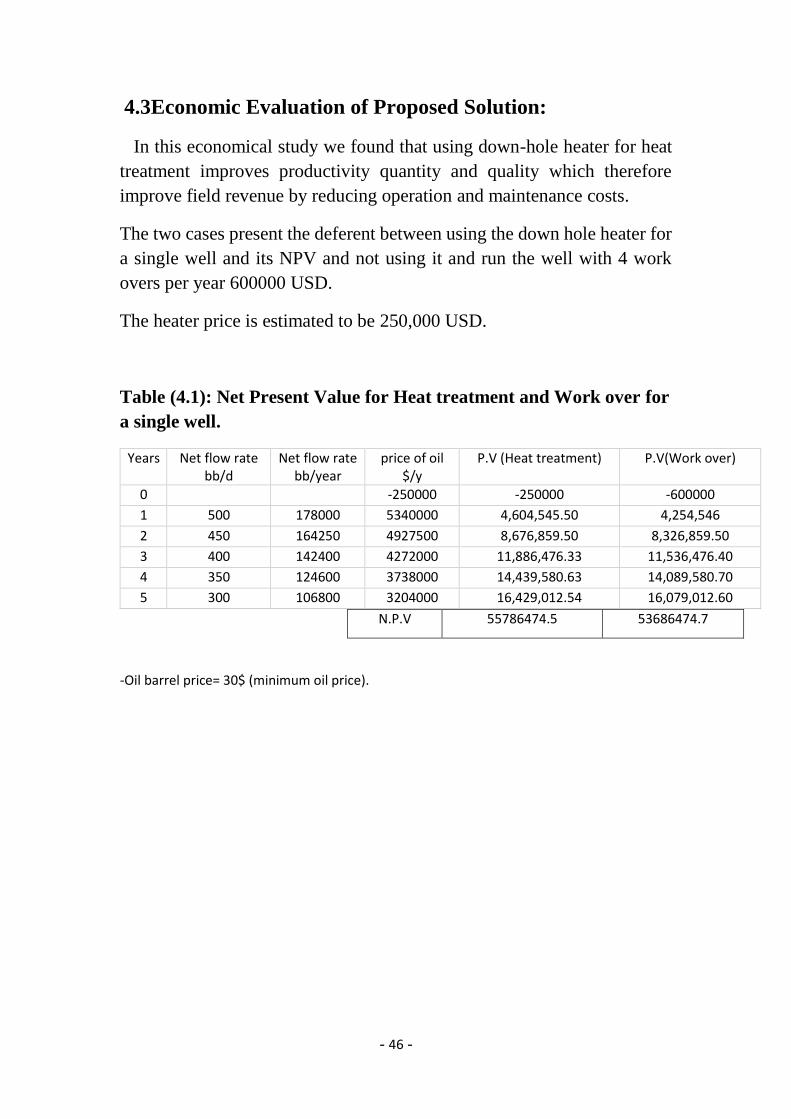
4.3Economic Evaluation of Proposed Solution:
In this economical study we found that using down-hole heater for heat
treatment improves productivity quantity and quality which therefore
improve field revenue by reducing operation and maintenance costs.
The two cases present the deferent between using the down hole heater for
a single well and its NPV and not using it and run the well with 4 work
overs per year 600000 USD.
The heater price is estimated to be 250,000 USD.
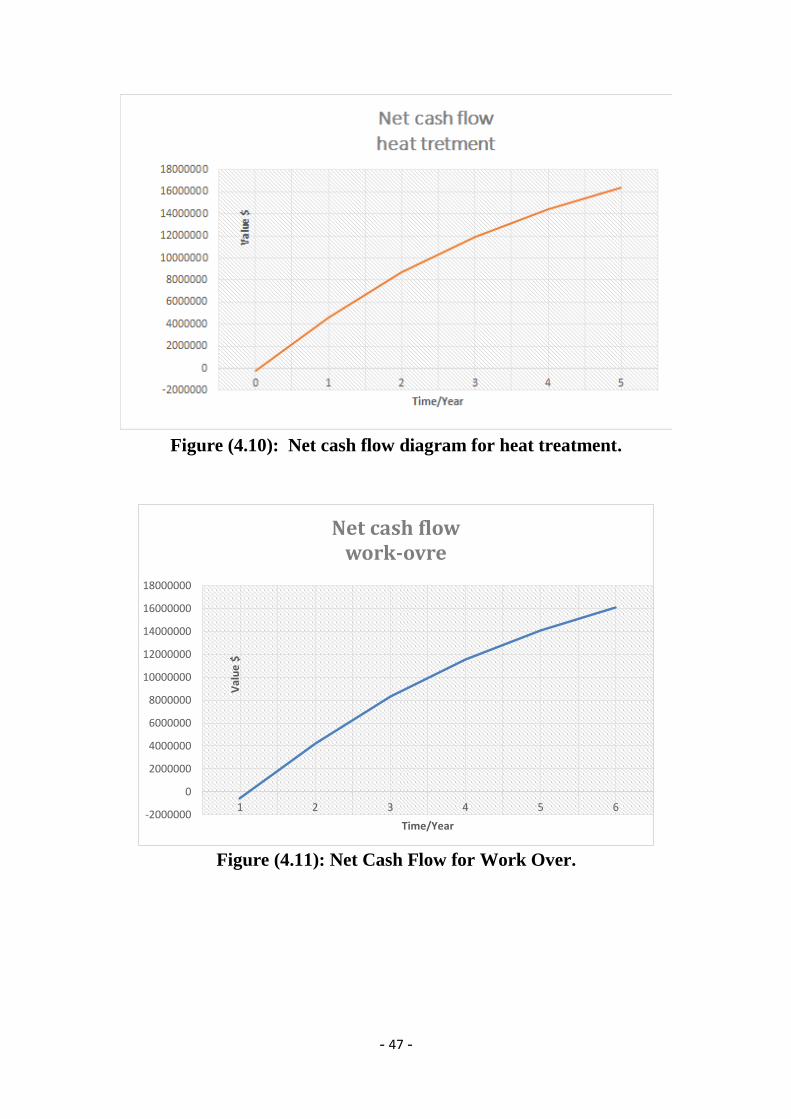
Table (4.1): Net Present Value for Heat treatment and Work over for
a single well.
Years Net flow rate bb/d
Net flow rate bb/year
price of oil $/y
P.V (Heat treatment) P.V(Work over)
0 -250000 -250000 -600000
1 500 178000 5340000 4,604,545.50 4,254,546
2 450 164250 4927500 8,676,859.50 8,326,859.50
3 400 142400 4272000 11,886,476.33 11,536,476.40
4 350 124600 3738000 14,439,580.63 14,089,580.70
5 300 106800 3204000 16,429,012.54 16,079,012.60
53686474.7 55786474.5 N.P.V
-Oil barrel price= 30$ (minimum oil price).
- 47 -
Figure (4.10): Net cash flow diagram for heat treatment.
Figure (4.11): Net Cash Flow for Work Over.
-2000000
0
2000000
4000000
6000000
8000000
10000000
12000000
14000000
16000000
18000000
1 2 3 4 5 6
Val
ue
$
Time/Year
Net cash flowwork-ovre
- 48 -
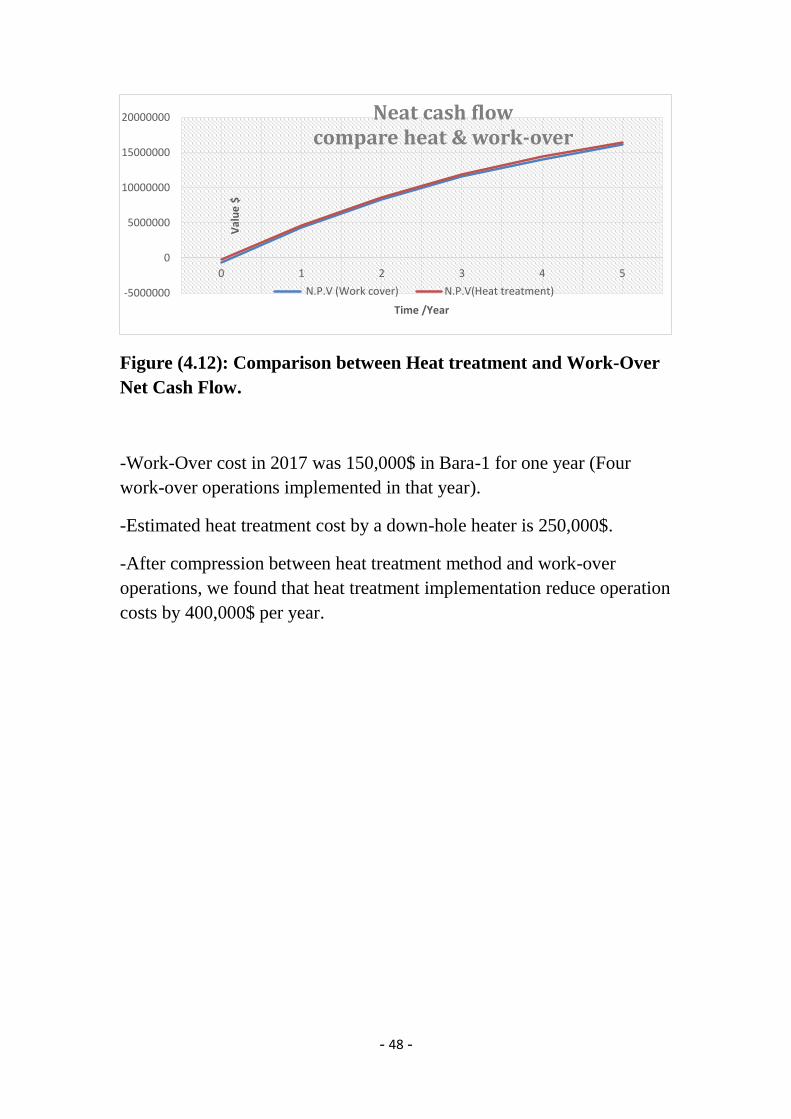
Figure (4.12): Comparison between Heat treatment and Work-Over
Net Cash Flow.
-Work-Over cost in 2017 was 150,000$ in Bara-1 for one year (Four
work-over operations implemented in that year).
-Estimated heat treatment cost by a down-hole heater is 250,000$.
-After compression between heat treatment method and work-over
operations, we found that heat treatment implementation reduce operation
costs by 400,000$ per year.
-5000000
0
5000000
10000000
15000000
20000000
0 1 2 3 4 5
Val
ue
$
Time /Year
Neat cash flowcompare heat & work-over
N.P.V (Work cover) N.P.V(Heat treatment)
- 49 -
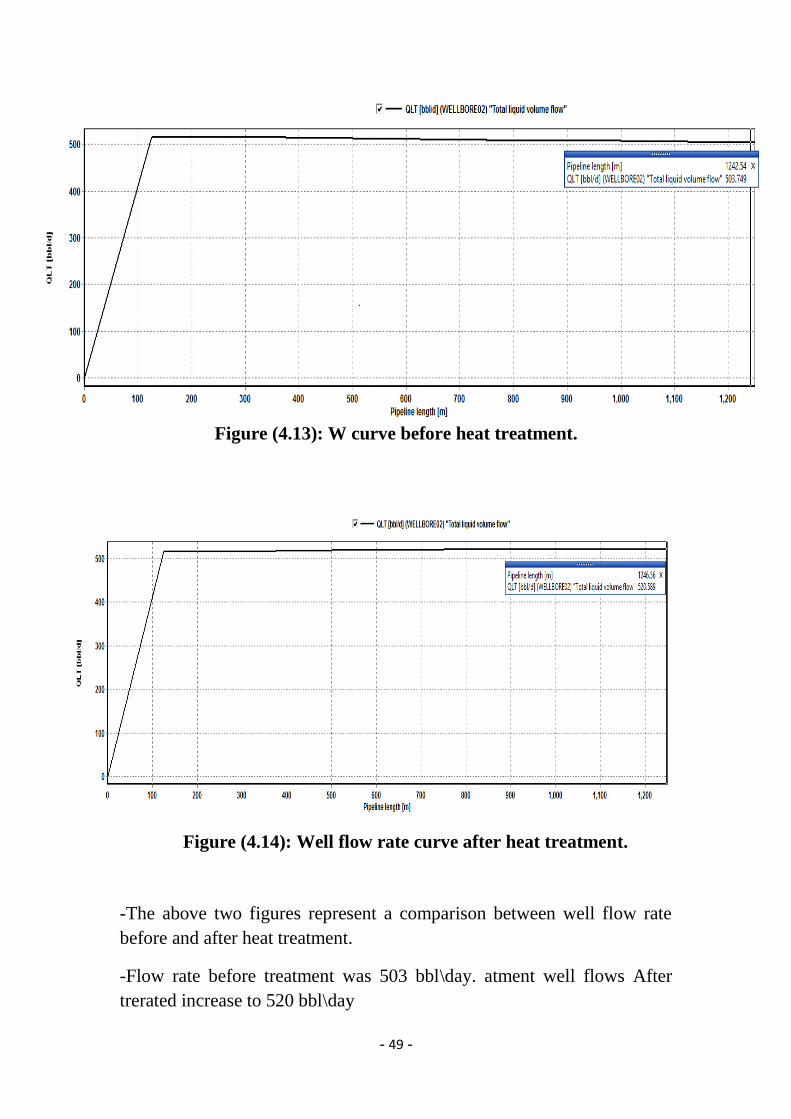
Figure (4.13): W curve before heat treatment.
Figure (4.14): Well flow rate curve after heat treatment.
-The above two figures represent a comparison between well flow rate
before and after heat treatment.
-Flow rate before treatment was 503 bbl\day. atment well flows After
trerated increase to 520 bbl\day
- 50 -
CHAPTER 5
CONCLUSION AND RECOMMENDATIONS
5.1Conclusion:
A waxy crude sample was brought from Bara oil filed for the purpose of
analysis and study. Laboratory tests conducted on the sample in Central
Petroleum Laboratories to determine the wax appearance temperature wax
content and sample components.
Sample components successfully obtained by analyzing it in Gas
chromatography device, wax appearance temperature test successfully
conducted on the sample using DSC device but the results were not
obtained due to a technical failure in CPL software. Wax content test was
not available in CPL due to malfunction in testing device.
Resultant PVT Data from CPL was processed by Multi-Flash software,
Phase envelope and wax precipitation vs. temperature curves was plotted.
A simulation model for Bara field was built using OLGA software, in
which different heating scenarios were implemented.
In the first scenario heat treatment was implemented to Bara-4, as a result
model showed no wax precipitation in well tubing or flow line. Second
scenario embodied heat treatment for Bara-1 and Bara-2; as a result the
simulation model showed no wax precipitation in the tubing of those two
wells, wax precipitation took place in the flow lines of both wells due to
long flow-lines effect, wax was also investigated in trunk line. In third
scenario three down-hole heaters were installed into three wells (Bara-1,
Bara-2 and Bara-4); model showed no wax precipitation in trunk line, wax
was investigated in all flow lines except of FLOWBATH-4, and all wells
tubing except of tubing 1, 2 and 4.
Economic study for the evaluation of the effectiveness of down-hole heater
treatment method was conducted.
- 51 -
Heat treatment method found to be very effective technically and
economically, the well recovers all heating and operating costs in less than
a year, results showed reduction in work-over and maintenance costs after
using the heaters. Also results showed slight improvement in production
after using the heater
5.2 Recommendations:
After studying Bara filed waxy crude effect on production performance,
and after modeling the field and studying various heating scenarios we
recommend:
Carry on a comprehensive flow assurance study to test all the
factors that affect the production performance in the future.
Implement the third scenario to the actual field by installing down-
hole heater in Bara-1, Bara-2 and Bara-4 operating at 220°F.
Keep updating the created OLGA model to test the production
scenarios with time.
- 52 -
References:
ABDEL-AAL, E., ABDEL-GHAFAR, H., EL ANADOULI, B. J. C. G.
& DESIGN 2015. New findings about nucleation and crystal growth of
reverse osmosis desalination scales with and without inhibitor. 15,
5133-5137.
ABDEL-AAL, N., SATOH, K. & SAWADA, K. J. J. O. C. G .2002 .
Study of the adhesion mechanism of CaCO3 using a combined bulk
chemistry/QCM technique. 245, 87-100.
AIYEJINA, A., CHAKRABARTI, D. P., PILGRIM, A. & SASTRY,
M. J. I. J. O. M. F. 2011. Wax formation in oil pipelines: A critical
review. 37, 671-694.
AJIENKA, A. 2011. Application of piezoelectric energy generated
from quartz plus semiprecious metals on wax deposition control.
Journal of Petroleum and Gas Engineering, 5, 93-98.
AKPABIO, M. G. 2013. Cold flow in long-distance subsea pipelines.
Institutt for petroleumsteknologi og anvendt geofysikk.
BAHMAN, J., SHARIFI, K., NASIRI, M., ASL, M. H. J. J. O. P. S. &
ENGINEERING 2018. Development of a Log-Log scaling law
approach for prediction of asphaltene precipitation from crude oil by n-
alkane titration. 160, 393-400.
BARRETO, C. V., PIMENTA, A., KARAMI, H., PEREYRA, E. &
SARICA, C. Experimental Investigation of Severe Slugging Control by
Surfactant Injection. Offshore Technology Conference, 2017. Offshore
Technology Conference.
BAUCK, I.-J. T. 2013 .Flow Assurance–A System Perspective,
MEK4450-FMC Subsea technologies.
BERN, P. A., WITHERS, V. R. & CAIRNS, R. J. Wax deposition in
crude oil pipelines. European offshore technology conference and
exhibition, 1980. Society of Petroleum Engineers.
BERNADINER, M. Advanced asphaltene and paraffin control
technology. SPE International Symposium on Oilfield Chemistry,
1993. Society of Petroleum Engineers.
BOTNE, K. K. 2012. Modeling wax thickness in single-phase turbulent
flow. Institutt for petroleumsteknologi og anvendt geofysikk.
BOTT, T. & GUDMUNDSSON, J. J. T. C. J. O. C. E. 1977. Deposition
of paraffin wax from kerosene in cooled heat exchanger tubes. 55, 381-
385.
BROWN, L. D. Flow Assurance: A? Discipline. Offshore Technology
Conference, 2002. Offshore Technology Conference.
- 53 -
CHANDA, D., SARMAH, A., BORTHAKUR, A., RAO, K.,
SUBRAHMANYAM, B. & DAS, H. 1998. Combined effect of
asphaltenes and flow improvers on the rheological behaviour of Indian
waxy crude oil. Fuel, 77, 1163-1167.
CHAUDHARI, P. N. 2016 .Development of hydrate risk quantification
in oil and gas production. Colorado School of Mines. Arthur Lakes
Library.
CHOW, R., SAWATZKY, R., HENRY, D., BABCHIN, A., WANG,
Y., CHERNEY, L. & HUMPHREYS, R. 2000. Precipitation of wax
from crude oil under the influence of a magnetic field. Journal of
Canadian Petroleum Technology, 39.
COBERLY, C. J. 1942. Method of preventing wax deposits in tubing.
Google Patents.
DI LULLO, A. J. T. W. A. 2012. Discover a Career: Flow Assurance.
8, 24-25.
DOBBS, J. B. A unique method of paraffin control in production
operations. SPE Rocky Mountain Regional Meeting, 1999. Society of
Petroleum Engineers.
DORSTEWITZ, F. & MEWES, D. Hydrate Formation in Pipelines.
The Fifth International Offshore and Polar Engineering Conference,
1995. International Society of Offshore and Polar Engineers.
ERICKSON, D., NIESEN, V. & BROWN, T. Thermodynamic
measurement and prediction of paraffin precipitation in crude oil. SPE
Annual Technical Conference and Exhibition, 1993. Society of
Petroleum Engineers.
GUO, B., SONG, S., GHALAMBOR, A. & CHACKO, J. 2005.
Offshore pipelines, Elsevier.
GUPTA, A. & ANIRBID, S. 2015. Need of Flow Assurance for Crude
Oil Pipelines: A Review. International Journal of Multidisciplinary
Sciences and Engineering , 6, 1-7.
HUANG, Z., ZHENG, S. & FOGLER, H. S. 2016. Wax deposition:
experimental characterizations, theoretical modeling, and field
practices, CRC Press.
HUNT JR, E. B. 1962. Laboratory study of paraffin deposition. Journal
of Petroleum Technology, 14, 1,2 59-1,269.
JOHAL, K. 2012. Flow Assurance for Oil-gas Fields Production
Transport: From Reservoir to Host Processing Facility, Fluids in
Motion Limited.
JORDA, R. 1966. Paraffin deposition and prevention in oil wells.
Journal of Petroleum Technology, 18, 1 ,605-1,612.
JOSHI, N. B., MUHAMMAD, M., CREEK, J. L. & MCFADDEN, J.
Flow assurance: A challenging path to well completions and
- 54 -
productivity. Offshore Technology Conference, 2003. Offshore
Technology Conference.
JUNIOR, J., BORGES, L. J., CARMELINO, C., HANGO, P.,
MILLIKEN, J. D. & ASOMANING, S. Calcium Naphthenate
Mitigation at Sonangols Gimboa Field. SPE International Symposium
on Oilfield Chemistry, 2013. Society of Petroleum Engineers.
KARAN, K., RATULOWSKI, J. & GERMAN, P. Measurement of
waxy crude properties using novel laboratory techniques. SPE annual
technical conference and exhibition, 2000. Society of Petroleum
Engineers.
KELLAND, M. A. 2014. Production chemicals for the oil and gas
industry, CRC press.
KHORMALI, A., PETRAKOV, D. G., MOEIN, M .J. A. J. J. O. P. S.
& ENGINEERING 2016. Experimental analysis of calcium carbonate
scale formation and inhibition in waterflooding of carbonate reservoirs.
147, 843-850.
KHORMALI, A., PETRAKOV, D. G., MOGHADDAM, R. N. J. J. O.
P. S. & ENGINEERING 2017 .Study of adsorption/desorption
properties of a new scale inhibitor package to prevent calcium carbonate
formation during water injection in oil reservoirs. 153, 257-267.
KJøRAAS, M. & STEINAR, J. 2012. Modeling of Wax Deposition in
Subsea Pipelines. MSc Thesis, Norwegian University of Science and
Technology. Available from: https://www. yumpu.
com/en/document/view/23496494/modeling-of-waxdeposition-along-
subsea-pipelines-ntnu [Accessed 19 August 2014.]
KONDAPI, P. & MOE, R. Today's Top 30 Flow Assurance
Technologies: Where Do They Stand? Offshore Technology
Conference, 2013. Offshore Technology Conference.
LARSEN, R., LUND, A. & ARGO, C. B. Cold flow-a practical
solution. Proc. of the 11th International Conference on Multiphase
Flow, June, San Remo, 20 03.
LASICH, J. & KAILA, N. Helitherm-solar power throughput
enhancement and heat tracing for heavy oil pipelines. SPE International
Thermal Operations and Heavy Oil Symposium, 2001. Society of
Petroleum Engineers.
LEE, H. S. 2008. Computational and Rheological Study of Wax
Deposition and Gelation in Subsea Pipelines.
LIN, N., LAN, H., XU, Y., DONG, S., BARBER, G. J. J. O. N. G. S.
& ENGINEERING 2015. Effect of the gas–solid two-phase flow
velocity on elbow erosion. 26, 581-586.
MALEKZADEH, R. 2012. Severe slugging in gas-liquid two-phase
pipe flow, Master of Science in Applied Earth Sciences Geboren te
Ghaemshahr, Sieca Repro. ISBN 978-94-6186-059-0.
- 55 -
MANAFI, H., MANSOORI, G. A., GHOTBI, S. J. J. O. P. S. &
ENGINEERING 1999. Phase behavior prediction of petroleum fluids
with minimum characterization data. 22, 67-93.
MCCLAFLIN, G. & WHITFILL, D. 1984. Control of paraffin
deposition in production operations. Journal of petroleum technology,
36, 1,965-1,970.
MERINO-GARCIA, D. & CORRERA, S. 2008. Cold flow: A review
of a technology to avoid wax deposition. Petroleum Science and
Technology, 26, 446-459.
MOHAMED, A. S., ALIAN, S. S., SINGH, J., SINGH, R., GOYAL,
A. & MUNAINNI, G. Remediation of Well Impaired by Complex
Organic Deposits Embedded with Naphthenate and Contaminated with
Inorganics. Offshore Technology Conference Asia, 2016. Offshore
Technology Conference.
MOHAMMADI, A. H. & RICHON, D. J. A. J. 2007. A monodisperse
thermodynamic model for estimating asphaltene precipitation. 53,
2940-2947.
NASERI ,S., MOGHADASI, J., JAMIALAHMADI, M. J. J. O. N. G.
S. & ENGINEERING 2015. Effect of temperature and calcium ion
concentration on permeability reduction due to composite barium and
calcium sulfate precipitation in porous media. 22, 299-312.
PAN, H. & FIROOZABADI, A. Thermodynamic micellization model
for asphaltene precipitation from reservoir crudes at high pressures and
temperatures. SPE Annual Technical Conference and Exhibition, 1997.
Society of Petroleum Engineers.
PETROWIKI. 1 July 2015. Oil emulsions [Online]. Available:
https://petrowiki.org/Oil_emulsions.
REISTLE JR, C. J. T. O. T. A. 1927. Summary of existing information
on handling congealing oils and paraffin. 77, 227-252.
ROENNINGSEN, H. P., BJOERNDAL, B., BALTZER HANSEN, A.
& BATSBERG PEDERSEN, W. 1991. Wax precipitation from North
Sea crude oils: 1. Crystallization and dissolution temperatures, and
Newtonian and non-Newtonian flow properties. Energy & Fuels, 5,
895-908.
ROSE, S. C. & MARSDEN JR, S. The flow of north slope crude oil and
its emulsions at low temperatures. Fall Meeting of the Society of
Petroleum Engineers of AIME, 1970. Society of Petroleum Engineers.
SALAM, K., ARINKOOLA, A., OKE, E. & ADELEYE, J. J. P. C.
2014. Optimization of operating parameters using response surface
methodology for paraffin-wax deposition in pipeline.
SHOCK, D., SUDBURY, J. & CROCKETT, J. 1955. Studies of the
mechanism of paraffin deposition and its control. Journal of Petroleum
Technology, 7, 23-28.
- 56 -
SILJUBERG, M. K. 2012. Modelling of Paraffin Wax in Oil Pipelines.
Institutt for petroleumsteknologi og anvendt geofysikk.
SINGH, P., VENKATESAN, R., FOGLER, H. S. & NAGARAJAN, N.
J. A. J. 2000. Formation and aging of incipient thin film wax‐oil gels.
46, 1059-1074.
SINGHAL, H., SAHAI, G., PUNDEER, G. & CHANDRA, K.
Designing and selecting wax crystal modifier for optimum field
performance based on crude oil composition. SPE Annual Technical
Conference and Exhibition, 1991. Society of Petroleum Engineers.
TAO, R. & XU, X. 2006. Reducing the viscosity of crude oil by pulsed
electric or magnetic field. Energy & fuels, 20, 2046-2051.
THEYAB, M. A. 2018. Fluid Flow Assurance Issues: Literature
Review.
TORDAL, A. Pigging of pipelines with high wax content. Pigging
Products and Services Association Seminar, 2006.
TRINA, S. & JOHANSEN, T. J. S. J. 2015. An integrated horizontal-
and vertical-flow simulation with application to wax precipitation. 20,
1,185-1,199.
TUNG, N. P., VAN VUONG, N., LONG, B. Q. K., VINH, N. Q.,
HUNG, P. V., HUE, V. T. & HOE, L. D. Studying the Mechanism of
magnetic field influence on paraffin crude oil viscosity and wax
deposition reductions. SPE Asia Pacific Oil and Gas Conference and
Exhibition, 2001. Society of Petroleum Engineers.
VALINEJAD, R. & NAZAR, A. R. S. J. F. 2013. An experimental
design approach for investigating the effects of operating factors on the
wax deposition in pipelines. 106, 843-850.
VAN ENGELEN, G., KAUL, C., VOS, B. & ARANHA, H. 1981.
Study of flow improvers for transportation of Bombay high crude oil
through submarine pipelines. Journal of Petroleum Technology, 33,
2,539-2,544.
WHITE, F. 2008. Fluid Mechanics, 864 pp. McGraw-Hill, New York.
WOO, G., GARBIS, S. & GRAY, T. Long-term control of paraffin
deposition. SPE Annual Technical Conference and Exhibition, 1 984 .
Society of Petroleum Engineers.
YANG, Y., KHAN, F., THODI, P., ABBASSI, R. J. R. E. & SAFETY,
S. 2017. Corrosion induced failure analysis of subsea pipelines. 159,
214-222.
YI, T., JIN, Z., CHUAN-LI, X., WEI-YING, W. J. P. S. &
TECHNOLOGY 2014. A Bohai Sea SZ36-1 Oil field formation scaling
experimental study and scale inhibitor optimization. 32, 2512-2519.
ZAMANI, M., SEDDIGHI, S., NAZIF, H. R. J. J. O. N. G. S. &
ENGINEERING 2017. Erosion of natural gas elbows due to rotating
particles in turbulent gas-solid flow. 40, 91-113.
- 57 -
ZHANG, L., CHEN, J., CAI, X., HUANG, S., JI, Y. J. C.,
PHYSICOCHEMICAL, S. A. & ASPECTS, E. 2017. Research on
electrostatic coalescence of water-in-crude-oil emulsions under high
frequency/high voltage AC electric field based on electro-rheological
method. 520, 246-256.
ZHU, T., WALKER, J. A. & LIANG, J. 2008. Evaluation of wax
deposition and its control during production of Alaska north slope oils.
University of Alaska.
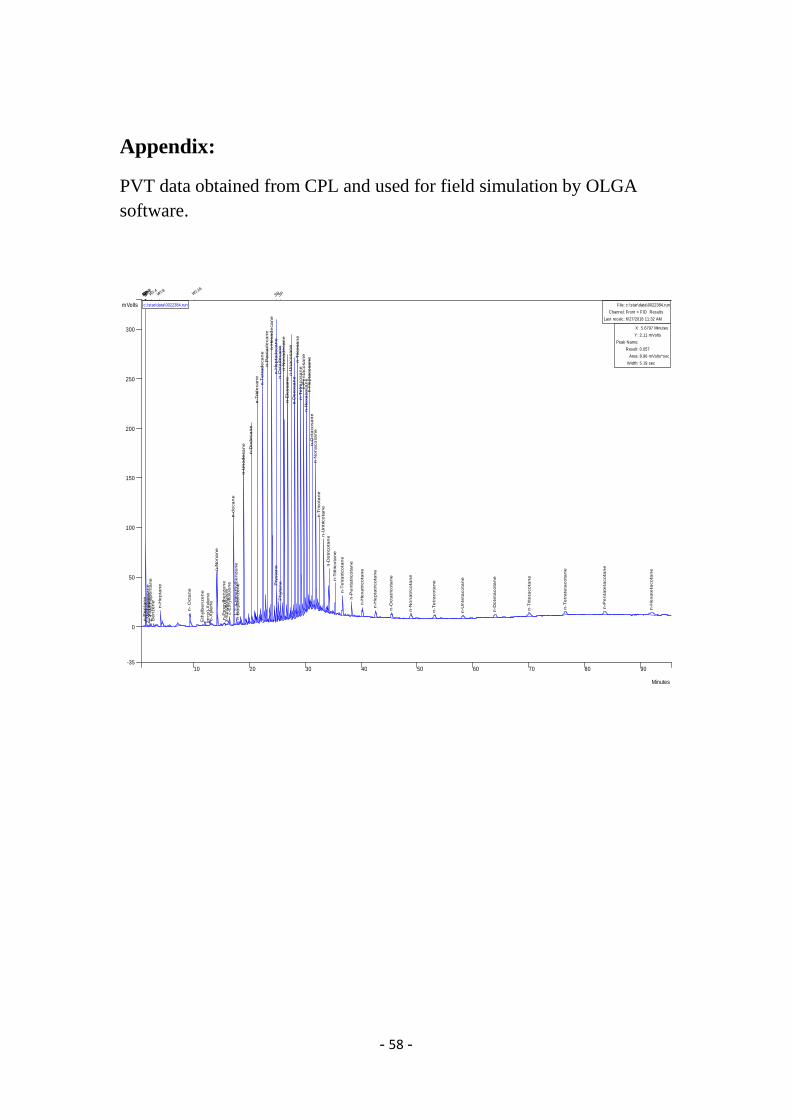
- 58 -
Appendix:
PVT data obtained from CPL and used for field simulation by OLGA
software.
10 20 30 40 50 60 70 80 90
Minutes
-35
0
50
100
150
200
250
300
mVolts
n-P
en
tan
e2
-Me
thylp
en
tan
en
-He
xa
ne
2.4
-Me
thylp
en
tan
eB
en
ze
ne
n-H
ep
tan
e
n-
Octa
ne
Eth
ylb
en
ze
ne
(m+
p)-
Xyle
ne
o-X
yle
ne
n-N
on
an
e
n-P
rop
ylb
en
ze
ne
3-E
thylto
lue
ne
2-E
thylto
lue
ne
n-d
eca
ne
1.2
.4-t
rim
eth
ylb
en
ze
ne
n-B
uty
lbe
nze
ne
n-U
no
de
ca
ne
n-D
od
eca
ne
n-T
rid
eca
ne
n-T
etr
ad
eca
ne
n-P
en
tad
eca
ne
n-H
exa
de
ca
ne
n-H
ep
tad
eca
ne
Pry
sta
ne
n-O
cta
de
ca
ne
Ph
yta
ne
n-N
on
ad
eca
ne
n-E
ico
sa
ne
n-U
na
co
sa
ne
n-D
oco
sa
ne
n-T
rico
sa
ne
n-T
etr
aco
sa
ne
n-P
en
taco
sa
ne
n-H
exa
co
sa
ne
n-H
ep
taco
sa
ne
n-O
cta
co
sa
ne
n-N
on
aco
sa
ne
n-T
rico
tan
en
-Un
tric
ota
ne
n-D
otr
ico
tan
e
n-T
ritr
ico
tan
e
n-T
etr
atr
ico
tan
e
n-P
en
tatr
ico
tan
e
n-H
exa
tric
ota
ne
n-H
ep
tatr
ico
tan
e
n-O
cta
tric
ota
ne
n-N
on
atr
ico
tan
e
n-T
etr
aco
tan
e
n-U
nte
taco
tan
e
n-D
ote
taco
tan
e
n-T
rite
taco
tan
e
n-T
etr
ate
taco
tan
e
n-P
en
tate
taco
tan
e
n-H
exa
teta
co
tan
e
c:\star\data\0022384.run File:
Channel:
Last recalc:
c:\star\data\0022384.run
Front = FID Results
6/27/2018 11:32 AM
X:
Y:
Peak Name:
Result:
Area:
Width:
5.6797 Minutes
2.11 mVolts
0.057
8.96 mVolts*sec
5.19 sec
FP+FP-W
I:4II+W
I:2II- W
I:4W
I:8 WI:1
6
SPSP
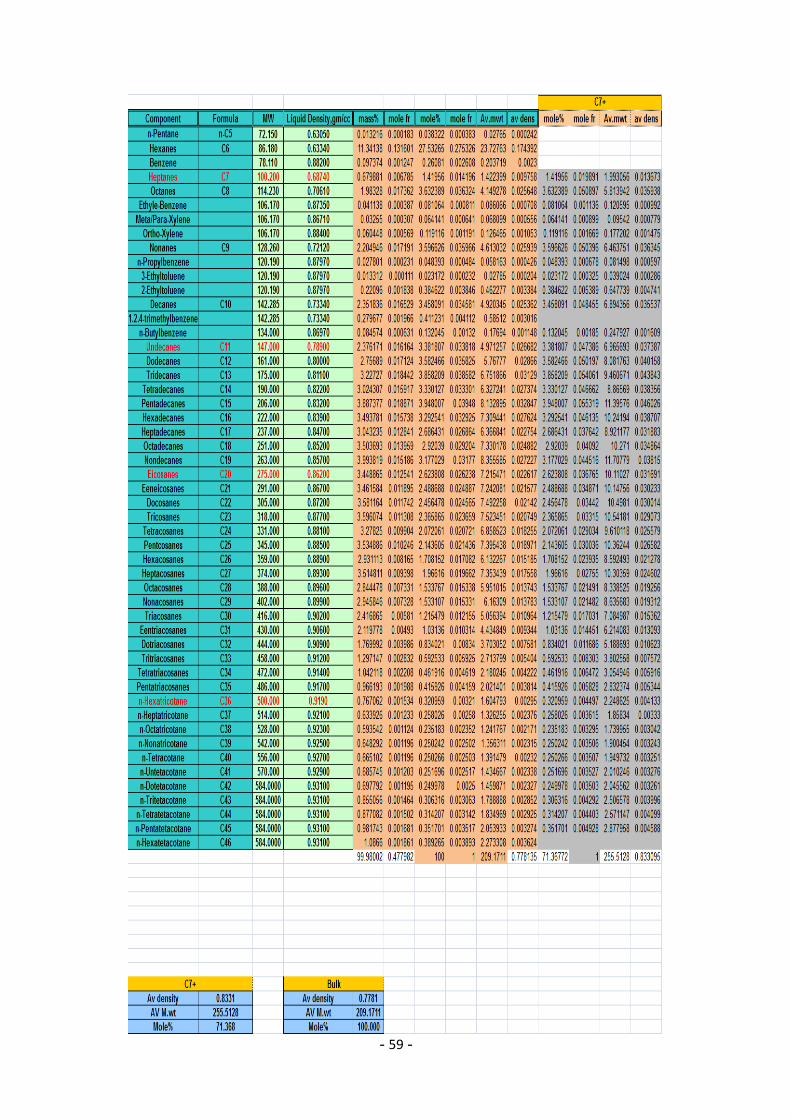
- 59 -

- 60 -