FINANCIAL STATEMENT ANALYSIS KEL LTD
105
FINANCIAL STATEMENT ANALYSIS KEL LTD NEW HORIZON COLLEGE, BANGALORE Page 1 PROJECT REPORT “FINANCIAL STATEMENT ANALYSIS OF KERALA ELECTRICAL AND ALLIED ENGINEERING COMPANY LTD” SUBMITTED BY: SUBITH S (Reg NO.14P35H0209) Under the guidance of MRS.PADMA NANDANAN Assistant Professor NEW HORIZON COLLEGE MASTERS OF BUSINESS ADMINISTRATION BHARATHIAR UNIVERSITY COLLEGE CODE: KA 11 B 131 2014-16
-
Upload
khangminh22 -
Category
Documents
-
view
0 -
download
0
Transcript of FINANCIAL STATEMENT ANALYSIS KEL LTD

FINANCIAL STATEMENT ANALYSIS KEL LTD
NEW HORIZON COLLEGE, BANGALORE Page 1
PROJECT REPORT
“FINANCIAL STATEMENT ANALYSIS OF KERALA
ELECTRICAL AND ALLIED ENGINEERING COMPANY LTD”
SUBMITTED BY:
SUBITH S
(Reg NO.14P35H0209)
Under the guidance of
MRS.PADMA NANDANAN
Assistant Professor
NEW HORIZON COLLEGE
MASTERS OF BUSINESS ADMINISTRATION
BHARATHIAR UNIVERSITY
COLLEGE CODE: KA 11 B 131
2014-16

FINANCIAL STATEMENT ANALYSIS KEL LTD
NEW HORIZON COLLEGE, BANGALORE Page 2
NEW HORIZON COLLEGE
STUDENT’S DECLARATION
I hereby declare that this project entitled “KERALA ELECTRICAL AND ALLIED
ENGINEERING CO. LTD “was prepared by me during the year 2014-2016 and was submitted
in partial fulfillment of the requirements for MASTERS OF BUSINESS ADMINISTRATION,
BHARATHIAR UNIVERSITY.
I also declare that this project report is original and genuine and has not been submitted to any
other university of the award of any degree, diploma or other similar titles or purposes.
Date: Signature
Bangalore SUBITH S
Reg no:14P35H0209

FINANCIAL STATEMENT ANALYSIS KEL LTD
NEW HORIZON COLLEGE, BANGALORE Page 3
NEW HORIZON COLLEGE
GUIDE CERTIFICATE.
This is to certify that the project report entitled “KERALA ELECTRICAL AND ALLIED
ENGINEERING CO. LTD “ submitted by Mr. SUBITH S bearing Registration number
14P35H0209 to Bharathiar University for the partial fulfillment of Masters Degree in
Business Administration is an outcome of genuine research work carried under my guidance
and it has not been submitted for the award of any other degree, diploma or prize.
Date: Signature
Bangalore Mrs.Padma Nandanan
Assistant Professor

FINANCIAL STATEMENT ANALYSIS KEL LTD
NEW HORIZON COLLEGE, BANGALORE Page 4
NEW HORIZON COLLEGE
PRINCIPAL’S CERTIFICATE
This is to certify that Mr. SUBITH S bearing Registration Number 14P35H0209 is a bonafide
student of this college. The project work entitled “KERALA ELECTRICAL AND ALLIED
ENGINEERING CO. LTD “ is a bonafide work carried out by him/her in partial fulfillment of
the requirements for Masters Degree in Business Administration of Bharathiar University
during the year 2014-2016
Date: Signature
Bangalore Dr.R.BODHISATVAN
Principal

FINANCIAL STATEMENT ANALYSIS KEL LTD
NEW HORIZON COLLEGE, BANGALORE Page 5
ACKNOWLEDGEMENT
This project would not have been successfully materialized had it not been for the several
people who have directly and indirectly helped me. I am extremely indebted to all of them and
whole –heartedly thank everyone for their valuable support.
I would be failing in my duty if I do not express my deep sense of gratitude to Dr.
R.Bodhisatvan, Principal , New Horizon College. I also thank Mr. Arun Raghu Babu, the
Program Coordinator, New Horizon College
I express my sincere thanks to my guide Mrs. Padma Nandanan , Assistant Professor
New Horizon College for the guidance and support for she gave every step of my project.
I sincerely thank Mr. A.M. Abdul Rasheed (General manager) KERALA
ELECTRICAL AND ALLIED ENGINEERING CO. LTD. I also thank all the employees of the
finance department of TCL for providing information for my project work.
I sincerely thank family members and friends for the co-operation to complete this
project work successfully.
Above all, I thank God Almighty for the ever-abiding kind blessings he has showered
upon me.
SUBITH S

FINANCIAL STATEMENT ANALYSIS KEL LTD
NEW HORIZON COLLEGE, BANGALORE Page 6
TABLE OF CONTENTS
CHAPTER NO. TITLE PAGE NO.
1
INTRODUCTION
1.1 FINANCIAL STATEMENT ANALYSIS
1.2 THEORETICAL BACKGROUND OF THE STUDY
1.3 TYPES OF FINANCIAL ANALYSIS
1.4 METHODS OF FINANCIAL ANALYSIS
1.5 ACTIVITY OR TURNOVER RATIO
1.6 LEVERAGE RATIOS OR SOLVENCY RATIOS
1.7 REVIEW OF LITERATURE
01-22
1
2
3
4
14
16
19
2 INDUSTRIAL& COMPANY PROFILE
2.1 INDUSTRIAL PROFILE
2.2 COMPANY PROFILE
23-38
23
26
3 RESEARCH DESIGN
3.1 TITLE
3.2 SCOPE OF THE STUDY
3.3 OBJECTIVE OF FINANCIAL STATEMENT
ANALYSIS
3.4 RESEARCH METHODOLOGY
3.5 LIMITATION OF THE STUDY
3.6 CHAPTER SCHEME
39-51
39
39
39
40
51
51
4 DATA ANALYSIS AND INTERPRETATION
1 RATIO ANALYSIS
2 COMPARATIVE STASTEMENT
52-81
52
74
5 FINDING ,SUGGESTION AND CONCLUSION
5.1 FINDINGS
5.2 SUGGESTIONS
5.3 CONCLUSION
82
83
84
BIBLIOGRAPHY
ANNEXURE
85
86

FINANCIAL STATEMENT ANALYSIS KEL LTD
NEW HORIZON COLLEGE, BANGALORE Page 7
LIST OF TABLES
TABLE. No. TITLE PAGE No.
4.1 Current Ratio 52
4.2 Quick Ratio 54
4.3 Absolute liquid Ratio 55
4.4 Net profit ratio 57
4.5 Debtors turnover ratio 58
4.6 Fixed asset turnover ratio
60
4.7 Debt equity ratio 62
4.8 Proprietary ratio 63
4.9 Solvency ratio 65
4.10 Fixed asset to net worth ratio 66
4..11 Trend analysis 68
4.12 Trend analysis of inventory 69
4.13 Trend analysis of cash 71
4.14 Trend analysis of current asset 72
4.15 Comparative balances sheet 2010-2011 74
4.16 Comparative balance sheet 2011-2012 76
4.17 Comparative balance sheet 2012-2013 78
4.18 Comparative balance sheet 2013-2014 80

FINANCIAL STATEMENT ANALYSIS KEL LTD
NEW HORIZON COLLEGE, BANGALORE Page 8
LIST OF FIGURES
CHART. No. TITLE PAGE
No.
4.1 Current Ratio 53
4.2 Quick Ratio
54
4.3 Absolute liquid Ratio
55
4.4 Net profit ratio
57
4.5 Debtors turnover ratio
59
4.6
Fixed asset turnover ratio
61
4.7 Debt equity ratio 62
4.8 Proprietary ratio 64
4.9 Solvency ratio 65
4.10 Fixed asset to net worth ratio 67
4..11 Trend analysis 68
4.12 Trend analysis of inventory 70
4.13 Trend analysis of cash 71
4.14 Trend analysis of current asset 73

FINANCIAL STATEMENT ANALYSIS KEL LTD
NEW HORIZON COLLEGE, BANGALORE Page 9
CHAPTER 1
INTRODUCTION

FINANCIAL STATEMENT ANALYSIS KEL LTD
NEW HORIZON COLLEGE, BANGALORE Page 10
CHAPTER 1
INTRODUCTION
1.1 Financial statement Analysis
Finance is the provision of money when it required. Every enterprise requires
finance to start and carry out its operation. Finance is the lifeblood of every
business. So the finance should be managed efficiency and effectively.
Financial statement is prepared mainly for the decision making. Financial
statement analysis is referred to the process of determining the strength and the
weakness of the firm by properly establishing strategic relationship between the
items of balance sheet and profit and loss account. There are many methods for the
analysis of financial statement, such as trend analysis, comparative statement,
common-size statement, ratio analysis etc. analysis of financial statement are used
by many interested parties such as investors, creditors, banks, management etc.
some of the steps involved in the analysis of financial statement analysis are:
First step to collect the information required for carrying out the study
Second step is to arrange the information so collected according to their
significant relationship.
Financial step is the drawing of conclusions and inferences.
In this project financial statement analysis has been made in the company
KERALA ELECTRICAL AND ALLIED ENGINEERING CO. LTD. All the
financial statement of KEL has been thoroughly checked for getting the
information and data so collected has been thoroughly interpreted for drawing for
the study.

FINANCIAL STATEMENT ANALYSIS KEL LTD
NEW HORIZON COLLEGE, BANGALORE Page 11
More details regarding the project have been in the following chapters. Also the
details regarding the analysis and the tool used for the analysis has also been
mentioned in the continuing chapters. At last my findings and suggestions to KEL
have been mentioned.
1.2 THEORETICAL BACKGROUND OF THE STUDY
1.2.1 FINANCIAL STATEMENTS
The financial statements are prepared for the purpose of presenting the periodical
review or report of the progress made by the concern and deal with status of the
investment in business and results achieved during the accounting period.
According to John N Meyer "the financial statements provide a summary of the
accounts of a business enterprise, the balance sheet reflecting the assets and
liabilities and the income statements showing the results of operations during a
certain period." This definition emphasizes the importance of balance sheet and
profit and loss accounts, but ignores the importance of other financial statements
like fund flow statements and statement retained earnings.
1.2.2 FINANCIAL ANALYSIS
Financial analysis is also known as analysis and interpretation of financial
statements. It is the process of determining financial strengths and weaknesses of
an organization by establishing relationship between the items of balance sheet and
profit and loss account. It refers to an assessment of the viability, stability and
profitability of a business. It is a valuable tool used by the users of financial
information like management,
Investors, creditors, lenders, government etc. to make sense of the data given in
financial statements to make informed decisions. The goal in analyzing the

FINANCIAL STATEMENT ANALYSIS KEL LTD
NEW HORIZON COLLEGE, BANGALORE Page 12
financial statements is to assess fast performances and current financial position to
make predictions about the future performance of a company.
1.3 TYPES OF FINANCIAL ANALYSIS
1.3.1 External and Internal Analysis
External analysis of financial statement is made by those who do not have access
to detailed accounting records. E.g. .Banks, Creditors, Public. They mainly
dependent upon published financial statements and other secondary sources of
data.
Internal analysis is made by the finance and accounting department of an
organization as a means to generate financial information for decision making. It is
based on relevant financial records maintained by the organization. Such an
analysis emphasizes on performance appraisal and assessment of profitability.
1.3.2 Short Term and Long Term Analysis
Short term analysis mainly involves analysis of working capital. In the short run, a
company must have ample funds readily available to meet its current needs and
sufficient borrowing capacity to meet contingencies. Hence, in short term analysis,
the current assets and current liabilities are analyzed and cash position of the
concern is evaluated. in long term analysis the stress is on the stability and future
earnings potential of the concern. Here fixed assets, long term debt structure and
ownership interest is analyzed.
1.3.3 Horizontal and Vertical Analysis

FINANCIAL STATEMENT ANALYSIS KEL LTD
NEW HORIZON COLLEGE, BANGALORE Page 13
When financial statements for a number of years are reviewed and analyzed
together it is called as horizontal analysis. The preparation of comparative
statements is an example of horizontal analysis.
Vertical analysis is also known as static analysis. lt refers to analysis of items in
financial statements for a particular year with reference to other items in the same
financial statement. It involves calculating ratios between two items in the
financial statement for the same year. lt is not very useful for long term planning as
it does not include trend analysis. However, it is an effective tool for performance
evaluation.
1.4 METHODS OF FINANCIAL ANALYSIS
The analysis and interpretation of financial statement is used to determine the
financial positions and result of operation as well. A number of methods or devices
are used to study the relationship between different statements an effort is made to
use those devices which clearly analysis the position of the enterprise. The
following methods of analysis are generally used:
COMPARATIVE BALANCE SHEET
TREND ANALYSIS
STATEMENT OF CHANGES IN WORKING CAPITAL
RATIO ANALYSIS
COMMON-SIZE STATEMENT
FUND FLOW STATEMENT
CASHFLOW STATEMENT

FINANCIAL STATEMENT ANALYSIS KEL LTD
NEW HORIZON COLLEGE, BANGALORE Page 14
These are the different methods used by experts to analysis the financial statements
of an enterprising during the current year.
A) COMPARATIVE STATEMENT
Comparative study of financial statement is the comparison of the financial
statement of the business with the previous year‟s financial statements and with the
performance of other competitive enterprises, so that weakness may be identified
and remedial measures applied. The comparative statement may show the
following:
Absolute figures
Changes in absolute figures
Absolute data terms of percentages
Increase of decrease in terms of percentage
Comparative statements can be prepared for both types of financial statements i.e.,
Balance sheet as well as profit and loss account. The comparative profits and loss
account will present a review of operating activities of the business. The
comparative balance shows the effect of operation on the assets and liabilities that
change in the financial position during the period under consideration.
Comparative analysis is the study of trend of the same items and computed items
into or more financial statements of the same business enterprise on different dates.
The presentation of comparative financial statements, in annual and other reports,
enhances the usefulness of such reports and brings out more clearly the nature and
trends of current changes affecting the enterprise. While the single balance sheet
represents balances of accounts drawn at the end of an accounting period, the

FINANCIAL STATEMENT ANALYSIS KEL LTD
NEW HORIZON COLLEGE, BANGALORE Page 15
comparative balance sheet represents not early the balance of accounts drawn on
two different dates, but also the extent of their increase or decrease between these
two dates. The single balance sheet focuses on the changes that have taken place in
one accounting period. The changes are the direct outcome of operational
activities, conversion of assets, liability and capital form into others as well as
various interactions among assets, liability and capital. The two comparative
statements are:
Balance sheet
Income statement.
B) TREND ANALYSIS
A trend analysis is a method of analysis that allows traders to predict what will
happen with a stock in the future. Trend analysis is based on historical data about
the stock‟s performance given the overall trends of the market and particular
indicators within the market. Trend analysis takes into account historical data
points for a stock and, controlling for other factors like the general changes in the
sector, market conditions, competitions for similar stocks, it allows traders to
forecast short, Intermediate, and long term possibilities for the stock.
Procedures for calculating trend analysis,
1.One year is taken as the base year. Generally the first or last taken as the
base year.
2. The figures of the base is taken as 100
3. The trend percentage are calculated in relation to the year

FINANCIAL STATEMENT ANALYSIS KEL LTD
NEW HORIZON COLLEGE, BANGALORE Page 16
C) RATIO ANALYSIS
Ratio analysis is a widely use tool of financial analysis. It can be used to compare
the risk and return relationship of firms of different sizes. It is defined as the
systematic use of ratio to interpret the financial statements so that the strengths and
weakness of a firm as well as its historical performance and current financial
condition can be determined. The term ratio refers to the numerical or quantitative
relationship between two items and variables. These ratios are expressed as
I. Percentage
II. Fraction
III. Proportion of numbers
These alternative methods of expressing items which are related to each other are,
for purpose of financial analysis, referred to as ratio analysis. It should be noted
that computing the ratio does not add any information not already inherent in the
above figures of profits and sales. What the ratio does is that they reveal the
relationship in a more meaningful way so as to enable equity investors;
management and lenders make better investment and credit decision.
DEFINITION
According to accountant‟s Handbook by Wixon and Bedford, “A ratio is an
expression of the quantitative relationship between two numbers”
FINANCIAL STATEMENT ANALYSIS KEL LTD
NEW HORIZON COLLEGE, BANGALORE Page 17
Utility of Ratio Analysis
Diagnosis of the firm‟s problems, weakness and strengths
For the assessment of firm‟s financial conditions and capabilities
Credit analysis
Comparative analysis
Time series analysis
Caution in using ratio analysis
Standards of comparisons
Company differences
Prices level
Different definition
Changing situations
Standard of comparison
Time series analysis
Inter-firm analysis
Industry analysis
Preformed financial statement analysis
USERS OF FINANCIAL RATIO
OWNERS
FINANCIAL MANAGERS
INVESTORS

FINANCIAL STATEMENT ANALYSIS KEL LTD
NEW HORIZON COLLEGE, BANGALORE Page 18
CREDITORS
FINANCIAL OF LONG TERM FUND
GOVERNMENT AGENCIES
Advantages of Ratio Analysis:
1. It helps in analysis of the situation i.e., analysis on the financial situation and
performance
2. Inter-firm and intra-firm comparison is both possible on the basis of accounting
3. Accounting ratio not only indicates the present position but they also indicate the
cause leading up to the position of a large extend
4. It helps in obtaining best result when ratios for a number of years are put in tabular
form so that the figures for one year can be easily compared with those of other
year.
5. They provide simplicity to the complex accounting information presented by the
financial statements
6. They are very helpful to outsiders as well as for internal management
7. They are very helpful to outsiders as well as internal management
8. It is very helpful to internal managements, discharge of the basic managerial
functions
9. It also helps in planning, policy making & controlling the activities
10. They are helpful in establishing the standard casting system
Limitations of ratio analysis
1. Ratio provides only guidelines to the management they are only the means.
However they scratch surfaces and raise question. The limitation of the ratio may
force the management to have detailed investigation of the situation under question

FINANCIAL STATEMENT ANALYSIS KEL LTD
NEW HORIZON COLLEGE, BANGALORE Page 19
2. Single accounting ratio is not useful at all unless it is studied with other accounting
ratios
3. They are based only on the quantitative information. Hence, qualitative
information puts limit on the ratios
4. Ratios are subject to arithmetical accuracy of the financial statements. Moreover
financial statement also includes estimated date like provision for depreciation, bad
and doubtful debts etc. hence, result revealed by ratios is subject to such estimates.
5. Ratios are computed on the basis of financial statements which are historical in
nature.
6. Knowledge of ratios only is meaningless unless it is also found how it is made up
7. Lack of homogeneity of data, personal judgment lack of consistency etc. is the
factors which limit the conclusions to be derived on the basis of accounting ratios.
Financial ratio:
Financial ratio is a relationship between two financial variables. It helps to
ascertain the financial condition of a firm.
Types of financial ratios
1. LIQUITDITY RATIOS
a) Current ratio
b) Quick ratio
c) Absolute Liquidity ratio
2. ACTIVITY RATIOS
a) Debtors turnover ratio
b) Working capital turnover ratio
c) Fixed assets turnover ratio
3. LEVERAGE RATIO

FINANCIAL STATEMENT ANALYSIS KEL LTD
NEW HORIZON COLLEGE, BANGALORE Page 20
a) Debt equity ratio
b) Proprietary ratio
c) Fixed assets to net worth ratio
4. PROFITABILITY RATIO
a) Net profit ratio
LIQUITDITY RATIOS
It refers to the ability of the firm to meet its current liabilities. The liquidity ratio,
therefore, are also called solvency ratio. These ratios are used to assess the short-
term financial position of the concern. They indicate the firm‟s ability to meet its
current obligation out of current resources. In the word of Saloman j. Flink,
“Liquidity is the ability of the firms to meet its current obligation as they fall due”.
Liquidity ratio includes three ratios:-
CURRENT RATIO
QUICK RATIO OR ACID TEST RATIO
ABSOLUTE LIQUIDITY RATIO
A. CURRENT RATIO
The current ratio expresses the relationship between the firm‟s current assets and
its current liabilities. Current assets normally include cash, marketable securities,
accounts receivable and inventories. Current liabilities consist of accounts payable,
short term notes payable, short-term loans, current maturities of long term debt,
accrued income taxes and other accrued expenses (wages).

FINANCIAL STATEMENT ANALYSIS KEL LTD
NEW HORIZON COLLEGE, BANGALORE Page 21
Current ratio = current assets/ current liabilities
Significance:
It is generally accepted that current assets should be 2 times the current liabilities.
In a sound business, a current ratio of 2:1 is considered an ideal one. If current
ratio is lower than 2:1, the short term solvency of the firm is considered doubtful
and it shows that the firm is not in a position to meet its current liabilities in times
and when they are due to mature. A higher current ratio is considered to be an
indication that of the firm is liquid and can meet its short term liabilities on
maturity. Higher current ratio represents a cushion to short-term creditors, “the
higher the current ratio, the greater the margin of safety to the creditors”. The
biggest drawback o the current ratio is that it is susceptible to “Window dressing”.
This ratio can be improved by an equal decrease in both current assets and current
liability.
B) QUICK RATIO
Measures assets that are quickly converted into cash and they are compared
with current liabilities. This ratio realizes that some of current assets are not easily
convertible to cash e.g., inventories. The quick ratio, also referred to as acid ratio,
examines the ability of the business to cover its short-term obligations from its
“quick” assets only (i.e., it ignores stock).
The quick ratio is calculated as follows
Quick ratio = quick assets/current liabilities

FINANCIAL STATEMENT ANALYSIS KEL LTD
NEW HORIZON COLLEGE, BANGALORE Page 22
Significance
The standard liquid ratio is supposed to be 1:1 i.e., liquid assets should be equal to
current liabilities. If the ratio is higher, i.e., liquid assets are more than the current
liabilities, the short term financial position is supposed to be very sound. On the
other hand, if the ratio is slow, i.e., current liabilities are more than the liquid
assets, the short term financial position of the business shall be deemed to be
unsound.
C) CASH RATIO
This is also known as cash position ratio or super quick ratio. It is a variation of
quick ratio. This ratio establishes the relationship between absolute liquid assets
and current liabilities. Absolute liquid assets are cash in hand, bank balance and
readily marketable securities. Both the debtors and the bills receivable are exclude
from liquid assets as there is always an uncertainty with respect to their realization.
In other words, liquid assets minus debtors and bills receivable are absolute liquid
assets. The cash ratio is calculated as follows
Cash Ratio = Cash in hand & at bank + marketable securities/current
liabilities
Significance
This ratio gains much significance only when it is used in conjunction with the first
two ratios. The accepted norm for this ratio is 50% worth absolute liquid assets are
considered adequate to pay Rs.2 worth current liabilities in time as all the creditors
are not expected to demand cash at the same time and then cash may also be
realized from debtors and inventories. This test is a more rigorous measure of a
firm‟s liquidity position. This type of ratio is not widely used in practice.
FINANCIAL STATEMENT ANALYSIS KEL LTD
NEW HORIZON COLLEGE, BANGALORE Page 23
1.5 ACTIVITY OR TURNOVER RATIOS
1. Debtors Turnover Ratio
This ratio indicates the relationship between credit sales average debtors during the
year.
Debtors turnover ratio = Net credit sales/avg debtors + avg B/S
When calculating this ratio, provision for bad and doubtful debt is not deducted
from the debtors, so that it may not give a false impression that debtors are
collected
Quickly.
Significance:
This ratio indicates the speed with which amount is collected from debtors. The
higher the ratio is better it is since it indicates that amount from debtors is being
collected more quickly. The more quickly the debtors pay the less the risk from
bad debts and so the lower the expenses of collection and increase in the liquidity
of the firm. By comparing the debtor‟s turnover ratio of the current year with the
previous year, it may be assessed whether the sales policy of the management is
efficient or not.
2. Fixed Assets Turnover Ratio:
The fixed assets turnover ratio measures the efficiency with which the firm has
been using its fixed assets to generate sales. It is calculated by dividing the firm‟s
sales by its net fixed assets as follows:

FINANCIAL STATEMENT ANALYSIS KEL LTD
NEW HORIZON COLLEGE, BANGALORE Page 24
Fixed assets turnover ratio = Net sales/net fixed assets
Significance:
This ratio gives an ideal about adequate investment or over investment or under
investment in fixed assets. As a rule, over- investment in unprofitable fixed assets
should be avoided to the possible extent. Under-investment is also equally bad
affecting unfavorably the operating costs and consequently the profit. In
manufacturing concerns, the ratio is important and appropriate, since sales are
produced not only by use of working capital but also the capital invested in fixed
assets. An increase in this ratio is the indicator of efficiency in work performance
and a decrease in this ratio speaks of unwise and improper investment in fixed
assets.
3. Working capital turnover ratio:
This ratio shows the number of times the working capital results in sales. In other
words, this ratio indicates the efficiency or otherwise in the utilization of short
term funds in making sales. Working capital means the excess of current assets
over current liabilities. In fact, in the short run, it is the current assets and current
liabilities which pay a major role. A careful handling of the short term assets and
funds will means a reduction in the amount of capital employed, thereby improving
turnover. The following formula is used to measure this ratio:
Working capital turnover ratio = Net sales/working capital
Significance:
This ratio is used to assess the efficiency with which the working capital has been
utilized in a business. A higher working capital turnover indicates either the

FINANCIAL STATEMENT ANALYSIS KEL LTD
NEW HORIZON COLLEGE, BANGALORE Page 25
favorable turnover of inventories and receivables and/or the inadequate of net
working capital accompanied by low turnover of inventories and receivables. A
low ratio signifies either the excess of net working capital or slow turnover of
inventories and receivables or both. This ratio can at best be used by making of
comparative and trend analysis for different firms in the same industry and for
various periods.
1.6 LEVERAGE RATIOS OR SOLVENCY RATIOS
1. Debt to Equity Ratio
This ratio indicates the extentto which debt is covered by shareholder‟s funds. It
reflects the relative position of the equity holders and the lenders and indicates the
company‟s policy on the mix of capital funds. The debt to equity ratio is calculated
as follows:
Debt equity ratio = total debt/equity
Significance:
The importance of debt-equity ratio is very well reflected in the words of Weston
and Brigham which are reproduced here: “Debt-equity ratio indicates to what
extent the firm depends upon outsiders for its existence. For the creditors, this
provides a margin of safety. For the owners, it is useful to measure the extent to
which they can gain the benefits of maintaining control over the firm with a limited
investment”. The debt-equity ratio states unambiguously the amount of assets
provided by the outsiders for every one rupee of assets provided by the
shareholders of the company.

FINANCIAL STATEMENT ANALYSIS KEL LTD
NEW HORIZON COLLEGE, BANGALORE Page 26
2. Proprietary Ratio:
This ratio is also known as „Owners fund ratio‟ or „shareholders equity ratio‟ or
„Equity ratio‟ or „Net worth ratio‟. This ratio establishes the relationship between
the proprietors fund and total tangible assets. The formula for this ratio may be
written as follows.
Proprietary ratio = Shareholders fund/total assets
Significance:
This ratio represents the relationship of owners‟ funds to total tangible assets,
higher the ratio or the share of the shareholders in the total capital of the company
better is the long term solvency position of the company. This ratio is of
importance to the creditors who can ascertain the proportion of the shareholder‟s
funds in the total assets employed in the firm. A ratio below 50% may be alarming
for the creditors since they may have to lose heavily in the event of company‟s
liquidation on account of heavy losses.
3. Solvency ratio
Solvency ratio = Asset/Total Debt
The main objective of solvency ratio is to test or measure the solvency of a firm.
The term solvency means the ability of a firm to pay the outside liabilities. For the
solvency ratios standard is not fixed. Generally, higher the solvency ratio, stronger
is its financial position and vice versa. It indicates the degree of solvency of the
business.

FINANCIAL STATEMENT ANALYSIS KEL LTD
NEW HORIZON COLLEGE, BANGALORE Page 27
4. Fixed asset to net worth ratio
This is calculated for the purpose of knowing the extent of proprietor‟s funds
invested in fixed assets. There is no rule of thumb to interpret this ratio. But 0.60 to
0.65 (60 to 65%) is considered to be satisfactory in case of industrial undertakings.
Fixed asset to net worth ratio = Fixed assets/proprietor‟s
Significance
This ratio indicates the extent to which shareholders‟ funds are invested in the
fixed assets. Generally, the fixed assets should be purchased out of shareholders
fund. If the ratio is less than 1 it will mean that all fixed assets are purchased out of
proprietor‟s fund is invested in working capital.
PROFITABILITY RATIO
Net profit ratio
This is a widely used measure of performance and is comparable across companies
in similar industries. The fact that s business works on a very low margin need not
cause alarm because there are some sectors in the industry that on a basis of high
turnover and low margins, for example supermarkets and motorcar dealers. What is
more important in any trend is the margin and whether it compares well with
similar businesses.
Net profit ratio = net profit/net sales*100
Significance:
An objective of working net profit ratio is to determine the overall efficiency of the
business. Higher the profit ratio, the better business. The net profit ratio indicates

FINANCIAL STATEMENT ANALYSIS KEL LTD
NEW HORIZON COLLEGE, BANGALORE Page 28
the management‟s ability to earn sufficient profits on sales not only to cover all
revenue operating expenses of the business, the cost of borrowed funds and the
cost of merchant designer servicing, but also to have a sufficient margin to pay
reasonable compensation to shareholders in their contribution to the firm. A high
ratio ensures adequate return to shareholders as well as to enable a firm to with
stand adverse economic conditions. A low margin has an opposite implication.
1.7 REVIEW OF LITERATURE
Literature review was done by referring previous studies, articles and books to
know the areas of study and the gap or study not done so far. There are various
studies were conducted relating to operational performance of the company from
which most relevant literature were reviewed.
Furkany.kamdar’S review (2008): The analysis of financial statements is a
process of evaluating the relationship between component parts of financial
statements to obtain a better understanding of the firm‟s position and performance.
Ratio analysis has a major significance in analyzing the financial performance of a
company over a period of time. Decisions affecting product prices, per unit costs,
volume or efficiency have an impact on the profit margin or turnover ratios of a
company.
Befekadu B. Kereta’s review (2007) the paper examines the performance of
MFIS in relation to outreach and financial sustainability. It reviews literatures on
core performance indicators of MFIS. The literatures noted that MFIS could be
examined though three main polar: outreach to the poor, financial sustainability
and welfare impact. The welfare impact assessment is not covered in this paper due
to time and money limitations.

FINANCIAL STATEMENT ANALYSIS KEL LTD
NEW HORIZON COLLEGE, BANGALORE Page 29
J .I. Bogen (2004) has considered that performance analysis is the total of assets of
an enterprise which circulates from one form to another, for instance, from cash to
inventories to receivables to back into cash. Thus , the capital that circulates, equal
the assets of an enterprise, Hence, performance of the firm and current assets are
interchangeable terms.
Anderson Reddy p and SomaeswarRao k (1996) conduct a study in Hindusthan
cables Ltd. For the period of 1989-1990, they did the detailed study on the
company on the basis of ratio analysis. The study recommended for efficient
utilization of current assets.
The International Accounting Standards (IFRS, 2006) indicates the facts that
liquidity refers to the available cash for the near future, after taking into account
the financial obligations corresponding to that period. Liquidity risk consist in the
probability that the organization should not be able to make its payments to
creditors, as a result of the changes in the proportion of long term credits and short
term credits and the correlation with the structure of organization‟s liabilities.
Studying the management working capital in Colgative Palmolive (India) Ltd Mr.
Debasishsuri (1997) attempted to assess the efficiency of working capital
management in terms of working capital ratio, quick ratio, ratio of current asset to
total sales, and composition of working capital. The study recommended for
special attention to the management of inventories which constituted largest part of
the current asset.
A study conducted by Mr.Kuldeepgoyal (CMD) BSNL revealed that how India is
one of the top countries to set up a telecommunication Centre and how all the eyes
of the world have been on India for the same. The study gave me idea about the
recent trends in Indian telecommunication.

FINANCIAL STATEMENT ANALYSIS KEL LTD
NEW HORIZON COLLEGE, BANGALORE Page 30
Weston and Brigham (1972) further extended the second proposition suggested
by walker by dividing debt into long-term debt and short-term debt. They
suggested that short-term debt should be used in place of long-term debt whenever
their use would lower the average cost of capital to the firm. They suggested that a
business would hold short-term marketable securities only if there is excess fund
after meeting short term debt obligations. They further suggest that current asset
holding should be expended to the point where marginal returns in these assets
would just equal the cost of capital required finance such increase.
Dr. HamadouBoubaca has considered that the financial analysis is objective if
this study is to taken into account the organizational characteristics that bind the
parent banks and their subsidiary companies to explain the financial performance
of banks foreign subsidiaries. To this aim we empirically study the average data
(from 2001 to Z005) of a sample of 123 bank subsidiary companies (with or
without majority ownership). The result shows that the percentage of the capital
held by the parent banks, an indicator of its capacity to influence the strategy of
subsidiaries, is not without consequence on their performance.
Kennedy and Muller(1999), has explained that “ The analysis and interpretation
of financial statements are an attempt to determine the significance and meaning of
financial statements data so that the forecast may be made of the prospects for
future earnings, ability to pay interest and debt maturities ( both current and long
term) and profitability and sound dividend policy.”
Jae K. Shim & Joel G. Siegel (1999), had explained that the financial statement of
an enterprise present the raw data of its assets, liabilities and equities in the balance
sheet and its revenue and expenses in the income statement. Without subjecting
these to data analysis, many fallacious conclusions might be drawn concerning the

FINANCIAL STATEMENT ANALYSIS KEL LTD
NEW HORIZON COLLEGE, BANGALORE Page 31
financial condition of the enterprise. Financial statement analysis is undertaken by
creditors, investors and other financial statement users in order to determine the
credit worthiness and earning potential of an entity.
Elizabeth Duncan and Elliot (2004), had stated that the paper in the title of
efficiency, customer service and financing performance among Australian financial
institutions showed that all financial performance measures as interest margin,
return on assets, and capital adequacy are positively correlated with customer
service quality scores.
Jonas Elmerraji (2005) tries to say that ratios can be an invaluable tool for
making an investment decision. Even, so many new investors would rather leave
their decisions to fate than try to deal with the intimidation of financial ratios. The
truth is that ratios aren‟t that intimidating even if you don‟t have any degree in
business or finance. Using ratios to make informed decisions about an investment
makes a lot sense, once you know how use them.

FINANCIAL STATEMENT ANALYSIS KEL LTD
NEW HORIZON COLLEGE, BANGALORE Page 32
CHAPTER 2
COMPANY AND INDUSTRY PROFILE

FINANCIAL STATEMENT ANALYSIS KEL LTD
NEW HORIZON COLLEGE, BANGALORE Page 33
CHAPTER – 2
INDUSTRIAL & COMPANY PROFILE
2.1 INDUSTRY PROFILE
Heavy electrical industry encompasses important industry sectors including power
generation, transmission, and distribution equipment‟s. This also covers turbo
generators, boilers, turbines, transformers, switch gears and relays. This
performance of the industry is closely linked to the power programmer of the
country. The Government of India has an ambitious mission of „power for All
2012‟ as per working group on the power for 11thplan, a capacity addition of
72000MW is required.To reach wheel power, an expansion of the regional
transmission network and inter regional capacity to transmit power would be
essential. This will stimulate substantially demand for heavy electrical
equipment‟s. There is a strong manufacture base for the manufacture of heavy
electrical equipment in the country. The technology available in India is almost at
par with that in the international market barring few areas of the high voltage lines.
However, items like CRGO Steel and amorphous cores for low loss transformers
are being important.
The present buoyancy in India Economy would create demand for the electrical
product through industrial growth and general economic development. The power
sector reforms will create large business for power sector equipment manufacturers
and service providers. In the current favorable scenario, the electrical industry can
certainly look forward to growth.
TRANSFORMERS
A transformeris a voltage changer. The health of transformer industry depends
largely on the power generation and transmission sector. The major user of this

FINANCIAL STATEMENT ANALYSIS KEL LTD
NEW HORIZON COLLEGE, BANGALORE Page 34
Industry is the State Electrical Boards and Industries. The transformer industry in
India has developed for over 50yrs and has a well matured technology base. It has
the technology to manufacture wide range of power transformers, distribution
transformers and special transformers for welding are also being developed to meet
international requirement. The export and import figure for the year 2007 were Rs
2923 crores respectively.
Transformer industry is divided into distribution, power and other type of
transformers. The demand for transformers comprises of the new demand as well
as replacement demand. About 95% of transformers used in India power network
are of indigenous make. New demand is depend on the new power generation
capacities added. Currently, India has an installed capacity of approximately
115000 MW. As per the planning estimates, the installed capacity should be
increased to 2000MW by 2012, majority of which is to be installed within next 3
years. The replacement demand depends on the life of the transformer and existing
capacity in the economy. At the end of the sixth five-year plan (1980-1985) a total
of 3, 37,584 MVA of transformer capacity was added. Since these transformers life
exceeds 20 yrs., they are due for replacement.
Also Indian players in the engineering segment, foraying into turnkey projects
overseas, are further adding to the demand for transformers. The demand is
expected to experience double digit growth over the next few years.
On the other hand the production numbers indicate a death in supply. Though on a
lower base the supply has grown at a rapid rate over a longer period of time, it
seems difficult to match the rate of growth in demand for the year ended April
2006, production of distribution transformers was 65,131,000KVA and 256,585
other transformers were produced. In light of strong demand and stringent supply,

FINANCIAL STATEMENT ANALYSIS KEL LTD
NEW HORIZON COLLEGE, BANGALORE Page 35
the transformer manufactures are expected to enjoy strong order book along with
firm margins. The global price hike in transformer raw materials such as copper,
aluminum, and oil caused transformer prices to increase in India. Also, a shortage
of cold-rolled, grain- oriented steel is further escalating the price of this essential
transformer core material. With growing demand and price both rising, Indian
manufacturers are finding it difficult to maintain margins in the long term thereby
transferring the burden of increased costs to the end users.
The regulatory structure of the power of the power sector has faced some
uncertainties in India due to the reluctance and failure of certain states to put the
regulations into practice. Furthermore, utilities are confronting financial problems
because of high transformation & distribution loses, thus increasing their debt.
Despite these setbacks, the power sector in India is likely to remain buoyant,
according. Reforms in the sector and the enlargement of the power distribution
network under India‟s Accelerated Power Development and Reforms Programme
is driving the growth and strengthening of sub transmission lines. In addition, the
increase in transmission grid reliability will result in heightened demand for power
transformers.
MARKET PLAYERS
The transformer market in India is unorganized players. The key organized players
in the segment include ABB, Bharat Biglee, BHEL, Crompton Greaves, EMCO,
Areva T&D, Indo Tech transformers and Volt Transformers.
The product range offered starts below 100 KVA capacity and spans beyond
10,000 KVA>

FINANCIAL STATEMENT ANALYSIS KEL LTD
NEW HORIZON COLLEGE, BANGALORE Page 36
2.2 COMPANY PROFILE
The Kerala Electrical and Allied Engineering Company Limited (KEL) were
established in 1964 in the state of Kerala, India. It is fully owned by the state
government. The corporate office of the KEL is situated at panampilly
Nagar,Cochin. The company has a wide range of network of regional officers and
services centers located in most of the major cities and business centers in India for
effective marketing and to provide efficient after sales service for the product. The
major regional offices and service centers are at New Delhi, Mumbai, Chennai,
Bangalore, Cochin and Thiruvananthapuram.
The company has progressively expanded its range of manufactured goods and
services over the years and has strategically broadened its customer base services
over the years and has strategically broadened its customer base on a global level.
KEL offers quality of products and services through its various manufacturing
units and services divisions, with a manpower of over 1200 which includes over
250 highly qualified and well trained professional engineers.
The primary interest of a company is in the field of electrical and machinery
encompassing areas such as generation transmission, distribution and utilization of
electrical power. In the generating equipment side, KEL is a leading manufacturer
of inductor type brushless alternators used for train lighting and air conditioning. In
the field of transmission and distribution of electrical power, the company‟s efforts
have been directed in the manufacture of transformers, switchgear, transmission
line towers, substations equipment and accessories. KEL is a leading manufacturer
and supplier of these items to various State Electricity Boards in India. The KEL is
also experienced and competent in the erection, commissioning and maintenance
of electrical power transmission and distribution network which includes H.T.L.T

FINANCIAL STATEMENT ANALYSIS KEL LTD
NEW HORIZON COLLEGE, BANGALORE Page 37
substations, both indoor and outdoor type, package/utilized substations overhead
transmission lines and pylons, booster stations, street lights etc. The company has
adopted modern technology in association with modern reputed overseas
manufactures, who are in the field. The technical overseas manufactures, who are
experts in the field. The technical collaboration with EVR of FRANCE (now
amalgamated with ALSTHOM ATLANTIQUE) for the manufactures of inductor
of HRC Fuses and MOTEURS LERROY SOMER of FRANCE for the
manufacturing units located in various districts of the state.
a. The inductor type brushless alternators , which is being manufactured at Kundara
Plant in Kollam Districts has been widely acclaimed and accepted by many railway
systems around the world. More than 20000 such alternators in operations which
the Indian Railway alone.
b. The second plant start began operations in 1968 at Mamala in Ernakulum District
with the manufacture of distribution transformers – up to 3000 KVA, 33KV class
with an annual production capacity of 600000KVA.
c. The third plant at olavakkot in Palakkad district, which was formely known as
MENCOS, was taken over by KEL in 1977; it provides HRC Fuse and other L.T.
switchgear items.
d. The fourth plant was commissioned at Kasargod District, in the year 1990 for the
manufacture of general- purpose brushless a.c. generators; KEL has consolidated
its position as a leading manufacturer of electrical equipment in India. This
company aided design center the latest VNC machines amongst other hi- tech
manufacturing and testing facilities.
The KEL has a well-organized Research Development Wing. Its inception in 1990
at corporate and R&D cell in Cochin. All R&D activities are coordinated from

FINANCIAL STATEMENT ANALYSIS KEL LTD
NEW HORIZON COLLEGE, BANGALORE Page 38
corporate office, Cochin. The R&D wing of KEL has to its credit many special
application generators and other products that were indigenously designed and
developed. Ground power Units for Avro and Dornier Aircrafts 400Hz alternators
of various capacities, brushless alternators are some of achievements of the
company‟s R&D wing.
The company‟s products are marketed through an extensive network of marketing
offices located in major cities. These offices provide all supports services to the
sales and marketing team to guarantee complete customer satisfaction.
COMPANY PROFILE
NAME KERALA ELECTRICALS &
ALLIED ENGINEERING LTD
ESTABLISHED YEAR 1968
ADDRESS MAMALA P.O, COCHIN 682304
TOTAL LAND 13.10 ACRES
UTILIZED LAND 13.10 ACRES
NUMBER OF EMPLOYEES 294
FIRM TYPE PUBLIC LTD
PRODUCTS DISTRIBUTION
TRANSFORMERS& HEAVY
STRUCTURAL ITEMS
NATURE OF BUSINESS MANUFACTURER
CATEGORY ELECTRICAL ENGINEERING
KEY POINT MULTIFARIOUS ACTIVITIES
INDUSTRY FOCUS ENERGY AGENTS

FINANCIAL STATEMENT ANALYSIS KEL LTD
NEW HORIZON COLLEGE, BANGALORE Page 39
LEVEL OF EXPAND INTERNATIONAL
AREA ALL OVER INDIA & ABROAD
HEAD OFFICE 7th
FLOOR, HOUSING BOARD
OFFICE COMPLEX,
PANAMPALLY NAGAR,COCHIN-
682036
VISION
Manufacture products to the requirements and to achieve targeted production.
Continues development in the field of experience to be a market leader
MISSION
Ensure prompt serving and to achieve continuous improvement.
Applying state-of-art technology, process and innovative solutions
Building long term relationship with stakeholders in an environment of fair
business ethics and values.
Creating value through sustainable and profitable growth.
Leveraging productivity through highly motivated and empowered team.
OBJECTIVES
The KEL which was formed in the year 1947 has the following objectives which
are as follows:
To carry on the business of electrical and structural engineering.

FINANCIAL STATEMENT ANALYSIS KEL LTD
NEW HORIZON COLLEGE, BANGALORE Page 40
To manufacture engineering equipment and fittings, electrical and plastic
goods and goods required for military and sports.
To provide welfare for the company employees.
To enter into foreign collaboration.
To expand business to all others states in India
OWNERSHIP PATTERN
Kerala Electrical and Allied Engineering Co.Ltd is a public sector undertaking
which is fully owned by the government of kerala. It was incorporated on 5th june,
1964. The administrative department of KEL is the industries department of kerala
government. 100% equity is with government of kerala. The main source of fund
for the company is government. Other than Government, they had taken loans from
State Bank of Travancore (SBT), State Bank of India (SBI), State Bank of Mysore
(SBM), and Federal Bank. These banks are granting loans to government on the
basis to shares at time of new capital. The company had taken working capital
loans from industrial finance corporation of India (IFCI) and Industrial
Development Board of India (IBDI). The government will allow fund for the
company from the KIRFB (Kerala Industrial and Revitalization Fund Board).
HISTORY AND GROWTH
The KERALA ELECTRICAL AND ALLIED ENGINEERING COMPANY
LIMITED (KEL) was established in 1968 in the state of Kerala, India. It is fully
owned by the Government of Kerala engaged in manufacturing electrical
engineering goods. Kerala Electric and Allied Engineering Company Limited have

FINANCIAL STATEMENT ANALYSIS KEL LTD
NEW HORIZON COLLEGE, BANGALORE Page 41
corporate office in Cochin which was properly situated at Panampally Nagar,
Cochin. It has four manufacturing units in various parts of state. The company has
various office which can be situated at major cities of the India to improve
marketing activities and to provide smooth after service to the company. Some of
the major centers among them are at New Delhi, Mumbai, Chennai, Bangalore,
Hyderabad, Cochin and Trivandrum. KEL is considered as the one of the biggest
public sectors in the state. The company has progressively expanded its range of
manufactured goods and service over the year and has strategically broadened its
customer base on a global level. KEL offers good quality products and service to
the customers, with a man power of over 1400 which included over 250
experienced and well qualified engineers.
The primary objective of company is generation, transmission, distribution and
utilization of electric power. KEL is a major producer and distributor of
transformer, switch gear, transmission line towers, substation equipment and
accessories to various State Electricity Boards of India.
KEL entered in multi-activities for broadening their wider domestic and overseas
market. The company has four manufacturing units located in various districts like
Kundara, Mamala, Olavakkot, and Kasargod has compliance with an ISO 9001-
2000 standards.
The KEL maintain electrical power transmission and distribution networks which
includes H.T, L.T, substations, both indoor and outdoor type, packages/unitized
substations, overhead transmission lines and Pylons, booster stations and street
light etc. KEL has acquired advanced technology with the support of various
expert manufactures from abroad like EVR of France for producing inductor type
brushless alternators, UNELEC of France for producing HRC fuses and

FINANCIAL STATEMENT ANALYSIS KEL LTD
NEW HORIZON COLLEGE, BANGALORE Page 42
MOTEURS LEROY SOMER of France for producing air conditioner generators
etc.
PRODUCT PROFILE
The company has majorly operated through two divisions, which are
a) Transformer Division and
b) Structural Division
A. TRANSFORMER DIVISION
The Transformer division went on stream in 1968. It has facilities for producing
distribution transformer and medium power transformers up to 1600KVA 33KVA
with annual production capacity of 600000KVA. The transformers of 100KV,
160KV and 500KV have more demand. Major products ranges of this division are:
1) Oil filled circuit distribution transformer
2) Oil filled on load tap changer (OLTC). Transformers with automatic voltage
regulator (AVR) and remote tap changing cubicable (RTCC)
3) Oil filled autotransformer.
4) Oil filled amorphous core transformer.
5) Dry type transformer (resin impregnated)
6) Unitized substations with oil filled dry type transformer.
Even though the division has capacity to manufactures transformers of rating up to
3000KVA classes, the majority of transformers manufactured in the range
100KVA-160KVA.

FINANCIAL STATEMENT ANALYSIS KEL LTD
NEW HORIZON COLLEGE, BANGALORE Page 43
B.STRUCTURAL DIVISION
The structural fabrication shop was setup in 1967. This division can have an
installed capacity of 1200 per annum. The division has a team of professional
engineers, Technicians & other employee with adequate experience for Performing
Designing Fabrication & Erection. There is a Centralized Planning & Quality
Assurance Department. This division will be able to earn good will of many states
and satisfied execution of number of projects involving Hydro mechanical
equipment. In structural division number of machines is employed one team will
work on each machine. Each team include three members, they are under the
control of leader. A team involves one welder, one fitter, and one unskilled worker.
These machines and its products are given:
1. Gear Hobbling Machines - used for gear cutting
2. Milling Machine - Slots, plane milling etc used for cutting
3. Laith machine - for forming thread
4. Vending Machine - Used for 12 mm pipe bending, which is used
in transformer tank
5. Gillette Machine - for cutting the palter up to 12mm
6. Press breaker Machine - Plates bending 90 degree, the capacity up to
12mm
7. Drilling Machine - used for drilling the plates
8. Mg Welding - used for welding
The structural divisions holds one manager, production Engineer, foreman and
charge.

FINANCIAL STATEMENT ANALYSIS KEL LTD
NEW HORIZON COLLEGE, BANGALORE Page 44
MARKET
Their products are marketed by an extensive network of marketing officers located
in major cities like
New Delhi,Trivandrum, Cochin, Hyderabad, Kolkatta. These officers provide all
supportive services to the sales and marketing team to guarantee complete
customer satisfaction.
TECHNOLOGY
It has a company in turn with modern technology associated with reputed overseas
manufactres who are expert in their respective fields. Technical collaboration are
with EVR of France for the manufactures of HRc fuses and MOTEURS LEROY
SOMER of France for the manufactures of brushless A.C generation.
TRADE UNIONS
KEL has four trade unions and have major rule in existing promotion policy of the
company. The existing promotions policy applicable to the work men of the
mamala unit was signed between the management and the trade union such as:
1. KEL employee congress (INTUC)
2. KEL employee union (CITUC)
3. KEL employee organization (STU)
4. KEL workers union
FINANCIAL STATEMENT ANALYSIS KEL LTD
NEW HORIZON COLLEGE, BANGALORE Page 45
MAJOR CUSTOMERS
KSEB
INDIAN RAILWAYS
BHEL
CROMPTON GREAVES LTD
BEML
R & DE (engineers) PUNE
BDL HYDERABAD (HMS)
COMPETITORS
The main competitors of KEL in the market are:
1. Kaviaka transformers:Karnataka Vidyuth Karkhane (KaViKa) is
Government of Karnataka undertaking
2. Indo Tech Transformers: This is a Chennai based transformer
manufacturing company, who is one among the major competitors of
KEL. It is a private limited company.
3. Rohini transformers: It is also a private firm.
4. Kirloskar Bangalore
5. Crompton greaves Chennai
6. Intrans ernakulam
7. TELK angamaly
FINANCIAL STATEMENT ANALYSIS KEL LTD
NEW HORIZON COLLEGE, BANGALORE Page 46
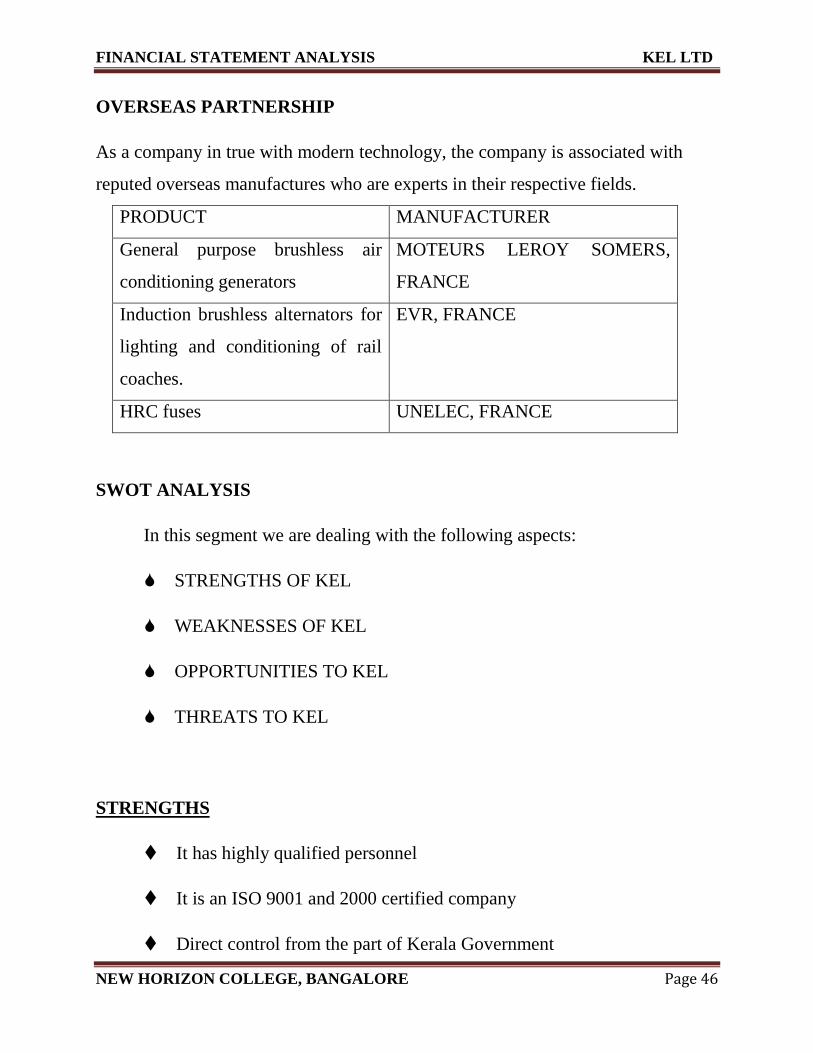
OVERSEAS PARTNERSHIP
As a company in true with modern technology, the company is associated with
reputed overseas manufactures who are experts in their respective fields.
PRODUCT MANUFACTURER
General purpose brushless air
conditioning generators
MOTEURS LEROY SOMERS,
FRANCE
Induction brushless alternators for
lighting and conditioning of rail
coaches.
EVR, FRANCE
HRC fuses UNELEC, FRANCE
SWOT ANALYSIS
In this segment we are dealing with the following aspects:
STRENGTHS OF KEL
WEAKNESSES OF KEL
OPPORTUNITIES TO KEL
THREATS TO KEL
STRENGTHS
It has highly qualified personnel
It is an ISO 9001 and 2000 certified company
Direct control from the part of Kerala Government

FINANCIAL STATEMENT ANALYSIS KEL LTD
NEW HORIZON COLLEGE, BANGALORE Page 47
KEL provide inevitable and valuable service to society.
The Company manufactures good product without any delays.
It maintain good industrial relations.
It has good infrastructural facilities
It ensures quality of product
Following a dynamic and democratic management style within the firm.
WEAKNESSES
Modern technology and machines are not implemented
Adequate technology of material processing is not exercised.
In adequate control over raw materials result in wastage
Absenteeism because of heavy workload
Delay in decision making
OPPURTUNITIES
It can adopt new technology in production
It can adopt new method of accounting
It can buy quality materials and maintained an effective material
control.
Globalization enables the company to find new markets foreign country.
Due to excess use of electricity, there is always an opportunity for
expanding business.
FINANCIAL STATEMENT ANALYSIS KEL LTD
NEW HORIZON COLLEGE, BANGALORE Page 48
Company can sustain existing monopoly environment due to less
competitor in the market.
THREATS
As due to lack of acknowledgement and decision there is resist in the
improvement and adaption of new technology for their products
Possibility of new foreign investment in this industry can affect the
market share of the firm.
Labor turnover
Hike in transportation charges
Lack of skilled work force
Absenteeism because of workload.
FUTURE EXPANSION
1. Development of dual frequency alternators for Army.
2. Development of under slung SLR power for Indian Railway
3. Development of water cooled alternators for India navy
4. Development of compact alternators of reduces cost.

FINANCIAL STATEMENT ANALYSIS KEL LTD
NEW HORIZON COLLEGE, BANGALORE Page 49
CHAPTER 3
RESEARCH DESIGN

FINANCIAL STATEMENT ANALYSIS KEL LTD
NEW HORIZON COLLEGE, BANGALORE Page 50
CHAPTER – 3
RESEARCH DESIGN
3.1 FINANCIAL STATEMENT ANALYSIS ON KEL LTD
3.2 SCOPE OF THE STUDY
The scope of the project is fully dependent upon the objective of the project.
The study can be helpful to the company for conducting any further
research.
The study is also helpful in finding out the respondent‟s opinion toward the
certain attributes.
It is also helps in finding out the reach and effectiveness of the financial system
3.3 OBJECTIVES OF FINANCIAL STATEMENTS ANALYSIS
The primary objective of financial statement analysis is to understand and diagnose
the information contained in the financial statement with a view to judge the
profitability and financial soundness of firm, and to make a forecast about the
future prospects of the firm. However the objectives of financial statement analysis
are as follows:
1. To assess the earning capacity or profitability of the firm
2. To make inter firm analysis and comparison
3. To assess the operational efficiency and managerial effectiveness.

FINANCIAL STATEMENT ANALYSIS KEL LTD
NEW HORIZON COLLEGE, BANGALORE Page 51
4. To assess the term as well as long solvency of the firm
5. To help in decision making and control of the firm
These are some of the important objective for the analysis of financial statement
for a limited company. Thus the analysis of financial statement help the firm in
knowing their current position and as well as to position in the future
3.4 RESEARCH METHODOLOGY
Research methodology or research design is a comprehensive master plan
of the research study to the undertaken giving a general statement of the
methods to be used. Research methodology is the systematic way to solve the
research problems.
METHODS OF DATA COLLECTION
Primary data: Primary data are those collected by the researcher himself
and thus are original in character.
Secondary data: The study is based mainly on the secondary data. It is
taken from published source of the company like annual financial statements
and other financial official records magazines etc.
Secondary data has been collected with the help of company prospects,
brochures, annual reports, journals, magazines and internet.
DATA COLLECTION
The whole study mentioned above was based on secondary data of KEL.
Secondary data are those data which are published by the company. These data has

FINANCIAL STATEMENT ANALYSIS KEL LTD
NEW HORIZON COLLEGE, BANGALORE Page 52
a nature of secondary style that‟s why it is called as secondary data. The following
secondary data were used for the analysis.
ANNUAL REPORT OF KEL
BALANCESHEET OF KEL
PROFIT AND LOSS OF KEL
3.4 COMPARATIVE STATEMENT
Comparative study of financial statement is the comparison of the financial
statement of the business with the previous year‟s financial statements and with the
performance of other competitive enterprises, so that weakness may be identified
and remedial measures applied. The comparative statement may show the
following:
Absolute figures
Changes in absolute figures
Absolute data terms of percentages
Increase of decrease in terms of percentage
Comparative statements can be prepared for both types of financial statements i.e.,
Balance sheet as well as profit and loss account. The comparative profits and loss
account will present a review of operating activities of the business. The
comparative balance shows the effect of operation on the assets and liabilities that
change in the financial position during the period under consideration.
Comparative analysis is the study of trend of the same items and computed items
into or more financial statements of the same business enterprise on different dates.
FINANCIAL STATEMENT ANALYSIS KEL LTD
NEW HORIZON COLLEGE, BANGALORE Page 53
The presentation of comparative financial statements, in annual and other reports,
enhances the usefulness of such reports and brings out more clearly the nature and
trends of current changes affecting the enterprise. While the single balance sheet
represents balances of accounts drawn at the end of an accounting period, the
comparative balance sheet represents not early the balance of accounts drawn on
two different dates, but also the extent of their increase or decrease between these
two dates. The single balance sheet focuses on the changes that have taken place in
one accounting period. The changes are the direct outcome of operational
activities, conversion of assets, liability and capital form into others as well as
various interactions among assets, liability and capital. The two comparative
statements are:
Balance sheet
Income statement.
3.4 RATIO ANALYSIS
Ratio analysis is a widely use tool of financial analysis. It can be used to compare
the risk and return relationship of firms of different sizes. It is defined as the
systematic use of ratio to interpret the financial statements so that the strengths and
weakness of a firm as well as its historical performance and current financial
condition can be determined. The term ratio refers to the numerical or quantitative
relationship between two items and variables. These ratios are expressed as
IV. Percentage
V. Fraction
VI. Proportion of numbers

FINANCIAL STATEMENT ANALYSIS KEL LTD
NEW HORIZON COLLEGE, BANGALORE Page 54
These alternative methods of expressing items which are related to each other are,
for purpose of financial analysis, referred to as ratio analysis. It should be noted
that computing the ratio does not add any information not already inherent in the
above figures of profits and sales. What the ratio does is that they reveal the
relationship in a more meaningful way so as to enable equity investors;
management and lenders make better investment and credit decision.
3.5 LIQUITDITY RATIOS
It refers to the ability of the firm to meet its current liabilities. The liquidity ratio,
therefore, are also called solvency ratio. These ratios are used to assess the short-
term financial position of the concern. They indicate the firm‟s ability to meet its
current obligation out of current resources. In the word of Saloman j. Flink,
“Liquidity is the ability of the firms to meet its current obligation as they fall due”.
Liquidity ratio includes three ratios:-
CURRENT RATIO
QUICK RATIO OR ACID TEST RATIO
ABSOLUTE LIQUIDITY RATIO
A) CURRENT RATIO
The current ratio expresses the relationship between the firm‟s current assets and
its current liabilities. Current assets normally include cash, marketable securities,
accounts receivable and inventories. Current liabilities consist of accounts payable,
short term notes payable, short-term loans, current maturities of long term debt,
accrued income taxes and other accrued expenses (wages).

FINANCIAL STATEMENT ANALYSIS KEL LTD
NEW HORIZON COLLEGE, BANGALORE Page 55
Current ratio = current assets/ current liabilities
Significance:
It is generally accepted that current assets should be 2 times the current liabilities.
In a sound business, a current ratio of 2:1 is considered an ideal one. If current
ratio is lower than 2:1, the short term solvency of the firm is considered doubtful
and it shows that the firm is not in a position to meet its current liabilities in times
and when they are due to mature. A higher current ratio is considered to be an
indication that of the firm is liquid and can meet its short term liabilities on
maturity. Higher current ratio represents a cushion to short-term creditors, “the
higher the current ratio, the greater the margin of safety to the creditors”. The
biggest drawback o the current ratio is that it is susceptible to “Window dressing”.
This ratio can be improved by an equal decrease in both current assets and current
liability.
B) QUICK RATIO
Measures assets that are quickly converted into cash and they are compared
with current liabilities. This ratio realizes that some of current assets are not easily
convertible to cash e.g., inventories. The quick ratio, also referred to as acid ratio,
examines the ability of the business to cover its short-term obligations from its
“quick” assets only (i.e., it ignores stock).
The quick ratio is calculated as follows
Quick ratio = quick assets/current liabilities

FINANCIAL STATEMENT ANALYSIS KEL LTD
NEW HORIZON COLLEGE, BANGALORE Page 56
Significance
The standard liquid ratio is supposed to be 1:1 i.e., liquid assets should be equal to
current liabilities. If the ratio is higher, i.e., liquid assets are more than the current
liabilities, the short term financial position is supposed to be very sound. On the
other hand, if the ratio is slow, i.e., current liabilities are more than the liquid
assets, the short term financial position of the business shall be deemed to be
unsound.
C) CASH RATIO
This is also known as cash position ratio or super quick ratio. It is a variation of
quick ratio. This ratio establishes the relationship between absolute liquid assets
and current liabilities. Absolute liquid assets are cash in hand, bank balance and
readily marketable securities. Both the debtors and the bills receivable are exclude
from liquid assets as there is always an uncertainty with respect to their realization.
In other words, liquid assets minus debtors and bills receivable are absolute liquid
assets. The cash ratio is calculated as follows
Cash Ratio = Cash in hand & at bank + marketable securities/current
liabilities
Significance
This ratio gains much significance only when it is used in conjunction with the first
two ratios. The accepted norm for this ratio is 50% worth absolute liquid assets are
considered adequate to pay Rs.2 worth current liabilities in time as all the creditors
are not expected to demand cash at the same time and then cash may also be
realized from debtors and inventories. This test is a more rigorous measure of a
firm‟s liquidity position. This type of ratio is not widely used in practice.

FINANCIAL STATEMENT ANALYSIS KEL LTD
NEW HORIZON COLLEGE, BANGALORE Page 57
3.6 ACTIVITY OR TURNOVER RATIOS
Debtors Turnover Ratio
This ratio indicates the relationship between credit sales average debtors during the
year.
Debtors turnover ratio = Net credit sales/avg debtors + avg B/S
When calculating this ratio, provision for bad and doubtful debt is not deducted
from the debtors, so that it may not give a false impression that debtors are
collected Quickly.
Significance:
This ratio indicates the speed with which amount is collected from debtors. The
higher the ratio is better it is since it indicates that amount from debtors is being
collected more quickly. The more quickly the debtors pay the less the risk from
bad debts and so the lower the expenses of collection and increase in the liquidity
of the firm. By comparing the debtor‟s turnover ratio of the current year with the
previous year, it may be assessed whether the sales policy of the management is
efficient or not.
4. Fixed Assets Turnover Ratio:
The fixed assets turnover ratio measures the efficiency with which the firm has
been using its fixed assets to generate sales. It is calculated by dividing the firm‟s
sales by its net fixed assets as follows:
Fixed assets turnover ratio = Net sales/net fixed assets

FINANCIAL STATEMENT ANALYSIS KEL LTD
NEW HORIZON COLLEGE, BANGALORE Page 58
Significance:
This ratio gives an ideal about adequate investment or over investment or under
investment in fixed assets. As a rule, over- investment in unprofitable fixed assets
should be avoided to the possible extent. Under-investment is also equally bad
affecting unfavorably the operating costs and consequently the profit. In
manufacturing concerns, the ratio is important and appropriate, since sales are
produced not only by use of working capital but also the capital invested in fixed
assets. An increase in this ratio is the indicator of efficiency in work performance
and a decrease in this ratio speaks of unwise and improper investment in fixed
assets.
5. Working capital turnover ratio:
This ratio shows the number of times the working capital results in sales. In other
words, this ratio indicates the efficiency or otherwise in the utilization of short
term funds in making sales. Working capital means the excess of current assets
over current liabilities. In fact, in the short run, it is the current assets and current
liabilities which pay a major role. A careful handling of the short term assets and
funds will means a reduction in the amount of capital employed, thereby improving
turnover. The following formula is used to measure this ratio:
Working capital turnover ratio = Net sales/working capital
Significance:
This ratio is used to assess the efficiency with which the working capital has been
utilized in a business. A higher working capital turnover indicates either the
favorable turnover of inventories and receivables and/or the inadequate of net
FINANCIAL STATEMENT ANALYSIS KEL LTD
NEW HORIZON COLLEGE, BANGALORE Page 59
working capital accompanied by low turnover of inventories and receivables. A
low ratio signifies either the excess of net working capital or slow turnover of
inventories and receivables or both. This ratio can at best be used by making of
comparative and trend analysis for different firms in the same industry and for
various periods.
LEVERAGE RATIOS OR SOLVENCY RATIOS
5. Debt to Equity Ratio
This ratio indicates the extentto which debt is covered by shareholder‟s funds. It
reflects the relative position of the equity holders and the lenders and indicates the
company‟s policy on the mix of capital funds. The debt to equity ratio is calculated
as follows:
Debt equity ratio = total debt/equity
Significance:
The importance of debt-equity ratio is very well reflected in the words of Weston
and Brigham which are reproduced here: “Debt-equity ratio indicates to what
extent the firm depends upon outsiders for its existence. For the creditors, this
provides a margin of safety. For the owners, it is useful to measure the extent to
which they can gain the benefits of maintaining control over the firm with a limited
investment”. The debt-equity ratio states unambiguously the amount of assets
provided by the outsiders for every one rupee of assets provided by the
shareholders of the company.
6. Proprietary Ratio:

FINANCIAL STATEMENT ANALYSIS KEL LTD
NEW HORIZON COLLEGE, BANGALORE Page 60
This ratio is also known as „Owners fund ratio‟ or „shareholders equity ratio‟ or
„Equity ratio‟ or „Net worth ratio‟. This ratio establishes the relationship between
the proprietors fund and total tangible assets. The formula for this ratio may be
written as follows.
Proprietary ratio = Shareholders fund/total assets
Significance:
This ratio represents the relationship of owners‟ funds to total tangible assets,
higher the ratio or the share of the shareholders in the total capital of the company
better is the long term solvency position of the company. This ratio is of
importance to the creditors who can ascertain the proportion of the shareholder‟s
funds in the total assets employed in the firm. A ratio below 50% may be alarming
for the creditors since they may have to lose heavily in the event of company‟s
liquidation on account of heavy losses.
7. Solvency ratio
Solvency ratio = Asset/Total Debt
The main objective of solvency ratio is to test or measure the solvency of a firm.
The term solvency means the ability of a firm to pay the outside liabilities. For the
solvency ratios standard is not fixed. Generally, higher the solvency ratio, stronger
is its financial position and vice versa. It indicates the degree of solvency of the
business.
8. Fixed asset to net worth ratio
This is calculated for the purpose of knowing the extent of proprietor‟s funds
invested in fixed assets. There is no rule of thumb to interpret this ratio. But 0.60 to
0.65 (60 to 65%) is considered to be satisfactory in case of industrial undertakings.

FINANCIAL STATEMENT ANALYSIS KEL LTD
NEW HORIZON COLLEGE, BANGALORE Page 61
Fixed asset to net worth ratio = Fixed assets/proprietor‟s
Significance
This ratio indicates the extent to which shareholders‟ funds are invested in the
fixed assets. Generally, the fixed assets should be purchased out of shareholders
fund. If the ratio is less than 1 it will mean that all fixed assets are purchased out of
proprietor‟s fund is invested in working capital.
PROFITABILITY RATIO
Net profit ratio
This is a widely used measure of performance and is comparable across companies
in similar industries. The fact that s business works on a very low margin need not
cause alarm because there are some sectors in the industry that on a basis of high
turnover and low margins, for example supermarkets and motorcar dealers. What is
more important in any trend is the margin and whether it compares well with
similar businesses.
Net profit ratio = net profit/net sales*100
Significance:
An objective of working net profit ratio is to determine the overall efficiency of the
business. Higher the profit ratio, the better business. The net profit ratio indicates
the management‟s ability to earn sufficient profits on sales not only to cover all
revenue operating expenses of the business, the cost of borrowed funds and the
cost of merchant designer servicing, but also to have a sufficient margin to pay
reasonable compensation to shareholders in their contribution to the firm. A high
ratio ensures adequate return to shareholders as well as to enable a firm to with
stand adverse economic conditions. A low margin has an opposite implication.
FINANCIAL STATEMENT ANALYSIS KEL LTD
NEW HORIZON COLLEGE, BANGALORE Page 62
3.5 LIMITATIONS OF THE STUDY
The study was conducted mainly on the basis of published secondary data, so
the effectiveness of the study depends on the correctness of information provided
in the data.
The study covers only for a limited period of 5 years
Time available for the study was limited.
Inter firm comparison of the data was not possible due to the non- availability
of the data.
3.6 CHAPTER SCHEME
CHAPTER -1: Introduction to the study
CHAPTER -2: company and industry profile
CHAPTER -3: Research Design
CHAPTER -4: Data Analysis and Interpretation
CHAPTER -5: Findings &Suggestions ,Conclusion
Bibliography
Annexure

FINANCIAL STATEMENT ANALYSIS KEL LTD
NEW HORIZON COLLEGE, BANGALORE Page 63
CHAPTER 4
DATA ANALYSIS AND INTERPRETATION

FINANCIAL STATEMENT ANALYSIS KEL LTD
NEW HORIZON COLLEGE, BANGALORE Page 64
CHAPTER-4
DATA ANALYSIS AND INTERPRETATION
1) RATIO ANALYSIS
A)RATIOS
1. LIQUIDITY RATIO
A) CURRENT RATIO
Table 4.1 Table showing Current Ratio
Year
Current Assets
Current Liability
Current ratio
2009-2010 632667872 425018025 1.48
2010-2011 682525117 4626542840 1.47
2011-2012 899987886 636680194 1.41
2012-2013 642980970 732498707 0.87
2013-2014 866743883 905252247 0.95

FINANCIAL STATEMENT ANALYSIS KEL LTD
NEW HORIZON COLLEGE, BANGALORE Page 65
Chart 4.1 Current Ratio of KEL from 2009-2014
INTERPRETATION
The idle current ratio of a firm is 2:1. The company is following a good current
ratio of 1.48 in the year 2008-2009, but after the current ratio of the firm is falling
at a drastic rate. It shows the poor management of working capital by the firm. In
the financial year 2013-2014 the company has made a slight improvement that is
from 0.87 to 0.95. This is good for the future.
0
0.2
0.4
0.6
0.8
1
1.2
1.4
1.6
2009-2010 2010-2011 2011-2012 2012-2013 2013-2014
Current Ratio

FINANCIAL STATEMENT ANALYSIS KEL LTD
NEW HORIZON COLLEGE, BANGALORE Page 66
B)QUICK RATIO
Table 4.2 Table showing quick Ratio
Year
Quick asset
Current Liabilities
2009-2010 435291318 425018025 1.02
2010-2011 498651099 462642840 1.07
2011-2012 704776653 636680194 1.10
2012-2013 458293986 732498707 0.62
2013-2014 678753862 905252247 0.74
Chart 4.2 Quick Ratio of KEL from 2009-2014
0
0.2
0.4
0.6
0.8
1
1.2
2009-2010 2010-2011 2011-2012 2012-2013 2013-2014
Quick Ratio

FINANCIAL STATEMENT ANALYSIS KEL LTD
NEW HORIZON COLLEGE, BANGALORE Page 67
INTERPRETATIONS
Quick ratio shows the relationship between quick asset and liabilities. The
standard quick ratio for a firm is 1:1. The KEL has a satisfactory quick ratio and
highest in the year 2011-2012. But it is reduced drastically in the year 2011-2012.
An improvement is made by the company in year 2013-2014
C) ABSOLUTE LIQUID RATIO
Table 4.3 Table showing Absolute Liquid Ratio
Year
Absolute Liquid
asset
Current Liability
Cash ratio
2009-2010 15303332 425018025 0.036006312
2010-2011 13919504 462642840 0.030086933
2011-2012 16069425 636680194 0.025239398
2012-2013 17561604 732498707 0.023974928
2013-2014 14817796 905252247 0.016368693

FINANCIAL STATEMENT ANALYSIS KEL LTD
NEW HORIZON COLLEGE, BANGALORE Page 68
Chart 4.3 Absolute Liquid Ratio of KEL from 2009-2014
INTERPRETATION
Absolute liquid ratio shows the relationship between absolute liquid assets and
current liabilities. The standard quick ratio is 1:2. The absolute liquid ratio of KEL
in 2013-2014 is the highest. The lowest rate is during the year 2012-2013
0
0.005
0.01
0.015
0.02
0.025
0.03
0.035
0.04
2009-2010 2010-2011 2011-2012 2012-2013 2013-2014
Absolute Liquid Ratio

FINANCIAL STATEMENT ANALYSIS KEL LTD
NEW HORIZON COLLEGE, BANGALORE Page 69
2. PROFITABILITY RATIO
A) NET PROFIT RATIO
Table 4.4 Table showing Net profit Ratio
Year
Net profit / loss
Net Sales
Net profit ratio
2009-2010 -9781150 934451927 -1.046725863
2010-2011 -20735794 913913181 -2.268901951
2011-2012 -15081345 990745407 -1.522222045
2012-2013 -62828880 729296232 -8.615001318
2013-2014 -64932902 642127681 -10.11214809
Chart 4.4 Net Profit Ratio of KEL from 2009-2014
-12
-10
-8
-6
-4
-2
0
2009-2010 2010-2011 2011-2012 2012-2013 2013-2014

FINANCIAL STATEMENT ANALYSIS KEL LTD
NEW HORIZON COLLEGE, BANGALORE Page 70
INTERPRETATION
KEL is continuously running in loss from 2008 to 2013. The highest loss was made
during the financial year 2013-2014. Thus the net profit ratio of KEL is not
satisfactory.
3) ACTIVITY RATIO
A) DEBTORS TURNOVER RATIO
Table 4.5 Table showing Debtors Turnover Ratio
Year
Net Sales
Average Debtors
Debtors Turnover
2009-2010 934451927 329964471 2.831995591
2010-2011 913913181 391522743 2.334253111
2011-2012 990745407 508264320 1.949271999
2012-2013 729296232 501476910 1.454296733
2013-2014 642127681 436518813 1.471019488

FINANCIAL STATEMENT ANALYSIS KEL LTD
NEW HORIZON COLLEGE, BANGALORE Page 71
Chart 4.5 Debtors Turnover ratio of KEL from 2009-2014
INTERPRETATIONS
KEL has a high debtor’s turnover ratio during the year 2009-2010. After that we
can see a reduction in each year. The lowest debtor’s turnover ratio is made
during the year 2012-2013.But made an improvement during the year 2013-2014.
Thus the debtor’s turnover ratio of KEL is satisfactory.
0
0.5
1
1.5
2
2.5
3
2009-2010 2010-2011 2011-2012 2012-2013 2013-2014
Debtors Turnover Ratio

FINANCIAL STATEMENT ANALYSIS KEL LTD
NEW HORIZON COLLEGE, BANGALORE Page 72
B) FIXED ASSET TURNOVER RATIO
Table 4.6 Table showing Fixed Asset Ratio
Year
Net sales
Net Fixed Asset
Fixed Asset
Turnover Ratio
2009-2010 934451927 93487443 9.99
2010-2011 913913181 90284879 10.12
2011-2012 990745407 73977716 13.39
2012-2013 729296232 70336181 10.36
2013-2014 642127681 76992939 8.34

FINANCIAL STATEMENT ANALYSIS KEL LTD
NEW HORIZON COLLEGE, BANGALORE Page 73
Chart 4.6 Fixed Asset Turnover Ratio of KEL from 2009-2014
INTERPRETATIONS
KEL has maintained good fixed asset turnover ratio during the financial years
2009-2014.The highest ratio was maintained during the financial year 2011-2012.
Thus the fixed assets turnover ratio of KEL is appreciable.
0
2
4
6
8
10
12
14
16
2009-2010 2010-2011 2011-2012 2012-2013 2013-2014
Fixed Asset Turnovrt Ratio

FINANCIAL STATEMENT ANALYSIS KEL LTD
NEW HORIZON COLLEGE, BANGALORE Page 74
4) SOLVENCY RATIO
A) DEBT EQUITY RATIO
Table 4.7 Table showing Debt Equity ratio
Year
Long Term Debt
Share Holder Fund
Debt equity Ratio
2009-2010 519263522 715348598 0.72
2010-2011 549029182 716324575 0.76
2011-2012 433533779 873048598 0.49
2012-2013 210952754 871480770 0.24
2013-2014 284434163 871480770 0.32
\
Chart 4.7 Debt Equity Ratio of KEL from 2009-2014
0
0.1
0.2
0.3
0.4
0.5
0.6
0.7
0.8
2009-2010 2010-2011 2011-2012 2012-2013 2013-2014
Debt Equity Ratio

FINANCIAL STATEMENT ANALYSIS KEL LTD
NEW HORIZON COLLEGE, BANGALORE Page 75
INTERPRETATIONS
The standard debt equity ratio of a firm is 1:1 that mean shareholders and long –
term fund should be equal. But KEL is not maintaining a good debt equity ratio.
The highest ratio made was 0.76, but low debt equity ratio is favorable from long
term creditor’s point of view. Thus it will increase the sales.
B) PROPRIETARY RATIO
Table 4.8 Table showing proprietary ratio
Year
Share holders
Fund
Total Assets
Proprietary ratio
2009-2010 715348598 727773143 0.98
2010-2011 715348598 774427824 0.92
2011-2012 873048598 975588430 0.89
2012-2013 871480770 784429210 1.11
2013-2014 871480770 965731257 0.90

FINANCIAL STATEMENT ANALYSIS KEL LTD
NEW HORIZON COLLEGE, BANGALORE Page 76
Chart 4.8 Proprietary Ratio of KEL from 2009-2014
INTERPRETATION
KEL show a satisfactory proprietary ratio. Thus it has a good long- term solvency
.The highest ratio was made during the year 2013-2014
0
0.2
0.4
0.6
0.8
1
1.2
2009-2010 2010-2011 2011-2012 2012-2013 2013-2014
proprietary ratio

FINANCIAL STATEMENT ANALYSIS KEL LTD
NEW HORIZON COLLEGE, BANGALORE Page 77
C) SOLVENCY RATIO
Table 4.9 Table showing Solvency Ratio
YEAR
TOTAL LIABILITIES
TOTAL ASSETS
SOLVENCY RATIO
2009-2010 944281547 727773143 129.74
2010-2011 1011672022 774427824 130.63
2011-2012 1070213973 975588430 109.69
2012-2013 943451461 784429210 120.27
2013-2014 1189686410 965731257 123.12
Chart4.9 Solvency Ratio of KEL from 2009-2014
95
100
105
110
115
120
125
130
135
2009-2010 2010-2011 2011-2012 2012-2013 2013-2014

FINANCIAL STATEMENT ANALYSIS KEL LTD
NEW HORIZON COLLEGE, BANGALORE Page 78
INTERPRETATIONS
Generally lower solvency ratio is more satisfactory for a firm, but KEL is showing a
high solvency ratio which is not appreciable. The highest is show during the year
2011-2012. Thus KEL should try to reduce its total liabilities to reduce its solvency
ratio.
D) FIXED ASSET TO NETWORTH RATIO
Table 4.10 Table showing Fixed Asset to Net worth Ratio
Year
Fixed asset
Share holders fund
Fixed asset to net
worth ratio
2009-2010 93487443 715348598 13.06
2010-2011 90284879 715348598 12.62
2011-2012 73977716 873048598 8.47
2012-2013 70336181 871480770 8.07
2013-2014 76992939 871480770 8.83

FINANCIAL STATEMENT ANALYSIS KEL LTD
NEW HORIZON COLLEGE, BANGALORE Page 79
Chart 4.11 Fixed Asset to Net worth Ratio of KEL from 2009-2014
INTERPRETATIONS
The shareholders fund of KEL is more compared to fixed assets. It is a good sing
because the owner’s are more than sufficient to financial the fixed assets of KEL.
Thus fixed assets to net worth ratio of KEL is satisfactory.
0
2
4
6
8
10
12
14
Fixed Asset To Net worth Ratio

FINANCIAL STATEMENT ANALYSIS KEL LTD
NEW HORIZON COLLEGE, BANGALORE Page 80
B ) TREND ANALYSIS
1. TREND ANALYSIS OF SALES OF KEL FROM 2009-2014
Table 4.12 Trend Percentage of Sales (Base year 2009)
Year
Amount of Sales
Trend Percentage
2009-2010 934451927 100
2010-2011 913913181 97.80
2011-2012 990745407 106.02
2012-2013 729296232 78.04
2013-2014 642127681 68.71
Chart 4.12 Trend Percentage of KEL from 2009-2014
0
20
40
60
80
100
120
2009-2010 2010-2011 2011-2012 2012-2013 2013-2014
Trend Percentage of Sales

FINANCIAL STATEMENT ANALYSIS KEL LTD
NEW HORIZON COLLEGE, BANGALORE Page 81
INTERPRETATION
The highest sales were made by KEL during the year 2011-2012. But KEL has made
some reduction in sales during the year 2013-2014.Impovement should be made
in sales.
2) TREND ANALYSIS OF INVENTORY OF KEL FROM 2009 TO 2014
Table 4.13 Trend Percentage of Inventory (Base year-2009)
Year
Amount of Inventory
Trend Perecentage
2009-2010 197376554 100
2010-2011 183874018 93.15
2011-2012 195211233 98.90
2012-2013 1846869885 93.57
2013-2014 187990021 95.24

FINANCIAL STATEMENT ANALYSIS KEL LTD
NEW HORIZON COLLEGE, BANGALORE Page 82
Chart 4.13 Trend Percentage of inventory of KEL FROM 2009-2014
INTERPRETATION
KEL’s maintenance of inventory is not consistent from 2009-2014.Compared to
2009-2010 the lowest maintenance of inventory made by KEL was during the
year2010-2011The trend percentage of inventory of KEL is just satisfactory.
88
90
92
94
96
98
100
102
2009-2010 2010-2011 2011-2012 2012-2013 2013-2014
Trend percentage of inventory

FINANCIAL STATEMENT ANALYSIS KEL LTD
NEW HORIZON COLLEGE, BANGALORE Page 83
3) TREND ANALISIS OF CASH OF KEL FROM 2009-2014
Table 4.14 TREND PERCENTAGE OF CASH (Base year 2009)
Year
Amount of cash
Trend percentage
2009-2010 13919504 100
2010-2011 16069425 115.44
2011-2012 175616064 126.16
2012-2013 14817796 106.45
2013-2014 120702938 867.14
Chart 4.13 Trend percentage of cash of KEL from 2009-2014
0
100
200
300
400
500
600
700
800
900
1000
2009-2010 2010-2011 2011-2012 2012-2013 2013-2014
TREND PERCENTAGE OF CASH

FINANCIAL STATEMENT ANALYSIS KEL LTD
NEW HORIZON COLLEGE, BANGALORE Page 84
INTERPRETATION
Trend percentage of KEL shows a steady improvement compare to2010-2011. The
highest percentage made in cash was during the year 2013-2014: we can see a
tremendous hike in cash. Thus KEL has a very good maintenance of liquid cash.
4) TREND ANALYSIS OF CURRENT ASSETS OF KEL FROM 2009 TO 2014
Table 4.15 Trend Percentage of Current Assets (Base Year -2009)
Year
Amount of current asset
Trend Percentage
2010-2010 632667872 100
2010-2011 682525117 107.88
2011-2012 899987886 142.25
2012-2013 693540970 109.62
2014-2014 886743883 136.99

FINANCIAL STATEMENT ANALYSIS KEL LTD
NEW HORIZON COLLEGE, BANGALORE Page 85
Chart 4.15 Trend percentage of cash of KEL from 2009-2014
INTERPRETATION
Trend analysis of current asset of KEL is showing a good increase compared to
2009-2010.The height percentage of current asset is showing during the year
2011-2012.
0
20
40
60
80
100
120
140
160
2009-2010 2010-2011 2011-2012 2012-2013 2013-2014
TREND PERCENTAGE OF CURRENT ASSET

FINANCIAL STATEMENT ANALYSIS KEL LTD
NEW HORIZON COLLEGE, BANGALORE Page 86
2) COMPARATIVE BALANCE SHEET
4.16 COMPARATIVE BALANCE SHEET OF KEL LTD
AS ON 31ST
MARCH 2010 AND 2011
PARTICULARS 2009-2010
(in Rs.)
2010-2011
(in Rs. )
ABSOLU
TE
CHANGE
PERCENT
AGE
CHANGE
ASSETS
CURRENT ASSETS:
Cash and cash equivalents
Debtors
Inventories
Short term loans and
advances
13919504
372712452
197376554
48659362
16069425
410333034
183874018
72248640
2149921
37620582
-13502536
23589278
15.44538512
10.09372823
-6.84100301
48.47839559
TOTAL CURRENT ASSETS 632667872 682525117 49857245 7.88047682
INVESTMENTS:
Current investments
Non-current investments
-
50000
-
50000
-
-
-
-
TOTAL INVESTMENT 50000 50000 - -
FIXED ASSETS:
Tangible assets
Capital work in progress
3324902
60237941
55217435
35067444
21967933
-25170497
66.06996099
-
41.78512177
TOTAL FIXED ASSETS 93487443 90284879 -3202564 -3.45662204
Long-term loans and
advances
Other fixed assets
1567828
-
1567828
-
-
-
-
-
TOTAL ASSETS 727773143 774427824 46654681 6.41060768
LIABILITIES AND
CAPITAL
CURRENT LIABILITIES:
Short-term borrowings and
payables
Short-term provisions
344354007
80664018
370092698
9255012
25738691
11886124
7.474485697
14.73534829
TOTAL CURRENT 425018025 462642840 37624815 8.852522196

FINANCIAL STATEMENT ANALYSIS KEL LTD
NEW HORIZON COLLEGE, BANGALORE Page 87
LIABILITIES
LONG-TERM DEBTS:
Long-term borrowings
Long-term provision
218805765
300457757
234886031
314143151
16080266
13685394
7.349105267
4.554847955
TOTAL LONG-TERM DEBT 519263522 549029182 29765660 5.732284041
TOTAL LIABILITIES 944281547 1011672022 67390475 7.136692993
SHAREHOLDERS FUND:
Share capital
Reserves and surplus
715348598
-
931857002
715348598
-952592796
-
-20735794
-
2.225212018
TOTAL SHAREHOLDERS
FUND
-
216508404
-237244198 -20735794 2.225212018
TOTAL LIABILITIES
AND CAPITAL
727773143 727773143 46654681 6.41060768

FINANCIAL STATEMENT ANALYSIS KEL LTD
NEW HORIZON COLLEGE, BANGALORE Page 88
4.17 COMPARATIVE BALANCE SHEET OF KEL LTD
AS ON 31ST
MARCH 2011 AND 2012
PARTICULARS 2010-2011
(in Rs.)
2011-2012
(in Rs. )
ABSOLUT
E
CHANGE
PERCENT
AGE
CHANGE
(in %)
ASSETS
CURRENT ASSETS:
Cash and cash equivalents
Debtors
Inventories
Short term loans and
advances
16069425
410333034
183874018
72248640
17561604
606195606
195211233
81019443
1492179
1995862572
11337215
8770803
9.285826966
4.773258689
6.165751488
12.13974824
TOTAL CURRENT
ASSETS
682525117 899987886 217462769 31.86150423
INVESTMENTS:
Current investments
Non-current investments
-
50000
-
55000
-
5000
-
10
TOTAL INVESTMENT 50000 55000 5000 10
FIXED ASSETS:
Tangible assets
Capital work in progress
55217435
35067444
38910272
35067444
-16307163
-
-2953263403
-
TOTAL FIXED ASSETS 90284879 73977716 -16307163 -1806189827
Long-term loans and
advances
Other fixed assets
1567828
-
1567828
-
-
-
-
-
TOTAL ASSETS 774427824 975588430 201160606 25.97538463
LIABILITIES AND
CAPITAL
CURRENT LIABILITIES:
Short-term borrowings
and payables
Short-term provisions
370092698
9255012
491942446
141737748
121849748
52187606
32.92411568
56.3884667
TOTAL CURRENT 462642840 636680194 174037354 37.61808007

FINANCIAL STATEMENT ANALYSIS KEL LTD
NEW HORIZON COLLEGE, BANGALORE Page 89
LIABILITIES
LONG-TERM DEBTS:
Long-term borrowings
Long-term provision
234886031
314143151
223719987
209813792
-76242088
-39253315
-
32.45918358
-12.3884667
TOTAL LONG-TERM
DEBT
549029182 433533779 -115495403 -
21.03629584
4
TOTAL LIABILITIES 1011672022 1070213973 58541951 5.786653157
SHAREHOLDERS
FUND:
Share capital
Reserves and surplus
715348598
-952592796
873048598
-967674141
157700000
-15081345
22.04519593
1.583189067
TOTAL SHAREHOLDERS
FUND
-237244198 -94625543 142618655 -6011470721
TOTAL LIABILITIES
AND CAPITAL
727773143 975588430 201160 606
25.97538463

FINANCIAL STATEMENT ANALYSIS KEL LTD
NEW HORIZON COLLEGE, BANGALORE Page 90
4.18 COMPARATIVE BALANCE SHEET OF KEL LTD
AS ON 31ST
MARCH 2012 AND 2013
PARTICULARS 2011-2012
(in Rs.)
2012-2013
(in Rs. )
ABSOLU
TE
CHANGE
PERCENTA
GE
CHANGE (in
%)
ASSETS
CURRENT ASSETS:
Cash and cash equivalents
Debtors
Inventories
Short term loans and
advances
17561604
606195606
195211233
81019443
14817796
396758213
184656985
46717976
-2743808
-
209437393
-10524248
-34301467
-15.62390315
-34.54947395
-5.391210249
-42.3373276
TOTAL CURRENT
ASSETS
899987886 642980970 -
257006916
-28.55670837
INVESTMENTS:
Current investments
Non-current investments
-
55000
50960000
55000
50960000
-
-
-
TOTAL INVESTMENT 55000 51015000 50960000 92654.54546
FIXED ASSETS:
Tangible assets
Capital work in progress
38910272
35067444
35268737
35067444
-3641535
-
-9.358801193
-
TOTAL FIXED ASSETS 73977716 70336181 -3641535 -4.922475574
Long-term loans and
advances
Other fixed assets
1567828
-
19448788
648271
17880960
648271
1140.492452
-
TOTAL ASSETS 975588430 784429210 -
199159220
-19.59424837
LIABILITIES AND
CAPITAL
CURRENT LIABILITIES:
Short-term borrowings and
payables
Short-term provisions
491942446
141737748
346279601
386219106
-
145662845
-
241481358
-29.6 0
0973305
166.8406213

FINANCIAL STATEMENT ANALYSIS KEL LTD
NEW HORIZON COLLEGE, BANGALORE Page 91
TOTAL CURRENT
LIABILITIES
636680194 732498707 95818513 15.04970846
LONG-TERM DEBTS:
Long-term borrowings
Long-term provision
223719987
209813792
90288844
120663910
-68355099
-
154225926
-43.08711553
-56.10463022
TOTAL LONG-TERM
DEBT
433533779 210952754 -
222581024
-51.34110323
TOTAL LIABILITIES 1070213973 943451461 -
126762512
-11.84459512
SHAREHOLDERS FUND:
Share capital
Reserves and surplus
873048598
-967674141
871480770
-
1030503021
-1567828
-62828880
-0.179580839
6.492772447
TOTAL SHAREHOLDERS
FUND
-94625543 -15902251 -64396708 68.0542465
TOTAL LIABILITIES
AND CAPITAL
975588430 784429210 -
199159220
-19.59424837

FINANCIAL STATEMENT ANALYSIS KEL LTD
NEW HORIZON COLLEGE, BANGALORE Page 92
4.19 COMPARATIVE BALANCE SHEET OF KEL LTD
AS ON 31ST
MARCH 2013 AND 2014
PARTICULARS 2012-2013
(in Rs.)
2013-2014
(in Rs. )
ABSOLUT
E
CHANGE
PERCENTA
GE
CHANGE (in
%)
ASSETS
CURRENT ASSETS:
Cash and cash equivalents
Debtors
Inventories
Short term loans and
advances
14817796
396758213
184656985
46717976
120702938
476279412
187990021
81771467
10 5885187
79521199
33030336
35053491
714.5812171
20.04273545
1.788450875
75.03212682
TOTAL CURRENT
ASSETS
642980970 866743883 223762913 34.8008609
INVESTMENTS:
Current investments
Non-current investments
50960000
55000
-
55000
-50960000
-
-100
-
TOTAL INVESTMENT 51015000 55000 -50960000 -99.89218857
FIXED ASSETS:
Tangible assets
Capital work in progress
35268737
35067444
35283569
41709370
14832
6641926
0.042054242
18.94043375
TOTAL FIXED ASSETS 70336181 76992939 6656758 18.982488
Long-term loans and
advances
Other fixed assets
19448788
648271
21291164
648271
1842376
-
9.472960474
-
TOTAL ASSETS 784429210 965731257 181302047 23.11260783
LIABILITIES AND
CAPITAL
CURRENT LIABILITIES:
Short-term borrowings and
payables
Short-term provisions
346279601
386219106
445249536
460002711
98969935
7378605
28.58093134
19.10407949
TOTAL CURRENT 732498707 905252247 172753540 23.58414265

FINANCIAL STATEMENT ANALYSIS KEL LTD
NEW HORIZON COLLEGE, BANGALORE Page 93
LIABILITIES
LONG-TERM DEBTS:
Long-term borrowings
Long-term provision
90288844
120663910
164842431
119591732
74553587
-1072178
82.57231314
-0.888565603
TOTAL LONG-TERM
DEBT
210952754 284434163 73481409 34.83311197
TOTAL LIABILITIES 943451461 1189686410 246234949 26.09937651
SHAREHOLDERS FUND:
Share capital
Reserves and surplus
871480770
-
1030503021
871480770
-
1095435923
-
-64932902
-
6.30108798
TOTAL SHAREHOLDERS
FUND
-15902251 -223955153 -6432902 0.408325
TOTAL LIABILITIES
AND CAPITAL
784429210 965731257 181302047 23.11260783

FINANCIAL STATEMENT ANALYSIS KEL LTD
NEW HORIZON COLLEGE, BANGALORE Page 94
CHAPTER 5
FINDINGS SUGGESTIONS AND CONCLUSIONS

FINANCIAL STATEMENT ANALYSIS KEL LTD
NEW HORIZON COLLEGE, BANGALORE Page 95
CHAPTER 5
FINDINGS,SUGGESTION & CONCLUSION
FINDINGES
Some of the findings made during the analysis of financial statement of KEL Were
as follows
KEL indicating a satisfactory current ratio which indicates that they
are maintain a good liquidity position.
KEL showing allow quick ratio which is favorable for the firm.
KEL is consistently going on a period of loss under the study. This is
not at all satisfactory for a government company.
KEL have a high fixed assets to net worth, this shows that owner fund
are more than sufficient to fiancé the fixed asset.
KEL had a good management of working capital till March 2012. But
after that the working capital turnover ratio of KEL is falling at a high
pace. This shows the in ability of the firm to manage working capital.
KEL is showing a high solvency in period under study ratio which is no
appreciable. A low solvency ratio is usually good.
KEL has a good long- term solvency so it shows a high proprietary
ratio in the period under study.
KEL has a low debt equity ratio which is satisfactory for long –term
creditor’s point of view

FINANCIAL STATEMENT ANALYSIS KEL LTD
NEW HORIZON COLLEGE, BANGALORE Page 96
The trend of sales was showing an increasing trend till 2011-2012
and then decreased slightly when it reached 2013-2014 .This indicate
that slight in efficiency in the management of working capital by KEL.
Compared to base year 2009-2010 KEL showing a tremendous
improvement in the case of maintain cash. The trend of cash showing
an increasing trend.
The trend of current liability of KEL is showing an increasing trend.
This indicates that company is enjoying credit facilities from
suppliers.
The trend percentage of current assets is showing a great
improvement compared to the base year 2009-2010. Thus it shows
that the company having a good ability to meet it short –term
obligation.
5.2 SUGGESTION
KEL should try to adopt innovative technology to reduce its cost of
production.Also the adoption of new technology help the firm increase its
production and sales.
Although the current ratio of KEL is satisfactory, it should try to maintain it
at a standard rate of2:1 which would be good.
KEL’s average collection period is very high, for avoiding this company
should adopt some new technique.This will to help to improve the short
term liquidity position.
Company is running for a loss for last five years mainly due to the heavy
expenses incurred in the purchasing of raw material for production. They

FINANCIAL STATEMENT ANALYSIS KEL LTD
NEW HORIZON COLLEGE, BANGALORE Page 97
should try to reduce its by purchasing the same material at a lower price
from other suppliers through questions.
KEL should t which will automatically increase their profit.
KEL should try to manage their working capital properly in order to meet its
short-term obligation and to increase the level of liquid cash.
The company should conduct a weekly meeting for material management,
production management and working capital management for better
operation of the company.
The company should conduct monthly regarding the performance of the company
during that month. This will help the employees to know the position of the firm
and will try to improve the performance of the firm
5.3 CONCLUSION
Financial statement of KEL has been thoroughly checked for getting the
information and data so collected has been thoroughly interpreted for drawing for
the study.
Inorder to avoid further loss KEL should try to adopt innovation technology to
reduce its cost of production. This will help the firm to increase its production and
sale. Through conducting weekly meeting and performance check employees will
be aware of company‟s position and though various employee friendly
motivational activities employees will try to improve their performance and
company will have a good fortune.
It has been a matter of immense pleasure, hunour and challenge to have this
opportunity to take up this project and complete it successfully. While developing
this project. I have learnt a lot about how a firm manages its financial statement.

FINANCIAL STATEMENT ANALYSIS KEL LTD
NEW HORIZON COLLEGE, BANGALORE Page 98
BIBLIOGRAPHY
FINANCIAL STATEMENT ANALYSIS KEL LTD
NEW HORIZON COLLEGE, BANGALORE Page 99
BIBLOGRAPHY
Annual Report of FINANCIAL STATEMENT ANALYSIS OF KERALA
ELECTRICAL AND ALLIED ENGINEERING COMPANY LTD. (2009 - 2014)
KOTHARI C.R, Research Methodology, New Delhi, Vikas Publishing House,
1990.
M.Y KHAN AND P K JAIN, Financial Management, New Delhi, Tata
McGraw-Hill
Publishing Company Limited, 2006.
PANDEY I M, Financial Management, Vikas Publishing House Private
Limited, 2004.
PERIASAMY P, Financial Cost and Management Accounting, Mumbai,
Himalaya Publishing House, 2013.
TulsianP.C ,Cost accounting, Tata Mcrow-Hill Publishing Company Ltd
2008.
Websites
https://www.google.co.in/search?newwindow=1&site=&source=hp&q=FINAN
CIAL+STATEMENT+ANALYSIS

FINANCIAL STATEMENT ANALYSIS KEL LTD
NEW HORIZON COLLEGE, BANGALORE Page 100
ANNEXURES

FINANCIAL STATEMENT ANALYSIS KEL LTD
NEW HORIZON COLLEGE, BANGALORE Page 101
ANNEXURE
BALANCDSHEET AS ON 2009-10
PARTICULARS AMOUNT
ASSETS
CURRENT ASSETS:
Cash and cash equivalents
Debtors
Inventories
Short term loans and advances
13919504
372712452
197376554
48659362
TOTAL CURRENT ASSETS 632667872
INVESTMENTS:
Current investments
Non-current investments
-
50000
TOTAL INVESTMENT 50000
FIXED ASSETS:
Tangible assets
Capital work in progress
3324902
60237941
TOTAL FIXED ASSETS 93487443
Long-term loans and advances
Other fixed assets
1567828
-
TOTAL ASSETS 727773143
LIABILITIES AND CAPITAL
CURRENT LIABILITIES:
Short-term borrowings and payables
Short-term provisions
344354007
80664018
TOTAL CURRENT LIABILITIES 425018025
LONG-TERM DEBTS:
Long-term borrowings
Long-term provision
218805765
300457757
TOTAL LONG-TERM DEBT 519263522
TOTAL LIABILITIES 944281547
SHAREHOLDERS FUND:
Share capital
Reserves and surplus
715348598
-931857002
TOTAL SHAREHOLDERS FUND -216508404
TOTAL LIABILITIES AND CAPITAL 727773143

FINANCIAL STATEMENT ANALYSIS KEL LTD
NEW HORIZON COLLEGE, BANGALORE Page 102
BALANCESHEET AS ON 2010-11
PARTICULARS AMOUNT
ASSETS
CURRENT ASSETS:
Cash and cash equivalents
Debtors
Inventories
Short term loans and advances
16069425
410333034
183874018
72248640
TOTAL CURRENT ASSETS 682525117
INVESTMENTS:
Current investments
Non-current investments
-
50000
TOTAL INVESTMENT 50000
FIXED ASSETS:
Tangible assets
Capital work in progress
55217435
35067444
TOTAL FIXED ASSETS 90284879
Long-term loans and advances
Other fixed assets
1567828
-
TOTAL ASSETS 774427824
LIABILITIES AND CAPITAL
CURRENT LIABILITIES:
Short-term borrowings and payables
Short-term provisions
370092698
9255012
TOTAL CURRENT LIABILITIES 462642840
LONG-TERM DEBTS:
Long-term borrowings
Long-term provision
234886031
314143151
TOTAL LONG-TERM DEBT 549029182
TOTAL LIABILITIES 1011672022
SHAREHOLDERS FUND:
Share capital
Reserves and surplus
715348598
-952592796
TOTAL SHAREHOLDERS FUND -237244198
TOTAL LIABILITIES AND CAPITAL 727773143

FINANCIAL STATEMENT ANALYSIS KEL LTD
NEW HORIZON COLLEGE, BANGALORE Page 103
BALANCESHEET AS ON 2011-12
PARTICULARS AMOUNT
ASSETS
CURRENT ASSETS:
Cash and cash equivalents
Debtors
Inventories
Short term loans and advances
17561604
606195606
195211233
81019443
TOTAL CURRENT ASSETS 899987886
INVESTMENTS:
Current investments
Non-current investments
-
55000
TOTAL INVESTMENT 55000
FIXED ASSETS:
Tangible assets
Capital work in progress
38910272
35067444
TOTAL FIXED ASSETS 73977716
Long-term loans and
advances
Other fixed assets
1567828
-
TOTAL ASSETS 975588430
LIABILITIES AND CAPITAL
CURRENT LIABILITIES:
Short-term borrowings and payables
Short-term provisions
491942446
141737748
TOTAL CURRENT LIABILITIES 636680194
LONG-TERM DEBTS:
Long-term borrowings
Long-term provision
223719987
209813792
TOTAL LONG-TERM DEBT 433533779
TOTAL LIABILITIES 1070213973
SHAREHOLDERS FUND:
Share capital
Reserves and surplus
873048598
-967674141
TOTAL SHAREHOLDERS FUND -94625543
TOTAL LIABILITIES AND CAPITAL 975588430

FINANCIAL STATEMENT ANALYSIS KEL LTD
NEW HORIZON COLLEGE, BANGALORE Page 104
BALANCESHET AS ON 2012-13
PARTICULARS AMOUNT
ASSETS
CURRENT ASSETS:
Cash and cash equivalents
Debtors
Inventories
Short term loans and advances
14817796
396758213
184656985
46717976
TOTAL CURRENT ASSETS 642980970
INVESTMENTS:
Current investments
Non-current investments
50960000
55000
TOTAL INVESTMENT 51015000
FIXED ASSETS:
Tangible assets
Capital work in progress
35268737
35067444
TOTAL FIXED ASSETS 70336181
Long-term loans and
advances
Other fixed assets
19448788
648271
TOTAL ASSETS 784429210
LIABILITIES AND CAPITAL
CURRENT LIABILITIES:
Short-term borrowings and payables
Short-term provisions
346279601
386219106
TOTAL CURRENT LIABILITIES 732498707
LONG-TERM DEBTS:
Long-term borrowings
Long-term provision
90288844
120663910
TOTAL LONG-TERM DEBT 210952754
TOTAL LIABILITIES 943451461
SHAREHOLDERS FUND:
Share capital
Reserves and surplus
871480770
-1030503021
TOTAL SHAREHOLDERS FUND -15902251
TOTAL LIABILITIES AND CAPITAL 784429210

FINANCIAL STATEMENT ANALYSIS KEL LTD
NEW HORIZON COLLEGE, BANGALORE Page 105
BALANCESHEET AS ON 2013-14
PARTICULARS AMOUNT
ASSETS
CURRENT ASSETS:
Cash and cash equivalents
Debtors
Inventories
Short term loans and advances
120702938
476279412
187990021
81771467
TOTAL CURRENT ASSETS 866743883
INVESTMENTS:
Current investments
Non-current investments
-
55000
TOTAL INVESTMENT 55000
FIXED ASSETS:
Tangible assets
Capital work in progress
35283569
41709370
TOTAL FIXED ASSETS 76992939
Long-term loans and
advances
Other fixed assets
21291164
648271
TOTAL ASSETS 965731257
LIABILITIES AND CAPITAL
CURRENT LIABILITIES:
Short-term borrowings and payables
Short-term provisions
445249536
460002711
TOTAL CURRENT LIABILITIES 905252247
LONG-TERM DEBTS:
Long-term borrowings
Long-term provision
164842431
119591732
TOTAL LONG-TERM DEBT 284434163
TOTAL LIABILITIES 1189686410
SHAREHOLDERS FUND:
Share capital
Reserves and surplus
871480770
-1095435923
TOTAL SHAREHOLDERS FUND -223955153
TOTAL LIABILITIES AND CAPITAL 965731257