
Computing general equilibrium models with occupational choice and financial frictions
Upload
independentCategory
view
0download
0
Financial Frictions and Investment: A
Requiem in Q
Russell W. CooperUniversity of Texas
Joao EjarqueInstitute of Economics, University of Essex
December 14, 2005

Question: Do financial factors matter for investment?
Answers:
• YES: Look at 1000 papers on Q investment regressions:
profits are significant
• NO: this evidence could all be measurement error ( Erickson-
Whited, Gomes) or market power (Cooper-Ejarque, Abel-
Eberly)
• A tiny bit: this paper nests financial frictions and market
power; frictions have a small influence
1

Methodology
• theory: dynamic optimization at firm level with borrowing
restrictions
• facts: Q investment regression coefficients and other mo-
ments
• organize facts around these models
• Answer question by determining whether financial frictions
improve the estimated model’s fit.
2

What this paper does not do:
• studies firm optimization problem; not an equilibrium analysis
• financial frictions (restrictions on capital accumulation) are
imposed not derived
3

Consider:
V (K, A) = maxK′
π(K, A)− p(K′ −K(1− δ))− C(K′, K) +
βEA′|AV (K′, A′) ∀(K, A)
• π(K, A) is profit after maximization over flexible inputs
• C(K′, K) is a cost of adjustment function
• A is a stochastic process; firm and aggregate components
• no financial factors present
4
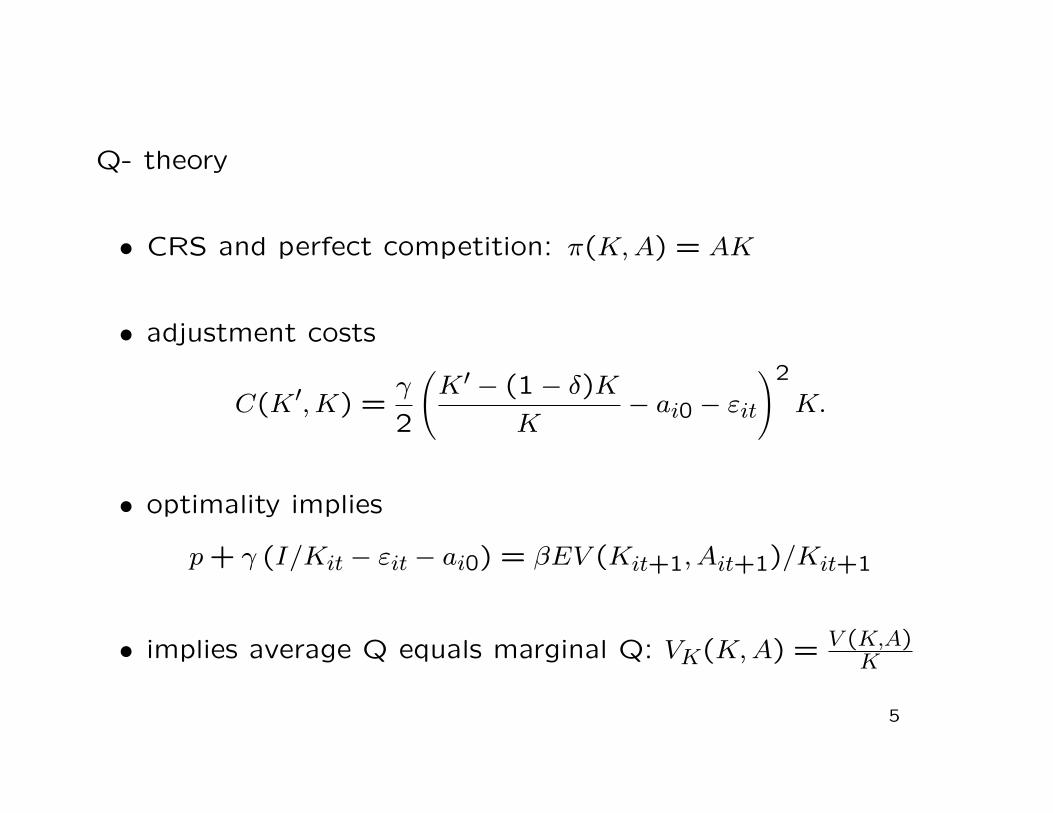
Q- theory
• CRS and perfect competition: π(K, A) = AK
• adjustment costs
C(K′, K) =γ
2
(K′ − (1− δ)K
K− ai0 − εit
)2
K.
• optimality implies
p + γ (I/Kit − εit − ai0) = βEV (Kit+1, Ait+1)/Kit+1
• implies average Q equals marginal Q: VK(K, A) = V (K,A)K
5

Evidence from Q-Theory based on:
(I/K)it = ai0 + a1Eq̄it+1 + a2(πit/Kit) + εit.
• Q-theory implies: a1 = 1/γ, a2 = 0
• Generally find (Table 1):
– a1 is small “implying” γ large
– a2 is significant “implying” financial frictions
Is there a framework for these inferences?
6

Table 1: Q Regression Results and Other Moments
study a1 a2 mean(q̄) std (q̄) std(I/K) std(π/K) sc(I/K)GH95 0.03 0.242 2.95 2.28 0.132 0.257 0.4
FHP88(low) 0.0008 0.46 3.8 na 0.17 0.2 naFHP88(high) 0.002 0.23 1.6 na 0.06 0.06 na
G01 0.06 0.14 1.56 na 0.139 na 0.239CHH94 0.019 0.164 na na na na na
7

Cooper-Ejarque: No! Hold It!
• let π(K, A) = AKα, α ≤ 1
• consider
minΘ
J(Θ) = (Ψd −Ψs(Θ))′W (Ψd −Ψs(Θ))
where
– Ψd = (a1, a2, sc(I/K), std(π/K), q̄)
– Ψs(Θ): corresponding simulation moments from solvingdynamic optimization problem
– Θ = (α, γ, ρ, σ)
8

Cooper-Ejarque reproduce Q-theory results without financial fric-
tions :
• α < 1 and no borrowing restrictions matches moments except
for serial correlation of investment rates
• small a1 does not reflect large adjustment costs as γ is rela-
tively small
• can mimic small vs. large firm results
9

Table 2a: Structural Parameter Estimates by ModelModel Structural Parameter Estimates (Θ)
α γ ρ σUnconstrained 0.699 0.1647 0.111 0.857
(0.01) (0.017) (0.007) (0.029)
Internal 0.6967 0.2307 0.1053 0.8382(0.01) (0.02) (0.01) (0.03)
Table 2b: Moments by Model
Model Reduced Form Coefficients and Moments
a1 a2 sc( IK) std( π
K) q̄ J(Θ)GH95 0.03 0.24 0.4 0.25 3.0 naUnconstrained 0.045 0.24 0.040 0.250 2.96 40.39Internal 0.046 0.233 0.064 0.248 2.98 42.36
10

Could a model with financial frictions improve the fit?
• Gilchrist-Himmelberg and Euler equations find support for
market power and frictions
• perhaps the market power is just substituting for the financial
frictions: identification is important
• But: why doesn’t average Q reflect financial frictions (Chirinko)?
• two models: internal finance and costly external finance
11

Internal Finance: Theory
V (K, A) = maxK′
π(K, A)− p(K′ −K(1− δ))− C(K′, K) +
βEA′|AV (K′, A′), with I ≤ π(A, K)
• “ constraint was violated” in about 20% of unconstrainedobservations
• allow for market power
• maintain quadratic costs
• see policy functions in Figures 2-3
12
Internal Finance: Evidence
• estimate Θ as before
• market power still evident
• fit is not better
• see Table 2 for details
13

Costly External Finance: Theory
V (K, A) = max{V e(K, A), V i(K, A)
}V e(K, A) = max
K′d− φ0 + βEA′|AV (K′, A′) and
V i(K, A) = maxK′≤π(K,A)+(1−δ)K
d + βEA′|AV (K′, A′)
where
d ≡ π(K, A)− (K′ − (1− δ)K)− C(K′, K)
• φ0: fixed costs for external finance
• nests previous cases
14

External Finance: Evidence in Table 3
• estimate 5 parameters, using six moments
• fit is no better when φ0 6= 0 is allowed
• market power still present
15

Table 3a: Structural Parameter Estimates: Costly External
Finance
Model Structural Parameter Estimates (Θ)α γ ρ σ φ̃0
Costly 0.6956 0.1331 0.0976 0.8932 0(0.01) (0.04) (0.02) (0.03) (0.05)
Table 3b: Moments by Model
Model Reduced Form Coefficients and Moments
a1 a2 sc( IK) std( π
K) q̄ Ext. Frac. J(Θ)Moments 0.03 0.24 0.4 0.25 3.0 0.25 naCostly 0.0388 0.2358 0.0158 0.2614 2.9413 0.2236 68.27
16

Implications for investment behavior:
• investment is a convex function of average Q
• profits still significant even in nonlinear Q-regression
• investment bursts in only 1% of observations
• sample splits in Table 4; not much difference across types
17

Costly finance with financial assets (in process)
V (K, A, B, D) = max{V e(K, A, B, D), V i(K, A, B, D)
}where
V i(K, A, B, D) = maxK′,B′,D′≤D
d + βEA′|AV (K′, A′, B′, D′)
V e(K, A, B, D) = maxK′,B′,D′≥0
d− φ0 + βEA′|AV (K′, A′, B′, D′)
for all (K, A, B ≥ 0, D ≥ 0).
where d = π(A, K) + RLB + D′ − I −RbD −B′ − C(K′, K) ≥ 0
18

• here B represents funds in the ”bank” and D is debt
• allow Rb > Rl
• lumpy financial market participation distinct from investmentbehavior
• if internal, firm may not be constrained
• d ≥ 0 so that firm must pay fixed cost to borrow
• allow both costs of market participation and gap in borrowingand lending rates.
19

Conclusions:
• estimated model allows for both financial frictions and marketpower
• fit of model reflects market power of firms not capital marketimperfections
• results from Q-regressions do not reflect capital market im-perfections
• no apparent bridge between financial factors and lumpy in-vestment yet: study financial and physical capital bursts to-gether
20
Copyright © 2022 FDOKUMEN


![\ ] q § n ' § b](https://static.fdokumen.com/doc/165x107/633204227f0d9c38da013cb8/-q-n-b.jpg)


![=^f EPiTSa^_b³Tgc^acX^]´ Q^\Q^]Tg 7< BT]P](https://static.fdokumen.com/doc/165x107/631b1814c51d6b41aa0517ad/f-epitsabtgcacx-qqtg-7-btp.jpg)

