
Dutch Q fever epidemic in a 'One Health' context: - Q-koorts.nl
240
Dutch Q fever epidemic in a ‘One Health’ context: outbreaks, seroprevalence and occupational risks Barbara Schimmer
-
Upload
khangminh22 -
Category
Documents
-
view
0 -
download
0
Transcript of Dutch Q fever epidemic in a 'One Health' context: - Q-koorts.nl
Dutch Q fever epidemic in a ‘One Health’ context:
outbreaks, seroprevalence and occupational risks
Barbara Schimmer
Copyright © 2018 B. Schimmer All rights reserved. No part of this publication may be reproduced, stored in a retrieval system, or transmitted, in any form or by any means, electronic, mechanical, photocopying, recording or otherwise, without the prior permission of the author or the copyright-owning journals and publishers for previously published chapters. Thesis Utrecht University http://igitur-archive.library.uu.nl ISBN/EAN: 978-94-6332-314-7 Cover image: Marielle at Geitenboerderij de Groote Stroe Photographer: Axel (volunteer at Geitenboerderij de Groote Stroe) Cover design: Jan-Willem Moulijn Printed by: GVO drukkers & vormgevers B.V., Ede, the Netherlands Several of the studies presented in this thesis were supported by ZonMw, The Netherlands Organisation for Health Research and Development (grant numbers: 125050001 and 125020008). The publication of this thesis was financially supported by the National Institute for Public Health and the Environment (RIVM), the Jeroen Bosch Hospital and Schimmer Music Productions.
Dutch Q fever epidemic in a ‘One Health’ context: outbreaks, seroprevalence and occupational risks
De Q-koorts epidemie in Nederland in een ‘One Health’ context:
uitbraken, seroprevalentie en beroepsgerelateerde risico’s
(met een samenvatting in het Nederlands)
Proefschrift
ter verkrijging van de graad van doctor aan de Universiteit Utrecht op gezag van de rector magnificus, prof.dr. G.J. van der Zwaan, ingevolge het besluit van het college voor promoties in het openbaar te
verdedigen op dinsdag 17 april 2018 des middags te 2.30 uur
door
Barbara Schimmer
geboren op 2 augustus 1975 te Schiedam

Promotor: Prof.dr. R.A. Coutinho
Copromotoren: Dr. Y.T.H.P. van Duijnhoven
Dr. W. van der Hoek
Table of ContentsPromotor: Prof. dr. R.A. Coutinho
Copromotoren: Dr. Y.T.H.P. van Duijnhoven Dr. W. van der Hoek

Promotor: Prof.dr. R.A. Coutinho
Copromotoren: Dr. Y.T.H.P. van Duijnhoven
Dr. W. van der Hoek
Table of ContentsPromotor: Prof. dr. R.A. Coutinho
Copromotoren: Dr. Y.T.H.P. van Duijnhoven Dr. W. van der Hoek

Contents
Chapter 1 General introduction and outline of the thesis
Chapter 2 Seroprevalence of Coxiella burnetii in the Dutch general population and time-course of antibody responses following acute Q fever
2.1 Low seroprevalence of Q fever in The Netherlands prior to a series of
large outbreaks Epidemiol Infect. 2012 Jan;140(1):27-35.
2.2 Time-course of antibody responses against Coxiella burnetii following
acute Q fever Epidemiol Infect. 2013 Jan;141(1):62-73.
Chapter 3 Outbreak investigations during the Dutch Q fever epidemic
3.1 Investigation of a Q fever outbreak in a rural area of The Netherlands Epidemiol Infect. 2009 Sep;137(9):1283-94.
3.2 The use of a geographic information system to identify a dairy goat farm as the most likely source of an urban Q fever outbreak BMC Infect Dis. 2010 Mar 16;10:69.
3.3 A Q fever outbreak in a psychiatric care institution in The Netherlands Epidemiol Infect. 2011 Jan;139(1):13-18.
3.4 Visits on 'lamb-viewing days' at a sheep farm open to the public was a risk factor for Q fever in 2009 Epidemiol Infect. 2012 May;140(5):858-64.
Chapter 4 Seroprevalence and risk factors of Coxiella burnetii infection in residents
and ruminants on commercial farms in a ‘One Health’ context
4.1 Seroprevalence and risk factors for Coxiella burnetii (Q fever) seropositivity in dairy goat farmers' households in The Netherlands, 2009-2010 PLoS One. 2012;7(7):e42364.
4.2 Seroprevalence and risk factors of Q fever in goats on commercial dairy goat farms in The Netherlands, 2009-2010 BMC Vet Res. 2011 Dec 30;7:81.
4.3. Coxiella burnetii seroprevalence and risk factors in sheep farmers and farm residents in The Netherlands
Epidemiol Infect. 2014 Jun;142(6):1231-44.
4.4 Coxiella burnetii seroprevalence and risk factors on commercial sheep farms in The Netherlands Vet Rec. 2014 Jul 5;175(1):17.
4.5. Coxiella burnetii seroprevalence and risk for humans on dairy cattle farms, The Netherlands, 2010-2011 Emerg Infect Dis. 2014 Mar;20(3):417-25.
4.6. Prevalence and risk factors for Coxiella burnetii (Q fever) in Dutch dairy cattle herds based on bulk tank milk testing Prev Vet Med. 2014 Nov 1;117(1):103-9.
Chapter 5 Seroprevalence and occupational risk factors of Coxiella burnetii infection
in veterinary-associated populations
5.1. Seroepidemiological survey for Coxiella burnetii antibodies and associated risk factors in Dutch livestock veterinarians PLoS One. 2013;8(1):e54021.
5.2. Risk factors of Coxiella burnetii (Q fever) seropositivity in veterinary medicine students PLoS One. 2012;7(2):e32108.
5.3. Q fever among culling workers, The Netherlands, 2009-2010 Emerg Infect Dis. 2011 Sep;17(9):1719-23.
Chapter 6 General discussion
Chapter 7 Summary Nederlandse samenvatting Chapter 8 Dankwoord
List of publications Biography
9
22
23
35
48
49
63
73
83
92
93
105

Contents
Chapter 1 General introduction and outline of the thesis
Chapter 2 Seroprevalence of Coxiella burnetii in the Dutch general population and time-course of antibody responses following acute Q fever
2.1 Low seroprevalence of Q fever in The Netherlands prior to a series of
large outbreaks Epidemiol Infect. 2012 Jan;140(1):27-35.
2.2 Time-course of antibody responses against Coxiella burnetii following
acute Q fever Epidemiol Infect. 2013 Jan;141(1):62-73.
Chapter 3 Outbreak investigations during the Dutch Q fever epidemic
3.1 Investigation of a Q fever outbreak in a rural area of The Netherlands Epidemiol Infect. 2009 Sep;137(9):1283-94.
3.2 The use of a geographic information system to identify a dairy goat farm as the most likely source of an urban Q fever outbreak BMC Infect Dis. 2010 Mar 16;10:69.
3.3 A Q fever outbreak in a psychiatric care institution in The Netherlands Epidemiol Infect. 2011 Jan;139(1):13-18.
3.4 Visits on 'lamb-viewing days' at a sheep farm open to the public was a risk factor for Q fever in 2009 Epidemiol Infect. 2012 May;140(5):858-64.
Chapter 4 Seroprevalence and risk factors of Coxiella burnetii infection in residents
and ruminants on commercial farms in a ‘One Health’ context
4.1 Seroprevalence and risk factors for Coxiella burnetii (Q fever) seropositivity in dairy goat farmers' households in The Netherlands, 2009-2010 PLoS One. 2012;7(7):e42364.
4.2 Seroprevalence and risk factors of Q fever in goats on commercial dairy goat farms in The Netherlands, 2009-2010 BMC Vet Res. 2011 Dec 30;7:81.
4.3. Coxiella burnetii seroprevalence and risk factors in sheep farmers and farm residents in The Netherlands
Epidemiol Infect. 2014 Jun;142(6):1231-44.
4.4 Coxiella burnetii seroprevalence and risk factors on commercial sheep farms in The Netherlands Vet Rec. 2014 Jul 5;175(1):17.
4.5. Coxiella burnetii seroprevalence and risk for humans on dairy cattle farms, The Netherlands, 2010-2011 Emerg Infect Dis. 2014 Mar;20(3):417-25.
4.6. Prevalence and risk factors for Coxiella burnetii (Q fever) in Dutch dairy cattle herds based on bulk tank milk testing Prev Vet Med. 2014 Nov 1;117(1):103-9.
Chapter 5 Seroprevalence and occupational risk factors of Coxiella burnetii infection
in veterinary-associated populations
5.1. Seroepidemiological survey for Coxiella burnetii antibodies and associated risk factors in Dutch livestock veterinarians PLoS One. 2013;8(1):e54021.
5.2. Risk factors of Coxiella burnetii (Q fever) seropositivity in veterinary medicine students PLoS One. 2012;7(2):e32108.
5.3. Q fever among culling workers, The Netherlands, 2009-2010 Emerg Infect Dis. 2011 Sep;17(9):1719-23.
Chapter 6 General discussion
Chapter 7 Summary Nederlandse samenvatting Chapter 8 Dankwoord
List of publications Biography
121
137
147
161
170
171
179
191
199
219
231

General introduction andoutline of the thesis
1
The One Health concept is a worldwide strategy for expanding interdisciplinarycollaborations and communications in all aspects of health care for humans, animalsand the environment. The synergism achieved will advance health care for the 21stcentury and beyond by accelerating biomedical research discoveries, enhancing publichealth efficacy, expeditiously expanding the scientific knowledge base, and improvingmedical education and clinical care. When properly implemented it will help protectand save untold mill ions of l ives in our present and future generations.
Kaplan et al. The brewing storm Monograph about One Medicine - One Healthconcept.Vet Ital 2009 Jan - Mar; 45(1):9-18
10 | CHAPTER 1
General Introduction
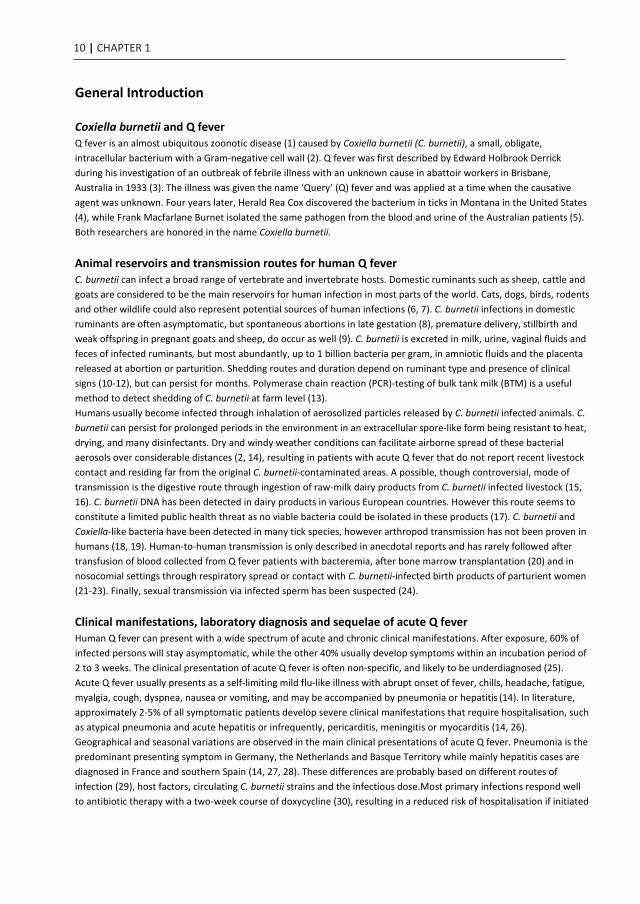
Coxiella burnetii and Q fever Q fever is an almost ubiquitous zoonotic disease (1) caused by Coxiella burnetii (C. burnetii), a small, obligate, intracellular bacterium with a Gram-negative cell wall (2). Q fever was first described by Edward Holbrook Derrick during his investigation of an outbreak of febrile illness with an unknown cause in abattoir workers in Brisbane, Australia in 1933 (3). The illness was given the name ‘Query’ (Q) fever and was applied at a time when the causative agent was unknown. Four years later, Herald Rea Cox discovered the bacterium in ticks in Montana in the United States (4), while Frank Macfarlane Burnet isolated the same pathogen from the blood and urine of the Australian patients (5). Both researchers are honored in the name Coxiella burnetii.
Animal reservoirs and transmission routes for human Q fever C. burnetii can infect a broad range of vertebrate and invertebrate hosts. Domestic ruminants such as sheep, cattle and goats are considered to be the main reservoirs for human infection in most parts of the world. Cats, dogs, birds, rodents and other wildlife could also represent potential sources of human infections (6, 7). C. burnetii infections in domestic ruminants are often asymptomatic, but spontaneous abortions in late gestation (8), premature delivery, stillbirth and weak offspring in pregnant goats and sheep, do occur as well (9). C. burnetii is excreted in milk, urine, vaginal fluids and feces of infected ruminants, but most abundantly, up to 1 billion bacteria per gram, in amniotic fluids and the placenta released at abortion or parturition. Shedding routes and duration depend on ruminant type and presence of clinical signs (10-12), but can persist for months. Polymerase chain reaction (PCR)-testing of bulk tank milk (BTM) is a useful method to detect shedding of C. burnetii at farm level (13). Humans usually become infected through inhalation of aerosolized particles released by C. burnetii infected animals. C. burnetii can persist for prolonged periods in the environment in an extracellular spore-like form being resistant to heat, drying, and many disinfectants. Dry and windy weather conditions can facilitate airborne spread of these bacterial aerosols over considerable distances (2, 14), resulting in patients with acute Q fever that do not report recent livestock contact and residing far from the original C. burnetii-contaminated areas. A possible, though controversial, mode of transmission is the digestive route through ingestion of raw-milk dairy products from C. burnetii infected livestock (15, 16). C. burnetii DNA has been detected in dairy products in various European countries. However this route seems to constitute a limited public health threat as no viable bacteria could be isolated in these products (17). C. burnetii and Coxiella-like bacteria have been detected in many tick species, however arthropod transmission has not been proven in humans (18, 19). Human-to-human transmission is only described in anecdotal reports and has rarely followed after transfusion of blood collected from Q fever patients with bacteremia, after bone marrow transplantation (20) and in nosocomial settings through respiratory spread or contact with C. burnetii-infected birth products of parturient women (21-23). Finally, sexual transmission via infected sperm has been suspected (24).
Clinical manifestations, laboratory diagnosis and sequelae of acute Q fever Human Q fever can present with a wide spectrum of acute and chronic clinical manifestations. After exposure, 60% of infected persons will stay asymptomatic, while the other 40% usually develop symptoms within an incubation period of 2 to 3 weeks. The clinical presentation of acute Q fever is often non-specific, and likely to be underdiagnosed (25). Acute Q fever usually presents as a self-limiting mild flu-like illness with abrupt onset of fever, chills, headache, fatigue, myalgia, cough, dyspnea, nausea or vomiting, and may be accompanied by pneumonia or hepatitis (14). In literature, approximately 2-5% of all symptomatic patients develop severe clinical manifestations that require hospitalisation, such as atypical pneumonia and acute hepatitis or infrequently, pericarditis, meningitis or myocarditis (14, 26). Geographical and seasonal variations are observed in the main clinical presentations of acute Q fever. Pneumonia is the predominant presenting symptom in Germany, the Netherlands and Basque Territory while mainly hepatitis cases are diagnosed in France and southern Spain (14, 27, 28). These differences are probably based on different routes of infection (29), host factors, circulating C. burnetii strains and the infectious dose.Most primary infections respond well to antibiotic therapy with a two-week course of doxycycline (30), resulting in a reduced risk of hospitalisation if initiated
within the first week of symptoms (31). The case fatality is reported around 1% in hospitalized acute Q fever cases (26, 32), but has not been thoroughly studied in large epidemic settings. Symptomatic cases are more likely to occur in adults, and more in males than in females. Pregnant women are less likely to be symptomatic (33). Children seem to have milder disease (34) but may also have a lower rate of infection after community exposure compared to adults (35). Q fever fatigue syndrome (QFS) is the most frequently reported sequela in approximately 20% of patients with symptomatic acute Q fever (36). It is characterised by long-term incapacitating fatigue, according to some definitions at least during 6 months, with no sign of a persistent C. burnetii infection. The severity of the primary infection appears a predictor of long-term reduced health status (36). A randomized clinical trial comparing the efficacy of doxycycline and cognitive behavioral therapy (CBT) versus placebo for the treatment of QFS shows that CBT is effective in reducing fatigue severity. Long-term treatment with doxycycline does not reduce fatigue severity compared to placebo (37).
Laboratory diagnosis of acute Q fever Various serological methods, such as immunofluorescence assay (IFA) test, complement fixation test (CFT) or enzyme-linked immunosorbent assay (ELISA) can be used to establish the diagnosis of acute Q fever (38). C. burnetii displays antigenic phase variation. Antibodies are expressed against phase 2 antigens during the acute infection and against phase 1 antigens in an established infection. For both antigens, IgM antibody production precedes IgG production, and thus three phases are distinguished in acute Q fever: a seronegative phase of 7 to 15 days after symptom onset, followed by IgM and IgG phase 2 seroconversion during the acute C. burnetii infection and subsequent IgM and IgG phase 1 seroconversion in the established infection. Molecular detection of C. burnetii DNA by PCR is an indispensable method for early diagnosis of acute Q fever as PCR is highly sensitive in serum during the first days after symptom onset, but rapidly declines to undetectable levels as the serologic response develops (39). Persistently high titers of IgG phase 1 antibodies are associated with chronic Q fever.
Chronic Q fever and persistent C. burnetii infection Approximately 1-2% of symptomatic acute Q fever cases will develop chronic Q fever, a potentially lethal disease that manifests itself usually within the first year after primary infection, but can also present years later (40). Persons with underlying conditions, especially those with pre-existing cardiac valve defects, vascular grafts or aneurysms, immunocompromised and pregnant women, are at risk for progression to persistent focalized C. burnetii infection manifested as vascular infections or as latent endocarditis that may take 10-15 years to develop (41). During the Dutch Q fever epidemic, vascular infections were the most common manifestation of a persistent infection, followed by endocarditis (42), in contrast to France where endocarditis is most common (43). There is a current lack of consensus whether the distinction between ‘acute’ and ‘chronic’ Q fever is still valid, as both the virulence of the C. burnetii strain and host-specific risk factors increasing host susceptibility, may influence the clinical presentation. Some researchers advocate for more precise qualifications of different clinical forms of Q fever and long-term complications of persistent infection (43).
Occupational Q fever and seroprevalence studies Q fever is a recognized occupational zoonosis, as illustrated by the first description of Q fever in a population of slaughterhouse workers (3). Sporadic cases or occupational Q fever clusters have occurred in persons working with livestock or animal products, such as farmers, veterinarians, animal attendants, hunters, sheep shearers, wool workers and slaughterhouse workers. Also laboratory staff cultivating C. burnetii or doing animal experiments using sheep or sheep placentas (44) have occupational risk to acquire C. burnetii infection. Imported Q fever has been reported in military personnel returning from field missions in endemic areas (45). In occupational groups working with infected livestock or in a high-risk environment for C. burnetii transmission, infection may occur for example through exposure during parturition, manure and waste removal, slaughter, animal product handling and consumption of unpasteurized milk. However, the probability of transmission depends on the animal health status, different activities carried out by the employee, contact frequency with animals and animal products and preventive measures taken (46). Appropriate health education in veterinary-associated populations might also reduce the risk of infection (47).

1
GENERAL INTRODUCTION AND OUTLINE THESIS | 11
General Introduction
Coxiella burnetii and Q fever Q fever is an almost ubiquitous zoonotic disease (1) caused by Coxiella burnetii (C. burnetii), a small, obligate, intracellular bacterium with a Gram-negative cell wall (2). Q fever was first described by Edward Holbrook Derrick during his investigation of an outbreak of febrile illness with an unknown cause in abattoir workers in Brisbane, Australia in 1933 (3). The illness was given the name ‘Query’ (Q) fever and was applied at a time when the causative agent was unknown. Four years later, Herald Rea Cox discovered the bacterium in ticks in Montana in the United States (4), while Frank Macfarlane Burnet isolated the same pathogen from the blood and urine of the Australian patients (5). Both researchers are honored in the name Coxiella burnetii.
Animal reservoirs and transmission routes for human Q fever C. burnetii can infect a broad range of vertebrate and invertebrate hosts. Domestic ruminants such as sheep, cattle and goats are considered to be the main reservoirs for human infection in most parts of the world. Cats, dogs, birds, rodents and other wildlife could also represent potential sources of human infections (6, 7). C. burnetii infections in domestic ruminants are often asymptomatic, but spontaneous abortions in late gestation (8), premature delivery, stillbirth and weak offspring in pregnant goats and sheep, do occur as well (9). C. burnetii is excreted in milk, urine, vaginal fluids and feces of infected ruminants, but most abundantly, up to 1 billion bacteria per gram, in amniotic fluids and the placenta released at abortion or parturition. Shedding routes and duration depend on ruminant type and presence of clinical signs (10-12), but can persist for months. Polymerase chain reaction (PCR)-testing of bulk tank milk (BTM) is a useful method to detect shedding of C. burnetii at farm level (13). Humans usually become infected through inhalation of aerosolized particles released by C. burnetii infected animals. C. burnetii can persist for prolonged periods in the environment in an extracellular spore-like form being resistant to heat, drying, and many disinfectants. Dry and windy weather conditions can facilitate airborne spread of these bacterial aerosols over considerable distances (2, 14), resulting in patients with acute Q fever that do not report recent livestock contact and residing far from the original C. burnetii-contaminated areas. A possible, though controversial, mode of transmission is the digestive route through ingestion of raw-milk dairy products from C. burnetii infected livestock (15, 16). C. burnetii DNA has been detected in dairy products in various European countries. However this route seems to constitute a limited public health threat as no viable bacteria could be isolated in these products (17). C. burnetii and Coxiella-like bacteria have been detected in many tick species, however arthropod transmission has not been proven in humans (18, 19). Human-to-human transmission is only described in anecdotal reports and has rarely followed after transfusion of blood collected from Q fever patients with bacteremia, after bone marrow transplantation (20) and in nosocomial settings through respiratory spread or contact with C. burnetii-infected birth products of parturient women (21-23). Finally, sexual transmission via infected sperm has been suspected (24).
Clinical manifestations, laboratory diagnosis and sequelae of acute Q fever Human Q fever can present with a wide spectrum of acute and chronic clinical manifestations. After exposure, 60% of infected persons will stay asymptomatic, while the other 40% usually develop symptoms within an incubation period of 2 to 3 weeks. The clinical presentation of acute Q fever is often non-specific, and likely to be underdiagnosed (25). Acute Q fever usually presents as a self-limiting mild flu-like illness with abrupt onset of fever, chills, headache, fatigue, myalgia, cough, dyspnea, nausea or vomiting, and may be accompanied by pneumonia or hepatitis (14). In literature, approximately 2-5% of all symptomatic patients develop severe clinical manifestations that require hospitalisation, such as atypical pneumonia and acute hepatitis or infrequently, pericarditis, meningitis or myocarditis (14, 26). Geographical and seasonal variations are observed in the main clinical presentations of acute Q fever. Pneumonia is the predominant presenting symptom in Germany, the Netherlands and Basque Territory while mainly hepatitis cases are diagnosed in France and southern Spain (14, 27, 28). These differences are probably based on different routes of infection (29), host factors, circulating C. burnetii strains and the infectious dose.Most primary infections respond well to antibiotic therapy with a two-week course of doxycycline (30), resulting in a reduced risk of hospitalisation if initiated
within the first week of symptoms (31). The case fatality is reported around 1% in hospitalized acute Q fever cases (26, 32), but has not been thoroughly studied in large epidemic settings. Symptomatic cases are more likely to occur in adults, and more in males than in females. Pregnant women are less likely to be symptomatic (33). Children seem to have milder disease (34) but may also have a lower rate of infection after community exposure compared to adults (35). Q fever fatigue syndrome (QFS) is the most frequently reported sequela in approximately 20% of patients with symptomatic acute Q fever (36). It is characterised by long-term incapacitating fatigue, according to some definitions at least during 6 months, with no sign of a persistent C. burnetii infection. The severity of the primary infection appears a predictor of long-term reduced health status (36). A randomized clinical trial comparing the efficacy of doxycycline and cognitive behavioral therapy (CBT) versus placebo for the treatment of QFS shows that CBT is effective in reducing fatigue severity. Long-term treatment with doxycycline does not reduce fatigue severity compared to placebo (37).
Laboratory diagnosis of acute Q fever Various serological methods, such as immunofluorescence assay (IFA) test, complement fixation test (CFT) or enzyme-linked immunosorbent assay (ELISA) can be used to establish the diagnosis of acute Q fever (38). C. burnetii displays antigenic phase variation. Antibodies are expressed against phase 2 antigens during the acute infection and against phase 1 antigens in an established infection. For both antigens, IgM antibody production precedes IgG production, and thus three phases are distinguished in acute Q fever: a seronegative phase of 7 to 15 days after symptom onset, followed by IgM and IgG phase 2 seroconversion during the acute C. burnetii infection and subsequent IgM and IgG phase 1 seroconversion in the established infection. Molecular detection of C. burnetii DNA by PCR is an indispensable method for early diagnosis of acute Q fever as PCR is highly sensitive in serum during the first days after symptom onset, but rapidly declines to undetectable levels as the serologic response develops (39). Persistently high titers of IgG phase 1 antibodies are associated with chronic Q fever.
Chronic Q fever and persistent C. burnetii infection Approximately 1-2% of symptomatic acute Q fever cases will develop chronic Q fever, a potentially lethal disease that manifests itself usually within the first year after primary infection, but can also present years later (40). Persons with underlying conditions, especially those with pre-existing cardiac valve defects, vascular grafts or aneurysms, immunocompromised and pregnant women, are at risk for progression to persistent focalized C. burnetii infection manifested as vascular infections or as latent endocarditis that may take 10-15 years to develop (41). During the Dutch Q fever epidemic, vascular infections were the most common manifestation of a persistent infection, followed by endocarditis (42), in contrast to France where endocarditis is most common (43). There is a current lack of consensus whether the distinction between ‘acute’ and ‘chronic’ Q fever is still valid, as both the virulence of the C. burnetii strain and host-specific risk factors increasing host susceptibility, may influence the clinical presentation. Some researchers advocate for more precise qualifications of different clinical forms of Q fever and long-term complications of persistent infection (43).
Occupational Q fever and seroprevalence studies Q fever is a recognized occupational zoonosis, as illustrated by the first description of Q fever in a population of slaughterhouse workers (3). Sporadic cases or occupational Q fever clusters have occurred in persons working with livestock or animal products, such as farmers, veterinarians, animal attendants, hunters, sheep shearers, wool workers and slaughterhouse workers. Also laboratory staff cultivating C. burnetii or doing animal experiments using sheep or sheep placentas (44) have occupational risk to acquire C. burnetii infection. Imported Q fever has been reported in military personnel returning from field missions in endemic areas (45). In occupational groups working with infected livestock or in a high-risk environment for C. burnetii transmission, infection may occur for example through exposure during parturition, manure and waste removal, slaughter, animal product handling and consumption of unpasteurized milk. However, the probability of transmission depends on the animal health status, different activities carried out by the employee, contact frequency with animals and animal products and preventive measures taken (46). Appropriate health education in veterinary-associated populations might also reduce the risk of infection (47).

12 | CHAPTER 1
Point-source outbreaks have been reported after the annual Muslim sheep feast (73) or after large public gatherings where pregnant small ruminants were exhibited and lambed at the occasion, shedding large amounts of C. burnetii (74). Geographical clusters of human Q fever in the community are also reported where no definite animal source could be identified (33, 75, 76). Epidemiological investigations can be complicated by so-called universal exposure, by which most or all persons are exposed to the same suspected sources of infection (77). Occupational outbreaks have occurred in various high-risk settings, such as in abattoirs (71, 78, 79), research laboratories using sheep as experimental animals (80-82) or recently in staff working in a ‘live cell therapy’ clinic using sheep fetal cells for human injection (83). Outbreaks have also occurred in industrial settings where occupational exposure was unexpected such as in a renovated office due to contaminated strawboard (84), a cosmetics supply factory (85) or a waste-sorting plant with exposure to animal carcasses as urban waste (86).
Sporadic Q fever cases in the Netherlands: the situation until 2006 In 1955, Kaplan and Bertagna reported the existence of Q fever in 51 countries on five continents (87). It was concluded that the disease was not present in the Netherlands as 2411 human sera including 664 patients with atypical pneumonia, 524 cattle sera and 294 sera from guinea-pigs and rabbits tested negative in a complement fixation test (CFT) (88). The first case report describing Q fever in the Netherlands dates from 1956, describing 3 human cases, including one butcher, with an atypical pneumonia (89-91). Acute Q fever is a notifiable disease in the Netherlands since 1975. Until 2006, Q fever was rarely notified in The Netherlands, with an average of 17 cases (range 1-32) annually (92). The majority of these cases occurred in persons with an occupational risk, such as farmers and veterinarians. Unlike other European countries, such as France, Spain, Germany and the United Kingdom, no Q fever outbreaks had occurred in the Netherlands. Only a small cluster of imported Q fever occurred in Dutch tourists returning from a farm holiday in France in 2000 (93).
The Dutch Q fever epidemic, 2007-2009 An unprecedented large epidemic of Q fever caused by C. burnetii occurred in the Netherlands during three consecutive years from 2007 until 2009, resulting in the notification of more than 4,000 acute Q fever cases and a substantial disease burden in the community (94, 95) (Figure 2). On the basis of the notifications and seroconversions in blood donors, there was a ratio of one Q fever notification to 12.6 incident C. burnetii infections, corresponding to at least 50,000 individuals infected with C. burnetii during the Dutch Q fever epidemic (96). End of May 2007, a general practitioner in the small rural village of Herpen in Noord-Brabant province was confronted with a rapidly increasing number of patients presenting with respiratory illness and atypical pneumonia in his practice, initially attributed to Mycoplasma pneumoniae. After more in-depth diagnostics it turned out to be Q fever as the majority of these patients had a positive serology for acute C. burnetii infection (92). This village outbreak was the start of a large and protracted human Q fever epidemic in the southeastern part of the country for three consecutive epidemic years. In 2007, a total of 168 cases were notified, followed by 1,000 notified cases in 2008, mainly in residents of the province of Noord-Brabant. In 2009, a total of 2,354 cases was notified as the epidemic further expanded in the provinces of Noord-Brabant and Gelderland and spread to the neighboring provinces Limburg and Utrecht (Figure 2-3). Following drastic and ultimate veterinary control measures, a sharp decline in notified human cases was observed with 504 notified cases in 2010. The annual epidemic peaks occurred synchronic with the kidding and lambing seasons of dairy goats and sheep. The densely populated province of Noord-Brabant with 2.4 million inhabitants was mostly affected (Figure 3). The risk to acquire an acute C. burnetii infection seemed related to the proximity of nearby dairy goat farms to the residential addresses of cases. In 2005, veterinary C. burnetii was diagnosed for the first time as a cause of abortion at two dairy goat farms, using immunohistochemistry on sections of placenta (97). During the period 2005-2009, abortion waves due to C. burnetii were confirmed on 26 dairy goat farms and in addition cases of C. burnetii-related abortion were confirmed at two dairy sheep farms (Figure 4). Retrospective syndromic surveillance using hospital discharge diagnosis data suggested sporadic occurrence of human Q fever clusters (pneumonia and hepatitis) in the southern region of the Netherlands that remained unrecognized since 2005 until May 2007 (98).
Physicians should consider the risk of infection with C. burnetii in patients with Q fever compatible symptoms, especially in those with potential occupational exposures (48). Seroprevalence studies assessing the presence of C. burnetii IgG phase 1 and phase 2 antibodies using IFA or ELISA have been carried out in various livestock-associated occupational groups, such as in farmers (49), agricultural workers (50), slaughterhouse workers (51), shepherds (52), veterinarians (53, 54), veterinary students (55, 56), foresters (57), hunters (58) and in workers processing livestock-associated products such as wool or hides (59). In general, seroprevalence estimates in occupational groups associated with livestock are much higher than estimates in the general population or in blood donors, reflecting the inherent occupational risks (44). However, it remains difficult to compare these estimates between occupational groups as different population samples, serological methods, diagnostic algorithms and cut-off values are used, reflecting a lack of standardization in interpretation of serology results (60, 61).
The epidemic potential of C. burnetii C. burnetii is a pathogen with the potential to cause epidemics due to its relative ease of transmission, environmental stability, high virulence, low infective dose and airborne route of transmission (62). Because of these features, the Centers for Disease Control and Prevention (CDC) in the United States has classified C. burnetii as a category B biological threat agent (63). Seasonal patterns of human Q fever usually show a spring peak in endemic European countries reflecting the lambing season or peak after the rainy season in tropical areas, as the epidemiology of this zoonotic infection in humans reflects the circulation of C. burnetii in livestock and wildlife. Long-term changes in Q fever seasonal patterns may reflect changes in animal husbandry (64). Q fever outbreaks in community and occupational settings have been reported in Europe, North America, the Middle East and Australia (Figure 1). Infected sheep or goats herds are the most implicated animal outbreak source (65). To a much lesser extent, cattle, parturient cats and dogs, pigeons, fallow deer and wild rabbits have caused small Q fever clusters, mainly in household settings (66-70). Community outbreaks can occur in isolated rural regions, but can also affect numerous persons living in semi-rural or urban areas downwind from nearby ruminant grazing areas, livestock farms or abattoirs where C. burnetii has become aerosolized (71, 72). Figure 1. Location and size of acute Q fever outbreaks in Europe and worldwide, 1980-2015 (n=111)*
*outbreaks were included if ≥10 confirmed acute Q fever cases (clustered in time, place and person) were mentioned in published outbreak reports or research articles in English-language medical literature
1
GENERAL INTRODUCTION AND OUTLINE THESIS | 13
Point-source outbreaks have been reported after the annual Muslim sheep feast (73) or after large public gatherings where pregnant small ruminants were exhibited and lambed at the occasion, shedding large amounts of C. burnetii (74). Geographical clusters of human Q fever in the community are also reported where no definite animal source could be identified (33, 75, 76). Epidemiological investigations can be complicated by so-called universal exposure, by which most or all persons are exposed to the same suspected sources of infection (77). Occupational outbreaks have occurred in various high-risk settings, such as in abattoirs (71, 78, 79), research laboratories using sheep as experimental animals (80-82) or recently in staff working in a ‘live cell therapy’ clinic using sheep fetal cells for human injection (83). Outbreaks have also occurred in industrial settings where occupational exposure was unexpected such as in a renovated office due to contaminated strawboard (84), a cosmetics supply factory (85) or a waste-sorting plant with exposure to animal carcasses as urban waste (86).
Sporadic Q fever cases in the Netherlands: the situation until 2006 In 1955, Kaplan and Bertagna reported the existence of Q fever in 51 countries on five continents (87). It was concluded that the disease was not present in the Netherlands as 2411 human sera including 664 patients with atypical pneumonia, 524 cattle sera and 294 sera from guinea-pigs and rabbits tested negative in a complement fixation test (CFT) (88). The first case report describing Q fever in the Netherlands dates from 1956, describing 3 human cases, including one butcher, with an atypical pneumonia (89-91). Acute Q fever is a notifiable disease in the Netherlands since 1975. Until 2006, Q fever was rarely notified in The Netherlands, with an average of 17 cases (range 1-32) annually (92). The majority of these cases occurred in persons with an occupational risk, such as farmers and veterinarians. Unlike other European countries, such as France, Spain, Germany and the United Kingdom, no Q fever outbreaks had occurred in the Netherlands. Only a small cluster of imported Q fever occurred in Dutch tourists returning from a farm holiday in France in 2000 (93).
The Dutch Q fever epidemic, 2007-2009 An unprecedented large epidemic of Q fever caused by C. burnetii occurred in the Netherlands during three consecutive years from 2007 until 2009, resulting in the notification of more than 4,000 acute Q fever cases and a substantial disease burden in the community (94, 95) (Figure 2). On the basis of the notifications and seroconversions in blood donors, there was a ratio of one Q fever notification to 12.6 incident C. burnetii infections, corresponding to at least 50,000 individuals infected with C. burnetii during the Dutch Q fever epidemic (96). End of May 2007, a general practitioner in the small rural village of Herpen in Noord-Brabant province was confronted with a rapidly increasing number of patients presenting with respiratory illness and atypical pneumonia in his practice, initially attributed to Mycoplasma pneumoniae. After more in-depth diagnostics it turned out to be Q fever as the majority of these patients had a positive serology for acute C. burnetii infection (92). This village outbreak was the start of a large and protracted human Q fever epidemic in the southeastern part of the country for three consecutive epidemic years. In 2007, a total of 168 cases were notified, followed by 1,000 notified cases in 2008, mainly in residents of the province of Noord-Brabant. In 2009, a total of 2,354 cases was notified as the epidemic further expanded in the provinces of Noord-Brabant and Gelderland and spread to the neighboring provinces Limburg and Utrecht (Figure 2-3). Following drastic and ultimate veterinary control measures, a sharp decline in notified human cases was observed with 504 notified cases in 2010. The annual epidemic peaks occurred synchronic with the kidding and lambing seasons of dairy goats and sheep. The densely populated province of Noord-Brabant with 2.4 million inhabitants was mostly affected (Figure 3). The risk to acquire an acute C. burnetii infection seemed related to the proximity of nearby dairy goat farms to the residential addresses of cases. In 2005, veterinary C. burnetii was diagnosed for the first time as a cause of abortion at two dairy goat farms, using immunohistochemistry on sections of placenta (97). During the period 2005-2009, abortion waves due to C. burnetii were confirmed on 26 dairy goat farms and in addition cases of C. burnetii-related abortion were confirmed at two dairy sheep farms (Figure 4). Retrospective syndromic surveillance using hospital discharge diagnosis data suggested sporadic occurrence of human Q fever clusters (pneumonia and hepatitis) in the southern region of the Netherlands that remained unrecognized since 2005 until May 2007 (98).
Physicians should consider the risk of infection with C. burnetii in patients with Q fever compatible symptoms, especially in those with potential occupational exposures (48). Seroprevalence studies assessing the presence of C. burnetii IgG phase 1 and phase 2 antibodies using IFA or ELISA have been carried out in various livestock-associated occupational groups, such as in farmers (49), agricultural workers (50), slaughterhouse workers (51), shepherds (52), veterinarians (53, 54), veterinary students (55, 56), foresters (57), hunters (58) and in workers processing livestock-associated products such as wool or hides (59). In general, seroprevalence estimates in occupational groups associated with livestock are much higher than estimates in the general population or in blood donors, reflecting the inherent occupational risks (44). However, it remains difficult to compare these estimates between occupational groups as different population samples, serological methods, diagnostic algorithms and cut-off values are used, reflecting a lack of standardization in interpretation of serology results (60, 61).
The epidemic potential of C. burnetii C. burnetii is a pathogen with the potential to cause epidemics due to its relative ease of transmission, environmental stability, high virulence, low infective dose and airborne route of transmission (62). Because of these features, the Centers for Disease Control and Prevention (CDC) in the United States has classified C. burnetii as a category B biological threat agent (63). Seasonal patterns of human Q fever usually show a spring peak in endemic European countries reflecting the lambing season or peak after the rainy season in tropical areas, as the epidemiology of this zoonotic infection in humans reflects the circulation of C. burnetii in livestock and wildlife. Long-term changes in Q fever seasonal patterns may reflect changes in animal husbandry (64). Q fever outbreaks in community and occupational settings have been reported in Europe, North America, the Middle East and Australia (Figure 1). Infected sheep or goats herds are the most implicated animal outbreak source (65). To a much lesser extent, cattle, parturient cats and dogs, pigeons, fallow deer and wild rabbits have caused small Q fever clusters, mainly in household settings (66-70). Community outbreaks can occur in isolated rural regions, but can also affect numerous persons living in semi-rural or urban areas downwind from nearby ruminant grazing areas, livestock farms or abattoirs where C. burnetii has become aerosolized (71, 72). Figure 1. Location and size of acute Q fever outbreaks in Europe and worldwide, 1980-2015 (n=111)*
*outbreaks were included if ≥10 confirmed acute Q fever cases (clustered in time, place and person) were mentioned in published outbreak reports or research articles in English-language medical literature

14 | CHAPTER 1
More human clusters probably have remained undetected as was shown in the Livestock Farming and Neighbouring Residents’ Health study that found high C. burnetii IgG phase 2 prevalence, up to 10%, in residents of municipalities with no notified cases of acute Q fever during the Dutch Q fever epidemic (99). Figure 2. Acute Q fever notifications by month of illness onset, the Netherlands, 2007 –2016. (source: OSIRIS, RIVM)
Figure 3. Incidence of notified Q fever cases per 100,000 inhabitants by municipality, the Netherlands, 2007- 2010. (source: OSIRIS, RIVM).
Figure 4. Locations of dairy goat farms (n=27) and dairy sheep farms (n=2) with reported waves of spontaneous abortions caused by Coxiella burnetii, 2005–2010 (source: GD Animal Health).
Veterinary and public health control measures The Dutch Q fever epidemic emerged as an important nationwide human and veterinary public health challenge and gained worldwide attention due to its size, disease burden and high societal costs (100). On the European level, concerns were raised about contributing factors to the development of this large protracted Q fever epidemic (65, 94). Since the start of the Dutch epidemic, dairy goats at commercial goat farms reporting abortion waves due to C. burnetii were considered the primary animal source, as they were mainly located in the aforementioned areas where human cases occurred. The cyclic nature of the epidemic with multiple Q fever clusters in different areas in the south of the country, and the peaks during dry periods in spring strongly supported this hypothesis (101). During the past decades, goat farming in the Netherlands had undergone a large shift from mostly hobbyists to commercial dairy goat farms (Figure 5). In 1995, 76,000 goats were housed in the Netherlands, of which 56% stayed in commercial dairy goat farms. In comparison, in 2009, 375,000 goats were housed in the Netherlands, of which 80% stayed on about 350 commercial farms with between 200 and 10,000 adult goats. These farms are mainly located in the densely populated province of Noord-Brabant, close to one another and often border villages and cities. On these commercial farms, herd sizes had increased on average by about 600 animals per farm in 2007 when the Dutch Q fever epidemic started. Therefore, one of the putative causes of the emergence of Q fever in goats in the Netherlands was the intensive husbandry system in which dairy goats are kept. Before June 2008, abortion waves on small ruminant farms were reported on a voluntary basis to the Animal Health Service. It then became mandatory for farmers and private veterinarians to notify an unusual occurrence of abortions in dairy small ruminants. This mandatory notification could potentially facilitate the early detection of related human cases or clusters. A voluntary veterinary vaccination campaign with an inactivated phase I vaccine (Coxevac®,CEVA Santé Animale) started during the fall of 2008 in the south of the Netherlands, targeting the high-risk Q fever areas to lower abortion rates and limit the spread of the infection by decreasing the bacterial load in vaginal mucus, feces and milk in dairy goats. The new upsurge and expansion of Q fever cases in 2009 warranted the implementation of extended veterinary control measures, such as a nationwide mandatory hygiene protocol and BTM-monitoring as an additional criterion for veterinary notification. In December 2009 it was decided to cull all gestating goats on 88 BTM-positive small ruminant farms determined by PCR while the remaining dairy goats and sheep nationwide were given compulsory vaccination. Limited human control options were available to prevent clinical human disease during this Q fever epidemic. There is only one human Q fever vaccine (Q-VAX) that is currently licensed in Australia. Since 2002, this vaccine has been used in Australia in a targeted Q fever vaccination program offered to persons with an occupational risk to acquire a C. burnetii infection, such as livestock farmers and veterinarians (102), with different uptake (103). The Dutch government decided to offer this unlicensed Q-VAX vaccine to patient groups at high risk of Q fever complications in 2010-2011 (104) as a one-off vaccination campaign. Vaccination of high-risk occupational groups such as ruminant farmers, culling workers and veterinarians was not recommended during the Dutch Q fever epidemic.

1
GENERAL INTRODUCTION AND OUTLINE THESIS | 15
More human clusters probably have remained undetected as was shown in the Livestock Farming and Neighbouring Residents’ Health study that found high C. burnetii IgG phase 2 prevalence, up to 10%, in residents of municipalities with no notified cases of acute Q fever during the Dutch Q fever epidemic (99). Figure 2. Acute Q fever notifications by month of illness onset, the Netherlands, 2007 –2016. (source: OSIRIS, RIVM)
Figure 3. Incidence of notified Q fever cases per 100,000 inhabitants by municipality, the Netherlands, 2007- 2010. (source: OSIRIS, RIVM).
Figure 4. Locations of dairy goat farms (n=27) and dairy sheep farms (n=2) with reported waves of spontaneous abortions caused by Coxiella burnetii, 2005–2010 (source: GD Animal Health).
Veterinary and public health control measures The Dutch Q fever epidemic emerged as an important nationwide human and veterinary public health challenge and gained worldwide attention due to its size, disease burden and high societal costs (100). On the European level, concerns were raised about contributing factors to the development of this large protracted Q fever epidemic (65, 94). Since the start of the Dutch epidemic, dairy goats at commercial goat farms reporting abortion waves due to C. burnetii were considered the primary animal source, as they were mainly located in the aforementioned areas where human cases occurred. The cyclic nature of the epidemic with multiple Q fever clusters in different areas in the south of the country, and the peaks during dry periods in spring strongly supported this hypothesis (101). During the past decades, goat farming in the Netherlands had undergone a large shift from mostly hobbyists to commercial dairy goat farms (Figure 5). In 1995, 76,000 goats were housed in the Netherlands, of which 56% stayed in commercial dairy goat farms. In comparison, in 2009, 375,000 goats were housed in the Netherlands, of which 80% stayed on about 350 commercial farms with between 200 and 10,000 adult goats. These farms are mainly located in the densely populated province of Noord-Brabant, close to one another and often border villages and cities. On these commercial farms, herd sizes had increased on average by about 600 animals per farm in 2007 when the Dutch Q fever epidemic started. Therefore, one of the putative causes of the emergence of Q fever in goats in the Netherlands was the intensive husbandry system in which dairy goats are kept. Before June 2008, abortion waves on small ruminant farms were reported on a voluntary basis to the Animal Health Service. It then became mandatory for farmers and private veterinarians to notify an unusual occurrence of abortions in dairy small ruminants. This mandatory notification could potentially facilitate the early detection of related human cases or clusters. A voluntary veterinary vaccination campaign with an inactivated phase I vaccine (Coxevac®,CEVA Santé Animale) started during the fall of 2008 in the south of the Netherlands, targeting the high-risk Q fever areas to lower abortion rates and limit the spread of the infection by decreasing the bacterial load in vaginal mucus, feces and milk in dairy goats. The new upsurge and expansion of Q fever cases in 2009 warranted the implementation of extended veterinary control measures, such as a nationwide mandatory hygiene protocol and BTM-monitoring as an additional criterion for veterinary notification. In December 2009 it was decided to cull all gestating goats on 88 BTM-positive small ruminant farms determined by PCR while the remaining dairy goats and sheep nationwide were given compulsory vaccination. Limited human control options were available to prevent clinical human disease during this Q fever epidemic. There is only one human Q fever vaccine (Q-VAX) that is currently licensed in Australia. Since 2002, this vaccine has been used in Australia in a targeted Q fever vaccination program offered to persons with an occupational risk to acquire a C. burnetii infection, such as livestock farmers and veterinarians (102), with different uptake (103). The Dutch government decided to offer this unlicensed Q-VAX vaccine to patient groups at high risk of Q fever complications in 2010-2011 (104) as a one-off vaccination campaign. Vaccination of high-risk occupational groups such as ruminant farmers, culling workers and veterinarians was not recommended during the Dutch Q fever epidemic.

16 | CHAPTER 1
Figure 5. Number of dairy goats, dairy goat farms and average herd size, The Netherlands, 2000-2016. (source: Statistics Netherlands)*
* There were 343 professional dairy goat farms (≥32 dairy goats) in 2015 and 358 professional dairy goat farms in 2016 (median: 1.032 goats; mean: 1.226 goats) in the Netherlands. (source: M. Gonggrijp, H. Brouwer, R. van den Brom, P. Vellema. Data analysis small ruminants 2016. Final report.Aug 2017, GD Animal Health)
The aftermath: 2011-2016 The number of notified Q fever cases further decreased to 81 cases in 2011 and 66 cases in 2012, suggesting that the intervention measures, including continued annual vaccination of all dairy goat and sheep herds, were effective. From 2013 until 2016, the number of notified cases stayed low at pre-epidemic levels, with 19 in 2013, 28 in 2014, 22 in 2015 and 9 in 2016, respectively (Figure 2). During this period, no patient clusters with acute Q fever have been notified. A molecular link to goats and sheep based on MLVA-genotyping was not established until the aftermath of the Dutch epidemic (105, 106). A single clone of C. burnetii designated CbNL01 was responsible for the Dutch outbreak (105). The same clone was observed in Belgium without an increase in incidence of human Q fever (107). In 2016, the complete genome sequence of the C. burnetii outbreak strain in goats (NL3262) and that of an epidemiologically linked strain of a Dutch patient with a chronic Q fever infection, both having the outbreak-related CbNL01 MLVA genotype, was published (108). Nationwide compulsory vaccination for all commercial dairy small ruminant farms and for small ruminant farms with a public function has been in place since 2010, and BTM-monitoring has continued. In the aftermath of the Dutch Q fever epidemic, the focus shifted from diagnosing acute Q fever patients to early identification and treatment of patients with chronic Q fever. Even though chronic Q fever is not notifiable, a separate national database is maintained for research purposes, including over 300 patients with confirmed or probable chronic Q fever patients (42). Recommendations for serological and clinical follow-up in acute Q fever patients regardless of compatible clinical presentation have been made (109, 110). Screening of the Dutch general population for chronic C. burnetii infection is under debate based on ongoing cost-effectiveness analyses and expected benefit.
The need and benefit of the One Health approach The most important lesson learned from the Dutch Q fever epidemic is that a close cooperation between the human and veterinary fields is essential for responding to outbreaks of zoonotic diseases (111). The Dutch Q fever epidemic intensified professional collaboration of multiple institutes and joined infectious disease control managers, policymakers and researchers from the human and veterinary domains. The involvement of two different ministries in this Q fever epidemic demonstrated key organizational differences in response structures, with a highly centralized veterinary domain around the Ministry of Agriculture and a strongly decentralized operational public health response. The Dutch Q fever epidemic has ignited fierce discussions about the perceived lack of cross-sectoral collaboration in the approach of zoonotic outbreaks, like occurred in other zoonotic outbreaks or major food safety events abroad such as the national HUS outbreak in Germany in 2014 (112). This prerequisite of a ‘One Health’ approach was one of the conclusions made by the official Q fever outbreak evaluation committee in 2010 that evaluated the process and actions of the Dutch government with respect to the Q fever crisis (113). A national zoonosis structure was implemented with an interdisciplinary early warning forum that meets monthly since 2011 to early identify signals and carry out risk assessments of emerging zoonoses. This regular and more informal contact has shortened communication lines and facilitated exchange of specific disease knowledge and diagnostic tools, benefiting overall outbreak management (114, 115).
Outline and aim of the thesis This thesis describes the main results of an integrated human-veterinary research project in all three relevant ruminant species and their farm households carried out between 2009 and 2011 with the aim to study the prevalence and risk factors for C. burnetii infection. This so-called ‘Q-VIVE’ project included dairy goat farms (141 participating farms), dairy sheep farms (14), non-dairy sheep farms (119), and dairy cattle farms (311). In contrast to many previous studies, where only human cases or animals were studied in isolation, this study uniquely integrated data collection for humans, animals and the environment. The presence of C. burnetii antibodies was studied in a subset of small ruminants (dairy goats, dairy sheep, non-dairy sheep) or bulk milk (dairy cattle) and in a maximum of three persons of the farm household, including employees. For some dairy sheep and dairy goat farms, also the barn and the barn environment were sampled for presence of the bacterium. In addition, the seroprevalence and risk factors for presence of C. burnetii antibodies in other livestock-associated occupational groups such as in culling workers, veterinarians and veterinary students were studied in separate cross-sectional studies. Furthermore, we estimated the seroprevalence of C. burnetii antibodies in the general Dutch population just before the start of the Dutch Q fever epidemic in 2006-2007. Several in-depth outbreak investigations of small ruminant-associated Q fever clusters and community outbreaks carried out in 2008 and 2009, as part of the protracted Dutch Q fever epidemic, are reported in this thesis. In Chapter 2, the seroprevalence and associated risk factors for C. burnetii infection in the general population during the pre-epidemic period (2006-2007) is described and a longitudinal study in a cohort of acute Q fever patients in which we obtained more insight in the time course of IgM and IgG antibody responses to C. burnetii. In Chapter 3, several outbreak investigations that were performed during the Q fever epidemic in 2007-2009 are described, including seroprevalence and risk factors for acquisition of acute Q fever. In Chapter 4 the results are presented of the Q-VIVE integrated human-veterinary sero-epidemiological studies on C. burnetii infection and associated risk factors on commercial farms in four ruminant sectors, both for farm households and their herds. In Chapter 5, the seroprevalence and associated risk factors of C. burnetii infection in Dutch livestock veterinarians and veterinary students are described in two seroepidemiological studies to assess the potential impact of Q fever. A general discussion of the findings of the present thesis is given in Chapter 6. Several recommendations are given in targeted approaches for future Q fever control, focusing on both primary (reduction of circulation in the ruminant reservoir) and secondary (reduction of transmission from infected animals to humans) preventive measures. In Chapter 7 the main findings of this thesis are summarized.

1
GENERAL INTRODUCTION AND OUTLINE THESIS | 17
Figure 5. Number of dairy goats, dairy goat farms and average herd size, The Netherlands, 2000-2016. (source: Statistics Netherlands)*
* There were 343 professional dairy goat farms (≥32 dairy goats) in 2015 and 358 professional dairy goat farms in 2016 (median: 1.032 goats; mean: 1.226 goats) in the Netherlands. (source: M. Gonggrijp, H. Brouwer, R. van den Brom, P. Vellema. Data analysis small ruminants 2016. Final report.Aug 2017, GD Animal Health)
The aftermath: 2011-2016 The number of notified Q fever cases further decreased to 81 cases in 2011 and 66 cases in 2012, suggesting that the intervention measures, including continued annual vaccination of all dairy goat and sheep herds, were effective. From 2013 until 2016, the number of notified cases stayed low at pre-epidemic levels, with 19 in 2013, 28 in 2014, 22 in 2015 and 9 in 2016, respectively (Figure 2). During this period, no patient clusters with acute Q fever have been notified. A molecular link to goats and sheep based on MLVA-genotyping was not established until the aftermath of the Dutch epidemic (105, 106). A single clone of C. burnetii designated CbNL01 was responsible for the Dutch outbreak (105). The same clone was observed in Belgium without an increase in incidence of human Q fever (107). In 2016, the complete genome sequence of the C. burnetii outbreak strain in goats (NL3262) and that of an epidemiologically linked strain of a Dutch patient with a chronic Q fever infection, both having the outbreak-related CbNL01 MLVA genotype, was published (108). Nationwide compulsory vaccination for all commercial dairy small ruminant farms and for small ruminant farms with a public function has been in place since 2010, and BTM-monitoring has continued. In the aftermath of the Dutch Q fever epidemic, the focus shifted from diagnosing acute Q fever patients to early identification and treatment of patients with chronic Q fever. Even though chronic Q fever is not notifiable, a separate national database is maintained for research purposes, including over 300 patients with confirmed or probable chronic Q fever patients (42). Recommendations for serological and clinical follow-up in acute Q fever patients regardless of compatible clinical presentation have been made (109, 110). Screening of the Dutch general population for chronic C. burnetii infection is under debate based on ongoing cost-effectiveness analyses and expected benefit.
The need and benefit of the One Health approach The most important lesson learned from the Dutch Q fever epidemic is that a close cooperation between the human and veterinary fields is essential for responding to outbreaks of zoonotic diseases (111). The Dutch Q fever epidemic intensified professional collaboration of multiple institutes and joined infectious disease control managers, policymakers and researchers from the human and veterinary domains. The involvement of two different ministries in this Q fever epidemic demonstrated key organizational differences in response structures, with a highly centralized veterinary domain around the Ministry of Agriculture and a strongly decentralized operational public health response. The Dutch Q fever epidemic has ignited fierce discussions about the perceived lack of cross-sectoral collaboration in the approach of zoonotic outbreaks, like occurred in other zoonotic outbreaks or major food safety events abroad such as the national HUS outbreak in Germany in 2014 (112). This prerequisite of a ‘One Health’ approach was one of the conclusions made by the official Q fever outbreak evaluation committee in 2010 that evaluated the process and actions of the Dutch government with respect to the Q fever crisis (113). A national zoonosis structure was implemented with an interdisciplinary early warning forum that meets monthly since 2011 to early identify signals and carry out risk assessments of emerging zoonoses. This regular and more informal contact has shortened communication lines and facilitated exchange of specific disease knowledge and diagnostic tools, benefiting overall outbreak management (114, 115).
Outline and aim of the thesis This thesis describes the main results of an integrated human-veterinary research project in all three relevant ruminant species and their farm households carried out between 2009 and 2011 with the aim to study the prevalence and risk factors for C. burnetii infection. This so-called ‘Q-VIVE’ project included dairy goat farms (141 participating farms), dairy sheep farms (14), non-dairy sheep farms (119), and dairy cattle farms (311). In contrast to many previous studies, where only human cases or animals were studied in isolation, this study uniquely integrated data collection for humans, animals and the environment. The presence of C. burnetii antibodies was studied in a subset of small ruminants (dairy goats, dairy sheep, non-dairy sheep) or bulk milk (dairy cattle) and in a maximum of three persons of the farm household, including employees. For some dairy sheep and dairy goat farms, also the barn and the barn environment were sampled for presence of the bacterium. In addition, the seroprevalence and risk factors for presence of C. burnetii antibodies in other livestock-associated occupational groups such as in culling workers, veterinarians and veterinary students were studied in separate cross-sectional studies. Furthermore, we estimated the seroprevalence of C. burnetii antibodies in the general Dutch population just before the start of the Dutch Q fever epidemic in 2006-2007. Several in-depth outbreak investigations of small ruminant-associated Q fever clusters and community outbreaks carried out in 2008 and 2009, as part of the protracted Dutch Q fever epidemic, are reported in this thesis. In Chapter 2, the seroprevalence and associated risk factors for C. burnetii infection in the general population during the pre-epidemic period (2006-2007) is described and a longitudinal study in a cohort of acute Q fever patients in which we obtained more insight in the time course of IgM and IgG antibody responses to C. burnetii. In Chapter 3, several outbreak investigations that were performed during the Q fever epidemic in 2007-2009 are described, including seroprevalence and risk factors for acquisition of acute Q fever. In Chapter 4 the results are presented of the Q-VIVE integrated human-veterinary sero-epidemiological studies on C. burnetii infection and associated risk factors on commercial farms in four ruminant sectors, both for farm households and their herds. In Chapter 5, the seroprevalence and associated risk factors of C. burnetii infection in Dutch livestock veterinarians and veterinary students are described in two seroepidemiological studies to assess the potential impact of Q fever. A general discussion of the findings of the present thesis is given in Chapter 6. Several recommendations are given in targeted approaches for future Q fever control, focusing on both primary (reduction of circulation in the ruminant reservoir) and secondary (reduction of transmission from infected animals to humans) preventive measures. In Chapter 7 the main findings of this thesis are summarized.

18 | CHAPTER 1
References (Chapter 1) 1. Hilbink F, Penrose M, Kovacova E, Kazar J. Q fever is absent from New Zealand. International journal of epidemiology.
1993;22(5):945-9. 2. Cutler SJ, Bouzid M, Cutler RR. Q fever. The Journal of infection. 2007;54(4):313-8. 3. Derrick EH. "Q" fever, a new fever entity: clinical features, diagnosis and laboratory investigation. Reviews of infectious
diseases. 1983;5(4):790-800. 4. Davis GE, Cox HR. A filter-passing infectious agent isolated from ticks. I. Isolation from Dermacentor andersoni, reactions in
animals, and filtration experiments. Public Health Rep. 1938;53:2259-67. 5. Burnet FM, Freeman M. Experimental studies on the virus of "Q" fever. Reviews of infectious diseases. 1983;5(4):800-8. 6. Meredith AL, Cleaveland SC, Denwood MJ, Brown JK, Shaw DJ. Coxiella burnetii (Q-Fever) Seroprevalence in Prey and
Predators in the United Kingdom: Evaluation of Infection in Wild Rodents, Foxes and Domestic Cats Using a Modified ELISA. Transboundary and emerging diseases. 2014.
7. Davoust B, Marie JL, Pommier de Santi V, Berenger JM, Edouard S, Raoult D. Three-toed sloth as putative reservoir of Coxiella burnetii, Cayenne, French Guiana. Emerging infectious diseases. 2014;20(10):1760-1. 8. Hogerwerf L, Courcoul A, Klinkenberg D, Beaudeau F, Vergu E, Nielen M. Dairy goat demography and Q fever infection
dynamics. Veterinary research. 2013;44:28. 9. Agerholm JS. Coxiella burnetii associated reproductive disorders in domestic animals--a critical review. Acta veterinaria
Scandinavica. 2013;55:13. 10. Arricau-Bouvery N, Rodolakis A. Is Q fever an emerging or re-emerging zoonosis? Veterinary research. 2005;36(3):327-49. 11. Rodolakis A, Berri M, Hechard C, Caudron C, Souriau A, Bodier CC, et al. Comparison of Coxiella burnetii shedding in milk of
dairy bovine, caprine, and ovine herds. Journal of dairy science. 2007;90(12):5352-60. 12. Rodolakis A. Q Fever in dairy animals. Annals of the New York Academy of Sciences. 2009;1166:90-3. 13. Bauer AE, Olivas S, Cooper M, Hornstra H, Keim P, Pearson T, et al. Estimated herd prevalence and sequence types of
Coxiella burnetii in bulk tank milk samples from commercial dairies in Indiana. BMC veterinary research. 2015;11:186. 14. Raoult D, Marrie T, Mege J. Natural history and pathophysiology of Q fever. The Lancet Infectious diseases. 2005;5(4):219-
226. 15. Krumbiegel ER, Wisniewski HJ. Q fever in the Milwaukee area. II. Consumption of infected raw milk by human volunteers.
Archives of environmental health. 1970;21(1):63-5. 16. Signs KA, Stobierski MG, Gandhi TN. Q fever cluster among raw milk drinkers in Michigan, 2011. Clinical infectious diseases.
2012;55(10):1387-9. 17. Eldin C, Angelakis E, Renvoise A, Raoult D. Coxiella burnetii DNA, but not viable bacteria, in dairy products in France. Am J
Trop Med Hyg. 2013;88(4):765-9. 18. Cooper A, Stephens J, Ketheesan N, Govan B. Detection of Coxiella burnetii DNA in wildlife and ticks in northern
Queensland, Australia. Vector borne and zoonotic diseases. 2013;13(1):12-6. 19. Duron O, Sidi-Boumedine K, Rousset E, Moutailler S, Jourdain E. The Importance of Ticks in Q Fever Transmission: What Has
(and Has Not) Been Demonstrated? Trends Parasitol. 2015;31(11):536-52. 20. Kanfer E, Farrag N, Price C, MacDonald D, Coleman J, Barrett AJ. Q fever following bone marrow transplantation. Bone
Marrow Transplant. 1988;3(2):165-6. 21. Amit S, Shinar S, Halutz O, Atiya-Nasagi Y, Giladi M. Suspected person-to-person transmission of Q fever among
hospitalized pregnant women. Clinical infectious diseases : an official publication of the Infectious Diseases Society of America. 2014;58(11):e146-7.
22. Osorio S, Sarria C, Gonzalez-Ruano P, Casal EC, Garcia A. Nosocomial transmission of Q fever. J Hosp Infect. 2003;54(2):162-163.
23. Raoult D, Stein A. Q fever during pregnancy--a risk for women, fetuses, and obstetricians. The New England journal of medicine. 1994;330(5):371.
24. Milazzo A, Hall R, Storm PA, Harris RJ, Winslow W, Marmion BP. Sexually transmitted Q fever. Clinical infectious diseases : 2001;33(3):399-402.
25. Porter SR, Czaplicki G, Mainil J, Guatteo R, Saegerman C. Q Fever: current state of knowledge and perspectives of research of a neglected zoonosis. Int J Microbiol. 2011;2011:248418.
26. Maurin M, Raoult D. Q fever. Clinical microbiology reviews. 1999;12(4):518-53. 27. Tissot Dupont H, Raoult D, Brouqui P, Janbon F, Peyramond D, Weiller PJ, et al. Epidemiologic features and clinical
presentation of acute Q fever in hospitalized patients: 323 French cases. Am J Med. 1992;93(4):427-34. 28. Espejo E, Gil-Diaz A, Oteo JA, Castillo-Rueda R, Garcia-Alvarez L, Santana-Baez S, et al. Clinical presentation of acute Q fever
in Spain: seasonal and geographical differences. Int J Infect Dis. 2014;26:162-4. 29. Marrie TJ, Stein A, Janigan D, Raoult D. Route of infection determines the clinical manifestations of acute Q fever. J Infect
Dis. 1996;173(2):484-7. 30. Kersh GJ. Antimicrobial therapies for Q fever. Expert review of anti-infective therapy. 2013;11(11):1207-14. 31. Dijkstra F, Riphagen-Dalhuisen J, Wijers N, Hak E, Van der Sande MA, Morroy G, et al. Antibiotic therapy for acute Q fever in
The Netherlands in 2007 and 2008 and its relation to hospitalization. Epidemiology and infection. 2011;139(9):1332-41. 32. Kampschreur LM, Wegdam-Blans MC, Thijsen SF, Groot CA, Schneeberger PM, Hollander AA, et al. Acute Q fever related in-
hospital mortality in the Netherlands. The Netherlands journal of medicine. 2010;68(12):408-13.
33. Tissot-Dupont H, Vaillant V, Rey S, Raoult D. Role of sex, age, previous valve lesion, and pregnancy in the clinical expression and outcome of Q fever after a large outbreak. Clinical infectious diseases. 2007;44(2):232-7.
34. Maltezou HC, Raoult D. Q fever in children. The Lancet Infectious diseases. 2002;2(11):686-91. 35. Hackert VH, Dukers-Muijrers NH, van Loo IH, Wegdam-Blans M, Somers C, Hoebe CJ. Coxiella burnetii infection is lower in
children than in adults after community exposure: overlooked cause of infrequent Q Fever reporting in the young. Pediatr Infect Dis J. 2015;34(12):1283-8.
36. Morroy G, Keijmel SP, Delsing CE, Bleijenberg G, Langendam M, Timen A, et al. Fatigue following acute Q-Fever: a systematic literature review. PloS one. 2016;11(5):e0155884.
37. Keijmel SP, Delsing CE, Bleijenberg G, van der Meer JWM, Donders RT, Leclercq M, et al. Effectiveness of Long-term Doxycycline Treatment and Cognitive-Behavioral Therapy on Fatigue Severity in Patients with Q Fever Fatigue Syndrome (Qure Study): A Randomized Controlled Trial. Clinical infectious diseases. 2017;64(8):998-1005.
38. Herremans T, Hogema BM, Nabuurs M, Peeters M, Wegdam-Blans M, Schneeberger P, et al. Comparison of the performance of IFA, CFA, and ELISA assays for the serodiagnosis of acute Q fever by quality assessment. Diagnostic microbiology and infectious disease. 2013;75(1):16-21.
39. Schneeberger PM, Hermans MH, van Hannen EJ, Schellekens JJ, Leenders AC, Wever PC. Real-time PCR with serum samples is indispensable for early diagnosis of acute Q fever. Clin Vaccine Immunol. 2010;17(2):286-90.
40. European Centre for Disease Prevention and Control: Technical Report: ECDC Risk Assessment on Q Fever 2010. Available: http://ecdc.europa.eu/en/publications/Publications/1005_TER_Risk_Assessment_Qfever.pdf.
41. Million M, Thuny F, Richet H, Raoult D. Long-term outcome of Q fever endocarditis: a 26-year personal survey. The Lancet Infectious diseases. 2010;10(8):527-35.
42. Kampschreur LM, Delsing CE, Groenwold RH, Wegdam-Blans MC, Bleeker-Rovers CP, de Jager-Leclercq MG, et al. Chronic Q fever in the Netherlands 5 years after the start of the Q fever epidemic: results from the Dutch chronic Q fever database. Journal of clinical microbiology. 2014;52(5):1637-43.
43. Eldin C, Melenotte C, Mediannikov O, Ghigo E, Million M, Edouard S, et al. From Q Fever to Coxiella burnetii Infection: a Paradigm Change. Clinical microbiology reviews. 2017;30(1):115-90.
44. Dorko E, Rimarova K, Pilipcinec E. Influence of the environment and occupational exposure on the occurrence of Q fever. Central European journal of public health. 2012;20(3):208-14.
45. White B, Brooks T, Seaton RA. Q fever in military and paramilitary personnel in conflict zones: case report and review. Travel Med Infect Dis. 2013;11(2):134-7.
46. Batelli G. Zoonoses as occupational diseases. Veterinaria Italiana 2006;44(4):601-9. 47. Chang CC, Lin PS, Hou MY, Lin CC, Hung MN, Wu TM, et al. Identification of risk factors of Coxiella burnetii (Q fever)
infection in veterinary-associated populations in southern Taiwan. Zoonoses and public health. 2010;57(7-8):e95-101. 48. Nett RJ, Helgerson SD, Anderson AD. Clinician assessment for Coxiella burnetii infection in hospitalized patients with
potentially compatible illnesses during Q fever outbreaks and following a health alert, Montana, 2011. Vector borne and zoonotic diseases. 2013;13(2):128-30.
49. Thomas DR, Treweek L, Salmon RL, Kench SM, Coleman TJ, Meadows D, et al. The risk of acquiring Q fever on farms: a seroepidemiological study. Occupational and environmental medicine. 1995;52(10):644-7.
50. Tabibi R, Baccalini R, Barassi A, Bonizzi L, Brambilla G, Consonni D, et al. Occupational exposure to zoonotic agents among agricultural workers in Lombardy Region, northern Italy. Annals of agricultural and environmental medicine : AAEM. 2013;20(4):676-81.
51. Marrie TJ, Fraser J. Prevalence of Antibodies to Coxiella burnetii Among Veterinarians and Slaughterhouse Workers in Nova Scotia. The Canadian veterinary journal.1985;26(6):181-4.
52. Dolce P, Belanger MJ, Tumanowicz K, Gauthier CP, Jutras P, Masse R, et al. Coxiella burnetii seroprevalence of shepherds and their flocks in the lower Saint-Lawrence River region of Quebec, Canada. The Canadian journal of infectious diseases. 2003;14(2):97-102.
53. Bernard H, Brockmann SO, Kleinkauf N, Klinc C, Wagner-Wiening C, Stark K, et al. High seroprevalence of Coxiella burnetii antibodies in veterinarians associated with cattle obstetrics, Bavaria, 2009. Vector borne and zoonotic diseases. 2012;12(7):552-7.
54. Whitney EA, Massung RF, Candee AJ, Ailes EC, Myers LM, Patterson NE, et al. Seroepidemiologic and occupational risk survey for Coxiella burnetii antibodies among US veterinarians. Clinical infectious diseases : an official publication of the Infectious Diseases Society of America. 2009;48(5):550-7.
55. Dorko E, Rimarova K, Kecerova A, Pilipcinec E, Dudrikova E, Lovayova V, et al. Potential association between Coxiella burnetii seroprevalence and selected risk factors among veterinary students in Slovakia. Annals of agricultural and environmental medicine : AAEM. 2011;18(1):47-53.
56. Valencia MC, Rodriguez CO, Punet OG, de Blas Giral I. Q fever seroprevalence and associated risk factors among students from the Veterinary School of Zaragoza, Spain. European journal of epidemiology. 2000;16(5):469-76.
57. Szymanska-Czerwinska M, Galinska EM, Niemczuk K, Zasepa M. Prevalence of Coxiella burnetii infection in foresters and ticks in the south-eastern Poland and comparison of diagnostic methods. Annals of agricultural and environmental medicine : AAEM. 2013;20(4):699-704.
58. Levesque B, Messier V, Bonnier-Viger Y, Couillard M, Cote S, Ward BJ, et al. Seroprevalence of zoonoses in a Cree community (Canada). Diagnostic microbiology and infectious disease. 2007;59(3):283-6.

1
GENERAL INTRODUCTION AND OUTLINE THESIS | 19
References (Chapter 1) 1. Hilbink F, Penrose M, Kovacova E, Kazar J. Q fever is absent from New Zealand. International journal of epidemiology.
1993;22(5):945-9. 2. Cutler SJ, Bouzid M, Cutler RR. Q fever. The Journal of infection. 2007;54(4):313-8. 3. Derrick EH. "Q" fever, a new fever entity: clinical features, diagnosis and laboratory investigation. Reviews of infectious
diseases. 1983;5(4):790-800. 4. Davis GE, Cox HR. A filter-passing infectious agent isolated from ticks. I. Isolation from Dermacentor andersoni, reactions in
animals, and filtration experiments. Public Health Rep. 1938;53:2259-67. 5. Burnet FM, Freeman M. Experimental studies on the virus of "Q" fever. Reviews of infectious diseases. 1983;5(4):800-8. 6. Meredith AL, Cleaveland SC, Denwood MJ, Brown JK, Shaw DJ. Coxiella burnetii (Q-Fever) Seroprevalence in Prey and
Predators in the United Kingdom: Evaluation of Infection in Wild Rodents, Foxes and Domestic Cats Using a Modified ELISA. Transboundary and emerging diseases. 2014.
7. Davoust B, Marie JL, Pommier de Santi V, Berenger JM, Edouard S, Raoult D. Three-toed sloth as putative reservoir of Coxiella burnetii, Cayenne, French Guiana. Emerging infectious diseases. 2014;20(10):1760-1. 8. Hogerwerf L, Courcoul A, Klinkenberg D, Beaudeau F, Vergu E, Nielen M. Dairy goat demography and Q fever infection
dynamics. Veterinary research. 2013;44:28. 9. Agerholm JS. Coxiella burnetii associated reproductive disorders in domestic animals--a critical review. Acta veterinaria
Scandinavica. 2013;55:13. 10. Arricau-Bouvery N, Rodolakis A. Is Q fever an emerging or re-emerging zoonosis? Veterinary research. 2005;36(3):327-49. 11. Rodolakis A, Berri M, Hechard C, Caudron C, Souriau A, Bodier CC, et al. Comparison of Coxiella burnetii shedding in milk of
dairy bovine, caprine, and ovine herds. Journal of dairy science. 2007;90(12):5352-60. 12. Rodolakis A. Q Fever in dairy animals. Annals of the New York Academy of Sciences. 2009;1166:90-3. 13. Bauer AE, Olivas S, Cooper M, Hornstra H, Keim P, Pearson T, et al. Estimated herd prevalence and sequence types of
Coxiella burnetii in bulk tank milk samples from commercial dairies in Indiana. BMC veterinary research. 2015;11:186. 14. Raoult D, Marrie T, Mege J. Natural history and pathophysiology of Q fever. The Lancet Infectious diseases. 2005;5(4):219-
226. 15. Krumbiegel ER, Wisniewski HJ. Q fever in the Milwaukee area. II. Consumption of infected raw milk by human volunteers.
Archives of environmental health. 1970;21(1):63-5. 16. Signs KA, Stobierski MG, Gandhi TN. Q fever cluster among raw milk drinkers in Michigan, 2011. Clinical infectious diseases.
2012;55(10):1387-9. 17. Eldin C, Angelakis E, Renvoise A, Raoult D. Coxiella burnetii DNA, but not viable bacteria, in dairy products in France. Am J
Trop Med Hyg. 2013;88(4):765-9. 18. Cooper A, Stephens J, Ketheesan N, Govan B. Detection of Coxiella burnetii DNA in wildlife and ticks in northern
Queensland, Australia. Vector borne and zoonotic diseases. 2013;13(1):12-6. 19. Duron O, Sidi-Boumedine K, Rousset E, Moutailler S, Jourdain E. The Importance of Ticks in Q Fever Transmission: What Has
(and Has Not) Been Demonstrated? Trends Parasitol. 2015;31(11):536-52. 20. Kanfer E, Farrag N, Price C, MacDonald D, Coleman J, Barrett AJ. Q fever following bone marrow transplantation. Bone
Marrow Transplant. 1988;3(2):165-6. 21. Amit S, Shinar S, Halutz O, Atiya-Nasagi Y, Giladi M. Suspected person-to-person transmission of Q fever among
hospitalized pregnant women. Clinical infectious diseases : an official publication of the Infectious Diseases Society of America. 2014;58(11):e146-7.
22. Osorio S, Sarria C, Gonzalez-Ruano P, Casal EC, Garcia A. Nosocomial transmission of Q fever. J Hosp Infect. 2003;54(2):162-163.
23. Raoult D, Stein A. Q fever during pregnancy--a risk for women, fetuses, and obstetricians. The New England journal of medicine. 1994;330(5):371.
24. Milazzo A, Hall R, Storm PA, Harris RJ, Winslow W, Marmion BP. Sexually transmitted Q fever. Clinical infectious diseases : 2001;33(3):399-402.
25. Porter SR, Czaplicki G, Mainil J, Guatteo R, Saegerman C. Q Fever: current state of knowledge and perspectives of research of a neglected zoonosis. Int J Microbiol. 2011;2011:248418.
26. Maurin M, Raoult D. Q fever. Clinical microbiology reviews. 1999;12(4):518-53. 27. Tissot Dupont H, Raoult D, Brouqui P, Janbon F, Peyramond D, Weiller PJ, et al. Epidemiologic features and clinical
presentation of acute Q fever in hospitalized patients: 323 French cases. Am J Med. 1992;93(4):427-34. 28. Espejo E, Gil-Diaz A, Oteo JA, Castillo-Rueda R, Garcia-Alvarez L, Santana-Baez S, et al. Clinical presentation of acute Q fever
in Spain: seasonal and geographical differences. Int J Infect Dis. 2014;26:162-4. 29. Marrie TJ, Stein A, Janigan D, Raoult D. Route of infection determines the clinical manifestations of acute Q fever. J Infect
Dis. 1996;173(2):484-7. 30. Kersh GJ. Antimicrobial therapies for Q fever. Expert review of anti-infective therapy. 2013;11(11):1207-14. 31. Dijkstra F, Riphagen-Dalhuisen J, Wijers N, Hak E, Van der Sande MA, Morroy G, et al. Antibiotic therapy for acute Q fever in
The Netherlands in 2007 and 2008 and its relation to hospitalization. Epidemiology and infection. 2011;139(9):1332-41. 32. Kampschreur LM, Wegdam-Blans MC, Thijsen SF, Groot CA, Schneeberger PM, Hollander AA, et al. Acute Q fever related in-
hospital mortality in the Netherlands. The Netherlands journal of medicine. 2010;68(12):408-13.
33. Tissot-Dupont H, Vaillant V, Rey S, Raoult D. Role of sex, age, previous valve lesion, and pregnancy in the clinical expression and outcome of Q fever after a large outbreak. Clinical infectious diseases. 2007;44(2):232-7.
34. Maltezou HC, Raoult D. Q fever in children. The Lancet Infectious diseases. 2002;2(11):686-91. 35. Hackert VH, Dukers-Muijrers NH, van Loo IH, Wegdam-Blans M, Somers C, Hoebe CJ. Coxiella burnetii infection is lower in
children than in adults after community exposure: overlooked cause of infrequent Q Fever reporting in the young. Pediatr Infect Dis J. 2015;34(12):1283-8.
36. Morroy G, Keijmel SP, Delsing CE, Bleijenberg G, Langendam M, Timen A, et al. Fatigue following acute Q-Fever: a systematic literature review. PloS one. 2016;11(5):e0155884.
37. Keijmel SP, Delsing CE, Bleijenberg G, van der Meer JWM, Donders RT, Leclercq M, et al. Effectiveness of Long-term Doxycycline Treatment and Cognitive-Behavioral Therapy on Fatigue Severity in Patients with Q Fever Fatigue Syndrome (Qure Study): A Randomized Controlled Trial. Clinical infectious diseases. 2017;64(8):998-1005.
38. Herremans T, Hogema BM, Nabuurs M, Peeters M, Wegdam-Blans M, Schneeberger P, et al. Comparison of the performance of IFA, CFA, and ELISA assays for the serodiagnosis of acute Q fever by quality assessment. Diagnostic microbiology and infectious disease. 2013;75(1):16-21.
39. Schneeberger PM, Hermans MH, van Hannen EJ, Schellekens JJ, Leenders AC, Wever PC. Real-time PCR with serum samples is indispensable for early diagnosis of acute Q fever. Clin Vaccine Immunol. 2010;17(2):286-90.
40. European Centre for Disease Prevention and Control: Technical Report: ECDC Risk Assessment on Q Fever 2010. Available: http://ecdc.europa.eu/en/publications/Publications/1005_TER_Risk_Assessment_Qfever.pdf.
41. Million M, Thuny F, Richet H, Raoult D. Long-term outcome of Q fever endocarditis: a 26-year personal survey. The Lancet Infectious diseases. 2010;10(8):527-35.
42. Kampschreur LM, Delsing CE, Groenwold RH, Wegdam-Blans MC, Bleeker-Rovers CP, de Jager-Leclercq MG, et al. Chronic Q fever in the Netherlands 5 years after the start of the Q fever epidemic: results from the Dutch chronic Q fever database. Journal of clinical microbiology. 2014;52(5):1637-43.
43. Eldin C, Melenotte C, Mediannikov O, Ghigo E, Million M, Edouard S, et al. From Q Fever to Coxiella burnetii Infection: a Paradigm Change. Clinical microbiology reviews. 2017;30(1):115-90.
44. Dorko E, Rimarova K, Pilipcinec E. Influence of the environment and occupational exposure on the occurrence of Q fever. Central European journal of public health. 2012;20(3):208-14.
45. White B, Brooks T, Seaton RA. Q fever in military and paramilitary personnel in conflict zones: case report and review. Travel Med Infect Dis. 2013;11(2):134-7.
46. Batelli G. Zoonoses as occupational diseases. Veterinaria Italiana 2006;44(4):601-9. 47. Chang CC, Lin PS, Hou MY, Lin CC, Hung MN, Wu TM, et al. Identification of risk factors of Coxiella burnetii (Q fever)
infection in veterinary-associated populations in southern Taiwan. Zoonoses and public health. 2010;57(7-8):e95-101. 48. Nett RJ, Helgerson SD, Anderson AD. Clinician assessment for Coxiella burnetii infection in hospitalized patients with
potentially compatible illnesses during Q fever outbreaks and following a health alert, Montana, 2011. Vector borne and zoonotic diseases. 2013;13(2):128-30.
49. Thomas DR, Treweek L, Salmon RL, Kench SM, Coleman TJ, Meadows D, et al. The risk of acquiring Q fever on farms: a seroepidemiological study. Occupational and environmental medicine. 1995;52(10):644-7.
50. Tabibi R, Baccalini R, Barassi A, Bonizzi L, Brambilla G, Consonni D, et al. Occupational exposure to zoonotic agents among agricultural workers in Lombardy Region, northern Italy. Annals of agricultural and environmental medicine : AAEM. 2013;20(4):676-81.
51. Marrie TJ, Fraser J. Prevalence of Antibodies to Coxiella burnetii Among Veterinarians and Slaughterhouse Workers in Nova Scotia. The Canadian veterinary journal.1985;26(6):181-4.
52. Dolce P, Belanger MJ, Tumanowicz K, Gauthier CP, Jutras P, Masse R, et al. Coxiella burnetii seroprevalence of shepherds and their flocks in the lower Saint-Lawrence River region of Quebec, Canada. The Canadian journal of infectious diseases. 2003;14(2):97-102.
53. Bernard H, Brockmann SO, Kleinkauf N, Klinc C, Wagner-Wiening C, Stark K, et al. High seroprevalence of Coxiella burnetii antibodies in veterinarians associated with cattle obstetrics, Bavaria, 2009. Vector borne and zoonotic diseases. 2012;12(7):552-7.
54. Whitney EA, Massung RF, Candee AJ, Ailes EC, Myers LM, Patterson NE, et al. Seroepidemiologic and occupational risk survey for Coxiella burnetii antibodies among US veterinarians. Clinical infectious diseases : an official publication of the Infectious Diseases Society of America. 2009;48(5):550-7.
55. Dorko E, Rimarova K, Kecerova A, Pilipcinec E, Dudrikova E, Lovayova V, et al. Potential association between Coxiella burnetii seroprevalence and selected risk factors among veterinary students in Slovakia. Annals of agricultural and environmental medicine : AAEM. 2011;18(1):47-53.
56. Valencia MC, Rodriguez CO, Punet OG, de Blas Giral I. Q fever seroprevalence and associated risk factors among students from the Veterinary School of Zaragoza, Spain. European journal of epidemiology. 2000;16(5):469-76.
57. Szymanska-Czerwinska M, Galinska EM, Niemczuk K, Zasepa M. Prevalence of Coxiella burnetii infection in foresters and ticks in the south-eastern Poland and comparison of diagnostic methods. Annals of agricultural and environmental medicine : AAEM. 2013;20(4):699-704.
58. Levesque B, Messier V, Bonnier-Viger Y, Couillard M, Cote S, Ward BJ, et al. Seroprevalence of zoonoses in a Cree community (Canada). Diagnostic microbiology and infectious disease. 2007;59(3):283-6.

20 | CHAPTER 1
59. Wattiau P, Boldisova E, Toman R, Van Esbroeck M, Quoilin S, Hammadi S, et al. Q fever in Woolsorters, Belgium. Emerging infectious diseases. 2011;17(12):2368-9.
60. Cilla G, Montes M, Perez-Trallero E. Q fever in the Netherlands - what matters is seriousness of disease rather than quantity. Eurosurveillance. 2008;13(37).
61. Villumsen S, Jorgensen CS, Smith B, Uldum S, Schiellerup P, Krogfelt KA. Determination of new cutoff values for indirect immunofluorescence antibody test for Q fever diagnosis in Denmark. Diagnostic microbiology and infectious disease. 2009;65(2):93-8.
62. Heymann DL e. Control of Communicable Diseases Manual. 19th edition ed. Association APH, editor. Washington, DC2008. 63. Moran GJ. Threats in bioterrorism. II: CDC category B and C agents. Emerg Med Clin North Am. 2002;20(2):311-30. 64. Hellenbrand W, Breuer T, Petersen L. Changing epidemiology of Q fever in Germany, 1947-1999. Emerging infectious
diseases. 2001;7(5):789-96. 65. Georgiev M, Afonso A, Neubauer H, Needham H, Thiery R, Rodolakis A, et al. Q fever in humans and farm animals in four
European countries, 1982 to 2010. Eurosurveillance. 2013;18(8). 66. Buhariwalla F, Cann B, Marrie TJ. A dog-related outbreak of Q fever. Clinical infectious diseases. 1996;23(4):753-5. 67. Chmielewski T, Tylewska-Wierzbanowska S. Q fever outbreaks in Poland during 2005-2011. Medical science monitor :
international medical journal of experimental and clinical research. 2013;19:1073-9. 68. Langley JM, Marrie TJ, Covert A, Waag DM, Williams JC. Poker players' pneumonia. An urban outbreak of Q fever following
exposure to a parturient cat. The New England journal of medicine. 1988;319(6):354-6. 69. Marrie TJ, Schlech WF, 3rd, Williams JC, Yates L. Q fever pneumonia associated with exposure to wild rabbits. Lancet.
1986;1(8478):427-9. 70. Stein A, Raoult D. Pigeon pneumonia in provence: a bird-borne Q fever outbreak. Clinical infectious diseases. 1999; 29(3):
617-20. 71. Carrieri MP, Tissot-Dupont H, Rey D, Brousse P, Renard H, Obadia Y, et al. Investigation of a slaughterhouse-related
outbreak of Q fever in the French Alps. European journal of clinical microbiology & infectious diseases. 2002;21(1):17-21. 72. Hawker JI, Ayres JG, Blair I, Evans MR, Smith DL, Smith EG, et al. A large outbreak of Q fever in the West Midlands:
windborne spread into a metropolitan area? Communicable disease and public health / PHLS. 1998;1(3):180-7. 73. Brouqui P, Badiaga S, Raoult D. Q fever outbreak in homeless shelter. Emerging infectious diseases. 2004;10(7):1297-9. 74. Porten K, Rissland J, Tigges A, Broll S, Hopp W, Lunemann M, et al. A super-spreading ewe infects hundreds with Q fever at
a farmers' market in Germany. BMC infectious diseases. 2006;6:147. 75. McQuiston JH, Gibbons RV, Velic R, Nicholson WL, Castrodale L, Wainright SH, et al. Investigation of a focus of Q fever in a
nonfarming population in the Federation of Bosnia and Herzegovina. Annals of the New York Academy of Sciences. 2003;990:229-32.
76. Winner SJ, Eglin RP, Moore VI, Mayon-White RT. An outbreak of Q fever affecting postal workers in Oxfordshire. The Journal of infection. 1987;14(3):255-61.
77. Tostmann A, Bousema T, Oliver I. Investigation of outbreaks complicated by universal exposure. Emerging infectious diseases. 2012;18(11):1717-22.
78. Wilson LE, Couper S, Prempeh H, Young D, Pollock KG, Stewart WC, et al. Investigation of a Q fever outbreak in a Scottish co-located slaughterhouse and cutting plant. Zoonoses and public health. 2010;57(7-8):493-8.
79. Gilroy N, Formica N, Beers M, Egan A, Conaty S, Marmion B. Abattoir-associated Q fever: a Q fever outbreak during a Q fever vaccination program. Australian and New Zealand journal of public health. 2001;25(4):362-7.
80. Rauch AM, Tanner M, Pacer RE, Barrett MJ, Brokopp CD, Schonberger LB. Sheep-associated outbreak of Q fever, Idaho. Archives of internal medicine. 1987;147(2):341-4.
81. Henning K, Hotzel H, Peters M, Welge P, Popps W, Theegarten D. [Unanticipated outbreak of Q fever during a study using sheep, and its significance for further projects]. Berliner und Munchener tierarztliche Wochenschrift. 2009;122(1-2):13-9.
82. Hall CJ, Richmond SJ, Caul EO, Pearce NH, Silver IA. Laboratory outbreak of Q fever acquired from sheep. Lancet. 1982;1(8279):1004-6.
83. George M, Reich A, Cussler K, Jehl H, Burckhardt F. Live Cell Therapy as Potential Risk Factor for Q Fever. Emerging infectious diseases. 2017;23(7).
84. van Woerden HC, Mason BW, Nehaul LK, Smith R, Salmon RL, Healy B, et al. Q fever outbreak in industrial setting. Emerging infectious diseases. 2004;10(7):1282-9.
85. Wade AJ, Cheng AC, Athan E, Molloy JL, Harris OC, Stenos J, et al. Q fever outbreak at a cosmetics supply factory. Clinical infectious diseases : an official publication of the Infectious Diseases Society of America. 2006;42(7):e50-2.
86. Alonso E, Lopez-Etxaniz I, Hurtado A, Liendo P, Urbaneja F, Aspiritxaga I, et al. Q Fever Outbreak among Workers at a Waste-Sorting Plant. PloS one. 2015;10(9):e0138817.
87. Kaplan MM, Bertagna P. The geographical distribution of Q fever. Bulletin of the World Health Organization. 1955;13(5):829-60.
88. Wolff JW, Kouwenaar W. [Investigation on occurrence of Q fever in Netherlands]. Nederlands tijdschrift voor geneeskunde. 1954;98(39):2726-32. 89. Dekking F, Zanen HC. Q fever in the Netherlands. Tropical and geographical medicine. 1958;10(2):157-62.
90. Jordans GH. [A case of Q fever]. Nederlands tijdschrift voor geneeskunde. 1958;102(32):1548-9. 91. Westra SA, Lopes Cardozo E, Ten Berg J. [The first cases of Q fever in the Netherlands]. Nederlands tijdschrift voor
geneeskunde. 1958;102(2):69-72. 92. Schimmer B, Morroy G, Dijkstra F, Schneeberger PM, Weers-Pothoff G, Timen A, et al. Large ongoing Q fever outbreak in
the south of The Netherlands, 2008. Euro surveillance : bulletin Europeen sur les maladies transmissibles = European communicable disease bulletin. 2008;13(31).
93. Stevens H, Beeres MP, Meijer JG, Koeman J, van Kregten E, Bartelink AK. [Q fever: not just in sheep]. Nederlands tijdschrift voor geneeskunde. 2000;144(27):1297-300.
94. Dijkstra F, van der Hoek W, Wijers N, Schimmer B, Rietveld A, Wijkmans CJ, et al. The 2007-2010 Q fever epidemic in The Netherlands: characteristics of notified acute Q fever patients and the association with dairy goat farming. FEMS immunology and medical microbiology. 2012;64(1):3-12.
95. van Loenhout JA, Wielders CC, Morroy G, Cox MJ, van der Hoek W, Hautvast JL, et al. Severely impaired health status of non-notified Q fever patients leads to an underestimation of the true burden of disease. Epidemiology and infection. 2015;143(12):2580-7.
96. van der Hoek W, Hogema BM, Dijkstra F, Rietveld A, Wijkmans CJ, Schneeberger PM, et al. Relation between Q fever notifications and Coxiella burnetii infections during the 2009 outbreak in The Netherlands. Eurosurveillance. 2012;17(3):20058.
97. Wouda W, Dercksen DP. [Abortion and stillbirth among dairy goats as a consequence of Coxiella burnetii]. Tijdschrift voor diergeneeskunde. 2007;132(23):908-11.
98. van den Wijngaard CC, Dijkstra F, van Pelt W, van Asten L, Kretzschmar M, Schimmer B, et al. In search of hidden Q fever outbreaks: linking syndromic hospital clusters to infected goat farms. Epidemiology and infection. 2011;139(1):19-26.
99. Maassen KS, L. Wouters, I. van Duijkeren, E. Janse, I. Hagenaars, T. IJzermans, J. van der Hoek, W. Heederik, D. Livestock farming and the health of local residents (in Dutch). Bilthoven, the Netherlands: National Institute of Public Health and the Environment; 2016 05-07-2016. Contract No.: RIVM Report 2016-0058.
100. van Asseldonk MA, Prins J, Bergevoet RH. Economic assessment of Q fever in the Netherlands. Preventive veterinary medicine. 2013;112(1-2):27-34.
101. van der Hoek W, Dijkstra F, Schimmer B, Schneeberger PM, Vellema P, Wijkmans C, et al. Q fever in the Netherlands: an update on the epidemiology and control measures. Eurosurveillance. 2010;15(12).
102. Gidding HF, Wallace C, Lawrence GL, McIntyre PB. Australia's national Q fever vaccination program. Vaccine. 2009;27(14):2037-41.
103. Sellens E, Norris JM, Dhand NK, Heller J, Hayes L, Gidding HF, et al. Q Fever Knowledge, Attitudes and Vaccination Status of Australia's Veterinary Workforce in 2014. PloS one. 2016;11(1):e0146819.
104. Isken LD, Kraaij-Dirkzwager M, Vermeer-de Bondt PE, Rumke HC, Wijkmans C, Opstelten W, et al. Implementation of a Q fever vaccination program for high-risk patients in the Netherlands. Vaccine. 2013;31(23):2617-22.
105. Roest HI, Ruuls RC, Tilburg JJ, Nabuurs-Franssen MH, Klaassen CH, Vellema P, et al. Molecular epidemiology of Coxiella burnetii from ruminants in Q fever outbreak, the Netherlands. Emerging infectious diseases. 2011;17(4):668-75.
106. Tilburg JJ, Rossen JW, van Hannen EJ, Melchers WJ, Hermans MH, van de Bovenkamp J, et al. Genotypic diversity of Coxiella burnetii in the 2007-2010 Q fever outbreak episodes in The Netherlands. Journal of clinical microbiology. 2012;50(3):1076-1078.
107. Boarbi S, Mori M, Rousset E, Sidi-Boumedine K, Van Esbroeck M, Fretin D. Prevalence and molecular typing of Coxiella burnetii in bulk tank milk in Belgian dairy goats, 2009-2013. Veterinary microbiology. 2014;170(1-2):117-24.
108. Kuley R, Smith HE, Janse I, Harders FL, Baas F, Schijlen E, et al. First Complete Genome Sequence of the Dutch Veterinary Coxiella burnetii Strain NL3262, Originating from the Largest Global Q Fever Outbreak, and Draft Genome Sequence of Its Epidemiologically Linked Chronic Human Isolate NLhu3345937. Genome Announc. 2016;4(2).
109. Wielders CC, Morroy G, Wever PC, Coutinho RA, Schneeberger PM, van der Hoek W. Strategies for early detection of chronic Q fever: a systematic review. Eur J Clin Invest. 2013;43(6):616-39.
110. Wielders CC, van Loenhout JA, Morroy G, Rietveld A, Notermans DW, Wever PC, et al. Long-Term Serological Follow-Up of Acute Q Fever Patients after a Large Epidemic. PloS one. 2015;10(7):e0131848. 111. Roest HIJM, C.B.M. van de Giessen, A. van Zijderveld, F.G. The Dutch Q fever situation - lessons learned? . Planet@Risk,
Special Issue on One Health (Part I/II) Davos: Global Risk Forum GRF Davos. 2014;2(3):166-8. 112. Wu CJ, Hsueh PR, Ko WC. A new health threat in Europe: Shiga toxin-producing Escherichia coli O104:H4 infections. J
Microbiol Immunol Infect. 2011;44(5):390-3. 113. van Dijk G, van Dissel JT, Speelman P. et al. Van verwerping tot verheffing Q-Koortsbeleid in Nederland 2005-2010.
[Evaluation Committee for handling of Q Fever in Netherlands 2005-2010].Report, 22 november 2010. Available: https://www.rijksoverheid.nl/documenten/rapporten/2010/11/22/van-verwerping-tot-verheffing
114. van der Giessen J, Kramer T. Fanoy E, de Rosa M, Roest HJ, Broens E; Vellema P,Notermans D, Swaan, C, Maassen K. [Early Warning Meeting Zoonoses celebrates five year anniversary]. Tijdschrift voor diergeneeskunde. 2016;6:48-9.
115. Eussen BGM, Schaveling J, Dragt MJ, Blomme RJ. Stimulating collaboration between human and veterinary health care professionals. BMC veterinary research. 2017;13(1):174.

1
GENERAL INTRODUCTION AND OUTLINE THESIS | 21
59. Wattiau P, Boldisova E, Toman R, Van Esbroeck M, Quoilin S, Hammadi S, et al. Q fever in Woolsorters, Belgium. Emerging infectious diseases. 2011;17(12):2368-9.
60. Cilla G, Montes M, Perez-Trallero E. Q fever in the Netherlands - what matters is seriousness of disease rather than quantity. Eurosurveillance. 2008;13(37).
61. Villumsen S, Jorgensen CS, Smith B, Uldum S, Schiellerup P, Krogfelt KA. Determination of new cutoff values for indirect immunofluorescence antibody test for Q fever diagnosis in Denmark. Diagnostic microbiology and infectious disease. 2009;65(2):93-8.
62. Heymann DL e. Control of Communicable Diseases Manual. 19th edition ed. Association APH, editor. Washington, DC2008. 63. Moran GJ. Threats in bioterrorism. II: CDC category B and C agents. Emerg Med Clin North Am. 2002;20(2):311-30. 64. Hellenbrand W, Breuer T, Petersen L. Changing epidemiology of Q fever in Germany, 1947-1999. Emerging infectious
diseases. 2001;7(5):789-96. 65. Georgiev M, Afonso A, Neubauer H, Needham H, Thiery R, Rodolakis A, et al. Q fever in humans and farm animals in four
European countries, 1982 to 2010. Eurosurveillance. 2013;18(8). 66. Buhariwalla F, Cann B, Marrie TJ. A dog-related outbreak of Q fever. Clinical infectious diseases. 1996;23(4):753-5. 67. Chmielewski T, Tylewska-Wierzbanowska S. Q fever outbreaks in Poland during 2005-2011. Medical science monitor :
international medical journal of experimental and clinical research. 2013;19:1073-9. 68. Langley JM, Marrie TJ, Covert A, Waag DM, Williams JC. Poker players' pneumonia. An urban outbreak of Q fever following
exposure to a parturient cat. The New England journal of medicine. 1988;319(6):354-6. 69. Marrie TJ, Schlech WF, 3rd, Williams JC, Yates L. Q fever pneumonia associated with exposure to wild rabbits. Lancet.
1986;1(8478):427-9. 70. Stein A, Raoult D. Pigeon pneumonia in provence: a bird-borne Q fever outbreak. Clinical infectious diseases. 1999; 29(3):
617-20. 71. Carrieri MP, Tissot-Dupont H, Rey D, Brousse P, Renard H, Obadia Y, et al. Investigation of a slaughterhouse-related
outbreak of Q fever in the French Alps. European journal of clinical microbiology & infectious diseases. 2002;21(1):17-21. 72. Hawker JI, Ayres JG, Blair I, Evans MR, Smith DL, Smith EG, et al. A large outbreak of Q fever in the West Midlands:
windborne spread into a metropolitan area? Communicable disease and public health / PHLS. 1998;1(3):180-7. 73. Brouqui P, Badiaga S, Raoult D. Q fever outbreak in homeless shelter. Emerging infectious diseases. 2004;10(7):1297-9. 74. Porten K, Rissland J, Tigges A, Broll S, Hopp W, Lunemann M, et al. A super-spreading ewe infects hundreds with Q fever at
a farmers' market in Germany. BMC infectious diseases. 2006;6:147. 75. McQuiston JH, Gibbons RV, Velic R, Nicholson WL, Castrodale L, Wainright SH, et al. Investigation of a focus of Q fever in a
nonfarming population in the Federation of Bosnia and Herzegovina. Annals of the New York Academy of Sciences. 2003;990:229-32.
76. Winner SJ, Eglin RP, Moore VI, Mayon-White RT. An outbreak of Q fever affecting postal workers in Oxfordshire. The Journal of infection. 1987;14(3):255-61.
77. Tostmann A, Bousema T, Oliver I. Investigation of outbreaks complicated by universal exposure. Emerging infectious diseases. 2012;18(11):1717-22.
78. Wilson LE, Couper S, Prempeh H, Young D, Pollock KG, Stewart WC, et al. Investigation of a Q fever outbreak in a Scottish co-located slaughterhouse and cutting plant. Zoonoses and public health. 2010;57(7-8):493-8.
79. Gilroy N, Formica N, Beers M, Egan A, Conaty S, Marmion B. Abattoir-associated Q fever: a Q fever outbreak during a Q fever vaccination program. Australian and New Zealand journal of public health. 2001;25(4):362-7.
80. Rauch AM, Tanner M, Pacer RE, Barrett MJ, Brokopp CD, Schonberger LB. Sheep-associated outbreak of Q fever, Idaho. Archives of internal medicine. 1987;147(2):341-4.
81. Henning K, Hotzel H, Peters M, Welge P, Popps W, Theegarten D. [Unanticipated outbreak of Q fever during a study using sheep, and its significance for further projects]. Berliner und Munchener tierarztliche Wochenschrift. 2009;122(1-2):13-9.
82. Hall CJ, Richmond SJ, Caul EO, Pearce NH, Silver IA. Laboratory outbreak of Q fever acquired from sheep. Lancet. 1982;1(8279):1004-6.
83. George M, Reich A, Cussler K, Jehl H, Burckhardt F. Live Cell Therapy as Potential Risk Factor for Q Fever. Emerging infectious diseases. 2017;23(7).
84. van Woerden HC, Mason BW, Nehaul LK, Smith R, Salmon RL, Healy B, et al. Q fever outbreak in industrial setting. Emerging infectious diseases. 2004;10(7):1282-9.
85. Wade AJ, Cheng AC, Athan E, Molloy JL, Harris OC, Stenos J, et al. Q fever outbreak at a cosmetics supply factory. Clinical infectious diseases : an official publication of the Infectious Diseases Society of America. 2006;42(7):e50-2.
86. Alonso E, Lopez-Etxaniz I, Hurtado A, Liendo P, Urbaneja F, Aspiritxaga I, et al. Q Fever Outbreak among Workers at a Waste-Sorting Plant. PloS one. 2015;10(9):e0138817.
87. Kaplan MM, Bertagna P. The geographical distribution of Q fever. Bulletin of the World Health Organization. 1955;13(5):829-60.
88. Wolff JW, Kouwenaar W. [Investigation on occurrence of Q fever in Netherlands]. Nederlands tijdschrift voor geneeskunde. 1954;98(39):2726-32. 89. Dekking F, Zanen HC. Q fever in the Netherlands. Tropical and geographical medicine. 1958;10(2):157-62.
90. Jordans GH. [A case of Q fever]. Nederlands tijdschrift voor geneeskunde. 1958;102(32):1548-9. 91. Westra SA, Lopes Cardozo E, Ten Berg J. [The first cases of Q fever in the Netherlands]. Nederlands tijdschrift voor
geneeskunde. 1958;102(2):69-72. 92. Schimmer B, Morroy G, Dijkstra F, Schneeberger PM, Weers-Pothoff G, Timen A, et al. Large ongoing Q fever outbreak in
the south of The Netherlands, 2008. Euro surveillance : bulletin Europeen sur les maladies transmissibles = European communicable disease bulletin. 2008;13(31).
93. Stevens H, Beeres MP, Meijer JG, Koeman J, van Kregten E, Bartelink AK. [Q fever: not just in sheep]. Nederlands tijdschrift voor geneeskunde. 2000;144(27):1297-300.
94. Dijkstra F, van der Hoek W, Wijers N, Schimmer B, Rietveld A, Wijkmans CJ, et al. The 2007-2010 Q fever epidemic in The Netherlands: characteristics of notified acute Q fever patients and the association with dairy goat farming. FEMS immunology and medical microbiology. 2012;64(1):3-12.
95. van Loenhout JA, Wielders CC, Morroy G, Cox MJ, van der Hoek W, Hautvast JL, et al. Severely impaired health status of non-notified Q fever patients leads to an underestimation of the true burden of disease. Epidemiology and infection. 2015;143(12):2580-7.
96. van der Hoek W, Hogema BM, Dijkstra F, Rietveld A, Wijkmans CJ, Schneeberger PM, et al. Relation between Q fever notifications and Coxiella burnetii infections during the 2009 outbreak in The Netherlands. Eurosurveillance. 2012;17(3):20058.
97. Wouda W, Dercksen DP. [Abortion and stillbirth among dairy goats as a consequence of Coxiella burnetii]. Tijdschrift voor diergeneeskunde. 2007;132(23):908-11.
98. van den Wijngaard CC, Dijkstra F, van Pelt W, van Asten L, Kretzschmar M, Schimmer B, et al. In search of hidden Q fever outbreaks: linking syndromic hospital clusters to infected goat farms. Epidemiology and infection. 2011;139(1):19-26.
99. Maassen KS, L. Wouters, I. van Duijkeren, E. Janse, I. Hagenaars, T. IJzermans, J. van der Hoek, W. Heederik, D. Livestock farming and the health of local residents (in Dutch). Bilthoven, the Netherlands: National Institute of Public Health and the Environment; 2016 05-07-2016. Contract No.: RIVM Report 2016-0058.
100. van Asseldonk MA, Prins J, Bergevoet RH. Economic assessment of Q fever in the Netherlands. Preventive veterinary medicine. 2013;112(1-2):27-34.
101. van der Hoek W, Dijkstra F, Schimmer B, Schneeberger PM, Vellema P, Wijkmans C, et al. Q fever in the Netherlands: an update on the epidemiology and control measures. Eurosurveillance. 2010;15(12).
102. Gidding HF, Wallace C, Lawrence GL, McIntyre PB. Australia's national Q fever vaccination program. Vaccine. 2009;27(14):2037-41.
103. Sellens E, Norris JM, Dhand NK, Heller J, Hayes L, Gidding HF, et al. Q Fever Knowledge, Attitudes and Vaccination Status of Australia's Veterinary Workforce in 2014. PloS one. 2016;11(1):e0146819.
104. Isken LD, Kraaij-Dirkzwager M, Vermeer-de Bondt PE, Rumke HC, Wijkmans C, Opstelten W, et al. Implementation of a Q fever vaccination program for high-risk patients in the Netherlands. Vaccine. 2013;31(23):2617-22.
105. Roest HI, Ruuls RC, Tilburg JJ, Nabuurs-Franssen MH, Klaassen CH, Vellema P, et al. Molecular epidemiology of Coxiella burnetii from ruminants in Q fever outbreak, the Netherlands. Emerging infectious diseases. 2011;17(4):668-75.
106. Tilburg JJ, Rossen JW, van Hannen EJ, Melchers WJ, Hermans MH, van de Bovenkamp J, et al. Genotypic diversity of Coxiella burnetii in the 2007-2010 Q fever outbreak episodes in The Netherlands. Journal of clinical microbiology. 2012;50(3):1076-1078.
107. Boarbi S, Mori M, Rousset E, Sidi-Boumedine K, Van Esbroeck M, Fretin D. Prevalence and molecular typing of Coxiella burnetii in bulk tank milk in Belgian dairy goats, 2009-2013. Veterinary microbiology. 2014;170(1-2):117-24.
108. Kuley R, Smith HE, Janse I, Harders FL, Baas F, Schijlen E, et al. First Complete Genome Sequence of the Dutch Veterinary Coxiella burnetii Strain NL3262, Originating from the Largest Global Q Fever Outbreak, and Draft Genome Sequence of Its Epidemiologically Linked Chronic Human Isolate NLhu3345937. Genome Announc. 2016;4(2).
109. Wielders CC, Morroy G, Wever PC, Coutinho RA, Schneeberger PM, van der Hoek W. Strategies for early detection of chronic Q fever: a systematic review. Eur J Clin Invest. 2013;43(6):616-39.
110. Wielders CC, van Loenhout JA, Morroy G, Rietveld A, Notermans DW, Wever PC, et al. Long-Term Serological Follow-Up of Acute Q Fever Patients after a Large Epidemic. PloS one. 2015;10(7):e0131848. 111. Roest HIJM, C.B.M. van de Giessen, A. van Zijderveld, F.G. The Dutch Q fever situation - lessons learned? . Planet@Risk,
Special Issue on One Health (Part I/II) Davos: Global Risk Forum GRF Davos. 2014;2(3):166-8. 112. Wu CJ, Hsueh PR, Ko WC. A new health threat in Europe: Shiga toxin-producing Escherichia coli O104:H4 infections. J
Microbiol Immunol Infect. 2011;44(5):390-3. 113. van Dijk G, van Dissel JT, Speelman P. et al. Van verwerping tot verheffing Q-Koortsbeleid in Nederland 2005-2010.
[Evaluation Committee for handling of Q Fever in Netherlands 2005-2010].Report, 22 november 2010. Available: https://www.rijksoverheid.nl/documenten/rapporten/2010/11/22/van-verwerping-tot-verheffing
114. van der Giessen J, Kramer T. Fanoy E, de Rosa M, Roest HJ, Broens E; Vellema P,Notermans D, Swaan, C, Maassen K. [Early Warning Meeting Zoonoses celebrates five year anniversary]. Tijdschrift voor diergeneeskunde. 2016;6:48-9.
115. Eussen BGM, Schaveling J, Dragt MJ, Blomme RJ. Stimulating collaboration between human and veterinary health care professionals. BMC veterinary research. 2017;13(1):174.
CHAPTER 2.1
Seroprevalence of Coxiella burnetii in the Dutch general population andtime-course of antibody responsesfollowing acute Q fever
Low seroprevalence of Q fever in The Netherlandsprior to a series of large outbreaks
2
B. SchimmerD.W. Notermans
M.G. HarmsJ.H.J. Reimerink
J. BakkerP. Schneeberger
L. MollemaP. Teunis
W. van PeltY. van Duijnhoven
Epidemiol Infect. 2012 Jan;140(1):27-35
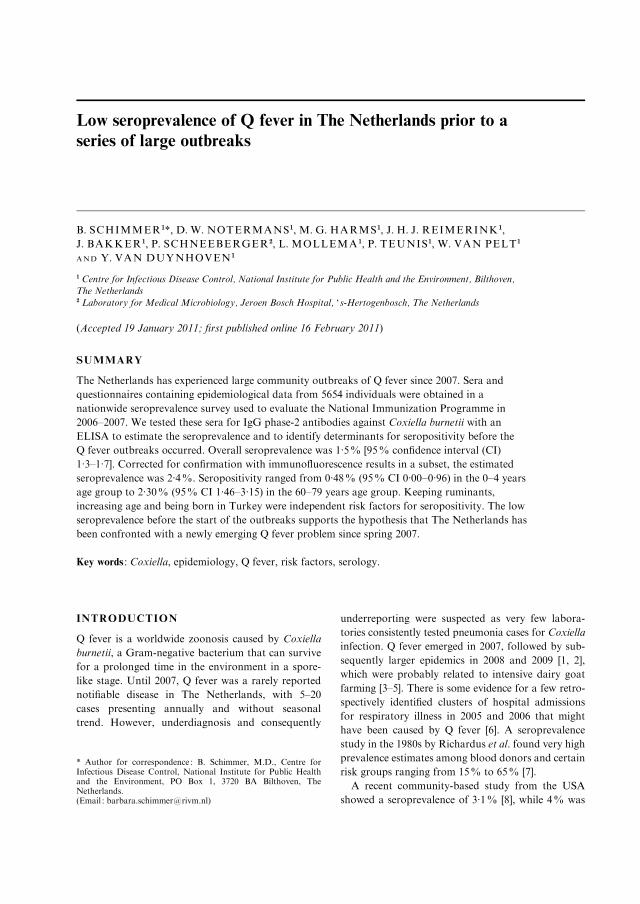
Low seroprevalence of Q fever in The Netherlands prior to aseries of large outbreaks
B. SCHIMMER 1*, D. W. NOTERMANS1, M. G. HARMS1, J. H. J. REIMERINK1,
J. BAKKER 1, P. SCHNEEBERGER 2, L. MOLLEMA 1, P. TEUNIS1, W. VAN PELT1
AND Y. VAN DUYNHOVEN 1
1 Centre for Infectious Disease Control, National Institute for Public Health and the Environment, Bilthoven,The Netherlands2 Laboratory for Medical Microbiology, Jeroen Bosch Hospital, ‘s-Hertogenbosch, The Netherlands
(Accepted 19 January 2011; first published online 16 February 2011)
SUMMARY
The Netherlands has experienced large community outbreaks of Q fever since 2007. Sera and
questionnaires containing epidemiological data from 5654 individuals were obtained in a
nationwide seroprevalence survey used to evaluate the National Immunization Programme in
2006–2007. We tested these sera for IgG phase-2 antibodies against Coxiella burnetii with an
ELISA to estimate the seroprevalence and to identify determinants for seropositivity before the
Q fever outbreaks occurred. Overall seroprevalence was 1.5% [95% confidence interval (CI)
1.3–1.7]. Corrected for confirmation with immunofluorescence results in a subset, the estimated
seroprevalence was 2.4%. Seropositivity ranged from 0.48% (95% CI 0.00–0.96) in the 0–4 years
age group to 2.30% (95% CI 1.46–3.15) in the 60–79 years age group. Keeping ruminants,
increasing age and being born in Turkey were independent risk factors for seropositivity. The low
seroprevalence before the start of the outbreaks supports the hypothesis that The Netherlands has
been confronted with a newly emerging Q fever problem since spring 2007.
Key words : Coxiella, epidemiology, Q fever, risk factors, serology.
INTRODUCTION
Q fever is a worldwide zoonosis caused by Coxiella
burnetii, a Gram-negative bacterium that can survive
for a prolonged time in the environment in a spore-
like stage. Until 2007, Q fever was a rarely reported
notifiable disease in The Netherlands, with 5–20
cases presenting annually and without seasonal
trend. However, underdiagnosis and consequently
underreporting were suspected as very few labora-
tories consistently tested pneumonia cases for Coxiella
infection. Q fever emerged in 2007, followed by sub-
sequently larger epidemics in 2008 and 2009 [1, 2],
which were probably related to intensive dairy goat
farming [3–5]. There is some evidence for a few retro-
spectively identified clusters of hospital admissions
for respiratory illness in 2005 and 2006 that might
have been caused by Q fever [6]. A seroprevalence
study in the 1980s by Richardus et al. found very high
prevalence estimates among blood donors and certain
risk groups ranging from 15% to 65% [7].
A recent community-based study from the USA
showed a seroprevalence of 3.1% [8], while 4% was
* Author for correspondence : B. Schimmer, M.D., Centre forInfectious Disease Control, National Institute for Public Healthand the Environment, PO Box 1, 3720 BA Bilthoven, TheNetherlands.(Email : [email protected])
Epidemiol. Infect. (2012), 140, 27–35. f Cambridge University Press 2011
doi:10.1017/S0950268811000136
found in a blood donor study in southern France in
the late 1980s [9] and 3.6% in Japanese blood donors
in the late 1990s [10]. Higher seroprevalences were
observed in other western countries : in Northern
Ireland, 12.8% in sera collected in 1986–1987 [11],
7.9% in rural Wales in the mid-1990s [12], similar to
the 7.5% found in southwestern Germany in 2008–
2009 [13]. In northwestern Russia a marked increase
in seroprevalence in a healthy population was ob-
served, from 1.1% in 1993 to 11.1% in 2003 [14].
In the UK the seroprevalence was 11.2% in an
occupational control cohort in the late 1980s [15].
Mediterranean countries report even higher sero-
prevalence levels : in Spain, 23.1% in blood donors in
Albacete [16], 48.6% in Eastern Cantabria [17], and
15.3% in the Barcelona region [18], while 13.5% was
found in north Turkey [19] and 52.7% in Cyprus [20].
A more detailed overview of human seroprevalence
studies done in European countries was recently
presented in reports by the European Food Safety
Authority and the European Centre for Disease
Prevention and Control [13, 21]. To understand the
baseline epidemiology of Q fever in The Netherlands
prior to the epidemics, available serum samples from
the general population, collected between February
2006 and June 2007 for evaluation by the Dutch
National Immunization Programme [22] were used to
obtain a seroprevalence estimate of the general Dutch
population just before the recent epidemics. In ad-
dition, risk factors for seropositivity were identified.
METHODS AND MATERIALS
Study population and questionnaire data
A large population-based seroprevalence study, called
the PIENTER project, was carried out primarily for
the evaluation of the Dutch National Immunization
Programme. Eight municipalities within each of
five geographical Dutch regions (Northeast, Central,
Northwest, Southwest and Southeast) were sampled
with probabilities proportional to their population
sizes (Fig. 1). In addition, there was an oversampling
of non-Western migrants in 12 of the above munici-
palities. Data collection started in February 2006 and
was finalized in June 2007. The study design and
details of the data collection in the PIENTER project
have been published [22]. The participants donated
blood and completed a questionnaire, one version
for children aged f14 years, and another version for
persons aged o15 years. The questionnaire covered,
among others, data on demographics, health percep-
tion and diseases, and activities possibly related to
infectious diseases (e.g. travelling, profession, food
habits, gardening).
Laboratory analysis
Stored sera of the nationwide sample of the
PIENTER project were screened for the presence of
C. burnetii IgG phase-2-specific antibodies by a com-
mercial enzyme-linked immunosorbent assay (ELISA)
according to the manufacturer’s instructions (Serion
ELISA classic, Virion/Serion, Germany). A positive
ELISA test was defined according to the manu-
facturer as a concentration of o30 U/ml, and a
borderline-positive ELISA was defined as a concen-
tration between 20 U/ml and 30 U/ml. We considered
ELISA-borderline-positive and ELISA-positive sam-
ples as a positive test result. Immunofluorescence
assay (IFA) is considered the reference method
for diagnostic screening of C. burnetii and a lower
sensitivity of the ELISA test compared to IFA was
anticipated, with a similar specificity [23]. ELISA-
borderline-positive and ELISA-positive samples were
subsequently confirmed by IFA (Focus Diagnostics,
Fig. 1. Selected municipalities in the seroprevalence study.Light grey municipalities are included in the nationwide
sample (n=40). Dark grey municipalities are low im-munization municipalities that are included in thePIENTER project but not in the present study.
28 B. Schimmer and others

LOW SEROPREVALENCE OF Q FEVER | 25
2.1
Low seroprevalence of Q fever in The Netherlands prior to aseries of large outbreaks
B. SCHIMMER 1*, D. W. NOTERMANS1, M. G. HARMS1, J. H. J. REIMERINK1,
J. BAKKER 1, P. SCHNEEBERGER 2, L. MOLLEMA 1, P. TEUNIS1, W. VAN PELT1
AND Y. VAN DUYNHOVEN 1
1 Centre for Infectious Disease Control, National Institute for Public Health and the Environment, Bilthoven,The Netherlands2 Laboratory for Medical Microbiology, Jeroen Bosch Hospital, ‘s-Hertogenbosch, The Netherlands
(Accepted 19 January 2011; first published online 16 February 2011)
SUMMARY
The Netherlands has experienced large community outbreaks of Q fever since 2007. Sera and
questionnaires containing epidemiological data from 5654 individuals were obtained in a
nationwide seroprevalence survey used to evaluate the National Immunization Programme in
2006–2007. We tested these sera for IgG phase-2 antibodies against Coxiella burnetii with an
ELISA to estimate the seroprevalence and to identify determinants for seropositivity before the
Q fever outbreaks occurred. Overall seroprevalence was 1.5% [95% confidence interval (CI)
1.3–1.7]. Corrected for confirmation with immunofluorescence results in a subset, the estimated
seroprevalence was 2.4%. Seropositivity ranged from 0.48% (95% CI 0.00–0.96) in the 0–4 years
age group to 2.30% (95% CI 1.46–3.15) in the 60–79 years age group. Keeping ruminants,
increasing age and being born in Turkey were independent risk factors for seropositivity. The low
seroprevalence before the start of the outbreaks supports the hypothesis that The Netherlands has
been confronted with a newly emerging Q fever problem since spring 2007.
Key words : Coxiella, epidemiology, Q fever, risk factors, serology.
INTRODUCTION
Q fever is a worldwide zoonosis caused by Coxiella
burnetii, a Gram-negative bacterium that can survive
for a prolonged time in the environment in a spore-
like stage. Until 2007, Q fever was a rarely reported
notifiable disease in The Netherlands, with 5–20
cases presenting annually and without seasonal
trend. However, underdiagnosis and consequently
underreporting were suspected as very few labora-
tories consistently tested pneumonia cases for Coxiella
infection. Q fever emerged in 2007, followed by sub-
sequently larger epidemics in 2008 and 2009 [1, 2],
which were probably related to intensive dairy goat
farming [3–5]. There is some evidence for a few retro-
spectively identified clusters of hospital admissions
for respiratory illness in 2005 and 2006 that might
have been caused by Q fever [6]. A seroprevalence
study in the 1980s by Richardus et al. found very high
prevalence estimates among blood donors and certain
risk groups ranging from 15% to 65% [7].
A recent community-based study from the USA
showed a seroprevalence of 3.1% [8], while 4% was
* Author for correspondence : B. Schimmer, M.D., Centre forInfectious Disease Control, National Institute for Public Healthand the Environment, PO Box 1, 3720 BA Bilthoven, TheNetherlands.(Email : [email protected])
Epidemiol. Infect. (2012), 140, 27–35. f Cambridge University Press 2011
doi:10.1017/S0950268811000136
found in a blood donor study in southern France in
the late 1980s [9] and 3.6% in Japanese blood donors
in the late 1990s [10]. Higher seroprevalences were
observed in other western countries : in Northern
Ireland, 12.8% in sera collected in 1986–1987 [11],
7.9% in rural Wales in the mid-1990s [12], similar to
the 7.5% found in southwestern Germany in 2008–
2009 [13]. In northwestern Russia a marked increase
in seroprevalence in a healthy population was ob-
served, from 1.1% in 1993 to 11.1% in 2003 [14].
In the UK the seroprevalence was 11.2% in an
occupational control cohort in the late 1980s [15].
Mediterranean countries report even higher sero-
prevalence levels : in Spain, 23.1% in blood donors in
Albacete [16], 48.6% in Eastern Cantabria [17], and
15.3% in the Barcelona region [18], while 13.5% was
found in north Turkey [19] and 52.7% in Cyprus [20].
A more detailed overview of human seroprevalence
studies done in European countries was recently
presented in reports by the European Food Safety
Authority and the European Centre for Disease
Prevention and Control [13, 21]. To understand the
baseline epidemiology of Q fever in The Netherlands
prior to the epidemics, available serum samples from
the general population, collected between February
2006 and June 2007 for evaluation by the Dutch
National Immunization Programme [22] were used to
obtain a seroprevalence estimate of the general Dutch
population just before the recent epidemics. In ad-
dition, risk factors for seropositivity were identified.
METHODS AND MATERIALS
Study population and questionnaire data
A large population-based seroprevalence study, called
the PIENTER project, was carried out primarily for
the evaluation of the Dutch National Immunization
Programme. Eight municipalities within each of
five geographical Dutch regions (Northeast, Central,
Northwest, Southwest and Southeast) were sampled
with probabilities proportional to their population
sizes (Fig. 1). In addition, there was an oversampling
of non-Western migrants in 12 of the above munici-
palities. Data collection started in February 2006 and
was finalized in June 2007. The study design and
details of the data collection in the PIENTER project
have been published [22]. The participants donated
blood and completed a questionnaire, one version
for children aged f14 years, and another version for
persons aged o15 years. The questionnaire covered,
among others, data on demographics, health percep-
tion and diseases, and activities possibly related to
infectious diseases (e.g. travelling, profession, food
habits, gardening).
Laboratory analysis
Stored sera of the nationwide sample of the
PIENTER project were screened for the presence of
C. burnetii IgG phase-2-specific antibodies by a com-
mercial enzyme-linked immunosorbent assay (ELISA)
according to the manufacturer’s instructions (Serion
ELISA classic, Virion/Serion, Germany). A positive
ELISA test was defined according to the manu-
facturer as a concentration of o30 U/ml, and a
borderline-positive ELISA was defined as a concen-
tration between 20 U/ml and 30 U/ml. We considered
ELISA-borderline-positive and ELISA-positive sam-
ples as a positive test result. Immunofluorescence
assay (IFA) is considered the reference method
for diagnostic screening of C. burnetii and a lower
sensitivity of the ELISA test compared to IFA was
anticipated, with a similar specificity [23]. ELISA-
borderline-positive and ELISA-positive samples were
subsequently confirmed by IFA (Focus Diagnostics,
Fig. 1. Selected municipalities in the seroprevalence study.Light grey municipalities are included in the nationwide
sample (n=40). Dark grey municipalities are low im-munization municipalities that are included in thePIENTER project but not in the present study.
28 B. Schimmer and others
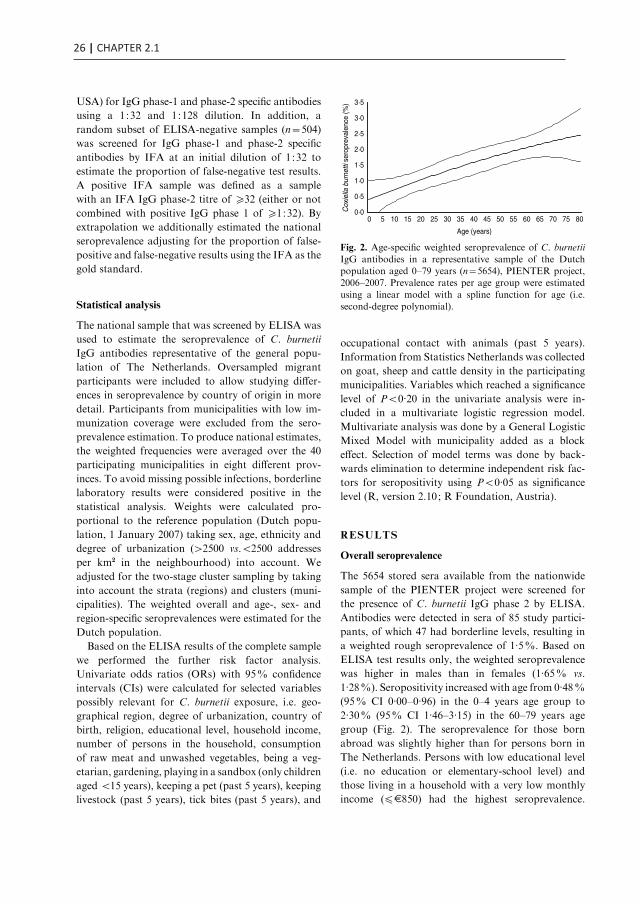
26 | CHAPTER 2.1
USA) for IgG phase-1 and phase-2 specific antibodies
using a 1:32 and 1:128 dilution. In addition, a
random subset of ELISA-negative samples (n=504)
was screened for IgG phase-1 and phase-2 specific
antibodies by IFA at an initial dilution of 1:32 to
estimate the proportion of false-negative test results.
A positive IFA sample was defined as a sample
with an IFA IgG phase-2 titre of o32 (either or not
combined with positive IgG phase 1 of o1:32). By
extrapolation we additionally estimated the national
seroprevalence adjusting for the proportion of false-
positive and false-negative results using the IFA as the
gold standard.
Statistical analysis
The national sample that was screened by ELISA was
used to estimate the seroprevalence of C. burnetii
IgG antibodies representative of the general popu-
lation of The Netherlands. Oversampled migrant
participants were included to allow studying differ-
ences in seroprevalence by country of origin in more
detail. Participants from municipalities with low im-
munization coverage were excluded from the sero-
prevalence estimation. To produce national estimates,
the weighted frequencies were averaged over the 40
participating municipalities in eight different prov-
inces. To avoid missing possible infections, borderline
laboratory results were considered positive in the
statistical analysis. Weights were calculated pro-
portional to the reference population (Dutch popu-
lation, 1 January 2007) taking sex, age, ethnicity and
degree of urbanization (>2500 vs.<2500 addresses
per km2 in the neighbourhood) into account. We
adjusted for the two-stage cluster sampling by taking
into account the strata (regions) and clusters (muni-
cipalities). The weighted overall and age-, sex- and
region-specific seroprevalences were estimated for the
Dutch population.
Based on the ELISA results of the complete sample
we performed the further risk factor analysis.
Univariate odds ratios (ORs) with 95% confidence
intervals (CIs) were calculated for selected variables
possibly relevant for C. burnetii exposure, i.e. geo-
graphical region, degree of urbanization, country of
birth, religion, educational level, household income,
number of persons in the household, consumption
of raw meat and unwashed vegetables, being a veg-
etarian, gardening, playing in a sandbox (only children
aged <15 years), keeping a pet (past 5 years), keeping
livestock (past 5 years), tick bites (past 5 years), and
occupational contact with animals (past 5 years).
Information from Statistics Netherlands was collected
on goat, sheep and cattle density in the participating
municipalities. Variables which reached a significance
level of P<0.20 in the univariate analysis were in-
cluded in a multivariate logistic regression model.
Multivariate analysis was done by a General Logistic
Mixed Model with municipality added as a block
effect. Selection of model terms was done by back-
wards elimination to determine independent risk fac-
tors for seropositivity using P<0.05 as significance
level (R, version 2.10; R Foundation, Austria).
RESULTS
Overall seroprevalence
The 5654 stored sera available from the nationwide
sample of the PIENTER project were screened for
the presence of C. burnetii IgG phase 2 by ELISA.
Antibodies were detected in sera of 85 study partici-
pants, of which 47 had borderline levels, resulting in
a weighted rough seroprevalence of 1.5%. Based on
ELISA test results only, the weighted seroprevalence
was higher in males than in females (1.65% vs.
1.28%). Seropositivity increased with age from 0.48%
(95% CI 0.00–0.96) in the 0–4 years age group to
2.30% (95% CI 1.46–3.15) in the 60–79 years age
group (Fig. 2). The seroprevalence for those born
abroad was slightly higher than for persons born in
The Netherlands. Persons with low educational level
(i.e. no education or elementary-school level) and
those living in a household with a very low monthly
income (fE850) had the highest seroprevalence.
0·0
0·5
1·0
1·5
2·0
2·5
3·0
3·5
0 5 10 15 20 25 30 35 40 45 50 55 60 65 70 75 80
Age (years)
Cox
iella
bur
netti
ser
opre
vale
nce
(%)
Fig. 2. Age-specific weighted seroprevalence of C. burnetii
IgG antibodies in a representative sample of the Dutchpopulation aged 0–79 years (n=5654), PIENTER project,2006–2007. Prevalence rates per age group were estimated
using a linear model with a spline function for age (i.e.second-degree polynomial).
Seroprevalence of Q fever in The Netherlands 29
No regional differences in seroprevalence were ob-
served (Table 1).
The 85 ELISA-positive samples were subsequently
screened by IFA. Fifteen samples (17.6%) turned
out IFA-negative. Of the remaining 70 IFA-positive
sera, 13 had a low-level IgG phase-2 titre ranging
between 1:32 and <1:128, while 57 sera had a titre
of o1:128. In the IFA-tested subset of 504 ELISA-
negative samples, six samples (1.2%) had low-level
IgG phase-2 titres ranging from 1:32 (n=5) to 1:128
(n=1). Correcting the ELISA results with the IFA
results, the adjusted overall seroprevalence estimate
was 2.4% (70 true positives and 66 false negatives
divided by the total number of 5654 study partici-
pants).
Determinants of C. burnetii seropositivity
Based on ELISA test results only, risk factors sig-
nificant at the P<0.20 level were increasing age,
being male, marital status, not being born in The
Netherlands, net income, religion, contact with cats
(past 12 months), kept livestock (past 5 years), fre-
quency of eating raw meat, and occupational contact
with animals (Table 2). No significant association was
found between seropositivity and goat, sheep or cattle
density in the 40 municipalities. In the multivariate
logistic regression model, seropositivity was found to
be associated with keeping ruminants (past 5 years)
with or without other farm animals [adjusted OR
(aOR) 8.2, 95% CI 3.3–20.8 and aOR 3.8, 95% CI,
1.1–13.1, respectively], being born in Turkey (aOR
5.1, CI 2.1–12.5), and increasing age (aOR 5.4, 95%
CI 1.4–20.4 for the 15–39 years age group; aOR 6.0,
95% CI 1.6–22.9 for the 40–59 years age group, and
aOR 6.6, 95% CI 1.8–24.0 for the oldest age group
of 60–79 years compared to the reference age group
of 0–14 years), with borderline significance being ob-
served for occupational contact with animals. Other
factors contributing to the multivariate model were
low monthly net income (fE850), and being male,
although these did not reach statistical significance
(Table 3). In the multivariate analysis, keeping pets
seemed to play a protective role (aOR 0.53, 95% CI
0.32–0.87). This variable was included based on the
significance of keeping rabbits as a variable in the
univariate analysis (P=0.18).
DISCUSSION
The overall Q fever seroprevalence, based on this
representative sample of the Dutch population from
2006 to 2007 is relatively low. The overall estimate of
1.5%, and IFA-corrected estimate of 2.4% reflect the
seroprevalence in a pre-epidemic period as the tested
sera were collected in 2006 and the first half 2007,
just before the major Q fever epidemics in 2007–2009.
The a-priori expected C. burnetii IgG phase-2 sero-
prevalence was estimated to be around 4% based on
screening of serum samples of pregnant women out-
side the epidemic area carried out in 2007 by IFA [24].
For comparison, since the epidemic rise in 2007,
seropositivity rates of the general population have
probably increased, as shown by a 24% seropositivity
rate in the population of the Q fever epicentre of 2007
[3]. In the 1980s, the seroprevalence for C. burnetii
in blood donors was studied in different regions of
Table 1. Weighted* seroprevalence of Coxiella
burnetii IgG phase-2 antibodies (Serion ELISA, IgG
phase 2) in the Dutch population aged 0–79 years
(n=5654), PIENTER 2 project, The Netherlands,
February 2006–June 2007
N (n positive)Seroprevalence(95% CI)
Overall 5654 (85) 1.46 (1.18–1.74)Sex
Male 2522 (45) 1.64 (1.21–2.07)Female 3132 (40) 1.28 (0.90–1.65)
Country of birthOther 735 (15) 1.78 (0.98–2.59)
The Netherlands 4833 (68) 1.41 (1.08–1.75)
Age category (yr)0–4 571 (4) 0.48 (0.00–0.96)5–19 1228 (9) 0.71 (0.24–1.19)
20–39 1321 (19) 1.56 (0.92–2.20)40–59 1266 (23) 1.65 (0.93–2.37)60–79 1268 (30) 2.30 (1.46–3.15)
Education
Elementary level 1373 (30) 2.05 (1.33–2.77)High school 2668 (30) 1.13 (0.68–1.57)University level 1515 (23) 1.54 (0.88–2.19)
Net income (E/month)f850 354 (10) 2.94 (1.15–4.74)
>850 4126 (62) 1.44 (1.10–1.78)
RegionNortheast 1328 (19) 1.48 (1.04–1.92)Central 1025 (18) 1.84 (0.93–2.76)
Northwest 1332 (22) 1.49 (0.86–2.12)Southwest 998 (13) 1.21 (0.67–1.76)Southeast 971 (13) 1.23 (0.67–1.78)
CI, Confidence interval.
* Weighted for sex, age, ethnicity and degree of urban-ization.
30 B. Schimmer and others

LOW SEROPREVALENCE OF Q FEVER | 27
2.1
USA) for IgG phase-1 and phase-2 specific antibodies
using a 1:32 and 1:128 dilution. In addition, a
random subset of ELISA-negative samples (n=504)
was screened for IgG phase-1 and phase-2 specific
antibodies by IFA at an initial dilution of 1:32 to
estimate the proportion of false-negative test results.
A positive IFA sample was defined as a sample
with an IFA IgG phase-2 titre of o32 (either or not
combined with positive IgG phase 1 of o1:32). By
extrapolation we additionally estimated the national
seroprevalence adjusting for the proportion of false-
positive and false-negative results using the IFA as the
gold standard.
Statistical analysis
The national sample that was screened by ELISA was
used to estimate the seroprevalence of C. burnetii
IgG antibodies representative of the general popu-
lation of The Netherlands. Oversampled migrant
participants were included to allow studying differ-
ences in seroprevalence by country of origin in more
detail. Participants from municipalities with low im-
munization coverage were excluded from the sero-
prevalence estimation. To produce national estimates,
the weighted frequencies were averaged over the 40
participating municipalities in eight different prov-
inces. To avoid missing possible infections, borderline
laboratory results were considered positive in the
statistical analysis. Weights were calculated pro-
portional to the reference population (Dutch popu-
lation, 1 January 2007) taking sex, age, ethnicity and
degree of urbanization (>2500 vs.<2500 addresses
per km2 in the neighbourhood) into account. We
adjusted for the two-stage cluster sampling by taking
into account the strata (regions) and clusters (muni-
cipalities). The weighted overall and age-, sex- and
region-specific seroprevalences were estimated for the
Dutch population.
Based on the ELISA results of the complete sample
we performed the further risk factor analysis.
Univariate odds ratios (ORs) with 95% confidence
intervals (CIs) were calculated for selected variables
possibly relevant for C. burnetii exposure, i.e. geo-
graphical region, degree of urbanization, country of
birth, religion, educational level, household income,
number of persons in the household, consumption
of raw meat and unwashed vegetables, being a veg-
etarian, gardening, playing in a sandbox (only children
aged <15 years), keeping a pet (past 5 years), keeping
livestock (past 5 years), tick bites (past 5 years), and
occupational contact with animals (past 5 years).
Information from Statistics Netherlands was collected
on goat, sheep and cattle density in the participating
municipalities. Variables which reached a significance
level of P<0.20 in the univariate analysis were in-
cluded in a multivariate logistic regression model.
Multivariate analysis was done by a General Logistic
Mixed Model with municipality added as a block
effect. Selection of model terms was done by back-
wards elimination to determine independent risk fac-
tors for seropositivity using P<0.05 as significance
level (R, version 2.10; R Foundation, Austria).
RESULTS
Overall seroprevalence
The 5654 stored sera available from the nationwide
sample of the PIENTER project were screened for
the presence of C. burnetii IgG phase 2 by ELISA.
Antibodies were detected in sera of 85 study partici-
pants, of which 47 had borderline levels, resulting in
a weighted rough seroprevalence of 1.5%. Based on
ELISA test results only, the weighted seroprevalence
was higher in males than in females (1.65% vs.
1.28%). Seropositivity increased with age from 0.48%
(95% CI 0.00–0.96) in the 0–4 years age group to
2.30% (95% CI 1.46–3.15) in the 60–79 years age
group (Fig. 2). The seroprevalence for those born
abroad was slightly higher than for persons born in
The Netherlands. Persons with low educational level
(i.e. no education or elementary-school level) and
those living in a household with a very low monthly
income (fE850) had the highest seroprevalence.
0·0
0·5
1·0
1·5
2·0
2·5
3·0
3·5
0 5 10 15 20 25 30 35 40 45 50 55 60 65 70 75 80
Age (years)
Cox
iella
bur
netti
ser
opre
vale
nce
(%)
Fig. 2. Age-specific weighted seroprevalence of C. burnetii
IgG antibodies in a representative sample of the Dutchpopulation aged 0–79 years (n=5654), PIENTER project,2006–2007. Prevalence rates per age group were estimated
using a linear model with a spline function for age (i.e.second-degree polynomial).
Seroprevalence of Q fever in The Netherlands 29
No regional differences in seroprevalence were ob-
served (Table 1).
The 85 ELISA-positive samples were subsequently
screened by IFA. Fifteen samples (17.6%) turned
out IFA-negative. Of the remaining 70 IFA-positive
sera, 13 had a low-level IgG phase-2 titre ranging
between 1:32 and <1:128, while 57 sera had a titre
of o1:128. In the IFA-tested subset of 504 ELISA-
negative samples, six samples (1.2%) had low-level
IgG phase-2 titres ranging from 1:32 (n=5) to 1:128
(n=1). Correcting the ELISA results with the IFA
results, the adjusted overall seroprevalence estimate
was 2.4% (70 true positives and 66 false negatives
divided by the total number of 5654 study partici-
pants).
Determinants of C. burnetii seropositivity
Based on ELISA test results only, risk factors sig-
nificant at the P<0.20 level were increasing age,
being male, marital status, not being born in The
Netherlands, net income, religion, contact with cats
(past 12 months), kept livestock (past 5 years), fre-
quency of eating raw meat, and occupational contact
with animals (Table 2). No significant association was
found between seropositivity and goat, sheep or cattle
density in the 40 municipalities. In the multivariate
logistic regression model, seropositivity was found to
be associated with keeping ruminants (past 5 years)
with or without other farm animals [adjusted OR
(aOR) 8.2, 95% CI 3.3–20.8 and aOR 3.8, 95% CI,
1.1–13.1, respectively], being born in Turkey (aOR
5.1, CI 2.1–12.5), and increasing age (aOR 5.4, 95%
CI 1.4–20.4 for the 15–39 years age group; aOR 6.0,
95% CI 1.6–22.9 for the 40–59 years age group, and
aOR 6.6, 95% CI 1.8–24.0 for the oldest age group
of 60–79 years compared to the reference age group
of 0–14 years), with borderline significance being ob-
served for occupational contact with animals. Other
factors contributing to the multivariate model were
low monthly net income (fE850), and being male,
although these did not reach statistical significance
(Table 3). In the multivariate analysis, keeping pets
seemed to play a protective role (aOR 0.53, 95% CI
0.32–0.87). This variable was included based on the
significance of keeping rabbits as a variable in the
univariate analysis (P=0.18).
DISCUSSION
The overall Q fever seroprevalence, based on this
representative sample of the Dutch population from
2006 to 2007 is relatively low. The overall estimate of
1.5%, and IFA-corrected estimate of 2.4% reflect the
seroprevalence in a pre-epidemic period as the tested
sera were collected in 2006 and the first half 2007,
just before the major Q fever epidemics in 2007–2009.
The a-priori expected C. burnetii IgG phase-2 sero-
prevalence was estimated to be around 4% based on
screening of serum samples of pregnant women out-
side the epidemic area carried out in 2007 by IFA [24].
For comparison, since the epidemic rise in 2007,
seropositivity rates of the general population have
probably increased, as shown by a 24% seropositivity
rate in the population of the Q fever epicentre of 2007
[3]. In the 1980s, the seroprevalence for C. burnetii
in blood donors was studied in different regions of
Table 1. Weighted* seroprevalence of Coxiella
burnetii IgG phase-2 antibodies (Serion ELISA, IgG
phase 2) in the Dutch population aged 0–79 years
(n=5654), PIENTER 2 project, The Netherlands,
February 2006–June 2007
N (n positive)Seroprevalence(95% CI)
Overall 5654 (85) 1.46 (1.18–1.74)Sex
Male 2522 (45) 1.64 (1.21–2.07)Female 3132 (40) 1.28 (0.90–1.65)
Country of birthOther 735 (15) 1.78 (0.98–2.59)
The Netherlands 4833 (68) 1.41 (1.08–1.75)
Age category (yr)0–4 571 (4) 0.48 (0.00–0.96)5–19 1228 (9) 0.71 (0.24–1.19)
20–39 1321 (19) 1.56 (0.92–2.20)40–59 1266 (23) 1.65 (0.93–2.37)60–79 1268 (30) 2.30 (1.46–3.15)
Education
Elementary level 1373 (30) 2.05 (1.33–2.77)High school 2668 (30) 1.13 (0.68–1.57)University level 1515 (23) 1.54 (0.88–2.19)
Net income (E/month)f850 354 (10) 2.94 (1.15–4.74)
>850 4126 (62) 1.44 (1.10–1.78)
RegionNortheast 1328 (19) 1.48 (1.04–1.92)Central 1025 (18) 1.84 (0.93–2.76)
Northwest 1332 (22) 1.49 (0.86–2.12)Southwest 998 (13) 1.21 (0.67–1.76)Southeast 971 (13) 1.23 (0.67–1.78)
CI, Confidence interval.
* Weighted for sex, age, ethnicity and degree of urban-ization.
30 B. Schimmer and others

28 | CHAPTER 2.1
The Netherlands using an IFA developed in-house.
Using a low cut-off for positivity in this IFA (screen-
ing dilution of 1:16), a high seroprevalence was found,
ranging between 15% and 65%, depending on region,
sex and age [7]. Unfortunately, no information was
available on exact titres measured. It is unknown how
current IFAs and ELISAs relate to this previously
used in-house IFA, as neither the test nor the sera are
available at present. The high seroprevalences found
in the 1980s led to the suggestion that C. burnetii may
have been far more prevalent for a considerable time
than the number of notifications suggested, and that
before 2007 clinical cases were not detected because
of the aspecific presentation of most symptomatic
Q fever infections as well as a large proportion of
asymptomatic and subclinical infections. Few labor-
atories had serology for C. burnetii in their standard
panel for pneumonia patients before national aware-
ness was raised by the Q fever outbreaks.
Several other population studies observed sero-
prevalences between 2% and 4%, similar to the esti-
mated seroprevalence found in our study [8–10].
However, comparisons of seroprevalence estimates
should be made with caution as different study
populations, different serological assays and criteria
for positivity are used. The latter is especially im-
portant in population surveys, while comparisons
of assays in The Netherlands for diagnoses of acute
cases demonstrate a high concordance of test results.
Increasing age, being born in Turkey, keeping rumi-
nants and to a lesser extent occupational contact with
animals were identified as independent risk factors for
Q fever seropositivity in this study. The increase in
seroprevalence with age is consistent with findings
from other seroprevalence studies [8, 25] ; however,
the range of age-specific seroprevalences in our study
is smaller. In accord with other studies [8, 11], we
showed that young children and adolescents have a
very low seroprevalence, which is supported by a very
small proportion of children in the notified clinical
cases in our routine Q fever surveillance. Keeping
ruminants was an independent risk factor in our study
as shown also in other studies [8, 11, 25]. Turkey as
country of birth was an independent risk factor. In
accord with this observation, recent studies in Turkey
indicate that Q fever is highly prevalent : prevalence of
C. burnetii anti-phase-2 IgG was 13.5% in healthy
subjects in the west Black Sea region [19] and 32.3%
by ELISA in blood donors from Ankara [26].
In southwestern Germany, the seroprevalence
showed a linear increase with sheep density in
different municipalities [13]. In our study we did not
find an association between goat, sheep and cattle
density, and seropositivity in the 40 municipalities,
suggesting that the dominant role of the dairy goats
in the epidemiology of Q fever in The Netherlands
is a relatively recent occurrence. Occupational animal
contact was not a strong independent predictor in the
multivariate analysis as there was a large overlap with
those keeping ruminants. The kind of occupational
animal contact was not further specified in the
questionnaire which also included contact with non-
ruminant species. Livestock farmers, veterinarians,
slaughterhouse workers and animal laboratory staff
are known occupational risk groups for Q fever, as
exemplified by higher seroprevalence levels than the
general population [11, 25]. In order to investigate the
actual risk for professionals dealing with livestock,
separate seroprevalence studies in livestock farmers,
veterinarians and persons actively involved in culling
activities at infected dairy farms are currently per-
formed in The Netherlands. Although poverty was a
risk factor in a seroprevalence study from the USA
[8], we cannot fully support this observation as the
category with the lowest monthly net income (fE850)
was not statistically significant in the multivariate
model. This is possibly caused by a large proportion
in this income group that chose not to disclose their
monthly income. Males generally have higher sero-
prevalence than females, which is often explained by
occupational contact. In our study, being male is a
possible confounding factor, at least partially ex-
plained by occupational exposure to animals. In lab-
oratory surveillance studies, males are more likely to
be diagnosed as they more often develop symptoms,
as shown in our routine laboratory surveillance.
Others suggested that this is explained by sex hor-
mones that may control the host’s immune response
to a C. burnetii infection [27], resulting in gender dif-
ferences in clinical attack rates. In the case-control
study performed during the first epidemic season
in 2007 in the main cluster area in the south of
The Netherlands we observed a higher proportion
of males developing symptoms, while seroprevalence
due to the airborne exposure was equally distributed
among males and females [3]. It is unclear why keep-
ing pets turned out to be a protective factor. Other
studies did not find any association with keeping pets,
or in contrast, found pets to be a risk factor, such as
in a recent study from Germany where pet rats were
surprisingly found as a risk factor (S. Brockmann,
unpublished observations). Moreover, several Q fever
Seroprevalence of Q fever in The Netherlands 31
Table 2. Coxiella burnetii IgG antibodies (%) in study population (n=5654) and adjusted* univariate analysis of
factors associated with seropositivity to Coxiella burnetii PIENTER 2 project, The Netherlands, February
2006–June 2007
Variable
No. (%) of respondents
OR (95% CI) P
Seropositive
(n=85)
Seronegative
(n=5569)
Degree of urbanization 0.91Very urbanized 20 (1.64) 1197 (98.36) 1.34 (0.60–3.28)Urbanized 37 (1.47) 2488 (98.53) 1.18 (0.57–2.75)
Moderately urbanized 10 (1.44) 685 (98.56) 1.18 (0.46–3.13)Little urbanized 10 (1.83) 536 (98.17) 1.51 (0.59–4.00)Rural 8 (1.19) 663 (98.81) Reference
Age category (yr) <0.01
0–14 7 (0.46) 1516 (99.54) Reference15–39 25 (1.57) 1572 (98.43) 4.02 (1.80–10.22)40–59 23 (1.82) 1243 (98.18) 4.62 (2.05–11.81)
60–79 30 (2.37) 1238 (97.63) 5.87 (2.69–14.73)
Sex 0.12Male 45 (1.78) 2477 (98.22) 1.41 (0.92–2.18)Female 40 (1.28) 3092 (98.72) Reference
Marital status 0.02
Married, registered partnership, living together 52 (1.87) 2733 (98.13) 0.58 (0.31–1.14)Not married 18 (2.13) 829 (97.87) ReferenceDivorced, living apart, widow, widower 7 (1.64) 419 (98.36) 0.48 (0.17–1.29)
Country of birth 0.02The Netherlands 68 (1.41) 4765 (98.59) Reference
Turkey 6 (6.32) 89 (93.68) 5.23 (1.96–11.72)Other country 9 (1.41) 631 (98.59) 0.98 (0.45–1.90)
Net income (E/month) 0.08f850 10 (2.82) 344 (97.18) 2.16 (1.02–4.14)
>850 62 (1.50) 4064 (98.50) ReferenceChose not to answer/ missing 13 (1.11) 1161 (98.89) 0.8 (0.42–1.43)
Religion 0.08Protestant Christian 28 (2.15) 1273 (97.85) 1.72 (0.97–3.08)
Catholic 18 (1.11) 1601 (98.89) 0.88 (0.46–1.65)Muslim 11 (2.81) 381 (97.19) 3.23 (1.14–7.98)Other religion 5 (1.59) 310 (98.41) 1.38 (0.46–3.43)
No religion 22 (1.12) 1941 (98.88) Reference
Allergies (self-reported) 0.13No allergies 80 (1.45) 5423 (98.55) ReferenceDust allergy 2 (9.09) 20 (90.91) 5.87 (0.90–21.63)
Contact with cats# 0.09
No contact 47 (1.90) 2428 (98.10) ReferenceYes, contact with young cats 0 (0.0) 192 (100.0) 0.00 (0.00–13.49)Yes, contact with older cats 25 (1.15) 2141 (98.85) 0.69 (0.42–1.12)Yes, both or of unknown age 11 (1.75) 619 (98.25) 1.18 (0.57–2.25)
Kept pets (past 5 years) 0.21No 48 (2.00) 2349 (98.00) ReferenceYes 35 (1.10) 3147 (98.90) 0.70 (0.44–1.11)
Kept livestock (past 5 years) <0.01No 69 (1.33) 5116 (98.67) Reference
Yes, ruminants only 3 (4.62) 62 (95.38) 4.25 (1.00–12.31)Yes, ruminants and other farm animals 7 (8.86) 72 (91.14) 8.99 (3.54–19.93)Yes, but no ruminants 2 (1.14) 173 (98.86) 1.09 (0.18–3.56)
32 B. Schimmer and others

LOW SEROPREVALENCE OF Q FEVER | 29
2.1
The Netherlands using an IFA developed in-house.
Using a low cut-off for positivity in this IFA (screen-
ing dilution of 1:16), a high seroprevalence was found,
ranging between 15% and 65%, depending on region,
sex and age [7]. Unfortunately, no information was
available on exact titres measured. It is unknown how
current IFAs and ELISAs relate to this previously
used in-house IFA, as neither the test nor the sera are
available at present. The high seroprevalences found
in the 1980s led to the suggestion that C. burnetii may
have been far more prevalent for a considerable time
than the number of notifications suggested, and that
before 2007 clinical cases were not detected because
of the aspecific presentation of most symptomatic
Q fever infections as well as a large proportion of
asymptomatic and subclinical infections. Few labor-
atories had serology for C. burnetii in their standard
panel for pneumonia patients before national aware-
ness was raised by the Q fever outbreaks.
Several other population studies observed sero-
prevalences between 2% and 4%, similar to the esti-
mated seroprevalence found in our study [8–10].
However, comparisons of seroprevalence estimates
should be made with caution as different study
populations, different serological assays and criteria
for positivity are used. The latter is especially im-
portant in population surveys, while comparisons
of assays in The Netherlands for diagnoses of acute
cases demonstrate a high concordance of test results.
Increasing age, being born in Turkey, keeping rumi-
nants and to a lesser extent occupational contact with
animals were identified as independent risk factors for
Q fever seropositivity in this study. The increase in
seroprevalence with age is consistent with findings
from other seroprevalence studies [8, 25] ; however,
the range of age-specific seroprevalences in our study
is smaller. In accord with other studies [8, 11], we
showed that young children and adolescents have a
very low seroprevalence, which is supported by a very
small proportion of children in the notified clinical
cases in our routine Q fever surveillance. Keeping
ruminants was an independent risk factor in our study
as shown also in other studies [8, 11, 25]. Turkey as
country of birth was an independent risk factor. In
accord with this observation, recent studies in Turkey
indicate that Q fever is highly prevalent : prevalence of
C. burnetii anti-phase-2 IgG was 13.5% in healthy
subjects in the west Black Sea region [19] and 32.3%
by ELISA in blood donors from Ankara [26].
In southwestern Germany, the seroprevalence
showed a linear increase with sheep density in
different municipalities [13]. In our study we did not
find an association between goat, sheep and cattle
density, and seropositivity in the 40 municipalities,
suggesting that the dominant role of the dairy goats
in the epidemiology of Q fever in The Netherlands
is a relatively recent occurrence. Occupational animal
contact was not a strong independent predictor in the
multivariate analysis as there was a large overlap with
those keeping ruminants. The kind of occupational
animal contact was not further specified in the
questionnaire which also included contact with non-
ruminant species. Livestock farmers, veterinarians,
slaughterhouse workers and animal laboratory staff
are known occupational risk groups for Q fever, as
exemplified by higher seroprevalence levels than the
general population [11, 25]. In order to investigate the
actual risk for professionals dealing with livestock,
separate seroprevalence studies in livestock farmers,
veterinarians and persons actively involved in culling
activities at infected dairy farms are currently per-
formed in The Netherlands. Although poverty was a
risk factor in a seroprevalence study from the USA
[8], we cannot fully support this observation as the
category with the lowest monthly net income (fE850)
was not statistically significant in the multivariate
model. This is possibly caused by a large proportion
in this income group that chose not to disclose their
monthly income. Males generally have higher sero-
prevalence than females, which is often explained by
occupational contact. In our study, being male is a
possible confounding factor, at least partially ex-
plained by occupational exposure to animals. In lab-
oratory surveillance studies, males are more likely to
be diagnosed as they more often develop symptoms,
as shown in our routine laboratory surveillance.
Others suggested that this is explained by sex hor-
mones that may control the host’s immune response
to a C. burnetii infection [27], resulting in gender dif-
ferences in clinical attack rates. In the case-control
study performed during the first epidemic season
in 2007 in the main cluster area in the south of
The Netherlands we observed a higher proportion
of males developing symptoms, while seroprevalence
due to the airborne exposure was equally distributed
among males and females [3]. It is unclear why keep-
ing pets turned out to be a protective factor. Other
studies did not find any association with keeping pets,
or in contrast, found pets to be a risk factor, such as
in a recent study from Germany where pet rats were
surprisingly found as a risk factor (S. Brockmann,
unpublished observations). Moreover, several Q fever
Seroprevalence of Q fever in The Netherlands 31
Table 2. Coxiella burnetii IgG antibodies (%) in study population (n=5654) and adjusted* univariate analysis of
factors associated with seropositivity to Coxiella burnetii PIENTER 2 project, The Netherlands, February
2006–June 2007
Variable
No. (%) of respondents
OR (95% CI) P
Seropositive
(n=85)
Seronegative
(n=5569)
Degree of urbanization 0.91Very urbanized 20 (1.64) 1197 (98.36) 1.34 (0.60–3.28)Urbanized 37 (1.47) 2488 (98.53) 1.18 (0.57–2.75)
Moderately urbanized 10 (1.44) 685 (98.56) 1.18 (0.46–3.13)Little urbanized 10 (1.83) 536 (98.17) 1.51 (0.59–4.00)Rural 8 (1.19) 663 (98.81) Reference
Age category (yr) <0.01
0–14 7 (0.46) 1516 (99.54) Reference15–39 25 (1.57) 1572 (98.43) 4.02 (1.80–10.22)40–59 23 (1.82) 1243 (98.18) 4.62 (2.05–11.81)
60–79 30 (2.37) 1238 (97.63) 5.87 (2.69–14.73)
Sex 0.12Male 45 (1.78) 2477 (98.22) 1.41 (0.92–2.18)Female 40 (1.28) 3092 (98.72) Reference
Marital status 0.02
Married, registered partnership, living together 52 (1.87) 2733 (98.13) 0.58 (0.31–1.14)Not married 18 (2.13) 829 (97.87) ReferenceDivorced, living apart, widow, widower 7 (1.64) 419 (98.36) 0.48 (0.17–1.29)
Country of birth 0.02The Netherlands 68 (1.41) 4765 (98.59) Reference
Turkey 6 (6.32) 89 (93.68) 5.23 (1.96–11.72)Other country 9 (1.41) 631 (98.59) 0.98 (0.45–1.90)
Net income (E/month) 0.08f850 10 (2.82) 344 (97.18) 2.16 (1.02–4.14)
>850 62 (1.50) 4064 (98.50) ReferenceChose not to answer/ missing 13 (1.11) 1161 (98.89) 0.8 (0.42–1.43)
Religion 0.08Protestant Christian 28 (2.15) 1273 (97.85) 1.72 (0.97–3.08)
Catholic 18 (1.11) 1601 (98.89) 0.88 (0.46–1.65)Muslim 11 (2.81) 381 (97.19) 3.23 (1.14–7.98)Other religion 5 (1.59) 310 (98.41) 1.38 (0.46–3.43)
No religion 22 (1.12) 1941 (98.88) Reference
Allergies (self-reported) 0.13No allergies 80 (1.45) 5423 (98.55) ReferenceDust allergy 2 (9.09) 20 (90.91) 5.87 (0.90–21.63)
Contact with cats# 0.09
No contact 47 (1.90) 2428 (98.10) ReferenceYes, contact with young cats 0 (0.0) 192 (100.0) 0.00 (0.00–13.49)Yes, contact with older cats 25 (1.15) 2141 (98.85) 0.69 (0.42–1.12)Yes, both or of unknown age 11 (1.75) 619 (98.25) 1.18 (0.57–2.25)
Kept pets (past 5 years) 0.21No 48 (2.00) 2349 (98.00) ReferenceYes 35 (1.10) 3147 (98.90) 0.70 (0.44–1.11)
Kept livestock (past 5 years) <0.01No 69 (1.33) 5116 (98.67) Reference
Yes, ruminants only 3 (4.62) 62 (95.38) 4.25 (1.00–12.31)Yes, ruminants and other farm animals 7 (8.86) 72 (91.14) 8.99 (3.54–19.93)Yes, but no ruminants 2 (1.14) 173 (98.86) 1.09 (0.18–3.56)
32 B. Schimmer and others
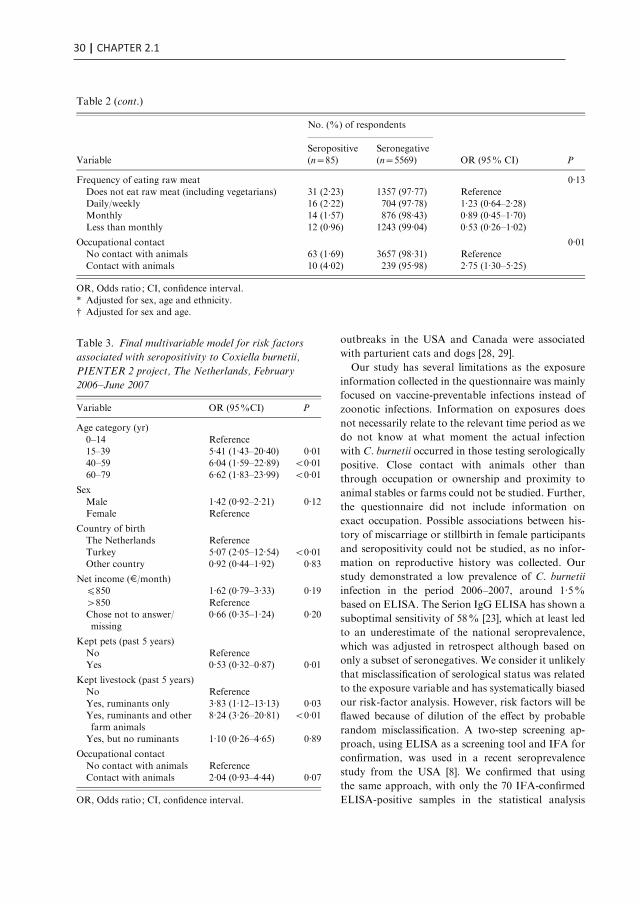
30 | CHAPTER 2.1
outbreaks in the USA and Canada were associated
with parturient cats and dogs [28, 29].
Our study has several limitations as the exposure
information collected in the questionnaire was mainly
focused on vaccine-preventable infections instead of
zoonotic infections. Information on exposures does
not necessarily relate to the relevant time period as we
do not know at what moment the actual infection
with C. burnetii occurred in those testing serologically
positive. Close contact with animals other than
through occupation or ownership and proximity to
animal stables or farms could not be studied. Further,
the questionnaire did not include information on
exact occupation. Possible associations between his-
tory of miscarriage or stillbirth in female participants
and seropositivity could not be studied, as no infor-
mation on reproductive history was collected. Our
study demonstrated a low prevalence of C. burnetii
infection in the period 2006–2007, around 1.5%
based on ELISA. The Serion IgG ELISA has shown a
suboptimal sensitivity of 58% [23], which at least led
to an underestimate of the national seroprevalence,
which was adjusted in retrospect although based on
only a subset of seronegatives. We consider it unlikely
that misclassification of serological status was related
to the exposure variable and has systematically biased
our risk-factor analysis. However, risk factors will be
flawed because of dilution of the effect by probable
random misclassification. A two-step screening ap-
proach, using ELISA as a screening tool and IFA for
confirmation, was used in a recent seroprevalence
study from the USA [8]. We confirmed that using
the same approach, with only the 70 IFA-confirmed
ELISA-positive samples in the statistical analysis
Table 2 (cont.)
Variable
No. (%) of respondents
OR (95% CI) PSeropositive(n=85)
Seronegative(n=5569)
Frequency of eating raw meat 0.13
Does not eat raw meat (including vegetarians) 31 (2.23) 1357 (97.77) ReferenceDaily/weekly 16 (2.22) 704 (97.78) 1.23 (0.64–2.28)Monthly 14 (1.57) 876 (98.43) 0.89 (0.45–1.70)
Less than monthly 12 (0.96) 1243 (99.04) 0.53 (0.26–1.02)
Occupational contact 0.01No contact with animals 63 (1.69) 3657 (98.31) ReferenceContact with animals 10 (4.02) 239 (95.98) 2.75 (1.30–5.25)
OR, Odds ratio ; CI, confidence interval.
* Adjusted for sex, age and ethnicity.# Adjusted for sex and age.
Table 3. Final multivariable model for risk factors
associated with seropositivity to Coxiella burnetii,
PIENTER 2 project, The Netherlands, February
2006–June 2007
Variable OR (95%CI) P
Age category (yr)
0–14 Reference15–39 5.41 (1.43–20.40) 0.0140–59 6.04 (1.59–22.89) <0.0160–79 6.62 (1.83–23.99) <0.01
Sex
Male 1.42 (0.92–2.21) 0.12Female Reference
Country of birthThe Netherlands Reference
Turkey 5.07 (2.05–12.54) <0.01Other country 0.92 (0.44–1.92) 0.83
Net income (E/month)f850 1.62 (0.79–3.33) 0.19
>850 ReferenceChose not to answer/missing
0.66 (0.35–1.24) 0.20
Kept pets (past 5 years)
No ReferenceYes 0.53 (0.32–0.87) 0.01
Kept livestock (past 5 years)No Reference
Yes, ruminants only 3.83 (1.12–13.13) 0.03Yes, ruminants and otherfarm animals
8.24 (3.26–20.81) <0.01
Yes, but no ruminants 1.10 (0.26–4.65) 0.89
Occupational contact
No contact with animals ReferenceContact with animals 2.04 (0.93–4.44) 0.07
OR, Odds ratio ; CI, confidence interval.
Seroprevalence of Q fever in The Netherlands 33
instead of 85 ELISA-positive samples, the same risk
factors were observed as in the current study (data not
shown). A separate risk-factor analysis only based on
the subset of IFA-tested samples was not possible due
to low seroprevalence.
Further modelling studies are necessary to study
the relationship between IFA and ELISA and im-
prove or replace the cut-off for ELISA as a binomial
outcome to a probability, which will improve the
multivariate analysis of the risk factors, but confi-
dence intervals will remain large. Municipalities in the
highest-incidence Q fever areas in 2007–2010 were not
part of the study sample. In 2007 a much larger part
of Noord-Brabant province was already affected.
Several other municipalities in this early-affected prov-
ince were included in our study sample. However,
adjacent municipalities did not show a higher sero-
prevalence nor was a relationship of seroprevalence
with goat density observed.
This study will serve as a baseline for future popu-
lation-based seroprevalence studies performed after
the emergence of Q fever. Prior to the recent Q fever
epidemics the overall seroprevalence of C. burnetii
infection in The Netherlands was relatively low and it
was not associated with goat, sheep or cattle density,
but merely with keeping ruminants or occupational
contact with animals. This supports the hypothesis
that The Netherlands has been confronted with a
newly emerging Q fever problem in the general
population since the spring of 2007. Before the start of
the epidemics, high-risk groups for Q fever were in-
dividuals with animal contact, including occupational
exposure, and Turkish immigrants, probably infected
in their home country. Further modelling studies
are needed to study the relationship between IFA
and ELISA in order to improve comparison between
seroprevalence studies.
ACKNOWLEDGEMENTS
We thank the participating municipal health services
and the municipalities involved in this study, the
PIENTER project team and all participants for their
contribution. We also thank Wim van der Hoek
and Tineke Herremans (CIb/RIVM) for their useful
comments on the manuscript.
DECLARATION OF INTEREST
None.
REFERENCES
1. Schimmer B, et al. Large ongoing Q fever outbreak inthe south of The Netherlands, 2008. Eurosurveillance2008; 13 : pii=18939 (http://www.eurosurveillance.org/ViewArticle.aspx?ArticleId=18939).
2. Schimmer B, et al. Sustained intensive transmissionof Q fever in the south of theNetherlands, 2009.Eurosurveillance 2009; 14 : pii=19210 (http://www.
eurosurveillance.org/ViewArticle.aspx?ArticleId=19210).
3. Karagiannis I, et al. Investigation of a Q fever outbreak
in a rural area of The Netherlands. Epidemiology andInfection 2009; 137 : 1283–1294.
4. Schimmer B, et al. The use of a geographic informationsystem to identify a dairy goat farm as the most likely
source of an urban Q-fever outbreak. BMC InfectiousDiseases 2010; 10 : 69.
5. van der Hoek W, et al. Q fever in the Netherlands :
an update on the epidemiology and control measures.Eurosurveillance 2010; 15 : pii=19520 (http://www.eurosurveillance.org/ViewArticle.aspx?ArticleId=
19520).6. van denWijngaard CC, et al. In search of hidden Q-fever
outbreaks : linking syndromic hospital clusters to in-
fected goat farms. Epidemiology and Infection 2011;139 : 19–26.
7. Richardus JH, et al. Q fever in the Netherlands : a sero-epidemiological survey among human population
groups from 1968 to 1983. Epidemiology and Infection1987; 98 : 211–219.
8. Anderson AD, et al. Seroprevalence of Q fever in the
United States, 2003–2004. American Journal of TropicalMedicine and Hygiene 2009; 81 : 691–694.
9. Tissot DH, et al. Epidemiologic features and clinical
presentation of acute Q fever in hospitalized patients :323 French cases. American Journal of Medicine 1992;93 : 427–434.
10. Abe T, et al. A seroepidemiological study of the risks ofQ fever infection in Japanese veterinarians. EuropeanJournal of Epidemiology 2001; 17 : 1029–1032.
11. McCaughey C, et al. Human seroprevalence to Coxiella
burnetii (Q fever) in Northern Ireland. Zoonoses andPublic Health 2008; 55 : 189–194.
12. Davies TR, et al. Prevalence of Q fever in a rural
practice. Journal of Public Health Medicine 1997; 19 :324–327.
13. European Centre for Disease Prevention and Control.
Technical report : risk assessment on Q fever.Stockholm, Sweden: ECDC, 2010, pp. 40.
14. Tokarevich NK, et al. Anthropogenic effects onchanging Q fever epidemiology in Russia. Annals of the
New York Academy of Sciences 2006; 1078 : 120–123.15. Thomas DR, et al. The risk of acquiring Q fever on
farms : a seroepidemiological study. Occupational and
Environmental Medicine 1995; 52 : 644–647.16. Bartolome J, et al. Seroepidemiology of Coxiella
burnetii infection among blood donors in Albacete.
Enfermedades Infecciosas y Microbiologia Clinica 2007;25 : 382–386.
34 B. Schimmer and others

LOW SEROPREVALENCE OF Q FEVER | 31
2.1
outbreaks in the USA and Canada were associated
with parturient cats and dogs [28, 29].
Our study has several limitations as the exposure
information collected in the questionnaire was mainly
focused on vaccine-preventable infections instead of
zoonotic infections. Information on exposures does
not necessarily relate to the relevant time period as we
do not know at what moment the actual infection
with C. burnetii occurred in those testing serologically
positive. Close contact with animals other than
through occupation or ownership and proximity to
animal stables or farms could not be studied. Further,
the questionnaire did not include information on
exact occupation. Possible associations between his-
tory of miscarriage or stillbirth in female participants
and seropositivity could not be studied, as no infor-
mation on reproductive history was collected. Our
study demonstrated a low prevalence of C. burnetii
infection in the period 2006–2007, around 1.5%
based on ELISA. The Serion IgG ELISA has shown a
suboptimal sensitivity of 58% [23], which at least led
to an underestimate of the national seroprevalence,
which was adjusted in retrospect although based on
only a subset of seronegatives. We consider it unlikely
that misclassification of serological status was related
to the exposure variable and has systematically biased
our risk-factor analysis. However, risk factors will be
flawed because of dilution of the effect by probable
random misclassification. A two-step screening ap-
proach, using ELISA as a screening tool and IFA for
confirmation, was used in a recent seroprevalence
study from the USA [8]. We confirmed that using
the same approach, with only the 70 IFA-confirmed
ELISA-positive samples in the statistical analysis
Table 2 (cont.)
Variable
No. (%) of respondents
OR (95% CI) PSeropositive(n=85)
Seronegative(n=5569)
Frequency of eating raw meat 0.13
Does not eat raw meat (including vegetarians) 31 (2.23) 1357 (97.77) ReferenceDaily/weekly 16 (2.22) 704 (97.78) 1.23 (0.64–2.28)Monthly 14 (1.57) 876 (98.43) 0.89 (0.45–1.70)
Less than monthly 12 (0.96) 1243 (99.04) 0.53 (0.26–1.02)
Occupational contact 0.01No contact with animals 63 (1.69) 3657 (98.31) ReferenceContact with animals 10 (4.02) 239 (95.98) 2.75 (1.30–5.25)
OR, Odds ratio ; CI, confidence interval.
* Adjusted for sex, age and ethnicity.# Adjusted for sex and age.
Table 3. Final multivariable model for risk factors
associated with seropositivity to Coxiella burnetii,
PIENTER 2 project, The Netherlands, February
2006–June 2007
Variable OR (95%CI) P
Age category (yr)
0–14 Reference15–39 5.41 (1.43–20.40) 0.0140–59 6.04 (1.59–22.89) <0.0160–79 6.62 (1.83–23.99) <0.01
Sex
Male 1.42 (0.92–2.21) 0.12Female Reference
Country of birthThe Netherlands Reference
Turkey 5.07 (2.05–12.54) <0.01Other country 0.92 (0.44–1.92) 0.83
Net income (E/month)f850 1.62 (0.79–3.33) 0.19
>850 ReferenceChose not to answer/missing
0.66 (0.35–1.24) 0.20
Kept pets (past 5 years)
No ReferenceYes 0.53 (0.32–0.87) 0.01
Kept livestock (past 5 years)No Reference
Yes, ruminants only 3.83 (1.12–13.13) 0.03Yes, ruminants and otherfarm animals
8.24 (3.26–20.81) <0.01
Yes, but no ruminants 1.10 (0.26–4.65) 0.89
Occupational contact
No contact with animals ReferenceContact with animals 2.04 (0.93–4.44) 0.07
OR, Odds ratio ; CI, confidence interval.
Seroprevalence of Q fever in The Netherlands 33
instead of 85 ELISA-positive samples, the same risk
factors were observed as in the current study (data not
shown). A separate risk-factor analysis only based on
the subset of IFA-tested samples was not possible due
to low seroprevalence.
Further modelling studies are necessary to study
the relationship between IFA and ELISA and im-
prove or replace the cut-off for ELISA as a binomial
outcome to a probability, which will improve the
multivariate analysis of the risk factors, but confi-
dence intervals will remain large. Municipalities in the
highest-incidence Q fever areas in 2007–2010 were not
part of the study sample. In 2007 a much larger part
of Noord-Brabant province was already affected.
Several other municipalities in this early-affected prov-
ince were included in our study sample. However,
adjacent municipalities did not show a higher sero-
prevalence nor was a relationship of seroprevalence
with goat density observed.
This study will serve as a baseline for future popu-
lation-based seroprevalence studies performed after
the emergence of Q fever. Prior to the recent Q fever
epidemics the overall seroprevalence of C. burnetii
infection in The Netherlands was relatively low and it
was not associated with goat, sheep or cattle density,
but merely with keeping ruminants or occupational
contact with animals. This supports the hypothesis
that The Netherlands has been confronted with a
newly emerging Q fever problem in the general
population since the spring of 2007. Before the start of
the epidemics, high-risk groups for Q fever were in-
dividuals with animal contact, including occupational
exposure, and Turkish immigrants, probably infected
in their home country. Further modelling studies
are needed to study the relationship between IFA
and ELISA in order to improve comparison between
seroprevalence studies.
ACKNOWLEDGEMENTS
We thank the participating municipal health services
and the municipalities involved in this study, the
PIENTER project team and all participants for their
contribution. We also thank Wim van der Hoek
and Tineke Herremans (CIb/RIVM) for their useful
comments on the manuscript.
DECLARATION OF INTEREST
None.
REFERENCES
1. Schimmer B, et al. Large ongoing Q fever outbreak inthe south of The Netherlands, 2008. Eurosurveillance2008; 13 : pii=18939 (http://www.eurosurveillance.org/ViewArticle.aspx?ArticleId=18939).
2. Schimmer B, et al. Sustained intensive transmissionof Q fever in the south of theNetherlands, 2009.Eurosurveillance 2009; 14 : pii=19210 (http://www.
eurosurveillance.org/ViewArticle.aspx?ArticleId=19210).
3. Karagiannis I, et al. Investigation of a Q fever outbreak
in a rural area of The Netherlands. Epidemiology andInfection 2009; 137 : 1283–1294.
4. Schimmer B, et al. The use of a geographic informationsystem to identify a dairy goat farm as the most likely
source of an urban Q-fever outbreak. BMC InfectiousDiseases 2010; 10 : 69.
5. van der Hoek W, et al. Q fever in the Netherlands :
an update on the epidemiology and control measures.Eurosurveillance 2010; 15 : pii=19520 (http://www.eurosurveillance.org/ViewArticle.aspx?ArticleId=
19520).6. van denWijngaard CC, et al. In search of hidden Q-fever
outbreaks : linking syndromic hospital clusters to in-
fected goat farms. Epidemiology and Infection 2011;139 : 19–26.
7. Richardus JH, et al. Q fever in the Netherlands : a sero-epidemiological survey among human population
groups from 1968 to 1983. Epidemiology and Infection1987; 98 : 211–219.
8. Anderson AD, et al. Seroprevalence of Q fever in the
United States, 2003–2004. American Journal of TropicalMedicine and Hygiene 2009; 81 : 691–694.
9. Tissot DH, et al. Epidemiologic features and clinical
presentation of acute Q fever in hospitalized patients :323 French cases. American Journal of Medicine 1992;93 : 427–434.
10. Abe T, et al. A seroepidemiological study of the risks ofQ fever infection in Japanese veterinarians. EuropeanJournal of Epidemiology 2001; 17 : 1029–1032.
11. McCaughey C, et al. Human seroprevalence to Coxiella
burnetii (Q fever) in Northern Ireland. Zoonoses andPublic Health 2008; 55 : 189–194.
12. Davies TR, et al. Prevalence of Q fever in a rural
practice. Journal of Public Health Medicine 1997; 19 :324–327.
13. European Centre for Disease Prevention and Control.
Technical report : risk assessment on Q fever.Stockholm, Sweden: ECDC, 2010, pp. 40.
14. Tokarevich NK, et al. Anthropogenic effects onchanging Q fever epidemiology in Russia. Annals of the
New York Academy of Sciences 2006; 1078 : 120–123.15. Thomas DR, et al. The risk of acquiring Q fever on
farms : a seroepidemiological study. Occupational and
Environmental Medicine 1995; 52 : 644–647.16. Bartolome J, et al. Seroepidemiology of Coxiella
burnetii infection among blood donors in Albacete.
Enfermedades Infecciosas y Microbiologia Clinica 2007;25 : 382–386.
34 B. Schimmer and others

32 | CHAPTER 2.1
17. Pascual-Velasco F, et al. High seroprevalence ofCoxiella burnetii infection in Eastern Cantabria (Spain).
International Journal of Epidemiology 1998; 27 : 142–145.18. Cardenosa N, et al. Short report : seroprevalence of
human infection by Coxiella burnetii in Barcelona
(northeast of Spain). American Journal of TropicalMedicine and Hygiene 2006; 75 : 33–35.
19. Gozalan A, et al. Seroprevalence of Q fever in a districtlocated in the west Black Sea region of Turkey.
European Journal of Clinical Microbiology and Infec-tious Diseases 2010; 29 : 465–469.
20. Psaroulaki A, et al. Epidemiological study of Q fever in
humans, ruminant animals, and ticks in Cyprus using ageographical information system. European Journal ofClinical Microbiology & Infectious Diseases 2006; 25 :
576–586.21. European Food Safety Authority. Scientific opinion on
Q fever. EFSA Journal 2010; 8 : 1–114.
22. van der Klis FR, et al. Second national serum bankfor population-based seroprevalence studies in theNetherlands. Netherlands Journal of Medicine 2009; 67 :301–308.
23. Blaauw GJ, et al. The application of an enzyme-linked immunosorbent assay or an immunofluorescent
assay test leads to different estimates of seroprevalenceof Coxiella burnetii in the population. Epidemiology and
Infection 2011. doi:10.1017/S0950268811000021.24. Meekelenkamp JC, et al. Seroprevalence of Coxiella
burnetii in pregnant women in the province of Noord-
Brabant in 2007. Infectieziekten Bulletin 2009; 20 :57–61.
25. Whitney EA, et al. Seroepidemiologic and occupationalrisk survey for Coxiella burnetii antibodies among
US veterinarians. Clinical Infectious Diseases 2009; 48 :550–557.
26. Kilic S, et al. Prevalence of Coxiella burnetii antibodies
in blood donors in Ankara, Central Anatolia, Turkey.New Microbiologica 2008; 31 : 527–534.
27. Leone M, et al. Effect of sex on Coxiella burnetii
infection: protective role of 17betaestradiol. Journal ofInfectious Diseases 2004; 189 : 339–345.
28. Pinsky RL, et al. An outbreak of cat-associated Q fever
in the United States. Journal of Infectious Diseases1991; 164 : 202–204.
29. Buhariwalla F, Cann B, Marrie TJ. A dog-related out-break of Q fever. Clinical Infectious Diseases 1996; 23 :
753–755.
Seroprevalence of Q fever in The Netherlands 35

CHAPTER 2.2
Time-course of antibody responses against Co iella bunetiifollowing acute Q fever
P.F.M. TeunisB. Schimmer
D.W. NotermansA.C.A.P. Leenders
P.C. WeverM.E.E. KretzschmarP.M. Schneeberger
Epidemiol Infect. 2013 Jan;141(1):62-73

CHAPTER 2.2
Time-course of antibody responses against Co iella bunetiifollowing acute Q fever
P.F.M. TeunisB. Schimmer
D.W. NotermansA.C.A.P. Leenders
P.C. WeverM.E.E. KretzschmarP.M. Schneeberger
Epidemiol Infect. 2013 Jan;141(1):62-73
x
Time-course of antibody responses against Coxiella burnetiifollowing acute Q fever
P. F. M. TEUNIS 1,2*, B. SCHIMMER 1, D. W. NOTERMANS3,
A. C. A. P. LEENDERS 4, P. C. WEVER 4, M. E. E. KRETZSCHMAR1,5
AND P. M. SCHNEEBERGER 4
1 Centre for Infectious Disease Control, Epidemiology and Surveillance Unit, RIVM, Bilthoven, The Netherlands2 Hubert Department of Global Health, Rollins School of Public Health, Emory University, Atlanta, GA, USA3 Centre for Infectious Disease Control, Laboratory for Infectious Diseases and Perinatal Screening, RIVM,Bilthoven, The Netherlands4 Jeroen Bosch Hospital, Department of Medical Microbiology and Infection Control,’s- Hertogenbosch, TheNetherlands5 Julius Centre for Health Sciences and Primary Care, University Medical Centre Utrecht, Utrecht, The
Netherlands
Received 11 October 2011; Final revision 15 February 2012; Accepted 15 February 2012;
first published online 4 April 2012
SUMMARY
Large outbreaks of Q fever in The Netherlands have provided a unique opportunity for studying
longitudinal serum antibody responses in patients. Results are presented of a cohort of 344
patients with acute symptoms of Q fever with three or more serum samples per patient. In all
these serum samples IgM and IgG against phase 1 and 2 Coxiella burnetii were measured by an
immunofluorescence assay. A mathematical model of the dynamic interaction of serum antibodies
and pathogens was used in a mixed model framework to quantitatively analyse responses to
C. burnetii infection. Responses show strong heterogeneity, with individual serum antibody
responses widely different in magnitude and shape. Features of the response, peak titre and decay
rate, are used to characterize the diversity of the observed responses. Binary mixture analysis of
IgG peak levels (phases 1 and 2) reveals a class of patients with high IgG peak titres that decay
slowly and may represent potential chronic cases. When combining the results of mixture analysis
into an odds score, it is concluded that not only high IgG phase 1 may be predictive for chronic
Q fever, but also that high IgG phase 2 may aid in detecting such putative chronic cases.
Key words: Coxiella, mathematical modelling, Q fever, serology, statistics.
INTRODUCTION
Since mid-2007 human cases of Q fever in The
Netherlands have increased sharply, with major out-
breaks in 2008 and 2009, reaching a total of about
4000 cases by 2010 [1–4]. Cases were predominantly
clustered in the south of The Netherlands [3] and the
majority of the laboratory samples were submitted
to one regional hospital : the Jeroen Bosch Hospital
in ’s-Hertogenbosch (about 2000 confirmed acute
Q fever cases). Follow-up of cases extended over a
period of up to 24 months. In the 3 years that this
outbreak persisted, laboratory results from over 2000
cases were collected in a laboratory database. This
* Author for correspondence : Professor P. F. M. Teunis, Centrefor Infectious Disease Control, Epidemiology and SurveillanceUnit, RIVM, PO Box 1, 3720BA Bilthoven, The Netherlands.(Email : [email protected])
Epidemiol. Infect. (2013), 141, 62–73. f Cambridge University Press 2012
doi:10.1017/S0950268812000404
database provides a unique opportunity for studying
the serum antibody response to infection withCoxiella
burnetii, and in particular enough data to obtain in-
sight into natural variation in the time-course of serum
antibodies in acute cases [5, 6].
The immunofluorescence assay (IFA) is considered
the reference method for serological diagnosis of
acute and chronic Q fever [7, 8]. The IFA used for Q
fever is a semi-quantitative assay: test sera are visually
compared to a fluorescence standard and the titre is
scored on a scale of twofold serial dilutions. In this
study IgM and IgG against both phase 1 and phase 2
antigen [9] were analysed, yielding time-courses of
four variables. The IgM response precedes that of IgG
and phase 2 antibodies indicate acute infection while
persistently high titres of IgG phase 1 antibodies are
associated with chronic Q fever [9].
In order to improve interpretation of serological
data a dynamic mathematical model was used to
quantitatively describe the serum antibody response.
Characteristic features such as time to peak, peak
antibody level, and decay rate are estimated as (joint)
probability distributions, to describe their variation
in individual patients. Using these longitudinal anti-
body response patterns, a binary mixture approach is
used to identify two distinct classes of serum antibody
responses, by their peak antibody levels and decay
rates.
MATERIALS AND METHODS
Collection of clinical and serum antibody data
Samples from cases diagnosed with acute Q fever
(positive serum PCR [8] and/or IgM phase 2o1:32)
from 1 January 2007 to 20 July 2009 were included in
the laboratory database of the Jeroen Bosch Hospital.
As described in Morroy et al. [10], 870 Q fever
patients who were part of the 2007 and 2008 cohorts
were mailed an informed consent form and a ques-
tionnaire for the date of onset of illness.
Patient consent was obtained between February
2009 and April 2009. According to Dutch law for re-
search involving human subjects there was no need
for approval by a medical ethics committee.
From the laboratory database patients with three
or more blood samples were selected. A total of 344
patients belonging to the 2007 and 2008 cohorts were
included in this study after having given informed
consent for linking their laboratory data with the
questionnaire data including date of onset of illness.
From this database patients referred for Q fever
diagnostics, with three or more blood samples, were
selected, yielding a total of 344 patients with at least
three blood samples over a period of about 2.5 years.
The diagnosis of chronic Q fever was made in-
dependently from the present study by a multi-
disciplinary team of medical specialists, based on
serological profile, PCR results [8], presence of clinical
data [11], radiological imaging, clinical presentation
and other patient characteristics. Patients had proven
chronic Q fever infection when they were PCR-
positive in a blood sample obtained more than 3
months after the onset of acute Q fever, and had a
clinical syndrome compatible with chronic Q fever.
Serology
In all serum samples IgM and IgG antibody titres
against phase 1 and phase 2 C. burnetii were measured
by IFA [7, 12].
The IFA used for Q fever produces semi-
quantitative data. Immunofluorescence in serial di-
lutions of the test sera are visually compared to a
standard and the titre is scored as a dilution factor
(IFA, Focus Diagnostics, USA) [5, 13]. As dilutions
increase twofold, any observed antibody titre is
known up to a single dilution step of magnitude 2.
For a quantitative interpretation, the reported mea-
surements must be translated to antibody concentra-
tions. Table 1 shows examples of the interpretation of
IFA data. Any observed titre is always an interval-
censored observation. Note that concentrations may
be too low to read (<1:32) or sera may not have been
diluted sufficiently to allow measurement to within a
single dilution step.
Dynamic model for serum antibody responses
Any observed titre consists of two numbers as a pair
of observations (X1, X2), representing an upper and
a lower margin for the concentration (Table 1). In the
case of a missing lower margin X1=0, and when an
upper margin is missing X2=O. As titres are mea-
sured on a twofold scale a lognormal error model is a
natural choice [14]. If W(x | log (m),s) is a cumulative
normal probability function with mean log(m) and
standard deviation s,
Prob( log (X)fu)=W(uj log (m), s): (1)
By fitting a normal model with mean log(m) to log(X)
(transforming both data and model) the measurement
Antibody response against C. burnetii in Q fever 63

TIME-COURSE OF ANTIBODY RESPONSES AGAINST C. BURNETII | 37
2.2
Time-course of antibody responses against Coxiella burnetiifollowing acute Q fever
P. F. M. TEUNIS 1,2*, B. SCHIMMER 1, D. W. NOTERMANS3,
A. C. A. P. LEENDERS 4, P. C. WEVER 4, M. E. E. KRETZSCHMAR1,5
AND P. M. SCHNEEBERGER 4
1 Centre for Infectious Disease Control, Epidemiology and Surveillance Unit, RIVM, Bilthoven, The Netherlands2 Hubert Department of Global Health, Rollins School of Public Health, Emory University, Atlanta, GA, USA3 Centre for Infectious Disease Control, Laboratory for Infectious Diseases and Perinatal Screening, RIVM,Bilthoven, The Netherlands4 Jeroen Bosch Hospital, Department of Medical Microbiology and Infection Control,’s- Hertogenbosch, TheNetherlands5 Julius Centre for Health Sciences and Primary Care, University Medical Centre Utrecht, Utrecht, The
Netherlands
Received 11 October 2011; Final revision 15 February 2012; Accepted 15 February 2012;
first published online 4 April 2012
SUMMARY
Large outbreaks of Q fever in The Netherlands have provided a unique opportunity for studying
longitudinal serum antibody responses in patients. Results are presented of a cohort of 344
patients with acute symptoms of Q fever with three or more serum samples per patient. In all
these serum samples IgM and IgG against phase 1 and 2 Coxiella burnetii were measured by an
immunofluorescence assay. A mathematical model of the dynamic interaction of serum antibodies
and pathogens was used in a mixed model framework to quantitatively analyse responses to
C. burnetii infection. Responses show strong heterogeneity, with individual serum antibody
responses widely different in magnitude and shape. Features of the response, peak titre and decay
rate, are used to characterize the diversity of the observed responses. Binary mixture analysis of
IgG peak levels (phases 1 and 2) reveals a class of patients with high IgG peak titres that decay
slowly and may represent potential chronic cases. When combining the results of mixture analysis
into an odds score, it is concluded that not only high IgG phase 1 may be predictive for chronic
Q fever, but also that high IgG phase 2 may aid in detecting such putative chronic cases.
Key words: Coxiella, mathematical modelling, Q fever, serology, statistics.
INTRODUCTION
Since mid-2007 human cases of Q fever in The
Netherlands have increased sharply, with major out-
breaks in 2008 and 2009, reaching a total of about
4000 cases by 2010 [1–4]. Cases were predominantly
clustered in the south of The Netherlands [3] and the
majority of the laboratory samples were submitted
to one regional hospital : the Jeroen Bosch Hospital
in ’s-Hertogenbosch (about 2000 confirmed acute
Q fever cases). Follow-up of cases extended over a
period of up to 24 months. In the 3 years that this
outbreak persisted, laboratory results from over 2000
cases were collected in a laboratory database. This
* Author for correspondence : Professor P. F. M. Teunis, Centrefor Infectious Disease Control, Epidemiology and SurveillanceUnit, RIVM, PO Box 1, 3720BA Bilthoven, The Netherlands.(Email : [email protected])
Epidemiol. Infect. (2013), 141, 62–73. f Cambridge University Press 2012
doi:10.1017/S0950268812000404
database provides a unique opportunity for studying
the serum antibody response to infection withCoxiella
burnetii, and in particular enough data to obtain in-
sight into natural variation in the time-course of serum
antibodies in acute cases [5, 6].
The immunofluorescence assay (IFA) is considered
the reference method for serological diagnosis of
acute and chronic Q fever [7, 8]. The IFA used for Q
fever is a semi-quantitative assay: test sera are visually
compared to a fluorescence standard and the titre is
scored on a scale of twofold serial dilutions. In this
study IgM and IgG against both phase 1 and phase 2
antigen [9] were analysed, yielding time-courses of
four variables. The IgM response precedes that of IgG
and phase 2 antibodies indicate acute infection while
persistently high titres of IgG phase 1 antibodies are
associated with chronic Q fever [9].
In order to improve interpretation of serological
data a dynamic mathematical model was used to
quantitatively describe the serum antibody response.
Characteristic features such as time to peak, peak
antibody level, and decay rate are estimated as (joint)
probability distributions, to describe their variation
in individual patients. Using these longitudinal anti-
body response patterns, a binary mixture approach is
used to identify two distinct classes of serum antibody
responses, by their peak antibody levels and decay
rates.
MATERIALS AND METHODS
Collection of clinical and serum antibody data
Samples from cases diagnosed with acute Q fever
(positive serum PCR [8] and/or IgM phase 2o1:32)
from 1 January 2007 to 20 July 2009 were included in
the laboratory database of the Jeroen Bosch Hospital.
As described in Morroy et al. [10], 870 Q fever
patients who were part of the 2007 and 2008 cohorts
were mailed an informed consent form and a ques-
tionnaire for the date of onset of illness.
Patient consent was obtained between February
2009 and April 2009. According to Dutch law for re-
search involving human subjects there was no need
for approval by a medical ethics committee.
From the laboratory database patients with three
or more blood samples were selected. A total of 344
patients belonging to the 2007 and 2008 cohorts were
included in this study after having given informed
consent for linking their laboratory data with the
questionnaire data including date of onset of illness.
From this database patients referred for Q fever
diagnostics, with three or more blood samples, were
selected, yielding a total of 344 patients with at least
three blood samples over a period of about 2.5 years.
The diagnosis of chronic Q fever was made in-
dependently from the present study by a multi-
disciplinary team of medical specialists, based on
serological profile, PCR results [8], presence of clinical
data [11], radiological imaging, clinical presentation
and other patient characteristics. Patients had proven
chronic Q fever infection when they were PCR-
positive in a blood sample obtained more than 3
months after the onset of acute Q fever, and had a
clinical syndrome compatible with chronic Q fever.
Serology
In all serum samples IgM and IgG antibody titres
against phase 1 and phase 2 C. burnetii were measured
by IFA [7, 12].
The IFA used for Q fever produces semi-
quantitative data. Immunofluorescence in serial di-
lutions of the test sera are visually compared to a
standard and the titre is scored as a dilution factor
(IFA, Focus Diagnostics, USA) [5, 13]. As dilutions
increase twofold, any observed antibody titre is
known up to a single dilution step of magnitude 2.
For a quantitative interpretation, the reported mea-
surements must be translated to antibody concentra-
tions. Table 1 shows examples of the interpretation of
IFA data. Any observed titre is always an interval-
censored observation. Note that concentrations may
be too low to read (<1:32) or sera may not have been
diluted sufficiently to allow measurement to within a
single dilution step.
Dynamic model for serum antibody responses
Any observed titre consists of two numbers as a pair
of observations (X1, X2), representing an upper and
a lower margin for the concentration (Table 1). In the
case of a missing lower margin X1=0, and when an
upper margin is missing X2=O. As titres are mea-
sured on a twofold scale a lognormal error model is a
natural choice [14]. If W(x | log (m),s) is a cumulative
normal probability function with mean log(m) and
standard deviation s,
Prob( log (X)fu)=W(uj log (m), s): (1)
By fitting a normal model with mean log(m) to log(X)
(transforming both data and model) the measurement
Antibody response against C. burnetii in Q fever 63
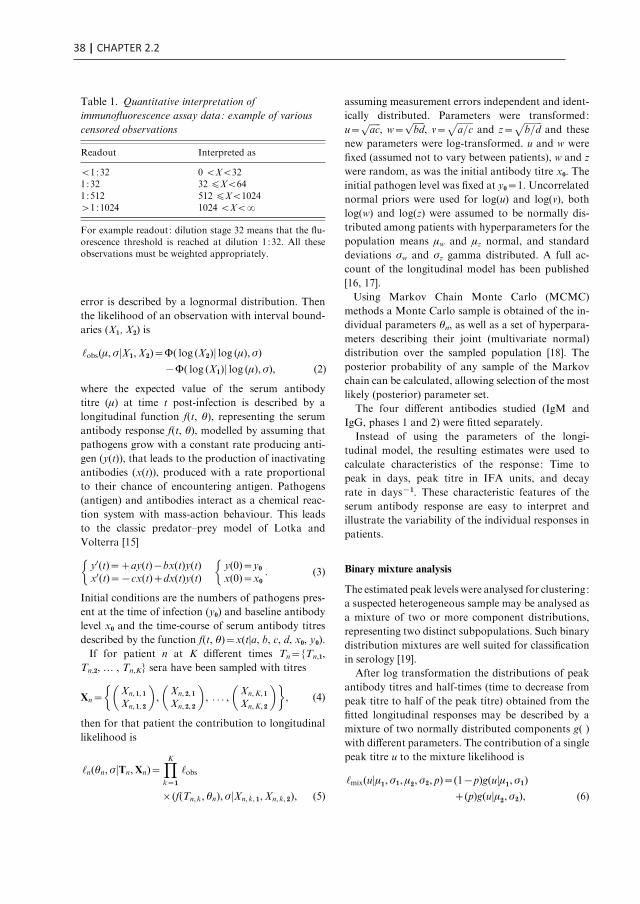
38 | CHAPTER 2.2
error is described by a lognormal distribution. Then
the likelihood of an observation with interval bound-
aries (X1, X2) is
‘obs(m, sjX1,X2)=W( log (X2)j log (m), s)xW( log (X1)j log (m), s), (2)
where the expected value of the serum antibody
titre (m) at time t post-infection is described by a
longitudinal function f(t, h), representing the serum
antibody response f(t, h), modelled by assuming that
pathogens grow with a constant rate producing anti-
gen (y(t)), that leads to the production of inactivating
antibodies (x(t)), produced with a rate proportional
to their chance of encountering antigen. Pathogens
(antigen) and antibodies interact as a chemical reac-
tion system with mass-action behaviour. This leads
to the classic predator–prey model of Lotka and
Volterra [15]
y0(t)=+ay(t)xbx(t)y(t)x0(t)=xcx(t)+dx(t)y(t)
�y(0)=y0x(0)=x0
�: (3)
Initial conditions are the numbers of pathogens pres-
ent at the time of infection (y0) and baseline antibody
level x0 and the time-course of serum antibody titres
described by the function f(t, h)=x(t|a, b, c, d, x0, y0).
If for patient n at K different times Tn={Tn,1,
Tn,2, … , Tn,K} sera have been sampled with titres
Xn=Xn, 1, 1
Xn, 1, 2
� �,
Xn, 2, 1
Xn, 2, 2
� �, . . . ,
Xn,K, 1
Xn,K, 2
� �� �, (4)
then for that patient the contribution to longitudinal
likelihood is
‘n(hn, sjTn,Xn)=YK
k=1
‘obs
r(f(Tn, k, hn), sjXn, k, 1,Xn, k, 2), (5)
assuming measurement errors independent and ident-
ically distributed. Parameters were transformed:
u=ffiffiffiffiffiac
p, w=
ffiffiffiffiffibd
p, v=
ffiffiffiffiffiffiffia=c
pand z=
ffiffiffiffiffiffiffiffib=d
pand these
new parameters were log-transformed. u and w were
fixed (assumed not to vary between patients), w and z
were random, as was the initial antibody titre x0. The
initial pathogen level was fixed at y0=1. Uncorrelated
normal priors were used for log(u) and log(v), both
log(w) and log(z) were assumed to be normally dis-
tributed among patients with hyperparameters for the
population means mw and mz normal, and standard
deviations sw and sz gamma distributed. A full ac-
count of the longitudinal model has been published
[16, 17].
Using Markov Chain Monte Carlo (MCMC)
methods a Monte Carlo sample is obtained of the in-
dividual parameters hn, as well as a set of hyperpara-
meters describing their joint (multivariate normal)
distribution over the sampled population [18]. The
posterior probability of any sample of the Markov
chain can be calculated, allowing selection of the most
likely (posterior) parameter set.
The four different antibodies studied (IgM and
IgG, phases 1 and 2) were fitted separately.
Instead of using the parameters of the longi-
tudinal model, the resulting estimates were used to
calculate characteristics of the response: Time to
peak in days, peak titre in IFA units, and decay
rate in daysx1. These characteristic features of the
serum antibody response are easy to interpret and
illustrate the variability of the individual responses in
patients.
Binary mixture analysis
The estimated peak levels were analysed for clustering:
a suspected heterogeneous sample may be analysed as
a mixture of two or more component distributions,
representing two distinct subpopulations. Such binary
distribution mixtures are well suited for classification
in serology [19].
After log transformation the distributions of peak
antibody titres and half-times (time to decrease from
peak titre to half of the peak titre) obtained from the
fitted longitudinal responses may be described by a
mixture of two normally distributed components g( )
with different parameters. The contribution of a single
peak titre u to the mixture likelihood is
‘mix(ujm1, s1, m2, s2, p)=(1xp)g(ujm1, s1)
+(p)g(ujm2, s2), (6)
Table 1. Quantitative interpretation of
immunofluorescence assay data: example of various
censored observations
Readout Interpreted as
<1:32 0 <X<321:32 32 fX<64
1:512 512 fX<1024>1:1024 1024 <X<O
For example readout : dilution stage 32 means that the flu-orescence threshold is reached at dilution 1:32. All theseobservations must be weighted appropriately.
64 P. F. M. Teunis and others
where g(u|m1,s1) and g(u|m2,s2) are the distributions
of ‘negative ’ and ‘positive’ subpopulations and p
is the proportion ‘positive ’ samples. The two fitted
components allow quantification of specificity and
sensitivity [20]. For half-times a similar likelihood
function can be constructed.
When described as a binary distribution mixture,
any titre can be assigned a probability of belonging to
either subpopulation. Using the ratio
r(U)=g(Ujm2, s2)
g(Ujm1, s1)(7)
individual classification can be done, assigning odds
r(U) of a positive specimen to any set of observations
for a case U.
RESULTS
Observed serum antibody titres
A total of 1624 serum samples were used in the
analysis. The average age of the 344 patients (209
males, 135 females) was 51 years (range 9–87 years),
34 patients became ill in 2007 and 310 had an onset
of illness in 2008. The median serological follow-up
since first positive IgM phase 2 was 363 days (range
273–577 days).
Figure 1 shows graphs of the individual time-course
of all serum antibody measurements in all patients.
Note that there are three different types of censoring:
both a lower and an upper margin are present
(represented by a circle at the geometric mean of up-
per and lower margins) ; an upper margin is present
but a lower margin is missing (downward pointing
triangle placed at the upper margin level) and lower
margin present but upper margin missing (upward
pointing triangle placed at the lower margin level).
There was no clear difference between any of the
antibodies measured in males or females, nor could an
age pattern be established (see Appendix Fig. A3).
Characteristics of the antibody response
The modelled antibody responses showed consider-
able heterogeneity. Both the magnitude and the shape
of the serum antibody response varied strongly in
individual patients. IgM and IgG against phase 2
tended to reach higher levels than the corresponding
phase 1 responses, while IgG antibodies tended to be
more persistent than IgM.
10
(a) IgM phase 2 (b) IgM phase 1
(c) IgG phase 2 (d ) IgG phase 1
0 200 400 600
100
1000
10000
Time from symptom onset (days)0 200 400 600
Time from symptom onset (days)
0 200 400 600Time from symptom onset (days)
0 200 400 600Time from symptom onset (days)
IgM
pha
se 2
(U
/ml)
IgM
pha
se 1
(U
/ml)
IgG
pha
se 1
(U
/ml)
IgG
pha
se 2
(U
/ml)
10
100
1000
10000
10
100
1000
10000
100000
10
100
1000
10000
100000
Fig. 1 [colour online]. Observed individual IgM and IgG titres against phase 2 and 1 C. burnetii against time following
symptom onset in 344 patients measured by immunofluorescence assay. Data from the same patient are connected. Symbolsindicate censoring : circles at geometric mean when both an upper and lower level have been observed. Triangles indicateabsence of either a lower bound (downward symbol) or an upper bound (upward symbol).
Antibody response against C. burnetii in Q fever 65

TIME-COURSE OF ANTIBODY RESPONSES AGAINST C. BURNETII | 39
2.2
error is described by a lognormal distribution. Then
the likelihood of an observation with interval bound-
aries (X1, X2) is
‘obs(m, sjX1,X2)=W( log (X2)j log (m), s)xW( log (X1)j log (m), s), (2)
where the expected value of the serum antibody
titre (m) at time t post-infection is described by a
longitudinal function f(t, h), representing the serum
antibody response f(t, h), modelled by assuming that
pathogens grow with a constant rate producing anti-
gen (y(t)), that leads to the production of inactivating
antibodies (x(t)), produced with a rate proportional
to their chance of encountering antigen. Pathogens
(antigen) and antibodies interact as a chemical reac-
tion system with mass-action behaviour. This leads
to the classic predator–prey model of Lotka and
Volterra [15]
y0(t)=+ay(t)xbx(t)y(t)x0(t)=xcx(t)+dx(t)y(t)
�y(0)=y0x(0)=x0
�: (3)
Initial conditions are the numbers of pathogens pres-
ent at the time of infection (y0) and baseline antibody
level x0 and the time-course of serum antibody titres
described by the function f(t, h)=x(t|a, b, c, d, x0, y0).
If for patient n at K different times Tn={Tn,1,
Tn,2, … , Tn,K} sera have been sampled with titres
Xn=Xn, 1, 1
Xn, 1, 2
� �,
Xn, 2, 1
Xn, 2, 2
� �, . . . ,
Xn,K, 1
Xn,K, 2
� �� �, (4)
then for that patient the contribution to longitudinal
likelihood is
‘n(hn, sjTn,Xn)=YK
k=1
‘obs
r(f(Tn, k, hn), sjXn, k, 1,Xn, k, 2), (5)
assuming measurement errors independent and ident-
ically distributed. Parameters were transformed:
u=ffiffiffiffiffiac
p, w=
ffiffiffiffiffibd
p, v=
ffiffiffiffiffiffiffia=c
pand z=
ffiffiffiffiffiffiffiffib=d
pand these
new parameters were log-transformed. u and w were
fixed (assumed not to vary between patients), w and z
were random, as was the initial antibody titre x0. The
initial pathogen level was fixed at y0=1. Uncorrelated
normal priors were used for log(u) and log(v), both
log(w) and log(z) were assumed to be normally dis-
tributed among patients with hyperparameters for the
population means mw and mz normal, and standard
deviations sw and sz gamma distributed. A full ac-
count of the longitudinal model has been published
[16, 17].
Using Markov Chain Monte Carlo (MCMC)
methods a Monte Carlo sample is obtained of the in-
dividual parameters hn, as well as a set of hyperpara-
meters describing their joint (multivariate normal)
distribution over the sampled population [18]. The
posterior probability of any sample of the Markov
chain can be calculated, allowing selection of the most
likely (posterior) parameter set.
The four different antibodies studied (IgM and
IgG, phases 1 and 2) were fitted separately.
Instead of using the parameters of the longi-
tudinal model, the resulting estimates were used to
calculate characteristics of the response: Time to
peak in days, peak titre in IFA units, and decay
rate in daysx1. These characteristic features of the
serum antibody response are easy to interpret and
illustrate the variability of the individual responses in
patients.
Binary mixture analysis
The estimated peak levels were analysed for clustering:
a suspected heterogeneous sample may be analysed as
a mixture of two or more component distributions,
representing two distinct subpopulations. Such binary
distribution mixtures are well suited for classification
in serology [19].
After log transformation the distributions of peak
antibody titres and half-times (time to decrease from
peak titre to half of the peak titre) obtained from the
fitted longitudinal responses may be described by a
mixture of two normally distributed components g( )
with different parameters. The contribution of a single
peak titre u to the mixture likelihood is
‘mix(ujm1, s1, m2, s2, p)=(1xp)g(ujm1, s1)
+(p)g(ujm2, s2), (6)
Table 1. Quantitative interpretation of
immunofluorescence assay data: example of various
censored observations
Readout Interpreted as
<1:32 0 <X<321:32 32 fX<64
1:512 512 fX<1024>1:1024 1024 <X<O
For example readout : dilution stage 32 means that the flu-orescence threshold is reached at dilution 1:32. All theseobservations must be weighted appropriately.
64 P. F. M. Teunis and others
where g(u|m1,s1) and g(u|m2,s2) are the distributions
of ‘negative ’ and ‘positive’ subpopulations and p
is the proportion ‘positive ’ samples. The two fitted
components allow quantification of specificity and
sensitivity [20]. For half-times a similar likelihood
function can be constructed.
When described as a binary distribution mixture,
any titre can be assigned a probability of belonging to
either subpopulation. Using the ratio
r(U)=g(Ujm2, s2)
g(Ujm1, s1)(7)
individual classification can be done, assigning odds
r(U) of a positive specimen to any set of observations
for a case U.
RESULTS
Observed serum antibody titres
A total of 1624 serum samples were used in the
analysis. The average age of the 344 patients (209
males, 135 females) was 51 years (range 9–87 years),
34 patients became ill in 2007 and 310 had an onset
of illness in 2008. The median serological follow-up
since first positive IgM phase 2 was 363 days (range
273–577 days).
Figure 1 shows graphs of the individual time-course
of all serum antibody measurements in all patients.
Note that there are three different types of censoring:
both a lower and an upper margin are present
(represented by a circle at the geometric mean of up-
per and lower margins) ; an upper margin is present
but a lower margin is missing (downward pointing
triangle placed at the upper margin level) and lower
margin present but upper margin missing (upward
pointing triangle placed at the lower margin level).
There was no clear difference between any of the
antibodies measured in males or females, nor could an
age pattern be established (see Appendix Fig. A3).
Characteristics of the antibody response
The modelled antibody responses showed consider-
able heterogeneity. Both the magnitude and the shape
of the serum antibody response varied strongly in
individual patients. IgM and IgG against phase 2
tended to reach higher levels than the corresponding
phase 1 responses, while IgG antibodies tended to be
more persistent than IgM.
10
(a) IgM phase 2 (b) IgM phase 1
(c) IgG phase 2 (d ) IgG phase 1
0 200 400 600
100
1000
10000
Time from symptom onset (days)0 200 400 600
Time from symptom onset (days)
0 200 400 600Time from symptom onset (days)
0 200 400 600Time from symptom onset (days)
IgM
pha
se 2
(U
/ml)
IgM
pha
se 1
(U
/ml)
IgG
pha
se 1
(U
/ml)
IgG
pha
se 2
(U
/ml)
10
100
1000
10000
10
100
1000
10000
100000
10
100
1000
10000
100000
Fig. 1 [colour online]. Observed individual IgM and IgG titres against phase 2 and 1 C. burnetii against time following
symptom onset in 344 patients measured by immunofluorescence assay. Data from the same patient are connected. Symbolsindicate censoring : circles at geometric mean when both an upper and lower level have been observed. Triangles indicateabsence of either a lower bound (downward symbol) or an upper bound (upward symbol).
Antibody response against C. burnetii in Q fever 65

40 | CHAPTER 2.2
Peak titres of phase 2 antibodies were higher, almost
by an order of magnitude compared to phase 1 anti-
bodies. Estimated decay rates were smallest (slowest
decay) in IgG phase 1, and more or less the same in all
other antibody responses.
Due to the low decay rates, patients with high esti-
mated peak titres tend to keep these high titres for a
prolonged period, for more than a year after diagnosis
of acute Q fever. Correlation coefficients of these
characteristics are given in the Appendix. As different
antibody classes have been fitted independently, cor-
relation has not been included into the longitudinal
models. However, by using the parameter estimates
of the individually fitted responses any correlation in
the observed data is conserved in the fitted responses.
Apart from negative correlation of time to peak and
peak titre (and, to a lesser extent, decay rate) there
appears to be weak positive correlation between peak
levels and decay rates, indicating that high antibody
titres tend to decay more rapidly. Time to peak
and peak titre tend to be weakly correlated in all
antibody classes, correlation between decay rates is
lower, especially between IgG phase 2 and IgM
(phases 1 and 2) (see Tables A1 and A2).
A contour graph showing quantiles of the fitted
responses to IgG phases 1 and 2 (Fig. 2) shows the
difference in response patterns. Also shown in these
graphs are the responses of confirmed chronic cases.
The peak titres and half-times of these chronic cases
do not show a clear segregation into a distinctive
subpopulation (see also Appendix Fig. A1).
Classification by binary mixture
As high serum antibody titres are considered predic-
tive for chronic Q fever [5] we attempted to find evi-
dence of a subclass with high peak titres and/or slow
decay (long half-times) using binary distribution
mixtures. By using symmetric (normally) distributed
components we attempted to detect a subclass
with overdispersed (large) peak titres/half-times in a
homogeneous background distribution. Joint fitting
of both phase 1 and phase 2 IgG (separate distri-
bution components for peak titres and half-times,
same prevalence, ignoring correlation between phase
1 and 2 IgG) resulted in a ‘positive ’ (high peak titre)
fraction of 8.8% (95% confidence interval 6.1–
11.5%) of the studied population (Fig. 3).
Characterization as a binary distribution mixture
allows specification of the probabilities of false and
true positive and negative classifications. Sensitivity
[Prob(true pos.)] and specificity [Prob(true neg.)] can
be calculated [receiver operating characteristic (ROC)
diagrams inAppendix Fig. A2 andTableA3]. The area
under the ROC curves (AUC) is 0.991 (peak titres
IgG phase 1), 0.914 (half-times IgG phase 1), 0.645
(peak titres IgG phase 2) and 0.973 (half-times IgG
phase 2), respectively.
Note that for peak titres of IgG phase 2 antibodies
the procedure failed to produce clearly separated
mixture components, although the fitted distributions
pick up a right-hand tail of high peak titres. Peak
titres of IgG phase 2 antibodies do not appear to
allow classification with this method.
The fitted distributions may be used to translate
any set of the four response variables (peak titre and
half-time, IgG phases 1 and 2) into an odds score, as
in equation (7). The distributions of these odds are
shown in Figure 4 for the seven identified confirmed
chronic cases and for the remainder of the patients.
Also shown is the combined odds score, obtained by
multiplying the odds for the four response variables.
It can be seen that chronic patients tend to have odds
>1 of falling into the positive subpopulation.
10000 200 400 600 800
107
106
105
104
103
102
101
100
105
104
103
102
101
100
IgG
pha
se 2
(U
/ml)
IgG
pha
se 1
(U
/ml)
t (days)
10000 200 400 600 800
t (days)
(a) IgG phase 2 (b) IgG phase 1
Fig. 2. The grey areas show quantile charts of the time-course of fitted responses for IgG phases 1 and 2. Quantiles shown are(from the outside inwards) : 0–100%, 10–90%, 20–80%, 30–70%, 40–60%, and 50% (black line). The superimposed blackcurves are the fitted responses of seven individual confirmed chronic patients.
66 P. F. M. Teunis and others
Use of a single (‘posterior mode’) set of peak titres
and half-time results in the odds are shown in Figure
4. Some uncertainty is associated with classification
by this method, as is evident from the prediction in-
tervals for the ROC curves (as shown in Appendix
Fig. A2). A more comprehensive uncertainty assess-
ment is possible, by determining peak titres and half-
times for all patients in any sample of the Monte
Carlo set of posterior parameter estimates, determin-
ing binary mixture components for each of these sets
of peak titres and half-times, and then calculating the
odds distributions for all patients over all fitted mix-
tures. The resulting marginal distribution (of a sample
of 1000 fitted mixtures) is essentially similar to that
seen in Figure 4 in that the combined odds of con-
firmed chronic patients are higher than those of the
0·0
0·2
0·4
0·6
0·8
100 101 102 103 104 105 106 100 101 102 103 104 105 106
100 101 102 103 104 105 106 100 101 102 103 104 105 106
Pro
babl
e de
nsity
0·0
0·2
0·4
0·6
0·8
Pro
babl
e de
nsity
0·0
0·2
0·4
0·6
0·8
1·0
Pro
babl
e de
nsity
Pro
babl
e de
nsity
Peak titre IgG phase 2 (U/ml) Half-time IgG phase 2 (days)
Peak titre IgG phase 1 (U/ml)
0·0
0·1
0·2
0·3
0·4
Half-time IgG phase 1 (days)
(a) IgG phase 2: Peak titres (b) IgG phase 2: half times
(c) IgG phase 1: Peak titres (d ) IgG phase 1: half times
Fig. 3. Discrimination of high and low peak titres by means of a binary mixture of normal distributions. Note that antibody
peak titres are shown on a logarithmic scale. The four variables (IgG phase 2 and 1, peak titres and half-times) have their ownmixture components but share the same fraction positives.
102
100
10–2
10–4
10–6
10–8
10–10
10–12
10–14
10–16
Peak titre half-timeIgG phase 1
Peak titre half-timeIgG phase 2
Joint
Odd
s
Not chronic
Chronic
Fig. 4. [colour online]. Distribution of the odds for each patient of falling into the ‘positive’ category as defined by binarymixtures for four variables (peak titre and half-time, for IgG phases 1 and 2). Box plots (median, quartiles and 95% range)
for separate variables and the product of all odds scores (joint).
Antibody response against C. burnetii in Q fever 67

TIME-COURSE OF ANTIBODY RESPONSES AGAINST C. BURNETII | 41
2.2
Peak titres of phase 2 antibodies were higher, almost
by an order of magnitude compared to phase 1 anti-
bodies. Estimated decay rates were smallest (slowest
decay) in IgG phase 1, and more or less the same in all
other antibody responses.
Due to the low decay rates, patients with high esti-
mated peak titres tend to keep these high titres for a
prolonged period, for more than a year after diagnosis
of acute Q fever. Correlation coefficients of these
characteristics are given in the Appendix. As different
antibody classes have been fitted independently, cor-
relation has not been included into the longitudinal
models. However, by using the parameter estimates
of the individually fitted responses any correlation in
the observed data is conserved in the fitted responses.
Apart from negative correlation of time to peak and
peak titre (and, to a lesser extent, decay rate) there
appears to be weak positive correlation between peak
levels and decay rates, indicating that high antibody
titres tend to decay more rapidly. Time to peak
and peak titre tend to be weakly correlated in all
antibody classes, correlation between decay rates is
lower, especially between IgG phase 2 and IgM
(phases 1 and 2) (see Tables A1 and A2).
A contour graph showing quantiles of the fitted
responses to IgG phases 1 and 2 (Fig. 2) shows the
difference in response patterns. Also shown in these
graphs are the responses of confirmed chronic cases.
The peak titres and half-times of these chronic cases
do not show a clear segregation into a distinctive
subpopulation (see also Appendix Fig. A1).
Classification by binary mixture
As high serum antibody titres are considered predic-
tive for chronic Q fever [5] we attempted to find evi-
dence of a subclass with high peak titres and/or slow
decay (long half-times) using binary distribution
mixtures. By using symmetric (normally) distributed
components we attempted to detect a subclass
with overdispersed (large) peak titres/half-times in a
homogeneous background distribution. Joint fitting
of both phase 1 and phase 2 IgG (separate distri-
bution components for peak titres and half-times,
same prevalence, ignoring correlation between phase
1 and 2 IgG) resulted in a ‘positive ’ (high peak titre)
fraction of 8.8% (95% confidence interval 6.1–
11.5%) of the studied population (Fig. 3).
Characterization as a binary distribution mixture
allows specification of the probabilities of false and
true positive and negative classifications. Sensitivity
[Prob(true pos.)] and specificity [Prob(true neg.)] can
be calculated [receiver operating characteristic (ROC)
diagrams inAppendix Fig. A2 andTableA3]. The area
under the ROC curves (AUC) is 0.991 (peak titres
IgG phase 1), 0.914 (half-times IgG phase 1), 0.645
(peak titres IgG phase 2) and 0.973 (half-times IgG
phase 2), respectively.
Note that for peak titres of IgG phase 2 antibodies
the procedure failed to produce clearly separated
mixture components, although the fitted distributions
pick up a right-hand tail of high peak titres. Peak
titres of IgG phase 2 antibodies do not appear to
allow classification with this method.
The fitted distributions may be used to translate
any set of the four response variables (peak titre and
half-time, IgG phases 1 and 2) into an odds score, as
in equation (7). The distributions of these odds are
shown in Figure 4 for the seven identified confirmed
chronic cases and for the remainder of the patients.
Also shown is the combined odds score, obtained by
multiplying the odds for the four response variables.
It can be seen that chronic patients tend to have odds
>1 of falling into the positive subpopulation.
10000 200 400 600 800
107
106
105
104
103
102
101
100
105
104
103
102
101
100
IgG
pha
se 2
(U
/ml)
IgG
pha
se 1
(U
/ml)
t (days)
10000 200 400 600 800
t (days)
(a) IgG phase 2 (b) IgG phase 1
Fig. 2. The grey areas show quantile charts of the time-course of fitted responses for IgG phases 1 and 2. Quantiles shown are(from the outside inwards) : 0–100%, 10–90%, 20–80%, 30–70%, 40–60%, and 50% (black line). The superimposed blackcurves are the fitted responses of seven individual confirmed chronic patients.
66 P. F. M. Teunis and others
Use of a single (‘posterior mode’) set of peak titres
and half-time results in the odds are shown in Figure
4. Some uncertainty is associated with classification
by this method, as is evident from the prediction in-
tervals for the ROC curves (as shown in Appendix
Fig. A2). A more comprehensive uncertainty assess-
ment is possible, by determining peak titres and half-
times for all patients in any sample of the Monte
Carlo set of posterior parameter estimates, determin-
ing binary mixture components for each of these sets
of peak titres and half-times, and then calculating the
odds distributions for all patients over all fitted mix-
tures. The resulting marginal distribution (of a sample
of 1000 fitted mixtures) is essentially similar to that
seen in Figure 4 in that the combined odds of con-
firmed chronic patients are higher than those of the
0·0
0·2
0·4
0·6
0·8
100 101 102 103 104 105 106 100 101 102 103 104 105 106
100 101 102 103 104 105 106 100 101 102 103 104 105 106
Pro
babl
e de
nsity
0·0
0·2
0·4
0·6
0·8
Pro
babl
e de
nsity
0·0
0·2
0·4
0·6
0·8
1·0
Pro
babl
e de
nsity
Pro
babl
e de
nsity
Peak titre IgG phase 2 (U/ml) Half-time IgG phase 2 (days)
Peak titre IgG phase 1 (U/ml)
0·0
0·1
0·2
0·3
0·4
Half-time IgG phase 1 (days)
(a) IgG phase 2: Peak titres (b) IgG phase 2: half times
(c) IgG phase 1: Peak titres (d ) IgG phase 1: half times
Fig. 3. Discrimination of high and low peak titres by means of a binary mixture of normal distributions. Note that antibody
peak titres are shown on a logarithmic scale. The four variables (IgG phase 2 and 1, peak titres and half-times) have their ownmixture components but share the same fraction positives.
102
100
10–2
10–4
10–6
10–8
10–10
10–12
10–14
10–16
Peak titre half-timeIgG phase 1
Peak titre half-timeIgG phase 2
Joint
Odd
s
Not chronic
Chronic
Fig. 4. [colour online]. Distribution of the odds for each patient of falling into the ‘positive’ category as defined by binarymixtures for four variables (peak titre and half-time, for IgG phases 1 and 2). Box plots (median, quartiles and 95% range)
for separate variables and the product of all odds scores (joint).
Antibody response against C. burnetii in Q fever 67

42 | CHAPTER 2.2
remaining patients. These results are summarized in
Appendix Figure A4.
DISCUSSION AND CONCLUSIONS
Of the 344 selected patients with acute Q fever, IgG
antibody responses characterized by peak titres and
half-times could be classified into two categories, with
8.8% of the study population of acute Q fever
patients falling into the presumed category with high
peak titres and slow decay. Although seven PCR and
clinically confirmed chronic cases did not clearly share
the characteristics of this ‘positive ’ subpopulation
(Fig. 2), their odds of belonging to this positive group
(median log10 odds x0.96, 90% range x7.8 to 2.19)
were higher than those of the remaining patients
(median log10 odds x6.4, 90% range x16.7 to 0.71).
The number of chronic cases is small, and strong
heterogeneity in seroresponses to C. burnetii may ob-
scure classification attempts. As time passes more
chronic cases may be found in the studied population.
With higher numbers of cases the validity of sero-
logical tests to detect chronic Q fever can be evaluated
[11].
This study also has shown that serum antibodies
against C. burnetii are highly persistent, so that when
a person generates high peak titres, any serum sample
taken within a year after infection has occurred, is
also likely to have high antibody levels (Fig. 2).
The longitudinal analysis was based on semi-quan-
titative IFA data. As a consequence, the quantitative
results may be uncertain, as some output may be
based on weak information in the observed data. In
particular the estimated time-to-peak characteristics
may be uncertain because the time of symptom onset
may be incorrect. Clinical symptoms of Q fever may
be aspecific and in areas with high incidence, pre-
viously resolved Q fever cases may have been mis-
diagnosed as acute Q fever, thus causing the presence
of improper serological data in our study population,
leading to misspecification of the responses and in-
correct estimation of peak titres and decay rates.
It should also be noted that selecting for patients
with multiple samples may imply selection bias:
patients with more severe symptoms may have been
more willing to submit follow-up samples. If this
selection bias resulted in higher antibody titres in the
study population, the distinction between chronic
patients and the remaining patient population may in
reality be clearer than found here.
Moreover, several of the early titre measurements
were censored (in order to ascertain that the sample
was positive, i.e. >1:32). With this caveat in mind,
the shorter time-to-peak estimates found for phase 1
antibodies compared to their phase 2 counterparts
(Table 2) may not be of note. Peak titres in IgG phase
1 do, however, seem to be more heterogeneous than
those in IgG phase 2. Binary mixture analysis con-
firms that this heterogeneity may be due to a separate
high titre class of responses that is more pronounced
in IgG phase 1 than in IgG phase 2.
Estimated decay rates are very slow, generally, half-
times up to several years are common, with IgG
antibodies more persistent than IgM, but mostly be-
cause the former show more variation in decay rates.
Peak titres of serum antibody responses cannot be
measured in clinical practice, because it is unknown
when individual patients reach their maximum anti-
body titres. However, as shown in Figure 2, antibody
decay is very slow and a high peak titre shortly after
acute infection is likely to lead to high antibody titres
for months to follow.
Many patients present a ‘chronic serological pro-
file ’ [21] during their follow-up and diagnoses of
chronic Q fever based on serology alone should be
treated with caution [22, 23], particularly because
many patients received antibiotic treatment that may
have influenced their antibody responses [22].
Notwithstanding the unclear relation between
serology and chronic Q fever, the present study shows
Table 2. Geometric mean and 95% confidence interval of the characteristic features of the serum antibody
response: time to peak (from symptom onset), peak titre, and half-time of antibody decay after reaching peak levels
Time to peak (days) Peak titre (IFA units) Half-time (days)
IgM 2 3.09 (0.23–17.1) r101 1.99 (0.20–38.0) r103 2.07 (0.25–43.0) r102
IgM 1 1.07 (0.02–13.5) 1.87 (0.19–50.4) r102 2.67 (0.18–120) r102
IgG 2 5.26 (0.55–21.9) r101 5.23 (0.49–65.0) r103 3.18 (0.64–50.0) r102
IgG 1 0.41 (0.01–4.37) 1.01 (0.07–28.0) r102 2.26 (0.04–122) r103
IFA, Immunofluorescence assay.
68 P. F. M. Teunis and others
that combined information on peak titres and half-
times for phase 1 and 2 IgG improves the power of
serological detection of chronic cases (Fig. 4). These
conclusions can be of use for future studies of Q fever
serology.
ACKNOWLEDGEMENTS
The authors gratefully acknowledge the expert assist-
ance of several colleagues with the collection of data:
the Municipal Health Services ‘Hart voor Brabant’,
notably Clementine Wijkmans and Gabriella
Morroy, the Jeroen Bosch Hospital, notably Jamie
Meekelenkamp, Tineke Herremans of the Laboratory
for Infectious Diseases and Perinatal Screening,
and Wim van der Hoek of the Epidemiology and
Surveillance Unit (RIVM).
DECLARATION OF INTEREST
None.
REFERENCES
1. Schimmer B, et al. Large ongoing Q fever outbreak in
the south of The Netherlands. Eurosurveillance 2008;13(31).
2. Schimmer B, et al. Sustained intensive transmission of Q
fever in the south of The Netherlands. Eurosurveillance2009; 14(9).
3. van der Hoek W, et al. Q fever in The Netherlands : anupdate on the epidemiology and control measures.
Eurosurveillance 2010; 15(12).4. Dijkstra F, et al. The 2007–2010 Q fever epidemic in The
Netherlands : characteristics of notified acute Q fever
patients and the association with dairy goat farming.FEMS Immunology and Medical Microbiology 2012;64 : 3–12.
5. Dupont HT, Thirion X, Raoult D. Q fever serology:cutoff determination for microimmunofluorescence.Clinical Diagnostics and Laboratory Immunology 1994;1 : 189–196.
6. Marrie TJ, de Carolis E. Seroepidemiology of Coxiellaburnetii infection and its frequency as a cause ofcommunity-acquired pneumonia in Canada. Canadian
Journal of Infectious Diseases 2002; 13 : 164–166.7. Fournier PE, Marrie TJ, Raoult D. Diagnosis of Q
fever. Journal of Clinical Microbiology 1998; 36 :
1823–1834.
8. Schneeberger PM, et al. Real-time PCR with serumsamples is indispensable for early diagnosis of acute Q
fever. Clinical and Vaccine Immunology 2010; 17 :286–290.
9. Raoult D, Marrie TJ, Mege JL. Natural history and
pathophysiology of Q fever. Lancet Infectious Diseases2005; 5 : 219–226.
10. Morroy G, et al. The health status of Q fever patientsafter long-term follow up. BMC Infectious Diseases
2011; 11 : 97.11. van der Hoek W, et al. Follow-up of 686 patients
with acute Q fever and detection of chronic infec-
tion. Clinical Infectious Diseases 2011; 52 : 1431–1436.
12. Landais C, et al. From acute Q fever to endocarditis :
serological follow-up strategy. Clinical InfectiousDiseases 2007; 44 : 1337–1340.
13. Dupont HT, et al. Epidemiologic features and clinical
presentation of acute Q fever in hospitalized patients :323 French cases. American Journal of Medicine 1992;93 : 427–434.
14. Teunis PFM, et al. Kinetics of IgG antibody response
to pertussis toxin after infection with B. pertussis.Epidemiology and Infection 2002; 129 : 479–489.
15. Edelstein-Keshet L. Mathematical Models in Biology
(Birkhauser Mathematics series). New York: McGraw-Hill Inc., 1988.
16. Simonsen J, et al. Estimation of incidences of infectious
diseases based on antibody measurements. Statistics inMedicine 2009; 28 : 1882–1885.
17. Teunis PFM, et al. Biomarker dynamics : estimating
infection rates from serological data. Statistics inMedicine (in press).
18. Teunis PFM, Ogden ID, Strachan NJC. Hierarchicaldose response of E. coli O157:H7 from human out-
breaks incorporating heterogeneity in exposure.Epidemiology and Infection 2008;136 : 761–770.
19. Gilks WR, Richardson S, Spiegelhalter DJ (eds).
Markov Chain Monte Carlo in Practice. London:Chapman & Hall, 1996.
20. Teunis PF, et al. Usefulness of sero-surveillance for
Trichinella infections in animal populations. VeterinaryParasitology 2009; 159 : 345–349.
21. Sunder S, et al. Chronic Q fever : relevance of serology.Clinical Infectious Diseases 2011; 53 : 749–750.
22. Limonard GJM, et al. One-year follow-up of patientsof the ongoing Q fever outbreak: clinical, serologicaland echocardiographic findings. Infection 2010; 38 :
471–477.23. Hung MN, et al. Serologic assessment of the risk of
developing chronic Q fever in cohorts of acutely
infected individuals. Journal of Infection 2011; 62 :39–44.
Antibody response against C. burnetii in Q fever 69

TIME-COURSE OF ANTIBODY RESPONSES AGAINST C. BURNETII | 43
2.2
remaining patients. These results are summarized in
Appendix Figure A4.
DISCUSSION AND CONCLUSIONS
Of the 344 selected patients with acute Q fever, IgG
antibody responses characterized by peak titres and
half-times could be classified into two categories, with
8.8% of the study population of acute Q fever
patients falling into the presumed category with high
peak titres and slow decay. Although seven PCR and
clinically confirmed chronic cases did not clearly share
the characteristics of this ‘positive ’ subpopulation
(Fig. 2), their odds of belonging to this positive group
(median log10 odds x0.96, 90% range x7.8 to 2.19)
were higher than those of the remaining patients
(median log10 odds x6.4, 90% range x16.7 to 0.71).
The number of chronic cases is small, and strong
heterogeneity in seroresponses to C. burnetii may ob-
scure classification attempts. As time passes more
chronic cases may be found in the studied population.
With higher numbers of cases the validity of sero-
logical tests to detect chronic Q fever can be evaluated
[11].
This study also has shown that serum antibodies
against C. burnetii are highly persistent, so that when
a person generates high peak titres, any serum sample
taken within a year after infection has occurred, is
also likely to have high antibody levels (Fig. 2).
The longitudinal analysis was based on semi-quan-
titative IFA data. As a consequence, the quantitative
results may be uncertain, as some output may be
based on weak information in the observed data. In
particular the estimated time-to-peak characteristics
may be uncertain because the time of symptom onset
may be incorrect. Clinical symptoms of Q fever may
be aspecific and in areas with high incidence, pre-
viously resolved Q fever cases may have been mis-
diagnosed as acute Q fever, thus causing the presence
of improper serological data in our study population,
leading to misspecification of the responses and in-
correct estimation of peak titres and decay rates.
It should also be noted that selecting for patients
with multiple samples may imply selection bias:
patients with more severe symptoms may have been
more willing to submit follow-up samples. If this
selection bias resulted in higher antibody titres in the
study population, the distinction between chronic
patients and the remaining patient population may in
reality be clearer than found here.
Moreover, several of the early titre measurements
were censored (in order to ascertain that the sample
was positive, i.e. >1:32). With this caveat in mind,
the shorter time-to-peak estimates found for phase 1
antibodies compared to their phase 2 counterparts
(Table 2) may not be of note. Peak titres in IgG phase
1 do, however, seem to be more heterogeneous than
those in IgG phase 2. Binary mixture analysis con-
firms that this heterogeneity may be due to a separate
high titre class of responses that is more pronounced
in IgG phase 1 than in IgG phase 2.
Estimated decay rates are very slow, generally, half-
times up to several years are common, with IgG
antibodies more persistent than IgM, but mostly be-
cause the former show more variation in decay rates.
Peak titres of serum antibody responses cannot be
measured in clinical practice, because it is unknown
when individual patients reach their maximum anti-
body titres. However, as shown in Figure 2, antibody
decay is very slow and a high peak titre shortly after
acute infection is likely to lead to high antibody titres
for months to follow.
Many patients present a ‘chronic serological pro-
file ’ [21] during their follow-up and diagnoses of
chronic Q fever based on serology alone should be
treated with caution [22, 23], particularly because
many patients received antibiotic treatment that may
have influenced their antibody responses [22].
Notwithstanding the unclear relation between
serology and chronic Q fever, the present study shows
Table 2. Geometric mean and 95% confidence interval of the characteristic features of the serum antibody
response: time to peak (from symptom onset), peak titre, and half-time of antibody decay after reaching peak levels
Time to peak (days) Peak titre (IFA units) Half-time (days)
IgM 2 3.09 (0.23–17.1) r101 1.99 (0.20–38.0) r103 2.07 (0.25–43.0) r102
IgM 1 1.07 (0.02–13.5) 1.87 (0.19–50.4) r102 2.67 (0.18–120) r102
IgG 2 5.26 (0.55–21.9) r101 5.23 (0.49–65.0) r103 3.18 (0.64–50.0) r102
IgG 1 0.41 (0.01–4.37) 1.01 (0.07–28.0) r102 2.26 (0.04–122) r103
IFA, Immunofluorescence assay.
68 P. F. M. Teunis and others
that combined information on peak titres and half-
times for phase 1 and 2 IgG improves the power of
serological detection of chronic cases (Fig. 4). These
conclusions can be of use for future studies of Q fever
serology.
ACKNOWLEDGEMENTS
The authors gratefully acknowledge the expert assist-
ance of several colleagues with the collection of data:
the Municipal Health Services ‘Hart voor Brabant’,
notably Clementine Wijkmans and Gabriella
Morroy, the Jeroen Bosch Hospital, notably Jamie
Meekelenkamp, Tineke Herremans of the Laboratory
for Infectious Diseases and Perinatal Screening,
and Wim van der Hoek of the Epidemiology and
Surveillance Unit (RIVM).
DECLARATION OF INTEREST
None.
REFERENCES
1. Schimmer B, et al. Large ongoing Q fever outbreak in
the south of The Netherlands. Eurosurveillance 2008;13(31).
2. Schimmer B, et al. Sustained intensive transmission of Q
fever in the south of The Netherlands. Eurosurveillance2009; 14(9).
3. van der Hoek W, et al. Q fever in The Netherlands : anupdate on the epidemiology and control measures.
Eurosurveillance 2010; 15(12).4. Dijkstra F, et al. The 2007–2010 Q fever epidemic in The
Netherlands : characteristics of notified acute Q fever
patients and the association with dairy goat farming.FEMS Immunology and Medical Microbiology 2012;64 : 3–12.
5. Dupont HT, Thirion X, Raoult D. Q fever serology:cutoff determination for microimmunofluorescence.Clinical Diagnostics and Laboratory Immunology 1994;1 : 189–196.
6. Marrie TJ, de Carolis E. Seroepidemiology of Coxiellaburnetii infection and its frequency as a cause ofcommunity-acquired pneumonia in Canada. Canadian
Journal of Infectious Diseases 2002; 13 : 164–166.7. Fournier PE, Marrie TJ, Raoult D. Diagnosis of Q
fever. Journal of Clinical Microbiology 1998; 36 :
1823–1834.
8. Schneeberger PM, et al. Real-time PCR with serumsamples is indispensable for early diagnosis of acute Q
fever. Clinical and Vaccine Immunology 2010; 17 :286–290.
9. Raoult D, Marrie TJ, Mege JL. Natural history and
pathophysiology of Q fever. Lancet Infectious Diseases2005; 5 : 219–226.
10. Morroy G, et al. The health status of Q fever patientsafter long-term follow up. BMC Infectious Diseases
2011; 11 : 97.11. van der Hoek W, et al. Follow-up of 686 patients
with acute Q fever and detection of chronic infec-
tion. Clinical Infectious Diseases 2011; 52 : 1431–1436.
12. Landais C, et al. From acute Q fever to endocarditis :
serological follow-up strategy. Clinical InfectiousDiseases 2007; 44 : 1337–1340.
13. Dupont HT, et al. Epidemiologic features and clinical
presentation of acute Q fever in hospitalized patients :323 French cases. American Journal of Medicine 1992;93 : 427–434.
14. Teunis PFM, et al. Kinetics of IgG antibody response
to pertussis toxin after infection with B. pertussis.Epidemiology and Infection 2002; 129 : 479–489.
15. Edelstein-Keshet L. Mathematical Models in Biology
(Birkhauser Mathematics series). New York: McGraw-Hill Inc., 1988.
16. Simonsen J, et al. Estimation of incidences of infectious
diseases based on antibody measurements. Statistics inMedicine 2009; 28 : 1882–1885.
17. Teunis PFM, et al. Biomarker dynamics : estimating
infection rates from serological data. Statistics inMedicine (in press).
18. Teunis PFM, Ogden ID, Strachan NJC. Hierarchicaldose response of E. coli O157:H7 from human out-
breaks incorporating heterogeneity in exposure.Epidemiology and Infection 2008;136 : 761–770.
19. Gilks WR, Richardson S, Spiegelhalter DJ (eds).
Markov Chain Monte Carlo in Practice. London:Chapman & Hall, 1996.
20. Teunis PF, et al. Usefulness of sero-surveillance for
Trichinella infections in animal populations. VeterinaryParasitology 2009; 159 : 345–349.
21. Sunder S, et al. Chronic Q fever : relevance of serology.Clinical Infectious Diseases 2011; 53 : 749–750.
22. Limonard GJM, et al. One-year follow-up of patientsof the ongoing Q fever outbreak: clinical, serologicaland echocardiographic findings. Infection 2010; 38 :
471–477.23. Hung MN, et al. Serologic assessment of the risk of
developing chronic Q fever in cohorts of acutely
infected individuals. Journal of Infection 2011; 62 :39–44.
Antibody response against C. burnetii in Q fever 69

44 | CHAPTER 2.2
APPENDIX
Additional output
Table A1. Correlations between characteristics of the same antibody
Time to peak Peak titre Decay rate Time to peak Peak titre Decay rate
(a) IgG phase 1 (b) IgM phase 1Time to peak 1 x0.911 x0.353 1 x0.895 x0.588Peak titre x0.911 1 0.185 x0.895 1 0.392Decay rate x0.353 0.185 1 x0.588 0.392 1
(c) IgG phase 2 (d) IgM phase 2Time to peak 1 x0.816 x0.408 1 x0.790 x0.525Peak titre x0.816 1 0.250 x0.790 1 0.315Decay rate x0.408 0.250 1 x0.525 0.315 1
Table A2. Correlations of characteristics between antibodies
IgG 1 IgM 1 IgG 2 IgM 2
(a) Time to peakIgG 1 1 0.411 0.340 0.231IgM 1 0.411 1 0.258 0.326IgG 2 0.340 0.258 1 0.169IgM 2 0.231 0.326 0.169 1
(b) Peak titreIgG 1 1 0.454 0.429 0.214IgM 1 0.454 1 0.269 0.325IgG 2 0.429 0.269 1 0.387IgM 2 0.214 0.325 0.387 1
(c) Decay rateIgG 1 1 0.302 0.165 0.128IgM 1 0.302 1 0.055 0.275IgG 2 0.165 0.055 1 0.087IgM 2 0.128 0.275 0.087 1
Table A3. Binary mixture for classification of peak titres: specificity and sensitivity as a function of cut-off level
Cut-off
IgG phase 1 IgG phase 2
Peak titre Half-time Peak titre Half-time
(IFA) Spec. Sens. Spec. Sens. Spec. Sens. Spec. Sens.
10 0.067 1.000 0.015 1.000 0.000 0.995 0.000 1.00020 0.167 1.000 0.031 1.000 0.000 0.990 0.004 1.00050 0.394 1.000 0.070 1.000 0.000 0.977 0.053 1.000100 0.603 1.000 0.119 1.000 0.001 0.960 0.203 0.998200 0.785 0.999 0.189 1.000 0.006 0.934 0.481 0.990500 0.932 0.977 0.313 1.000 0.038 0.882 0.838 0.9501000 0.978 0.890 0.425 1.000 0.111 0.827 0.962 0.8702000 0.994 0.677 0.543 0.999 0.251 0.758 0.995 0.7265000 0.999 0.291 0.692 0.988 0.523 0.648 1.000 0.46310000 1.000 0.094 0.788 0.942 0.729 0.554 1.000 0.26820000 1.000 0.019 0.864 0.815 0.877 0.458 1.000 0.12650000 1.000 0.001 0.932 0.502 0.970 0.334 1.000 0.033100000 1.000 0.000 0.963 0.251 0.993 0.251 1.000 0.009
IFA, Immunofluorescence assay ; Spec., specificity ; Sens., sensitivity.
70 P. F. M. Teunis and others
107
106
105
104
103
102
101
100
106
105
104
103
102
101
100
100 101 102 103 104 105 106 100 101 102 103 104 105 106
Peak titre IgG phase 1 (U/ml)
Pea
k tit
re Ig
G p
hase
2 (
U/m
l)
Half-time IgG phase 1 (days)
Hal
f-tim
e Ig
G p
hase
2 (
days
)
(a) Peak titre (b) Half-time
Fig. A1 [colour online]. Scatterplots of (a) peak titres and (b) half-times of IgG phase 1 and 2 antibodies for presumed chronic(grey) and non-chronic patients (black).
102050100200500
1000
2000
5000
10000
200000·0
0·2
0·4
0·6
0·8
1·0
0·0
0·2
0·4
0·6
0·8
1·0
0·0
0·2
0·4
0·6
0·8
1·0
0·00·0 0·2 0·4 0·6 0·8 1·0
0·0 0·2 0·4 0·6 0·8 1·0 0·0 0·2 0·4 0·6 0·8 1·0
0·0 0·2 0·4 0·6 0·8 1·0
0·2
0·4
0·6
0·8
1·0
1 – specificity 1 – specificity
1 – specificity1 – specificity
Sen
sitiv
ityS
ensi
tivity
Sen
sitiv
ityS
ensi
tivity
5010020050010002000500010000
20000
50000
100000
1000
2000
5000
10000
20000
50000
100000
100200500
1000
2000
5000
10000
20000
50000
(a) IgG phase 1: Peak titre
(c) IgG phase 2: Peak titre
(b) IgG phase 1: Half-time
(d) IgG phase 2: Half-time
Fig. A2. Specificity and sensitivity of discrimination by peak titre by means of a binary mixture of normal distributions.Receiver operating characteristic (ROC) diagrams shown for the most likely (maximum likelihood) components, and 95%uncertainty interval (grey area). Also shown are levels for peak titres and half-times corresponding to the charted sensitivities
and specificities (numbers along the graphs).
Antibody response against C. burnetii in Q fever 71

TIME-COURSE OF ANTIBODY RESPONSES AGAINST C. BURNETII | 45
2.2
APPENDIX
Additional output
Table A1. Correlations between characteristics of the same antibody
Time to peak Peak titre Decay rate Time to peak Peak titre Decay rate
(a) IgG phase 1 (b) IgM phase 1Time to peak 1 x0.911 x0.353 1 x0.895 x0.588Peak titre x0.911 1 0.185 x0.895 1 0.392Decay rate x0.353 0.185 1 x0.588 0.392 1
(c) IgG phase 2 (d) IgM phase 2Time to peak 1 x0.816 x0.408 1 x0.790 x0.525Peak titre x0.816 1 0.250 x0.790 1 0.315Decay rate x0.408 0.250 1 x0.525 0.315 1
Table A2. Correlations of characteristics between antibodies
IgG 1 IgM 1 IgG 2 IgM 2
(a) Time to peakIgG 1 1 0.411 0.340 0.231IgM 1 0.411 1 0.258 0.326IgG 2 0.340 0.258 1 0.169IgM 2 0.231 0.326 0.169 1
(b) Peak titreIgG 1 1 0.454 0.429 0.214IgM 1 0.454 1 0.269 0.325IgG 2 0.429 0.269 1 0.387IgM 2 0.214 0.325 0.387 1
(c) Decay rateIgG 1 1 0.302 0.165 0.128IgM 1 0.302 1 0.055 0.275IgG 2 0.165 0.055 1 0.087IgM 2 0.128 0.275 0.087 1
Table A3. Binary mixture for classification of peak titres: specificity and sensitivity as a function of cut-off level
Cut-off
IgG phase 1 IgG phase 2
Peak titre Half-time Peak titre Half-time
(IFA) Spec. Sens. Spec. Sens. Spec. Sens. Spec. Sens.
10 0.067 1.000 0.015 1.000 0.000 0.995 0.000 1.00020 0.167 1.000 0.031 1.000 0.000 0.990 0.004 1.00050 0.394 1.000 0.070 1.000 0.000 0.977 0.053 1.000100 0.603 1.000 0.119 1.000 0.001 0.960 0.203 0.998200 0.785 0.999 0.189 1.000 0.006 0.934 0.481 0.990500 0.932 0.977 0.313 1.000 0.038 0.882 0.838 0.9501000 0.978 0.890 0.425 1.000 0.111 0.827 0.962 0.8702000 0.994 0.677 0.543 0.999 0.251 0.758 0.995 0.7265000 0.999 0.291 0.692 0.988 0.523 0.648 1.000 0.46310000 1.000 0.094 0.788 0.942 0.729 0.554 1.000 0.26820000 1.000 0.019 0.864 0.815 0.877 0.458 1.000 0.12650000 1.000 0.001 0.932 0.502 0.970 0.334 1.000 0.033100000 1.000 0.000 0.963 0.251 0.993 0.251 1.000 0.009
IFA, Immunofluorescence assay ; Spec., specificity ; Sens., sensitivity.
70 P. F. M. Teunis and others
107
106
105
104
103
102
101
100
106
105
104
103
102
101
100
100 101 102 103 104 105 106 100 101 102 103 104 105 106
Peak titre IgG phase 1 (U/ml)
Pea
k tit
re Ig
G p
hase
2 (
U/m
l)
Half-time IgG phase 1 (days)
Hal
f-tim
e Ig
G p
hase
2 (
days
)
(a) Peak titre (b) Half-time
Fig. A1 [colour online]. Scatterplots of (a) peak titres and (b) half-times of IgG phase 1 and 2 antibodies for presumed chronic(grey) and non-chronic patients (black).
102050100200500
1000
2000
5000
10000
200000·0
0·2
0·4
0·6
0·8
1·0
0·0
0·2
0·4
0·6
0·8
1·0
0·0
0·2
0·4
0·6
0·8
1·0
0·00·0 0·2 0·4 0·6 0·8 1·0
0·0 0·2 0·4 0·6 0·8 1·0 0·0 0·2 0·4 0·6 0·8 1·0
0·0 0·2 0·4 0·6 0·8 1·0
0·2
0·4
0·6
0·8
1·0
1 – specificity 1 – specificity
1 – specificity1 – specificity
Sen
sitiv
ityS
ensi
tivity
Sen
sitiv
ityS
ensi
tivity
5010020050010002000500010000
20000
50000
100000
1000
2000
5000
10000
20000
50000
100000
100200500
1000
2000
5000
10000
20000
50000
(a) IgG phase 1: Peak titre
(c) IgG phase 2: Peak titre
(b) IgG phase 1: Half-time
(d) IgG phase 2: Half-time
Fig. A2. Specificity and sensitivity of discrimination by peak titre by means of a binary mixture of normal distributions.Receiver operating characteristic (ROC) diagrams shown for the most likely (maximum likelihood) components, and 95%uncertainty interval (grey area). Also shown are levels for peak titres and half-times corresponding to the charted sensitivities
and specificities (numbers along the graphs).
Antibody response against C. burnetii in Q fever 71

46 | CHAPTER 2.2
10 000.0–3 months
3–6 months3–6 months
6–9 months
9–12 months
>12 months >12 months
9–12 months
6–9 months
0–3 months
IgG phase 1: 0–3 months
IgG phase 1: 3–6 months
IgG phase 1: 6–9 months
IgG phase 1: 9–12 months
IgG phase 1: >12 months IgG phase 2: >12 months
IgG phase 2: 9–12 months
IgG phase 2: 6–9 months
IgG phase 2: 0–3 months
IgG phase 2: 3–6 months
IgG
1
1000.
100.
10.
10 000.
IgG
1
1000.
100.
10.
10 000.
IgG
1
1000.
100.
10.
10 000.
IgG
1
1000.
100.
10.
10 000.
IgG
1
1000.
100.
10.
10 000.
IgG
2
1000.
100.
10.
10 000.
100 000.
IgG
2 1000.
100.
10.
10 000.
100 000.
IgG
2 1000.
100.
10.
10 000.
100 000.
IgG
2 1000.
100.
10.
10 000.
100 000.
IgG
2 1000.
100.
10.
Time (years)
0–40 40–60 >60
Time (years)
0–40 40–60 >60
Time (years)
0–40 40–60 >60
Time (years)
0–40 40–60 >60
Time (years)
0–40 40–60 >60
Time (years)
0–40 40–60 >60
Time (years)
0–40 40–60 >60
Time (years)
0–40 40–60 >60
Time (years)
0–40 40–60 >60
Time (years)
0–40 40–60 >60
(a) (b)
(c) (d)
(e) (f )
(g) (h)
(i ) (j )
Fig. A3 [colour online]. IgG phase 1 and 2 titres by age (<40, 40–60, >60 years) at 0–3, 4–6, 7–9, 10–12, and >12 monthsfollowing symptom onset.
72 P. F. M. Teunis and others
100
10–4
10–8
10–12
10–16
Peak titre half-timeIgG phase 1
Odd
s
IgG phase 2Peak titre half-time Joint
Not chronic
Chronic
Fig. A4 [colour online]. Distribution of the odds for each patient of falling into the ‘positive’ category (cf. Fig. 4). Assessmentof uncertainty in the classification by using a (Markov chain) Monte Carlo sample of fitted longitudinal responses, fitting abinary normal mixture to each individual (posterior) set of peak titres and half-times, and calculating odds over all patients in
all fitted mixtures.
Antibody response against C. burnetii in Q fever 73

TIME-COURSE OF ANTIBODY RESPONSES AGAINST C. BURNETII | 47
2.2
10 000.0–3 months
3–6 months3–6 months
6–9 months
9–12 months
>12 months >12 months
9–12 months
6–9 months
0–3 months
IgG phase 1: 0–3 months
IgG phase 1: 3–6 months
IgG phase 1: 6–9 months
IgG phase 1: 9–12 months
IgG phase 1: >12 months IgG phase 2: >12 months
IgG phase 2: 9–12 months
IgG phase 2: 6–9 months
IgG phase 2: 0–3 months
IgG phase 2: 3–6 months
IgG
1
1000.
100.
10.
10 000.
IgG
1
1000.
100.
10.
10 000.
IgG
1
1000.
100.
10.
10 000.
IgG
1
1000.
100.
10.
10 000.
IgG
1
1000.
100.
10.
10 000.
IgG
2
1000.
100.
10.
10 000.
100 000.
IgG
2 1000.
100.
10.
10 000.
100 000.
IgG
2 1000.
100.
10.
10 000.
100 000.
IgG
2 1000.
100.
10.
10 000.
100 000.
IgG
2 1000.
100.
10.
Time (years)
0–40 40–60 >60
Time (years)
0–40 40–60 >60
Time (years)
0–40 40–60 >60
Time (years)
0–40 40–60 >60
Time (years)
0–40 40–60 >60
Time (years)
0–40 40–60 >60
Time (years)
0–40 40–60 >60
Time (years)
0–40 40–60 >60
Time (years)
0–40 40–60 >60
Time (years)
0–40 40–60 >60
(a) (b)
(c) (d)
(e) (f )
(g) (h)
(i ) (j )
Fig. A3 [colour online]. IgG phase 1 and 2 titres by age (<40, 40–60, >60 years) at 0–3, 4–6, 7–9, 10–12, and >12 monthsfollowing symptom onset.
72 P. F. M. Teunis and others
100
10–4
10–8
10–12
10–16
Peak titre half-timeIgG phase 1
Odd
s
IgG phase 2Peak titre half-time Joint
Not chronic
Chronic
Fig. A4 [colour online]. Distribution of the odds for each patient of falling into the ‘positive’ category (cf. Fig. 4). Assessmentof uncertainty in the classification by using a (Markov chain) Monte Carlo sample of fitted longitudinal responses, fitting abinary normal mixture to each individual (posterior) set of peak titres and half-times, and calculating odds over all patients in
all fitted mixtures.
Antibody response against C. burnetii in Q fever 73
CHAPTER 3.1
Outbreak investigations during the Dutch Q fever epidemic
Investigation of a Q fever outbreak in a rural areaof The Netherlands
3
I. KaragiannisB. Schimmer
A. van LierA. Timen
P. SchneebergerB. van Rotterdam
A. de BruinC. Wijkmans
A. RietveldY. van Duijnhoven
Epidemiol Infect. 2009 Sep;137(9):1283-94

Investigation of a Q fever outbreak in a rural areaof The Netherlands
I. KARAGIANNIS 1,2, B. SCHIMMER 1*, A. VAN LIER1, A. TIMEN1,
P. SCHNEEBERGER 1,3, B. VAN ROTTERDAM1, A. DE BRUIN1, C. WIJKMANS4,
A. RIETVELD 4AND Y. VAN DUYNHOVEN1
1 National Institute for Public Health and the Environment, Bilthoven, The Netherlands2 European Program for Intervention Epidemiology Training (EPIET)3 ‘Jeroen Bosch Hospital’, ‘s-Hertogenbosch, The Netherlands4 Municipal Health Service ‘Hart voor Brabant’, ‘s-Hertogenbosch, The Netherlands
(Accepted 5 December 2008; first published online 23 January 2009)
SUMMARY
A Q fever outbreak occurred in the southeast of The Netherlands in spring and summer 2007.
Risk factors for the acquisition of a recent Coxiella burnetii infection were studied. In total,
696 inhabitants in the cluster area were invited to complete a questionnaire and provide a
blood sample for serological testing of IgG and IgM phases I and II antibodies against
C. burnetii, in order to recruit seronegative controls for a case-control study. Questionnaires were
also sent to 35 previously identified clinical cases. Limited environmental sampling focused on
two goat farms in the area. Living in the east of the cluster area, in which a positive goat farm,
cattle and small ruminants were situated, smoking and contact with agricultural products were
associated with a recent infection. Information leaflets were distributed on a large scale to
ruminant farms, including hygiene measures to reduce the risk of spread between animals and
to humans.
Key words : Aerosols, disease outbreaks, Q fever, weather.
INTRODUCTION
Q fever is a zoonosis caused by Coxiella burnetii, an
intracellular bacterium that appears almost every-
where in the world [1]. The most common reservoirs
for C. burnetii that cause human infections are rumi-
nants, primarily cattle, sheep and goats, although
some documented outbreaks have been associated
with parturient cats or birds [2–4]. Humans typically
acquire an infection from inhaling infected aerosols
or dust generated by infected animals or animal
products [5].
Q fever usually occurs sporadically, but common
occupational exposures have been reported to cause
outbreaks, mostly in abattoirs and among veterin-
arians or research staff using sheep as experimental
animals [6–8]. An old study in The Netherlands
showed significantly higher prevalence of IgG anti-
bodies against C. burnetii among veterinarians, resi-
dents of dairy farms and taxidermists compared to
controls from the general population [9]. Outbreaks
not involving occupational exposure to C. burnetii
* Author for correspondence : B. Schimmer, M.D., EPI/RIVM,PO Box 1, 3720 BA Bilthoven, The Netherlands.(Email : [email protected])
Epidemiol. Infect. (2009), 137, 1283–1294. f 2009 Cambridge University Press
doi:10.1017/S0950268808001908 Printed in the United Kingdom
have also been described, particularly inEurope. These
are usually temporally linked to the lambing season in
ruminants [10–12].
In The Netherlands Q fever is a mandatory noti-
fiable disease in humans, but only since June 2008 in
small ruminants. Five to 20 human cases are notified
annually, but no community-acquired outbreak had
been reported before 2007 [13].
On 29May 2007, a general practitioner (GP) from a
rural village in the south of The Netherlands alerted
the municipal health service about an unusual in-
crease in pneumonia cases in adults [14]. By the end of
2007, 178 Q fever cases with symptom onset in 2007
had been notified and appeared in the national sur-
veillance database (Fig. 1). The peak of the outbreak
was in week 21 with most cases occurring between
30 April and 30 June 2007 [15]. A substantial number
of the cases (n=55) were notified in a well-defined
cluster area in the east of the municipality of Oss
(Fig. 2).
As notification of further cases was received, an
outbreak investigation was launched in this cluster
area to describe the outbreak, find the source and
route of transmission and investigate possible links to
animal reservoirs in the region in order to decide on
appropriate control measures. The present study de-
scribes this outbreak investigation.
MATERIALS AND METHODS
A frequency-matched case-control study with sero-
negative controls was used. Both cases and controls
were restricted to the adult population of the cluster
area.
Thirty-five confirmed cases had been identified in
the cluster area by September 2007, when the case-
control studywas initiated.Our statistical assumptions
and criteria were: (a) an achievement of a statistical
power of 80%, (b) assumed overall attack rate of
15%, (c) participation rate of 33% in males and 40%
in females (d ) a error equal to 5%, (e) 1:2 case :
control (seronegative for C. burnetii) ratio. Hence, we
calculated that 696 inhabitants aged 18–84 years
should be asked to complete a questionnaire and
provide a blood sample. Previously identified cases
were not excluded from the sampling procedure so as
to achieve a truly random sample of the population.
The overall estimated attack rate of 15% was based
on a small survey in pregnant women in this area.
The invited participants were frequency-matched
with the known cases by village of residence, sex
and age category (18–19, 20–29, 30–39, …, 70–79,
80–84 years). All eligible participants were invited by
mail. Moreover, all of the 35 cases diagnosed before
the study began were invited to complete the same
30
25
20
15
10
5
0
Num
ber
of c
ases
1 3 5 7 9 11 13 15 17 19 21 23 25 27 29 31 33 35 37 39 41 43 45 47 49 51
Week of symptom onset (2007)
Rest of the country
Cluster area
Fig. 1.Distribution of week of symptom onset for notified cases of Q fever in The Netherlands in 2007 (n=178). Cluster area(n=55).
1284 I. Karagiannis and others

Q FEVER OUTBREAK IN A RURAL AREA | 51
3.1
Investigation of a Q fever outbreak in a rural areaof The Netherlands
I. KARAGIANNIS 1,2, B. SCHIMMER 1*, A. VAN LIER1, A. TIMEN1,
P. SCHNEEBERGER 1,3, B. VAN ROTTERDAM1, A. DE BRUIN1, C. WIJKMANS4,
A. RIETVELD 4AND Y. VAN DUYNHOVEN1
1 National Institute for Public Health and the Environment, Bilthoven, The Netherlands2 European Program for Intervention Epidemiology Training (EPIET)3 ‘Jeroen Bosch Hospital’, ‘s-Hertogenbosch, The Netherlands4 Municipal Health Service ‘Hart voor Brabant’, ‘s-Hertogenbosch, The Netherlands
(Accepted 5 December 2008; first published online 23 January 2009)
SUMMARY
A Q fever outbreak occurred in the southeast of The Netherlands in spring and summer 2007.
Risk factors for the acquisition of a recent Coxiella burnetii infection were studied. In total,
696 inhabitants in the cluster area were invited to complete a questionnaire and provide a
blood sample for serological testing of IgG and IgM phases I and II antibodies against
C. burnetii, in order to recruit seronegative controls for a case-control study. Questionnaires were
also sent to 35 previously identified clinical cases. Limited environmental sampling focused on
two goat farms in the area. Living in the east of the cluster area, in which a positive goat farm,
cattle and small ruminants were situated, smoking and contact with agricultural products were
associated with a recent infection. Information leaflets were distributed on a large scale to
ruminant farms, including hygiene measures to reduce the risk of spread between animals and
to humans.
Key words : Aerosols, disease outbreaks, Q fever, weather.
INTRODUCTION
Q fever is a zoonosis caused by Coxiella burnetii, an
intracellular bacterium that appears almost every-
where in the world [1]. The most common reservoirs
for C. burnetii that cause human infections are rumi-
nants, primarily cattle, sheep and goats, although
some documented outbreaks have been associated
with parturient cats or birds [2–4]. Humans typically
acquire an infection from inhaling infected aerosols
or dust generated by infected animals or animal
products [5].
Q fever usually occurs sporadically, but common
occupational exposures have been reported to cause
outbreaks, mostly in abattoirs and among veterin-
arians or research staff using sheep as experimental
animals [6–8]. An old study in The Netherlands
showed significantly higher prevalence of IgG anti-
bodies against C. burnetii among veterinarians, resi-
dents of dairy farms and taxidermists compared to
controls from the general population [9]. Outbreaks
not involving occupational exposure to C. burnetii
* Author for correspondence : B. Schimmer, M.D., EPI/RIVM,PO Box 1, 3720 BA Bilthoven, The Netherlands.(Email : [email protected])
Epidemiol. Infect. (2009), 137, 1283–1294. f 2009 Cambridge University Press
doi:10.1017/S0950268808001908 Printed in the United Kingdom
have also been described, particularly inEurope. These
are usually temporally linked to the lambing season in
ruminants [10–12].
In The Netherlands Q fever is a mandatory noti-
fiable disease in humans, but only since June 2008 in
small ruminants. Five to 20 human cases are notified
annually, but no community-acquired outbreak had
been reported before 2007 [13].
On 29May 2007, a general practitioner (GP) from a
rural village in the south of The Netherlands alerted
the municipal health service about an unusual in-
crease in pneumonia cases in adults [14]. By the end of
2007, 178 Q fever cases with symptom onset in 2007
had been notified and appeared in the national sur-
veillance database (Fig. 1). The peak of the outbreak
was in week 21 with most cases occurring between
30 April and 30 June 2007 [15]. A substantial number
of the cases (n=55) were notified in a well-defined
cluster area in the east of the municipality of Oss
(Fig. 2).
As notification of further cases was received, an
outbreak investigation was launched in this cluster
area to describe the outbreak, find the source and
route of transmission and investigate possible links to
animal reservoirs in the region in order to decide on
appropriate control measures. The present study de-
scribes this outbreak investigation.
MATERIALS AND METHODS
A frequency-matched case-control study with sero-
negative controls was used. Both cases and controls
were restricted to the adult population of the cluster
area.
Thirty-five confirmed cases had been identified in
the cluster area by September 2007, when the case-
control studywas initiated.Our statistical assumptions
and criteria were: (a) an achievement of a statistical
power of 80%, (b) assumed overall attack rate of
15%, (c) participation rate of 33% in males and 40%
in females (d ) a error equal to 5%, (e) 1:2 case :
control (seronegative for C. burnetii) ratio. Hence, we
calculated that 696 inhabitants aged 18–84 years
should be asked to complete a questionnaire and
provide a blood sample. Previously identified cases
were not excluded from the sampling procedure so as
to achieve a truly random sample of the population.
The overall estimated attack rate of 15% was based
on a small survey in pregnant women in this area.
The invited participants were frequency-matched
with the known cases by village of residence, sex
and age category (18–19, 20–29, 30–39, …, 70–79,
80–84 years). All eligible participants were invited by
mail. Moreover, all of the 35 cases diagnosed before
the study began were invited to complete the same
30
25
20
15
10
5
0
Num
ber
of c
ases
1 3 5 7 9 11 13 15 17 19 21 23 25 27 29 31 33 35 37 39 41 43 45 47 49 51
Week of symptom onset (2007)
Rest of the country
Cluster area
Fig. 1.Distribution of week of symptom onset for notified cases of Q fever in The Netherlands in 2007 (n=178). Cluster area(n=55).
1284 I. Karagiannis and others

52 | CHAPTER 3.1
questionnaire. The questionnaire included age, sex,
postcode, working situation (including working in
open air), residence information, distance of house to
farms and meadows with livestock, animal pos-
session, contact with animals, contact with unhandled
animal products, consumption of raw milk products,
visits to specific places or events, outdoor activities,
house ventilation and health conditions – predispo-
sitions. Besides self-reported distances, distances from
participants ’ residence to farms with goats, sheep and
cows in the cluster area and meadows where dung was
spread were calculated using GIS software. We also
calculated distance from participants’ residence to all
postcodes where ruminant farms were situated in the
area, in order to identify neighbourhoods associated
with recent infections. Participants were also asked
about specific symptoms between 7 May and 8 July
2007. The recall period for the exposure variables was
the end of April and the whole month of May 2007,
i.e. up to 4 weeks before the peak of onset of cases
(week 21 of 2007, i.e. 21–27 May 2007).
Cases included all laboratory-confirmed cases pre-
viously identified in the area at the time of the start of
the study and all seropositive participants indicating a
recent infection from the serological survey. The term
‘cases ’ in the univariate and multivariable analyses of
the case-control study refers to this whole group of
seropositive participants. ‘Controls ’ included partici-
pants from the serological survey with negative results
for a recent C. burnetii infection. All participants with
Participants
Recent infection
Past infection
Already known case
Negative
N
EW
S
Herpen
Fig. 2. Participants with laboratory findings compatible with a recent or past C. burnetii infection, negative findings and cases
previously identified in the centre of the cluster area.
Q fever emerging in The Netherlands 1285
laboratory evidence for a past infection were excluded
from the analysis.
The case-control study was approved by the Medi-
cal Ethical Committee of the University Medical Cen-
tre Utrecht (reference number: 07-241).
Statistical analysis
Odds ratios (OR) and corresponding 95% confidence
intervals (CI) were calculated through logistic re-
gression analysis to identify potential risk factors
for the acquisition of a recent C. burnetii infection.
Variables that were statistically significant at the 20%
level and could explain at least 20% of the cases in the
univariate analysis were included in the multivariable
analyses. In the latter analysis, sex and age were al-
ways adjusted for. All other variables were tested with
the use of manual backwards-elimination techniques.
We also tested for interaction terms between variables
in the final multivariable analysis model. All analyses
were run in Stata version 10.0 (Stata Corp, College
Station, TX, USA).
Laboratory screening
Study participants were screened for Q fever infection
with an immunofluorescence assay (IFA) (Focus Di-
agnostics, Cypress, CA, USA) for IgG and IgM
antibodies with a single 1:64 serum dilution. In order
to harmonize the screening method, all 35 previously
confirmed cases were reconfirmed by IFA and all met
the case definition of a recent infection. Screening was
performed to distinguish between uninfected, recently
infected and individuals who had been infected in
the past. Samples with unequivocal results were fur-
ther analysed using twofold dilutions. A recent infec-
tion was defined as IgM phases 1 and 2o1:64 or an
individual with an isolated titre of IgM phases 1 or
2o1:512. Individuals with a past infection did not
match the IgM criteria in the definition of a recent
infection, but had IgG phases 1 and 2o1:64 or an
isolated titre of IgG phases 1 or 2o512. The remain-
ing samples were scored negative and were used as
seronegative controls in the case-control study.
Environmental investigation
Within the cluster area, environmental and animal
samples were taken from a commercial (goat popu-
lation: 3794) and a hobby goat farm, both probably
related to incident cases, to track possible sources
of C. burnetii. DNA was extracted using several
modified NucliSens DNA extraction protocols (bio-
Merieux, France), depending on the environmental
matrix examined. Detection of C. burnetii was per-
formed by using a newly developed multiplex Q-PCR
assay. Genomic targets that are most frequently used
for detection of C. burnetii (icd, com1 [16] and IS1111
[17]) were incorporated into one multiplex Q-PCR
assay. For these three targets, primers and Taqman
probes (Biolegio, The Netherlands) were designed
using Visual OMP 6 for simultaneous detection. The
specificity of the multiplex quantitative real-time
PCR (Q-PCR) was tested on a large panel of non-
target organisms to verify any cross-reaction with
other closely related species. These non-target organ-
isms included Bacillus cereus, B. mycoides, B. thurin-
giensis, Yersinia pseudotuberculosis, Y. agglomerans,
Y. enterocolitica, Y. frederiksenii, Klebsiella pneumo-
niae, Pseudomonas aeruginosa, Legionella pneumo-
phila, L. bozemonii, L. longbeachae, L. micdadei, L.
dumoggii and L. anisa. No cross-reactions were ob-
served for these organisms. The sensitivity of the
assay was tested in a probit analysis (De Bruin et al.,
personal communication) and differed between the
three targets. The minimal number of genome equiv-
alents per reaction that could be detected with a 95%
probability was found to be below five copies for the
single copy targets icd and com1, and below three
copies for the multicopy target IS1111.
Weather data for April 2007 and the same month
over the last 30 years were acquired from the nearby
weather station of the National Meteorological Insti-
tute (KNMI) at Eindhoven and weather conditions
(temperature and wind direction) for this month were
compared to mean long-term climatic values for April
in the region.
RESULTS
Descriptive results
Of all 696 invited participants, 515 (74.0%) com-
pleted a questionnaire and 443 (63.6%) provided a
blood sample. All participants who provided a blood
sample also completed a questionnaire. Of the 35
previously identified cases, 30 (85.7%) completed the
questionnaire. All the cases were eventually confirmed
by IFA. Full respondents, i.e. participants who pro-
vided both a questionnaire and a blood sample, did
not differ in age or sex distribution from the rest of the
invited population.
1286 I. Karagiannis and others

Q FEVER OUTBREAK IN A RURAL AREA | 53
3.1
questionnaire. The questionnaire included age, sex,
postcode, working situation (including working in
open air), residence information, distance of house to
farms and meadows with livestock, animal pos-
session, contact with animals, contact with unhandled
animal products, consumption of raw milk products,
visits to specific places or events, outdoor activities,
house ventilation and health conditions – predispo-
sitions. Besides self-reported distances, distances from
participants ’ residence to farms with goats, sheep and
cows in the cluster area and meadows where dung was
spread were calculated using GIS software. We also
calculated distance from participants’ residence to all
postcodes where ruminant farms were situated in the
area, in order to identify neighbourhoods associated
with recent infections. Participants were also asked
about specific symptoms between 7 May and 8 July
2007. The recall period for the exposure variables was
the end of April and the whole month of May 2007,
i.e. up to 4 weeks before the peak of onset of cases
(week 21 of 2007, i.e. 21–27 May 2007).
Cases included all laboratory-confirmed cases pre-
viously identified in the area at the time of the start of
the study and all seropositive participants indicating a
recent infection from the serological survey. The term
‘cases ’ in the univariate and multivariable analyses of
the case-control study refers to this whole group of
seropositive participants. ‘Controls ’ included partici-
pants from the serological survey with negative results
for a recent C. burnetii infection. All participants with
Participants
Recent infection
Past infection
Already known case
Negative
N
EW
S
Herpen
Fig. 2. Participants with laboratory findings compatible with a recent or past C. burnetii infection, negative findings and cases
previously identified in the centre of the cluster area.
Q fever emerging in The Netherlands 1285
laboratory evidence for a past infection were excluded
from the analysis.
The case-control study was approved by the Medi-
cal Ethical Committee of the University Medical Cen-
tre Utrecht (reference number: 07-241).
Statistical analysis
Odds ratios (OR) and corresponding 95% confidence
intervals (CI) were calculated through logistic re-
gression analysis to identify potential risk factors
for the acquisition of a recent C. burnetii infection.
Variables that were statistically significant at the 20%
level and could explain at least 20% of the cases in the
univariate analysis were included in the multivariable
analyses. In the latter analysis, sex and age were al-
ways adjusted for. All other variables were tested with
the use of manual backwards-elimination techniques.
We also tested for interaction terms between variables
in the final multivariable analysis model. All analyses
were run in Stata version 10.0 (Stata Corp, College
Station, TX, USA).
Laboratory screening
Study participants were screened for Q fever infection
with an immunofluorescence assay (IFA) (Focus Di-
agnostics, Cypress, CA, USA) for IgG and IgM
antibodies with a single 1:64 serum dilution. In order
to harmonize the screening method, all 35 previously
confirmed cases were reconfirmed by IFA and all met
the case definition of a recent infection. Screening was
performed to distinguish between uninfected, recently
infected and individuals who had been infected in
the past. Samples with unequivocal results were fur-
ther analysed using twofold dilutions. A recent infec-
tion was defined as IgM phases 1 and 2o1:64 or an
individual with an isolated titre of IgM phases 1 or
2o1:512. Individuals with a past infection did not
match the IgM criteria in the definition of a recent
infection, but had IgG phases 1 and 2o1:64 or an
isolated titre of IgG phases 1 or 2o512. The remain-
ing samples were scored negative and were used as
seronegative controls in the case-control study.
Environmental investigation
Within the cluster area, environmental and animal
samples were taken from a commercial (goat popu-
lation: 3794) and a hobby goat farm, both probably
related to incident cases, to track possible sources
of C. burnetii. DNA was extracted using several
modified NucliSens DNA extraction protocols (bio-
Merieux, France), depending on the environmental
matrix examined. Detection of C. burnetii was per-
formed by using a newly developed multiplex Q-PCR
assay. Genomic targets that are most frequently used
for detection of C. burnetii (icd, com1 [16] and IS1111
[17]) were incorporated into one multiplex Q-PCR
assay. For these three targets, primers and Taqman
probes (Biolegio, The Netherlands) were designed
using Visual OMP 6 for simultaneous detection. The
specificity of the multiplex quantitative real-time
PCR (Q-PCR) was tested on a large panel of non-
target organisms to verify any cross-reaction with
other closely related species. These non-target organ-
isms included Bacillus cereus, B. mycoides, B. thurin-
giensis, Yersinia pseudotuberculosis, Y. agglomerans,
Y. enterocolitica, Y. frederiksenii, Klebsiella pneumo-
niae, Pseudomonas aeruginosa, Legionella pneumo-
phila, L. bozemonii, L. longbeachae, L. micdadei, L.
dumoggii and L. anisa. No cross-reactions were ob-
served for these organisms. The sensitivity of the
assay was tested in a probit analysis (De Bruin et al.,
personal communication) and differed between the
three targets. The minimal number of genome equiv-
alents per reaction that could be detected with a 95%
probability was found to be below five copies for the
single copy targets icd and com1, and below three
copies for the multicopy target IS1111.
Weather data for April 2007 and the same month
over the last 30 years were acquired from the nearby
weather station of the National Meteorological Insti-
tute (KNMI) at Eindhoven and weather conditions
(temperature and wind direction) for this month were
compared to mean long-term climatic values for April
in the region.
RESULTS
Descriptive results
Of all 696 invited participants, 515 (74.0%) com-
pleted a questionnaire and 443 (63.6%) provided a
blood sample. All participants who provided a blood
sample also completed a questionnaire. Of the 35
previously identified cases, 30 (85.7%) completed the
questionnaire. All the cases were eventually confirmed
by IFA. Full respondents, i.e. participants who pro-
vided both a questionnaire and a blood sample, did
not differ in age or sex distribution from the rest of the
invited population.
1286 I. Karagiannis and others

54 | CHAPTER 3.1
Of all 443 people who provided a blood sample, 332
(74.9%) were seronegative for C. burnetii, 38 (8.6%)
had a past infection and the remaining 73 (16.5%)
had a recent infection. Of these recently infected
participants, 67 (91.8%) lived in Herpen, the most
affected village. The highest percentage of recent in-
fections was observed in participants aged <30 years
(median age of cases 49 years, for seronegative
controls 54 years), while these percentages did not
differ between the two sexes (Table 1). The median age
in participants with a past infection was 54.2 years
(36–80 years) and the male :female ratio was 2.2.
The most frequent symptoms in the 30 previously
confirmed cases that provided a questionnaire were
fever (100.0%), night sweating (92.6%) and general
malaise (92.3%). Of these cases, 11 (36.7%) were
Table 1. Laboratory results for recent C. burnetii infection in participants in the most affected village
of the cluster area (Herpen)
Age category (years)(n=381)
Males Females Total
Total No. pos.* P(T+)# Total No. pos.* P(T+)# Total No. pos. P(T+)$
18–19 (n=11) 2 1 50.0 9 3 44.4 11 4 45.520–29 (n=7) 4 2 50.0 3 2 66.7 7 4 57.1
30–39 (n=17) 6 1 16.7 11 3 27.3 17 4 23.540–49 (n=137) 98 22 22.4 39 8 20.5 137 28 21.950–59 (n=83) 62 11 17.7 21 3 19.0 83 13 18.1
60–69 (n=91) 63 9 14.3 28 3 10.7 91 12 13.270–79 (n=27) 23 2 8.7 4 0 0.0 27 1 7.480–84 (n=8) 5 1 20.0 3 0 0.0 8 1 12.5
Total (adjusted)$ 263 49 23.0 118 22 22.3 381 67 22.8
* Numbers include cases identified at the time of the study set-up.# P(T+) refers to the percentage of participants with a laboratory-confirmed recent infection, including cases identified atthe time of the study set-up. The crude P(T+) in Herpen, not standardized for age and sex distribution of the population, was19.2% (18.6% for males and 20.3% for females). Excluding past infections from the denominator, the overall attack rate in
Herpen was estimated to be 23.9% (24.8% for males and 23.0% for females).$ P(T+) adjusted percentages for the overall age and sex distribution of the village in inhabitants aged 18–84 years.
Table 2. Self-reported symptoms in patients with a serologically confirmed C. burnetii infection
in the cluster area in spring/summer 2007
Symptoms
Participants with a recentinfection (n=73)
Previously identifiedcases (n=30)*
Total Yes % Total Yes %
Fever (>38 xC) 63 16 25.4 28 28 100Malaise 67 26 38.8 26 24 92.3Headache 64 26 40.6 27 23 85.2
Cough 67 25 37.3 26 18 69.2Severe fatigue 68 29 42.7 27 24 88.9Shortness of breath or
respiratory difficulties
65 14 21.5 24 16 66.7
Pain or pressure on the pain 64 6 9.4 24 14 58.3Diarrhoea 67 15 22.4 26 14 53.8
Joint pain 68 18 26.5 27 22 81.5Night sweating 65 20 30.8 27 25 92.6Jaundice, hepatitis
(as a clinical diagnosis)
64 1 1.6 17 3 17.6
Loss of weight 65 7 10.8 26 14 53.8Pneumonia (as a clinical diagnosis) 63 4 6.4 24 16 66.7
* Only 30 of the 35 cases identified at the time of the study set-up were supplied with a questionnaire.
Q fever emerging in The Netherlands 1287
hospitalized (Table 2). In the 73 seropositive partici-
pants in the serological study, severe fatigue (42.7%),
headache (40.6%) and general malaise (38.8%) were
the most common symptoms. Fever was only re-
ported by a minority (25.4%). In this group, 25
(34.3%) individuals reported none of the symptoms
they were asked about. Consultation with a physician
and hospitalization were reported by 17 (23.3%) and
one (1.4%) of these seropositive individuals, respect-
ively (Table 2).
Case-control study
The final group of cases for the analyses consisted of
the 35 previously diagnosed cases at the time of the
study’s initiation and the 73 randomly selected par-
ticipants with a recent infection, the latter including
five of the confirmed cases. Therefore, the total num-
ber of cases in the case-control study was 103 (98 for
risk-factor analyses; no questionnaire was available
for five of the confirmed cases) and the number of
seronegative controls was 332. The 38 participants
with a past C. burnetii infection were excluded from
the analysis (Fig. 3). The latter participants did not
differ from the group of 103 cases in sex distribution,
but were on average 5.2 years older.
Several variables were shown to be potential risk
factors for the acquisition of a recent C. burnetii in-
fection in the univariate analysis. An increase in age
by 1 year resulted in a decrease in risk for infection by
3.1% (OR 0.97, 95% CI 0.95–0.99). People agedf44
years had the highest risk of infection. Several risk
factors that were associated with exposure to the open
air and animals or animal/agricultural products, as
well as distance to farms and meadows with goats,
sheep and cows or where dung was spread were also
significant (Table 3). Household size, type of resi-
dence and work in meat treatment, the agricultural
sector and wool or leather treatment, as well as having
spent nights in a different area during the incubation
period, were not found to be related to the acquisition
of a recent C. burnetii infection. The same applied to
doing household-related activities outside the house
as proxies for exposure to the open air.
In the multivariable analysis, smoking, contact with
agricultural products such as manure, hay and straw
and distance to a farm or one of four neighbourhood
postal codes to the east of Herpen (‘area A’) remained
statistically significant, also adjusted for sex and age
(Table 3). Adding interaction terms between distance
to area A and contact with agricultural products was
not statistically significant. Smoking was not clearly
associated with symptom acquisition, given an infec-
tion; in 60 seropositive participants for whom smok-
ing habits were known, 15/24 (62.5%) non-current
smokers developed symptoms compared to 27/36
current smokers (75%).
Environmental investigation
Seventy-nine environmental and animal samples were
collected from two farms (10 and 69 samples from the
hobby and commercial farm respectively), of which 75
were screened for C. burnetii. Twenty-five (33%) were
Initial population sample696 inhabitants
(including 12 previously identified cases)
Questionnaire515 (74·0%)(including 11
previously identifiedcases)
Noquestionnaire
or bloodsample
181 (26·0%),(including
one previouslyidentified case)
Did not give ablood sample72 (14·0%),(including 6
previously identifiedcases)
Recent infection73 (16·5%)
Negative332 (74·9%)
Past infection38 (8·6%)
Gave a bloodsample
443 (86·0%),(including 5
previously identifiedcases)
Fig. 3. Participation of the invited inhabitants and results of the serological study for C. burnetti, 2007.
1288 I. Karagiannis and others

Q FEVER OUTBREAK IN A RURAL AREA | 55
3.1
Of all 443 people who provided a blood sample, 332
(74.9%) were seronegative for C. burnetii, 38 (8.6%)
had a past infection and the remaining 73 (16.5%)
had a recent infection. Of these recently infected
participants, 67 (91.8%) lived in Herpen, the most
affected village. The highest percentage of recent in-
fections was observed in participants aged <30 years
(median age of cases 49 years, for seronegative
controls 54 years), while these percentages did not
differ between the two sexes (Table 1). The median age
in participants with a past infection was 54.2 years
(36–80 years) and the male :female ratio was 2.2.
The most frequent symptoms in the 30 previously
confirmed cases that provided a questionnaire were
fever (100.0%), night sweating (92.6%) and general
malaise (92.3%). Of these cases, 11 (36.7%) were
Table 1. Laboratory results for recent C. burnetii infection in participants in the most affected village
of the cluster area (Herpen)
Age category (years)(n=381)
Males Females Total
Total No. pos.* P(T+)# Total No. pos.* P(T+)# Total No. pos. P(T+)$
18–19 (n=11) 2 1 50.0 9 3 44.4 11 4 45.520–29 (n=7) 4 2 50.0 3 2 66.7 7 4 57.1
30–39 (n=17) 6 1 16.7 11 3 27.3 17 4 23.540–49 (n=137) 98 22 22.4 39 8 20.5 137 28 21.950–59 (n=83) 62 11 17.7 21 3 19.0 83 13 18.1
60–69 (n=91) 63 9 14.3 28 3 10.7 91 12 13.270–79 (n=27) 23 2 8.7 4 0 0.0 27 1 7.480–84 (n=8) 5 1 20.0 3 0 0.0 8 1 12.5
Total (adjusted)$ 263 49 23.0 118 22 22.3 381 67 22.8
* Numbers include cases identified at the time of the study set-up.# P(T+) refers to the percentage of participants with a laboratory-confirmed recent infection, including cases identified atthe time of the study set-up. The crude P(T+) in Herpen, not standardized for age and sex distribution of the population, was19.2% (18.6% for males and 20.3% for females). Excluding past infections from the denominator, the overall attack rate in
Herpen was estimated to be 23.9% (24.8% for males and 23.0% for females).$ P(T+) adjusted percentages for the overall age and sex distribution of the village in inhabitants aged 18–84 years.
Table 2. Self-reported symptoms in patients with a serologically confirmed C. burnetii infection
in the cluster area in spring/summer 2007
Symptoms
Participants with a recentinfection (n=73)
Previously identifiedcases (n=30)*
Total Yes % Total Yes %
Fever (>38 xC) 63 16 25.4 28 28 100Malaise 67 26 38.8 26 24 92.3Headache 64 26 40.6 27 23 85.2
Cough 67 25 37.3 26 18 69.2Severe fatigue 68 29 42.7 27 24 88.9Shortness of breath or
respiratory difficulties
65 14 21.5 24 16 66.7
Pain or pressure on the pain 64 6 9.4 24 14 58.3Diarrhoea 67 15 22.4 26 14 53.8
Joint pain 68 18 26.5 27 22 81.5Night sweating 65 20 30.8 27 25 92.6Jaundice, hepatitis
(as a clinical diagnosis)
64 1 1.6 17 3 17.6
Loss of weight 65 7 10.8 26 14 53.8Pneumonia (as a clinical diagnosis) 63 4 6.4 24 16 66.7
* Only 30 of the 35 cases identified at the time of the study set-up were supplied with a questionnaire.
Q fever emerging in The Netherlands 1287
hospitalized (Table 2). In the 73 seropositive partici-
pants in the serological study, severe fatigue (42.7%),
headache (40.6%) and general malaise (38.8%) were
the most common symptoms. Fever was only re-
ported by a minority (25.4%). In this group, 25
(34.3%) individuals reported none of the symptoms
they were asked about. Consultation with a physician
and hospitalization were reported by 17 (23.3%) and
one (1.4%) of these seropositive individuals, respect-
ively (Table 2).
Case-control study
The final group of cases for the analyses consisted of
the 35 previously diagnosed cases at the time of the
study’s initiation and the 73 randomly selected par-
ticipants with a recent infection, the latter including
five of the confirmed cases. Therefore, the total num-
ber of cases in the case-control study was 103 (98 for
risk-factor analyses; no questionnaire was available
for five of the confirmed cases) and the number of
seronegative controls was 332. The 38 participants
with a past C. burnetii infection were excluded from
the analysis (Fig. 3). The latter participants did not
differ from the group of 103 cases in sex distribution,
but were on average 5.2 years older.
Several variables were shown to be potential risk
factors for the acquisition of a recent C. burnetii in-
fection in the univariate analysis. An increase in age
by 1 year resulted in a decrease in risk for infection by
3.1% (OR 0.97, 95% CI 0.95–0.99). People agedf44
years had the highest risk of infection. Several risk
factors that were associated with exposure to the open
air and animals or animal/agricultural products, as
well as distance to farms and meadows with goats,
sheep and cows or where dung was spread were also
significant (Table 3). Household size, type of resi-
dence and work in meat treatment, the agricultural
sector and wool or leather treatment, as well as having
spent nights in a different area during the incubation
period, were not found to be related to the acquisition
of a recent C. burnetii infection. The same applied to
doing household-related activities outside the house
as proxies for exposure to the open air.
In the multivariable analysis, smoking, contact with
agricultural products such as manure, hay and straw
and distance to a farm or one of four neighbourhood
postal codes to the east of Herpen (‘area A’) remained
statistically significant, also adjusted for sex and age
(Table 3). Adding interaction terms between distance
to area A and contact with agricultural products was
not statistically significant. Smoking was not clearly
associated with symptom acquisition, given an infec-
tion; in 60 seropositive participants for whom smok-
ing habits were known, 15/24 (62.5%) non-current
smokers developed symptoms compared to 27/36
current smokers (75%).
Environmental investigation
Seventy-nine environmental and animal samples were
collected from two farms (10 and 69 samples from the
hobby and commercial farm respectively), of which 75
were screened for C. burnetii. Twenty-five (33%) were
Initial population sample696 inhabitants
(including 12 previously identified cases)
Questionnaire515 (74·0%)(including 11
previously identifiedcases)
Noquestionnaire
or bloodsample
181 (26·0%),(including
one previouslyidentified case)
Did not give ablood sample72 (14·0%),(including 6
previously identifiedcases)
Recent infection73 (16·5%)
Negative332 (74·9%)
Past infection38 (8·6%)
Gave a bloodsample
443 (86·0%),(including 5
previously identifiedcases)
Fig. 3. Participation of the invited inhabitants and results of the serological study for C. burnetti, 2007.
1288 I. Karagiannis and others
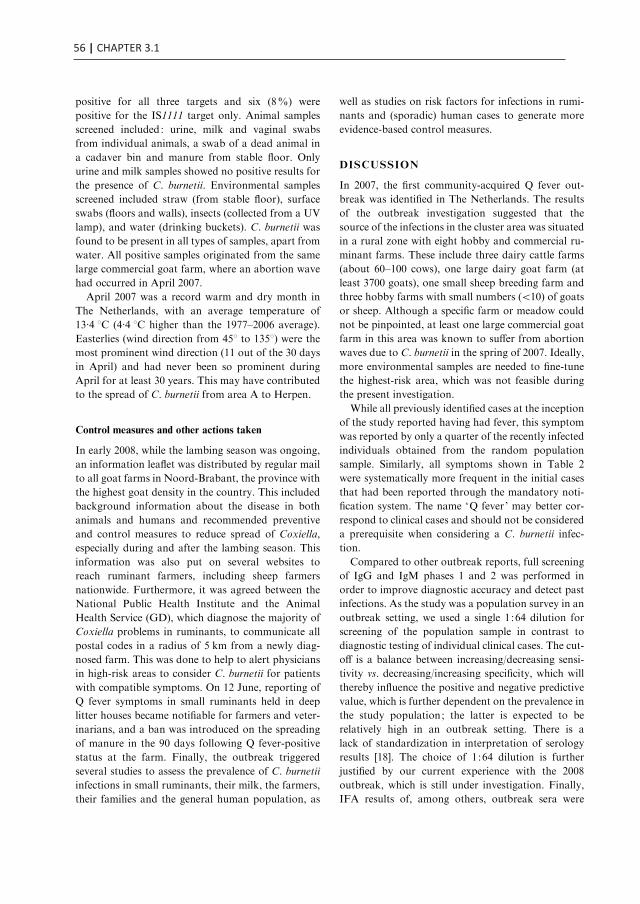
56 | CHAPTER 3.1
positive for all three targets and six (8%) were
positive for the IS1111 target only. Animal samples
screened included: urine, milk and vaginal swabs
from individual animals, a swab of a dead animal in
a cadaver bin and manure from stable floor. Only
urine and milk samples showed no positive results for
the presence of C. burnetii. Environmental samples
screened included straw (from stable floor), surface
swabs (floors and walls), insects (collected from a UV
lamp), and water (drinking buckets). C. burnetii was
found to be present in all types of samples, apart from
water. All positive samples originated from the same
large commercial goat farm, where an abortion wave
had occurred in April 2007.
April 2007 was a record warm and dry month in
The Netherlands, with an average temperature of
13.4 xC (4.4 xC higher than the 1977–2006 average).
Easterlies (wind direction from 45x to 135x) were the
most prominent wind direction (11 out of the 30 days
in April) and had never been so prominent during
April for at least 30 years. This may have contributed
to the spread of C. burnetii from area A to Herpen.
Control measures and other actions taken
In early 2008, while the lambing season was ongoing,
an information leaflet was distributed by regular mail
to all goat farms in Noord-Brabant, the province with
the highest goat density in the country. This included
background information about the disease in both
animals and humans and recommended preventive
and control measures to reduce spread of Coxiella,
especially during and after the lambing season. This
information was also put on several websites to
reach ruminant farmers, including sheep farmers
nationwide. Furthermore, it was agreed between the
National Public Health Institute and the Animal
Health Service (GD), which diagnose the majority of
Coxiella problems in ruminants, to communicate all
postal codes in a radius of 5 km from a newly diag-
nosed farm. This was done to help to alert physicians
in high-risk areas to consider C. burnetii for patients
with compatible symptoms. On 12 June, reporting of
Q fever symptoms in small ruminants held in deep
litter houses became notifiable for farmers and veter-
inarians, and a ban was introduced on the spreading
of manure in the 90 days following Q fever-positive
status at the farm. Finally, the outbreak triggered
several studies to assess the prevalence of C. burnetii
infections in small ruminants, their milk, the farmers,
their families and the general human population, as
well as studies on risk factors for infections in rumi-
nants and (sporadic) human cases to generate more
evidence-based control measures.
DISCUSSION
In 2007, the first community-acquired Q fever out-
break was identified in The Netherlands. The results
of the outbreak investigation suggested that the
source of the infections in the cluster area was situated
in a rural zone with eight hobby and commercial ru-
minant farms. These include three dairy cattle farms
(about 60–100 cows), one large dairy goat farm (at
least 3700 goats), one small sheep breeding farm and
three hobby farms with small numbers (<10) of goats
or sheep. Although a specific farm or meadow could
not be pinpointed, at least one large commercial goat
farm in this area was known to suffer from abortion
waves due to C. burnetii in the spring of 2007. Ideally,
more environmental samples are needed to fine-tune
the highest-risk area, which was not feasible during
the present investigation.
While all previously identified cases at the inception
of the study reported having had fever, this symptom
was reported by only a quarter of the recently infected
individuals obtained from the random population
sample. Similarly, all symptoms shown in Table 2
were systematically more frequent in the initial cases
that had been reported through the mandatory noti-
fication system. The name ‘Q fever ’ may better cor-
respond to clinical cases and should not be considered
a prerequisite when considering a C. burnetii infec-
tion.
Compared to other outbreak reports, full screening
of IgG and IgM phases 1 and 2 was performed in
order to improve diagnostic accuracy and detect past
infections. As the study was a population survey in an
outbreak setting, we used a single 1:64 dilution for
screening of the population sample in contrast to
diagnostic testing of individual clinical cases. The cut-
off is a balance between increasing/decreasing sensi-
tivity vs. decreasing/increasing specificity, which will
thereby influence the positive and negative predictive
value, which is further dependent on the prevalence in
the study population; the latter is expected to be
relatively high in an outbreak setting. There is a
lack of standardization in interpretation of serology
results [18]. The choice of 1:64 dilution is further
justified by our current experience with the 2008
outbreak, which is still under investigation. Finally,
IFA results of, among others, outbreak sera were
Q fever emerging in The Netherlands 1289
Table 3. Results of the univariate and multivariable analyses of the case-control study for acquisition
of C. burnetii infection in the cluster area, 2007
Cases
(N=103)*n (%)
Controls
(N=332)n (%) OR 95% CI
Univariate analysis
Age category (years)# f45 41 (40) 78 (23) 2.57 1.35–4.91
(ref. : >62 years) 46–61 42 (41) 158 (48) 1.24 0.67–2.35Sex#(ref. : female)
Male 68 (66) 215 (65) 1.06 0.66–1.68
Working condition >32 h/week# 49 (52) 142 (43) 1.77 1.01–3.12(ref. : not working) 20–31 h/week 8 (8) 28 (9) 1.47 0.59–3.66
12–19 h/week 8 (8) 24 (7) 1.71 0.68–4.33
<12 h/week 8 (8) 21 (6) 1.96 0.76–5.02Work industry(ref. : other than food preparation,animal care, meat treatment, agricultural
sector, wool and leather treatment)
Food preparation 5 (7) 5 (2) 3.18 0.88–11.5Animal care 3 (5) 1 (1) 9.55 0.95–96.3
Possession of animals(ref. : no possession of a specific animal)
Dogs# 45 (46) 115 (35) 1.60 0.99–2.59Pigs 4 (4) 3 (1) 4.67 0.77–32.3
Possession of animals(ref : possession of any animal)
No# 28 (29) 127 (38) 0.65 0.38–1.08
Contact with animals
(ref : no contact with any animal)
With other people’s
animals#
49 (50) 128 (39) 1.59 0.99–2.57
Contact with animals(ref : contact with any animal)
No contact withany animal#
21 (21) 102 (31) 0.61 0.34–1.07
Seen animals (<5 m)
(ref : not having seen a specific animal)
(Wild) birds# 30 (31) 76 (23) 1.49 0.87–2.51
Sheep# 23 (23) 59 (18) 1.42 0.78–2.51Goats# 33 (34) 73 (22) 1.80 1.06–3.02Horses, ponies# 34 (35) 84 (25) 1.57 0.93–2.61
Poultry# 32 (33) 74 (22) 1.69 0.99–2.84Rodents, rabbits# 35 (36) 76 (23) 1.87 1.11–3.12Reptiles 5 (5) 2 (1) 8.87 1.42–94.0
Touched animals(ref : not having touched thespecific animal)
Horses, ponies# 21 (21) 39 (12) 2.05 1.13–3.7Goats 13 (13) 29 (9) 1.60 0.79–3.22Dogs# 57 (58) 157 (47) 1.55 0.96–2.51
Poultry 15 (15) 30 (9) 1.82 0.93–3.55Rodents 20 (20) 39 (12) 1.93 1.06–3.5Reptiles 3 (3) 0 (0) n.a. 2.69–O
Contact with animal products
[ref. : not having had contact withspecific (group of) product(s)]
Dung, excreta 20 (20) 48 (14) 1.52 0.80–2.78
Hay or straw 31 (32) 76 (23) 1.56 0.91–2.62Hay, straw ordung#
35 (34) 87 (26) 1.45 0.87–2.37
Consumption(ref. : no consumption)
Raw milkproducts#
25 (24) 48 (14) 1.90 1.05–3.36
Visits to…
(ref. : not attended a specific event)
Children’s farm 9 (9) 12 (4) 2.70 0.97–7.21
Party or BBQin theneighbourhood
9 (9) 18 (5) 1.76 0.67–4.31
Herps Mertje#$ 52 (53) 146 (44) 1.44 0.89–2.32
Activities : horse-riding(ref. : seldom or never)
Almost daily 5 (6) 2 (1) 9.93 1.83–53.81–3 times/week 4 (5) 11 (4) 1.44 0.44–4.692–3 times/
month
2 (2) 4 (1) 1.99 0.35–11.11
<Once/month 2 (2) 1 (0) 7.94 0.70–90.5Smoking#
(ref. : never)
Current smoker# 76 (74) 206 (62) 1.72 1.03–2.93
Prior clinical conditions, medical history(ref. : no consumption of antibiotics)
Antibiotics consumption(end of April and
month of May)
14 (14) 22 (7) 2.22 1.00–4.74
1290 I. Karagiannis and others

Q FEVER OUTBREAK IN A RURAL AREA | 57
3.1
positive for all three targets and six (8%) were
positive for the IS1111 target only. Animal samples
screened included: urine, milk and vaginal swabs
from individual animals, a swab of a dead animal in
a cadaver bin and manure from stable floor. Only
urine and milk samples showed no positive results for
the presence of C. burnetii. Environmental samples
screened included straw (from stable floor), surface
swabs (floors and walls), insects (collected from a UV
lamp), and water (drinking buckets). C. burnetii was
found to be present in all types of samples, apart from
water. All positive samples originated from the same
large commercial goat farm, where an abortion wave
had occurred in April 2007.
April 2007 was a record warm and dry month in
The Netherlands, with an average temperature of
13.4 xC (4.4 xC higher than the 1977–2006 average).
Easterlies (wind direction from 45x to 135x) were the
most prominent wind direction (11 out of the 30 days
in April) and had never been so prominent during
April for at least 30 years. This may have contributed
to the spread of C. burnetii from area A to Herpen.
Control measures and other actions taken
In early 2008, while the lambing season was ongoing,
an information leaflet was distributed by regular mail
to all goat farms in Noord-Brabant, the province with
the highest goat density in the country. This included
background information about the disease in both
animals and humans and recommended preventive
and control measures to reduce spread of Coxiella,
especially during and after the lambing season. This
information was also put on several websites to
reach ruminant farmers, including sheep farmers
nationwide. Furthermore, it was agreed between the
National Public Health Institute and the Animal
Health Service (GD), which diagnose the majority of
Coxiella problems in ruminants, to communicate all
postal codes in a radius of 5 km from a newly diag-
nosed farm. This was done to help to alert physicians
in high-risk areas to consider C. burnetii for patients
with compatible symptoms. On 12 June, reporting of
Q fever symptoms in small ruminants held in deep
litter houses became notifiable for farmers and veter-
inarians, and a ban was introduced on the spreading
of manure in the 90 days following Q fever-positive
status at the farm. Finally, the outbreak triggered
several studies to assess the prevalence of C. burnetii
infections in small ruminants, their milk, the farmers,
their families and the general human population, as
well as studies on risk factors for infections in rumi-
nants and (sporadic) human cases to generate more
evidence-based control measures.
DISCUSSION
In 2007, the first community-acquired Q fever out-
break was identified in The Netherlands. The results
of the outbreak investigation suggested that the
source of the infections in the cluster area was situated
in a rural zone with eight hobby and commercial ru-
minant farms. These include three dairy cattle farms
(about 60–100 cows), one large dairy goat farm (at
least 3700 goats), one small sheep breeding farm and
three hobby farms with small numbers (<10) of goats
or sheep. Although a specific farm or meadow could
not be pinpointed, at least one large commercial goat
farm in this area was known to suffer from abortion
waves due to C. burnetii in the spring of 2007. Ideally,
more environmental samples are needed to fine-tune
the highest-risk area, which was not feasible during
the present investigation.
While all previously identified cases at the inception
of the study reported having had fever, this symptom
was reported by only a quarter of the recently infected
individuals obtained from the random population
sample. Similarly, all symptoms shown in Table 2
were systematically more frequent in the initial cases
that had been reported through the mandatory noti-
fication system. The name ‘Q fever ’ may better cor-
respond to clinical cases and should not be considered
a prerequisite when considering a C. burnetii infec-
tion.
Compared to other outbreak reports, full screening
of IgG and IgM phases 1 and 2 was performed in
order to improve diagnostic accuracy and detect past
infections. As the study was a population survey in an
outbreak setting, we used a single 1:64 dilution for
screening of the population sample in contrast to
diagnostic testing of individual clinical cases. The cut-
off is a balance between increasing/decreasing sensi-
tivity vs. decreasing/increasing specificity, which will
thereby influence the positive and negative predictive
value, which is further dependent on the prevalence in
the study population; the latter is expected to be
relatively high in an outbreak setting. There is a
lack of standardization in interpretation of serology
results [18]. The choice of 1:64 dilution is further
justified by our current experience with the 2008
outbreak, which is still under investigation. Finally,
IFA results of, among others, outbreak sera were
Q fever emerging in The Netherlands 1289
Table 3. Results of the univariate and multivariable analyses of the case-control study for acquisition
of C. burnetii infection in the cluster area, 2007
Cases
(N=103)*n (%)
Controls
(N=332)n (%) OR 95% CI
Univariate analysis
Age category (years)# f45 41 (40) 78 (23) 2.57 1.35–4.91
(ref. : >62 years) 46–61 42 (41) 158 (48) 1.24 0.67–2.35Sex#(ref. : female)
Male 68 (66) 215 (65) 1.06 0.66–1.68
Working condition >32 h/week# 49 (52) 142 (43) 1.77 1.01–3.12(ref. : not working) 20–31 h/week 8 (8) 28 (9) 1.47 0.59–3.66
12–19 h/week 8 (8) 24 (7) 1.71 0.68–4.33
<12 h/week 8 (8) 21 (6) 1.96 0.76–5.02Work industry(ref. : other than food preparation,animal care, meat treatment, agricultural
sector, wool and leather treatment)
Food preparation 5 (7) 5 (2) 3.18 0.88–11.5Animal care 3 (5) 1 (1) 9.55 0.95–96.3
Possession of animals(ref. : no possession of a specific animal)
Dogs# 45 (46) 115 (35) 1.60 0.99–2.59Pigs 4 (4) 3 (1) 4.67 0.77–32.3
Possession of animals(ref : possession of any animal)
No# 28 (29) 127 (38) 0.65 0.38–1.08
Contact with animals
(ref : no contact with any animal)
With other people’s
animals#
49 (50) 128 (39) 1.59 0.99–2.57
Contact with animals(ref : contact with any animal)
No contact withany animal#
21 (21) 102 (31) 0.61 0.34–1.07
Seen animals (<5 m)
(ref : not having seen a specific animal)
(Wild) birds# 30 (31) 76 (23) 1.49 0.87–2.51
Sheep# 23 (23) 59 (18) 1.42 0.78–2.51Goats# 33 (34) 73 (22) 1.80 1.06–3.02Horses, ponies# 34 (35) 84 (25) 1.57 0.93–2.61
Poultry# 32 (33) 74 (22) 1.69 0.99–2.84Rodents, rabbits# 35 (36) 76 (23) 1.87 1.11–3.12Reptiles 5 (5) 2 (1) 8.87 1.42–94.0
Touched animals(ref : not having touched thespecific animal)
Horses, ponies# 21 (21) 39 (12) 2.05 1.13–3.7Goats 13 (13) 29 (9) 1.60 0.79–3.22Dogs# 57 (58) 157 (47) 1.55 0.96–2.51
Poultry 15 (15) 30 (9) 1.82 0.93–3.55Rodents 20 (20) 39 (12) 1.93 1.06–3.5Reptiles 3 (3) 0 (0) n.a. 2.69–O
Contact with animal products
[ref. : not having had contact withspecific (group of) product(s)]
Dung, excreta 20 (20) 48 (14) 1.52 0.80–2.78
Hay or straw 31 (32) 76 (23) 1.56 0.91–2.62Hay, straw ordung#
35 (34) 87 (26) 1.45 0.87–2.37
Consumption(ref. : no consumption)
Raw milkproducts#
25 (24) 48 (14) 1.90 1.05–3.36
Visits to…
(ref. : not attended a specific event)
Children’s farm 9 (9) 12 (4) 2.70 0.97–7.21
Party or BBQin theneighbourhood
9 (9) 18 (5) 1.76 0.67–4.31
Herps Mertje#$ 52 (53) 146 (44) 1.44 0.89–2.32
Activities : horse-riding(ref. : seldom or never)
Almost daily 5 (6) 2 (1) 9.93 1.83–53.81–3 times/week 4 (5) 11 (4) 1.44 0.44–4.692–3 times/
month
2 (2) 4 (1) 1.99 0.35–11.11
<Once/month 2 (2) 1 (0) 7.94 0.70–90.5Smoking#
(ref. : never)
Current smoker# 76 (74) 206 (62) 1.72 1.03–2.93
Prior clinical conditions, medical history(ref. : no consumption of antibiotics)
Antibiotics consumption(end of April and
month of May)
14 (14) 22 (7) 2.22 1.00–4.74
1290 I. Karagiannis and others

58 | CHAPTER 3.1
compared with results of two commercially available
ELISAs, and showed that the ELISAs had a lower
sensitivity compared to IFA and that the IFA showed
no substantial cross-reactivity (P. Schneeberger, per-
sonal communication).
Rodolakis et al. [19] showed that goats excreted
C. burnetii primarily in milk, and that sheep shed the
bacteria primarily in faeces and vaginal mucus. Our
results showed that goats also shed C. burnetii in
faeces and vaginal mucus, which is in agreement with
their observations that human Q fever cases are
more often related to ovine (in our case caprine) than
bovine flocks affected by Q fever. We found no C. bur-
netii presence in the milk samples, but the number of
milk samples screened (four) was too small for a valid
comparison with other studies.
Weather conditions in April 2007 were favourable
for the spread of C. burnetii. The unseasonably warm
and dry weather conditions, in addition to an un-
usually easterly component in wind direction, prob-
ably contributed to a wide spread of aerosols from
contaminated farms to nearby residential areas. Daily
maximum temperatures were up to 15 xC higher than
the average for April and hardly any precipitation had
fallen during that month. The predominant wind di-
rection was also in agreement with the location of
area A.
The role of windborne spread is also indirectly sup-
ported by the lack of a gender difference in cases in the
case-control study. Usually, more males are infected,
mainly through occupational exposure. A windborne
spread would not give a preference for either females
or males; an even sex distribution was indeed ob-
served in the outbreak discussed here.
Only 39/98 cases (39.8%) reported direct contact
with, possibly contaminated, agricultural products
such as manure, hay and straw. However, contact
with hay or straw can cause aerosols and by that
contaminate a wide environment. This may explain
why no particular common exposures were found by
the previously performed hypothesis-generating in-
terviews targeted at the cases diagnosed in the regular
medical circuit, which preceded this epidemiological
outbreak investigation.
As stated in the first brief outbreak report [14], the
initial hypothesis was that the increase in pneumonia
cases was caused by Mycoplasma pneumoniae. As
Q fever is a relatively rarely notified disease in The
Netherlands, clinicians usually do not test for C. bur-
netii infection in patients with an atypical pneumonia.
Consequently, small or diffuse clusters of cases might
easily be missed. This outbreak clearly stresses the
added value of early warning by physicians based
on the clinical picture only. Therefore, reporting of
Table 3 (cont.)
Cases
(N=103)*n (%)
Controls
(N=332)n (%) OR 95% CI
Distance from residence togoat farm (m)
Distance to farm No. 4# 0.999 P=0.033Distance to farm No. 13# 0.999 P=0.013
Distance to farm No. 14# 0.999 P=0.002Distance to farm No. 15# 0.999 P=0.017
Multivariable analysis (n=430: 98
cases, 332 controls)
Smoking(ref. : never smoked)
Currentsmoker
2.14 1.17–3.90
Contact with hay, straw, dung
(ref. : no)
Yes 1.69 1.03–2.80
Distance to farm (m)· No. 14 0.999 P=0.001
OR, Odds ratio ; CI, confidence interval ; n.a., not available.* Ninety-eight for analysis of risk factors obtained from the questionnaire. Because distance to farm No. 14 was calculated
with GIS software, this information was available for all 103 cases as residence address was also known for the five non-respondents.# Variables included in the multivariable model before backward elimination.$ Large annual open-air market with among others small ruminants as part of a mobile pet farm.
· Distance to farm No. 14 could be replaced by either one of four adjacent postal codes, with almost equal results for themodel. Therefore, it was assumed that farm 14 was not uniquely associated with recent infections. It should be noted thatodds ratios should be interpreted as living further away from the farm is protective.
Q fever emerging in The Netherlands 1291
unusual numbers of cases with common symptoms to
the local health authorities is strongly encouraged.
The higher numbers of Q fever cases notified in the
second half of 2007 (Fig. 1) and first quarter of 2008
may be partly attributable to the raised awareness
among clinicians and increased diagnostic testing at
laboratories following the outbreak.
Contact with animals and consumption of raw milk
products were not significant risk factors in the mul-
tivariable analysis of our study. In theory, this could
have been because inhabitants residing closer to area
A tended to have more contact with animals. How-
ever, a closer inspection of our data showed no in-
teraction between distance of residence to area A and
contact with animals. Thomas and colleagues showed
that exposure to cattle (but not sheep), cats, raw milk
and hay, all reported sources of Q fever, are as-
sociated with C. burnetii IgG by univariate analysis,
but this association was not independent from animal
contact [20].
No information on possible general exposures in
the past was available from the present study. In-
dividuals with a past infection were older than recent
cases, which could represent the cumulative risk for
acquiring a C. burnetii infection. This group worked
more frequently in the agricultural (11.1% vs. 2.8%)
and meat-handling (7.4% vs. 1.4%) sector than re-
cent cases, but these differences were not statistically
significant.
Smoking was found to be an important risk factor
for the acquisition of a C. burnetii infection. A poss-
ible explanation could be outdoor smoking habits,
resulting in smokers being more exposed to outdoor
contaminated aerosols than non-smokers. No infor-
mation on smoking habits was collected to confirm
this. Alternatively, smoking might represent an in-
creased risk by more hand–mouth contact or an in-
creased risk for respiratory infections in general
because of alterations in structural and immune de-
fences, as suggested by others [21]. Smoking was not
associated with development of symptoms in sero-
positive participants in the present study, although
a slight tendency towards more symptoms for smok-
ers was observed. In contrast, McCaughey and
colleagues in a study in Northern Ireland concluded
that smoking was not a significant risk factor for
the acquisition of infection, but suggested that it was
only associated with developing symptomatic disease
[22]. No clear explanation can be given for this dis-
crepant result, but different laboratory tests were
used and sera in the study in Northern Ireland were
20 years old. Moreover, that study [22] refers to
general population sera, where the infection risk
is multifactoral and scattered in place and time, while
the present study is targeted at an outbreak setting
with an overall more homogeneous risk of exposure.
The present study shows that small ruminants were
most likely responsible for the outbreak. This group
of animals has been implicated in Q fever outbreaks
previously [5, 7, 23–25]. It should also be noted that
contact with one’s own animals was not found to be a
significant risk factor in the present study, which
might assume partial immunity. The percentage of a
past Q fever infection was 10.6% in those who had
animals and 4.5% in those who did not. The goat
density in the south of the country is the highest
(about 38.1 goats/km2 while the national average is
9.2 goats/km2) and the goat population is still in-
creasing. Public health education and control meas-
ures are, hence, of great importance to avoid future
similar outbreaks.
Although not included in the final model, some of
the significant univariate associations deserve further
attention, as they might have played an intermediate
or minor role in the outbreak. Having touched horses
and ponies and frequent horse-riding are among these
possible risk factors, associated only univariately.
This may either indicate Q fever being transmitted
from an infected horse, as Coxiella infection in horses
has been documented previously [26], or the activities
related to horse-riding such as cleaning stables,
handling straw or hay and brushing the crest might
have lead to exposure to contaminated dust or air
from the environment. Second, having seen rodents,
rabbits and reptiles was univariately found to be as-
sociated with Q fever, although the latter was re-
ported by a very small group of cases only. This is of
particular interest as Q fever has been shown to be
rodent-associated in some cases [27]. In further ana-
lyses, having seen rodents, including rabbits, was
strongly associated with having had contact with un-
handled animal products, such as hay, straw or dung;
of those that had contact with these animal products,
84.6% had also seen rodents in the recall period.
Adjusted for age and sex, having seen rodents had a
positive interaction with distance from ‘area A’ (OR
1.001, 95% CI 1.000–1.002). Interestingly, this seems
to suggest that windborne transmission was most
likely for those living in proximity to ‘area A’, while
rodents, possibly infected through the environment
near area A, might have facilitated the transmission
beyond the reach of the wind.
1292 I. Karagiannis and others

Q FEVER OUTBREAK IN A RURAL AREA | 59
3.1
compared with results of two commercially available
ELISAs, and showed that the ELISAs had a lower
sensitivity compared to IFA and that the IFA showed
no substantial cross-reactivity (P. Schneeberger, per-
sonal communication).
Rodolakis et al. [19] showed that goats excreted
C. burnetii primarily in milk, and that sheep shed the
bacteria primarily in faeces and vaginal mucus. Our
results showed that goats also shed C. burnetii in
faeces and vaginal mucus, which is in agreement with
their observations that human Q fever cases are
more often related to ovine (in our case caprine) than
bovine flocks affected by Q fever. We found no C. bur-
netii presence in the milk samples, but the number of
milk samples screened (four) was too small for a valid
comparison with other studies.
Weather conditions in April 2007 were favourable
for the spread of C. burnetii. The unseasonably warm
and dry weather conditions, in addition to an un-
usually easterly component in wind direction, prob-
ably contributed to a wide spread of aerosols from
contaminated farms to nearby residential areas. Daily
maximum temperatures were up to 15 xC higher than
the average for April and hardly any precipitation had
fallen during that month. The predominant wind di-
rection was also in agreement with the location of
area A.
The role of windborne spread is also indirectly sup-
ported by the lack of a gender difference in cases in the
case-control study. Usually, more males are infected,
mainly through occupational exposure. A windborne
spread would not give a preference for either females
or males; an even sex distribution was indeed ob-
served in the outbreak discussed here.
Only 39/98 cases (39.8%) reported direct contact
with, possibly contaminated, agricultural products
such as manure, hay and straw. However, contact
with hay or straw can cause aerosols and by that
contaminate a wide environment. This may explain
why no particular common exposures were found by
the previously performed hypothesis-generating in-
terviews targeted at the cases diagnosed in the regular
medical circuit, which preceded this epidemiological
outbreak investigation.
As stated in the first brief outbreak report [14], the
initial hypothesis was that the increase in pneumonia
cases was caused by Mycoplasma pneumoniae. As
Q fever is a relatively rarely notified disease in The
Netherlands, clinicians usually do not test for C. bur-
netii infection in patients with an atypical pneumonia.
Consequently, small or diffuse clusters of cases might
easily be missed. This outbreak clearly stresses the
added value of early warning by physicians based
on the clinical picture only. Therefore, reporting of
Table 3 (cont.)
Cases
(N=103)*n (%)
Controls
(N=332)n (%) OR 95% CI
Distance from residence togoat farm (m)
Distance to farm No. 4# 0.999 P=0.033Distance to farm No. 13# 0.999 P=0.013
Distance to farm No. 14# 0.999 P=0.002Distance to farm No. 15# 0.999 P=0.017
Multivariable analysis (n=430: 98
cases, 332 controls)
Smoking(ref. : never smoked)
Currentsmoker
2.14 1.17–3.90
Contact with hay, straw, dung
(ref. : no)
Yes 1.69 1.03–2.80
Distance to farm (m)· No. 14 0.999 P=0.001
OR, Odds ratio ; CI, confidence interval ; n.a., not available.* Ninety-eight for analysis of risk factors obtained from the questionnaire. Because distance to farm No. 14 was calculated
with GIS software, this information was available for all 103 cases as residence address was also known for the five non-respondents.# Variables included in the multivariable model before backward elimination.$ Large annual open-air market with among others small ruminants as part of a mobile pet farm.
· Distance to farm No. 14 could be replaced by either one of four adjacent postal codes, with almost equal results for themodel. Therefore, it was assumed that farm 14 was not uniquely associated with recent infections. It should be noted thatodds ratios should be interpreted as living further away from the farm is protective.
Q fever emerging in The Netherlands 1291
unusual numbers of cases with common symptoms to
the local health authorities is strongly encouraged.
The higher numbers of Q fever cases notified in the
second half of 2007 (Fig. 1) and first quarter of 2008
may be partly attributable to the raised awareness
among clinicians and increased diagnostic testing at
laboratories following the outbreak.
Contact with animals and consumption of raw milk
products were not significant risk factors in the mul-
tivariable analysis of our study. In theory, this could
have been because inhabitants residing closer to area
A tended to have more contact with animals. How-
ever, a closer inspection of our data showed no in-
teraction between distance of residence to area A and
contact with animals. Thomas and colleagues showed
that exposure to cattle (but not sheep), cats, raw milk
and hay, all reported sources of Q fever, are as-
sociated with C. burnetii IgG by univariate analysis,
but this association was not independent from animal
contact [20].
No information on possible general exposures in
the past was available from the present study. In-
dividuals with a past infection were older than recent
cases, which could represent the cumulative risk for
acquiring a C. burnetii infection. This group worked
more frequently in the agricultural (11.1% vs. 2.8%)
and meat-handling (7.4% vs. 1.4%) sector than re-
cent cases, but these differences were not statistically
significant.
Smoking was found to be an important risk factor
for the acquisition of a C. burnetii infection. A poss-
ible explanation could be outdoor smoking habits,
resulting in smokers being more exposed to outdoor
contaminated aerosols than non-smokers. No infor-
mation on smoking habits was collected to confirm
this. Alternatively, smoking might represent an in-
creased risk by more hand–mouth contact or an in-
creased risk for respiratory infections in general
because of alterations in structural and immune de-
fences, as suggested by others [21]. Smoking was not
associated with development of symptoms in sero-
positive participants in the present study, although
a slight tendency towards more symptoms for smok-
ers was observed. In contrast, McCaughey and
colleagues in a study in Northern Ireland concluded
that smoking was not a significant risk factor for
the acquisition of infection, but suggested that it was
only associated with developing symptomatic disease
[22]. No clear explanation can be given for this dis-
crepant result, but different laboratory tests were
used and sera in the study in Northern Ireland were
20 years old. Moreover, that study [22] refers to
general population sera, where the infection risk
is multifactoral and scattered in place and time, while
the present study is targeted at an outbreak setting
with an overall more homogeneous risk of exposure.
The present study shows that small ruminants were
most likely responsible for the outbreak. This group
of animals has been implicated in Q fever outbreaks
previously [5, 7, 23–25]. It should also be noted that
contact with one’s own animals was not found to be a
significant risk factor in the present study, which
might assume partial immunity. The percentage of a
past Q fever infection was 10.6% in those who had
animals and 4.5% in those who did not. The goat
density in the south of the country is the highest
(about 38.1 goats/km2 while the national average is
9.2 goats/km2) and the goat population is still in-
creasing. Public health education and control meas-
ures are, hence, of great importance to avoid future
similar outbreaks.
Although not included in the final model, some of
the significant univariate associations deserve further
attention, as they might have played an intermediate
or minor role in the outbreak. Having touched horses
and ponies and frequent horse-riding are among these
possible risk factors, associated only univariately.
This may either indicate Q fever being transmitted
from an infected horse, as Coxiella infection in horses
has been documented previously [26], or the activities
related to horse-riding such as cleaning stables,
handling straw or hay and brushing the crest might
have lead to exposure to contaminated dust or air
from the environment. Second, having seen rodents,
rabbits and reptiles was univariately found to be as-
sociated with Q fever, although the latter was re-
ported by a very small group of cases only. This is of
particular interest as Q fever has been shown to be
rodent-associated in some cases [27]. In further ana-
lyses, having seen rodents, including rabbits, was
strongly associated with having had contact with un-
handled animal products, such as hay, straw or dung;
of those that had contact with these animal products,
84.6% had also seen rodents in the recall period.
Adjusted for age and sex, having seen rodents had a
positive interaction with distance from ‘area A’ (OR
1.001, 95% CI 1.000–1.002). Interestingly, this seems
to suggest that windborne transmission was most
likely for those living in proximity to ‘area A’, while
rodents, possibly infected through the environment
near area A, might have facilitated the transmission
beyond the reach of the wind.
1292 I. Karagiannis and others

60 | CHAPTER 3.1
Our study had several limitations which need
attention. Participants were asked about possible
exposures that had taken place 5 months before.
Consequently, some participants may have answered
based on their usual habits rather than their behav-
iour in the time period they were asked about. How-
ever, we believe that recall bias did not occur, as our
analysis was restricted to a population sample which
included mainly cases with milder symptoms. More-
over, self-reported symptoms might have been under-
reported, especially the ones that are mild and
non-specific, although the proportion of asymptomatic
infected individuals was quite similar to others [1].
Just before and during our study, media reports
were released promoting the idea of goats being a
plausible cause of the outbreak (Q fever was called
‘goat flu’). We were expecting a priori that this would
cause reporting bias for questions about goats.
However, univariately, not only contact with goats
but also with other ruminants were associated with
infection and both subjectively calculated distances of
their residence to goat farms and GIS-based distances
were associated with infection. In the present study,
only the latter objective distances were used in the
multivariable analyses.
This first documented outbreak of Q fever in The
Netherlands received plenty of attention from both
the public health and the veterinary authorities. It
was an excellent chance for these parties to cooperate
with each other and facilitate long-term communi-
cation channels. Further, it was a unique opportunity
to test and improve diagnostic assays for C. burnetii
in humans, animals and environmental samples.
Unfortunately, immediate implementation of con-
trol measures was hampered because of the fail-
ure to identify the exact source of the outbreak. In
future similar outbreaks, an earlier start of the epi-
demiological investigation combined with more in-
tensive environmental sampling should improve the
quality of data, provide more detailed exposure and
contamination data and, by that, enhance adequate
control.
ACKNOWLEDGEMENTS
Financial support for this study was provided by
ZonMW, The Netherlands Organization for Health
Research and Development, which is predominantly
funded by the Ministry of Health, Welfare and Sport
(VWS) and The Netherlands Organization for Scient-
ific Research (NWO). We thank Frederika Dijkstra
for providing surveillance data and assistance during
the preparation of the study; all staff from the
Municipal Health Authority (GGD) ‘Hart voor
Brabant’ for their help in collecting sera and question-
naires of participants and responding to questions
following study results ; Maurice Hamans, Peter
Wielinga and Jasper Bok for sampling at the two
goat farms; the municipality of Oss for their help in
the mailing of the eligible study population; Ineke
Weers-Pothoff for testing the sera of all participants ;
Daan Notermans for his helpful comments on the
manuscript ; Laurens Zwakhals for providing the
maps; Barbora Kostalova for providing constantly
updated maps in the course of the outbreak; Olaf
Stenvers, for his help in communication between pub-
lic health and veterinary parties and for providing
data on ruminant farms in the cluster area.
DECLARATION OF INTEREST
None.
REFERENCES
1. Raoult D, Marrie TJ, Mege JL. Natural history andpathophysiology of Q fever. Lancet Infectious Diseases2005; 5 : 219–226.
2. Pinsky RL, et al. An outbreak of cat-associated Q feverin the United States. Journal of Infectious Diseases1991; 164 : 202–204.
3. Marrie TJ, et al. An outbreak of Q fever probably dueto contact with a parturient cat.Chest 1988; 93 : 98–103.
4. Stein A, Raoult D. Pigeon pneumonia in Provence : a
bird-borne Q fever outbreak. Clinical Infectious Dis-eases 1999; 29 : 617–620.
5. Lyttikainen O, et al. An outbreak of sheep-associated Q
fever in a rural community in Germany. EuropeanJournal of Epidemiology 1998; 14 :193–199.
6. Pedogy RG, et al. Epidemiological features of Cox-iella burnetii infection in England and Wales : 1984 to
1994. Communicable Disease Report 1995; 6 : 128–132.7. Sawyer LA, Fishbein DB, McDade JE. Q fever : Current
concepts. Reviews of Infectious Diseases 1987; 5 : 935–
946.8. Grilc E, et al. Outbreak of Q fever among a group of
high school students in Slovenia, March–April 2007.
Eurosurveillance 2007; 12(7) : E070719.1 (http://www.eurosurveillance.org/ew/2007/070719.asp#1).
9. Richardus JH, et al. Q fever in the Netherlands : a sero-epidemiological survey among human population
groups from 1968 to 1983. Epidemiology and Infection1987; 98 : 211–219.
10. Robert Koch Institut. Large Q fever outbreak in Jena,
June 2005 [in German]. Epidemiologisches Bulletin2006; 45 : 391–398 (http://www.gpk.de/downloadp/STIKO_Bulletin45_061110_Q_Fieber2005.pdf).
Q fever emerging in The Netherlands 1293
11. Porten K, et al. A super-spreading ewe infects hundredswith Q fever at a farmers’ market in Germany. BMC
Infectious Diseases 2006; 6 : 147.12. Orr HJ, et al. Case-control study for risk factors
for Q Fever in southwest England and Northern
Ireland. Eurosurveillance 2006; 11(10) (http://www.eurosurveillance.org/ViewArticle.aspx?ArticleId=655).
13. van Lier EA, Rahamat-Langendoen JC, van Vliet JA.
State of infectious diseases in The Netherlands 2006 [in
Dutch]. RIVM Rapport 210211002/2007.14. Karagiannis I, et al. A Q fever outbreak in the Nether-
lands : a preliminary report. Eurosurveillance 2007;
12 : 3247 (http://www.eurosurveillance.org/ViewArticle.aspx?ArticleId=3247).
15. van Steenbergen JE, et al. An outbreak of Q fever in
the Netherlands – possible link to goats [in Dutch].Nederlandse Tijdschrift voor Geneeskunde 2007; 151 :1998–2003.
16. Klee SR, et al. Highly sensitive real-time PCR for spe-cific detection and quantification of Coxiella burnetii.BMC Microbiology 2006; 19 : 2.
17. Zhang GQ, et al. Clinical evaluation of a new PCR as-
say for detection of Coxiella burnetii in human serumsamples. Journal of Clinical Microbiology 1998; 36 :77–80.
18. Schimmer B, et al. Authors reply : Q fever in theNetherlands – what matters is seriousness of diseaserather than quantity. Eurosurveillance 2008; 13 : 18976
(http://www.eurosurveillance.org/ViewArticle.aspx?ArticleId=18976).
19. Rodolakis A, et al. Comparison of Coxiella bur-netii shedding in milk of dairy bovine, caprine and
ovine herds. Journal of Dairy Sciences 2007; 90 : 5352–5360.
20. Thomas DR, et al. The risk of acquiring Q fever on
farms : a seroepidemiological study. Occupational andEnvironmental Medicine 1995; 52 : 644–647.
21. Carolan BJ, et al.Decreased expression of intelectin 1 inthe human airway epithelium of smokers compared to
nonsmokers. Journal of Immunology 2008; 181 : 5760–5767.
22. McCaughey C, et al. Human seroprevalence to C. bur-
netii (Q fever) in Northern Ireland. Zoonoses and PublicHealth 2008; 55 : 189–194.
23. Australian Broadcasting Company. Q fever – Austra-
lia (South Australia) : Abattoir. ProMed. 13 July,2007 (http://www.promedmail.org), archive number :20070713.2244.
24. Hatchette TF, et al. Goat-associated Q fever : a newdisease in Newfoundland. Emerging Infectious Diseases2001; 7 : 413–419.
25. Bamberg WM, et al. Outbreak of Q fever associated
with a horse-boarding ranch, Colorado, 2005. VectorBorne Zoonotic Diseases 2007; 7 : 394–402.
26. George J, Marrie TJ. Serological evidence of Coxiella
burnetii infection in horses in Atlantic Canada. Ca-nadian Veterinary Journal 1987; 28 : 425–426.
27. Gardon J, et al. Suburban transmission of Q fever in
French Guiana: evidence of a wild reservoir. Journal ofInfectious Diseases 2001; 184 : 278–284.
1294 I. Karagiannis and others

Q FEVER OUTBREAK IN A RURAL AREA | 61
3.1
Our study had several limitations which need
attention. Participants were asked about possible
exposures that had taken place 5 months before.
Consequently, some participants may have answered
based on their usual habits rather than their behav-
iour in the time period they were asked about. How-
ever, we believe that recall bias did not occur, as our
analysis was restricted to a population sample which
included mainly cases with milder symptoms. More-
over, self-reported symptoms might have been under-
reported, especially the ones that are mild and
non-specific, although the proportion of asymptomatic
infected individuals was quite similar to others [1].
Just before and during our study, media reports
were released promoting the idea of goats being a
plausible cause of the outbreak (Q fever was called
‘goat flu’). We were expecting a priori that this would
cause reporting bias for questions about goats.
However, univariately, not only contact with goats
but also with other ruminants were associated with
infection and both subjectively calculated distances of
their residence to goat farms and GIS-based distances
were associated with infection. In the present study,
only the latter objective distances were used in the
multivariable analyses.
This first documented outbreak of Q fever in The
Netherlands received plenty of attention from both
the public health and the veterinary authorities. It
was an excellent chance for these parties to cooperate
with each other and facilitate long-term communi-
cation channels. Further, it was a unique opportunity
to test and improve diagnostic assays for C. burnetii
in humans, animals and environmental samples.
Unfortunately, immediate implementation of con-
trol measures was hampered because of the fail-
ure to identify the exact source of the outbreak. In
future similar outbreaks, an earlier start of the epi-
demiological investigation combined with more in-
tensive environmental sampling should improve the
quality of data, provide more detailed exposure and
contamination data and, by that, enhance adequate
control.
ACKNOWLEDGEMENTS
Financial support for this study was provided by
ZonMW, The Netherlands Organization for Health
Research and Development, which is predominantly
funded by the Ministry of Health, Welfare and Sport
(VWS) and The Netherlands Organization for Scient-
ific Research (NWO). We thank Frederika Dijkstra
for providing surveillance data and assistance during
the preparation of the study; all staff from the
Municipal Health Authority (GGD) ‘Hart voor
Brabant’ for their help in collecting sera and question-
naires of participants and responding to questions
following study results ; Maurice Hamans, Peter
Wielinga and Jasper Bok for sampling at the two
goat farms; the municipality of Oss for their help in
the mailing of the eligible study population; Ineke
Weers-Pothoff for testing the sera of all participants ;
Daan Notermans for his helpful comments on the
manuscript ; Laurens Zwakhals for providing the
maps; Barbora Kostalova for providing constantly
updated maps in the course of the outbreak; Olaf
Stenvers, for his help in communication between pub-
lic health and veterinary parties and for providing
data on ruminant farms in the cluster area.
DECLARATION OF INTEREST
None.
REFERENCES
1. Raoult D, Marrie TJ, Mege JL. Natural history andpathophysiology of Q fever. Lancet Infectious Diseases2005; 5 : 219–226.
2. Pinsky RL, et al. An outbreak of cat-associated Q feverin the United States. Journal of Infectious Diseases1991; 164 : 202–204.
3. Marrie TJ, et al. An outbreak of Q fever probably dueto contact with a parturient cat.Chest 1988; 93 : 98–103.
4. Stein A, Raoult D. Pigeon pneumonia in Provence : a
bird-borne Q fever outbreak. Clinical Infectious Dis-eases 1999; 29 : 617–620.
5. Lyttikainen O, et al. An outbreak of sheep-associated Q
fever in a rural community in Germany. EuropeanJournal of Epidemiology 1998; 14 :193–199.
6. Pedogy RG, et al. Epidemiological features of Cox-iella burnetii infection in England and Wales : 1984 to
1994. Communicable Disease Report 1995; 6 : 128–132.7. Sawyer LA, Fishbein DB, McDade JE. Q fever : Current
concepts. Reviews of Infectious Diseases 1987; 5 : 935–
946.8. Grilc E, et al. Outbreak of Q fever among a group of
high school students in Slovenia, March–April 2007.
Eurosurveillance 2007; 12(7) : E070719.1 (http://www.eurosurveillance.org/ew/2007/070719.asp#1).
9. Richardus JH, et al. Q fever in the Netherlands : a sero-epidemiological survey among human population
groups from 1968 to 1983. Epidemiology and Infection1987; 98 : 211–219.
10. Robert Koch Institut. Large Q fever outbreak in Jena,
June 2005 [in German]. Epidemiologisches Bulletin2006; 45 : 391–398 (http://www.gpk.de/downloadp/STIKO_Bulletin45_061110_Q_Fieber2005.pdf).
Q fever emerging in The Netherlands 1293
11. Porten K, et al. A super-spreading ewe infects hundredswith Q fever at a farmers’ market in Germany. BMC
Infectious Diseases 2006; 6 : 147.12. Orr HJ, et al. Case-control study for risk factors
for Q Fever in southwest England and Northern
Ireland. Eurosurveillance 2006; 11(10) (http://www.eurosurveillance.org/ViewArticle.aspx?ArticleId=655).
13. van Lier EA, Rahamat-Langendoen JC, van Vliet JA.
State of infectious diseases in The Netherlands 2006 [in
Dutch]. RIVM Rapport 210211002/2007.14. Karagiannis I, et al. A Q fever outbreak in the Nether-
lands : a preliminary report. Eurosurveillance 2007;
12 : 3247 (http://www.eurosurveillance.org/ViewArticle.aspx?ArticleId=3247).
15. van Steenbergen JE, et al. An outbreak of Q fever in
the Netherlands – possible link to goats [in Dutch].Nederlandse Tijdschrift voor Geneeskunde 2007; 151 :1998–2003.
16. Klee SR, et al. Highly sensitive real-time PCR for spe-cific detection and quantification of Coxiella burnetii.BMC Microbiology 2006; 19 : 2.
17. Zhang GQ, et al. Clinical evaluation of a new PCR as-
say for detection of Coxiella burnetii in human serumsamples. Journal of Clinical Microbiology 1998; 36 :77–80.
18. Schimmer B, et al. Authors reply : Q fever in theNetherlands – what matters is seriousness of diseaserather than quantity. Eurosurveillance 2008; 13 : 18976
(http://www.eurosurveillance.org/ViewArticle.aspx?ArticleId=18976).
19. Rodolakis A, et al. Comparison of Coxiella bur-netii shedding in milk of dairy bovine, caprine and
ovine herds. Journal of Dairy Sciences 2007; 90 : 5352–5360.
20. Thomas DR, et al. The risk of acquiring Q fever on
farms : a seroepidemiological study. Occupational andEnvironmental Medicine 1995; 52 : 644–647.
21. Carolan BJ, et al.Decreased expression of intelectin 1 inthe human airway epithelium of smokers compared to
nonsmokers. Journal of Immunology 2008; 181 : 5760–5767.
22. McCaughey C, et al. Human seroprevalence to C. bur-
netii (Q fever) in Northern Ireland. Zoonoses and PublicHealth 2008; 55 : 189–194.
23. Australian Broadcasting Company. Q fever – Austra-
lia (South Australia) : Abattoir. ProMed. 13 July,2007 (http://www.promedmail.org), archive number :20070713.2244.
24. Hatchette TF, et al. Goat-associated Q fever : a newdisease in Newfoundland. Emerging Infectious Diseases2001; 7 : 413–419.
25. Bamberg WM, et al. Outbreak of Q fever associated
with a horse-boarding ranch, Colorado, 2005. VectorBorne Zoonotic Diseases 2007; 7 : 394–402.
26. George J, Marrie TJ. Serological evidence of Coxiella
burnetii infection in horses in Atlantic Canada. Ca-nadian Veterinary Journal 1987; 28 : 425–426.
27. Gardon J, et al. Suburban transmission of Q fever in
French Guiana: evidence of a wild reservoir. Journal ofInfectious Diseases 2001; 184 : 278–284.
1294 I. Karagiannis and others

CHAPTER 3.2
The use of a geographic information system to identtifya dairy goat farm as the most likely source
of an urban Q fever outbreak
B. SchimmerR. ter Schegget
M. WegdamL. Züchner
A. de BruinP.M. Schneeberger
T. VeenstraP. Vellema
W. van der Hoek
BMC Infect Dis. 2010 Mar 16;10:69

CHAPTER 3.2
The use of a geographic information system to identifya dairy goat farm as the most likely source
of an urban Q fever outbreak
B. SchimmerR. ter Schegget
M. WegdamL. Züchner
A. de BruinP.M. Schneeberger
T. VeenstraP. Vellema
W. van der Hoek
BMC Infect Dis. 2010 Mar 16;10:69

Time-course of antibody responses against Coxiella burnetiifollowing acute Q fever
P. F. M. TEUNIS 1,2*, B. SCHIMMER 1, D. W. NOTERMANS3,
A. C. A. P. LEENDERS 4, P. C. WEVER 4, M. E. E. KRETZSCHMAR1,5
AND P. M. SCHNEEBERGER 4
1 Centre for Infectious Disease Control, Epidemiology and Surveillance Unit, RIVM, Bilthoven, The Netherlands2 Hubert Department of Global Health, Rollins School of Public Health, Emory University, Atlanta, GA, USA3 Centre for Infectious Disease Control, Laboratory for Infectious Diseases and Perinatal Screening, RIVM,Bilthoven, The Netherlands4 Jeroen Bosch Hospital, Department of Medical Microbiology and Infection Control,’s- Hertogenbosch, TheNetherlands5 Julius Centre for Health Sciences and Primary Care, University Medical Centre Utrecht, Utrecht, The
Netherlands
Received 11 October 2011; Final revision 15 February 2012; Accepted 15 February 2012;
first published online 4 April 2012
SUMMARY
Large outbreaks of Q fever in The Netherlands have provided a unique opportunity for studying
longitudinal serum antibody responses in patients. Results are presented of a cohort of 344
patients with acute symptoms of Q fever with three or more serum samples per patient. In all
these serum samples IgM and IgG against phase 1 and 2 Coxiella burnetii were measured by an
immunofluorescence assay. A mathematical model of the dynamic interaction of serum antibodies
and pathogens was used in a mixed model framework to quantitatively analyse responses to
C. burnetii infection. Responses show strong heterogeneity, with individual serum antibody
responses widely different in magnitude and shape. Features of the response, peak titre and decay
rate, are used to characterize the diversity of the observed responses. Binary mixture analysis of
IgG peak levels (phases 1 and 2) reveals a class of patients with high IgG peak titres that decay
slowly and may represent potential chronic cases. When combining the results of mixture analysis
into an odds score, it is concluded that not only high IgG phase 1 may be predictive for chronic
Q fever, but also that high IgG phase 2 may aid in detecting such putative chronic cases.
Key words: Coxiella, mathematical modelling, Q fever, serology, statistics.
INTRODUCTION
Since mid-2007 human cases of Q fever in The
Netherlands have increased sharply, with major out-
breaks in 2008 and 2009, reaching a total of about
4000 cases by 2010 [1–4]. Cases were predominantly
clustered in the south of The Netherlands [3] and the
majority of the laboratory samples were submitted
to one regional hospital : the Jeroen Bosch Hospital
in ’s-Hertogenbosch (about 2000 confirmed acute
Q fever cases). Follow-up of cases extended over a
period of up to 24 months. In the 3 years that this
outbreak persisted, laboratory results from over 2000
cases were collected in a laboratory database. This
* Author for correspondence : Professor P. F. M. Teunis, Centrefor Infectious Disease Control, Epidemiology and SurveillanceUnit, RIVM, PO Box 1, 3720BA Bilthoven, The Netherlands.(Email : [email protected])
Epidemiol. Infect. (2013), 141, 62–73. f Cambridge University Press 2012
doi:10.1017/S0950268812000404
The use of a geographic information system to identify a dairy goat farm as the most likely source of an urban Q fever outbreak
B. SCHIMMER1, R. TER SCHEGGET2, M. WEGDAM3, L. ZÜCHNER4, A. DE BRUIN1, P.M. SCHNEEBERGER5, T. VEENSTRA1, P. VELLEMA6, W. VAN DER HOEK1*
Time-course of antibody responses against Coxiella burnetiifollowing acute Q fever
P. F. M. TEUNIS 1,2*, B. SCHIMMER 1, D. W. NOTERMANS3,
A. C. A. P. LEENDERS 4, P. C. WEVER 4, M. E. E. KRETZSCHMAR1,5
AND P. M. SCHNEEBERGER 4
1 Centre for Infectious Disease Control, Epidemiology and Surveillance Unit, RIVM, Bilthoven, The Netherlands2 Hubert Department of Global Health, Rollins School of Public Health, Emory University, Atlanta, GA, USA3 Centre for Infectious Disease Control, Laboratory for Infectious Diseases and Perinatal Screening, RIVM,Bilthoven, The Netherlands4 Jeroen Bosch Hospital, Department of Medical Microbiology and Infection Control,’s- Hertogenbosch, TheNetherlands5 Julius Centre for Health Sciences and Primary Care, University Medical Centre Utrecht, Utrecht, The
Netherlands
Received 11 October 2011; Final revision 15 February 2012; Accepted 15 February 2012;
first published online 4 April 2012
SUMMARY
Large outbreaks of Q fever in The Netherlands have provided a unique opportunity for studying
longitudinal serum antibody responses in patients. Results are presented of a cohort of 344
patients with acute symptoms of Q fever with three or more serum samples per patient. In all
these serum samples IgM and IgG against phase 1 and 2 Coxiella burnetii were measured by an
immunofluorescence assay. A mathematical model of the dynamic interaction of serum antibodies
and pathogens was used in a mixed model framework to quantitatively analyse responses to
C. burnetii infection. Responses show strong heterogeneity, with individual serum antibody
responses widely different in magnitude and shape. Features of the response, peak titre and decay
rate, are used to characterize the diversity of the observed responses. Binary mixture analysis of
IgG peak levels (phases 1 and 2) reveals a class of patients with high IgG peak titres that decay
slowly and may represent potential chronic cases. When combining the results of mixture analysis
into an odds score, it is concluded that not only high IgG phase 1 may be predictive for chronic
Q fever, but also that high IgG phase 2 may aid in detecting such putative chronic cases.
Key words: Coxiella, mathematical modelling, Q fever, serology, statistics.
INTRODUCTION
Since mid-2007 human cases of Q fever in The
Netherlands have increased sharply, with major out-
breaks in 2008 and 2009, reaching a total of about
4000 cases by 2010 [1–4]. Cases were predominantly
clustered in the south of The Netherlands [3] and the
majority of the laboratory samples were submitted
to one regional hospital : the Jeroen Bosch Hospital
in ’s-Hertogenbosch (about 2000 confirmed acute
Q fever cases). Follow-up of cases extended over a
period of up to 24 months. In the 3 years that this
outbreak persisted, laboratory results from over 2000
cases were collected in a laboratory database. This
* Author for correspondence : Professor P. F. M. Teunis, Centrefor Infectious Disease Control, Epidemiology and SurveillanceUnit, RIVM, PO Box 1, 3720BA Bilthoven, The Netherlands.(Email : [email protected])
Epidemiol. Infect. (2013), 141, 62–73. f Cambridge University Press 2012
doi:10.1017/S0950268812000404
RESEARCH ARTICLE Open Access
The use of a geographic information system toidentify a dairy goat farm as the most likelysource of an urban Q-fever outbreakBarbara Schimmer1, Ronald ter Schegget2, Marjolijn Wegdam3, Lothar Züchner4, Arnout de Bruin1,Peter M Schneeberger5, Thijs Veenstra1, Piet Vellema6, Wim van der Hoek1*
Abstract
Background: A Q-fever outbreak occurred in an urban area in the south of the Netherlands in May 2008. Thedistribution and timing of cases suggested a common source. We studied the spatial relationship between theresidence locations of human cases and nearby small ruminant farms, of which one dairy goat farm hadexperienced abortions due to Q-fever since mid April 2008. A generic geographic information system (GIS) wasused to develop a method for source detection in the still evolving major epidemic of Q-fever in the Netherlands.
Methods: All notified Q-fever cases in the area were interviewed. Postal codes of cases and of small ruminantfarms (size >40 animals) located within 5 kilometres of the cluster area were geo-referenced as point locations in aGIS-model. For each farm, attack rates and relative risks were calculated for 5 concentric zones adding 1 kilometreat a time, using the 5-10 kilometres zone as reference. These data were linked to the results of veterinaryinvestigations.
Results: Persons living within 2 kilometres of an affected dairy goat farm (>400 animals) had a much higher riskfor Q-fever than those living more than 5 kilometres away (Relative risk 31.1 [95% CI 16.4-59.1]).
Conclusions: The study supported the hypothesis that a single dairy goat farm was the source of the humanoutbreak. GIS-based attack rate analysis is a promising tool for source detection in outbreaks of human Q-fever.
BackgroundQ-fever, a zoonosis caused by the bacterium Coxiellaburnetii, is an emerging public health problem in theNetherlands. In May 2007, the first community Q-feveroutbreak was documented around a single village in theprovince of Noord Brabant. A case control study carriedout subsequently suggested a role of warm, dry weatherconditions in addition to a residence location close toruminant farms [1].The unprecedented magnitude (>3000 notified human
cases) and geographical spread within the province dur-ing the following years (2008-2009) suggested multiplesources of infection [2]. The affected area matches withthe part of the Netherlands that has the highest
concentration of dairy goat farms, some of which arevery large (>5000 goats) [3]. From 2005 to 2008, clinicalQ-fever represented by abortions or stillbirths in smallruminants, was diagnosed at 22 large (>50 goats) com-mercial dairy goat farms and 2 dairy sheep farms, mainlyin the affected province [4]. Although large dairy goatfarms were implicated, questions about exact transmis-sion routes and risk factors remained unanswered.In May 2008 the municipal health service (MHS) in
the southeast region of the affected province was alertedby a cluster of human Q-fever cases in an urban area(88,000 inhabitants). Based on the distribution of casesin time and place, a common source was suspected. TheMHS had been informed by the Animal Health Servicethat a dairy goat farm was diagnosed with Q-fever intheir region. Some patients that were interviewed by theMHS indicated a pet farm in their neighbourhood as apotential source.
* Correspondence: [email protected] for Infectious Disease Control, National Institute for Public Healthand the Environment, A van Leeuwenhoeklaan 9, PO Box 1, 3720 BABilthoven, the Netherlands
Schimmer et al. BMC Infectious Diseases 2010, 10:69http://www.biomedcentral.com/1471-2334/10/69
© 2010 Schimmer et al; licensee BioMed Central Ltd. This is an Open Access article distributed under the terms of the CreativeCommons Attribution License (http://creativecommons.org/licenses/by/2.0), which permits unrestricted use, distribution, andreproduction in any medium, provided the original work is properly cited.
Affiliaties
Chapter 3.2
1Centre for Infectious Disease Control, National Institute for Public Health and the Environment, Bilthoven, the Netherlands 2Municipal Health Service ‘Brabant Zuidoost, Eindhoven, the Netherlands 3Laboratory for Pathology and Medical Microbiology, Veldhoven, the Netherlands 4Region East, Food and Consumer Product Safety Authority, Zutphen, the Netherlands 5Department of Medical Microbiology and Infection Control, Jeroen Bosch Hospital, ‘s Hertogenbosch, the Netherlands 6Department of Small Ruminant Health, Animal Health Service, Deventer, the Netherlands
Chapter 4.1
1 Centre for Infectious Disease Control, National Institute for Public Health and The Environment, Bilthoven, The Netherlands 2 Academic Collaborative Centre AMPHI, Department of Primary and Community Care, Radboud University Nijmegen Medical Centre, Nijmegen, The Netherlands 3 Department of Medical Microbiology and Infection Control, Jeroen Bosch Hospital, ’s-Hertogenbosch, The Netherlands 4 Department of Small Ruminant Health, Animal Health Service, Deventer, The Netherlands
Chapter 4.2 1Centre for Infectious Disease Control, National Institute for Public Health and the Environment, Bilthoven, the Netherlands 2Quantitative Veterinary Epidemiology Group, Wageningen Institute of Animal Sciences, Wageningen, The Netherlands 3Department of Small Ruminant Health, Animal Health Service, Deventer, The Netherlands 4Academic Collaborative Centre AMPHI, Department of Primary and Community Care, Radboud University Nijmegen Medical Centre, the Netherlands
Chapter 4.4 1Centre for Infectious Disease Control, National Institute for Public Health and the Environment, Bilthoven, the Netherlands 2 Academic Collaborative Centre AMPHI, Department of Primary and Community Care, Radboud University Nijmegen Medical Centre, Nijmegen, the Netherlands 3Department of Small Ruminant Health, Animal Health Service, Deventer, The Netherlands
Chapter 4.5 1 National Institute for Public Health and the Environment (RIVM), Bilthoven, the Netherlands 2 Animal Health Service,Deventer, the Netherlands 3 Radboud University Nijmegen Medical Centre, Nijmegen, the Netherlands 4. Jeroen Bosch Hospital, ‘s-Hertogenbosch, the Netherlands Chapter 4.6 1 GD Animal Health, Deventer, The Netherlands 2 Centre for Infectious Disease Control, National Institute for Public Health and the Environment, Bilthoven, the Netherlands 3 Department of Primary and Community Care, Academic Collaborative Centre for Public Health (AMPHI), Radboud University Nijmegen Medical Centre, Nijmegen, The Netherlands
Chapter 5.1 1 Department of Small Ruminant Health, Animal Health Service, Deventer, The Netherlands 2 Centre for Infectious Disease Control, National Institute for Public Health and the Environment, Bilthoven, The Netherlands 3 Department of Medical Microbiology and Infection Control, Jeroen Bosch Hospital, ‘s-Hertogenbosch, The Netherlands, 4 Department of Diagnostics, Research and Epidemiology, Animal Health Service, Deventer, The Netherlands
Chapter 5.2
1 Division of Environmental Epidemiology, Institute for Risk Assessment Sciences, Utrecht, the Netherlands 2 Centre for Infectious Disease Control, National Institute for Public Health and the Environment, Bilthoven, the Netherlands, 3 Department of Medical Microbiology and Infection Control, Jeroen Bosch Hospital, ‘s-Hertogenbosch, the Netherlands, 4 Division of Veterinary Public Health, Institute for Risk Assessment Sciences, Utrecht, the Netherlands
Chapter 5.3 1.National Institute for Public Health and the Environment, Bilthoven, the Netherlands 2 European Centre for Disease Prevention and Control, Stockholm, Sweden 3 Jeroen Bosch Hospital, ‘s-Hertogenbosch, the Netherlands 4 ArboUnie, Utrecht, the Netherlands
The objective of the study was to assess whether thecluster of human Q-fever cases in this urban area couldbe linked to the suspected source on the basis of thedistribution of illness onset and residence location rela-tive to small ruminant farms. Furthermore, the studyexplored the usefulness of a generic geographic informa-tion system (GIS) for source detection in the still evol-ving major epidemic of Q-fever in the Netherlands.
MethodsHuman Q-fever casesQ-fever is a notifiable disease in the Netherlands andthe regional MHS was responsible for the outbreakinvestigation. A regional laboratory provided the major-ity of microbiological diagnostic services for the inhabi-tants of the MHS region. Submitted serum sampleswere screened with a C. burnetii complement fixationtest (CFT, Siemens, the Netherlands). Notification cri-teria for acute Q-fever were a clinical presentation withat least fever, or pneumonia, or hepatitis and a fourfoldrise in titre in the CFT or a single high titre or a hightitre in two samples without a fourfold increase (CFTtitre ≥1:4). All persons notified to the Dutch nationalsurveillance system for infectious diseases (OSIRIS) whowere residing or had visited the MHS region of BrabantSoutheast and who had an illness onset from week 16(14 April 2008) to week 32 (10 August 2008) wereincluded.A hypothesis generating questionnaire was used to get
insight into possible sources of C. burnetii infection.Questions pertained to age, sex, day of illness onset,self-reported symptoms and complications, and a rangeof potential risk factors, such as travel history and occu-pational exposure. A recall period of four weeks beforeillness onset was used to investigate if cases had hadrelevant exposures immediately before the incubationperiod. Questionnaires to all notified cases were admi-nistered by trained public health employees from theMHS during house visits, or self-administered by mail.Data on human cases was collected as part of the rou-
tine system of infectious disease surveillance and out-break control. Because no additional information orlaboratory materials were collected from patients, amedical ethical review was not needed.
Meteorological dataWe determined the predominant wind direction by dayand calculated the number of days that the wind hadblown in every wind direction during the estimatedexposure period. These data were available for weatherstation Volkel (station 375 of the Royal NetherlandsMeteorological Institute), located within 15 kilometresfrom the centre of the cluster area.
Veterinary dataVeterinary data were obtained from the Animal HealthService. A mandatory veterinary notification system wasonly introduced on 12 June 2008 (week 24). If a veterin-ary source was suspected based on the exposure infor-mation from patients, the MHS notified the Food andConsumer Product Safety Authority.
Data analysisResidence locations of all Q-fever cases were plotted aspoint data on a digital map of the area. The AnimalHealth Service provided the locations and specificationsof goat and sheep farms that were located within 5 kilo-metres of the average longitudinal and lateral coordinateof the cases, thus defining the centre of the cluster. Theresidential addresses of the cases was considered aproxy for level of exposure to small ruminant farms. Wehypothesized that the attack rate would be higher forpersons living close to the source and would decreasewith increasing distance. Around each farm with morethan 40 small ruminants we made concentric rings eachexpanding with a 1 kilometre radius (range 0-5000meters) and a reference ring with a range from 5000 -10,000 meters). Attack rates for residents living withinthese zones were calculated using a digital map of popu-lation distribution. Relative risks for 5 zones were esti-mated using the 5000-10,000 meters zone as reference.Mapping and spatial analyses were done with ArcGis 9software (ESRI, Redlands, CA, USA).
ResultsBetween week 16 and 33 (14 April-15 August 2008) theMHS Brabant Southeast notified 96 Q-fever cases. In 55patients positive CFT titres were found in two sequen-tial (≥14 days interval) samples (of which 42 cases had afourfold increase in titre) and 41 patients had a singlepositive CFT titre. The median age of cases was 53years (interquartile range 42-61) and the male to femaleratio was 2.3:1. Day of onset of illness was known for 95cases (median 4 June 2008). Nineteen individuals (20%)were hospitalised.Eighty one (84%) of the 96 cases completed a question-
naire. Most commonly reported symptoms were fever>38°C (95%), fatigue (83%), headache (70%), night sweats(62%), dyspnoea (53%), malaise (52%), and myalgia (51%).The majority of cases (79%) presented clinically with apneumonia. Five patients (6%) presented with hepatitis.Seventy eight (81%) of the 96 cases that were notified inthe MHS region Brabant Southeast resided in one citywith 87,752 inhabitants and a surface area of 54.56 km2
(1608/km2). Eight cases were from adjacent municipali-ties and 10 from more distant municipalities and none ofthese reported to have a work address within the city.
Schimmer et al. BMC Infectious Diseases 2010, 10:69http://www.biomedcentral.com/1471-2334/10/69
Page 2 of 7

USE OF GIS IN URBAN Q FEVER OUTBREAK | 65
3.2
Time-course of antibody responses against Coxiella burnetiifollowing acute Q fever
P. F. M. TEUNIS 1,2*, B. SCHIMMER 1, D. W. NOTERMANS3,
A. C. A. P. LEENDERS 4, P. C. WEVER 4, M. E. E. KRETZSCHMAR1,5
AND P. M. SCHNEEBERGER 4
1 Centre for Infectious Disease Control, Epidemiology and Surveillance Unit, RIVM, Bilthoven, The Netherlands2 Hubert Department of Global Health, Rollins School of Public Health, Emory University, Atlanta, GA, USA3 Centre for Infectious Disease Control, Laboratory for Infectious Diseases and Perinatal Screening, RIVM,Bilthoven, The Netherlands4 Jeroen Bosch Hospital, Department of Medical Microbiology and Infection Control,’s- Hertogenbosch, TheNetherlands5 Julius Centre for Health Sciences and Primary Care, University Medical Centre Utrecht, Utrecht, The
Netherlands
Received 11 October 2011; Final revision 15 February 2012; Accepted 15 February 2012;
first published online 4 April 2012
SUMMARY
Large outbreaks of Q fever in The Netherlands have provided a unique opportunity for studying
longitudinal serum antibody responses in patients. Results are presented of a cohort of 344
patients with acute symptoms of Q fever with three or more serum samples per patient. In all
these serum samples IgM and IgG against phase 1 and 2 Coxiella burnetii were measured by an
immunofluorescence assay. A mathematical model of the dynamic interaction of serum antibodies
and pathogens was used in a mixed model framework to quantitatively analyse responses to
C. burnetii infection. Responses show strong heterogeneity, with individual serum antibody
responses widely different in magnitude and shape. Features of the response, peak titre and decay
rate, are used to characterize the diversity of the observed responses. Binary mixture analysis of
IgG peak levels (phases 1 and 2) reveals a class of patients with high IgG peak titres that decay
slowly and may represent potential chronic cases. When combining the results of mixture analysis
into an odds score, it is concluded that not only high IgG phase 1 may be predictive for chronic
Q fever, but also that high IgG phase 2 may aid in detecting such putative chronic cases.
Key words: Coxiella, mathematical modelling, Q fever, serology, statistics.
INTRODUCTION
Since mid-2007 human cases of Q fever in The
Netherlands have increased sharply, with major out-
breaks in 2008 and 2009, reaching a total of about
4000 cases by 2010 [1–4]. Cases were predominantly
clustered in the south of The Netherlands [3] and the
majority of the laboratory samples were submitted
to one regional hospital : the Jeroen Bosch Hospital
in ’s-Hertogenbosch (about 2000 confirmed acute
Q fever cases). Follow-up of cases extended over a
period of up to 24 months. In the 3 years that this
outbreak persisted, laboratory results from over 2000
cases were collected in a laboratory database. This
* Author for correspondence : Professor P. F. M. Teunis, Centrefor Infectious Disease Control, Epidemiology and SurveillanceUnit, RIVM, PO Box 1, 3720BA Bilthoven, The Netherlands.(Email : [email protected])
Epidemiol. Infect. (2013), 141, 62–73. f Cambridge University Press 2012
doi:10.1017/S0950268812000404
RESEARCH ARTICLE Open Access
The use of a geographic information system toidentify a dairy goat farm as the most likelysource of an urban Q-fever outbreakBarbara Schimmer1, Ronald ter Schegget2, Marjolijn Wegdam3, Lothar Züchner4, Arnout de Bruin1,Peter M Schneeberger5, Thijs Veenstra1, Piet Vellema6, Wim van der Hoek1*
Abstract
Background: A Q-fever outbreak occurred in an urban area in the south of the Netherlands in May 2008. Thedistribution and timing of cases suggested a common source. We studied the spatial relationship between theresidence locations of human cases and nearby small ruminant farms, of which one dairy goat farm hadexperienced abortions due to Q-fever since mid April 2008. A generic geographic information system (GIS) wasused to develop a method for source detection in the still evolving major epidemic of Q-fever in the Netherlands.
Methods: All notified Q-fever cases in the area were interviewed. Postal codes of cases and of small ruminantfarms (size >40 animals) located within 5 kilometres of the cluster area were geo-referenced as point locations in aGIS-model. For each farm, attack rates and relative risks were calculated for 5 concentric zones adding 1 kilometreat a time, using the 5-10 kilometres zone as reference. These data were linked to the results of veterinaryinvestigations.
Results: Persons living within 2 kilometres of an affected dairy goat farm (>400 animals) had a much higher riskfor Q-fever than those living more than 5 kilometres away (Relative risk 31.1 [95% CI 16.4-59.1]).
Conclusions: The study supported the hypothesis that a single dairy goat farm was the source of the humanoutbreak. GIS-based attack rate analysis is a promising tool for source detection in outbreaks of human Q-fever.
BackgroundQ-fever, a zoonosis caused by the bacterium Coxiellaburnetii, is an emerging public health problem in theNetherlands. In May 2007, the first community Q-feveroutbreak was documented around a single village in theprovince of Noord Brabant. A case control study carriedout subsequently suggested a role of warm, dry weatherconditions in addition to a residence location close toruminant farms [1].The unprecedented magnitude (>3000 notified human
cases) and geographical spread within the province dur-ing the following years (2008-2009) suggested multiplesources of infection [2]. The affected area matches withthe part of the Netherlands that has the highest
concentration of dairy goat farms, some of which arevery large (>5000 goats) [3]. From 2005 to 2008, clinicalQ-fever represented by abortions or stillbirths in smallruminants, was diagnosed at 22 large (>50 goats) com-mercial dairy goat farms and 2 dairy sheep farms, mainlyin the affected province [4]. Although large dairy goatfarms were implicated, questions about exact transmis-sion routes and risk factors remained unanswered.In May 2008 the municipal health service (MHS) in
the southeast region of the affected province was alertedby a cluster of human Q-fever cases in an urban area(88,000 inhabitants). Based on the distribution of casesin time and place, a common source was suspected. TheMHS had been informed by the Animal Health Servicethat a dairy goat farm was diagnosed with Q-fever intheir region. Some patients that were interviewed by theMHS indicated a pet farm in their neighbourhood as apotential source.
* Correspondence: [email protected] for Infectious Disease Control, National Institute for Public Healthand the Environment, A van Leeuwenhoeklaan 9, PO Box 1, 3720 BABilthoven, the Netherlands
Schimmer et al. BMC Infectious Diseases 2010, 10:69http://www.biomedcentral.com/1471-2334/10/69
© 2010 Schimmer et al; licensee BioMed Central Ltd. This is an Open Access article distributed under the terms of the CreativeCommons Attribution License (http://creativecommons.org/licenses/by/2.0), which permits unrestricted use, distribution, andreproduction in any medium, provided the original work is properly cited.
Affiliaties
Chapter 3.2
1Centre for Infectious Disease Control, National Institute for Public Health and the Environment, Bilthoven, the Netherlands 2Municipal Health Service ‘Brabant Zuidoost, Eindhoven, the Netherlands 3Laboratory for Pathology and Medical Microbiology, Veldhoven, the Netherlands 4Region East, Food and Consumer Product Safety Authority, Zutphen, the Netherlands 5Department of Medical Microbiology and Infection Control, Jeroen Bosch Hospital, ‘s Hertogenbosch, the Netherlands 6Department of Small Ruminant Health, Animal Health Service, Deventer, the Netherlands
Chapter 4.1
1 Centre for Infectious Disease Control, National Institute for Public Health and The Environment, Bilthoven, The Netherlands 2 Academic Collaborative Centre AMPHI, Department of Primary and Community Care, Radboud University Nijmegen Medical Centre, Nijmegen, The Netherlands 3 Department of Medical Microbiology and Infection Control, Jeroen Bosch Hospital, ’s-Hertogenbosch, The Netherlands 4 Department of Small Ruminant Health, Animal Health Service, Deventer, The Netherlands
Chapter 4.2 1Centre for Infectious Disease Control, National Institute for Public Health and the Environment, Bilthoven, the Netherlands 2Quantitative Veterinary Epidemiology Group, Wageningen Institute of Animal Sciences, Wageningen, The Netherlands 3Department of Small Ruminant Health, Animal Health Service, Deventer, The Netherlands 4Academic Collaborative Centre AMPHI, Department of Primary and Community Care, Radboud University Nijmegen Medical Centre, the Netherlands
Chapter 4.4 1Centre for Infectious Disease Control, National Institute for Public Health and the Environment, Bilthoven, the Netherlands 2 Academic Collaborative Centre AMPHI, Department of Primary and Community Care, Radboud University Nijmegen Medical Centre, Nijmegen, the Netherlands 3Department of Small Ruminant Health, Animal Health Service, Deventer, The Netherlands
Chapter 4.5 1 National Institute for Public Health and the Environment (RIVM), Bilthoven, the Netherlands 2 Animal Health Service,Deventer, the Netherlands 3 Radboud University Nijmegen Medical Centre, Nijmegen, the Netherlands 4. Jeroen Bosch Hospital, ‘s-Hertogenbosch, the Netherlands Chapter 4.6 1 GD Animal Health, Deventer, The Netherlands 2 Centre for Infectious Disease Control, National Institute for Public Health and the Environment, Bilthoven, the Netherlands 3 Department of Primary and Community Care, Academic Collaborative Centre for Public Health (AMPHI), Radboud University Nijmegen Medical Centre, Nijmegen, The Netherlands
Chapter 5.1 1 Department of Small Ruminant Health, Animal Health Service, Deventer, The Netherlands 2 Centre for Infectious Disease Control, National Institute for Public Health and the Environment, Bilthoven, The Netherlands 3 Department of Medical Microbiology and Infection Control, Jeroen Bosch Hospital, ‘s-Hertogenbosch, The Netherlands, 4 Department of Diagnostics, Research and Epidemiology, Animal Health Service, Deventer, The Netherlands
Chapter 5.2
1 Division of Environmental Epidemiology, Institute for Risk Assessment Sciences, Utrecht, the Netherlands 2 Centre for Infectious Disease Control, National Institute for Public Health and the Environment, Bilthoven, the Netherlands, 3 Department of Medical Microbiology and Infection Control, Jeroen Bosch Hospital, ‘s-Hertogenbosch, the Netherlands, 4 Division of Veterinary Public Health, Institute for Risk Assessment Sciences, Utrecht, the Netherlands
Chapter 5.3 1.National Institute for Public Health and the Environment, Bilthoven, the Netherlands 2 European Centre for Disease Prevention and Control, Stockholm, Sweden 3 Jeroen Bosch Hospital, ‘s-Hertogenbosch, the Netherlands 4 ArboUnie, Utrecht, the Netherlands
The objective of the study was to assess whether thecluster of human Q-fever cases in this urban area couldbe linked to the suspected source on the basis of thedistribution of illness onset and residence location rela-tive to small ruminant farms. Furthermore, the studyexplored the usefulness of a generic geographic informa-tion system (GIS) for source detection in the still evol-ving major epidemic of Q-fever in the Netherlands.
MethodsHuman Q-fever casesQ-fever is a notifiable disease in the Netherlands andthe regional MHS was responsible for the outbreakinvestigation. A regional laboratory provided the major-ity of microbiological diagnostic services for the inhabi-tants of the MHS region. Submitted serum sampleswere screened with a C. burnetii complement fixationtest (CFT, Siemens, the Netherlands). Notification cri-teria for acute Q-fever were a clinical presentation withat least fever, or pneumonia, or hepatitis and a fourfoldrise in titre in the CFT or a single high titre or a hightitre in two samples without a fourfold increase (CFTtitre ≥1:4). All persons notified to the Dutch nationalsurveillance system for infectious diseases (OSIRIS) whowere residing or had visited the MHS region of BrabantSoutheast and who had an illness onset from week 16(14 April 2008) to week 32 (10 August 2008) wereincluded.A hypothesis generating questionnaire was used to get
insight into possible sources of C. burnetii infection.Questions pertained to age, sex, day of illness onset,self-reported symptoms and complications, and a rangeof potential risk factors, such as travel history and occu-pational exposure. A recall period of four weeks beforeillness onset was used to investigate if cases had hadrelevant exposures immediately before the incubationperiod. Questionnaires to all notified cases were admi-nistered by trained public health employees from theMHS during house visits, or self-administered by mail.Data on human cases was collected as part of the rou-
tine system of infectious disease surveillance and out-break control. Because no additional information orlaboratory materials were collected from patients, amedical ethical review was not needed.
Meteorological dataWe determined the predominant wind direction by dayand calculated the number of days that the wind hadblown in every wind direction during the estimatedexposure period. These data were available for weatherstation Volkel (station 375 of the Royal NetherlandsMeteorological Institute), located within 15 kilometresfrom the centre of the cluster area.
Veterinary dataVeterinary data were obtained from the Animal HealthService. A mandatory veterinary notification system wasonly introduced on 12 June 2008 (week 24). If a veterin-ary source was suspected based on the exposure infor-mation from patients, the MHS notified the Food andConsumer Product Safety Authority.
Data analysisResidence locations of all Q-fever cases were plotted aspoint data on a digital map of the area. The AnimalHealth Service provided the locations and specificationsof goat and sheep farms that were located within 5 kilo-metres of the average longitudinal and lateral coordinateof the cases, thus defining the centre of the cluster. Theresidential addresses of the cases was considered aproxy for level of exposure to small ruminant farms. Wehypothesized that the attack rate would be higher forpersons living close to the source and would decreasewith increasing distance. Around each farm with morethan 40 small ruminants we made concentric rings eachexpanding with a 1 kilometre radius (range 0-5000meters) and a reference ring with a range from 5000 -10,000 meters). Attack rates for residents living withinthese zones were calculated using a digital map of popu-lation distribution. Relative risks for 5 zones were esti-mated using the 5000-10,000 meters zone as reference.Mapping and spatial analyses were done with ArcGis 9software (ESRI, Redlands, CA, USA).
ResultsBetween week 16 and 33 (14 April-15 August 2008) theMHS Brabant Southeast notified 96 Q-fever cases. In 55patients positive CFT titres were found in two sequen-tial (≥14 days interval) samples (of which 42 cases had afourfold increase in titre) and 41 patients had a singlepositive CFT titre. The median age of cases was 53years (interquartile range 42-61) and the male to femaleratio was 2.3:1. Day of onset of illness was known for 95cases (median 4 June 2008). Nineteen individuals (20%)were hospitalised.Eighty one (84%) of the 96 cases completed a question-
naire. Most commonly reported symptoms were fever>38°C (95%), fatigue (83%), headache (70%), night sweats(62%), dyspnoea (53%), malaise (52%), and myalgia (51%).The majority of cases (79%) presented clinically with apneumonia. Five patients (6%) presented with hepatitis.Seventy eight (81%) of the 96 cases that were notified inthe MHS region Brabant Southeast resided in one citywith 87,752 inhabitants and a surface area of 54.56 km2
(1608/km2). Eight cases were from adjacent municipali-ties and 10 from more distant municipalities and none ofthese reported to have a work address within the city.
Schimmer et al. BMC Infectious Diseases 2010, 10:69http://www.biomedcentral.com/1471-2334/10/69
Page 2 of 7

66 | CHAPTER 3.2
We estimated from the epidemic curve (Figure 1) thatthe likely period of infection was from week 15 (mid-April)to week 24 (mid-June). This encompassed the known twoto four week incubation period for C. burnetii and wasbased on date of symptom onset for 95 of the 96 cases.
Veterinary investigationsThere were 60 locations with small ruminants within the5 kilometre zone around the centre of the human Q-fever cluster. Seven of these locations were large farms(A-G) with more than 40 small ruminants, including onelarge dairy goat farm (A, >400 goats), one mixed sheep/goat farm (E, 126 goats and 90 sheep) and 5 sheep farms(B, C, D, F, and G with between 57 and 118 sheep).These farms are mapped in figure 2. Farm A reported anabortion wave on 21 April 2008 (week 17) to the AnimalHealth Service and submitted two aborted lambs for postmortem examination. C. burnetii infection was confirmedin placental tissue from aborted goats by immunohisto-chemistry. The first abortions were noticed in week 15(mid April) 2008. No other farms in the area reportedabortions in the weeks prior to the outbreak. At the timeof the visit by the Animal Health Service on 15 May(week 20), 40 out of 120 pregnant goats had aborted(33%), 20 (17%) had an uncomplicated pregnancy and got
healthy offspring, while another 60 animals still had todeliver. No veterinary problems were reported by theother farms. A pet farm in the part of the city wheremost of the cases resided was visited by the Food andConsumer Product Safety Authority. Three tested goatsand one sheep had a weak positive PCR (only one ofthree Coxiella specific genomic targets positive). How-ever these animals had not been pregnant recently.Hygiene standards at the pet farm were good and noneof the employees of the pet farm developed symptoms orhad been diagnosed with acute Q-fever. It was concludedthat these animals were not the main source of the largecluster of human cases.
Meteorological dataWith an east to north-eastern wind most of the city liesdownwind of the dairy goat farm and could potentiallyhave been exposed to contaminated dust particles. Dur-ing the study period these wind conditions were com-mon in week 16 (14-20 April) with 4 out of 7 days andin week 20 (12-18 May) with 6 out of 7 days (Figure 1).
GIS analysisDistance-related attack rates and relative risks forincreasingly larger sequential ring buffers from each of
Figure 1 Epidemic curve of Q-fever and wind direction. Number of Q-fever cases in the Municipal Health Service region Brabant Southeastby week of illness onset (n = 95, black bars); and number of days in the week with prevailing eastern or north-eastern wind (white bars).Information on date of illness onset is missing for one case.
Schimmer et al. BMC Infectious Diseases 2010, 10:69http://www.biomedcentral.com/1471-2334/10/69
Page 3 of 7
the 7 large farms (A-G) are shown in Table 1. A gradualdiminishing relative risk with increasing distance wasobserved for farm A, the large dairy goat farm with thereported abortion wave, and two small sheep farmsB and C.Farm A and B both showed a gradual diminishing
relative risk with increasing radius, with the exceptionof the first 1-kilometer zone, possibly due to the smalldenominator. There were no significant differences inattack rates between farm A and B. The attack rates
within 2 and within 3 kilometres were significantlyhigher for farm A than for farm C (p = 0.004 and p =0.001 respectively). The highest attack rate for farm Awas for inhabitants residing in the south to south-wes-tern direction within 2 kilometres of the farm. Personsliving in this zone had a much higher risk for Q-feverthan those living more than 5 kilometres away (Relativerisk 31.1 [95% CI 16.4-59.1]). In the 4-5 kilometre zonefrom farm A, only 1 case was added and the risk ofQ-fever for people living in this zone was very low. The
Figure 2 Map of the study area. Locations of goat and sheep farms with >40 animals (farm A-G) and residential addresses of Q-fever cases inurban and rural areas, 14 April to 10 August 2008.
Schimmer et al. BMC Infectious Diseases 2010, 10:69http://www.biomedcentral.com/1471-2334/10/69
Page 4 of 7

USE OF GIS IN URBAN Q FEVER OUTBREAK | 67
3.2
We estimated from the epidemic curve (Figure 1) thatthe likely period of infection was from week 15 (mid-April)to week 24 (mid-June). This encompassed the known twoto four week incubation period for C. burnetii and wasbased on date of symptom onset for 95 of the 96 cases.
Veterinary investigationsThere were 60 locations with small ruminants within the5 kilometre zone around the centre of the human Q-fever cluster. Seven of these locations were large farms(A-G) with more than 40 small ruminants, including onelarge dairy goat farm (A, >400 goats), one mixed sheep/goat farm (E, 126 goats and 90 sheep) and 5 sheep farms(B, C, D, F, and G with between 57 and 118 sheep).These farms are mapped in figure 2. Farm A reported anabortion wave on 21 April 2008 (week 17) to the AnimalHealth Service and submitted two aborted lambs for postmortem examination. C. burnetii infection was confirmedin placental tissue from aborted goats by immunohisto-chemistry. The first abortions were noticed in week 15(mid April) 2008. No other farms in the area reportedabortions in the weeks prior to the outbreak. At the timeof the visit by the Animal Health Service on 15 May(week 20), 40 out of 120 pregnant goats had aborted(33%), 20 (17%) had an uncomplicated pregnancy and got
healthy offspring, while another 60 animals still had todeliver. No veterinary problems were reported by theother farms. A pet farm in the part of the city wheremost of the cases resided was visited by the Food andConsumer Product Safety Authority. Three tested goatsand one sheep had a weak positive PCR (only one ofthree Coxiella specific genomic targets positive). How-ever these animals had not been pregnant recently.Hygiene standards at the pet farm were good and noneof the employees of the pet farm developed symptoms orhad been diagnosed with acute Q-fever. It was concludedthat these animals were not the main source of the largecluster of human cases.
Meteorological dataWith an east to north-eastern wind most of the city liesdownwind of the dairy goat farm and could potentiallyhave been exposed to contaminated dust particles. Dur-ing the study period these wind conditions were com-mon in week 16 (14-20 April) with 4 out of 7 days andin week 20 (12-18 May) with 6 out of 7 days (Figure 1).
GIS analysisDistance-related attack rates and relative risks forincreasingly larger sequential ring buffers from each of
Figure 1 Epidemic curve of Q-fever and wind direction. Number of Q-fever cases in the Municipal Health Service region Brabant Southeastby week of illness onset (n = 95, black bars); and number of days in the week with prevailing eastern or north-eastern wind (white bars).Information on date of illness onset is missing for one case.
Schimmer et al. BMC Infectious Diseases 2010, 10:69http://www.biomedcentral.com/1471-2334/10/69
Page 3 of 7
the 7 large farms (A-G) are shown in Table 1. A gradualdiminishing relative risk with increasing distance wasobserved for farm A, the large dairy goat farm with thereported abortion wave, and two small sheep farmsB and C.Farm A and B both showed a gradual diminishing
relative risk with increasing radius, with the exceptionof the first 1-kilometer zone, possibly due to the smalldenominator. There were no significant differences inattack rates between farm A and B. The attack rates
within 2 and within 3 kilometres were significantlyhigher for farm A than for farm C (p = 0.004 and p =0.001 respectively). The highest attack rate for farm Awas for inhabitants residing in the south to south-wes-tern direction within 2 kilometres of the farm. Personsliving in this zone had a much higher risk for Q-feverthan those living more than 5 kilometres away (Relativerisk 31.1 [95% CI 16.4-59.1]). In the 4-5 kilometre zonefrom farm A, only 1 case was added and the risk ofQ-fever for people living in this zone was very low. The
Figure 2 Map of the study area. Locations of goat and sheep farms with >40 animals (farm A-G) and residential addresses of Q-fever cases inurban and rural areas, 14 April to 10 August 2008.
Schimmer et al. BMC Infectious Diseases 2010, 10:69http://www.biomedcentral.com/1471-2334/10/69
Page 4 of 7
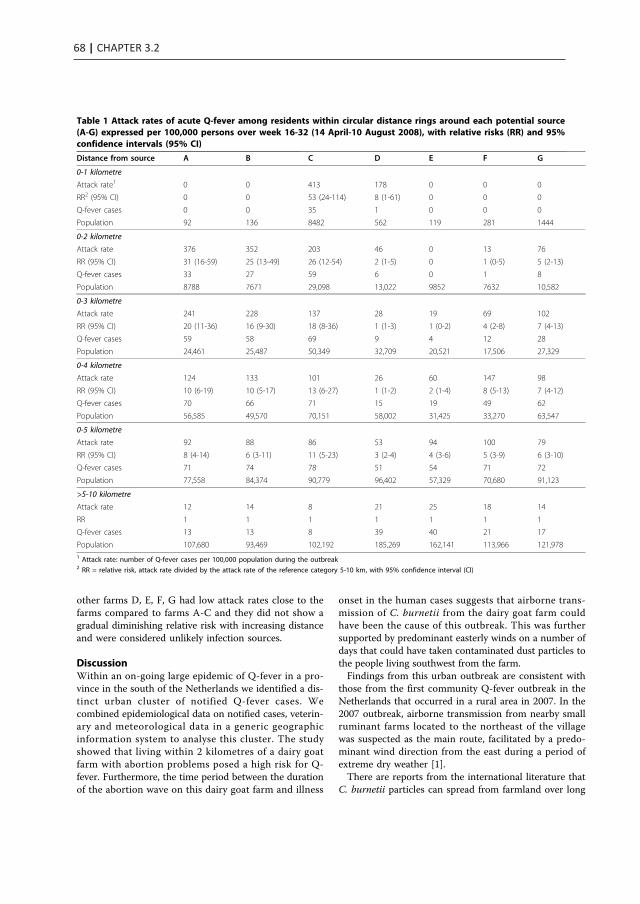
68 | CHAPTER 3.2
other farms D, E, F, G had low attack rates close to thefarms compared to farms A-C and they did not show agradual diminishing relative risk with increasing distanceand were considered unlikely infection sources.
DiscussionWithin an on-going large epidemic of Q-fever in a pro-vince in the south of the Netherlands we identified a dis-tinct urban cluster of notified Q-fever cases. Wecombined epidemiological data on notified cases, veterin-ary and meteorological data in a generic geographicinformation system to analyse this cluster. The studyshowed that living within 2 kilometres of a dairy goatfarm with abortion problems posed a high risk for Q-fever. Furthermore, the time period between the durationof the abortion wave on this dairy goat farm and illness
onset in the human cases suggests that airborne trans-mission of C. burnetii from the dairy goat farm couldhave been the cause of this outbreak. This was furthersupported by predominant easterly winds on a number ofdays that could have taken contaminated dust particles tothe people living southwest from the farm.Findings from this urban outbreak are consistent with
those from the first community Q-fever outbreak in theNetherlands that occurred in a rural area in 2007. In the2007 outbreak, airborne transmission from nearby smallruminant farms located to the northeast of the villagewas suspected as the main route, facilitated by a predo-minant wind direction from the east during a period ofextreme dry weather [1].There are reports from the international literature that
C. burnetii particles can spread from farmland over long
Table 1 Attack rates of acute Q-fever among residents within circular distance rings around each potential source(A-G) expressed per 100,000 persons over week 16-32 (14 April-10 August 2008), with relative risks (RR) and 95%confidence intervals (95% CI)
Distance from source A B C D E F G
0-1 kilometre
Attack rate1 0 0 413 178 0 0 0
RR2 (95% CI) 0 0 53 (24-114) 8 (1-61) 0 0 0
Q-fever cases 0 0 35 1 0 0 0
Population 92 136 8482 562 119 281 1444
0-2 kilometre
Attack rate 376 352 203 46 0 13 76
RR (95% CI) 31 (16-59) 25 (13-49) 26 (12-54) 2 (1-5) 0 1 (0-5) 5 (2-13)
Q-fever cases 33 27 59 6 0 1 8
Population 8788 7671 29,098 13,022 9852 7632 10,582
0-3 kilometre
Attack rate 241 228 137 28 19 69 102
RR (95% CI) 20 (11-36) 16 (9-30) 18 (8-36) 1 (1-3) 1 (0-2) 4 (2-8) 7 (4-13)
Q-fever cases 59 58 69 9 4 12 28
Population 24,461 25,487 50,349 32,709 20,521 17,506 27,329
0-4 kilometre
Attack rate 124 133 101 26 60 147 98
RR (95% CI) 10 (6-19) 10 (5-17) 13 (6-27) 1 (1-2) 2 (1-4) 8 (5-13) 7 (4-12)
Q-fever cases 70 66 71 15 19 49 62
Population 56,585 49,570 70,151 58,002 31,425 33,270 63,547
0-5 kilometre
Attack rate 92 88 86 53 94 100 79
RR (95% CI) 8 (4-14) 6 (3-11) 11 (5-23) 3 (2-4) 4 (3-6) 5 (3-9) 6 (3-10)
Q-fever cases 71 74 78 51 54 71 72
Population 77,558 84,374 90,779 96,402 57,329 70,680 91,123
>5-10 kilometre
Attack rate 12 14 8 21 25 18 14
RR 1 1 1 1 1 1 1
Q-fever cases 13 13 8 39 40 21 17
Population 107,680 93,469 102,192 185,269 162,141 113,966 121,9781 Attack rate: number of Q-fever cases per 100,000 population during the outbreak2 RR = relative risk, attack rate divided by the attack rate of the reference category 5-10 km, with 95% confidence interval (CI)
Schimmer et al. BMC Infectious Diseases 2010, 10:69http://www.biomedcentral.com/1471-2334/10/69
Page 5 of 7
distances, often facilitated by strong winds towardsurban areas [5]. In a community outbreak in the UnitedKingdom cases were identified up to 18 kilometres fromthe source [6]. Our results suggest a low risk beyond 5kilometres from the infection source. The role of windspeed and direction is difficult to analyse when a farm isinfectious for a longer period of time.
Source detectionIn the high incidence area in the south of the Nether-lands there are thousands of locations with goats andsheep in addition to the many cattle, pig and poultryfarms. In this environment the investigation and sam-pling of all potential animal infection sources to explainhuman clusters is impossible. Goats, sheep and cattle onmany farms throughout the country show serologicalevidence of previous infection with C. burnetii. How-ever, based on the experience since 2007, the prevailingopinion among the human and veterinary public healthcommunity is that abortion waves at large dairy goatfarms play the predominant role in transmission [4].Abortion rates of more than 5% on large dairy goat andsheep farms have to be notified since June 2008. How-ever, abortions in deep litter houses with many hun-dreds of animals might easily go unnoticed. Attack rateanalysis as proposed in the present paper could be anadditional tool for source detection.In order to apply this method real-time, detailed geo-
graphic information with residence locations of casesand farm locations, and early notification of humanclusters by health professionals are required. The com-plement fixation test is known to be specific but defini-tive diagnosis may be delayed because often pairedsamples are required [7]. Increased awareness amongpatients and physicians, as well as introduction of rapidlaboratory assays, such as PCR, may further reduce thedelay between onset of illness and diagnosis and notifi-cation [8]. Moreover, in June 2008 Q-fever became aveterinary notifiable disease. This legal framework hasfacilitated communication between the human andveterinary public health sectors. Clearly, it is essentialthat the MHS can alert general practitioners in a regionwhere there is a small ruminant farm with clinical Q-fever. Veterinary information on Q-fever status of farmsin the near proximity, for example clinical Q-fever orpositive bulk milk status, could facilitate to pinpoint themost likely sources in an exposed area.The analysis of the 2008 urban cluster was facilitated
by the relatively small number of farms in the area.Even so, the attack rate analysis showed similar resultsfor three farms (A-C) that were located very close toeach other. The tool can provide only a rough indicationbut could facilitate efficient source detection by placinganimal locations in classes of ‘possible’ and ‘unlikely’.
This would have to be followed by a veterinary riskassessment and possible sampling at suspected farms.Generating the attack rates requires experience in theuse of GIS software. When adequate tools for GIS ana-lyses are available, the workload is limited and the pro-cedure can be automated.
Limitations of the studyThis retrospective cohort study was performed in a newendemic area for Q-fever in the Netherlands wheredairy goat farming started recently. Q-fever was labora-tory confirmed on the newly established dairy goat farmbut no systematic environmental sampling took place inthe cluster area. Therefore we cannot exclude that othersources might have been present in the same time per-iod in the region.Most Q-fever infections remain asymptomatic or give
aspecific signs and symptoms. Differences in diagnostictesting and alertness of general practitioners might haveled to ascertainment bias. To provide a reliable estimate ofthe attack rate all patients with symptoms compatible withQ-fever would have to be tested or population surveyswould have to be done to include asymptomatic cases.
Research prioritiesConclusive evidence of a link between certain animalsand human Q-fever cases can only be provided bygenetic analysis of human, animal and environmentalsamples. Current typing techniques provide insufficientcontrast and methods for culturing and sequencingcarry bio safety concerns and are still under develop-ment. The presented attack rate analysis assumes homo-geneity in the distribution of Coxiella in each concentricring. In future analyses landscape features should betaken into account to make a more informative analysispossible. This should be combined with information onmovement patterns of human cases, recreational activ-ities and other behavioural factors that might changethe risk of exposure.
ConclusionsWe found a clear epidemiological link between a clusterof human Q-fever cases and a Q-fever positive dairygoat farm. The present study suggests an effective rangeof airborne C. burnetii spread of <5 kilometres. GIS-based automated attack rate analysis is a promising toolthat could classify animal locations as possible or unli-kely infection sources. This methodology should betransformed from a retrospective analysis to a real-timepinpointing tool to guide environmental sampling ofpotential sources. This requires close collaborationbetween the human and veterinary public health sectorsto ensure timely detection of cases, identification ofplausible sources and standardised environmental
Schimmer et al. BMC Infectious Diseases 2010, 10:69http://www.biomedcentral.com/1471-2334/10/69
Page 6 of 7
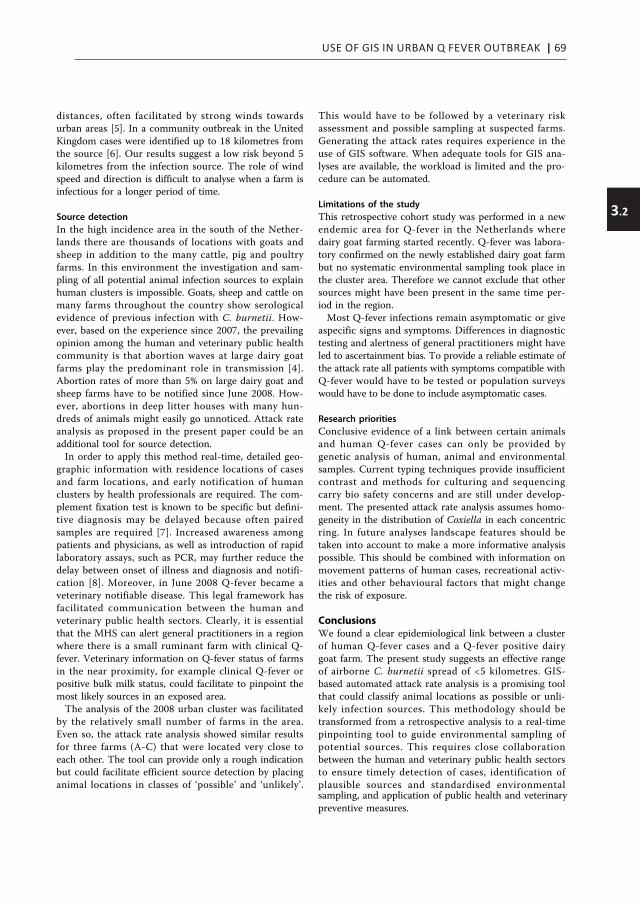
USE OF GIS IN URBAN Q FEVER OUTBREAK | 69
3.2
other farms D, E, F, G had low attack rates close to thefarms compared to farms A-C and they did not show agradual diminishing relative risk with increasing distanceand were considered unlikely infection sources.
DiscussionWithin an on-going large epidemic of Q-fever in a pro-vince in the south of the Netherlands we identified a dis-tinct urban cluster of notified Q-fever cases. Wecombined epidemiological data on notified cases, veterin-ary and meteorological data in a generic geographicinformation system to analyse this cluster. The studyshowed that living within 2 kilometres of a dairy goatfarm with abortion problems posed a high risk for Q-fever. Furthermore, the time period between the durationof the abortion wave on this dairy goat farm and illness
onset in the human cases suggests that airborne trans-mission of C. burnetii from the dairy goat farm couldhave been the cause of this outbreak. This was furthersupported by predominant easterly winds on a number ofdays that could have taken contaminated dust particles tothe people living southwest from the farm.Findings from this urban outbreak are consistent with
those from the first community Q-fever outbreak in theNetherlands that occurred in a rural area in 2007. In the2007 outbreak, airborne transmission from nearby smallruminant farms located to the northeast of the villagewas suspected as the main route, facilitated by a predo-minant wind direction from the east during a period ofextreme dry weather [1].There are reports from the international literature that
C. burnetii particles can spread from farmland over long
Table 1 Attack rates of acute Q-fever among residents within circular distance rings around each potential source(A-G) expressed per 100,000 persons over week 16-32 (14 April-10 August 2008), with relative risks (RR) and 95%confidence intervals (95% CI)
Distance from source A B C D E F G
0-1 kilometre
Attack rate1 0 0 413 178 0 0 0
RR2 (95% CI) 0 0 53 (24-114) 8 (1-61) 0 0 0
Q-fever cases 0 0 35 1 0 0 0
Population 92 136 8482 562 119 281 1444
0-2 kilometre
Attack rate 376 352 203 46 0 13 76
RR (95% CI) 31 (16-59) 25 (13-49) 26 (12-54) 2 (1-5) 0 1 (0-5) 5 (2-13)
Q-fever cases 33 27 59 6 0 1 8
Population 8788 7671 29,098 13,022 9852 7632 10,582
0-3 kilometre
Attack rate 241 228 137 28 19 69 102
RR (95% CI) 20 (11-36) 16 (9-30) 18 (8-36) 1 (1-3) 1 (0-2) 4 (2-8) 7 (4-13)
Q-fever cases 59 58 69 9 4 12 28
Population 24,461 25,487 50,349 32,709 20,521 17,506 27,329
0-4 kilometre
Attack rate 124 133 101 26 60 147 98
RR (95% CI) 10 (6-19) 10 (5-17) 13 (6-27) 1 (1-2) 2 (1-4) 8 (5-13) 7 (4-12)
Q-fever cases 70 66 71 15 19 49 62
Population 56,585 49,570 70,151 58,002 31,425 33,270 63,547
0-5 kilometre
Attack rate 92 88 86 53 94 100 79
RR (95% CI) 8 (4-14) 6 (3-11) 11 (5-23) 3 (2-4) 4 (3-6) 5 (3-9) 6 (3-10)
Q-fever cases 71 74 78 51 54 71 72
Population 77,558 84,374 90,779 96,402 57,329 70,680 91,123
>5-10 kilometre
Attack rate 12 14 8 21 25 18 14
RR 1 1 1 1 1 1 1
Q-fever cases 13 13 8 39 40 21 17
Population 107,680 93,469 102,192 185,269 162,141 113,966 121,9781 Attack rate: number of Q-fever cases per 100,000 population during the outbreak2 RR = relative risk, attack rate divided by the attack rate of the reference category 5-10 km, with 95% confidence interval (CI)
Schimmer et al. BMC Infectious Diseases 2010, 10:69http://www.biomedcentral.com/1471-2334/10/69
Page 5 of 7
distances, often facilitated by strong winds towardsurban areas [5]. In a community outbreak in the UnitedKingdom cases were identified up to 18 kilometres fromthe source [6]. Our results suggest a low risk beyond 5kilometres from the infection source. The role of windspeed and direction is difficult to analyse when a farm isinfectious for a longer period of time.
Source detectionIn the high incidence area in the south of the Nether-lands there are thousands of locations with goats andsheep in addition to the many cattle, pig and poultryfarms. In this environment the investigation and sam-pling of all potential animal infection sources to explainhuman clusters is impossible. Goats, sheep and cattle onmany farms throughout the country show serologicalevidence of previous infection with C. burnetii. How-ever, based on the experience since 2007, the prevailingopinion among the human and veterinary public healthcommunity is that abortion waves at large dairy goatfarms play the predominant role in transmission [4].Abortion rates of more than 5% on large dairy goat andsheep farms have to be notified since June 2008. How-ever, abortions in deep litter houses with many hun-dreds of animals might easily go unnoticed. Attack rateanalysis as proposed in the present paper could be anadditional tool for source detection.In order to apply this method real-time, detailed geo-
graphic information with residence locations of casesand farm locations, and early notification of humanclusters by health professionals are required. The com-plement fixation test is known to be specific but defini-tive diagnosis may be delayed because often pairedsamples are required [7]. Increased awareness amongpatients and physicians, as well as introduction of rapidlaboratory assays, such as PCR, may further reduce thedelay between onset of illness and diagnosis and notifi-cation [8]. Moreover, in June 2008 Q-fever became aveterinary notifiable disease. This legal framework hasfacilitated communication between the human andveterinary public health sectors. Clearly, it is essentialthat the MHS can alert general practitioners in a regionwhere there is a small ruminant farm with clinical Q-fever. Veterinary information on Q-fever status of farmsin the near proximity, for example clinical Q-fever orpositive bulk milk status, could facilitate to pinpoint themost likely sources in an exposed area.The analysis of the 2008 urban cluster was facilitated
by the relatively small number of farms in the area.Even so, the attack rate analysis showed similar resultsfor three farms (A-C) that were located very close toeach other. The tool can provide only a rough indicationbut could facilitate efficient source detection by placinganimal locations in classes of ‘possible’ and ‘unlikely’.
This would have to be followed by a veterinary riskassessment and possible sampling at suspected farms.Generating the attack rates requires experience in theuse of GIS software. When adequate tools for GIS ana-lyses are available, the workload is limited and the pro-cedure can be automated.
Limitations of the studyThis retrospective cohort study was performed in a newendemic area for Q-fever in the Netherlands wheredairy goat farming started recently. Q-fever was labora-tory confirmed on the newly established dairy goat farmbut no systematic environmental sampling took place inthe cluster area. Therefore we cannot exclude that othersources might have been present in the same time per-iod in the region.Most Q-fever infections remain asymptomatic or give
aspecific signs and symptoms. Differences in diagnostictesting and alertness of general practitioners might haveled to ascertainment bias. To provide a reliable estimate ofthe attack rate all patients with symptoms compatible withQ-fever would have to be tested or population surveyswould have to be done to include asymptomatic cases.
Research prioritiesConclusive evidence of a link between certain animalsand human Q-fever cases can only be provided bygenetic analysis of human, animal and environmentalsamples. Current typing techniques provide insufficientcontrast and methods for culturing and sequencingcarry bio safety concerns and are still under develop-ment. The presented attack rate analysis assumes homo-geneity in the distribution of Coxiella in each concentricring. In future analyses landscape features should betaken into account to make a more informative analysispossible. This should be combined with information onmovement patterns of human cases, recreational activ-ities and other behavioural factors that might changethe risk of exposure.
ConclusionsWe found a clear epidemiological link between a clusterof human Q-fever cases and a Q-fever positive dairygoat farm. The present study suggests an effective rangeof airborne C. burnetii spread of <5 kilometres. GIS-based automated attack rate analysis is a promising toolthat could classify animal locations as possible or unli-kely infection sources. This methodology should betransformed from a retrospective analysis to a real-timepinpointing tool to guide environmental sampling ofpotential sources. This requires close collaborationbetween the human and veterinary public health sectorsto ensure timely detection of cases, identification ofplausible sources and standardised environmental
Schimmer et al. BMC Infectious Diseases 2010, 10:69http://www.biomedcentral.com/1471-2334/10/69
Page 6 of 7
sampling, and application of public health and veterinarypreventive measures.
AcknowledgementsLuppo de Vries and Wouter Boasson at the National Institute for PublicHealth and the Environment provided technical support for the GIS-basedattack rate analysis. We also thank Yvonne van Duynhoven for criticallyreading the manuscript.
Author details1Centre for Infectious Disease Control, National Institute for Public Healthand the Environment, A van Leeuwenhoeklaan 9, PO Box 1, 3720 BABilthoven, the Netherlands. 2Municipal Health Service ‘Brabant Zuidoost’,Stadhuisplein 2, 5611 EM Eindhoven, the Netherlands. 3Laboratory forPathology and Medical Microbiology, De Run 6250, 5504 DL Veldhoven, theNetherlands. 4Region East, Food and Consumer Product Safety Authority, DeStoven 22, Postbus 202, 7200 AE Zutphen, the Netherlands. 5Department ofMedical Microbiology and Infection Control, Jeroen Bosch Hospital,Tolbrugstraat 11, PO Box 90153, 5200 ME, ‘s Hertogenbosch, theNetherlands. 6Department of Small Ruminant Health, Animal Health Service,Arnsbergstraat 7, PO Box 9, 7400 AA Deventer, the Netherlands.
Authors’ contributionsBS, PV and WvdH were involved in designing the study and the protocol fordata collection. RtS, MW, LZ, AdB and PV provided the human, veterinaryand environmental data. BS and TV conducted the data analysis. TVproduced the map. BS produced the first draft of the paper, which wasrevised by WvdH and PS following contributions from RtS, MW, LZ, AdB, TVand PV. All authors read and approved the final manuscript.
Competing interestsThe authors declare that they have no competing interests.
Received: 16 October 2009 Accepted: 16 March 2010Published: 16 March 2010
References1. Karagiannis I, Schimmer B, van Lier A, Timen A, Schneeberger P, van
Rotterdam B, de Bruin A, Wijkmans C, Rietveld A, van Duynhoven Y:Investigation of a Q fever outbreak in a rural area of The Netherlands.Epidemiol Infect 2009, 137:1283-1294.
2. Schimmer B, Morroy G, Dijkstra F, Schneeberger PM, Weers-Pothoff G,Timen A, Wijkmans C, Hoek van der W: Large ongoing Q fever outbreakin the south of The Netherlands, 2008. Euro Surveill 2008, 13, pii: 18939.
3. Schimmer B, Dijkstra F, Vellema P, Schneeberger PM, Hackert V, terSchegget R, Wijkmans C, van Duynhoven Y, Hoek van der W: Sustainedintensive transmission of Q fever in the south of the Netherlands, 2009.Euro Surveill 2009, 14, pii: 19210.
4. Brom Van den R, Vellema P: Q fever outbreaks in small ruminants andpeople in the Netherlands. Small Ruminant Res 2009, 86:74-79.
5. Tissot-Dupont H, Amadei MA, Nezri M, Raoult D: Wind in November, Qfever in December. Emerg Infect Dis 2004, 10:1264-1269.
6. Hawker JI, Ayres JG, Blair I, Evans MR, Smith DL, Smith EG, Burge PS,Carpenter MJ, Caul EO, Coupland B, Desselberger U, Farrell ID, Saunders PJ,Wood MJ: A large outbreak of Q fever in the West Midlands: windbornespread into a metropolitan area? Commun Dis Public Health 1998,1:180-187.
7. Péter O, Dupuis G, Peacock MG, Burgdorfer W: Comparison of enzyme-linked immunosorbent assay and complement fixation and indirectfluorescent-antibody tests for detection of Coxiella burnetii antibody.J Clin Microbiol 1987, 25:1063-1067.
8. Schneeberger PM, Hermans MHA, van Hannen EJ, Schellekens JJA,Leenders ACAP, Wever PC: Real-time PCR on serum samples isindispensable for early diagnosis of acute Q-fever. Clin Vaccine Immunol2010, 17:286-290.
Pre-publication historyThe pre-publication history for this paper can be accessed here:[http://www.biomedcentral.com/1471-2334/10/69/prepub]
doi:10.1186/1471-2334-10-69Cite this article as: Schimmer et al.: The use of a geographicinformation system to identify a dairy goat farm as the most likelysource of an urban Q-fever outbreak. BMC Infectious Diseases 2010 10:69.
Submit your next manuscript to BioMed Centraland take full advantage of:
• Convenient online submission
• Thorough peer review
• No space constraints or color figure charges
• Immediate publication on acceptance
• Inclusion in PubMed, CAS, Scopus and Google Scholar
• Research which is freely available for redistribution
Submit your manuscript at www.biomedcentral.com/submit
Schimmer et al. BMC Infectious Diseases 2010, 10:69http://www.biomedcentral.com/1471-2334/10/69
Page 7 of 7

70 | CHAPTER 3.2
sampling, and application of public health and veterinarypreventive measures.
AcknowledgementsLuppo de Vries and Wouter Boasson at the National Institute for PublicHealth and the Environment provided technical support for the GIS-basedattack rate analysis. We also thank Yvonne van Duynhoven for criticallyreading the manuscript.
Author details1Centre for Infectious Disease Control, National Institute for Public Healthand the Environment, A van Leeuwenhoeklaan 9, PO Box 1, 3720 BABilthoven, the Netherlands. 2Municipal Health Service ‘Brabant Zuidoost’,Stadhuisplein 2, 5611 EM Eindhoven, the Netherlands. 3Laboratory forPathology and Medical Microbiology, De Run 6250, 5504 DL Veldhoven, theNetherlands. 4Region East, Food and Consumer Product Safety Authority, DeStoven 22, Postbus 202, 7200 AE Zutphen, the Netherlands. 5Department ofMedical Microbiology and Infection Control, Jeroen Bosch Hospital,Tolbrugstraat 11, PO Box 90153, 5200 ME, ‘s Hertogenbosch, theNetherlands. 6Department of Small Ruminant Health, Animal Health Service,Arnsbergstraat 7, PO Box 9, 7400 AA Deventer, the Netherlands.
Authors’ contributionsBS, PV and WvdH were involved in designing the study and the protocol fordata collection. RtS, MW, LZ, AdB and PV provided the human, veterinaryand environmental data. BS and TV conducted the data analysis. TVproduced the map. BS produced the first draft of the paper, which wasrevised by WvdH and PS following contributions from RtS, MW, LZ, AdB, TVand PV. All authors read and approved the final manuscript.
Competing interestsThe authors declare that they have no competing interests.
Received: 16 October 2009 Accepted: 16 March 2010Published: 16 March 2010
References1. Karagiannis I, Schimmer B, van Lier A, Timen A, Schneeberger P, van
Rotterdam B, de Bruin A, Wijkmans C, Rietveld A, van Duynhoven Y:Investigation of a Q fever outbreak in a rural area of The Netherlands.Epidemiol Infect 2009, 137:1283-1294.
2. Schimmer B, Morroy G, Dijkstra F, Schneeberger PM, Weers-Pothoff G,Timen A, Wijkmans C, Hoek van der W: Large ongoing Q fever outbreakin the south of The Netherlands, 2008. Euro Surveill 2008, 13, pii: 18939.
3. Schimmer B, Dijkstra F, Vellema P, Schneeberger PM, Hackert V, terSchegget R, Wijkmans C, van Duynhoven Y, Hoek van der W: Sustainedintensive transmission of Q fever in the south of the Netherlands, 2009.Euro Surveill 2009, 14, pii: 19210.
4. Brom Van den R, Vellema P: Q fever outbreaks in small ruminants andpeople in the Netherlands. Small Ruminant Res 2009, 86:74-79.
5. Tissot-Dupont H, Amadei MA, Nezri M, Raoult D: Wind in November, Qfever in December. Emerg Infect Dis 2004, 10:1264-1269.
6. Hawker JI, Ayres JG, Blair I, Evans MR, Smith DL, Smith EG, Burge PS,Carpenter MJ, Caul EO, Coupland B, Desselberger U, Farrell ID, Saunders PJ,Wood MJ: A large outbreak of Q fever in the West Midlands: windbornespread into a metropolitan area? Commun Dis Public Health 1998,1:180-187.
7. Péter O, Dupuis G, Peacock MG, Burgdorfer W: Comparison of enzyme-linked immunosorbent assay and complement fixation and indirectfluorescent-antibody tests for detection of Coxiella burnetii antibody.J Clin Microbiol 1987, 25:1063-1067.
8. Schneeberger PM, Hermans MHA, van Hannen EJ, Schellekens JJA,Leenders ACAP, Wever PC: Real-time PCR on serum samples isindispensable for early diagnosis of acute Q-fever. Clin Vaccine Immunol2010, 17:286-290.
Pre-publication historyThe pre-publication history for this paper can be accessed here:[http://www.biomedcentral.com/1471-2334/10/69/prepub]
doi:10.1186/1471-2334-10-69Cite this article as: Schimmer et al.: The use of a geographicinformation system to identify a dairy goat farm as the most likelysource of an urban Q-fever outbreak. BMC Infectious Diseases 2010 10:69.
Submit your next manuscript to BioMed Centraland take full advantage of:
• Convenient online submission
• Thorough peer review
• No space constraints or color figure charges
• Immediate publication on acceptance
• Inclusion in PubMed, CAS, Scopus and Google Scholar
• Research which is freely available for redistribution
Submit your manuscript at www.biomedcentral.com/submit
Schimmer et al. BMC Infectious Diseases 2010, 10:69http://www.biomedcentral.com/1471-2334/10/69
Page 7 of 7


CHAPTER 3.3
A Q fever outbreak in a psychiatric care institution
R.P.M. KoeneB. Schimmer
H. RensenM. Biesheuvel
A. de BruinA. Lohuis
A. HorrevortsF. Verduijn Lunel
C.E. DelsingJ.L.A. Hautvast
Epidemiol Infect. 2011 Jan;139(1):13-18

CHAPTER 3.3
A Q fever outbreak in a psychiatric care institution
R.P.M. KoeneB. Schimmer
H. RensenM. Biesheuvel
A. de BruinA. Lohuis
A. HorrevortsF. Verduijn Lunel
C.E. DelsingJ.L.A. Hautvast
Epidemiol Infect. 2011 Jan;139(1):13-18
in the Netherlands
A Q fever outbreak in a psychiatric care institution inThe Netherlands
R. P. M. KOENE 1,2*, B. SCHIMMER 2,3, H. RENSEN 4, M. BIESHEUVEL 5,
A. DE BRUIN 6, A. LOHUIS 1, A. HORREVORTS7, F. VERDUYN LUNEL 8,
C. E. DELSING 9AND J. L. A. HAUTVAST 1,2
1 Municipal Health Service Region Nijmegen, The Netherlands2 Academic Collaborative Center Public Health AMPHI, Department of Public Health, Radboud University
Nijmegen Medical Centre, The Netherlands3 Centre for Infectious Disease Control, National Institute for Public Health and the Environment (RIVM),The Netherlands4 GGZ Location Nijmeegse Baan, Nijmegen, The Netherlands5 Food and Consumer Product Safety Authority (VWA), The Netherlands6 Laboratory for Zoonoses and Environmental Microbiology, Centre for Infectious Disease Control,National Institute for Public Health and the Environment (RIVM), The Netherlands7 Department of Medical Microbiology and Infectious diseases, Canisius Wilhelmina Hospital, Nijmegen,The Netherlands8 Department of Microbiology, Radboud University Nijmegen Medical Centre, The Netherlands9 Department of Internal Medicine and Infectious Diseases, Radboud University Nijmegen Medical Centre,The Netherlands
(Accepted 6 January 2010; first published online 9 February 2010)
SUMMARY
In May 2008 the Nijmegen Municipal Health Service (MHS) was informed about an outbreak
of atypical pneumonia in three in-patients of a long-term psychiatric institution. The patients had
been hospitalized and had laboratory confirmation of acute Q fever infection. The MHS started
active case finding among in-patients, employees of and visitors to the institution. In a small
meadow on the institution premises a flock of sheep was present. One of the lambs in the flock
had been abandoned by its mother and cuddled by the in-patients. Samples were taken of the
flock. Forty-five clinical cases were identified in employees, in-patients and visitors ; 28 were
laboratory confirmed as Q fever. Laboratory screening of pregnant women and persons with
valvular heart disease resulted in one confirmed Q fever case in a pregnant woman. Of 27 samples
from animals, seven were positive and 15 suspect for Coxiella burnetii infection. This outbreak
of Q fever in a unique psychiatric setting pointed to a small flock of sheep with newborn lambs as
the most likely source of exposure. Care institutions that have vulnerable residents and keep
flocks of sheep should be careful to take adequate hygienic measures during delivery of lambs and
handling of birth products.
Key words : Community outbreaks, coxiellae, zoonoses.
INTRODUCTION
Q fever is a zoonosis caused by Coxiella burnetii,
a small, pleomorphic Gram-negative obligate intra-
cellular bacterium. Ruminants, mainly sheep, goat
and cattle are the most common reservoir. C. burnetii
infections in animals are usually asymptomatic, but
may cause abortions in sheep and goats. High
* Author for correspondence : R. P. M. Koene, P.O. Box 1120, 6501 BC Nijmegen, The Netherlands. (Email : [email protected])
Epidemiol. Infect. (2011), 139, 13–18. f Cambridge University Press 2010
doi:10.1017/S095026881000021X
concentrations ofC. burnetii can be found in birth pro-
ducts of infected mammals [1]. Humans can acquire
infection by inhaling contaminated dust and aerosols.
The incubation period varies from 1 to 6 weeks de-
pending on the number of inhaled organisms, with
most patients becoming ill within 3 weeks of exposure
[2]. About half of those infected with C. burnetii show
signs of clinical illness, and 20% develop a more
severe infection complicated with pneumonia, hepa-
titis or another clinical diagnosis. Fatal infections are
rare [1, 2]. About 5% of cases are hospitalized but, in
a previous large outbreak in The Netherlands, this
reached more than 20% [3]. Certain conditions such
as pregnancy, heart valve and other vascular abnor-
malities predispose individuals to chronic Q fever [4].
In The Netherlands, acute Q fever is notifiable.
Between 2001 and 2006 the annual number of cases
varied from 5 to 19 per year. In 2007 and 2008, 191
and 1000 cases were notified, respectively [3]. In other
countries, such as Switzerland, Germany and the UK
several community outbreaks of Q fever in rural areas
due to aerosolized spread have been described [5–10].
In most cases these outbreaks were attributed to
sheep, although sometimes no source was detected.
Other outbreaks have been associated with goats,
cattle, pigeons, cats and rabbits [11–15]. Outbreaks
have also been described in abattoirs [16, 17].
Boschini and colleagues described an outbreak in
an Italian residential (‘closed’) facility for the re-
habilitation of drug users [18]. No other Q fever out-
breaks in a healthcare setting have been described.
OUTBREAK INVESTIGATION
Outbreak alert
On 9May 2008, a physician in a long-term psychiatric
institution located south-east of the city of Nijmegen
reported to the regional Municipal Health Service
(MHS) that three residents of the institution had been
hospitalized with atypical pneumonia. (For CXR of
one of the residents see Supplementary Fig. S1,
available online.) Symptoms included high fever,
headache, cough and chills. The physician suspected
an outbreak. In all three patients the diagnosis of
Q fever was confirmed by polymerase chain reaction
(PCR) on throat swabs or sputum samples. No other
infections, including Legionella and influenza were
diagnosed. Because of their presence on the premises
of the institution, sheep and birds were considered as
likely sources. Upon the alert day (day 0) MHS
Nijmegen started an outbreak investigation to deter-
mine the source and extent of the outbreak.
Outbreak setting
A total of 127 in-patients were resident in this long-
term psychiatric care institution; in addition, there
were 1285 ambulatory patients. Most patients suffered
from chronic psychiatric disorders such as schizo-
phrenia and bipolar disorders. The institution had 350
employees. The institution was openly accessible to
visitors.
Case finding
The MHS immediately started active case finding
among residents and employees of the institution. The
nursing staff were asked to be on the alert for clinical
symptoms in their in-patients. All staff of the psychi-
atric institution and nearby surrounding institutes
were also asked to be alert for possible cases. In ad-
dition, local and regional general practitioners and
appropriate hospital clinicians were warned to be
aware of possible cases, both in patients residing at
the institution as well as those in the local community.
Case finding of ambulatory patients and visitors was
not actively performed.
Case definitions
A suspected case was defined as a person who had
been living or working at the psychiatric institution or
in one of the neighbouring organizations on the same
premises ; or had visited the premises ; or lived within
500 m of the area in the 6 weeks prior to the alert and
who, in addition, had fever (>38.5 xC) and three or
more of the following symptoms: severe headache,
pneumonia (clinical or radiological), chills, sweats,
coughing, aching muscles, diarrhoea, fatigue or mal-
aise. A case was confirmed if C. burnetii was detected
in throat swab and/or blood samples using PCR, and/
or a fourfold rise in serum antibody titres to C. bur-
netii complement fixation test (CFT), and/or detec-
tion of IgM using an immunofluorescence assay
(IFA).
PCR tests of clinical specimen (both blood samples
and throat swabs) of suspected cases, CFTs for IgG,
and phase 1 (IgM) and phase 2 antibody IFAs were
performed.
From each confirmed case the following infor-
mation was obtained: general characteristics (age,
14 R. P. M. Koene and others

Q FEVER OUTBREAK IN A PSYCHIATRIC CARE INSTITUTION | 75
3.3
A Q fever outbreak in a psychiatric care institution inThe Netherlands
R. P. M. KOENE 1,2*, B. SCHIMMER 2,3, H. RENSEN 4, M. BIESHEUVEL 5,
A. DE BRUIN 6, A. LOHUIS 1, A. HORREVORTS7, F. VERDUYN LUNEL 8,
C. E. DELSING 9AND J. L. A. HAUTVAST 1,2
1 Municipal Health Service Region Nijmegen, The Netherlands2 Academic Collaborative Center Public Health AMPHI, Department of Public Health, Radboud University
Nijmegen Medical Centre, The Netherlands3 Centre for Infectious Disease Control, National Institute for Public Health and the Environment (RIVM),The Netherlands4 GGZ Location Nijmeegse Baan, Nijmegen, The Netherlands5 Food and Consumer Product Safety Authority (VWA), The Netherlands6 Laboratory for Zoonoses and Environmental Microbiology, Centre for Infectious Disease Control,National Institute for Public Health and the Environment (RIVM), The Netherlands7 Department of Medical Microbiology and Infectious diseases, Canisius Wilhelmina Hospital, Nijmegen,The Netherlands8 Department of Microbiology, Radboud University Nijmegen Medical Centre, The Netherlands9 Department of Internal Medicine and Infectious Diseases, Radboud University Nijmegen Medical Centre,The Netherlands
(Accepted 6 January 2010; first published online 9 February 2010)
SUMMARY
In May 2008 the Nijmegen Municipal Health Service (MHS) was informed about an outbreak
of atypical pneumonia in three in-patients of a long-term psychiatric institution. The patients had
been hospitalized and had laboratory confirmation of acute Q fever infection. The MHS started
active case finding among in-patients, employees of and visitors to the institution. In a small
meadow on the institution premises a flock of sheep was present. One of the lambs in the flock
had been abandoned by its mother and cuddled by the in-patients. Samples were taken of the
flock. Forty-five clinical cases were identified in employees, in-patients and visitors ; 28 were
laboratory confirmed as Q fever. Laboratory screening of pregnant women and persons with
valvular heart disease resulted in one confirmed Q fever case in a pregnant woman. Of 27 samples
from animals, seven were positive and 15 suspect for Coxiella burnetii infection. This outbreak
of Q fever in a unique psychiatric setting pointed to a small flock of sheep with newborn lambs as
the most likely source of exposure. Care institutions that have vulnerable residents and keep
flocks of sheep should be careful to take adequate hygienic measures during delivery of lambs and
handling of birth products.
Key words : Community outbreaks, coxiellae, zoonoses.
INTRODUCTION
Q fever is a zoonosis caused by Coxiella burnetii,
a small, pleomorphic Gram-negative obligate intra-
cellular bacterium. Ruminants, mainly sheep, goat
and cattle are the most common reservoir. C. burnetii
infections in animals are usually asymptomatic, but
may cause abortions in sheep and goats. High
* Author for correspondence : R. P. M. Koene, P.O. Box 1120, 6501 BC Nijmegen, The Netherlands. (Email : [email protected])
Epidemiol. Infect. (2011), 139, 13–18. f Cambridge University Press 2010
doi:10.1017/S095026881000021X
concentrations ofC. burnetii can be found in birth pro-
ducts of infected mammals [1]. Humans can acquire
infection by inhaling contaminated dust and aerosols.
The incubation period varies from 1 to 6 weeks de-
pending on the number of inhaled organisms, with
most patients becoming ill within 3 weeks of exposure
[2]. About half of those infected with C. burnetii show
signs of clinical illness, and 20% develop a more
severe infection complicated with pneumonia, hepa-
titis or another clinical diagnosis. Fatal infections are
rare [1, 2]. About 5% of cases are hospitalized but, in
a previous large outbreak in The Netherlands, this
reached more than 20% [3]. Certain conditions such
as pregnancy, heart valve and other vascular abnor-
malities predispose individuals to chronic Q fever [4].
In The Netherlands, acute Q fever is notifiable.
Between 2001 and 2006 the annual number of cases
varied from 5 to 19 per year. In 2007 and 2008, 191
and 1000 cases were notified, respectively [3]. In other
countries, such as Switzerland, Germany and the UK
several community outbreaks of Q fever in rural areas
due to aerosolized spread have been described [5–10].
In most cases these outbreaks were attributed to
sheep, although sometimes no source was detected.
Other outbreaks have been associated with goats,
cattle, pigeons, cats and rabbits [11–15]. Outbreaks
have also been described in abattoirs [16, 17].
Boschini and colleagues described an outbreak in
an Italian residential (‘closed’) facility for the re-
habilitation of drug users [18]. No other Q fever out-
breaks in a healthcare setting have been described.
OUTBREAK INVESTIGATION
Outbreak alert
On 9May 2008, a physician in a long-term psychiatric
institution located south-east of the city of Nijmegen
reported to the regional Municipal Health Service
(MHS) that three residents of the institution had been
hospitalized with atypical pneumonia. (For CXR of
one of the residents see Supplementary Fig. S1,
available online.) Symptoms included high fever,
headache, cough and chills. The physician suspected
an outbreak. In all three patients the diagnosis of
Q fever was confirmed by polymerase chain reaction
(PCR) on throat swabs or sputum samples. No other
infections, including Legionella and influenza were
diagnosed. Because of their presence on the premises
of the institution, sheep and birds were considered as
likely sources. Upon the alert day (day 0) MHS
Nijmegen started an outbreak investigation to deter-
mine the source and extent of the outbreak.
Outbreak setting
A total of 127 in-patients were resident in this long-
term psychiatric care institution; in addition, there
were 1285 ambulatory patients. Most patients suffered
from chronic psychiatric disorders such as schizo-
phrenia and bipolar disorders. The institution had 350
employees. The institution was openly accessible to
visitors.
Case finding
The MHS immediately started active case finding
among residents and employees of the institution. The
nursing staff were asked to be on the alert for clinical
symptoms in their in-patients. All staff of the psychi-
atric institution and nearby surrounding institutes
were also asked to be alert for possible cases. In ad-
dition, local and regional general practitioners and
appropriate hospital clinicians were warned to be
aware of possible cases, both in patients residing at
the institution as well as those in the local community.
Case finding of ambulatory patients and visitors was
not actively performed.
Case definitions
A suspected case was defined as a person who had
been living or working at the psychiatric institution or
in one of the neighbouring organizations on the same
premises ; or had visited the premises ; or lived within
500 m of the area in the 6 weeks prior to the alert and
who, in addition, had fever (>38.5 xC) and three or
more of the following symptoms: severe headache,
pneumonia (clinical or radiological), chills, sweats,
coughing, aching muscles, diarrhoea, fatigue or mal-
aise. A case was confirmed if C. burnetii was detected
in throat swab and/or blood samples using PCR, and/
or a fourfold rise in serum antibody titres to C. bur-
netii complement fixation test (CFT), and/or detec-
tion of IgM using an immunofluorescence assay
(IFA).
PCR tests of clinical specimen (both blood samples
and throat swabs) of suspected cases, CFTs for IgG,
and phase 1 (IgM) and phase 2 antibody IFAs were
performed.
From each confirmed case the following infor-
mation was obtained: general characteristics (age,
14 R. P. M. Koene and others

76 | CHAPTER 3.3
gender, place of residence), medical status (medical
history), and exposure information (contact with
animals at or around the premises of the institution).
At 10 weeks after Q fever diagnosis, 17 cases were fol-
lowed up and asked whether they still had symptoms.
In addition to the active case finding, active screening
of pregnant women and persons with valvular heart
disease linked to the institution was performed.
Epidemiological investigation
During the epidemiological investigation two main
hypotheses were explored. First, a flock of six sheep
present in a small meadow on the institution premises
for 5–6 years was considered a possible source of the
outbreak. Since this flock produced five lambs in the
weeks prior to the outbreak alert [the first born in
the beginning of April (day 38), the last on 8 May
(day 1)] it was the most likely source. In-patients
and outpatients could have been infected by inhaling
contaminated aerosols after close animal contact,
particularly with pregnant or newborn animals. One
of the lambs, born on 14 April (day 25), was aban-
doned by its mother and was adopted by one of the
in-patients, who took it into her bedroom and living
room (building 4, Fig. 1) and bottle-fed it six times a
day. Several in-patients cuddled this lamb. Three days
after its birth, it was placed in a rabbit cage on
the premises of the institution, and cared for by
in-patients and employees.
The other hypothesis was that cases were infected
by a large flock of sheep in a large meadow directly
opposite the main entrance of the institution. A flock
of about 200 sheep had grazed there until 1 April
(day 38). Two shepherds and the wife of one of the
shepherds had been confirmed as Q fever cases with
onset in March 2008. The hypothesis was that infec-
tion could have occurred by windborne spread from
Largemeadow
Standingplace of sheep andbirth lamb
Smallmeadows
Rabbit cage
Fig. 1. Map of the psychiatric institution, Nijmegen. Location of the meadows where the flock of sheep was grazing (white),location of the birth of the abandoned lamb, rabbit cage (black) and client residences with confirmed Q fever clients (greycircles) are indicated. Attack rate (AR) per building : building 4, AR 4/25 (16%); building 6, AR 1/26 (4%); building 7,
AR 2/26 (8%); building 8, AR 1/21 (5%); building 15 AR 1/68 (1%).
Q fever outbreak psychiatric care institution 15
the meadow, or by introduction of contaminated
animal products from this flock (such as straw, hay,
or compost), or by wild animals. Considering wind-
borne spread, the MHS assumed human Q fever cases
could have also occurred in the neighbouring com-
munity.
A detailed map of the institution premises was
used to plot cases, calculate attack rates (ARs) for
each building and indicate environmental information
such as the location of the meadow, the rabbit cage
and the predominant wind direction (Fig. 1).
Veterinary and environmental investigation
In order to identify the source of the outbreak an
environmental and veterinary investigationwas under-
taken by the Food & Consumer Safety Authority
and by scientists of the Laboratory of Zoonoses
and Environmental Microbiology of the National
Institute for Public Health and the Environment
(RIVM). Animal samples were collected from: (i) rab-
bits (anal and oral swabs) at the psychiatric insti-
tution, (ii) the sheep and lambs (vaginal and udder
swabs) who had been residing at the institution, but
had now moved, and (iii) the flock of sheep opposite
the entrance of the institution. Environmental samples
taken included faecal samples from the rabbit cage
and meadow (sheep) at the institution, and faecal
samples and wool from the flock of sheep opposite
the institution. All samples were sent for PCR testing
at the RIVM using a newly developed multiplex
Q-PCR [19]. MLVA (multiple locus VNTR analysis)
typing was used for some of the human and animal
specimens.
RESULTS
Q fever cases
Through active case finding 45 persons were identified
as suspected cases. Of those 28 (62%) were confirmed
by laboratory tests, as per the case definition. Of the
other 17 persons screened, all laboratory results (PCR,
CFT, IFA) were negative. Of the confirmed cases
there were 16 employees (one from a neighbouring
organization), 10 in-patients, one friend of an em-
ployee who had visited the institution and walked in
the meadow, and one person living nearby (<500 m)
(Fig. 2). The friend of the employee and the person
living nearby did not have close contact with the lamb
or sheep. The average mean age of the confirmed
cases was 42 years (range 15–63 years). Fifteen of the
28 cases were male.
The dates of onset of illness extended from 21 April
(day 18) to 17 June (day 39). Follow-up of 17 cases
showed that the median duration of illness was
2 weeks (range 0.5–3.5 weeks). At 10 weeks after
infection, 7/17 cases reported to be still suffering
from fatigue (a common sequela of Q fever). In all,
29% (8/28) of cases were hospitalized, six of whom
were in-patients and two employees of the institution.
The overall clinical AR was 7.9% (10/127) in in-
patients residing at the institution and 4.6% (16/350)
in employees. The ARs appeared to be highest (16%)
in building 4 (Fig. 1). This is probably due to the fact
that the lamb was placed in building 4 directly after
delivery. Nine of 10 confirmed cases resided in five of
the 15 buildings on the premises. These five buildings
were close to the small meadows where the sheep were
grazing. Denominators for the number of employees
0
1
2
3
4
5
6
7
11 A
pr.
25 A
pr.
9 May
23 M
ay
6 Jun
e
No.
of
case
s
Fig. 2. Confirmed ( ) and possible (%) Q fever cases in a psychiatric care institution by day of illness onset, April–June 2008(n=45).
16 R. P. M. Koene and others
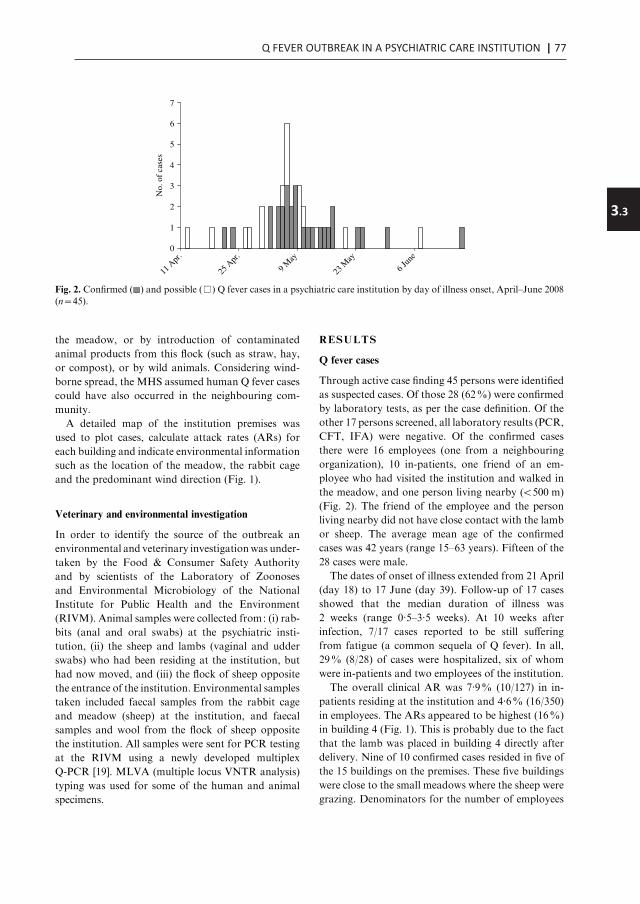
Q FEVER OUTBREAK IN A PSYCHIATRIC CARE INSTITUTION | 77
3.3
gender, place of residence), medical status (medical
history), and exposure information (contact with
animals at or around the premises of the institution).
At 10 weeks after Q fever diagnosis, 17 cases were fol-
lowed up and asked whether they still had symptoms.
In addition to the active case finding, active screening
of pregnant women and persons with valvular heart
disease linked to the institution was performed.
Epidemiological investigation
During the epidemiological investigation two main
hypotheses were explored. First, a flock of six sheep
present in a small meadow on the institution premises
for 5–6 years was considered a possible source of the
outbreak. Since this flock produced five lambs in the
weeks prior to the outbreak alert [the first born in
the beginning of April (day 38), the last on 8 May
(day 1)] it was the most likely source. In-patients
and outpatients could have been infected by inhaling
contaminated aerosols after close animal contact,
particularly with pregnant or newborn animals. One
of the lambs, born on 14 April (day 25), was aban-
doned by its mother and was adopted by one of the
in-patients, who took it into her bedroom and living
room (building 4, Fig. 1) and bottle-fed it six times a
day. Several in-patients cuddled this lamb. Three days
after its birth, it was placed in a rabbit cage on
the premises of the institution, and cared for by
in-patients and employees.
The other hypothesis was that cases were infected
by a large flock of sheep in a large meadow directly
opposite the main entrance of the institution. A flock
of about 200 sheep had grazed there until 1 April
(day 38). Two shepherds and the wife of one of the
shepherds had been confirmed as Q fever cases with
onset in March 2008. The hypothesis was that infec-
tion could have occurred by windborne spread from
Largemeadow
Standingplace of sheep andbirth lamb
Smallmeadows
Rabbit cage
Fig. 1. Map of the psychiatric institution, Nijmegen. Location of the meadows where the flock of sheep was grazing (white),location of the birth of the abandoned lamb, rabbit cage (black) and client residences with confirmed Q fever clients (greycircles) are indicated. Attack rate (AR) per building : building 4, AR 4/25 (16%); building 6, AR 1/26 (4%); building 7,
AR 2/26 (8%); building 8, AR 1/21 (5%); building 15 AR 1/68 (1%).
Q fever outbreak psychiatric care institution 15
the meadow, or by introduction of contaminated
animal products from this flock (such as straw, hay,
or compost), or by wild animals. Considering wind-
borne spread, the MHS assumed human Q fever cases
could have also occurred in the neighbouring com-
munity.
A detailed map of the institution premises was
used to plot cases, calculate attack rates (ARs) for
each building and indicate environmental information
such as the location of the meadow, the rabbit cage
and the predominant wind direction (Fig. 1).
Veterinary and environmental investigation
In order to identify the source of the outbreak an
environmental and veterinary investigationwas under-
taken by the Food & Consumer Safety Authority
and by scientists of the Laboratory of Zoonoses
and Environmental Microbiology of the National
Institute for Public Health and the Environment
(RIVM). Animal samples were collected from: (i) rab-
bits (anal and oral swabs) at the psychiatric insti-
tution, (ii) the sheep and lambs (vaginal and udder
swabs) who had been residing at the institution, but
had now moved, and (iii) the flock of sheep opposite
the entrance of the institution. Environmental samples
taken included faecal samples from the rabbit cage
and meadow (sheep) at the institution, and faecal
samples and wool from the flock of sheep opposite
the institution. All samples were sent for PCR testing
at the RIVM using a newly developed multiplex
Q-PCR [19]. MLVA (multiple locus VNTR analysis)
typing was used for some of the human and animal
specimens.
RESULTS
Q fever cases
Through active case finding 45 persons were identified
as suspected cases. Of those 28 (62%) were confirmed
by laboratory tests, as per the case definition. Of the
other 17 persons screened, all laboratory results (PCR,
CFT, IFA) were negative. Of the confirmed cases
there were 16 employees (one from a neighbouring
organization), 10 in-patients, one friend of an em-
ployee who had visited the institution and walked in
the meadow, and one person living nearby (<500 m)
(Fig. 2). The friend of the employee and the person
living nearby did not have close contact with the lamb
or sheep. The average mean age of the confirmed
cases was 42 years (range 15–63 years). Fifteen of the
28 cases were male.
The dates of onset of illness extended from 21 April
(day 18) to 17 June (day 39). Follow-up of 17 cases
showed that the median duration of illness was
2 weeks (range 0.5–3.5 weeks). At 10 weeks after
infection, 7/17 cases reported to be still suffering
from fatigue (a common sequela of Q fever). In all,
29% (8/28) of cases were hospitalized, six of whom
were in-patients and two employees of the institution.
The overall clinical AR was 7.9% (10/127) in in-
patients residing at the institution and 4.6% (16/350)
in employees. The ARs appeared to be highest (16%)
in building 4 (Fig. 1). This is probably due to the fact
that the lamb was placed in building 4 directly after
delivery. Nine of 10 confirmed cases resided in five of
the 15 buildings on the premises. These five buildings
were close to the small meadows where the sheep were
grazing. Denominators for the number of employees
0
1
2
3
4
5
6
7
11 A
pr.
25 A
pr.
9 May
23 M
ay
6 Jun
e
No.
of
case
s
Fig. 2. Confirmed ( ) and possible (%) Q fever cases in a psychiatric care institution by day of illness onset, April–June 2008(n=45).
16 R. P. M. Koene and others

78 | CHAPTER 3.3
per building were unavailable, and ARs for employees
per building could not be calculated. The buildings
with confirmed Q fever residents were in general closer
to one of the small meadows or the rabbit cage (or
harboured the abandoned lamb, building 4) com-
pared to the other buildings.
Screening of employees pregnant or with valvular
lesions
Screening of 24 asymptomatic pregnant employees
of the institution resulted in one positive Q fever
infection in a woman who was 38 weeks pregnant.
This woman was hospitalized and labour was in-
duced, because of the risk of placentitis. A healthy
infant was born and PCR on birth products was
negative. None of the six screened persons with val-
vular heart disease became infected.
Results of the veterinary and environmental
investigation
Of 27 animal samples analysed, five were negative,
15 were suspect for Q fever, with one or two out of
three genomic targets positive in Q-PCR, but con-
cluded to be negative, and seven were found to be
positive (all three genomic targets positive in Q-PCR).
The positive samples were obtained from three ewes
and the abandoned lamb from the small meadow.
Vaginal and udder swabs were found to be positive
in two ewes. A vaginal swab and a wool sample were
found to be positive in a third ewe. The abandoned
lamb was found to be positive from a throat swab.
No other potential wild or domestic animal sources
were identified. Of the flock of sheep that had been
grazing outside the premises 10 were tested; all were
negative.
DISCUSSION
To our knowledge, this is the first reported outbreak
of Q fever related to lambing, in an open healthcare
institution. Our investigation pointed to a small flock
of sheep with newborn lambs on the premises of the
institution as the most probable source of exposure.
Due to the unique and restricted setting of this out-
break in a psychiatric care institution, exhaustive
screening of risk groups was feasible. However,
an analytical study in this type of setting was not
possible. Urgent outbreak control was also para-
mount.
This outbreak investigation was thus limited to de-
scriptive analyses on active case finding and active
screening of risk groups, and it was not possible to
investigate exposure of asymptomatic cases or involve
controls.
Our outbreak investigation nevertheless strongly
suggested that the flock of sheep and its newborn
lambs were the most likely sources of the outbreak,
in accord with other studies [5, 8, 18, 20]. During the
Q fever outbreak in The Netherlands, which has been
ongoing since 2007, MLVA typing of samples from
patients, ewes and lambs showed similar relationships
between each other. In this study a swab specimen
from a newborn lamb showed an identical MLVA
genotype to that from a patient who developed severe
pneumonia after close cuddling with a lamb in
another incident [21].
It is possible that other, untested lambs of the small
flock, that were born before or after the birth of the
abandoned lamb, were carriers of C. burnetii and
caused illness. Presuming the abandoned lamb was
the main source of this outbreak, the infectious
potential of this one lamb was comparable to that of
entire flocks in different settings as described in the
study of a superspreading ewe [20]. If the abandoned
lamb at birth on 14 April 2008 was the main source
of this Q fever outbreak, the mean incubation period
of the cases was 27 days (range 7–64 days), which is
higher than the incubation period of 3 weeks found
in comparable studies [9, 20]. This suggests that
transmission could have taken place during delivery,
but in addition also after delivery. The rejection by
the mother offered an opportunity for the psychiatric
patients to have frequent and in some instances, in-
tensive contact with the abandoned lamb. In addition,
the possibility of infection by inhalation of contami-
nated dust (from manure or birth products) by in-
patients and employees should be considered, taking
into account that the first day of illness of some cases
exceeds the maximal incubation time of 6 weeks after
the birth of the lamb.
The observed overall ARs in in-patients (7.9%)
and employees (4.6%) are comparable with those
described in a recent study of an outbreak in a
German village, which showed an AR of 4.3% in
citizens living in the area within 400 m of a suspected
meadow [8].
The proportion of clinical cases hospitalized was
29%, which is similar to a 25% hospitalization
rate in the outbreak caused by a superspreading
ewe in a market in Germany [20], but substantially
Q fever outbreak psychiatric care institution 17
higher than the average of 9% found in other studies
[6, 9, 18].
Markedly, 60% (6/10) of Q fever cases in in-
patients were hospitalized, compared to 13% (2/16)
of the employees. Possibly, case finding in employees
was more complete and included milder cases.
Future preventive measures should focus on
reducing contact with lambing sheep and increase
awareness in personnel and occupational health pro-
fessionals of the potential health risks posed in similar
settings. After a study of a large outbreak of Q fever
at a farmers’ market in Germany [20] the authors
recommended that pregnant sheep should not be
displayed in public during the third trimester, and
that animals in petting zoos should be tested regularly
for C. burnetii [20]. Another study recommend not
keeping sheep within 500 m of residential areas and
that lambing of sheep should not occur outdoors [8].
Care institutions with vulnerable residents maintain-
ing flocks of sheep should be made to take adequate
hygienic measures during delivery of the sheep and
handling of birth products.
NOTE
Supplementarymaterial accompanies this paper on the
Journal’s website (http://journals.cambridge.org/hyg).
ACKNOWLEDGEMENTS
We thank employees of the Food and Consumer
Product Safety Authority (VWA), especially Astrid de
Groot for taking samples for veterinary environmen-
tal investigation. Furthermore, the in-patients and
employees of the psychiatric institution are acknowl-
edged for kindly cooperating in the collection of data.
DECLARATION OF INTEREST
None.
REFERENCES
1. Raoult D, Marrie T.Q fever. Clinical Infectious Diseases1995; 20 : 489–495.
2. Maurin M, Raoult D. Q fever. Clinical MicrobiologyReviews 1999; 12 : 518–553.
3. Schimmer B, et al. Large ongoing Q fever outbreak inthe south of the Netherlands, 2008. Eurosurveillance
2008; 13(31).
4. Fenollar R, et al. Chronic endocarditis following acuteQ fever. Clinical Infectious Diseases 2000; 33 : 312–316.
5. Salmon MM, et al. Q fever in an urban area. Lancet1982; 1 : 1002–1004.
6. Dupuis G, et al. An important outbreak of human
Q-fever in a Swiss Alpine valley. International Journalof Epidemiology 1987; 16 : 282–287.
7. Hawker JI, et al. A large outbreak of Q fever in theWest Midlands : windborne spread into a metropolitan
area? Communicable Disease and Public Health 1998; 1 :180–187.
8. Gilsdorf A, et al. Large Q fever outbreak due to sheep
farming near residential areas, Germany, 2005. Epi-demiology and Infection 2008; 136 : 1084–1087.
9. Lyytikınen O, et al. An outbreak of sheep-associated
Q fever in a rural community in Germany. EuropeanJournal of Epidemiology 1997; 14 : 193–199.
10. Robert Koch Institut. Large Q fever outbreak in Jena,
June 2005 [in German]. Epidemiologisches Bulletin 2006;45 : 391–395.
11. Hatchette TF, et al. Goat-associated Q fever : a newdisease in Newfoundland. Emerging Infectious Diseases
2001; 7 : 413–419.12. Tylewska-Wierzbanowska S, et al. Epidemics of Q fever
in Poland in 1992-1994. Roczniki Akademii Medycznej
w Białymstoku 1996; 41 : 123–128.13. Stein A. Pigeon pneumonia in provence : a bird-borne
Q fever outbreak. Clinical Infectious Diseases 1999; 29 :
617–620.14. Pinsky RL.An outbreak of cat-associated Q fever in the
United States. Journal of Infectious Diseases 1991; 164 :
202–204.15. Marrie TJ, et al. Q fever pneumonia associated with
exposure to wild rabbits. Lancet 1986; 1 : 427–429.16. Carriere MP, et al. Investigation of a slaughterhouse-
related outbreak of Q fever in the French Alps.European Journal of Clinical Microbiology & InfectiousDiseases 2002; 21 : 17–21.
17. Donaghy M, et al. Outbreak of Q fever in workers at ameat processing plant in Scotland, July 2006. Eurosur-veillance (http://www.eurosurveillance.org/ViewArticle.
aspx?ArticleId=3031).18. Boschini A, et al. Consecutive epidemics of Q fever in a
residential facility for drug abusers : impact on personswith human immunodeficiency virus infection. Clinical
Infectious Diseases 1999; 28 : 866–872.19. De Bruin A, et al. A Query for Q-fever using a new
developed multiplex Q-PCR. 4th Annual meeting
MedVetNet Network of Excellence EU 2008, St. Malo,France. Poster DC27 (http://www.medvetnet.org/pdf/Conferences/abstract_book_website.pdf). Accessed
June 2008.20. Porten K, et al. A super-spreading ewe infects hundreds
with Q fever at a farmers’ market in Germany. BMC
Infectious Diseases 2006; 6 : 147.21. Klaassen CHW, et al.Multigenotype Q Fever outbreak,
the Netherlands [Letter]. Emerging Infectious Diseases2009; 15 : 613.
18 R. P. M. Koene and others

Q FEVER OUTBREAK IN A PSYCHIATRIC CARE INSTITUTION | 79
3.3
per building were unavailable, and ARs for employees
per building could not be calculated. The buildings
with confirmed Q fever residents were in general closer
to one of the small meadows or the rabbit cage (or
harboured the abandoned lamb, building 4) com-
pared to the other buildings.
Screening of employees pregnant or with valvular
lesions
Screening of 24 asymptomatic pregnant employees
of the institution resulted in one positive Q fever
infection in a woman who was 38 weeks pregnant.
This woman was hospitalized and labour was in-
duced, because of the risk of placentitis. A healthy
infant was born and PCR on birth products was
negative. None of the six screened persons with val-
vular heart disease became infected.
Results of the veterinary and environmental
investigation
Of 27 animal samples analysed, five were negative,
15 were suspect for Q fever, with one or two out of
three genomic targets positive in Q-PCR, but con-
cluded to be negative, and seven were found to be
positive (all three genomic targets positive in Q-PCR).
The positive samples were obtained from three ewes
and the abandoned lamb from the small meadow.
Vaginal and udder swabs were found to be positive
in two ewes. A vaginal swab and a wool sample were
found to be positive in a third ewe. The abandoned
lamb was found to be positive from a throat swab.
No other potential wild or domestic animal sources
were identified. Of the flock of sheep that had been
grazing outside the premises 10 were tested; all were
negative.
DISCUSSION
To our knowledge, this is the first reported outbreak
of Q fever related to lambing, in an open healthcare
institution. Our investigation pointed to a small flock
of sheep with newborn lambs on the premises of the
institution as the most probable source of exposure.
Due to the unique and restricted setting of this out-
break in a psychiatric care institution, exhaustive
screening of risk groups was feasible. However,
an analytical study in this type of setting was not
possible. Urgent outbreak control was also para-
mount.
This outbreak investigation was thus limited to de-
scriptive analyses on active case finding and active
screening of risk groups, and it was not possible to
investigate exposure of asymptomatic cases or involve
controls.
Our outbreak investigation nevertheless strongly
suggested that the flock of sheep and its newborn
lambs were the most likely sources of the outbreak,
in accord with other studies [5, 8, 18, 20]. During the
Q fever outbreak in The Netherlands, which has been
ongoing since 2007, MLVA typing of samples from
patients, ewes and lambs showed similar relationships
between each other. In this study a swab specimen
from a newborn lamb showed an identical MLVA
genotype to that from a patient who developed severe
pneumonia after close cuddling with a lamb in
another incident [21].
It is possible that other, untested lambs of the small
flock, that were born before or after the birth of the
abandoned lamb, were carriers of C. burnetii and
caused illness. Presuming the abandoned lamb was
the main source of this outbreak, the infectious
potential of this one lamb was comparable to that of
entire flocks in different settings as described in the
study of a superspreading ewe [20]. If the abandoned
lamb at birth on 14 April 2008 was the main source
of this Q fever outbreak, the mean incubation period
of the cases was 27 days (range 7–64 days), which is
higher than the incubation period of 3 weeks found
in comparable studies [9, 20]. This suggests that
transmission could have taken place during delivery,
but in addition also after delivery. The rejection by
the mother offered an opportunity for the psychiatric
patients to have frequent and in some instances, in-
tensive contact with the abandoned lamb. In addition,
the possibility of infection by inhalation of contami-
nated dust (from manure or birth products) by in-
patients and employees should be considered, taking
into account that the first day of illness of some cases
exceeds the maximal incubation time of 6 weeks after
the birth of the lamb.
The observed overall ARs in in-patients (7.9%)
and employees (4.6%) are comparable with those
described in a recent study of an outbreak in a
German village, which showed an AR of 4.3% in
citizens living in the area within 400 m of a suspected
meadow [8].
The proportion of clinical cases hospitalized was
29%, which is similar to a 25% hospitalization
rate in the outbreak caused by a superspreading
ewe in a market in Germany [20], but substantially
Q fever outbreak psychiatric care institution 17
higher than the average of 9% found in other studies
[6, 9, 18].
Markedly, 60% (6/10) of Q fever cases in in-
patients were hospitalized, compared to 13% (2/16)
of the employees. Possibly, case finding in employees
was more complete and included milder cases.
Future preventive measures should focus on
reducing contact with lambing sheep and increase
awareness in personnel and occupational health pro-
fessionals of the potential health risks posed in similar
settings. After a study of a large outbreak of Q fever
at a farmers’ market in Germany [20] the authors
recommended that pregnant sheep should not be
displayed in public during the third trimester, and
that animals in petting zoos should be tested regularly
for C. burnetii [20]. Another study recommend not
keeping sheep within 500 m of residential areas and
that lambing of sheep should not occur outdoors [8].
Care institutions with vulnerable residents maintain-
ing flocks of sheep should be made to take adequate
hygienic measures during delivery of the sheep and
handling of birth products.
NOTE
Supplementarymaterial accompanies this paper on the
Journal’s website (http://journals.cambridge.org/hyg).
ACKNOWLEDGEMENTS
We thank employees of the Food and Consumer
Product Safety Authority (VWA), especially Astrid de
Groot for taking samples for veterinary environmen-
tal investigation. Furthermore, the in-patients and
employees of the psychiatric institution are acknowl-
edged for kindly cooperating in the collection of data.
DECLARATION OF INTEREST
None.
REFERENCES
1. Raoult D, Marrie T.Q fever. Clinical Infectious Diseases1995; 20 : 489–495.
2. Maurin M, Raoult D. Q fever. Clinical MicrobiologyReviews 1999; 12 : 518–553.
3. Schimmer B, et al. Large ongoing Q fever outbreak inthe south of the Netherlands, 2008. Eurosurveillance
2008; 13(31).
4. Fenollar R, et al. Chronic endocarditis following acuteQ fever. Clinical Infectious Diseases 2000; 33 : 312–316.
5. Salmon MM, et al. Q fever in an urban area. Lancet1982; 1 : 1002–1004.
6. Dupuis G, et al. An important outbreak of human
Q-fever in a Swiss Alpine valley. International Journalof Epidemiology 1987; 16 : 282–287.
7. Hawker JI, et al. A large outbreak of Q fever in theWest Midlands : windborne spread into a metropolitan
area? Communicable Disease and Public Health 1998; 1 :180–187.
8. Gilsdorf A, et al. Large Q fever outbreak due to sheep
farming near residential areas, Germany, 2005. Epi-demiology and Infection 2008; 136 : 1084–1087.
9. Lyytikınen O, et al. An outbreak of sheep-associated
Q fever in a rural community in Germany. EuropeanJournal of Epidemiology 1997; 14 : 193–199.
10. Robert Koch Institut. Large Q fever outbreak in Jena,
June 2005 [in German]. Epidemiologisches Bulletin 2006;45 : 391–395.
11. Hatchette TF, et al. Goat-associated Q fever : a newdisease in Newfoundland. Emerging Infectious Diseases
2001; 7 : 413–419.12. Tylewska-Wierzbanowska S, et al. Epidemics of Q fever
in Poland in 1992-1994. Roczniki Akademii Medycznej
w Białymstoku 1996; 41 : 123–128.13. Stein A. Pigeon pneumonia in provence : a bird-borne
Q fever outbreak. Clinical Infectious Diseases 1999; 29 :
617–620.14. Pinsky RL.An outbreak of cat-associated Q fever in the
United States. Journal of Infectious Diseases 1991; 164 :
202–204.15. Marrie TJ, et al. Q fever pneumonia associated with
exposure to wild rabbits. Lancet 1986; 1 : 427–429.16. Carriere MP, et al. Investigation of a slaughterhouse-
related outbreak of Q fever in the French Alps.European Journal of Clinical Microbiology & InfectiousDiseases 2002; 21 : 17–21.
17. Donaghy M, et al. Outbreak of Q fever in workers at ameat processing plant in Scotland, July 2006. Eurosur-veillance (http://www.eurosurveillance.org/ViewArticle.
aspx?ArticleId=3031).18. Boschini A, et al. Consecutive epidemics of Q fever in a
residential facility for drug abusers : impact on personswith human immunodeficiency virus infection. Clinical
Infectious Diseases 1999; 28 : 866–872.19. De Bruin A, et al. A Query for Q-fever using a new
developed multiplex Q-PCR. 4th Annual meeting
MedVetNet Network of Excellence EU 2008, St. Malo,France. Poster DC27 (http://www.medvetnet.org/pdf/Conferences/abstract_book_website.pdf). Accessed
June 2008.20. Porten K, et al. A super-spreading ewe infects hundreds
with Q fever at a farmers’ market in Germany. BMC
Infectious Diseases 2006; 6 : 147.21. Klaassen CHW, et al.Multigenotype Q Fever outbreak,
the Netherlands [Letter]. Emerging Infectious Diseases2009; 15 : 613.
18 R. P. M. Koene and others

80 | CHAPTER 3.3
Supplementary Figure S1. Posterior-anterior chest X-ray of a female patient
showing infiltrates in the right upper and lower lobes.


CHAPTER 3.4
Visits on ‘lamb-viewing days’ at a sheep farm open to thepublic was a risk factor for Q fever in 2009
J. WhelanB. Schimmer
A. de BruinM. Robert-Du Ry van Beest Holle
W. van der HoekR. ter Schegget
Epidemiol Infect. 2012 May;140(5):858-64

CHAPTER 3.4
Visits on ‘lamb-viewing days’ at a sheep farm open to thepublic was a risk factor for Q fever in 2009
J. WhelanB. Schimmer
A. de BruinM. Robert-Du Ry van Beest Holle
W. van der HoekR. ter Schegget
Epidemiol Infect. 2012 May;140(5):858-64

Visits on ‘ lamb-viewing days’ at a sheep farm open to thepublic was a risk factor for Q fever in 2009
J. WHELAN 1,2*, B. SCHIMMER 1, A. DE BRUIN1, M. ROBERT-DU RY VAN
BEEST HOLLE 1, W. VAN DER HOEK1AND R. TER SCHEGGET3
1 Centre for Infectious Disease Control, National Institute for Public Health and the Environment, RIVM,
Bilthoven, The Netherlands2 European Programme for Intervention Epidemiology Training (EPIET), European Centre for DiseasePrevention and Control (ECDC), Stockholm, Sweden3 Municipal Health Service Brabant-Zuidoost, Eindhoven, The Netherlands
(Accepted 5 July 2011; first published online 11 August 2011)
SUMMARY
Between February and May 2009, 347 laboratory-confirmed cases of acute Q fever were reported
in a southern municipal health service region in The Netherlands. Commercial dairy-goat farms
were implicated and control measures were initially targeted there. A preliminary investigation
also implicated a non-dairy sheep farm, open to the public on ‘ lamb-viewing days’. This study
tested the association between visiting the non-dairy sheep farm and developing Q fever in
residents of the region between February and May 2009. A case-control study of 146 cases and
431 address-matched controls was conducted. Multivariable logistic regression analysis confirmed
the association between visiting to the sheep farm and Q fever disease (matched odds ratio 43,
95% confidence interval 9–200). Other risk factors were being a smoker, having a past medical
history and being aged >40 years. Vaccination of sheep and goats on farms open to the public
should help to reduce the number of future human cases.
Key words: Case-control study, Coxiella, Q fever, The Netherlands.
INTRODUCTION
Q fever is a zoonosis caused by the bacterium Coxiella
burnetii. The bacterium is found in the milk, urine,
faeces and wool of infected animals (particularly
sheep, goats and cattle) but birth products are known
to be highly contagious [1–3]. It is hypothesized that
human infection occurs through inhalation of con-
taminated aerosols [4]. Since 2007, over 3000 cases
have been reported in The Netherlands (2354 cases
in 2009 alone), peaking annually in spring–early
summer. Commercial dairy-goat farms and some
dairy-sheep farms have been implicated in the spread
of disease. Control measures in 2008 and 2009
were centred on these farms, as the risk associated
with non-milk-producing farms was thought to be
low [5].
Limited data are available in relation to what other
agricultural sectors might have contributed to the
spread of disease.
In 2009, the municipal health service in the south-
east region of Brabant province (MHS Brabant
Southeast) received over 400 notifications of Q fever
* Author for correspondence : Dr J. Whelan, P.218 Postbak 75,Epidemiology & Surveillance Unit (EPI), National Institute forPublic Health and the Environment (RIVM), PO Box 1, 3720 BABilthoven, The Netherlands.(Email : [email protected])
Epidemiol. Infect. (2012), 140, 858–864. f Cambridge University Press 2011
doi:10.1017/S0950268811001427
of which 379 were laboratory-confirmed cases (Fig. 1).
The majority of these cases were probably explained
by residence near an infected dairy-goat farm located
northeast of Helmond city [6]. Following a trawling
questionnaire conducted with 343 confirmed cases, a
second cluster, possibly associated with a non-dairy
sheep farm, was identified in the region. Forty-six
cases spontaneously indicated in an open-text ques-
tion that they had visited the sheep farm (farm X)
during the lambing season in February–March 2009.
In the trawling questionnaires other veterinary sources
were listed, such as a visit to a pet goat farm and a
zoo, but these locations were common for only two
and three cases, respectively.
Farm X has been open to the public during the
lambing season since 2004. In 2009, it was open each
Saturday from 1 February until 31 March and there
were an estimated 12000 visitors to the farm, most of
whom lived locally within 25 km of the farm. More
than 1200 lambs were born that season (the majority
in January and February), and visitors could oc-
casionally witness the birth of a lamb and were en-
couraged to watch the lambs play. Only three
abortions were reported on the farm during this
season, which is less than might be expected in a
typical season, unaffected by Q fever.
The aim of this study was to test whether there
was an association between visiting farm X and de-
veloping Q fever in residents of Southeast Brabant
in February–May 2009. A secondary objective was
to identify risk factors for acquiring Q fever (or a
C. burnetii infection) in people who visited the farm.
METHODS
Epidemiological investigation
Southeast Brabant is predominantly an agricultural
region in the south of The Netherlands bordering
Belgium. A case-control study was conducted in the
region in June 2010. All adults aged o18 years who
were normally resident in Southeast Brabant between
1 February and 31 of March 2009 were eligible for
inclusion (n=732 731). The exposure of interest was a
visit to farm X between 1 February (end of week 5)
and 31 March (beginning week 14) in 2009 (the period
when the farm was open to the public). Given a
minimum incubation period of 3 days and a maxi-
mum incubation period of about 6 weeks [4, 7], cases
were defined as adult inhabitants of the region who
were notified with Q fever and for whom illness onset
was between 1 February (end of week 5) and 15 May
(end of week 20), 2009 (Fig. 1). In The Netherlands,
criteria for notification of acute illness are presence of
at least fever, pneumonia, or hepatitis plus laboratory
confirmation of C. burnetii infection with (a) poly-
merase chain reaction (PCR), or (b) detection of a
fourfold rise in serum antibody titres to C. burnetii or
a high titre in two samples without a fourfold in-
crease, or (c) a single high titre of IgM to phase II
antigen. Controls were householders randomly
selected based on having an address in the same
six-digit postcode area (living on the same street) as
each case.
Data were collected by means of a postal ques-
tionnaire addressed individually to named cases, and
Farm X opento public*
Cases eligible forinclusion†
1 3 5 7 9 11 13 15 17 19 21 23 25 27 29 32 34 37 42 51
Did not visit farm X
Visited farm X
Week of onset 2009
No.
of c
ases
70
60
50
40
30
20
10
0
Fig. 1.Q fever cases by week of onset of symptoms and visits to farm X. Brabant Southeast, The Netherlands, 2009. * Farm Xwas open on weekends only from 1 February (week 5) to 31 March (week 14). # 246 cases had a date of onset of illnessbetween 1 February 2009 and 15 May 2009 and were eligible for inclusion in the study.
Visits to a non-dairy sheep farm associated with Q fever 859

VISITS ON ‘LAMB-VIEWING DAYS’ RISK FACTOR FOR Q FEVER | 85
3.4
Visits on ‘ lamb-viewing days’ at a sheep farm open to thepublic was a risk factor for Q fever in 2009
J. WHELAN 1,2*, B. SCHIMMER 1, A. DE BRUIN1, M. ROBERT-DU RY VAN
BEEST HOLLE 1, W. VAN DER HOEK1AND R. TER SCHEGGET3
1 Centre for Infectious Disease Control, National Institute for Public Health and the Environment, RIVM,
Bilthoven, The Netherlands2 European Programme for Intervention Epidemiology Training (EPIET), European Centre for DiseasePrevention and Control (ECDC), Stockholm, Sweden3 Municipal Health Service Brabant-Zuidoost, Eindhoven, The Netherlands
(Accepted 5 July 2011; first published online 11 August 2011)
SUMMARY
Between February and May 2009, 347 laboratory-confirmed cases of acute Q fever were reported
in a southern municipal health service region in The Netherlands. Commercial dairy-goat farms
were implicated and control measures were initially targeted there. A preliminary investigation
also implicated a non-dairy sheep farm, open to the public on ‘ lamb-viewing days’. This study
tested the association between visiting the non-dairy sheep farm and developing Q fever in
residents of the region between February and May 2009. A case-control study of 146 cases and
431 address-matched controls was conducted. Multivariable logistic regression analysis confirmed
the association between visiting to the sheep farm and Q fever disease (matched odds ratio 43,
95% confidence interval 9–200). Other risk factors were being a smoker, having a past medical
history and being aged >40 years. Vaccination of sheep and goats on farms open to the public
should help to reduce the number of future human cases.
Key words: Case-control study, Coxiella, Q fever, The Netherlands.
INTRODUCTION
Q fever is a zoonosis caused by the bacterium Coxiella
burnetii. The bacterium is found in the milk, urine,
faeces and wool of infected animals (particularly
sheep, goats and cattle) but birth products are known
to be highly contagious [1–3]. It is hypothesized that
human infection occurs through inhalation of con-
taminated aerosols [4]. Since 2007, over 3000 cases
have been reported in The Netherlands (2354 cases
in 2009 alone), peaking annually in spring–early
summer. Commercial dairy-goat farms and some
dairy-sheep farms have been implicated in the spread
of disease. Control measures in 2008 and 2009
were centred on these farms, as the risk associated
with non-milk-producing farms was thought to be
low [5].
Limited data are available in relation to what other
agricultural sectors might have contributed to the
spread of disease.
In 2009, the municipal health service in the south-
east region of Brabant province (MHS Brabant
Southeast) received over 400 notifications of Q fever
* Author for correspondence : Dr J. Whelan, P.218 Postbak 75,Epidemiology & Surveillance Unit (EPI), National Institute forPublic Health and the Environment (RIVM), PO Box 1, 3720 BABilthoven, The Netherlands.(Email : [email protected])
Epidemiol. Infect. (2012), 140, 858–864. f Cambridge University Press 2011
doi:10.1017/S0950268811001427
of which 379 were laboratory-confirmed cases (Fig. 1).
The majority of these cases were probably explained
by residence near an infected dairy-goat farm located
northeast of Helmond city [6]. Following a trawling
questionnaire conducted with 343 confirmed cases, a
second cluster, possibly associated with a non-dairy
sheep farm, was identified in the region. Forty-six
cases spontaneously indicated in an open-text ques-
tion that they had visited the sheep farm (farm X)
during the lambing season in February–March 2009.
In the trawling questionnaires other veterinary sources
were listed, such as a visit to a pet goat farm and a
zoo, but these locations were common for only two
and three cases, respectively.
Farm X has been open to the public during the
lambing season since 2004. In 2009, it was open each
Saturday from 1 February until 31 March and there
were an estimated 12000 visitors to the farm, most of
whom lived locally within 25 km of the farm. More
than 1200 lambs were born that season (the majority
in January and February), and visitors could oc-
casionally witness the birth of a lamb and were en-
couraged to watch the lambs play. Only three
abortions were reported on the farm during this
season, which is less than might be expected in a
typical season, unaffected by Q fever.
The aim of this study was to test whether there
was an association between visiting farm X and de-
veloping Q fever in residents of Southeast Brabant
in February–May 2009. A secondary objective was
to identify risk factors for acquiring Q fever (or a
C. burnetii infection) in people who visited the farm.
METHODS
Epidemiological investigation
Southeast Brabant is predominantly an agricultural
region in the south of The Netherlands bordering
Belgium. A case-control study was conducted in the
region in June 2010. All adults aged o18 years who
were normally resident in Southeast Brabant between
1 February and 31 of March 2009 were eligible for
inclusion (n=732 731). The exposure of interest was a
visit to farm X between 1 February (end of week 5)
and 31 March (beginning week 14) in 2009 (the period
when the farm was open to the public). Given a
minimum incubation period of 3 days and a maxi-
mum incubation period of about 6 weeks [4, 7], cases
were defined as adult inhabitants of the region who
were notified with Q fever and for whom illness onset
was between 1 February (end of week 5) and 15 May
(end of week 20), 2009 (Fig. 1). In The Netherlands,
criteria for notification of acute illness are presence of
at least fever, pneumonia, or hepatitis plus laboratory
confirmation of C. burnetii infection with (a) poly-
merase chain reaction (PCR), or (b) detection of a
fourfold rise in serum antibody titres to C. burnetii or
a high titre in two samples without a fourfold in-
crease, or (c) a single high titre of IgM to phase II
antigen. Controls were householders randomly
selected based on having an address in the same
six-digit postcode area (living on the same street) as
each case.
Data were collected by means of a postal ques-
tionnaire addressed individually to named cases, and
Farm X opento public*
Cases eligible forinclusion†
1 3 5 7 9 11 13 15 17 19 21 23 25 27 29 32 34 37 42 51
Did not visit farm X
Visited farm X
Week of onset 2009
No.
of c
ases
70
60
50
40
30
20
10
0
Fig. 1.Q fever cases by week of onset of symptoms and visits to farm X. Brabant Southeast, The Netherlands, 2009. * Farm Xwas open on weekends only from 1 February (week 5) to 31 March (week 14). # 246 cases had a date of onset of illnessbetween 1 February 2009 and 15 May 2009 and were eligible for inclusion in the study.
Visits to a non-dairy sheep farm associated with Q fever 859

86 | CHAPTER 3.4
to ‘ the householder ’ at the control address. Questions
related to demography (age, gender, occupation), ex-
posure (number of visits to farm X and two additional
agricultural sites Y and Z offering viewing/petting of
sheep or goats, and which were open to the public in
the area), month of visit, duration of direct contact
with animals (time spent on the premises, presence at
birth of lambs on the farm), outcome (symptoms,
hospitalizations for Q fever-like symptoms), behav-
ioural factors (travel history, smoking) and medical
history.
Sample size calculation and data analysis
Of all notified adult cases in the region in 2009, 248
reported onset of illness between the start of week 5
and the end of week 20, and 42 of these had visited the
farm between the first week of February and the last
week of March (Fig. 1). The exposure among the
cases was therefore 17% (42/248). For the detection
of a minimum odds ratio (OR) of 3, two controls per
case were required at a precision (alpha) of 5% [two-
sided 95% confidence interval (CI)] to achieve power
of 80%. Assuming 50% of cases responded, the
minimum number of case respondents required was
therefore 134 and for controls it was 268. Eight con-
trols per case were invited to participate, with the aim
of achieving a 25% response rate from controls.
Data were entered using Access and analysed using
Stata v. 10.1 (StataCorp., USA). Baseline character-
istics of cases and controls were compared using x2
test. Univariable and multivariable analyses of the
distribution of exposures in cases and controls were
examined using matched ORs (conditional logistic
regression) with 95% exact CIs. Risk factors which
were statistically significantly associated with being a
case at the 0.25 univariable level were selected for a
conditional backward stepwise multivariable model.
Significance level was set to 0.05 for the latter model.
Environmental investigation
Vaginal swabs were collected from 20 sheep on farm
X on 19 May 2009, and were tested by multiplex
quantitative real-time PCR (qPCR) at the laboratory
in the National Institute of Public Health and the
Environment in The Netherlands. Eight environmen-
tal aerosol samples were also obtained on 20 May
2009 in the vicinity of the farm, at a distance of 500 m
and 1000 m in all four wind directions (north, east,
south, west). A summary description of laboratory
methods is given here, but these will be discussed in
detail more appropriately elsewhere (A. De Bruin
et al., unpublished data).
The qPCR detects two C. burnetii targets (com1 and
IS1111), and one Bacillus thuringiensis internal con-
trol target (cry1b). B. thuringiensis spores were added
to samples to control both DNA extraction and PCR
amplification. Each DNA extract obtained was tested
in triplicate for C. burnetii presence. Three ml of DNA
extract per reaction were used in qPCR assays per-
formed on a Lightcycler 480 Instrument (Roche
Diagnostics Nederland BV, The Netherlands). In ad-
dition, 3 ml DNA from the C. burnetiiNine Mile RSA
phase I strain were included as positive control, or
3 ml H2O as negative control. Analysis was performed
on the instruments software: Lightcycler 480 software
release 1.5.0. SP3.
Cq values were calculated using the second deriva-
tive method. Samples were scored as positive when at
least one of the C. burnetii targets (com1, or IS1111)
showed a positive signal. Samples were scored as
negative when (a) no C. burnetii targets showed posi-
tive signals, and (b) there was a positive result for the
internal control.
RESULTS
Epidemiological investigation
Sixty-five percent (162/248) of cases responded as did
35% (686/1985) of controls. As the sample size re-
quirements had been fulfilled, no reminder letter was
issued. Cases were individually matched on address
and the matched analysis was performed on 146 cases
matched to between one and six controls per case
(1:Mk matching; total matched sample, n=579).
Cases were of a similar age distribution to controls
(mean age of cases 54.9 years, range 18–89; mean age
of controls 54.8, range 22–79). Fifty-seven percent
(n=85) of cases and 47% (n=202) of controls were
male (Table 1). Of the cases, 62% (n=86) reported
having pneumonia, two reported having hepatitis and
three reported endocarditis ; 38% of cases reported a
variety of other symptoms including exhaustion,
headache, high fever and cough. Overall, 35 (25%)
cases were hospitalized. Mean duration of illness for
cases was 21 days (median 10 days, range 0–365). No
cases were pregnant at the time.
Based on trawling questionnaire data received from
the first 32 cases (where precise date of farm visit and
date of onset of illness were recorded), and assuming a
860 J. Whelan and others
Table1.Matched
univariable
andmultivariableoddsratiosoffactors
associatedwiththeQ
feveroutbreakin
Southeast
Brabantregion,TheNetherlands,
February–May,2009
Cases
Controls
Univariablematched#OR
Multivariablematched
OR
nn/N
%*
nn/N
%OR
95%
CI
POR
95%
CI
P
Dem
ographics
Agegroup
<40yr
17
11. 6
69
16. 4
Ref.
Ref.
Ref.
Ref.
40–59yr
74
50. 7
178
42. 3
1. 7
(0. 9–3. 2)
0. 094
5. 4
(1. 9–15. 3)
0. 001
o60yr
55
37. 7
174
41. 3
1. 2
(0. 6–2. 3)
0. 594
3. 8
(1. 3–10. 6)
0. 012
Gender
(male)
85
57. 4
202
47. 4
1. 8
(1. 1–2. 9)
0. 013
Visitsto
agriculturalsitesandevents
Visited
farm
X31
21. 1
61. 4
24. 2
(8. 4–69. 2)
0. 000
43. 3
(9. 4–200. 1)
0. 000
Visited
site
Y5
3. 5
14
3. 3
1. 2
(0. 4–3. 5)
0. 773
Visited
site
Z1
0. 7
00. 0
——
—
Other
agriculturalsite
forrecreationalvisit(unspecified)
17
12. 1
23
5. 6
1. 9
(0. 9–3. 7)
0. 076
Other
publiceventwithanim
als
85. 7
15
3. 6
1. 4
(0. 5–3. 4)
0. 520
Visited
other
sheeporgoatfarm
,nototherwisenamed
64. 2
92. 1
2. 1
(0. 7–6. 2)
0. 186
Other
contact
withanim
als
Work
inindustry
relatedto
agriculture
10. 7
61. 4
0. 6
(0. 1–4. 9)
0. 620
Petsathome
58
39. 2
176
40. 9
0. 9
(0. 6–1. 4)
0. 671
Farm
anim
alsatthehome-place
32. 1
71. 7
1. 8
(0. 4–8. 1)
0. 473
Sheepathome
32. 0
10. 2
——
—Goatsathome
00. 0
10. 2
——
—
Generalhealth
History
ofmedicalproblems
80
60. 0
193
47. 3
1. 5
(1. 0–2. 3)
0. 054
1. 6
(0. 9–2. 8)
0. 084
History
ofQ
fever
priorto
February
2009
00. 0
1. 0
0. 3
——
—Currentsm
oker
52
35. 6
85
20. 0
2. 0
(1. 3–3. 0)
0. 002
2. 2
(1. 3–3. 8)
0. 006
Occurrence
ofdisease
inhouseholds
Another
personin
thehousehold
withQ
fever
in2009
96. 1
20. 5
10. 3
(2. 2–48. 7)
0. 003
4. 8
(0. 6–36. 1)
0. 126
OR,Oddsratio;CI,confidence
interval.
*N
isthetotalnumber
ofrespondents
tothequestion.Wherethereismissingdata,thismaynottotal146forcasesand486forcontrols.
#1:M
kmatching:casesmatched
tobetween1and6controls.
Visits to a non-dairy sheep farm associated with Q fever 861
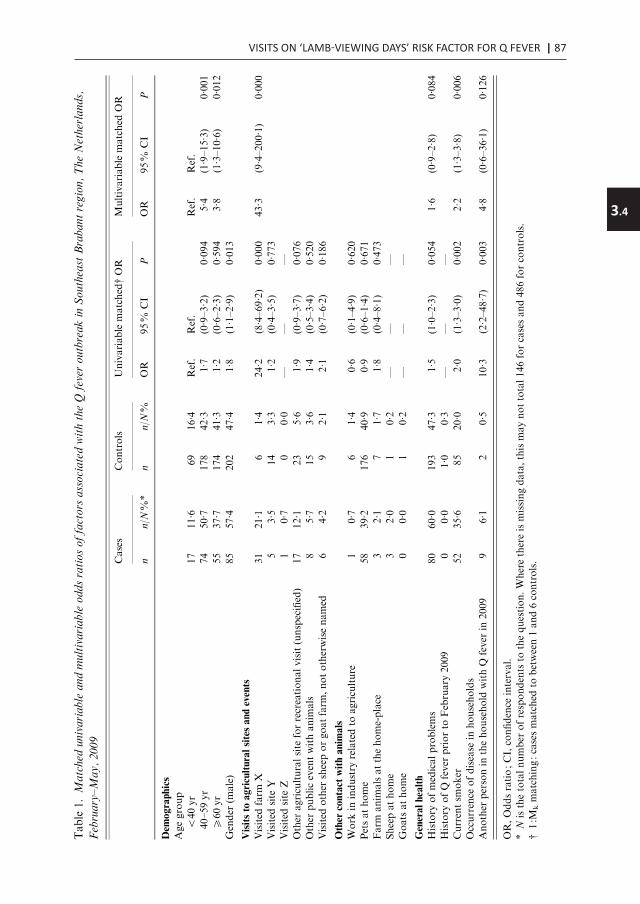
VISITS ON ‘LAMB-VIEWING DAYS’ RISK FACTOR FOR Q FEVER | 87
3.4
to ‘ the householder ’ at the control address. Questions
related to demography (age, gender, occupation), ex-
posure (number of visits to farm X and two additional
agricultural sites Y and Z offering viewing/petting of
sheep or goats, and which were open to the public in
the area), month of visit, duration of direct contact
with animals (time spent on the premises, presence at
birth of lambs on the farm), outcome (symptoms,
hospitalizations for Q fever-like symptoms), behav-
ioural factors (travel history, smoking) and medical
history.
Sample size calculation and data analysis
Of all notified adult cases in the region in 2009, 248
reported onset of illness between the start of week 5
and the end of week 20, and 42 of these had visited the
farm between the first week of February and the last
week of March (Fig. 1). The exposure among the
cases was therefore 17% (42/248). For the detection
of a minimum odds ratio (OR) of 3, two controls per
case were required at a precision (alpha) of 5% [two-
sided 95% confidence interval (CI)] to achieve power
of 80%. Assuming 50% of cases responded, the
minimum number of case respondents required was
therefore 134 and for controls it was 268. Eight con-
trols per case were invited to participate, with the aim
of achieving a 25% response rate from controls.
Data were entered using Access and analysed using
Stata v. 10.1 (StataCorp., USA). Baseline character-
istics of cases and controls were compared using x2
test. Univariable and multivariable analyses of the
distribution of exposures in cases and controls were
examined using matched ORs (conditional logistic
regression) with 95% exact CIs. Risk factors which
were statistically significantly associated with being a
case at the 0.25 univariable level were selected for a
conditional backward stepwise multivariable model.
Significance level was set to 0.05 for the latter model.
Environmental investigation
Vaginal swabs were collected from 20 sheep on farm
X on 19 May 2009, and were tested by multiplex
quantitative real-time PCR (qPCR) at the laboratory
in the National Institute of Public Health and the
Environment in The Netherlands. Eight environmen-
tal aerosol samples were also obtained on 20 May
2009 in the vicinity of the farm, at a distance of 500 m
and 1000 m in all four wind directions (north, east,
south, west). A summary description of laboratory
methods is given here, but these will be discussed in
detail more appropriately elsewhere (A. De Bruin
et al., unpublished data).
The qPCR detects two C. burnetii targets (com1 and
IS1111), and one Bacillus thuringiensis internal con-
trol target (cry1b). B. thuringiensis spores were added
to samples to control both DNA extraction and PCR
amplification. Each DNA extract obtained was tested
in triplicate for C. burnetii presence. Three ml of DNA
extract per reaction were used in qPCR assays per-
formed on a Lightcycler 480 Instrument (Roche
Diagnostics Nederland BV, The Netherlands). In ad-
dition, 3 ml DNA from the C. burnetiiNine Mile RSA
phase I strain were included as positive control, or
3 ml H2O as negative control. Analysis was performed
on the instruments software: Lightcycler 480 software
release 1.5.0. SP3.
Cq values were calculated using the second deriva-
tive method. Samples were scored as positive when at
least one of the C. burnetii targets (com1, or IS1111)
showed a positive signal. Samples were scored as
negative when (a) no C. burnetii targets showed posi-
tive signals, and (b) there was a positive result for the
internal control.
RESULTS
Epidemiological investigation
Sixty-five percent (162/248) of cases responded as did
35% (686/1985) of controls. As the sample size re-
quirements had been fulfilled, no reminder letter was
issued. Cases were individually matched on address
and the matched analysis was performed on 146 cases
matched to between one and six controls per case
(1:Mk matching; total matched sample, n=579).
Cases were of a similar age distribution to controls
(mean age of cases 54.9 years, range 18–89; mean age
of controls 54.8, range 22–79). Fifty-seven percent
(n=85) of cases and 47% (n=202) of controls were
male (Table 1). Of the cases, 62% (n=86) reported
having pneumonia, two reported having hepatitis and
three reported endocarditis ; 38% of cases reported a
variety of other symptoms including exhaustion,
headache, high fever and cough. Overall, 35 (25%)
cases were hospitalized. Mean duration of illness for
cases was 21 days (median 10 days, range 0–365). No
cases were pregnant at the time.
Based on trawling questionnaire data received from
the first 32 cases (where precise date of farm visit and
date of onset of illness were recorded), and assuming a
860 J. Whelan and othersTable1.Matched
univariable
andmultivariableoddsratiosoffactors
associatedwiththeQ
feveroutbreakin
Southeast
Brabantregion,TheNetherlands,
February–May,2009
Cases
Controls
Univariablematched#OR
Multivariablematched
OR
nn/N
%*
nn/N
%OR
95%
CI
POR
95%
CI
P
Dem
ographics
Agegroup
<40yr
17
11. 6
69
16. 4
Ref.
Ref.
Ref.
Ref.
40–59yr
74
50. 7
178
42. 3
1. 7
(0. 9–3. 2)
0. 094
5. 4
(1. 9–15. 3)
0. 001
o60yr
55
37. 7
174
41. 3
1. 2
(0. 6–2. 3)
0. 594
3. 8
(1. 3–10. 6)
0. 012
Gender
(male)
85
57. 4
202
47. 4
1. 8
(1. 1–2. 9)
0. 013
Visitsto
agriculturalsitesandevents
Visited
farm
X31
21. 1
61. 4
24. 2
(8. 4–69. 2)
0. 000
43. 3
(9. 4–200. 1)
0. 000
Visited
site
Y5
3. 5
14
3. 3
1. 2
(0. 4–3. 5)
0. 773
Visited
site
Z1
0. 7
00. 0
——
—
Other
agriculturalsite
forrecreationalvisit(unspecified)
17
12. 1
23
5. 6
1. 9
(0. 9–3. 7)
0. 076
Other
publiceventwithanim
als
85. 7
15
3. 6
1. 4
(0. 5–3. 4)
0. 520
Visited
other
sheeporgoatfarm
,nototherwisenamed
64. 2
92. 1
2. 1
(0. 7–6. 2)
0. 186
Other
contact
withanim
als
Work
inindustry
relatedto
agriculture
10. 7
61. 4
0. 6
(0. 1–4. 9)
0. 620
Petsathome
58
39. 2
176
40. 9
0. 9
(0. 6–1. 4)
0. 671
Farm
anim
alsatthehome-place
32. 1
71. 7
1. 8
(0. 4–8. 1)
0. 473
Sheepathome
32. 0
10. 2
——
—Goatsathome
00. 0
10. 2
——
—
Generalhealth
History
ofmedicalproblems
80
60. 0
193
47. 3
1. 5
(1. 0–2. 3)
0. 054
1. 6
(0. 9–2. 8)
0. 084
History
ofQ
fever
priorto
February
2009
00. 0
1. 0
0. 3
——
—Currentsm
oker
52
35. 6
85
20. 0
2. 0
(1. 3–3. 0)
0. 002
2. 2
(1. 3–3. 8)
0. 006
Occurrence
ofdisease
inhouseholds
Another
personin
thehousehold
withQ
fever
in2009
96. 1
20. 5
10. 3
(2. 2–48. 7)
0. 003
4. 8
(0. 6–36. 1)
0. 126
OR,Oddsratio;CI,confidence
interval.
*N
isthetotalnumber
ofrespondents
tothequestion.Wherethereismissingdata,thismaynottotal146forcasesand486forcontrols.
#1:M
kmatching:casesmatched
tobetween1and6controls.
Visits to a non-dairy sheep farm associated with Q fever 861

88 | CHAPTER 3.4
point-source exposure, the average incubation time,
defined as the time between day of illness onset and
day of visit farm X, was 20.7 days (range 9–43 days).
At univariable level, 21% (n=31) of cases reported
visiting farm X compared to 1% (n=6) of controls
resulting in an OR of exposure between cases and
controls of 24 (95% CI 8.4–69.2). When adjusted for
other risk factors based on univariable findings (age
group, gender, recreational visits to other agricultural
sites or events, visits to other sheep/goat farms
otherwise unspecified, medical history, smoking
status and having a family member who had Q fever
in 2009) the multivariable adjusted OR for a visit to
farm X was 43.3 (95% CI 9.4–200.1). Other signifi-
cant independent risk factors (Table 1) included being
a current smoker (OR 2.2, 95% CI 1.3–2.8), and be-
ing aged >40 years (40–59 years : OR 5.4, 95% CI
1.9–15.3; o60 years : OR 3.8, 95% CI 1.3–10.6).
Subgroup analysis : risk of Q fever for those visiting
farm X
Thirty-seven respondents reported visiting farm X
during the specified time period. No significant as-
sociation was found between different behaviours on
the farm (Table 2) in cases and controls.
Environmental investigation
Seventeen out of 20 vaginal swabs taken from sheep
on the farm were positive for C. burnetii multicopy
target IS1111 only, indicating a relatively low level of
C. burnetiiDNA present in these samples. One sample
was found positive for both C. burnetii targets (com1
and IS1111).
Seven out of the total of eight aerosol samples
taken 500 m and 1000 m from farm X were positive
for C. burnetii target IS1111 in 2009; the only negative
aerosol sample was located 500 m north of the farm.
DISCUSSION
This study confirms the association between a visit
to ‘ lamb-viewing days’ on sheep farm X between
1 February and 31 March 2009, and Q fever in cases.
Other risk factors included increasing age, smoking
and positive medical history (consistent with findings
elsewhere [9]). The reported mean incubation period
of 21 days is also consistent with findings from other
research [3]. Increased risk associated with handling
or petting sheep and lambs, or witnessing the birth of
a lamb was not demonstrated here (possibly related to
the small number of cases and controls who reported
such behaviours).
This study had a number of limitations. A cohort
study of farm visitors could not be performed as no
visitor list was available, therefore no attack rate or
risk ratio could be calculated. The outbreak occurred
in early 2009 and given the time lapse between the
outbreak and this study and the degree of media
coverage of outbreaks nationwide, there is potential
recall bias. A farm visit is a distinct event however, and
as the farm of interest was open for only a limited
period it is likely that visitors would recall attending –
in fact less than 1% reported not remembering
whether they visited – although some could not re-
member the precise date.
This cluster occurred in the context of a much
larger outbreak in the region. Farm X is situated in a
region with other infected farms in proximity [6, 10],
and given the potential role of the wind and other
forms of indirect spread of C. burnetii [3, 11, 12], it
would in any case prove difficult to establish a causal
link to farm X. In the absence of trawling ques-
tionnaires indicating the farm as a possible source, it
is likely that this cluster would have remained un-
recognized, and other unidentified sources may also
be implicated in this outbreak. In this study, we
matched controls to cases by street address in an at-
tempt to control for some of these unknown factors.
Table 2. Distribution of exposures on the farm among cases and controls who visited the farm between 1 February
and 31 March 2009
Cases Controls Univariable matched OR
n n/N%* n n/N% OR 95% CI P
Held or cuddled a lamb during visit 23 85 3 60 3.8 (0.2–44.6) 0.185Witnessed the birth of a lamb during visit 3 12 0 0 — — —
OR, Odds ratio ; CI, confidence interval.
* N is the total number of respondents to the question. Missing data is not included.
862 J. Whelan and others
We tested the association with visits to other farm
sites Y and Z, and public agricultural events in the
area, but none was found. Q fever cases associated
with flocks of non-dairy sheep and newborn lambs
have been reported previously [13] and in one study,
hundreds of infections were attributed to a single ewe
at a farmer’s market [3]. Given these findings, the
positive vaginal swabs from sheep on the farm, and
the fact that DNA was isolated from three aerosol
sampling locations proximal to the farm, it is plaus-
ible that of those who visited farm X between 1
February and 31 March 2009, 95% of the cases that
occurred were attributable to the visit (the attribu-
table fraction among the exposed).
It is estimated that up to 60% of Q fever cases are
asymptomatic, and therefore there were potentially
cases in the control group. No serological testing of
controls was conducted in this study; however, recent
analysis of blood donor samples in the region con-
firmed a prevalence of anti-IgG antibodies of 12% in
2009 [14]. If this prevalence were applied to our data,
the impact on the ORs reported here is uncertain. If
cases and controls were correctly classified, the re-
ported ORs may be an overestimate of the associ-
ation. If, however, a greater proportion of farm
visitors than expected were reclassified as cases, the
OR of association would not necessarily be reduced.
In either case, a visit to farm X would still be a strong
independent risk factor for Q fever.
In the Brabant region there are 35 petting farms
and 14 zoos open to the public and in 2008, there were
1.6 million recreational visits to farms and farmland
in the area. ‘Lamb-viewing days’ during lambing
season were particularly popular [15]. ‘Agri-tourism’
is therefore an important recreational and revenue-
generating activity in the region. In January 2010, the
Ministry of Health issued a hygiene protocol to all
farms with a public function including petting farms
and those offering ‘ lamb-viewing days’ [16]. Control
measures implemented throughout the country in-
cluded isolation of pregnant sheep and goats (away
from public areas), mandatory animal vaccination,
and cessation of ‘ lamb-viewing days’ until vacci-
nation was complete. As a result, farm X was closed
to the public in February–March 2010, pending vac-
cination of the herd which has since been completed.
The farm reopened to the public in spring 2011. As a
result of the vaccination campaign in sheep and goats
nationally, it is expected that the number of human
cases will fall in the coming years [17], but farm
visitors should continue to be vigilant. Vulnerable
groups such as pregnant women, people with cardio-
vascular anomalies, and those with reduced immun-
ity, should be aware of their elevated risk with regard
to Q fever. For all farm visitors, hygiene and preven-
tive measures should continue to be practised ac-
cording to recommendations [18].
ACKNOWLEDGEMENTS
Many thanks to Jan van den Beer for his contribution
to this study. We are particularly grateful to the
farmer at farm X who readily provided information
about the farm and the public function of the farm;
thanks are also due to all respondents who partici-
pated in the study. Finally, thanks to EPIET coordi-
nator Ioannis Karagiannis for his comments and
suggestions in relation to the manuscript.
DECLARATION OF INTEREST
None.
REFERENCES
1. Abinanti FR, et al. Q fever studies XVIII. Presenceof Coxiella burnetii in the birth fluids of naturallyinfected sheep. American Journal of Hygiene 1953; 58 :
385–388.2. Aitken ID, et al. Q fever in Europe: current aspects of
aetiology, epidemiology, human infection, diagnosis
and therapy. Infection 1987; 15 : 323–327.3. Porten K, et al. A super-spreading ewe infects hundreds
with Q fever at a farmers’ market in Germany. BMCInfectious Diseases 2006; 6 : 147.
4. Maurin M, Raoult D. Q fever. Clinical MicrobiologicalReviews 1999; 12 : 518–553.
5. Q fever Evaluation Commission. Q fever policy in the
Netherlands 2005–2010 [in Dutch], 2010 (http://www.rijksoverheid.nl/documenten-en-publicaties/rapporten/2010/11/22/van-verwerping-tot-verheffing.html). Accessed
5 December 2010.6. Schimmer B, et al. The use of a geographic information
system to identify a dairy goat farm as the most likelysource of an urban Q-fever outbreak. BMC Infectious
Diseases 2010; 10 : 69.7. Heymann D (ed.). Control of Communicable Diseases
Manual, 19th edn. Washington, DC. : American Public
Health Association, 2008.8. Bustin SA, et al. The MIQE guidelines : minimum in-
formation for publication of quantitative real-time
PCR experiments. Clinical Chemistry 2009; 55 : 611–22.9. Karagiannis I, et al. Investigation of a Q fever outbreak
in a rural area of The Netherlands. Epidemiology and
Infection 2009; 137 : 1283–1294.
Visits to a non-dairy sheep farm associated with Q fever 863

VISITS ON ‘LAMB-VIEWING DAYS’ RISK FACTOR FOR Q FEVER | 89
3.4
point-source exposure, the average incubation time,
defined as the time between day of illness onset and
day of visit farm X, was 20.7 days (range 9–43 days).
At univariable level, 21% (n=31) of cases reported
visiting farm X compared to 1% (n=6) of controls
resulting in an OR of exposure between cases and
controls of 24 (95% CI 8.4–69.2). When adjusted for
other risk factors based on univariable findings (age
group, gender, recreational visits to other agricultural
sites or events, visits to other sheep/goat farms
otherwise unspecified, medical history, smoking
status and having a family member who had Q fever
in 2009) the multivariable adjusted OR for a visit to
farm X was 43.3 (95% CI 9.4–200.1). Other signifi-
cant independent risk factors (Table 1) included being
a current smoker (OR 2.2, 95% CI 1.3–2.8), and be-
ing aged >40 years (40–59 years : OR 5.4, 95% CI
1.9–15.3; o60 years : OR 3.8, 95% CI 1.3–10.6).
Subgroup analysis : risk of Q fever for those visiting
farm X
Thirty-seven respondents reported visiting farm X
during the specified time period. No significant as-
sociation was found between different behaviours on
the farm (Table 2) in cases and controls.
Environmental investigation
Seventeen out of 20 vaginal swabs taken from sheep
on the farm were positive for C. burnetii multicopy
target IS1111 only, indicating a relatively low level of
C. burnetiiDNA present in these samples. One sample
was found positive for both C. burnetii targets (com1
and IS1111).
Seven out of the total of eight aerosol samples
taken 500 m and 1000 m from farm X were positive
for C. burnetii target IS1111 in 2009; the only negative
aerosol sample was located 500 m north of the farm.
DISCUSSION
This study confirms the association between a visit
to ‘ lamb-viewing days’ on sheep farm X between
1 February and 31 March 2009, and Q fever in cases.
Other risk factors included increasing age, smoking
and positive medical history (consistent with findings
elsewhere [9]). The reported mean incubation period
of 21 days is also consistent with findings from other
research [3]. Increased risk associated with handling
or petting sheep and lambs, or witnessing the birth of
a lamb was not demonstrated here (possibly related to
the small number of cases and controls who reported
such behaviours).
This study had a number of limitations. A cohort
study of farm visitors could not be performed as no
visitor list was available, therefore no attack rate or
risk ratio could be calculated. The outbreak occurred
in early 2009 and given the time lapse between the
outbreak and this study and the degree of media
coverage of outbreaks nationwide, there is potential
recall bias. A farm visit is a distinct event however, and
as the farm of interest was open for only a limited
period it is likely that visitors would recall attending –
in fact less than 1% reported not remembering
whether they visited – although some could not re-
member the precise date.
This cluster occurred in the context of a much
larger outbreak in the region. Farm X is situated in a
region with other infected farms in proximity [6, 10],
and given the potential role of the wind and other
forms of indirect spread of C. burnetii [3, 11, 12], it
would in any case prove difficult to establish a causal
link to farm X. In the absence of trawling ques-
tionnaires indicating the farm as a possible source, it
is likely that this cluster would have remained un-
recognized, and other unidentified sources may also
be implicated in this outbreak. In this study, we
matched controls to cases by street address in an at-
tempt to control for some of these unknown factors.
Table 2. Distribution of exposures on the farm among cases and controls who visited the farm between 1 February
and 31 March 2009
Cases Controls Univariable matched OR
n n/N%* n n/N% OR 95% CI P
Held or cuddled a lamb during visit 23 85 3 60 3.8 (0.2–44.6) 0.185Witnessed the birth of a lamb during visit 3 12 0 0 — — —
OR, Odds ratio ; CI, confidence interval.
* N is the total number of respondents to the question. Missing data is not included.
862 J. Whelan and others
We tested the association with visits to other farm
sites Y and Z, and public agricultural events in the
area, but none was found. Q fever cases associated
with flocks of non-dairy sheep and newborn lambs
have been reported previously [13] and in one study,
hundreds of infections were attributed to a single ewe
at a farmer’s market [3]. Given these findings, the
positive vaginal swabs from sheep on the farm, and
the fact that DNA was isolated from three aerosol
sampling locations proximal to the farm, it is plaus-
ible that of those who visited farm X between 1
February and 31 March 2009, 95% of the cases that
occurred were attributable to the visit (the attribu-
table fraction among the exposed).
It is estimated that up to 60% of Q fever cases are
asymptomatic, and therefore there were potentially
cases in the control group. No serological testing of
controls was conducted in this study; however, recent
analysis of blood donor samples in the region con-
firmed a prevalence of anti-IgG antibodies of 12% in
2009 [14]. If this prevalence were applied to our data,
the impact on the ORs reported here is uncertain. If
cases and controls were correctly classified, the re-
ported ORs may be an overestimate of the associ-
ation. If, however, a greater proportion of farm
visitors than expected were reclassified as cases, the
OR of association would not necessarily be reduced.
In either case, a visit to farm X would still be a strong
independent risk factor for Q fever.
In the Brabant region there are 35 petting farms
and 14 zoos open to the public and in 2008, there were
1.6 million recreational visits to farms and farmland
in the area. ‘Lamb-viewing days’ during lambing
season were particularly popular [15]. ‘Agri-tourism’
is therefore an important recreational and revenue-
generating activity in the region. In January 2010, the
Ministry of Health issued a hygiene protocol to all
farms with a public function including petting farms
and those offering ‘ lamb-viewing days’ [16]. Control
measures implemented throughout the country in-
cluded isolation of pregnant sheep and goats (away
from public areas), mandatory animal vaccination,
and cessation of ‘ lamb-viewing days’ until vacci-
nation was complete. As a result, farm X was closed
to the public in February–March 2010, pending vac-
cination of the herd which has since been completed.
The farm reopened to the public in spring 2011. As a
result of the vaccination campaign in sheep and goats
nationally, it is expected that the number of human
cases will fall in the coming years [17], but farm
visitors should continue to be vigilant. Vulnerable
groups such as pregnant women, people with cardio-
vascular anomalies, and those with reduced immun-
ity, should be aware of their elevated risk with regard
to Q fever. For all farm visitors, hygiene and preven-
tive measures should continue to be practised ac-
cording to recommendations [18].
ACKNOWLEDGEMENTS
Many thanks to Jan van den Beer for his contribution
to this study. We are particularly grateful to the
farmer at farm X who readily provided information
about the farm and the public function of the farm;
thanks are also due to all respondents who partici-
pated in the study. Finally, thanks to EPIET coordi-
nator Ioannis Karagiannis for his comments and
suggestions in relation to the manuscript.
DECLARATION OF INTEREST
None.
REFERENCES
1. Abinanti FR, et al. Q fever studies XVIII. Presenceof Coxiella burnetii in the birth fluids of naturallyinfected sheep. American Journal of Hygiene 1953; 58 :
385–388.2. Aitken ID, et al. Q fever in Europe: current aspects of
aetiology, epidemiology, human infection, diagnosis
and therapy. Infection 1987; 15 : 323–327.3. Porten K, et al. A super-spreading ewe infects hundreds
with Q fever at a farmers’ market in Germany. BMCInfectious Diseases 2006; 6 : 147.
4. Maurin M, Raoult D. Q fever. Clinical MicrobiologicalReviews 1999; 12 : 518–553.
5. Q fever Evaluation Commission. Q fever policy in the
Netherlands 2005–2010 [in Dutch], 2010 (http://www.rijksoverheid.nl/documenten-en-publicaties/rapporten/2010/11/22/van-verwerping-tot-verheffing.html). Accessed
5 December 2010.6. Schimmer B, et al. The use of a geographic information
system to identify a dairy goat farm as the most likelysource of an urban Q-fever outbreak. BMC Infectious
Diseases 2010; 10 : 69.7. Heymann D (ed.). Control of Communicable Diseases
Manual, 19th edn. Washington, DC. : American Public
Health Association, 2008.8. Bustin SA, et al. The MIQE guidelines : minimum in-
formation for publication of quantitative real-time
PCR experiments. Clinical Chemistry 2009; 55 : 611–22.9. Karagiannis I, et al. Investigation of a Q fever outbreak
in a rural area of The Netherlands. Epidemiology and
Infection 2009; 137 : 1283–1294.
Visits to a non-dairy sheep farm associated with Q fever 863

90 | CHAPTER 3.4
10. Food and Consumer Product Safety Authority, Ministry
of Agriculture Nature and Food Quality. Q Fever :
map with overview of infected dairy-goat and dairy-sheep farms, 2010 (http://www.vwa.nl/onderwerpen/dierziekten/dossier/q-koorts/kaart-met-overzicht-van-
besmette-bedrijven). Accessed 3 December 2010.11. Hawker JI, et al. A large outbreak of Q fever in the
West Midlands : windborne spread into a metropolitanarea? Communicable Disease and Public Health 1998; 1 :
180–187.12. Lyytikainen O, et al.An outbreak of sheep-associated Q
fever in a rural community in Germany. European
Journal of Epidemiology 1998; 14 : 193–199.13. Koene RP, et al. A Q fever outbreak in a psychiatric
care institution in The Netherlands. Epidemiology and
Infection 2011; 139 : 13–18.14. Hogema BM, et al. Coxiella burnetii infection among
blood donors during the 2009 Q-fever outbreak in the
Netherlands. Transfusion. Published online: 14 July2011. doi:10.1111/j.1537-2995.2011.03250.x.
15. Province of North Brabant. Brabant in figures. LeisureIndustry Trend Report, 2010 (http://www.vrijetijdshuis.nl/wp-content/uploads/2010/05/Totaal-Trendrapport2.
pdf). Accessed 10 December 2010.16. Ministry of Agriculture Nature and Food Quality.
Hygiene protocol for goat and sheep farms with apublic function, 2010 (http://www.rijksoverheid.
nl/documenten-en-publicaties/rapporten/2010/01/27/hygieneprotocol-voor-geiten-en-schapenbedrijven-met-een-publieke-functie.html). Accessed 3 December 2010.
17. van der Hoek W, et al. Q fever in the Netherlands : anupdate on the epidemiology and control measures.Eurosurveillance 2010; 15 : pii=19520.
18. Netherlands Foundation for Petting Zoos (SKBN).
Hygiene Code, 2010 (http://www.skbn.net/de-kinderboerderij/hygiene-code). Accessed 3 December 2010.
864 J. Whelan and others

CHAPTER 4.1
Seroprevalence and risk factorsof Coxiella burnetii infection in residents and ruminants on commercial farms in a ‘One Health’ context
Seroprevalence and risk factors for Coxiella burnetii (Q fever) seropositivity in dairy goat farmers‘ households
in The Netherlands, 2009-2010
4
B. SchimmerA.Lenferink
P. SchneebergerH. Aangenend
P. VellemaJ. Hautvast
Y.T.H.P. van Duijnhoven
PLoS One. 2012;7(7):e42364
Seroprevalence and Risk Factors for Coxiella burnetii (QFever) Seropositivity in Dairy Goat Farmers’ Householdsin The Netherlands, 2009–2010Barbara Schimmer1, Anke Lenferink1,2, Peter Schneeberger3, Helen Aangenend2, Piet Vellema4,
Jeannine Hautvast2, Yvonne van Duynhoven1*
1Centre for Infectious Disease Control, National Institute for Public Health and The Environment, Bilthoven, The Netherlands, 2Academic Collaborative Centre AMPHI,
Department of Primary and Community Care, Radboud University Nijmegen Medical Centre, Nijmegen, The Netherlands, 3Department of Medical Microbiology and
Infection Control, Jeroen Bosch Hospital, ’s-Hertogenbosch, The Netherlands, 4Department of Small Ruminant Health, Animal Health Service, Deventer, The Netherlands
Abstract
Community Q fever epidemics occurred in the Netherlands in 2007–2009, with dairy goat and dairy sheep farms as theimplicated source. The aim of the study was to determine the seroprevalence and risk factors for seropositivity in dairy goatfarmers and their household members living or working on these farms. Sera of 268 people living or working on 111 dairygoat farms were tested for Coxiella burnetii IgG and IgM antibodies using immunofluorescence assay. Seroprevalences infarmers, spouses and children (12–17 years) were 73.5%, 66.7%, and 57.1%, respectively. Risk factors for seropositivity were:performing three or more daily goat-related tasks, farm location in the two southern provinces of the country, proximity tobulk milk-positive farms, distance from the nearest stable to residence of 10 meters or less, presence of cats and multiplegoat breeds in the stable, covering stable air spaces and staff not wearing farm boots. Goat farmers have a high risk toacquire this occupational infection. Clinicians should consider Q fever in this population presenting with compatiblesymptoms to allow timely diagnosis and treatment to prevent severe sequelae. Based on the risk factors identified,strengthening general biosecurity measures is recommended such as consistently wearing boots and protective clothing byfarm staff to avoid indirect transmission and avoiding access of companion animals in the goat stable. Furthermore, itprovides an evidence base for continuation of the current vaccination policy for small ruminants, preventing spread fromcontaminated farms to other farms in the vicinity. Finally, vaccination of seronegative farmers and household memberscould be considered.
Received March 23, 2012; Accepted July 4, 2012; Published July 27, 2012
Introduction
Q fever is a ubiquitous zoonosis caused by the bacterium Coxiella
burnetii (C. burnetii). The primary animal reservoirs for human
infection are cattle, sheep and goats. Bacteria are shed in especially
high concentrations in placentas and birth fluids of infected
animals, which may subsequently contaminate the stable environ-
ment [1]. Human infection results from inhalation of contami-
nated aerosols, generated by infected animals or animal products
or through direct contact with milk, urine, faeces, or semen of
infected animals [2,3,4]. Human Q fever may range from
subclinical infection to endocarditis and ruptured aneurysms,
and long-term sequelae such as chronic fatigue syndrome (1–4).
Ruminant farmers are considered one of the main occupational
risk populations for acquiring C. burnetii infections [5]. In 2009–
2010, our integrated human-animal-environmental Q-VIVE study
among Dutch dairy goat farms showed a farm prevalence of
43.1% and a goat seroprevalence of 21.4% [6]. The aim of the
present study was to determine within the same farm study
population, the seroprevalence in farmers and household members
living and/or working on dairy goat farms and to assess the farm-
related and individual risk factors for seropositivity in order to
update control measures and to provide targeted advice for this
occupational group and the Dutch dairy goat industry.
Methods
All dairy goat farms in the Netherlands with at least 100 adult
goats that were not vaccinated for Q-fever were selected from a
national database of the Animal Health Service. On eligible farms,
we approached dairy goat farmers and one or two of their
household members aged 12 years and older, and in some
instances, other persons working or living on the farm such as farm
employees. A maximum of three participants were included per
farm. Non-responders received a reminder three weeks after the
initial invitation. After providing informed consent on farm and
individual level, all participating farms were visited by professional
laboratory assistants, who collected sera from October 2009
through March 2010. Each participant received an individual
questionnaire by e-mail or post containing questions on person-
PLoS ONE | www.plosone.org 1 July 2012 | Volume 7 | Issue 7 | e42364
Time-course of antibody responses against Coxiella burnetiifollowing acute Q fever
P. F. M. TEUNIS 1,2*, B. SCHIMMER 1, D. W. NOTERMANS3,
A. C. A. P. LEENDERS 4, P. C. WEVER 4, M. E. E. KRETZSCHMAR1,5
AND P. M. SCHNEEBERGER 4
1 Centre for Infectious Disease Control, Epidemiology and Surveillance Unit, RIVM, Bilthoven, The Netherlands2 Hubert Department of Global Health, Rollins School of Public Health, Emory University, Atlanta, GA, USA3 Centre for Infectious Disease Control, Laboratory for Infectious Diseases and Perinatal Screening, RIVM,Bilthoven, The Netherlands4 Jeroen Bosch Hospital, Department of Medical Microbiology and Infection Control,’s- Hertogenbosch, TheNetherlands5 Julius Centre for Health Sciences and Primary Care, University Medical Centre Utrecht, Utrecht, The
Netherlands
Received 11 October 2011; Final revision 15 February 2012; Accepted 15 February 2012;
first published online 4 April 2012
SUMMARY
Large outbreaks of Q fever in The Netherlands have provided a unique opportunity for studying
longitudinal serum antibody responses in patients. Results are presented of a cohort of 344
patients with acute symptoms of Q fever with three or more serum samples per patient. In all
these serum samples IgM and IgG against phase 1 and 2 Coxiella burnetii were measured by an
immunofluorescence assay. A mathematical model of the dynamic interaction of serum antibodies
and pathogens was used in a mixed model framework to quantitatively analyse responses to
C. burnetii infection. Responses show strong heterogeneity, with individual serum antibody
responses widely different in magnitude and shape. Features of the response, peak titre and decay
rate, are used to characterize the diversity of the observed responses. Binary mixture analysis of
IgG peak levels (phases 1 and 2) reveals a class of patients with high IgG peak titres that decay
slowly and may represent potential chronic cases. When combining the results of mixture analysis
into an odds score, it is concluded that not only high IgG phase 1 may be predictive for chronic
Q fever, but also that high IgG phase 2 may aid in detecting such putative chronic cases.
Key words: Coxiella, mathematical modelling, Q fever, serology, statistics.
INTRODUCTION
Since mid-2007 human cases of Q fever in The
Netherlands have increased sharply, with major out-
breaks in 2008 and 2009, reaching a total of about
4000 cases by 2010 [1–4]. Cases were predominantly
clustered in the south of The Netherlands [3] and the
majority of the laboratory samples were submitted
to one regional hospital : the Jeroen Bosch Hospital
in ’s-Hertogenbosch (about 2000 confirmed acute
Q fever cases). Follow-up of cases extended over a
period of up to 24 months. In the 3 years that this
outbreak persisted, laboratory results from over 2000
cases were collected in a laboratory database. This
* Author for correspondence : Professor P. F. M. Teunis, Centrefor Infectious Disease Control, Epidemiology and SurveillanceUnit, RIVM, PO Box 1, 3720BA Bilthoven, The Netherlands.(Email : [email protected])
Epidemiol. Infect. (2013), 141, 62–73. f Cambridge University Press 2012
doi:10.1017/S0950268812000404
Seroprevalence and Risk Factors for Coxiella burnetii (Q Fever) Seropositivity in Dairy Goat Farmers’ Households in The Netherlands, 2009-2010
B. SCHIMMER1, A. LENFERINK1,2, P. SCHNEEBERGER3, H. AANGENEND2, P. VELLEMA4, J. HAUTVAST2, Y.T.H.P. VAN DUIJNHOVEN1*
Affiliaties
Chapter 3.2
1Centre for Infectious Disease Control, National Institute for Public Health and the Environment, Bilthoven, the Netherlands 2Municipal Health Service ‘Brabant Zuidoost, Eindhoven, the Netherlands 3Laboratory for Pathology and Medical Microbiology, Veldhoven, the Netherlands 4Region East, Food and Consumer Product Safety Authority, Zutphen, the Netherlands 5Department of Medical Microbiology and Infection Control, Jeroen Bosch Hospital, ‘s Hertogenbosch, the Netherlands 6Department of Small Ruminant Health, Animal Health Service, Deventer, the Netherlands
Chapter 4.1
1 Centre for Infectious Disease Control, National Institute for Public Health and The Environment, Bilthoven, The Netherlands 2 Academic Collaborative Centre AMPHI, Department of Primary and Community Care, Radboud University Nijmegen Medical Centre, Nijmegen, The Netherlands 3 Department of Medical Microbiology and Infection Control, Jeroen Bosch Hospital, ’s-Hertogenbosch, The Netherlands 4 Department of Small Ruminant Health, Animal Health Service, Deventer, The Netherlands
Chapter 4.2 1Centre for Infectious Disease Control, National Institute for Public Health and the Environment, Bilthoven, the Netherlands 2Quantitative Veterinary Epidemiology Group, Wageningen Institute of Animal Sciences, Wageningen, The Netherlands 3Department of Small Ruminant Health, Animal Health Service, Deventer, The Netherlands 4Academic Collaborative Centre AMPHI, Department of Primary and Community Care, Radboud University Nijmegen Medical Centre, the Netherlands
Chapter 4.4 1Centre for Infectious Disease Control, National Institute for Public Health and the Environment, Bilthoven, the Netherlands 2 Academic Collaborative Centre AMPHI, Department of Primary and Community Care, Radboud University Nijmegen Medical Centre, Nijmegen, the Netherlands 3Department of Small Ruminant Health, Animal Health Service, Deventer, The Netherlands
Chapter 4.5 1 National Institute for Public Health and the Environment (RIVM), Bilthoven, the Netherlands 2 Animal Health Service,Deventer, the Netherlands 3 Radboud University Nijmegen Medical Centre, Nijmegen, the Netherlands 4. Jeroen Bosch Hospital, ‘s-Hertogenbosch, the Netherlands Chapter 4.6 1 GD Animal Health, Deventer, The Netherlands 2 Centre for Infectious Disease Control, National Institute for Public Health and the Environment, Bilthoven, the Netherlands 3 Department of Primary and Community Care, Academic Collaborative Centre for Public Health (AMPHI), Radboud University Nijmegen Medical Centre, Nijmegen, The Netherlands
Chapter 5.1 1 Department of Small Ruminant Health, Animal Health Service, Deventer, The Netherlands 2 Centre for Infectious Disease Control, National Institute for Public Health and the Environment, Bilthoven, The Netherlands 3 Department of Medical Microbiology and Infection Control, Jeroen Bosch Hospital, ‘s-Hertogenbosch, The Netherlands, 4 Department of Diagnostics, Research and Epidemiology, Animal Health Service, Deventer, The Netherlands
Chapter 5.2
1 Division of Environmental Epidemiology, Institute for Risk Assessment Sciences, Utrecht, the Netherlands 2 Centre for Infectious Disease Control, National Institute for Public Health and the Environment, Bilthoven, the Netherlands, 3 Department of Medical Microbiology and Infection Control, Jeroen Bosch Hospital, ‘s-Hertogenbosch, the Netherlands, 4 Division of Veterinary Public Health, Institute for Risk Assessment Sciences, Utrecht, the Netherlands
Chapter 5.3 1.National Institute for Public Health and the Environment, Bilthoven, the Netherlands 2 European Centre for Disease Prevention and Control, Stockholm, Sweden 3 Jeroen Bosch Hospital, ‘s-Hertogenbosch, the Netherlands 4 ArboUnie, Utrecht, the Netherlands
Seroprevalence and Risk Factors for Coxiella burnetii (QFever) Seropositivity in Dairy Goat Farmers’ Householdsin The Netherlands, 2009–2010Barbara Schimmer1, Anke Lenferink1,2, Peter Schneeberger3, Helen Aangenend2, Piet Vellema4,
Jeannine Hautvast2, Yvonne van Duynhoven1*
1Centre for Infectious Disease Control, National Institute for Public Health and The Environment, Bilthoven, The Netherlands, 2Academic Collaborative Centre AMPHI,
Department of Primary and Community Care, Radboud University Nijmegen Medical Centre, Nijmegen, The Netherlands, 3Department of Medical Microbiology and
Infection Control, Jeroen Bosch Hospital, ’s-Hertogenbosch, The Netherlands, 4Department of Small Ruminant Health, Animal Health Service, Deventer, The Netherlands
Abstract
Community Q fever epidemics occurred in the Netherlands in 2007–2009, with dairy goat and dairy sheep farms as theimplicated source. The aim of the study was to determine the seroprevalence and risk factors for seropositivity in dairy goatfarmers and their household members living or working on these farms. Sera of 268 people living or working on 111 dairygoat farms were tested for Coxiella burnetii IgG and IgM antibodies using immunofluorescence assay. Seroprevalences infarmers, spouses and children (12–17 years) were 73.5%, 66.7%, and 57.1%, respectively. Risk factors for seropositivity were:performing three or more daily goat-related tasks, farm location in the two southern provinces of the country, proximity tobulk milk-positive farms, distance from the nearest stable to residence of 10 meters or less, presence of cats and multiplegoat breeds in the stable, covering stable air spaces and staff not wearing farm boots. Goat farmers have a high risk toacquire this occupational infection. Clinicians should consider Q fever in this population presenting with compatiblesymptoms to allow timely diagnosis and treatment to prevent severe sequelae. Based on the risk factors identified,strengthening general biosecurity measures is recommended such as consistently wearing boots and protective clothing byfarm staff to avoid indirect transmission and avoiding access of companion animals in the goat stable. Furthermore, itprovides an evidence base for continuation of the current vaccination policy for small ruminants, preventing spread fromcontaminated farms to other farms in the vicinity. Finally, vaccination of seronegative farmers and household memberscould be considered.
Received March 23, 2012; Accepted July 4, 2012; Published July 27, 2012
Introduction
Q fever is a ubiquitous zoonosis caused by the bacterium Coxiella
burnetii (C. burnetii). The primary animal reservoirs for human
infection are cattle, sheep and goats. Bacteria are shed in especially
high concentrations in placentas and birth fluids of infected
animals, which may subsequently contaminate the stable environ-
ment [1]. Human infection results from inhalation of contami-
nated aerosols, generated by infected animals or animal products
or through direct contact with milk, urine, faeces, or semen of
infected animals [2,3,4]. Human Q fever may range from
subclinical infection to endocarditis and ruptured aneurysms,
and long-term sequelae such as chronic fatigue syndrome (1–4).
Ruminant farmers are considered one of the main occupational
risk populations for acquiring C. burnetii infections [5]. In 2009–
2010, our integrated human-animal-environmental Q-VIVE study
among Dutch dairy goat farms showed a farm prevalence of
43.1% and a goat seroprevalence of 21.4% [6]. The aim of the
present study was to determine within the same farm study
population, the seroprevalence in farmers and household members
living and/or working on dairy goat farms and to assess the farm-
related and individual risk factors for seropositivity in order to
update control measures and to provide targeted advice for this
occupational group and the Dutch dairy goat industry.
Methods
All dairy goat farms in the Netherlands with at least 100 adult
goats that were not vaccinated for Q-fever were selected from a
national database of the Animal Health Service. On eligible farms,
we approached dairy goat farmers and one or two of their
household members aged 12 years and older, and in some
instances, other persons working or living on the farm such as farm
employees. A maximum of three participants were included per
farm. Non-responders received a reminder three weeks after the
initial invitation. After providing informed consent on farm and
individual level, all participating farms were visited by professional
laboratory assistants, who collected sera from October 2009
through March 2010. Each participant received an individual
questionnaire by e-mail or post containing questions on person-
PLoS ONE | www.plosone.org 1 July 2012 | Volume 7 | Issue 7 | e42364
based exposures, for instance living and/or working on the farm,
contact with goats, other livestock, pets and the farm environment,
consumption of raw dairy products, use of protective clothing,
pregnancy, smoking and underlying health conditions. A farm
questionnaire was sent to the farm manager/owner containing
questions on herd size, presence of other livestock and pets, farm
management, stable environment, lambing season and hygiene
measures. We obtained data on the Q fever bulk milk status for the
period 1 October 2009–30 September 2010 from the Dutch
Ministry of Agriculture. The Medical Ethical Commission of the
University Medical Center Utrecht approved the study protocol
(nr. 09–189/K).
SerologySerum samples were tested for C. burnetii IgM and IgG
antibodies, both phase I and II, using indirect immunofluores-
cence assay (IFA) with a screening dilution of 1:32. Study
participants without any positive antibody result and participants
with a solitary IgM phase I or solitary IgM phase II were defined
as seronegative. All other outcomes were classified as seropositive.
Those with among others IgM phase II antibodies were designated
as ‘relatively recent infections’ and include possible current
infections. The term ‘relatively recent’ was chosen as IgM phase
II is found positive ($1:32) in the majority of cases one year post-
infection and may even persist up to three years post-infection [7],
(personal communication C. Wielders). Seropositives without IgM
phase II antibodies were designated as ‘past infections’. As the
latter also includes possible chronic infections, within the past
infections a distinction was made between serological profiles
which had IgG phase I ,1:32 or negative and therefore not
consistent with chronic infection, and serological profiles which
could indicate chronic infection. IgG phase I and II end point
titers were determined.
Data analysisTo study participation bias, participating and non-participating
farms were compared with regard to herd size, urbanization
degree, region and bulk milk status. For the risk factor analyses,
first frequency tables of variables were analysed and distributions
of continuous variables were studied. If the latter were not linearly
related to the outcome variable, variables were divided into classes
based on biological arguments and if these were lacking based on
quartiles or medians and/or chosen similarly to classes used in a
previous analyses of risk factors for the goats of these same farms
[6]. Using SAS software version 9.2, univariate logistic regression
analysis was performed to assess the main factors associated with
C. burnetii seropositivity at the individual level (p,0.20 in the
likelihood ratio test (22LL)). Variables with less than 10% of data
in one risk category were excluded. Age was always kept in the
model because of the frequent relationship with C. burnetiiseropositivity observed in other studies. Proxy outcomes such as
bulk milk Q fever status were not included in multivariable
analyses. All identified individual variables were analyzed with a
manual backward elimination procedure starting with a full
multivariable logistic regression model. Variables were kept in de
model if the 22LL ratio test of the model with and without the
variable was significant (p,0.05). The final individual model was
tested with the Hosmer-Lemeshow-Goodness-of-fit test. Subse-
quently, multilevel univariate model analyses were performed to
identify risk factors derived from the farm questionnaire, taking
into account clustered farm-based data for all persons within the
same farm, using a unique farm number as cluster variable for
each farm. All univariately significant farm variables (p,0.20)
were analyzed with a manual backward elimination procedure
starting with a full multilevel model. Finally, both the individual
and farm-based characteristics from the final two submodels were
combined in a multivariate multilevel analysis, to examine the
independent relationship between risk determinants and C. burnetiiseropositivity. The final model fit was assessed by the QIC (Quasi-
Likelihood under the Independence Model Criterion) goodness-of
-fit statistic for GEE (generalized estimation equation) models.
Results
Descriptive characteristicsOf all 334 invited eligible dairy goat farms, 111 (33.2%) farms
participated in this study. In total, 24.3% of the participating farms
tested bulk milk-positive from October 2009 through March 2010,
similar to 22.9% positive for the non-participating farms. The
mean herd size was 869 goats (range 121–3805) in participating
farms, not statistically different from the mean of 809 goats (105–
4733) in non-participating farms. In addition, no differences
between participating and non-participating farms were observed
with regard to urbanization degree and region. From the 111
participating farms, 268 persons provided a blood sample (mean
age 42.0 years (12–81), 53.7% male). Of these, 184 (68.7%) were
seropositive; 154 (57.5%) participants had experienced a past
infection and 30 (11.2%) had experienced a relatively recent
infection, as demonstrated by presence of IgM phase II antibodies.
IgG phase II end titres were known for the 75 participants with a
past infection with IgG phase I ,1:32: 1:32 (n= 20), 1:64 (n= 14),
1:128 (n= 16), 1:256 (n= 12), 1:512 (n= 9) and $1:1024 (n= 4).
For the 79 participants with a past infection with IgG phase I
$1:32, 11 persons had ‘possible chronic Q fever’ with IgG phase I
titers $1:1024 according to diagnostic criteria used in the
Netherlands [8]. Clinical information was lacking to confirm that
these were truly chronic cases. Based on questions regarding
clinical history in the individual questionnaire, none of them
reported a history of pneumonia, hepatitis or endocarditis during
the past 5 years or were diagnosed with acute Q fever by their
general practitioner. Also none of them indicated a history of an
immune disorder, chronic pulmonary disease or cardiovascular
problem except for one case with a high blood pressure and one
case with a breast malignancy in 1999. Seroprevalences in males
increased by age reaching a plateau around 80% in the 35–55
years age group, while in females the highest seroprevalence
(75.9%) was observed in those below 35 years. The seroprevalence
was highest among farmers (73.5%) and in the small group of non-
household members such as farm employees or servants (83.3%).
Seroprevalences in spouses and children (12–17 years) were 66.7%
and 57.1%, respectively (Table 1). Among those living or working
on a bulk milk-positive farm, 95.5% were seropositive. The
median duration of residence on a dairy goat farm was 10 years
(0–29 years). A Q fever episode was confirmed by a general
practitioner in 10 participants (4.1%) during the period 2008–
2010. Based on their serum sample, 5 had a serological profile
matching relatively recent infection and 5 a profile indicating past
infection.
Univariate analyses on individual and farm levelIndividual farm exposures, such as milking and feeding goats,
supply and removal of dairy goats into and outside the stable,
giving general health care and birth assistance, cleaning the
stables, removal and spread of manure, contact with raw goat milk
and daily contact with goat manure, dead-born animals during the
lambing season, daily contact with roughage or animal feed, direct
contact with cattle on own farm and residence as a child on a
ruminant farm were all associated with human seropositivity
Q Fever Seroprevalence in Dutch Dairy Goat Farmers
PLoS ONE | www.plosone.org 2 July 2012 | Volume 7 | Issue 7 | e42364
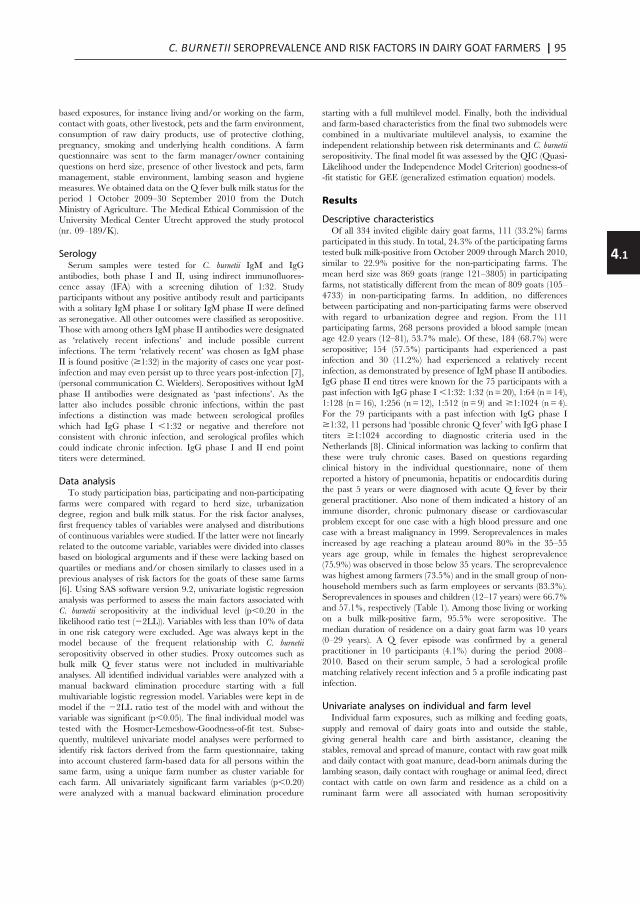
C. BURNETII SEROPREVALENCE AND RISK FACTORS IN DAIRY GOAT FARMERS | 95
4.1
Seroprevalence and Risk Factors for Coxiella burnetii (QFever) Seropositivity in Dairy Goat Farmers’ Householdsin The Netherlands, 2009–2010Barbara Schimmer1, Anke Lenferink1,2, Peter Schneeberger3, Helen Aangenend2, Piet Vellema4,
Jeannine Hautvast2, Yvonne van Duynhoven1*
1Centre for Infectious Disease Control, National Institute for Public Health and The Environment, Bilthoven, The Netherlands, 2Academic Collaborative Centre AMPHI,
Department of Primary and Community Care, Radboud University Nijmegen Medical Centre, Nijmegen, The Netherlands, 3Department of Medical Microbiology and
Infection Control, Jeroen Bosch Hospital, ’s-Hertogenbosch, The Netherlands, 4Department of Small Ruminant Health, Animal Health Service, Deventer, The Netherlands
Abstract
Community Q fever epidemics occurred in the Netherlands in 2007–2009, with dairy goat and dairy sheep farms as theimplicated source. The aim of the study was to determine the seroprevalence and risk factors for seropositivity in dairy goatfarmers and their household members living or working on these farms. Sera of 268 people living or working on 111 dairygoat farms were tested for Coxiella burnetii IgG and IgM antibodies using immunofluorescence assay. Seroprevalences infarmers, spouses and children (12–17 years) were 73.5%, 66.7%, and 57.1%, respectively. Risk factors for seropositivity were:performing three or more daily goat-related tasks, farm location in the two southern provinces of the country, proximity tobulk milk-positive farms, distance from the nearest stable to residence of 10 meters or less, presence of cats and multiplegoat breeds in the stable, covering stable air spaces and staff not wearing farm boots. Goat farmers have a high risk toacquire this occupational infection. Clinicians should consider Q fever in this population presenting with compatiblesymptoms to allow timely diagnosis and treatment to prevent severe sequelae. Based on the risk factors identified,strengthening general biosecurity measures is recommended such as consistently wearing boots and protective clothing byfarm staff to avoid indirect transmission and avoiding access of companion animals in the goat stable. Furthermore, itprovides an evidence base for continuation of the current vaccination policy for small ruminants, preventing spread fromcontaminated farms to other farms in the vicinity. Finally, vaccination of seronegative farmers and household memberscould be considered.
Received March 23, 2012; Accepted July 4, 2012; Published July 27, 2012
Introduction
Q fever is a ubiquitous zoonosis caused by the bacterium Coxiella
burnetii (C. burnetii). The primary animal reservoirs for human
infection are cattle, sheep and goats. Bacteria are shed in especially
high concentrations in placentas and birth fluids of infected
animals, which may subsequently contaminate the stable environ-
ment [1]. Human infection results from inhalation of contami-
nated aerosols, generated by infected animals or animal products
or through direct contact with milk, urine, faeces, or semen of
infected animals [2,3,4]. Human Q fever may range from
subclinical infection to endocarditis and ruptured aneurysms,
and long-term sequelae such as chronic fatigue syndrome (1–4).
Ruminant farmers are considered one of the main occupational
risk populations for acquiring C. burnetii infections [5]. In 2009–
2010, our integrated human-animal-environmental Q-VIVE study
among Dutch dairy goat farms showed a farm prevalence of
43.1% and a goat seroprevalence of 21.4% [6]. The aim of the
present study was to determine within the same farm study
population, the seroprevalence in farmers and household members
living and/or working on dairy goat farms and to assess the farm-
related and individual risk factors for seropositivity in order to
update control measures and to provide targeted advice for this
occupational group and the Dutch dairy goat industry.
Methods
All dairy goat farms in the Netherlands with at least 100 adult
goats that were not vaccinated for Q-fever were selected from a
national database of the Animal Health Service. On eligible farms,
we approached dairy goat farmers and one or two of their
household members aged 12 years and older, and in some
instances, other persons working or living on the farm such as farm
employees. A maximum of three participants were included per
farm. Non-responders received a reminder three weeks after the
initial invitation. After providing informed consent on farm and
individual level, all participating farms were visited by professional
laboratory assistants, who collected sera from October 2009
through March 2010. Each participant received an individual
questionnaire by e-mail or post containing questions on person-
PLoS ONE | www.plosone.org 1 July 2012 | Volume 7 | Issue 7 | e42364
Time-course of antibody responses against Coxiella burnetiifollowing acute Q fever
P. F. M. TEUNIS 1,2*, B. SCHIMMER 1, D. W. NOTERMANS3,
A. C. A. P. LEENDERS 4, P. C. WEVER 4, M. E. E. KRETZSCHMAR1,5
AND P. M. SCHNEEBERGER 4
1 Centre for Infectious Disease Control, Epidemiology and Surveillance Unit, RIVM, Bilthoven, The Netherlands2 Hubert Department of Global Health, Rollins School of Public Health, Emory University, Atlanta, GA, USA3 Centre for Infectious Disease Control, Laboratory for Infectious Diseases and Perinatal Screening, RIVM,Bilthoven, The Netherlands4 Jeroen Bosch Hospital, Department of Medical Microbiology and Infection Control,’s- Hertogenbosch, TheNetherlands5 Julius Centre for Health Sciences and Primary Care, University Medical Centre Utrecht, Utrecht, The
Netherlands
Received 11 October 2011; Final revision 15 February 2012; Accepted 15 February 2012;
first published online 4 April 2012
SUMMARY
Large outbreaks of Q fever in The Netherlands have provided a unique opportunity for studying
longitudinal serum antibody responses in patients. Results are presented of a cohort of 344
patients with acute symptoms of Q fever with three or more serum samples per patient. In all
these serum samples IgM and IgG against phase 1 and 2 Coxiella burnetii were measured by an
immunofluorescence assay. A mathematical model of the dynamic interaction of serum antibodies
and pathogens was used in a mixed model framework to quantitatively analyse responses to
C. burnetii infection. Responses show strong heterogeneity, with individual serum antibody
responses widely different in magnitude and shape. Features of the response, peak titre and decay
rate, are used to characterize the diversity of the observed responses. Binary mixture analysis of
IgG peak levels (phases 1 and 2) reveals a class of patients with high IgG peak titres that decay
slowly and may represent potential chronic cases. When combining the results of mixture analysis
into an odds score, it is concluded that not only high IgG phase 1 may be predictive for chronic
Q fever, but also that high IgG phase 2 may aid in detecting such putative chronic cases.
Key words: Coxiella, mathematical modelling, Q fever, serology, statistics.
INTRODUCTION
Since mid-2007 human cases of Q fever in The
Netherlands have increased sharply, with major out-
breaks in 2008 and 2009, reaching a total of about
4000 cases by 2010 [1–4]. Cases were predominantly
clustered in the south of The Netherlands [3] and the
majority of the laboratory samples were submitted
to one regional hospital : the Jeroen Bosch Hospital
in ’s-Hertogenbosch (about 2000 confirmed acute
Q fever cases). Follow-up of cases extended over a
period of up to 24 months. In the 3 years that this
outbreak persisted, laboratory results from over 2000
cases were collected in a laboratory database. This
* Author for correspondence : Professor P. F. M. Teunis, Centrefor Infectious Disease Control, Epidemiology and SurveillanceUnit, RIVM, PO Box 1, 3720BA Bilthoven, The Netherlands.(Email : [email protected])
Epidemiol. Infect. (2013), 141, 62–73. f Cambridge University Press 2012
doi:10.1017/S0950268812000404
Affiliaties
Chapter 3.2
1Centre for Infectious Disease Control, National Institute for Public Health and the Environment, Bilthoven, the Netherlands 2Municipal Health Service ‘Brabant Zuidoost, Eindhoven, the Netherlands 3Laboratory for Pathology and Medical Microbiology, Veldhoven, the Netherlands 4Region East, Food and Consumer Product Safety Authority, Zutphen, the Netherlands 5Department of Medical Microbiology and Infection Control, Jeroen Bosch Hospital, ‘s Hertogenbosch, the Netherlands 6Department of Small Ruminant Health, Animal Health Service, Deventer, the Netherlands
Chapter 4.1
1 Centre for Infectious Disease Control, National Institute for Public Health and The Environment, Bilthoven, The Netherlands 2 Academic Collaborative Centre AMPHI, Department of Primary and Community Care, Radboud University Nijmegen Medical Centre, Nijmegen, The Netherlands 3 Department of Medical Microbiology and Infection Control, Jeroen Bosch Hospital, ’s-Hertogenbosch, The Netherlands 4 Department of Small Ruminant Health, Animal Health Service, Deventer, The Netherlands
Chapter 4.2 1Centre for Infectious Disease Control, National Institute for Public Health and the Environment, Bilthoven, the Netherlands 2Quantitative Veterinary Epidemiology Group, Wageningen Institute of Animal Sciences, Wageningen, The Netherlands 3Department of Small Ruminant Health, Animal Health Service, Deventer, The Netherlands 4Academic Collaborative Centre AMPHI, Department of Primary and Community Care, Radboud University Nijmegen Medical Centre, the Netherlands
Chapter 4.4 1Centre for Infectious Disease Control, National Institute for Public Health and the Environment, Bilthoven, the Netherlands 2 Academic Collaborative Centre AMPHI, Department of Primary and Community Care, Radboud University Nijmegen Medical Centre, Nijmegen, the Netherlands 3Department of Small Ruminant Health, Animal Health Service, Deventer, The Netherlands
Chapter 4.5 1 National Institute for Public Health and the Environment (RIVM), Bilthoven, the Netherlands 2 Animal Health Service,Deventer, the Netherlands 3 Radboud University Nijmegen Medical Centre, Nijmegen, the Netherlands 4. Jeroen Bosch Hospital, ‘s-Hertogenbosch, the Netherlands Chapter 4.6 1 GD Animal Health, Deventer, The Netherlands 2 Centre for Infectious Disease Control, National Institute for Public Health and the Environment, Bilthoven, the Netherlands 3 Department of Primary and Community Care, Academic Collaborative Centre for Public Health (AMPHI), Radboud University Nijmegen Medical Centre, Nijmegen, The Netherlands
Chapter 5.1 1 Department of Small Ruminant Health, Animal Health Service, Deventer, The Netherlands 2 Centre for Infectious Disease Control, National Institute for Public Health and the Environment, Bilthoven, The Netherlands 3 Department of Medical Microbiology and Infection Control, Jeroen Bosch Hospital, ‘s-Hertogenbosch, The Netherlands, 4 Department of Diagnostics, Research and Epidemiology, Animal Health Service, Deventer, The Netherlands
Chapter 5.2
1 Division of Environmental Epidemiology, Institute for Risk Assessment Sciences, Utrecht, the Netherlands 2 Centre for Infectious Disease Control, National Institute for Public Health and the Environment, Bilthoven, the Netherlands, 3 Department of Medical Microbiology and Infection Control, Jeroen Bosch Hospital, ‘s-Hertogenbosch, the Netherlands, 4 Division of Veterinary Public Health, Institute for Risk Assessment Sciences, Utrecht, the Netherlands
Chapter 5.3 1.National Institute for Public Health and the Environment, Bilthoven, the Netherlands 2 European Centre for Disease Prevention and Control, Stockholm, Sweden 3 Jeroen Bosch Hospital, ‘s-Hertogenbosch, the Netherlands 4 ArboUnie, Utrecht, the Netherlands
Seroprevalence and Risk Factors for Coxiella burnetii (QFever) Seropositivity in Dairy Goat Farmers’ Householdsin The Netherlands, 2009–2010Barbara Schimmer1, Anke Lenferink1,2, Peter Schneeberger3, Helen Aangenend2, Piet Vellema4,
Jeannine Hautvast2, Yvonne van Duynhoven1*
1Centre for Infectious Disease Control, National Institute for Public Health and The Environment, Bilthoven, The Netherlands, 2Academic Collaborative Centre AMPHI,
Department of Primary and Community Care, Radboud University Nijmegen Medical Centre, Nijmegen, The Netherlands, 3Department of Medical Microbiology and
Infection Control, Jeroen Bosch Hospital, ’s-Hertogenbosch, The Netherlands, 4Department of Small Ruminant Health, Animal Health Service, Deventer, The Netherlands
Abstract
Community Q fever epidemics occurred in the Netherlands in 2007–2009, with dairy goat and dairy sheep farms as theimplicated source. The aim of the study was to determine the seroprevalence and risk factors for seropositivity in dairy goatfarmers and their household members living or working on these farms. Sera of 268 people living or working on 111 dairygoat farms were tested for Coxiella burnetii IgG and IgM antibodies using immunofluorescence assay. Seroprevalences infarmers, spouses and children (12–17 years) were 73.5%, 66.7%, and 57.1%, respectively. Risk factors for seropositivity were:performing three or more daily goat-related tasks, farm location in the two southern provinces of the country, proximity tobulk milk-positive farms, distance from the nearest stable to residence of 10 meters or less, presence of cats and multiplegoat breeds in the stable, covering stable air spaces and staff not wearing farm boots. Goat farmers have a high risk toacquire this occupational infection. Clinicians should consider Q fever in this population presenting with compatiblesymptoms to allow timely diagnosis and treatment to prevent severe sequelae. Based on the risk factors identified,strengthening general biosecurity measures is recommended such as consistently wearing boots and protective clothing byfarm staff to avoid indirect transmission and avoiding access of companion animals in the goat stable. Furthermore, itprovides an evidence base for continuation of the current vaccination policy for small ruminants, preventing spread fromcontaminated farms to other farms in the vicinity. Finally, vaccination of seronegative farmers and household memberscould be considered.
Received March 23, 2012; Accepted July 4, 2012; Published July 27, 2012
Introduction
Q fever is a ubiquitous zoonosis caused by the bacterium Coxiella
burnetii (C. burnetii). The primary animal reservoirs for human
infection are cattle, sheep and goats. Bacteria are shed in especially
high concentrations in placentas and birth fluids of infected
animals, which may subsequently contaminate the stable environ-
ment [1]. Human infection results from inhalation of contami-
nated aerosols, generated by infected animals or animal products
or through direct contact with milk, urine, faeces, or semen of
infected animals [2,3,4]. Human Q fever may range from
subclinical infection to endocarditis and ruptured aneurysms,
and long-term sequelae such as chronic fatigue syndrome (1–4).
Ruminant farmers are considered one of the main occupational
risk populations for acquiring C. burnetii infections [5]. In 2009–
2010, our integrated human-animal-environmental Q-VIVE study
among Dutch dairy goat farms showed a farm prevalence of
43.1% and a goat seroprevalence of 21.4% [6]. The aim of the
present study was to determine within the same farm study
population, the seroprevalence in farmers and household members
living and/or working on dairy goat farms and to assess the farm-
related and individual risk factors for seropositivity in order to
update control measures and to provide targeted advice for this
occupational group and the Dutch dairy goat industry.
Methods
All dairy goat farms in the Netherlands with at least 100 adult
goats that were not vaccinated for Q-fever were selected from a
national database of the Animal Health Service. On eligible farms,
we approached dairy goat farmers and one or two of their
household members aged 12 years and older, and in some
instances, other persons working or living on the farm such as farm
employees. A maximum of three participants were included per
farm. Non-responders received a reminder three weeks after the
initial invitation. After providing informed consent on farm and
individual level, all participating farms were visited by professional
laboratory assistants, who collected sera from October 2009
through March 2010. Each participant received an individual
questionnaire by e-mail or post containing questions on person-
PLoS ONE | www.plosone.org 1 July 2012 | Volume 7 | Issue 7 | e42364
based exposures, for instance living and/or working on the farm,
contact with goats, other livestock, pets and the farm environment,
consumption of raw dairy products, use of protective clothing,
pregnancy, smoking and underlying health conditions. A farm
questionnaire was sent to the farm manager/owner containing
questions on herd size, presence of other livestock and pets, farm
management, stable environment, lambing season and hygiene
measures. We obtained data on the Q fever bulk milk status for the
period 1 October 2009–30 September 2010 from the Dutch
Ministry of Agriculture. The Medical Ethical Commission of the
University Medical Center Utrecht approved the study protocol
(nr. 09–189/K).
SerologySerum samples were tested for C. burnetii IgM and IgG
antibodies, both phase I and II, using indirect immunofluores-
cence assay (IFA) with a screening dilution of 1:32. Study
participants without any positive antibody result and participants
with a solitary IgM phase I or solitary IgM phase II were defined
as seronegative. All other outcomes were classified as seropositive.
Those with among others IgM phase II antibodies were designated
as ‘relatively recent infections’ and include possible current
infections. The term ‘relatively recent’ was chosen as IgM phase
II is found positive ($1:32) in the majority of cases one year post-
infection and may even persist up to three years post-infection [7],
(personal communication C. Wielders). Seropositives without IgM
phase II antibodies were designated as ‘past infections’. As the
latter also includes possible chronic infections, within the past
infections a distinction was made between serological profiles
which had IgG phase I ,1:32 or negative and therefore not
consistent with chronic infection, and serological profiles which
could indicate chronic infection. IgG phase I and II end point
titers were determined.
Data analysisTo study participation bias, participating and non-participating
farms were compared with regard to herd size, urbanization
degree, region and bulk milk status. For the risk factor analyses,
first frequency tables of variables were analysed and distributions
of continuous variables were studied. If the latter were not linearly
related to the outcome variable, variables were divided into classes
based on biological arguments and if these were lacking based on
quartiles or medians and/or chosen similarly to classes used in a
previous analyses of risk factors for the goats of these same farms
[6]. Using SAS software version 9.2, univariate logistic regression
analysis was performed to assess the main factors associated with
C. burnetii seropositivity at the individual level (p,0.20 in the
likelihood ratio test (22LL)). Variables with less than 10% of data
in one risk category were excluded. Age was always kept in the
model because of the frequent relationship with C. burnetiiseropositivity observed in other studies. Proxy outcomes such as
bulk milk Q fever status were not included in multivariable
analyses. All identified individual variables were analyzed with a
manual backward elimination procedure starting with a full
multivariable logistic regression model. Variables were kept in de
model if the 22LL ratio test of the model with and without the
variable was significant (p,0.05). The final individual model was
tested with the Hosmer-Lemeshow-Goodness-of-fit test. Subse-
quently, multilevel univariate model analyses were performed to
identify risk factors derived from the farm questionnaire, taking
into account clustered farm-based data for all persons within the
same farm, using a unique farm number as cluster variable for
each farm. All univariately significant farm variables (p,0.20)
were analyzed with a manual backward elimination procedure
starting with a full multilevel model. Finally, both the individual
and farm-based characteristics from the final two submodels were
combined in a multivariate multilevel analysis, to examine the
independent relationship between risk determinants and C. burnetiiseropositivity. The final model fit was assessed by the QIC (Quasi-
Likelihood under the Independence Model Criterion) goodness-of
-fit statistic for GEE (generalized estimation equation) models.
Results
Descriptive characteristicsOf all 334 invited eligible dairy goat farms, 111 (33.2%) farms
participated in this study. In total, 24.3% of the participating farms
tested bulk milk-positive from October 2009 through March 2010,
similar to 22.9% positive for the non-participating farms. The
mean herd size was 869 goats (range 121–3805) in participating
farms, not statistically different from the mean of 809 goats (105–
4733) in non-participating farms. In addition, no differences
between participating and non-participating farms were observed
with regard to urbanization degree and region. From the 111
participating farms, 268 persons provided a blood sample (mean
age 42.0 years (12–81), 53.7% male). Of these, 184 (68.7%) were
seropositive; 154 (57.5%) participants had experienced a past
infection and 30 (11.2%) had experienced a relatively recent
infection, as demonstrated by presence of IgM phase II antibodies.
IgG phase II end titres were known for the 75 participants with a
past infection with IgG phase I ,1:32: 1:32 (n= 20), 1:64 (n= 14),
1:128 (n= 16), 1:256 (n= 12), 1:512 (n= 9) and $1:1024 (n= 4).
For the 79 participants with a past infection with IgG phase I
$1:32, 11 persons had ‘possible chronic Q fever’ with IgG phase I
titers $1:1024 according to diagnostic criteria used in the
Netherlands [8]. Clinical information was lacking to confirm that
these were truly chronic cases. Based on questions regarding
clinical history in the individual questionnaire, none of them
reported a history of pneumonia, hepatitis or endocarditis during
the past 5 years or were diagnosed with acute Q fever by their
general practitioner. Also none of them indicated a history of an
immune disorder, chronic pulmonary disease or cardiovascular
problem except for one case with a high blood pressure and one
case with a breast malignancy in 1999. Seroprevalences in males
increased by age reaching a plateau around 80% in the 35–55
years age group, while in females the highest seroprevalence
(75.9%) was observed in those below 35 years. The seroprevalence
was highest among farmers (73.5%) and in the small group of non-
household members such as farm employees or servants (83.3%).
Seroprevalences in spouses and children (12–17 years) were 66.7%
and 57.1%, respectively (Table 1). Among those living or working
on a bulk milk-positive farm, 95.5% were seropositive. The
median duration of residence on a dairy goat farm was 10 years
(0–29 years). A Q fever episode was confirmed by a general
practitioner in 10 participants (4.1%) during the period 2008–
2010. Based on their serum sample, 5 had a serological profile
matching relatively recent infection and 5 a profile indicating past
infection.
Univariate analyses on individual and farm levelIndividual farm exposures, such as milking and feeding goats,
supply and removal of dairy goats into and outside the stable,
giving general health care and birth assistance, cleaning the
stables, removal and spread of manure, contact with raw goat milk
and daily contact with goat manure, dead-born animals during the
lambing season, daily contact with roughage or animal feed, direct
contact with cattle on own farm and residence as a child on a
ruminant farm were all associated with human seropositivity
Q Fever Seroprevalence in Dutch Dairy Goat Farmers
PLoS ONE | www.plosone.org 2 July 2012 | Volume 7 | Issue 7 | e42364

96 | CHAPTER 4.1
(p,0.05). Potential risk factors with p$0.05 to p,0.20 were
having lived and/or worked before 1997 on a dairy goat farm,
being a farmer, fulltime work week, having a dog, direct contact
with horses on own farm, daily contact with birth material during
the lambing season, contact with cattle manure and contact with
goats, dogs and cats at other farms and work experience in the
cattle sector (Table 2).
The following farm-based characteristics were potential risk
factors in univariate analyses: farm location (south), short distance
to the nearest bulk milk-positive farm, bulk milk status from 1
October 2009 to 30 September 2010, herd size $800 goats,
distance between residence and nearest goat stable #10 meters,
presence of other goat breeds besides the Dutch White Goat, use
of artificial insemination, extended lactation, presence of cats in
the stable, use of silage and/or maize feed, using a fodder mixer or
automatic feeding method, use of screen/gauze in the stable,
covering air spaces in the stable for combating nuisance animals
such as wild birds, $3 lambing periods per year, an abortion
percentage of $4% in 2007–2009 or a reported Q fever abortion
wave. Biosecurity factors such as having a closed farm tenure, goat
supply from southern provinces, receiving farm visitors for school
tours or organised groups, and not wearing farm boots among staff
and other employees were also potential risk factors. Two spatial
variables were potential risk factors: municipal cattle density of 100
ruminants per km2 and a net goat density of $15 goats per km2
within five kilometre radius. Besides risk factors, potential
protective factors were found, such as presence of laying hens,
stable air ventilation through a flap, membership of an organic
dairy goat cooperative, and presence of rats or mice in the stable in
2008 before implementation of the hygiene protocol (Table 3).
Multivariate and multilevel analysesThree individual and eight farm-based variables were significant
in the two final multivariate submodels (p,0.05, 22LL) (Tables 4
and 5, respectively) and together with age group used as the full
multilevel model. The final combined individual-farm multilevel
model showed that the number of daily performed goat-related
tasks (including milking, feeding, supply and removal of goats,
general health care, birth assistance of goats) was an independent
significant risk factor as well as farm location in the two southern
provinces, distance to nearest bulk milk-positive farm, presence of
a cat in the goat stable, distance between residence and goat stable
#10 meters, presence of other goat breeds besides the Dutch
White Goat and not wearing farm boots among staff and other
employees (Table 6). A borderline significant risk factor and a
protective factor were found, i.e. living as child on a ruminant
farm and no use of extended lactation, respectively.
Discussion
This is the first study addressing the seroprevalence in dairy goat
households in the Netherlands, and one of few risk factor studies
on human C. burnetii infections in farm populations worldwide. It
confirms that living and or working on a dairy goat farm poses a
high lifetime risk for acquisition of a C. burnetii infection. Farmers
and other household members are generally in closest proximity to
infected goats and contaminated stables on farms, and therefore at
Table 1. Descriptive characteristics and seroprevalence of dairy goat farmers and family members (n = 268), September 2009–April2010, The Netherlands.
Variable Frequency (N) Seroprevalence
% (N) 95% CI (exact)
Participant 268 68.7 (184) 62.7–74.2
Sex
Male 144 70.1 (101) 62.0–77.5
Female 124 66.9 (83) 57.9–75.1
Age (years) in males
,35 36 55.6 (20) 38.1–72.1
35-,45 43 79.1 (34) 64.0–90.0
45-,55 35 80.0 (28) 63.1–91.6
$55 30 63.3 (19) 43.9–80.1
Age (years) in females
,35 29 75.9 (22) 56.5–89.7
35-,45 47 61.7 (29) 46.4–75.5
45-,55 31 67.7 (21) 48.6–83.3
$55 17 64.7 (11) 38.3–85.8
Function
Farmer 132 73.5 (97) 65.1–80.8
Spouse 69 66.7 (46) 54.3–77.6
Farmers’ son/daughter $18 years 21 66.7 (14) 43.0–85.4
Child (12–17 years) 14 57.1 (8) 28.9–82.3
Other family members 26 53.9 (14) 33.4–73.4
Other persons, such as farm employees 6 83.3 (5) 35.9–99.6
CI, Confidence Interval.doi:10.1371/journal.pone.0042364.t001
Q Fever Seroprevalence in Dutch Dairy Goat Farmers
PLoS ONE | www.plosone.org 3 July 2012 | Volume 7 | Issue 7 | e42364
Table 2. Univariate logistic model of individual factors associated with human Q-fever (P,0.20) with corresponding frequency (N),seroprevalence (%), odds ratio (OR) and 95% confidence interval (CI).
Variable CategoryFreq.(N)
Seropre-valence(%) OR [95% CI] p-value
Age group ,35 years 65 64.6 Reference 0.57
35-,45 years 90 70.0 1.28 [0.65–2.52
45-,55 years 66 74.2 1.58 [0.75–3.34]
$55 years 47 63.8 0.97 [0.44–2.11]
Start working on goat farm 1997 or after 141 66.0 Reference 0.07
before 1997 107 76.6 1.69 [0.96–2.99]
Function Farmer 122 74.6 1.54 [0.89–2.68] 0.13
Other 122 65.6 Reference
Hours working on farm Fulltime 124 76.6 2.46 [1.25–4.82] 0.05
Halftime 35 74.3 2.17 [0.86–5.46]
Quarter week 29 62.1 1.23 [0.49–3.07]
Sometimes/never 56 57.1 Reference
Number of daily goat-related tasks (milking, feeding, supplyand removal, general animal health care, birth assistance)
$3 tasks 167 79.6 3.69 [2.14–6.34] ,0.01
#2 tasks 101 50.5 Reference
Milking goats Yes 183 75.4 2.60 [1.42–4.77] ,0.01
No 61 54.1 Reference
Feeding goats Yes 186 76.3 3.23 [1.74–5.97] ,0.01
No 58 50.0 Reference
Supply and removal of dairy goats or bucks Yes 120 82.5 3.41 [1.89–6.15] ,0.01
No 124 58.1 Reference
Care for general animal health Yes 151 78.8 2.93 [1.67–5.16] ,0.01
No 93 55.9 Reference
Birth assistance Yes 151 78.2 2.70 [1.54–4.74] ,0.01
No 93 57.0 Reference
Remove manure Yes 130 76.9 2.02 [1.16–3.52] 0.01
No 114 62.3 Reference
Spread manure Yes 69 82.6 2.54 [1.27–5.10] ,0.01
No 175 65.1 Reference
Clean the stables Yes 118 81.4 2.97 [1.66–5.32] ,0.01
No 126 59.5 Reference
Administration Yes 148 74.3 1.66 [0.95–2.90] 0.07
No 96 63.5 Reference
Having a dog Yes 209 71.8 1.70 [0.81–3.55] 0.16
No 35 60.0 Reference
Direct contact cattle own farm Yes 34 85.3 2.78 [1.03–7.55] 0.04
No 210 67.6 Reference
Direct contact horses own farm Yes 90 76.7 1.68 [0.93–3.03] 0.09
No 154 66.2 Reference
Direct contact goats other farm Yes 28 82.1 2.11 [0.77–5.80] 0.15
No 216 68.5 Reference
Direct contact horses other farm Yes 24 83.3 2.29 [0.75–6.94] 0.14
No 250 68.6 Reference
Direct contact dogs other farm Yes 81 77.8 1.78 [0.96–3.30] 0.07
No 163 66.3 Reference
Direct contact cats other farm Yes 29 82.8 2.22 [0.81–6.07] 0.12
No 215 68.4 Reference
Daily contact roughage/animal feed Yes 174 74.1 1.91 [1.06–3.44] 0.03
No 70 60.0 Reference
Q Fever Seroprevalence in Dutch Dairy Goat Farmers
PLoS ONE | www.plosone.org 4 July 2012 | Volume 7 | Issue 7 | e42364

C. BURNETII SEROPREVALENCE AND RISK FACTORS IN DAIRY GOAT FARMERS | 97
4.1
(p,0.05). Potential risk factors with p$0.05 to p,0.20 were
having lived and/or worked before 1997 on a dairy goat farm,
being a farmer, fulltime work week, having a dog, direct contact
with horses on own farm, daily contact with birth material during
the lambing season, contact with cattle manure and contact with
goats, dogs and cats at other farms and work experience in the
cattle sector (Table 2).
The following farm-based characteristics were potential risk
factors in univariate analyses: farm location (south), short distance
to the nearest bulk milk-positive farm, bulk milk status from 1
October 2009 to 30 September 2010, herd size $800 goats,
distance between residence and nearest goat stable #10 meters,
presence of other goat breeds besides the Dutch White Goat, use
of artificial insemination, extended lactation, presence of cats in
the stable, use of silage and/or maize feed, using a fodder mixer or
automatic feeding method, use of screen/gauze in the stable,
covering air spaces in the stable for combating nuisance animals
such as wild birds, $3 lambing periods per year, an abortion
percentage of $4% in 2007–2009 or a reported Q fever abortion
wave. Biosecurity factors such as having a closed farm tenure, goat
supply from southern provinces, receiving farm visitors for school
tours or organised groups, and not wearing farm boots among staff
and other employees were also potential risk factors. Two spatial
variables were potential risk factors: municipal cattle density of 100
ruminants per km2 and a net goat density of $15 goats per km2
within five kilometre radius. Besides risk factors, potential
protective factors were found, such as presence of laying hens,
stable air ventilation through a flap, membership of an organic
dairy goat cooperative, and presence of rats or mice in the stable in
2008 before implementation of the hygiene protocol (Table 3).
Multivariate and multilevel analysesThree individual and eight farm-based variables were significant
in the two final multivariate submodels (p,0.05, 22LL) (Tables 4
and 5, respectively) and together with age group used as the full
multilevel model. The final combined individual-farm multilevel
model showed that the number of daily performed goat-related
tasks (including milking, feeding, supply and removal of goats,
general health care, birth assistance of goats) was an independent
significant risk factor as well as farm location in the two southern
provinces, distance to nearest bulk milk-positive farm, presence of
a cat in the goat stable, distance between residence and goat stable
#10 meters, presence of other goat breeds besides the Dutch
White Goat and not wearing farm boots among staff and other
employees (Table 6). A borderline significant risk factor and a
protective factor were found, i.e. living as child on a ruminant
farm and no use of extended lactation, respectively.
Discussion
This is the first study addressing the seroprevalence in dairy goat
households in the Netherlands, and one of few risk factor studies
on human C. burnetii infections in farm populations worldwide. It
confirms that living and or working on a dairy goat farm poses a
high lifetime risk for acquisition of a C. burnetii infection. Farmers
and other household members are generally in closest proximity to
infected goats and contaminated stables on farms, and therefore at
Table 1. Descriptive characteristics and seroprevalence of dairy goat farmers and family members (n = 268), September 2009–April2010, The Netherlands.
Variable Frequency (N) Seroprevalence
% (N) 95% CI (exact)
Participant 268 68.7 (184) 62.7–74.2
Sex
Male 144 70.1 (101) 62.0–77.5
Female 124 66.9 (83) 57.9–75.1
Age (years) in males
,35 36 55.6 (20) 38.1–72.1
35-,45 43 79.1 (34) 64.0–90.0
45-,55 35 80.0 (28) 63.1–91.6
$55 30 63.3 (19) 43.9–80.1
Age (years) in females
,35 29 75.9 (22) 56.5–89.7
35-,45 47 61.7 (29) 46.4–75.5
45-,55 31 67.7 (21) 48.6–83.3
$55 17 64.7 (11) 38.3–85.8
Function
Farmer 132 73.5 (97) 65.1–80.8
Spouse 69 66.7 (46) 54.3–77.6
Farmers’ son/daughter $18 years 21 66.7 (14) 43.0–85.4
Child (12–17 years) 14 57.1 (8) 28.9–82.3
Other family members 26 53.9 (14) 33.4–73.4
Other persons, such as farm employees 6 83.3 (5) 35.9–99.6
CI, Confidence Interval.doi:10.1371/journal.pone.0042364.t001
Q Fever Seroprevalence in Dutch Dairy Goat Farmers
PLoS ONE | www.plosone.org 3 July 2012 | Volume 7 | Issue 7 | e42364
Table 2. Univariate logistic model of individual factors associated with human Q-fever (P,0.20) with corresponding frequency (N),seroprevalence (%), odds ratio (OR) and 95% confidence interval (CI).
Variable CategoryFreq.(N)
Seropre-valence(%) OR [95% CI] p-value
Age group ,35 years 65 64.6 Reference 0.57
35-,45 years 90 70.0 1.28 [0.65–2.52
45-,55 years 66 74.2 1.58 [0.75–3.34]
$55 years 47 63.8 0.97 [0.44–2.11]
Start working on goat farm 1997 or after 141 66.0 Reference 0.07
before 1997 107 76.6 1.69 [0.96–2.99]
Function Farmer 122 74.6 1.54 [0.89–2.68] 0.13
Other 122 65.6 Reference
Hours working on farm Fulltime 124 76.6 2.46 [1.25–4.82] 0.05
Halftime 35 74.3 2.17 [0.86–5.46]
Quarter week 29 62.1 1.23 [0.49–3.07]
Sometimes/never 56 57.1 Reference
Number of daily goat-related tasks (milking, feeding, supplyand removal, general animal health care, birth assistance)
$3 tasks 167 79.6 3.69 [2.14–6.34] ,0.01
#2 tasks 101 50.5 Reference
Milking goats Yes 183 75.4 2.60 [1.42–4.77] ,0.01
No 61 54.1 Reference
Feeding goats Yes 186 76.3 3.23 [1.74–5.97] ,0.01
No 58 50.0 Reference
Supply and removal of dairy goats or bucks Yes 120 82.5 3.41 [1.89–6.15] ,0.01
No 124 58.1 Reference
Care for general animal health Yes 151 78.8 2.93 [1.67–5.16] ,0.01
No 93 55.9 Reference
Birth assistance Yes 151 78.2 2.70 [1.54–4.74] ,0.01
No 93 57.0 Reference
Remove manure Yes 130 76.9 2.02 [1.16–3.52] 0.01
No 114 62.3 Reference
Spread manure Yes 69 82.6 2.54 [1.27–5.10] ,0.01
No 175 65.1 Reference
Clean the stables Yes 118 81.4 2.97 [1.66–5.32] ,0.01
No 126 59.5 Reference
Administration Yes 148 74.3 1.66 [0.95–2.90] 0.07
No 96 63.5 Reference
Having a dog Yes 209 71.8 1.70 [0.81–3.55] 0.16
No 35 60.0 Reference
Direct contact cattle own farm Yes 34 85.3 2.78 [1.03–7.55] 0.04
No 210 67.6 Reference
Direct contact horses own farm Yes 90 76.7 1.68 [0.93–3.03] 0.09
No 154 66.2 Reference
Direct contact goats other farm Yes 28 82.1 2.11 [0.77–5.80] 0.15
No 216 68.5 Reference
Direct contact horses other farm Yes 24 83.3 2.29 [0.75–6.94] 0.14
No 250 68.6 Reference
Direct contact dogs other farm Yes 81 77.8 1.78 [0.96–3.30] 0.07
No 163 66.3 Reference
Direct contact cats other farm Yes 29 82.8 2.22 [0.81–6.07] 0.12
No 215 68.4 Reference
Daily contact roughage/animal feed Yes 174 74.1 1.91 [1.06–3.44] 0.03
No 70 60.0 Reference
Q Fever Seroprevalence in Dutch Dairy Goat Farmers
PLoS ONE | www.plosone.org 4 July 2012 | Volume 7 | Issue 7 | e42364

98 | CHAPTER 4.1
highest risk for inhaling C. burnetii. We investigated C. burnetii
presence in vaginal swabs, manure, surface area swabs, milk unit
filters, and aerosols at 19 Dutch dairy goat farms in the
environmental study component. Farms with an abortion history
and positive bulk milk status displayed the highest level of C.
burnetii DNA in, among others, aerosols and surface area swabs,
indicating an elevated risk to farm households and visitors in
acquiring Q fever [9]. This is supported by our finding that one
quarter of all study participants resided on a bulk milk-positive
farm, of which all were seropositive except for three persons on
one farm which tested bulk milk-positive two months after human
sera were taken. This indicates a highly effective transmission from
infected animals to humans, as was already shown in workers
involved in culling goats of whom 17.5% seroconverted post-cull
[10].
The observed seroprevalence was not only high for the farmers
(74.2%), as expected, but also among spouses (66.7%) and children
of 12–17 years (57.1%), who lived and often also worked at the
farm. The seroprevalence clearly exceeds the estimates of 2.4%
found in the Dutch general population preceding the first
epidemic season in 2006–2007 [11], the 24% in a rural area in
the epicentre of the epidemic in September 2007 [12] and the
12.2% in blood donors living in the high-endemic regions in
2009–2010 [13]. The seroprevalence was also higher compared to
those in other studies focusing on, non-further specified, farm
populations, such as 49% among farmers from Northern Ireland
[14], and 27% in a farm cohort in the United Kingdom [5,14], but
was comparable to the seroprevalences ranging from 68% through
84% among professionals intensively working with ruminants in
several other studies [15,16,17,18]. In general, comparison of
seroprevalences is complicated because of the different study
populations, diagnostic tests and cut-off values used. The study
from Northern Ireland suggested that infection is mainly acquired
in adolescence and early adulthood with slight further acquisition
of infection in older age groups above 35 years [14]. We observed
a different seroprevalence pattern in our study, with a simialr
seroprevalence among males in the age group 12 to 25 years and
25 to 34 years (55.0% and 56.3%, respectively) and observed an
increase to 79.1% in males of 35 to 44 years, while females below
25 years had already a higher seroprevalence (81.3%) compared to
females in the 25–34 years age group (69.2%).
This study shows Q fever in dairy goat farm households is an
actual occupational disease as one out of 9 participants had an
indication for a relatively recent infection. Partially these were also
diagnosed in routine medical practice in the past few years and
thus with symptomatic manifestations. Eleven participants (4.1%)
had a serological profile indicative for a chronic infection (IgG
phase I titers $1:1024), classified as ‘possible chronic Q-fever’
according to the recent Dutch criteria [8]. Clinical information
was lacking to confirm that these were truly chronic cases: we
neither had date of onset of symptoms compatible with Q-fever in
the acute stage of these participants, if any, to know that these high
level antibodies were found more than six months following
infection, nor had we any clinical follow-up information for these
patients after the test result from the study was communicated to
them through their general practitioner, who took care of the
regular follow-up protocol.
Several independent individual and farm-based risk factors for
C. burnetii seropositivity were found such as performing $3 daily
goat-related tasks, farm location in the two southern provinces,
distance to the nearest bulk milk-positive farm, presence of other
goat breeds besides the Dutch White Goat, covering air spaces in
the goat stable to combat nuisance animals such as wild birds,
#10 meters distance between residence and nearest stable,
Table 2. Cont.
Variable CategoryFreq.(N)
Seropre-valence(%) OR [95% CI] p-value
Contact raw milk Yes 182 75.3 2.51 [1.37–4.58] ,0.01
No 62 54.8 Reference
Daily contact goat manure Yes 163 75.5 2.11 [1.20–3.74] 0.01
No/no respons 81 59.3 Reference
Contact cattle manure Yes 32 84.4 2.55 [0.94–6.91] 0.07
No 212 67.9 Reference
Daily contact dead-born animals Yes 100 80.0 2.33 [0.94–6.91] ,0.01
No 143 63.2 Reference
Daily contact with placenta/birth material Yes 156 73.1 1.48 [0.84–2.59] 0.17
No/no respons 88 64.8 Reference
Work in agriculture (swine) Yes 79 77.2 1.69 [0.91–3.14] 0.09
No 165 66.7 Reference
Work in agriculture (cattle) Yes 134\ 74.6\ 1.62 [0.92–2.80] 0.09
No 110 64.5 Reference
Work in agriculture (crops) Yes 53 77.4 1.60 [0.79–3.27] 0.19
No 191 68.1 Reference
Work in transport (agricultural products, such as hay, straw) Yes 31 83.9 2.44 [0.90–6.63] 0.08
No 213 68.1 Reference
Lived as child on a ruminant farm Yes 172 74.4 1.79 [0.96–3.32] 0.02
No 72 59.7 Reference
doi:10.1371/journal.pone.0042364.t002
Q Fever Seroprevalence in Dutch Dairy Goat Farmers
PLoS ONE | www.plosone.org 5 July 2012 | Volume 7 | Issue 7 | e42364
Table 3. Univariate multilevel model of farm-based factors associated with human Q-fever (p,0.20) with corresponding frequency(N), seroprevalence (%), odds ratio (OR) and 95% confidence interval (CI).
Variable CategoryFreq.(N)
Seropre-valence(%) OR [95% CI] p-value
Herd size $800 goats 124 75.8 1.82 [1.07–3.11] 0.03
,800 goats 144 63.2 Reference
Farm region North (Dr, Fr, Gro) 39 51.3 Reference ,0.01
East (Ge, Ov, Fle) 92 67.4 1.96 [0.91–4.22]
West (Ut, Ze, Nh, Zh) 37 56.8 1.25 [0.51–3.08]
South (Nb, Li) 100 82.0 4.33 [1.93–9.72]
Q fever mandatory vaccination area 2009 Yes 124 83.1 3.71 [2.09–6.58] ,0.01
No 144 56.9 Reference
Bulk milk farm status Positive 67 95.5 14.1 [4.28–46.45] ,0.01
Negative 201 60.2 Reference
Serological farm status ($1 goat seropositive) Positive 100 93.0 12.1 [5.21–28.10] ,0.01
Negative 128 52.3 Reference
Net goat density per km2 within 5 km radius $15 110 79.1 2.32 [1.32–4.06] ,0.01
,15 158 62.0 Reference
Cattle density (incl meat calves) $100 183 72.1 1.42 [0.81–2.47] 0.13
,100 82 64.6 Reference
Bulk milk-positive farm within 5 km radius Yes 81 81.5 2.51 [1.33–4.74] ,0.01
No 187 63.6 Reference
Distance to nearest positive farm 0- ,4 km 74 83.8 4.74 [2.18–10.31] ,0.01
4- ,8 km 50 76.0 2.90 [1.30–6.48]
8- ,16 km 75 65.3 1.73 [0.88–3.38]
$16 km 69 52.2 Reference
Farm part of organic goat farming cooperation Yes 38 57.9 0.57[0.28–1.14] 0.12
No 220 70.9 Reference
Distance residence to nearest stable #10 m 118 77.1 2.06 [1.17–3.61] 0.01
.10 m 124 62.1 Reference
Other goat breeds next to white dairy goat Present 125 78.4 2.22 [1.27–3.88] ,0.01
Absent 124 62.1 Reference
Number of stables .3 stables 55 78.2 1.68[0.83–3.41] 0.15
#3 stables 194 68.0 Reference
Use of artificial insemination Yes 62 80.7 2.05[1.02–4.13] 0.04
No 185 67.0 Reference
Extended lactation Yes 212 72.6 Reference 0.03
No 32 53.1 0.43 [0.20–0.91]
Laying hens on farm Yes 40 55.0 0.45 [0.22–0.90] 0.03
No 209 73.2 Reference
Presence of cat(s) in goat stable Present 91 75.8 1.54 [0.86–2.76] 0.15
Absent 158 67.1 Reference
Use of silage Yes 165 75.8 2.13 [1.21–3.73] ,0.01
No 84 59.5 Reference
Use of maize Yes 95 81.1 2.44[1.33–4.50] ,0.01
No 154 63.6 Reference
Feeding method Fodder mixer or automatic 159 74.8 1.81[1.04–3.15] 0.04
Hand/wheelbarrow 90 62.2 Reference
Use of screen/gauze Screen/gauze 91 78.0 1.86 [0.91–3.80] 0.12
Windstoppers only 94 66.0 1.01 [0.52–1.98]
None of the above 64 65.6 Reference
Air ventilation through flap Yes 33 57.6 0.52 [0.25–1.11] 0.10
Q Fever Seroprevalence in Dutch Dairy Goat Farmers
PLoS ONE | www.plosone.org 6 July 2012 | Volume 7 | Issue 7 | e42364

C. BURNETII SEROPREVALENCE AND RISK FACTORS IN DAIRY GOAT FARMERS | 99
4.1
highest risk for inhaling C. burnetii. We investigated C. burnetii
presence in vaginal swabs, manure, surface area swabs, milk unit
filters, and aerosols at 19 Dutch dairy goat farms in the
environmental study component. Farms with an abortion history
and positive bulk milk status displayed the highest level of C.
burnetii DNA in, among others, aerosols and surface area swabs,
indicating an elevated risk to farm households and visitors in
acquiring Q fever [9]. This is supported by our finding that one
quarter of all study participants resided on a bulk milk-positive
farm, of which all were seropositive except for three persons on
one farm which tested bulk milk-positive two months after human
sera were taken. This indicates a highly effective transmission from
infected animals to humans, as was already shown in workers
involved in culling goats of whom 17.5% seroconverted post-cull
[10].
The observed seroprevalence was not only high for the farmers
(74.2%), as expected, but also among spouses (66.7%) and children
of 12–17 years (57.1%), who lived and often also worked at the
farm. The seroprevalence clearly exceeds the estimates of 2.4%
found in the Dutch general population preceding the first
epidemic season in 2006–2007 [11], the 24% in a rural area in
the epicentre of the epidemic in September 2007 [12] and the
12.2% in blood donors living in the high-endemic regions in
2009–2010 [13]. The seroprevalence was also higher compared to
those in other studies focusing on, non-further specified, farm
populations, such as 49% among farmers from Northern Ireland
[14], and 27% in a farm cohort in the United Kingdom [5,14], but
was comparable to the seroprevalences ranging from 68% through
84% among professionals intensively working with ruminants in
several other studies [15,16,17,18]. In general, comparison of
seroprevalences is complicated because of the different study
populations, diagnostic tests and cut-off values used. The study
from Northern Ireland suggested that infection is mainly acquired
in adolescence and early adulthood with slight further acquisition
of infection in older age groups above 35 years [14]. We observed
a different seroprevalence pattern in our study, with a simialr
seroprevalence among males in the age group 12 to 25 years and
25 to 34 years (55.0% and 56.3%, respectively) and observed an
increase to 79.1% in males of 35 to 44 years, while females below
25 years had already a higher seroprevalence (81.3%) compared to
females in the 25–34 years age group (69.2%).
This study shows Q fever in dairy goat farm households is an
actual occupational disease as one out of 9 participants had an
indication for a relatively recent infection. Partially these were also
diagnosed in routine medical practice in the past few years and
thus with symptomatic manifestations. Eleven participants (4.1%)
had a serological profile indicative for a chronic infection (IgG
phase I titers $1:1024), classified as ‘possible chronic Q-fever’
according to the recent Dutch criteria [8]. Clinical information
was lacking to confirm that these were truly chronic cases: we
neither had date of onset of symptoms compatible with Q-fever in
the acute stage of these participants, if any, to know that these high
level antibodies were found more than six months following
infection, nor had we any clinical follow-up information for these
patients after the test result from the study was communicated to
them through their general practitioner, who took care of the
regular follow-up protocol.
Several independent individual and farm-based risk factors for
C. burnetii seropositivity were found such as performing $3 daily
goat-related tasks, farm location in the two southern provinces,
distance to the nearest bulk milk-positive farm, presence of other
goat breeds besides the Dutch White Goat, covering air spaces in
the goat stable to combat nuisance animals such as wild birds,
#10 meters distance between residence and nearest stable,
Table 2. Cont.
Variable CategoryFreq.(N)
Seropre-valence(%) OR [95% CI] p-value
Contact raw milk Yes 182 75.3 2.51 [1.37–4.58] ,0.01
No 62 54.8 Reference
Daily contact goat manure Yes 163 75.5 2.11 [1.20–3.74] 0.01
No/no respons 81 59.3 Reference
Contact cattle manure Yes 32 84.4 2.55 [0.94–6.91] 0.07
No 212 67.9 Reference
Daily contact dead-born animals Yes 100 80.0 2.33 [0.94–6.91] ,0.01
No 143 63.2 Reference
Daily contact with placenta/birth material Yes 156 73.1 1.48 [0.84–2.59] 0.17
No/no respons 88 64.8 Reference
Work in agriculture (swine) Yes 79 77.2 1.69 [0.91–3.14] 0.09
No 165 66.7 Reference
Work in agriculture (cattle) Yes 134\ 74.6\ 1.62 [0.92–2.80] 0.09
No 110 64.5 Reference
Work in agriculture (crops) Yes 53 77.4 1.60 [0.79–3.27] 0.19
No 191 68.1 Reference
Work in transport (agricultural products, such as hay, straw) Yes 31 83.9 2.44 [0.90–6.63] 0.08
No 213 68.1 Reference
Lived as child on a ruminant farm Yes 172 74.4 1.79 [0.96–3.32] 0.02
No 72 59.7 Reference
doi:10.1371/journal.pone.0042364.t002
Q Fever Seroprevalence in Dutch Dairy Goat Farmers
PLoS ONE | www.plosone.org 5 July 2012 | Volume 7 | Issue 7 | e42364
Table 3. Univariate multilevel model of farm-based factors associated with human Q-fever (p,0.20) with corresponding frequency(N), seroprevalence (%), odds ratio (OR) and 95% confidence interval (CI).
Variable CategoryFreq.(N)
Seropre-valence(%) OR [95% CI] p-value
Herd size $800 goats 124 75.8 1.82 [1.07–3.11] 0.03
,800 goats 144 63.2 Reference
Farm region North (Dr, Fr, Gro) 39 51.3 Reference ,0.01
East (Ge, Ov, Fle) 92 67.4 1.96 [0.91–4.22]
West (Ut, Ze, Nh, Zh) 37 56.8 1.25 [0.51–3.08]
South (Nb, Li) 100 82.0 4.33 [1.93–9.72]
Q fever mandatory vaccination area 2009 Yes 124 83.1 3.71 [2.09–6.58] ,0.01
No 144 56.9 Reference
Bulk milk farm status Positive 67 95.5 14.1 [4.28–46.45] ,0.01
Negative 201 60.2 Reference
Serological farm status ($1 goat seropositive) Positive 100 93.0 12.1 [5.21–28.10] ,0.01
Negative 128 52.3 Reference
Net goat density per km2 within 5 km radius $15 110 79.1 2.32 [1.32–4.06] ,0.01
,15 158 62.0 Reference
Cattle density (incl meat calves) $100 183 72.1 1.42 [0.81–2.47] 0.13
,100 82 64.6 Reference
Bulk milk-positive farm within 5 km radius Yes 81 81.5 2.51 [1.33–4.74] ,0.01
No 187 63.6 Reference
Distance to nearest positive farm 0- ,4 km 74 83.8 4.74 [2.18–10.31] ,0.01
4- ,8 km 50 76.0 2.90 [1.30–6.48]
8- ,16 km 75 65.3 1.73 [0.88–3.38]
$16 km 69 52.2 Reference
Farm part of organic goat farming cooperation Yes 38 57.9 0.57[0.28–1.14] 0.12
No 220 70.9 Reference
Distance residence to nearest stable #10 m 118 77.1 2.06 [1.17–3.61] 0.01
.10 m 124 62.1 Reference
Other goat breeds next to white dairy goat Present 125 78.4 2.22 [1.27–3.88] ,0.01
Absent 124 62.1 Reference
Number of stables .3 stables 55 78.2 1.68[0.83–3.41] 0.15
#3 stables 194 68.0 Reference
Use of artificial insemination Yes 62 80.7 2.05[1.02–4.13] 0.04
No 185 67.0 Reference
Extended lactation Yes 212 72.6 Reference 0.03
No 32 53.1 0.43 [0.20–0.91]
Laying hens on farm Yes 40 55.0 0.45 [0.22–0.90] 0.03
No 209 73.2 Reference
Presence of cat(s) in goat stable Present 91 75.8 1.54 [0.86–2.76] 0.15
Absent 158 67.1 Reference
Use of silage Yes 165 75.8 2.13 [1.21–3.73] ,0.01
No 84 59.5 Reference
Use of maize Yes 95 81.1 2.44[1.33–4.50] ,0.01
No 154 63.6 Reference
Feeding method Fodder mixer or automatic 159 74.8 1.81[1.04–3.15] 0.04
Hand/wheelbarrow 90 62.2 Reference
Use of screen/gauze Screen/gauze 91 78.0 1.86 [0.91–3.80] 0.12
Windstoppers only 94 66.0 1.01 [0.52–1.98]
None of the above 64 65.6 Reference
Air ventilation through flap Yes 33 57.6 0.52 [0.25–1.11] 0.10
Q Fever Seroprevalence in Dutch Dairy Goat Farmers
PLoS ONE | www.plosone.org 6 July 2012 | Volume 7 | Issue 7 | e42364

100 | CHAPTER 4.1
presence of cats in the stable and not wearing farm boots by staff.
The individual risk factor of performing $3 daily activities
involving direct contact with goats or dust-producing activities in
the goat stable, such as milking, feeding, supply and removal of
goats, general health care and cleaning the stable, reflects the
intensity of goat and stable environment contact. Under these
circumstances the risk of inhalation of contaminated aerosols is
high, with a plausible increased risk for acquiring an infection. A
study among British farm workers suggested that the extent of total
farm animal contact seemed more important than specific animal
exposure, indicating that risk of C. burnetii exposure is mainly
related to farm environment contact [5]. Manure-related tasks did
not add to the cumulative risk of performing goat-related tasks
indicating transmission through manure is probably less important
as shown in a C. burnetii survival study showing short decimal
reduction times to establish effective killing of viable bacteria in
goat manure piles [19]. Persons who lived as child on a ruminant
farm were more often seropositive. This is a plausible risk factor
for identified past infections and in agreement with a study among
Dutch veterinary students where those that grew up on a ruminant
Table 3. Cont.
Variable CategoryFreq.(N)
Seropre-valence(%) OR [95% CI] p-value
No 216 72.2 Reference
Presence of Mice and/or rats in the stable in 2008 Present 171 67.3 Reference 0.09
Absent 76 77.6 1.69 [0.90–3.16]
Combat other nuisance animals in 2008 Via covering airspaces 32 84.4 2.52[0.93–6.82] 0.05
Not via covering airspaces or nocombat
217 68.2 Reference
Lambing periods $3 or more periods 21 90.5 4.39 [1.00–19.33] 0.05
#2 lambing periods 228 68.4 Reference
Abortion percentage 2007–2009 including abortion historydue to Q fever
.4 percent 36 86.1 2.97 [1.11–7.97] 0.02
0–4 percent 213 67.6 Reference
Farm tenure Closed farm for male and femalegoats
63 77.8 1.68 [0.86–3.28] 0.12
Not completely closed 185 67.6 Reference
Goat supply region South 77 83.1 1.68 [1.87–7.69] ,0.01
Other regions 108 56.5 Reference
No supply 64 78.1 2.75[1.36–5.56]
Farm visitors School tours 98 75.5 1.53 [0.86–2.70] 0.14
No tours 151 66.9 Reference
Farm boots for staff Yes 164 66.5 Reference 0.03
No 82 79.3 1.93 [1.03–3.60]
doi:10.1371/journal.pone.0042364.t003
Table 4. Results of the multivariate logistic regression with individual characteristics (p,0.05, 22LL), as independent factorsrelated to human Q-fever status.
Individual Variables Category OR [95% CI] p-value
Age group ,35 years Reference 0.867
35-,45 years 1.04 [0.46–2.34]
45-,55 years 1.31 [0.54–3.19]
$55 years 0.88 [0.36–2.14]
Number of daily goat-related tasks (milking, feeding, supplyand removal, general animal health care, birth assistance)
$3 tasks 3.73 [2.00–6.94] ,.0001
#2 tasks Reference
Lived as child on a ruminant farm Yes 2.24 [1.17–4.28] 0.015
No Reference
Direct contact with cattle Yes 2.65 [0.93–7.53] 0.068
No/no respons Reference
Multivariate logistic regression model with individual characteristics * Number of observations used: 244.doi:10.1371/journal.pone.0042364.t004
Q Fever Seroprevalence in Dutch Dairy Goat Farmers
PLoS ONE | www.plosone.org 7 July 2012 | Volume 7 | Issue 7 | e42364
farm had a higher risk of being seropositive and a dose-response
relationship between seropositivity and years of farm residence was
identified [20].
Two risk factors indicate the importance of airborne transmis-
sion between farms and to humans in high-incidence areas for Q
fever: a farm location in two southern provinces of the Netherlands
and a closer distance to the nearest bulk milk-positive farm. The
concentration of intensive goat farming in the south of the country
probably facilitated transmission between farms following the
introduction of Q fever. Next to the farm families, the general
population in these regions was severely affected with annual
incidences up to 500–1500 notifications per 100,000 inhabitants.
Of 2,421 notified cases in 2007–2009, 3.2% worked in the
agricultural sector including stockbreeding, arable and dairy
farming [21]. Effective airborne spread between farms and to
farm families from infected farms in the vicinity is also supported
by the observation that 38% of the participating farms within eight
kilometers proximity from a bulk milk-positive farm were bulk
milk-positive themselves. The farms’s own bulk milk status became
a strong significant risk factor if we added it to the final multilevel
model, while the significance of distance to the nearest bulk milk-
positive farm decreased (data not shown), which indicated that a
positive bulk milk status of the own farm is the strongest predictor
for human seropositivity. A previous study showed that the risk of
acute Q fever gradually decreased with increasing distance from a
dairy goat farm that experienced an abortion wave [22]. The same
distance-response relationship was observed for goat seropositivity
in the veterinary study component [6]. A distance of #10 meters
between stable and residence as risk factor could be a sign of more
intensive transmission through aerosol spread but could also be a
proxy for more intense direct human-animal contact. The
presence of other goat breeds, such as Toggenburg, Anglo-
Nubian, Dutch Pied or Alpine Goat, besides the omnipresent
Dutch White Goat was identified as risk factor. Compared to other
goats, the Dutch White goat is specifically bred on their milk-
producing quality. Animal-to-human transmission of C. burnetii
may be influenced by breed diversity [23] and in cattle the Friesian
breed has higher C. burnetii seroprevalences than other breeds [24].
However, presence of other goat breeds as a risk factor for human
seropositivity was not previously described and therefore this
finding cannot be satisfactorily explained. Possible mechanisms
behind this risk factor need further investigation, for example
through seroprevalence studies in different goat breeds. The study
further indicates that not performing extended lactation may
protect against human infections which could point to a selection
on dairy goats for its qualities as a high-productive dairy goat,
rather than on disease resistance, which can cause undesirable
side-effects in for example immunological traits, as seen in other
livestock [25]. Covering air spaces in a stable to combat nuisance
animals such as wild birds could point at a more air-locked stable,
facilitating C. burnetii accumulation inside the stable, which may
increase human and goat exposure [26]. The observed risk for
farms where staff did not wear farm boots may indicate the need
for more stringent routine biosecurity procedures for household
members, farm employees and visitors as indirect transmission
through contaminated clothing has been described for Q fever
[26]. The presence of cats in the stable was also observed as risk
factor for both human and goat seropositivity [6], suggesting C.
burnetii introduction or facilitation of spread by infected companion
animals. In the veterinary study component, additionally the
presence of dogs in the stable was a risk factor.
Table 5. Results of the multilevel analyses with farm-based characteristics (p,0.05, 22LL), as independent factors related tohuman Q-fever status.
Farm Variables Category OR [95% CI] p-value
Farm region North (provinces Dr, Fr, Gro) Reference 0.011
West (provinces Ut, Ze, Nh, Zh) 0.85 [0.26–2.71]
East (provinces Ge, Ov, Fle) 2.26 [0.88–5.84]
South (provinces Nb, Li) 5.95 [2.08–16.99]
Distance to nearest positive farm 0- ,4 km 3.38 [1.25–9.11] 0.050
4- ,8 km 2.64 [1.03–6.75]
8- ,16 km 3.46 [1.44–8.30]
$16 km Reference
Presence of cat(s) in goat stable Present 2.54 [1.24–5.21] 0.011
Absent Reference
Distance residence to nearest stable #10 m 2.44 [1.27–4.67] 0.011
.10 m Reference
Other goat breeds next to white dairy goat Present 3.38 [1.61–7.09] 0.003
Absent Reference
Extended lactation Yes Reference 0.036
No 0.37 [0.15–0.86]
Combat other nuisance animals in 2008 Via covering airspaces 6.03 [1.77–20.61] 0.007
Not via covering airspaces or no combat Reference
Farm boots for staff Yes Reference 0.025
No 2.66 [1.12–6.32]
Multivariate multilevel model with farm characteristics * Number of observations used: 234, number of levels used: 103 (7 with missing values).doi:10.1371/journal.pone.0042364.t005
Q Fever Seroprevalence in Dutch Dairy Goat Farmers
PLoS ONE | www.plosone.org 8 July 2012 | Volume 7 | Issue 7 | e42364

C. BURNETII SEROPREVALENCE AND RISK FACTORS IN DAIRY GOAT FARMERS | 101
4.1
presence of cats in the stable and not wearing farm boots by staff.
The individual risk factor of performing $3 daily activities
involving direct contact with goats or dust-producing activities in
the goat stable, such as milking, feeding, supply and removal of
goats, general health care and cleaning the stable, reflects the
intensity of goat and stable environment contact. Under these
circumstances the risk of inhalation of contaminated aerosols is
high, with a plausible increased risk for acquiring an infection. A
study among British farm workers suggested that the extent of total
farm animal contact seemed more important than specific animal
exposure, indicating that risk of C. burnetii exposure is mainly
related to farm environment contact [5]. Manure-related tasks did
not add to the cumulative risk of performing goat-related tasks
indicating transmission through manure is probably less important
as shown in a C. burnetii survival study showing short decimal
reduction times to establish effective killing of viable bacteria in
goat manure piles [19]. Persons who lived as child on a ruminant
farm were more often seropositive. This is a plausible risk factor
for identified past infections and in agreement with a study among
Dutch veterinary students where those that grew up on a ruminant
Table 3. Cont.
Variable CategoryFreq.(N)
Seropre-valence(%) OR [95% CI] p-value
No 216 72.2 Reference
Presence of Mice and/or rats in the stable in 2008 Present 171 67.3 Reference 0.09
Absent 76 77.6 1.69 [0.90–3.16]
Combat other nuisance animals in 2008 Via covering airspaces 32 84.4 2.52[0.93–6.82] 0.05
Not via covering airspaces or nocombat
217 68.2 Reference
Lambing periods $3 or more periods 21 90.5 4.39 [1.00–19.33] 0.05
#2 lambing periods 228 68.4 Reference
Abortion percentage 2007–2009 including abortion historydue to Q fever
.4 percent 36 86.1 2.97 [1.11–7.97] 0.02
0–4 percent 213 67.6 Reference
Farm tenure Closed farm for male and femalegoats
63 77.8 1.68 [0.86–3.28] 0.12
Not completely closed 185 67.6 Reference
Goat supply region South 77 83.1 1.68 [1.87–7.69] ,0.01
Other regions 108 56.5 Reference
No supply 64 78.1 2.75[1.36–5.56]
Farm visitors School tours 98 75.5 1.53 [0.86–2.70] 0.14
No tours 151 66.9 Reference
Farm boots for staff Yes 164 66.5 Reference 0.03
No 82 79.3 1.93 [1.03–3.60]
doi:10.1371/journal.pone.0042364.t003
Table 4. Results of the multivariate logistic regression with individual characteristics (p,0.05, 22LL), as independent factorsrelated to human Q-fever status.
Individual Variables Category OR [95% CI] p-value
Age group ,35 years Reference 0.867
35-,45 years 1.04 [0.46–2.34]
45-,55 years 1.31 [0.54–3.19]
$55 years 0.88 [0.36–2.14]
Number of daily goat-related tasks (milking, feeding, supplyand removal, general animal health care, birth assistance)
$3 tasks 3.73 [2.00–6.94] ,.0001
#2 tasks Reference
Lived as child on a ruminant farm Yes 2.24 [1.17–4.28] 0.015
No Reference
Direct contact with cattle Yes 2.65 [0.93–7.53] 0.068
No/no respons Reference
Multivariate logistic regression model with individual characteristics * Number of observations used: 244.doi:10.1371/journal.pone.0042364.t004
Q Fever Seroprevalence in Dutch Dairy Goat Farmers
PLoS ONE | www.plosone.org 7 July 2012 | Volume 7 | Issue 7 | e42364
farm had a higher risk of being seropositive and a dose-response
relationship between seropositivity and years of farm residence was
identified [20].
Two risk factors indicate the importance of airborne transmis-
sion between farms and to humans in high-incidence areas for Q
fever: a farm location in two southern provinces of the Netherlands
and a closer distance to the nearest bulk milk-positive farm. The
concentration of intensive goat farming in the south of the country
probably facilitated transmission between farms following the
introduction of Q fever. Next to the farm families, the general
population in these regions was severely affected with annual
incidences up to 500–1500 notifications per 100,000 inhabitants.
Of 2,421 notified cases in 2007–2009, 3.2% worked in the
agricultural sector including stockbreeding, arable and dairy
farming [21]. Effective airborne spread between farms and to
farm families from infected farms in the vicinity is also supported
by the observation that 38% of the participating farms within eight
kilometers proximity from a bulk milk-positive farm were bulk
milk-positive themselves. The farms’s own bulk milk status became
a strong significant risk factor if we added it to the final multilevel
model, while the significance of distance to the nearest bulk milk-
positive farm decreased (data not shown), which indicated that a
positive bulk milk status of the own farm is the strongest predictor
for human seropositivity. A previous study showed that the risk of
acute Q fever gradually decreased with increasing distance from a
dairy goat farm that experienced an abortion wave [22]. The same
distance-response relationship was observed for goat seropositivity
in the veterinary study component [6]. A distance of #10 meters
between stable and residence as risk factor could be a sign of more
intensive transmission through aerosol spread but could also be a
proxy for more intense direct human-animal contact. The
presence of other goat breeds, such as Toggenburg, Anglo-
Nubian, Dutch Pied or Alpine Goat, besides the omnipresent
Dutch White Goat was identified as risk factor. Compared to other
goats, the Dutch White goat is specifically bred on their milk-
producing quality. Animal-to-human transmission of C. burnetii
may be influenced by breed diversity [23] and in cattle the Friesian
breed has higher C. burnetii seroprevalences than other breeds [24].
However, presence of other goat breeds as a risk factor for human
seropositivity was not previously described and therefore this
finding cannot be satisfactorily explained. Possible mechanisms
behind this risk factor need further investigation, for example
through seroprevalence studies in different goat breeds. The study
further indicates that not performing extended lactation may
protect against human infections which could point to a selection
on dairy goats for its qualities as a high-productive dairy goat,
rather than on disease resistance, which can cause undesirable
side-effects in for example immunological traits, as seen in other
livestock [25]. Covering air spaces in a stable to combat nuisance
animals such as wild birds could point at a more air-locked stable,
facilitating C. burnetii accumulation inside the stable, which may
increase human and goat exposure [26]. The observed risk for
farms where staff did not wear farm boots may indicate the need
for more stringent routine biosecurity procedures for household
members, farm employees and visitors as indirect transmission
through contaminated clothing has been described for Q fever
[26]. The presence of cats in the stable was also observed as risk
factor for both human and goat seropositivity [6], suggesting C.
burnetii introduction or facilitation of spread by infected companion
animals. In the veterinary study component, additionally the
presence of dogs in the stable was a risk factor.
Table 5. Results of the multilevel analyses with farm-based characteristics (p,0.05, 22LL), as independent factors related tohuman Q-fever status.
Farm Variables Category OR [95% CI] p-value
Farm region North (provinces Dr, Fr, Gro) Reference 0.011
West (provinces Ut, Ze, Nh, Zh) 0.85 [0.26–2.71]
East (provinces Ge, Ov, Fle) 2.26 [0.88–5.84]
South (provinces Nb, Li) 5.95 [2.08–16.99]
Distance to nearest positive farm 0- ,4 km 3.38 [1.25–9.11] 0.050
4- ,8 km 2.64 [1.03–6.75]
8- ,16 km 3.46 [1.44–8.30]
$16 km Reference
Presence of cat(s) in goat stable Present 2.54 [1.24–5.21] 0.011
Absent Reference
Distance residence to nearest stable #10 m 2.44 [1.27–4.67] 0.011
.10 m Reference
Other goat breeds next to white dairy goat Present 3.38 [1.61–7.09] 0.003
Absent Reference
Extended lactation Yes Reference 0.036
No 0.37 [0.15–0.86]
Combat other nuisance animals in 2008 Via covering airspaces 6.03 [1.77–20.61] 0.007
Not via covering airspaces or no combat Reference
Farm boots for staff Yes Reference 0.025
No 2.66 [1.12–6.32]
Multivariate multilevel model with farm characteristics * Number of observations used: 234, number of levels used: 103 (7 with missing values).doi:10.1371/journal.pone.0042364.t005
Q Fever Seroprevalence in Dutch Dairy Goat Farmers
PLoS ONE | www.plosone.org 8 July 2012 | Volume 7 | Issue 7 | e42364
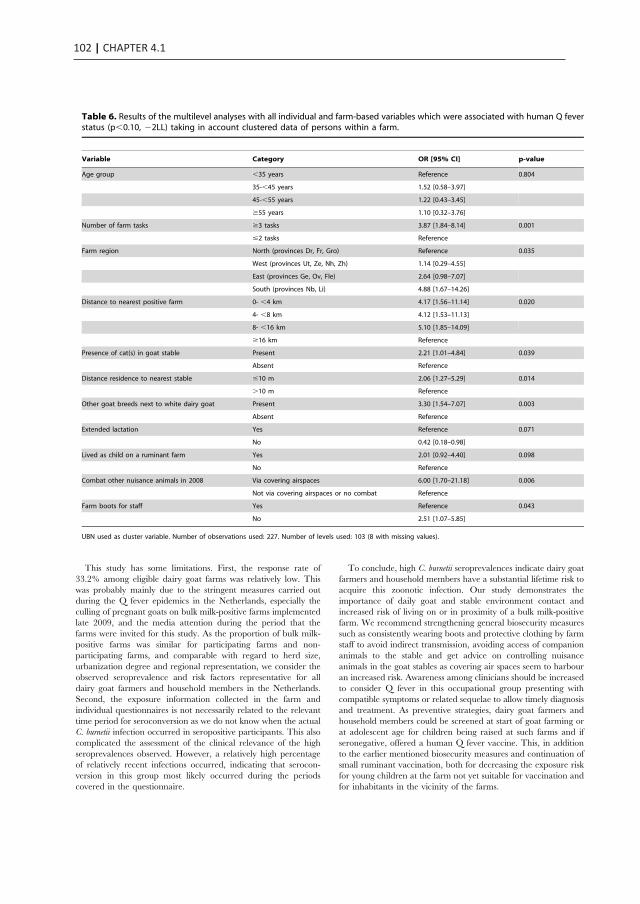
102 | CHAPTER 4.1
This study has some limitations. First, the response rate of
33.2% among eligible dairy goat farms was relatively low. This
was probably mainly due to the stringent measures carried out
during the Q fever epidemics in the Netherlands, especially the
culling of pregnant goats on bulk milk-positive farms implemented
late 2009, and the media attention during the period that the
farms were invited for this study. As the proportion of bulk milk-
positive farms was similar for participating farms and non-
participating farms, and comparable with regard to herd size,
urbanization degree and regional representation, we consider the
observed seroprevalence and risk factors representative for all
dairy goat farmers and household members in the Netherlands.
Second, the exposure information collected in the farm and
individual questionnaires is not necessarily related to the relevant
time period for seroconversion as we do not know when the actual
C. burnetii infection occurred in seropositive participants. This also
complicated the assessment of the clinical relevance of the high
seroprevalences observed. However, a relatively high percentage
of relatively recent infections occurred, indicating that serocon-
version in this group most likely occurred during the periods
covered in the questionnaire.
To conclude, high C. burnetii seroprevalences indicate dairy goat
farmers and household members have a substantial lifetime risk to
acquire this zoonotic infection. Our study demonstrates the
importance of daily goat and stable environment contact and
increased risk of living on or in proximity of a bulk milk-positive
farm. We recommend strengthening general biosecurity measures
such as consistently wearing boots and protective clothing by farm
staff to avoid indirect transmission, avoiding access of companion
animals to the stable and get advice on controlling nuisance
animals in the goat stables as covering air spaces seem to harbour
an increased risk. Awareness among clinicians should be increased
to consider Q fever in this occupational group presenting with
compatible symptoms or related sequelae to allow timely diagnosis
and treatment. As preventive strategies, dairy goat farmers and
household members could be screened at start of goat farming or
at adolescent age for children being raised at such farms and if
seronegative, offered a human Q fever vaccine. This, in addition
to the earlier mentioned biosecurity measures and continuation of
small ruminant vaccination, both for decreasing the exposure risk
for young children at the farm not yet suitable for vaccination and
for inhabitants in the vicinity of the farms.
Table 6. Results of the multilevel analyses with all individual and farm-based variables which were associated with human Q feverstatus (p,0.10, 22LL) taking in account clustered data of persons within a farm.
Variable Category OR [95% CI] p-value
Age group ,35 years Reference 0.804
35-,45 years 1.52 [0.58–3.97]
45-,55 years 1.22 [0.43–3.45]
$55 years 1.10 [0.32–3.76]
Number of farm tasks $3 tasks 3.87 [1.84–8.14] 0.001
#2 tasks Reference
Farm region North (provinces Dr, Fr, Gro) Reference 0.035
West (provinces Ut, Ze, Nh, Zh) 1.14 [0.29–4.55]
East (provinces Ge, Ov, Fle) 2.64 [0.98–7.07]
South (provinces Nb, Li) 4.88 [1.67–14.26]
Distance to nearest positive farm 0- ,4 km 4.17 [1.56–11.14] 0.020
4- ,8 km 4.12 [1.53–11.13]
8- ,16 km 5.10 [1.85–14.09]
$16 km Reference
Presence of cat(s) in goat stable Present 2.21 [1.01–4.84] 0.039
Absent Reference
Distance residence to nearest stable #10 m 2.06 [1.27–5.29] 0.014
.10 m Reference
Other goat breeds next to white dairy goat Present 3.30 [1.54–7.07] 0.003
Absent Reference
Extended lactation Yes Reference 0.071
No 0.42 [0.18–0.98]
Lived as child on a ruminant farm Yes 2.01 [0.92–4.40] 0.098
No Reference
Combat other nuisance animals in 2008 Via covering airspaces 6.00 [1.70–21.18] 0.006
Not via covering airspaces or no combat Reference
Farm boots for staff Yes Reference 0.043
No 2.51 [1.07–5.85]
UBN used as cluster variable. Number of observations used: 227. Number of levels used: 103 (8 with missing values).doi:10.1371/journal.pone.0042364.t006
Q Fever Seroprevalence in Dutch Dairy Goat Farmers
PLoS ONE | www.plosone.org 9 July 2012 | Volume 7 | Issue 7 | e42364
Acknowledgments
We are grateful to all participants without whom the study could not be
conducted. We would like to thank all laboratory assistants that collected
serum samples, Jamie Meekelenkamp of the Jeroen Bosch Hospital for the
laboratory analyses, Noel Peters for sending test results to participants;
Sanne Kelderman for invitation mailings and providing reference data and
Ben Bom for generating geographical information. Finally, we thank all
expert members of the Q-VIVE project group and affiliated organizations
for their support and advice during the study: Jan van de Bergh, Olaf
Stenvers, Rob van Oosterom, Mark Paauw, Harry Stinis, Ad de Rooij,
Margo Vonk, Clementine Wijkmans and Wim van der Hoek.
Author Contributions
Conceived and designed the experiments: BS YD. Performed the
experiments: BS AL PS YD. Analyzed the data: BS AL YD. Contributed
reagents/materials/analysis tools: BS AL PS HA PV JH YD. Wrote the
paper: BS AL PS HA PV JH YD.
References
1. Rousset E, Berri M, Durand B, Dufour P, Prigent M, et al. (2009) Coxiellaburnetii shedding routes and antibody response after outbreaks of Q fever-
induced abortion in dairy goat herds. Appl Environ Microbiol 75: 428–433.
2. Maurin M, Raoult D (1999) Q fever. Clin Microbiol Rev 12: 518–553.3. Rodolakis A (2009) Q Fever in dairy animals. Ann N Y Acad Sci 1166: 90–93.
4. Tissot-Dupont H, Amadei MA, Nezri M, Raoult D (2004) Wind in November,Q fever in December. Emerg Infect Dis 10: 1264–1269.
5. Thomas DR, Treweek L, Salmon RL, Kench SM, Coleman TJ, et al. (1995)The risk of acquiring Q fever on farms: a seroepidemiological study. Occup
Environ Med 52: 644–647.
6. Schimmer B LS, Hautvast JLA, Graat EAM, Vellema P, van DuynhovenYTHP. (2011) Seroprevalence and risk factors of Q fever in goats on commercial
dairy goat farms in the Netherlands, 2009–2010. BMC Veterinary Research Dec30 7:81 doi:10.1186/1746-6148-7-81. [Epub ahead of print]
7. Wegdam-Blans MC, Wielders CC, Meekelenkamp J, Korbeeck JM, Herremans
T, Tjhie HT, Bijlmer HA, Koopmans MP, Schneeberger PM. (2012) Evaluationof commonly used serological tests for the detection of Coxiella burnetii
antibodies in well-defined acute and follow-up sera. Clin Vaccine Immunol 23May 2012, doi: 10.1128/CVI.05581-11. [Epub ahead of print]
8. Wegdam-Blans MC, Kampschreur LM, Delsing CE, Bleeker-Rovers CP,Sprong T, et al. (2012) Chronic Q fever: Review of the literature and a proposal
of new diagnostic criteria. J Infect 64: 247–259.
9. de Bruin RQJ, van der Plaats L, Paauwe R, Schimmer B, Vellema P, et al.(2012) Detection of Coxiella burnetii DNA on small ruminant farms during a Q
fever outbreak in the Netherlands. Appl Environ Microbiol 78: 1652–1657.10. Whelan J, Schimmer B, Schneeberger P, Meekelenkamp J, Ijff A, et al. (2011) Q
fever among culling workers, the Netherlands, 2009–2010. Emerg Infect Dis 17:
1719–1723.11. Schimmer B, Notermans DW, Harms MG, Reimerink JH, Bakker J, et al. (2012)
Low seroprevalence of Q fever in The Netherlands prior to a series of largeoutbreaks. Epidemiol Infect: 140: 27–35.
12. Karagiannis I, Schimmer B, Van Lier A, Timen A, Schneeberger P, et al. (2009)
Investigation of a Q fever outbreak in a rural area of The Netherlands.Epidemiol Infect 137: 1283–1294.
13. Hogema BM, Slot E, Molier M, Schneeberger PM, Hermans MH, et al. (2012)Coxiella burnetii infection among blood donors during the 2009 Q-fever
outbreak in the Netherlands. Transfusion 52: 144–150.14. McCaughey C, McKenna J, McKenna C, Coyle PV, O’Neill HJ, et al. (2008)
Human seroprevalence to Coxiella burnetii (Q fever) in Northern Ireland.
Zoonoses Public Health 55: 189–194.
15. Chang CC, Lin PS, Hou MY, Lin CC, Hung MN, et al. (2010) Identification ofrisk factors of Coxiella burnetii (Q fever) infection in veterinary-associated
populations in southern Taiwan. Zoonoses Public Health 57: e95–101.
16. Monno R, Fumarola L, Trerotoli P, Cavone D, Giannelli G, et al. (2009)Seroprevalence of Q fever, brucellosis and leptospirosis in farmers and
agricultural workers in Bari, Southern Italy. Ann Agric Environ Med 16: 205–209.
17. Richardus JH, Donkers A, Dumas AM, Schaap GJ, Akkermans JP, et al. (1987)Q fever in the Netherlands: a sero-epidemiological survey among human
population groups from 1968 to 1983. Epidemiol Infect 98: 211–219.
18. Thibon M, Villiers V, Souque P, Dautry-Varsat A, Duquesnel R, et al. (1996)High incidence of Coxiella burnetii markers in a rural population in France.
Eur J Epidemiol 12: 509–513.19. Roest HI, Dinkla A, Van Rotterdam B, De Bruin A, Dercksen D, et al. (2011)
Survival of Coxiella burnetii in goat manure- final report. 11/CVI0212 11/
CVI0212. 1–23 p. [in Dutch] http://www.rijksoverheid.nl/documenten-en-publicaties/rapporten/2011/07/14/overleving-van-coxiella-burnetii-in-
geitenmest-eindrapportage.html (accessed 14 June 2012)20. de Rooij MT, Schimmer B, Versteeg B, Schneeberger P, Berends BR, et al.
(2012) Risk factors of Coxiella burnetii (Q fever) seropositivity in VeterinaryMedicine Students. PLoS One 7:e32108.
21. Dijkstra F, Hoek W, Wijers N, Schimmer B, Rietveld A, et al. (2012) The 2007–
2010 Q fever epidemic in the Netherlands: characteristics of notified acute Qfever patients and the association with dairy goat farming. FEMS Immunol Med
Microbiol. 64: 3–12.22. Schimmer B, Ter Schegget R, Wegdam M, Zuchner L, de Bruin A, et al. (2010)
The use of a geographic information system to identify a dairy goat farm as the
most likely source of an urban Q-fever outbreak. BMC Infect Dis 10: 69.23. Marrie T (1990) Epidemiology of Q fever. In: Marrie T, editor. Q fever, the
disease Boca Raton: CRC Press. pp. 49–65.24. McCaughey C, Murray LJ, McKenna JP, Menzies FD, McCullough SJ, et al.
(2010) Coxiella burnetii (Q fever) seroprevalence in cattle. Epidemiol Infect 138:
21–27.25. Rauw WM, Kanis E, Noordhuizen-Stassen EN, Grommers FJ (1998)
Undesirable side effects of selection for high production efficiency in farmanimals: a review. Livest Prod Sci 56: 15–33.
26. Marrie TJ, Langille D, Papukna V, Yates L (1989) Truckin’ pneumonia–anoutbreak of Q fever in a truck repair plant probably due to aerosols from
clothing contaminated by contact with newborn kittens. Epidemiol Infect 102:
119–127.
Q Fever Seroprevalence in Dutch Dairy Goat Farmers
PLoS ONE | www.plosone.org 10 July 2012 | Volume 7 | Issue 7 | e42364

C. BURNETII SEROPREVALENCE AND RISK FACTORS IN DAIRY GOAT FARMERS | 103
4.1
This study has some limitations. First, the response rate of
33.2% among eligible dairy goat farms was relatively low. This
was probably mainly due to the stringent measures carried out
during the Q fever epidemics in the Netherlands, especially the
culling of pregnant goats on bulk milk-positive farms implemented
late 2009, and the media attention during the period that the
farms were invited for this study. As the proportion of bulk milk-
positive farms was similar for participating farms and non-
participating farms, and comparable with regard to herd size,
urbanization degree and regional representation, we consider the
observed seroprevalence and risk factors representative for all
dairy goat farmers and household members in the Netherlands.
Second, the exposure information collected in the farm and
individual questionnaires is not necessarily related to the relevant
time period for seroconversion as we do not know when the actual
C. burnetii infection occurred in seropositive participants. This also
complicated the assessment of the clinical relevance of the high
seroprevalences observed. However, a relatively high percentage
of relatively recent infections occurred, indicating that serocon-
version in this group most likely occurred during the periods
covered in the questionnaire.
To conclude, high C. burnetii seroprevalences indicate dairy goat
farmers and household members have a substantial lifetime risk to
acquire this zoonotic infection. Our study demonstrates the
importance of daily goat and stable environment contact and
increased risk of living on or in proximity of a bulk milk-positive
farm. We recommend strengthening general biosecurity measures
such as consistently wearing boots and protective clothing by farm
staff to avoid indirect transmission, avoiding access of companion
animals to the stable and get advice on controlling nuisance
animals in the goat stables as covering air spaces seem to harbour
an increased risk. Awareness among clinicians should be increased
to consider Q fever in this occupational group presenting with
compatible symptoms or related sequelae to allow timely diagnosis
and treatment. As preventive strategies, dairy goat farmers and
household members could be screened at start of goat farming or
at adolescent age for children being raised at such farms and if
seronegative, offered a human Q fever vaccine. This, in addition
to the earlier mentioned biosecurity measures and continuation of
small ruminant vaccination, both for decreasing the exposure risk
for young children at the farm not yet suitable for vaccination and
for inhabitants in the vicinity of the farms.
Table 6. Results of the multilevel analyses with all individual and farm-based variables which were associated with human Q feverstatus (p,0.10, 22LL) taking in account clustered data of persons within a farm.
Variable Category OR [95% CI] p-value
Age group ,35 years Reference 0.804
35-,45 years 1.52 [0.58–3.97]
45-,55 years 1.22 [0.43–3.45]
$55 years 1.10 [0.32–3.76]
Number of farm tasks $3 tasks 3.87 [1.84–8.14] 0.001
#2 tasks Reference
Farm region North (provinces Dr, Fr, Gro) Reference 0.035
West (provinces Ut, Ze, Nh, Zh) 1.14 [0.29–4.55]
East (provinces Ge, Ov, Fle) 2.64 [0.98–7.07]
South (provinces Nb, Li) 4.88 [1.67–14.26]
Distance to nearest positive farm 0- ,4 km 4.17 [1.56–11.14] 0.020
4- ,8 km 4.12 [1.53–11.13]
8- ,16 km 5.10 [1.85–14.09]
$16 km Reference
Presence of cat(s) in goat stable Present 2.21 [1.01–4.84] 0.039
Absent Reference
Distance residence to nearest stable #10 m 2.06 [1.27–5.29] 0.014
.10 m Reference
Other goat breeds next to white dairy goat Present 3.30 [1.54–7.07] 0.003
Absent Reference
Extended lactation Yes Reference 0.071
No 0.42 [0.18–0.98]
Lived as child on a ruminant farm Yes 2.01 [0.92–4.40] 0.098
No Reference
Combat other nuisance animals in 2008 Via covering airspaces 6.00 [1.70–21.18] 0.006
Not via covering airspaces or no combat Reference
Farm boots for staff Yes Reference 0.043
No 2.51 [1.07–5.85]
UBN used as cluster variable. Number of observations used: 227. Number of levels used: 103 (8 with missing values).doi:10.1371/journal.pone.0042364.t006
Q Fever Seroprevalence in Dutch Dairy Goat Farmers
PLoS ONE | www.plosone.org 9 July 2012 | Volume 7 | Issue 7 | e42364
Acknowledgments
We are grateful to all participants without whom the study could not be
conducted. We would like to thank all laboratory assistants that collected
serum samples, Jamie Meekelenkamp of the Jeroen Bosch Hospital for the
laboratory analyses, Noel Peters for sending test results to participants;
Sanne Kelderman for invitation mailings and providing reference data and
Ben Bom for generating geographical information. Finally, we thank all
expert members of the Q-VIVE project group and affiliated organizations
for their support and advice during the study: Jan van de Bergh, Olaf
Stenvers, Rob van Oosterom, Mark Paauw, Harry Stinis, Ad de Rooij,
Margo Vonk, Clementine Wijkmans and Wim van der Hoek.
Author Contributions
Conceived and designed the experiments: BS YD. Performed the
experiments: BS AL PS YD. Analyzed the data: BS AL YD. Contributed
reagents/materials/analysis tools: BS AL PS HA PV JH YD. Wrote the
paper: BS AL PS HA PV JH YD.
References
1. Rousset E, Berri M, Durand B, Dufour P, Prigent M, et al. (2009) Coxiellaburnetii shedding routes and antibody response after outbreaks of Q fever-
induced abortion in dairy goat herds. Appl Environ Microbiol 75: 428–433.
2. Maurin M, Raoult D (1999) Q fever. Clin Microbiol Rev 12: 518–553.3. Rodolakis A (2009) Q Fever in dairy animals. Ann N Y Acad Sci 1166: 90–93.
4. Tissot-Dupont H, Amadei MA, Nezri M, Raoult D (2004) Wind in November,Q fever in December. Emerg Infect Dis 10: 1264–1269.
5. Thomas DR, Treweek L, Salmon RL, Kench SM, Coleman TJ, et al. (1995)The risk of acquiring Q fever on farms: a seroepidemiological study. Occup
Environ Med 52: 644–647.
6. Schimmer B LS, Hautvast JLA, Graat EAM, Vellema P, van DuynhovenYTHP. (2011) Seroprevalence and risk factors of Q fever in goats on commercial
dairy goat farms in the Netherlands, 2009–2010. BMC Veterinary Research Dec30 7:81 doi:10.1186/1746-6148-7-81. [Epub ahead of print]
7. Wegdam-Blans MC, Wielders CC, Meekelenkamp J, Korbeeck JM, Herremans
T, Tjhie HT, Bijlmer HA, Koopmans MP, Schneeberger PM. (2012) Evaluationof commonly used serological tests for the detection of Coxiella burnetii
antibodies in well-defined acute and follow-up sera. Clin Vaccine Immunol 23May 2012, doi: 10.1128/CVI.05581-11. [Epub ahead of print]
8. Wegdam-Blans MC, Kampschreur LM, Delsing CE, Bleeker-Rovers CP,Sprong T, et al. (2012) Chronic Q fever: Review of the literature and a proposal
of new diagnostic criteria. J Infect 64: 247–259.
9. de Bruin RQJ, van der Plaats L, Paauwe R, Schimmer B, Vellema P, et al.(2012) Detection of Coxiella burnetii DNA on small ruminant farms during a Q
fever outbreak in the Netherlands. Appl Environ Microbiol 78: 1652–1657.10. Whelan J, Schimmer B, Schneeberger P, Meekelenkamp J, Ijff A, et al. (2011) Q
fever among culling workers, the Netherlands, 2009–2010. Emerg Infect Dis 17:
1719–1723.11. Schimmer B, Notermans DW, Harms MG, Reimerink JH, Bakker J, et al. (2012)
Low seroprevalence of Q fever in The Netherlands prior to a series of largeoutbreaks. Epidemiol Infect: 140: 27–35.
12. Karagiannis I, Schimmer B, Van Lier A, Timen A, Schneeberger P, et al. (2009)
Investigation of a Q fever outbreak in a rural area of The Netherlands.Epidemiol Infect 137: 1283–1294.
13. Hogema BM, Slot E, Molier M, Schneeberger PM, Hermans MH, et al. (2012)Coxiella burnetii infection among blood donors during the 2009 Q-fever
outbreak in the Netherlands. Transfusion 52: 144–150.14. McCaughey C, McKenna J, McKenna C, Coyle PV, O’Neill HJ, et al. (2008)
Human seroprevalence to Coxiella burnetii (Q fever) in Northern Ireland.
Zoonoses Public Health 55: 189–194.
15. Chang CC, Lin PS, Hou MY, Lin CC, Hung MN, et al. (2010) Identification ofrisk factors of Coxiella burnetii (Q fever) infection in veterinary-associated
populations in southern Taiwan. Zoonoses Public Health 57: e95–101.
16. Monno R, Fumarola L, Trerotoli P, Cavone D, Giannelli G, et al. (2009)Seroprevalence of Q fever, brucellosis and leptospirosis in farmers and
agricultural workers in Bari, Southern Italy. Ann Agric Environ Med 16: 205–209.
17. Richardus JH, Donkers A, Dumas AM, Schaap GJ, Akkermans JP, et al. (1987)Q fever in the Netherlands: a sero-epidemiological survey among human
population groups from 1968 to 1983. Epidemiol Infect 98: 211–219.
18. Thibon M, Villiers V, Souque P, Dautry-Varsat A, Duquesnel R, et al. (1996)High incidence of Coxiella burnetii markers in a rural population in France.
Eur J Epidemiol 12: 509–513.19. Roest HI, Dinkla A, Van Rotterdam B, De Bruin A, Dercksen D, et al. (2011)
Survival of Coxiella burnetii in goat manure- final report. 11/CVI0212 11/
CVI0212. 1–23 p. [in Dutch] http://www.rijksoverheid.nl/documenten-en-publicaties/rapporten/2011/07/14/overleving-van-coxiella-burnetii-in-
geitenmest-eindrapportage.html (accessed 14 June 2012)20. de Rooij MT, Schimmer B, Versteeg B, Schneeberger P, Berends BR, et al.
(2012) Risk factors of Coxiella burnetii (Q fever) seropositivity in VeterinaryMedicine Students. PLoS One 7:e32108.
21. Dijkstra F, Hoek W, Wijers N, Schimmer B, Rietveld A, et al. (2012) The 2007–
2010 Q fever epidemic in the Netherlands: characteristics of notified acute Qfever patients and the association with dairy goat farming. FEMS Immunol Med
Microbiol. 64: 3–12.22. Schimmer B, Ter Schegget R, Wegdam M, Zuchner L, de Bruin A, et al. (2010)
The use of a geographic information system to identify a dairy goat farm as the
most likely source of an urban Q-fever outbreak. BMC Infect Dis 10: 69.23. Marrie T (1990) Epidemiology of Q fever. In: Marrie T, editor. Q fever, the
disease Boca Raton: CRC Press. pp. 49–65.24. McCaughey C, Murray LJ, McKenna JP, Menzies FD, McCullough SJ, et al.
(2010) Coxiella burnetii (Q fever) seroprevalence in cattle. Epidemiol Infect 138:
21–27.25. Rauw WM, Kanis E, Noordhuizen-Stassen EN, Grommers FJ (1998)
Undesirable side effects of selection for high production efficiency in farmanimals: a review. Livest Prod Sci 56: 15–33.
26. Marrie TJ, Langille D, Papukna V, Yates L (1989) Truckin’ pneumonia–anoutbreak of Q fever in a truck repair plant probably due to aerosols from
clothing contaminated by contact with newborn kittens. Epidemiol Infect 102:
119–127.
Q Fever Seroprevalence in Dutch Dairy Goat Farmers
PLoS ONE | www.plosone.org 10 July 2012 | Volume 7 | Issue 7 | e42364

CHAPTER 4.2
Seroprevalence and risk factors of Q fever in goatson commercial dairy goat farms
in The Netherlands, 2009-2010
B. SchimmerS. LuttikholtJ.L. Hautvast
E.A. GraatP. Vellema
Y.T.H.P. van Duijnhoven
BMC Vet Res. 2011 Dec 30;7:81

CHAPTER 4.2
Seroprevalence and risk factors of Q fever in goatson commercial dairy goat farms
in The Netherlands, 2009-2010
B. SchimmerS. LuttikholtJ.L. Hautvast
E.A. GraatP. Vellema
Y.T.H.P. van Duijnhoven
BMC Vet Res. 2011 Dec 30;7:81
RESEARCH ARTICLE Open Access
Seroprevalence and risk factors of Q fever ingoats on commercial dairy goat farms in theNetherlands, 2009-2010Barbara Schimmer1*, Saskia Luttikholt2,3, Jeannine LA Hautvast4, Elisabeth AM Graat2, Piet Vellema3 andYvonne THP van Duynhoven1
Abstract
Background: The aim of this study was to estimate the seroprevalence of Coxiella burnetii in dairy goat farms inthe Netherlands and to identify risk factors for farm and goat seropositivity before mandatory vaccination started.We approached 334 eligible farms with more than 100 goats for serum sampling and a farm questionnaire. Perfarm, median 21 goats were sampled. A farm was considered positive when at least one goat tested ELISA positive.
Results: In total, 2,828 goat serum samples from 123 farms were available. Farm prevalence was 43.1% (95%CI:34.3%-51.8%). Overall goat seroprevalence was 21.4% (95%CI: 19.9%-22.9%) and among the 53 positive farms 46.6%(95%CI: 43.8%-49.3%). Multivariable logistic regression analysis included 96 farms and showed that farm locationwithin 8 kilometres proximity from a bulk milk PCR positive farm, location in a municipality with high cattle density(≥ 100 cattle per square kilometre), controlling nuisance animals through covering airspaces, presence of cats ordogs in the goat stable, straw imported from abroad or unknown origin and a herd size above 800 goats wereindependent risk factors associated with Q fever on farm level. At animal level almost identical risk factors werefound, with use of windbreak curtain and artificial insemination as additional risk factors.
Conclusion: In 2009-2010, the seroprevalence in dairy goats in the Netherlands increased on animal and farm levelcompared to a previous study in 2008. Risk factors suggest spread from relatively closely located bulk milk-infectedsmall ruminant farms, next to introduction and spread from companion animals, imported straw and use ofartificial insemination. In-depth studies investigating the role of artificial insemination and bedding material areneeded, while simultaneously general biosecurity measures should be updated, such as avoiding companionanimals and vermin entering the stables, next to advice on farm stable constructions on how to preventintroduction and minimize airborne transmission from affected dairy goat farms to prevent further spread to thenear environment.
Keywords: Coxiella burnetii, small ruminants, seroprevalence, risk factors, zoonosis, goat
BackgroundQ fever is a zoonosis caused by Coxiella burnetii, anintracellular Gram-negative bacterium. From spring2007 until the end of 2009, large community outbreaksof Q fever with over 3500 notified cases occurred in theDutch population, mainly in the south-eastern provincesof the Netherlands [1,2]. The main transmission route is
through inhalation of contaminated aerosols. Climaticconditions play a role as dry and windy conditions arefavourable for transmission of the bacterium [3]. C. bur-netii is very resistant to heat, drought and disinfectants[4]. Domestic ruminants are the primary animal reser-voirs for C. burnetii for human infections. In addition,outbreaks due to parturient cats and dogs are described[5,6]. When infected animals give birth, large numbersof C. burnetii can be shed, but shedding of the bacter-ium can also occur via urine, faeces and milk, and is dif-ferent between ruminant species in duration and
* Correspondence: [email protected] for Infectious Disease Control, National Institute for Public Healthand the Environment, Bilthoven, the NetherlandsFull list of author information is available at the end of the article
Schimmer et al. BMC Veterinary Research 2011, 7:81http://www.biomedcentral.com/1746-6148/7/81
© 2011 Schimmer et al; licensee BioMed Central Ltd. This is an Open Access article distributed under the terms of the CreativeCommons Attribution License (http://creativecommons.org/licenses/by/2.0), which permits unrestricted use, distribution, andreproduction in any medium, provided the original work is properly cited.
Time-course of antibody responses against Coxiella burnetiifollowing acute Q fever
P. F. M. TEUNIS 1,2*, B. SCHIMMER 1, D. W. NOTERMANS3,
A. C. A. P. LEENDERS 4, P. C. WEVER 4, M. E. E. KRETZSCHMAR1,5
AND P. M. SCHNEEBERGER 4
1 Centre for Infectious Disease Control, Epidemiology and Surveillance Unit, RIVM, Bilthoven, The Netherlands2 Hubert Department of Global Health, Rollins School of Public Health, Emory University, Atlanta, GA, USA3 Centre for Infectious Disease Control, Laboratory for Infectious Diseases and Perinatal Screening, RIVM,Bilthoven, The Netherlands4 Jeroen Bosch Hospital, Department of Medical Microbiology and Infection Control,’s- Hertogenbosch, TheNetherlands5 Julius Centre for Health Sciences and Primary Care, University Medical Centre Utrecht, Utrecht, The
Netherlands
Received 11 October 2011; Final revision 15 February 2012; Accepted 15 February 2012;
first published online 4 April 2012
SUMMARY
Large outbreaks of Q fever in The Netherlands have provided a unique opportunity for studying
longitudinal serum antibody responses in patients. Results are presented of a cohort of 344
patients with acute symptoms of Q fever with three or more serum samples per patient. In all
these serum samples IgM and IgG against phase 1 and 2 Coxiella burnetii were measured by an
immunofluorescence assay. A mathematical model of the dynamic interaction of serum antibodies
and pathogens was used in a mixed model framework to quantitatively analyse responses to
C. burnetii infection. Responses show strong heterogeneity, with individual serum antibody
responses widely different in magnitude and shape. Features of the response, peak titre and decay
rate, are used to characterize the diversity of the observed responses. Binary mixture analysis of
IgG peak levels (phases 1 and 2) reveals a class of patients with high IgG peak titres that decay
slowly and may represent potential chronic cases. When combining the results of mixture analysis
into an odds score, it is concluded that not only high IgG phase 1 may be predictive for chronic
Q fever, but also that high IgG phase 2 may aid in detecting such putative chronic cases.
Key words: Coxiella, mathematical modelling, Q fever, serology, statistics.
INTRODUCTION
Since mid-2007 human cases of Q fever in The
Netherlands have increased sharply, with major out-
breaks in 2008 and 2009, reaching a total of about
4000 cases by 2010 [1–4]. Cases were predominantly
clustered in the south of The Netherlands [3] and the
majority of the laboratory samples were submitted
to one regional hospital : the Jeroen Bosch Hospital
in ’s-Hertogenbosch (about 2000 confirmed acute
Q fever cases). Follow-up of cases extended over a
period of up to 24 months. In the 3 years that this
outbreak persisted, laboratory results from over 2000
cases were collected in a laboratory database. This
* Author for correspondence : Professor P. F. M. Teunis, Centrefor Infectious Disease Control, Epidemiology and SurveillanceUnit, RIVM, PO Box 1, 3720BA Bilthoven, The Netherlands.(Email : [email protected])
Epidemiol. Infect. (2013), 141, 62–73. f Cambridge University Press 2012
doi:10.1017/S0950268812000404
Seroprevalence and risk factors of Q fever in goats on commercial dairy goat farms in the Netherlands, 2009-2010
B. SCHIMMER1*, S. LUTTIKHOLT2,3, J.L. HAUTVAST4, E.A. GRAAT2, P. VELLEMA3, Y.T.H.P. VAN DUIJNHOVEN1
Affiliaties
Chapter 3.2
1Centre for Infectious Disease Control, National Institute for Public Health and the Environment, Bilthoven, the Netherlands 2Municipal Health Service ‘Brabant Zuidoost, Eindhoven, the Netherlands 3Laboratory for Pathology and Medical Microbiology, Veldhoven, the Netherlands 4Region East, Food and Consumer Product Safety Authority, Zutphen, the Netherlands 5Department of Medical Microbiology and Infection Control, Jeroen Bosch Hospital, ‘s Hertogenbosch, the Netherlands 6Department of Small Ruminant Health, Animal Health Service, Deventer, the Netherlands
Chapter 4.1
1 Centre for Infectious Disease Control, National Institute for Public Health and The Environment, Bilthoven, The Netherlands 2 Academic Collaborative Centre AMPHI, Department of Primary and Community Care, Radboud University Nijmegen Medical Centre, Nijmegen, The Netherlands 3 Department of Medical Microbiology and Infection Control, Jeroen Bosch Hospital, ’s-Hertogenbosch, The Netherlands 4 Department of Small Ruminant Health, Animal Health Service, Deventer, The Netherlands
Chapter 4.2 1Centre for Infectious Disease Control, National Institute for Public Health and the Environment, Bilthoven, the Netherlands 2Quantitative Veterinary Epidemiology Group, Wageningen Institute of Animal Sciences, Wageningen, The Netherlands 3Department of Small Ruminant Health, Animal Health Service, Deventer, The Netherlands 4Academic Collaborative Centre AMPHI, Department of Primary and Community Care, Radboud University Nijmegen Medical Centre, the Netherlands
Chapter 4.4 1Centre for Infectious Disease Control, National Institute for Public Health and the Environment, Bilthoven, the Netherlands 2 Academic Collaborative Centre AMPHI, Department of Primary and Community Care, Radboud University Nijmegen Medical Centre, Nijmegen, the Netherlands 3Department of Small Ruminant Health, Animal Health Service, Deventer, The Netherlands
Chapter 4.5 1 National Institute for Public Health and the Environment (RIVM), Bilthoven, the Netherlands 2 Animal Health Service,Deventer, the Netherlands 3 Radboud University Nijmegen Medical Centre, Nijmegen, the Netherlands 4. Jeroen Bosch Hospital, ‘s-Hertogenbosch, the Netherlands Chapter 4.6 1 GD Animal Health, Deventer, The Netherlands 2 Centre for Infectious Disease Control, National Institute for Public Health and the Environment, Bilthoven, the Netherlands 3 Department of Primary and Community Care, Academic Collaborative Centre for Public Health (AMPHI), Radboud University Nijmegen Medical Centre, Nijmegen, The Netherlands
Chapter 5.1 1 Department of Small Ruminant Health, Animal Health Service, Deventer, The Netherlands 2 Centre for Infectious Disease Control, National Institute for Public Health and the Environment, Bilthoven, The Netherlands 3 Department of Medical Microbiology and Infection Control, Jeroen Bosch Hospital, ‘s-Hertogenbosch, The Netherlands, 4 Department of Diagnostics, Research and Epidemiology, Animal Health Service, Deventer, The Netherlands
Chapter 5.2
1 Division of Environmental Epidemiology, Institute for Risk Assessment Sciences, Utrecht, the Netherlands 2 Centre for Infectious Disease Control, National Institute for Public Health and the Environment, Bilthoven, the Netherlands, 3 Department of Medical Microbiology and Infection Control, Jeroen Bosch Hospital, ‘s-Hertogenbosch, the Netherlands, 4 Division of Veterinary Public Health, Institute for Risk Assessment Sciences, Utrecht, the Netherlands
Chapter 5.3 1.National Institute for Public Health and the Environment, Bilthoven, the Netherlands 2 European Centre for Disease Prevention and Control, Stockholm, Sweden 3 Jeroen Bosch Hospital, ‘s-Hertogenbosch, the Netherlands 4 ArboUnie, Utrecht, the Netherlands
importance of shedding routes [7]. An infection isusually asymptomatic in cattle, while in dairy goats anddairy sheep an infection may result in abortion or still-birth [4], often without preceding symptoms. Q feveraffected goat herds can show abortion rates up to 90%[8,9].Dairy goats are considered the predominant source of
the community Q fever epidemics in the Netherlandssince 2007 [2,10]. The overall goat density in the Neth-erlands is 38 goats per square kilometre and the totalnumber of goats has increased six-fold from 61.000 in1990 up to 374.000 in 2009. In the period 2000 until2009, dairy goat farming has increased almost 3-foldfrom 98.000 up to 274.000 dairy goats and is especiallyconcentrated in the southern parts of the Netherlands[11]. In the Netherlands, dairy goats are mainly keptyear-round in deep litter houses, with partially openwalls or roofs. During 2005-2009, Q fever abortionwaves were reported on 28 dairy goat farms and 2 dairysheep farms with abortion percentages varying between10 and 60% [12]. Human incidence of acute Q fever washighest each spring (April-June), following the mainlambing season (December-April) [2]. In order to reducethe risk of exposure from C. burnetii-infected smallruminants to humans, mandatory vaccination started inthe epicentre of the human outbreak in the southeast ofthe Netherlands from April 2009 onwards following avoluntary small ruminant vaccination campaign in amore restricted area in the fall of 2008. The 2009 vacci-nation campaign targeted all dairy goat and dairy sheepfarms with at least 50 animals, all open farms (pettingzoos, care farms) and all known clinically infected farmssince 2005. Studies evaluating the effect of vaccinationare promising, especially in nulliparous animals [13]. InOctober 2009, mandatory bulk milk monitoring usingPCR was implemented on all dairy goat and dairy sheepfarms with more than 50 animals, to actively detect C.burnetii-positive farms, next to the mandatory notifica-tion of abortion waves [2]. As of 25 April 2011, 96 dairygoat farms (about 25% of the about 360 large dairygoats farms in 2010) and 2 dairy sheep farms (5%) werefound to be bulk milk-positive [14]. In European coun-tries where studies have been done, the seroprevalencein goats in general varies between 6.5% and 48.2%, butis reported up to 75% if sampling is done in sheddergoats such as reported in France [15,16]. Farm preva-lences were 42.9% in Northern Ireland, 43.0% in a studyfrom Italy and 47.0% in northern Spain [17-19]. Sero-prevalences may vary widely within countries as demon-strated in the south-east of France, where at 39 farmswithout Q fever abortions during the last five yearswithin-herd rates ranged from 0-98% [20]. In 2008, inthe Netherlands, the overall Q fever seroprevalence in aconvenience sample of 3,134 samples from 442 goat
farms submitted for the Brucella melitensis monitoringprogram was 7.8% (95%CI 6.9-8.8%) [12]. The seropre-valence was 11.4% in the southeastern part of the Neth-erlands compared to 5.3% in the rest of the country.Seroprevalence was higher among the 1,290 dairy goatscompared to the 1,844 non-dairy goats (14.7%, 95% CI2.8%-16.6% versus 3.0%, 95%CI 2.2%-3.8%). The farmprevalence (at least one goat testing positive), was 17.9%(95%CI 14.2-21.5). The average within-herd prevalenceon a positive dairy goat farm was 32.1% (95%CI 28.4-35.9%) (van den Brom R, Moll L, Vellema P: Q feverseroprevalence in sheep and goats in the Netherlands in2008, submitted). Risk factor studies for Q fever in dairygoat farms in the Netherlands have not been done. Theaim of this study was to assess the actual magnitude ofthe spread of C. burnetii among small ruminants follow-ing the (what turned out to be the peak-) epidemic sea-son in humans in 2009, through testing of sera from anationwide representative sample of dairy goat farmsprior to the start of mandatory vaccination. We identi-fied risk factors for Q fever seropositivity on farm andanimal level in order to update control measures and toprovide targeted advice for the Dutch dairy goat sector.
MethodsStudy design and sampling strategyThe study was designed as a cross-sectional study. InMarch 2009, 357 dairy goat farms with more than 100dairy goats were present in the Netherlands andapproached for participation. These farms are consid-ered commercial farms and include the size of allknown clinically infected goat farms with Q fever. Thewide range in herd size allows studying the influence ofthis size on the infection risk. For all farms, results frombulk milk monitoring using PCR were available fromOctober 2009 until October 2010. Farms with less than100 goats and farms with a goat population completelyvaccinated during the voluntary vaccination campaign in2008 (approximately 36,000 goats) were excluded. Toestimate farm prevalence, 110 farms should be includedbased on an expected prevalence of 50%, with 95% con-fidence, 10% accuracy and 90% sensitivity of the serolo-gical test used [21]. Based on an assumed within-herdprevalence of 16% [16,19] and a herd size varyingbetween 100 and 4000 goats, 21 goats per farm were tobe screened for C. burnetii infection. On participatingfarms, the private veterinary practitioner collected sero-logical samples from the jugular vein of goats before thevaccination campaign in 2009 started. Written informedconsent was obtained from each participating farm. Asthe investigation by the Animal Health Service of goatserum samples taken by the private veterinary practi-tioner could be considered as part of regular and rou-tine clinical-diagnostic care, no official review and
Schimmer et al. BMC Veterinary Research 2011, 7:81http://www.biomedcentral.com/1746-6148/7/81
Page 2 of 14

C. BURNETII SEROPREVALENCE AND RISK FACTORS IN DAIRY GOATS | 107
4.2
RESEARCH ARTICLE Open Access
Seroprevalence and risk factors of Q fever ingoats on commercial dairy goat farms in theNetherlands, 2009-2010Barbara Schimmer1*, Saskia Luttikholt2,3, Jeannine LA Hautvast4, Elisabeth AM Graat2, Piet Vellema3 andYvonne THP van Duynhoven1
Abstract
Background: The aim of this study was to estimate the seroprevalence of Coxiella burnetii in dairy goat farms inthe Netherlands and to identify risk factors for farm and goat seropositivity before mandatory vaccination started.We approached 334 eligible farms with more than 100 goats for serum sampling and a farm questionnaire. Perfarm, median 21 goats were sampled. A farm was considered positive when at least one goat tested ELISA positive.
Results: In total, 2,828 goat serum samples from 123 farms were available. Farm prevalence was 43.1% (95%CI:34.3%-51.8%). Overall goat seroprevalence was 21.4% (95%CI: 19.9%-22.9%) and among the 53 positive farms 46.6%(95%CI: 43.8%-49.3%). Multivariable logistic regression analysis included 96 farms and showed that farm locationwithin 8 kilometres proximity from a bulk milk PCR positive farm, location in a municipality with high cattle density(≥ 100 cattle per square kilometre), controlling nuisance animals through covering airspaces, presence of cats ordogs in the goat stable, straw imported from abroad or unknown origin and a herd size above 800 goats wereindependent risk factors associated with Q fever on farm level. At animal level almost identical risk factors werefound, with use of windbreak curtain and artificial insemination as additional risk factors.
Conclusion: In 2009-2010, the seroprevalence in dairy goats in the Netherlands increased on animal and farm levelcompared to a previous study in 2008. Risk factors suggest spread from relatively closely located bulk milk-infectedsmall ruminant farms, next to introduction and spread from companion animals, imported straw and use ofartificial insemination. In-depth studies investigating the role of artificial insemination and bedding material areneeded, while simultaneously general biosecurity measures should be updated, such as avoiding companionanimals and vermin entering the stables, next to advice on farm stable constructions on how to preventintroduction and minimize airborne transmission from affected dairy goat farms to prevent further spread to thenear environment.
Keywords: Coxiella burnetii, small ruminants, seroprevalence, risk factors, zoonosis, goat
BackgroundQ fever is a zoonosis caused by Coxiella burnetii, anintracellular Gram-negative bacterium. From spring2007 until the end of 2009, large community outbreaksof Q fever with over 3500 notified cases occurred in theDutch population, mainly in the south-eastern provincesof the Netherlands [1,2]. The main transmission route is
through inhalation of contaminated aerosols. Climaticconditions play a role as dry and windy conditions arefavourable for transmission of the bacterium [3]. C. bur-netii is very resistant to heat, drought and disinfectants[4]. Domestic ruminants are the primary animal reser-voirs for C. burnetii for human infections. In addition,outbreaks due to parturient cats and dogs are described[5,6]. When infected animals give birth, large numbersof C. burnetii can be shed, but shedding of the bacter-ium can also occur via urine, faeces and milk, and is dif-ferent between ruminant species in duration and
* Correspondence: [email protected] for Infectious Disease Control, National Institute for Public Healthand the Environment, Bilthoven, the NetherlandsFull list of author information is available at the end of the article
Schimmer et al. BMC Veterinary Research 2011, 7:81http://www.biomedcentral.com/1746-6148/7/81
© 2011 Schimmer et al; licensee BioMed Central Ltd. This is an Open Access article distributed under the terms of the CreativeCommons Attribution License (http://creativecommons.org/licenses/by/2.0), which permits unrestricted use, distribution, andreproduction in any medium, provided the original work is properly cited.
Time-course of antibody responses against Coxiella burnetiifollowing acute Q fever
P. F. M. TEUNIS 1,2*, B. SCHIMMER 1, D. W. NOTERMANS3,
A. C. A. P. LEENDERS 4, P. C. WEVER 4, M. E. E. KRETZSCHMAR1,5
AND P. M. SCHNEEBERGER 4
1 Centre for Infectious Disease Control, Epidemiology and Surveillance Unit, RIVM, Bilthoven, The Netherlands2 Hubert Department of Global Health, Rollins School of Public Health, Emory University, Atlanta, GA, USA3 Centre for Infectious Disease Control, Laboratory for Infectious Diseases and Perinatal Screening, RIVM,Bilthoven, The Netherlands4 Jeroen Bosch Hospital, Department of Medical Microbiology and Infection Control,’s- Hertogenbosch, TheNetherlands5 Julius Centre for Health Sciences and Primary Care, University Medical Centre Utrecht, Utrecht, The
Netherlands
Received 11 October 2011; Final revision 15 February 2012; Accepted 15 February 2012;
first published online 4 April 2012
SUMMARY
Large outbreaks of Q fever in The Netherlands have provided a unique opportunity for studying
longitudinal serum antibody responses in patients. Results are presented of a cohort of 344
patients with acute symptoms of Q fever with three or more serum samples per patient. In all
these serum samples IgM and IgG against phase 1 and 2 Coxiella burnetii were measured by an
immunofluorescence assay. A mathematical model of the dynamic interaction of serum antibodies
and pathogens was used in a mixed model framework to quantitatively analyse responses to
C. burnetii infection. Responses show strong heterogeneity, with individual serum antibody
responses widely different in magnitude and shape. Features of the response, peak titre and decay
rate, are used to characterize the diversity of the observed responses. Binary mixture analysis of
IgG peak levels (phases 1 and 2) reveals a class of patients with high IgG peak titres that decay
slowly and may represent potential chronic cases. When combining the results of mixture analysis
into an odds score, it is concluded that not only high IgG phase 1 may be predictive for chronic
Q fever, but also that high IgG phase 2 may aid in detecting such putative chronic cases.
Key words: Coxiella, mathematical modelling, Q fever, serology, statistics.
INTRODUCTION
Since mid-2007 human cases of Q fever in The
Netherlands have increased sharply, with major out-
breaks in 2008 and 2009, reaching a total of about
4000 cases by 2010 [1–4]. Cases were predominantly
clustered in the south of The Netherlands [3] and the
majority of the laboratory samples were submitted
to one regional hospital : the Jeroen Bosch Hospital
in ’s-Hertogenbosch (about 2000 confirmed acute
Q fever cases). Follow-up of cases extended over a
period of up to 24 months. In the 3 years that this
outbreak persisted, laboratory results from over 2000
cases were collected in a laboratory database. This
* Author for correspondence : Professor P. F. M. Teunis, Centrefor Infectious Disease Control, Epidemiology and SurveillanceUnit, RIVM, PO Box 1, 3720BA Bilthoven, The Netherlands.(Email : [email protected])
Epidemiol. Infect. (2013), 141, 62–73. f Cambridge University Press 2012
doi:10.1017/S0950268812000404
Time-course of antibody responses against Coxiella burnetiifollowing acute Q fever
P. F. M. TEUNIS 1,2*, B. SCHIMMER 1, D. W. NOTERMANS3,
A. C. A. P. LEENDERS 4, P. C. WEVER 4, M. E. E. KRETZSCHMAR1,5
AND P. M. SCHNEEBERGER 4
1 Centre for Infectious Disease Control, Epidemiology and Surveillance Unit, RIVM, Bilthoven, The Netherlands2 Hubert Department of Global Health, Rollins School of Public Health, Emory University, Atlanta, GA, USA3 Centre for Infectious Disease Control, Laboratory for Infectious Diseases and Perinatal Screening, RIVM,Bilthoven, The Netherlands4 Jeroen Bosch Hospital, Department of Medical Microbiology and Infection Control,’s- Hertogenbosch, TheNetherlands5 Julius Centre for Health Sciences and Primary Care, University Medical Centre Utrecht, Utrecht, The
Netherlands
Received 11 October 2011; Final revision 15 February 2012; Accepted 15 February 2012;
first published online 4 April 2012
SUMMARY
Large outbreaks of Q fever in The Netherlands have provided a unique opportunity for studying
longitudinal serum antibody responses in patients. Results are presented of a cohort of 344
patients with acute symptoms of Q fever with three or more serum samples per patient. In all
these serum samples IgM and IgG against phase 1 and 2 Coxiella burnetii were measured by an
immunofluorescence assay. A mathematical model of the dynamic interaction of serum antibodies
and pathogens was used in a mixed model framework to quantitatively analyse responses to
C. burnetii infection. Responses show strong heterogeneity, with individual serum antibody
responses widely different in magnitude and shape. Features of the response, peak titre and decay
rate, are used to characterize the diversity of the observed responses. Binary mixture analysis of
IgG peak levels (phases 1 and 2) reveals a class of patients with high IgG peak titres that decay
slowly and may represent potential chronic cases. When combining the results of mixture analysis
into an odds score, it is concluded that not only high IgG phase 1 may be predictive for chronic
Q fever, but also that high IgG phase 2 may aid in detecting such putative chronic cases.
Key words: Coxiella, mathematical modelling, Q fever, serology, statistics.
INTRODUCTION
Since mid-2007 human cases of Q fever in The
Netherlands have increased sharply, with major out-
breaks in 2008 and 2009, reaching a total of about
4000 cases by 2010 [1–4]. Cases were predominantly
clustered in the south of The Netherlands [3] and the
majority of the laboratory samples were submitted
to one regional hospital : the Jeroen Bosch Hospital
in ’s-Hertogenbosch (about 2000 confirmed acute
Q fever cases). Follow-up of cases extended over a
period of up to 24 months. In the 3 years that this
outbreak persisted, laboratory results from over 2000
cases were collected in a laboratory database. This
* Author for correspondence : Professor P. F. M. Teunis, Centrefor Infectious Disease Control, Epidemiology and SurveillanceUnit, RIVM, PO Box 1, 3720BA Bilthoven, The Netherlands.(Email : [email protected])
Epidemiol. Infect. (2013), 141, 62–73. f Cambridge University Press 2012
doi:10.1017/S0950268812000404
Affiliaties
Chapter 3.2
1Centre for Infectious Disease Control, National Institute for Public Health and the Environment, Bilthoven, the Netherlands 2Municipal Health Service ‘Brabant Zuidoost, Eindhoven, the Netherlands 3Laboratory for Pathology and Medical Microbiology, Veldhoven, the Netherlands 4Region East, Food and Consumer Product Safety Authority, Zutphen, the Netherlands 5Department of Medical Microbiology and Infection Control, Jeroen Bosch Hospital, ‘s Hertogenbosch, the Netherlands 6Department of Small Ruminant Health, Animal Health Service, Deventer, the Netherlands
Chapter 4.1
1 Centre for Infectious Disease Control, National Institute for Public Health and The Environment, Bilthoven, The Netherlands 2 Academic Collaborative Centre AMPHI, Department of Primary and Community Care, Radboud University Nijmegen Medical Centre, Nijmegen, The Netherlands 3 Department of Medical Microbiology and Infection Control, Jeroen Bosch Hospital, ’s-Hertogenbosch, The Netherlands 4 Department of Small Ruminant Health, Animal Health Service, Deventer, The Netherlands
Chapter 4.2 1Centre for Infectious Disease Control, National Institute for Public Health and the Environment, Bilthoven, the Netherlands 2Quantitative Veterinary Epidemiology Group, Wageningen Institute of Animal Sciences, Wageningen, The Netherlands 3Department of Small Ruminant Health, Animal Health Service, Deventer, The Netherlands 4Academic Collaborative Centre AMPHI, Department of Primary and Community Care, Radboud University Nijmegen Medical Centre, the Netherlands
Chapter 4.4 1Centre for Infectious Disease Control, National Institute for Public Health and the Environment, Bilthoven, the Netherlands 2 Academic Collaborative Centre AMPHI, Department of Primary and Community Care, Radboud University Nijmegen Medical Centre, Nijmegen, the Netherlands 3Department of Small Ruminant Health, Animal Health Service, Deventer, The Netherlands
Chapter 4.5 1 National Institute for Public Health and the Environment (RIVM), Bilthoven, the Netherlands 2 Animal Health Service,Deventer, the Netherlands 3 Radboud University Nijmegen Medical Centre, Nijmegen, the Netherlands 4. Jeroen Bosch Hospital, ‘s-Hertogenbosch, the Netherlands Chapter 4.6 1 GD Animal Health, Deventer, The Netherlands 2 Centre for Infectious Disease Control, National Institute for Public Health and the Environment, Bilthoven, the Netherlands 3 Department of Primary and Community Care, Academic Collaborative Centre for Public Health (AMPHI), Radboud University Nijmegen Medical Centre, Nijmegen, The Netherlands
Chapter 5.1 1 Department of Small Ruminant Health, Animal Health Service, Deventer, The Netherlands 2 Centre for Infectious Disease Control, National Institute for Public Health and the Environment, Bilthoven, The Netherlands 3 Department of Medical Microbiology and Infection Control, Jeroen Bosch Hospital, ‘s-Hertogenbosch, The Netherlands, 4 Department of Diagnostics, Research and Epidemiology, Animal Health Service, Deventer, The Netherlands
Chapter 5.2
1 Division of Environmental Epidemiology, Institute for Risk Assessment Sciences, Utrecht, the Netherlands 2 Centre for Infectious Disease Control, National Institute for Public Health and the Environment, Bilthoven, the Netherlands, 3 Department of Medical Microbiology and Infection Control, Jeroen Bosch Hospital, ‘s-Hertogenbosch, the Netherlands, 4 Division of Veterinary Public Health, Institute for Risk Assessment Sciences, Utrecht, the Netherlands
Chapter 5.3 1.National Institute for Public Health and the Environment, Bilthoven, the Netherlands 2 European Centre for Disease Prevention and Control, Stockholm, Sweden 3 Jeroen Bosch Hospital, ‘s-Hertogenbosch, the Netherlands 4 ArboUnie, Utrecht, the Netherlands
importance of shedding routes [7]. An infection isusually asymptomatic in cattle, while in dairy goats anddairy sheep an infection may result in abortion or still-birth [4], often without preceding symptoms. Q feveraffected goat herds can show abortion rates up to 90%[8,9].Dairy goats are considered the predominant source of
the community Q fever epidemics in the Netherlandssince 2007 [2,10]. The overall goat density in the Neth-erlands is 38 goats per square kilometre and the totalnumber of goats has increased six-fold from 61.000 in1990 up to 374.000 in 2009. In the period 2000 until2009, dairy goat farming has increased almost 3-foldfrom 98.000 up to 274.000 dairy goats and is especiallyconcentrated in the southern parts of the Netherlands[11]. In the Netherlands, dairy goats are mainly keptyear-round in deep litter houses, with partially openwalls or roofs. During 2005-2009, Q fever abortionwaves were reported on 28 dairy goat farms and 2 dairysheep farms with abortion percentages varying between10 and 60% [12]. Human incidence of acute Q fever washighest each spring (April-June), following the mainlambing season (December-April) [2]. In order to reducethe risk of exposure from C. burnetii-infected smallruminants to humans, mandatory vaccination started inthe epicentre of the human outbreak in the southeast ofthe Netherlands from April 2009 onwards following avoluntary small ruminant vaccination campaign in amore restricted area in the fall of 2008. The 2009 vacci-nation campaign targeted all dairy goat and dairy sheepfarms with at least 50 animals, all open farms (pettingzoos, care farms) and all known clinically infected farmssince 2005. Studies evaluating the effect of vaccinationare promising, especially in nulliparous animals [13]. InOctober 2009, mandatory bulk milk monitoring usingPCR was implemented on all dairy goat and dairy sheepfarms with more than 50 animals, to actively detect C.burnetii-positive farms, next to the mandatory notifica-tion of abortion waves [2]. As of 25 April 2011, 96 dairygoat farms (about 25% of the about 360 large dairygoats farms in 2010) and 2 dairy sheep farms (5%) werefound to be bulk milk-positive [14]. In European coun-tries where studies have been done, the seroprevalencein goats in general varies between 6.5% and 48.2%, butis reported up to 75% if sampling is done in sheddergoats such as reported in France [15,16]. Farm preva-lences were 42.9% in Northern Ireland, 43.0% in a studyfrom Italy and 47.0% in northern Spain [17-19]. Sero-prevalences may vary widely within countries as demon-strated in the south-east of France, where at 39 farmswithout Q fever abortions during the last five yearswithin-herd rates ranged from 0-98% [20]. In 2008, inthe Netherlands, the overall Q fever seroprevalence in aconvenience sample of 3,134 samples from 442 goat
farms submitted for the Brucella melitensis monitoringprogram was 7.8% (95%CI 6.9-8.8%) [12]. The seropre-valence was 11.4% in the southeastern part of the Neth-erlands compared to 5.3% in the rest of the country.Seroprevalence was higher among the 1,290 dairy goatscompared to the 1,844 non-dairy goats (14.7%, 95% CI2.8%-16.6% versus 3.0%, 95%CI 2.2%-3.8%). The farmprevalence (at least one goat testing positive), was 17.9%(95%CI 14.2-21.5). The average within-herd prevalenceon a positive dairy goat farm was 32.1% (95%CI 28.4-35.9%) (van den Brom R, Moll L, Vellema P: Q feverseroprevalence in sheep and goats in the Netherlands in2008, submitted). Risk factor studies for Q fever in dairygoat farms in the Netherlands have not been done. Theaim of this study was to assess the actual magnitude ofthe spread of C. burnetii among small ruminants follow-ing the (what turned out to be the peak-) epidemic sea-son in humans in 2009, through testing of sera from anationwide representative sample of dairy goat farmsprior to the start of mandatory vaccination. We identi-fied risk factors for Q fever seropositivity on farm andanimal level in order to update control measures and toprovide targeted advice for the Dutch dairy goat sector.
MethodsStudy design and sampling strategyThe study was designed as a cross-sectional study. InMarch 2009, 357 dairy goat farms with more than 100dairy goats were present in the Netherlands andapproached for participation. These farms are consid-ered commercial farms and include the size of allknown clinically infected goat farms with Q fever. Thewide range in herd size allows studying the influence ofthis size on the infection risk. For all farms, results frombulk milk monitoring using PCR were available fromOctober 2009 until October 2010. Farms with less than100 goats and farms with a goat population completelyvaccinated during the voluntary vaccination campaign in2008 (approximately 36,000 goats) were excluded. Toestimate farm prevalence, 110 farms should be includedbased on an expected prevalence of 50%, with 95% con-fidence, 10% accuracy and 90% sensitivity of the serolo-gical test used [21]. Based on an assumed within-herdprevalence of 16% [16,19] and a herd size varyingbetween 100 and 4000 goats, 21 goats per farm were tobe screened for C. burnetii infection. On participatingfarms, the private veterinary practitioner collected sero-logical samples from the jugular vein of goats before thevaccination campaign in 2009 started. Written informedconsent was obtained from each participating farm. Asthe investigation by the Animal Health Service of goatserum samples taken by the private veterinary practi-tioner could be considered as part of regular and rou-tine clinical-diagnostic care, no official review and
Schimmer et al. BMC Veterinary Research 2011, 7:81http://www.biomedcentral.com/1746-6148/7/81
Page 2 of 14

108 | CHAPTER 4.2
approval of the Animal Welfare Commission wasneeded.Samples were collected in the mandatory vaccination
area of 2009 between May and September 2009 (91% ofsamples were taken in May and June 2009) while sam-ples outside this area were collected between July 2009and May 2010 (81% of samples were taken from Octo-ber 2009 until January 2010). A farm questionnaire wassent by e-mail or regular mail to all participating farmsbetween October 2009 and May 2010 and completed bythe farm owner or farm manager. The questionnaireaddressed the general farm situation, number of lambsand goats, housing characteristics, vermin control andmanure handling in 2008 (the year before the manda-tory hygiene protocol was implemented), general healthstatus and reproductive problems (including abortionrates) of the herd, breeding information, annual milkproduction and farm management, including biosecurityand hygiene measures for own staff and farm visitors.
Laboratory analysisIndividual goat serum samples were tested with anELISA test (Ruminant serum Q Fever ELISA kit, Labor-atoire Service International, Lissieu, France) on C. bur-netii specific antibodies with a single 1:400 serumdilution. All steps were carried out according to theinstruction of the manufacturer. A goat was consideredELISA-positive if the optical density percent was 40 orhigher, otherwise negative. A farm was considered posi-tive if at least one goat on the farm was classifiedpositive.
Data analysesNon-response analysisParticipating and non-participating farms were com-pared with respect to bulk milk PCR results (LSI TaqVetCoxiella burnetii, LSI, Lissieu, France), herd size, goat,sheep and cattle density, degree of urbanization andregion where farms were located to study the represen-tativeness of participating farms. Categorical variablesamong participating and non-participating farms werecompared with a chi-square or Fisher exact test whilenumerical variables were compared using the Wilcoxonrank sum test.Descriptive statistics and risk factor analysisAnimal and farm prevalence of C. burnetii with corre-sponding exact 95 percent confidence intervals were cal-culated. First, frequency tables of categorical variableswere analysed and distributions of continuous variableswere studied, and if not linearly related to the outcomevariable divided into classes based on biological argu-ments, and if these were lacking based on medians.Potential risk factors on farm level were analysed bylogistic regression (PROC LOGISTIC, SAS Institute Inc.,
2004), and on animal level by generalized linear regres-sion analysis accounting for farm effect (PROC GEN-MOD, SAS Institute Inc., 2004). For the latter, anexchangeable correlation covariance structure fitted bestand was used to account for within-herd variation. First,univariable analyses were performed. In multivariableanalysis, all variables with a p-value below 0.20 in theunivariable analyses were included. For multivariableanalysis on farm level, we excluded variables with lessthan 10% of data in one risk category. Proxy outcomessuch as bulk milk status and mandatory vaccination areawere not included in multivariable analyses. A back-wards elimination procedure was performed until allvariables were significant at 10% significance level in thelikelihood ratio test. Two-way interactions between bio-logical plausible and significant variables in the multi-variate model were investigated. For the final model onfarm level, model fit was assessed with the Hosmer-Lemeshow-Goodness-of-fit test (Hosmer and Lemeshow,1989). Model fit on animal level was assessed by theQIC (Quasilikelihood under the Independence ModelCriterion) goodness of fit statistic for GEE models.
ResultsNon-response analysisOf the 357 approached farms, 23 farms were excludedas they were not eligible for participation due to com-plete vaccination in 2008 or a herd size < 100 goats. Intotal, 123 dairy goat farms (36.8%) out of 334 eligiblefarms were willing to cooperate (Figure 1). Three addi-tional dairy goat farms (0.9%) with only three goat serawere excluded from analysis and considered as a non-participant. Farms in the mandatory vaccination areaparticipated more often than farms outside this area,46.1% versus 30.1% (p < 0.05). The median number ofgoats among participating farms was 782 goats com-pared to 689 goats in the non-participating farms (p <0.05). Bulk milk PCR-positivity did not differ betweenparticipating and non-participating farms, 24.4% and22.8%, respectively. Participating and non-participatingfarms were also comparable with regard to location inrural areas (95.1% versus 97.2%), municipal cattle den-sity (median: 121 versus 117), sheep density within 10kilometres from farm (median: 21 versus 16) and affilia-tion to an organic goat farming cooperative (11.4% ver-sus 13.4%).
Descriptive resultsFrom the 123 participating farms, 51 farms (41.5%) werelocated in the two southern provinces, 44 (35.8%) in theeastern part, 16 (13.0%) in the western part and 12(9.7%) in the northern part of the country. The majorityof farms (95.8%) were located in rural areas (< 500addresses/km2). A farm questionnaire was available for
Schimmer et al. BMC Veterinary Research 2011, 7:81http://www.biomedcentral.com/1746-6148/7/81
Page 3 of 14
96 (78.0%) of the 123 dairy goat farms. Consequently,the investigation of risk factors was conducted in thissubsample of 96 farms. Participating goat farmsstarted between 1975 and 2009 (median: 1997, inter-quartile range (IQR) 1995-2000). The Dutch Whitegoat was present on all farms. Additionally, othergoat species, such as Toggenburger, Dutch pied origi-nal, Anglo-Nubian, alpine or mixed breeds were pre-sent at 50 farms (52.1%). The median annual milkproduction per goat was 1000 litres (IQR 900-1150litres). Fourteen farms (14.6%) reported abortion per-centages of 4% or higher in the period 2007-2009 (n= 11) and/or experienced an abortion wave due to Qfever since 2005 (n = 7).
SeroprevalenceA total of 2,828 serum samples were taken at the 123participating farms. At 101 farms (82.1%), 21 samplesper farm were taken as planned, while at the other 22farms the median number of samples was 22 (range 13-116). Of these 2,828 samples, 21.4% were seropositive(exact 95% CI: 19.9-23.0) (Figure 2). At least one posi-tive goat serum sample was found on 53 out of the 123farms (43.1%; exact 95% CI: 34.2-52.3). On these 53positive farms 46.6% of tested animals were seropositive(exact 95% CI: 43.9-49.3%). The prevalence of seroposi-tive goats per farm varied between 4.8% and 95.2%(mean 46.0%, median 45.8% positive goats per farm,inter-quartile range 23.8%-63.6%). The average herd size
on positive farms was 1,116 goats (median 890 goats,range 121-4,146) while the average herd size of negativefarms was 793 goats (median 729 goats, range 120-2,970). Within the mandatory vaccination area, 58.5% offarms were classified positive compared to 25.9% of goatfarms outside this area. Samples within the mandatoryvaccination area were almost all taken during the end ofthe lambing season in 2009 (May-June) while 82.9% ofsamples outside this area were taken during the nextlambing season in 2010 defined as December 2009 untilMay 2010. Median age, known for 1,474 goats, was 2.3years. Seroprevalence increased with age: 5.8% for goatsyounger than 1 year, 15.7% between 1-3 years and 26.1%older than 3 years. Prevalence of the group that hadlambed at least once was significantly higher than in thenulliparous group (19.4% (n = 1,251) vs. 11.9% (n =236); for 1,341 goats lambing status was unknown.
Comparison of bulk milk and serological statusFrom the 123 participating farms, 30 were bulk milkPCR positive (24.4%; exact 95% CI: 17.1-33.0). Amongthese 30 farms, 28 (93.3%) were also classified positivebased on individual animal sera, with an average animalprevalence of 54.4% per positive farm. One farm wasserologically negative in May 2009, but tested bulk milk-positive in November 2009, while the other farm wasserologically negative in January 2010, and tested bulkmilk-positive end March 2010. At 25 (26.9%) of the 93bulk milk-negative farms at least one goat was positive,
Figure 1 Study participation of invited commercial dairy goat farms (> 100 goats), The Netherlands, 2009-2010.
Schimmer et al. BMC Veterinary Research 2011, 7:81http://www.biomedcentral.com/1746-6148/7/81
Page 4 of 14

C. BURNETII SEROPREVALENCE AND RISK FACTORS IN DAIRY GOATS | 109
4.2
approval of the Animal Welfare Commission wasneeded.Samples were collected in the mandatory vaccination
area of 2009 between May and September 2009 (91% ofsamples were taken in May and June 2009) while sam-ples outside this area were collected between July 2009and May 2010 (81% of samples were taken from Octo-ber 2009 until January 2010). A farm questionnaire wassent by e-mail or regular mail to all participating farmsbetween October 2009 and May 2010 and completed bythe farm owner or farm manager. The questionnaireaddressed the general farm situation, number of lambsand goats, housing characteristics, vermin control andmanure handling in 2008 (the year before the manda-tory hygiene protocol was implemented), general healthstatus and reproductive problems (including abortionrates) of the herd, breeding information, annual milkproduction and farm management, including biosecurityand hygiene measures for own staff and farm visitors.
Laboratory analysisIndividual goat serum samples were tested with anELISA test (Ruminant serum Q Fever ELISA kit, Labor-atoire Service International, Lissieu, France) on C. bur-netii specific antibodies with a single 1:400 serumdilution. All steps were carried out according to theinstruction of the manufacturer. A goat was consideredELISA-positive if the optical density percent was 40 orhigher, otherwise negative. A farm was considered posi-tive if at least one goat on the farm was classifiedpositive.
Data analysesNon-response analysisParticipating and non-participating farms were com-pared with respect to bulk milk PCR results (LSI TaqVetCoxiella burnetii, LSI, Lissieu, France), herd size, goat,sheep and cattle density, degree of urbanization andregion where farms were located to study the represen-tativeness of participating farms. Categorical variablesamong participating and non-participating farms werecompared with a chi-square or Fisher exact test whilenumerical variables were compared using the Wilcoxonrank sum test.Descriptive statistics and risk factor analysisAnimal and farm prevalence of C. burnetii with corre-sponding exact 95 percent confidence intervals were cal-culated. First, frequency tables of categorical variableswere analysed and distributions of continuous variableswere studied, and if not linearly related to the outcomevariable divided into classes based on biological argu-ments, and if these were lacking based on medians.Potential risk factors on farm level were analysed bylogistic regression (PROC LOGISTIC, SAS Institute Inc.,
2004), and on animal level by generalized linear regres-sion analysis accounting for farm effect (PROC GEN-MOD, SAS Institute Inc., 2004). For the latter, anexchangeable correlation covariance structure fitted bestand was used to account for within-herd variation. First,univariable analyses were performed. In multivariableanalysis, all variables with a p-value below 0.20 in theunivariable analyses were included. For multivariableanalysis on farm level, we excluded variables with lessthan 10% of data in one risk category. Proxy outcomessuch as bulk milk status and mandatory vaccination areawere not included in multivariable analyses. A back-wards elimination procedure was performed until allvariables were significant at 10% significance level in thelikelihood ratio test. Two-way interactions between bio-logical plausible and significant variables in the multi-variate model were investigated. For the final model onfarm level, model fit was assessed with the Hosmer-Lemeshow-Goodness-of-fit test (Hosmer and Lemeshow,1989). Model fit on animal level was assessed by theQIC (Quasilikelihood under the Independence ModelCriterion) goodness of fit statistic for GEE models.
ResultsNon-response analysisOf the 357 approached farms, 23 farms were excludedas they were not eligible for participation due to com-plete vaccination in 2008 or a herd size < 100 goats. Intotal, 123 dairy goat farms (36.8%) out of 334 eligiblefarms were willing to cooperate (Figure 1). Three addi-tional dairy goat farms (0.9%) with only three goat serawere excluded from analysis and considered as a non-participant. Farms in the mandatory vaccination areaparticipated more often than farms outside this area,46.1% versus 30.1% (p < 0.05). The median number ofgoats among participating farms was 782 goats com-pared to 689 goats in the non-participating farms (p <0.05). Bulk milk PCR-positivity did not differ betweenparticipating and non-participating farms, 24.4% and22.8%, respectively. Participating and non-participatingfarms were also comparable with regard to location inrural areas (95.1% versus 97.2%), municipal cattle den-sity (median: 121 versus 117), sheep density within 10kilometres from farm (median: 21 versus 16) and affilia-tion to an organic goat farming cooperative (11.4% ver-sus 13.4%).
Descriptive resultsFrom the 123 participating farms, 51 farms (41.5%) werelocated in the two southern provinces, 44 (35.8%) in theeastern part, 16 (13.0%) in the western part and 12(9.7%) in the northern part of the country. The majorityof farms (95.8%) were located in rural areas (< 500addresses/km2). A farm questionnaire was available for
Schimmer et al. BMC Veterinary Research 2011, 7:81http://www.biomedcentral.com/1746-6148/7/81
Page 3 of 14
96 (78.0%) of the 123 dairy goat farms. Consequently,the investigation of risk factors was conducted in thissubsample of 96 farms. Participating goat farmsstarted between 1975 and 2009 (median: 1997, inter-quartile range (IQR) 1995-2000). The Dutch Whitegoat was present on all farms. Additionally, othergoat species, such as Toggenburger, Dutch pied origi-nal, Anglo-Nubian, alpine or mixed breeds were pre-sent at 50 farms (52.1%). The median annual milkproduction per goat was 1000 litres (IQR 900-1150litres). Fourteen farms (14.6%) reported abortion per-centages of 4% or higher in the period 2007-2009 (n= 11) and/or experienced an abortion wave due to Qfever since 2005 (n = 7).
SeroprevalenceA total of 2,828 serum samples were taken at the 123participating farms. At 101 farms (82.1%), 21 samplesper farm were taken as planned, while at the other 22farms the median number of samples was 22 (range 13-116). Of these 2,828 samples, 21.4% were seropositive(exact 95% CI: 19.9-23.0) (Figure 2). At least one posi-tive goat serum sample was found on 53 out of the 123farms (43.1%; exact 95% CI: 34.2-52.3). On these 53positive farms 46.6% of tested animals were seropositive(exact 95% CI: 43.9-49.3%). The prevalence of seroposi-tive goats per farm varied between 4.8% and 95.2%(mean 46.0%, median 45.8% positive goats per farm,inter-quartile range 23.8%-63.6%). The average herd size
on positive farms was 1,116 goats (median 890 goats,range 121-4,146) while the average herd size of negativefarms was 793 goats (median 729 goats, range 120-2,970). Within the mandatory vaccination area, 58.5% offarms were classified positive compared to 25.9% of goatfarms outside this area. Samples within the mandatoryvaccination area were almost all taken during the end ofthe lambing season in 2009 (May-June) while 82.9% ofsamples outside this area were taken during the nextlambing season in 2010 defined as December 2009 untilMay 2010. Median age, known for 1,474 goats, was 2.3years. Seroprevalence increased with age: 5.8% for goatsyounger than 1 year, 15.7% between 1-3 years and 26.1%older than 3 years. Prevalence of the group that hadlambed at least once was significantly higher than in thenulliparous group (19.4% (n = 1,251) vs. 11.9% (n =236); for 1,341 goats lambing status was unknown.
Comparison of bulk milk and serological statusFrom the 123 participating farms, 30 were bulk milkPCR positive (24.4%; exact 95% CI: 17.1-33.0). Amongthese 30 farms, 28 (93.3%) were also classified positivebased on individual animal sera, with an average animalprevalence of 54.4% per positive farm. One farm wasserologically negative in May 2009, but tested bulk milk-positive in November 2009, while the other farm wasserologically negative in January 2010, and tested bulkmilk-positive end March 2010. At 25 (26.9%) of the 93bulk milk-negative farms at least one goat was positive,
Figure 1 Study participation of invited commercial dairy goat farms (> 100 goats), The Netherlands, 2009-2010.
Schimmer et al. BMC Veterinary Research 2011, 7:81http://www.biomedcentral.com/1746-6148/7/81
Page 4 of 14
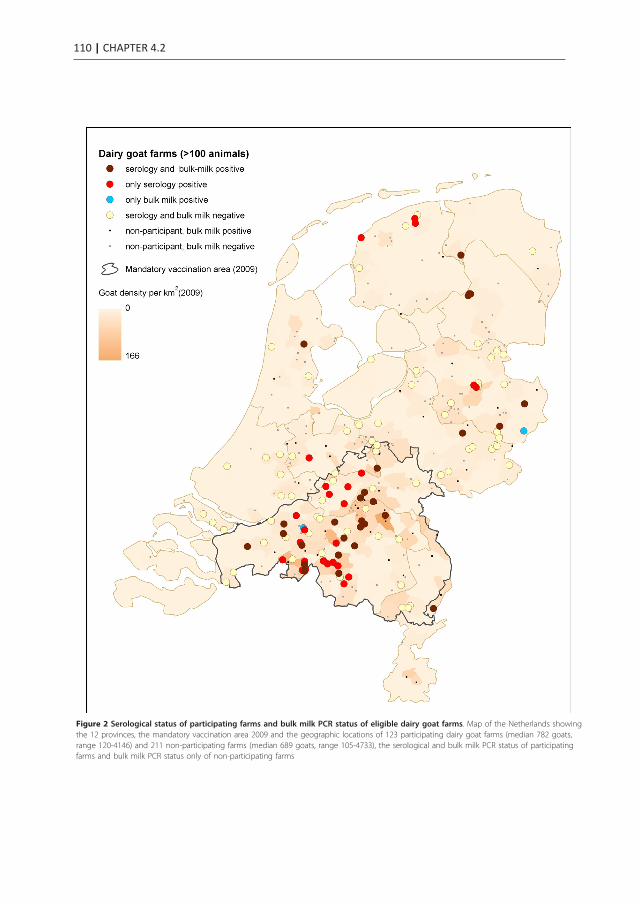
110 | CHAPTER 4.2
Figure 2 Serological status of participating farms and bulk milk PCR status of eligible dairy goat farms. Map of the Netherlands showingthe 12 provinces, the mandatory vaccination area 2009 and the geographic locations of 123 participating dairy goat farms (median 782 goats,range 120-4146) and 211 non-participating farms (median 689 goats, range 105-4733), the serological and bulk milk PCR status of participatingfarms and bulk milk PCR status only of non-participating farms
Schimmer et al. BMC Veterinary Research 2011, 7:81http://www.biomedcentral.com/1746-6148/7/81
Page 5 of 14
with an average animal prevalence of 36.5% per positivefarm.
Univariable analyses on farm levelRisk factors associated (p < 0.20) with farm seropositiv-ity were herd size larger than 800 goats, location inmandatory vaccination area, farm location within 8 kmfrom nearest bulk milk PCR-positive farm, high goatand cattle density, 3 or more stables, use of artificialinsemination, having a dog at the farm, having a dog ora cat in the goat stable, unknown status of signs of ver-min in roughage or litter, use of silage feed, maize andother feed such as lucerne or pulp, straw imported fromabroad or unknown origin, use of a fodder mixer, con-trolling nuisance animals (e.g. wild birds) by covering airspaces, abortion percentage ≥ 4% during 2007-2009 orknown history of abortion wave due to Q fever since2005, spread of manure to other places than own farmor direct environment, two or more lambing seasonsannually and having a closed or open tenure versus asemi-closed tenure (e.g. only bucks supplied). Protectivefactors were keeping rabbit(s) or pet birds, sidewall ven-tilation, and goat supply from the provinces of Frieslandand Overijssel (Table 1).
Multivariable analysis on farm levelA total of 21 variables were included in the initial multi-variable model. Artificial insemination strongly corre-lated with large herd size and was excluded from themodel. Supply from the provinces of Friesland andOverijssel provinces was not included in the model aspossible protective factor because overall goat supply orsupply from other provinces were not significant riskfactors in the univariable analysis. Having a rabbit or apet bird was also not included as it correlated inverselywith having a dog. The following nine variablesremained independently associated with seropositivity inthe final model (Table 2): farm located within 8 kmproximity to a bulk milk PCR-positive dairy goat farm,high cattle density, controlling nuisance animals by cov-ering air spaces, presence of cats and/or dogs in thegoat stable, straw imported from abroad or unknownorigin, a herd size of 800 goats or more and unknownstatus of signs of vermin in roughage or litter. Interac-tion terms were not statisticially significant and did notimprove the model. The Hosmer and Lemeshow Good-ness-of-Fit test showed no lack of fit of the model (P =0.60).
Univariable risk factor analyses on animal levelThe same variables as in the analysis on farm level wereidentified on animal level, except for having a dog in thestable and straw imported from abroad or unknown ori-gin. Additionally the following univariable risk factors
were identified on animal level: mechanic ventilation inthe stable, use of windbreak curtain only or in combina-tion with wind shields, presence of few nuisance animals(e.g. wild birds), while additional univariable protectivefactors on animal level were presence of the Anglo-Nubian goat and keeping laying hens (Table 3).
Multivariable risk factors analysis on animal levelThe variable presence of a dog on the farm was notincluded on animal level, as the reference category wastoo small as almost all farms (88%) had a dog. Sevenvariables remained in the multivariable model on animallevel of which five also were present in the final modelon farm level i.e. farm located within 8 km proximityfrom a bulk milk PCR-positive dairy goat farm, high cat-tle density, presence of a cat in the goat stable, control-ling nuisance animals by covering air spaces andunknown status of vermin in roughage or litter. Addi-tional risk factors on animal level were use of artificialinsemination and use of windbreak curtain only or incombination with wind shields compared to none ofthese (Table 4). Within-farm variation accounted for34.6% of all non-explained variance of the model.
DiscussionThe overall animal and farm seroprevalence of C. burne-tii in dairy goats farms with ≥ 100 dairy goats observedin this study was 21.4% and 43.1% respectively. Theseseroprevalence estimates increased compared to the ser-oprevalence measured in 2008, when 14.7% of individualdairy goats were serologically positive and 17.9% offarms tested positive. The within-herd prevalence onpositive dairy goat farms in our study was 46.6% com-pared to 32.1% (95%CI 28.4%-35.9%) in 2008 (van denBrom R, Moll L, Vellema P: Q fever seroprevalence insheep and goats in the Netherlands in 2008, submitted).This study demonstrates substantial transmission of C.burnetii within and between dairy goat farms in recentyears prior to the mandatory vaccination campaign inthe Netherlands.The relatively low overall participation rate of 37%
probably reflects the reluctance to take part in the studyat the same time as control measures increased, includ-ing finally the culling of pregnant goats at bulk milkPCR-positive farms. The overrepresentation of farmslocated in the mandatory vaccination area probablyreflects that the risk perception of the farmers played arole. Because of the higher participation rate in thisarea, we might have overestimated the overall seropreva-lence in eligible dairy goat farms in the Netherlands. Asexpected, dairy goat farms located in the mandatory vac-cination area were more often seropositive in our study,as was previously observed in 2008 (van den Brom R,Moll L, Vellema P: Q fever seroprevalence in sheep and
Schimmer et al. BMC Veterinary Research 2011, 7:81http://www.biomedcentral.com/1746-6148/7/81
Page 6 of 14

C. BURNETII SEROPREVALENCE AND RISK FACTORS IN DAIRY GOATS | 111
4.2
Figure 2 Serological status of participating farms and bulk milk PCR status of eligible dairy goat farms. Map of the Netherlands showingthe 12 provinces, the mandatory vaccination area 2009 and the geographic locations of 123 participating dairy goat farms (median 782 goats,range 120-4146) and 211 non-participating farms (median 689 goats, range 105-4733), the serological and bulk milk PCR status of participatingfarms and bulk milk PCR status only of non-participating farms
Schimmer et al. BMC Veterinary Research 2011, 7:81http://www.biomedcentral.com/1746-6148/7/81
Page 5 of 14
with an average animal prevalence of 36.5% per positivefarm.
Univariable analyses on farm levelRisk factors associated (p < 0.20) with farm seropositiv-ity were herd size larger than 800 goats, location inmandatory vaccination area, farm location within 8 kmfrom nearest bulk milk PCR-positive farm, high goatand cattle density, 3 or more stables, use of artificialinsemination, having a dog at the farm, having a dog ora cat in the goat stable, unknown status of signs of ver-min in roughage or litter, use of silage feed, maize andother feed such as lucerne or pulp, straw imported fromabroad or unknown origin, use of a fodder mixer, con-trolling nuisance animals (e.g. wild birds) by covering airspaces, abortion percentage ≥ 4% during 2007-2009 orknown history of abortion wave due to Q fever since2005, spread of manure to other places than own farmor direct environment, two or more lambing seasonsannually and having a closed or open tenure versus asemi-closed tenure (e.g. only bucks supplied). Protectivefactors were keeping rabbit(s) or pet birds, sidewall ven-tilation, and goat supply from the provinces of Frieslandand Overijssel (Table 1).
Multivariable analysis on farm levelA total of 21 variables were included in the initial multi-variable model. Artificial insemination strongly corre-lated with large herd size and was excluded from themodel. Supply from the provinces of Friesland andOverijssel provinces was not included in the model aspossible protective factor because overall goat supply orsupply from other provinces were not significant riskfactors in the univariable analysis. Having a rabbit or apet bird was also not included as it correlated inverselywith having a dog. The following nine variablesremained independently associated with seropositivity inthe final model (Table 2): farm located within 8 kmproximity to a bulk milk PCR-positive dairy goat farm,high cattle density, controlling nuisance animals by cov-ering air spaces, presence of cats and/or dogs in thegoat stable, straw imported from abroad or unknownorigin, a herd size of 800 goats or more and unknownstatus of signs of vermin in roughage or litter. Interac-tion terms were not statisticially significant and did notimprove the model. The Hosmer and Lemeshow Good-ness-of-Fit test showed no lack of fit of the model (P =0.60).
Univariable risk factor analyses on animal levelThe same variables as in the analysis on farm level wereidentified on animal level, except for having a dog in thestable and straw imported from abroad or unknown ori-gin. Additionally the following univariable risk factors
were identified on animal level: mechanic ventilation inthe stable, use of windbreak curtain only or in combina-tion with wind shields, presence of few nuisance animals(e.g. wild birds), while additional univariable protectivefactors on animal level were presence of the Anglo-Nubian goat and keeping laying hens (Table 3).
Multivariable risk factors analysis on animal levelThe variable presence of a dog on the farm was notincluded on animal level, as the reference category wastoo small as almost all farms (88%) had a dog. Sevenvariables remained in the multivariable model on animallevel of which five also were present in the final modelon farm level i.e. farm located within 8 km proximityfrom a bulk milk PCR-positive dairy goat farm, high cat-tle density, presence of a cat in the goat stable, control-ling nuisance animals by covering air spaces andunknown status of vermin in roughage or litter. Addi-tional risk factors on animal level were use of artificialinsemination and use of windbreak curtain only or incombination with wind shields compared to none ofthese (Table 4). Within-farm variation accounted for34.6% of all non-explained variance of the model.
DiscussionThe overall animal and farm seroprevalence of C. burne-tii in dairy goats farms with ≥ 100 dairy goats observedin this study was 21.4% and 43.1% respectively. Theseseroprevalence estimates increased compared to the ser-oprevalence measured in 2008, when 14.7% of individualdairy goats were serologically positive and 17.9% offarms tested positive. The within-herd prevalence onpositive dairy goat farms in our study was 46.6% com-pared to 32.1% (95%CI 28.4%-35.9%) in 2008 (van denBrom R, Moll L, Vellema P: Q fever seroprevalence insheep and goats in the Netherlands in 2008, submitted).This study demonstrates substantial transmission of C.burnetii within and between dairy goat farms in recentyears prior to the mandatory vaccination campaign inthe Netherlands.The relatively low overall participation rate of 37%
probably reflects the reluctance to take part in the studyat the same time as control measures increased, includ-ing finally the culling of pregnant goats at bulk milkPCR-positive farms. The overrepresentation of farmslocated in the mandatory vaccination area probablyreflects that the risk perception of the farmers played arole. Because of the higher participation rate in thisarea, we might have overestimated the overall seropreva-lence in eligible dairy goat farms in the Netherlands. Asexpected, dairy goat farms located in the mandatory vac-cination area were more often seropositive in our study,as was previously observed in 2008 (van den Brom R,Moll L, Vellema P: Q fever seroprevalence in sheep and
Schimmer et al. BMC Veterinary Research 2011, 7:81http://www.biomedcentral.com/1746-6148/7/81
Page 6 of 14

112 | CHAPTER 4.2
Table 1 Univariable logistic regression of farm-based factors associated with serological Q fever infection on farmlevel
Variable Category N (%) Prev(%) OR 95% CI P-value
Herd size(number of goats according to UBN registry)
≥ 800 47 (49.0) 59.6 3.7 1.6-8.6 0.0020
< 800 49 (51.0) 28.6 Ref
Mandatory vaccination area 2009 Inside 53 (55.2) 58.5 4.1 1.7-9.9 0.0010
Outside 43 (44.8) 25.6 Ref
Goat density per km2
within 5 km radius from farm≥ 25 48 (50.0) 56.3 2.8 1.2-6.5 0.0130
< 25 48 (50.0) 31.3 Ref
Cattle density per km2
in farm municipality (excl. meat calves)≥ 100 67 (69.8) 50.8 2.7 1.1-7.0 0.0329
< 100 29 (30.2) 27.6 Ref
Distance to nearest bulk milk PCR-positive farm(km)
0- < 4 29 (30.2) 72.4 10.0 3.4-29.1 < .0001
4- < 8 19 (19.8) 57.9 5.2 1.7-16.5
≥ 8 48 (50.0) 20.8 Ref
Number of stables 1-2 stables 40 (41.7) 35.0 Ref 0.1424
≥ 3 stables 56 (58.3) 50.0 1.9 0.8-4.3
Use of artificial insemination Yes 26 (27.1) 61.5 2.7 1.1-6.7 0.0370
No 70 (72.9) 37.7 Ref
Having at least one dog at the farm Yes 84 (87.5) 47.6 4.6 0.9-22.0 0.0337
No 12 (12.5) 16.7 Ref
Having at least one rabbit at the farm Yes 26 (27.1) 30.8 0.5 0.2-1.2 0.1138
No 70 (72.9) 48.6 Ref
Having at least one pet bird at the farm Yes 25 (25.0) 28.0 0.4 0.2-1.1 0.0606
No 71 (75.0) 49.3 Ref
Dog(s) in goat stable Yes 60 (62.5) 51.7 2.4 1.0-5.8 0.0415
No/unknown 36 (37.5) 30.6 Ref
Cat(s) in goat stable Yes 34 (35.4) 58.8 2.6 1.1-6.1 0.0275
No/unknown 62 (64.6) 35.5 Ref
Signs of vermin (mice, rats, birds)in roughage or litter during past 12 months
Unknown 14 (14.6) 64.3 2.7 0.8-8.7 0.0944
Known (yes or no) 82 (85.4) 40.2 Ref
Feeding silage Yes 64 (66.7) 51.6 2.7 1.1-6.8 0.0269
No 32 (33.3) 28.1 Ref
Feeding maize Yes 40 (41.7) 55.0 2.2 1.0-5.0 0.0602
No 56 (58.3) 35.7 Ref
Use of lucerne, pulp feedor other roughage/litter
Yes 24 (25.0) 58.3 2.2 0.9-5.6 0.0972
No 72 (75.0) 38.9 Ref
Origin of straw Abroad/unknown 59 (61.5) 49.2 1.8 0.8-4.2 0.1757
No straw or domestic straw 37 (38.5) 35.1 Ref
Feeding method Hand/wheelbarrow 31 (32.3) 22.6 Ref 0.0202
Fodder mixer 56 (58.3) 57.1 4.6 1.7-12.4
Automatic 9 (9.4) 33.3 1.7 0.3-8.7
Sidewall ventilation Yes 38 (39.6) 34.2 0.5 0.2-1.2 0.1252
No 58 (60.4) 50.0 Ref
Control nuisance animals(e.g. wild birds) in 2008
Yes, by covering air spaces 15 (15.6) 73.3 2.1 1.3-15.4 0.0409
Yes, only via another ways(a.o. capture cage)
13 (13.5) 38.5 1.0 0.3-3.4
Not applicable 68 (70.8) 38.2 Ref
Schimmer et al. BMC Veterinary Research 2011, 7:81http://www.biomedcentral.com/1746-6148/7/81
Page 7 of 14
goats in the Netherlands in 2008, submitted). In con-trast, the estimated seroprevalence might have beenunderestimated as the non-eligible farms probably over-represented positive farms, such as farms with a clinicalhistory of Q fever. These were prioritized for vaccina-tion early 2009, and probably positive and suspectedfarms relatively more often volunteered for vaccinationin the 2008 campaign. Nevertheless, the net effect ofthese biases are thought to be limited, as bulk milk-posi-tive farms were equally represented among participatingand non-participating farms. As the diversity in farms,
also outside the vaccination area, was still large, effecton the risk factor analyses is considered limited andresults are considered generalizable to all commercialdairy goat farms in the Netherlands.Small ruminant studies have shown that goats test sig-
nificantly more often serologically positive during preg-nancy and in the periparturient period compared toearly pregnancy or non-pregnant period (van den BromR, Moll L, Vellema P: Q fever seroprevalance in sheepand goats in the Netherlands in 2008, submitted), [21].Different sampling periods in our study, mainly at the
Table 1 Univariable logistic regression of farm-based factors associated with serological Q fever infection on farmlevel (Continued)
Percentage of aborting goats or goats with stillbirthin 2007-2009 or known history of abortion wavedue to Q fever since 2005
< 4% 82 (85.4) 39.0 Ref 0.0234
≥ 4% and/or abortion wave 14 (14.6) 71.4 3.9 1.1-13.5
Spread of manure On or near own farmland 79 (82.3) 39.2 Ref 0.0497
To other places 15 (15.6) 66.7 3.1 1.0-9.9
Lambing periods in 2009 ≤ 1 57 (59.4) 31.6 Ref 0.0035
≥ 2 39 (40.6) 61.5 3.5 1.5-8.1
Type of tenure Completely closed 27 (28.1) 55.6 2.4 0.9-6.1 0.1158
Closed for female goats only 52 (54.2) 34.6 Ref
No, not closed 16 (16.7) 56.3 2.4 0.8-7.6
Goat supply from the province of Friesland Yes 19 (19.6) 26.3 0.4 0.1-1.2 0.0806
No 77 (80.2) 48.1 Ref
Goat supply from the province of Overijssel Yes 10 (10.4) 20.0 0.3 0.1-1.4 0.0961
No 86 (89.6) 46.5 Ref
Frequency (N), prevalence (Prev), odds ratio (OR), and 95% confidence interval (95%CI) of variables with Likelihood ratio test P values < 0.20 (96 farms, 43.1%positive farms based on total sample of 123 farms and 2,828 goats)
Table 2 Multivariable logistic regression of farm-based factors associated with serological Q fever infection on farmlevel
Variable Category N (%) Prev (%) aOR 95% CI
Distance to the nearest bulk milk PCR-positive farm (km) < 8 48 50.0 66.7 12.9 3.0-54.8
≥ 8 48 50.0 20.8 Ref
Cattle density per km2 in farm municipality (excl. meat calves) ≥ 100 67 69.8 50.8 14.4 2.7-78.4
< 100 29 30.2 27.6 Ref
Herd size (number of goats according to UBN registry) ≥ 800 47 49.0 59.6 2.8 0.8-9.4
< 800 49 51.0 28.6 Ref
Control nuisance animals (e.g. wild birds) in 2008 Yes, by covering air spaces 15 84.4 73.3 48.8 4.0-591.2
By other ways or not applicable 81 15.6 38.3 Ref
Dogs(s) in goat stable Yes 60 62.5 51.7 3.8 1.0-14.2
No/unknown 36 37.5 30.6 Ref
Cat(s) in goat stable Yes 34 35.4 58.8 6.3 1.5-25.8
No/unknown 62 64.6 35.5 Ref
Origin of � � � � � traw Abroad/unknown 59 61.5 49.2 5.0 1.3-19.6
No straw or domestic straw 37 38.5 35.1 Ref
Signs of vermin (mice, rats, birds) in roughage or litter during past 12 months Unknown 14 14.6 64.3 4.3 0.8-22.3
Known (yes or no) 82 85.4 40.2 Ref
Factors associated with Q fever on farm level with their frequency (N), prevalence (Prev), adjusted odds ratio (aOR) with corresponding 95% confidence interval(95% CI) in the final multivariable logistic model (96 farms; 43.1% positive farms based on total sample of 123 farms and 2,828 goats)
Schimmer et al. BMC Veterinary Research 2011, 7:81http://www.biomedcentral.com/1746-6148/7/81
Page 8 of 14
s

C. BURNETII SEROPREVALENCE AND RISK FACTORS IN DAIRY GOATS | 113
4.2
Table 1 Univariable logistic regression of farm-based factors associated with serological Q fever infection on farmlevel
Variable Category N (%) Prev(%) OR 95% CI P-value
Herd size(number of goats according to UBN registry)
≥ 800 47 (49.0) 59.6 3.7 1.6-8.6 0.0020
< 800 49 (51.0) 28.6 Ref
Mandatory vaccination area 2009 Inside 53 (55.2) 58.5 4.1 1.7-9.9 0.0010
Outside 43 (44.8) 25.6 Ref
Goat density per km2
within 5 km radius from farm≥ 25 48 (50.0) 56.3 2.8 1.2-6.5 0.0130
< 25 48 (50.0) 31.3 Ref
Cattle density per km2
in farm municipality (excl. meat calves)≥ 100 67 (69.8) 50.8 2.7 1.1-7.0 0.0329
< 100 29 (30.2) 27.6 Ref
Distance to nearest bulk milk PCR-positive farm(km)
0- < 4 29 (30.2) 72.4 10.0 3.4-29.1 < .0001
4- < 8 19 (19.8) 57.9 5.2 1.7-16.5
≥ 8 48 (50.0) 20.8 Ref
Number of stables 1-2 stables 40 (41.7) 35.0 Ref 0.1424
≥ 3 stables 56 (58.3) 50.0 1.9 0.8-4.3
Use of artificial insemination Yes 26 (27.1) 61.5 2.7 1.1-6.7 0.0370
No 70 (72.9) 37.7 Ref
Having at least one dog at the farm Yes 84 (87.5) 47.6 4.6 0.9-22.0 0.0337
No 12 (12.5) 16.7 Ref
Having at least one rabbit at the farm Yes 26 (27.1) 30.8 0.5 0.2-1.2 0.1138
No 70 (72.9) 48.6 Ref
Having at least one pet bird at the farm Yes 25 (25.0) 28.0 0.4 0.2-1.1 0.0606
No 71 (75.0) 49.3 Ref
Dog(s) in goat stable Yes 60 (62.5) 51.7 2.4 1.0-5.8 0.0415
No/unknown 36 (37.5) 30.6 Ref
Cat(s) in goat stable Yes 34 (35.4) 58.8 2.6 1.1-6.1 0.0275
No/unknown 62 (64.6) 35.5 Ref
Signs of vermin (mice, rats, birds)in roughage or litter during past 12 months
Unknown 14 (14.6) 64.3 2.7 0.8-8.7 0.0944
Known (yes or no) 82 (85.4) 40.2 Ref
Feeding silage Yes 64 (66.7) 51.6 2.7 1.1-6.8 0.0269
No 32 (33.3) 28.1 Ref
Feeding maize Yes 40 (41.7) 55.0 2.2 1.0-5.0 0.0602
No 56 (58.3) 35.7 Ref
Use of lucerne, pulp feedor other roughage/litter
Yes 24 (25.0) 58.3 2.2 0.9-5.6 0.0972
No 72 (75.0) 38.9 Ref
Origin of straw Abroad/unknown 59 (61.5) 49.2 1.8 0.8-4.2 0.1757
No straw or domestic straw 37 (38.5) 35.1 Ref
Feeding method Hand/wheelbarrow 31 (32.3) 22.6 Ref 0.0202
Fodder mixer 56 (58.3) 57.1 4.6 1.7-12.4
Automatic 9 (9.4) 33.3 1.7 0.3-8.7
Sidewall ventilation Yes 38 (39.6) 34.2 0.5 0.2-1.2 0.1252
No 58 (60.4) 50.0 Ref
Control nuisance animals(e.g. wild birds) in 2008
Yes, by covering air spaces 15 (15.6) 73.3 2.1 1.3-15.4 0.0409
Yes, only via another ways(a.o. capture cage)
13 (13.5) 38.5 1.0 0.3-3.4
Not applicable 68 (70.8) 38.2 Ref
Schimmer et al. BMC Veterinary Research 2011, 7:81http://www.biomedcentral.com/1746-6148/7/81
Page 7 of 14
goats in the Netherlands in 2008, submitted). In con-trast, the estimated seroprevalence might have beenunderestimated as the non-eligible farms probably over-represented positive farms, such as farms with a clinicalhistory of Q fever. These were prioritized for vaccina-tion early 2009, and probably positive and suspectedfarms relatively more often volunteered for vaccinationin the 2008 campaign. Nevertheless, the net effect ofthese biases are thought to be limited, as bulk milk-posi-tive farms were equally represented among participatingand non-participating farms. As the diversity in farms,
also outside the vaccination area, was still large, effecton the risk factor analyses is considered limited andresults are considered generalizable to all commercialdairy goat farms in the Netherlands.Small ruminant studies have shown that goats test sig-
nificantly more often serologically positive during preg-nancy and in the periparturient period compared toearly pregnancy or non-pregnant period (van den BromR, Moll L, Vellema P: Q fever seroprevalance in sheepand goats in the Netherlands in 2008, submitted), [21].Different sampling periods in our study, mainly at the
Table 1 Univariable logistic regression of farm-based factors associated with serological Q fever infection on farmlevel (Continued)
Percentage of aborting goats or goats with stillbirthin 2007-2009 or known history of abortion wavedue to Q fever since 2005
< 4% 82 (85.4) 39.0 Ref 0.0234
≥ 4% and/or abortion wave 14 (14.6) 71.4 3.9 1.1-13.5
Spread of manure On or near own farmland 79 (82.3) 39.2 Ref 0.0497
To other places 15 (15.6) 66.7 3.1 1.0-9.9
Lambing periods in 2009 ≤ 1 57 (59.4) 31.6 Ref 0.0035
≥ 2 39 (40.6) 61.5 3.5 1.5-8.1
Type of tenure Completely closed 27 (28.1) 55.6 2.4 0.9-6.1 0.1158
Closed for female goats only 52 (54.2) 34.6 Ref
No, not closed 16 (16.7) 56.3 2.4 0.8-7.6
Goat supply from the province of Friesland Yes 19 (19.6) 26.3 0.4 0.1-1.2 0.0806
No 77 (80.2) 48.1 Ref
Goat supply from the province of Overijssel Yes 10 (10.4) 20.0 0.3 0.1-1.4 0.0961
No 86 (89.6) 46.5 Ref
Frequency (N), prevalence (Prev), odds ratio (OR), and 95% confidence interval (95%CI) of variables with Likelihood ratio test P values < 0.20 (96 farms, 43.1%positive farms based on total sample of 123 farms and 2,828 goats)
Table 2 Multivariable logistic regression of farm-based factors associated with serological Q fever infection on farmlevel
Variable Category N (%) Prev (%) aOR 95% CI
Distance to the nearest bulk milk PCR-positive farm (km) < 8 48 50.0 66.7 12.9 3.0-54.8
≥ 8 48 50.0 20.8 Ref
Cattle density per km2 in farm municipality (excl. meat calves) ≥ 100 67 69.8 50.8 14.4 2.7-78.4
< 100 29 30.2 27.6 Ref
Herd size (number of goats according to UBN registry) ≥ 800 47 49.0 59.6 2.8 0.8-9.4
< 800 49 51.0 28.6 Ref
Control nuisance animals (e.g. wild birds) in 2008 Yes, by covering air spaces 15 84.4 73.3 48.8 4.0-591.2
By other ways or not applicable 81 15.6 38.3 Ref
Dogs(s) in goat stable Yes 60 62.5 51.7 3.8 1.0-14.2
No/unknown 36 37.5 30.6 Ref
Cat(s) in goat stable Yes 34 35.4 58.8 6.3 1.5-25.8
No/unknown 62 64.6 35.5 Ref
Origin of � � � � � traw Abroad/unknown 59 61.5 49.2 5.0 1.3-19.6
No straw or domestic straw 37 38.5 35.1 Ref
Signs of vermin (mice, rats, birds) in roughage or litter during past 12 months Unknown 14 14.6 64.3 4.3 0.8-22.3
Known (yes or no) 82 85.4 40.2 Ref
Factors associated with Q fever on farm level with their frequency (N), prevalence (Prev), adjusted odds ratio (aOR) with corresponding 95% confidence interval(95% CI) in the final multivariable logistic model (96 farms; 43.1% positive farms based on total sample of 123 farms and 2,828 goats)
Schimmer et al. BMC Veterinary Research 2011, 7:81http://www.biomedcentral.com/1746-6148/7/81
Page 8 of 14
s
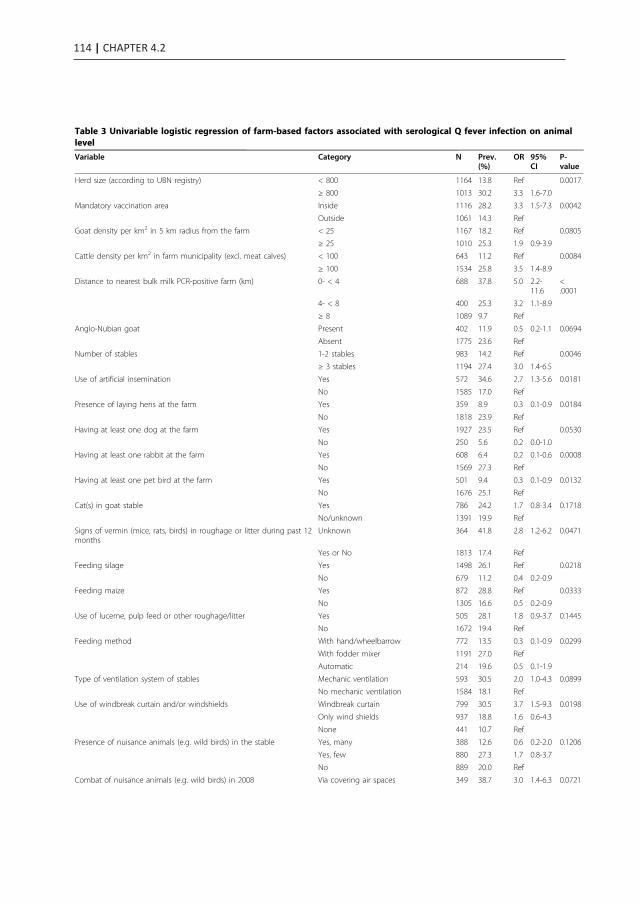
114 | CHAPTER 4.2
Table 3 Univariable logistic regression of farm-based factors associated with serological Q fever infection on animallevel
Variable Category N Prev.(%)
OR 95%CI
P-value
Herd size (according to UBN registry) < 800 1164 13.8 Ref 0.0017
≥ 800 1013 30.2 3.3 1.6-7.0
Mandatory vaccination area Inside 1116 28.2 3.3 1.5-7.3 0.0042
Outside 1061 14.3 Ref
Goat density per km2 in 5 km radius from the farm < 25 1167 18.2 Ref 0.0805
≥ 25 1010 25.3 1.9 0.9-3.9
Cattle density per km2 in farm municipality (excl. meat calves) < 100 643 11.2 Ref 0.0084
≥ 100 1534 25.8 3.5 1.4-8.9
Distance to nearest bulk milk PCR-positive farm (km) 0- < 4 688 37.8 5.0 2.2-11.6
<.0001
4- < 8 400 25.3 3.2 1.1-8.9
≥ 8 1089 9.7 Ref
Anglo-Nubian goat Present 402 11.9 0.5 0.2-1.1 0.0694
Absent 1775 23.6 Ref
Number of stables 1-2 stables 983 14.2 Ref 0.0046
≥ 3 stables 1194 27.4 3.0 1.4-6.5
Use of artificial insemination Yes 572 34.6 2.7 1.3-5.6 0.0181
No 1585 17.0 Ref
Presence of laying hens at the farm Yes 359 8.9 0.3 0.1-0.9 0.0184
No 1818 23.9 Ref
Having at least one dog at the farm Yes 1927 23.5 Ref 0.0530
No 250 5.6 0.2 0.0-1.0
Having at least one rabbit at the farm Yes 608 6.4 0.2 0.1-0.6 0.0008
No 1569 27.3 Ref
Having at least one pet bird at the farm Yes 501 9.4 0.3 0.1-0.9 0.0132
No 1676 25.1 Ref
Cat(s) in goat stable Yes 786 24.2 1.7 0.8-3.4 0.1718
No/unknown 1391 19.9 Ref
Signs of vermin (mice, rats, birds) in roughage or litter during past 12months
Unknown 364 41.8 2.8 1.2-6.2 0.0471
Yes or No 1813 17.4 Ref
Feeding silage Yes 1498 26.1 Ref 0.0218
No 679 11.2 0.4 0.2-0.9
Feeding maize Yes 872 28.8 Ref 0.0333
No 1305 16.6 0.5 0.2-0.9
Use of lucerne, pulp feed or other roughage/litter Yes 505 28.1 1.8 0.9-3.7 0.1445
No 1672 19.4 Ref
Feeding method With hand/wheelbarrow 772 13.5 0.3 0.1-0.9 0.0299
With fodder mixer 1191 27.0 Ref
Automatic 214 19.6 0.5 0.1-1.9
Type of ventilation system of stables Mechanic ventilation 593 30.5 2.0 1.0-4.3 0.0899
No mechanic ventilation 1584 18.1 Ref
Use of windbreak curtain and/or windshields Windbreak curtain 799 30.5 3.7 1.5-9.3 0.0198
Only wind shields 937 18.8 1.6 0.6-4.3
None 441 10.7 Ref
Presence of nuisance animals (e.g. wild birds) in the stable Yes, many 388 12.6 0.6 0.2-2.0 0.1206
Yes, few 880 27.3 1.7 0.8-3.7
No 889 20.0 Ref
Combat of nuisance animals (e.g. wild birds) in 2008 Via covering air spaces 349 38.7 3.0 1.4-6.3 0.0721
Schimmer et al. BMC Veterinary Research 2011, 7:81http://www.biomedcentral.com/1746-6148/7/81
Page 9 of 14
end of the lambing season in 2009 inside the vaccinationarea and in the beginning of the lambing season 2010outside the vaccination area, make it difficult to disen-tangle the possible effect of seasonal sampling on theobserved significant regional differences. We think thisstudy shows a true higher seroprevalence in the
mandatory vaccination area as it (1) confirms the signifi-cant difference already observed in 2008 in the south-eastern part of the country and (2) reflects the majorburden of human and veterinary clinical Q fever casesthat occurred in the south-eastern part of the country[1,2,10]. A distinction with ELISA between IgG phase 1
Table 3 Univariable logistic regression of farm-based factors associated with serological Q fever infection on animallevel (Continued)
Yes, only via other ways (e.g. capturecage)
274 21.2 1.3 0.4-4.3
Not applicable 1554 17.6 Ref
Spread of manure To other places/not applicable 352 30.7 2.1 1.0-4.7 0.1076
On farmland or near environment 1825 19.7 Ref
Lambing periods in 2009 ≤ 1 1351 15.6 Ref 0.0039
> 1 826 31.0 3.0 1.5-6.1
Percentage of aborting goats or goats with stillbirth in 2007-2009or known history of abortion wave due to Q fever since 2005
< 4% 1882 18.4 Ref 0.0251
≥ 4% 295 40.7 3.4 1.5-7.6
Type of � � � � � � �enure Completely closed 590 29.5 2.3 1.0-5.0 0.0898
Only closed for female goats 1217 16.1 Ref
Not closed 349 27.8 2.2 0.8-5.6
Provinces where supplied animals originated Provinces of Friesland and/orOverijssel
639 8.0 0.3 0.1-0.7 0.0028
Supply from other provinces or nosupply
1538 27.1 Ref
Factors associated with Q fever with their frequency (N), animal prevalence (Prev), odds ratio (OR), and 95% confidence intervals (95% CI) with P value of theunivariable generalized linear regression < 0.20 on animal level accounting for random herd effect (2,177 animals from 96 farms; 21.4% seropositive animals and43.1% positive farms based on total sample of 123 farms and 2,828 goats)
Table 4 Multivariable logistic regression of farm-based factors associated with serological Q fever infection on animallevel
Variable Category N (%) Prev(%)
aOR 95%CI
Distance to the nearest bulk milk PCR-positive farm (km) < 8 km 1088 50.0 33.2 3.2 1.4-7.3
≥ 8 km 1089 50.0 9.73 Ref
Cattle density per km2 in farm municipality (excl meat calves) < 100 643 29.5 11.2 Ref
≥ 100 1534 70.5 25.8 4.5 2.0-9.9
Combat of nuisance animals (e.g. wild birds) in 2008 Yes, by covering air spaces 349 16.0 38.7 3.7 1.8-7.9
By other ways or notapplicable
1828 84.0 18.2 Ref
Signs of vermin (mice, rats, birds) in roughage or litter during past 12months
Unknown 364 16.7 41.8 3.3 1.4-7.9
Known (yes or no) 1813 83.3 17.4 Ref
Cat(s) in goat stable Yes 786 36.1 24.2 2.6 1.2-5.6
No/unknown 1391 63.9 19.9 Ref
Use of windbreak curtain and/or windshields Windbreak curtain 799 36.7 30.5 2.8 1.2-6.7
Only wind shields 937 43.0 18.8 1.7 0.7-4.1
None 441 4.9 10.6 Ref
Artificial insemination Yes 572 26.3 34.6 2.3 1.2-4.7
No 1585 72.8 17.0
Factors associated with Q fever with their frequency (N), animal prevalence (Prev), adjusted odds ratio (aOR) with corresponding 95% confidence interval (95%CI) in the final multivariable model on animal level with random herd effect (2,177 animals from 96 farms; 21.4% positive animals; 43.1% positive farms based ontotal sample of 123 farms and 2,828 goats)
**within-farm variation accounts for 34.6% of non-explained variance
Schimmer et al. BMC Veterinary Research 2011, 7:81http://www.biomedcentral.com/1746-6148/7/81
Page 10 of 14
t
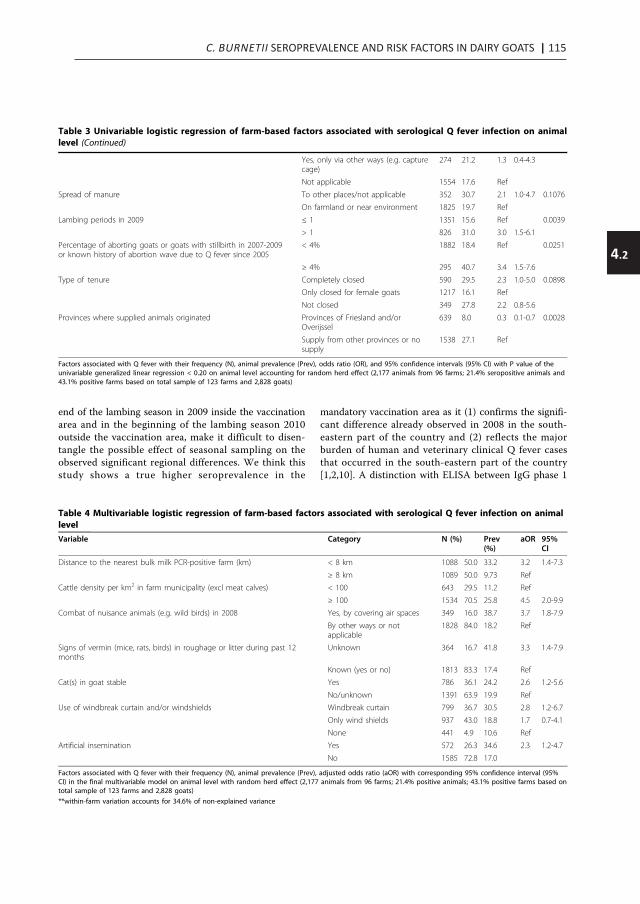
C. BURNETII SEROPREVALENCE AND RISK FACTORS IN DAIRY GOATS | 115
4.2
Table 3 Univariable logistic regression of farm-based factors associated with serological Q fever infection on animallevel
Variable Category N Prev.(%)
OR 95%CI
P-value
Herd size (according to UBN registry) < 800 1164 13.8 Ref 0.0017
≥ 800 1013 30.2 3.3 1.6-7.0
Mandatory vaccination area Inside 1116 28.2 3.3 1.5-7.3 0.0042
Outside 1061 14.3 Ref
Goat density per km2 in 5 km radius from the farm < 25 1167 18.2 Ref 0.0805
≥ 25 1010 25.3 1.9 0.9-3.9
Cattle density per km2 in farm municipality (excl. meat calves) < 100 643 11.2 Ref 0.0084
≥ 100 1534 25.8 3.5 1.4-8.9
Distance to nearest bulk milk PCR-positive farm (km) 0- < 4 688 37.8 5.0 2.2-11.6
<.0001
4- < 8 400 25.3 3.2 1.1-8.9
≥ 8 1089 9.7 Ref
Anglo-Nubian goat Present 402 11.9 0.5 0.2-1.1 0.0694
Absent 1775 23.6 Ref
Number of stables 1-2 stables 983 14.2 Ref 0.0046
≥ 3 stables 1194 27.4 3.0 1.4-6.5
Use of artificial insemination Yes 572 34.6 2.7 1.3-5.6 0.0181
No 1585 17.0 Ref
Presence of laying hens at the farm Yes 359 8.9 0.3 0.1-0.9 0.0184
No 1818 23.9 Ref
Having at least one dog at the farm Yes 1927 23.5 Ref 0.0530
No 250 5.6 0.2 0.0-1.0
Having at least one rabbit at the farm Yes 608 6.4 0.2 0.1-0.6 0.0008
No 1569 27.3 Ref
Having at least one pet bird at the farm Yes 501 9.4 0.3 0.1-0.9 0.0132
No 1676 25.1 Ref
Cat(s) in goat stable Yes 786 24.2 1.7 0.8-3.4 0.1718
No/unknown 1391 19.9 Ref
Signs of vermin (mice, rats, birds) in roughage or litter during past 12months
Unknown 364 41.8 2.8 1.2-6.2 0.0471
Yes or No 1813 17.4 Ref
Feeding silage Yes 1498 26.1 Ref 0.0218
No 679 11.2 0.4 0.2-0.9
Feeding maize Yes 872 28.8 Ref 0.0333
No 1305 16.6 0.5 0.2-0.9
Use of lucerne, pulp feed or other roughage/litter Yes 505 28.1 1.8 0.9-3.7 0.1445
No 1672 19.4 Ref
Feeding method With hand/wheelbarrow 772 13.5 0.3 0.1-0.9 0.0299
With fodder mixer 1191 27.0 Ref
Automatic 214 19.6 0.5 0.1-1.9
Type of ventilation system of stables Mechanic ventilation 593 30.5 2.0 1.0-4.3 0.0899
No mechanic ventilation 1584 18.1 Ref
Use of windbreak curtain and/or windshields Windbreak curtain 799 30.5 3.7 1.5-9.3 0.0198
Only wind shields 937 18.8 1.6 0.6-4.3
None 441 10.7 Ref
Presence of nuisance animals (e.g. wild birds) in the stable Yes, many 388 12.6 0.6 0.2-2.0 0.1206
Yes, few 880 27.3 1.7 0.8-3.7
No 889 20.0 Ref
Combat of nuisance animals (e.g. wild birds) in 2008 Via covering air spaces 349 38.7 3.0 1.4-6.3 0.0721
Schimmer et al. BMC Veterinary Research 2011, 7:81http://www.biomedcentral.com/1746-6148/7/81
Page 9 of 14
end of the lambing season in 2009 inside the vaccinationarea and in the beginning of the lambing season 2010outside the vaccination area, make it difficult to disen-tangle the possible effect of seasonal sampling on theobserved significant regional differences. We think thisstudy shows a true higher seroprevalence in the
mandatory vaccination area as it (1) confirms the signifi-cant difference already observed in 2008 in the south-eastern part of the country and (2) reflects the majorburden of human and veterinary clinical Q fever casesthat occurred in the south-eastern part of the country[1,2,10]. A distinction with ELISA between IgG phase 1
Table 3 Univariable logistic regression of farm-based factors associated with serological Q fever infection on animallevel (Continued)
Yes, only via other ways (e.g. capturecage)
274 21.2 1.3 0.4-4.3
Not applicable 1554 17.6 Ref
Spread of manure To other places/not applicable 352 30.7 2.1 1.0-4.7 0.1076
On farmland or near environment 1825 19.7 Ref
Lambing periods in 2009 ≤ 1 1351 15.6 Ref 0.0039
> 1 826 31.0 3.0 1.5-6.1
Percentage of aborting goats or goats with stillbirth in 2007-2009or known history of abortion wave due to Q fever since 2005
< 4% 1882 18.4 Ref 0.0251
≥ 4% 295 40.7 3.4 1.5-7.6
Type of � � � � � � �enure Completely closed 590 29.5 2.3 1.0-5.0 0.0898
Only closed for female goats 1217 16.1 Ref
Not closed 349 27.8 2.2 0.8-5.6
Provinces where supplied animals originated Provinces of Friesland and/orOverijssel
639 8.0 0.3 0.1-0.7 0.0028
Supply from other provinces or nosupply
1538 27.1 Ref
Factors associated with Q fever with their frequency (N), animal prevalence (Prev), odds ratio (OR), and 95% confidence intervals (95% CI) with P value of theunivariable generalized linear regression < 0.20 on animal level accounting for random herd effect (2,177 animals from 96 farms; 21.4% seropositive animals and43.1% positive farms based on total sample of 123 farms and 2,828 goats)
Table 4 Multivariable logistic regression of farm-based factors associated with serological Q fever infection on animallevel
Variable Category N (%) Prev(%)
aOR 95%CI
Distance to the nearest bulk milk PCR-positive farm (km) < 8 km 1088 50.0 33.2 3.2 1.4-7.3
≥ 8 km 1089 50.0 9.73 Ref
Cattle density per km2 in farm municipality (excl meat calves) < 100 643 29.5 11.2 Ref
≥ 100 1534 70.5 25.8 4.5 2.0-9.9
Combat of nuisance animals (e.g. wild birds) in 2008 Yes, by covering air spaces 349 16.0 38.7 3.7 1.8-7.9
By other ways or notapplicable
1828 84.0 18.2 Ref
Signs of vermin (mice, rats, birds) in roughage or litter during past 12months
Unknown 364 16.7 41.8 3.3 1.4-7.9
Known (yes or no) 1813 83.3 17.4 Ref
Cat(s) in goat stable Yes 786 36.1 24.2 2.6 1.2-5.6
No/unknown 1391 63.9 19.9 Ref
Use of windbreak curtain and/or windshields Windbreak curtain 799 36.7 30.5 2.8 1.2-6.7
Only wind shields 937 43.0 18.8 1.7 0.7-4.1
None 441 4.9 10.6 Ref
Artificial insemination Yes 572 26.3 34.6 2.3 1.2-4.7
No 1585 72.8 17.0
Factors associated with Q fever with their frequency (N), animal prevalence (Prev), adjusted odds ratio (aOR) with corresponding 95% confidence interval (95%CI) in the final multivariable model on animal level with random herd effect (2,177 animals from 96 farms; 21.4% positive animals; 43.1% positive farms based ontotal sample of 123 farms and 2,828 goats)
**within-farm variation accounts for 34.6% of non-explained variance
Schimmer et al. BMC Veterinary Research 2011, 7:81http://www.biomedcentral.com/1746-6148/7/81
Page 10 of 14
t

116 | CHAPTER 4.2
and 2 antibodies might have helped to distinguish morerecent infection and older infections in animals to assesssuch a sampling effect [22].Seroprevalence of C. burnetii in goats has been stu-
died in several countries [16]. Comparison should bedone with caution as study populations and study yearsvary and different serological assays with different per-formance are used [23,24]. The goat seroprevalence was8.8% in Albania [25] and 6.5% in Northern Greece [26].In Spain, the goat and farm prevalence was 8.7% and45%, respectively, based on ELISA [19] similar to resultsof a smaller study from Northern Ireland (goat seropre-valence 9.3%, farm prevalence 42.9%) [17], and in Sardi-nia in 1999-2002: goat prevalence 13% and farmprevalence 47% using an alternative criterion of two ormore seropositive animals per farm [18]. In our study,the farm seroprevalence was 38.2% (95%CI 29.6%-46.8%)using the same criterion, so only slightly lower thanwith at least one positive goat as criterion for a positivefarm. Clearly different goat prevalences were observedin Poland, with the absence of C. burnetii IgG phase 2antibodies in 918 goats from 48 herds [27] while highestimates were observed in Cyprus (48.2% in 420 ran-dom goats) [28] and in Gran Canaria island, Spain(60.4% in 733 goats) [29]. Ignoring these last exceptions,the overall goat prevalence of 21.4% observed in ourstudy was relatively high compared to other Europeanseroprevalence studies (6.5%-13%), while the farm preva-lence falls within the range of farm prevalences (43-47%)in other European countries. The within-herd preva-lence of 46.6% among the positive farms indicates strongcirculation of the bacterium within the herds, suggestingfarm conditions or practices favoring spread, such as arelatively large number of goats per farm, year-roundhousing in deep litter stables or reflects circulation of aunique efficiently spreading strain. In France, goat herdswith a within-herd prevalence over 40% had the highestproportion of shedder goats and highest averages ofshedding quantities as determined by real-time qPCR onvaginal swabs, representing a high risk level for environ-mental contamination and by that transmission withinfarms [20]. At about one quarter of the bulk milk PCR-negative farms, on average 37% of the goats tested sero-positive. This might be explained by the fact that not allseropositive goats shed the bacterium in milk and thatexcretion of the bacterium is intermittently [7,15].Besides, antibodies persist in goats [9], finding still posi-tive serology but no actual excretion of DNA which ismeasured in the bulk milk monitoring program.Considering the risk factors analyses, the exposure
information collected in the farm questionnaire is notnecessarily related to the relevant time period for sero-conversion as we do not know at what moment theactual infection with C. burnetii occurred in
serologically positive goats. However, since the medianage of tested goats was 2.3 years, and infections espe-cially occur during the first pregnancy of nulliparousgoats (between 1-2 years of age) it is plausible thatinfection in the majority of goats occurred during theperiods covered in the questionnaire. It is most likelythat goats on these farms get infected the same way ashumans, i.e. by inhalation of C. burnetii infected aero-sols [4], as indicated by the increased risk of a farmlocation within 8 km of a bulk milk-positive small rumi-nant farm. From literature we know that herd size andhigh farm and animal densities can augment the risk foracquisition of (respiratory) zoonoses, for example inswine diseases and avian influenza in poultry [30,31]. Inour study, we found that farms with more than 800goats had a higher risk to be positive than smallerfarms. This corresponds with Rupanner et al. whoobserved in the 1970s an increased infection risk ofgoats with C. burnetii with increasing herd size [32].Similar associations with herd size were found for Qfever in dairy cattle [17,33]. This can be explained by alarger population at risk, an increased risk of introduc-tion and transmission of pathogens within and betweenherds for instance by larger amounts of feed, animalsupply and more professionals working at or visiting thefarm. In addition, farm management practices or envir-onmental characteristics related to large farms but notcovered in our questionnaire might play a role in theobserved increased risk. As about 35% of the unex-plained variance in the model was explained by thefarm-effect, relevant underlying factors might have beenmissed. Therefore, an advice to limit the herd size with-out further changes in farm management does notnecessarily guarantee a reduction in infection risk. Arti-ficial insemination was an independent risk factor atanimal level and found to be related to farms with aherd size over 800 goats. Artificial insemination cantherefore be an indirect marker of farm managementpractices in larger farms that were not covered in thequestionnaire. From cattle studies, it is known thatviable C. burnetii is detected in semen of seropositivebulls indicating the possibility of sexual transmission[34]. Between 3000 and 4000 inseminations each yearare carried out by the main goat artificial insemination(AI) cooperative using fresh semen from the Nether-lands and frozen semen from French or Dutch origin.Since end of 2008, AI bucks are routinely screened forpresence of C. burnetii. In a targeted survey, so far, goatsemen samples from 300 bucks present on bulk milk-positive farms were all negative (personal communica-tion, P. Vellema, Animal Health Service). High cattledensity in the municipality where the farm was locatedwas also an independent risk factor, indicating the pre-sence of one or several cattle farms in the same
Schimmer et al. BMC Veterinary Research 2011, 7:81http://www.biomedcentral.com/1746-6148/7/81
Page 11 of 14
municipality as the goat farm. A recent review on C.burnetii infection in domestic ruminants suggested ahigher seroprevalence in cattle compared to goats andsheep [16]. In the Netherlands, a prevalence of bacterialDNA of 56.6% in cattle bulk tank milk was found ascompared to 24.4% bacterial DNA in goat bulk tankmilk among participating farms in our study, confirmingwidespread circulation of the bacterium among cattle[35]. However, an association with cattle density wasnot observed when the outcome variable ‘bulk milkPCR-positivity’ was used instead of ELISA-seropositivity(data not shown). Therefore, it is hypothesized that cat-tle especially played a role in the more historical infec-tions in goats, while spread between dairy goat herds isresponsible for the more recent infections and a largepart of the epidemic observed since 2007. The serologi-cal status of cattle and foremost comparison of C. bur-netii isolates by subtyping in different ruminant speciesmight help to elucidate the transmission pathwaysbetween different species of ruminants and to humans.So far, one unique genotype predominated in dairygoats herds, although at 50% of the farms at least oneadditional genotype was observed [36]. Very sparse dataon cattle isolates in the Netherlands suggest differentsubtypes from those found in goats, sheep and humans[37]. More and nationwide representative data areurgently needed to confirm these distinct types for cat-tle, and to study if some cattle types match with thenon-dominant genotypes regularly observed at dairygoat farms.Previous ruminant studies have shown that farm man-
agement practices can influence the seroprevalence of C.burnetii [17,38]. Straw, used widely as bedding in deeplitter stables, could be a way in which Q fever was intro-duced in the Dutch dairy goat farms as import of strawfrom abroad or unknown origin was an independentrisk factor. Farmers indicated straw was most oftenimported from Germany and France, which are endemiccountries for Q fever. Microbiological examination fromstraw originating from France showed presence of C.burnetii by PCR, although the method of sampling doesnot exclude contamination at the farm [39]. Contactwith straw and other farm products was also a risk fac-tor for humans in the first documented outbreak in2007 and in international outbreak studies [40-42]. Thepresence of dogs and cats in the goat stable was relatedto a seropositive Q fever status of dairy goat farms.Furthermore, the seven farms without companion ani-mals were all seronegative. This suggests introduction ofC. burnetii or facilitation of within farm-spread byinfected companion animals. In a study in Cyprus, riskfactors for Q fever abortions compared to abortions ofother causes were studied in a convenience sample ofruminant farms including only two goat farms; among
others presence of dogs and cats were on farm risk fac-tors [38]. Pets, especially during kidding, have beenassociated with outbreaks in the past [5,6]. In a Dutchstudy in the early 1990s, 13.2% of dogs and 10.4% ofcats tested positive for C. burnetii by ELISA [43]. Tostudy the role of companion animals in current trans-mission, an update of this study, ideally also looking atshedding by PCR, is needed.Covering airspaces in the stable to control nuisance
animals, such as wild birds, unexpectedly was an inde-pendent risk factor. As wild birds may play a role in thetransmission within and between farms and were thecause of a familial Q fever outbreak [44] a protectiveeffect was expected if any. However, presence of wildbirds in the stable was not a risk factor in the multivari-able analysis but mainly indicated the farmer activelycontrolled nuisance animals such as by covering air-spaces. In addition, we found at animal level anincreased risk for farms that use windbreak curtain,sometimes in combination with windshields. These tworisk factors could point at a more air-locked stable, facil-itating accumulation of C. burnetii inside the stable,which may promote spread within the herd. This accu-mulation risk was indirectly shown in the study fromCyprus where a high frequency of litter cleaning wasfound to be a protective factor [38]. Although a lessconfined farm might limit the within-herd spread, suchopen constructions can be a risk for aerosol spread toother farms and persons in the near environment. Pre-sence of mice and rats in the stable was not found to bea risk factor in our study, although a recent studyshowed presence of C. burnetii in rats at livestock farmsin the Netherlands [45]. Whether vermin are able tomaintain the transmission cycle and are able to (re)introduce Q fever at farms is currently underinvestigation.
ConclusionsThis study shows that before the start of mandatory vac-cination of small ruminants in 2009-2010, the seropre-valence of C. burnetii antibodies in goats at commercialdairy goat farms has increased compared to a study car-ried out in 2008 in the Netherlands. The overall goatprevalence of 21.4% was considerably high, but the farmprevalence of 43.1% was comparable to generallyobserved seroprevalences in other European countries.On positive dairy goat farms, the within-herd prevalencewas 46.6%, reflecting high circulation of C. burnetiiwithin a farm and a risk for environmental contamina-tion and spread. In general, the risk for farms and dairygoats to acquire a C. burnetii infection seems to be mul-tifactorial. The two strongest associated risk factors,proximity of bulk milk-positive small ruminant farmsand a high cattle density, suggest aerosol spread as an
Schimmer et al. BMC Veterinary Research 2011, 7:81http://www.biomedcentral.com/1746-6148/7/81
Page 12 of 14
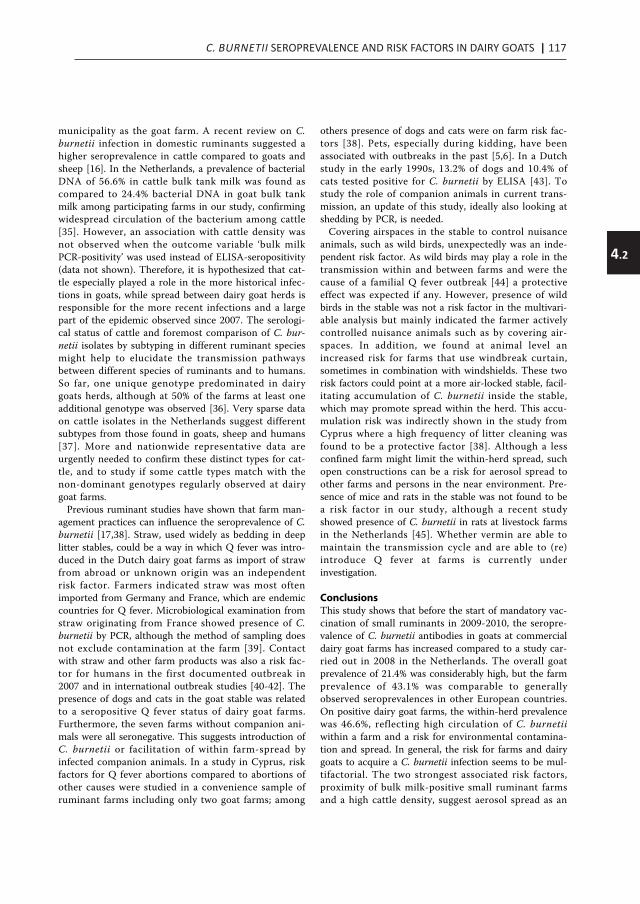
C. BURNETII SEROPREVALENCE AND RISK FACTORS IN DAIRY GOATS | 117
4.2
and 2 antibodies might have helped to distinguish morerecent infection and older infections in animals to assesssuch a sampling effect [22].Seroprevalence of C. burnetii in goats has been stu-
died in several countries [16]. Comparison should bedone with caution as study populations and study yearsvary and different serological assays with different per-formance are used [23,24]. The goat seroprevalence was8.8% in Albania [25] and 6.5% in Northern Greece [26].In Spain, the goat and farm prevalence was 8.7% and45%, respectively, based on ELISA [19] similar to resultsof a smaller study from Northern Ireland (goat seropre-valence 9.3%, farm prevalence 42.9%) [17], and in Sardi-nia in 1999-2002: goat prevalence 13% and farmprevalence 47% using an alternative criterion of two ormore seropositive animals per farm [18]. In our study,the farm seroprevalence was 38.2% (95%CI 29.6%-46.8%)using the same criterion, so only slightly lower thanwith at least one positive goat as criterion for a positivefarm. Clearly different goat prevalences were observedin Poland, with the absence of C. burnetii IgG phase 2antibodies in 918 goats from 48 herds [27] while highestimates were observed in Cyprus (48.2% in 420 ran-dom goats) [28] and in Gran Canaria island, Spain(60.4% in 733 goats) [29]. Ignoring these last exceptions,the overall goat prevalence of 21.4% observed in ourstudy was relatively high compared to other Europeanseroprevalence studies (6.5%-13%), while the farm preva-lence falls within the range of farm prevalences (43-47%)in other European countries. The within-herd preva-lence of 46.6% among the positive farms indicates strongcirculation of the bacterium within the herds, suggestingfarm conditions or practices favoring spread, such as arelatively large number of goats per farm, year-roundhousing in deep litter stables or reflects circulation of aunique efficiently spreading strain. In France, goat herdswith a within-herd prevalence over 40% had the highestproportion of shedder goats and highest averages ofshedding quantities as determined by real-time qPCR onvaginal swabs, representing a high risk level for environ-mental contamination and by that transmission withinfarms [20]. At about one quarter of the bulk milk PCR-negative farms, on average 37% of the goats tested sero-positive. This might be explained by the fact that not allseropositive goats shed the bacterium in milk and thatexcretion of the bacterium is intermittently [7,15].Besides, antibodies persist in goats [9], finding still posi-tive serology but no actual excretion of DNA which ismeasured in the bulk milk monitoring program.Considering the risk factors analyses, the exposure
information collected in the farm questionnaire is notnecessarily related to the relevant time period for sero-conversion as we do not know at what moment theactual infection with C. burnetii occurred in
serologically positive goats. However, since the medianage of tested goats was 2.3 years, and infections espe-cially occur during the first pregnancy of nulliparousgoats (between 1-2 years of age) it is plausible thatinfection in the majority of goats occurred during theperiods covered in the questionnaire. It is most likelythat goats on these farms get infected the same way ashumans, i.e. by inhalation of C. burnetii infected aero-sols [4], as indicated by the increased risk of a farmlocation within 8 km of a bulk milk-positive small rumi-nant farm. From literature we know that herd size andhigh farm and animal densities can augment the risk foracquisition of (respiratory) zoonoses, for example inswine diseases and avian influenza in poultry [30,31]. Inour study, we found that farms with more than 800goats had a higher risk to be positive than smallerfarms. This corresponds with Rupanner et al. whoobserved in the 1970s an increased infection risk ofgoats with C. burnetii with increasing herd size [32].Similar associations with herd size were found for Qfever in dairy cattle [17,33]. This can be explained by alarger population at risk, an increased risk of introduc-tion and transmission of pathogens within and betweenherds for instance by larger amounts of feed, animalsupply and more professionals working at or visiting thefarm. In addition, farm management practices or envir-onmental characteristics related to large farms but notcovered in our questionnaire might play a role in theobserved increased risk. As about 35% of the unex-plained variance in the model was explained by thefarm-effect, relevant underlying factors might have beenmissed. Therefore, an advice to limit the herd size with-out further changes in farm management does notnecessarily guarantee a reduction in infection risk. Arti-ficial insemination was an independent risk factor atanimal level and found to be related to farms with aherd size over 800 goats. Artificial insemination cantherefore be an indirect marker of farm managementpractices in larger farms that were not covered in thequestionnaire. From cattle studies, it is known thatviable C. burnetii is detected in semen of seropositivebulls indicating the possibility of sexual transmission[34]. Between 3000 and 4000 inseminations each yearare carried out by the main goat artificial insemination(AI) cooperative using fresh semen from the Nether-lands and frozen semen from French or Dutch origin.Since end of 2008, AI bucks are routinely screened forpresence of C. burnetii. In a targeted survey, so far, goatsemen samples from 300 bucks present on bulk milk-positive farms were all negative (personal communica-tion, P. Vellema, Animal Health Service). High cattledensity in the municipality where the farm was locatedwas also an independent risk factor, indicating the pre-sence of one or several cattle farms in the same
Schimmer et al. BMC Veterinary Research 2011, 7:81http://www.biomedcentral.com/1746-6148/7/81
Page 11 of 14
municipality as the goat farm. A recent review on C.burnetii infection in domestic ruminants suggested ahigher seroprevalence in cattle compared to goats andsheep [16]. In the Netherlands, a prevalence of bacterialDNA of 56.6% in cattle bulk tank milk was found ascompared to 24.4% bacterial DNA in goat bulk tankmilk among participating farms in our study, confirmingwidespread circulation of the bacterium among cattle[35]. However, an association with cattle density wasnot observed when the outcome variable ‘bulk milkPCR-positivity’ was used instead of ELISA-seropositivity(data not shown). Therefore, it is hypothesized that cat-tle especially played a role in the more historical infec-tions in goats, while spread between dairy goat herds isresponsible for the more recent infections and a largepart of the epidemic observed since 2007. The serologi-cal status of cattle and foremost comparison of C. bur-netii isolates by subtyping in different ruminant speciesmight help to elucidate the transmission pathwaysbetween different species of ruminants and to humans.So far, one unique genotype predominated in dairygoats herds, although at 50% of the farms at least oneadditional genotype was observed [36]. Very sparse dataon cattle isolates in the Netherlands suggest differentsubtypes from those found in goats, sheep and humans[37]. More and nationwide representative data areurgently needed to confirm these distinct types for cat-tle, and to study if some cattle types match with thenon-dominant genotypes regularly observed at dairygoat farms.Previous ruminant studies have shown that farm man-
agement practices can influence the seroprevalence of C.burnetii [17,38]. Straw, used widely as bedding in deeplitter stables, could be a way in which Q fever was intro-duced in the Dutch dairy goat farms as import of strawfrom abroad or unknown origin was an independentrisk factor. Farmers indicated straw was most oftenimported from Germany and France, which are endemiccountries for Q fever. Microbiological examination fromstraw originating from France showed presence of C.burnetii by PCR, although the method of sampling doesnot exclude contamination at the farm [39]. Contactwith straw and other farm products was also a risk fac-tor for humans in the first documented outbreak in2007 and in international outbreak studies [40-42]. Thepresence of dogs and cats in the goat stable was relatedto a seropositive Q fever status of dairy goat farms.Furthermore, the seven farms without companion ani-mals were all seronegative. This suggests introduction ofC. burnetii or facilitation of within farm-spread byinfected companion animals. In a study in Cyprus, riskfactors for Q fever abortions compared to abortions ofother causes were studied in a convenience sample ofruminant farms including only two goat farms; among
others presence of dogs and cats were on farm risk fac-tors [38]. Pets, especially during kidding, have beenassociated with outbreaks in the past [5,6]. In a Dutchstudy in the early 1990s, 13.2% of dogs and 10.4% ofcats tested positive for C. burnetii by ELISA [43]. Tostudy the role of companion animals in current trans-mission, an update of this study, ideally also looking atshedding by PCR, is needed.Covering airspaces in the stable to control nuisance
animals, such as wild birds, unexpectedly was an inde-pendent risk factor. As wild birds may play a role in thetransmission within and between farms and were thecause of a familial Q fever outbreak [44] a protectiveeffect was expected if any. However, presence of wildbirds in the stable was not a risk factor in the multivari-able analysis but mainly indicated the farmer activelycontrolled nuisance animals such as by covering air-spaces. In addition, we found at animal level anincreased risk for farms that use windbreak curtain,sometimes in combination with windshields. These tworisk factors could point at a more air-locked stable, facil-itating accumulation of C. burnetii inside the stable,which may promote spread within the herd. This accu-mulation risk was indirectly shown in the study fromCyprus where a high frequency of litter cleaning wasfound to be a protective factor [38]. Although a lessconfined farm might limit the within-herd spread, suchopen constructions can be a risk for aerosol spread toother farms and persons in the near environment. Pre-sence of mice and rats in the stable was not found to bea risk factor in our study, although a recent studyshowed presence of C. burnetii in rats at livestock farmsin the Netherlands [45]. Whether vermin are able tomaintain the transmission cycle and are able to (re)introduce Q fever at farms is currently underinvestigation.
ConclusionsThis study shows that before the start of mandatory vac-cination of small ruminants in 2009-2010, the seropre-valence of C. burnetii antibodies in goats at commercialdairy goat farms has increased compared to a study car-ried out in 2008 in the Netherlands. The overall goatprevalence of 21.4% was considerably high, but the farmprevalence of 43.1% was comparable to generallyobserved seroprevalences in other European countries.On positive dairy goat farms, the within-herd prevalencewas 46.6%, reflecting high circulation of C. burnetiiwithin a farm and a risk for environmental contamina-tion and spread. In general, the risk for farms and dairygoats to acquire a C. burnetii infection seems to be mul-tifactorial. The two strongest associated risk factors,proximity of bulk milk-positive small ruminant farmsand a high cattle density, suggest aerosol spread as an
Schimmer et al. BMC Veterinary Research 2011, 7:81http://www.biomedcentral.com/1746-6148/7/81
Page 12 of 14
118 | CHAPTER 4.2
important route of infection of the dairy goat farms.Furthermore, other risk factors identified possible vehi-cles for introduction, spreading and/or persistencewithin farms, such as import of straw from abroad,access to the goat stable of cats, dogs and use of artifi-cial insemination, and covering airspaces of the stable.Besides, larger farms with 800 or more goats seem tohave an increased risk for infection, although it can notbe concluded that this is entirely due to the size itselfby the larger population at risk, combined with a gen-eral increased chance of introduction of pathogens inlarger farms or is due to unmeasured farm characteris-tics strongly related to a large herd size. Based on ourresults, it is recommended to further prove the role inthe current transmission of bedding material, goatsemen and excreta from companion animals by micro-biological testing. Simultaneously, as a precautionarymeasure general biosecurity measures should be takennext to advice on farm stable constructions targeted atavoiding access of companion animals and how to con-trol nuisance animals in the goat stables to preventintroduction and minimizing airborne transmission fromaffected farms to prevent spread to humans and otherfarms.
AcknowledgementsFinancial support for this research study was provided by the NetherlandsOrganisation for Health Research and Development ZonMW. We thank allveterinary practitioners that helped in the collection of goat serum samples,Helen Aangenend and Anke Lenferink from the Academic CollaborativeCentre AMPHI for mailing and phoning the farmers for data collection;Sanne Kelderman from the Animal Health Service for her help by theinvitation mailings and providing reference data; René van den Brom fromthe Animal Health Service for his comments on the questionnaire and BenBom for generating the geographical data and compiling Figure 2 usingSTATLINE and ArcGis. We thank all expert members and their affiliatedorganisations of the multidisciplinary QVIVE project group (Jan van de Bergh,Olaf Stenvers and Rob van Oosterom of the Dutch Food and ConsumerProduct Safety Authority, Mark Paauw of the Southern Agriculture andHorticulture Organisation, Harry Stinis of the Netherlands Centre forOccupational Diseases, Ad de Rooij, occupational physician at Stigas MargoVonk of the Product Boards for Livestock, Meat and Eggs, ClementineWijkmans of the Academic Collaborative Centre AMPHI and chair of thenational consultation of infectious disease control, Peter Schneeberger of theJeroen Bosch Hospital, Bart van Rotterdam and Wim van der Hoek of theCentre for Infectious Disease Control of the RIVM) for their advice in thestudy design, interpretation and feedback of the results.
Author details1Centre for Infectious Disease Control, National Institute for Public Healthand the Environment, Bilthoven, the Netherlands. 2Quantitative VeterinaryEpidemiology Group, Wageningen Institute of Animal Sciences, WageningenUniversity, Wageningen, The Netherlands. 3Department of Small RuminantHealth, Animal Health Service, Deventer, The Netherlands. 4AcademicCollaborative Centre AMPHI, Department of Primary and Community Care,Radboud University Nijmegen Medical Centre, the Netherlands.
Authors’ contributionsThe study idea was conceived by BS and YD together with the Q-VIVEresearch group. BS, YD and PV participated in the design of the study. JHand YD participated in the acquisition of the data and coordinated logistics.PV provided previously acquired reference data. BS, SL, EG and YD carried
out the statistical analysis. Data interpretation was done by all authors. BSand SL drafted the manuscript. All authors contributed to the critical revisionof the manuscript for important intellectual content and have seen andapproved the final draft.
Competing interestsThe authors declare that they have no competing interests.
Received: 19 June 2011 Accepted: 30 December 2011Published: 30 December 2011
References1. Schimmer B, Dijkstra F, Vellema P, Schneeberger PM, Hackert V, ter
Schegget R, Wijkmans C, van Duynhoven Y, van der Hoek W: Sustainedintensive transmission of Q fever in the south of the Netherlands, 2009.Euro Surveill 2009, 14(19):pii = 19210.
2. van der Hoek W, Dijkstra F, Schimmer B, Schneeberger PM, Vellema P,Wijkmans C, ter Schegget R, Hackert V, van Duynhoven Y: Q fever in theNetherlands: an update on the epidemiology and control measures. EuroSurveill 2010, 15(12):pii = 19520.
3. Tissot-Dupont H, Amadei MA, Nezri M, Raoult D: Wind in November, Qfever in December. Emerg Infect Dis 2004, 10:1264-1269.
4. Maurin M, Raoult D: Q fever. Clin Microbiol Rev 1999, 12:518-553.5. Buhariwalla F, Cann B, Marrie TJ: A dog-related outbreak of Q fever. Clin
Infect Dis 1996, 23:753-755.6. Marrie TJ, Durant H, Williams JC, Mintz E, Waag DM: Exposure to parturient
cats: a risk factor for acquisition of Q fever in Maritime Canada. J InfectDis 1988, 158:101-108.
7. Rodolakis A, Berri M, Hechard C, Caudron C, Souriau A, Bodier CC,Blanchard B, Camuset P, Devillechaise P, Natorp JC, et al: Comparison ofCoxiella burnetii shedding in milk of dairy bovine, caprine, and ovineherds. J Dairy Sci 2007, 90:5352-5360.
8. Wouda W, Dercksen DP: [Abortion and stillbirth among dairy goats as aconsequence of Coxiella burnetii]. Tijdschr Diergeneeskd 2007, 132:908-911.
9. Hatchette T, Campbell N, Hudson R, Raoult D, Marrie TJ: Natural history ofQ fever in goats. Vector Borne Zoonotic Dis 2003, 3:11-15.
10. Roest HI, Tilburg JJ, van der Hoek W, Vellema P, van Zijderveld FG,Klaassen CH, Raoult D: The Q fever epidemic in The Netherlands: history,onset, response and reflection. Epidemiol Infect 2011, 139:1-12.
11. StatLine database. [http://statline.cbs.nl].12. van den Brom R, Vellema P: Q fever outbreaks in small ruminants and
people in the Netherlands. Small Rum Res 2009, 86:74-79.13. Hogerwerf L, van den Brom R, Roest HI, Bouma A, Vellema P, Pieterse M,
Dercksen D, Nielen M: Reduction of Coxiella burnetii prevalence byvaccination of goats and sheep, The Netherlands. Emerg Infect Dis 2011,17:379-386.
14. Food and Consumer Product Safety Authority: Address locations ofQ fever infected small ruminant farms. [http://www.vwa.nl/onderwerpen/dierziekten/dossier/q-koorts/kaart-met-overzicht-van-besmette-bedrijven].
15. Rousset E, Berri M, Durand B, Dufour P, Prigent M, Delcroix T, Touratier A,Rodolakis A: Coxiella burnetii shedding routes and antibody responseafter outbreaks of Q fever-induced abortion in dairy goat herds. ApplEnviron Microbiol 2009, 75:428-433.
16. Guatteo R, Seegers H, Taurel AF, Joly A, Beaudeau F: Prevalence of Coxiellaburnetii infection in domestic ruminants: a critical review. Vet Microbiol2011, 149:1-16.
17. McCaughey C, Murray LJ, McKenna JP, Menzies FD, McCullough SJ,O’Neill HJ, Wyatt DE, Cardwell CR, Coyle PV: Coxiella burnetii (Q fever)seroprevalence in cattle. Epidemiol Infect 2010, 138:21-27.
18. Masala G, Porcu R, Sanna G, Chessa G, Cillara G, Chisu V, Tola S:Occurrence, distribution, and role in abortion of Coxiella burnetii insheep and goats in Sardinia, Italy. Vet Microbiol 2004, 99:301-305.
19. Ruiz-Fons F, Astobiza I, Barandika JF, Hurtado A, Atxaerandio R, Juste RA,Garcia-Perez AL: Seroepidemiological study of Q fever in domesticruminants in semi-extensive grazing systems. BMC Vet Res 2010, 6:3.
20. Dubuc-Forfait C, Prigent M, Delcont A, Champion JL, Marois M, Kouji M,Dufour P, Sidi-Boumedine K, Rousset E: Evaluation of Coxiella burnetiitransmission risk levels in goat herds without apparent Q fever (P067)[abstract]. Proceedings of the 6th International Meeting on Rickettsia andRickettsial Diseases 2011.
Schimmer et al. BMC Veterinary Research 2011, 7:81http://www.biomedcentral.com/1746-6148/7/81
Page 13 of 14
21. Ryan ED, Kirby M, Collins DM, Sayers R, Mee JF, Clegg T: Prevalence ofCoxiella burnetii (Q fever) antibodies in bovine serum and bulk-milksamples. Epidemiol Infect 2010, 1-5.
22. Hatchette T, Campbell N, Whitney H, Hudson R, Marrie TJ: Seroprevalenceof Coxiella burnetii in selected populations of domestic ruminants inNewfoundland. Can Vet J 2002, 43:363-364.
23. Kittelberger R, Mars J, Wibberley G, Sting R, Henning K, Horner GW,Garnett KM, Hannah MJ, Jenner JA, Piggott CJ, et al: Comparison of the Q-fever complement fixation test and two commercial enzyme-linkedimmunosorbent assays for the detection of serum antibodies againstCoxiella burnetti (Q-fever) in ruminants: recommendations for use ofserological tests on imported animals in New Zealand. N Z Vet J 2009,57:262-268.
24. Rousset E, Durand B, Berri M, Dufour P, Prigent M, Russo P, Delcroix T,Touratier A, Rodolakis A, Aubert M: Comparative diagnostic potential ofthree serological tests for abortive Q fever in goat herds. Vet Microbiol2007, 124:286-297.
25. Cekani M, Papa A, Kota M, Velo E, Berxholi K: Report of a serological studyof Coxiella burnetii in domestic animals in Albania. Vet J 2008,175:276-278.
26. Pape M, Bouzalas EG, Koptopoulos GS, Mandraveli K, Arvanitidou-Vagiona M, Nikolaidis P, Alexiou-Daniel S: The serological prevalence ofCoxiella burnetii antibodies in sheep and goats in northern Greece. ClinMicrobiol Infect 2009, 15(Suppl 2):146-147.
27. Czopowicz M, Kaba J, Szalus-Jordanow O, Nowicki M, Witkowski L,Nowicka D, Frymus T: Prevalence of antibodies against Chlamydophilaabortus and Coxiella burnetii in goat herds in Poland. Pol J Vet Sci 2010,13:175-179.
28. Psaroulaki A, Hadjichristodoulou C, Loukaides F, Soteriades E,Konstantinidis A, Papastergiou P, Ioannidou MC, Tselentis Y:Epidemiological study of Q fever in humans, ruminant animals, and ticksin Cyprus using a geographical information system. Eur J Clin MicrobiolInfect Dis 2006, 25:576-586.
29. Rodriquez NF, Carranza C, Bolanos M, Perez-Arellano JL, Gutierrez C:Seroprevalence of Coxiella burnetii in domestic ruminants in GranCanaria island, Spain. Transbound Emerg Dis 2010, 57:66-67.
30. Gardner IA, Willeberg P, Mousing J: Empirical and theoretical evidence forherd size as a risk factor for swine diseases. Anim Health Res Rev 2002,3:43-55.
31. Boender GJ, Meester R, Gies E, de Jong MCM: The local threshold forgeographical spread of infectious diseases between farms. Prev Vet Med2007, 82:90-101.
32. Ruppanner R, Riemann HP, Farver TB, West G, Behymer DE, Wijayasinghe C:Prevalence of Coxiella burnetii (Q fever) and Toxoplasma gondii amongdairy goats in California. Am J Vet Res 1978, 39:867-870.
33. Agger JF, Christoffersen AB, Rattenborg E, Nielsen J, Agerholm JS:Prevalence of Coxiella burnetii antibodies in Danish dairy herds. Acta VetScand 2010, 52:5.
34. Kruszewska D, Tylewska-Wierzbanowska S: Isolation of Coxiella burnetiifrom bull semen. Res Vet Sci 1997, 62:299-300.
35. Muskens J, van Engelen E, van Maanen C, Bartels C, Lam TJ: Prevalence ofCoxiella burnetii infection in Dutch dairy herds based on testing bulktank milk and individual samples by PCR and ELISA. Vet Rec 2011, 168:79.
36. Roest HI, Ruuls RC, Tilburg JJ, Nabuurs-Franssen MH, Klaassen CH, Vellema P,van den Brom R, Dercksen D, Wouda W, Spierenburg MA, et al: Molecularepidemiology of Coxiella burnetii from ruminants in Q fever outbreak,the Netherlands. Emerg Infect Dis 2011, 17:668-675.
37. Huijsmans CJ, Schellekens JJ, Wever PC, Toman R, Savelkoul PH, Janse I,Hermans MH: Single-nucleotide-polymorphism genotyping of Coxiellaburnetii during a Q fever outbreak in The Netherlands. Appl EnvironMicrobiol 2011, 77:2051-2057.
38. Cantas H, Muwonge A, Sareyyupoglu B, Yardimci H, Skjerve E: Q feverabortions in ruminants and associated on-farm risk factors in northernCyprus. BMC Vet Res 2011, 7:13.
39. Wever PC, van Hannen EJ, Schellekens JJ, van Lokven JW, Schneeberger P,Zaaijer HL, Hermans MH: Detection of Coxiella burnetii DNA in veterinarysamples and supermarket dairy products using routine hospitaldeveloped real-time PCR techniques. [abstract]. Ned Tijdschr MedMicrobiol 2010, 18(Suppl):s74.
40. Karagiannis I, Schimmer B, van Lier A, Timen A, Schneeberger P, vanRotterdam B, de Bruin A, Wijkmans C, Rietveld A, van Duynhoven Y:
Investigation of a Q fever outbreak in a rural area of The Netherlands.Epidemiol Infect 2009, 137:1283-1294.
41. Salmon MM, Howells B, Glencross EJ, Evans AD, Palmer SR: Q fever in anurban area. Lancet 1982, 1:1002-1004.
42. Van Woerden HC, Mason BW, Nehaul LK, Smith R, Salmon RL, Healy B,Valappil M, Westmoreland D, de Martin S, Evans MR, et al: Q fever outbreakin industrial setting. Emerg Infect Dis 2004, 10:1282-1289.
43. Houwers DJ, van der Meer M, van Dijk AA, Ossewaarde JM: Prevalence ofinfections with C. burnetii in dogs and cats in the Netherlands and the centralregion of the Netherlands, 1991-1992. Research report 91-102. Utrecht 1992.
44. Stein A, Raoult D: Pigeon pneumonia in provence: a bird-borne Q feveroutbreak. Clin Infect Dis 1999, 29:617-620.
45. Reusken C, van der Plaats R, Opsteegh M, de Bruin A, Swart A: Coxiellaburnetii (Q fever) in Rattus norvegicus and Rattus rattus at livestock farmsand urban locations in the Netherlands; could Rattus spp. representreservoirs for (re)introduction? Prev Vet Med 2011, 101:124-130.
doi:10.1186/1746-6148-7-81Cite this article as: Schimmer et al.: Seroprevalence and risk factors of Qfever in goats on commercial dairy goat farms in the Netherlands,2009-2010. BMC Veterinary Research 2011 7:81.
Submit your next manuscript to BioMed Centraland take full advantage of:
• Convenient online submission
• Thorough peer review
• No space constraints or color figure charges
• Immediate publication on acceptance
• Inclusion in PubMed, CAS, Scopus and Google Scholar
• Research which is freely available for redistribution
Submit your manuscript at www.biomedcentral.com/submit
Schimmer et al. BMC Veterinary Research 2011, 7:81http://www.biomedcentral.com/1746-6148/7/81
Page 14 of 14
C. BURNETII SEROPREVALENCE AND RISK FACTORS IN DAIRY GOATS | 119
4.2
important route of infection of the dairy goat farms.Furthermore, other risk factors identified possible vehi-cles for introduction, spreading and/or persistencewithin farms, such as import of straw from abroad,access to the goat stable of cats, dogs and use of artifi-cial insemination, and covering airspaces of the stable.Besides, larger farms with 800 or more goats seem tohave an increased risk for infection, although it can notbe concluded that this is entirely due to the size itselfby the larger population at risk, combined with a gen-eral increased chance of introduction of pathogens inlarger farms or is due to unmeasured farm characteris-tics strongly related to a large herd size. Based on ourresults, it is recommended to further prove the role inthe current transmission of bedding material, goatsemen and excreta from companion animals by micro-biological testing. Simultaneously, as a precautionarymeasure general biosecurity measures should be takennext to advice on farm stable constructions targeted atavoiding access of companion animals and how to con-trol nuisance animals in the goat stables to preventintroduction and minimizing airborne transmission fromaffected farms to prevent spread to humans and otherfarms.
AcknowledgementsFinancial support for this research study was provided by the NetherlandsOrganisation for Health Research and Development ZonMW. We thank allveterinary practitioners that helped in the collection of goat serum samples,Helen Aangenend and Anke Lenferink from the Academic CollaborativeCentre AMPHI for mailing and phoning the farmers for data collection;Sanne Kelderman from the Animal Health Service for her help by theinvitation mailings and providing reference data; René van den Brom fromthe Animal Health Service for his comments on the questionnaire and BenBom for generating the geographical data and compiling Figure 2 usingSTATLINE and ArcGis. We thank all expert members and their affiliatedorganisations of the multidisciplinary QVIVE project group (Jan van de Bergh,Olaf Stenvers and Rob van Oosterom of the Dutch Food and ConsumerProduct Safety Authority, Mark Paauw of the Southern Agriculture andHorticulture Organisation, Harry Stinis of the Netherlands Centre forOccupational Diseases, Ad de Rooij, occupational physician at Stigas MargoVonk of the Product Boards for Livestock, Meat and Eggs, ClementineWijkmans of the Academic Collaborative Centre AMPHI and chair of thenational consultation of infectious disease control, Peter Schneeberger of theJeroen Bosch Hospital, Bart van Rotterdam and Wim van der Hoek of theCentre for Infectious Disease Control of the RIVM) for their advice in thestudy design, interpretation and feedback of the results.
Author details1Centre for Infectious Disease Control, National Institute for Public Healthand the Environment, Bilthoven, the Netherlands. 2Quantitative VeterinaryEpidemiology Group, Wageningen Institute of Animal Sciences, WageningenUniversity, Wageningen, The Netherlands. 3Department of Small RuminantHealth, Animal Health Service, Deventer, The Netherlands. 4AcademicCollaborative Centre AMPHI, Department of Primary and Community Care,Radboud University Nijmegen Medical Centre, the Netherlands.
Authors’ contributionsThe study idea was conceived by BS and YD together with the Q-VIVEresearch group. BS, YD and PV participated in the design of the study. JHand YD participated in the acquisition of the data and coordinated logistics.PV provided previously acquired reference data. BS, SL, EG and YD carried
out the statistical analysis. Data interpretation was done by all authors. BSand SL drafted the manuscript. All authors contributed to the critical revisionof the manuscript for important intellectual content and have seen andapproved the final draft.
Competing interestsThe authors declare that they have no competing interests.
Received: 19 June 2011 Accepted: 30 December 2011Published: 30 December 2011
References1. Schimmer B, Dijkstra F, Vellema P, Schneeberger PM, Hackert V, ter
Schegget R, Wijkmans C, van Duynhoven Y, van der Hoek W: Sustainedintensive transmission of Q fever in the south of the Netherlands, 2009.Euro Surveill 2009, 14(19):pii = 19210.
2. van der Hoek W, Dijkstra F, Schimmer B, Schneeberger PM, Vellema P,Wijkmans C, ter Schegget R, Hackert V, van Duynhoven Y: Q fever in theNetherlands: an update on the epidemiology and control measures. EuroSurveill 2010, 15(12):pii = 19520.
3. Tissot-Dupont H, Amadei MA, Nezri M, Raoult D: Wind in November, Qfever in December. Emerg Infect Dis 2004, 10:1264-1269.
4. Maurin M, Raoult D: Q fever. Clin Microbiol Rev 1999, 12:518-553.5. Buhariwalla F, Cann B, Marrie TJ: A dog-related outbreak of Q fever. Clin
Infect Dis 1996, 23:753-755.6. Marrie TJ, Durant H, Williams JC, Mintz E, Waag DM: Exposure to parturient
cats: a risk factor for acquisition of Q fever in Maritime Canada. J InfectDis 1988, 158:101-108.
7. Rodolakis A, Berri M, Hechard C, Caudron C, Souriau A, Bodier CC,Blanchard B, Camuset P, Devillechaise P, Natorp JC, et al: Comparison ofCoxiella burnetii shedding in milk of dairy bovine, caprine, and ovineherds. J Dairy Sci 2007, 90:5352-5360.
8. Wouda W, Dercksen DP: [Abortion and stillbirth among dairy goats as aconsequence of Coxiella burnetii]. Tijdschr Diergeneeskd 2007, 132:908-911.
9. Hatchette T, Campbell N, Hudson R, Raoult D, Marrie TJ: Natural history ofQ fever in goats. Vector Borne Zoonotic Dis 2003, 3:11-15.
10. Roest HI, Tilburg JJ, van der Hoek W, Vellema P, van Zijderveld FG,Klaassen CH, Raoult D: The Q fever epidemic in The Netherlands: history,onset, response and reflection. Epidemiol Infect 2011, 139:1-12.
11. StatLine database. [http://statline.cbs.nl].12. van den Brom R, Vellema P: Q fever outbreaks in small ruminants and
people in the Netherlands. Small Rum Res 2009, 86:74-79.13. Hogerwerf L, van den Brom R, Roest HI, Bouma A, Vellema P, Pieterse M,
Dercksen D, Nielen M: Reduction of Coxiella burnetii prevalence byvaccination of goats and sheep, The Netherlands. Emerg Infect Dis 2011,17:379-386.
14. Food and Consumer Product Safety Authority: Address locations ofQ fever infected small ruminant farms. [http://www.vwa.nl/onderwerpen/dierziekten/dossier/q-koorts/kaart-met-overzicht-van-besmette-bedrijven].
15. Rousset E, Berri M, Durand B, Dufour P, Prigent M, Delcroix T, Touratier A,Rodolakis A: Coxiella burnetii shedding routes and antibody responseafter outbreaks of Q fever-induced abortion in dairy goat herds. ApplEnviron Microbiol 2009, 75:428-433.
16. Guatteo R, Seegers H, Taurel AF, Joly A, Beaudeau F: Prevalence of Coxiellaburnetii infection in domestic ruminants: a critical review. Vet Microbiol2011, 149:1-16.
17. McCaughey C, Murray LJ, McKenna JP, Menzies FD, McCullough SJ,O’Neill HJ, Wyatt DE, Cardwell CR, Coyle PV: Coxiella burnetii (Q fever)seroprevalence in cattle. Epidemiol Infect 2010, 138:21-27.
18. Masala G, Porcu R, Sanna G, Chessa G, Cillara G, Chisu V, Tola S:Occurrence, distribution, and role in abortion of Coxiella burnetii insheep and goats in Sardinia, Italy. Vet Microbiol 2004, 99:301-305.
19. Ruiz-Fons F, Astobiza I, Barandika JF, Hurtado A, Atxaerandio R, Juste RA,Garcia-Perez AL: Seroepidemiological study of Q fever in domesticruminants in semi-extensive grazing systems. BMC Vet Res 2010, 6:3.
20. Dubuc-Forfait C, Prigent M, Delcont A, Champion JL, Marois M, Kouji M,Dufour P, Sidi-Boumedine K, Rousset E: Evaluation of Coxiella burnetiitransmission risk levels in goat herds without apparent Q fever (P067)[abstract]. Proceedings of the 6th International Meeting on Rickettsia andRickettsial Diseases 2011.
Schimmer et al. BMC Veterinary Research 2011, 7:81http://www.biomedcentral.com/1746-6148/7/81
Page 13 of 14
21. Ryan ED, Kirby M, Collins DM, Sayers R, Mee JF, Clegg T: Prevalence ofCoxiella burnetii (Q fever) antibodies in bovine serum and bulk-milksamples. Epidemiol Infect 2010, 1-5.
22. Hatchette T, Campbell N, Whitney H, Hudson R, Marrie TJ: Seroprevalenceof Coxiella burnetii in selected populations of domestic ruminants inNewfoundland. Can Vet J 2002, 43:363-364.
23. Kittelberger R, Mars J, Wibberley G, Sting R, Henning K, Horner GW,Garnett KM, Hannah MJ, Jenner JA, Piggott CJ, et al: Comparison of the Q-fever complement fixation test and two commercial enzyme-linkedimmunosorbent assays for the detection of serum antibodies againstCoxiella burnetti (Q-fever) in ruminants: recommendations for use ofserological tests on imported animals in New Zealand. N Z Vet J 2009,57:262-268.
24. Rousset E, Durand B, Berri M, Dufour P, Prigent M, Russo P, Delcroix T,Touratier A, Rodolakis A, Aubert M: Comparative diagnostic potential ofthree serological tests for abortive Q fever in goat herds. Vet Microbiol2007, 124:286-297.
25. Cekani M, Papa A, Kota M, Velo E, Berxholi K: Report of a serological studyof Coxiella burnetii in domestic animals in Albania. Vet J 2008,175:276-278.
26. Pape M, Bouzalas EG, Koptopoulos GS, Mandraveli K, Arvanitidou-Vagiona M, Nikolaidis P, Alexiou-Daniel S: The serological prevalence ofCoxiella burnetii antibodies in sheep and goats in northern Greece. ClinMicrobiol Infect 2009, 15(Suppl 2):146-147.
27. Czopowicz M, Kaba J, Szalus-Jordanow O, Nowicki M, Witkowski L,Nowicka D, Frymus T: Prevalence of antibodies against Chlamydophilaabortus and Coxiella burnetii in goat herds in Poland. Pol J Vet Sci 2010,13:175-179.
28. Psaroulaki A, Hadjichristodoulou C, Loukaides F, Soteriades E,Konstantinidis A, Papastergiou P, Ioannidou MC, Tselentis Y:Epidemiological study of Q fever in humans, ruminant animals, and ticksin Cyprus using a geographical information system. Eur J Clin MicrobiolInfect Dis 2006, 25:576-586.
29. Rodriquez NF, Carranza C, Bolanos M, Perez-Arellano JL, Gutierrez C:Seroprevalence of Coxiella burnetii in domestic ruminants in GranCanaria island, Spain. Transbound Emerg Dis 2010, 57:66-67.
30. Gardner IA, Willeberg P, Mousing J: Empirical and theoretical evidence forherd size as a risk factor for swine diseases. Anim Health Res Rev 2002,3:43-55.
31. Boender GJ, Meester R, Gies E, de Jong MCM: The local threshold forgeographical spread of infectious diseases between farms. Prev Vet Med2007, 82:90-101.
32. Ruppanner R, Riemann HP, Farver TB, West G, Behymer DE, Wijayasinghe C:Prevalence of Coxiella burnetii (Q fever) and Toxoplasma gondii amongdairy goats in California. Am J Vet Res 1978, 39:867-870.
33. Agger JF, Christoffersen AB, Rattenborg E, Nielsen J, Agerholm JS:Prevalence of Coxiella burnetii antibodies in Danish dairy herds. Acta VetScand 2010, 52:5.
34. Kruszewska D, Tylewska-Wierzbanowska S: Isolation of Coxiella burnetiifrom bull semen. Res Vet Sci 1997, 62:299-300.
35. Muskens J, van Engelen E, van Maanen C, Bartels C, Lam TJ: Prevalence ofCoxiella burnetii infection in Dutch dairy herds based on testing bulktank milk and individual samples by PCR and ELISA. Vet Rec 2011, 168:79.
36. Roest HI, Ruuls RC, Tilburg JJ, Nabuurs-Franssen MH, Klaassen CH, Vellema P,van den Brom R, Dercksen D, Wouda W, Spierenburg MA, et al: Molecularepidemiology of Coxiella burnetii from ruminants in Q fever outbreak,the Netherlands. Emerg Infect Dis 2011, 17:668-675.
37. Huijsmans CJ, Schellekens JJ, Wever PC, Toman R, Savelkoul PH, Janse I,Hermans MH: Single-nucleotide-polymorphism genotyping of Coxiellaburnetii during a Q fever outbreak in The Netherlands. Appl EnvironMicrobiol 2011, 77:2051-2057.
38. Cantas H, Muwonge A, Sareyyupoglu B, Yardimci H, Skjerve E: Q feverabortions in ruminants and associated on-farm risk factors in northernCyprus. BMC Vet Res 2011, 7:13.
39. Wever PC, van Hannen EJ, Schellekens JJ, van Lokven JW, Schneeberger P,Zaaijer HL, Hermans MH: Detection of Coxiella burnetii DNA in veterinarysamples and supermarket dairy products using routine hospitaldeveloped real-time PCR techniques. [abstract]. Ned Tijdschr MedMicrobiol 2010, 18(Suppl):s74.
40. Karagiannis I, Schimmer B, van Lier A, Timen A, Schneeberger P, vanRotterdam B, de Bruin A, Wijkmans C, Rietveld A, van Duynhoven Y:
Investigation of a Q fever outbreak in a rural area of The Netherlands.Epidemiol Infect 2009, 137:1283-1294.
41. Salmon MM, Howells B, Glencross EJ, Evans AD, Palmer SR: Q fever in anurban area. Lancet 1982, 1:1002-1004.
42. Van Woerden HC, Mason BW, Nehaul LK, Smith R, Salmon RL, Healy B,Valappil M, Westmoreland D, de Martin S, Evans MR, et al: Q fever outbreakin industrial setting. Emerg Infect Dis 2004, 10:1282-1289.
43. Houwers DJ, van der Meer M, van Dijk AA, Ossewaarde JM: Prevalence ofinfections with C. burnetii in dogs and cats in the Netherlands and the centralregion of the Netherlands, 1991-1992. Research report 91-102. Utrecht 1992.
44. Stein A, Raoult D: Pigeon pneumonia in provence: a bird-borne Q feveroutbreak. Clin Infect Dis 1999, 29:617-620.
45. Reusken C, van der Plaats R, Opsteegh M, de Bruin A, Swart A: Coxiellaburnetii (Q fever) in Rattus norvegicus and Rattus rattus at livestock farmsand urban locations in the Netherlands; could Rattus spp. representreservoirs for (re)introduction? Prev Vet Med 2011, 101:124-130.
doi:10.1186/1746-6148-7-81Cite this article as: Schimmer et al.: Seroprevalence and risk factors of Qfever in goats on commercial dairy goat farms in the Netherlands,2009-2010. BMC Veterinary Research 2011 7:81.
Submit your next manuscript to BioMed Centraland take full advantage of:
• Convenient online submission
• Thorough peer review
• No space constraints or color figure charges
• Immediate publication on acceptance
• Inclusion in PubMed, CAS, Scopus and Google Scholar
• Research which is freely available for redistribution
Submit your manuscript at www.biomedcentral.com/submit
Schimmer et al. BMC Veterinary Research 2011, 7:81http://www.biomedcentral.com/1746-6148/7/81
Page 14 of 14

CHAPTER 4.3
Coxiella burnetii seroprevalence and risk factors in sheep farmers and farm residents in The Netherlands
B. SchimmerM.M.A. de Lange
P. VellemaJ.L.A. Hautvast
P.M. SchneebergerY.T.H.P. van Duijnhoven
Epidemiol Infect. 2014 Jun;142(6):1231-44

CHAPTER 4.3
Coxiella burnetii seroprevalence and risk factors in sheep farmers and farm residents in The Netherlands
B. SchimmerM.M.A. de Lange
P. VellemaJ.L.A. Hautvast
P.M. SchneebergerY.T.H.P. van Duijnhoven
Epidemiol Infect. 2014 Jun;142(6):1231-44

Coxiella burnetii seroprevalence and risk factors in sheepfarmers and farm residents in The Netherlands
M. M. A. DE LANGE1*†, B. SCHIMMER1†, P. VELLEMA2, J. L. A. HAUTVAST3,P. M. SCHNEEBERGER4
AND Y. T. H. P. VAN DUIJNHOVEN1
1Centre for Infectious Disease Control Netherlands, National Institute for Public Health and the Environment(RIVM), Bilthoven, The Netherlands2Department of Small Ruminant Health, Animal Health Service (GD), Deventer, The Netherlands3Department of Primary and Community Care, Academic Collaborative Centre for Public Health (AMPHI),Radboud University Nijmegen Medical Centre, Nijmegen, The Netherlands4Department of Medical Microbiology and Infection Control, Jeroen Bosch Hospital,’s-Hertogenbosch,The Netherlands
Received 15 January 2013; Final revision 17 May 2013; Accepted 3 July 2013;first published online 7 August 2013
SUMMARY
In this study, Coxiella burnetii seroprevalence was assessed for dairy and non-dairy sheep farmresidents in The Netherlands for 2009–2010. Risk factors for seropositivity were identified fornon-dairy sheep farm residents. Participants completed farm-based and individual questionnaires.In addition, participants were tested for IgG and IgM C. burnetii antibodies usingimmunofluorescent assay. Risk factors were identified by univariate, multivariate logisticregression, and multivariate multilevel analyses. In dairy and non-dairy sheep farm residents,seroprevalence was 66·7% and 51·3%, respectively. Significant risk factors were cattle contact,high goat density near the farm, sheep supplied from two provinces, high frequency of refreshingstable bedding, farm started before 1990 and presence of the Blessumer breed. Most risk factorsindicate current or past goat and cattle exposure, with limited factors involving sheep. Subtypinghuman, cattle, goat, and sheep C. burnetii strains might elucidate their role in the infection riskof sheep farm residents.
Key words: Coxiellae, Q fever, risk assessment, serology, zoonoses.
INTRODUCTION
Q fever, caused by Coxiella burnetii, is a worldwidezoonosis with goats, sheep, and cattle as primarysources for human infections [1]. Humans are usuallyinfected by inhalation of contaminated aerosolsoriginating from parturient animals and their birth
products [1–3]. Acute Q fever presents itself as a self-limiting febrile illness, pneumonia or hepatitis, witha small proportion developing chronic infections(mainly endocarditis and vascular infections) [4, 5].
From 2007 until 2009, large Q fever outbreaksoccurred in The Netherlands, with over 3500 humancases notified [6]. Abortion waves at dairy goatfarms were the primary source of these infections[7–9]. Between 2006 and 2008, C. burnetii abortionwaves occurred on two dairy sheep farms [9].Infected non-dairy sheep farms were not associatedwith an increased number of human cases livingnear these farms [10], although cases occurred in
* Author for correspondence: Mrs M. M. A. de Lange, Centre forInfectious Disease Control Netherlands, National Institute forPublic Health and the Environment (RIVM), P.O. Box 1, 3720BA, Bilthoven, The Netherlands.(Email: [email protected])† These authors contributed equally to this work.
Epidemiol. Infect. (2014), 142, 1231–1244. © Cambridge University Press 2013doi:10.1017/S0950268813001726
The online version of this article is published within an Open Access environment subject to the conditions of the Creative CommonsAttribution-NonCommercial-ShareAlike licence <http://creativecommons.org/licenses/by-nc-sa/3.0/>. The written permission ofCambridge University Press must be obtained for commercial re-use.
to persist in the majority of cases for 1 yearpost-infection and may even persist up to 4 yearspost-infection [20, 21] (C. C. H. Wielders, personalcommunication). Seropositives without IgM phase IIantibodies were designated as ‘past infections’. Asthe latter group also includes possible chronic infec-tions, a further distinction was made between serologi-cal profiles that had IgG phase I 51:1024 indicativefor a chronic infection according to the new Dutchconsensus guidelines [22].
Statistical analyses
Dairy sheep farms
All data were analysed with SAS, version 9.2 (SASInstitute Inc., USA). For the dairy sheep farms inThe Netherlands, participation bias was investigatedby comparing participating and non-participatingfarms with regard to herd size, urbanization degreeand region. The seroprevalence of C. burnetii in resi-dents and the corresponding 95% confidence interval(CI) were calculated. Descriptive statistics were per-formed by analysing frequency tables and studyingdistributions of continuous variables. No risk factoranalysis was performed because of the small numberof participants.
Non-dairy sheep farms
To study participation bias, participating and non-participating farms were compared with regard toherd size, cattle, sheep, and goat density in the sur-roundings, urbanization degree, region, situated insideor outside a compulsory Q fever vaccination area,number of bulk-milk-positive dairy goat or dairysheep farms in a radius of 5 and 10 km, and distancein metres to the closest bulk-milk-positive smallruminant farm.
The seroprevalence of C. burnetii and the corre-sponding 95% CI were calculated. For descriptivestatistics, frequency tables were analysed. In addition,distributions of continuous variables were studied,and if not linearly related to the outcome variable,continuous variables were recoded into classes.
Univariate logistic regression analysis was per-formed to assess the main factors associatedwith C. burnetii seropositivity at the individual level[P<0·20 in the likelihood ratio test (−2LL)].Variables with <20 participants in one risk categorywere excluded. Age was always kept in the modelbecause of the frequent association with Q fever
seropositivity in the literature. Proxy outcomes, suchas sheep seropositivity, were not included in the multi-variate analysis. If several variables, which wereassociated in the univariate analysis, were interrelated,a preferred variable was chosen and related variableswere excluded. The preferred variable was chosenbased on the most informative value, the strongestassociation or most relevant exposure (exposure atown farm instead of comparable exposure at otherfarms). All identified individual variables were ana-lysed with a manual backwards elimination procedureuntil all variables were significant at the 10% signifi-cance level in the likelihood ratio test, starting witha full multivariate logistic regression model.
Subsequently, potential risk factors derived fromthe farm-based questionnaire were analysed by uni-variate multilevel analyses considering clustered farm-based data for all persons within the same farm, usinga unique farm number as cluster variable. All farmvariables which were significant in the univariateanalysis (P<0·20), were analysed with a manual back-ward elimination procedure starting with a full multi-level model.
Finally, both the individual and farm-based charac-teristics from the two final submodels were combinedin a multivariate multilevel analysis to identify theindependent risk determinants for C. burnetii sero-positivity. The final model fit was assessed by thequasi-likelihood under the independence modelcriterion (QIC) goodness-of-fit statistic for generalizedestimation equation (GEE) models.
RESULTS
Dairy sheep farms
Out of the 32 invited farms, 12 participated (responserate 37·5%). The participating farms were all situatedin a rural area (<500 addresses/km2). Participatingand non-participating farms were comparable withregard to urbanization degree and province distri-bution. However, participating farms had a mediannumber of 529 sheep (range 143–1163) vs. the signifi-cantly lower median of 353 sheep (range 96–730) fornon-participating farms (P=0·03).
Twenty-seven study participants (mean age38·7 years, range 14–61, 63% male), provided ablood sample. Overall, 18 (66·7%) participants wereseropositive: 80·0% for the 15 farmers (12 males),and 50·0% for the 12 household members (fivechildren, five female spouses, one male spouse, one
Q fever infections sheep farm residents 1233

4.3
Coxiella burnetii seroprevalence and risk factors in sheepfarmers and farm residents in The Netherlands
M. M. A. DE LANGE1*†, B. SCHIMMER1†, P. VELLEMA2, J. L. A. HAUTVAST3,P. M. SCHNEEBERGER4
AND Y. T. H. P. VAN DUIJNHOVEN1
1Centre for Infectious Disease Control Netherlands, National Institute for Public Health and the Environment(RIVM), Bilthoven, The Netherlands2Department of Small Ruminant Health, Animal Health Service (GD), Deventer, The Netherlands3Department of Primary and Community Care, Academic Collaborative Centre for Public Health (AMPHI),Radboud University Nijmegen Medical Centre, Nijmegen, The Netherlands4Department of Medical Microbiology and Infection Control, Jeroen Bosch Hospital,’s-Hertogenbosch,The Netherlands
Received 15 January 2013; Final revision 17 May 2013; Accepted 3 July 2013;first published online 7 August 2013
SUMMARY
In this study, Coxiella burnetii seroprevalence was assessed for dairy and non-dairy sheep farmresidents in The Netherlands for 2009–2010. Risk factors for seropositivity were identified fornon-dairy sheep farm residents. Participants completed farm-based and individual questionnaires.In addition, participants were tested for IgG and IgM C. burnetii antibodies usingimmunofluorescent assay. Risk factors were identified by univariate, multivariate logisticregression, and multivariate multilevel analyses. In dairy and non-dairy sheep farm residents,seroprevalence was 66·7% and 51·3%, respectively. Significant risk factors were cattle contact,high goat density near the farm, sheep supplied from two provinces, high frequency of refreshingstable bedding, farm started before 1990 and presence of the Blessumer breed. Most risk factorsindicate current or past goat and cattle exposure, with limited factors involving sheep. Subtypinghuman, cattle, goat, and sheep C. burnetii strains might elucidate their role in the infection riskof sheep farm residents.
Key words: Coxiellae, Q fever, risk assessment, serology, zoonoses.
INTRODUCTION
Q fever, caused by Coxiella burnetii, is a worldwidezoonosis with goats, sheep, and cattle as primarysources for human infections [1]. Humans are usuallyinfected by inhalation of contaminated aerosolsoriginating from parturient animals and their birth
products [1–3]. Acute Q fever presents itself as a self-limiting febrile illness, pneumonia or hepatitis, witha small proportion developing chronic infections(mainly endocarditis and vascular infections) [4, 5].
From 2007 until 2009, large Q fever outbreaksoccurred in The Netherlands, with over 3500 humancases notified [6]. Abortion waves at dairy goatfarms were the primary source of these infections[7–9]. Between 2006 and 2008, C. burnetii abortionwaves occurred on two dairy sheep farms [9].Infected non-dairy sheep farms were not associatedwith an increased number of human cases livingnear these farms [10], although cases occurred in
* Author for correspondence: Mrs M. M. A. de Lange, Centre forInfectious Disease Control Netherlands, National Institute forPublic Health and the Environment (RIVM), P.O. Box 1, 3720BA, Bilthoven, The Netherlands.(Email: [email protected])† These authors contributed equally to this work.
Epidemiol. Infect. (2014), 142, 1231–1244. © Cambridge University Press 2013doi:10.1017/S0950268813001726
The online version of this article is published within an Open Access environment subject to the conditions of the Creative CommonsAttribution-NonCommercial-ShareAlike licence <http://creativecommons.org/licenses/by-nc-sa/3.0/>. The written permission ofCambridge University Press must be obtained for commercial re-use.
individuals living a small distance from or havingdirect contact with non-dairy sheep in TheNetherlands [11, 12]. Internationally, several sheep-related Q fever outbreaks have been reported[13–19].
In The Netherlands, sheep farms can be distin-guished from dairy farms and fat lamb-producingfarms. There is a small dairy sheep industry with<50 farms, in which sheep are usually milked twicea day during several months each year. The numberof sheep per farm differs from <50 to almost 1000with most kept outdoors for part of the year. On thefat lamb-producing sheep farms the sheep are keptoutside, except for a few weeks around lambing,which usually occurs inside. Except for meat pro-duction, non-dairy sheep are also kept for breedingpurposes or nature management.
So far, no international studies have addressedthe seroprevalence and risk factors for acquisition ofC. burnetii infection in sheep farmers and their house-hold members. Therefore, our aim was to determinethe C. burnetii seroprevalence in both dairy and non-dairy sheep farmers and their household members,and for the large non-dairy sector, to identify individ-ual and farm-related risk factors for seropositivity.
MATERIAL AND METHODS
All dairy sheep and non-dairy sheep farms in TheNetherlands with at least 100 breeding ewes inNovember 2008, according to the national identifi-cation and registration database, were eligible. Aminimum of 100 ewes, considered to be a professionalfarm, was chosen because in the early stage of theDutch epidemic it was clear that only (relativelylarge) commercial (dairy goat) farms were incrimi-nated as a potential source; no obvious role forsmall farms was observed [9]. Besides, smaller hobbyfarms have different management and farm residentsof those farms are assumed to have a more limitedexposure to sheep-related pathogens compared tocommercial farms. Between September andDecember 2009, 32 dairy sheep farmers were ap-proached for the study. In addition, in March andApril 2010, 1344 non-dairy sheep farmers wereapproached for participation. At the time of inclusionin 2010, those farms with at least 60 unvaccinatedbreeding animals were kept in the study. Farmswith vaccinated sheep were excluded because inthis integrated human-veterinary study the sheep atthese farms were likely to be seropositive due to
vaccination; vaccine-induced and naturally inducedseroresponses cannot be distinguished to assess thetrue seroprevalence from natural infection. Second,we assumed that the infection rate for farm residentscould be different for farms with vaccinated sheep(leading to reduced exposure) compared to farmswith unvaccinated sheep. About 3 weeks after theinitial invitation, all non-responding farmers weresent a written reminder. Because of the small number,dairy sheep farmers who did not respond to thissecond invitation were contacted by telephone.
After written informed consent, a maximum ofthree persons were selected from each farm, i.e. thefarmer and a maximum of two family membersaged512 years residing at the farm; in some instancesother persons working or living on the farm wereselected. Each participant received a questionnaireaddressing individual-based risk factors like age,gender, profession, ownership or contact with rumi-nants and pets, consumption of unpasteurized milk,medical history, and contact with agricultural pro-ducts. In addition, the farm owner or farm managercompleted a farm-based questionnaire addressingcharacteristics like farm hygiene and management,herd size, presence of other livestock and pets, stableenvironment, and lambing season characteristics.Separate farm-based questionnaires were developedfor dairy farms and non-dairy farms because of cleardifferences in farm management. A professional lab-oratory assistant visited the farms to collect bloodsamples from all participating individuals for sero-logy. All data of the dairy sheep farms were collectedbetween September 2009 and September 2010, for thenon-dairy sheep farms data were collected betweenApril and September 2010. The Medical EthicalCommission of the University Medical CenterUtrecht approved the study protocol (no. 09–189/K).
Serological analysis
Serum samples were tested for C. burnetii IgM andIgG antibodies, both phases I and II, using an indirectimmunofluorescence assay (IFA) with a screeningdilution of 1:32. Participants without any positiveantibody result and participants with a solitary IgMphase I or solitary IgM phase II result were classifiedas seronegative. All other outcomes were classifiedas seropositive. Those with IgM phase II antibodieswere designated as ‘relatively recent infections’ andincluded possible current infections. The term ‘rela-tively recent’ was chosen as IgM phase II is found
1232 M. M. A. de Lange and others

C. BURNETII SEROPREVALENCE AND RISK FACTORS IN SHEEP FARMERS | 123
4.3
Coxiella burnetii seroprevalence and risk factors in sheepfarmers and farm residents in The Netherlands
M. M. A. DE LANGE1*†, B. SCHIMMER1†, P. VELLEMA2, J. L. A. HAUTVAST3,P. M. SCHNEEBERGER4
AND Y. T. H. P. VAN DUIJNHOVEN1
1Centre for Infectious Disease Control Netherlands, National Institute for Public Health and the Environment(RIVM), Bilthoven, The Netherlands2Department of Small Ruminant Health, Animal Health Service (GD), Deventer, The Netherlands3Department of Primary and Community Care, Academic Collaborative Centre for Public Health (AMPHI),Radboud University Nijmegen Medical Centre, Nijmegen, The Netherlands4Department of Medical Microbiology and Infection Control, Jeroen Bosch Hospital,’s-Hertogenbosch,The Netherlands
Received 15 January 2013; Final revision 17 May 2013; Accepted 3 July 2013;first published online 7 August 2013
SUMMARY
In this study, Coxiella burnetii seroprevalence was assessed for dairy and non-dairy sheep farmresidents in The Netherlands for 2009–2010. Risk factors for seropositivity were identified fornon-dairy sheep farm residents. Participants completed farm-based and individual questionnaires.In addition, participants were tested for IgG and IgM C. burnetii antibodies usingimmunofluorescent assay. Risk factors were identified by univariate, multivariate logisticregression, and multivariate multilevel analyses. In dairy and non-dairy sheep farm residents,seroprevalence was 66·7% and 51·3%, respectively. Significant risk factors were cattle contact,high goat density near the farm, sheep supplied from two provinces, high frequency of refreshingstable bedding, farm started before 1990 and presence of the Blessumer breed. Most risk factorsindicate current or past goat and cattle exposure, with limited factors involving sheep. Subtypinghuman, cattle, goat, and sheep C. burnetii strains might elucidate their role in the infection riskof sheep farm residents.
Key words: Coxiellae, Q fever, risk assessment, serology, zoonoses.
INTRODUCTION
Q fever, caused by Coxiella burnetii, is a worldwidezoonosis with goats, sheep, and cattle as primarysources for human infections [1]. Humans are usuallyinfected by inhalation of contaminated aerosolsoriginating from parturient animals and their birth
products [1–3]. Acute Q fever presents itself as a self-limiting febrile illness, pneumonia or hepatitis, witha small proportion developing chronic infections(mainly endocarditis and vascular infections) [4, 5].
From 2007 until 2009, large Q fever outbreaksoccurred in The Netherlands, with over 3500 humancases notified [6]. Abortion waves at dairy goatfarms were the primary source of these infections[7–9]. Between 2006 and 2008, C. burnetii abortionwaves occurred on two dairy sheep farms [9].Infected non-dairy sheep farms were not associatedwith an increased number of human cases livingnear these farms [10], although cases occurred in
* Author for correspondence: Mrs M. M. A. de Lange, Centre forInfectious Disease Control Netherlands, National Institute forPublic Health and the Environment (RIVM), P.O. Box 1, 3720BA, Bilthoven, The Netherlands.(Email: [email protected])† These authors contributed equally to this work.
Epidemiol. Infect. (2014), 142, 1231–1244. © Cambridge University Press 2013doi:10.1017/S0950268813001726
The online version of this article is published within an Open Access environment subject to the conditions of the Creative CommonsAttribution-NonCommercial-ShareAlike licence <http://creativecommons.org/licenses/by-nc-sa/3.0/>. The written permission ofCambridge University Press must be obtained for commercial re-use.
to persist in the majority of cases for 1 yearpost-infection and may even persist up to 4 yearspost-infection [20, 21] (C. C. H. Wielders, personalcommunication). Seropositives without IgM phase IIantibodies were designated as ‘past infections’. Asthe latter group also includes possible chronic infec-tions, a further distinction was made between serologi-cal profiles that had IgG phase I 51:1024 indicativefor a chronic infection according to the new Dutchconsensus guidelines [22].
Statistical analyses
Dairy sheep farms
All data were analysed with SAS, version 9.2 (SASInstitute Inc., USA). For the dairy sheep farms inThe Netherlands, participation bias was investigatedby comparing participating and non-participatingfarms with regard to herd size, urbanization degreeand region. The seroprevalence of C. burnetii in resi-dents and the corresponding 95% confidence interval(CI) were calculated. Descriptive statistics were per-formed by analysing frequency tables and studyingdistributions of continuous variables. No risk factoranalysis was performed because of the small numberof participants.
Non-dairy sheep farms
To study participation bias, participating and non-participating farms were compared with regard toherd size, cattle, sheep, and goat density in the sur-roundings, urbanization degree, region, situated insideor outside a compulsory Q fever vaccination area,number of bulk-milk-positive dairy goat or dairysheep farms in a radius of 5 and 10 km, and distancein metres to the closest bulk-milk-positive smallruminant farm.
The seroprevalence of C. burnetii and the corre-sponding 95% CI were calculated. For descriptivestatistics, frequency tables were analysed. In addition,distributions of continuous variables were studied,and if not linearly related to the outcome variable,continuous variables were recoded into classes.
Univariate logistic regression analysis was per-formed to assess the main factors associatedwith C. burnetii seropositivity at the individual level[P<0·20 in the likelihood ratio test (−2LL)].Variables with <20 participants in one risk categorywere excluded. Age was always kept in the modelbecause of the frequent association with Q fever
seropositivity in the literature. Proxy outcomes, suchas sheep seropositivity, were not included in the multi-variate analysis. If several variables, which wereassociated in the univariate analysis, were interrelated,a preferred variable was chosen and related variableswere excluded. The preferred variable was chosenbased on the most informative value, the strongestassociation or most relevant exposure (exposure atown farm instead of comparable exposure at otherfarms). All identified individual variables were ana-lysed with a manual backwards elimination procedureuntil all variables were significant at the 10% signifi-cance level in the likelihood ratio test, starting witha full multivariate logistic regression model.
Subsequently, potential risk factors derived fromthe farm-based questionnaire were analysed by uni-variate multilevel analyses considering clustered farm-based data for all persons within the same farm, usinga unique farm number as cluster variable. All farmvariables which were significant in the univariateanalysis (P<0·20), were analysed with a manual back-ward elimination procedure starting with a full multi-level model.
Finally, both the individual and farm-based charac-teristics from the two final submodels were combinedin a multivariate multilevel analysis to identify theindependent risk determinants for C. burnetii sero-positivity. The final model fit was assessed by thequasi-likelihood under the independence modelcriterion (QIC) goodness-of-fit statistic for generalizedestimation equation (GEE) models.
RESULTS
Dairy sheep farms
Out of the 32 invited farms, 12 participated (responserate 37·5%). The participating farms were all situatedin a rural area (<500 addresses/km2). Participatingand non-participating farms were comparable withregard to urbanization degree and province distri-bution. However, participating farms had a mediannumber of 529 sheep (range 143–1163) vs. the signifi-cantly lower median of 353 sheep (range 96–730) fornon-participating farms (P=0·03).
Twenty-seven study participants (mean age38·7 years, range 14–61, 63% male), provided ablood sample. Overall, 18 (66·7%) participants wereseropositive: 80·0% for the 15 farmers (12 males),and 50·0% for the 12 household members (fivechildren, five female spouses, one male spouse, one
Q fever infections sheep farm residents 1233

124 | CHAPTER 4.3
seasonal worker). Three (11·1%) participants had arelatively recent C. burnetii infection (IgM phase IIantibodies). None consulted their general practitioneror were hospitalized because of influenza-like illnessor fever. One participant had an IgG phase I titre of51:1024, indicating a possible chronic case [22].
Non-dairy sheep farms
Non-response analyses
Out of the 1344 approached farms, at least 32appeared to be no longer eligible because they had<60 animals at inclusion or had vaccinated all theirsheep. Of the remaining 1312 farms, 119 participatedin the study (response rate 9·1%).
A significant difference was found for sheepdensity in the 5-km radius of participating and non-participating farms, 34·5 (range 1·8–143·6) and 47·5(range 1·0–162·9) sheep/km2 in the 5-km radius(excluding own sheep), respectively (P=0·01). Inaddition, the number of sheep was borderline signifi-cantly higher at the participating farms (median191 sheep, range 102–1310), compared to the non-participating farms (median 167 sheep, range100–2857). For the other variables, no significantdifferences were found between participating and non-participating farms (Table 1).
Descriptive characteristics
The 119 participating farms were mainly situatedin the provinces of Noord-Holland and Friesland,commonly (90·8%) situated in rural areas (<500addresses/km2) and the most common breeds atthe farms were Texel (57·0%) and Swifter (46·5%).The farms were mainly started after 1950 (9·6%1875–1950, 39·4% 1951–1980, 51·0% after 1980).Out of the 114 farms with a farm-based questionnaire,23 (20·2%) kept one or more goats, 45 (39·5%) keptdairy cattle and/or beef cattle, and 13 (11·4%) otherfarms reported that cattle were present on their pas-tures. The farms could have one or more function;95 (83·3%) farms kept sheep for meat production,53 (46·5%) farms for rearing, and 20 (17·5%) farmsfor nature management. Of those 20 farms, 12 farmskept their sheep exclusively for nature management.
From the 119 farms, 271 persons provided a bloodsample (mean age 47, range 12–93 years, 55% male).Of those, 266 completed the individual self-administered questionnaire and from 261 individuals
information was available from the farm-basedquestionnaire.
C. burnetii seroprevalence was 51·3% (95% CI45·5–57·4). In the univariate analysis, seroprevalencewas significantly higher for farmers (58·8% vs. 36·3%for spouses) and for males (57·7% vs. 43·4% forfemales). Out of the 271 participants, seven (2·6%)had a relatively recent infection (IgM phase II anti-bodies). No participant had an IgG phase I titre sug-gestive for chronic infection.
Although the seroprevalence of the farm residentswas higher for those living on a dairy sheep farm,the difference was not statistically significant [oddsratio (OR) 1·9, 95% CI 0·8–4·4] for dairy sheep farm-ers vs. non-dairy sheep farmers).
Univariate analyses at individual and farm level
All individual and farm-based variables, which weretested in the univariate analysis for relationship withhuman C. burnetii seropositivity, are displayed inTables 2 and 3.
Multivariate and multilevel analyses
In the multivariate analyses, from 23 individual vari-ables which were associated in the univariate analysis,four were independently associated with C. burnetiiseropositivity (Table 4). In addition, 10/23 farm-basedvariables included in the multilevel analyses were sig-nificantly independent risk or protective factors andtogether were used as the full multilevel start model(Table 5).
Combined multilevel analyses of individual andfarm-based factors
In the final combined multilevel model, significant riskfactors were contact with cattle at own or other farm,past employment in the cattle sector, high goat densityin the vicinity of the farm, living or working at afarm that was started in 1990 or later, the presenceof Blessumer breed on the farm, cattle on the samepastures used by sheep, although not simultaneouslywith the sheep, high frequency of refreshing the bed-ding in the sheep stables, and sheep supplied fromthe provinces of Groningen or Noord-Holland(Table 6). Borderline significant risk factors were age40–49 years, and presence of dairy cattle during thestabling period of the sheep. In addition, sheep lamb-ing outside was a significant protective factor, and airentering the stable through the door was a borderlinesignificant protective factor.
1234 M. M. A. de Lange and others
DISCUSSION
Seroprevalence
The seroprevalence of non-dairy (51·3%) and dairysheep farm residents (66·7%) is clearly higher com-pared to the seroprevalence estimate of 2·4% in thegeneral population before the outbreak occurredin The Netherlands in 2006–2007. It is even highercompared to the seroprevalence found in a small
community in the epicentre of the Q fever outbreakin 2007 (25·1%), and in blood donors in the most Qfever-affected areas in 2009 (12·2%), indicating thatsheep farm residents have an increased life-time riskof acquiring a C. burnetii infection compared to thegeneral Dutch population [7, 23, 24].
The observed seroprevalence in Dutch sheepfarm households is also high compared to a studyof sheep farmers in Sweden (28·5%) [25], and of
Table 1. Non-response analyses of non-dairy sheep farms, comparison of participating and non-participating farms
Numerical variables
Participatingfarms (N=119)
Non-participatingfarms (N=1193)
P valueMedian Median
Number of sheep 191 167 0·05Cattle density (number of cattle/km2 in the municipality)* 134·7 135·5 0·16Cattle density without veal calves (number of cattle/km2
in the municipality)*114·7 119·5 0·10
Goat density (number of goats/km2 excluding own animalsin a 5-km radius)*
2·6 3·5 0·17
Sheep density (number of sheep/km2 excluding own animalsin a 5-km radius)*
34·5 47·5 0·01
Closest Q fever bulk-milk-positive dairy goat or dairysheep farm (metres)*
13960 13806 0·70
Number Q fever bulk-milk-positive dairy goat or dairysheep farms in a 5-km radius*
0 (min=0, max=2) 0 (min=0, max=4) 0·62
Number Q fever bulk-milk-positive dairy goat or dairysheep farms in a 10-km radius*
0 (min=0, max=4) 0 (min=0, max=9) 0·71
Categorical variables n (%) n (%) P value
Inside vaccination area 20 (16·8) 181 (15·2) 0·64Outside vaccination area 99 (83·2) 1012 (84·8)
UrbanizationVery high urban area*† 0 (0·0) 2 (0·2) 0·37High urban area 0 (0·0) 3 (0·3)Moderate urban area 4 (3·3) 14 (1·2)Minor urban area 7 (5·9) 84 (7·0)Rural area 108 (90·8) 1086 (91·3)
ProvinceDrenthe* 4 (3·4) 57 (4·8) 0·52Flevoland 1 (0·8) 9 (0·8)Friesland 18 (15·1) 213 (17·9)Gelderland 14 (11·8) 170 (14·3)Groningen 11 (9·2) 93 (7·8)Limburg 4 (3·4) 23 (1·9)Noord-Brabant 12 (10·1) 74 (6·2)Noord-Holland 29 (24·4) 241 (20·3)Overijsel 11 (9·2) 86 (7·2)Utrecht 2 (1·7) 48 (4·1)Zeeland 2 (1·7) 49 (4·1)Zuid-Holland 11 (9·2) 126 (10·6)
N, Total number of individuals.* Four missing values at non-participating farms.†Urbanization degree: very high urban area >2500 addresses/km2; high urban area=1500–2500 addresses/km2;moderate urban area=1000–1500 addresses/km2; minor urban area=500–1000 addresses/km2; rural area <500 addresses/km2.
Q fever infections sheep farm residents 1235
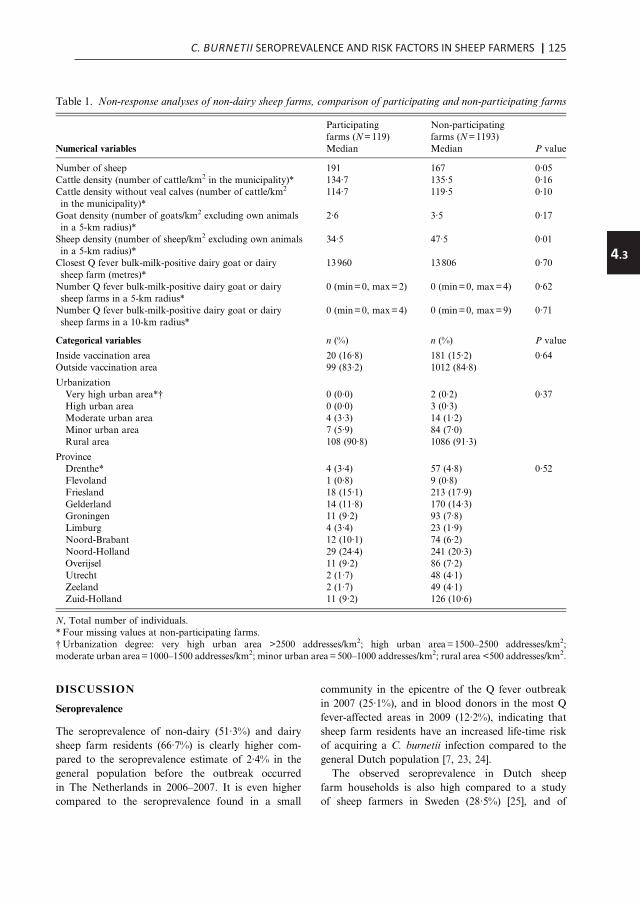
C. BURNETII SEROPREVALENCE AND RISK FACTORS IN SHEEP FARMERS | 125
4.3
seasonal worker). Three (11·1%) participants had arelatively recent C. burnetii infection (IgM phase IIantibodies). None consulted their general practitioneror were hospitalized because of influenza-like illnessor fever. One participant had an IgG phase I titre of51:1024, indicating a possible chronic case [22].
Non-dairy sheep farms
Non-response analyses
Out of the 1344 approached farms, at least 32appeared to be no longer eligible because they had<60 animals at inclusion or had vaccinated all theirsheep. Of the remaining 1312 farms, 119 participatedin the study (response rate 9·1%).
A significant difference was found for sheepdensity in the 5-km radius of participating and non-participating farms, 34·5 (range 1·8–143·6) and 47·5(range 1·0–162·9) sheep/km2 in the 5-km radius(excluding own sheep), respectively (P=0·01). Inaddition, the number of sheep was borderline signifi-cantly higher at the participating farms (median191 sheep, range 102–1310), compared to the non-participating farms (median 167 sheep, range100–2857). For the other variables, no significantdifferences were found between participating and non-participating farms (Table 1).
Descriptive characteristics
The 119 participating farms were mainly situatedin the provinces of Noord-Holland and Friesland,commonly (90·8%) situated in rural areas (<500addresses/km2) and the most common breeds atthe farms were Texel (57·0%) and Swifter (46·5%).The farms were mainly started after 1950 (9·6%1875–1950, 39·4% 1951–1980, 51·0% after 1980).Out of the 114 farms with a farm-based questionnaire,23 (20·2%) kept one or more goats, 45 (39·5%) keptdairy cattle and/or beef cattle, and 13 (11·4%) otherfarms reported that cattle were present on their pas-tures. The farms could have one or more function;95 (83·3%) farms kept sheep for meat production,53 (46·5%) farms for rearing, and 20 (17·5%) farmsfor nature management. Of those 20 farms, 12 farmskept their sheep exclusively for nature management.
From the 119 farms, 271 persons provided a bloodsample (mean age 47, range 12–93 years, 55% male).Of those, 266 completed the individual self-administered questionnaire and from 261 individuals
information was available from the farm-basedquestionnaire.
C. burnetii seroprevalence was 51·3% (95% CI45·5–57·4). In the univariate analysis, seroprevalencewas significantly higher for farmers (58·8% vs. 36·3%for spouses) and for males (57·7% vs. 43·4% forfemales). Out of the 271 participants, seven (2·6%)had a relatively recent infection (IgM phase II anti-bodies). No participant had an IgG phase I titre sug-gestive for chronic infection.
Although the seroprevalence of the farm residentswas higher for those living on a dairy sheep farm,the difference was not statistically significant [oddsratio (OR) 1·9, 95% CI 0·8–4·4] for dairy sheep farm-ers vs. non-dairy sheep farmers).
Univariate analyses at individual and farm level
All individual and farm-based variables, which weretested in the univariate analysis for relationship withhuman C. burnetii seropositivity, are displayed inTables 2 and 3.
Multivariate and multilevel analyses
In the multivariate analyses, from 23 individual vari-ables which were associated in the univariate analysis,four were independently associated with C. burnetiiseropositivity (Table 4). In addition, 10/23 farm-basedvariables included in the multilevel analyses were sig-nificantly independent risk or protective factors andtogether were used as the full multilevel start model(Table 5).
Combined multilevel analyses of individual andfarm-based factors
In the final combined multilevel model, significant riskfactors were contact with cattle at own or other farm,past employment in the cattle sector, high goat densityin the vicinity of the farm, living or working at afarm that was started in 1990 or later, the presenceof Blessumer breed on the farm, cattle on the samepastures used by sheep, although not simultaneouslywith the sheep, high frequency of refreshing the bed-ding in the sheep stables, and sheep supplied fromthe provinces of Groningen or Noord-Holland(Table 6). Borderline significant risk factors were age40–49 years, and presence of dairy cattle during thestabling period of the sheep. In addition, sheep lamb-ing outside was a significant protective factor, and airentering the stable through the door was a borderlinesignificant protective factor.
1234 M. M. A. de Lange and others
DISCUSSION
Seroprevalence
The seroprevalence of non-dairy (51·3%) and dairysheep farm residents (66·7%) is clearly higher com-pared to the seroprevalence estimate of 2·4% in thegeneral population before the outbreak occurredin The Netherlands in 2006–2007. It is even highercompared to the seroprevalence found in a small
community in the epicentre of the Q fever outbreakin 2007 (25·1%), and in blood donors in the most Qfever-affected areas in 2009 (12·2%), indicating thatsheep farm residents have an increased life-time riskof acquiring a C. burnetii infection compared to thegeneral Dutch population [7, 23, 24].
The observed seroprevalence in Dutch sheepfarm households is also high compared to a studyof sheep farmers in Sweden (28·5%) [25], and of
Table 1. Non-response analyses of non-dairy sheep farms, comparison of participating and non-participating farms
Numerical variables
Participatingfarms (N=119)
Non-participatingfarms (N=1193)
P valueMedian Median
Number of sheep 191 167 0·05Cattle density (number of cattle/km2 in the municipality)* 134·7 135·5 0·16Cattle density without veal calves (number of cattle/km2
in the municipality)*114·7 119·5 0·10
Goat density (number of goats/km2 excluding own animalsin a 5-km radius)*
2·6 3·5 0·17
Sheep density (number of sheep/km2 excluding own animalsin a 5-km radius)*
34·5 47·5 0·01
Closest Q fever bulk-milk-positive dairy goat or dairysheep farm (metres)*
13960 13806 0·70
Number Q fever bulk-milk-positive dairy goat or dairysheep farms in a 5-km radius*
0 (min=0, max=2) 0 (min=0, max=4) 0·62
Number Q fever bulk-milk-positive dairy goat or dairysheep farms in a 10-km radius*
0 (min=0, max=4) 0 (min=0, max=9) 0·71
Categorical variables n (%) n (%) P value
Inside vaccination area 20 (16·8) 181 (15·2) 0·64Outside vaccination area 99 (83·2) 1012 (84·8)
UrbanizationVery high urban area*† 0 (0·0) 2 (0·2) 0·37High urban area 0 (0·0) 3 (0·3)Moderate urban area 4 (3·3) 14 (1·2)Minor urban area 7 (5·9) 84 (7·0)Rural area 108 (90·8) 1086 (91·3)
ProvinceDrenthe* 4 (3·4) 57 (4·8) 0·52Flevoland 1 (0·8) 9 (0·8)Friesland 18 (15·1) 213 (17·9)Gelderland 14 (11·8) 170 (14·3)Groningen 11 (9·2) 93 (7·8)Limburg 4 (3·4) 23 (1·9)Noord-Brabant 12 (10·1) 74 (6·2)Noord-Holland 29 (24·4) 241 (20·3)Overijsel 11 (9·2) 86 (7·2)Utrecht 2 (1·7) 48 (4·1)Zeeland 2 (1·7) 49 (4·1)Zuid-Holland 11 (9·2) 126 (10·6)
N, Total number of individuals.* Four missing values at non-participating farms.†Urbanization degree: very high urban area >2500 addresses/km2; high urban area=1500–2500 addresses/km2;moderate urban area=1000–1500 addresses/km2; minor urban area=500–1000 addresses/km2; rural area <500 addresses/km2.
Q fever infections sheep farm residents 1235

126 | CHAPTER 4.3
Table 2. Univariate logistic model of individual factors related to C. burnetii seropositivity in non-dairy sheep farmresidents (P<0·20, −2LL)
Variable Category
Frequency(N)(N=266)
Sero-prevalence(%) OR (95% CI)
Gender* Male 144 57·6 1·77 (1·09–2·88)Female 122 43·4 Reference
Age (years)* 12–19 21 57·1 2·04 (0·72–5·76)20–39 45 51·1 1·60 (0·70–3·63)40–49 68 58·8 2·18 (1·03–4·63)50–59 84 50·0 1·53 (0·74–3·13)>60 48 39·6 Reference
Work and/or live on farm Work and live 188 53·7 1·61 (0·83–3·15)Work, but not live 35 48·6 1·31 (0·53–3·22)Not work, but live 43 41·9 Reference
Function Farmer 136 58·8 2·51 (1·42–4·44)Spouse 80 36·3 ReferenceChild† 39 53·9 2·05 (0·94–4·46)Other‡ 11 54·6 2·11 (0·59–7·53)
How often in stable Every day 185 55·7 ReferenceEvery week 56 41·1 0·56 (0·30–1·02)Every month 10 50·0 0·80 (0·22–2·84)Less than once a month/never 15 33·3 0·40 (0·13–1·21)
Amount of work at farm* Full working week 61 63·9 2·39 (1·25–4·56)Up to half a working week 97 52·9 1·49 (0·86–2·59)Never/occasionally 108 42·6 Reference
Feed sheep* Yes 225 55·6 3·41 (1·63–7·14)No 41 26·8 Reference
Load and unload sheep Yes 194 56·2 2·14 (1·23–3·72)No 72 37·5 Reference
General healthcare of sheep Yes 201 55·7 2·15 (1·21–3·82)No 65 36·9 Reference
Remove manure Yes 180 57·8 2·31 (1·36–3·92)No 86 37·2 Reference
Spread manure* Yes 124 58·9 1·80 (1·10–2·92)No 142 44·4 Reference
Clean stables Yes 167 56·3 1·75 (1·06–2·89)No 99 42·4 Reference
Administrative work Yes 193 54·4 1·62 (0·94–2·78)No 73 42·5 Reference
Wear overalls or boots* Yes 234 54·3 3·03 (1·35–6·84)No 32 28·1 Reference
Contact with cattle at own orother farm*§
Yes 172 63·4 4·29 (2·49–7·40)No 94 28·7 Reference
Contact with horses at own orother farm*§
Yes 145 59·3 2·07 (1·27–3·38)No 121 41·3 Reference
Contact with pigs at own farm*§ Yes 24 37·5 0·54 (0·23–1·29)No 242 52·5 Reference
Indirect contact with poultryat own farm*∥
Yes 93 57·0 1·44 (0·87–2·39)No 173 48·0 Reference
Indirect contact with ratsat own farm*∥
Yes 45 64·4 1·93 (0·99–3·76)No 221 48·4 Reference
Contact with goats at other farm*§ Yes 32 62·5 1·70 (0·79–3·63)No 234 49·6 Reference
Contact with sheep at other farm*§ Yes 102 60·8 1·89 (1·14–3·12)No 164 45·1 Reference
Contact with dogs at other farm*§ Yes 112 58·9 1·72 (1·05–2·82)No 154 45·5 Reference
1236 M. M. A. de Lange and others
farmers from all types of farms: 17·8% in Poland, and27·3% in the UK [26, 27]. Generally, it is difficultto compare international seroprevalence studies,because most studies use different tests or cut-offvalues. The cut-off value of the test in our study(51:32) was chosen because it allowed comparisonwith other population surveys conducted in TheNetherlands [23, 28].
Dairy sheep farm residents had a higher seropreva-lence compared to non-dairy sheep farm residents.Although no statistically significant difference in sero-prevalence was found between the residents of both
farm types, this might be due to lack of power becauseof the small number of participants from dairysheep farms. In this study it was impossible to assesswhich risk factors were responsible for the higher sero-prevalence in dairy sheep farm residents, due to thelow number of participating dairy sheep farm resi-dents. In addition, because of the differences in farmmanagement, the farm-based questionnaires of bothfarm types were not the same, therefore poolingthe analysis with the other sheep farm residentsto increase power was not an option. Specificresearch, targeting all current dairy sheep farms
Table 2 (cont.)
Variable Category
Frequency(N)(N=266)
Sero-prevalence(%) OR (95% CI)
Indirect contact with poultryat other farm∥
Yes 38 63·2 1·78 (0·87–3·61)No 228 49·1 Reference
Indirect contact with catsat other farm*∥
Yes 81 59·3 1·60 (0·95–2·72)No 185 47·6 Reference
Direct contact with wool* Yes 113 60·2 1·89 (1·15–3·09)No 153 44·4 Reference
Direct contact with hay, strawor animal feed*
Yes 228 54·8 2·98 (1·41–6·29)No 38 29·0 Reference
Direct contact with raw milk Yes 72 62·5 1·91 (1·10–3·32)No 193 46·6 Reference
Drink raw milk from cattle* Yes 45 66·7 2·17 (1·11–4·26)No 221 48·0 Reference
Direct contact with cattle manure Yes 110 68·2 3·30 (1·97–5·52)No 155 39·4 Reference
Direct contact with live-born animalsduring lambing period
Yes 246 53·3 3·42 (1·21–9·69)No 20 25·0 Reference
Direct contact with dead-bornanimals/placenta*
Yes 210 54·3 1·84 (1·01–3·35)No 56 39·3 Reference
Tick bite* Yes 61 42·6 0·64 (0·36–1·14)No 205 53·7 Reference
Did not work in animalhusbandry/agriculture in the past
Yes 114 39·5 0·44 (0·27–0·72)No 152 59·9 Reference
Employment in cattle sector in the past* Yes 107 64·5 2·49 (1·50–4·14)No 159 42·1 Reference
Worked in animal transport/ transportof agricultural products in the past*
Yes 37 70·3 2·56 (1·21–5·42)No 229 48·0 Reference
As a child lived at: Cattle farm 151 59·6 2·04 (1·18–3·53)Other kind of farm 34 35·3 0·75 (0·33–1·73)No farm 81 42·0 Reference
As a child worked in animal care/withmanure/hay/in vegetation care*
Yes 178 56·2 1·85 (1·10–3·11)No 88 40·9 Reference
N, Total number of individuals; OR, odds ratio; CI, confidence interval, −2LL, likelihood ratio test.* Variables included in subsequent multivariate individual analyses before manual backward elimination.†Children aged <18 years (n=17) and older children (n=22) of the farmer.‡Employees, shepherds, other family members.§ See animals at <5m or touch animals.∥ See animals at <5m.
Q fever infections sheep farm residents 1237

C. BURNETII SEROPREVALENCE AND RISK FACTORS IN SHEEP FARMERS | 127
4.3
Table 2. Univariate logistic model of individual factors related to C. burnetii seropositivity in non-dairy sheep farmresidents (P<0·20, −2LL)
Variable Category
Frequency(N)(N=266)
Sero-prevalence(%) OR (95% CI)
Gender* Male 144 57·6 1·77 (1·09–2·88)Female 122 43·4 Reference
Age (years)* 12–19 21 57·1 2·04 (0·72–5·76)20–39 45 51·1 1·60 (0·70–3·63)40–49 68 58·8 2·18 (1·03–4·63)50–59 84 50·0 1·53 (0·74–3·13)>60 48 39·6 Reference
Work and/or live on farm Work and live 188 53·7 1·61 (0·83–3·15)Work, but not live 35 48·6 1·31 (0·53–3·22)Not work, but live 43 41·9 Reference
Function Farmer 136 58·8 2·51 (1·42–4·44)Spouse 80 36·3 ReferenceChild† 39 53·9 2·05 (0·94–4·46)Other‡ 11 54·6 2·11 (0·59–7·53)
How often in stable Every day 185 55·7 ReferenceEvery week 56 41·1 0·56 (0·30–1·02)Every month 10 50·0 0·80 (0·22–2·84)Less than once a month/never 15 33·3 0·40 (0·13–1·21)
Amount of work at farm* Full working week 61 63·9 2·39 (1·25–4·56)Up to half a working week 97 52·9 1·49 (0·86–2·59)Never/occasionally 108 42·6 Reference
Feed sheep* Yes 225 55·6 3·41 (1·63–7·14)No 41 26·8 Reference
Load and unload sheep Yes 194 56·2 2·14 (1·23–3·72)No 72 37·5 Reference
General healthcare of sheep Yes 201 55·7 2·15 (1·21–3·82)No 65 36·9 Reference
Remove manure Yes 180 57·8 2·31 (1·36–3·92)No 86 37·2 Reference
Spread manure* Yes 124 58·9 1·80 (1·10–2·92)No 142 44·4 Reference
Clean stables Yes 167 56·3 1·75 (1·06–2·89)No 99 42·4 Reference
Administrative work Yes 193 54·4 1·62 (0·94–2·78)No 73 42·5 Reference
Wear overalls or boots* Yes 234 54·3 3·03 (1·35–6·84)No 32 28·1 Reference
Contact with cattle at own orother farm*§
Yes 172 63·4 4·29 (2·49–7·40)No 94 28·7 Reference
Contact with horses at own orother farm*§
Yes 145 59·3 2·07 (1·27–3·38)No 121 41·3 Reference
Contact with pigs at own farm*§ Yes 24 37·5 0·54 (0·23–1·29)No 242 52·5 Reference
Indirect contact with poultryat own farm*∥
Yes 93 57·0 1·44 (0·87–2·39)No 173 48·0 Reference
Indirect contact with ratsat own farm*∥
Yes 45 64·4 1·93 (0·99–3·76)No 221 48·4 Reference
Contact with goats at other farm*§ Yes 32 62·5 1·70 (0·79–3·63)No 234 49·6 Reference
Contact with sheep at other farm*§ Yes 102 60·8 1·89 (1·14–3·12)No 164 45·1 Reference
Contact with dogs at other farm*§ Yes 112 58·9 1·72 (1·05–2·82)No 154 45·5 Reference
1236 M. M. A. de Lange and others
farmers from all types of farms: 17·8% in Poland, and27·3% in the UK [26, 27]. Generally, it is difficultto compare international seroprevalence studies,because most studies use different tests or cut-offvalues. The cut-off value of the test in our study(51:32) was chosen because it allowed comparisonwith other population surveys conducted in TheNetherlands [23, 28].
Dairy sheep farm residents had a higher seropreva-lence compared to non-dairy sheep farm residents.Although no statistically significant difference in sero-prevalence was found between the residents of both
farm types, this might be due to lack of power becauseof the small number of participants from dairysheep farms. In this study it was impossible to assesswhich risk factors were responsible for the higher sero-prevalence in dairy sheep farm residents, due to thelow number of participating dairy sheep farm resi-dents. In addition, because of the differences in farmmanagement, the farm-based questionnaires of bothfarm types were not the same, therefore poolingthe analysis with the other sheep farm residentsto increase power was not an option. Specificresearch, targeting all current dairy sheep farms
Table 2 (cont.)
Variable Category
Frequency(N)(N=266)
Sero-prevalence(%) OR (95% CI)
Indirect contact with poultryat other farm∥
Yes 38 63·2 1·78 (0·87–3·61)No 228 49·1 Reference
Indirect contact with catsat other farm*∥
Yes 81 59·3 1·60 (0·95–2·72)No 185 47·6 Reference
Direct contact with wool* Yes 113 60·2 1·89 (1·15–3·09)No 153 44·4 Reference
Direct contact with hay, strawor animal feed*
Yes 228 54·8 2·98 (1·41–6·29)No 38 29·0 Reference
Direct contact with raw milk Yes 72 62·5 1·91 (1·10–3·32)No 193 46·6 Reference
Drink raw milk from cattle* Yes 45 66·7 2·17 (1·11–4·26)No 221 48·0 Reference
Direct contact with cattle manure Yes 110 68·2 3·30 (1·97–5·52)No 155 39·4 Reference
Direct contact with live-born animalsduring lambing period
Yes 246 53·3 3·42 (1·21–9·69)No 20 25·0 Reference
Direct contact with dead-bornanimals/placenta*
Yes 210 54·3 1·84 (1·01–3·35)No 56 39·3 Reference
Tick bite* Yes 61 42·6 0·64 (0·36–1·14)No 205 53·7 Reference
Did not work in animalhusbandry/agriculture in the past
Yes 114 39·5 0·44 (0·27–0·72)No 152 59·9 Reference
Employment in cattle sector in the past* Yes 107 64·5 2·49 (1·50–4·14)No 159 42·1 Reference
Worked in animal transport/ transportof agricultural products in the past*
Yes 37 70·3 2·56 (1·21–5·42)No 229 48·0 Reference
As a child lived at: Cattle farm 151 59·6 2·04 (1·18–3·53)Other kind of farm 34 35·3 0·75 (0·33–1·73)No farm 81 42·0 Reference
As a child worked in animal care/withmanure/hay/in vegetation care*
Yes 178 56·2 1·85 (1·10–3·11)No 88 40·9 Reference
N, Total number of individuals; OR, odds ratio; CI, confidence interval, −2LL, likelihood ratio test.* Variables included in subsequent multivariate individual analyses before manual backward elimination.†Children aged <18 years (n=17) and older children (n=22) of the farmer.‡Employees, shepherds, other family members.§ See animals at <5m or touch animals.∥ See animals at <5m.
Q fever infections sheep farm residents 1237
128 | CHAPTER 4.3
in The Netherlands (n∼40), might elucidate furtherrisk factors next to the higher sheep seroprevalence,explaining the higher seroprevalence in dairy sheepfarm residents. Nevertheless, it might well be thatdairy farm residents were more exposed to Coxiella,as the seroprevalence in dairy sheep at these samefarms was significantly higher compared to that ofnon-dairy sheep (data not shown). A higher vulner-ability for infection of breeds selected for milkproduction rather than for disease resistance has pre-viously been observed for dairy cattle, dairy sheep,and dairy goats [29, 30]. In addition, dairy sheepare more often housed in stables compared to non-dairy sheep which spend most of the year outside.Indoor housing might facilitate the spread of C. bur-netii in dairy sheep and to humans. Moreover, thehigher seroprevalence in dairy farm residentsmight be explained by more intense contact withdairy sheep.
The seroprevalence of the dairy sheep farm resi-dents (66·7%) was comparable to the seroprevalenceof dairy goat farm residents (68·7%) in TheNetherlands [28]. Furthermore, the percentage of rela-tively recent infections (clinical status unknown as noquestions addressed current Q fever compatible symp-toms) in the dairy sheep farm residents (11·1%) iscomparable to that of the dairy goat farm residents(11·2%) [28]. Additionally, the percentage of partici-pants with an indication for a possible chronic infec-tion is also similarly high for dairy sheep and dairygoat farm residents (3·7% and 4·1%, respectively)[28]. In contrast, the percentage of relatively recentinfections and possible chronic infections are lowerfor non-dairy sheep farm residents (2·6% and 0%,respectively). Therefore, currently C. burnetii infectionseems to be a more serious and on-going health prob-lem in dairy goat and dairy sheep farm residentscompared to non-dairy sheep farm residents, althoughthe numbers are relatively small.
Although numbers are too low to draw any con-clusion and do not allow for valid statistical testing,the 10 (three from dairy and seven from non-dairyfarms) relatively recent (IgM phase II positive) caseswere generally younger (median 37 years vs. median50 years for the seronegatives), were more oftenmale (80% vs. 48%) and more often lived on a dairysheep farm (30% of the recently infected vs. 6%of the seronegatives). This may point to ongoinginfections especially in male dairy sheep farm re-sidents, in the relatively early days of their contactwith sheep.
Risk and protective factors for non-dairy sheepfarm residents
One of the protective factors for C. burnetii seroposi-tivty was sheep lambing outside. Farm residentsmight be less exposed to contaminated aerosols inthat situation, compared to lambing inside stables.
In addition, several risk factors for C. burnetii sero-positivity were identified in this study. McCaugheyet al. [31] suggested in his study in the general popu-lation (age 12–64 years) that most people acquiredC. burnetii infection between ages 25 and 34 yearsand after that age seroprevalence remained stable.This age trend was not seen in our study; sheep farmresidents had already a high seroprevalence at youngage (12–19 years). This might be explained byexposure to infected animals at a young age. The high-est seroprevalence found in humans (age 40–49 years),matches the most common age group of notified clini-cal Q fever cases in The Netherlands [9]. The increasedrisk at this age seems not to be explained by differ-ences in specific work activities, frequency of cattlecontact, or hours worked. Perhaps host factors playa role in the increased risk, or it generally reflects reg-ular exposure to the bacterium and repeated develop-ment of antibodies (booster effect), not adequatelymeasured by the questions in the questionnaire.
Animal movement is a known risk factor for thetransfer of microorganisms and should be discour-aged [32, 33]. Why specifically supply of sheepfrom the northern provinces of Noord-Hollandand Groningen showed an independent increasedrisk for infection of the farm residents is notclear. The seroprevalence in sheep in these two pro-vinces was not significantly different from pre-valences in other provinces, both in the currentstudy (B. Schimmer et al., unpublished data) and ina previous study in 2008 using convenience serumsamples from sheep [30].
It is also unknown why the fact that a farm startedbefore 1990 was a risk factor. No change in farm man-agement is known around that year that could influ-ence the risk of a C. burnetii infection.
Having the Blessumer sheep breed on the farmwas the next significant risk factor. This breed is acrossing of the breeds of Texel (non-dairy sheep)and Flemish sheep (dairy sheep); therefore, theBlessummer breed might have a lower disease resist-ance [29, 30]. Differences in infection rates betweensheep breeds have not yet been studied to investigatewhether Blessumer sheep are more often infected.
1238 M. M. A. de Lange and others
Table 3. Univariate multilevel analysis of farm-based factors related toC. burnetii seropositivity in non-dairy sheepfarm residents (P<0·20)
Variable Category
Frequency(N)(N=261)*
Sero-prevalence(%) OR (95% CI)
Urbanization†‡§ Moderate or minorurban area
28 67·9 2·00 (0·80–5·04)
Rural area 242 49·2 ReferenceGoat density (number of goats/km2 excludingown animals in a 5-km radius)†§
<2·9 135 38·5 Reference2·9–11·3 67 68·7 3·59 (1·86–6·91)511·4 68 58·8 2·38 (1·18–4·79)
Sheep density (number of sheep/km2 excludingown animals in 5-km radius)†§
<33·7 133 41·4 Reference33·7–79·0 69 53·6 1·68 (0·87–3·25)579·1 68 67·7 2·98 (1·54–5·78)
Cattle density (number of cattle/km2 in themunicipality)†§
< 200·0 240 47·9 Reference5200·0 30 76·7 3·20 (1·37–7·51)
Number of Q fever bulk-milk-positive dairygoat or dairy sheep farms in a 10-km radius†§
0 166 45·8 Reference1–4 104 59·6 1·78 (1·02–3·11)
Closest Q fever bulk-milk-positive dairy goator dairy sheep farms (km)§
<5·0 35 62·9 Reference5·0–9·9 69 58·0 0·39 (0·14–1·13)10·0–14·9 53 41·5 0·87 (0·30–2·54)15·0–19·9 41 61·0 0·82 (0·32–2·14)5 20·0 72 40·3 0·42 (0·16–1·10)
Year farm started† Before 1990 165 44·2 Reference1990 or later 75 61·3 1·97 (1·12–3·48)
Distance between house and pastures <30m 127 40·2 Reference530m 103 61·1 2·20 (1·23–3·94)
Number of male sheep 2010† <6 130 46·9 Reference6–20 56 60·7 1·78 (0·85–3·75)>20 41 51·2 1·20 (0·53–2·70)No 16 56·3 1·30 (0·42–4·00)
Zwartbles breed present on farm† Yes 30 63·3 1·75 (0·89–3·42)No 228 48·7 Reference
Rijnlam breed present on farm Yes 7 85·7 5·72 (0·78–42·12)No 251 49·4 Reference
Blessumer breed present on farm† Yes 21 76·2 3·51 (1·25–9·81)No 237 48·1 Reference
Animals at same pasture simultaneouslywith sheep
None 160 52·5 ReferenceCattle 66 59·1 1·30 (0·73–2·33)Other 27 18·5 0·21 (0·07–0·66)
Cattle at same pasture but notsimultaneously with sheep†
Yes 62 74·2 3·90 (1·74–8·72)No 188 42·0 Reference
Straw bedding in the stables Yes 243 50·2 0·69 (0·40–1·21)No 5 60·0 ReferenceNo stable 10 50·0 0·31 (0·24–1·68)
How often bedding in stableis refreshed†
Every other day or more 200 53·0 1·77 (0·83–3·76)Once or twice a week 47 38·3 ReferenceNo stable 10 50·0 1·46 (0·49–4·35)
Air enters stable through door† Yes 163 46·6 0·64 (0·35–1·18)No 79 58·2 ReferenceNo stable 10 50·0 0·67 (0·25–1·80)
No farm animals present on farmother than sheep
Yes 73 42·5 0·63 (0·34–1·14)No 183 53·6 Reference
Other farm animals present insheep stables
Yes 164 54·9 1·71 (0·98–3·00)No 92 42·4 Reference
Laying hen in stable† Yes 35 65·7 2·11 (0·88–5·04)No 215 47·9 Reference
Q fever infections sheep farm residents 1239

C. BURNETII SEROPREVALENCE AND RISK FACTORS IN SHEEP FARMERS | 129
4.3
in The Netherlands (n∼40), might elucidate furtherrisk factors next to the higher sheep seroprevalence,explaining the higher seroprevalence in dairy sheepfarm residents. Nevertheless, it might well be thatdairy farm residents were more exposed to Coxiella,as the seroprevalence in dairy sheep at these samefarms was significantly higher compared to that ofnon-dairy sheep (data not shown). A higher vulner-ability for infection of breeds selected for milkproduction rather than for disease resistance has pre-viously been observed for dairy cattle, dairy sheep,and dairy goats [29, 30]. In addition, dairy sheepare more often housed in stables compared to non-dairy sheep which spend most of the year outside.Indoor housing might facilitate the spread of C. bur-netii in dairy sheep and to humans. Moreover, thehigher seroprevalence in dairy farm residentsmight be explained by more intense contact withdairy sheep.
The seroprevalence of the dairy sheep farm resi-dents (66·7%) was comparable to the seroprevalenceof dairy goat farm residents (68·7%) in TheNetherlands [28]. Furthermore, the percentage of rela-tively recent infections (clinical status unknown as noquestions addressed current Q fever compatible symp-toms) in the dairy sheep farm residents (11·1%) iscomparable to that of the dairy goat farm residents(11·2%) [28]. Additionally, the percentage of partici-pants with an indication for a possible chronic infec-tion is also similarly high for dairy sheep and dairygoat farm residents (3·7% and 4·1%, respectively)[28]. In contrast, the percentage of relatively recentinfections and possible chronic infections are lowerfor non-dairy sheep farm residents (2·6% and 0%,respectively). Therefore, currently C. burnetii infectionseems to be a more serious and on-going health prob-lem in dairy goat and dairy sheep farm residentscompared to non-dairy sheep farm residents, althoughthe numbers are relatively small.
Although numbers are too low to draw any con-clusion and do not allow for valid statistical testing,the 10 (three from dairy and seven from non-dairyfarms) relatively recent (IgM phase II positive) caseswere generally younger (median 37 years vs. median50 years for the seronegatives), were more oftenmale (80% vs. 48%) and more often lived on a dairysheep farm (30% of the recently infected vs. 6%of the seronegatives). This may point to ongoinginfections especially in male dairy sheep farm re-sidents, in the relatively early days of their contactwith sheep.
Risk and protective factors for non-dairy sheepfarm residents
One of the protective factors for C. burnetii seroposi-tivty was sheep lambing outside. Farm residentsmight be less exposed to contaminated aerosols inthat situation, compared to lambing inside stables.
In addition, several risk factors for C. burnetii sero-positivity were identified in this study. McCaugheyet al. [31] suggested in his study in the general popu-lation (age 12–64 years) that most people acquiredC. burnetii infection between ages 25 and 34 yearsand after that age seroprevalence remained stable.This age trend was not seen in our study; sheep farmresidents had already a high seroprevalence at youngage (12–19 years). This might be explained byexposure to infected animals at a young age. The high-est seroprevalence found in humans (age 40–49 years),matches the most common age group of notified clini-cal Q fever cases in The Netherlands [9]. The increasedrisk at this age seems not to be explained by differ-ences in specific work activities, frequency of cattlecontact, or hours worked. Perhaps host factors playa role in the increased risk, or it generally reflects reg-ular exposure to the bacterium and repeated develop-ment of antibodies (booster effect), not adequatelymeasured by the questions in the questionnaire.
Animal movement is a known risk factor for thetransfer of microorganisms and should be discour-aged [32, 33]. Why specifically supply of sheepfrom the northern provinces of Noord-Hollandand Groningen showed an independent increasedrisk for infection of the farm residents is notclear. The seroprevalence in sheep in these two pro-vinces was not significantly different from pre-valences in other provinces, both in the currentstudy (B. Schimmer et al., unpublished data) and ina previous study in 2008 using convenience serumsamples from sheep [30].
It is also unknown why the fact that a farm startedbefore 1990 was a risk factor. No change in farm man-agement is known around that year that could influ-ence the risk of a C. burnetii infection.
Having the Blessumer sheep breed on the farmwas the next significant risk factor. This breed is acrossing of the breeds of Texel (non-dairy sheep)and Flemish sheep (dairy sheep); therefore, theBlessummer breed might have a lower disease resist-ance [29, 30]. Differences in infection rates betweensheep breeds have not yet been studied to investigatewhether Blessumer sheep are more often infected.
1238 M. M. A. de Lange and others
Table 3. Univariate multilevel analysis of farm-based factors related toC. burnetii seropositivity in non-dairy sheepfarm residents (P<0·20)
Variable Category
Frequency(N)(N=261)*
Sero-prevalence(%) OR (95% CI)
Urbanization†‡§ Moderate or minorurban area
28 67·9 2·00 (0·80–5·04)
Rural area 242 49·2 ReferenceGoat density (number of goats/km2 excludingown animals in a 5-km radius)†§
<2·9 135 38·5 Reference2·9–11·3 67 68·7 3·59 (1·86–6·91)511·4 68 58·8 2·38 (1·18–4·79)
Sheep density (number of sheep/km2 excludingown animals in 5-km radius)†§
<33·7 133 41·4 Reference33·7–79·0 69 53·6 1·68 (0·87–3·25)579·1 68 67·7 2·98 (1·54–5·78)
Cattle density (number of cattle/km2 in themunicipality)†§
< 200·0 240 47·9 Reference5200·0 30 76·7 3·20 (1·37–7·51)
Number of Q fever bulk-milk-positive dairygoat or dairy sheep farms in a 10-km radius†§
0 166 45·8 Reference1–4 104 59·6 1·78 (1·02–3·11)
Closest Q fever bulk-milk-positive dairy goator dairy sheep farms (km)§
<5·0 35 62·9 Reference5·0–9·9 69 58·0 0·39 (0·14–1·13)10·0–14·9 53 41·5 0·87 (0·30–2·54)15·0–19·9 41 61·0 0·82 (0·32–2·14)5 20·0 72 40·3 0·42 (0·16–1·10)
Year farm started† Before 1990 165 44·2 Reference1990 or later 75 61·3 1·97 (1·12–3·48)
Distance between house and pastures <30m 127 40·2 Reference530m 103 61·1 2·20 (1·23–3·94)
Number of male sheep 2010† <6 130 46·9 Reference6–20 56 60·7 1·78 (0·85–3·75)>20 41 51·2 1·20 (0·53–2·70)No 16 56·3 1·30 (0·42–4·00)
Zwartbles breed present on farm† Yes 30 63·3 1·75 (0·89–3·42)No 228 48·7 Reference
Rijnlam breed present on farm Yes 7 85·7 5·72 (0·78–42·12)No 251 49·4 Reference
Blessumer breed present on farm† Yes 21 76·2 3·51 (1·25–9·81)No 237 48·1 Reference
Animals at same pasture simultaneouslywith sheep
None 160 52·5 ReferenceCattle 66 59·1 1·30 (0·73–2·33)Other 27 18·5 0·21 (0·07–0·66)
Cattle at same pasture but notsimultaneously with sheep†
Yes 62 74·2 3·90 (1·74–8·72)No 188 42·0 Reference
Straw bedding in the stables Yes 243 50·2 0·69 (0·40–1·21)No 5 60·0 ReferenceNo stable 10 50·0 0·31 (0·24–1·68)
How often bedding in stableis refreshed†
Every other day or more 200 53·0 1·77 (0·83–3·76)Once or twice a week 47 38·3 ReferenceNo stable 10 50·0 1·46 (0·49–4·35)
Air enters stable through door† Yes 163 46·6 0·64 (0·35–1·18)No 79 58·2 ReferenceNo stable 10 50·0 0·67 (0·25–1·80)
No farm animals present on farmother than sheep
Yes 73 42·5 0·63 (0·34–1·14)No 183 53·6 Reference
Other farm animals present insheep stables
Yes 164 54·9 1·71 (0·98–3·00)No 92 42·4 Reference
Laying hen in stable† Yes 35 65·7 2·11 (0·88–5·04)No 215 47·9 Reference
Q fever infections sheep farm residents 1239
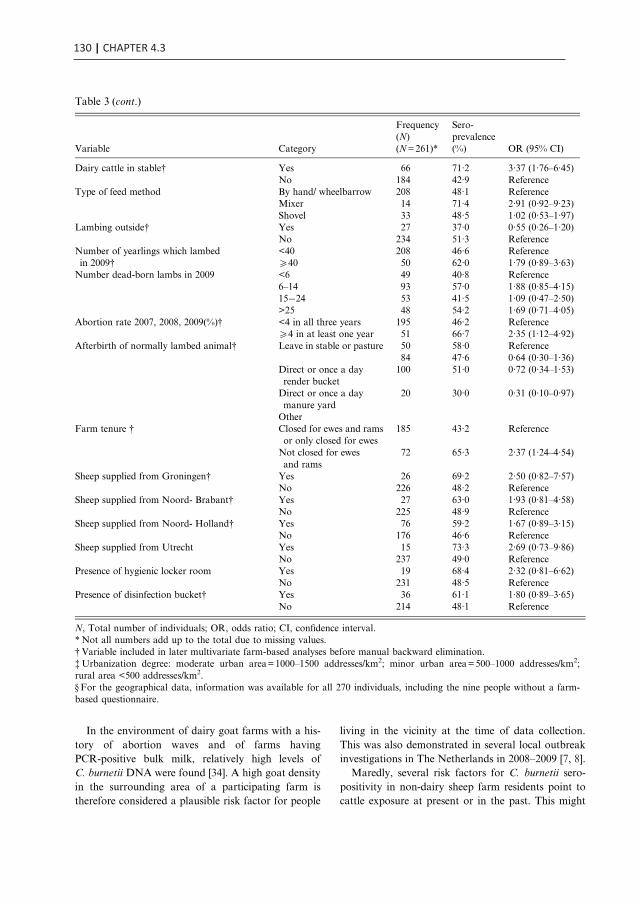
130 | CHAPTER 4.3
In the environment of dairy goat farms with a his-tory of abortion waves and of farms havingPCR-positive bulk milk, relatively high levels ofC. burnetii DNA were found [34]. A high goat densityin the surrounding area of a participating farm istherefore considered a plausible risk factor for people
living in the vicinity at the time of data collection.This was also demonstrated in several local outbreakinvestigations in The Netherlands in 2008–2009 [7, 8].
Maredly, several risk factors for C. burnetii sero-positivity in non-dairy sheep farm residents point tocattle exposure at present or in the past. This might
Table 3 (cont.)
Variable Category
Frequency(N)(N=261)*
Sero-prevalence(%) OR (95% CI)
Dairy cattle in stable† Yes 66 71·2 3·37 (1·76–6·45)No 184 42·9 Reference
Type of feed method By hand/ wheelbarrow 208 48·1 ReferenceMixer 14 71·4 2·91 (0·92–9·23)Shovel 33 48·5 1·02 (0·53–1·97)
Lambing outside† Yes 27 37·0 0·55 (0·26–1·20)No 234 51·3 Reference
Number of yearlings which lambedin 2009†
<40 208 46·6 Reference540 50 62·0 1·79 (0·89–3·63)
Number dead-born lambs in 2009 <6 49 40·8 Reference6–14 93 57·0 1·88 (0·85–4·15)15−24 53 41·5 1·09 (0·47–2·50)>25 48 54·2 1·69 (0·71–4·05)
Abortion rate 2007, 2008, 2009(%)† <4 in all three years 195 46·2 Reference54 in at least one year 51 66·7 2·35 (1·12–4·92)
Afterbirth of normally lambed animal† Leave in stable or pasture 50 58·0 Reference84 47·6 0·64 (0·30–1·36)
Direct or once a dayrender bucket
100 51·0 0·72 (0·34–1·53)
Direct or once a daymanure yard
20 30·0 0·31 (0·10–0·97)
OtherFarm tenure † Closed for ewes and rams
or only closed for ewes185 43·2 Reference
Not closed for ewesand rams
72 65·3 2·37 (1·24–4·54)
Sheep supplied from Groningen† Yes 26 69·2 2·50 (0·82–7·57)No 226 48·2 Reference
Sheep supplied from Noord- Brabant† Yes 27 63·0 1·93 (0·81–4·58)No 225 48·9 Reference
Sheep supplied from Noord- Holland† Yes 76 59·2 1·67 (0·89–3·15)No 176 46·6 Reference
Sheep supplied from Utrecht Yes 15 73·3 2·69 (0·73–9·86)No 237 49·0 Reference
Presence of hygienic locker room Yes 19 68·4 2·32 (0·81–6·62)No 231 48·5 Reference
Presence of disinfection bucket† Yes 36 61·1 1·80 (0·89–3·65)No 214 48·1 Reference
N, Total number of individuals; OR, odds ratio; CI, confidence interval.* Not all numbers add up to the total due to missing values.†Variable included in later multivariate farm-based analyses before manual backward elimination.‡Urbanization degree: moderate urban area=1000–1500 addresses/km2; minor urban area=500–1000 addresses/km2;rural area <500 addresses/km2.§ For the geographical data, information was available for all 270 individuals, including the nine people without a farm-based questionnaire.
1240 M. M. A. de Lange and others
suggest that cattle were partially responsible for theinfections observed in the sheep farm residents. In aprevious study in farmers (all farm types) contactwith cattle was also described as a risk [27]. A recent
published review including worldwide studies,suggested a higher seroprevalence of C. burnetii incattle compared to goat and sheep [35]. In TheNetherlands, a prevalence of 78·6% for antibodies
Table 4. Results of the multivariate logistic regression analysis for the individual characteristics (P<0·10, −2LL)in relation to non-dairy sheep farm residents C. burnetii seropositivity
Variable Category OR (95% CI)
Age (years) 12–19 2·81 (0·85–9·35)20–39 1·42 (0·57–3·54)40–49 2·29 (1·00–5·24)50–59 1·12 (0·50–2·48)>60 Reference
Amount of work at farm Full working week 2·42 (1·13–5·15)Up to half a working week 1·23 (0·65–2·33)Never/occasionally Reference
Contact with cattle at own or other farm* Yes 3·87 (2·13–7·04)No Reference
Worked in cattle sector in the past Yes 1·79 (1·01–3·18)No Reference
OR, Odds ratio; CI, confidence interval; −2LL, likelihood ratio test; AIC, Akaike’s Information Criterion.Number of observations used: 266 (AIC=340·38).* See animals at <5m or touch animals.
Table 5. Results of the multilevel analysis with farm-based characteristics (P<0·10) as independent factorsin relation to non-dairy sheep farm residents C. burnetii seroprevalence
Variable Category OR (95% CI)
Goat density (number of goats/km2 excluding ownanimals in a 5-km radius)
<2·9 Reference2·9–11·3 1·60 (0·75–3·43)511·4 3·80 (1·67–8·65)
Year farm started Before 1990 Reference1990 or later 3·97 (1·79–8·82)
Blessumer breed present on farm Yes 5·19 (2·36–11·41)No Reference
Cattle at same pasture but not simultaneously with sheep Yes 5·14 (2·17–12·19)No Reference
How often bedding in stable is refreshed Every other day or more 3·24 (1·49–7·07)Once or twice a week ReferenceNo stable 8·91 (2·17–36·68)
Air enters stable through door Yes 0·46 (0·23–0·92)No ReferenceNo stable 8·91 (2·17–36·68)
Dairy cattle present during stabling period of sheep Yes 3·33 (1·17–9·46)No Reference
Lambing outside Yes 0·34 (0·14–0·86)No Reference
Sheep supplied from Groningen Yes 4·17 (1·59–10·97)No Reference
Sheep supplied from Noord-Holland Yes 3·93 (1·74–8·90)No Reference
OR, Odds ratio; CI, confidence interval; QIC, quasi-likelihood under the independence model criterion.Number of observations used: 212. Number of levels used: 107 (QIC=232·9560).
Q fever infections sheep farm residents 1241
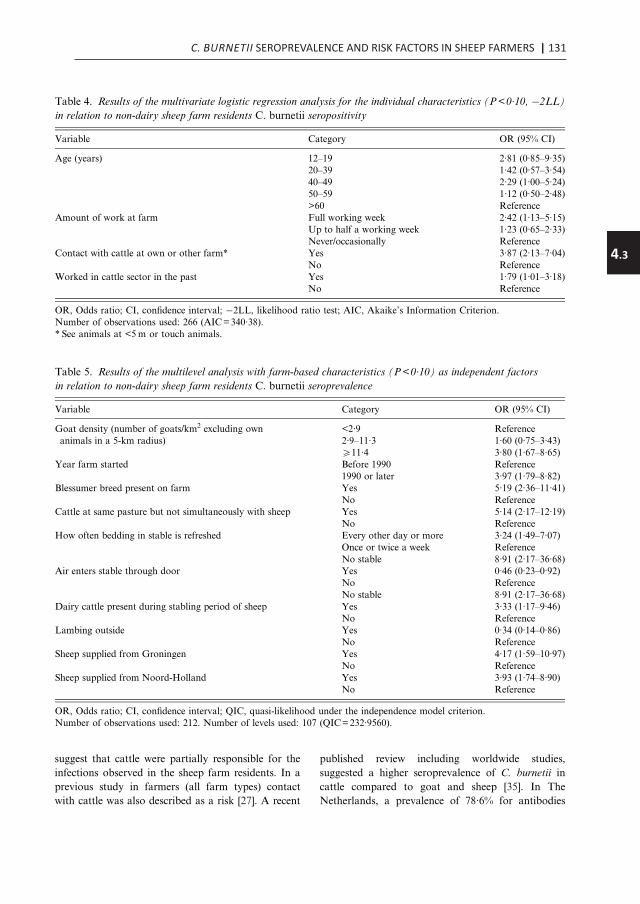
C. BURNETII SEROPREVALENCE AND RISK FACTORS IN SHEEP FARMERS | 131
4.3
In the environment of dairy goat farms with a his-tory of abortion waves and of farms havingPCR-positive bulk milk, relatively high levels ofC. burnetii DNA were found [34]. A high goat densityin the surrounding area of a participating farm istherefore considered a plausible risk factor for people
living in the vicinity at the time of data collection.This was also demonstrated in several local outbreakinvestigations in The Netherlands in 2008–2009 [7, 8].
Maredly, several risk factors for C. burnetii sero-positivity in non-dairy sheep farm residents point tocattle exposure at present or in the past. This might
Table 3 (cont.)
Variable Category
Frequency(N)(N=261)*
Sero-prevalence(%) OR (95% CI)
Dairy cattle in stable† Yes 66 71·2 3·37 (1·76–6·45)No 184 42·9 Reference
Type of feed method By hand/ wheelbarrow 208 48·1 ReferenceMixer 14 71·4 2·91 (0·92–9·23)Shovel 33 48·5 1·02 (0·53–1·97)
Lambing outside† Yes 27 37·0 0·55 (0·26–1·20)No 234 51·3 Reference
Number of yearlings which lambedin 2009†
<40 208 46·6 Reference540 50 62·0 1·79 (0·89–3·63)
Number dead-born lambs in 2009 <6 49 40·8 Reference6–14 93 57·0 1·88 (0·85–4·15)15−24 53 41·5 1·09 (0·47–2·50)>25 48 54·2 1·69 (0·71–4·05)
Abortion rate 2007, 2008, 2009(%)† <4 in all three years 195 46·2 Reference54 in at least one year 51 66·7 2·35 (1·12–4·92)
Afterbirth of normally lambed animal† Leave in stable or pasture 50 58·0 Reference84 47·6 0·64 (0·30–1·36)
Direct or once a dayrender bucket
100 51·0 0·72 (0·34–1·53)
Direct or once a daymanure yard
20 30·0 0·31 (0·10–0·97)
OtherFarm tenure † Closed for ewes and rams
or only closed for ewes185 43·2 Reference
Not closed for ewesand rams
72 65·3 2·37 (1·24–4·54)
Sheep supplied from Groningen† Yes 26 69·2 2·50 (0·82–7·57)No 226 48·2 Reference
Sheep supplied from Noord- Brabant† Yes 27 63·0 1·93 (0·81–4·58)No 225 48·9 Reference
Sheep supplied from Noord- Holland† Yes 76 59·2 1·67 (0·89–3·15)No 176 46·6 Reference
Sheep supplied from Utrecht Yes 15 73·3 2·69 (0·73–9·86)No 237 49·0 Reference
Presence of hygienic locker room Yes 19 68·4 2·32 (0·81–6·62)No 231 48·5 Reference
Presence of disinfection bucket† Yes 36 61·1 1·80 (0·89–3·65)No 214 48·1 Reference
N, Total number of individuals; OR, odds ratio; CI, confidence interval.* Not all numbers add up to the total due to missing values.†Variable included in later multivariate farm-based analyses before manual backward elimination.‡Urbanization degree: moderate urban area=1000–1500 addresses/km2; minor urban area=500–1000 addresses/km2;rural area <500 addresses/km2.§ For the geographical data, information was available for all 270 individuals, including the nine people without a farm-based questionnaire.
1240 M. M. A. de Lange and others
suggest that cattle were partially responsible for theinfections observed in the sheep farm residents. In aprevious study in farmers (all farm types) contactwith cattle was also described as a risk [27]. A recent
published review including worldwide studies,suggested a higher seroprevalence of C. burnetii incattle compared to goat and sheep [35]. In TheNetherlands, a prevalence of 78·6% for antibodies
Table 4. Results of the multivariate logistic regression analysis for the individual characteristics (P<0·10, −2LL)in relation to non-dairy sheep farm residents C. burnetii seropositivity
Variable Category OR (95% CI)
Age (years) 12–19 2·81 (0·85–9·35)20–39 1·42 (0·57–3·54)40–49 2·29 (1·00–5·24)50–59 1·12 (0·50–2·48)>60 Reference
Amount of work at farm Full working week 2·42 (1·13–5·15)Up to half a working week 1·23 (0·65–2·33)Never/occasionally Reference
Contact with cattle at own or other farm* Yes 3·87 (2·13–7·04)No Reference
Worked in cattle sector in the past Yes 1·79 (1·01–3·18)No Reference
OR, Odds ratio; CI, confidence interval; −2LL, likelihood ratio test; AIC, Akaike’s Information Criterion.Number of observations used: 266 (AIC=340·38).* See animals at <5m or touch animals.
Table 5. Results of the multilevel analysis with farm-based characteristics (P<0·10) as independent factorsin relation to non-dairy sheep farm residents C. burnetii seroprevalence
Variable Category OR (95% CI)
Goat density (number of goats/km2 excluding ownanimals in a 5-km radius)
<2·9 Reference2·9–11·3 1·60 (0·75–3·43)511·4 3·80 (1·67–8·65)
Year farm started Before 1990 Reference1990 or later 3·97 (1·79–8·82)
Blessumer breed present on farm Yes 5·19 (2·36–11·41)No Reference
Cattle at same pasture but not simultaneously with sheep Yes 5·14 (2·17–12·19)No Reference
How often bedding in stable is refreshed Every other day or more 3·24 (1·49–7·07)Once or twice a week ReferenceNo stable 8·91 (2·17–36·68)
Air enters stable through door Yes 0·46 (0·23–0·92)No ReferenceNo stable 8·91 (2·17–36·68)
Dairy cattle present during stabling period of sheep Yes 3·33 (1·17–9·46)No Reference
Lambing outside Yes 0·34 (0·14–0·86)No Reference
Sheep supplied from Groningen Yes 4·17 (1·59–10·97)No Reference
Sheep supplied from Noord-Holland Yes 3·93 (1·74–8·90)No Reference
OR, Odds ratio; CI, confidence interval; QIC, quasi-likelihood under the independence model criterion.Number of observations used: 212. Number of levels used: 107 (QIC=232·9560).
Q fever infections sheep farm residents 1241

132 | CHAPTER 4.3
in cattle bulk tank milk was found, confirming wide-spread circulation of the bacterium in cattle [36]. Tofurther assess the risk for human infection fromcattle, a similar study addressing the seroprevalenceand risk factors in dairy cattle farm residents isbeing finalized in The Netherlands. A role for cattlein the human infections observed in the currentsheep farm study, is also supported by the fact thatthe high seroprevalence in sheep farm residents doesnot seem to correspond with the low sheep seropreva-lence at the participating farms (<2%). The role ofspecific activities with sheep for the infection riskwas presumably relatively small, although not absenttaking into account the significant association betweenhuman and sheep seroprevalence at the participating
non-dairy farms. Whether sheep themselves are atincreased risk for infection because of contact withcattle or nearby goat populations is currentlyunder investigation. In The Netherlands, a dominantC. burnetii genotype was identified in humans, goats,and sheep throughout the entire affected area; the gen-otype found in cattle appeared to be different [37, 38].
Based on the results of the present study, some rec-ommendations can be made. First, we want to eluci-date the transmission cycle between different speciesof ruminants and farm residents; strains from goat,sheep, cattle, and sheep farm residents could be sub-typed and compared. Second, more research is neededto investigate whether the Blessumer breed is moreoften infected compared to other breeds. Third,
Table 6. Results of the multilevel analysis with individual and farm-based characteristics (P<0·10) as independentfactors in relation to non-dairy sheep farm residents C. burnetii seroprevalence
Variable Category OR (95% CI)
Age (years) 12–19 0·96 (0·29–3·21)20–39 1·96 (0·56–6·90)40–49 2·43 (0·98–6·04)50–59 1·54 (0·63–3·78)>60 Reference
Contact with cattle at own or other farm* Yes 2·32 (1·02–5·29)No Reference
Worked in cattle sector in the past Yes 3·98 (1·71–9·25)No Reference
Goat density (number of goats/km2 excluding ownanimals in a 5-km radius)
<2·9 Reference2·9–11·3 1·11 (0·46–2·68)511·4 5·86 (1·81–18·95)
Year farm started Before 1990 Reference1990 or Later 3·67 (1·45–9·31)
Blessumer breed present on farm Yes 4·49 (1·59–12·65)No Reference
Cattle at same pasture but not simultaneously with sheep Yes 5·77 (2·29–14·56)No Reference
How often bedding in stable is refreshed Every other day or more 4·58 (1·69–12·37)Once or twice a week ReferenceNo stable 8·34 (1·71–40·60)
Air enters stable through door Yes 0·47 (0·21–1·01)No ReferenceNo stable 8·34 (1·71–40·60)
Dairy cattle present during stabling period of sheep Yes 2·69 (0·81–8·95)No Reference
Lambing outside Yes 0·33 (0·12–0·92)No Reference
Sheep supplied from Groningen Yes 5·05 (1·73–14·69)No Reference
Sheep supplied from Noord-Holland Yes 3·63 (1·27–10·33)No Reference
OR, Odds ratio; CI, confidence interval; QIC, quasi-likelihood under the independence model criterion.Number of observations used: 208. Number of levels used: 105 (QIC=219·1157).* See animals at <5m or touch animals.
1242 M. M. A. de Lange and others
in this study a high seroprevalence in spouses wasfound (36·3% non-dairy farm spouses, 50·0% dairyfarm spouses). Therefore, we emphasize the impor-tance of the advice that pregnant women shouldavoid contact with sheep during the lambing season,and that they should avoid contact with birth productsof sheep. Currently, the Dutch Health Council is pre-paring an advice about vaccination of high-risk pro-fessionals, including several farm populations. Forthis advice, they also will take into account the resultsof this study.
Limitations
The study of non-dairy sheep farms had a lowresponse rate of 9·1%. As reported by several farmersnot willing to participate, sheep were outside whenthe request to participate was made, and it would betoo labour-intensive to collect about 60 sheep forblood sampling. In addition, this part of the sheepindustry was not affected by the implemented controlmeasures, mainly targeted at farms with dairy sheepand dairy goats. Therefore, non-dairy sheep farmersmight be less motivated to participate compared tothe small dairy sheep sector, which had a responserate of 38%.
Except for differences in sheep density in the sur-roundings and the number of sheep on their farms,participating and non-participating non-dairy sheepfarms appeared to be comparable. As both factorswere not related to seropositivity, this selectiveresponse is not thought to be of influence on thestudy results, which are therefore considered represen-tative for the Dutch professional non-dairy sheepsector.
At 79% of the 119 participating non-dairy farmsboth the farmer and partner participated in thestudy. Therefore, results for the farmers and partnersare considered representative of the group of farm-ers/partners at the participating farms. It was notregistered how many children aged 512 years livedat the participating non-dairy farms, and we cannotbe absolutely sure that the participating childrenwere representative of all children in this age category.
CONCLUSION
This study demonstrates that C. burnetii infection iscommon in individuals living and/or working at asheep farm in The Netherlands. Except for theirsheep, the risk also seems dictated by contact with
cattle at present or in the past and by nearby goatpopulations.
ACKNOWLEDGEMENTS
We are grateful to all participants without whom thestudy could not have been conducted. We thank alllaboratory assistants for collection of serum samples,Jamie Meekelenkamp for laboratory analyses, NoelPeters for sending test results to participants, SanneKelderman for invitation mailings and providingreference data, Helen Aangenend for organizinglogistics of human data collection, and Ben Bom forgenerating geographical information. Finally, wethank all expert members of the Q-VIVE projectgroup and affiliated organizations for their supportand advice during the study: Jan van den Bergh,Olaf Stenvers, Rob van Oosterom, Mark Paauw,Harry Stinis, Ad de Rooij, Margo Vonk, Clemen-tine Wijkmans and Wim van der Hoek.
The study was funded by The NetherlandsOrganization for Health Research and Development[grant no. 50-50800-98-100: An integrated study onQ fever in livestock farmers and their (small) rumi-nants in The Netherlands]; and co-financed by theMinistry of Public Health and the Ministry ofAgriculture. The funders had no role in study design,data collection and analysis, decision to publish, orpreparation of the manuscript.
DECLARATION OF INTEREST
None.
REFERENCES
1. Maurin M, Raoult D. Q fever. Clinical MicrobiologyReviews 1999; 12: 518–553.
2. Marrie TJ, et al. Truckin’ pneumonia–an outbreak of Qfever in a truck repair plant probably due to aerosolsfrom clothing contaminated by contact with newbornkittens. Epidemiology and Infection 1989; 102: 119–127.
3. Gonder JC, et al. Cynomolgus monkey model for exper-imental Q fever infection. Journal of Infectious Diseases1979; 139: 191–196.
4. Raoult D, et al. Q fever 1985–1998. Clinical and epi-demiologic features of 1,383 infections. Medicine(Baltimore) 2000; 79: 109–123.
5. van der Hoek W, et al. Shifting priorities in the after-math of a Q fever epidemic in 2007 to 2009 in TheNetherlands: from acute to chronic infection. Euro-surveillance 2012; 17: pii=20059.
Q fever infections sheep farm residents 1243

C. BURNETII SEROPREVALENCE AND RISK FACTORS IN SHEEP FARMERS | 133
4.3
in cattle bulk tank milk was found, confirming wide-spread circulation of the bacterium in cattle [36]. Tofurther assess the risk for human infection fromcattle, a similar study addressing the seroprevalenceand risk factors in dairy cattle farm residents isbeing finalized in The Netherlands. A role for cattlein the human infections observed in the currentsheep farm study, is also supported by the fact thatthe high seroprevalence in sheep farm residents doesnot seem to correspond with the low sheep seropreva-lence at the participating farms (<2%). The role ofspecific activities with sheep for the infection riskwas presumably relatively small, although not absenttaking into account the significant association betweenhuman and sheep seroprevalence at the participating
non-dairy farms. Whether sheep themselves are atincreased risk for infection because of contact withcattle or nearby goat populations is currentlyunder investigation. In The Netherlands, a dominantC. burnetii genotype was identified in humans, goats,and sheep throughout the entire affected area; the gen-otype found in cattle appeared to be different [37, 38].
Based on the results of the present study, some rec-ommendations can be made. First, we want to eluci-date the transmission cycle between different speciesof ruminants and farm residents; strains from goat,sheep, cattle, and sheep farm residents could be sub-typed and compared. Second, more research is neededto investigate whether the Blessumer breed is moreoften infected compared to other breeds. Third,
Table 6. Results of the multilevel analysis with individual and farm-based characteristics (P<0·10) as independentfactors in relation to non-dairy sheep farm residents C. burnetii seroprevalence
Variable Category OR (95% CI)
Age (years) 12–19 0·96 (0·29–3·21)20–39 1·96 (0·56–6·90)40–49 2·43 (0·98–6·04)50–59 1·54 (0·63–3·78)>60 Reference
Contact with cattle at own or other farm* Yes 2·32 (1·02–5·29)No Reference
Worked in cattle sector in the past Yes 3·98 (1·71–9·25)No Reference
Goat density (number of goats/km2 excluding ownanimals in a 5-km radius)
<2·9 Reference2·9–11·3 1·11 (0·46–2·68)511·4 5·86 (1·81–18·95)
Year farm started Before 1990 Reference1990 or Later 3·67 (1·45–9·31)
Blessumer breed present on farm Yes 4·49 (1·59–12·65)No Reference
Cattle at same pasture but not simultaneously with sheep Yes 5·77 (2·29–14·56)No Reference
How often bedding in stable is refreshed Every other day or more 4·58 (1·69–12·37)Once or twice a week ReferenceNo stable 8·34 (1·71–40·60)
Air enters stable through door Yes 0·47 (0·21–1·01)No ReferenceNo stable 8·34 (1·71–40·60)
Dairy cattle present during stabling period of sheep Yes 2·69 (0·81–8·95)No Reference
Lambing outside Yes 0·33 (0·12–0·92)No Reference
Sheep supplied from Groningen Yes 5·05 (1·73–14·69)No Reference
Sheep supplied from Noord-Holland Yes 3·63 (1·27–10·33)No Reference
OR, Odds ratio; CI, confidence interval; QIC, quasi-likelihood under the independence model criterion.Number of observations used: 208. Number of levels used: 105 (QIC=219·1157).* See animals at <5m or touch animals.
1242 M. M. A. de Lange and others
in this study a high seroprevalence in spouses wasfound (36·3% non-dairy farm spouses, 50·0% dairyfarm spouses). Therefore, we emphasize the impor-tance of the advice that pregnant women shouldavoid contact with sheep during the lambing season,and that they should avoid contact with birth productsof sheep. Currently, the Dutch Health Council is pre-paring an advice about vaccination of high-risk pro-fessionals, including several farm populations. Forthis advice, they also will take into account the resultsof this study.
Limitations
The study of non-dairy sheep farms had a lowresponse rate of 9·1%. As reported by several farmersnot willing to participate, sheep were outside whenthe request to participate was made, and it would betoo labour-intensive to collect about 60 sheep forblood sampling. In addition, this part of the sheepindustry was not affected by the implemented controlmeasures, mainly targeted at farms with dairy sheepand dairy goats. Therefore, non-dairy sheep farmersmight be less motivated to participate compared tothe small dairy sheep sector, which had a responserate of 38%.
Except for differences in sheep density in the sur-roundings and the number of sheep on their farms,participating and non-participating non-dairy sheepfarms appeared to be comparable. As both factorswere not related to seropositivity, this selectiveresponse is not thought to be of influence on thestudy results, which are therefore considered represen-tative for the Dutch professional non-dairy sheepsector.
At 79% of the 119 participating non-dairy farmsboth the farmer and partner participated in thestudy. Therefore, results for the farmers and partnersare considered representative of the group of farm-ers/partners at the participating farms. It was notregistered how many children aged 512 years livedat the participating non-dairy farms, and we cannotbe absolutely sure that the participating childrenwere representative of all children in this age category.
CONCLUSION
This study demonstrates that C. burnetii infection iscommon in individuals living and/or working at asheep farm in The Netherlands. Except for theirsheep, the risk also seems dictated by contact with
cattle at present or in the past and by nearby goatpopulations.
ACKNOWLEDGEMENTS
We are grateful to all participants without whom thestudy could not have been conducted. We thank alllaboratory assistants for collection of serum samples,Jamie Meekelenkamp for laboratory analyses, NoelPeters for sending test results to participants, SanneKelderman for invitation mailings and providingreference data, Helen Aangenend for organizinglogistics of human data collection, and Ben Bom forgenerating geographical information. Finally, wethank all expert members of the Q-VIVE projectgroup and affiliated organizations for their supportand advice during the study: Jan van den Bergh,Olaf Stenvers, Rob van Oosterom, Mark Paauw,Harry Stinis, Ad de Rooij, Margo Vonk, Clemen-tine Wijkmans and Wim van der Hoek.
The study was funded by The NetherlandsOrganization for Health Research and Development[grant no. 50-50800-98-100: An integrated study onQ fever in livestock farmers and their (small) rumi-nants in The Netherlands]; and co-financed by theMinistry of Public Health and the Ministry ofAgriculture. The funders had no role in study design,data collection and analysis, decision to publish, orpreparation of the manuscript.
DECLARATION OF INTEREST
None.
REFERENCES
1. Maurin M, Raoult D. Q fever. Clinical MicrobiologyReviews 1999; 12: 518–553.
2. Marrie TJ, et al. Truckin’ pneumonia–an outbreak of Qfever in a truck repair plant probably due to aerosolsfrom clothing contaminated by contact with newbornkittens. Epidemiology and Infection 1989; 102: 119–127.
3. Gonder JC, et al. Cynomolgus monkey model for exper-imental Q fever infection. Journal of Infectious Diseases1979; 139: 191–196.
4. Raoult D, et al. Q fever 1985–1998. Clinical and epi-demiologic features of 1,383 infections. Medicine(Baltimore) 2000; 79: 109–123.
5. van der Hoek W, et al. Shifting priorities in the after-math of a Q fever epidemic in 2007 to 2009 in TheNetherlands: from acute to chronic infection. Euro-surveillance 2012; 17: pii=20059.
Q fever infections sheep farm residents 1243
134 | CHAPTER 4.3
6. van der Hoek W, et al. Q fever in the Netherlands: anupdate on the epidemiology and control measures.Eurosurveillance 2010; 15: pii=19520.
7. Karagiannis I, et al. Investigation of a Q fever outbreakin a rural area of The Netherlands. Epidemiology andInfection 2009; 137: 1283–1294.
8. Schimmer B, et al. The use of a geographic informationsystem to identify a dairy goat farm as the most likelysource of an urban Q-fever outbreak. BMC InfectiousDiseases 2010; 10: 69.
9. Schimmer B, et al. Sustained intensive transmissionof Q fever in the south of the Netherlands, 2009.Eurosurveillance 2009; 14: pii=19210.
10. van der Hoek W, et al. Human Q fever and non-dairyfarm [in Dutch]. National Institute of Public Healthand Environment, 2010. Report No.: 2010/02.
11. Koene RP, et al. A Q fever outbreak in a psychiatriccare institution in The Netherlands. Epidemiology andInfection 2011; 139: 13–18.
12. Whelan J, et al. Visits on ‘lamb-viewing days’ at asheep farm open to the public was a risk factor for Qfever in 2009. Epidemiology and Infection 2012; 140:858–864.
13. Gilsdorf A, et al. Large Q fever outbreak due to sheepfarming near residential areas, Germany, 2005. Epi-demiology and Infection 2008; 136: 1084–1087.
14. Hellenbrand W, Breuer T, Petersen L. Changing epide-miology of Q fever in Germany, 1947–1999. EmergingInfectious Diseases 2001; 7: 789–796.
15. Porten K, et al. A super-spreading ewe infects hundredswith Q fever at a farmers’ market in Germany. BMCInfectious Diseases 2006; 6: 147.
16. Medic A, et al. Q fever epidemic among employees in afactory in the suburb of Zadar, Croatia. CroatianMedical Journal 2005; 46: 315–319.
17. Dupuis G, et al. An important outbreak of human Qfever in a Swiss Alpine valley. International Journal ofEpidemiology 1987; 16: 282–287.
18. Starnini G, et al. An outbreak of Q fever in a prison inItaly. Epidemiology and Infection 2005; 133: 377–380.
19. Manfredi Selvaggi T, et al. Investigation of a Q-feveroutbreak in northern Italy. European Journal ofEpidemiology 1996; 12: 403–408.
20. Wegdam-Blans MCA, et al. Evaluation of commonlyused serological tests for detection of Coxiellaburnetii antibodies in well-defined acute and follow-up sera. Clinical and Vaccine Immunology 2012; 19:1110–1115.
21. Hussain-Yusuf H, et al. An analysis of Q fever patients 6years after an outbreak in Newport, Wales, UK. QJM:an International Journal of Medicine 2012; 105: 1067–1073.
22. Wegdam-Blans MCA, et al. Chronic Q fever: review ofthe literature and a proposal of new diagnostic criteria.Journal of Infection 2012; 64: 247–259.
23. Schimmer B, et al. Low seroprevalence of Q fever in TheNetherlands prior to a series of large outbreaks.Epidemiology and Infection 2012; 140: 27–35.
24. Hogema BM, et al. Coxiella burnetii infection amongblood donors during the 2009 Q-fever outbreak in TheNetherlands. Transfusion 2012; 52: 144–150.
25. Macellaro A, Akesson A, Norlander L. A survey ofQ-fever in Sweden. European Journal of Epidemiology1993; 9: 213–216.
26. Cisak E, et al. Prevalence of antibodies to Coxiella bur-netii among farming population in eastern Poland.Annals of Agricultural and Environmental Medicine2003; 10: 265–267.
27. Thomas DR, et al. The risk of acquiring Q fever onfarms: a seroepidemiological study. Occupational andEnvironmental Medicine 1995; 52: 644–647.
28. Schimmer B, et al. Seroprevalence and Risk Factors forCoxiella burnetii (Q Fever) Seropositivity in Dairy GoatFarmers’ Households in The Netherlands, 2009–2010.PLoS One 2012; 7: e42364.
29. Rauw WM, et al. Undesirable side effects of selectionfor high production efficiency in farm animals: a review.Livestock Production Science 1998; 56: 15–33.
30. van den Brom R, et al. Demography of Q fever seropre-valence in sheep and goats in The Netherlands in 2008.Preventive Veterinary Medicine 2012.
31. McCaughey C, et al. Human seroprevalence to Coxiellaburnetii (Q fever) in Northern Ireland. Zoonoses PublicHealth 2008; 55: 189–194.
32. Bölske G, et al. Bovine tuberculosis in Swedish deerfarms: epidemiological investigations and tracing usingrestriction fragment analysis. Veterinary Record 1995;136: 414–417.
33. Mansley LM, et al. Early dissemination of foot-and-mouth disease virus through sheep marketing inFebruary 2001. Veterinary Record 2003; 153: 43–50.
34. de Bruin A, et al.Detection of Coxiella burnetiiDNA onsmall-ruminant farms during a Q fever outbreak in theNetherlands. Applied and Environmental Microbiology2012; 78: 1652–1657.
35. Guatteo R, et al. Prevalence of Coxiella burnetiiinfection in domestic ruminants: a critical review.Veterinary Microbiology 2011; 149: 1–16.
36. Muskens J, et al. Prevalence of Coxiella burnetii infec-tion in Dutch dairy herds based on testing bulk tankmilk and individual samples by PCR and ELISA.Veterinary Record 2011; 168: 79.
37. Roest HIJ, et al. Molecular epidemiology of Coxiellaburnetii from ruminants in Q fever outbreak, theNetherlands. Emerging Infectious Diseases 2011; 17:668–675.
38. Tilburg JJHC, et al. Epidemic genotype of Coxiellaburnetii among goats, sheep, and humans in theNetherlands. Emerging Infectious Diseases 2012; 18:887–889.
1244 M. M. A. de Lange and others

CHAPTER 4.4
Coxiella burnetii seroprevalence and risk factors on commercial sheep farms in The Netherlands
B. SchimmerM.M. de Lange
J.L. HautvastP. Vellema
Y.T.H.P. van Duijnhoven
Vet Rec. 2014 Jul 5;175(1):17

CHAPTER 4.4
Coxiella burnetii seroprevalence and risk factors on commercial sheep farms in The Netherlands
B. SchimmerM.M. de Lange
J.L. HautvastP. Vellema
Y.T.H.P. van Duijnhoven
Vet Rec. 2014 Jul 5;175(1):17

Time-course of antibody responses against Coxiella burnetiifollowing acute Q fever
P. F. M. TEUNIS 1,2*, B. SCHIMMER 1, D. W. NOTERMANS3,
A. C. A. P. LEENDERS 4, P. C. WEVER 4, M. E. E. KRETZSCHMAR1,5
AND P. M. SCHNEEBERGER 4
1 Centre for Infectious Disease Control, Epidemiology and Surveillance Unit, RIVM, Bilthoven, The Netherlands2 Hubert Department of Global Health, Rollins School of Public Health, Emory University, Atlanta, GA, USA3 Centre for Infectious Disease Control, Laboratory for Infectious Diseases and Perinatal Screening, RIVM,Bilthoven, The Netherlands4 Jeroen Bosch Hospital, Department of Medical Microbiology and Infection Control,’s- Hertogenbosch, TheNetherlands5 Julius Centre for Health Sciences and Primary Care, University Medical Centre Utrecht, Utrecht, The
Netherlands
Received 11 October 2011; Final revision 15 February 2012; Accepted 15 February 2012;
first published online 4 April 2012
SUMMARY
Large outbreaks of Q fever in The Netherlands have provided a unique opportunity for studying
longitudinal serum antibody responses in patients. Results are presented of a cohort of 344
patients with acute symptoms of Q fever with three or more serum samples per patient. In all
these serum samples IgM and IgG against phase 1 and 2 Coxiella burnetii were measured by an
immunofluorescence assay. A mathematical model of the dynamic interaction of serum antibodies
and pathogens was used in a mixed model framework to quantitatively analyse responses to
C. burnetii infection. Responses show strong heterogeneity, with individual serum antibody
responses widely different in magnitude and shape. Features of the response, peak titre and decay
rate, are used to characterize the diversity of the observed responses. Binary mixture analysis of
IgG peak levels (phases 1 and 2) reveals a class of patients with high IgG peak titres that decay
slowly and may represent potential chronic cases. When combining the results of mixture analysis
into an odds score, it is concluded that not only high IgG phase 1 may be predictive for chronic
Q fever, but also that high IgG phase 2 may aid in detecting such putative chronic cases.
Key words: Coxiella, mathematical modelling, Q fever, serology, statistics.
INTRODUCTION
Since mid-2007 human cases of Q fever in The
Netherlands have increased sharply, with major out-
breaks in 2008 and 2009, reaching a total of about
4000 cases by 2010 [1–4]. Cases were predominantly
clustered in the south of The Netherlands [3] and the
majority of the laboratory samples were submitted
to one regional hospital : the Jeroen Bosch Hospital
in ’s-Hertogenbosch (about 2000 confirmed acute
Q fever cases). Follow-up of cases extended over a
period of up to 24 months. In the 3 years that this
outbreak persisted, laboratory results from over 2000
cases were collected in a laboratory database. This
* Author for correspondence : Professor P. F. M. Teunis, Centrefor Infectious Disease Control, Epidemiology and SurveillanceUnit, RIVM, PO Box 1, 3720BA Bilthoven, The Netherlands.(Email : [email protected])
Epidemiol. Infect. (2013), 141, 62–73. f Cambridge University Press 2012
doi:10.1017/S0950268812000404
Coxiella burnetii seroprevalence and risk factors on commercial sheep farms in The Netherlands
B. SCHIMMER1, M.M. DE LANGE1, J.L. HAUTVAST2, P. VELLEMA3, Y.T.H.P. VAN DUIJNHOVEN1
Coxiella burnetii seroprevalence was assessed on Dutch dairy and non-dairy sheep farms using ELISA. Risk factors for seropositivity on non-dairy sheep farms were identified at farm and sheep level by univariate and multivariate multilevel analyses. Based on 953 dairy and 5671 non-dairy serum samples, sheep seroprevalences were 18.7 per cent and 2.0 per cent, respectively, and 78.6 per cent and 30.5 per cent at farm level. Significant risk factors for non-dairy sheep farms were farm location in the south of the country, sheep kept on marginal grounds, one or several supply addresses for ewes during 2007–2009 and wearing farm boots and/or outfit by professional visitors. On sheep level, risk factors included among others farm location in the south of the country, lamb breeding as main farm purpose, goat density within 10 km farm radius, use of windbreak curtain or windshields, and presence of ≥6 stillborn lambs in 2009. Farm location in the south of the country and goat density suggests that infected goats have played a role in the transmission to non-dairy sheep. Other risk factors suggest introduction of the bacterium through sheep supply and professional visitors. Biosecurity measures should be strengthened, including avoiding infection during handling of stillborn lambs and birth products in the lambing period.
July 5, 2014 | Veterinary Record
Paper
Paper
Coxiella burnetii seroprevalence and risk factors on commercial sheep farms in The NetherlandsB. Schimmer, M. M. A. de Lange, J. L. A. Hautvast, P. Vellema, Y. T. H. P. van Duynhoven
Coxiella burnetii seroprevalence was assessed on Dutch dairy and non-dairy sheep farms using ELISA. Risk factors for seropositivity on non-dairy sheep farms were identified at farm and sheep level by univariate and multivariate multilevel analyses. Based on 953 dairy and 5671 non-dairy serum samples, sheep seroprevalences were 18.7 per cent and 2.0 per cent, respectively, and 78.6 per cent and 30.5 per cent at farm level. Significant risk factors for non-dairy sheep farms were farm location in the south of the country, sheep kept on marginal grounds, one or several supply addresses for ewes during 2007–2009 and wearing farm boots and/or outfit by professional visitors. On sheep level, risk factors included among others farm location in the south of the country, lamb breeding as main farm purpose, goat density within 10 km farm radius, use of windbreak curtain or windshields, and presence of ≥6 stillborn lambs in 2009. Farm location in the south of the country and goat density suggests that infected goats have played a role in the transmission to non-dairy sheep. Other risk factors suggest introduction of the bacterium through sheep supply and professional visitors. Biosecurity measures should be strengthened, including avoiding infection during handling of stillborn lambs and birth products in the lambing period.
IntroductionCoxiella burnetii infections in sheep are generally not considered a vet-erinary concern due to lack of significant impact on animal health. In The Netherlands, approximately 1,1 million sheep were kept in 2010. Most sheep are kept for meat production next to a relatively small dairy sheep sector for the production of dairy products. Besides, sheep can also be kept for breeding purposes or nature management. The highest sheep density is found in the coastal provinces. In The Netherlands, dairy sheep are usually milked twice a day during several months a year, and most of them are kept outdoors part of the year. Non-dairy sheep are generally kept outside, except for a few weeks around lambing that usually occurs in a stable.
During the protracted Dutch Q fever epidemic in 2007–2009, abortion waves at dairy goat and dairy sheep farms were considered the primary source of human infections (Roest and others 2011). The transmission of C. burnetii from non-dairy sheep farms to human beings seemed not as important as for dairy small ruminant farms (goat and sheep), although direct contact with non-dairy sheep was identified as the most probable source for several human Q fever clus-ters in The Netherlands during this period (Koene and others 2011, Whelan and others 2012) and internationally (Lyytikainen and others
1998, Grilc and others 2007, Porten and others 2006). While source-finding studies during the Q fever epidemic in The Netherlands iden-tified positive non-dairy sheep farms, no elevated risk for human Q fever was observed in the vicinity of such farms (van der Hoek and others 2012). The low sheep seroprevalence of 2.4 per cent in 2008 found in a convenience sample indicated that non-dairy sheep might play a minor role in the Dutch Q fever epidemic (Van den Brom and others 2013). In other European countries, recent seroprevalences on sheep level ranged between 3.1 per cent and 18.9 per cent and ranged between 3.0 per cent and 74.0 per cent on herd level. In 2008, the C. burnetii seroprevalence was also studied on dairy goat farms with 7.8 per cent of individual goats testing positive (ELISA) with the high-est seroprevalence in the southeastern part of the country (Van den Brom and others 2013). In the same year, the herd seroprevalence on Dutch dairy cattle farms was 78.6 per cent (ELISA) and 56.6 per cent (PCR) based on a submitted bulk tank milk (BTM) sample by each farm (Muskens and others 2011).
Representative data on seroprevalence of C. burnetii infections in dairy and non-dairy sheep are scarce. Moreover, risk factors for C. burnetii seropositivity in sheep have been rarely studied (Thomas and others 1995, Ruiz-Fons and others 2010, Van den Brom and others 2013). The aim of the current study was to estimate the C. burnetii seropreva-lence in a representative sample of non-vaccinated dairy and non-dairy sheep at farms with over 100 sheep in The Netherlands. Furthermore, we identified risk factors for seropositivity at farm and sheep level at non-dairy sheep farms in order to update control measures and to pro-vide targeted advice for the Dutch sheep industry.
Materials and methodsStudy design and sampling strategyIn this cross-sectional study in 2009–2011, we approached 33 dairy sheep farms and 1344 non-dairy sheep farms with at least 100 breed-ing ewes in November 2008, according to the national identification and registration database, for serum sampling and a farm question-naire (Figs 1 and 2). A farm with a minimum of 100 ewes was chosen as it was considered to be a commercial sheep farm. In the early stage
Veterinary Record (2014) doi: 10.1136/vr.102155
B. Schimmer, MD,M. M. A. de Lange, Msc,Y. T. H. P. van Duynhoven, PhD,National Institute for Public Health and the Environment, Centre for Infectious Disease Control Netherlands, P.O. Box 1, Bilthoven 3720 BA, The NetherlandsJ. L. A. Hautvast, MD, PhD,Department of Primary and Community Care, Academic Collaborative Centre for Public Health AMPHI, Radboud University Nijmegen Medical Centre,
P.O. Box 9101, Nijmegen 6500 HB, The NetherlandsP. Vellema, DVM, PhD, Dip.ECSRHM,Department of Small Ruminant Health, Animal Health Service (GD), P.O. Box 9, Deventer 7400 AA, The Netherlands
E-mail for correspondence: [email protected]
Provenance: not commissioned; externally peer reviewed
Accepted March 2, 2014
group.bmj.com on December 27, 2014 - Published by http://veterinaryrecord.bmj.com/Downloaded from
Affiliaties
Chapter 3.2
1Centre for Infectious Disease Control, National Institute for Public Health and the Environment, Bilthoven, the Netherlands 2Municipal Health Service ‘Brabant Zuidoost, Eindhoven, the Netherlands 3Laboratory for Pathology and Medical Microbiology, Veldhoven, the Netherlands 4Region East, Food and Consumer Product Safety Authority, Zutphen, the Netherlands 5Department of Medical Microbiology and Infection Control, Jeroen Bosch Hospital, ‘s Hertogenbosch, the Netherlands 6Department of Small Ruminant Health, Animal Health Service, Deventer, the Netherlands
Chapter 4.1
1 Centre for Infectious Disease Control, National Institute for Public Health and The Environment, Bilthoven, The Netherlands 2 Academic Collaborative Centre AMPHI, Department of Primary and Community Care, Radboud University Nijmegen Medical Centre, Nijmegen, The Netherlands 3 Department of Medical Microbiology and Infection Control, Jeroen Bosch Hospital, ’s-Hertogenbosch, The Netherlands 4 Department of Small Ruminant Health, Animal Health Service, Deventer, The Netherlands
Chapter 4.2 1Centre for Infectious Disease Control, National Institute for Public Health and the Environment, Bilthoven, the Netherlands 2Quantitative Veterinary Epidemiology Group, Wageningen Institute of Animal Sciences, Wageningen, The Netherlands 3Department of Small Ruminant Health, Animal Health Service, Deventer, The Netherlands 4Academic Collaborative Centre AMPHI, Department of Primary and Community Care, Radboud University Nijmegen Medical Centre, the Netherlands
Chapter 4.4 1Centre for Infectious Disease Control, National Institute for Public Health and the Environment, Bilthoven, the Netherlands 2 Academic Collaborative Centre AMPHI, Department of Primary and Community Care, Radboud University Nijmegen Medical Centre, Nijmegen, the Netherlands 3Department of Small Ruminant Health, Animal Health Service, Deventer, The Netherlands
Chapter 4.5 1 National Institute for Public Health and the Environment (RIVM), Bilthoven, the Netherlands 2 Animal Health Service,Deventer, the Netherlands 3 Radboud University Nijmegen Medical Centre, Nijmegen, the Netherlands 4. Jeroen Bosch Hospital, ‘s-Hertogenbosch, the Netherlands Chapter 4.6 1 GD Animal Health, Deventer, The Netherlands 2 Centre for Infectious Disease Control, National Institute for Public Health and the Environment, Bilthoven, the Netherlands 3 Department of Primary and Community Care, Academic Collaborative Centre for Public Health (AMPHI), Radboud University Nijmegen Medical Centre, Nijmegen, The Netherlands
Chapter 5.1 1 Department of Small Ruminant Health, Animal Health Service, Deventer, The Netherlands 2 Centre for Infectious Disease Control, National Institute for Public Health and the Environment, Bilthoven, The Netherlands 3 Department of Medical Microbiology and Infection Control, Jeroen Bosch Hospital, ‘s-Hertogenbosch, The Netherlands, 4 Department of Diagnostics, Research and Epidemiology, Animal Health Service, Deventer, The Netherlands
Chapter 5.2
1 Division of Environmental Epidemiology, Institute for Risk Assessment Sciences, Utrecht, the Netherlands 2 Centre for Infectious Disease Control, National Institute for Public Health and the Environment, Bilthoven, the Netherlands, 3 Department of Medical Microbiology and Infection Control, Jeroen Bosch Hospital, ‘s-Hertogenbosch, the Netherlands, 4 Division of Veterinary Public Health, Institute for Risk Assessment Sciences, Utrecht, the Netherlands
Chapter 5.3 1.National Institute for Public Health and the Environment, Bilthoven, the Netherlands 2 European Centre for Disease Prevention and Control, Stockholm, Sweden 3 Jeroen Bosch Hospital, ‘s-Hertogenbosch, the Netherlands 4 ArboUnie, Utrecht, the Netherlands
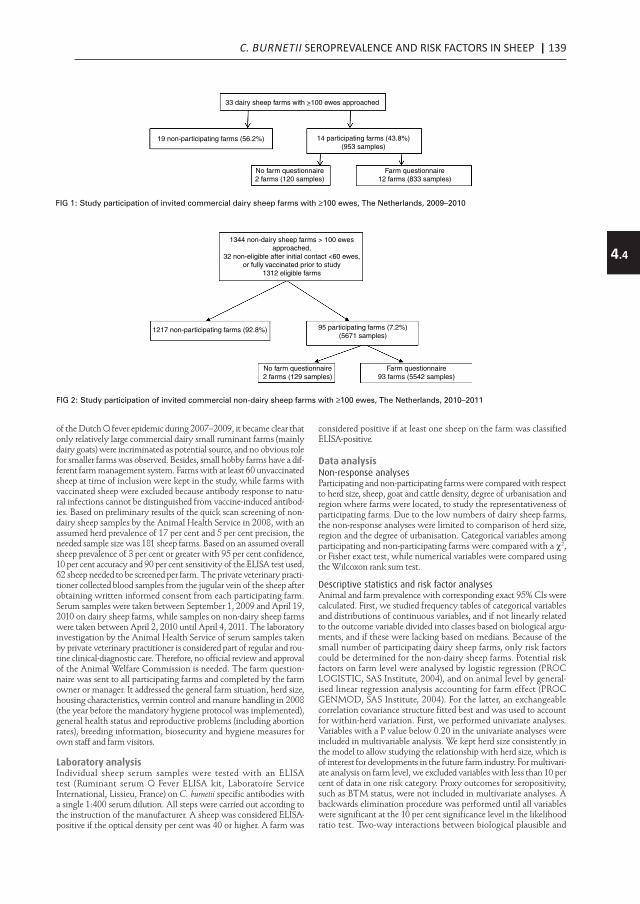
C. BURNETII SEROPREVALENCE AND RISK FACTORS IN SHEEP | 139
4.4
Time-course of antibody responses against Coxiella burnetiifollowing acute Q fever
P. F. M. TEUNIS 1,2*, B. SCHIMMER 1, D. W. NOTERMANS3,
A. C. A. P. LEENDERS 4, P. C. WEVER 4, M. E. E. KRETZSCHMAR1,5
AND P. M. SCHNEEBERGER 4
1 Centre for Infectious Disease Control, Epidemiology and Surveillance Unit, RIVM, Bilthoven, The Netherlands2 Hubert Department of Global Health, Rollins School of Public Health, Emory University, Atlanta, GA, USA3 Centre for Infectious Disease Control, Laboratory for Infectious Diseases and Perinatal Screening, RIVM,Bilthoven, The Netherlands4 Jeroen Bosch Hospital, Department of Medical Microbiology and Infection Control,’s- Hertogenbosch, TheNetherlands5 Julius Centre for Health Sciences and Primary Care, University Medical Centre Utrecht, Utrecht, The
Netherlands
Received 11 October 2011; Final revision 15 February 2012; Accepted 15 February 2012;
first published online 4 April 2012
SUMMARY
Large outbreaks of Q fever in The Netherlands have provided a unique opportunity for studying
longitudinal serum antibody responses in patients. Results are presented of a cohort of 344
patients with acute symptoms of Q fever with three or more serum samples per patient. In all
these serum samples IgM and IgG against phase 1 and 2 Coxiella burnetii were measured by an
immunofluorescence assay. A mathematical model of the dynamic interaction of serum antibodies
and pathogens was used in a mixed model framework to quantitatively analyse responses to
C. burnetii infection. Responses show strong heterogeneity, with individual serum antibody
responses widely different in magnitude and shape. Features of the response, peak titre and decay
rate, are used to characterize the diversity of the observed responses. Binary mixture analysis of
IgG peak levels (phases 1 and 2) reveals a class of patients with high IgG peak titres that decay
slowly and may represent potential chronic cases. When combining the results of mixture analysis
into an odds score, it is concluded that not only high IgG phase 1 may be predictive for chronic
Q fever, but also that high IgG phase 2 may aid in detecting such putative chronic cases.
Key words: Coxiella, mathematical modelling, Q fever, serology, statistics.
INTRODUCTION
Since mid-2007 human cases of Q fever in The
Netherlands have increased sharply, with major out-
breaks in 2008 and 2009, reaching a total of about
4000 cases by 2010 [1–4]. Cases were predominantly
clustered in the south of The Netherlands [3] and the
majority of the laboratory samples were submitted
to one regional hospital : the Jeroen Bosch Hospital
in ’s-Hertogenbosch (about 2000 confirmed acute
Q fever cases). Follow-up of cases extended over a
period of up to 24 months. In the 3 years that this
outbreak persisted, laboratory results from over 2000
cases were collected in a laboratory database. This
* Author for correspondence : Professor P. F. M. Teunis, Centrefor Infectious Disease Control, Epidemiology and SurveillanceUnit, RIVM, PO Box 1, 3720BA Bilthoven, The Netherlands.(Email : [email protected])
Epidemiol. Infect. (2013), 141, 62–73. f Cambridge University Press 2012
doi:10.1017/S0950268812000404
Affiliaties
Chapter 3.2
1Centre for Infectious Disease Control, National Institute for Public Health and the Environment, Bilthoven, the Netherlands 2Municipal Health Service ‘Brabant Zuidoost, Eindhoven, the Netherlands 3Laboratory for Pathology and Medical Microbiology, Veldhoven, the Netherlands 4Region East, Food and Consumer Product Safety Authority, Zutphen, the Netherlands 5Department of Medical Microbiology and Infection Control, Jeroen Bosch Hospital, ‘s Hertogenbosch, the Netherlands 6Department of Small Ruminant Health, Animal Health Service, Deventer, the Netherlands
Chapter 4.1
1 Centre for Infectious Disease Control, National Institute for Public Health and The Environment, Bilthoven, The Netherlands 2 Academic Collaborative Centre AMPHI, Department of Primary and Community Care, Radboud University Nijmegen Medical Centre, Nijmegen, The Netherlands 3 Department of Medical Microbiology and Infection Control, Jeroen Bosch Hospital, ’s-Hertogenbosch, The Netherlands 4 Department of Small Ruminant Health, Animal Health Service, Deventer, The Netherlands
Chapter 4.2 1Centre for Infectious Disease Control, National Institute for Public Health and the Environment, Bilthoven, the Netherlands 2Quantitative Veterinary Epidemiology Group, Wageningen Institute of Animal Sciences, Wageningen, The Netherlands 3Department of Small Ruminant Health, Animal Health Service, Deventer, The Netherlands 4Academic Collaborative Centre AMPHI, Department of Primary and Community Care, Radboud University Nijmegen Medical Centre, the Netherlands
Chapter 4.4 1Centre for Infectious Disease Control, National Institute for Public Health and the Environment, Bilthoven, the Netherlands 2 Academic Collaborative Centre AMPHI, Department of Primary and Community Care, Radboud University Nijmegen Medical Centre, Nijmegen, the Netherlands 3Department of Small Ruminant Health, Animal Health Service, Deventer, The Netherlands
Chapter 4.5 1 National Institute for Public Health and the Environment (RIVM), Bilthoven, the Netherlands 2 Animal Health Service,Deventer, the Netherlands 3 Radboud University Nijmegen Medical Centre, Nijmegen, the Netherlands 4. Jeroen Bosch Hospital, ‘s-Hertogenbosch, the Netherlands Chapter 4.6 1 GD Animal Health, Deventer, The Netherlands 2 Centre for Infectious Disease Control, National Institute for Public Health and the Environment, Bilthoven, the Netherlands 3 Department of Primary and Community Care, Academic Collaborative Centre for Public Health (AMPHI), Radboud University Nijmegen Medical Centre, Nijmegen, The Netherlands
Chapter 5.1 1 Department of Small Ruminant Health, Animal Health Service, Deventer, The Netherlands 2 Centre for Infectious Disease Control, National Institute for Public Health and the Environment, Bilthoven, The Netherlands 3 Department of Medical Microbiology and Infection Control, Jeroen Bosch Hospital, ‘s-Hertogenbosch, The Netherlands, 4 Department of Diagnostics, Research and Epidemiology, Animal Health Service, Deventer, The Netherlands
Chapter 5.2
1 Division of Environmental Epidemiology, Institute for Risk Assessment Sciences, Utrecht, the Netherlands 2 Centre for Infectious Disease Control, National Institute for Public Health and the Environment, Bilthoven, the Netherlands, 3 Department of Medical Microbiology and Infection Control, Jeroen Bosch Hospital, ‘s-Hertogenbosch, the Netherlands, 4 Division of Veterinary Public Health, Institute for Risk Assessment Sciences, Utrecht, the Netherlands
Chapter 5.3 1.National Institute for Public Health and the Environment, Bilthoven, the Netherlands 2 European Centre for Disease Prevention and Control, Stockholm, Sweden 3 Jeroen Bosch Hospital, ‘s-Hertogenbosch, the Netherlands 4 ArboUnie, Utrecht, the Netherlands
Paper
Veterinary Record | July 5, 2014
of the Dutch Q fever epidemic during 2007–2009, it became clear that only relatively large commercial dairy small ruminant farms (mainly dairy goats) were incriminated as potential source, and no obvious role for smaller farms was observed. Besides, small hobby farms have a dif-ferent farm management system. Farms with at least 60 unvaccinated sheep at time of inclusion were kept in the study, while farms with vaccinated sheep were excluded because antibody response to natu-ral infections cannot be distinguished from vaccine-induced antibod-ies. Based on preliminary results of the quick scan screening of non-dairy sheep samples by the Animal Health Service in 2008, with an assumed herd prevalence of 17 per cent and 5 per cent precision, the needed sample size was 181 sheep farms. Based on an assumed overall sheep prevalence of 3 per cent or greater with 95 per cent confidence, 10 per cent accuracy and 90 per cent sensitivity of the ELISA test used, 62 sheep needed to be screened per farm. The private veterinary practi-tioner collected blood samples from the jugular vein of the sheep after obtaining written informed consent from each participating farm. Serum samples were taken between September 1, 2009 and April 19, 2010 on dairy sheep farms, while samples on non-dairy sheep farms were taken between April 2, 2010 until April 4, 2011. The laboratory investigation by the Animal Health Service of serum samples taken by private veterinary practitioner is considered part of regular and rou-tine clinical-diagnostic care. Therefore, no official review and approval of the Animal Welfare Commission is needed. The farm question-naire was sent to all participating farms and completed by the farm owner or manager. It addressed the general farm situation, herd size, housing characteristics, vermin control and manure handling in 2008 (the year before the mandatory hygiene protocol was implemented), general health status and reproductive problems (including abortion rates), breeding information, biosecurity and hygiene measures for own staff and farm visitors.
Laboratory analysisIndividual sheep serum samples were tested with an ELISA test (Ruminant serum Q Fever ELISA kit, Laboratoire Service International, Lissieu, France) on C. burnetii specific antibodies with a single 1:400 serum dilution. All steps were carried out according to the instruction of the manufacturer. A sheep was considered ELISA-positive if the optical density per cent was 40 or higher. A farm was
considered positive if at least one sheep on the farm was classified ELISA-positive.
Data analysisNon-response analysesParticipating and non-participating farms were compared with respect to herd size, sheep, goat and cattle density, degree of urbanisation and region where farms were located, to study the representativeness of participating farms. Due to the low numbers of dairy sheep farms, the non-response analyses were limited to comparison of herd size, region and the degree of urbanisation. Categorical variables among participating and non-participating farms were compared with a χ2, or Fisher exact test, while numerical variables were compared using the Wilcoxon rank sum test.
Descriptive statistics and risk factor analysesAnimal and farm prevalence with corresponding exact 95% CIs were calculated. First, we studied frequency tables of categorical variables and distributions of continuous variables, and if not linearly related to the outcome variable divided into classes based on biological argu-ments, and if these were lacking based on medians. Because of the small number of participating dairy sheep farms, only risk factors could be determined for the non-dairy sheep farms. Potential risk factors on farm level were analysed by logistic regression (PROC LOGISTIC, SAS Institute, 2004), and on animal level by general-ised linear regression analysis accounting for farm effect (PROC GENMOD, SAS Institute, 2004). For the latter, an exchangeable correlation covariance structure fitted best and was used to account for within-herd variation. First, we performed univariate analyses. Variables with a P value below 0.20 in the univariate analyses were included in multivariable analysis. We kept herd size consistently in the model to allow studying the relationship with herd size, which is of interest for developments in the future farm industry. For multivari-ate analysis on farm level, we excluded variables with less than 10 per cent of data in one risk category. Proxy outcomes for seropositivity, such as BTM status, were not included in multivariate analyses. A backwards elimination procedure was performed until all variables were significant at the 10 per cent significance level in the likelihood ratio test. Two-way interactions between biological plausible and
33 dairy sheep farms with >100 ewes approached
19 non-participating farms (56.2%) 14 participating farms (43.8%)(953 samples)
No farm questionnaire2 farms (120 samples)
Farm questionnaire12 farms (833 samples)
FIG 1: Study participation of invited commercial dairy sheep farms with ≥100 ewes, The Netherlands, 2009–2010
1344 non-dairy sheep farms > 100 ewesapproached,
32 non-eligible after initial contact <60 ewes,or fully vaccinated prior to study
1312 eligible farms
1217 non-participating farms (92.8%) 95 participating farms (7.2%)(5671 samples)
No farm questionnaire2 farms (129 samples)
Farm questionnaire93 farms (5542 samples)
FIG 2: Study participation of invited commercial non-dairy sheep farms with ≥100 ewes, The Netherlands, 2010–2011
group.bmj.com on December 27, 2014 - Published by http://veterinaryrecord.bmj.com/Downloaded from
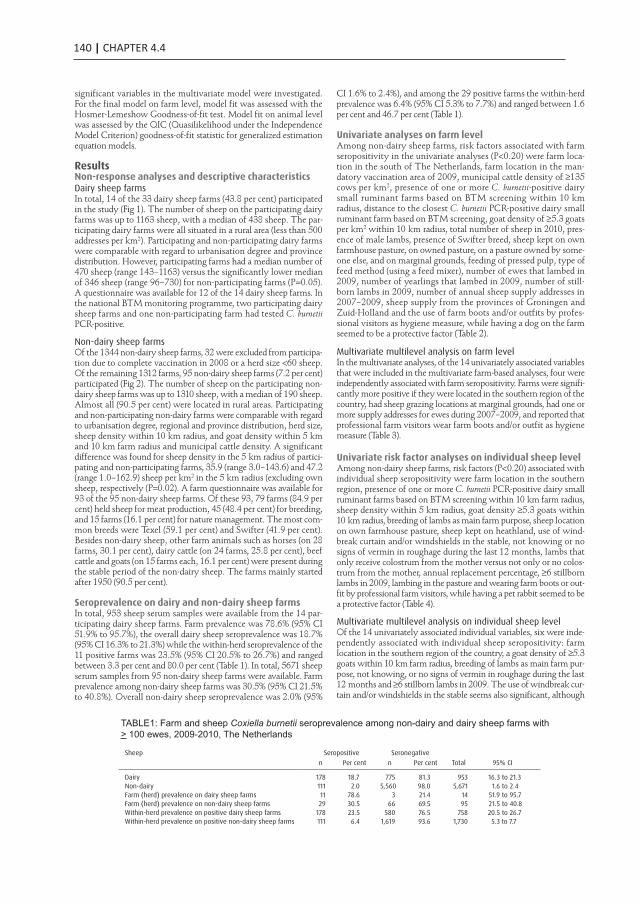
140 | CHAPTER 4.4Paper
July 5, 2014 | Veterinary Record
significant variables in the multivariate model were investigated. For the final model on farm level, model fit was assessed with the Hosmer-Lemeshow Goodness-of-fit test. Model fit on animal level was assessed by the QIC (Quasilikelihood under the Independence Model Criterion) goodness-of-fit statistic for generalized estimation equation models.
ResultsNon-response analyses and descriptive characteristicsDairy sheep farmsIn total, 14 of the 33 dairy sheep farms (43.8 per cent) participated in the study (Fig 1). The number of sheep on the participating dairy farms was up to 1163 sheep, with a median of 438 sheep. The par-ticipating dairy farms were all situated in a rural area (less than 500 addresses per km2). Participating and non-participating dairy farms were comparable with regard to urbanisation degree and province distribution. However, participating farms had a median number of 470 sheep (range 143–1163) versus the significantly lower median of 346 sheep (range 96–730) for non-participating farms (P=0.05). A questionnaire was available for 12 of the 14 dairy sheep farms. In the national BTM monitoring programme, two participating dairy sheep farms and one non-participating farm had tested C. burnetii PCR-positive.
Non-dairy sheep farmsOf the 1344 non-dairy sheep farms, 32 were excluded from participa-tion due to complete vaccination in 2008 or a herd size <60 sheep. Of the remaining 1312 farms, 95 non-dairy sheep farms (7.2 per cent) participated (Fig 2). The number of sheep on the participating non-dairy sheep farms was up to 1310 sheep, with a median of 190 sheep. Almost all (90.5 per cent) were located in rural areas. Participating and non-participating non-dairy farms were comparable with regard to urbanisation degree, regional and province distribution, herd size, sheep density within 10 km radius, and goat density within 5 km and 10 km farm radius and municipal cattle density. A significant difference was found for sheep density in the 5 km radius of partici-pating and non-participating farms, 35.9 (range 3.0–143.6) and 47.2 (range 1.0–162.9) sheep per km2 in the 5 km radius (excluding own sheep, respectively (P=0.02). A farm questionnaire was available for 93 of the 95 non-dairy sheep farms. Of these 93, 79 farms (84.9 per cent) held sheep for meat production, 45 (48.4 per cent) for breeding, and 15 farms (16.1 per cent) for nature management. The most com-mon breeds were Texel (59.1 per cent) and Swifter (41.9 per cent). Besides non-dairy sheep, other farm animals such as horses (on 28 farms, 30.1 per cent), dairy cattle (on 24 farms, 25.8 per cent), beef cattle and goats (on 15 farms each, 16.1 per cent) were present during the stable period of the non-dairy sheep. The farms mainly started after 1950 (90.5 per cent).
Seroprevalence on dairy and non-dairy sheep farmsIn total, 953 sheep serum samples were available from the 14 par-ticipating dairy sheep farms. Farm prevalence was 78.6% (95% CI 51.9% to 95.7%), the overall dairy sheep seroprevalence was 18.7% (95% CI 16.3% to 21.3%) while the within-herd seroprevalence of the 11 positive farms was 23.5% (95% CI 20.5% to 26.7%) and ranged between 3.3 per cent and 80.0 per cent (Table 1). In total, 5671 sheep serum samples from 95 non-dairy sheep farms were available. Farm prevalence among non-dairy sheep farms was 30.5% (95% CI 21.5% to 40.8%). Overall non-dairy sheep seroprevalence was 2.0% (95%
CI 1.6% to 2.4%), and among the 29 positive farms the within-herd prevalence was 6.4% (95% CI 5.3% to 7.7%) and ranged between 1.6 per cent and 46.7 per cent (Table 1).
Univariate analyses on farm levelAmong non-dairy sheep farms, risk factors associated with farm seropositivity in the univariate analyses (P<0.20) were farm loca-tion in the south of The Netherlands, farm location in the man-datory vaccination area of 2009, municipal cattle density of ≥135 cows per km2, presence of one or more C. burnetii-positive dairy small ruminant farms based on BTM screening within 10 km radius, distance to the closest C. burnetii PCR-positive dairy small ruminant farm based on BTM screening, goat density of ≥5.3 goats per km2 within 10 km radius, total number of sheep in 2010, pres-ence of male lambs, presence of Swifter breed, sheep kept on own farmhouse pasture, on owned pasture, on a pasture owned by some-one else, and on marginal grounds, feeding of pressed pulp, type of feed method (using a feed mixer), number of ewes that lambed in 2009, number of yearlings that lambed in 2009, number of still-born lambs in 2009, number of annual sheep supply addresses in 2007–2009, sheep supply from the provinces of Groningen and Zuid-Holland and the use of farm boots and/or outfits by profes-sional visitors as hygiene measure, while having a dog on the farm seemed to be a protective factor (Table 2).
Multivariate multilevel analysis on farm levelIn the multivariate analyses, of the 14 univariately associated variables that were included in the multivariate farm-based analyses, four were independently associated with farm seropositivity. Farms were signifi-cantly more positive if they were located in the southern region of the country, had sheep grazing locations at marginal grounds, had one or more supply addresses for ewes during 2007–2009, and reported that professional farm visitors wear farm boots and/or outfit as hygiene measure (Table 3).
Univariate risk factor analyses on individual sheep levelAmong non-dairy sheep farms, risk factors (P<0.20) associated with individual sheep seropositivity were farm location in the southern region, presence of one or more C. burnetii PCR-positive dairy small ruminant farms based on BTM screening within 10 km farm radius, sheep density within 5 km radius, goat density ≥5.3 goats within 10 km radius, breeding of lambs as main farm purpose, sheep location on own farmhouse pasture, sheep kept on heathland, use of wind-break curtain and/or windshields in the stable, not knowing or no signs of vermin in roughage during the last 12 months, lambs that only receive colostrum from the mother versus not only or no colos-trum from the mother, annual replacement percentage, ≥6 stillborn lambs in 2009, lambing in the pasture and wearing farm boots or out-fit by professional farm visitors, while having a pet rabbit seemed to be a protective factor (Table 4).
Multivariate multilevel analysis on individual sheep levelOf the 14 univariately associated individual variables, six were inde-pendently associated with individual sheep seropositivity: farm location in the southern region of the country, a goat density of ≥5.3 goats within 10 km farm radius, breeding of lambs as main farm pur-pose, not knowing, or no signs of vermin in roughage during the last 12 months and ≥6 stillborn lambs in 2009. The use of windbreak cur-tain and/or windshields in the stable seems also significant, although
TABLE 1: Farm and sheep Coxiella burnetii seroprevalence among non-dairy and dairy sheep farms with ≥100 ewes, 2009–2011, The Netherlands
Sheep Seropositive Seronegativen Per cent n Per cent Total 95% CI
Dairy 178 18.7 775 81.3 953 16.3 to 21.3Non-dairy 111 2.0 5,560 98.0 5,671 1.6 to 2.4Farm (herd) prevalence on dairy sheep farms 11 78.6 3 21.4 14 51.9 to 95.7Farm (herd) prevalence on non-dairy sheep farms 29 30.5 66 69.5 95 21.5 to 40.8Within-herd prevalence on positive dairy sheep farms 178 23.5 580 76.5 758 20.5 to 26.7Within-herd prevalence on positive non-dairy sheep farms 111 6.4 1,619 93.6 1,730 5.3 to 7.7
group.bmj.com on December 27, 2014 - Published by http://veterinaryrecord.bmj.com/Downloaded from
TABLE1: Farm and sheep Coxiella burnetii seroprevalence among non-dairy and dairy sheep farms with > 100 ewes, 2009-2010, The Netherlands

C. BURNETII SEROPREVALENCE AND RISK FACTORS IN SHEEP | 141
4.4
Paper
Veterinary Record | July 5, 2014
this variable only applied to the subset of 83 farms which used a stable (Table 5).
DiscussionSeroprevalence in dairy and non-dairy sheepIn dairy and non-dairy sheep, the prevalence on animal level was 18.7 per cent and 2.0 per cent, while herd prevalences were 78.6 per cent
and 30.5 per cent, respectively. Compared with the 2008 figures based on samples collected for the mandatory Brucella melitensis monitoring (Van den Brom and others 2013), the non-dairy sheep seroprevalence remained stable (2.4 per cent in 2008). The within-herd prevalence in non-dairy sheep decreased from 14.7 per cent in the 2008 study to 6.4 per cent in 2009–2010, which fits with a low perceived risk for zoonotic spread from non-dairy sheep farms to neighbouring areas.
TABLE 2: Univariate logistic regression of farm-based factors related to Coxiella burnetti seropositivity on non-dairy sheep farm level (p<0.20), 2010–2011, The Netherlands
Variable Category Frequency (n) Seroprevalence (%) OR 95% CI −2LL P value
Farm location per region* North (Dr, Fr, Gro) 26 30.8 2.16 (0.67 to 6.92) 0.037East (Ge, Ov, Fle) 18 44.4 3.89 (0.13 to 13.37)South (Nb, Li) 10 60.0 7.29 (1.62 to 32.79)West (Ut, Ze, Nh, Zh) 41 17.1 Ref.
Farm location in mandatory vaccination area (2009)
Yes 13 69.2 6.98 (1.94 to 25.11) 0.003No 82 24.4 Ref.
Cattle density (number of cattle/km2 in the municipality)*
<135.0 47 23.4 Ref. 0.139≥135.0 48 37.5 1.96 (0.80 to 4.80)
Number of C. burnetii PCR-positive dairy small ruminant farms in 10 km radius based on BTM screening*
0 61 24.6 Ref. 0.0951–4 34 41.2 2.15 (0.88 to 5.27)
Closest C. burnetii PCR-positive dairy small ruminant farms based on BTM screening (km)
<5.0 11 36.4 Ref. 0.1595.0–9.9 23 43.5 1.35 (0.31 to 5.91)10.0–14.9 18 22.2 0.50 (0.10 to 2.62)15.0–19.9 16 43.8 1.36 (0.28 to 6.58)20.0 27 14.8 0.30 (0.06 to 1.54)
Goat density (number of goats/km2 in 10 km radius)*
<5.3 47 21.3 Ref. 0.056≥5.3 48 39.6 2.42 (0.98 to 6.00)
Number of non-dairy sheep in 2010* <225 69 24.6 Ref. 0.046≥225 26 46.2 2.62 (1.02 to 6.75)
Male lambs present on farm Yes 14 57.1 4.00 (1.22 to 13.09) 0.071No 72 25.0 Ref.Missing 9 33.3 1.50 (0.34 to 6.62)
Swifter breed present on farm* Yes 39 41.0 2.38 (0.96 to 5.88) 0.173No 53 22.6 Ref.Missing 3 33.3 1.71 (0.14 to 20.51)
Sheep kept on farm house pasture* Yes 73 37.0 5.87 (1.27 to 27.09) 0.023Not applicable/missing 22 9.1 Ref.
Sheep kept on owned pasture* Yes 73 34.3 2.34 (0.72 to 7.68) 0.159Not applicable/missing 22 18.2 Ref.
Sheep kept on pasture owned by someone else*
Yes 48 39.6 2.42 (0.98 to 6.00) 0.056Not applicable/missing 47 21.3 Ref.
Sheep kept on marginal grounds* Yes 24 58.3 5.23 (1.94 to 14.09) 0.001Not applicable/missing 71 21.1 Ref.
Dog present on farm Yes 59 25.4 Ref. 0.197No 34 38.2 1.87 (0.77 to 4.55)Missing 2 50.0 2.93 (0.17 to 49.85)
Feeding of pressed pulp* Yes 10 50.0 2.73 (0.72 to 10.34) 0.154No 82 26.8 Ref.Missing 3 66.7 5.46 (0.47 to 63.19)
Number of ewes which lambed in 2009 <125 52 21.2 0.46 (0.16 to 1.27) 0.134125–224 27 37.0 Ref.≥225 11 54.6 2.04 (0.49 to 8.45)Missing 5 40.0 1.13 (0.16 to 7.98)
Number of yearlings which lambed in 2009 <40 74 25.7 Ref. 0.166≥40 17 47.1 2.57 (0.87 to 7.62)Missing 4 50.0 2.89 (0.38 to 22.00)
Number of stillborn lambs (in 2009)* ≤5 18 11.1 Ref. 0.1306–12 31 25.8 2.78 (0.52 to 14.87)≥13 40 42.5 5.91 (120 to 29.23)Missing 4 33.3 4.00 (0.42 to 37.78)
Number of annual supply addresses for ewes during 2007–2009*
No supply/missing 61 19.7 Ref. 0.0231 18 55.6 5.10 (1.66 to 15.70)2 or more 13 46.2 3.50 (0.99 to 12.34)Missing 3 33.3 2.04 (0.17 to 24.43)
Sheep supplied from Groningen Province Yes 10 50.0 2.52 (0.67 to 9.54) 0.173No 81 28.4 Ref.Missing 4 25.0
Sheep supplied from Zuid-Holland Province Yes 12 58.3 3.87 (1.11 to 13.52) 0.103No 79 26.6 Ref. (0.09 to 9.35)Missing 4 25.0 0.92
Farm boots and/or outfit as hygiene meas-ures applied for professional farm visitors*
Yes 45 42.2 3.17 (1.24 to 8.07) 0.047No 48 18.8 Ref.Missing 2 50.0 4.33 (1.25 to 76.05)
*Variables included in subsequent multivariate analyses before manual backward elimination.−2LL, likelihood ratio test; BTM, bulk tank milk; Dr, Drenthe; Fle, Flevoland; Fr, Friesland; Ge, Gelderland; Gro, Groningen; Li, Limburg provinces; Nb, Noord-Brabant; Nh, Noord-Holland; Ov, Overijssel; Ut, Utrecht; Ze, Zeeland; Zh, Zuid-Holland Provinces.
group.bmj.com on December 27, 2014 - Published by http://veterinaryrecord.bmj.com/Downloaded from
TABLE 2: Univariate logistic regression of farm-based factors related to Coxiella burnetii seropositivity on non-dairy sheep farm level (p<0.20)), 2010-2011, The Netherlands

142 | CHAPTER 4.4Paper
July 5, 2014 | Veterinary Record
Despite the stable individual seroprevalence in non-dairy sheep, the herd prevalence among non-dairy sheep farms was 14.2 per cent in 2008 and 30.5 per cent in 2009–2010. This could be a true increase, but because of the stable overall seroprevalence in the sheep, a more likely explanation is the difference in sample size as a median of 60 sheep per farm were tested in 2009–2010, while only 13 sheep per farm were tested in 2008. In dairy sheep, the individual seroprevalence increased from 5.7 per cent in 2008 to 18.7 per cent in 2009–2010, and at herd level from 38.5 per cent in 2008 to 78.6 per cent in 2009–2010, while the within-herd prevalence of positive farms remained stable. A simi-lar increase in herd and animal prevalence over the same period was observed on dairy goat farms (Schimmer and others 2011).
Dairy sheep are thus more likely to be seropositive than non-dairy sheep, which is probably due to different housing conditions between both sheep types, a generally larger herd size for dairy sheep, as well as differences in susceptibility for infections as suggested earlier (Van den Brom and others 2013). Dairy sheep also have higher within-herd prevalences reflecting more circulation of C. burnetii within a dairy sheep farm and a risk for environmental contamination and spread (Schimmer and others 2011, Van den Brom and others 2013). Other ruminant studies also report a higher prevalence of C. burnetii antibodies in dairy breeds than in beef breeds, in this paper referred to as non-dairy breeds. Environmental investigations among a sub-set of non-dairy sheep farms included in this study showed that the percentage of positive samples and the C. burnetii DNA load was sig-nificantly higher for farms with seropositive sheep compared to farms with seronegative sheep, but were clearly lower in comparison to a similar study on dairy goat farms (de Bruin and others 2012). This supports their relatively limited role in the transmission of C. burnetii to the community in their vicinity during the Q fever epidemic in The Netherlands. It might also partially explain the relatively lower observed seroprevalence among the non-dairy sheep farm households compared to dairy sheep farm households (De Lange and others 2013) and dairy goat farm households (Schimmer and others 2012).
The observed non-dairy sheep C. burnetii seroprevalence in The Netherlands is generally low. The observed sheep prevalence is com-parable to a study in Germany, with a prevalence of 2.7 per cent in 1714 tested sheep from 95 flocks (Runge and others 2012), a prev-alence of 3.1 per cent in Canada (Hatchette and others 2002) and of 3.1 per cent in Albania (Cekani and others 2008), while higher seroprevalences in sheep, around 10 per cent or above, were reported in Portugal, Cyprus, Greece, Northern Ireland, Italy, Spain and Japan (Masala and others 2004, Psaroulaki and others 2006, Garcia-Perez and others 2009, Pape and others 2009, McCaughey and others 2010, Ruiz-Fons and others 2010, Giangaspero and others 2012, Anastacio and others 2013).
Also, our observed herd prevalence of 30.5 per cent was compara-ble to the 28 per cent seroprevalence in 39 randomly selected healthy sheep flocks with more than 100 ewes in Germany (Hilbert and oth-ers 2012). A somewhat higher herd prevalence was found in sheep herds in Portugal (37.5 per cent) (Anastacio and others 2013) and in Sardinia (38 per cent) (Masala and others 2004), while a somewhat lower sheep herd prevalence was found in Canada (21 per cent) (Lang and others 1991). Much higher herd prevalences were reported from
Northern Spain (prevalence of 75 per cent) (Ruiz-Fons and others 2010) and Turkey (prevalence of 83.0 per cent) (Kennerman and oth-ers 2010), although direct comparison of seroprevalence estimates in different studies is complicated due to substantial differences in study design, laboratory methods and farm characteristics for the tested flocks.
Risk factorsIn 2009–2010, we observed a higher seropositivity among non-dairy sheep farms located in the southern region of the country, while no difference in seroprevalence was observed per region in 2008 (Van den Brom and others 2013). This result, together with the asso-ciation with goat density within 10 km radius supports the potential role of transmission from infected dairy goat farms to the non-dairy sheep in the vicinity, as the dairy goat density and epidemic spread among small ruminants was clearly higher in the south of the country (Dijkstra and others 2012).
On farm level, sheep kept on marginal grounds and one or more supply addresses for ewes were independent risk factors. These fac-tors are most likely a proxy for movements between herds (Paul and others 2013), which is a known risk factor for introduction of zoonotic pathogens. Other explanations why sheep grazing on mar-ginal grounds had a higher seropositivity could be the presence of other livestock on the same grounds as a proxy for increased risk of introduction of pathogens from the environment into the flock. Other factors, such as the number and different type of grazing loca-tions used were not investigated with the questionnaire. Wearing farm boots or outfit by professional farm visitors was also an inde-pendent risk factor. This association can only be explained satisfac-torily if these professional visitors took their own boots or outfits to the farm, which then can facilitate transmission between herds if not changed between farms, as observed in a Q fever outbreak with person-to-person spread by farm outfits (Marrie and others 1989). Unfortunately, the questionnaire did not specify the origin of the clothes and boots worn by the professional visitors to substantiate this with data. However, as non-dairy sheep are mainly kept out-side on meadows where no dedicated farm outfits can be properly stored, this was considered a plausible explanation. All these risk factors suggest introduction of the bacterium into the farm, stress-ing the importance of good biosecurity. On individual sheep level, besides farm location in the southern region of the country and higher goat density, other risk factors included breeding of lambs as main farm purpose and presence of ≥6 stillborn lambs in 2009. These factors might represent conditions facilitating acquisition of infectious diseases and within farm spread. Sheep breeding being the main purpose of the farm could reflect the intensity of annual animal movements and reproduction levels, possibly leading to a higher sus-ceptibility for infections. Half the farms (51 per cent) with breeding as the main farm purpose had annual replacement percentages of 25 per cent or higher, while only 32 per cent of the farms with other main farm purposes reported such percentages. Besides, an increas-ing number of stillborn lambs might indicate presence of other infec-tious pathogens, possibly leaving sheep more vulnerable for other infections as well. The main infectious causes of abortion in sheep in
TABLE 3: Multivariate logistic regression analysis of farm-based factors associated with Coxiella burnetii seropositivity on non-dairy sheep farm level (P<0.10, −2LL), 2010–2011, The Netherlands
Variable Category aOR (95% CI) P value
Number of non-dairy sheep in 2010 ≥225 1.31 (0.38 to 4.58) 0.67<225 Reference
Sheep kept on marginal grounds Yes 7.04 (2.04 to 24.24) <0.01Not applicable/missing Reference
Farm region South 5.19 (1.04 to 25.80) 0.04Other Reference
Number of annual supply addresses for ewes in 2007–2009 1 3.49 (0.94 to 13.01) 0.08≥2 3.89 (0.84 to 17.99)No supply/missing Reference
Farm boots and/or outfit as hygiene measures applied for professional farm visitors
YesNo
3.12 (0.96 to 10.10)Reference
0.06
Number of observations used: 91. AIC=97.21, Hosmer and Lemeshow Goodness-of-fit Test 0.7736. aOR, adjusted odds ratio; −2LL, likelihood ratio test; AIC, Akaike Information Criterion.
group.bmj.com on December 27, 2014 - Published by http://veterinaryrecord.bmj.com/Downloaded from
TABLE 3: Multivariate logistic regression analysis of farm-based factors associated with Coxiella burnetii seropositivity on non-dairy sheep farm level (P<0.10, -2LL), 2010-2011, The Netherlands

C. BURNETII SEROPREVALENCE AND RISK FACTORS IN SHEEP | 143
4.4
Paper
Veterinary Record | July 5, 2014
The Netherlands are due to Chlamydia abortus, Campylobacter species, Toxoplasma gondii, Listeria species and Yersinia pseudotuberculosis (van den Brom and others 2012), although abortions due to C. burnetii cannot be excluded, as partially, they might more directly explain the identi-fied risk. Not knowing, or no traces of vermin in roughage, was a risk factor on animal level for dairy goats as well (Schimmer and others 2011), although it is unclear why. The use of windbreak curtain and/or windshields in the stable was a possible risk factor in the final model applicable to farms with a stable. This same risk factor on animal level was found for dairy goats (Schimmer and others 2011), which possibly points to a more open stable, facilitating transmis-sion of C. burnetii inside the stable, which may again promote spread within the herd.
LimitationsIn the 2008 convenience survey, sheep tested during pregnancy and in the periparturient period, had a somewhat higher seroprevalence (3.3 per cent v 1.2 per cent in early or non-pregnant sheep), which is explained by massive C. burnetii multiplication in pregnant animals (Van den Brom and others 2013). As sampling of sheep is easier when they are in the stable, we assume that many of the sampled animals were in their pregnant or periparturient period, although we did not register their pregnancy status to confirm this. In theory, this might have caused an overestimation of the overall seroprevalence. However, as the observed seroprevalence among the non-dairy sheep was the same than that obtained in the year-round convenience sample, the effect seems to have been negligible.
TABLE 4: Univariate logistic regression of farm-based factors related to Coxiella burnetii seropositivity on non-dairy sheep level, 2010–2011, The Netherlands
Variable Frequency (n) Prev (%) OR 95% CI P value
Farm location per region* North (Dr, Fr, Gro) 1559 1.0 1.25 (0.41 to 3.84) 0.188East (Ge, Ov, Fle) 1072 1.9 2.33 (0.78 to 6.90)South (Nb, Li) 602 9.3 12.58 (3.23 to 49.08)West (Ut, Ze, Nh, Zh) 2438 0.8 Ref.
Farm location in mandatory vaccination area (2009)
YesNo
7844887
8.30.9
6.98Ref.
(3.38 to 26.31) 0.061
Number of C. burnetii PCR- positive dairy small ruminant farm in 10 km radius based on BTM screening*
01 or more
36362035
1.03.7
Ref.3.76
(1.40 to 10.14) 0.088
Closest C. burnetii PCR-positive dairy small ruminant farm based on BTM screening (km)
<5.05.0–9.910.0–14.915.0–19.9≥20.0
65013851081945
1610
1.44.81.02.00.4
Ref.3.580.731.510.27
(1.03 to 12.47)(0.20 to 2.63)(0.51 to 4.46)(0.07 to 0.95)
0.079
Sheep density (number of sheep per km2 in 5 km radius)*
<35.9≥35.9
27942877
2.81.2
Ref.0.43
(0.16 to 1.18) 0.191
Goat density (number of goats per km2 in 10 km radius)*
<5.3≥5.3
28432828
0.73.2
Ref.4.42
(1.67 to 11.67) 0.036
Total number of sheep in 2010* <225 4094 1.8 Ref. 0.559≥225 1577 2.4 1.37 (0.47 to 4.00)
Lambs present in 2010 Yes 975 2.8 1.39 (0.50 to 3.85) 0.184No 4203 1.9 Ref.Missing 493 0.8 0.43 (0.12 to 1.51)
Breeding lambs as main farm purpose* Yes 2702 3.3 4.56 (1.83 to 11.37) 0.111No 2780 0.8 Ref.Missing 189 1.1 1.50 (0.27 to 8.32)
Sheep kept on farm house pasture* Yes 4381 2.3 2.78 (0.43 to 17.96) 0.169Not applicable/missing 1290 0.9 Ref.
Sheep kept on heathland* Yes 571 0.7 0.32 (0.08 to 1.26) 0.100Not applicable/missing 5100 2.1 Ref.
Use of windbreak curtain and/or wind-shields in the stable*
Yes 1402 3.6 2.12 (0.59 to 7.57) 0.109None 3536 1.6 Ref.No stable/missing 733 0.4 0.25 (0.06 to 1.07)
Rabbit present on farm* Yes 1197 0.9 0.41 (0.14 to 1.19) 0.126No/missing 4474 2.2 Ref.
Traces of vermin in roughage (past 12 months)*
Yes 2252 0.6 Ref. 0.133No 1882 2.5 3.82 (1.43 to 10.29)Do not know 1229 3.7 5.69 (1.41 to 23.07)Missing 308 1.3 2.01 (0.55 to 7.31)
Lambs receiving colostrum from own mother*
Yes, only from mother 3541 2.7 Ref. 0.121Yes, but not only 1818 0.7 0.27 (0.10 to 0.68)No/missing 312 1.3 0.50 (0.14 to 1.80)
Replacement rate (in %) <16 1076 2.0 0.62 (0.16 to 2.44) 0.13216–25 1743 0.5 0.16 (0.05 to 0.48)>25 2295 3.2 Ref.Missing 557 1.1 0.33 (0.33 to 6.20)
Lambing outside in pasture* Yes 546 0.4 0.17 (0.02 to 1.18) 0.141No 4996 2.1 Ref.Missing 129 1.6 0.77 (0.16 to 3.61)
Number of stillborn lambs (in 2009)* ≤5 1051 0.2 Ref. 0.0746–12 1473 1.4 8.02 (1.56 to 41.21)≥13 2779 3.1 16.84 (3.77 to 75.31)Missing 368 0.8 4.47 (0.74 to 27.01)
Farm boots and/or outfit as hygiene measures applied for professional farm visitors*
YesNoMissing
26862856
129
3.01.01.6
3.09Ref.1.67
(1.01 to 9.39)
(0.33 to 8.60)
0.242
Factors associated with Coxiella burnetii seropositivity with their frequency (n), animal prevalence (Prev), odds ratio (OR); and 95% CI with P value of the univariable generalised linear regression <0.20 on animal level accounting for random herd effect (5671 non-dairy sheep from 95 farms).*Variables included in subsequent multivariate analyses before manual backward eliminationBTM, bulk tank milk; Dr, Drenthe; Fle, Flevoland; Fr, Friesland; Ge, Gelderland; Gro, Groningen; Li, Limburg provinces; N, total number of individuals; Nb, Noord-Brabant; Nh, Noord-Holland; Ov, Overijssel; Prev, prevalence; Ut, Utrecht; Ze, Zeeland; Zh, Zuid-Holland Provinces.
group.bmj.com on December 27, 2014 - Published by http://veterinaryrecord.bmj.com/Downloaded from
TABLE 4: Univariate logistic regression of farm-based factors related to Coxiella burnetii seropositivity on non-dairy sheep level, 2010-2011, The Netherlands
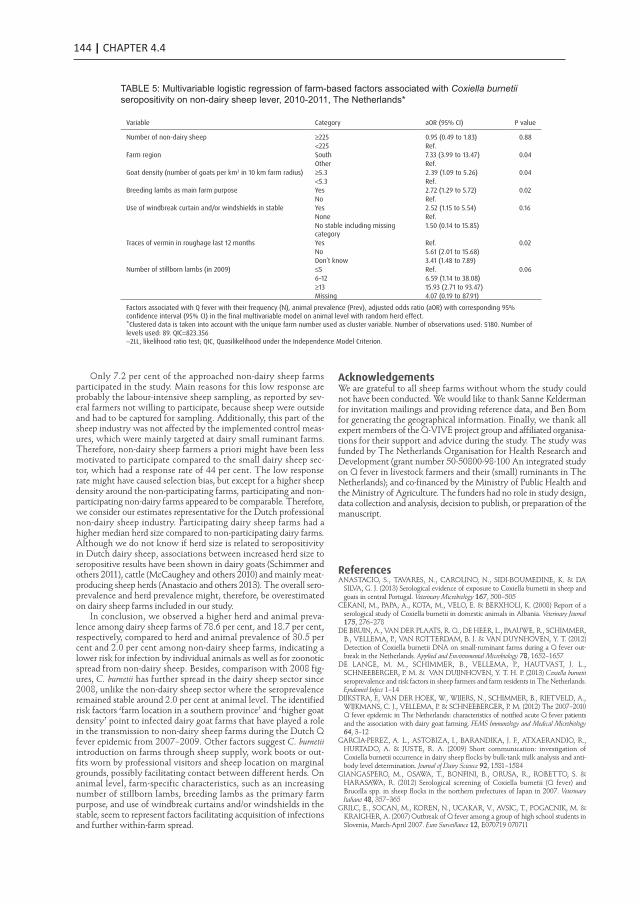
144 | CHAPTER 4.4Paper
July 5, 2014 | Veterinary Record
Only 7.2 per cent of the approached non-dairy sheep farms participated in the study. Main reasons for this low response are probably the labour-intensive sheep sampling, as reported by sev-eral farmers not willing to participate, because sheep were outside and had to be captured for sampling. Additionally, this part of the sheep industry was not affected by the implemented control meas-ures, which were mainly targeted at dairy small ruminant farms. Therefore, non-dairy sheep farmers a priori might have been less motivated to participate compared to the small dairy sheep sec-tor, which had a response rate of 44 per cent. The low response rate might have caused selection bias, but except for a higher sheep density around the non-participating farms, participating and non-participating non-dairy farms appeared to be comparable. Therefore, we consider our estimates representative for the Dutch professional non-dairy sheep industry. Participating dairy sheep farms had a higher median herd size compared to non-participating dairy farms. Although we do not know if herd size is related to seropositivity in Dutch dairy sheep, associations between increased herd size to seropositive results have been shown in dairy goats (Schimmer and others 2011), cattle (McCaughey and others 2010) and mainly meat-producing sheep herds (Anastacio and others 2013). The overall sero-prevalence and herd prevalence might, therefore, be overestimated on dairy sheep farms included in our study.
In conclusion, we observed a higher herd and animal preva-lence among dairy sheep farms of 78.6 per cent, and 18.7 per cent, respectively, compared to herd and animal prevalence of 30.5 per cent and 2.0 per cent among non-dairy sheep farms, indicating a lower risk for infection by individual animals as well as for zoonotic spread from non-dairy sheep. Besides, comparison with 2008 fig-ures, C. burnetii has further spread in the dairy sheep sector since 2008, unlike the non-dairy sheep sector where the seroprevalence remained stable around 2.0 per cent at animal level. The identified risk factors ‘farm location in a southern province’ and ‘higher goat density’ point to infected dairy goat farms that have played a role in the transmission to non-dairy sheep farms during the Dutch Q fever epidemic from 2007–2009. Other factors suggest C. burnetii introduction on farms through sheep supply, work boots or out-fits worn by professional visitors and sheep location on marginal grounds, possibly facilitating contact between different herds. On animal level, farm-specific characteristics, such as an increasing number of stillborn lambs, breeding lambs as the primary farm purpose, and use of windbreak curtains and/or windshields in the stable, seem to represent factors facilitating acquisition of infections and further within-farm spread.
AcknowledgementsWe are grateful to all sheep farms without whom the study could not have been conducted. We would like to thank Sanne Kelderman for invitation mailings and providing reference data, and Ben Bom for generating the geographical information. Finally, we thank all expert members of the Q-VIVE project group and affiliated organisa-tions for their support and advice during the study. The study was funded by The Netherlands Organisation for Health Research and Development (grant number 50-50800-98-100 An integrated study on Q fever in livestock farmers and their (small) ruminants in The Netherlands); and co-financed by the Ministry of Public Health and the Ministry of Agriculture. The funders had no role in study design, data collection and analysis, decision to publish, or preparation of the manuscript.
Correction notice In Table 2, the OR for 'Farm boots and/or outfit as hygiene measures applied for professional farm visitors*' has been amended from 3.7 to 3.17.
ReferencesANASTACIO, S., TAVARES, N., CAROLINO, N., SIDI-BOUMEDINE, K. & DA
SILVA, G. J. (2013) Serological evidence of exposure to Coxiella burnetii in sheep and goats in central Portugal. Veterinary Microbiology 167, 500–505
CEKANI, M., PAPA, A., KOTA, M., VELO, E. & BERXHOLI, K. (2008) Report of a serological study of Coxiella burnetii in domestic animals in Albania. Veterinary Journal 175, 276–278
DE BRUIN, A., VAN DER PLAATS, R. Q., DE HEER, L., PAAUWE, R., SCHIMMER, B., VELLEMA, P., VAN ROTTERDAM, B. J. & VAN DUYNHOVEN, Y. T. (2012) Detection of Coxiella burnetii DNA on small-ruminant farms during a Q fever out-break in the Netherlands. Applied and Environmental Microbiology 78, 1652–1657
DE LANGE, M. M., SCHIMMER, B., VELLEMA, P., HAUTVAST, J. L., SCHNEEBERGER, P. M. & VAN DUIJNHOVEN, Y. T. H. P. (2013) Coxiella burnetii seroprevalence and risk factors in sheep farmers and farm residents in The Netherlands. Epidemiol Infect 1–14
DIJKSTRA, F., VAN DER HOEK, W., WIJERS, N., SCHIMMER, B., RIETVELD, A., WIJKMANS, C. J., VELLEMA, P. & SCHNEEBERGER, P. M. (2012) The 2007–2010 Q fever epidemic in The Netherlands: characteristics of notified acute Q fever patients and the association with dairy goat farming. FEMS Immunology and Medical Microbiology 64, 3–12
GARCIA-PEREZ, A. L., ASTOBIZA, I., BARANDIKA, J. F., ATXAERANDIO, R., HURTADO, A. & JUSTE, R. A. (2009) Short communication: investigation of Coxiella burnetii occurrence in dairy sheep flocks by bulk-tank milk analysis and anti-body level determination. Journal of Dairy Science 92, 1581–1584
GIANGASPERO, M., OSAWA, T., BONFINI, B., ORUSA, R., ROBETTO, S. & HARASAWA, R. (2012) Serological screening of Coxiella burnetii (Q fever) and Brucella spp. in sheep flocks in the northern prefectures of Japan in 2007. Veterinary Italiano 48, 357–365
GRILC, E., SOCAN, M., KOREN, N., UCAKAR, V., AVSIC, T., POGACNIK, M. & KRAIGHER, A. (2007) Outbreak of Q fever among a group of high school students in Slovenia, March-April 2007. Euro Surveillance 12, E070719 070711
TABLE 5: Multivariable logistic regression of farm-based factors associated with Coxiella burnetii seropositivity on non-dairy sheep level, 2010–2011, The Netherlands*
Variable Category aOR (95% CI) P value
Number of non-dairy sheep ≥225 0.95 (0.49 to 1.83) 0.88<225 Ref.
Farm region South 7.33 (3.99 to 13.47) 0.04Other Ref.
Goat density (number of goats per km2 in 10 km farm radius) ≥5.3 2.39 (1.09 to 5.26) 0.04<5.3 Ref.
Breeding lambs as main farm purpose Yes 2.72 (1.29 to 5.72) 0.02No Ref.
Use of windbreak curtain and/or windshields in stable Yes 2.52 (1.15 to 5.54) 0.16None Ref.No stable including missing category
1.50 (0.14 to 15.85)
Traces of vermin in roughage last 12 months Yes Ref. 0.02No 5.61 (2.01 to 15.68)Don’t know 3.41 (1.48 to 7.89)
Number of stillborn lambs (in 2009) ≤5 Ref. 0.066–12 6.59 (1.14 to 38.08)≥13 15.93 (2.71 to 93.47)Missing 4.07 (0.19 to 87.91)
Factors associated with Q fever with their frequency (N), animal prevalence (Prev), adjusted odds ratio (aOR) with corresponding 95% confidence interval (95% CI) in the final multivariable model on animal level with random herd effect. *Clustered data is taken into account with the unique farm number used as cluster variable. Number of observations used: 5180. Number of levels used: 89. QIC=823.356−2LL, likelihood ratio test; QIC, Quasilikelihood under the Independence Model Criterion.
group.bmj.com on December 27, 2014 - Published by http://veterinaryrecord.bmj.com/Downloaded from
TABLE 5: Multivariable logistic regression of farm-based factors associated with Coxiella burnetii seropositivity on non-dairy sheep lever, 2010-2011, The Netherlands*

C. BURNETII SEROPREVALENCE AND RISK FACTORS IN SHEEP | 145
4.4
Paper
Veterinary Record | July 5, 2014
HATCHETTE, T., CAMPBELL, N., WHITNEY, H., HUDSON, R. & MARRIE, T. J. (2002) Seroprevalence of Coxiella burnetii in selected populations of domestic rumi-nants in Newfoundland. The Canadian Veterinary Journal 43, 363–364
HILBERT, A., SCHMOOCK, G., LENZKO, H., MOOG, U., DILLER, R., FROHLICH, A., HOFFMANN, L., HORNER, S., ELSCHNER, M., TOMASO, H., HENNING, K., NEUBAUER, H. & SPRAGUE, L. D. (2012) Prevalence of Coxiella burnetii in clini-cally healthy German sheep flocks. BMC Research Notes 5, 152
KENNERMAN, E., ROUSSET, E., GOLCU, E. & DUFOUR, P. (2010) Seroprevalence of Q fever (coxiellosis) in sheep from the Southern Marmara Region, Turkey. Comparative Immunology, Microbiology and Infectious Diseases 33, 37–45
KOENE, R. P., SCHIMMER, B., RENSEN, H., BIESHEUVEL, M., DE BRUIN, A., LOHUIS, A., HORREVORTS, A., LUNEL, F. V., DELSING, C. E. & HAUTVAST, J. L. (2011) A Q fever outbreak in a psychiatric care institution in The Netherlands. Epidemiology and Infection 139, 13–18
LANG, G., WALTNER-TOEWS, D. & MENZIES, P. (1991) The seroprevalence of coxiellosis (Q fever) in Ontario sheep flocks. Canadian Journal of Veterinary Research 55, 139–142
LYYTIKAINEN, O., ZIESE, T., SCHWARTLANDER, B., MATZDORFF, P., KUHNHEN, C., JAGER, C. & PETERSEN, L. (1998) An outbreak of sheep-asso-ciated Q fever in a rural community in Germany. European Journal of Epidemiology 14, 193–199
MARRIE, T. J., LANGILLE, D., PAPUKNA, V. & YATES, L. (1989) Truckin’ pneu-monia—an outbreak of Q fever in a truck repair plant probably due to aerosols from clothing contaminated by contact with newborn kittens. Epidemiology and Infection 102, 119–127
MASALA, G., PORCU, R., SANNA, G., CHESSA, G., CILLARA, G., CHISU, V. & TOLA, S. (2004) Occurrence, distribution, and role in abortion of Coxiella burnetii in sheep and goats in Sardinia, Italy. Veterinary Microbiology 99, 301–305
MCCAUGHEY, C., MURRAY, L. J., MCKENNA, J. P., MENZIES, F. D., MCCULLOUGH, S. J., O’NEILL, H. J., WYATT, D. E., CARDWELL, C. R. & COYLE, P. V. (2010) Coxiella burnetii (Q fever) seroprevalence in cattle. Epidemiology and Infection 138, 21–27
MUSKENS, J., VAN ENGELEN, E., VAN MAANEN, C., BARTELS, C. & LAM, T. J. (2011) Prevalence of Coxiella burnetii infection in Dutch dairy herds based on test-ing bulk tank milk and individual samples by PCR and ELISA. The Veterinary Record 168, 79
PAPE, M., BOUZALAS, E. G., KOPTOPOULOS, G. S., MANDRAVELI, K., ARVANITIDOU-VAGIONA, M., NIKOLAIDIS, P. & ALEXIOU-DANIEL, S. (2009) The serological prevalence of Coxiella burnetii antibodies in sheep and goats in north-ern Greece. Clinical Microbiology and Infection 15(Suppl 2), 146–147
PAUL, S., AGGER, J. F., AGERHOLM, J. S. & MARKUSSEN, B. (2014) Prevalence and risk factors of Coxiella burnetii seropositivity in Danish beef and dairy cattle at slaughter adjusted for test uncertainty. Prev Vet Med 113, 504–511
PORTEN, K., RISSLAND, J., TIGGES, A., BROLL, S., HOPP, W., LUNEMANN, M., VAN TREECK, U., KIMMIG, P., BROCKMANN, S. O., WAGNER-WIENING, C., HELLENBRAND, W. & BUCHHOLZ, U. (2006) A super-spreading ewe infects hun-dreds with Q fever at a farmers’ market in Germany. BMC Infectious Diseases 6, 147
PSAROULAKI, A., HADJICHRISTODOULOU, C., LOUKAIDES, F., SOTERIADES, E., KONSTANTINIDIS, A., PAPASTERGIOU, P., IOANNIDOU, M. C. & TSELENTIS, Y. (2006) Epidemiological study of Q fever in humans, ruminant animals, and ticks in Cyprus using a geographical information system. European Journal of Clinical Microbiology & Infectious Diseases 25, 576–586
ROEST, H. I., TILBURG, J. J., VAN DER HOEK, W., VELLEMA, P., VAN ZIJDERVELD, F. G., KLAASSEN, C. H. & RAOULT, D. (2011) The Q fever epidemic in The Netherlands: history, onset, response and reflection. Epidemiology and Infection 139, 1–12
RUIZ-FONS, F., ASTOBIZA, I., BARANDIKA, J. F., HURTADO, A., ATXAERANDIO, R., JUSTE, R. A. & GARCIA-PEREZ, A. L. (2010) Seroepidemiological study of Q fever in domestic ruminants in semi-extensive grazing systems. BMC Veterinary Research 6, 3
RUNGE, M., BINDER, A., SCHOTTE, U. & GANTER, M. (2012) Investigations con-cerning the prevalence of Coxiella burnetii and Chlamydia abortus in sheep in correla-tion with management systems and abortion rate in Lower Saxony in 2004. Berliner und Munchener tierarztliche Wochenschrift 125, 138–143
SCHIMMER, B., LENFERINK, A., SCHNEEBERGER, P., AANGENEND, H., VELLEMA, P., HAUTVAST, J. & VAN DUYNHOVEN, Y. (2012) Seroprevalence and risk factors for Coxiella burnetii (Q fever) seropositivity in dairy goat farmers’ households in The Netherlands, 2009–2010. PLoS ONE 7, e42364
SCHIMMER, B., LUTTIKHOLT, S., HAUTVAST, J. L., GRAAT, E. A., VELLEMA, P. & DUYNHOVEN, Y. T. (2011) Seroprevalence and risk factors of Q fever in goats on com-mercial dairy goat farms in the Netherlands, 2009–2010. BMC Veterinary Research 7, 81
THOMAS, D. R., TREWEEK, L., SALMON, R. L., KENCH, S. M., COLEMAN, T. J., MEADOWS, D., MORGAN-CAPNER, P. & CAUL, E. O. (1995) The risk of acquiring Q fever on farms: a seroepidemiological study. Occupational and Environmental Medicine 52, 644–647
VAN DEN BROM, R., LIEVAART-PETERSON, K., LUTTIKHOLT, S., PEPERKAMP, K., WOUDA, W. & VELLEMA, P. (2012) Abortion in small ruminants in the Netherlands between 2006 and 2011. Tijdschrift voor diergeneeskunde 137, 450–457
VAN DEN BROM, R., MOLL, L., VAN SCHAIK, G. & VELLEMA, P. (2013) Demography of Q fever seroprevalence in sheep and goats in The Netherlands in 2008. Prev Vet Med 109, 76–82.
VAN DER HOEK, W., VAN DE KASSTEELE, J., BOM, B., DE BRUIN, A., DIJKSTRA, F., SCHIMMER, B., VELLEMA, P., TER SCHEGGET, R. & SCHNEEBERGER, P. M. (2012) Smooth incidence maps give valuable insight into Q fever outbreaks in The Netherlands. Geospat Health 7, 127–134
WHELAN, J., SCHIMMER, B., DE BRUIN, A., VAN BEEST HOLLE, M. R., VAN DER HOEK, W. & TER SCHEGGET, R. (2012) Visits on ‘lamb-viewing days’ at a sheep farm open to the public was a risk factor for Q fever in 2009. Epidemiology and Infection 140, 858–864
group.bmj.com on December 27, 2014 - Published by http://veterinaryrecord.bmj.com/Downloaded from

CHAPTER 4.5
Coxiella burnetii seroprevalence and risk for humans on dairy cattle farms, The Netherlands, 2010-2011
B. SchimmerN. Schotten
E. van EngelenJ.L.A. Hautvast
P.M. SchneebergerY.T.H.P. van Duijnhoven
Emerg Infect Dis. 2014 Mar;20(3):417-25
CHAPTER 4.5
Coxiella burnetii seroprevalence and risk for humans on dairy cattle farms, The Netherlands, 2010-2011
B. SchimmerN. Schotten
E. van EngelenJ.L.A. Hautvast
P.M. SchneebergerY.T.H.P. van Duijnhoven
Emerg Infect Dis. 2014 Mar;20(3):417-25

Time-course of antibody responses against Coxiella burnetiifollowing acute Q fever
P. F. M. TEUNIS 1,2*, B. SCHIMMER 1, D. W. NOTERMANS3,
A. C. A. P. LEENDERS 4, P. C. WEVER 4, M. E. E. KRETZSCHMAR1,5
AND P. M. SCHNEEBERGER 4
1 Centre for Infectious Disease Control, Epidemiology and Surveillance Unit, RIVM, Bilthoven, The Netherlands2 Hubert Department of Global Health, Rollins School of Public Health, Emory University, Atlanta, GA, USA3 Centre for Infectious Disease Control, Laboratory for Infectious Diseases and Perinatal Screening, RIVM,Bilthoven, The Netherlands4 Jeroen Bosch Hospital, Department of Medical Microbiology and Infection Control,’s- Hertogenbosch, TheNetherlands5 Julius Centre for Health Sciences and Primary Care, University Medical Centre Utrecht, Utrecht, The
Netherlands
Received 11 October 2011; Final revision 15 February 2012; Accepted 15 February 2012;
first published online 4 April 2012
SUMMARY
Large outbreaks of Q fever in The Netherlands have provided a unique opportunity for studying
longitudinal serum antibody responses in patients. Results are presented of a cohort of 344
patients with acute symptoms of Q fever with three or more serum samples per patient. In all
these serum samples IgM and IgG against phase 1 and 2 Coxiella burnetii were measured by an
immunofluorescence assay. A mathematical model of the dynamic interaction of serum antibodies
and pathogens was used in a mixed model framework to quantitatively analyse responses to
C. burnetii infection. Responses show strong heterogeneity, with individual serum antibody
responses widely different in magnitude and shape. Features of the response, peak titre and decay
rate, are used to characterize the diversity of the observed responses. Binary mixture analysis of
IgG peak levels (phases 1 and 2) reveals a class of patients with high IgG peak titres that decay
slowly and may represent potential chronic cases. When combining the results of mixture analysis
into an odds score, it is concluded that not only high IgG phase 1 may be predictive for chronic
Q fever, but also that high IgG phase 2 may aid in detecting such putative chronic cases.
Key words: Coxiella, mathematical modelling, Q fever, serology, statistics.
INTRODUCTION
Since mid-2007 human cases of Q fever in The
Netherlands have increased sharply, with major out-
breaks in 2008 and 2009, reaching a total of about
4000 cases by 2010 [1–4]. Cases were predominantly
clustered in the south of The Netherlands [3] and the
majority of the laboratory samples were submitted
to one regional hospital : the Jeroen Bosch Hospital
in ’s-Hertogenbosch (about 2000 confirmed acute
Q fever cases). Follow-up of cases extended over a
period of up to 24 months. In the 3 years that this
outbreak persisted, laboratory results from over 2000
cases were collected in a laboratory database. This
* Author for correspondence : Professor P. F. M. Teunis, Centrefor Infectious Disease Control, Epidemiology and SurveillanceUnit, RIVM, PO Box 1, 3720BA Bilthoven, The Netherlands.(Email : [email protected])
Epidemiol. Infect. (2013), 141, 62–73. f Cambridge University Press 2012
doi:10.1017/S0950268812000404
Q fever, causedbyCoxiella burnetii, is a recognized occupational infection in persons who have regular contact with ruminants. We determined C. burnetii seroprevalence in residents living or working on dairy cattle farms with >50adultcowsandidentifiedriskfactorsforseropositivity.Se-rum samples from farm residents, including employees, were tested for C. burnetii IgG and IgM; seroprevalencewas72.1%overalland87.2%,54.5%,and44.2%amongfarmers, spouses, and children, respectively.Risk factorsincluded farm location in southern region, larger herd size, farm employment, birds in stable, contact with pigs, and in-directcontactwithratsormice.Protectivefactorsincludedautomatic milking of cows and fully compliant use of gloves during and around calving. We recommend strengthening general biosecurity measures, such as consistent use of personalprotectiveequipment(e.g.,boots,clothing,gloves)by farm staff and avoidance of birds and vermin in stables.
Q fever is an occupational zoonosis caused by Coxiella burnetii, a gram-negative bacterium (1). Ruminant
farmers, laboratory workers, dairy workers, and veterinar-ians are at particular risk for infection. Humans usually ac-quire Q fever by inhalation of C. burnetii aerosolized from contaminated materials originating from infected animals. The primary animal reservoirs responsible for human in-fections are cattle, sheep, and goats, which can shed C. burnetii in urine, feces, milk, and birth products. Before
2007, the seroprevalence of C. burnetii antibodies within the general population of the Netherlands was 2.4%; keep-ing ruminants and increasing age were risk factors for se-ropositivity (2). During 2007–2009, Q fever was a major public health problem in the Netherlands; >4,000 human cases were reported (3). Large-scale interventions primar-ily targeting small ruminants were used to control the epi-demic. In 2008, mandatory vaccination was conducted in a defined cluster area and later nationwide. In 2009–2010, a program was implemented to cull pregnant dairy goats and sheep on farms with C. burnetii–positive animals identi-fied through a national bulk tank milk (BTM) screening (4). Since then, the incidence of acute Q fever cases has dimin-ished substantially (5), but chronic cases still occur (6). No epidemiologic associations between Q fever cases in hu-mans and dairy cattle were identified during this epidemic, nor have any been described in other Q fever outbreaks (7). Nevertheless, recent reports indicate that C. burnetii is widespread among Dutch dairy cattle herds (prevalence 78.6% [ELISA] or 56.6% [PCR] in BTM samples) (8). In 2008, seroprevalence was 16.0% in lactating cows and 1.0% in young animals (8).
C. burnetii seroprevalence estimates for dairy cattle farm residents in the Netherlands are outdated, and risk factors associated with seropositivity are seldom studied. This lack of data inhibits accurate assessment of the public health risk. To inform control measures and provide advice for persons living/working on a dairy cattle farm (DCF), we conducted a cross-sectional study to investigate the se-roprevalence of C. burnetii antibodies in DCF residents/workers and identified participant-based and farm-based risk factors for seropositivity. The study was approved by the Medical Ethics Committee of the University Medical Centre Utrecht (no. 09–189/K).
Coxiella burnetii Seroprevalence and Risk for Humans on Dairy Cattle Farms, the Netherlands, 2010–2011
B. Schimmer,1 N. Schotten,1 E. van Engelen, J.L.A. Hautvast, P.M. Schneeberger, and Y.T.H.P. van Duijnhoven
EmergingInfectiousDiseases•www.cdc.gov/eid•Vol.20,No.3,March2014 417
Author affiliations: National Institute for Public Health and the Environment (RIVM), Bilthoven, the Netherlands (B. Schimmer,N. Schotten, Y.T.H.P. van Duynhoven); Animal Health Service,Deventer, theNetherlands (E.vanEngelen);RadboudUniversity NijmegenMedicalCentre,Nijmegen,theNetherlands(J.L.A.Haut-vast);andJeroenBoschHospital, ‘s-Hertogenbosch, theNether-lands(P.M.Schneeberger)
DOI:http://dx.doi.org/10.3201/eid2003.131111 1These authors contributed equally to this article.
Coxiella burnetii Seroprevelance and Risk for Humans on Dairy Cattle Farms, The Netherlands, 2010-2011
B. SCHIMMER1, N. SCHOTTEN1, E. VAN ENGELEN2, J.L.A. HAUTVAST3, P.M. SCHNEEBERGER4, Y.T.H.P. VAN DUIJNHOVEN1
Q fever, causedbyCoxiella burnetii, is a recognized occupational infection in persons who have regular contact with ruminants. We determined C. burnetii seroprevalence in residents living or working on dairy cattle farms with >50adultcowsandidentifiedriskfactorsforseropositivity.Se-rum samples from farm residents, including employees, were tested for C. burnetii IgG and IgM; seroprevalencewas72.1%overalland87.2%,54.5%,and44.2%amongfarmers, spouses, and children, respectively.Risk factorsincluded farm location in southern region, larger herd size, farm employment, birds in stable, contact with pigs, and in-directcontactwithratsormice.Protectivefactorsincludedautomatic milking of cows and fully compliant use of gloves during and around calving. We recommend strengthening general biosecurity measures, such as consistent use of personalprotectiveequipment(e.g.,boots,clothing,gloves)by farm staff and avoidance of birds and vermin in stables.
Q fever is an occupational zoonosis caused by Coxiella burnetii, a gram-negative bacterium (1). Ruminant
farmers, laboratory workers, dairy workers, and veterinar-ians are at particular risk for infection. Humans usually ac-quire Q fever by inhalation of C. burnetii aerosolized from contaminated materials originating from infected animals. The primary animal reservoirs responsible for human in-fections are cattle, sheep, and goats, which can shed C. burnetii in urine, feces, milk, and birth products. Before
2007, the seroprevalence of C. burnetii antibodies within the general population of the Netherlands was 2.4%; keep-ing ruminants and increasing age were risk factors for se-ropositivity (2). During 2007–2009, Q fever was a major public health problem in the Netherlands; >4,000 human cases were reported (3). Large-scale interventions primar-ily targeting small ruminants were used to control the epi-demic. In 2008, mandatory vaccination was conducted in a defined cluster area and later nationwide. In 2009–2010, a program was implemented to cull pregnant dairy goats and sheep on farms with C. burnetii–positive animals identi-fied through a national bulk tank milk (BTM) screening (4). Since then, the incidence of acute Q fever cases has dimin-ished substantially (5), but chronic cases still occur (6). No epidemiologic associations between Q fever cases in hu-mans and dairy cattle were identified during this epidemic, nor have any been described in other Q fever outbreaks (7). Nevertheless, recent reports indicate that C. burnetii is widespread among Dutch dairy cattle herds (prevalence 78.6% [ELISA] or 56.6% [PCR] in BTM samples) (8). In 2008, seroprevalence was 16.0% in lactating cows and 1.0% in young animals (8).
C. burnetii seroprevalence estimates for dairy cattle farm residents in the Netherlands are outdated, and risk factors associated with seropositivity are seldom studied. This lack of data inhibits accurate assessment of the public health risk. To inform control measures and provide advice for persons living/working on a dairy cattle farm (DCF), we conducted a cross-sectional study to investigate the se-roprevalence of C. burnetii antibodies in DCF residents/workers and identified participant-based and farm-based risk factors for seropositivity. The study was approved by the Medical Ethics Committee of the University Medical Centre Utrecht (no. 09–189/K).
Coxiella burnetii Seroprevalence and Risk for Humans on Dairy Cattle Farms, the Netherlands, 2010–2011
B. Schimmer,1 N. Schotten,1 E. van Engelen, J.L.A. Hautvast, P.M. Schneeberger, and Y.T.H.P. van Duijnhoven
EmergingInfectiousDiseases•www.cdc.gov/eid•Vol.20,No.3,March2014 417
Author affiliations: National Institute for Public Health and the Environment (RIVM), Bilthoven, the Netherlands (B. Schimmer,N. Schotten, Y.T.H.P. van Duynhoven); Animal Health Service,Deventer, theNetherlands (E.vanEngelen);RadboudUniversity NijmegenMedicalCentre,Nijmegen,theNetherlands(J.L.A.Haut-vast);andJeroenBoschHospital, ‘s-Hertogenbosch, theNether-lands(P.M.Schneeberger)
DOI:http://dx.doi.org/10.3201/eid2003.131111 1These authors contributed equally to this article.
Affiliaties
Chapter 3.2
1Centre for Infectious Disease Control, National Institute for Public Health and the Environment, Bilthoven, the Netherlands 2Municipal Health Service ‘Brabant Zuidoost, Eindhoven, the Netherlands 3Laboratory for Pathology and Medical Microbiology, Veldhoven, the Netherlands 4Region East, Food and Consumer Product Safety Authority, Zutphen, the Netherlands 5Department of Medical Microbiology and Infection Control, Jeroen Bosch Hospital, ‘s Hertogenbosch, the Netherlands 6Department of Small Ruminant Health, Animal Health Service, Deventer, the Netherlands
Chapter 4.1
1 Centre for Infectious Disease Control, National Institute for Public Health and The Environment, Bilthoven, The Netherlands 2 Academic Collaborative Centre AMPHI, Department of Primary and Community Care, Radboud University Nijmegen Medical Centre, Nijmegen, The Netherlands 3 Department of Medical Microbiology and Infection Control, Jeroen Bosch Hospital, ’s-Hertogenbosch, The Netherlands 4 Department of Small Ruminant Health, Animal Health Service, Deventer, The Netherlands
Chapter 4.2 1Centre for Infectious Disease Control, National Institute for Public Health and the Environment, Bilthoven, the Netherlands 2Quantitative Veterinary Epidemiology Group, Wageningen Institute of Animal Sciences, Wageningen, The Netherlands 3Department of Small Ruminant Health, Animal Health Service, Deventer, The Netherlands 4Academic Collaborative Centre AMPHI, Department of Primary and Community Care, Radboud University Nijmegen Medical Centre, the Netherlands
Chapter 4.4 1Centre for Infectious Disease Control, National Institute for Public Health and the Environment, Bilthoven, the Netherlands 2 Academic Collaborative Centre AMPHI, Department of Primary and Community Care, Radboud University Nijmegen Medical Centre, Nijmegen, the Netherlands 3Department of Small Ruminant Health, Animal Health Service, Deventer, The Netherlands
Chapter 4.5 1 National Institute for Public Health and the Environment (RIVM), Bilthoven, the Netherlands 2 Animal Health Service,Deventer, the Netherlands 3 Radboud University Nijmegen Medical Centre, Nijmegen, the Netherlands 4. Jeroen Bosch Hospital, ‘s-Hertogenbosch, the Netherlands Chapter 4.6 1 GD Animal Health, Deventer, The Netherlands 2 Centre for Infectious Disease Control, National Institute for Public Health and the Environment, Bilthoven, the Netherlands 3 Department of Primary and Community Care, Academic Collaborative Centre for Public Health (AMPHI), Radboud University Nijmegen Medical Centre, Nijmegen, The Netherlands
Chapter 5.1 1 Department of Small Ruminant Health, Animal Health Service, Deventer, The Netherlands 2 Centre for Infectious Disease Control, National Institute for Public Health and the Environment, Bilthoven, The Netherlands 3 Department of Medical Microbiology and Infection Control, Jeroen Bosch Hospital, ‘s-Hertogenbosch, The Netherlands, 4 Department of Diagnostics, Research and Epidemiology, Animal Health Service, Deventer, The Netherlands
Chapter 5.2
1 Division of Environmental Epidemiology, Institute for Risk Assessment Sciences, Utrecht, the Netherlands 2 Centre for Infectious Disease Control, National Institute for Public Health and the Environment, Bilthoven, the Netherlands, 3 Department of Medical Microbiology and Infection Control, Jeroen Bosch Hospital, ‘s-Hertogenbosch, the Netherlands, 4 Division of Veterinary Public Health, Institute for Risk Assessment Sciences, Utrecht, the Netherlands
Chapter 5.3 1.National Institute for Public Health and the Environment, Bilthoven, the Netherlands 2 European Centre for Disease Prevention and Control, Stockholm, Sweden 3 Jeroen Bosch Hospital, ‘s-Hertogenbosch, the Netherlands 4 ArboUnie, Utrecht, the Netherlands
Q fever, causedbyCoxiella burnetii, is a recognized occupational infection in persons who have regular contact with ruminants. We determined C. burnetii seroprevalence in residents living or working on dairy cattle farms with >50adultcowsandidentifiedriskfactorsforseropositivity.Se-rum samples from farm residents, including employees, were tested for C. burnetii IgG and IgM; seroprevalencewas72.1%overalland87.2%,54.5%,and44.2%amongfarmers, spouses, and children, respectively.Risk factorsincluded farm location in southern region, larger herd size, farm employment, birds in stable, contact with pigs, and in-directcontactwithratsormice.Protectivefactorsincludedautomatic milking of cows and fully compliant use of gloves during and around calving. We recommend strengthening general biosecurity measures, such as consistent use of personalprotectiveequipment(e.g.,boots,clothing,gloves)by farm staff and avoidance of birds and vermin in stables.
Q fever is an occupational zoonosis caused by Coxiella burnetii, a gram-negative bacterium (1). Ruminant
farmers, laboratory workers, dairy workers, and veterinar-ians are at particular risk for infection. Humans usually ac-quire Q fever by inhalation of C. burnetii aerosolized from contaminated materials originating from infected animals. The primary animal reservoirs responsible for human in-fections are cattle, sheep, and goats, which can shed C. burnetii in urine, feces, milk, and birth products. Before
2007, the seroprevalence of C. burnetii antibodies within the general population of the Netherlands was 2.4%; keep-ing ruminants and increasing age were risk factors for se-ropositivity (2). During 2007–2009, Q fever was a major public health problem in the Netherlands; >4,000 human cases were reported (3). Large-scale interventions primar-ily targeting small ruminants were used to control the epi-demic. In 2008, mandatory vaccination was conducted in a defined cluster area and later nationwide. In 2009–2010, a program was implemented to cull pregnant dairy goats and sheep on farms with C. burnetii–positive animals identi-fied through a national bulk tank milk (BTM) screening (4). Since then, the incidence of acute Q fever cases has dimin-ished substantially (5), but chronic cases still occur (6). No epidemiologic associations between Q fever cases in hu-mans and dairy cattle were identified during this epidemic, nor have any been described in other Q fever outbreaks (7). Nevertheless, recent reports indicate that C. burnetii is widespread among Dutch dairy cattle herds (prevalence 78.6% [ELISA] or 56.6% [PCR] in BTM samples) (8). In 2008, seroprevalence was 16.0% in lactating cows and 1.0% in young animals (8).
C. burnetii seroprevalence estimates for dairy cattle farm residents in the Netherlands are outdated, and risk factors associated with seropositivity are seldom studied. This lack of data inhibits accurate assessment of the public health risk. To inform control measures and provide advice for persons living/working on a dairy cattle farm (DCF), we conducted a cross-sectional study to investigate the se-roprevalence of C. burnetii antibodies in DCF residents/workers and identified participant-based and farm-based risk factors for seropositivity. The study was approved by the Medical Ethics Committee of the University Medical Centre Utrecht (no. 09–189/K).
Coxiella burnetii Seroprevalence and Risk for Humans on Dairy Cattle Farms, the Netherlands, 2010–2011
B. Schimmer,1 N. Schotten,1 E. van Engelen, J.L.A. Hautvast, P.M. Schneeberger, and Y.T.H.P. van Duijnhoven
EmergingInfectiousDiseases•www.cdc.gov/eid•Vol.20,No.3,March2014 417
Author affiliations: National Institute for Public Health and the Environment (RIVM), Bilthoven, the Netherlands (B. Schimmer,N. Schotten, Y.T.H.P. van Duynhoven); Animal Health Service,Deventer, theNetherlands (E.vanEngelen);RadboudUniversity NijmegenMedicalCentre,Nijmegen,theNetherlands(J.L.A.Haut-vast);andJeroenBoschHospital, ‘s-Hertogenbosch, theNether-lands(P.M.Schneeberger)
DOI:http://dx.doi.org/10.3201/eid2003.131111 1These authors contributed equally to this article.

C. BURNETII SEROPREVALENCE AND RISK IN DAIRY CATTLE FARMERS | 149
4.5
Time-course of antibody responses against Coxiella burnetiifollowing acute Q fever
P. F. M. TEUNIS 1,2*, B. SCHIMMER 1, D. W. NOTERMANS3,
A. C. A. P. LEENDERS 4, P. C. WEVER 4, M. E. E. KRETZSCHMAR1,5
AND P. M. SCHNEEBERGER 4
1 Centre for Infectious Disease Control, Epidemiology and Surveillance Unit, RIVM, Bilthoven, The Netherlands2 Hubert Department of Global Health, Rollins School of Public Health, Emory University, Atlanta, GA, USA3 Centre for Infectious Disease Control, Laboratory for Infectious Diseases and Perinatal Screening, RIVM,Bilthoven, The Netherlands4 Jeroen Bosch Hospital, Department of Medical Microbiology and Infection Control,’s- Hertogenbosch, TheNetherlands5 Julius Centre for Health Sciences and Primary Care, University Medical Centre Utrecht, Utrecht, The
Netherlands
Received 11 October 2011; Final revision 15 February 2012; Accepted 15 February 2012;
first published online 4 April 2012
SUMMARY
Large outbreaks of Q fever in The Netherlands have provided a unique opportunity for studying
longitudinal serum antibody responses in patients. Results are presented of a cohort of 344
patients with acute symptoms of Q fever with three or more serum samples per patient. In all
these serum samples IgM and IgG against phase 1 and 2 Coxiella burnetii were measured by an
immunofluorescence assay. A mathematical model of the dynamic interaction of serum antibodies
and pathogens was used in a mixed model framework to quantitatively analyse responses to
C. burnetii infection. Responses show strong heterogeneity, with individual serum antibody
responses widely different in magnitude and shape. Features of the response, peak titre and decay
rate, are used to characterize the diversity of the observed responses. Binary mixture analysis of
IgG peak levels (phases 1 and 2) reveals a class of patients with high IgG peak titres that decay
slowly and may represent potential chronic cases. When combining the results of mixture analysis
into an odds score, it is concluded that not only high IgG phase 1 may be predictive for chronic
Q fever, but also that high IgG phase 2 may aid in detecting such putative chronic cases.
Key words: Coxiella, mathematical modelling, Q fever, serology, statistics.
INTRODUCTION
Since mid-2007 human cases of Q fever in The
Netherlands have increased sharply, with major out-
breaks in 2008 and 2009, reaching a total of about
4000 cases by 2010 [1–4]. Cases were predominantly
clustered in the south of The Netherlands [3] and the
majority of the laboratory samples were submitted
to one regional hospital : the Jeroen Bosch Hospital
in ’s-Hertogenbosch (about 2000 confirmed acute
Q fever cases). Follow-up of cases extended over a
period of up to 24 months. In the 3 years that this
outbreak persisted, laboratory results from over 2000
cases were collected in a laboratory database. This
* Author for correspondence : Professor P. F. M. Teunis, Centrefor Infectious Disease Control, Epidemiology and SurveillanceUnit, RIVM, PO Box 1, 3720BA Bilthoven, The Netherlands.(Email : [email protected])
Epidemiol. Infect. (2013), 141, 62–73. f Cambridge University Press 2012
doi:10.1017/S0950268812000404
Affiliaties
Chapter 3.2
1Centre for Infectious Disease Control, National Institute for Public Health and the Environment, Bilthoven, the Netherlands 2Municipal Health Service ‘Brabant Zuidoost, Eindhoven, the Netherlands 3Laboratory for Pathology and Medical Microbiology, Veldhoven, the Netherlands 4Region East, Food and Consumer Product Safety Authority, Zutphen, the Netherlands 5Department of Medical Microbiology and Infection Control, Jeroen Bosch Hospital, ‘s Hertogenbosch, the Netherlands 6Department of Small Ruminant Health, Animal Health Service, Deventer, the Netherlands
Chapter 4.1
1 Centre for Infectious Disease Control, National Institute for Public Health and The Environment, Bilthoven, The Netherlands 2 Academic Collaborative Centre AMPHI, Department of Primary and Community Care, Radboud University Nijmegen Medical Centre, Nijmegen, The Netherlands 3 Department of Medical Microbiology and Infection Control, Jeroen Bosch Hospital, ’s-Hertogenbosch, The Netherlands 4 Department of Small Ruminant Health, Animal Health Service, Deventer, The Netherlands
Chapter 4.2 1Centre for Infectious Disease Control, National Institute for Public Health and the Environment, Bilthoven, the Netherlands 2Quantitative Veterinary Epidemiology Group, Wageningen Institute of Animal Sciences, Wageningen, The Netherlands 3Department of Small Ruminant Health, Animal Health Service, Deventer, The Netherlands 4Academic Collaborative Centre AMPHI, Department of Primary and Community Care, Radboud University Nijmegen Medical Centre, the Netherlands
Chapter 4.4 1Centre for Infectious Disease Control, National Institute for Public Health and the Environment, Bilthoven, the Netherlands 2 Academic Collaborative Centre AMPHI, Department of Primary and Community Care, Radboud University Nijmegen Medical Centre, Nijmegen, the Netherlands 3Department of Small Ruminant Health, Animal Health Service, Deventer, The Netherlands
Chapter 4.5 1 National Institute for Public Health and the Environment (RIVM), Bilthoven, the Netherlands 2 Animal Health Service,Deventer, the Netherlands 3 Radboud University Nijmegen Medical Centre, Nijmegen, the Netherlands 4. Jeroen Bosch Hospital, ‘s-Hertogenbosch, the Netherlands Chapter 4.6 1 GD Animal Health, Deventer, The Netherlands 2 Centre for Infectious Disease Control, National Institute for Public Health and the Environment, Bilthoven, the Netherlands 3 Department of Primary and Community Care, Academic Collaborative Centre for Public Health (AMPHI), Radboud University Nijmegen Medical Centre, Nijmegen, The Netherlands
Chapter 5.1 1 Department of Small Ruminant Health, Animal Health Service, Deventer, The Netherlands 2 Centre for Infectious Disease Control, National Institute for Public Health and the Environment, Bilthoven, The Netherlands 3 Department of Medical Microbiology and Infection Control, Jeroen Bosch Hospital, ‘s-Hertogenbosch, The Netherlands, 4 Department of Diagnostics, Research and Epidemiology, Animal Health Service, Deventer, The Netherlands
Chapter 5.2
1 Division of Environmental Epidemiology, Institute for Risk Assessment Sciences, Utrecht, the Netherlands 2 Centre for Infectious Disease Control, National Institute for Public Health and the Environment, Bilthoven, the Netherlands, 3 Department of Medical Microbiology and Infection Control, Jeroen Bosch Hospital, ‘s-Hertogenbosch, the Netherlands, 4 Division of Veterinary Public Health, Institute for Risk Assessment Sciences, Utrecht, the Netherlands
Chapter 5.3 1.National Institute for Public Health and the Environment, Bilthoven, the Netherlands 2 European Centre for Disease Prevention and Control, Stockholm, Sweden 3 Jeroen Bosch Hospital, ‘s-Hertogenbosch, the Netherlands 4 ArboUnie, Utrecht, the Netherlands
RESEARCH
MethodsA total of 3,000 DCFs housing >50 adult dairy cows
were randomly selected for possible participation in the study from a national database maintained by the Animal Health Service. In September and November 2010, infor-mation and recruitment materials were sent to 1,000 and 2,000 farms, respectively. Farms were enrolled in the study after returning a completed informed-consent form. After 4 weeks, nonresponding farms from the first mailing re-ceived a written reminder. Nonresponding farms from the second mailing did not receive a reminder because the goal of enrolling 296 farms had been reached; this number was determined on the basis of power calculations assum-ing 50.0% prevalence and 5.5% precision. We contacted enrolled farms by telephone to confirm participation and determine the number of participants. Dairy cattle farmers and up to 2 family members or farm employees >12 years of age were eligible for participation in the study. Partici-pants completed a questionnaire about personal character-istics (e.g., age, medical history, farm-related activities, contact with livestock and companion animals, consump-tion of unpasteurized dairy products, and use of personal protective equipment [PPE]) and provided a serum sample (collected by a laboratory assistant during a home visit). The farm owner or manager completed a questionnaire about herd size, cattle housing, presence of other livestock and companion animals, farm facilities, animal health, and hygiene measures. Participating farms were requested to provide one BTM sample for testing by ELISA and PCR, as described (8).
SerologyWe used an immunofluorescence assay (IFA) (Focus
Diagnostics, Cypress, CA, USA) to test serum samples for C. burnetii phase I and II IgM and IgG. All samples were screened at an initial dilution of 1:32; those with negative results were considered negative. Positive samples were further classified as indicative of relatively recent infec-tions (IgM phase II titer >32) or past infections (IgG phase II titer >32 and IgM phase II titer <32). Samples with all other outcomes were considered negative. The term rela-tively recent was chosen because phase II IgM is common-ly found up to 1 year after infection in acute Q fever cases, but it may persist up to 3 years (9). Phase I and II IgG end point titers were determined for all seropositive persons. In agreement with chronic Q fever diagnostic criteria used in the Netherlands (10), phase I IgG titers ≥1,024 in samples in the past infection group were considered indicative of possible chronic infection.
Data AnalysisParticipating and nonparticipating farms were
compared with respect to herd size; distance to nearest
C. burnetii–positive BTM small-ruminant farm; goat, sheep, and cattle density; location by province and region; and degree of urbanization. We used the Mann-Whitney U test to determine differences in continuous variables and the χ2 test to analyze categorical variables. We performed univariate logistic regression analyses to determine the main factors associated with C. burnetii seropositivity among participants (p<0.20, likelihood ratio test). Poten-tial farm-based risk factors were analyzed by univariate multilevel analyses; a unique farm identifier was used as the cluster variable. Distributions of continuous variables were studied, and variables not linearly related to the out-come variable were categorized on the basis of biological arguments (e.g., nearest C. burnetii–positive BTM small-ruminant farm) or, if those were lacking, on medians (e.g., goat density within 5-km radius). Participant age was al-ways kept in the model because of its frequent relation with seropositivity. Variables with <10.0% of participants in a risk category were excluded from further analysis. If several variables were found interrelated in the univariate analysis, only the most informative and relevant variable was selected for inclusion.
Risk factors determined to be significant (p<0.20) in univariate analyses of the participant-based and farm-based data were incorporated into multivariate logistic regression and multivariate multilevel analyses, respec-tively. Stratified multivariate analyses for participant risk factors were performed separately for farmers and for the remaining group. Starting with a full model, manual backward elimination was performed; all variables meet-ing the 10.0% significance level in the likelihood ratio test were kept in the final model. Two-way interactions be-tween biologically plausible variables in the multivariate model were investigated. Last, variables included in the final multivariate model for participant-based factors and those included in the multilevel model for farm-based fac-tors were combined in a multivariate multilevel analysis to identify the independent risk determinants for seroposi-tivity. The final model fit was assessed by the quasi-likeli-hood under the independence model criterion goodness-of -fit statistic for generalized estimation equation models. SAS version 9.2 (SAS Institute, Cary, NC, USA) was used for all analyses.
Results
Nonresponse AnalysisOf the 3,000 invited farms, 311 provided a BTM
sample, and 755 persons from 309 (10.3%) farms par-ticipated in this study by providing a serum sample. A farm-based questionnaire was available for 736 (97.5%) persons from 301 farms, and a participant-based question-naire was completed by 729 (96.6%) persons from 308
418 EmergingInfectiousDiseases•www.cdc.gov/eid•Vol.20,No.3,March2014

150 | CHAPTER 4.5
C. burnetiiRiskforHumansonDairyCattleFarms
farms. Compared with nonparticipating farms, participat-ing farms were a median of 1.5 km closer to small rumi-nant farms with C. burnetii–positive BTM samples (Table 1). In addition, the density of sheep within a 5-km radius of participating farms was higher than that for nonpartici-pating farms; however, the absolute difference was very small (3 sheep/km2).
SeroprevalenceOverall C. burnetii seroprevalence was 72.1% (95%
CI 68.8%–75.3%), and seroprevalence among farmers, spouses, and children (12–17 years of age) was 87.2%, 54.5%, and 44.2%, respectively (Table 2). Seroprevalence was univariately significantly higher among male partici-pants, farmers, and participants >35 years of age (Table 3, Appendix, wwwnc.cdc.gov/EID/article/20/3/13-1111-T3.htm). The median duration of farm residence was 28 years (range 0–56). IgG phase II end titers were known for 534 (98.9%) of 540 C. burnetii IgG phase II–seropositive par-ticipants: 32 (n =166), 64 (n = 92), 128 (n = 119), 256 (n = 106), 512 (n = 39), 1,024 (n = 10), 2,048 (n = 1), and 4,096 (n = 1). IgG phase I end titers were known for 283 (97.6%) of the 290 IgG phase I–seropositive participants: 32 (n = 105), 64 (n = 73), 128 (n = 61), 256 (n = 32), 512 (n = 10), 1,024 (n = 1), and 2,048 (n = 1). These last 2
participants, with phase I titers of 1,024 and 2,048, re-spectively, had lower IgG phase II titers (512 and 1,024, respectively), and according to chronic Q fever diagnostic criteria used in the Netherlands (10), these participants met the conditions for possible chronic Q fever infec-tion. We could not confirm that these truly were chronic Q fever cases because clinical information (e.g., presence of vascular infection, endocardial involvement, or other clinical risk factors) was lacking.
Nine (1.2%) participants from 8 farms were classified as having a relatively recent infection (IgM phase II titer range 32–256). All 8 farms were within 2.5–21.2 km of the nearest C. burnetii–positive BTM small-ruminant farm, and 4 of the 8 were within 3 km.
Four participants reported having had Q fever diag-nosed by a physician during 2008–2010. On the basis of serum samples obtained at study entry, 3 of these par-ticipants had a serologic profile indicating past infection. These 3 participants lived in the southern or eastern re-gion of the Netherlands on farms within a 3-km radius of the nearest small-ruminant farm with C. burnetii–posi-tive BTM samples. The fourth participant had no sero-logic evidence of a past infection and lived 14 km from the nearest small-ruminant farm with C. burnetii–positive BTM samples.
EmergingInfectiousDiseases•www.cdc.gov/eid•Vol.20,No.3,March2014 419
Table1.NonresponseanalysesoffarmsinastudyofCoxiella burnetii seroprevalence and risk for seropositivity in humans on dairy cattlefarms,theNetherlands,September2010–March2011
Variable Farms
p value Participating,n=311 Nonparticipating,n=2,685 Categorical,no.(%) Farm located inside vaccination area 83(26.4) 590(21.9) 0.08 Farm region* 0.36 North 80(25.4) 781(29.1) East 104(33.7) 911(33.9) West 57(18.7) 494(18.3) South 70(22.2) 503(18.7) Degree of urbanization of the farm municipality 0.77 Moderately,strongly,orextremely(>1,000addresses/km2) 1(0.3) 17(0.6) Hardly(500–1,000addresses/km2) 10(3.2) 94(3.5) Not(<500addresses/km2) 300(96.5) 2,574(95.9) Numerical,medianno. No.cowsin2008 <1 35 35 0.44 1–2 26 26 0.65 >2 85 86 0.16 Nearestbulktankmilkpositivesmall-ruminantfarm(meters) 9,793 11,301 0.01 Goatdensity(animals/km2)† Within5-km radius 9.2 6.7 0.27 Within10-km radius 9.3 9.2 0.26 Sheepdensity(animals/km2)† Within5-km radius 30 33 0.04 Within10-km radius 34 35 0.11 Cattledensity(animals/km2)within5-km radius† Including own animals 178 181 0.29 Excludingownanimals 175 179 0.27 Cattledensity(animals/km2)within10-km radius† Including own animals 170 170 0.99 Excludingownanimals 169 169 0.91 *NorthrepresentsGroningen,Friesland,andDrentheProvinces;EastrepresentsGelderland,Overijssel,andFlevolandProvinces;WestrepresentsNoord–Holland,Zuid–Holland,Utrecht,andZeelandProvinces;andSouthrepresentsLimburgandNoord–BrabantProvinces. †Corrected for area in the Netherlands.

C. BURNETII SEROPREVALENCE AND RISK IN DAIRY CATTLE FARMERS | 151
4.5
RESEARCH
Univariate Analyses at Participant and Farm LevelsRisk factors for seropositivity for farmers/workers
and residents included age >35 years; farm employment; directly performing cattle-related tasks; contact with cat-tle, pigs, hay, cattle food, raw milk, manure, or cattle birth products; presence of rats or mice on the farm; and grow-ing up on a farm (Table 3, Appendix). Protective factors included poultry and compost contact and fully compliant use of gloves during and around calving. Farm-based risk factors included a larger herd size, farm location in the southern region, an annual peak in calving, having beef cattle on the farm, and the presence of birds in the stable. Protective factors included automatic milking, having pet cats or rabbits, and having farm clothes and boots avail-able for professional visitors (e.g., veterinarians and feed specialists) (Table 4). No relationship was found between PCR or ELISA status on the basis of BTM samples and participant seropositivity.
Multivariate and Multilevel AnalysesOf the 21 variables considered in the multivariate par-
ticipant model, 8 were independently associated with sero-positivity: age >55 years; working on the farm; fully com-pliant use of gloves during cattle birth care; contact with pigs, cattle at other farms, poultry, or compost; and indirect contact with rats or mice (Table 5). Interaction terms did not improve the model.
Of the 9 variables considered in the multilevel farm model, 6 were independently associated with seropositivity; larger herd size, farm location in the southern region, beef cattle on the farm, use of food concentrate, and presence of birds in the stable were risk factors, and automatic milking was a protective factor (Table 6). In the combined multilevel analysis, the 12 significant factors from the multivariate par-ticipant and multilevel farm models, in addition to age, were combined in 1 model. The nonstratified model had a clearly better fit than the stratified model for farmers. Farm location
within 8 km of the nearest C. burnetii–positive BTM small-ruminant farm (odds ratio 2.3, 95% CI 1.2%–2.5%) was a risk factor in the final stratified multilevel model among farmers and was therefore included in the combined mul-tilevel analysis. In the final overall model, independent risk factors were age >55 years, farm employment, pig contact, larger herd size, farm location in the southern region, beef cattle on the farm, cattle contact at other farms, and pres-ence of birds in the stable. Indirect contact with rats or mice was borderline significant (Table 7). Protective factors were contact with poultry or compost, use of automatic milking, and fully compliant use of gloves during birth care. We ran an additional model by adding a protective variable (farm clothes and boots available for professional visitors), as de-scribed in Table 5, in the farm-based and combined multi-level models. Doing so resulted in a final model with the same factors as shown in Table 7, except that automatic milking was replaced by another protective factor (farm clothes and boots available for professional visitors) and 2 borderline significant risk factors (distance to the nearest C. burnetii–positive BTM small-ruminant farm and use of by-product feedstuffs) (data not shown).
DiscussionThe overall seroprevalence of 72.1% among DCF
residents, including employees, was high, indicating a con-siderable lifetime risk for acquiring C. burnetii infection. Seroprevalence was highest among farmers (87.2%). The observed seroprevalence was similar to that determined by a study from the 1980s that showed an estimated serop-revalence of 68.0% among 94 Dutch dairy farm residents; however, laboratory methods used in that study were dif-ferent than those used by us (11). The 72.1% seropreva-lence was also compatible with recent estimates among dairy goat farms residents (68.7%) (12), dairy sheep farms residents (66.7%) (13), and livestock veterinarians (65.1%) (14). Estimates for these livestock-associated groups
420 EmergingInfectiousDiseases•www.cdc.gov/eid•Vol.20,No.3,March2014
Table2.Participantcharacteristics and Coxiella burnetii seroprevalence amongdairycattlefarmresidents,theNetherlands,September2010– March2011 Participantcharacteristic Totalno.residents/no.positive(%) 95%CI All participants 755/544(72.1) 68.8–75.3 Sex M 431/368(85.4) 82.0–88.7 F 323/176(54.5) 49.0–59.9 Age, y <35 169/107(63.3) 56.0–70.7 35–44 176/131(74.4) 67.9–80.9 45–54 252/185(73.4) 67.9–78.9 >55 132/106(80.3) 73.4–87.2 Role Farmer 361/315(87.2) 83.8–90.7 Spouse 222/121(54.5) 47.9–61.1 Child<18y 52/23(44.2) 30.3–58.2 Child>18y 54/40(74.1) 62.0–86.1 Other* 40/30(75.0) 61.0–89.0 *Representsotherfamilymembersandemployees.

152 | CHAPTER 4.5
C. burnetiiRiskforHumansonDairyCattleFarms
exceed the seroprevalence of 2.4% for the Dutch popula-tion during the pre-epidemic period, 2006–2007 (2), and the seroprevalences of 12.2% and 24.0% among persons residing in the most affected outbreak areas during the epi-demic in the Netherlands (15,16).
Seroprevalence studies of other farmer populations, particularly dairy cattle farmers, are scarce, and, in gener-al, it is difficult to compare international studies because of different study populations, tests, or cutoff values used. However, published seroprevalence estimates are generally
EmergingInfectiousDiseases•www.cdc.gov/eid•Vol.20,No.3,March2014 421
Table4.Univariatelogisticmodeloffarm-based characteristics associated with Coxiella burnetii positivity among dairy cattle farm residents,theNetherlands,September2010–March2011* Variable No.residentstotal(%positive) OR(95%CI) No.cowson farm in 2008†‡ 755(72.1) 1.0(1.0–1.0) Nearestbulktank milk positive small-ruminant farm† <8km 331(75.8) 1.4(1.0–1.9) >8km 424(69.1) Reference Municipalcattledensity,includingbeefcalves§ 755(72.1) 1.0(1.0–1.0) Farm location Inside small-ruminant vaccination area 202(78.2) 1.6(1.0–2.3) Outside small-ruminant vaccination area 553(69.8) Reference Farm region† South 170(80.6) 1.8(1.2–2.7) Other 585(69.6) Reference Beef cattle on the farm† Yes 79(82.3) 1.9(1.1–3.4) No 652(70.7) Reference Annual peak in calving Yes 135(76.3) 1.3(0.9–2.0) No 601(71.1) Reference Automatic milking† Yes 154(65.6) 0.7(0.5–1.0) No 580(73.8) Reference Use of bedding in stables Yes 717(72.4) 1.9(1.2–2.9) No 19(57.9) Reference Petcat Yes 444(69.1) 0.6(0.5–0.9) No 285(77.9) Reference Petrabbit Yes 202(64.4) 0.6(0.4–0.8) No 527(75.7) Reference Birds in stable† Yes 90(82.2) 1.9(1.0–3.6) No 644(70.5) Reference Use of by-product feedstuffs† Yes 229(77.3) 1.5(1.0–2.1) No 507(69.6) Reference No. cows that calved in 2009‡ 720(71.8) 1.0(1.0–1.0) No.live-born calves <78 335(69.0) Reference >78 344(74.1) 1.3(0.9–1.8) No.twincalves 1–2 272(69.9) Reference >3 313(76.4) 1.4(1.0–2.0) Type of farm management† Closedherd 515(73.4) Reference Purchaseofcattle 213(68.1) 0.8(0.6–1.1) No. cattle purchase addresses in 2007† 0or1 649(72.7) Reference >2 76(64.5) 0.7(0.4–1.0) Farm boots and work clothes available for professional visitors Yes 662(71.3) 0.7(0.4–1.1) No 74(78.4) Reference Work clothes available for own personnel Yes 556(73.6) 1.4(1.0–1.9) No 180(67.2) Reference *The analysis included the primary farm-basedfactorsassociatedwithpositivity(p<0.20inlikelihoodratiotest).OR,oddsratio. †Variable included in later multivariate analysis before manual backward elimination. ‡Risk increases per cow. §Riskdecreasespercow.
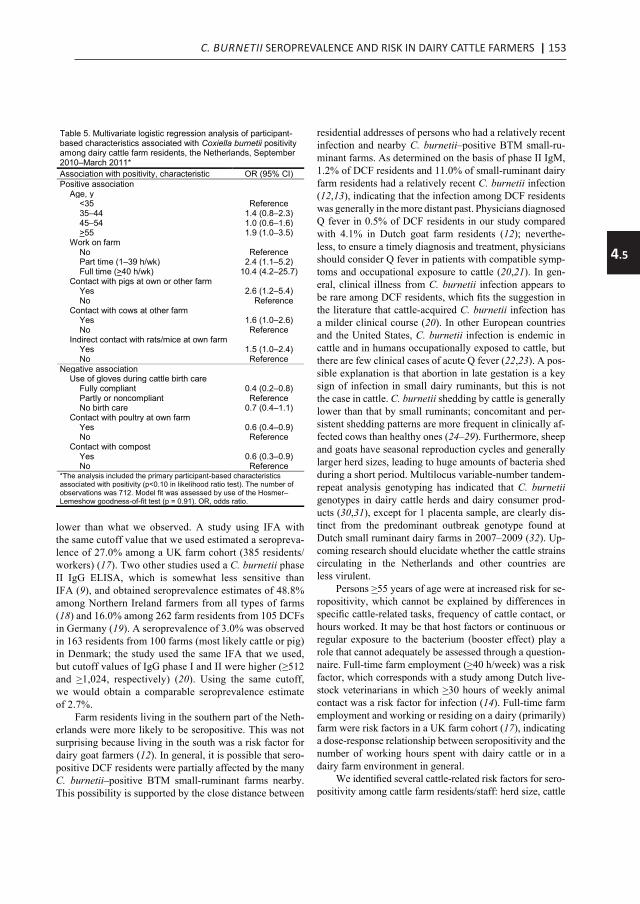
C. BURNETII SEROPREVALENCE AND RISK IN DAIRY CATTLE FARMERS | 153
4.5
RESEARCH
lower than what we observed. A study using IFA with the same cutoff value that we used estimated a seropreva-lence of 27.0% among a UK farm cohort (385 residents/workers) (17). Two other studies used a C. burnetii phase II IgG ELISA, which is somewhat less sensitive than IFA (9), and obtained seroprevalence estimates of 48.8% among Northern Ireland farmers from all types of farms (18) and 16.0% among 262 farm residents from 105 DCFs in Germany (19). A seroprevalence of 3.0% was observed in 163 residents from 100 farms (most likely cattle or pig) in Denmark; the study used the same IFA that we used, but cutoff values of IgG phase I and II were higher (≥512 and >1,024, respectively) (20). Using the same cutoff, we would obtain a comparable seroprevalence estimate of 2.7%.
Farm residents living in the southern part of the Neth-erlands were more likely to be seropositive. This was not surprising because living in the south was a risk factor for dairy goat farmers (12). In general, it is possible that sero-positive DCF residents were partially affected by the many C. burnetii–positive BTM small-ruminant farms nearby. This possibility is supported by the close distance between
residential addresses of persons who had a relatively recent infection and nearby C. burnetii–positive BTM small-ru-minant farms. As determined on the basis of phase II IgM, 1.2% of DCF residents and 11.0% of small-ruminant dairy farm residents had a relatively recent C. burnetii infection (12,13), indicating that the infection among DCF residents was generally in the more distant past. Physicians diagnosed Q fever in 0.5% of DCF residents in our study compared with 4.1% in Dutch goat farm residents (12); neverthe-less, to ensure a timely diagnosis and treatment, physicians should consider Q fever in patients with compatible symp-toms and occupational exposure to cattle (20,21). In gen-eral, clinical illness from C. burnetii infection appears to be rare among DCF residents, which fits the suggestion in the literature that cattle-acquired C. burnetii infection has a milder clinical course (20). In other European countries and the United States, C. burnetii infection is endemic in cattle and in humans occupationally exposed to cattle, but there are few clinical cases of acute Q fever (22,23). A pos-sible explanation is that abortion in late gestation is a key sign of infection in small dairy ruminants, but this is not the case in cattle. C. burnetii shedding by cattle is generally lower than that by small ruminants; concomitant and per-sistent shedding patterns are more frequent in clinically af-fected cows than healthy ones (24–29). Furthermore, sheep and goats have seasonal reproduction cycles and generally larger herd sizes, leading to huge amounts of bacteria shed during a short period. Multilocus variable-number tandem-repeat analysis genotyping has indicated that C. burnetii genotypes in dairy cattle herds and dairy consumer prod-ucts (30,31), except for 1 placenta sample, are clearly dis-tinct from the predominant outbreak genotype found at Dutch small ruminant dairy farms in 2007–2009 (32). Up-coming research should elucidate whether the cattle strains circulating in the Netherlands and other countries are less virulent.
Persons >55 years of age were at increased risk for se-ropositivity, which cannot be explained by differences in specific cattle-related tasks, frequency of cattle contact, or hours worked. It may be that host factors or continuous or regular exposure to the bacterium (booster effect) play a role that cannot adequately be assessed through a question-naire. Full-time farm employment (>40 h/week) was a risk factor, which corresponds with a study among Dutch live-stock veterinarians in which >30 hours of weekly animal contact was a risk factor for infection (14). Full-time farm employment and working or residing on a dairy (primarily) farm were risk factors in a UK farm cohort (17), indicating a dose-response relationship between seropositivity and the number of working hours spent with dairy cattle or in a dairy farm environment in general.
We identified several cattle-related risk factors for sero-positivity among cattle farm residents/staff: herd size, cattle
422 EmergingInfectiousDiseases•www.cdc.gov/eid•Vol.20,No.3,March2014
Table5.Multivariatelogisticregressionanalysisofparticipant-based characteristics associated with Coxiella burnetii positivity amongdairycattlefarmresidents,theNetherlands,September2010–March2011* Association with positivity, characteristic OR(95%CI) Positiveassociation Age, y <35 Reference 35–44 1.4(0.8–2.3) 45–54 1.0(0.6–1.6) >55 1.9(1.0–3.5) Work on farm No Reference Parttime(1–39h/wk) 2.4(1.1–5.2) Fulltime(>40h/wk) 10.4(4.2–25.7) Contactwithpigsatownorotherfarm Yes 2.6(1.2–5.4) No Reference Contactwithcowsatotherfarm Yes 1.6(1.0–2.6) No Reference Indirectcontactwithrats/miceatownfarm Yes 1.5(1.0–2.4) No Reference Negativeassociation Use of gloves during cattle birth care Fully compliant 0.4(0.2–0.8) Partlyornoncompliant Reference Nobirthcare 0.7(0.4–1.1) Contactwithpoultryatownfarm Yes 0.6(0.4–0.9) No Reference Contactwithcompost Yes 0.6(0.3–0.9) No Reference *The analysis included the primary participant-based characteristics associatedwithpositivity(p<0.10inlikelihoodratiotest).Thenumberofobservationswas712.ModelfitwasassessedbyuseoftheHosmer–Lemeshowgoodness-of-fittest(p=0.91).OR,oddsratio.

154 | CHAPTER 4.5
C. burnetiiRiskforHumansonDairyCattleFarms
contact at other farms, and presence of beef cattle on their own farm. A larger herd size could pose a risk because of an increased chance for C. burnetii introduction or the presence of a larger susceptible population of cows; however, some farm-based risk factors associated with a large herd that were not assessed through the questionnaire might also have caused this effect (19,33,34). Cattle contact at other farms possibly reflects risk from exposure to C. burnetii in other infected herds. The presence of beef cattle as a risk factor for DCF residents is not easily explained, but it might reflect risk from more intense birth care and, therefore, more extensive human contact with cattle and birth products.
Protective factors included use of automatic milking and fully compliant use of gloves during birth care. Birth products of C. burnetii–infected ruminants are a source of human infections. A German study among veterinar-ians identified an association between increasing numbers of cattle obstetric procedures performed and seropositiv-ity (21). Pig contact, indirect contact with rats/mice, and presence of wild or domesticated birds in the stable were indicated as risk factors in our study. Studies among veteri-narians in the Netherlands and the United States identified swine contact as a risk factor (14,35); however, C. burnetii has not been found in pigs in the Netherlands (30). Rats and wild birds were identified as C. burnetii reservoirs in several studies (36–38) and as reservoirs on cattle farms in the Netherlands (39).
Fully compliant use of gloves during birth care can help farmers protect themselves against C. burnetii in-fection (21). Consistent use of farm boots and working clothes for professional visitors was a protective factor in our additional multilevel model. It might appear that the use of protective clothing by visitors will prevent C. burnetii transmission to the visitor rather than the farmer; however, providing gloves and farm clothes for visitors indicates a state of optimal awareness on the farm with regard to communicable diseases. In addition, automatic milking of cows might reflect less direct cattle exposure, especially through avoiding contact with the udders, raw milk, manure, and genital fluids, and thus might limit the chance of infection. Statistical analyses indicated lower risk for seropositivity among farm residents exposed to poultry and to compost. We have no biologically plau-sible explanation for this finding, and the statistical ef-fect might have occurred by chance. Raw milk consump-tion was a risk factor for seropositivity in German dairy cattle farmers (19). Although consumption of raw milk was not an independent risk factor in our study, 21.8% of farm residents reported daily drinking of raw milk. C. burnetii exposure during nonautomatic milking could still implicate the risk of inhaling contaminated aerosols during pretreatment of the cow or during accidental raw milk ingestion.
The relatively low response rate of 10.4% in this study can be explained by a general lack of motivation or aware-ness among cattle farmers because Q fever was mainly con-sidered a problem among small-ruminant dairy farms. A general fear of consequences resulting from possible con-trol measures targeting the cattle sector comparable with implemented control measures for Q fever in the small-ru-minant sector might also have played a role. Study results are, however, considered representative for the Dutch dairy cattle sector because participating and nonparticipating farms were generally comparable.
The overall C. burnetii seroprevalence of 72.1% among DCF residents is high. Multilevel analysis identi-fied several plausible risk factors (e.g., employment on a farm, larger herd size, and cattle contact at other farms). A farm location in the southern region as risk factor sug-gests C. burnetii transmission from small-ruminant dairy farms to cattle farm residents living nearby. Use of au-tomatic milking and fully compliant use of gloves dur-ing birth care are plausible protective factors, indicating less direct contact with cattle and, thus, a reduced chance of animal-to-human transmission. The dairy cattle sector must inform farmers about potential sources of infection. Biosecurity measures are warranted; for example, wild birds and vermin should be kept out of stables, and farm-ers/staff should be educated regarding the consistent use of PPE, such as wearing gloves during birth assistance and invasive procedures. Physicians should consider Q fever in the differential diagnosis for dairy cattle farmers with compatible symptoms. Future studies should more explicitly assess the clinical effect of acute and chronic Q fever in humans who live or work on DCFs.
EmergingInfectiousDiseases•www.cdc.gov/eid•Vol.20,No.3,March2014 423
Table6.Multilevelanalysisoffarm-based characteristics as independent factors associated with Coxiella burnetii positivity amongdairycattlefarmresidents,theNetherlands,September2010–March2011* Variable OR(95%CI) No. cows on farm in 2008† 1.0(1.0–1.0) Farm region South 1.8(1.2–2.8) Other Reference Beef cattle on farm Yes 1.7 (1.0–2.8) No Reference Automatic milking Yes 0.7(0.4–1.0) No Reference Birds in stable Yes 2.0(1.1–3.8) No Reference Use of by-product feedstuffs Yes 1.4(1.0–2.0) No Reference *The analysis included the primary farm-based characteristics associated withpositivity(p<0.10inlikelihoodratiotest).Thenumberofobservationswas716;thenumberoflevelsusedwas309(quasi-likelihood under the independencemodelcriterion832.88).OR,oddsratio. †Risk increased per cow.

C. BURNETII SEROPREVALENCE AND RISK IN DAIRY CATTLE FARMERS | 155
4.5
RESEARCH
AcknowledgmentsWe thank all participants for their cooperation in this study;
Diagnostiek Nederland for collecting blood samples at the partici-pating farms; Jeroen Bosch Hospital, especially Jamie Meekelen-kamp, for examining the blood samples; Noel Peters for send-ing test results to the participants’ doctors; Sanne Kelderman for mailing invitations and providing reference data; Helen Aan-genend for coordinating the human data collection; and Ben Bom for generating geographic information. We also thank Jan van de Bergh, Olaf Stenvers, Rob van Oosterom, Mark Paauw, Harry Sti-nis, Ad de Rooij, Margo Vonk, Clementine Wijkmans, and Wim van der Hoek for their support and advice during the study and Roel Coutinho for his comments on the manuscript.
The study was funded by the Netherlands Organization for Health Research and Development (grant no. 50-50800-98-100: an integrated study on Q fever in livestock farmers and their [small] ruminants in the Netherlands) and cofinanced by the Min-istry of Health, Welfare and Sport and the Ministry of Economic Affairs, Agriculture and Innovation.
Dr Schimmer is a medical epidemiologist at RIVM. Her re-search interests are Q fever in the Netherlands and other nonali-mentary zoonoses.
References
1. Dorko E, Rimarova K, Pilipcinec E. Influence of the environment and occupational exposure on the occurrence of Q fever. Cent Eur J Public Health. 2012;20:208–14.
2. Schimmer B, Notermans DW, Harms MG, Reimerink JH, Bakker J, Schneeberger P, et al. Low seroprevalence of Q fever in the Netherlands prior to a series of large outbreaks. Epidemiol Infect. 2012;140:27–35. http://dx.doi.org/10.1017/S0950268811000136
3. Dijkstra F, van der Hoek W, Wijers N, Schimmer B, Rietveld A, Wijkmans CJ, et al. The 2007–2010 Q fever epidemic in the Neth-erlands: characteristics of notified acute Q fever patients and the association with dairy goat farming. FEMS Immunol Med Microbiol. 2012;64:3–12. http://dx.doi.org/10.1111/j.1574-695X. 2011.00876.x
4. van der Hoek W, Dijkstra F, Schimmer B, Schneeberger PM, Vellema P, Wijkmans C, et al. Q fever in the Netherlands: an update on the epidemiology and control measures. Euro Surveill. 2010;15:19520.
5. Roest HI, Hogerwerf L, van der Brom R, Oomen T, van Steenbergen JE, Nielen M, et al. Q fever in the Netherlands: current status, results from veterinary research and expectations of the coming years [in Dutch]. Tijdschr Diergeneeskd. 2011;136:340–3.
6. van der Hoek W, Schneeberger PM, Oomen T, Wegdam-Blans MC, Dijkstra F, Notermans DW, et al. Shifting priorities in the aftermath of a Q fever epidemic in 2007 to 2009 in the Netherlands: from acute to chronic infection. Euro Surveill. 2012;17:20059.
7. Georgiev M, Afonso A, Neubauer H, Needham H, Thiery R, Rodolakis A, et al. Q fever in humans and farm animals in four European countries, 1982 to 2010. Euro Surveill. 2013;18:20407.
8. Muskens J, van Engelen E, van Maanen C, Bartels C, Lam TJ. Prevalence of Coxiella burnetii infection in Dutch dairy herds based on testing bulk tank milk and individual samples by PCR and ELI-SA. Vet Rec. 2011;168:79. http://dx.doi.org/10.1136/vr.c6106
9. Wegdam-Blans MC, Wielders CC, Meekelenkamp J, Korbeeck JM, Herremans T, Tjhie HT, et al. Evaluation of commonly used serolog-ical tests for detection of Coxiella burnetii antibodies in well-defined acute and follow-up sera. Clin Vaccine Immunol. 2012;19:1110–5. http://dx.doi.org/10.1128/CVI.05581-11
10. Wegdam-Blans MC, Kampschreur LM, Delsing CE, Bleeker- Rovers CP, Sprong T, van Kasteren ME, et al. Chronic Q fever: review of the literature and a proposal of new diagnostic criteria. J Infect. 2012;64:247–59. http://dx.doi.org/10.1016/j.jinf.2011.12.014
11. Richardus JH, Donkers A, Dumas AM, Schaap GJ, Akkermans JP, Huisman J, et al. Q fever in the Netherlands: a sero-epidemiological survey among human population groups from 1968 to 1983. Epidemiol Infect. 1987;98:211–9. http://dx.doi.org/10.1017/S0950268800061938
12. Schimmer B, Lenferink A, Schneeberger P, Aangenend H, Vellema P, Hautvast J, et al. Seroprevalence and risk factors for Coxiella burnetii (Q fever) seropositivity in dairy goat farmers’ households in the Netherlands, 2009–2010. PLoS ONE. 2012;7:e42364. http://dx.doi.org/10.1371/journal.pone.0042364
424 EmergingInfectiousDiseases•www.cdc.gov/eid•Vol.20,No.3,March2014
Table7.Combinedmultilevelanalysisofparticipant- and farm-based characteristics associated with Coxiella burnetii seropositivityindairycattlefarmresidents,theNetherlands,September2010–March2011* Variable OR(95%CI) Age, y <35 Reference 35–44 1.3(0.8–2.3) 45–54 1.2(0.7–2.0) >55 1.9(1.1–3.5) Work on farm No Reference Parttime(1–39 h/wk) 2.5(1.1–5.6) Fulltime(>40h/wk) 10.7(4.2–27.0) Use of gloves during cattle birth care Fully compliant 0.4(0.2–0.8) Partlyornoncompliant Reference Nobirthcare 0.7(0.4–1.1) Contactwithpigsatownorotherfarm Yes 2.4(1.1–5.1) No Reference Contactwithpoultryatownfarm Yes 0.5(0.3–0.8) No Reference Indirectcontactwithrats/miceatownfarm Yes 1.6(1.0–2.7) No Reference No. cows on farm in 2008† 1.0(1.0–1.0) Farm region South 1.9(1.2–3.1) Other Reference Automatic milking Yes 0.6(0.4–1.0) No Reference Birds in stable Yes 2.3(1.2–4.4) No Reference Contactwithcowsat other farm Yes 1.8(1.0–3.2) No Reference Contactwithcompost Yes 0.6(0.3–0.9) No Reference Beef cattle on the farm Yes 1.9(1.0–3.7) No Reference *The analysis included the primary participant- and farm-based characteristics associatedwithpositivity(p<0.10inlikelihoodratiotest).Thenumberofobservationswas708;thenumberoflevelsusedwas309(quasi-likelihoodundertheindependencemodelcriterion695.52).OR,odds ratio. †Risk increases per cow.
156 | CHAPTER 4.5
C. burnetiiRiskforHumansonDairyCattleFarms
13. De Lange MMA, Schimmer B, Vellema P, Hautvast JLA, Schneeberger PM, van Duynhoven YTHP. Coxiella burnetii seroprevalence and risk factors in sheep farmers and farm residents in the Netherlands. Epidemiol Infect. 2013 Aug 7:1–14. [Epub ahead of print]. http://dx.doi.org/10.1017/S0950268813001726
14. Van den Brom R, Schimmer B, Schneeberger PM, Swart WA, van der Hoek W, Vellema P. Seroepidemiological survey for Coxiella burnetii antibodies and associated risk factors in Dutch livestock veterinarians. PLoS ONE. 2013;8:e54021. http://dx.doi.org/10.1371/journal.pone.0054021
15. Hogema BM, Slot E, Molier M, Schneeberger PM, Hermans MH, van Hannen EJ, et al. Coxiella burnetii infection among blood donors during the 2009 Q-fever outbreak in the Netherlands. Transfusion. 2012;52:144–50. http://dx.doi.org/10.1111/j.1537-2995.2011.03250.x
16. Karagiannis I, Schimmer B, Van Lier A, Timen A, Schneeberger P, Van Rotterdam B, et al. Investigation of a Q fever outbreak in a rural area of the Netherlands. Epidemiol Infect. 2009;137:1283–94. http://dx.doi.org/10.1017/S0950268808001908
17. Thomas DR, Treweek L, Salmon RL, Kench SM, Coleman TJ, Meadows D, et al. The risk of acquiring Q fever on farms: a seroepidemiological study. Occup Environ Med. 1995;52:644–7. http://dx.doi.org/10.1136/oem.52.10.644
18. McCaughey C, McKenna J, McKenna C, Coyle PV, O’Neill HJ, Wyatt DE, et al. Human seroprevalence to Coxiella burnetii (Q fever) in Northern Ireland. Zoonoses Public Health. 2008;55:189–94. http://dx.doi.org/10.1111/j.1863-2378.2008.01109.x
19. Kopp J. Untersuchungen über Zusammenhänge von C. burnetii- und Chlamydien-Infektionen in Rinderbeständen und der in diesen Betrieben tätigen Personen. Berlin: Freien Universität Berlin; 2000.
20. Bosnjak E, Hvass AM, Villumsen S, Nielsen H. Emerging evidence for Q fever in humans in Denmark: role of contact with dairy cattle. Clin Microbiol Infect. 2010;16:1285–8. http://dx.doi.org/10.1111/j.1469-0691.2009.03062.x
21. Bernard H, Brockmann SO, Kleinkauf N, Klinc C, Wagner-Wiening C, Stark K, et al. High seroprevalence of Coxiella burnetii antibod-ies in veterinarians associated with cattle obstetrics, Bavaria, 2009. Vector Borne Zoonotic Dis. 2012;12:552–7. http://dx.doi.org/10.1089/vbz.2011.0879
22. Nielsen SY, Mølbak K, Nybo Andersen A, Brink Henriksen T, Kantsø B, Krogfelt K, et al. Prevalence of Coxiella burnetii in women exposed to livestock animals, Denmark, 1996 to 2002. Euro Surveill. 2013;18:20528.
23. Anderson AD, Kruszon-Moran D, Loftis AD, McQuillan G, Nicholson WL, Priestley RA, et al. Seroprevalence of Q fever in the United States, 2003–2004. Am J Trop Med Hyg. 2009;81:691–4. http://dx.doi.org/10.4269/ajtmh.2009.09-0168
24. Arricau-Bouvery N, Rodolakis A. Is Q fever an emerging or re-emerging zoonosis? Vet Res. 2005;36:327–49. http://dx.doi.org/10.1051/vetres:2005010
25. Guatteo R, Beaudeau F, Joly A, Seegers H. Coxiella burnetii shedding by dairy cows. Vet Res. 2007;38:849–60. http://dx.doi.org/10.1051/vetres:2007038
26. Guatteo R, Joly A, Beaudeau F. Shedding and serological patterns of dairy cows following abortions associated with Coxiella burnetii DNA detection. Vet Microbiol. 2012;155:430–3. http://dx.doi.org/10.1016/j.vetmic.2011.09.026
27. Hansen MS, Rodolakis A, Cochonneau D, Agger JF, Christoffer-sen AB, Jensen TK, et al. Coxiella burnetii associated placental lesions and infection level in parturient cows. Vet J. 2011;190:e135–9. http://dx.doi.org/10.1016/j.tvjl.2010.12.021
28. Rodolakis A, Berri M, Hechard C, Caudron C, Souriau A, Bodier CC, et al. Comparison of Coxiella burnetii shedding in milk of dairy bovine, caprine, and ovine herds. J Dairy Sci. 2007;90:5352–60. http://dx.doi.org/10.3168/jds.2006-815
29. van Moll P, Baumgartner W, Eskens U, Hanichen T. Immunocytochem-ical demonstration of Coxiella burnetii antigen in the fetal placenta of naturally infected sheep and cattle. J Comp Pathol. 1993;109:295–301. http://dx.doi.org/10.1016/S0021-9975(08)80254-X
30. Roest HIJ, van Solt CB, Tilburg JJHC, Klaassen CHW, Hovius EK, Roest TF, et al. Search for possible additional reservoirs for human Q fever, the Netherlands. Emerg Infect Dis. 2013;19:834–5. http://dx.doi.org/10.3201/eid1905.121489
31. Tilburg JJ, Roest HJ, Nabuurs-Franssen MH, Horrevorts AM, Klaassen CH. Genotyping reveals the presence of a predominant genotype of Coxiella burnetii in consumer milk products. J Clin Microbiol. 2012;50:2156–8. http://dx.doi.org/10.1128/JCM.06831-11
32. Roest HI, Ruuls RC, Tilburg JJ, Nabuurs-Franssen MH, Klaassen CH, Vellema P, et al. Molecular epidemiology of Coxiella burnetii from ruminants in Q fever outbreak, the Netherlands. Emerg Infect Dis. 2011;17:668–75. http://dx.doi.org/10.3201/eid1704.101562
33. McCaughey C, Murray LJ, McKenna JP, Menzies FD, McCullough SJ, O’Neill HJ, et al. Coxiella burnetii (Q fever) sero-prevalence in cattle. Epidemiol Infect. 2010;138:21–7. http://dx.doi.org/10.1017/S0950268809002854
34. Ryan ED, Kirby M, Collins DM, Sayers R, Mee JF, Clegg T. Prevalence of Coxiella burnetii (Q fever) antibodies in bovine se-rum and bulk-milk samples. Epidemiol Infect. 2011;139:1413–7. http://dx.doi.org/10.1017/S0950268810002530
35. Whitney EA, Massung RF, Candee AJ, Ailes EC, Myers LM, Patterson NE, et al. Seroepidemiologic and occupational risk survey for Coxiella burnetii antibodies among US veterinarians. Clin Infect Dis. 2009;48:550–7. http://dx.doi.org/10.1086/596705
36. Parker NR, Barralet JH, Bell AM. Q fever. Lancet. 2006;367:679–88. http://dx.doi.org/10.1016/S0140-6736(06)68266-4
37. Ioannou I, Chochlakis D, Kasinis N, Anayiotos P, Lyssandrou A, Papadopoulos B, et al. Carriage of Rickettsia spp., Coxiella burnetii and Anaplasma spp. by endemic and migratory wild birds and their ectoparasites in Cyprus. Clin Microbiol Infect. 2009;15(Suppl 2):158–60. http://dx.doi.org/10.1111/j.1469-0691.2008.02207.x
38. Stein A, Raoult D. Pigeon pneumonia in Provence: a bird-borne Q fever outbreak. Clin Infect Dis. 1999;29:617–20. http://dx.doi.org/10.1086/598643
39. Reusken C, van der Plaats R, Opsteegh M, de Bruin A, Swart A. Coxiella burnetii (Q fever) in Rattus norvegicus and Rattus rat-tus at livestock farms and urban locations in the Netherlands; could Rattus spp. represent reservoirs for (re)introduction? Prev Vet Med. 2011;101:124–30. http://dx.doi.org/10.1016/j.prevet-med.2011.05.003
Address for correspondence: Barbara Schimmer, Centre for Infectious Disease Control Netherlands, National Institute for Public Health and the Environment, PO Box 1, 3720 BA Bilthoven, the Netherlands; email: [email protected]
EmergingInfectiousDiseases•www.cdc.gov/eid•Vol.20,No.3,March2014 425
Appendix Table 3. Univariate logistic model of participant-based characteristics associated with Coxiella burnetii seropositivity among dairy cattle farm residents, the Netherlands, September 2010– March 2011* Variable No. residents (% positive) OR (95% CI) Sex M 431 (85.4) 4.9 (3.5–6.9) F 323 (54.5) Reference Age, y† <35 169 (63.3) Reference 35–44 176 (74.4) 1.7 (1.1–2.7) 45–54 252 (73.4) 1.6 (1.1–2.4) >55 132 (80.3) 2.4 (1.4–4.0) Role Farmer 361 (87.3) 5.7 (3.8–8.6) Spouse 222 (54.5) Reference Child <18 y 52 (44.2) 0.7 (0.4–1.2) Child >18 y 54 (74.1) 2.4 (1.2–4.6) Other‡ 40 (75.0) 2.5 (1.2–5.4) Presence in stable Every day 584 (78.3) 8.4 (2.1–32.9) Every week 117 (51.3) 2.5 (0.6–10.0) Every month 18 (50.0) 2.3 (0.5–12.0) <1 time/month 10 (30.0) Reference Work on the farm† No 42 (31.0) Reference Part time (1–39 h/wk) 333 (60.7) 3.3 (1.7–6.6) Full time (>40 h/wk) 354 (88.7) 17.5 (8.4–36.4) Care for calves Yes 501 (78.4) 2.5 (1.8–3.5) No 228 (59.6) Reference Milk cows Yes 442 (84.4) 4.5 (3.2–6.4) No 287 (54.4) Reference Feed cattle Yes 515 (81.6) 4.3 (3.0–6.0) No 214 (50.9) Reference Transport cattle Yes 414 (85.0) 4.4 (3.1–6.3) No 315 (56.2) Reference Provide health care for cattle Yes 440 (83.0) 3.7 (2.7–5.3) No 288 (56.6) Reference Provide birth care for cattle Yes 516 (80.8) 3.8 (2.7–5.4) No 212 (52.4) Reference Remove manure Yes 478 (83.3) 4.6 (3.2–6.4) No 251 (52.2) Reference
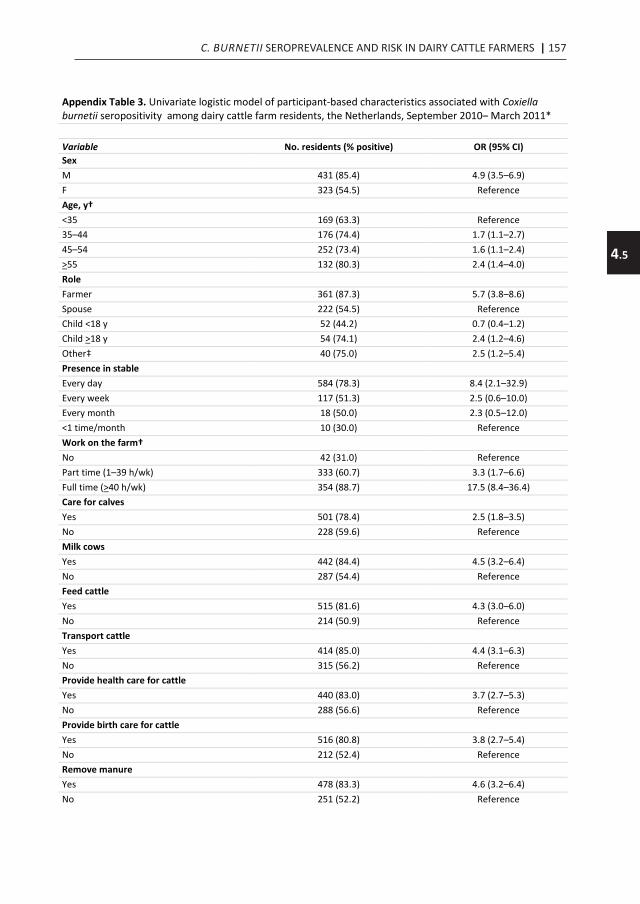
C. BURNETII SEROPREVALENCE AND RISK IN DAIRY CATTLE FARMERS | 157
4.5
Appendix Table 3. Univariate logistic model of participant-based characteristics associated with Coxiella burnetii seropositivity among dairy cattle farm residents, the Netherlands, September 2010– March 2011* Variable No. residents (% positive) OR (95% CI) Sex M 431 (85.4) 4.9 (3.5–6.9) F 323 (54.5) Reference Age, y† <35 169 (63.3) Reference 35–44 176 (74.4) 1.7 (1.1–2.7) 45–54 252 (73.4) 1.6 (1.1–2.4) >55 132 (80.3) 2.4 (1.4–4.0) Role Farmer 361 (87.3) 5.7 (3.8–8.6) Spouse 222 (54.5) Reference Child <18 y 52 (44.2) 0.7 (0.4–1.2) Child >18 y 54 (74.1) 2.4 (1.2–4.6) Other‡ 40 (75.0) 2.5 (1.2–5.4) Presence in stable Every day 584 (78.3) 8.4 (2.1–32.9) Every week 117 (51.3) 2.5 (0.6–10.0) Every month 18 (50.0) 2.3 (0.5–12.0) <1 time/month 10 (30.0) Reference Work on the farm† No 42 (31.0) Reference Part time (1–39 h/wk) 333 (60.7) 3.3 (1.7–6.6) Full time (>40 h/wk) 354 (88.7) 17.5 (8.4–36.4) Care for calves Yes 501 (78.4) 2.5 (1.8–3.5) No 228 (59.6) Reference Milk cows Yes 442 (84.4) 4.5 (3.2–6.4) No 287 (54.4) Reference Feed cattle Yes 515 (81.6) 4.3 (3.0–6.0) No 214 (50.9) Reference Transport cattle Yes 414 (85.0) 4.4 (3.1–6.3) No 315 (56.2) Reference Provide health care for cattle Yes 440 (83.0) 3.7 (2.7–5.3) No 288 (56.6) Reference Provide birth care for cattle Yes 516 (80.8) 3.8 (2.7–5.4) No 212 (52.4) Reference Remove manure Yes 478 (83.3) 4.6 (3.2–6.4) No 251 (52.2) Reference
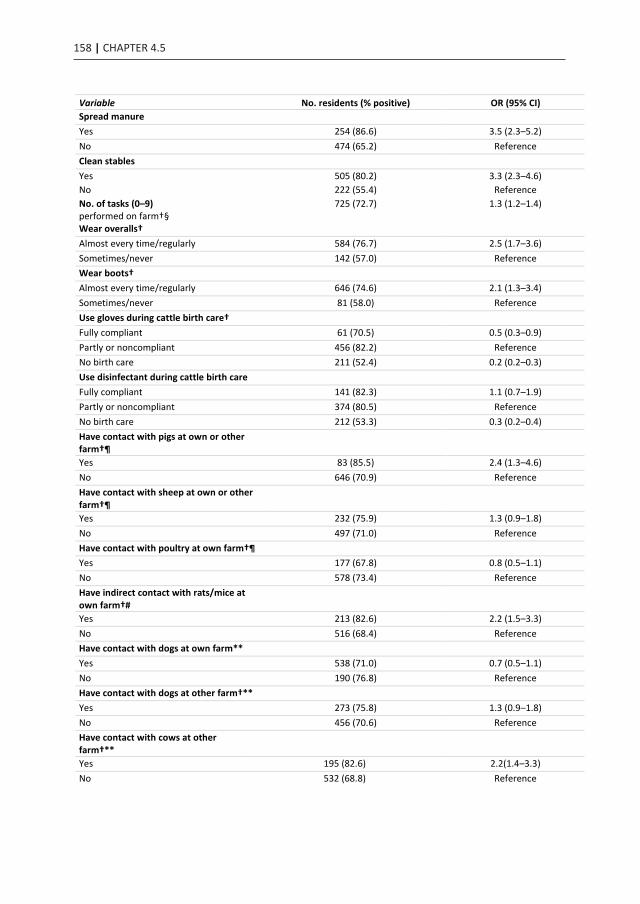
158 | CHAPTER 4.5
Variable No. residents (% positive) OR (95% CI) Spread manure Yes 254 (86.6) 3.5 (2.3–5.2) No 474 (65.2) Reference Clean stables Yes 505 (80.2) 3.3 (2.3–4.6) No 222 (55.4) Reference No. of tasks (0–9) performed on farm†§
725 (72.7) 1.3 (1.2–1.4)
Wear overalls† Almost every time/regularly 584 (76.7) 2.5 (1.7–3.6) Sometimes/never 142 (57.0) Reference Wear boots† Almost every time/regularly 646 (74.6) 2.1 (1.3–3.4) Sometimes/never 81 (58.0) Reference Use gloves during cattle birth care† Fully compliant 61 (70.5) 0.5 (0.3–0.9) Partly or noncompliant 456 (82.2) Reference No birth care 211 (52.4) 0.2 (0.2–0.3) Use disinfectant during cattle birth care Fully compliant 141 (82.3) 1.1 (0.7–1.9) Partly or noncompliant 374 (80.5) Reference No birth care 212 (53.3) 0.3 (0.2–0.4) Have contact with pigs at own or other farm†¶
Yes 83 (85.5) 2.4 (1.3–4.6) No 646 (70.9) Reference Have contact with sheep at own or other farm†¶
Yes 232 (75.9) 1.3 (0.9–1.8) No 497 (71.0) Reference Have contact with poultry at own farm†¶ Yes 177 (67.8) 0.8 (0.5–1.1) No 578 (73.4) Reference Have indirect contact with rats/mice at own farm†#
Yes 213 (82.6) 2.2 (1.5–3.3) No 516 (68.4) Reference Have contact with dogs at own farm** Yes 538 (71.0) 0.7 (0.5–1.1) No 190 (76.8) Reference Have contact with dogs at other farm†** Yes 273 (75.8) 1.3 (0.9–1.8) No 456 (70.6) Reference Have contact with cows at other farm†**
Yes 195 (82.6) 2.2(1.4–3.3) No 532 (68.8) Reference
Variable No. residents (% positive) OR (95% CI) Have indirect contact with cows at other farm#
Yes 326 (77.6) 1.6 (1.1–2.3) No 400 (68.3) Reference Have contact with compost† Yes 139 (66.2) 0.7 (0.5–1.0) No 590 (74.1) Reference Have contact with hay† Daily (almost) 505 (80.2) 3.3 (2.3–4.6) Weekly or less often 222 (55.4) Reference Have contact with cattle food† Daily (almost) 530 (80.9) 4.2 (3.0–6.0) Weekly or less often 199 (50.3) Reference Have contact with raw milk† Daily (almost) 507 (78.9) 2.7 (1.9–3.8) Weekly or less often 221 (57.9) Reference Have contact with sheep or goat manure†
Yes 96 (80.2) 1.6 (1.0–2.8) No 632 (71.4) Reference Have contact with cattle manure† Daily (almost) 477 (83.0) 4.4 (3.1–6.2) Weekly or less often 252 (52.8) Reference Have contact with live–born animals Yes 626 (76.7) 3.7 (2.4–5.7) No 102 (47.1) Reference Have contact with stillborn animals
Yes 304 (83.9) 2.9 (2.0–4.1)
No 424 (64.5) Reference Have contact with placenta material or amniotic fluid†
Yes 425 (84.2) 4.2 (2.9–5.9) No 304 (56.3) Reference Consume Brie cheese† Yes 166 (63.9) 0.6 (0.4–0.9) No 563 (75.1) Reference Lived on a farm with animals during childhood†
Yes 604 (76.4) 2.8 (1. 9–4.2) No 125 (53.6) Reference *Analysis was performed to assess the main participant-based characteristics associated with positivity (p<0.20 in likelihood ratio test) †Variables included in later multivariate analysis before manual backward elimination.
‡Represents other family members and employees. §No. tasks (i.e., caring for calves, milking, feeding cattle, transport of cattle, general cattle health, assistance during calving,
removing manure, spreading manure and cleaning the stables) performed on the farm by 1 person (0–9 tasks). Risk increases per task. ¶See animals at <5 meters or touch animals (contact).
#See animals at <5 meters (indirect contact). **Touch animals (direct contact).

C. BURNETII SEROPREVALENCE AND RISK IN DAIRY CATTLE FARMERS | 159
4.5
Variable No. residents (% positive) OR (95% CI) Spread manure Yes 254 (86.6) 3.5 (2.3–5.2) No 474 (65.2) Reference Clean stables Yes 505 (80.2) 3.3 (2.3–4.6) No 222 (55.4) Reference No. of tasks (0–9) performed on farm†§
725 (72.7) 1.3 (1.2–1.4)
Wear overalls† Almost every time/regularly 584 (76.7) 2.5 (1.7–3.6) Sometimes/never 142 (57.0) Reference Wear boots† Almost every time/regularly 646 (74.6) 2.1 (1.3–3.4) Sometimes/never 81 (58.0) Reference Use gloves during cattle birth care† Fully compliant 61 (70.5) 0.5 (0.3–0.9) Partly or noncompliant 456 (82.2) Reference No birth care 211 (52.4) 0.2 (0.2–0.3) Use disinfectant during cattle birth care Fully compliant 141 (82.3) 1.1 (0.7–1.9) Partly or noncompliant 374 (80.5) Reference No birth care 212 (53.3) 0.3 (0.2–0.4) Have contact with pigs at own or other farm†¶
Yes 83 (85.5) 2.4 (1.3–4.6) No 646 (70.9) Reference Have contact with sheep at own or other farm†¶
Yes 232 (75.9) 1.3 (0.9–1.8) No 497 (71.0) Reference Have contact with poultry at own farm†¶ Yes 177 (67.8) 0.8 (0.5–1.1) No 578 (73.4) Reference Have indirect contact with rats/mice at own farm†#
Yes 213 (82.6) 2.2 (1.5–3.3) No 516 (68.4) Reference Have contact with dogs at own farm** Yes 538 (71.0) 0.7 (0.5–1.1) No 190 (76.8) Reference Have contact with dogs at other farm†** Yes 273 (75.8) 1.3 (0.9–1.8) No 456 (70.6) Reference Have contact with cows at other farm†**
Yes 195 (82.6) 2.2(1.4–3.3) No 532 (68.8) Reference
Variable No. residents (% positive) OR (95% CI) Have indirect contact with cows at other farm#
Yes 326 (77.6) 1.6 (1.1–2.3) No 400 (68.3) Reference Have contact with compost† Yes 139 (66.2) 0.7 (0.5–1.0) No 590 (74.1) Reference Have contact with hay† Daily (almost) 505 (80.2) 3.3 (2.3–4.6) Weekly or less often 222 (55.4) Reference Have contact with cattle food† Daily (almost) 530 (80.9) 4.2 (3.0–6.0) Weekly or less often 199 (50.3) Reference Have contact with raw milk† Daily (almost) 507 (78.9) 2.7 (1.9–3.8) Weekly or less often 221 (57.9) Reference Have contact with sheep or goat manure†
Yes 96 (80.2) 1.6 (1.0–2.8) No 632 (71.4) Reference Have contact with cattle manure† Daily (almost) 477 (83.0) 4.4 (3.1–6.2) Weekly or less often 252 (52.8) Reference Have contact with live–born animals Yes 626 (76.7) 3.7 (2.4–5.7) No 102 (47.1) Reference Have contact with stillborn animals
Yes 304 (83.9) 2.9 (2.0–4.1)
No 424 (64.5) Reference Have contact with placenta material or amniotic fluid†
Yes 425 (84.2) 4.2 (2.9–5.9) No 304 (56.3) Reference Consume Brie cheese† Yes 166 (63.9) 0.6 (0.4–0.9) No 563 (75.1) Reference Lived on a farm with animals during childhood†
Yes 604 (76.4) 2.8 (1. 9–4.2) No 125 (53.6) Reference *Analysis was performed to assess the main participant-based characteristics associated with positivity (p<0.20 in likelihood ratio test) †Variables included in later multivariate analysis before manual backward elimination.
‡Represents other family members and employees. §No. tasks (i.e., caring for calves, milking, feeding cattle, transport of cattle, general cattle health, assistance during calving,
removing manure, spreading manure and cleaning the stables) performed on the farm by 1 person (0–9 tasks). Risk increases per task. ¶See animals at <5 meters or touch animals (contact).
#See animals at <5 meters (indirect contact). **Touch animals (direct contact).

CHAPTER 4.6
Prevalence and risk factors for Coxiella burnetii (Q fever)in Dutch dairy cattle herds based on bulk tank milk testing
E. van EngelenN. Schotten
B. SchimmerJ.L. Hautvast
G. van SchaikY.T.H.P. van Duijnhoven
Prev Vet Med. 2014 Nov 1;117(1):103-9

CHAPTER 4.6
Prevalence and risk factors for Coxiella burnetii (Q fever)in Dutch dairy cattle herds based on bulk tank milk testing
E. van EngelenN. Schotten
B. SchimmerJ.L. Hautvast
G. van SchaikY.T.H.P. van Duijnhoven
Prev Vet Med. 2014 Nov 1;117(1):103-9

Time-course of antibody responses against Coxiella burnetiifollowing acute Q fever
P. F. M. TEUNIS 1,2*, B. SCHIMMER 1, D. W. NOTERMANS3,
A. C. A. P. LEENDERS 4, P. C. WEVER 4, M. E. E. KRETZSCHMAR1,5
AND P. M. SCHNEEBERGER 4
1 Centre for Infectious Disease Control, Epidemiology and Surveillance Unit, RIVM, Bilthoven, The Netherlands2 Hubert Department of Global Health, Rollins School of Public Health, Emory University, Atlanta, GA, USA3 Centre for Infectious Disease Control, Laboratory for Infectious Diseases and Perinatal Screening, RIVM,Bilthoven, The Netherlands4 Jeroen Bosch Hospital, Department of Medical Microbiology and Infection Control,’s- Hertogenbosch, TheNetherlands5 Julius Centre for Health Sciences and Primary Care, University Medical Centre Utrecht, Utrecht, The
Netherlands
Received 11 October 2011; Final revision 15 February 2012; Accepted 15 February 2012;
first published online 4 April 2012
SUMMARY
Large outbreaks of Q fever in The Netherlands have provided a unique opportunity for studying
longitudinal serum antibody responses in patients. Results are presented of a cohort of 344
patients with acute symptoms of Q fever with three or more serum samples per patient. In all
these serum samples IgM and IgG against phase 1 and 2 Coxiella burnetii were measured by an
immunofluorescence assay. A mathematical model of the dynamic interaction of serum antibodies
and pathogens was used in a mixed model framework to quantitatively analyse responses to
C. burnetii infection. Responses show strong heterogeneity, with individual serum antibody
responses widely different in magnitude and shape. Features of the response, peak titre and decay
rate, are used to characterize the diversity of the observed responses. Binary mixture analysis of
IgG peak levels (phases 1 and 2) reveals a class of patients with high IgG peak titres that decay
slowly and may represent potential chronic cases. When combining the results of mixture analysis
into an odds score, it is concluded that not only high IgG phase 1 may be predictive for chronic
Q fever, but also that high IgG phase 2 may aid in detecting such putative chronic cases.
Key words: Coxiella, mathematical modelling, Q fever, serology, statistics.
INTRODUCTION
Since mid-2007 human cases of Q fever in The
Netherlands have increased sharply, with major out-
breaks in 2008 and 2009, reaching a total of about
4000 cases by 2010 [1–4]. Cases were predominantly
clustered in the south of The Netherlands [3] and the
majority of the laboratory samples were submitted
to one regional hospital : the Jeroen Bosch Hospital
in ’s-Hertogenbosch (about 2000 confirmed acute
Q fever cases). Follow-up of cases extended over a
period of up to 24 months. In the 3 years that this
outbreak persisted, laboratory results from over 2000
cases were collected in a laboratory database. This
* Author for correspondence : Professor P. F. M. Teunis, Centrefor Infectious Disease Control, Epidemiology and SurveillanceUnit, RIVM, PO Box 1, 3720BA Bilthoven, The Netherlands.(Email : [email protected])
Epidemiol. Infect. (2013), 141, 62–73. f Cambridge University Press 2012
doi:10.1017/S0950268812000404
Preventive Veterinary Medicine 117 (2014) 103–109
Contents lists available at ScienceDirect
Preventive Veterinary Medicine
journa l homepage: www.e lsev ier .com/ locate /prevetmed
Prevalence and risk factors for Coxiella burnetii (Q fever) inDutch dairy cattle herds based on bulk tank milk testing
E. van Engelena,∗,1, N. Schottenb,1, B. Schimmerb, J.L.A. Hautvastc,G. van Schaika, Y.T.H.P. van Duijnhovenb
a GD Animal Health, P.O. Box 9, 7400 AA Deventer, The Netherlandsb Centre for Infectious Disease Control Netherlands, National Institute for Public Health and the Environment (RIVM), P.O. Box 1, 3720BA Bilthoven, The Netherlandsc Department of Primary and Community Care, Academic Collaborative Centre for Public Health (AMPHI), Radboud University NijmegenMedical Centre, P.O. Box 9101, 6500 HB Nijmegen, The Netherlands
a r t i c l e i n f o
Article history:Received 31 October 2013Received in revised form 27 August 2014Accepted 28 August 2014
Keywords:PrevalenceRisk factorsQ feverDairy cattle
a b s t r a c t
Despite cattle herds can harbor Coxiella burnetii, risk factors for C. burnetii presence in dairycattle herds are largely unknown. Therefore, C. burnetii herd prevalence and risk factors forbulk tank milk (BTM) positivity were investigated. In this cross-sectional study, a question-naire was filled out by the farmer and BTM from 301 farms was tested by ELISA for presenceof C. burnetii antibodies and PCR for presence of C. burnetii DNA. Risk factors were identifiedby univariable and multivariable logistic regression analyses. Antibodies to C. burnetii weredetected in 81.6% (CI: 77.2–85.9) and C. burnetii DNA in 18.8% (CI: 14.4–23.1) of the BTMsamples. Herd size (OR = 1.1 per 10 cows), cleaning the bedding of the cubicles at most everyother day (OR = 2.8) and purchase of cattle from at least two addresses (OR = 3.1) showeda significant and positive association with ELISA positivity and use of an automatic milk-ing system a negative association (OR = 0.3). Risk factors for PCR positivity were purchase ofcattle from at least two delivery addresses (OR = 3.2), presence of cows with ticks (OR = 2.0),use of an automatic milking system (OR = 0.2) and presence of goats or sheep on the farm(OR = 0.4). Biosecurity and general hygiene seem associated with introduction and spreadof C. burnetii in dairy herds.
© 2014 Elsevier B.V. All rights reserved.
Introduction
Q fever is a human zoonosis which is caused by anobligate intracellular Gram-negative bacterium, Coxiellaburnetii (Angelakis and Raoult, 2010). This bacterium hasan almost worldwide distribution, affecting both a vari-ety of animals and humans. In the Netherlands from 2007
∗ Corresponding author. Tel.: +31 0570 660550; fax: +31 0570 660176.E-mail address: [email protected] (E. van Engelen).
1 These authors contributed equally to this work.
to 2010, an outbreak of human cases occurred on a scalethat never had been observed before (van der Hoek et al.,2010; Roest et al., 2011a). This outbreak could be related toabortion problems on dairy goat- and sheep farms. Besidessheep, goats and other animals such as cats, dogs andbirds, also cattle can harbor C. burnetii and can functionas reservoirs for human infection (Fournier et al., 1998;McQuiston et al., 2005; Parker et al., 2006; Angelakis andRaoult, 2010). While for dairy goats and sheep, an impor-tant symptom of infection is abortion, in cattle, this israrely the case, and shedding of C. burnetii is of lowerlevel (van Moll et al., 1993; Arricau-Bouvery and Rodolakis,
http://dx.doi.org/10.1016/j.prevetmed.2014.08.0160167-5877/© 2014 Elsevier B.V. All rights reserved.
Prevalence and risk factors for Coxiella burnetti (Q Fever) in Dutch dairy cattle herds based on bulk tank milk testing
E. VAN ENGELEN1*, N. SCHOTTEN2*, B. SCHIMMER2, J.L. HAUTVAST3, G. VAN SCHAIK1, Y.T.H.P. VAN DUIJNHOVEN2
Preventive Veterinary Medicine 117 (2014) 103–109
Contents lists available at ScienceDirect
Preventive Veterinary Medicine
journa l homepage: www.e lsev ier .com/ locate /prevetmed
Prevalence and risk factors for Coxiella burnetii (Q fever) inDutch dairy cattle herds based on bulk tank milk testing
E. van Engelena,∗,1, N. Schottenb,1, B. Schimmerb, J.L.A. Hautvastc,G. van Schaika, Y.T.H.P. van Duijnhovenb
a GD Animal Health, P.O. Box 9, 7400 AA Deventer, The Netherlandsb Centre for Infectious Disease Control Netherlands, National Institute for Public Health and the Environment (RIVM), P.O. Box 1, 3720BA Bilthoven, The Netherlandsc Department of Primary and Community Care, Academic Collaborative Centre for Public Health (AMPHI), Radboud University NijmegenMedical Centre, P.O. Box 9101, 6500 HB Nijmegen, The Netherlands
a r t i c l e i n f o
Article history:Received 31 October 2013Received in revised form 27 August 2014Accepted 28 August 2014
Keywords:PrevalenceRisk factorsQ feverDairy cattle
a b s t r a c t
Despite cattle herds can harbor Coxiella burnetii, risk factors for C. burnetii presence in dairycattle herds are largely unknown. Therefore, C. burnetii herd prevalence and risk factors forbulk tank milk (BTM) positivity were investigated. In this cross-sectional study, a question-naire was filled out by the farmer and BTM from 301 farms was tested by ELISA for presenceof C. burnetii antibodies and PCR for presence of C. burnetii DNA. Risk factors were identifiedby univariable and multivariable logistic regression analyses. Antibodies to C. burnetii weredetected in 81.6% (CI: 77.2–85.9) and C. burnetii DNA in 18.8% (CI: 14.4–23.1) of the BTMsamples. Herd size (OR = 1.1 per 10 cows), cleaning the bedding of the cubicles at most everyother day (OR = 2.8) and purchase of cattle from at least two addresses (OR = 3.1) showeda significant and positive association with ELISA positivity and use of an automatic milk-ing system a negative association (OR = 0.3). Risk factors for PCR positivity were purchase ofcattle from at least two delivery addresses (OR = 3.2), presence of cows with ticks (OR = 2.0),use of an automatic milking system (OR = 0.2) and presence of goats or sheep on the farm(OR = 0.4). Biosecurity and general hygiene seem associated with introduction and spreadof C. burnetii in dairy herds.
© 2014 Elsevier B.V. All rights reserved.
Introduction
Q fever is a human zoonosis which is caused by anobligate intracellular Gram-negative bacterium, Coxiellaburnetii (Angelakis and Raoult, 2010). This bacterium hasan almost worldwide distribution, affecting both a vari-ety of animals and humans. In the Netherlands from 2007
∗ Corresponding author. Tel.: +31 0570 660550; fax: +31 0570 660176.E-mail address: [email protected] (E. van Engelen).
1 These authors contributed equally to this work.
to 2010, an outbreak of human cases occurred on a scalethat never had been observed before (van der Hoek et al.,2010; Roest et al., 2011a). This outbreak could be related toabortion problems on dairy goat- and sheep farms. Besidessheep, goats and other animals such as cats, dogs andbirds, also cattle can harbor C. burnetii and can functionas reservoirs for human infection (Fournier et al., 1998;McQuiston et al., 2005; Parker et al., 2006; Angelakis andRaoult, 2010). While for dairy goats and sheep, an impor-tant symptom of infection is abortion, in cattle, this israrely the case, and shedding of C. burnetii is of lowerlevel (van Moll et al., 1993; Arricau-Bouvery and Rodolakis,
http://dx.doi.org/10.1016/j.prevetmed.2014.08.0160167-5877/© 2014 Elsevier B.V. All rights reserved.
Affiliaties
Chapter 3.2
1Centre for Infectious Disease Control, National Institute for Public Health and the Environment, Bilthoven, the Netherlands 2Municipal Health Service ‘Brabant Zuidoost, Eindhoven, the Netherlands 3Laboratory for Pathology and Medical Microbiology, Veldhoven, the Netherlands 4Region East, Food and Consumer Product Safety Authority, Zutphen, the Netherlands 5Department of Medical Microbiology and Infection Control, Jeroen Bosch Hospital, ‘s Hertogenbosch, the Netherlands 6Department of Small Ruminant Health, Animal Health Service, Deventer, the Netherlands
Chapter 4.1
1 Centre for Infectious Disease Control, National Institute for Public Health and The Environment, Bilthoven, The Netherlands 2 Academic Collaborative Centre AMPHI, Department of Primary and Community Care, Radboud University Nijmegen Medical Centre, Nijmegen, The Netherlands 3 Department of Medical Microbiology and Infection Control, Jeroen Bosch Hospital, ’s-Hertogenbosch, The Netherlands 4 Department of Small Ruminant Health, Animal Health Service, Deventer, The Netherlands
Chapter 4.2 1Centre for Infectious Disease Control, National Institute for Public Health and the Environment, Bilthoven, the Netherlands 2Quantitative Veterinary Epidemiology Group, Wageningen Institute of Animal Sciences, Wageningen, The Netherlands 3Department of Small Ruminant Health, Animal Health Service, Deventer, The Netherlands 4Academic Collaborative Centre AMPHI, Department of Primary and Community Care, Radboud University Nijmegen Medical Centre, the Netherlands
Chapter 4.4 1Centre for Infectious Disease Control, National Institute for Public Health and the Environment, Bilthoven, the Netherlands 2 Academic Collaborative Centre AMPHI, Department of Primary and Community Care, Radboud University Nijmegen Medical Centre, Nijmegen, the Netherlands 3Department of Small Ruminant Health, Animal Health Service, Deventer, The Netherlands
Chapter 4.5 1 National Institute for Public Health and the Environment (RIVM), Bilthoven, the Netherlands 2 Animal Health Service,Deventer, the Netherlands 3 Radboud University Nijmegen Medical Centre, Nijmegen, the Netherlands 4. Jeroen Bosch Hospital, ‘s-Hertogenbosch, the Netherlands Chapter 4.6 1 GD Animal Health, Deventer, The Netherlands 2 Centre for Infectious Disease Control, National Institute for Public Health and the Environment, Bilthoven, the Netherlands 3 Department of Primary and Community Care, Academic Collaborative Centre for Public Health (AMPHI), Radboud University Nijmegen Medical Centre, Nijmegen, The Netherlands
Chapter 5.1 1 Department of Small Ruminant Health, Animal Health Service, Deventer, The Netherlands 2 Centre for Infectious Disease Control, National Institute for Public Health and the Environment, Bilthoven, The Netherlands 3 Department of Medical Microbiology and Infection Control, Jeroen Bosch Hospital, ‘s-Hertogenbosch, The Netherlands, 4 Department of Diagnostics, Research and Epidemiology, Animal Health Service, Deventer, The Netherlands
Chapter 5.2
1 Division of Environmental Epidemiology, Institute for Risk Assessment Sciences, Utrecht, the Netherlands 2 Centre for Infectious Disease Control, National Institute for Public Health and the Environment, Bilthoven, the Netherlands, 3 Department of Medical Microbiology and Infection Control, Jeroen Bosch Hospital, ‘s-Hertogenbosch, the Netherlands, 4 Division of Veterinary Public Health, Institute for Risk Assessment Sciences, Utrecht, the Netherlands
Chapter 5.3 1.National Institute for Public Health and the Environment, Bilthoven, the Netherlands 2 European Centre for Disease Prevention and Control, Stockholm, Sweden 3 Jeroen Bosch Hospital, ‘s-Hertogenbosch, the Netherlands 4 ArboUnie, Utrecht, the Netherlands
Q fever, causedbyCoxiella burnetii, is a recognized occupational infection in persons who have regular contact with ruminants. We determined C. burnetii seroprevalence in residents living or working on dairy cattle farms with >50adultcowsandidentifiedriskfactorsforseropositivity.Se-rum samples from farm residents, including employees, were tested for C. burnetii IgG and IgM; seroprevalencewas72.1%overalland87.2%,54.5%,and44.2%amongfarmers, spouses, and children, respectively.Risk factorsincluded farm location in southern region, larger herd size, farm employment, birds in stable, contact with pigs, and in-directcontactwithratsormice.Protectivefactorsincludedautomatic milking of cows and fully compliant use of gloves during and around calving. We recommend strengthening general biosecurity measures, such as consistent use of personalprotectiveequipment(e.g.,boots,clothing,gloves)by farm staff and avoidance of birds and vermin in stables.
Q fever is an occupational zoonosis caused by Coxiella burnetii, a gram-negative bacterium (1). Ruminant
farmers, laboratory workers, dairy workers, and veterinar-ians are at particular risk for infection. Humans usually ac-quire Q fever by inhalation of C. burnetii aerosolized from contaminated materials originating from infected animals. The primary animal reservoirs responsible for human in-fections are cattle, sheep, and goats, which can shed C. burnetii in urine, feces, milk, and birth products. Before
2007, the seroprevalence of C. burnetii antibodies within the general population of the Netherlands was 2.4%; keep-ing ruminants and increasing age were risk factors for se-ropositivity (2). During 2007–2009, Q fever was a major public health problem in the Netherlands; >4,000 human cases were reported (3). Large-scale interventions primar-ily targeting small ruminants were used to control the epi-demic. In 2008, mandatory vaccination was conducted in a defined cluster area and later nationwide. In 2009–2010, a program was implemented to cull pregnant dairy goats and sheep on farms with C. burnetii–positive animals identi-fied through a national bulk tank milk (BTM) screening (4). Since then, the incidence of acute Q fever cases has dimin-ished substantially (5), but chronic cases still occur (6). No epidemiologic associations between Q fever cases in hu-mans and dairy cattle were identified during this epidemic, nor have any been described in other Q fever outbreaks (7). Nevertheless, recent reports indicate that C. burnetii is widespread among Dutch dairy cattle herds (prevalence 78.6% [ELISA] or 56.6% [PCR] in BTM samples) (8). In 2008, seroprevalence was 16.0% in lactating cows and 1.0% in young animals (8).
C. burnetii seroprevalence estimates for dairy cattle farm residents in the Netherlands are outdated, and risk factors associated with seropositivity are seldom studied. This lack of data inhibits accurate assessment of the public health risk. To inform control measures and provide advice for persons living/working on a dairy cattle farm (DCF), we conducted a cross-sectional study to investigate the se-roprevalence of C. burnetii antibodies in DCF residents/workers and identified participant-based and farm-based risk factors for seropositivity. The study was approved by the Medical Ethics Committee of the University Medical Centre Utrecht (no. 09–189/K).
Coxiella burnetii Seroprevalence and Risk for Humans on Dairy Cattle Farms, the Netherlands, 2010–2011
B. Schimmer,1 N. Schotten,1 E. van Engelen, J.L.A. Hautvast, P.M. Schneeberger, and Y.T.H.P. van Duijnhoven
EmergingInfectiousDiseases•www.cdc.gov/eid•Vol.20,No.3,March2014 417
Author affiliations: National Institute for Public Health and the Environment (RIVM), Bilthoven, the Netherlands (B. Schimmer,N. Schotten, Y.T.H.P. van Duynhoven); Animal Health Service,Deventer, theNetherlands (E.vanEngelen);RadboudUniversity NijmegenMedicalCentre,Nijmegen,theNetherlands(J.L.A.Haut-vast);andJeroenBoschHospital, ‘s-Hertogenbosch, theNether-lands(P.M.Schneeberger)
DOI:http://dx.doi.org/10.3201/eid2003.131111 1These authors contributed equally to this article.*

C. BURNETII PREVALENCE AND RISK FACTORS IN DAIRY CATTLE HERDS | 163
4.6
Time-course of antibody responses against Coxiella burnetiifollowing acute Q fever
P. F. M. TEUNIS 1,2*, B. SCHIMMER 1, D. W. NOTERMANS3,
A. C. A. P. LEENDERS 4, P. C. WEVER 4, M. E. E. KRETZSCHMAR1,5
AND P. M. SCHNEEBERGER 4
1 Centre for Infectious Disease Control, Epidemiology and Surveillance Unit, RIVM, Bilthoven, The Netherlands2 Hubert Department of Global Health, Rollins School of Public Health, Emory University, Atlanta, GA, USA3 Centre for Infectious Disease Control, Laboratory for Infectious Diseases and Perinatal Screening, RIVM,Bilthoven, The Netherlands4 Jeroen Bosch Hospital, Department of Medical Microbiology and Infection Control,’s- Hertogenbosch, TheNetherlands5 Julius Centre for Health Sciences and Primary Care, University Medical Centre Utrecht, Utrecht, The
Netherlands
Received 11 October 2011; Final revision 15 February 2012; Accepted 15 February 2012;
first published online 4 April 2012
SUMMARY
Large outbreaks of Q fever in The Netherlands have provided a unique opportunity for studying
longitudinal serum antibody responses in patients. Results are presented of a cohort of 344
patients with acute symptoms of Q fever with three or more serum samples per patient. In all
these serum samples IgM and IgG against phase 1 and 2 Coxiella burnetii were measured by an
immunofluorescence assay. A mathematical model of the dynamic interaction of serum antibodies
and pathogens was used in a mixed model framework to quantitatively analyse responses to
C. burnetii infection. Responses show strong heterogeneity, with individual serum antibody
responses widely different in magnitude and shape. Features of the response, peak titre and decay
rate, are used to characterize the diversity of the observed responses. Binary mixture analysis of
IgG peak levels (phases 1 and 2) reveals a class of patients with high IgG peak titres that decay
slowly and may represent potential chronic cases. When combining the results of mixture analysis
into an odds score, it is concluded that not only high IgG phase 1 may be predictive for chronic
Q fever, but also that high IgG phase 2 may aid in detecting such putative chronic cases.
Key words: Coxiella, mathematical modelling, Q fever, serology, statistics.
INTRODUCTION
Since mid-2007 human cases of Q fever in The
Netherlands have increased sharply, with major out-
breaks in 2008 and 2009, reaching a total of about
4000 cases by 2010 [1–4]. Cases were predominantly
clustered in the south of The Netherlands [3] and the
majority of the laboratory samples were submitted
to one regional hospital : the Jeroen Bosch Hospital
in ’s-Hertogenbosch (about 2000 confirmed acute
Q fever cases). Follow-up of cases extended over a
period of up to 24 months. In the 3 years that this
outbreak persisted, laboratory results from over 2000
cases were collected in a laboratory database. This
* Author for correspondence : Professor P. F. M. Teunis, Centrefor Infectious Disease Control, Epidemiology and SurveillanceUnit, RIVM, PO Box 1, 3720BA Bilthoven, The Netherlands.(Email : [email protected])
Epidemiol. Infect. (2013), 141, 62–73. f Cambridge University Press 2012
doi:10.1017/S0950268812000404
Preventive Veterinary Medicine 117 (2014) 103–109
Contents lists available at ScienceDirect
Preventive Veterinary Medicine
journa l homepage: www.e lsev ier .com/ locate /prevetmed
Prevalence and risk factors for Coxiella burnetii (Q fever) inDutch dairy cattle herds based on bulk tank milk testing
E. van Engelena,∗,1, N. Schottenb,1, B. Schimmerb, J.L.A. Hautvastc,G. van Schaika, Y.T.H.P. van Duijnhovenb
a GD Animal Health, P.O. Box 9, 7400 AA Deventer, The Netherlandsb Centre for Infectious Disease Control Netherlands, National Institute for Public Health and the Environment (RIVM), P.O. Box 1, 3720BA Bilthoven, The Netherlandsc Department of Primary and Community Care, Academic Collaborative Centre for Public Health (AMPHI), Radboud University NijmegenMedical Centre, P.O. Box 9101, 6500 HB Nijmegen, The Netherlands
a r t i c l e i n f o
Article history:Received 31 October 2013Received in revised form 27 August 2014Accepted 28 August 2014
Keywords:PrevalenceRisk factorsQ feverDairy cattle
a b s t r a c t
Despite cattle herds can harbor Coxiella burnetii, risk factors for C. burnetii presence in dairycattle herds are largely unknown. Therefore, C. burnetii herd prevalence and risk factors forbulk tank milk (BTM) positivity were investigated. In this cross-sectional study, a question-naire was filled out by the farmer and BTM from 301 farms was tested by ELISA for presenceof C. burnetii antibodies and PCR for presence of C. burnetii DNA. Risk factors were identifiedby univariable and multivariable logistic regression analyses. Antibodies to C. burnetii weredetected in 81.6% (CI: 77.2–85.9) and C. burnetii DNA in 18.8% (CI: 14.4–23.1) of the BTMsamples. Herd size (OR = 1.1 per 10 cows), cleaning the bedding of the cubicles at most everyother day (OR = 2.8) and purchase of cattle from at least two addresses (OR = 3.1) showeda significant and positive association with ELISA positivity and use of an automatic milk-ing system a negative association (OR = 0.3). Risk factors for PCR positivity were purchase ofcattle from at least two delivery addresses (OR = 3.2), presence of cows with ticks (OR = 2.0),use of an automatic milking system (OR = 0.2) and presence of goats or sheep on the farm(OR = 0.4). Biosecurity and general hygiene seem associated with introduction and spreadof C. burnetii in dairy herds.
© 2014 Elsevier B.V. All rights reserved.
Introduction
Q fever is a human zoonosis which is caused by anobligate intracellular Gram-negative bacterium, Coxiellaburnetii (Angelakis and Raoult, 2010). This bacterium hasan almost worldwide distribution, affecting both a vari-ety of animals and humans. In the Netherlands from 2007
∗ Corresponding author. Tel.: +31 0570 660550; fax: +31 0570 660176.E-mail address: [email protected] (E. van Engelen).
1 These authors contributed equally to this work.
to 2010, an outbreak of human cases occurred on a scalethat never had been observed before (van der Hoek et al.,2010; Roest et al., 2011a). This outbreak could be related toabortion problems on dairy goat- and sheep farms. Besidessheep, goats and other animals such as cats, dogs andbirds, also cattle can harbor C. burnetii and can functionas reservoirs for human infection (Fournier et al., 1998;McQuiston et al., 2005; Parker et al., 2006; Angelakis andRaoult, 2010). While for dairy goats and sheep, an impor-tant symptom of infection is abortion, in cattle, this israrely the case, and shedding of C. burnetii is of lowerlevel (van Moll et al., 1993; Arricau-Bouvery and Rodolakis,
http://dx.doi.org/10.1016/j.prevetmed.2014.08.0160167-5877/© 2014 Elsevier B.V. All rights reserved.
Affiliaties
Chapter 3.2
1Centre for Infectious Disease Control, National Institute for Public Health and the Environment, Bilthoven, the Netherlands 2Municipal Health Service ‘Brabant Zuidoost, Eindhoven, the Netherlands 3Laboratory for Pathology and Medical Microbiology, Veldhoven, the Netherlands 4Region East, Food and Consumer Product Safety Authority, Zutphen, the Netherlands 5Department of Medical Microbiology and Infection Control, Jeroen Bosch Hospital, ‘s Hertogenbosch, the Netherlands 6Department of Small Ruminant Health, Animal Health Service, Deventer, the Netherlands
Chapter 4.1
1 Centre for Infectious Disease Control, National Institute for Public Health and The Environment, Bilthoven, The Netherlands 2 Academic Collaborative Centre AMPHI, Department of Primary and Community Care, Radboud University Nijmegen Medical Centre, Nijmegen, The Netherlands 3 Department of Medical Microbiology and Infection Control, Jeroen Bosch Hospital, ’s-Hertogenbosch, The Netherlands 4 Department of Small Ruminant Health, Animal Health Service, Deventer, The Netherlands
Chapter 4.2 1Centre for Infectious Disease Control, National Institute for Public Health and the Environment, Bilthoven, the Netherlands 2Quantitative Veterinary Epidemiology Group, Wageningen Institute of Animal Sciences, Wageningen, The Netherlands 3Department of Small Ruminant Health, Animal Health Service, Deventer, The Netherlands 4Academic Collaborative Centre AMPHI, Department of Primary and Community Care, Radboud University Nijmegen Medical Centre, the Netherlands
Chapter 4.4 1Centre for Infectious Disease Control, National Institute for Public Health and the Environment, Bilthoven, the Netherlands 2 Academic Collaborative Centre AMPHI, Department of Primary and Community Care, Radboud University Nijmegen Medical Centre, Nijmegen, the Netherlands 3Department of Small Ruminant Health, Animal Health Service, Deventer, The Netherlands
Chapter 4.5 1 National Institute for Public Health and the Environment (RIVM), Bilthoven, the Netherlands 2 Animal Health Service,Deventer, the Netherlands 3 Radboud University Nijmegen Medical Centre, Nijmegen, the Netherlands 4. Jeroen Bosch Hospital, ‘s-Hertogenbosch, the Netherlands Chapter 4.6 1 GD Animal Health, Deventer, The Netherlands 2 Centre for Infectious Disease Control, National Institute for Public Health and the Environment, Bilthoven, the Netherlands 3 Department of Primary and Community Care, Academic Collaborative Centre for Public Health (AMPHI), Radboud University Nijmegen Medical Centre, Nijmegen, The Netherlands
Chapter 5.1 1 Department of Small Ruminant Health, Animal Health Service, Deventer, The Netherlands 2 Centre for Infectious Disease Control, National Institute for Public Health and the Environment, Bilthoven, The Netherlands 3 Department of Medical Microbiology and Infection Control, Jeroen Bosch Hospital, ‘s-Hertogenbosch, The Netherlands, 4 Department of Diagnostics, Research and Epidemiology, Animal Health Service, Deventer, The Netherlands
Chapter 5.2
1 Division of Environmental Epidemiology, Institute for Risk Assessment Sciences, Utrecht, the Netherlands 2 Centre for Infectious Disease Control, National Institute for Public Health and the Environment, Bilthoven, the Netherlands, 3 Department of Medical Microbiology and Infection Control, Jeroen Bosch Hospital, ‘s-Hertogenbosch, the Netherlands, 4 Division of Veterinary Public Health, Institute for Risk Assessment Sciences, Utrecht, the Netherlands
Chapter 5.3 1.National Institute for Public Health and the Environment, Bilthoven, the Netherlands 2 European Centre for Disease Prevention and Control, Stockholm, Sweden 3 Jeroen Bosch Hospital, ‘s-Hertogenbosch, the Netherlands 4 ArboUnie, Utrecht, the Netherlands
104 E. van Engelen et al. / Preventive Veterinary Medicine 117 (2014) 103–109
2005; Rodolakis et al., 2007; Hansen et al., 2011). Infectedcows shed the bacterium in feces, milk and birth products(Guatteo et al., 2006, 2007). After shedding, C. burnetii canbe transmitted to humans or to animals on the same farmor on other farms. For humans, the main infection route isby inhalation of infected aerosols (Cutler et al., 2007; Roestet al., 2011a). It has been described previously that in 2007the seroprevalence and DNA prevalence of C. burnetii inbovine herds in the Netherlands were 79% and 28%, respec-tively (Muskens et al., 2011) which was comparable to thatin other western European countries (Agger et al., 2010;Ryan et al., 2011). Because it cannot be excluded that dairycattle may transmit C. burnetii to other species, it is impor-tant to be able to take preventive measures to reduce theprevalence in cattle herds. Therefore, this study presentsboth the herd prevalence of C. burnetii in dairy cattle aswell as the risk factors for C. burnetii antibody and DNApositivity on herd level.
Materials and methods
This study is part of a larger study conducted in 2009 –2011 that describes the relationship between the presenceof C. burnetii in several ruminant species on farm-level andseropositivity for C. burnetii among household members(Schimmer et al., 2012, 2014; De Lange et al., 2014). Theyelaborately describe the methods of our study (Schimmeret al., 2014). In short, a total of 3000 farms with at least 50adult dairy cows were randomly selected from the nationalInformation and Registration database. All farms receivedan informative letter and an invitation to participate in2010. Farmers could agree to participate by returning aninformed consent.
The farm was visited and an electronic questionnairewas filled out by the farmer, containing questions about theherd demographics and animal health management. Thequestionnaire was validated by several veterinary experts,pretested by two farmers and adapted according to theircomments. Ninety closed questions available for univari-able analysis. Furthermore, a bulk tank milk (BTM) samplewas collected for determination of the presence of C. bur-netii DNA (by PCR) and antibodies (by ELISA).
ELISA
In this study, BTM antibodies against C. burnetii weremeasured with an indirect ELISA (LSIVetTM Ruminant QFever – Serum/Milk ELISA Kit, LSI, Lissieu, France). Thetest was used according to the manufacturer’s instruc-tions and was validated for use as bulk milk test byMuskens et al. (2011). Briefly, milk was diluted 1:20in dilution buffer, and transferred to 96 wells ELISAplates (total volume 100 �l), coated with antigen. Thesamples were incubated overnight at 4 ◦C, washed fourtimes and incubated with 100 �l anti-ruminant IgGperoxidase conjugate for 1 h at 37 ◦C. After washingfour times, the wells were incubated with 100 �l tetra-methylbenzidine (TMB) substrate for 10 min at 22 ◦C indarkness. Color development was stopped by the addi-tion of 100 �l 0.5 M H2SO4. Optical density values (OD)were measured at 450 nm. Sample/Positive percentages
(S/P%) were calculated using the following formulaS/P% = (ODsample − ODnegative control)/(ODpositive control −ODnegative control) × 100%. An S/P ratio exceeding 30% wasregarded as positive (Muskens et al., 2011).
PCR
Presence of C. burnetii DNA in BTM samples was testedusing a commercial real-time PCR assay (kit TaqvetTM
Coxiella burnetii, LSI, Lissieu, France) which targets therepetitive transposon-like region of the bacterium. The testwas used according to the manufacturer’s instructions asdescribed previously (Muskens et al., 2011). DNase RNasefree water was used as negative control sample. A sam-ple included in the kit containing 105 C. burnetii/mL wasused as positive control. DNA was extracted using theMagmax Express-96 and the Magmax total nucleic acidisolation kit® according to the manufacturer’s instructions.The extraction was performed directly from 175 �L of rawmilk. The PCR assays were performed using ABI Prism®
sequence Detection System 7500 (Applied Biosystems).Each sample was also tested with a specific primer setfor ruminant Glyceraldehyde-3-phosphatedehydrogenase(GAPDH). For samples with the typical amplification curvesand Ct values <40, presence of C. burnetii/mL was quan-tified, based on a reference line generated from decimaldilutions of the positive control. Since, according to themanufacturer’s recommendations, numbers lower than100 are not quantifiable, parallel to the procedure forgoat BTM (van den Brom et al., 2012), presence of DNAequivalent to 100 bacteria/mL or more was regarded aspositive.
Data analysis
A non-response analysis was conducted to compare par-ticipating and non-participating farms with regard to herdsize (number of cows in different age categories), distanceto nearest C. burnetii BTM positive dairy goat or sheep farm,goat density, sheep density and cattle density for the areain which the farms were situated, location in the area inwhich in 2009 due to the large human outbreaks all dairygoats had to be vaccinated against C. burnetii and province,region and urbanization degree of the region in whichthe farm was located. Differences between responders andnon-responders were analyzed using the Mann–WhitneyU test for continuous variables and the Chi-square test forcategorical variables.
Two logistic regression models were developed, one forELISA results and one for PCR results in BTM. Univariablelogistic regression analysis was performed to select thevariables for the full multivariable models based on p < 0.20in the likelihood ratio test. Variables with less than 10% ofthe participants in the risk category were not included forfurther analysis. When several variables were strongly cor-related in the univariable analysis or not informative, onlythe most informative and relevant variable was selected forinclusion. In the multivariable logistic regression analyses,manual stepwise backwards selection was used to selectsignificant variables with a p-value <0.10 (likelihood ratiotest). This liberal cut-off was used because the presence

164 | CHAPTER 4.6
E. van Engelen et al. / Preventive Veterinary Medicine 117 (2014) 103–109 105
Table 1Prevalence of C. burnetii DNA and antibodies in Dutch dairy cattle herds(n = 309) in the Netherlands, tested by PCR and ELISA on bulk tank milk(number (%)).
PCR ELISA
Negative Positive Total
Negative 57 (18.4) 194(62.8) 251 (81.2)Positive 0 (0.0) 58 (18.8) 58 (18.8)Total 57 (18.4) 252 (81.6) 309 (100.0)
of C. burnetii may have serious public health implications,therefore we did not want to miss potential risk factorseven though the relationships may be weak. Confoundingwas monitored by calculating the change in the coeffi-cient of a variable after removing another variable. If thechange of the estimates exceeded 25%, the removed vari-able was considered as potential confounder. The excludedfactors were added to the final model one by one to checkfor confounding significance. In the final model biologi-cal plausible two-way interactions between variables inthe two multivariable models were investigated for sig-nificance. Goodness of fit was assessed by the HosmerLemeshow test statistic. All analyses were performed usingSAS version 9.2.
Results
3.1. Non-response analysis
Results of the non-response analyses were pub-lished before (Schimmer et al., 2014). In short, theoverall response-rate was 10.4%. Participating and non-participating farms were comparable, except that partic-ipating farms had a smaller distance to C. burnetii BTMpositive small ruminant farms and were more frequentlysituated in an area with a higher sheep density.
3.2. Bulk tank milk analyses
From the 311 farmers that participated, 309 provided aBTM sample. Of those 309, an on-farm questionnaire wasavailable from 301 farms. Of the BTM samples, 81.6% (CI:77.2–85.9) were ELISA positive and 18.8% (CI: 14.4–23.1)were PCR positive (Table 1).
For presence of C. burnetii antibodies in BTM, in theunivariable analysis (including 90 variables), eight vari-ables were significant at p < 0.20 (Table 2). From these,four variables remained in the final model (Table 3): largeherd size (increase per 10 cows; OR = 1.1; CI: 1.0–1.2),cleaning bedding of the cubicles at most every other day(OR = 2.8; CI: 1.1–7.1), having purchased cattle from at
Table 2Univariable analysis results of farm-based factors associated with C. burnetii antibodies in BTM from 301 Dutch dairy cattle herds (p < 0.20, −2LL).
Variable Category Frequency (N) Prevalence (%) p-Value
Herdsize in 2008a,b 309 0.067
Regiona Southeast 174 85.6 0.038Other 135 76.3 Reference
Working on farm since Before 1990 224 77.7 0.0121990 or later 66 92.3 Reference
Use of automatic milking systema Yes 62 67.7 0.002No 238 85.3 Reference
Mattress used as bedding in the cubiclea Yes 182 78.6 0.122No 119 85.7 Reference
Frequency cleaning bedding in stablea Daily or more often 234 78.6 ReferenceEvery other day or less 65 90.8 0.032
Horses on farma Yes 73 75.3 0.142No 225 83.1 Reference
Feeding maize silagea Yes 264 83.0 0.068No 37 70.3 Reference
Numbers of cows that calved in 2009b 294 0.109
Numbers of twins born in 2009 <3 113 76.1 Reference≥3 126 87.3 0.027
Origin of semen Only national 111 81.1 ReferenceInternational 139 86.3 0.262Unknown 40 67.5 0.081
Numbers of cattle purchase addresses in 2009a <2 260 79.6 Reference≥2 36 91.7 0.096
Farm boots available for professional visitorsa Yes 275 82.9 0.033No 26 65.4 Reference
Farm clothes available for professional visitors Yes 278 82.7 0.044No 23 65.2 Reference
a Variables included in multivariable analysis before manual backward elimination.b The risk increases per cow.
106 E. van Engelen et al. / Preventive Veterinary Medicine 117 (2014) 103–109
Table 3Final multivariable logistic regression model for presence of C. bur-netii antibodies in BTM of 289 Dutch dairy cattle herds (p < 0.10,−2LL), with corresponding Odds Ratio and 95% Confidence Interval.Hosmer–Lemeshow goodness-of-fit test p = 0.79.
Variable Category OR [95% CI]
Herd size (per 10cows)
1.1 [1.0–1.2]
Use of automaticmilking system
Yes 0.3 [0.2–0.6]
No Reference
Frequency cleaningbedding in stable
≥2 times/day or daily Reference
Every other day or less 2.8 [1.1–7.1]
Locations fromwhich cattle arepurchased in 2009
<2 Reference
≥2 3.1 [0.9–11.2]
least two addresses in 2009 (OR = 3.1; CI: 0.9–11.2) anduse of an automatic milking system (OR = 0.3; CI: 0.2–0.6).Interaction terms were not statistically significant and noconfounding was present.
Table 5Final multivariable logistic regression model for presence of C. burnetiiDNA in BTM of 284 Dutch dairy cattle herds (p < 0.10, −2LL), with cor-responding Odds Ratio and 95% Confidence Interval. Hosmer–Lemeshowgoodness-of-fit test p = 0.77.
Variable Category OR [95% CI]
Use of automaticmilking system
Yes 0.2 [0.1–0.6]
No Reference
Goats or sheep onfarm
Yes 0.4 [0.1–1.0]
No Reference
Number of cattlepurchase addressesin 2009
<2 Reference
≥2 3.2 [1.4–7.5]
Ticks at dairy cattle Present/unknown 2.0 [1.0–3.9]No Reference
Ten risk factors were significantly associated with pres-ence of C. burnetii DNA in BTM in the univariable analysis(Table 4). From these, four variables remained in the finalmodel (Table 5): having purchased cattle from at least two
Table 4Univariable analysis results of farm-based factors associated which with presence of C. burnetii DNA in BTM from 301 Dutch dairy cattle herds (p < 0.20,−2LL).
Variable Category Frequency (N) Prevalence (%) p-Value
Regiona Southeast 174 21.8 0.119Other 135 14.8 Reference
Distance living to pasture <20 m 111 26.1 0.009≥20 m 151 13.2 Reference
Bulk tank milk cell count <200,000 187 15.0 Reference≥200,000 106 22.6 0.101
Use of automatic milking systema Yes 62 4.8 0.005No 238 21.8 Reference
Poultry on farma Yes 58 10.3 0.082No 240 20.4 Reference
Goats or sheep on farma Yes 53 7.5 0.016No 245 20.8 Reference
Cat in stable Yes 177 20.9 0.170No 123 14.6 Reference
Rabbit/guinea pig in stable Yes 10 40.0 0.087No 289 17.6 Reference
Use of hay as roughagea Yes 218 15.6 0.054No 83 25.3 Reference
Ticks at dairy cattlea Present/unknown 72 28.4 0.010No 222 14.9 Reference
Type of farm management Closed 213 14.6 ReferenceOpen 85 27.1 0.013
Number of cattle purchase addresses in 2009a <2 260 15.4 Reference≥2 36 36.1 0.003
Pet: doga Yes 201 16.4 0.169No 99 23.2
Pet: cata Yes 179 21.8 0.092No 122 13.9 Reference
Pet: rabbita Yes 66 24.2 0.185No 234 17.1 Reference
a Variables included in multivariable analysis before manual backward elimination.
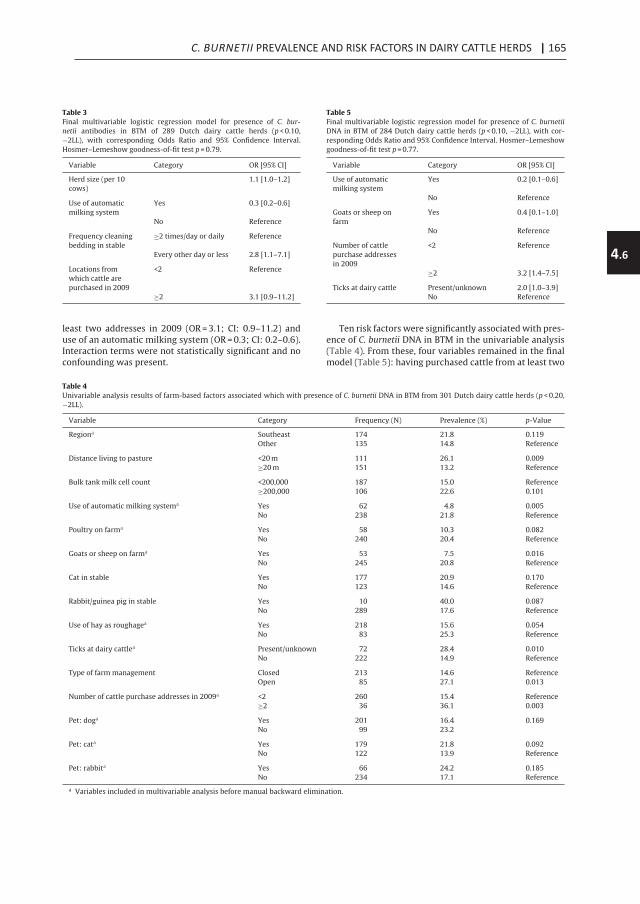
C. BURNETII PREVALENCE AND RISK FACTORS IN DAIRY CATTLE HERDS | 165
4.6
E. van Engelen et al. / Preventive Veterinary Medicine 117 (2014) 103–109 105
Table 1Prevalence of C. burnetii DNA and antibodies in Dutch dairy cattle herds(n = 309) in the Netherlands, tested by PCR and ELISA on bulk tank milk(number (%)).
PCR ELISA
Negative Positive Total
Negative 57 (18.4) 194(62.8) 251 (81.2)Positive 0 (0.0) 58 (18.8) 58 (18.8)Total 57 (18.4) 252 (81.6) 309 (100.0)
of C. burnetii may have serious public health implications,therefore we did not want to miss potential risk factorseven though the relationships may be weak. Confoundingwas monitored by calculating the change in the coeffi-cient of a variable after removing another variable. If thechange of the estimates exceeded 25%, the removed vari-able was considered as potential confounder. The excludedfactors were added to the final model one by one to checkfor confounding significance. In the final model biologi-cal plausible two-way interactions between variables inthe two multivariable models were investigated for sig-nificance. Goodness of fit was assessed by the HosmerLemeshow test statistic. All analyses were performed usingSAS version 9.2.
Results
3.1. Non-response analysis
Results of the non-response analyses were pub-lished before (Schimmer et al., 2014). In short, theoverall response-rate was 10.4%. Participating and non-participating farms were comparable, except that partic-ipating farms had a smaller distance to C. burnetii BTMpositive small ruminant farms and were more frequentlysituated in an area with a higher sheep density.
3.2. Bulk tank milk analyses
From the 311 farmers that participated, 309 provided aBTM sample. Of those 309, an on-farm questionnaire wasavailable from 301 farms. Of the BTM samples, 81.6% (CI:77.2–85.9) were ELISA positive and 18.8% (CI: 14.4–23.1)were PCR positive (Table 1).
For presence of C. burnetii antibodies in BTM, in theunivariable analysis (including 90 variables), eight vari-ables were significant at p < 0.20 (Table 2). From these,four variables remained in the final model (Table 3): largeherd size (increase per 10 cows; OR = 1.1; CI: 1.0–1.2),cleaning bedding of the cubicles at most every other day(OR = 2.8; CI: 1.1–7.1), having purchased cattle from at
Table 2Univariable analysis results of farm-based factors associated with C. burnetii antibodies in BTM from 301 Dutch dairy cattle herds (p < 0.20, −2LL).
Variable Category Frequency (N) Prevalence (%) p-Value
Herdsize in 2008a,b 309 0.067
Regiona Southeast 174 85.6 0.038Other 135 76.3 Reference
Working on farm since Before 1990 224 77.7 0.0121990 or later 66 92.3 Reference
Use of automatic milking systema Yes 62 67.7 0.002No 238 85.3 Reference
Mattress used as bedding in the cubiclea Yes 182 78.6 0.122No 119 85.7 Reference
Frequency cleaning bedding in stablea Daily or more often 234 78.6 ReferenceEvery other day or less 65 90.8 0.032
Horses on farma Yes 73 75.3 0.142No 225 83.1 Reference
Feeding maize silagea Yes 264 83.0 0.068No 37 70.3 Reference
Numbers of cows that calved in 2009b 294 0.109
Numbers of twins born in 2009 <3 113 76.1 Reference≥3 126 87.3 0.027
Origin of semen Only national 111 81.1 ReferenceInternational 139 86.3 0.262Unknown 40 67.5 0.081
Numbers of cattle purchase addresses in 2009a <2 260 79.6 Reference≥2 36 91.7 0.096
Farm boots available for professional visitorsa Yes 275 82.9 0.033No 26 65.4 Reference
Farm clothes available for professional visitors Yes 278 82.7 0.044No 23 65.2 Reference
a Variables included in multivariable analysis before manual backward elimination.b The risk increases per cow.
106 E. van Engelen et al. / Preventive Veterinary Medicine 117 (2014) 103–109
Table 3Final multivariable logistic regression model for presence of C. bur-netii antibodies in BTM of 289 Dutch dairy cattle herds (p < 0.10,−2LL), with corresponding Odds Ratio and 95% Confidence Interval.Hosmer–Lemeshow goodness-of-fit test p = 0.79.
Variable Category OR [95% CI]
Herd size (per 10cows)
1.1 [1.0–1.2]
Use of automaticmilking system
Yes 0.3 [0.2–0.6]
No Reference
Frequency cleaningbedding in stable
≥2 times/day or daily Reference
Every other day or less 2.8 [1.1–7.1]
Locations fromwhich cattle arepurchased in 2009
<2 Reference
≥2 3.1 [0.9–11.2]
least two addresses in 2009 (OR = 3.1; CI: 0.9–11.2) anduse of an automatic milking system (OR = 0.3; CI: 0.2–0.6).Interaction terms were not statistically significant and noconfounding was present.
Table 5Final multivariable logistic regression model for presence of C. burnetiiDNA in BTM of 284 Dutch dairy cattle herds (p < 0.10, −2LL), with cor-responding Odds Ratio and 95% Confidence Interval. Hosmer–Lemeshowgoodness-of-fit test p = 0.77.
Variable Category OR [95% CI]
Use of automaticmilking system
Yes 0.2 [0.1–0.6]
No Reference
Goats or sheep onfarm
Yes 0.4 [0.1–1.0]
No Reference
Number of cattlepurchase addressesin 2009
<2 Reference
≥2 3.2 [1.4–7.5]
Ticks at dairy cattle Present/unknown 2.0 [1.0–3.9]No Reference
Ten risk factors were significantly associated with pres-ence of C. burnetii DNA in BTM in the univariable analysis(Table 4). From these, four variables remained in the finalmodel (Table 5): having purchased cattle from at least two
Table 4Univariable analysis results of farm-based factors associated which with presence of C. burnetii DNA in BTM from 301 Dutch dairy cattle herds (p < 0.20,−2LL).
Variable Category Frequency (N) Prevalence (%) p-Value
Regiona Southeast 174 21.8 0.119Other 135 14.8 Reference
Distance living to pasture <20 m 111 26.1 0.009≥20 m 151 13.2 Reference
Bulk tank milk cell count <200,000 187 15.0 Reference≥200,000 106 22.6 0.101
Use of automatic milking systema Yes 62 4.8 0.005No 238 21.8 Reference
Poultry on farma Yes 58 10.3 0.082No 240 20.4 Reference
Goats or sheep on farma Yes 53 7.5 0.016No 245 20.8 Reference
Cat in stable Yes 177 20.9 0.170No 123 14.6 Reference
Rabbit/guinea pig in stable Yes 10 40.0 0.087No 289 17.6 Reference
Use of hay as roughagea Yes 218 15.6 0.054No 83 25.3 Reference
Ticks at dairy cattlea Present/unknown 72 28.4 0.010No 222 14.9 Reference
Type of farm management Closed 213 14.6 ReferenceOpen 85 27.1 0.013
Number of cattle purchase addresses in 2009a <2 260 15.4 Reference≥2 36 36.1 0.003
Pet: doga Yes 201 16.4 0.169No 99 23.2
Pet: cata Yes 179 21.8 0.092No 122 13.9 Reference
Pet: rabbita Yes 66 24.2 0.185No 234 17.1 Reference
a Variables included in multivariable analysis before manual backward elimination.
166 | CHAPTER 4.6
E. van Engelen et al. / Preventive Veterinary Medicine 117 (2014) 103–109 107
delivery addresses in 2009 (OR = 3.2; CI: 1.4–7.5), havingdairy cattle with ticks or unknown tick status (OR = 2.0; CI:1.0–3.9), use of an automatic milking system (OR = 0.2; CI:0.1–0.6) and having goats or sheep on the farm (OR = 0.4; CI:0.1–1.0). Interaction terms were not statistically significantand no confounding was present.
Discussion
The aim of the study was to estimate the herd preva-lence of C. burnetii in dairy cattle and to identify andquantify risk factors for C. burnetii antibody and DNA posi-tivity on herd level.
ELISA and PCR prevalence
A considerable part of the Dutch cattle herds had C. bur-netii antibodies (81.6%) or DNA (18.8%) in their BTM. Whencomparing these figures to prevalences in other countries,it must be taken into account that differences can be causedby the use of different diagnostic techniques and matri-ces (Guatteo et al., 2011). In the review of Guatteo et al.based on DNA and antibody tests, prevalences from 4.4% to100% at herd level were reported worldwide, with a meanof 37.7%. In the United States, herd prevalences varied from26.3% (McQuiston and Childs, 2002) to 94.3% (Kim et al.,2005) while in Asia, herd prevalences from 16.7% to 35.4%were determined (Guatteo et al., 2011). In Norway, no indi-cation of C. burnetii infection in dairy cattle was observed(Kampen et al., 2012). However, herd prevalences of 59% inDenmark, 64.5% in Northern Ireland and 72.3% in Germanywere reported (Agger et al., 2010; McCaughey et al., 2010;Bottcher et al., 2011). A large study in the Netherlands in2007 showed a prevalence of 78.6% C. burnetii antibodiesin BTM samples from dairy cattle herds (Muskens et al.,2011), which was comparable with the result of 81.6% seenin our study. However, in our study 18.8% of the dairy cattleherds was PCR positive, which was significantly (p < 0.05)lower than found by Muskens et al. (28.2%), when usingthe same test and cut-off value. They conducted their studyin the Netherlands just in the beginning of a large humanoutbreak that occurred from 2007 to 2009 resulting in com-pulsory control measures for dairy goat herds. Therefore,the lower prevalence in 2011 in dairy cattle herds mightbe related to the control measures that were applied atdairy goat farms. Even though C. burnetii types found indairy cattle herds were different from the type that wasmainly present in dairy goats and in human cases duringthe 2007–2009 outbreak, the strain similar to that in goatshas been found as well (Roest et al., 2011b, 2013).
Risk factors
Several factors were associated with BTM status. It can-not be excluded that there was some bias in the resultsdue to the low response rate and the finding that partic-ipating farms had a smaller distance to C. burnetii BTMpositive small ruminant farms and were more frequentlysituated in an area with a higher sheep density. However,the differences for these variables were small and partici-pating and non-participating farms were not different for
the other characteristics for which they could be compared(Schimmer et al., 2014). Therefore, the potential responsebias will not to have influenced the results of the study toa large extent.
A consistent and strong correlation was found betweenBTM status (PCR and ELISA) and purchase of cattle from atleast two addresses in 2009. In general, purchasing animalsis a well-known risk factor for introduction of infectiousdiseases (van Schaik et al., 2002; Fevre et al., 2006). Inaddition, for C. burnetii it has been shown that use of quar-antine for newly purchased animals reduced BTM ELISApositivity (Paul et al., 2012). Both findings indicate that theintroduction of new animals with unknown disease sta-tus might be a substantial risk for introducing C. burnetiiin the herd (Brennan and Christley, 2012). In our study,a larger dairy herd size turned out to be a risk factor forBTM ELISA positivity. This is in agreement with other stud-ies (McCaughey et al., 2010; Ryan et al., 2011; Paul et al.,2012). In The Netherlands in 1211 there were 19,247 herdswith on average 76 milking cows with an average annualmilk production of 8.063 kg per cow (Zuivel in cijfers 2011,Dutch Dairy Board). A large herd could face an increasedrisk, either because of an increased chance of introductionof the pathogen or because of a decreased chance to clearthe infection due to the presence of a relatively large num-ber of susceptible animals. In addition, larger herds maydiffer in management practices that are favorable for a C.burnetii infection. Thus, farm-related risk factors that areassociated with herd size may have influenced this associ-ation.
The use of automatic milking was unrelated to herdsize and is a strong negatively associated factor for ELISA(OR = 0.3) and PCR positivity (OR = 0.2). To the best of ourknowledge, this is the first time, that a relationship is foundbetween milking systems and risk of infectious diseases,except mastitis (Hovinen and Pyorala, 2011). Automaticmilking was introduced in the Netherlands in 1992 and itsuse has increased to 16% in 2012 (Stichting KwaliteitszorgOnderhoud Melkinstallaties (KOM), The Netherlands). Inour study automatic milking was performed on 20% of thefarms. The management practices, cow behavior and con-tact structures are obviously different between herds withautomatic milking and herds with conventional milking(Jacobs and Siegford, 2012). So, automatic milking could bea surrogate for other underlying risk factors not availablein this study. When automatic milking is used, cows arenot gathered simultaneously at pre-milking but are milkedseparately. It was shown previously that tie stalls have alower risk to be C. burnetii BTM positive than free stalls, alsoprobably caused by different contact structures betweenthe cows and thus a reduced risk of transmission (Paul et al.,2012). We could not reproduce this because in our studyonly 3 (1%) herds were housed in tie stalls.
Cleaning the bedding in the cubicles at least once per daywas negatively associated to presence of C. burnetii anti-bodies in BTM. This could be a proxy measure of hygienepractices in general. However, it could also be explainedby a decreased transmission of C. burnetii to other cows inthe herd by removing contaminated birth material or gen-ital tract excretions deposited in the bedding when cowslie down in the cubicles. It has been shown before, that
108 E. van Engelen et al. / Preventive Veterinary Medicine 117 (2014) 103–109
hygiene of cubicles in free stalls influences infection rates(De Kruif, 1978). In parallel, also for endometritis, it wassuggested that bedding plays a role in the transmission ofendometritis related bacteria (Cheong et al., 2011).
A risk factor for PCR positivity was the presence of dairycattle with ticks or an unknown tick status compared to nothaving dairy cattle with ticks. Cantas et al. (2011) also foundthat dairy cattle in Cyprus with ticks had an increased riskfor C. burnetii PCR positivity (Cantas et al., 2011). Spronget al. (2012) however, found no C. burnetii in ticks originat-ing from dairy cattle in the Netherlands in 2008. However,in that study ticks from only one location were investigated.One might argue that the presence of ticks on the cows is aregional effect or is a proxy for grazing practices (Capuanoet al., 2001) because in our study tick infestation was sig-nificantly more seen on cattle that grazed during summer(93.2% vs 72.2%, �2, p = 0.0002). However, the underlyingfactors were not statistically significant in the model.
Having sheep or goats on the farm showed a negativeassociation with PCR positivity. This effect could partly bedue to the fact that farms with sheep or goats (only a fewcattle farms had only goats as small ruminants) are moreoften located in the northwestern part of the Netherlands,more distant from the epicenter of the Q fever outbreak ingoats and humans. In addition, farms with goats and sheepmay have a more extensive management system.
This study found several factors associated with C. bur-netii BTM positivity. The results emphasize the importanceof biosecurity and optimized hygiene for decreasing therisk for C. burnetii on farm level.
Acknowledgments
We would like to thank all farmers for their cooper-ation in this study. In addition, we would like to thankSanne Kelderman for the invitation mailings and providingreference data, and Ben Bom for generating geographicalinformation. Finally, we thank all expert members of theQ-VIVE project group and affiliated organizations for theirsupport and advice during the study: Jan van de Bergh,Olaf Stenvers, Rob van Oosterom, Mark Paauw, Harry Stinis,Ad de Rooij, Margo Vonk, Clementine Wijkmans and Wimvan der Hoek. The study was funded by the NetherlandsOrganization for Health Research and Development (grantno. 50-50800-98-100: An integrated study on Q feverin livestock farmers and their (small) ruminants in theNetherlands); and co-financed by the Dutch Dairy Board,the Ministry of Health and Welfare and the Ministry ofEconomic Affairs, Agriculture and Innovation. The fundershad no role in study design, data collection and analysis,decision to publish or preparation of the manuscript.
References
Agger, J.F., Christoffersen, A.B., Rattenborg, E., Nielsen, J., Agerholm, J.S.,2010. Prevalence of Coxiella burnetii antibodies in Danish dairy herds.Acta. Vet. Scand. 52, 5.
Angelakis, E., Raoult, D., 2010. Q Fever. Vet. Microbiol. 140, 297–309.Arricau-Bouvery, N., Rodolakis, A., 2005. Is Q fever an emerging or re-
emerging zoonosis? Vet. Res. 36, 327–349.Bottcher, J., Vossen, A., Janowetz, B., Alex, M., Gangl, A., Randt, A., Meier, N.,
2011. Insights into the dynamics of endemic Coxiella burnetii infection
in cattle by application of phase-specific ELISAs in an infected dairyherd. Vet. Microbiol. 151, 291–300.
Brennan, M.L., Christley, R.M., 2012. Biosecurity on cattle farms: a studyin north-west England. PLoS ONE 7, e28139.
Cantas, H., Muwonge, A., Sareyyupoglu, B., Yardimci, H., Skjerve, E., 2011.Q fever abortions in ruminants and associated on-farm risk factors innorthern Cyprus. BMC Vet. Res. 7, 13.
Capuano, F., Landolfi, M.C., Monetti, D.M., 2001. Influence of threetypes of farm management on the seroprevalence of Q fever asassessed by an indirect immunofluorescence assay. Vet. Rec. 149, 669–671.
Cheong, S.H., Nydam, D.V., Galvao, K.N., Crosier, B.M., Gilbert, R.O., 2011.Cow-level and herd-level risk factors for subclinical endometritis inlactating Holstein cows. J. Dairy Sci. 94, 762–770.
Cutler, S.J., Bouzid, M., Cutler, R.R., 2007. Q fever. J. Infect. 54, 313–318.De Kruif, A., 1978. Factors influencing the fertility of a cattle population. J.
Reprod. Fertil. 54, 507–518.De Lange, M.M., Schimmer, B., Vellema, P., Hautvast, J.L., Schneeberger,
P.M., Van Duijnhoven, Y.T., 2014. Coxiella burnetii seroprevalence andrisk factors in sheep farmers and farm residents in The Netherlands.Epidemiol. Infect. 142, 1231–1244.
Fevre, E.M., Bronsvoort, B.M., Hamilton, K.A., Cleaveland, S., 2006. Animalmovements and the spread of infectious diseases. Trends Microbiol.14, 125–131.
Fournier, P.E., Marrie, T.J., Raoult, D., 1998. Diagnosis of Q fever. J. Clin.Microbiol. 36, 1823–1834.
Guatteo, R., Beaudeau, F., Berri, M., Rodolakis, A., Joly, A., Seegers, H., 2006.Shedding routes of Coxiella burnetii in dairy cows: implications fordetection and control. Vet. Res. 37, 827–833.
Guatteo, R., Beaudeau, F., Joly, A., Seegers, H., 2007. Coxiella burnetii shed-ding by dairy cows. Vet. Res. 38, 849–860.
Guatteo, R., Seegers, H., Taurel, A.F., Joly, A., Beaudeau, F., 2011. Prevalenceof Coxiella burnetii infection in domestic ruminants: a critical review.Vet. Microbiol. 149, 1–16.
Hansen, M.S., Rodolakis, A., Cochonneau, D., Agger, J.F., Christoffersen,A.B., Jensen, T.K., Agerholm, J.S., 2011. Coxiella burnetii associatedplacental lesions and infection level in parturient cows. Vet. J. 190,135–139.
Hovinen, M., Pyorala, S., 2011. Invited review: udder health of dairy cowsin automatic milking. J. Dairy Sci. 94, 547–562.
Jacobs, J.A., Siegford, J.M., 2012. Invited review: the impact of automaticmilking systems on dairy cow management, behavior, health, andwelfare. J. Dairy Sci. 95, 2227–2247.
Kampen, A.H., Hopp, P., Groneng, G.M., Melkild, I., Urdahl, A.M., Karlsson,A.C., Tharaldsen, J., 2012. No indication of Coxiella burnetii infection inNorwegian farmed ruminants. BMC Vet. Res. 8, 59.
Kim, S.G., Kim, E.H., Lafferty, C.J., Dubovi, E., 2005. Coxiella burnetii in bulktank milk samples, United States. Emerg. Infect. Dis. 11, 619–621.
McCaughey, C., Murray, L.J., McKenna, J.P., Menzies, F.D., McCullough, S.J.,O’Neill, H.J., Wyatt, D.E., Cardwell, C.R., Coyle, P.V., 2010. Coxiella bur-netii (Q fever) seroprevalence in cattle. Epidemiol. Infect. 138, 21–27.
McQuiston, J.H., Childs, J.E., 2002. Q fever in humans and animals in theUnited States. Vector Borne Zoonotic Dis. 2, 179–191.
McQuiston, J.H., Nargund, V.N., Miller, J.D., Priestley, R., Shaw, E.I., Thomp-son, H.A., 2005. Prevalence of antibodies to Coxiella burnetii amongveterinary school dairy herds in the United States, 2003. Vector BorneZoonotic Dis. 5, 90–91.
Muskens, J., van Engelen, E., van Maanen, C., Bartels, C., Lam, T.J., 2011.Prevalence of Coxiella burnetii infection in Dutch dairy herds based ontesting bulk tank milk and individual samples by PCR and ELISA. Vet.Rec. 168, 79.
Parker, N.R., Barralet, J.H., Bell, A.M., 2006. Q fever. Lancet 367, 679–688.Paul, S., Agger, J.F., Markussen, B., Christoffersen, A.B., Agerholm, J.S., 2012.
Factors associated with Coxiella burnetii antibody positivity in Danishdairy cows. Prev. Vet. Med. 107, 57–64.
Rodolakis, A., Berri, M., Hechard, C., Caudron, C., Souriau, A., Bodier, C.C.,Blanchard, B., Camuset, P., Devillechaise, P., Natorp, J.C., Vadet, J.P.,Arricau-Bouvery, N., 2007. Comparison of Coxiella burnetii sheddingin milk of dairy bovine, caprine, and ovine herds. J. Dairy Sci. 90,5352–5360.
Roest, H.I., Tilburg, J.J., van der Hoek, W., Vellema, P., van Zijderveld,F.G., Klaassen, C.H., Raoult, D., 2011a. The Q fever epidemic in TheNetherlands: history, onset, response and reflection. Epidemiol. Infect.139, 1–12.
Roest, H.I., Ruuls, R.C., Tilburg, J.J., Nabuurs-Franssen, M.H., Klaassen, C.H.,Vellema, P., van den Brom, R., Dercksen, D., Wouda, W., Spierenburg,M.A., van der Spek, A.N., Buijs, R., de Boer, A.G., Willemsen, P.T., vanZijderveld, F.G., 2011b. Molecular epidemiology of Coxiella burnetiifrom ruminants in Q fever outbreak, the Netherlands. Emerg. Infect.Dis. 17, 668–675.

C. BURNETII PREVALENCE AND RISK FACTORS IN DAIRY CATTLE HERDS | 167
4.6
E. van Engelen et al. / Preventive Veterinary Medicine 117 (2014) 103–109 107
delivery addresses in 2009 (OR = 3.2; CI: 1.4–7.5), havingdairy cattle with ticks or unknown tick status (OR = 2.0; CI:1.0–3.9), use of an automatic milking system (OR = 0.2; CI:0.1–0.6) and having goats or sheep on the farm (OR = 0.4; CI:0.1–1.0). Interaction terms were not statistically significantand no confounding was present.
Discussion
The aim of the study was to estimate the herd preva-lence of C. burnetii in dairy cattle and to identify andquantify risk factors for C. burnetii antibody and DNA posi-tivity on herd level.
ELISA and PCR prevalence
A considerable part of the Dutch cattle herds had C. bur-netii antibodies (81.6%) or DNA (18.8%) in their BTM. Whencomparing these figures to prevalences in other countries,it must be taken into account that differences can be causedby the use of different diagnostic techniques and matri-ces (Guatteo et al., 2011). In the review of Guatteo et al.based on DNA and antibody tests, prevalences from 4.4% to100% at herd level were reported worldwide, with a meanof 37.7%. In the United States, herd prevalences varied from26.3% (McQuiston and Childs, 2002) to 94.3% (Kim et al.,2005) while in Asia, herd prevalences from 16.7% to 35.4%were determined (Guatteo et al., 2011). In Norway, no indi-cation of C. burnetii infection in dairy cattle was observed(Kampen et al., 2012). However, herd prevalences of 59% inDenmark, 64.5% in Northern Ireland and 72.3% in Germanywere reported (Agger et al., 2010; McCaughey et al., 2010;Bottcher et al., 2011). A large study in the Netherlands in2007 showed a prevalence of 78.6% C. burnetii antibodiesin BTM samples from dairy cattle herds (Muskens et al.,2011), which was comparable with the result of 81.6% seenin our study. However, in our study 18.8% of the dairy cattleherds was PCR positive, which was significantly (p < 0.05)lower than found by Muskens et al. (28.2%), when usingthe same test and cut-off value. They conducted their studyin the Netherlands just in the beginning of a large humanoutbreak that occurred from 2007 to 2009 resulting in com-pulsory control measures for dairy goat herds. Therefore,the lower prevalence in 2011 in dairy cattle herds mightbe related to the control measures that were applied atdairy goat farms. Even though C. burnetii types found indairy cattle herds were different from the type that wasmainly present in dairy goats and in human cases duringthe 2007–2009 outbreak, the strain similar to that in goatshas been found as well (Roest et al., 2011b, 2013).
Risk factors
Several factors were associated with BTM status. It can-not be excluded that there was some bias in the resultsdue to the low response rate and the finding that partic-ipating farms had a smaller distance to C. burnetii BTMpositive small ruminant farms and were more frequentlysituated in an area with a higher sheep density. However,the differences for these variables were small and partici-pating and non-participating farms were not different for
the other characteristics for which they could be compared(Schimmer et al., 2014). Therefore, the potential responsebias will not to have influenced the results of the study toa large extent.
A consistent and strong correlation was found betweenBTM status (PCR and ELISA) and purchase of cattle from atleast two addresses in 2009. In general, purchasing animalsis a well-known risk factor for introduction of infectiousdiseases (van Schaik et al., 2002; Fevre et al., 2006). Inaddition, for C. burnetii it has been shown that use of quar-antine for newly purchased animals reduced BTM ELISApositivity (Paul et al., 2012). Both findings indicate that theintroduction of new animals with unknown disease sta-tus might be a substantial risk for introducing C. burnetiiin the herd (Brennan and Christley, 2012). In our study,a larger dairy herd size turned out to be a risk factor forBTM ELISA positivity. This is in agreement with other stud-ies (McCaughey et al., 2010; Ryan et al., 2011; Paul et al.,2012). In The Netherlands in 1211 there were 19,247 herdswith on average 76 milking cows with an average annualmilk production of 8.063 kg per cow (Zuivel in cijfers 2011,Dutch Dairy Board). A large herd could face an increasedrisk, either because of an increased chance of introductionof the pathogen or because of a decreased chance to clearthe infection due to the presence of a relatively large num-ber of susceptible animals. In addition, larger herds maydiffer in management practices that are favorable for a C.burnetii infection. Thus, farm-related risk factors that areassociated with herd size may have influenced this associ-ation.
The use of automatic milking was unrelated to herdsize and is a strong negatively associated factor for ELISA(OR = 0.3) and PCR positivity (OR = 0.2). To the best of ourknowledge, this is the first time, that a relationship is foundbetween milking systems and risk of infectious diseases,except mastitis (Hovinen and Pyorala, 2011). Automaticmilking was introduced in the Netherlands in 1992 and itsuse has increased to 16% in 2012 (Stichting KwaliteitszorgOnderhoud Melkinstallaties (KOM), The Netherlands). Inour study automatic milking was performed on 20% of thefarms. The management practices, cow behavior and con-tact structures are obviously different between herds withautomatic milking and herds with conventional milking(Jacobs and Siegford, 2012). So, automatic milking could bea surrogate for other underlying risk factors not availablein this study. When automatic milking is used, cows arenot gathered simultaneously at pre-milking but are milkedseparately. It was shown previously that tie stalls have alower risk to be C. burnetii BTM positive than free stalls, alsoprobably caused by different contact structures betweenthe cows and thus a reduced risk of transmission (Paul et al.,2012). We could not reproduce this because in our studyonly 3 (1%) herds were housed in tie stalls.
Cleaning the bedding in the cubicles at least once per daywas negatively associated to presence of C. burnetii anti-bodies in BTM. This could be a proxy measure of hygienepractices in general. However, it could also be explainedby a decreased transmission of C. burnetii to other cows inthe herd by removing contaminated birth material or gen-ital tract excretions deposited in the bedding when cowslie down in the cubicles. It has been shown before, that
108 E. van Engelen et al. / Preventive Veterinary Medicine 117 (2014) 103–109
hygiene of cubicles in free stalls influences infection rates(De Kruif, 1978). In parallel, also for endometritis, it wassuggested that bedding plays a role in the transmission ofendometritis related bacteria (Cheong et al., 2011).
A risk factor for PCR positivity was the presence of dairycattle with ticks or an unknown tick status compared to nothaving dairy cattle with ticks. Cantas et al. (2011) also foundthat dairy cattle in Cyprus with ticks had an increased riskfor C. burnetii PCR positivity (Cantas et al., 2011). Spronget al. (2012) however, found no C. burnetii in ticks originat-ing from dairy cattle in the Netherlands in 2008. However,in that study ticks from only one location were investigated.One might argue that the presence of ticks on the cows is aregional effect or is a proxy for grazing practices (Capuanoet al., 2001) because in our study tick infestation was sig-nificantly more seen on cattle that grazed during summer(93.2% vs 72.2%, �2, p = 0.0002). However, the underlyingfactors were not statistically significant in the model.
Having sheep or goats on the farm showed a negativeassociation with PCR positivity. This effect could partly bedue to the fact that farms with sheep or goats (only a fewcattle farms had only goats as small ruminants) are moreoften located in the northwestern part of the Netherlands,more distant from the epicenter of the Q fever outbreak ingoats and humans. In addition, farms with goats and sheepmay have a more extensive management system.
This study found several factors associated with C. bur-netii BTM positivity. The results emphasize the importanceof biosecurity and optimized hygiene for decreasing therisk for C. burnetii on farm level.
Acknowledgments
We would like to thank all farmers for their cooper-ation in this study. In addition, we would like to thankSanne Kelderman for the invitation mailings and providingreference data, and Ben Bom for generating geographicalinformation. Finally, we thank all expert members of theQ-VIVE project group and affiliated organizations for theirsupport and advice during the study: Jan van de Bergh,Olaf Stenvers, Rob van Oosterom, Mark Paauw, Harry Stinis,Ad de Rooij, Margo Vonk, Clementine Wijkmans and Wimvan der Hoek. The study was funded by the NetherlandsOrganization for Health Research and Development (grantno. 50-50800-98-100: An integrated study on Q feverin livestock farmers and their (small) ruminants in theNetherlands); and co-financed by the Dutch Dairy Board,the Ministry of Health and Welfare and the Ministry ofEconomic Affairs, Agriculture and Innovation. The fundershad no role in study design, data collection and analysis,decision to publish or preparation of the manuscript.
References
Agger, J.F., Christoffersen, A.B., Rattenborg, E., Nielsen, J., Agerholm, J.S.,2010. Prevalence of Coxiella burnetii antibodies in Danish dairy herds.Acta. Vet. Scand. 52, 5.
Angelakis, E., Raoult, D., 2010. Q Fever. Vet. Microbiol. 140, 297–309.Arricau-Bouvery, N., Rodolakis, A., 2005. Is Q fever an emerging or re-
emerging zoonosis? Vet. Res. 36, 327–349.Bottcher, J., Vossen, A., Janowetz, B., Alex, M., Gangl, A., Randt, A., Meier, N.,
2011. Insights into the dynamics of endemic Coxiella burnetii infection
in cattle by application of phase-specific ELISAs in an infected dairyherd. Vet. Microbiol. 151, 291–300.
Brennan, M.L., Christley, R.M., 2012. Biosecurity on cattle farms: a studyin north-west England. PLoS ONE 7, e28139.
Cantas, H., Muwonge, A., Sareyyupoglu, B., Yardimci, H., Skjerve, E., 2011.Q fever abortions in ruminants and associated on-farm risk factors innorthern Cyprus. BMC Vet. Res. 7, 13.
Capuano, F., Landolfi, M.C., Monetti, D.M., 2001. Influence of threetypes of farm management on the seroprevalence of Q fever asassessed by an indirect immunofluorescence assay. Vet. Rec. 149, 669–671.
Cheong, S.H., Nydam, D.V., Galvao, K.N., Crosier, B.M., Gilbert, R.O., 2011.Cow-level and herd-level risk factors for subclinical endometritis inlactating Holstein cows. J. Dairy Sci. 94, 762–770.
Cutler, S.J., Bouzid, M., Cutler, R.R., 2007. Q fever. J. Infect. 54, 313–318.De Kruif, A., 1978. Factors influencing the fertility of a cattle population. J.
Reprod. Fertil. 54, 507–518.De Lange, M.M., Schimmer, B., Vellema, P., Hautvast, J.L., Schneeberger,
P.M., Van Duijnhoven, Y.T., 2014. Coxiella burnetii seroprevalence andrisk factors in sheep farmers and farm residents in The Netherlands.Epidemiol. Infect. 142, 1231–1244.
Fevre, E.M., Bronsvoort, B.M., Hamilton, K.A., Cleaveland, S., 2006. Animalmovements and the spread of infectious diseases. Trends Microbiol.14, 125–131.
Fournier, P.E., Marrie, T.J., Raoult, D., 1998. Diagnosis of Q fever. J. Clin.Microbiol. 36, 1823–1834.
Guatteo, R., Beaudeau, F., Berri, M., Rodolakis, A., Joly, A., Seegers, H., 2006.Shedding routes of Coxiella burnetii in dairy cows: implications fordetection and control. Vet. Res. 37, 827–833.
Guatteo, R., Beaudeau, F., Joly, A., Seegers, H., 2007. Coxiella burnetii shed-ding by dairy cows. Vet. Res. 38, 849–860.
Guatteo, R., Seegers, H., Taurel, A.F., Joly, A., Beaudeau, F., 2011. Prevalenceof Coxiella burnetii infection in domestic ruminants: a critical review.Vet. Microbiol. 149, 1–16.
Hansen, M.S., Rodolakis, A., Cochonneau, D., Agger, J.F., Christoffersen,A.B., Jensen, T.K., Agerholm, J.S., 2011. Coxiella burnetii associatedplacental lesions and infection level in parturient cows. Vet. J. 190,135–139.
Hovinen, M., Pyorala, S., 2011. Invited review: udder health of dairy cowsin automatic milking. J. Dairy Sci. 94, 547–562.
Jacobs, J.A., Siegford, J.M., 2012. Invited review: the impact of automaticmilking systems on dairy cow management, behavior, health, andwelfare. J. Dairy Sci. 95, 2227–2247.
Kampen, A.H., Hopp, P., Groneng, G.M., Melkild, I., Urdahl, A.M., Karlsson,A.C., Tharaldsen, J., 2012. No indication of Coxiella burnetii infection inNorwegian farmed ruminants. BMC Vet. Res. 8, 59.
Kim, S.G., Kim, E.H., Lafferty, C.J., Dubovi, E., 2005. Coxiella burnetii in bulktank milk samples, United States. Emerg. Infect. Dis. 11, 619–621.
McCaughey, C., Murray, L.J., McKenna, J.P., Menzies, F.D., McCullough, S.J.,O’Neill, H.J., Wyatt, D.E., Cardwell, C.R., Coyle, P.V., 2010. Coxiella bur-netii (Q fever) seroprevalence in cattle. Epidemiol. Infect. 138, 21–27.
McQuiston, J.H., Childs, J.E., 2002. Q fever in humans and animals in theUnited States. Vector Borne Zoonotic Dis. 2, 179–191.
McQuiston, J.H., Nargund, V.N., Miller, J.D., Priestley, R., Shaw, E.I., Thomp-son, H.A., 2005. Prevalence of antibodies to Coxiella burnetii amongveterinary school dairy herds in the United States, 2003. Vector BorneZoonotic Dis. 5, 90–91.
Muskens, J., van Engelen, E., van Maanen, C., Bartels, C., Lam, T.J., 2011.Prevalence of Coxiella burnetii infection in Dutch dairy herds based ontesting bulk tank milk and individual samples by PCR and ELISA. Vet.Rec. 168, 79.
Parker, N.R., Barralet, J.H., Bell, A.M., 2006. Q fever. Lancet 367, 679–688.Paul, S., Agger, J.F., Markussen, B., Christoffersen, A.B., Agerholm, J.S., 2012.
Factors associated with Coxiella burnetii antibody positivity in Danishdairy cows. Prev. Vet. Med. 107, 57–64.
Rodolakis, A., Berri, M., Hechard, C., Caudron, C., Souriau, A., Bodier, C.C.,Blanchard, B., Camuset, P., Devillechaise, P., Natorp, J.C., Vadet, J.P.,Arricau-Bouvery, N., 2007. Comparison of Coxiella burnetii sheddingin milk of dairy bovine, caprine, and ovine herds. J. Dairy Sci. 90,5352–5360.
Roest, H.I., Tilburg, J.J., van der Hoek, W., Vellema, P., van Zijderveld,F.G., Klaassen, C.H., Raoult, D., 2011a. The Q fever epidemic in TheNetherlands: history, onset, response and reflection. Epidemiol. Infect.139, 1–12.
Roest, H.I., Ruuls, R.C., Tilburg, J.J., Nabuurs-Franssen, M.H., Klaassen, C.H.,Vellema, P., van den Brom, R., Dercksen, D., Wouda, W., Spierenburg,M.A., van der Spek, A.N., Buijs, R., de Boer, A.G., Willemsen, P.T., vanZijderveld, F.G., 2011b. Molecular epidemiology of Coxiella burnetiifrom ruminants in Q fever outbreak, the Netherlands. Emerg. Infect.Dis. 17, 668–675.

168 | CHAPTER 4.6
E. van Engelen et al. / Preventive Veterinary Medicine 117 (2014) 103–109 109
Roest, H.I., van Solt, C.B., Tilburg, J.J., Klaassen, C.H., Hovius, E.K., Roest,F.T., Vellema, P., van den Brom, R., van Zijderveld, F.G., 2013. Searchfor possible additional reservoirs for human Q fever, The Netherlands.Emerg. Infect. Dis. 19, 834–835.
Ryan, E.D., Kirby, M., Collins, D.M., Sayers, R., Mee, J.F., Clegg, T., 2011.Prevalence of Coxiella burnetii (Q fever) antibodies in bovine serumand bulk-milk samples. Epidemiol. Infect. 139, 1413–1417.
Schimmer, B., Notermans, D.W., Harms, M.G., Reimerink, J.H., Bakker, J.,Schneeberger, P., Mollema, L., Teunis, P., van Pelt, W., van Duynhoven,Y., 2012. Low seroprevalence of Q fever in The Netherlands prior to aseries of large outbreaks. Epidemiol. Infect. 140, 27–35.
Schimmer, B., Schotten, N., van Engelen, E., Hautvast, J.L., Schneeberger,P.M., van Duijnhoven, Y.T., 2014. Coxiella burnetii seroprevalence andrisk for humans on dairy cattle farms, the Netherlands, 2010–2011.Emerg. Infect. Dis. 20, 417–425.
Sprong, H., Tijsse-Klasen, E., Langelaar, M., De Bruin, A., Fonville, M.,Gassner, F., Takken, W., Van Wieren, S., Nijhof, A., Jongejan, F.,Maassen, C.B., Scholte, E.J., Hovius, J.W., Emil Hovius, K., Spitalska, E.,
Van Duynhoven, Y.T., 2012. Prevalence of Coxiella burnetii in ticks aftera large outbreak of Q fever. Zoonoses Public Health 59, 69–75.
van den Brom, R., van Engelen, E., Luttikholt, S., Moll, L., van Maanen, K.,Vellema, P., 2012. Coxiella burnetii in bulk tank milk samples fromdairy goat and dairy sheep farms in The Netherlands in 2008. Vet. Rec.170, 310–316.
van der Hoek, W., Dijkstra, F., Schimmer, B., Schneeberger, P.M., Vellema,P., Wijkmans, C., ter Schegget, R., Hackert, V., van Duynhoven, Y., 2010.Q fever in the Netherlands: an update on the epidemiology and controlmeasures. Euro Surveill. 15 (12), 2.
van Moll, P., Baumgartner, W., Eskens, U., Hanichen, T., 1993. Immuno-cytochemical demonstration of Coxiella burnetii antigen in the fetalplacenta of naturally infected sheep and cattle. J. Comp. Pathol. 109,295–301.
van Schaik, G., Schukken, Y.H., Nielen, M., Dijkhuizen, A.A., Barkema, H.W.,Benedictus, G., 2002. Probability of and risk factors for introduction ofinfectious diseases into Dutch SPF dairy farms: a cohort study. Prev.Vet. Med. 54, 279–289.

CHAPTER 5.1
Seroprevalence and occupational risk factors of Coxiella burnetii infection in veterinary-associated populations
Seroepidemiological survey for Coxiella burnetii antibodies and associated risk factors in Dutch livestock veterinarians
5
R. van den BromB. Schimmer
P.M. SchneebergerW.A. Swart
W. van der HoekP. Vellema
PLoS One. 2013;8(1):e54021

Time-course of antibody responses against Coxiella burnetiifollowing acute Q fever
P. F. M. TEUNIS 1,2*, B. SCHIMMER 1, D. W. NOTERMANS3,
A. C. A. P. LEENDERS 4, P. C. WEVER 4, M. E. E. KRETZSCHMAR1,5
AND P. M. SCHNEEBERGER 4
1 Centre for Infectious Disease Control, Epidemiology and Surveillance Unit, RIVM, Bilthoven, The Netherlands2 Hubert Department of Global Health, Rollins School of Public Health, Emory University, Atlanta, GA, USA3 Centre for Infectious Disease Control, Laboratory for Infectious Diseases and Perinatal Screening, RIVM,Bilthoven, The Netherlands4 Jeroen Bosch Hospital, Department of Medical Microbiology and Infection Control,’s- Hertogenbosch, TheNetherlands5 Julius Centre for Health Sciences and Primary Care, University Medical Centre Utrecht, Utrecht, The
Netherlands
Received 11 October 2011; Final revision 15 February 2012; Accepted 15 February 2012;
first published online 4 April 2012
SUMMARY
Large outbreaks of Q fever in The Netherlands have provided a unique opportunity for studying
longitudinal serum antibody responses in patients. Results are presented of a cohort of 344
patients with acute symptoms of Q fever with three or more serum samples per patient. In all
these serum samples IgM and IgG against phase 1 and 2 Coxiella burnetii were measured by an
immunofluorescence assay. A mathematical model of the dynamic interaction of serum antibodies
and pathogens was used in a mixed model framework to quantitatively analyse responses to
C. burnetii infection. Responses show strong heterogeneity, with individual serum antibody
responses widely different in magnitude and shape. Features of the response, peak titre and decay
rate, are used to characterize the diversity of the observed responses. Binary mixture analysis of
IgG peak levels (phases 1 and 2) reveals a class of patients with high IgG peak titres that decay
slowly and may represent potential chronic cases. When combining the results of mixture analysis
into an odds score, it is concluded that not only high IgG phase 1 may be predictive for chronic
Q fever, but also that high IgG phase 2 may aid in detecting such putative chronic cases.
Key words: Coxiella, mathematical modelling, Q fever, serology, statistics.
INTRODUCTION
Since mid-2007 human cases of Q fever in The
Netherlands have increased sharply, with major out-
breaks in 2008 and 2009, reaching a total of about
4000 cases by 2010 [1–4]. Cases were predominantly
clustered in the south of The Netherlands [3] and the
majority of the laboratory samples were submitted
to one regional hospital : the Jeroen Bosch Hospital
in ’s-Hertogenbosch (about 2000 confirmed acute
Q fever cases). Follow-up of cases extended over a
period of up to 24 months. In the 3 years that this
outbreak persisted, laboratory results from over 2000
cases were collected in a laboratory database. This
* Author for correspondence : Professor P. F. M. Teunis, Centrefor Infectious Disease Control, Epidemiology and SurveillanceUnit, RIVM, PO Box 1, 3720BA Bilthoven, The Netherlands.(Email : [email protected])
Epidemiol. Infect. (2013), 141, 62–73. f Cambridge University Press 2012
doi:10.1017/S0950268812000404
Seroepidemiological Survey for Coxiella burnetiiAntibodies and Associated Risk Factors in DutchLivestock VeterinariansRene Van den Brom1*, Barbara Schimmer2, Peter M. Schneeberger3, Wim A. Swart4, Wim van der Hoek2,
Piet Vellema1
1Department of Small Ruminant Health, Animal Health Service, Deventer, The Netherlands, 2Centre for Infectious Disease Control, National Institute for Public Health and
the Environment, Bilthoven, The Netherlands, 3Department of Medical Microbiology and Infection Control, Jeroen Bosch Hospital, ‘s-Hertogenbosch, The Netherlands,
4Department of Diagnostics, Research and Epidemiology, Animal Health Service, Deventer, The Netherlands
Abstract
Since 2007, Q fever has become a major public health problem in the Netherlands and goats were the most likely source ofthe human outbreaks in 2007, 2008 and 2009. Little was known about the consequences of these outbreaks for thoseprofessional care providers directly involved. The aim of this survey was to estimate the seroprevalence of antibodiesagainst C. burnetii among Dutch livestock veterinarians and to determine possible risk factors. Single blood samples from189 veterinarians, including veterinary students in their final year, were collected at a veterinary conference and aquestionnaire was filled in by each participant. The blood samples were screened for IgG antibodies against phase I andphase II antigen of C. burnetii using an indirect immunofluorescent assay, and for IgM antibodies using an ELISA. Antibodiesagainst C. burnetii were detected in 123 (65.1%) out of 189 veterinarians. Independent risk factors associated withseropositivity were number of hours with animal contact per week, number of years graduated as veterinarian, rural or suburban living area, being a practicing veterinarian, and occupational contact with swine. Livestock veterinarians should beaware of this risk to acquire an infection with C. burnetii. Physicians should consider potential infection with C. burnetii whentreating occupational risk groups, bearing in mind that the burden of disease among veterinarians remains uncertain.Vaccination of occupational risk groups should be debated.
Citation: Van den Brom R, Schimmer B, Schneeberger PM, Swart WA, van der Hoek W, et al. (2013) Seroepidemiological Survey for Coxiella burnetii Antibodiesand Associated Risk Factors in Dutch Livestock Veterinarians. PLoS ONE 8(1): e54021. doi:10.1371/journal.pone.0054021
Editor: Tara C. Smith, University of Iowa, United States of America
Received August 30, 2012; Accepted December 5, 2012; Published January 16, 2013
Copyright: � 2013 Van den Brom et al. This is an open-access article distributed under the terms of the Creative Commons Attribution License, which permitsunrestricted use, distribution, and reproduction in any medium, provided the original author and source are credited.
Funding: No external funding was received for this survey.
Competing Interests: The authors have declared that no competing interests exists.
* E-mail: [email protected]
Introduction
Q fever is a zoonotic disease caused by the obligate intracellular
bacterium, Coxiella burnetii, and ruminants are considered to be the
primary source of infection for humans. In cattle, the disease is
mainly asymptomatic [1], but in sheep and goats the main
symptom is abortion, stillbirth and retention of foetal membranes
[2–6]. The bacterium is shed in urine, milk, faeces and birth
products of infected animals. The main route of transmission of
the bacterium to humans is by aerosols [4,7,8].
Until 2007, about 20 Q fever cases were reported in the
Netherlands annually [9]. In that year, Q fever became a major
public health problem in the Netherlands with 168, 1000 and
2,357 human cases notified in 2007, 2008 and 2009, respectively
[10]. These unprecedented annual outbreaks are largely explained
by exposure of the general population living in the surroundings of
infected dairy goat farms to airborne contaminated dust particles.
Only 5% of the notified Q fever patients in the Netherlands report
an occupation in agriculture, transporting or handling animal
products, or animal care [11]. However, since its first description
in abattoir workers in Australia in 1935 [12], Q fever has been
considered primarily an occupational zoonotic disease for abattoir
workers, sheep shearers, livestock farmers, and especially veteri-
narians because of their direct contact with potentially infected
animals [13–19].
The aim of this survey was to estimate the seroprevalence of
antibodies against C. burnetii among Dutch livestock veterinarians
and to determine possible risk factors.
Materials and Methods
Human Population and Data CollectionIn November 2009, professional laboratory assistants collected a
single blood sample from Dutch livestock veterinarians and final-
year veterinary students attending a veterinary conference.
Each participant filled in a self-administered questionnaire to
obtain epidemiological and clinical information. The question-
naire existed of three parts, and took approximately fifteen
minutes to complete. The first part focused on demographic data
and included age, gender, and residence in urban, sub urban or
rural area. The second part consisted of occupation-related
questions regarding work location, type of veterinary occupation,
years in veterinary practice, contact with livestock and livestock
farms, contact with animal related products as straw, hay, soil,
birth products and urine and faeces, contact with aborted animals,
use of personnel protective equipment, work related wounds and
PLOS ONE | www.plosone.org 1 January 2013 | Volume 8 | Issue 1 | e54021
Seroepidemiological Survey for Coxiella burnetii Antibodies and Associated Risk Factors in Dutch Livestock Veterinarians
R. VAN DEN BROM1, B. SCHIMMER2, P.M. SCHNEEBERGER3, W.A. SWART4, W. VAN DER HOEK2, P. VELLEMA1
Affiliaties
Chapter 3.2
1Centre for Infectious Disease Control, National Institute for Public Health and the Environment, Bilthoven, the Netherlands 2Municipal Health Service ‘Brabant Zuidoost, Eindhoven, the Netherlands 3Laboratory for Pathology and Medical Microbiology, Veldhoven, the Netherlands 4Region East, Food and Consumer Product Safety Authority, Zutphen, the Netherlands 5Department of Medical Microbiology and Infection Control, Jeroen Bosch Hospital, ‘s Hertogenbosch, the Netherlands 6Department of Small Ruminant Health, Animal Health Service, Deventer, the Netherlands
Chapter 4.1
1 Centre for Infectious Disease Control, National Institute for Public Health and The Environment, Bilthoven, The Netherlands 2 Academic Collaborative Centre AMPHI, Department of Primary and Community Care, Radboud University Nijmegen Medical Centre, Nijmegen, The Netherlands 3 Department of Medical Microbiology and Infection Control, Jeroen Bosch Hospital, ’s-Hertogenbosch, The Netherlands 4 Department of Small Ruminant Health, Animal Health Service, Deventer, The Netherlands
Chapter 4.2 1Centre for Infectious Disease Control, National Institute for Public Health and the Environment, Bilthoven, the Netherlands 2Quantitative Veterinary Epidemiology Group, Wageningen Institute of Animal Sciences, Wageningen, The Netherlands 3Department of Small Ruminant Health, Animal Health Service, Deventer, The Netherlands 4Academic Collaborative Centre AMPHI, Department of Primary and Community Care, Radboud University Nijmegen Medical Centre, the Netherlands
Chapter 4.4 1Centre for Infectious Disease Control, National Institute for Public Health and the Environment, Bilthoven, the Netherlands 2 Academic Collaborative Centre AMPHI, Department of Primary and Community Care, Radboud University Nijmegen Medical Centre, Nijmegen, the Netherlands 3Department of Small Ruminant Health, Animal Health Service, Deventer, The Netherlands
Chapter 4.5 1 National Institute for Public Health and the Environment (RIVM), Bilthoven, the Netherlands 2 Animal Health Service,Deventer, the Netherlands 3 Radboud University Nijmegen Medical Centre, Nijmegen, the Netherlands 4. Jeroen Bosch Hospital, ‘s-Hertogenbosch, the Netherlands Chapter 4.6 1 GD Animal Health, Deventer, The Netherlands 2 Centre for Infectious Disease Control, National Institute for Public Health and the Environment, Bilthoven, the Netherlands 3 Department of Primary and Community Care, Academic Collaborative Centre for Public Health (AMPHI), Radboud University Nijmegen Medical Centre, Nijmegen, The Netherlands
Chapter 5.1 1 Department of Small Ruminant Health, Animal Health Service, Deventer, The Netherlands 2 Centre for Infectious Disease Control, National Institute for Public Health and the Environment, Bilthoven, The Netherlands 3 Department of Medical Microbiology and Infection Control, Jeroen Bosch Hospital, ‘s-Hertogenbosch, The Netherlands, 4 Department of Diagnostics, Research and Epidemiology, Animal Health Service, Deventer, The Netherlands
Chapter 5.2
1 Division of Environmental Epidemiology, Institute for Risk Assessment Sciences, Utrecht, the Netherlands 2 Centre for Infectious Disease Control, National Institute for Public Health and the Environment, Bilthoven, the Netherlands, 3 Department of Medical Microbiology and Infection Control, Jeroen Bosch Hospital, ‘s-Hertogenbosch, the Netherlands, 4 Division of Veterinary Public Health, Institute for Risk Assessment Sciences, Utrecht, the Netherlands
Chapter 5.3 1.National Institute for Public Health and the Environment, Bilthoven, the Netherlands 2 European Centre for Disease Prevention and Control, Stockholm, Sweden 3 Jeroen Bosch Hospital, ‘s-Hertogenbosch, the Netherlands 4 ArboUnie, Utrecht, the Netherlands
AbstractSince 2007, Q fever has become a major public health problem in the Netherlands and goats were the most likely source of the human outbreaks in 2007, 2008 and 2009. Little was known about the consequences of these outbreaks for those professional care providers directly involved. The aim of this survey was to estimate the seroprevalence of antibodies against C. burnetii among Dutch livestock veterinarians and to determine possible risk factors. Single blood samples from 189 veterinarians, including veterinary students in their final year, were collected at a veterinary conference and a questionnaire was filled in by each participant. The blood samples were screened for IgG antibodies against phase I and phase II antigen of C. burnetii using an indirect immunofluorescent assay, and for IgM antibodies using an ELISA. Antibodies against C. burnetii were detected in 123 (65.1%) out of 189 veterinarians. Independent risk factors associated with seropositivity were number of hours with animal contact per week, number of years graduated as veterinarian, rural or sub urban living area, being a practicing veterinarian, and occupational contact with swine. Livestock veterinarians should be aware of this risk to acquire an infection with C. burnetii. Physicians should consider potential infection with C. burnetii when treating occupational risk groups, bearing in mind that the burden of disease among veterinarians remains uncertain. Vaccination of occupational risk groups should be debated.
accidental vaccine exposure. The third part consisted of non-
occupation related questions regarding possession of animals in the
last five years, consumption of raw dairy products, outdoor
activities and health conditions, including smoking, tick bites
during the last five years and a known history of a clinical Q fever
infection, pregnancy and abortion.
This study was approved by the Medical Ethical Committee of
the University Medical Centre Utrecht, Utrecht, the Netherlands
(reference number 09–322). All participants received a book to
express appreciation for their cooperation.
Laboratory MethodsA serum sample from each participant was tested for the
presence of IgG antibodies against C. burnetii using a Q fever
indirect immunofluorescent assay (IFA; Focus Diagnostics, Cy-
press, CA), according to the manufacturer’s protocol. Sera were
screened for phase I and phase II IgG using a cut-off of 1:32.
Samples with both IgG phase I and II titres of $1:32 were
considered to be positive, while solitary IgG phase II samples were
scored positive if they had a single titre of $1:512.
All samples were also screened for IgM using an ELISA (Focus
Diagnostics), according to the manufacturer’s protocol, and
positive samples were confirmed with IFA. Samples with a titre
of $1:32, both for IgM phase I and II, were considered to be
positive, indicating a possibly recent infection.
Within the group of participants with a past infection, a
distinction was made between serological profiles considered not
likely to be compatible with a chronic infection, and serological
profiles which could indicate a chronic infection. Serum samples
from participants with a possibly chronic Q fever infection, having
an IgG phase I titre $1:1024, were additionally analysed by
performing a C. burnetii PCR.
Statistical Data AnalysisAll individual laboratory results were merged with the self-
administered questionnaires. Statistical analysis was carried out
using STATA 11. The Chi square test and the two-sided
proportion-test were used to estimate univariate associations
between exposures and seropositivity. Analyses were carried out
to calculate odds ratio’s with 95% confidence intervals. The odds
ratio (OR) was defined, in this context as the odds of a given
exposure among veterinarians seropositive for C. burnetii divided by
the odds of exposure among seronegative veterinarians. Veteri-
narians who did not completely fill in the questionnaire were
excluded for the analysis of that particular question.
For the multivariable logistic regression, initially all variables
with (2-sided) p,0.20 and with sufficient numbers (.10) were
selected. To avoid multicollinearity, from groups of variables that
had a correlation of more than 0.50 with each other, only one, the
most plausible biological variable, was left in the multivariable
analysis.
Stepwise backward logistic regression was carried out, starting
with all data and excluding stepwise each variable that had a p-
value of .0.05. All remaining variables were considered to be risk
or protective factors.
Results
Descriptive ResultsA total of 189 participants, being more than 90% of the
attendants, completed the questionnaire and provided a blood
sample during the conference. The median age of the participants
was 44 years (interquartile range, 34–52 years). Of the partici-
pants, 130 (68.8%) were male and 59 (31.2%) were female
(Table 1). One hundred and twelve of the participants worked as a
livestock practitioner, 20 were non-practicing, 37 worked as
livestock veterinarian at a veterinary institute (Utrecht University
(UU) or Animal Health Service (GD)) and 20 were livestock
veterinary students in their final year. A total of 108 (57.1%) of the
participants had contact with livestock for more than 50% of
working hours in their current job.
The overall seroprevalence was 65.1% (n= 189). In livestock
veterinarians the seroprevalence was 69.2% (n= 169). The
seroprevalence in livestock veterinary students was 30.0%
(n= 20). Among the group of 169 livestock veterinarians the
seroprevalence was 87.5% in practicing livestock veterinarians
(n = 112), 45.0% in non-practicing livestock veterinarians (n = 20)
and 27.0% in livestock veterinarians working at a veterinary
institute (n = 37). IgG antibody titers against C. burnetii measured
for both phase I and II ranged from 1:32 to 1:2048. Seven out of
nine participants with a positive IgM ELISA result were confirmed
with IFA, suggesting a recent infection. Four of those seven IFA
positive study participants were livestock veterinary students. The
other three were practicing livestock veterinarians. Seven partic-
ipants with an IgG phase I titre$1:1024, a possible indication of a
chronic Q fever infection, were followed up by performing a C.burnetii PCR on a blood sample, and in all cases PCR results were
negative. Additionally, participants with an IgG phase I titre
$1:512 are offered to participate in a follow-up study and are
advised to be controlled for risk factors of a chronic Q fever
infection.
Univariable AnalysisParticipants who were seropositive were likely to be male over
the age of 32 years (Table 1). Participants living in rural or
suburban areas were significantly more often seropositive than
participants living in an urban area. Occupational risk factors in
univariable analysis were: graduated as a veterinarian more than
two years ago; more than 10 hours of animal contact per week;
practicing as livestock veterinarian; and working with cattle,
horses, dogs and cats. Participants with frequent contact with
animal products, like straw, hay, roughage, raw milk, birth
products of ruminants as well as of pets, urine of ruminants,
practicing on cattle farms with abortion, and one or more contacts
on farms with abortion problems in the last five years, were
significantly more often seropositive. Accidental needle injections
and cutting incidents were also found to be associated with
seropositivity. Non-occupational activities like cycling and shop-
ping were associated with seronegativity. In contrast, gardening
and having dogs and (pet) birds were found to be associated with
seropositivity. Consumption of dairy products, health conditions
like smoking behaviour, and not wearing protective clothes during
work were not found to be a significant univariate risk factor. The
number of participants primarily working with sheep and goats,
with a history of a clinical Q fever infection, or with pregnancy
and abortion was too small for statistical analysis.
Multivariable AnalysisVariables with a p-value ,0.20 in the univariable analysis were
used as input for the multivariable analysis. The number of years
as a veterinarian was highly correlated with age and gender; the
latter two were left out of the analysis. Working category and
contacts with ruminants were very highly correlated to contact
with hay/straw, roughage, raw milk, birth products of ruminants
and with urine of ruminants; the latter 5 were left out of the
analysis.
In this group of livestock veterinarians, risk factors for C. burnetiiseropositivity in the multivariable analysis (Table 2) were: number
Q Fever in Dutch Livestock Veterinarians
PLOS ONE | www.plosone.org 2 January 2013 | Volume 8 | Issue 1 | e54021

C. BURNETII ANTIBODIES AND RISK FACTORS IN LIVESTOCK VETERINARIANS | 173
5.1
Time-course of antibody responses against Coxiella burnetiifollowing acute Q fever
P. F. M. TEUNIS 1,2*, B. SCHIMMER 1, D. W. NOTERMANS3,
A. C. A. P. LEENDERS 4, P. C. WEVER 4, M. E. E. KRETZSCHMAR1,5
AND P. M. SCHNEEBERGER 4
1 Centre for Infectious Disease Control, Epidemiology and Surveillance Unit, RIVM, Bilthoven, The Netherlands2 Hubert Department of Global Health, Rollins School of Public Health, Emory University, Atlanta, GA, USA3 Centre for Infectious Disease Control, Laboratory for Infectious Diseases and Perinatal Screening, RIVM,Bilthoven, The Netherlands4 Jeroen Bosch Hospital, Department of Medical Microbiology and Infection Control,’s- Hertogenbosch, TheNetherlands5 Julius Centre for Health Sciences and Primary Care, University Medical Centre Utrecht, Utrecht, The
Netherlands
Received 11 October 2011; Final revision 15 February 2012; Accepted 15 February 2012;
first published online 4 April 2012
SUMMARY
Large outbreaks of Q fever in The Netherlands have provided a unique opportunity for studying
longitudinal serum antibody responses in patients. Results are presented of a cohort of 344
patients with acute symptoms of Q fever with three or more serum samples per patient. In all
these serum samples IgM and IgG against phase 1 and 2 Coxiella burnetii were measured by an
immunofluorescence assay. A mathematical model of the dynamic interaction of serum antibodies
and pathogens was used in a mixed model framework to quantitatively analyse responses to
C. burnetii infection. Responses show strong heterogeneity, with individual serum antibody
responses widely different in magnitude and shape. Features of the response, peak titre and decay
rate, are used to characterize the diversity of the observed responses. Binary mixture analysis of
IgG peak levels (phases 1 and 2) reveals a class of patients with high IgG peak titres that decay
slowly and may represent potential chronic cases. When combining the results of mixture analysis
into an odds score, it is concluded that not only high IgG phase 1 may be predictive for chronic
Q fever, but also that high IgG phase 2 may aid in detecting such putative chronic cases.
Key words: Coxiella, mathematical modelling, Q fever, serology, statistics.
INTRODUCTION
Since mid-2007 human cases of Q fever in The
Netherlands have increased sharply, with major out-
breaks in 2008 and 2009, reaching a total of about
4000 cases by 2010 [1–4]. Cases were predominantly
clustered in the south of The Netherlands [3] and the
majority of the laboratory samples were submitted
to one regional hospital : the Jeroen Bosch Hospital
in ’s-Hertogenbosch (about 2000 confirmed acute
Q fever cases). Follow-up of cases extended over a
period of up to 24 months. In the 3 years that this
outbreak persisted, laboratory results from over 2000
cases were collected in a laboratory database. This
* Author for correspondence : Professor P. F. M. Teunis, Centrefor Infectious Disease Control, Epidemiology and SurveillanceUnit, RIVM, PO Box 1, 3720BA Bilthoven, The Netherlands.(Email : [email protected])
Epidemiol. Infect. (2013), 141, 62–73. f Cambridge University Press 2012
doi:10.1017/S0950268812000404
Seroepidemiological Survey for Coxiella burnetiiAntibodies and Associated Risk Factors in DutchLivestock VeterinariansRene Van den Brom1*, Barbara Schimmer2, Peter M. Schneeberger3, Wim A. Swart4, Wim van der Hoek2,
Piet Vellema1
1Department of Small Ruminant Health, Animal Health Service, Deventer, The Netherlands, 2Centre for Infectious Disease Control, National Institute for Public Health and
the Environment, Bilthoven, The Netherlands, 3Department of Medical Microbiology and Infection Control, Jeroen Bosch Hospital, ‘s-Hertogenbosch, The Netherlands,
4Department of Diagnostics, Research and Epidemiology, Animal Health Service, Deventer, The Netherlands
Abstract
Since 2007, Q fever has become a major public health problem in the Netherlands and goats were the most likely source ofthe human outbreaks in 2007, 2008 and 2009. Little was known about the consequences of these outbreaks for thoseprofessional care providers directly involved. The aim of this survey was to estimate the seroprevalence of antibodiesagainst C. burnetii among Dutch livestock veterinarians and to determine possible risk factors. Single blood samples from189 veterinarians, including veterinary students in their final year, were collected at a veterinary conference and aquestionnaire was filled in by each participant. The blood samples were screened for IgG antibodies against phase I andphase II antigen of C. burnetii using an indirect immunofluorescent assay, and for IgM antibodies using an ELISA. Antibodiesagainst C. burnetii were detected in 123 (65.1%) out of 189 veterinarians. Independent risk factors associated withseropositivity were number of hours with animal contact per week, number of years graduated as veterinarian, rural or suburban living area, being a practicing veterinarian, and occupational contact with swine. Livestock veterinarians should beaware of this risk to acquire an infection with C. burnetii. Physicians should consider potential infection with C. burnetii whentreating occupational risk groups, bearing in mind that the burden of disease among veterinarians remains uncertain.Vaccination of occupational risk groups should be debated.
Citation: Van den Brom R, Schimmer B, Schneeberger PM, Swart WA, van der Hoek W, et al. (2013) Seroepidemiological Survey for Coxiella burnetii Antibodiesand Associated Risk Factors in Dutch Livestock Veterinarians. PLoS ONE 8(1): e54021. doi:10.1371/journal.pone.0054021
Editor: Tara C. Smith, University of Iowa, United States of America
Received August 30, 2012; Accepted December 5, 2012; Published January 16, 2013
Copyright: � 2013 Van den Brom et al. This is an open-access article distributed under the terms of the Creative Commons Attribution License, which permitsunrestricted use, distribution, and reproduction in any medium, provided the original author and source are credited.
Funding: No external funding was received for this survey.
Competing Interests: The authors have declared that no competing interests exists.
* E-mail: [email protected]
Introduction
Q fever is a zoonotic disease caused by the obligate intracellular
bacterium, Coxiella burnetii, and ruminants are considered to be the
primary source of infection for humans. In cattle, the disease is
mainly asymptomatic [1], but in sheep and goats the main
symptom is abortion, stillbirth and retention of foetal membranes
[2–6]. The bacterium is shed in urine, milk, faeces and birth
products of infected animals. The main route of transmission of
the bacterium to humans is by aerosols [4,7,8].
Until 2007, about 20 Q fever cases were reported in the
Netherlands annually [9]. In that year, Q fever became a major
public health problem in the Netherlands with 168, 1000 and
2,357 human cases notified in 2007, 2008 and 2009, respectively
[10]. These unprecedented annual outbreaks are largely explained
by exposure of the general population living in the surroundings of
infected dairy goat farms to airborne contaminated dust particles.
Only 5% of the notified Q fever patients in the Netherlands report
an occupation in agriculture, transporting or handling animal
products, or animal care [11]. However, since its first description
in abattoir workers in Australia in 1935 [12], Q fever has been
considered primarily an occupational zoonotic disease for abattoir
workers, sheep shearers, livestock farmers, and especially veteri-
narians because of their direct contact with potentially infected
animals [13–19].
The aim of this survey was to estimate the seroprevalence of
antibodies against C. burnetii among Dutch livestock veterinarians
and to determine possible risk factors.
Materials and Methods
Human Population and Data CollectionIn November 2009, professional laboratory assistants collected a
single blood sample from Dutch livestock veterinarians and final-
year veterinary students attending a veterinary conference.
Each participant filled in a self-administered questionnaire to
obtain epidemiological and clinical information. The question-
naire existed of three parts, and took approximately fifteen
minutes to complete. The first part focused on demographic data
and included age, gender, and residence in urban, sub urban or
rural area. The second part consisted of occupation-related
questions regarding work location, type of veterinary occupation,
years in veterinary practice, contact with livestock and livestock
farms, contact with animal related products as straw, hay, soil,
birth products and urine and faeces, contact with aborted animals,
use of personnel protective equipment, work related wounds and
PLOS ONE | www.plosone.org 1 January 2013 | Volume 8 | Issue 1 | e54021
Affiliaties
Chapter 3.2
1Centre for Infectious Disease Control, National Institute for Public Health and the Environment, Bilthoven, the Netherlands 2Municipal Health Service ‘Brabant Zuidoost, Eindhoven, the Netherlands 3Laboratory for Pathology and Medical Microbiology, Veldhoven, the Netherlands 4Region East, Food and Consumer Product Safety Authority, Zutphen, the Netherlands 5Department of Medical Microbiology and Infection Control, Jeroen Bosch Hospital, ‘s Hertogenbosch, the Netherlands 6Department of Small Ruminant Health, Animal Health Service, Deventer, the Netherlands
Chapter 4.1
1 Centre for Infectious Disease Control, National Institute for Public Health and The Environment, Bilthoven, The Netherlands 2 Academic Collaborative Centre AMPHI, Department of Primary and Community Care, Radboud University Nijmegen Medical Centre, Nijmegen, The Netherlands 3 Department of Medical Microbiology and Infection Control, Jeroen Bosch Hospital, ’s-Hertogenbosch, The Netherlands 4 Department of Small Ruminant Health, Animal Health Service, Deventer, The Netherlands
Chapter 4.2 1Centre for Infectious Disease Control, National Institute for Public Health and the Environment, Bilthoven, the Netherlands 2Quantitative Veterinary Epidemiology Group, Wageningen Institute of Animal Sciences, Wageningen, The Netherlands 3Department of Small Ruminant Health, Animal Health Service, Deventer, The Netherlands 4Academic Collaborative Centre AMPHI, Department of Primary and Community Care, Radboud University Nijmegen Medical Centre, the Netherlands
Chapter 4.4 1Centre for Infectious Disease Control, National Institute for Public Health and the Environment, Bilthoven, the Netherlands 2 Academic Collaborative Centre AMPHI, Department of Primary and Community Care, Radboud University Nijmegen Medical Centre, Nijmegen, the Netherlands 3Department of Small Ruminant Health, Animal Health Service, Deventer, The Netherlands
Chapter 4.5 1 National Institute for Public Health and the Environment (RIVM), Bilthoven, the Netherlands 2 Animal Health Service,Deventer, the Netherlands 3 Radboud University Nijmegen Medical Centre, Nijmegen, the Netherlands 4. Jeroen Bosch Hospital, ‘s-Hertogenbosch, the Netherlands Chapter 4.6 1 GD Animal Health, Deventer, The Netherlands 2 Centre for Infectious Disease Control, National Institute for Public Health and the Environment, Bilthoven, the Netherlands 3 Department of Primary and Community Care, Academic Collaborative Centre for Public Health (AMPHI), Radboud University Nijmegen Medical Centre, Nijmegen, The Netherlands
Chapter 5.1 1 Department of Small Ruminant Health, Animal Health Service, Deventer, The Netherlands 2 Centre for Infectious Disease Control, National Institute for Public Health and the Environment, Bilthoven, The Netherlands 3 Department of Medical Microbiology and Infection Control, Jeroen Bosch Hospital, ‘s-Hertogenbosch, The Netherlands, 4 Department of Diagnostics, Research and Epidemiology, Animal Health Service, Deventer, The Netherlands
Chapter 5.2
1 Division of Environmental Epidemiology, Institute for Risk Assessment Sciences, Utrecht, the Netherlands 2 Centre for Infectious Disease Control, National Institute for Public Health and the Environment, Bilthoven, the Netherlands, 3 Department of Medical Microbiology and Infection Control, Jeroen Bosch Hospital, ‘s-Hertogenbosch, the Netherlands, 4 Division of Veterinary Public Health, Institute for Risk Assessment Sciences, Utrecht, the Netherlands
Chapter 5.3 1.National Institute for Public Health and the Environment, Bilthoven, the Netherlands 2 European Centre for Disease Prevention and Control, Stockholm, Sweden 3 Jeroen Bosch Hospital, ‘s-Hertogenbosch, the Netherlands 4 ArboUnie, Utrecht, the Netherlands
accidental vaccine exposure. The third part consisted of non-
occupation related questions regarding possession of animals in the
last five years, consumption of raw dairy products, outdoor
activities and health conditions, including smoking, tick bites
during the last five years and a known history of a clinical Q fever
infection, pregnancy and abortion.
This study was approved by the Medical Ethical Committee of
the University Medical Centre Utrecht, Utrecht, the Netherlands
(reference number 09–322). All participants received a book to
express appreciation for their cooperation.
Laboratory MethodsA serum sample from each participant was tested for the
presence of IgG antibodies against C. burnetii using a Q fever
indirect immunofluorescent assay (IFA; Focus Diagnostics, Cy-
press, CA), according to the manufacturer’s protocol. Sera were
screened for phase I and phase II IgG using a cut-off of 1:32.
Samples with both IgG phase I and II titres of $1:32 were
considered to be positive, while solitary IgG phase II samples were
scored positive if they had a single titre of $1:512.
All samples were also screened for IgM using an ELISA (Focus
Diagnostics), according to the manufacturer’s protocol, and
positive samples were confirmed with IFA. Samples with a titre
of $1:32, both for IgM phase I and II, were considered to be
positive, indicating a possibly recent infection.
Within the group of participants with a past infection, a
distinction was made between serological profiles considered not
likely to be compatible with a chronic infection, and serological
profiles which could indicate a chronic infection. Serum samples
from participants with a possibly chronic Q fever infection, having
an IgG phase I titre $1:1024, were additionally analysed by
performing a C. burnetii PCR.
Statistical Data AnalysisAll individual laboratory results were merged with the self-
administered questionnaires. Statistical analysis was carried out
using STATA 11. The Chi square test and the two-sided
proportion-test were used to estimate univariate associations
between exposures and seropositivity. Analyses were carried out
to calculate odds ratio’s with 95% confidence intervals. The odds
ratio (OR) was defined, in this context as the odds of a given
exposure among veterinarians seropositive for C. burnetii divided by
the odds of exposure among seronegative veterinarians. Veteri-
narians who did not completely fill in the questionnaire were
excluded for the analysis of that particular question.
For the multivariable logistic regression, initially all variables
with (2-sided) p,0.20 and with sufficient numbers (.10) were
selected. To avoid multicollinearity, from groups of variables that
had a correlation of more than 0.50 with each other, only one, the
most plausible biological variable, was left in the multivariable
analysis.
Stepwise backward logistic regression was carried out, starting
with all data and excluding stepwise each variable that had a p-
value of .0.05. All remaining variables were considered to be risk
or protective factors.
Results
Descriptive ResultsA total of 189 participants, being more than 90% of the
attendants, completed the questionnaire and provided a blood
sample during the conference. The median age of the participants
was 44 years (interquartile range, 34–52 years). Of the partici-
pants, 130 (68.8%) were male and 59 (31.2%) were female
(Table 1). One hundred and twelve of the participants worked as a
livestock practitioner, 20 were non-practicing, 37 worked as
livestock veterinarian at a veterinary institute (Utrecht University
(UU) or Animal Health Service (GD)) and 20 were livestock
veterinary students in their final year. A total of 108 (57.1%) of the
participants had contact with livestock for more than 50% of
working hours in their current job.
The overall seroprevalence was 65.1% (n= 189). In livestock
veterinarians the seroprevalence was 69.2% (n= 169). The
seroprevalence in livestock veterinary students was 30.0%
(n= 20). Among the group of 169 livestock veterinarians the
seroprevalence was 87.5% in practicing livestock veterinarians
(n = 112), 45.0% in non-practicing livestock veterinarians (n = 20)
and 27.0% in livestock veterinarians working at a veterinary
institute (n = 37). IgG antibody titers against C. burnetii measured
for both phase I and II ranged from 1:32 to 1:2048. Seven out of
nine participants with a positive IgM ELISA result were confirmed
with IFA, suggesting a recent infection. Four of those seven IFA
positive study participants were livestock veterinary students. The
other three were practicing livestock veterinarians. Seven partic-
ipants with an IgG phase I titre$1:1024, a possible indication of a
chronic Q fever infection, were followed up by performing a C.burnetii PCR on a blood sample, and in all cases PCR results were
negative. Additionally, participants with an IgG phase I titre
$1:512 are offered to participate in a follow-up study and are
advised to be controlled for risk factors of a chronic Q fever
infection.
Univariable AnalysisParticipants who were seropositive were likely to be male over
the age of 32 years (Table 1). Participants living in rural or
suburban areas were significantly more often seropositive than
participants living in an urban area. Occupational risk factors in
univariable analysis were: graduated as a veterinarian more than
two years ago; more than 10 hours of animal contact per week;
practicing as livestock veterinarian; and working with cattle,
horses, dogs and cats. Participants with frequent contact with
animal products, like straw, hay, roughage, raw milk, birth
products of ruminants as well as of pets, urine of ruminants,
practicing on cattle farms with abortion, and one or more contacts
on farms with abortion problems in the last five years, were
significantly more often seropositive. Accidental needle injections
and cutting incidents were also found to be associated with
seropositivity. Non-occupational activities like cycling and shop-
ping were associated with seronegativity. In contrast, gardening
and having dogs and (pet) birds were found to be associated with
seropositivity. Consumption of dairy products, health conditions
like smoking behaviour, and not wearing protective clothes during
work were not found to be a significant univariate risk factor. The
number of participants primarily working with sheep and goats,
with a history of a clinical Q fever infection, or with pregnancy
and abortion was too small for statistical analysis.
Multivariable AnalysisVariables with a p-value ,0.20 in the univariable analysis were
used as input for the multivariable analysis. The number of years
as a veterinarian was highly correlated with age and gender; the
latter two were left out of the analysis. Working category and
contacts with ruminants were very highly correlated to contact
with hay/straw, roughage, raw milk, birth products of ruminants
and with urine of ruminants; the latter 5 were left out of the
analysis.
In this group of livestock veterinarians, risk factors for C. burnetiiseropositivity in the multivariable analysis (Table 2) were: number
Q Fever in Dutch Livestock Veterinarians
PLOS ONE | www.plosone.org 2 January 2013 | Volume 8 | Issue 1 | e54021

174 | CHAPTER 5.1
of hours with animal contact per week, number of years graduated
as veterinarian, living in a rural (OR, 17.9 (95% CI: 3.6–88.1)) or
semi urban area (OR, 11.9 (95% CI: 2.1–68.5)), working as
practicing livestock veterinarian (OR, 15.8 (95% CI: 2.9–87.2)),
and occupational contact with swine (OR, 3.4 (95% CI: 1.1–10.2)).
Discussion
In this cross-sectional study, an overall C. burnetii seroprevalence
of 65.1% among Dutch livestock veterinarians was found. The
number of hours with animal contact per week, the number of
Table 1. Results of univariable analysis of risk factors for presence of antibodies against Coxiella burnetii.
Participants
Seropositive# Seronegative
No. % No. % Odds Ratio 95% confidence interval P
Gender
Female 24 40.7 35 59.3 1.0 . . .
Male 99 76.2 31 23.8 4.7 2.3 9.4 ,0.001
Age
,= 32 year 19 40.4 28 59.6 1.0 . .
33–44 year 35 71.4 14 28.6 3.7 1.6 8.6 0.003
45–52 year 37 75.5 12 24.5 4.5 1.9 10.9 0.001
53–65 year 32 72.7 12 27.3 3.9 1.6 9.5 0.002
Living region
Urban 8 30.8 18 69.2 1.0 . . .
Sub-urban 21 56.8 16 43.2 3.0 1.0 8.5 0.037
Rural 94 74.6 32 25.4 6.6 2.6 16.7 ,0.001
Veterinarian (years)
Veterinarian (,= 2) 13 27.7 34 72.3 1.0
veterinarian (3–13) 36 70.6 15 29.4 6.3 2.6 15.1 ,0.001
veterinarian (14–21) 33 75.0 11 25.0 7.9 3.1 20.0 ,0.001
veterinarian (.= 22) 40 87.0 6 13.0 17.4 6.00 50.8 ,0.001
Animal contact (hours/week)
,10 hours 9 24.3 28 75.7 1.0
10–19 hours 25 55.6 20 44.4 3.9 1.5 10.1 0.005
20–29 hours 42 80.8 10 19.2 13.1 4.7 36.2 ,0.001
.= 30 hours 43 89.6 5 10.4 26.8 8.1 88.2 ,0.001
Work category
Others 23 30.7 52 69.3 1.0
Practicing 100 87.7 14 12.3 16.2 7.7 34.0 ,0.001
Contact with cows
No 11 31.4 24 68.6 1.0 . . .
Yes 112 72.7 42 27.3 5.8 2.6 12.9 ,0.001
Contact with swine
No 80 61.5 50 38.5 1.0 . .
Yes 43 72.9 16 27.1 1.7 0.9 3.3 0.131
Contact with birth products of ruminants
No 16 33.3 32 66.7 1.0 . . .
Yes 107 75.9 34 24.1 6.3 3.1 12.9 ,0.001
Contact with birth products of pets
No 101 61.2 64 38.8 1.0 . . .
Yes 22 91.7 2 8.3 7.0 1.5 31.9 0.004
Practice on cow farm with abortion
No 32 43.8 41 56.2 1.0 . . .
Yes 91 78.4 25 21.6 4.7 2.4 9.3 ,0.001
#Sera were screened for phase I and phase II IgG using a cut-off of 1:32. Samples with both IgG phase I and II $1:32 were considered to be positive, while solitary IgGphase II samples were scored positive if they had a single titre of $1:512 (Focus Diagnostics, Cypress, CA).doi:10.1371/journal.pone.0054021.t001
Q Fever in Dutch Livestock Veterinarians
PLOS ONE | www.plosone.org 3 January 2013 | Volume 8 | Issue 1 | e54021
years the participants were graduated and practicing as a
veterinarian, were the main independent risk factors in this study.
These risk factors suggest a high dose-effect relation for
seropositivity in Dutch livestock veterinarians. In 1984, 84% of
222 Dutch livestock veterinarians were seropositive for IgG
antibodies against C. burnetii [17]. The use of a different laboratory
test and cut-offs, differences in study population and different
infection rates of livestock over time could be possible explanations
for other seroprevalence estimates.
Dutch livestock veterinarians have a high risk of getting C.
burnetii seropositive because of intensive contact with potentially
infected livestock, and the immune system can be boosted
frequently because of a high prevalence in Dutch livestock
[20,21]. Contact with swine was found to be an independent risk
factor, but the group of veterinarians involved was also exposed to
cattle. Further, the main geographical areas where pigs are kept in
the Netherlands corresponds with the high-incidence areas where
the human Q fever epidemic related to dairy goats was situated
and where high seroprevalences were found in the rural
population. On the other hand, treatment of swine has previously
been described as a risk factor for seropositivity for veterinarians
[19]. The natural susceptibility of swine to C. burnetii was
demonstrated during a Q fever epidemic in Uruguay. A
seroprevalence of 21.4% was measured in 391 healthy slaughter
pigs [22]. No information about Q fever prevalences in swine in
the Netherlands is available.
In this survey, 20 veterinary students participated, and the
seroprevalence was 30%. In a survey in Spain, a seroprevalence of
11% among veterinary students was found. First course students
showed a significant lower seroprevalence. Multiple risk factors
were associated with C. burnetii: study course, contact with live
animals especially ruminants and contact with persons working
with animals [18]. A large serological survey (n = 674) was already
carried out in the Netherlands in 2006. At that time 18.7% of the
veterinary students were seropositive. Students in their final year
with the livestock study direction had a seroprevalence of 37.3%.
The main risk factors were a study direction focusing on large
animals, advanced year of study, having had a zoonosis during
study and having ever lived on a farm with ruminants [23]. To
detect possible recent exposure to C. burnetii, testing was also
performed by ELISA IgM, and it is not remarkable that four out of
seven possible recent infections occurred in veterinary livestock
students, indicating this group is susceptible for the infection
during the practical rotations during their study. The lower
prevalence in veterinary students, an indication for recent
infection in seven of whom four were students, and the main risk
factors we found, are another indication for a high dose-effect
relation for seropositivity.
Our study clearly indicates that livestock veterinarians are an
occupational risk group. The prevalence found in this study was
much higher than described in several international sero-
epidemical studies among livestock veterinarians [13–
15,18,19,24,25], with the exception of a small survey among 12
veterinarians in southern Italy, which revealed a seroprevalence of
100% [16]. In other studies, contact with livestock is described as
an important risk factor for seropositivity [14,19,24], and exposure
to goats was the most important risk factor associated with C.burnetii infection in Southern Taiwan [14]. Treatment of cattle,
swine or wildlife were main risk factors associated with C. burnetiiseropositivity in US veterinarians [19]. In Slovakia and Nova
Scotia, professional orientation and regular contact with farm
animals and pets [24], and exposure to sheep placentas [15] were
described as important risk factors, respectively. In contrast, in
Japan, no significant correlation was found between years of
occupational experience and C. burnetii seropositivity [13].
The final independent risk factor was living in a rural or sub-
urban area. Participants living in these areas were significantly
more often seropositive than participants living in an urban area.
Rural and sub-urban living areas have been described before as a
risk factor [26–30], although urban outbreaks also have been
described, but could mostly be related to exposure to animals or
animal products [31–33]. In the Netherlands, livestock farms are
mainly situated in rural or sub-urban areas. The knowledge that
ruminants are the main reservoir for C. burnetii [1,34] and the fact
that C. burnetii can easily be spread by aerosols [4,7,8], presumably
explains why living in rural or sub-urban area is a risk factor for
seropositivity.
In the univariable analysis, age and gender were risk factors for
seropositivity. Nevertheless, both were left out of the multivariable
analysis because they were highly correlated with the number of
years participants were graduated as veterinarian. The higher
incidence in males than in females has been reported in several
sero-epidemical studies among veterinarians, but without a clear
explanation [15,17–19]. Also a Spanish study among veterinary
students revealed that male students in the fifth study year had a
significantly higher risk to be seropositive than female students
[18]. A higher clinical incidence in males and persons aged
between 40–60 years in the Dutch population has been described
during the Q fever outbreaks between 2007–2010 [11]. Age above
46 years, was also previously described as a risk factor for
seropositivity in veterinarians [19].
To differentiate in the group of practicing veterinarians, all
analyses were repeated in the multivariable analysis for the subset
of practicing veterinarians only, mainly working with cattle, swine
and poultry, or individual housed animals. The analysis on the
subset of practicing veterinarians did not result in additional
significant results (data are not shown), and was less robust than
the multivariable analysis based on the full data set.
Table 2. Final multivariable model for risk factors associatedwith presence of antibodies against Coxiella burnetii in 189veterinarians.
Variable Category No. OR [95% CI] P
Animalcontacts
,10 hours 37 1.0
(hours/week) 10–19 hours 45 12.0 2.5 57.1 0.002
20–29 hours 52 1.2 0.2 7.6 0.869
.= 30 hours 48 16.0 1.8 141.8 0.013
Veterinarian(years)
,= 2 47 1.0
3–13 51 17.5 4.0 77.4 ,0.001
14–21 44 26.5 4.8 145.9 ,0.001
.= 22 46 58.1 10.3 328.0 ,0.001
Living region Urban 26 1.0
Sub-urban 37 11.9 2.1 68.5 0.005
Rural 126 17.9 3.6 88.1 ,0.001
Work category Others 75 1.0
Practicing 114 15.8 2.9 87.2 0.002
Contact withswine
No 130 1.0
Yes 59 3.4 1.1 10.2 0.029
doi:10.1371/journal.pone.0054021.t002
Q Fever in Dutch Livestock Veterinarians
PLOS ONE | www.plosone.org 4 January 2013 | Volume 8 | Issue 1 | e54021

C. BURNETII ANTIBODIES AND RISK FACTORS IN LIVESTOCK VETERINARIANS | 175
5.1
of hours with animal contact per week, number of years graduated
as veterinarian, living in a rural (OR, 17.9 (95% CI: 3.6–88.1)) or
semi urban area (OR, 11.9 (95% CI: 2.1–68.5)), working as
practicing livestock veterinarian (OR, 15.8 (95% CI: 2.9–87.2)),
and occupational contact with swine (OR, 3.4 (95% CI: 1.1–10.2)).
Discussion
In this cross-sectional study, an overall C. burnetii seroprevalence
of 65.1% among Dutch livestock veterinarians was found. The
number of hours with animal contact per week, the number of
Table 1. Results of univariable analysis of risk factors for presence of antibodies against Coxiella burnetii.
Participants
Seropositive# Seronegative
No. % No. % Odds Ratio 95% confidence interval P
Gender
Female 24 40.7 35 59.3 1.0 . . .
Male 99 76.2 31 23.8 4.7 2.3 9.4 ,0.001
Age
,= 32 year 19 40.4 28 59.6 1.0 . .
33–44 year 35 71.4 14 28.6 3.7 1.6 8.6 0.003
45–52 year 37 75.5 12 24.5 4.5 1.9 10.9 0.001
53–65 year 32 72.7 12 27.3 3.9 1.6 9.5 0.002
Living region
Urban 8 30.8 18 69.2 1.0 . . .
Sub-urban 21 56.8 16 43.2 3.0 1.0 8.5 0.037
Rural 94 74.6 32 25.4 6.6 2.6 16.7 ,0.001
Veterinarian (years)
Veterinarian (,= 2) 13 27.7 34 72.3 1.0
veterinarian (3–13) 36 70.6 15 29.4 6.3 2.6 15.1 ,0.001
veterinarian (14–21) 33 75.0 11 25.0 7.9 3.1 20.0 ,0.001
veterinarian (.= 22) 40 87.0 6 13.0 17.4 6.00 50.8 ,0.001
Animal contact (hours/week)
,10 hours 9 24.3 28 75.7 1.0
10–19 hours 25 55.6 20 44.4 3.9 1.5 10.1 0.005
20–29 hours 42 80.8 10 19.2 13.1 4.7 36.2 ,0.001
.= 30 hours 43 89.6 5 10.4 26.8 8.1 88.2 ,0.001
Work category
Others 23 30.7 52 69.3 1.0
Practicing 100 87.7 14 12.3 16.2 7.7 34.0 ,0.001
Contact with cows
No 11 31.4 24 68.6 1.0 . . .
Yes 112 72.7 42 27.3 5.8 2.6 12.9 ,0.001
Contact with swine
No 80 61.5 50 38.5 1.0 . .
Yes 43 72.9 16 27.1 1.7 0.9 3.3 0.131
Contact with birth products of ruminants
No 16 33.3 32 66.7 1.0 . . .
Yes 107 75.9 34 24.1 6.3 3.1 12.9 ,0.001
Contact with birth products of pets
No 101 61.2 64 38.8 1.0 . . .
Yes 22 91.7 2 8.3 7.0 1.5 31.9 0.004
Practice on cow farm with abortion
No 32 43.8 41 56.2 1.0 . . .
Yes 91 78.4 25 21.6 4.7 2.4 9.3 ,0.001
#Sera were screened for phase I and phase II IgG using a cut-off of 1:32. Samples with both IgG phase I and II $1:32 were considered to be positive, while solitary IgGphase II samples were scored positive if they had a single titre of $1:512 (Focus Diagnostics, Cypress, CA).doi:10.1371/journal.pone.0054021.t001
Q Fever in Dutch Livestock Veterinarians
PLOS ONE | www.plosone.org 3 January 2013 | Volume 8 | Issue 1 | e54021
years the participants were graduated and practicing as a
veterinarian, were the main independent risk factors in this study.
These risk factors suggest a high dose-effect relation for
seropositivity in Dutch livestock veterinarians. In 1984, 84% of
222 Dutch livestock veterinarians were seropositive for IgG
antibodies against C. burnetii [17]. The use of a different laboratory
test and cut-offs, differences in study population and different
infection rates of livestock over time could be possible explanations
for other seroprevalence estimates.
Dutch livestock veterinarians have a high risk of getting C.
burnetii seropositive because of intensive contact with potentially
infected livestock, and the immune system can be boosted
frequently because of a high prevalence in Dutch livestock
[20,21]. Contact with swine was found to be an independent risk
factor, but the group of veterinarians involved was also exposed to
cattle. Further, the main geographical areas where pigs are kept in
the Netherlands corresponds with the high-incidence areas where
the human Q fever epidemic related to dairy goats was situated
and where high seroprevalences were found in the rural
population. On the other hand, treatment of swine has previously
been described as a risk factor for seropositivity for veterinarians
[19]. The natural susceptibility of swine to C. burnetii was
demonstrated during a Q fever epidemic in Uruguay. A
seroprevalence of 21.4% was measured in 391 healthy slaughter
pigs [22]. No information about Q fever prevalences in swine in
the Netherlands is available.
In this survey, 20 veterinary students participated, and the
seroprevalence was 30%. In a survey in Spain, a seroprevalence of
11% among veterinary students was found. First course students
showed a significant lower seroprevalence. Multiple risk factors
were associated with C. burnetii: study course, contact with live
animals especially ruminants and contact with persons working
with animals [18]. A large serological survey (n = 674) was already
carried out in the Netherlands in 2006. At that time 18.7% of the
veterinary students were seropositive. Students in their final year
with the livestock study direction had a seroprevalence of 37.3%.
The main risk factors were a study direction focusing on large
animals, advanced year of study, having had a zoonosis during
study and having ever lived on a farm with ruminants [23]. To
detect possible recent exposure to C. burnetii, testing was also
performed by ELISA IgM, and it is not remarkable that four out of
seven possible recent infections occurred in veterinary livestock
students, indicating this group is susceptible for the infection
during the practical rotations during their study. The lower
prevalence in veterinary students, an indication for recent
infection in seven of whom four were students, and the main risk
factors we found, are another indication for a high dose-effect
relation for seropositivity.
Our study clearly indicates that livestock veterinarians are an
occupational risk group. The prevalence found in this study was
much higher than described in several international sero-
epidemical studies among livestock veterinarians [13–
15,18,19,24,25], with the exception of a small survey among 12
veterinarians in southern Italy, which revealed a seroprevalence of
100% [16]. In other studies, contact with livestock is described as
an important risk factor for seropositivity [14,19,24], and exposure
to goats was the most important risk factor associated with C.burnetii infection in Southern Taiwan [14]. Treatment of cattle,
swine or wildlife were main risk factors associated with C. burnetiiseropositivity in US veterinarians [19]. In Slovakia and Nova
Scotia, professional orientation and regular contact with farm
animals and pets [24], and exposure to sheep placentas [15] were
described as important risk factors, respectively. In contrast, in
Japan, no significant correlation was found between years of
occupational experience and C. burnetii seropositivity [13].
The final independent risk factor was living in a rural or sub-
urban area. Participants living in these areas were significantly
more often seropositive than participants living in an urban area.
Rural and sub-urban living areas have been described before as a
risk factor [26–30], although urban outbreaks also have been
described, but could mostly be related to exposure to animals or
animal products [31–33]. In the Netherlands, livestock farms are
mainly situated in rural or sub-urban areas. The knowledge that
ruminants are the main reservoir for C. burnetii [1,34] and the fact
that C. burnetii can easily be spread by aerosols [4,7,8], presumably
explains why living in rural or sub-urban area is a risk factor for
seropositivity.
In the univariable analysis, age and gender were risk factors for
seropositivity. Nevertheless, both were left out of the multivariable
analysis because they were highly correlated with the number of
years participants were graduated as veterinarian. The higher
incidence in males than in females has been reported in several
sero-epidemical studies among veterinarians, but without a clear
explanation [15,17–19]. Also a Spanish study among veterinary
students revealed that male students in the fifth study year had a
significantly higher risk to be seropositive than female students
[18]. A higher clinical incidence in males and persons aged
between 40–60 years in the Dutch population has been described
during the Q fever outbreaks between 2007–2010 [11]. Age above
46 years, was also previously described as a risk factor for
seropositivity in veterinarians [19].
To differentiate in the group of practicing veterinarians, all
analyses were repeated in the multivariable analysis for the subset
of practicing veterinarians only, mainly working with cattle, swine
and poultry, or individual housed animals. The analysis on the
subset of practicing veterinarians did not result in additional
significant results (data are not shown), and was less robust than
the multivariable analysis based on the full data set.
Table 2. Final multivariable model for risk factors associatedwith presence of antibodies against Coxiella burnetii in 189veterinarians.
Variable Category No. OR [95% CI] P
Animalcontacts
,10 hours 37 1.0
(hours/week) 10–19 hours 45 12.0 2.5 57.1 0.002
20–29 hours 52 1.2 0.2 7.6 0.869
.= 30 hours 48 16.0 1.8 141.8 0.013
Veterinarian(years)
,= 2 47 1.0
3–13 51 17.5 4.0 77.4 ,0.001
14–21 44 26.5 4.8 145.9 ,0.001
.= 22 46 58.1 10.3 328.0 ,0.001
Living region Urban 26 1.0
Sub-urban 37 11.9 2.1 68.5 0.005
Rural 126 17.9 3.6 88.1 ,0.001
Work category Others 75 1.0
Practicing 114 15.8 2.9 87.2 0.002
Contact withswine
No 130 1.0
Yes 59 3.4 1.1 10.2 0.029
doi:10.1371/journal.pone.0054021.t002
Q Fever in Dutch Livestock Veterinarians
PLOS ONE | www.plosone.org 4 January 2013 | Volume 8 | Issue 1 | e54021

176 | CHAPTER 5.1
In conclusion, Dutch livestock veterinarians are an occupational
risk group with increased risk for C. burnetii infection presumably
because of their direct contact with infected livestock. Dutch
livestock veterinarians should be aware of this risk and be extra
alert regarding symptoms of Q fever. Most of the infections are not
notified, as they remain asymptomatic or result in only mild flu-
like symptoms. Serious infections leading to pneumonia or
hepatitis may occur. A C. burnetii infection can cause serious
complications during pregnancy and in those with underlying
disease, therefore these groups should be monitored properly.
Vaccination of occupational groups at risk is common in Australia
[35,36]. In the Netherlands, vaccination has been made available
in the first half of 2011, but only for specific risk groups, as those
patients with heart valve and vascular disorders. During the
community Q fever outbreaks between 2007 and 2009 in the
Netherlands, few patients reported occupational exposure [11].
Most veterinarians are not eligible for vaccination because the
presence of antibodies is an absolute contraindication for
administering the currently available Australian vaccine. However,
vaccination could be considered for seronegative veterinary
students at the beginning of their study [35]. Routine serological
follow-up is useful as well as basic safety rules, like hygiene
measures and the use of protection clothes [18,19,24,37], although
in this study disregard of protective measures was not found to be
an independent risk factor. Occupational exposure to several
zoonotic diseases makes basic safety rules useful for protecting the
livestock veterinarian.
Acknowledgments
This study was facilitated by the GGL (Dutch society for livestock
veterinarians). We would like to thank all participants for their cooperation
in this seroepidemical survey. In addition, we would like to thank
Diagnostiek Nederland for collecting blood samples and Jeroen Bosch
Hospital, and especially Jamie Meekelenkamp for examining the blood
samples. Last but not least we would like to thank Lammert Moll, and
Gerdien van Schaik of the Animal Health Service (GD) for their help with
the data-analysis and their comments on the manuscript, and Roel
Coutinho of the National Institute for Public Health and the Environment
(RIVM) for his comments on the manuscript.
Author Contributions
Revised the manuscript: BS PV. Read and approved the final manuscript:
RV BS PS WS Wvdh PV. Conceived and designed the experiments: RV
BS WvdH PV. Performed the experiments: PS. Analyzed the data: WS RV
BS. Wrote the paper: RV.
References
1. Arricau-Bouvery N, Rodolakis A (2005) Is Q fever an emerging or re-emerging
zoonosis? Vet Res 36: 327–349.2. Damoser J, Hofer E, Muller M (1993) [Abortions in a lower Austrian sheep facility
caused by Coxiella burnetii]. Berl Munch Tierarztl Wochenschr 106: 361–364.3. Hatchette TF, Hudson RC, Schlech WF, Campbell NA, Hatchette JE, et al.
(2001) Goat-associated Q fever: a new disease in Newfoundland. Emerg InfectDis 7: 413–419.
4. Maurin M, Raoult D (1999) Q fever. Clin Microbiol Rev 12: 518–553.
5. Wouda W, Dercksen DP (2007) [Abortion and stillbirth among dairy goats as aconsequence of Coxiella burnetii]. Tijdschr Diergeneeskd 132: 908–911.
6. Zeman DH, Kirkbride CA, Leslie-Steen P, Duimstra JR (1989) Ovine abortiondue to Coxiella burnetti infection. J Vet Diagn Invest 1: 178–180.
7. Marrie TJ (1990) Q fever - a review. Can Vet J 31: 555–563.
8. Schimmer B, Dijkstra F, Vellema P, Schneeberger PM, Hackert V, et al. (2009)Sustained intensive transmission of Q fever in the south of the Netherlands,
2009. Euro Surveill 14.9. Van Steenbergen JE, Morroy G, Groot CA, Ruikes FG, Marcelis JH, et al.
(2007) [An outbreak of Q fever in The Netherlands–possible link to goats]. NedTijdschr Geneeskd 151: 1998–2003.
10. van der Hoek W, Dijkstra F, Wijers N, Rietveld A, Wijkmans CJ, et al. (2010)
[Three years of Q fever in the Netherlands: faster diagnosis]. Ned TijdschrGeneeskd 154: A1845.
11. Dijkstra F, van der Hoek W, Wijers N, Schimmer B, Rietveld A, et al. (2012)The 2007–2010 Q fever epidemic in The Netherlands: characteristics of notified
acute Q fever patients and the association with dairy goat farming. FEMS
Immunol Med Microbiol 64: 3–12.12. Derrick EH (1937) Q fever, new fever entity: clinical features, diagnosis and
laboratory investigation. Med J Aus 2: 282–299.13. Abe T, Yamaki K, Hayakawa T, Fukuda H, Ito Y, et al. (2001) A
seroepidemiological study of the risks of Q fever infection in Japaneseveterinarians. Eur J Epidemiol 17: 1029–1032.
14. Chang CC, Lin PS, Hou MY, Lin CC, Hung MN, et al. (2010) Identification of
risk factors of Coxiella burnetii (Q fever) infection in veterinary-associatedpopulations in southern Taiwan. Zoonoses Public Health 57: e95–101.
15. Marrie TJ, Fraser J (1985) Prevalence of Antibodies to Coxiella burnetii AmongVeterinarians and Slaughterhouse Workers in Nova Scotia. Can Vet J 26: 181–184.
16. Monno R, Fumarola L, Trerotoli P, Cavone D, Giannelli G, et al. (2009)
Seroprevalence of Q fever, brucellosis and leptospirosis in farmers and agriculturalworkers in Bari, Southern Italy. Ann Agric Environ Med 16: 205–209.
17. Richardus JH, Donkers A, Dumas AM, Schaap GJ, Akkermans JP, et al. (1987)Q fever in the Netherlands: a sero-epidemiological survey among human
population groups from 1968 to 1983. Epidemiol Infect 98: 211–219.18. Valencia MC, Rodriguez CO, Punet OG, de Blas Giral I (2000) Q fever
seroprevalence and associated risk factors among students from the Veterinary
School of Zaragoza, Spain. Eur J Epidemiol 16: 469–476.19. Whitney EA, Massung RF, Candee AJ, Ailes EC, Myers LM, et al. (2009)
Seroepidemiologic and occupational risk survey for Coxiella burnetii antibodiesamong US veterinarians. Clin Infect Dis 48: 550–557.
20. Muskens J, Mars MH, Franken P (2007) [Q fever: an overview]. Tijdschr
Diergeneeskd 132: 912–917.21. Van den Brom R, van Engelen E, Luttikholt S, Moll L, van Maanen K, et al.
(2012) Coxiella burnetii in bulk tank milk samples from dairy goat and dairysheep farms in The Netherlands in 2008. Vet Rec 170: 310.
22. Somma-Moreira RE, Caffarena RM, Somma S, Perez G, Monteiro M (1987)Analysis of Q fever in Uruguay Rev Infect Dis 9: 386–387.
23. De Rooij MM, Schimmer B, Versteeg B, Schneeberger P, Berends BR, et al.
(2012) Risk factors of Coxiella burnetii (Q fever) seropositivity in veterinarymedicine students. PloS One 7: e32108.
24. Dorko E, Kalinova Z, Weissova T, Pilipcinec E (2008) Seroprevalence ofantibodies to Coxiella burnetii among employees of the Veterinary University in
Kosice, eastern Slovakia. Ann Agric Environ Med 15: 119–124.
25. Ergonul O, Zeller H, Kilic S, Kutlu S, Kutlu M, et al. (2006) Zoonotic infectionsamong veterinarians in Turkey: Crimean-Congo hemorrhagic fever and beyond.
Int J Infect Dis 10: 465–469.26. Gardon J, Heraud JM, Laventure S, Ladam A, Capot P, et al. (2001) Suburban
transmission of Q fever in French Guiana: evidence of a wild reservoir. J InfectDis 184: 278–284.
27. Karagiannis I, Schimmer B, Van Lier A, Timen A, Schneeberger P, et al. (2009)
Investigation of a Q fever outbreak in a rural area of The Netherlands.Epidemiol Infect 137: 1283–1294.
28. Lyytikainen O, Ziese T, Schwartlander B, Matzdorff P, Kuhnhen C, et al. (1998)An outbreak of sheep-associated Q fever in a rural community in Germany.
Eur J Epidemiol 14: 193–199.
29. Nebreda T, Contreras E, Jesus Merino F, Dodero E, Campos A (2001)[Outbreak of Q fever and seroprevalence in a rural population from Soria
Province]. Enferm Infecc Microbiol Clin 19: 57–60.30. Stein A, Raoult D (1999) Pigeon pneumonia in provence: a bird-borne Q fever
outbreak. Clin Infect Dis 29: 617–620.31. Langley JM, Marrie TJ, Covert A, Waag DM, Williams JC (1988) Poker players’
pneumonia. An urban outbreak of Q fever following exposure to a parturient
cat. N Engl J Med 319: 354–356.32. Oren I, Kraoz Z, Hadani Y, Kassis I, Zaltzman-Bershadsky N, et al. (2005) An
outbreak of Q fever in an urban area in Israel. Eur J Clin Microbiol Infect Dis24: 338–341.
33. Schimmer B, Ter Schegget R, Wegdam M, Zuchner L, de Bruin A, et al. (2010)
The use of a geographic information system to identify a dairy goat farm as themost likely source of an urban Q-fever outbreak. BMC Infect Dis 10: 69.
34. Raoult D, Marrie T, Mege J (2005) Natural history and pathophysiology of Qfever. Lancet Infect Dis 5: 219–226.
35. Gidding HF, Wallace C, Lawrence GL, McIntyre PB (2009) Australia’s nationalQ fever vaccination program. Vaccine 27: 2037–2041.
36. Marmion B (2007) Q fever: the long journey to control by vaccination.
Med J Aust 186: 164–166.37. Henning K, Hotzel H, Peters M, Welge P, Popps W, et al. (2009) [Unanticipated
outbreak of Q fever during a study using sheep, and its significance for furtherprojects]. Berl Munch Tierarztl Wochenschr 122: 13–19.
Q Fever in Dutch Livestock Veterinarians
PLOS ONE | www.plosone.org 5 January 2013 | Volume 8 | Issue 1 | e54021

CHAPTER 5.2
Risk factors of Coxiella burnetii (Q fever) seropositivity inveterinary medicine students
M.M.T. de RooijB. Schimmer
B. VersteegP.M. Schneeberger
B.R. BerendsD. Heederik
W. van der HoekI.M. Wouters
PLoS One. 2012;7(2):e32108

CHAPTER 5.2
Risk factors of Coxiella burnetii (Q fever) seropositivity inveterinary medicine students
M.M.T. de RooijB. Schimmer
B. VersteegP.M. Schneeberger
B.R. BerendsD. Heederik
W. van der HoekI.M. Wouters
PLoS One. 2012;7(2):e32108

Time-course of antibody responses against Coxiella burnetiifollowing acute Q fever
P. F. M. TEUNIS 1,2*, B. SCHIMMER 1, D. W. NOTERMANS3,
A. C. A. P. LEENDERS 4, P. C. WEVER 4, M. E. E. KRETZSCHMAR1,5
AND P. M. SCHNEEBERGER 4
1 Centre for Infectious Disease Control, Epidemiology and Surveillance Unit, RIVM, Bilthoven, The Netherlands2 Hubert Department of Global Health, Rollins School of Public Health, Emory University, Atlanta, GA, USA3 Centre for Infectious Disease Control, Laboratory for Infectious Diseases and Perinatal Screening, RIVM,Bilthoven, The Netherlands4 Jeroen Bosch Hospital, Department of Medical Microbiology and Infection Control,’s- Hertogenbosch, TheNetherlands5 Julius Centre for Health Sciences and Primary Care, University Medical Centre Utrecht, Utrecht, The
Netherlands
Received 11 October 2011; Final revision 15 February 2012; Accepted 15 February 2012;
first published online 4 April 2012
SUMMARY
Large outbreaks of Q fever in The Netherlands have provided a unique opportunity for studying
longitudinal serum antibody responses in patients. Results are presented of a cohort of 344
patients with acute symptoms of Q fever with three or more serum samples per patient. In all
these serum samples IgM and IgG against phase 1 and 2 Coxiella burnetii were measured by an
immunofluorescence assay. A mathematical model of the dynamic interaction of serum antibodies
and pathogens was used in a mixed model framework to quantitatively analyse responses to
C. burnetii infection. Responses show strong heterogeneity, with individual serum antibody
responses widely different in magnitude and shape. Features of the response, peak titre and decay
rate, are used to characterize the diversity of the observed responses. Binary mixture analysis of
IgG peak levels (phases 1 and 2) reveals a class of patients with high IgG peak titres that decay
slowly and may represent potential chronic cases. When combining the results of mixture analysis
into an odds score, it is concluded that not only high IgG phase 1 may be predictive for chronic
Q fever, but also that high IgG phase 2 may aid in detecting such putative chronic cases.
Key words: Coxiella, mathematical modelling, Q fever, serology, statistics.
INTRODUCTION
Since mid-2007 human cases of Q fever in The
Netherlands have increased sharply, with major out-
breaks in 2008 and 2009, reaching a total of about
4000 cases by 2010 [1–4]. Cases were predominantly
clustered in the south of The Netherlands [3] and the
majority of the laboratory samples were submitted
to one regional hospital : the Jeroen Bosch Hospital
in ’s-Hertogenbosch (about 2000 confirmed acute
Q fever cases). Follow-up of cases extended over a
period of up to 24 months. In the 3 years that this
outbreak persisted, laboratory results from over 2000
cases were collected in a laboratory database. This
* Author for correspondence : Professor P. F. M. Teunis, Centrefor Infectious Disease Control, Epidemiology and SurveillanceUnit, RIVM, PO Box 1, 3720BA Bilthoven, The Netherlands.(Email : [email protected])
Epidemiol. Infect. (2013), 141, 62–73. f Cambridge University Press 2012
doi:10.1017/S0950268812000404
Risk Factors of Coxiella burnetii (Q Fever) Seropositivityin Veterinary Medicine StudentsMyrna M. T. de Rooij1, Barbara Schimmer2, Bart Versteeg2,3, Peter Schneeberger3, Boyd R. Berends4,
Dick Heederik1, Wim van der Hoek2, Inge M. Wouters1*
1Division of Environmental Epidemiology, Institute for Risk Assessment Sciences, Utrecht, the Netherlands, 2Centre for Infectious Disease Control, National Institute for
Public Health and the Environment, Bilthoven, the Netherlands, 3Department of Medical Microbiology and Infection Control, Jeroen Bosch Hospital, ‘s-Hertogenbosch,
the Netherlands, 4Division of Veterinary Public Health, Institute for Risk Assessment Sciences, Utrecht, the Netherlands
Abstract
Background: Q fever is an occupational risk for veterinarians, however little is known about the risk for veterinary medicinestudents. This study aimed to assess the seroprevalence of Coxiella burnetii among veterinary medicine students and toidentify associated risk factors.
Methods: A cross-sectional study with questionnaire and blood sample collection was performed among all veterinarymedicine students studying in the Netherlands in 2006. Serum samples (n = 674), representative of all study years and studydirections, were analyzed for C. burnetii IgG and IgM phase I and II antibodies with an immunofluorescence assay (IFA).Seropositivity was defined as IgG phase I and/or II titer of 1:32 and above.
Results: Of the veterinary medicine students 126 (18.7%) had IgG antibodies against C. burnetii. Seropositivity associated riskfactors identified were the study direction ‘farm animals’ (Odds Ratio (OR) 3.27 [95% CI 2.14–5.02]), advanced year of study(OR year 6: 2.31 [1.22–4.39] OR year 3–5 1.83 [1.07–3.10]) having had a zoonosis during the study (OR 1.74 [1.07–2.82]) andever lived on a ruminant farm (OR 2.73 [1.59–4.67]). Stratified analysis revealed study direction ‘farm animals’ to be a study-related risk factor apart from ever living on a farm. In addition we identified a clear dose-response relation for the number ofyears lived on a farm with C. burnetii seropositivity.
Conclusions: C. burnetii seroprevalence is considerable among veterinary medicine students and study related risk factorswere identified. This indicates Q fever as an occupational risk for veterinary medicine students.
Received September 23, 2011; Accepted January 23, 2012; Published February 2 , 2012
Introduction
Q fever is a zoonotic disease caused by the bacterium Coxiella
burnetii and is, apart from community outbreaks, known as an
occupational disease of veterinarians, farmers and abattoir workers
[1]. Symptomatic acute Q fever mainly presents as fever and
headache, hepatitis, or pneumonia [2,3]. Moreover, infection with
C. burnetii is asymptomatic in approximately 60% of those infected
[2]. Many Q fever infections are not diagnosed because of the
often mild and nonspecific clinical symptoms [4]. Acute Q fever,
whether or not symptomatic, can develop into chronic Q fever [3].
Chronic Q fever generally presents as a culture-negative
endocarditis or vascular infection with a high case fatality [3].
Another important long-term effect is Q fever fatigue syndrome,
which occurs in 10 to 20% of all acute Q fever cases [5].
C. burnetii is a pathogenic bacterium which can infect mammals,
birds and arthropods [1]. Transmission of Coxiella to humans
occurs primarily through air via bioaerosols [6]. Furthermore
humans can be infected by intake of contaminated milk or food,
but these routes of transmission are of minor relevance [7]. The
Coxiella bacterium is known to have two antigenic stages: the
virulent phase I variant and the avirulent phase II variant [8]. In
the body, C. burnetii is controlled by the T-cell dependent immune
system, resulting in the production of specific antibodies [2].
Immunoglobulin G (IgG) is primarily effective against phase II
antigen, while Immunoglobulin M (IgM) targets both phase I and
II antigens [2]. The level of IgM increases rapidly after infection,
thus is considered to be a marker of recent infection, however it
can persist for many months [9,10]. IgG levels increase a few
weeks after infection, but remain detectable for years or even
throughout life [5,9].
Before the large community outbreaks in the Netherlands
starting in 2007, C. burnetii seroprevalence was 2.4% in a general
population sample taken in 2006–2007 [11]. Furthermore the
study showed that persons who kept ruminants or with
occupational animal contact had a higher risk to be infected with
Coxiella [11]. Serum samples collected in the Netherlands in
November 2009 showed that more than half of the livestock
veterinarians were seropositive [12]. A similarly high seropreva-
lence for C. burnetii in veterinarians has been reported in other
PLoS ONE | www.plosone.org 1 February 2012 | Volume 7 | Issue 2 | e32108
1
Risk Factors of Coxiella burnetii (Q Fever) Seropositivity in Veterinary Medicine Students
M.M.T. DE ROOIJ1, B. SCHIMMER2, B. VERSTEEG2,3, P. SCHNEEBERGER3, B.R. BERENDS4, D. HEEDERIK1, W. VAN DER HOEK2, I.M. WOUTERS1
Affiliaties
Chapter 3.2
1Centre for Infectious Disease Control, National Institute for Public Health and the Environment, Bilthoven, the Netherlands 2Municipal Health Service ‘Brabant Zuidoost, Eindhoven, the Netherlands 3Laboratory for Pathology and Medical Microbiology, Veldhoven, the Netherlands 4Region East, Food and Consumer Product Safety Authority, Zutphen, the Netherlands 5Department of Medical Microbiology and Infection Control, Jeroen Bosch Hospital, ‘s Hertogenbosch, the Netherlands 6Department of Small Ruminant Health, Animal Health Service, Deventer, the Netherlands
Chapter 4.1
1 Centre for Infectious Disease Control, National Institute for Public Health and The Environment, Bilthoven, The Netherlands 2 Academic Collaborative Centre AMPHI, Department of Primary and Community Care, Radboud University Nijmegen Medical Centre, Nijmegen, The Netherlands 3 Department of Medical Microbiology and Infection Control, Jeroen Bosch Hospital, ’s-Hertogenbosch, The Netherlands 4 Department of Small Ruminant Health, Animal Health Service, Deventer, The Netherlands
Chapter 4.2 1Centre for Infectious Disease Control, National Institute for Public Health and the Environment, Bilthoven, the Netherlands 2Quantitative Veterinary Epidemiology Group, Wageningen Institute of Animal Sciences, Wageningen, The Netherlands 3Department of Small Ruminant Health, Animal Health Service, Deventer, The Netherlands 4Academic Collaborative Centre AMPHI, Department of Primary and Community Care, Radboud University Nijmegen Medical Centre, the Netherlands
Chapter 4.4 1Centre for Infectious Disease Control, National Institute for Public Health and the Environment, Bilthoven, the Netherlands 2 Academic Collaborative Centre AMPHI, Department of Primary and Community Care, Radboud University Nijmegen Medical Centre, Nijmegen, the Netherlands 3Department of Small Ruminant Health, Animal Health Service, Deventer, The Netherlands
Chapter 4.5 1 National Institute for Public Health and the Environment (RIVM), Bilthoven, the Netherlands 2 Animal Health Service,Deventer, the Netherlands 3 Radboud University Nijmegen Medical Centre, Nijmegen, the Netherlands 4. Jeroen Bosch Hospital, ‘s-Hertogenbosch, the Netherlands Chapter 4.6 1 GD Animal Health, Deventer, The Netherlands 2 Centre for Infectious Disease Control, National Institute for Public Health and the Environment, Bilthoven, the Netherlands 3 Department of Primary and Community Care, Academic Collaborative Centre for Public Health (AMPHI), Radboud University Nijmegen Medical Centre, Nijmegen, The Netherlands
Chapter 5.1 1 Department of Small Ruminant Health, Animal Health Service, Deventer, The Netherlands 2 Centre for Infectious Disease Control, National Institute for Public Health and the Environment, Bilthoven, The Netherlands 3 Department of Medical Microbiology and Infection Control, Jeroen Bosch Hospital, ‘s-Hertogenbosch, The Netherlands, 4 Department of Diagnostics, Research and Epidemiology, Animal Health Service, Deventer, The Netherlands
Chapter 5.2
1 Division of Environmental Epidemiology, Institute for Risk Assessment Sciences, Utrecht, the Netherlands 2 Centre for Infectious Disease Control, National Institute for Public Health and the Environment, Bilthoven, the Netherlands, 3 Department of Medical Microbiology and Infection Control, Jeroen Bosch Hospital, ‘s-Hertogenbosch, the Netherlands, 4 Division of Veterinary Public Health, Institute for Risk Assessment Sciences, Utrecht, the Netherlands
Chapter 5.3 1.National Institute for Public Health and the Environment, Bilthoven, the Netherlands 2 European Centre for Disease Prevention and Control, Stockholm, Sweden 3 Jeroen Bosch Hospital, ‘s-Hertogenbosch, the Netherlands 4 ArboUnie, Utrecht, the Netherlands
studies, with prevalence ranging from approximately 20 to 50%
[13,14]. Hence a substantial number of veterinarians become
infected during their career, or possibly during their veterinary
education. Veterinary medicine students perform similar activities
as veterinarians during their study and likely have an increased risk
to become infected with C. burnetii also. Yet, little is known about
seroprevalence among veterinary students and the possible risk
factors.
Few serological studies have been done among veterinary
students, showing prevalence figures of Coxiella antibodies to range
from 10 to 40% [15–17]. Valencia et al showed that students at the
beginning of their first study year had a seroprevalence of 4.0%
which was significantly lower compared to the 16.8% prevalence
in the fifth year, implying a gradual increase in prevalence over the
study periods [16]. However, studies reporting on the seroprev-
alence for C. burnetii covering the complete educational program
and study duration are thus far missing. In univariate analysis
some risk factors for seropositivity were identified in these studies,
i.e. male gender, contact with ruminants, and study direction,
although multivariate analyses were not carried out [16,17]. We
thus performed a large-scale cross sectional study to determine the
seroprevalence of C. burnetii among all veterinary medicine
students studying in the Netherlands in the year 2006. All study
years and study directions were included in order to identify the
pattern in seroprevalence of antibodies against C. burnetii and to
determine the associated study-related factors and other student
characteristics.
Methods
Study design and populationThe cross sectional design and study population have been
described before by Samadi et al [18]. Briefly, all 1416 students,
who were registered as a student of veterinary medicine in 2006 at
Utrecht University, the only faculty of Veterinary Medicine in the
Netherlands, were requested to participate. Students of all study
phases were asked to fill in an online questionnaire and were
invited to donate a blood sample of 20 ml for serological testing.
Non-responders were sent maximally two reminders. Blood
collection was performed in 2006 before the start of large
community outbreaks of Q fever in the Netherlands in 2007–2009.
Ethics statementThe study protocol was approved by the Ethical Committee of
the Utrecht University. All participants gave written informed
consent prior to blood collection.
QuestionnaireInformation was collected on participants’ demographic and
study related characteristics and on their smoking habits and
health status. Regular contact with diverse animal species was
asked for during different periods of childhood and adulthood.
Information was gathered about a farm childhood, the number of
years lived on a farm, farm type and the activities performed on
the farm. Questions about health status addressed general health,
clinical symptoms and self-reported zoonotic diseases.
Study related characteristics for veterinary medicine students in
the Netherlands are affected by the structure of the veterinary
curriculum with its variety of directions and theoretical/practical
stages. Six months after the start of the study the veterinary
curriculum divides into two main directions: ‘individually kept
animals’ and ‘farm animal health’. After the second study year, the
curriculum subdivides further. The direction ‘individually kept
animals’ is split into ‘companion animals’ and ‘equine’. The
direction: ‘farm animal health’ is also split further in ‘farm animals
and veterinary public health’ and ‘veterinary scientific research’.
The first two study years consist of theoretical courses. During the
third and fourth year the content of the courses shifts gradually
towards practical lessons, but the majority is still theoretical. Fifth-
year students start to follow internships at all departments but with
the emphasis on their own specialization. Students with the
companion animal direction mostly encounter cats and dogs,
students at the equine department focus on horses and students
doing the farm animal health specialization encounter mainly
cows, pigs, poultry, sheep and goats.
Detection of C. burnetii IgG and IgMSera were analyzed for phase I and phase II IgG antibodies
against C. burnetii at the Regional Laboratory of Medical
Microbiology and Infection Control of the Jeroen Bosch Hospital
in Den Bosch, using an Immunofluorescence Assay (IFA)
according to the manufacturer’s protocol (Focus Diagnostics).
Sera were tested in a dilution series starting from a 1:32 till a
1:4096 dilution. An antibody titer of 1:32 and above for either IgG
I or II antibodies of a serum sample was defined seropositive. A
positive IgG test was followed by determination of phase I and II
IgM antibodies by IFA.
Statistical analysisAll statistical analyses were carried out using SPSS for Windows
(version 16). Univariate regression analyses were performed to
investigate the association between seropositivity and possible risk
factors. Variables in univariate analysis associated with seropos-
itivity (p,0.20) were selected for multivariate logistic regression
analyses. These variables were tested for multicollinearity and after
assumptions were met, both forward and backward regression
analyses were applied. The final multivariate model was obtained
with the criteria of a p-value of less than 0.05 for the model and for
each variable itself. Smoothed regression analysis was performed
to assess the shape of the association between seropositivity and the
number of years a student had lived on a farm.
Results
ResponseIn total, 965 of all the 1416 veterinary medicine students
responded to the questionnaire (68.2%) of which 5 were excluded
in further analyses. One student was excluded because the
questionnaire was not completed and four others as they
represented study specializations with intrinsic low numbers. Of
the 960 students providing a questionnaire, 674 students provided
a blood sample as well (47.6% of the total population). The
division over the different study phases and study directions of the
respondents is shown in Figure 1.
Participants’ characteristicsOf the participants that completed the questionnaire, 80% were
women (Table 1). The mean age was 24 years with a range from
18 to 47 years. A high number (51.1%) of the students reported
previous or current regular contact with farm animals outside the
veterinary curriculum. Furthermore 645 students (67.2%) had
regular contact with horses and 97.6% of the students had regular
contact with pets. Of the students 39.5% grew up in a rural area
and 13.5% had ever lived on a farm. Demographic characteristics
of students who did not provide blood were generally similar to
those who did, except for borderline significance for having lived
on a farm or in a village (Table 1). Of the students 130 reported to
have had a zoonosis during their study of which were reported
C. burnetii Serology Veterinary Students
PLoS ONE | www.plosone.org 2 February 2012 | Volume 7 | Issue 2 | e32108

C. BURNETII SEROPOSITIVITY AND RISK FACTORS IN VETERINARY MEDICINE STUDENTS | 181
5.2
Time-course of antibody responses against Coxiella burnetiifollowing acute Q fever
P. F. M. TEUNIS 1,2*, B. SCHIMMER 1, D. W. NOTERMANS3,
A. C. A. P. LEENDERS 4, P. C. WEVER 4, M. E. E. KRETZSCHMAR1,5
AND P. M. SCHNEEBERGER 4
1 Centre for Infectious Disease Control, Epidemiology and Surveillance Unit, RIVM, Bilthoven, The Netherlands2 Hubert Department of Global Health, Rollins School of Public Health, Emory University, Atlanta, GA, USA3 Centre for Infectious Disease Control, Laboratory for Infectious Diseases and Perinatal Screening, RIVM,Bilthoven, The Netherlands4 Jeroen Bosch Hospital, Department of Medical Microbiology and Infection Control,’s- Hertogenbosch, TheNetherlands5 Julius Centre for Health Sciences and Primary Care, University Medical Centre Utrecht, Utrecht, The
Netherlands
Received 11 October 2011; Final revision 15 February 2012; Accepted 15 February 2012;
first published online 4 April 2012
SUMMARY
Large outbreaks of Q fever in The Netherlands have provided a unique opportunity for studying
longitudinal serum antibody responses in patients. Results are presented of a cohort of 344
patients with acute symptoms of Q fever with three or more serum samples per patient. In all
these serum samples IgM and IgG against phase 1 and 2 Coxiella burnetii were measured by an
immunofluorescence assay. A mathematical model of the dynamic interaction of serum antibodies
and pathogens was used in a mixed model framework to quantitatively analyse responses to
C. burnetii infection. Responses show strong heterogeneity, with individual serum antibody
responses widely different in magnitude and shape. Features of the response, peak titre and decay
rate, are used to characterize the diversity of the observed responses. Binary mixture analysis of
IgG peak levels (phases 1 and 2) reveals a class of patients with high IgG peak titres that decay
slowly and may represent potential chronic cases. When combining the results of mixture analysis
into an odds score, it is concluded that not only high IgG phase 1 may be predictive for chronic
Q fever, but also that high IgG phase 2 may aid in detecting such putative chronic cases.
Key words: Coxiella, mathematical modelling, Q fever, serology, statistics.
INTRODUCTION
Since mid-2007 human cases of Q fever in The
Netherlands have increased sharply, with major out-
breaks in 2008 and 2009, reaching a total of about
4000 cases by 2010 [1–4]. Cases were predominantly
clustered in the south of The Netherlands [3] and the
majority of the laboratory samples were submitted
to one regional hospital : the Jeroen Bosch Hospital
in ’s-Hertogenbosch (about 2000 confirmed acute
Q fever cases). Follow-up of cases extended over a
period of up to 24 months. In the 3 years that this
outbreak persisted, laboratory results from over 2000
cases were collected in a laboratory database. This
* Author for correspondence : Professor P. F. M. Teunis, Centrefor Infectious Disease Control, Epidemiology and SurveillanceUnit, RIVM, PO Box 1, 3720BA Bilthoven, The Netherlands.(Email : [email protected])
Epidemiol. Infect. (2013), 141, 62–73. f Cambridge University Press 2012
doi:10.1017/S0950268812000404
Risk Factors of Coxiella burnetii (Q Fever) Seropositivityin Veterinary Medicine StudentsMyrna M. T. de Rooij1, Barbara Schimmer2, Bart Versteeg2,3, Peter Schneeberger3, Boyd R. Berends4,
Dick Heederik1, Wim van der Hoek2, Inge M. Wouters1*
1Division of Environmental Epidemiology, Institute for Risk Assessment Sciences, Utrecht, the Netherlands, 2Centre for Infectious Disease Control, National Institute for
Public Health and the Environment, Bilthoven, the Netherlands, 3Department of Medical Microbiology and Infection Control, Jeroen Bosch Hospital, ‘s-Hertogenbosch,
the Netherlands, 4Division of Veterinary Public Health, Institute for Risk Assessment Sciences, Utrecht, the Netherlands
Abstract
Background: Q fever is an occupational risk for veterinarians, however little is known about the risk for veterinary medicinestudents. This study aimed to assess the seroprevalence of Coxiella burnetii among veterinary medicine students and toidentify associated risk factors.
Methods: A cross-sectional study with questionnaire and blood sample collection was performed among all veterinarymedicine students studying in the Netherlands in 2006. Serum samples (n = 674), representative of all study years and studydirections, were analyzed for C. burnetii IgG and IgM phase I and II antibodies with an immunofluorescence assay (IFA).Seropositivity was defined as IgG phase I and/or II titer of 1:32 and above.
Results: Of the veterinary medicine students 126 (18.7%) had IgG antibodies against C. burnetii. Seropositivity associated riskfactors identified were the study direction ‘farm animals’ (Odds Ratio (OR) 3.27 [95% CI 2.14–5.02]), advanced year of study(OR year 6: 2.31 [1.22–4.39] OR year 3–5 1.83 [1.07–3.10]) having had a zoonosis during the study (OR 1.74 [1.07–2.82]) andever lived on a ruminant farm (OR 2.73 [1.59–4.67]). Stratified analysis revealed study direction ‘farm animals’ to be a study-related risk factor apart from ever living on a farm. In addition we identified a clear dose-response relation for the number ofyears lived on a farm with C. burnetii seropositivity.
Conclusions: C. burnetii seroprevalence is considerable among veterinary medicine students and study related risk factorswere identified. This indicates Q fever as an occupational risk for veterinary medicine students.
Received September 23, 2011; Accepted January 23, 2012; Published February 2 , 2012
Introduction
Q fever is a zoonotic disease caused by the bacterium Coxiella
burnetii and is, apart from community outbreaks, known as an
occupational disease of veterinarians, farmers and abattoir workers
[1]. Symptomatic acute Q fever mainly presents as fever and
headache, hepatitis, or pneumonia [2,3]. Moreover, infection with
C. burnetii is asymptomatic in approximately 60% of those infected
[2]. Many Q fever infections are not diagnosed because of the
often mild and nonspecific clinical symptoms [4]. Acute Q fever,
whether or not symptomatic, can develop into chronic Q fever [3].
Chronic Q fever generally presents as a culture-negative
endocarditis or vascular infection with a high case fatality [3].
Another important long-term effect is Q fever fatigue syndrome,
which occurs in 10 to 20% of all acute Q fever cases [5].
C. burnetii is a pathogenic bacterium which can infect mammals,
birds and arthropods [1]. Transmission of Coxiella to humans
occurs primarily through air via bioaerosols [6]. Furthermore
humans can be infected by intake of contaminated milk or food,
but these routes of transmission are of minor relevance [7]. The
Coxiella bacterium is known to have two antigenic stages: the
virulent phase I variant and the avirulent phase II variant [8]. In
the body, C. burnetii is controlled by the T-cell dependent immune
system, resulting in the production of specific antibodies [2].
Immunoglobulin G (IgG) is primarily effective against phase II
antigen, while Immunoglobulin M (IgM) targets both phase I and
II antigens [2]. The level of IgM increases rapidly after infection,
thus is considered to be a marker of recent infection, however it
can persist for many months [9,10]. IgG levels increase a few
weeks after infection, but remain detectable for years or even
throughout life [5,9].
Before the large community outbreaks in the Netherlands
starting in 2007, C. burnetii seroprevalence was 2.4% in a general
population sample taken in 2006–2007 [11]. Furthermore the
study showed that persons who kept ruminants or with
occupational animal contact had a higher risk to be infected with
Coxiella [11]. Serum samples collected in the Netherlands in
November 2009 showed that more than half of the livestock
veterinarians were seropositive [12]. A similarly high seropreva-
lence for C. burnetii in veterinarians has been reported in other
PLoS ONE | www.plosone.org 1 February 2012 | Volume 7 | Issue 2 | e32108
1
Affiliaties
Chapter 3.2
1Centre for Infectious Disease Control, National Institute for Public Health and the Environment, Bilthoven, the Netherlands 2Municipal Health Service ‘Brabant Zuidoost, Eindhoven, the Netherlands 3Laboratory for Pathology and Medical Microbiology, Veldhoven, the Netherlands 4Region East, Food and Consumer Product Safety Authority, Zutphen, the Netherlands 5Department of Medical Microbiology and Infection Control, Jeroen Bosch Hospital, ‘s Hertogenbosch, the Netherlands 6Department of Small Ruminant Health, Animal Health Service, Deventer, the Netherlands
Chapter 4.1
1 Centre for Infectious Disease Control, National Institute for Public Health and The Environment, Bilthoven, The Netherlands 2 Academic Collaborative Centre AMPHI, Department of Primary and Community Care, Radboud University Nijmegen Medical Centre, Nijmegen, The Netherlands 3 Department of Medical Microbiology and Infection Control, Jeroen Bosch Hospital, ’s-Hertogenbosch, The Netherlands 4 Department of Small Ruminant Health, Animal Health Service, Deventer, The Netherlands
Chapter 4.2 1Centre for Infectious Disease Control, National Institute for Public Health and the Environment, Bilthoven, the Netherlands 2Quantitative Veterinary Epidemiology Group, Wageningen Institute of Animal Sciences, Wageningen, The Netherlands 3Department of Small Ruminant Health, Animal Health Service, Deventer, The Netherlands 4Academic Collaborative Centre AMPHI, Department of Primary and Community Care, Radboud University Nijmegen Medical Centre, the Netherlands
Chapter 4.4 1Centre for Infectious Disease Control, National Institute for Public Health and the Environment, Bilthoven, the Netherlands 2 Academic Collaborative Centre AMPHI, Department of Primary and Community Care, Radboud University Nijmegen Medical Centre, Nijmegen, the Netherlands 3Department of Small Ruminant Health, Animal Health Service, Deventer, The Netherlands
Chapter 4.5 1 National Institute for Public Health and the Environment (RIVM), Bilthoven, the Netherlands 2 Animal Health Service,Deventer, the Netherlands 3 Radboud University Nijmegen Medical Centre, Nijmegen, the Netherlands 4. Jeroen Bosch Hospital, ‘s-Hertogenbosch, the Netherlands Chapter 4.6 1 GD Animal Health, Deventer, The Netherlands 2 Centre for Infectious Disease Control, National Institute for Public Health and the Environment, Bilthoven, the Netherlands 3 Department of Primary and Community Care, Academic Collaborative Centre for Public Health (AMPHI), Radboud University Nijmegen Medical Centre, Nijmegen, The Netherlands
Chapter 5.1 1 Department of Small Ruminant Health, Animal Health Service, Deventer, The Netherlands 2 Centre for Infectious Disease Control, National Institute for Public Health and the Environment, Bilthoven, The Netherlands 3 Department of Medical Microbiology and Infection Control, Jeroen Bosch Hospital, ‘s-Hertogenbosch, The Netherlands, 4 Department of Diagnostics, Research and Epidemiology, Animal Health Service, Deventer, The Netherlands
Chapter 5.2
1 Division of Environmental Epidemiology, Institute for Risk Assessment Sciences, Utrecht, the Netherlands 2 Centre for Infectious Disease Control, National Institute for Public Health and the Environment, Bilthoven, the Netherlands, 3 Department of Medical Microbiology and Infection Control, Jeroen Bosch Hospital, ‘s-Hertogenbosch, the Netherlands, 4 Division of Veterinary Public Health, Institute for Risk Assessment Sciences, Utrecht, the Netherlands
Chapter 5.3 1.National Institute for Public Health and the Environment, Bilthoven, the Netherlands 2 European Centre for Disease Prevention and Control, Stockholm, Sweden 3 Jeroen Bosch Hospital, ‘s-Hertogenbosch, the Netherlands 4 ArboUnie, Utrecht, the Netherlands
studies, with prevalence ranging from approximately 20 to 50%
[13,14]. Hence a substantial number of veterinarians become
infected during their career, or possibly during their veterinary
education. Veterinary medicine students perform similar activities
as veterinarians during their study and likely have an increased risk
to become infected with C. burnetii also. Yet, little is known about
seroprevalence among veterinary students and the possible risk
factors.
Few serological studies have been done among veterinary
students, showing prevalence figures of Coxiella antibodies to range
from 10 to 40% [15–17]. Valencia et al showed that students at the
beginning of their first study year had a seroprevalence of 4.0%
which was significantly lower compared to the 16.8% prevalence
in the fifth year, implying a gradual increase in prevalence over the
study periods [16]. However, studies reporting on the seroprev-
alence for C. burnetii covering the complete educational program
and study duration are thus far missing. In univariate analysis
some risk factors for seropositivity were identified in these studies,
i.e. male gender, contact with ruminants, and study direction,
although multivariate analyses were not carried out [16,17]. We
thus performed a large-scale cross sectional study to determine the
seroprevalence of C. burnetii among all veterinary medicine
students studying in the Netherlands in the year 2006. All study
years and study directions were included in order to identify the
pattern in seroprevalence of antibodies against C. burnetii and to
determine the associated study-related factors and other student
characteristics.
Methods
Study design and populationThe cross sectional design and study population have been
described before by Samadi et al [18]. Briefly, all 1416 students,
who were registered as a student of veterinary medicine in 2006 at
Utrecht University, the only faculty of Veterinary Medicine in the
Netherlands, were requested to participate. Students of all study
phases were asked to fill in an online questionnaire and were
invited to donate a blood sample of 20 ml for serological testing.
Non-responders were sent maximally two reminders. Blood
collection was performed in 2006 before the start of large
community outbreaks of Q fever in the Netherlands in 2007–2009.
Ethics statementThe study protocol was approved by the Ethical Committee of
the Utrecht University. All participants gave written informed
consent prior to blood collection.
QuestionnaireInformation was collected on participants’ demographic and
study related characteristics and on their smoking habits and
health status. Regular contact with diverse animal species was
asked for during different periods of childhood and adulthood.
Information was gathered about a farm childhood, the number of
years lived on a farm, farm type and the activities performed on
the farm. Questions about health status addressed general health,
clinical symptoms and self-reported zoonotic diseases.
Study related characteristics for veterinary medicine students in
the Netherlands are affected by the structure of the veterinary
curriculum with its variety of directions and theoretical/practical
stages. Six months after the start of the study the veterinary
curriculum divides into two main directions: ‘individually kept
animals’ and ‘farm animal health’. After the second study year, the
curriculum subdivides further. The direction ‘individually kept
animals’ is split into ‘companion animals’ and ‘equine’. The
direction: ‘farm animal health’ is also split further in ‘farm animals
and veterinary public health’ and ‘veterinary scientific research’.
The first two study years consist of theoretical courses. During the
third and fourth year the content of the courses shifts gradually
towards practical lessons, but the majority is still theoretical. Fifth-
year students start to follow internships at all departments but with
the emphasis on their own specialization. Students with the
companion animal direction mostly encounter cats and dogs,
students at the equine department focus on horses and students
doing the farm animal health specialization encounter mainly
cows, pigs, poultry, sheep and goats.
Detection of C. burnetii IgG and IgMSera were analyzed for phase I and phase II IgG antibodies
against C. burnetii at the Regional Laboratory of Medical
Microbiology and Infection Control of the Jeroen Bosch Hospital
in Den Bosch, using an Immunofluorescence Assay (IFA)
according to the manufacturer’s protocol (Focus Diagnostics).
Sera were tested in a dilution series starting from a 1:32 till a
1:4096 dilution. An antibody titer of 1:32 and above for either IgG
I or II antibodies of a serum sample was defined seropositive. A
positive IgG test was followed by determination of phase I and II
IgM antibodies by IFA.
Statistical analysisAll statistical analyses were carried out using SPSS for Windows
(version 16). Univariate regression analyses were performed to
investigate the association between seropositivity and possible risk
factors. Variables in univariate analysis associated with seropos-
itivity (p,0.20) were selected for multivariate logistic regression
analyses. These variables were tested for multicollinearity and after
assumptions were met, both forward and backward regression
analyses were applied. The final multivariate model was obtained
with the criteria of a p-value of less than 0.05 for the model and for
each variable itself. Smoothed regression analysis was performed
to assess the shape of the association between seropositivity and the
number of years a student had lived on a farm.
Results
ResponseIn total, 965 of all the 1416 veterinary medicine students
responded to the questionnaire (68.2%) of which 5 were excluded
in further analyses. One student was excluded because the
questionnaire was not completed and four others as they
represented study specializations with intrinsic low numbers. Of
the 960 students providing a questionnaire, 674 students provided
a blood sample as well (47.6% of the total population). The
division over the different study phases and study directions of the
respondents is shown in Figure 1.
Participants’ characteristicsOf the participants that completed the questionnaire, 80% were
women (Table 1). The mean age was 24 years with a range from
18 to 47 years. A high number (51.1%) of the students reported
previous or current regular contact with farm animals outside the
veterinary curriculum. Furthermore 645 students (67.2%) had
regular contact with horses and 97.6% of the students had regular
contact with pets. Of the students 39.5% grew up in a rural area
and 13.5% had ever lived on a farm. Demographic characteristics
of students who did not provide blood were generally similar to
those who did, except for borderline significance for having lived
on a farm or in a village (Table 1). Of the students 130 reported to
have had a zoonosis during their study of which were reported
C. burnetii Serology Veterinary Students
PLoS ONE | www.plosone.org 2 February 2012 | Volume 7 | Issue 2 | e32108

182 | CHAPTER 5.2
most frequently: dermatophytosis (ringworm, 8.5%) and other
fungal infections (5.5%, Table 2).
Serological resultsSera of 126 students (18.7%) were positive, with an IgG II titer
ranging from 1:32 to 1:4096. Thirty percent (n = 38) of the
students with a positive IgG II titer also had a positive IgG I titer
ranging from 1:32 to 1:2084. There were no students with
exclusive positive IgG I titers. Only sera with a positive IgG titer
were tested for IgM antibodies. Of the IgG positives, 3% also had
a positive IgM I with titers ranging from 1:32 to 1:256. While 19%
of the IgG positives had also a positive IgM II indicating recent
infection, with titers from 1:32 to .1:256. Seroprevalence showed
an increase from study phase 1 (year 1–2) to phase 2 (year 3–5) and
to phase 3 (year 6). Additionally, students mostly involved with
farm animals had a much higher seroprevalence than those
working with individually kept animals (Table 3).
Risk factor analysesIn the univariate analyses we identified variables associated with
C. burnetii seropositivity as shown in Table 4. Male students were
more often seropositive than females and seropositivity increased
significantly with age per year. The study phase, study direction
and whether or not internships were followed, were also
associated. Moreover contact with cows, pigs, dogs and sheep
was positively associated with seropositivity. Students who had
lived on a farm were 2.9 times more likely to have C. burnetiiantibodies. The risk was higher for having lived on a livestock
breeding farm and was the highest for a ruminant farm. The risk
for a positive serology significantly increased with each year the
student had lived on the farm. The shape of this relationship was
log-linear, implying that the risk for a positive serology significantly
increased with each year the student had lived on the farm
(p= 0.028; p-spline 2 df = 0.566; Figure 2). The following activities
performed on the farm were associated with seropositivity: animal
nursing and work with liquid and/or solid manure. Students
reporting to have had a zoonosis during their study had a higher
chance of seropositivity. However none of the students reported to
have had Q fever during their study (Table 2).General health
status and specific clinical symptoms like cough, headache,
unusually tired feeling, flu like symptoms and shortness of breath
were not associated with seropositivity.
Ten variables were included in the initial multivariate regression
model. In the final model the following were identified to be
associated with seropositivity: having lived on a ruminant farm
(OR 2.7), study direction ‘farm animals’ (OR 3.3), having had a
zoonotic disease during study (OR 1.7) and duration of study
(phase 2 (OR 1.8) and phase 3 (OR 2.3), (Table 5)).
We performed stratified analyses for students who had lived on
a farm and those who did not, to investigate whether study
direction remained an independent risk factor (Table 5). Results
showed that the study direction ‘farm animals’ remained
significantly associated with seropositivity for those who grew up
on a farm (OR study direction= 4.9), as well as for those who did
not (OR study direction= 3.3).
Discussion
In this cross-sectional study among Dutch veterinary students,
we found a C. burnetii seroprevalence of 18.7% and identified
several associated risk factors including study related factors. Only
few studies have assessed zoonotic risks for veterinary medicine
students. This is the first large-scale study that examined the
seroprevalence for Coxiella among veterinary medicine students of
all study years and directions. The overall observed seroprevalence
was within the range of 10 to 40% reported in other studies for
veterinary students of Spain, Brazil, California and Ohio [15–17].
The found prevalence is considerably lower than the prevalence
of over 80% in Dutch livestock veterinarians sampled in 2009
[12]. The prevalence among these veterinarians might be slightly
Figure 1. Numbers and percentages of participants per study direction and study phase.
C. burnetii Serology Veterinary Students
PLoS ONE | www.plosone.org 3 February 2012 | Volume 7 | Issue 2 | e32108
higher than when sampling would have taken place in 2006, due
to the environmental outbreaks starting in 2007. Conversely, other
studies reported high seroprevalences of 20% and more for
veterinarians in countries like the United States, Canada, Slovakia
and Taiwan [13,14,19–21]. Comparing seroprevalences should
however be done with caution, because different study populations
and diagnostic tests applied might affect the outcomes. Recently,
commercial IFAs and ELISAs have become available which are
now predominantly used [22]. Despite this progress, there is still a
wide interlaboratory variability due to different IgG and IgM cut-
off levels applied [22]. There is no general consensus of the
appropriate cut-off level as it depends on the population under
study and the used antigen-preparation [23]. In this study IFA was
used instead of ELISA because it is considered to be the reference
method to study seroprevalence of Coxiella [24]. We chose a cut-off
level of 1:32 instead of the 1:16 cut-off recommended by the
manufacturer to increase specificity thus lowering the chance of
false positives.
We found that students who grew up on a farm, especially on a
ruminant farm, had a higher risk of being seropositive. All kinds of
animals can be affected by Coxiella but ruminants are the most
important reservoirs [25]. Furthermore almost all students
performed at least one activity on the farm on which they had
lived, for example more than 80% performed animal nursing. The
shedding of Coxiella occurs primarily during aborting or parturi-
tion, thus likely occasions whereby students were often present
[26,27]. A study in Spain among veterinary students documented
working with ruminants as a risk factor and in Taiwan goat
exposure was a risk factor for veterinarians [16,21].
The risk for a positive serology was found to significantly
increase with each year the student had lived on a farm. The
biological meaning of this is not known, as profound studies
concerning exposure-response relations for Coxiella are lacking.
Our finding might just reflect the increased probability to
encounter C. burnetii exposure, as the risk for each exposure
moment is constant given that one Coxiella organism entering the
body is enough to cause disease [1]. On the other hand, our
finding might be explained by a cumulative effect of long term
exposure, suggesting that a threshold exposure should be met.
Lastly, the level of exposure might be of importance as well: the
persons who lived longer on a farm are more likely to have
performed activities like animal nursing.
Students within the ‘farm animals’ direction had a three times
higher risk to be seropositive than students from other directions.
Table 1. Descriptive characteristics (n (%) or stated otherwise) of the total study population and those who did and did notprovide a blood sample.
Population characteristics total with blood without blood
Number of students 960 674 286
Female 771 (80.3%) 540 (80.1%) 231 (80.8%)
Age, AMa (SDb) 23.7 (3.7) 23.7 (3.6) 23.9 (3.8)
Weight (kg), AMa (SDb) 68.5 (11.2) 68.3 (10.7) 69.1 (12.3)
Height (cm), AMa (SDb) 174.6 (8.3) 174.4 (8.2) 175.2 (8.5)
Current smoker 103 (10.7%) 69 (10.2%) 34 (11.8%)
Past Smoker 86 (8.9%) 60 (8.9%) 26 (9.0%)
Regular contactc with animals besides the study:
Horses 645 (67.2%) 451 (66.9%) 194 (67.8%)
Cows 312 (32.5%) 216 (32.0%) 96 (33.6%)
Pigs 136 (14.2%) 94 (13.9%) 42 (14.7%)
Sheep 275 (28.6%) 192 (28.5%) 83 (29.0%)
Poultry 307 (32.0%) 220 (32.6%) 87 (30.4%)
Goats 232 (24.2%) 166 (24.6%) 66 (23.1%)
Dogs 717 (74.7%) 507 (75.2%) 210 (73.4%)
Cats 712 (74.2%) 496 (73.6%) 216 (75.5%)
Rodents 715 (74.5%) 505 (74.9%) 210 (73.4%)
Birds 394 (41.0%) 283 (42.0%) 111 (38.8%)
Job with previous or current regular animal contact 439 (45.7%) 307 (45.5%) 132 (46.2%)
Growing up in rural area (village)d 379 (39.5%) 282 (41.8%) 97 (33.9%)
Farm childhoode 130 (13.5%) 100 (14.8%) 30 (10.5%)
Self reported zoonosis during VMf 190 (19.8%) 132 (19.6%) 58 (20.3%)
Self reported Q fever 0 (0%) 0 (0%) 0 (0%)
Positive Q fever status 126 (18.7%)
aAM, Arithmetic Mean.bSD, Standard Deviation.cPrevious or current regular contact (.once a week).dChi-square between providing and not-providing blood borderline significant with p = 0.07.eChi-square between providing and not-providing blood borderline significant with p = 0.08.fVM, veterinary medicine.
C. burnetii Serology Veterinary Students
PLoS ONE | www.plosone.org 4 February 2012 | Volume 7 | Issue 2 | e32108

C. BURNETII SEROPOSITIVITY AND RISK FACTORS IN VETERINARY MEDICINE STUDENTS | 183
5.2
most frequently: dermatophytosis (ringworm, 8.5%) and other
fungal infections (5.5%, Table 2).
Serological resultsSera of 126 students (18.7%) were positive, with an IgG II titer
ranging from 1:32 to 1:4096. Thirty percent (n = 38) of the
students with a positive IgG II titer also had a positive IgG I titer
ranging from 1:32 to 1:2084. There were no students with
exclusive positive IgG I titers. Only sera with a positive IgG titer
were tested for IgM antibodies. Of the IgG positives, 3% also had
a positive IgM I with titers ranging from 1:32 to 1:256. While 19%
of the IgG positives had also a positive IgM II indicating recent
infection, with titers from 1:32 to .1:256. Seroprevalence showed
an increase from study phase 1 (year 1–2) to phase 2 (year 3–5) and
to phase 3 (year 6). Additionally, students mostly involved with
farm animals had a much higher seroprevalence than those
working with individually kept animals (Table 3).
Risk factor analysesIn the univariate analyses we identified variables associated with
C. burnetii seropositivity as shown in Table 4. Male students were
more often seropositive than females and seropositivity increased
significantly with age per year. The study phase, study direction
and whether or not internships were followed, were also
associated. Moreover contact with cows, pigs, dogs and sheep
was positively associated with seropositivity. Students who had
lived on a farm were 2.9 times more likely to have C. burnetiiantibodies. The risk was higher for having lived on a livestock
breeding farm and was the highest for a ruminant farm. The risk
for a positive serology significantly increased with each year the
student had lived on the farm. The shape of this relationship was
log-linear, implying that the risk for a positive serology significantly
increased with each year the student had lived on the farm
(p = 0.028; p-spline 2 df = 0.566; Figure 2). The following activities
performed on the farm were associated with seropositivity: animal
nursing and work with liquid and/or solid manure. Students
reporting to have had a zoonosis during their study had a higher
chance of seropositivity. However none of the students reported to
have had Q fever during their study (Table 2).General health
status and specific clinical symptoms like cough, headache,
unusually tired feeling, flu like symptoms and shortness of breath
were not associated with seropositivity.
Ten variables were included in the initial multivariate regression
model. In the final model the following were identified to be
associated with seropositivity: having lived on a ruminant farm
(OR 2.7), study direction ‘farm animals’ (OR 3.3), having had a
zoonotic disease during study (OR 1.7) and duration of study
(phase 2 (OR 1.8) and phase 3 (OR 2.3), (Table 5)).
We performed stratified analyses for students who had lived on
a farm and those who did not, to investigate whether study
direction remained an independent risk factor (Table 5). Results
showed that the study direction ‘farm animals’ remained
significantly associated with seropositivity for those who grew up
on a farm (OR study direction= 4.9), as well as for those who did
not (OR study direction= 3.3).
Discussion
In this cross-sectional study among Dutch veterinary students,
we found a C. burnetii seroprevalence of 18.7% and identified
several associated risk factors including study related factors. Only
few studies have assessed zoonotic risks for veterinary medicine
students. This is the first large-scale study that examined the
seroprevalence for Coxiella among veterinary medicine students of
all study years and directions. The overall observed seroprevalence
was within the range of 10 to 40% reported in other studies for
veterinary students of Spain, Brazil, California and Ohio [15–17].
The found prevalence is considerably lower than the prevalence
of over 80% in Dutch livestock veterinarians sampled in 2009
[12]. The prevalence among these veterinarians might be slightly
Figure 1. Numbers and percentages of participants per study direction and study phase.
C. burnetii Serology Veterinary Students
PLoS ONE | www.plosone.org 3 February 2012 | Volume 7 | Issue 2 | e32108
higher than when sampling would have taken place in 2006, due
to the environmental outbreaks starting in 2007. Conversely, other
studies reported high seroprevalences of 20% and more for
veterinarians in countries like the United States, Canada, Slovakia
and Taiwan [13,14,19–21]. Comparing seroprevalences should
however be done with caution, because different study populations
and diagnostic tests applied might affect the outcomes. Recently,
commercial IFAs and ELISAs have become available which are
now predominantly used [22]. Despite this progress, there is still a
wide interlaboratory variability due to different IgG and IgM cut-
off levels applied [22]. There is no general consensus of the
appropriate cut-off level as it depends on the population under
study and the used antigen-preparation [23]. In this study IFA was
used instead of ELISA because it is considered to be the reference
method to study seroprevalence of Coxiella [24]. We chose a cut-off
level of 1:32 instead of the 1:16 cut-off recommended by the
manufacturer to increase specificity thus lowering the chance of
false positives.
We found that students who grew up on a farm, especially on a
ruminant farm, had a higher risk of being seropositive. All kinds of
animals can be affected by Coxiella but ruminants are the most
important reservoirs [25]. Furthermore almost all students
performed at least one activity on the farm on which they had
lived, for example more than 80% performed animal nursing. The
shedding of Coxiella occurs primarily during aborting or parturi-
tion, thus likely occasions whereby students were often present
[26,27]. A study in Spain among veterinary students documented
working with ruminants as a risk factor and in Taiwan goat
exposure was a risk factor for veterinarians [16,21].
The risk for a positive serology was found to significantly
increase with each year the student had lived on a farm. The
biological meaning of this is not known, as profound studies
concerning exposure-response relations for Coxiella are lacking.
Our finding might just reflect the increased probability to
encounter C. burnetii exposure, as the risk for each exposure
moment is constant given that one Coxiella organism entering the
body is enough to cause disease [1]. On the other hand, our
finding might be explained by a cumulative effect of long term
exposure, suggesting that a threshold exposure should be met.
Lastly, the level of exposure might be of importance as well: the
persons who lived longer on a farm are more likely to have
performed activities like animal nursing.
Students within the ‘farm animals’ direction had a three times
higher risk to be seropositive than students from other directions.
Table 1. Descriptive characteristics (n (%) or stated otherwise) of the total study population and those who did and did notprovide a blood sample.
Population characteristics total with blood without blood
Number of students 960 674 286
Female 771 (80.3%) 540 (80.1%) 231 (80.8%)
Age, AMa (SDb) 23.7 (3.7) 23.7 (3.6) 23.9 (3.8)
Weight (kg), AMa (SDb) 68.5 (11.2) 68.3 (10.7) 69.1 (12.3)
Height (cm), AMa (SDb) 174.6 (8.3) 174.4 (8.2) 175.2 (8.5)
Current smoker 103 (10.7%) 69 (10.2%) 34 (11.8%)
Past Smoker 86 (8.9%) 60 (8.9%) 26 (9.0%)
Regular contactc with animals besides the study:
Horses 645 (67.2%) 451 (66.9%) 194 (67.8%)
Cows 312 (32.5%) 216 (32.0%) 96 (33.6%)
Pigs 136 (14.2%) 94 (13.9%) 42 (14.7%)
Sheep 275 (28.6%) 192 (28.5%) 83 (29.0%)
Poultry 307 (32.0%) 220 (32.6%) 87 (30.4%)
Goats 232 (24.2%) 166 (24.6%) 66 (23.1%)
Dogs 717 (74.7%) 507 (75.2%) 210 (73.4%)
Cats 712 (74.2%) 496 (73.6%) 216 (75.5%)
Rodents 715 (74.5%) 505 (74.9%) 210 (73.4%)
Birds 394 (41.0%) 283 (42.0%) 111 (38.8%)
Job with previous or current regular animal contact 439 (45.7%) 307 (45.5%) 132 (46.2%)
Growing up in rural area (village)d 379 (39.5%) 282 (41.8%) 97 (33.9%)
Farm childhoode 130 (13.5%) 100 (14.8%) 30 (10.5%)
Self reported zoonosis during VMf 190 (19.8%) 132 (19.6%) 58 (20.3%)
Self reported Q fever 0 (0%) 0 (0%) 0 (0%)
Positive Q fever status 126 (18.7%)
aAM, Arithmetic Mean.bSD, Standard Deviation.cPrevious or current regular contact (.once a week).dChi-square between providing and not-providing blood borderline significant with p = 0.07.eChi-square between providing and not-providing blood borderline significant with p = 0.08.fVM, veterinary medicine.
C. burnetii Serology Veterinary Students
PLoS ONE | www.plosone.org 4 February 2012 | Volume 7 | Issue 2 | e32108

184 | CHAPTER 5.2
The ‘farm animal’ direction itself includes regular contact with
ruminants, but ‘farm animal’ students also often had contact with
ruminants before or beside their study (Table 3). Furthermore the
percentage of students with a farm childhood in this direction is
considerably higher. Stratified analyses on farm childhood
however showed study direction to be a risk factor also for those
with a farm childhood, suggesting two independent effects,
indicating also for these students the importance of their study
for the development of seropositivity.
Longer study duration was associated with an increased
likelihood for seropositivity. As mentioned before, the study has
an increasing amount of practical lessons from the second study
phase and onwards. Furthermore the last studyphase consists
solely of internships whereby largely all veterinary activities are
performed by the students. Thus, towards the end of the study the
number of animal contact increases as well as the number of
treatments executed. The treatment of cattle, swine and wildlife
were previously reported as a risk factor for veterinarians [13].
Presumably, treatment of these species by students in their last
phase can partly explain studyphase being a risk factor. In
addition, by default students in later study phases are older likewise
their possibility of becoming infected during their lifetime is higher
[9]. Age as a risk factor was also found in a study amongst a
Canadian general population and among U.S. veterinarians
[13,19]. It could be argued that students in higher study phases
have lived longer on a farm, and therefore are more likely to
become seropositive. However, the average number of years
students lived on a farm in study phase 1, 2 and 3 did not differ,
being respectively 15.03, 14.84 and 16.75 years.
Table 2. Overview of self-reported zoonotic diseasesreported by veterinary medicine students (n = 960) during theveterinary medicine study.
Self reported zoonoses during VMa Number (%)
Brucellosis 0 (0%)
Campylobacteriosis 10 (1.5%)
Cryptosporidiosis 0 (0%)
Ecthyma 9 (1.3%)
Giardiasis 1 (0.1%)
Cat scratch 3 (0.4%)
Leptospirosis 0 (0%)
Listeriosis 2 (0.3%)
Psittacosis 0 (0%)
Q fever 0 (0%)
Salmonellosis 8 (1.2%)
Dermatophytosis (ringworm) 57 (8.5%)
Other fungal infections 37 (5.5%)
Staphylococcus 5 (0.7%)
Toxoplasmosis 0 (0%)
VTEC 2 (0.3%)
Worminfection 13 (1.9%)
aVM, veterinary medicine.
Table 3. Characteristics of students (n (%) or stated otherwise) who provided blood for the different study phases and by studydirection.
Students study phase 1 (Year 1–2) Farm animals Individually kept animals
Number of students 63 158
Contact with ruminants outside VMa 44 (69.8%) 43 (27.2%)
Job with regular animal contact 29 (46.0%) 72 (45.6%)
Growing up in rural area (village) 38 (60.3%) 52 (32.9%)
Farm childhood 17 (27.0%) 16 (10.1%)
Positive C. burnetii status 15 (23.8%) 9 (5.7%)
Students study phase 2 (Year 3–5) Farm animals Companion animals Horse
Number of students 128 163 45
Contact ruminants outside VMa 95 (74.2%) 48 (29.4%) 18 (40%)
Job with regular animal contact 57 (44.5%) 65 (39.9%) 29 (64.4%)
Growing up in rural area (village) 61 (47.7%) 59 (36.2%) 21 (46.7%)
Farm childhood 40 (31.2%) 10 (6.1%) 5 (11.1%)
Positive C. burnetii status 46 (35.9%) 19 (11.7%) 6 (13.3%)
Students study phase 3 (Year 6) Farm animals Companion animals Horse
Number of students 51 54 12
Contact with ruminants outside VMa 27 (52.9%) 15 (27.8%) 6 (50%)
Job with regular animal contact 22 (43.1%) 27 (50.0%) 6 (50.0%)
Growing up in rural area (village) 24 (47.1%) 19 (35.2%) 8 (66.7%)
Farm childhood 7 (13.7%) 3 (5.6%) 2 (16.7%)
Positive C. burnetii status 19 (37.3%) 10 (18.5%) 2 (16.7%)
Note.aPrevious or current regular (.once a week) contact with ruminants outside the veterinary medicine curriculum.
C. burnetii Serology Veterinary Students
PLoS ONE | www.plosone.org 5 February 2012 | Volume 7 | Issue 2 | e32108
Students reporting zoonoses since the start of their study were
more likely to be seropositive, although none of the 960 students
reported to have had Q fever. Of the students 20% reported a
zoonosis; most prevalent were ringworm and other fungal
infections. A variety of fungi are known to be commensals of the
animal skin, occasionally they can also be pathogenic either for
animals or humans [28]. Students with frequent animal contact
are presumably more exposed to several zoonotic pathogens [29].
Good hygiene is important for the prevention of these zoonoses
[30]. Presumably zoonotic diseases were found to be a risk factor
for Coxiella seropositivity because it reflects the students’ amount of
animal contact and hygiene practices. Whitney et al examined the
use of personal protective equipment by veterinarians, whereby
wearing always a lab coat and always a surgical mask were
protective factors [13]. These findings indicate the probable
benefit of strict hygienic measures. In contrast, recent findings
Table 4. Univariate analysis of factors possibly associated with seropositivity for Coxiella burnetii among veterinary medicinestudents.
Variable Odds Ratio (95% CI) P-value
Male gender (n = 134 (19.9%)) 1.74 (1.12–2.73) 0.018b
Age (per year) 1.10 (1.05–1.16) 0.000
Study direction farm animals (n = 242 (35.9%)) 4.15 (2.76–6.22) 0.000b
Zoonotic disease during VMa (n = 132 (19.6%)) 2.08 (1.34–3.24) 0.001b
Followed VMa internships (n = 171 (25.4%)) 2.12 (1.41–3.21) 0.000
Regular contact with:
Horses (n = 451 (66.9%)) 1.13 (0.74–1.71) 0.601
Cows (n = 216 (32%)) 2.39 (1.60–3.50) 0.000b
Pigs (n = 94 (13.9%)) 1.72 (1.04–2.85) 0.045b
Sheep (n = 192 (28.5%)) 1.73 (1.15–2.59) 0.009b
Poultry (n = 220 (32.6%)) 1.29 (0.86–1.93) 0.246
Goats (n = 166 (24.6%)) 1.35 (0.88–2.08) 0.207
Dogs (n = 507 (75.2%)) 1.81 (1.10–3.01) 0.022b
Cats (n = 496 (73.6%)) 0.96 (0.62–1.49) 0.911
Rodents (n = 505 (74.9%)) 0.80 (0.52–1.24) 0.362
Birds (n = 283 (42.0%)) 1.27 (0.86–1.88) 0.231
Former job with regular animal contact (n = 307 (45.5%)) 0.91 (0.62–1.34) 0.692
Ever lived on a farm (n = 100 (14.8%)) 2.86 (1.79–4.56) 0.000
Ever lived on a ruminant farm (n = 80 (11.9%)) 3.78 (2.30–6.22) 0.000b
Ever lived on a livestock breeding farm (n = 67 (10.0%)) 3.73 (2.18–6.31) 0.000
Years lived on a farm (per year) 1.07 (1.04–1.10) 0.024
Activities performed on the livestock farm:
Animal nursing (n = 73 (82.0%)) 4.40 (1.20–16.14) 0.022
Work with liquid and/or dry manure (n = 61 (68.5%)) 3.23 (1.23–8.43) 0.017
Work with straw/hay (n = 75 (84.3%)) 3.20 (0.86–11.94) 0.102
Plant nursing (n = 33 (37.1%)) 1.61 (0.70–3.71) 0.291
Compared to currently in study phase 1
Currently in study phase 2 (n = 336 (49.9%)) 2.20 (1.34–3.62) 0.001b
Currently in study phase 3 (n = 117 (17.4%)) 2.95 (1.64–5.34) 0.001b
Compared to town (15.000 to 80.000 inh) in childhood
Grew up in a village (,15.000 inhabitants) (n = 282 (41.8%)) 1.49 (0.97–2.29) 0.183
Grew up in a city (.80.000 inhabitants) (n = 110 (16.3%)) 1.28 (0.72–2.27) 0.183
Compared to currently living in a student house
Private house (n = 169 (25.1%)) 1.45 (0.94–2.25)) 0.218
Parental house n= 71 (10.5%)) 0.95 (0.49–1.86) 0.218
Compared to a none smoker
Past smoker (n = 60 (8.9%)) 1.11 (0.57–2.17) 0.898
Current smoker (n = 69 (10.2%)) 1.13 (0.61–2.12) 0.898
Note.aVM, veterinary medicine.bVariables included in the multivariate analysis, other variables p,0.20 were excluded because of multicollinearity.
C. burnetii Serology Veterinary Students
PLoS ONE | www.plosone.org 6 February 2012 | Volume 7 | Issue 2 | e32108

C. BURNETII SEROPOSITIVITY AND RISK FACTORS IN VETERINARY MEDICINE STUDENTS | 185
5.2
The ‘farm animal’ direction itself includes regular contact with
ruminants, but ‘farm animal’ students also often had contact with
ruminants before or beside their study (Table 3). Furthermore the
percentage of students with a farm childhood in this direction is
considerably higher. Stratified analyses on farm childhood
however showed study direction to be a risk factor also for those
with a farm childhood, suggesting two independent effects,
indicating also for these students the importance of their study
for the development of seropositivity.
Longer study duration was associated with an increased
likelihood for seropositivity. As mentioned before, the study has
an increasing amount of practical lessons from the second study
phase and onwards. Furthermore the last studyphase consists
solely of internships whereby largely all veterinary activities are
performed by the students. Thus, towards the end of the study the
number of animal contact increases as well as the number of
treatments executed. The treatment of cattle, swine and wildlife
were previously reported as a risk factor for veterinarians [13].
Presumably, treatment of these species by students in their last
phase can partly explain studyphase being a risk factor. In
addition, by default students in later study phases are older likewise
their possibility of becoming infected during their lifetime is higher
[9]. Age as a risk factor was also found in a study amongst a
Canadian general population and among U.S. veterinarians
[13,19]. It could be argued that students in higher study phases
have lived longer on a farm, and therefore are more likely to
become seropositive. However, the average number of years
students lived on a farm in study phase 1, 2 and 3 did not differ,
being respectively 15.03, 14.84 and 16.75 years.
Table 2. Overview of self-reported zoonotic diseasesreported by veterinary medicine students (n = 960) during theveterinary medicine study.
Self reported zoonoses during VMa Number (%)
Brucellosis 0 (0%)
Campylobacteriosis 10 (1.5%)
Cryptosporidiosis 0 (0%)
Ecthyma 9 (1.3%)
Giardiasis 1 (0.1%)
Cat scratch 3 (0.4%)
Leptospirosis 0 (0%)
Listeriosis 2 (0.3%)
Psittacosis 0 (0%)
Q fever 0 (0%)
Salmonellosis 8 (1.2%)
Dermatophytosis (ringworm) 57 (8.5%)
Other fungal infections 37 (5.5%)
Staphylococcus 5 (0.7%)
Toxoplasmosis 0 (0%)
VTEC 2 (0.3%)
Worminfection 13 (1.9%)
aVM, veterinary medicine.
Table 3. Characteristics of students (n (%) or stated otherwise) who provided blood for the different study phases and by studydirection.
Students study phase 1 (Year 1–2) Farm animals Individually kept animals
Number of students 63 158
Contact with ruminants outside VMa 44 (69.8%) 43 (27.2%)
Job with regular animal contact 29 (46.0%) 72 (45.6%)
Growing up in rural area (village) 38 (60.3%) 52 (32.9%)
Farm childhood 17 (27.0%) 16 (10.1%)
Positive C. burnetii status 15 (23.8%) 9 (5.7%)
Students study phase 2 (Year 3–5) Farm animals Companion animals Horse
Number of students 128 163 45
Contact ruminants outside VMa 95 (74.2%) 48 (29.4%) 18 (40%)
Job with regular animal contact 57 (44.5%) 65 (39.9%) 29 (64.4%)
Growing up in rural area (village) 61 (47.7%) 59 (36.2%) 21 (46.7%)
Farm childhood 40 (31.2%) 10 (6.1%) 5 (11.1%)
Positive C. burnetii status 46 (35.9%) 19 (11.7%) 6 (13.3%)
Students study phase 3 (Year 6) Farm animals Companion animals Horse
Number of students 51 54 12
Contact with ruminants outside VMa 27 (52.9%) 15 (27.8%) 6 (50%)
Job with regular animal contact 22 (43.1%) 27 (50.0%) 6 (50.0%)
Growing up in rural area (village) 24 (47.1%) 19 (35.2%) 8 (66.7%)
Farm childhood 7 (13.7%) 3 (5.6%) 2 (16.7%)
Positive C. burnetii status 19 (37.3%) 10 (18.5%) 2 (16.7%)
Note.aPrevious or current regular (.once a week) contact with ruminants outside the veterinary medicine curriculum.
C. burnetii Serology Veterinary Students
PLoS ONE | www.plosone.org 5 February 2012 | Volume 7 | Issue 2 | e32108
Students reporting zoonoses since the start of their study were
more likely to be seropositive, although none of the 960 students
reported to have had Q fever. Of the students 20% reported a
zoonosis; most prevalent were ringworm and other fungal
infections. A variety of fungi are known to be commensals of the
animal skin, occasionally they can also be pathogenic either for
animals or humans [28]. Students with frequent animal contact
are presumably more exposed to several zoonotic pathogens [29].
Good hygiene is important for the prevention of these zoonoses
[30]. Presumably zoonotic diseases were found to be a risk factor
for Coxiella seropositivity because it reflects the students’ amount of
animal contact and hygiene practices. Whitney et al examined the
use of personal protective equipment by veterinarians, whereby
wearing always a lab coat and always a surgical mask were
protective factors [13]. These findings indicate the probable
benefit of strict hygienic measures. In contrast, recent findings
Table 4. Univariate analysis of factors possibly associated with seropositivity for Coxiella burnetii among veterinary medicinestudents.
Variable Odds Ratio (95% CI) P-value
Male gender (n = 134 (19.9%)) 1.74 (1.12–2.73) 0.018b
Age (per year) 1.10 (1.05–1.16) 0.000
Study direction farm animals (n = 242 (35.9%)) 4.15 (2.76–6.22) 0.000b
Zoonotic disease during VMa (n = 132 (19.6%)) 2.08 (1.34–3.24) 0.001b
Followed VMa internships (n = 171 (25.4%)) 2.12 (1.41–3.21) 0.000
Regular contact with:
Horses (n = 451 (66.9%)) 1.13 (0.74–1.71) 0.601
Cows (n = 216 (32%)) 2.39 (1.60–3.50) 0.000b
Pigs (n = 94 (13.9%)) 1.72 (1.04–2.85) 0.045b
Sheep (n = 192 (28.5%)) 1.73 (1.15–2.59) 0.009b
Poultry (n = 220 (32.6%)) 1.29 (0.86–1.93) 0.246
Goats (n = 166 (24.6%)) 1.35 (0.88–2.08) 0.207
Dogs (n = 507 (75.2%)) 1.81 (1.10–3.01) 0.022b
Cats (n = 496 (73.6%)) 0.96 (0.62–1.49) 0.911
Rodents (n = 505 (74.9%)) 0.80 (0.52–1.24) 0.362
Birds (n = 283 (42.0%)) 1.27 (0.86–1.88) 0.231
Former job with regular animal contact (n = 307 (45.5%)) 0.91 (0.62–1.34) 0.692
Ever lived on a farm (n = 100 (14.8%)) 2.86 (1.79–4.56) 0.000
Ever lived on a ruminant farm (n = 80 (11.9%)) 3.78 (2.30–6.22) 0.000b
Ever lived on a livestock breeding farm (n = 67 (10.0%)) 3.73 (2.18–6.31) 0.000
Years lived on a farm (per year) 1.07 (1.04–1.10) 0.024
Activities performed on the livestock farm:
Animal nursing (n = 73 (82.0%)) 4.40 (1.20–16.14) 0.022
Work with liquid and/or dry manure (n = 61 (68.5%)) 3.23 (1.23–8.43) 0.017
Work with straw/hay (n = 75 (84.3%)) 3.20 (0.86–11.94) 0.102
Plant nursing (n = 33 (37.1%)) 1.61 (0.70–3.71) 0.291
Compared to currently in study phase 1
Currently in study phase 2 (n = 336 (49.9%)) 2.20 (1.34–3.62) 0.001b
Currently in study phase 3 (n = 117 (17.4%)) 2.95 (1.64–5.34) 0.001b
Compared to town (15.000 to 80.000 inh) in childhood
Grew up in a village (,15.000 inhabitants) (n = 282 (41.8%)) 1.49 (0.97–2.29) 0.183
Grew up in a city (.80.000 inhabitants) (n = 110 (16.3%)) 1.28 (0.72–2.27) 0.183
Compared to currently living in a student house
Private house (n = 169 (25.1%)) 1.45 (0.94–2.25)) 0.218
Parental house n= 71 (10.5%)) 0.95 (0.49–1.86) 0.218
Compared to a none smoker
Past smoker (n = 60 (8.9%)) 1.11 (0.57–2.17) 0.898
Current smoker (n = 69 (10.2%)) 1.13 (0.61–2.12) 0.898
Note.aVM, veterinary medicine.bVariables included in the multivariate analysis, other variables p,0.20 were excluded because of multicollinearity.
C. burnetii Serology Veterinary Students
PLoS ONE | www.plosone.org 6 February 2012 | Volume 7 | Issue 2 | e32108

186 | CHAPTER 5.2
among culling workers showed seroconversion in around one out
of five workers despite the use of personal protective equipment
[31].
The seroprevalence of 18.7% for the Dutch veterinary students
is high when compared to the seroprevalence of 2.4% for the
general population in the Netherlands measured in the same time
period, using the same methodology [11]. This indicates C. burnetiias a study or occupation related risk for veterinary students, as it
also exists for veterinarians. It should be noted that 18.7% is the
average prevalence in the study population. The risk for students
in certain subgroups is considerably higher. For example the
seroprevalence is 37.3% among students in the third study phase
within the ‘farm animals’ direction. This overall prevalence of
18.7% is presumably a valid estimate for the general veterinary
medicine student population, since about half of the total
population provided a blood sample. The students who provided
a blood sample showed to be only marginally different from the
student population who did not.
The measurement series in the Netherlands revealed that the
seroprevalence of students lies in between the prevalence observed
in the general population and among veterinarians. However,
students at the start of their study already had an increased
seroprevalence of 10.9%. These students only have had theoretical
courses; hence the increased seroprevalence can only be explained
by other determinants, such as the frequent occurrence of a farm
childhood in this population and the degree of ruminant contact
prior to the start of their study. As could be expected, veterinary
students have always been highly interested in animals. A large
number of the students had regular contact with different animal
species in childhood and around half of the students reported to
have had a job with regular animal contact (Table 1). Students in
the first phase within the ‘farm animals’ direction had a substantial
higher seroprevalence (23.8%) than students in the ‘individually
kept animals’ direction (5.7%, Table 3). This is likely a result of
previous contact with ruminants, as students with a farm
childhood are more likely to choose for the ‘farm animals’
direction.
The risk factors identified comprised most of the risk factors
found by several other studies both in open population and
occupational settings. However, some other risk factors have been
reported before, but could not be studied as the questionnaire did
not include these items. An example is contact with pond water
and knowledge of Q fever [13,21].
The implications of the high occurrence rate of seropositivity on
students’ health are not yet known. None of the students reported
to have had Q fever. Q fever has a wide variety of non-specific
symptoms and is often asymptomatic, so it is difficult to collect
relevant information with a questionnaire over an extended period
of time [2,3]. Poor recall might also have contributed to the low
reported prevalence for Q fever. Furthermore the questionnaire
was primarily based on the European Community Respiratory
Health Survey questionnaire, and was not specifically directed to
identify acute Q fever symptoms [32]. On the other hand, a high
prevalence of self reported Q fever was not expected as as
approximately 60% of Q fever infections are considered to be
asymptomatic [4]. Both symptomatic and asymptomatic Q fever
has been described to develop into chronic Q fever, although most
information is available from symptomatic acute Q fever patients
[3].Therefore research is needed to explore the risk for
asymptomatic seroconverters of development into chronic Q fever.
This study raises the question whether specific measures have to
be taken in this population to prevent development of C. burnetiiinfection. General protective measures may not be sufficient to
protect students throughout their career. Therefore offering
vaccination may be considered, like in Australia for personnel
with high risk occupations [33], or yearly serological screenings as
suggested for wool workers [34]. Moreover, in general, awareness
about study related health risks should be strengthened. Knowl-
Figure 2. Association between C. burnetii seropositivity and number of years lived on a farm (p=0.028, spline 2 d.f p=0.586) forstudents who ever lived on a farm (n=100). Open circles represent the 95% upper and lower confidence limits.
C. burnetii Serology Veterinary Students
PLoS ONE | www.plosone.org 7 February 2012 | Volume 7 | Issue 2 | e32108
edge regarding clinical symptoms of Q fever can improve referral
to the occupational physician affiliated to the university and
prevent development of chronic stages of disease.
To conclude, this is the first large-scale study that examined the
seroprevalence for C. burnetii among veterinary medicine students
across all study phases. It demonstrates a considerable C. burnetiiseroprevalence among veterinary medicine students. Besides
regular contact to ruminants outside the curriculum program,
also study related factors were associated with seropositivity. This
suggests the importance of Q fever as an occupational risk for
veterinary medicine students. Interestingly, we demonstrated a
log-linear relationship between the numbers of years lived on a
farm and seropositivity. Since clinical Q fever illness was not self-
reported further research is recommended to study the health
implications of seropositivity. Overall, this study contributes to the
knowledge and the awareness of Q fever as a risk for veterinary
students in order to contribute to its prevention.
Acknowledgments
We are grateful to all participants without whom the study could not be
conducted. We would like to thank Jamie Meekelenkamp of the Jeroen
Bosch Hospital for the laboratory analyses. We also thank the dean of the
Veterinary Medicine faculty and the department of student affairs for their
cooperation when performing the study. Lot Bannink is acknowledged for
coordinating the inclusion of the students.
Author Contributions
Conceived and designed the experiments: DH BRB IMW. Performed the
experiments: MMTR BS BV PS WH IMW. Analyzed the data: MMTR
IMW. Contributed reagents/materials/analysis tools: MMTR DH BS PS
WH IMW. Wrote the paper: MMTR IW. Reviewed and commented on
the manuscript: MMTR BS BV PS BRB DH WH IMW.
References
1. Madariaga MG, Rezai K, Trenholme GM, Weinstein RA (2003) Q fever: Abiological weapon in your backyard. Lancet Infect Dis 3: 709–721.
2. Raoult D, Marrie TJ, Mege JL (2005) Natural history and pathophysiology of Q
fever. Lancet Infect Dis 5: 219–226.
3. Parker NR, Barralet JH, Bell AM (2006) Q fever. Lancet 367: 679–688.
4. Maurin M, Raoult D (1999) Q fever. Clin Microbiol Rev 12: 518–553.
5. Sukocheva OA, Marmion BP, Storm PA, Lockhart M, Turra M, et al. (2010)
Long-term persistence after acute Q fever of non-infective Coxiella burnetii cellcomponents, including antigens. QJM 103: 847–863.
6. McQuiston JH, Childs JE (2002) Q fever in humans and animals in the UnitedStates. Vector Borne Zoonotic Dis 2: 179–191.
7. Woldehiwet Z (2004) Q fever (coxiellosis): Epidemiology and pathogenesis. Res
Vet Sci 77: 93–100.
8. Heinzen RA, Hackstadt T, Samuel JE (1999) Developmental biology of Coxiella
burnetii. Trends Microbiol 7: 149–154.
9. Dupont HT, Thirion X, Raoult D (1994) Q fever serology: Cutoff determination
for microimmunofluorescence. Clin Diagn Lab Immunol 1: 189–196.
10. van der Hoek W, Meekelenkamp JC, Leenders AC, Wijers N, Notermans DW,
et al. (2011) Antibodies against Coxiella burnetii and pregnancy outcome duringthe 2007–2008 Q fever outbreaks in the Netherlands. BMC Infect Dis 11: 44.
11. Schimmer B, Notermans DW, Harms MG, Reimerink JH, Bakker J, et al. (2012)Low seroprevalence of Q fever in the Netherlands prior to a series of large
outbreaks. Epidemiol Infect Jan;140(1): 27–35. Epub 2011 Feb 16.
12. van Duynhoven Y, Schimmer B, van Steenbergen J, van der Hoek W.The story
of human Q-fever in the Netherlands [Internet]. Netherlands: Ministry ofEconomic Affairs, Agriculture and Innovation. Available at http://english.
minlnv.nl. Accessed 1 July 2011.
13. Whitney EA, Massung RF, Candee AJ, Ailes EC, Myers LM, et al. (2009)
Seroepidemiologic and occupational risk survey for Coxiella burnetii antibodies
among US veterinarians. Clin Infect Dis 48: 550–557.
Table 5. Factors associated with Coxiella burnetii seropositivity obtained by multivariate analysis for all students and stratified byever lived on a farm.
All Ever lived on a farm
OR (95% CI) Yes (OR (95% CI)) No (OR (95% CI))
Study direction
Farm animal health 3.27 (2.14–5.02) 4.86 (1.54–15.29) 3.32 (2.06–5.35)
Other direction 1.00 1.00 1.00
Study phase
Phase 3 (Year 6) 2.31 (1.22–4.39) 0.43 (0.07–2.66) 3.16 (1.55–6.46)
Phase 2 (Year 3–5) 1.83 (1.07–3.10) 1.34 (0.46–3.94) 2.03 (1.09–3.79)
Phase 1 (Year 1–2) 1.00 1.00 1.00
Zoonotic disease during VMa
Yes 1.74 (1.07–2.82) 7.23 (1.74–30.09) 1.34 (0.78–2.34)
No 1.00 1.00 1.00
Ever lived on ruminant farm
Yes 2.73 (1.59–4.67) - -
No 1.00 - -
Childhood municipality
Village - 0.53 (0.18–1.52) 1.53 (0.89–2.62)
City - - 2.18 (1.15–4.14)
Town 1.00 1.00
Note. Multivariate analysis for all students obtained with Forward and Backward logistic regression.Stratified analysis obtained with Enter.aVM, veterinary medicine.
C. burnetii Serology Veterinary Students
PLoS ONE | www.plosone.org 8 February 2012 | Volume 7 | Issue 2 | e32108

C. BURNETII SEROPOSITIVITY AND RISK FACTORS IN VETERINARY MEDICINE STUDENTS | 187
5.2
among culling workers showed seroconversion in around one out
of five workers despite the use of personal protective equipment
[31].
The seroprevalence of 18.7% for the Dutch veterinary students
is high when compared to the seroprevalence of 2.4% for the
general population in the Netherlands measured in the same time
period, using the same methodology [11]. This indicates C. burnetiias a study or occupation related risk for veterinary students, as it
also exists for veterinarians. It should be noted that 18.7% is the
average prevalence in the study population. The risk for students
in certain subgroups is considerably higher. For example the
seroprevalence is 37.3% among students in the third study phase
within the ‘farm animals’ direction. This overall prevalence of
18.7% is presumably a valid estimate for the general veterinary
medicine student population, since about half of the total
population provided a blood sample. The students who provided
a blood sample showed to be only marginally different from the
student population who did not.
The measurement series in the Netherlands revealed that the
seroprevalence of students lies in between the prevalence observed
in the general population and among veterinarians. However,
students at the start of their study already had an increased
seroprevalence of 10.9%. These students only have had theoretical
courses; hence the increased seroprevalence can only be explained
by other determinants, such as the frequent occurrence of a farm
childhood in this population and the degree of ruminant contact
prior to the start of their study. As could be expected, veterinary
students have always been highly interested in animals. A large
number of the students had regular contact with different animal
species in childhood and around half of the students reported to
have had a job with regular animal contact (Table 1). Students in
the first phase within the ‘farm animals’ direction had a substantial
higher seroprevalence (23.8%) than students in the ‘individually
kept animals’ direction (5.7%, Table 3). This is likely a result of
previous contact with ruminants, as students with a farm
childhood are more likely to choose for the ‘farm animals’
direction.
The risk factors identified comprised most of the risk factors
found by several other studies both in open population and
occupational settings. However, some other risk factors have been
reported before, but could not be studied as the questionnaire did
not include these items. An example is contact with pond water
and knowledge of Q fever [13,21].
The implications of the high occurrence rate of seropositivity on
students’ health are not yet known. None of the students reported
to have had Q fever. Q fever has a wide variety of non-specific
symptoms and is often asymptomatic, so it is difficult to collect
relevant information with a questionnaire over an extended period
of time [2,3]. Poor recall might also have contributed to the low
reported prevalence for Q fever. Furthermore the questionnaire
was primarily based on the European Community Respiratory
Health Survey questionnaire, and was not specifically directed to
identify acute Q fever symptoms [32]. On the other hand, a high
prevalence of self reported Q fever was not expected as as
approximately 60% of Q fever infections are considered to be
asymptomatic [4]. Both symptomatic and asymptomatic Q fever
has been described to develop into chronic Q fever, although most
information is available from symptomatic acute Q fever patients
[3].Therefore research is needed to explore the risk for
asymptomatic seroconverters of development into chronic Q fever.
This study raises the question whether specific measures have to
be taken in this population to prevent development of C. burnetiiinfection. General protective measures may not be sufficient to
protect students throughout their career. Therefore offering
vaccination may be considered, like in Australia for personnel
with high risk occupations [33], or yearly serological screenings as
suggested for wool workers [34]. Moreover, in general, awareness
about study related health risks should be strengthened. Knowl-
Figure 2. Association between C. burnetii seropositivity and number of years lived on a farm (p=0.028, spline 2 d.f p=0.586) forstudents who ever lived on a farm (n=100). Open circles represent the 95% upper and lower confidence limits.
C. burnetii Serology Veterinary Students
PLoS ONE | www.plosone.org 7 February 2012 | Volume 7 | Issue 2 | e32108
edge regarding clinical symptoms of Q fever can improve referral
to the occupational physician affiliated to the university and
prevent development of chronic stages of disease.
To conclude, this is the first large-scale study that examined the
seroprevalence for C. burnetii among veterinary medicine students
across all study phases. It demonstrates a considerable C. burnetiiseroprevalence among veterinary medicine students. Besides
regular contact to ruminants outside the curriculum program,
also study related factors were associated with seropositivity. This
suggests the importance of Q fever as an occupational risk for
veterinary medicine students. Interestingly, we demonstrated a
log-linear relationship between the numbers of years lived on a
farm and seropositivity. Since clinical Q fever illness was not self-
reported further research is recommended to study the health
implications of seropositivity. Overall, this study contributes to the
knowledge and the awareness of Q fever as a risk for veterinary
students in order to contribute to its prevention.
Acknowledgments
We are grateful to all participants without whom the study could not be
conducted. We would like to thank Jamie Meekelenkamp of the Jeroen
Bosch Hospital for the laboratory analyses. We also thank the dean of the
Veterinary Medicine faculty and the department of student affairs for their
cooperation when performing the study. Lot Bannink is acknowledged for
coordinating the inclusion of the students.
Author Contributions
Conceived and designed the experiments: DH BRB IMW. Performed the
experiments: MMTR BS BV PS WH IMW. Analyzed the data: MMTR
IMW. Contributed reagents/materials/analysis tools: MMTR DH BS PS
WH IMW. Wrote the paper: MMTR IW. Reviewed and commented on
the manuscript: MMTR BS BV PS BRB DH WH IMW.
References
1. Madariaga MG, Rezai K, Trenholme GM, Weinstein RA (2003) Q fever: Abiological weapon in your backyard. Lancet Infect Dis 3: 709–721.
2. Raoult D, Marrie TJ, Mege JL (2005) Natural history and pathophysiology of Q
fever. Lancet Infect Dis 5: 219–226.
3. Parker NR, Barralet JH, Bell AM (2006) Q fever. Lancet 367: 679–688.
4. Maurin M, Raoult D (1999) Q fever. Clin Microbiol Rev 12: 518–553.
5. Sukocheva OA, Marmion BP, Storm PA, Lockhart M, Turra M, et al. (2010)
Long-term persistence after acute Q fever of non-infective Coxiella burnetii cellcomponents, including antigens. QJM 103: 847–863.
6. McQuiston JH, Childs JE (2002) Q fever in humans and animals in the UnitedStates. Vector Borne Zoonotic Dis 2: 179–191.
7. Woldehiwet Z (2004) Q fever (coxiellosis): Epidemiology and pathogenesis. Res
Vet Sci 77: 93–100.
8. Heinzen RA, Hackstadt T, Samuel JE (1999) Developmental biology of Coxiella
burnetii. Trends Microbiol 7: 149–154.
9. Dupont HT, Thirion X, Raoult D (1994) Q fever serology: Cutoff determination
for microimmunofluorescence. Clin Diagn Lab Immunol 1: 189–196.
10. van der Hoek W, Meekelenkamp JC, Leenders AC, Wijers N, Notermans DW,
et al. (2011) Antibodies against Coxiella burnetii and pregnancy outcome duringthe 2007–2008 Q fever outbreaks in the Netherlands. BMC Infect Dis 11: 44.
11. Schimmer B, Notermans DW, Harms MG, Reimerink JH, Bakker J, et al. (2012)Low seroprevalence of Q fever in the Netherlands prior to a series of large
outbreaks. Epidemiol Infect Jan;140(1): 27–35. Epub 2011 Feb 16.
12. van Duynhoven Y, Schimmer B, van Steenbergen J, van der Hoek W.The story
of human Q-fever in the Netherlands [Internet]. Netherlands: Ministry ofEconomic Affairs, Agriculture and Innovation. Available at http://english.
minlnv.nl. Accessed 1 July 2011.
13. Whitney EA, Massung RF, Candee AJ, Ailes EC, Myers LM, et al. (2009)
Seroepidemiologic and occupational risk survey for Coxiella burnetii antibodies
among US veterinarians. Clin Infect Dis 48: 550–557.
Table 5. Factors associated with Coxiella burnetii seropositivity obtained by multivariate analysis for all students and stratified byever lived on a farm.
All Ever lived on a farm
OR (95% CI) Yes (OR (95% CI)) No (OR (95% CI))
Study direction
Farm animal health 3.27 (2.14–5.02) 4.86 (1.54–15.29) 3.32 (2.06–5.35)
Other direction 1.00 1.00 1.00
Study phase
Phase 3 (Year 6) 2.31 (1.22–4.39) 0.43 (0.07–2.66) 3.16 (1.55–6.46)
Phase 2 (Year 3–5) 1.83 (1.07–3.10) 1.34 (0.46–3.94) 2.03 (1.09–3.79)
Phase 1 (Year 1–2) 1.00 1.00 1.00
Zoonotic disease during VMa
Yes 1.74 (1.07–2.82) 7.23 (1.74–30.09) 1.34 (0.78–2.34)
No 1.00 1.00 1.00
Ever lived on ruminant farm
Yes 2.73 (1.59–4.67) - -
No 1.00 - -
Childhood municipality
Village - 0.53 (0.18–1.52) 1.53 (0.89–2.62)
City - - 2.18 (1.15–4.14)
Town 1.00 1.00
Note. Multivariate analysis for all students obtained with Forward and Backward logistic regression.Stratified analysis obtained with Enter.aVM, veterinary medicine.
C. burnetii Serology Veterinary Students
PLoS ONE | www.plosone.org 8 February 2012 | Volume 7 | Issue 2 | e32108

188 | CHAPTER 5.2
14. Dorko E, Kalinova Z, Weissova T, Pilipcinec E (2008) Seroprevalence of
antibodies to Coxiella burnetii among employees of the veterinary university inKosice, eastern Slovakia. Ann Agric Environ Med 15: 119–124.
15. Schnurrenberger PR, Helwig JH, Bashe WJ, Jr. (1964) The incidence of
zoonotic infections in veterinary students. J Am Vet Med Assoc 144: 384–386.16. Valencia MC, Rodriguez CO, Punet OG, de Blas Giral I (2000) Q fever
seroprevalence and associated risk factors among students from the veterinaryschool of Zaragoza, Spain. Eur J Epidemiol 16: 469–476.
17. Riemann HP, Brant PC, Franti CE, Reis R, Buchanan AM, et al. (1974)
Antibodies to Toxoplasma gondii and Coxiella burneti among students andother personnel in veterinary colleges in California and Brazil. Am J Epidemiol
100: 197–208.18. Samadi S, Spithoven J, Jamshidifard AR, Berends BR, Lipman L, et al. (2012)
Allergy among veterinary medicine students in the Netherlands. Occup EnvironMed 69: 48–55. Published Online First: 31 May 2011.
19. Marrie TJ, Pollak PT (1995) Seroepidemiology of Q fever in nova scotia:
Evidence for age dependent cohorts and geographical distribution.Eur J Epidemiol 11: 47–54.
20. Marrie TJ, Fraser J (1985) Prevalence of antibodies to Coxiella burnetii amongveterinarians and slaughterhouse workers in Nova Scotia. Can Vet J 26:
181–184.
21. Chang CC, Lin PS, Hou MY, Lin CC, Hung MN, et al. (2010) Identification ofrisk factors of Coxiella burnetii (Q fever) infection in veterinary-associated
populations in southern Taiwan. Zoonoses Public Health 57: e95–101.22. Raoult D (2009) Reemergence of Q fever after 11 september 2001. Clin Infect
Dis 48: 558–559.23. Abe T, Yamaki K, Hayakawa T, Fukuda H, Ito Y, et al. (2001) A
seroepidemiological study of the risks of Q fever infection in Japanese
veterinarians. Eur J Epidemiol 17: 1029–1032.24. Blaauw GJ, Notermans DW, Schimmer B, Meekelenkamp J, Reimerink JH, et
al. (2012) The application of an enzyme-linked immunosorbent assay or an
immunofluorescent assay test leads to different estimates of seroprevalence of
Coxiella burnetii in the population. Epidemiol Infect Jan;140(1): 36–41. Epub
2011 Feb 15.
25. Tissot-Dupont H, Amadei MA, Nezri M, Raoult D (2004) Wind in November,
Q fever in December. Emerg Infect Dis 10: 1264–1269.
26. Sanchez J, Souriau A, Buendia AJ, Arricau-Bouvery N, Martinez CM, et al.
(2006) Experimental Coxiella burnetii infection in pregnant goats: A
histopathological and immunohistochemical study. J Comp Pathol 135:
108–115.
27. Hatchette T, Campbell N, Hudson R, Raoult D, Marrie TJ (2003) Natural
history of Q fever in goats. Vector Borne Zoonotic Dis 3: 11–15.
28. Bond R (2010) Superficial veterinary mycoses. Clin Dermatol 28: 226–236.
29. Cascio A, Bosilkovski M, Rodriguez-Morales AJ, Pappas G (2011) The socio-
ecology of zoonotic infections. Clin Microbiol Infect 17: 336–342.
30. National Association of State Public Health Veterinarians, Inc. (NASPHV)
(2011) Compendium of measures to prevent disease associated with animals in
public settings, 2011: National association of state public health veterinarians,
inc. MMWR Recomm Rep 60: 1–24.
31. Whelan J, Schimmer B, Schneeberger P, Meelenkamp J, Ijff A, et al. (2011) Q
fever among culling workers, the Netherlands, 2009–2010. Emerg Infect Dis
17(9): 1719–1723.
32. Burney PG, Luczynska C, Chinn S, Jarvis D (1994) The European community
respiratory health survey. Eur Respir J 7: 954–960.
33. Tozer SJ, Lambert SB, Sloots TP, Nissen MD (2011) Q fever seroprevalence in
metropolitan samples is similar to rural/remote samples in Queensland,
Australia. Eur J Clin Microbiol Infect Dis Oct;30(10): 1287–93.
34. Wattiau P, Boldisova E, Toman R, Van Esbroeck M, Quoilin S, et al. (2011) Q
fever in woolsorters, Belgium [letter]. Emerg Infect Dis Dec: [Epub ahead of
print].
C. burnetii Serology Veterinary Students
PLoS ONE | www.plosone.org 9 February 2012 | Volume 7 | Issue 2 | e32108

CHAPTER 5.3
Q fever among culling workers,The Netherlands, 2009-2010
J. WhelanB. Schimmer
P. SchneebergerJ. Meekelenkamp
A. IJffW. van der Hoek
M. Robert-Du Ry van Beest Holle
Emerg Infect Dis. 2011 Sep;17(9):1719-23

CHAPTER 5.3
Q fever among culling workers,The Netherlands, 2009-2010
J. WhelanB. Schimmer
P. SchneebergerJ. Meekelenkamp
A. IJffW. van der Hoek
M. Robert-Du Ry van Beest Holle
Emerg Infect Dis. 2011 Sep;17(9):1719-23

Time-course of antibody responses against Coxiella burnetiifollowing acute Q fever
P. F. M. TEUNIS 1,2*, B. SCHIMMER 1, D. W. NOTERMANS3,
A. C. A. P. LEENDERS 4, P. C. WEVER 4, M. E. E. KRETZSCHMAR1,5
AND P. M. SCHNEEBERGER 4
1 Centre for Infectious Disease Control, Epidemiology and Surveillance Unit, RIVM, Bilthoven, The Netherlands2 Hubert Department of Global Health, Rollins School of Public Health, Emory University, Atlanta, GA, USA3 Centre for Infectious Disease Control, Laboratory for Infectious Diseases and Perinatal Screening, RIVM,Bilthoven, The Netherlands4 Jeroen Bosch Hospital, Department of Medical Microbiology and Infection Control,’s- Hertogenbosch, TheNetherlands5 Julius Centre for Health Sciences and Primary Care, University Medical Centre Utrecht, Utrecht, The
Netherlands
Received 11 October 2011; Final revision 15 February 2012; Accepted 15 February 2012;
first published online 4 April 2012
SUMMARY
Large outbreaks of Q fever in The Netherlands have provided a unique opportunity for studying
longitudinal serum antibody responses in patients. Results are presented of a cohort of 344
patients with acute symptoms of Q fever with three or more serum samples per patient. In all
these serum samples IgM and IgG against phase 1 and 2 Coxiella burnetii were measured by an
immunofluorescence assay. A mathematical model of the dynamic interaction of serum antibodies
and pathogens was used in a mixed model framework to quantitatively analyse responses to
C. burnetii infection. Responses show strong heterogeneity, with individual serum antibody
responses widely different in magnitude and shape. Features of the response, peak titre and decay
rate, are used to characterize the diversity of the observed responses. Binary mixture analysis of
IgG peak levels (phases 1 and 2) reveals a class of patients with high IgG peak titres that decay
slowly and may represent potential chronic cases. When combining the results of mixture analysis
into an odds score, it is concluded that not only high IgG phase 1 may be predictive for chronic
Q fever, but also that high IgG phase 2 may aid in detecting such putative chronic cases.
Key words: Coxiella, mathematical modelling, Q fever, serology, statistics.
INTRODUCTION
Since mid-2007 human cases of Q fever in The
Netherlands have increased sharply, with major out-
breaks in 2008 and 2009, reaching a total of about
4000 cases by 2010 [1–4]. Cases were predominantly
clustered in the south of The Netherlands [3] and the
majority of the laboratory samples were submitted
to one regional hospital : the Jeroen Bosch Hospital
in ’s-Hertogenbosch (about 2000 confirmed acute
Q fever cases). Follow-up of cases extended over a
period of up to 24 months. In the 3 years that this
outbreak persisted, laboratory results from over 2000
cases were collected in a laboratory database. This
* Author for correspondence : Professor P. F. M. Teunis, Centrefor Infectious Disease Control, Epidemiology and SurveillanceUnit, RIVM, PO Box 1, 3720BA Bilthoven, The Netherlands.(Email : [email protected])
Epidemiol. Infect. (2013), 141, 62–73. f Cambridge University Press 2012
doi:10.1017/S0950268812000404Time-course of antibody responses against Coxiella burnetiifollowing acute Q fever
P. F. M. TEUNIS 1,2*, B. SCHIMMER 1, D. W. NOTERMANS3,
A. C. A. P. LEENDERS 4, P. C. WEVER 4, M. E. E. KRETZSCHMAR1,5
AND P. M. SCHNEEBERGER 4
1 Centre for Infectious Disease Control, Epidemiology and Surveillance Unit, RIVM, Bilthoven, The Netherlands2 Hubert Department of Global Health, Rollins School of Public Health, Emory University, Atlanta, GA, USA3 Centre for Infectious Disease Control, Laboratory for Infectious Diseases and Perinatal Screening, RIVM,Bilthoven, The Netherlands4 Jeroen Bosch Hospital, Department of Medical Microbiology and Infection Control,’s- Hertogenbosch, TheNetherlands5 Julius Centre for Health Sciences and Primary Care, University Medical Centre Utrecht, Utrecht, The
Netherlands
Received 11 October 2011; Final revision 15 February 2012; Accepted 15 February 2012;
first published online 4 April 2012
SUMMARY
Large outbreaks of Q fever in The Netherlands have provided a unique opportunity for studying
longitudinal serum antibody responses in patients. Results are presented of a cohort of 344
patients with acute symptoms of Q fever with three or more serum samples per patient. In all
these serum samples IgM and IgG against phase 1 and 2 Coxiella burnetii were measured by an
immunofluorescence assay. A mathematical model of the dynamic interaction of serum antibodies
and pathogens was used in a mixed model framework to quantitatively analyse responses to
C. burnetii infection. Responses show strong heterogeneity, with individual serum antibody
responses widely different in magnitude and shape. Features of the response, peak titre and decay
rate, are used to characterize the diversity of the observed responses. Binary mixture analysis of
IgG peak levels (phases 1 and 2) reveals a class of patients with high IgG peak titres that decay
slowly and may represent potential chronic cases. When combining the results of mixture analysis
into an odds score, it is concluded that not only high IgG phase 1 may be predictive for chronic
Q fever, but also that high IgG phase 2 may aid in detecting such putative chronic cases.
Key words: Coxiella, mathematical modelling, Q fever, serology, statistics.
INTRODUCTION
Since mid-2007 human cases of Q fever in The
Netherlands have increased sharply, with major out-
breaks in 2008 and 2009, reaching a total of about
4000 cases by 2010 [1–4]. Cases were predominantly
clustered in the south of The Netherlands [3] and the
majority of the laboratory samples were submitted
to one regional hospital : the Jeroen Bosch Hospital
in ’s-Hertogenbosch (about 2000 confirmed acute
Q fever cases). Follow-up of cases extended over a
period of up to 24 months. In the 3 years that this
outbreak persisted, laboratory results from over 2000
cases were collected in a laboratory database. This
* Author for correspondence : Professor P. F. M. Teunis, Centrefor Infectious Disease Control, Epidemiology and SurveillanceUnit, RIVM, PO Box 1, 3720BA Bilthoven, The Netherlands.(Email : [email protected])
Epidemiol. Infect. (2013), 141, 62–73. f Cambridge University Press 2012
doi:10.1017/S0950268812000404
Q Fever among Culling Workers, the Netherlands,
2009–2010Jane Whelan, Barbara Schimmer,
Peter Schneeberger, Jamie Meekelenkamp, Arnold IJff, Wim van der Hoek,
and Mirna Robert–Du Ry van Beest Holle
In 2009, dairy goat farms in the Netherlands were implicated in >2,300 cases of Q fever; in response, 51,820 small ruminants were culled. Among 517 culling workers, despite use of personal protective equipment, 17.5% seroconverted for antibodies to Coxiella burnetii.Vaccination of culling workers could be considered.
Q fever is caused by the bacterium Coxiella burnetii. Since 2007 in the Netherlands, annual outbreaks
originating from dairy goat and sheep farms have occurred. In 2009, a total of 2,354 cases in humans were reported, 20% of patients were hospitalized, and at least 6 died (1). Among acute cases, ≈2% become chronic, and fatality rates for untreated chronic patients are high (2). To stop spread, culling was conducted from December 19, 2009, through June 22, 2010, on 87 infected commercial dairy goat farms and 2 dairy sheep farms (Figure 1). A total of 50,355 pregnant goats and sheep and 1,465 bucks were culled (3). Animal pregnancies were con rmed by abdominal ultrasound; pregnant animals were sedated and euthanized, and their corpses were transported to a destruction facility. Culling workers were provided with personal protective equipment (PPE) and advised to read occupational health and hygiene regulations (4). To determine seropositivity of workers before culling, incidence of symptomatic and asymptomatic C. burnetii infection during culling, and risk factors associated with occupational exposure, we conducted a prospective cohort study.
The StudyParticipants were 517 workers who culled goats
and sheep during December 2009–June 2010. Serum samples were required from workers before employment in December 2009 (pre-cull) (4), and voluntary post-cullsamples were requested in June 2010. In June, workers were asked to complete a questionnaire about symptoms, occupational exposure, adoption of hygiene measures and PPE use ( ltering facepiece masks, gloves, overalls, hairnets), demographics, medical history, and other animal contact. Written informed consent was obtained. Information about farms (animal numbers and abortions) and workers (hours worked per person, job description) was available from occupational records.
Serum was tested for immunoglobulin (Ig) G and IgM against C. burnetii phase II by using ELISA (Virion/Serion, Würzburg, Germany). According to manufacturer instructions, IgG phase II seropositivity was de ned as negative for titers <30 IU/mL and positive for titers >30 IU/mL. IgM phase II was qualitatively positive or negative. A worker was considered seronegative if a phase II sample was IgM and IgG negative and seropositive if IgM and/
Emerging Infectious Diseases • www.cdc.gov/eid • Vol. 17, No. 9, September 2011 1719
Author affi liations: National Institute for Public Health and the Environment, Bilthoven, the Netherlands (J. Whelan, B. Schimmer, P. Schneeberger, W. van der Hoek, M. Robert–Du Ry van Beest Holle); European Centre for Disease Prevention and Control, Stockholm, Sweden (J. Whelan); Jeroen Bosch Hospital, ‘s-Hertogenbosch, the Netherlands (P. Schneeberger, J. Meekelenkamp); and ArboUnie, Utrecht, the Netherlands (A. IJff)
DOI: http://dx.doi.org/10.3201/eid1709.110051
Figure 1. Residential location of 246 culling workers who were seronegative in December 2009 and their serostatus in June 2010 with location of 89 farms declared to be infected (by PCR-positive bulk-milk monitoring) in 2009 and 2010, the Netherlands. Ig, immunoglobulin. Seroconversion detected by ELISA was confi rmed by immunofl uorescence assay for 40 persons (38 [95%] at titers >128 and 2 [5%] at titers of 32).
Q Fever among Culling Workers, the Netherlands, 2009-2010
J. WHELAN1,2, B. SCHIMMER1, P. SCHNEEBERGER3, J. MEEKELENKAMP3, A. IJFF4, W. VAN DER HOEK1, M. ROBERT-DU RY VAN BEEST HOLLE1
Affiliaties
Chapter 3.2
1Centre for Infectious Disease Control, National Institute for Public Health and the Environment, Bilthoven, the Netherlands 2Municipal Health Service ‘Brabant Zuidoost, Eindhoven, the Netherlands 3Laboratory for Pathology and Medical Microbiology, Veldhoven, the Netherlands 4Region East, Food and Consumer Product Safety Authority, Zutphen, the Netherlands 5Department of Medical Microbiology and Infection Control, Jeroen Bosch Hospital, ‘s Hertogenbosch, the Netherlands 6Department of Small Ruminant Health, Animal Health Service, Deventer, the Netherlands
Chapter 4.1
1 Centre for Infectious Disease Control, National Institute for Public Health and The Environment, Bilthoven, The Netherlands 2 Academic Collaborative Centre AMPHI, Department of Primary and Community Care, Radboud University Nijmegen Medical Centre, Nijmegen, The Netherlands 3 Department of Medical Microbiology and Infection Control, Jeroen Bosch Hospital, ’s-Hertogenbosch, The Netherlands 4 Department of Small Ruminant Health, Animal Health Service, Deventer, The Netherlands
Chapter 4.2 1Centre for Infectious Disease Control, National Institute for Public Health and the Environment, Bilthoven, the Netherlands 2Quantitative Veterinary Epidemiology Group, Wageningen Institute of Animal Sciences, Wageningen, The Netherlands 3Department of Small Ruminant Health, Animal Health Service, Deventer, The Netherlands 4Academic Collaborative Centre AMPHI, Department of Primary and Community Care, Radboud University Nijmegen Medical Centre, the Netherlands
Chapter 4.4 1Centre for Infectious Disease Control, National Institute for Public Health and the Environment, Bilthoven, the Netherlands 2 Academic Collaborative Centre AMPHI, Department of Primary and Community Care, Radboud University Nijmegen Medical Centre, Nijmegen, the Netherlands 3Department of Small Ruminant Health, Animal Health Service, Deventer, The Netherlands
Chapter 4.5 1 National Institute for Public Health and the Environment (RIVM), Bilthoven, the Netherlands 2 Animal Health Service,Deventer, the Netherlands 3 Radboud University Nijmegen Medical Centre, Nijmegen, the Netherlands 4. Jeroen Bosch Hospital, ‘s-Hertogenbosch, the Netherlands Chapter 4.6 1 GD Animal Health, Deventer, The Netherlands 2 Centre for Infectious Disease Control, National Institute for Public Health and the Environment, Bilthoven, the Netherlands 3 Department of Primary and Community Care, Academic Collaborative Centre for Public Health (AMPHI), Radboud University Nijmegen Medical Centre, Nijmegen, The Netherlands
Chapter 5.1 1 Department of Small Ruminant Health, Animal Health Service, Deventer, The Netherlands 2 Centre for Infectious Disease Control, National Institute for Public Health and the Environment, Bilthoven, The Netherlands 3 Department of Medical Microbiology and Infection Control, Jeroen Bosch Hospital, ‘s-Hertogenbosch, The Netherlands, 4 Department of Diagnostics, Research and Epidemiology, Animal Health Service, Deventer, The Netherlands
Chapter 5.2
1 Division of Environmental Epidemiology, Institute for Risk Assessment Sciences, Utrecht, the Netherlands 2 Centre for Infectious Disease Control, National Institute for Public Health and the Environment, Bilthoven, the Netherlands, 3 Department of Medical Microbiology and Infection Control, Jeroen Bosch Hospital, ‘s-Hertogenbosch, the Netherlands, 4 Division of Veterinary Public Health, Institute for Risk Assessment Sciences, Utrecht, the Netherlands
Chapter 5.3 1.National Institute for Public Health and the Environment, Bilthoven, the Netherlands 2 European Centre for Disease Prevention and Control, Stockholm, Sweden 3 Jeroen Bosch Hospital, ‘s-Hertogenbosch, the Netherlands 4 ArboUnie, Utrecht, the Netherlands
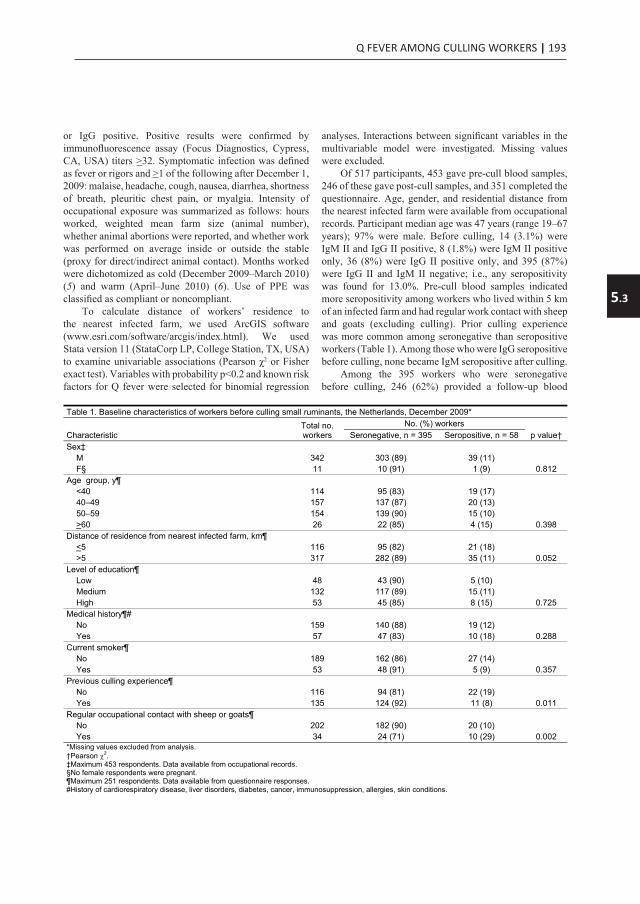
Q FEVER AMONG CULLING WORKERS | 193
5.3
Time-course of antibody responses against Coxiella burnetiifollowing acute Q fever
P. F. M. TEUNIS 1,2*, B. SCHIMMER 1, D. W. NOTERMANS3,
A. C. A. P. LEENDERS 4, P. C. WEVER 4, M. E. E. KRETZSCHMAR1,5
AND P. M. SCHNEEBERGER 4
1 Centre for Infectious Disease Control, Epidemiology and Surveillance Unit, RIVM, Bilthoven, The Netherlands2 Hubert Department of Global Health, Rollins School of Public Health, Emory University, Atlanta, GA, USA3 Centre for Infectious Disease Control, Laboratory for Infectious Diseases and Perinatal Screening, RIVM,Bilthoven, The Netherlands4 Jeroen Bosch Hospital, Department of Medical Microbiology and Infection Control,’s- Hertogenbosch, TheNetherlands5 Julius Centre for Health Sciences and Primary Care, University Medical Centre Utrecht, Utrecht, The
Netherlands
Received 11 October 2011; Final revision 15 February 2012; Accepted 15 February 2012;
first published online 4 April 2012
SUMMARY
Large outbreaks of Q fever in The Netherlands have provided a unique opportunity for studying
longitudinal serum antibody responses in patients. Results are presented of a cohort of 344
patients with acute symptoms of Q fever with three or more serum samples per patient. In all
these serum samples IgM and IgG against phase 1 and 2 Coxiella burnetii were measured by an
immunofluorescence assay. A mathematical model of the dynamic interaction of serum antibodies
and pathogens was used in a mixed model framework to quantitatively analyse responses to
C. burnetii infection. Responses show strong heterogeneity, with individual serum antibody
responses widely different in magnitude and shape. Features of the response, peak titre and decay
rate, are used to characterize the diversity of the observed responses. Binary mixture analysis of
IgG peak levels (phases 1 and 2) reveals a class of patients with high IgG peak titres that decay
slowly and may represent potential chronic cases. When combining the results of mixture analysis
into an odds score, it is concluded that not only high IgG phase 1 may be predictive for chronic
Q fever, but also that high IgG phase 2 may aid in detecting such putative chronic cases.
Key words: Coxiella, mathematical modelling, Q fever, serology, statistics.
INTRODUCTION
Since mid-2007 human cases of Q fever in The
Netherlands have increased sharply, with major out-
breaks in 2008 and 2009, reaching a total of about
4000 cases by 2010 [1–4]. Cases were predominantly
clustered in the south of The Netherlands [3] and the
majority of the laboratory samples were submitted
to one regional hospital : the Jeroen Bosch Hospital
in ’s-Hertogenbosch (about 2000 confirmed acute
Q fever cases). Follow-up of cases extended over a
period of up to 24 months. In the 3 years that this
outbreak persisted, laboratory results from over 2000
cases were collected in a laboratory database. This
* Author for correspondence : Professor P. F. M. Teunis, Centrefor Infectious Disease Control, Epidemiology and SurveillanceUnit, RIVM, PO Box 1, 3720BA Bilthoven, The Netherlands.(Email : [email protected])
Epidemiol. Infect. (2013), 141, 62–73. f Cambridge University Press 2012
doi:10.1017/S0950268812000404Time-course of antibody responses against Coxiella burnetiifollowing acute Q fever
P. F. M. TEUNIS 1,2*, B. SCHIMMER 1, D. W. NOTERMANS3,
A. C. A. P. LEENDERS 4, P. C. WEVER 4, M. E. E. KRETZSCHMAR1,5
AND P. M. SCHNEEBERGER 4
1 Centre for Infectious Disease Control, Epidemiology and Surveillance Unit, RIVM, Bilthoven, The Netherlands2 Hubert Department of Global Health, Rollins School of Public Health, Emory University, Atlanta, GA, USA3 Centre for Infectious Disease Control, Laboratory for Infectious Diseases and Perinatal Screening, RIVM,Bilthoven, The Netherlands4 Jeroen Bosch Hospital, Department of Medical Microbiology and Infection Control,’s- Hertogenbosch, TheNetherlands5 Julius Centre for Health Sciences and Primary Care, University Medical Centre Utrecht, Utrecht, The
Netherlands
Received 11 October 2011; Final revision 15 February 2012; Accepted 15 February 2012;
first published online 4 April 2012
SUMMARY
Large outbreaks of Q fever in The Netherlands have provided a unique opportunity for studying
longitudinal serum antibody responses in patients. Results are presented of a cohort of 344
patients with acute symptoms of Q fever with three or more serum samples per patient. In all
these serum samples IgM and IgG against phase 1 and 2 Coxiella burnetii were measured by an
immunofluorescence assay. A mathematical model of the dynamic interaction of serum antibodies
and pathogens was used in a mixed model framework to quantitatively analyse responses to
C. burnetii infection. Responses show strong heterogeneity, with individual serum antibody
responses widely different in magnitude and shape. Features of the response, peak titre and decay
rate, are used to characterize the diversity of the observed responses. Binary mixture analysis of
IgG peak levels (phases 1 and 2) reveals a class of patients with high IgG peak titres that decay
slowly and may represent potential chronic cases. When combining the results of mixture analysis
into an odds score, it is concluded that not only high IgG phase 1 may be predictive for chronic
Q fever, but also that high IgG phase 2 may aid in detecting such putative chronic cases.
Key words: Coxiella, mathematical modelling, Q fever, serology, statistics.
INTRODUCTION
Since mid-2007 human cases of Q fever in The
Netherlands have increased sharply, with major out-
breaks in 2008 and 2009, reaching a total of about
4000 cases by 2010 [1–4]. Cases were predominantly
clustered in the south of The Netherlands [3] and the
majority of the laboratory samples were submitted
to one regional hospital : the Jeroen Bosch Hospital
in ’s-Hertogenbosch (about 2000 confirmed acute
Q fever cases). Follow-up of cases extended over a
period of up to 24 months. In the 3 years that this
outbreak persisted, laboratory results from over 2000
cases were collected in a laboratory database. This
* Author for correspondence : Professor P. F. M. Teunis, Centrefor Infectious Disease Control, Epidemiology and SurveillanceUnit, RIVM, PO Box 1, 3720BA Bilthoven, The Netherlands.(Email : [email protected])
Epidemiol. Infect. (2013), 141, 62–73. f Cambridge University Press 2012
doi:10.1017/S0950268812000404
Q Fever among Culling Workers, the Netherlands,
2009–2010Jane Whelan, Barbara Schimmer,
Peter Schneeberger, Jamie Meekelenkamp, Arnold IJff, Wim van der Hoek,
and Mirna Robert–Du Ry van Beest Holle
In 2009, dairy goat farms in the Netherlands were implicated in >2,300 cases of Q fever; in response, 51,820 small ruminants were culled. Among 517 culling workers, despite use of personal protective equipment, 17.5% seroconverted for antibodies to Coxiella burnetii.Vaccination of culling workers could be considered.
Q fever is caused by the bacterium Coxiella burnetii. Since 2007 in the Netherlands, annual outbreaks
originating from dairy goat and sheep farms have occurred. In 2009, a total of 2,354 cases in humans were reported, 20% of patients were hospitalized, and at least 6 died (1). Among acute cases, ≈2% become chronic, and fatality rates for untreated chronic patients are high (2). To stop spread, culling was conducted from December 19, 2009, through June 22, 2010, on 87 infected commercial dairy goat farms and 2 dairy sheep farms (Figure 1). A total of 50,355 pregnant goats and sheep and 1,465 bucks were culled (3). Animal pregnancies were con rmed by abdominal ultrasound; pregnant animals were sedated and euthanized, and their corpses were transported to a destruction facility. Culling workers were provided with personal protective equipment (PPE) and advised to read occupational health and hygiene regulations (4). To determine seropositivity of workers before culling, incidence of symptomatic and asymptomatic C. burnetii infection during culling, and risk factors associated with occupational exposure, we conducted a prospective cohort study.
The StudyParticipants were 517 workers who culled goats
and sheep during December 2009–June 2010. Serum samples were required from workers before employment in December 2009 (pre-cull) (4), and voluntary post-cullsamples were requested in June 2010. In June, workers were asked to complete a questionnaire about symptoms, occupational exposure, adoption of hygiene measures and PPE use ( ltering facepiece masks, gloves, overalls, hairnets), demographics, medical history, and other animal contact. Written informed consent was obtained. Information about farms (animal numbers and abortions) and workers (hours worked per person, job description) was available from occupational records.
Serum was tested for immunoglobulin (Ig) G and IgM against C. burnetii phase II by using ELISA (Virion/Serion, Würzburg, Germany). According to manufacturer instructions, IgG phase II seropositivity was de ned as negative for titers <30 IU/mL and positive for titers >30 IU/mL. IgM phase II was qualitatively positive or negative. A worker was considered seronegative if a phase II sample was IgM and IgG negative and seropositive if IgM and/
Emerging Infectious Diseases • www.cdc.gov/eid • Vol. 17, No. 9, September 2011 1719
Author affi liations: National Institute for Public Health and the Environment, Bilthoven, the Netherlands (J. Whelan, B. Schimmer, P. Schneeberger, W. van der Hoek, M. Robert–Du Ry van Beest Holle); European Centre for Disease Prevention and Control, Stockholm, Sweden (J. Whelan); Jeroen Bosch Hospital, ‘s-Hertogenbosch, the Netherlands (P. Schneeberger, J. Meekelenkamp); and ArboUnie, Utrecht, the Netherlands (A. IJff)
DOI: http://dx.doi.org/10.3201/eid1709.110051
Figure 1. Residential location of 246 culling workers who were seronegative in December 2009 and their serostatus in June 2010 with location of 89 farms declared to be infected (by PCR-positive bulk-milk monitoring) in 2009 and 2010, the Netherlands. Ig, immunoglobulin. Seroconversion detected by ELISA was confi rmed by immunofl uorescence assay for 40 persons (38 [95%] at titers >128 and 2 [5%] at titers of 32).
Q Fever among Culling Workers, the Netherlands,
2009–2010Jane Whelan, Barbara Schimmer,
Peter Schneeberger, Jamie Meekelenkamp, Arnold IJff, Wim van der Hoek,
and Mirna Robert–Du Ry van Beest Holle
In 2009, dairy goat farms in the Netherlands were implicated in >2,300 cases of Q fever; in response, 51,820 small ruminants were culled. Among 517 culling workers, despite use of personal protective equipment, 17.5% seroconverted for antibodies to Coxiella burnetii.Vaccination of culling workers could be considered.
Q fever is caused by the bacterium Coxiella burnetii. Since 2007 in the Netherlands, annual outbreaks
originating from dairy goat and sheep farms have occurred. In 2009, a total of 2,354 cases in humans were reported, 20% of patients were hospitalized, and at least 6 died (1). Among acute cases, ≈2% become chronic, and fatality rates for untreated chronic patients are high (2). To stop spread, culling was conducted from December 19, 2009, through June 22, 2010, on 87 infected commercial dairy goat farms and 2 dairy sheep farms (Figure 1). A total of 50,355 pregnant goats and sheep and 1,465 bucks were culled (3). Animal pregnancies were con rmed by abdominal ultrasound; pregnant animals were sedated and euthanized, and their corpses were transported to a destruction facility. Culling workers were provided with personal protective equipment (PPE) and advised to read occupational health and hygiene regulations (4). To determine seropositivity of workers before culling, incidence of symptomatic and asymptomatic C. burnetii infection during culling, and risk factors associated with occupational exposure, we conducted a prospective cohort study.
The StudyParticipants were 517 workers who culled goats
and sheep during December 2009–June 2010. Serum samples were required from workers before employment in December 2009 (pre-cull) (4), and voluntary post-cullsamples were requested in June 2010. In June, workers were asked to complete a questionnaire about symptoms, occupational exposure, adoption of hygiene measures and PPE use ( ltering facepiece masks, gloves, overalls, hairnets), demographics, medical history, and other animal contact. Written informed consent was obtained. Information about farms (animal numbers and abortions) and workers (hours worked per person, job description) was available from occupational records.
Serum was tested for immunoglobulin (Ig) G and IgM against C. burnetii phase II by using ELISA (Virion/Serion, Würzburg, Germany). According to manufacturer instructions, IgG phase II seropositivity was de ned as negative for titers <30 IU/mL and positive for titers >30 IU/mL. IgM phase II was qualitatively positive or negative. A worker was considered seronegative if a phase II sample was IgM and IgG negative and seropositive if IgM and/
Emerging Infectious Diseases • www.cdc.gov/eid • Vol. 17, No. 9, September 2011 1719
Author affi liations: National Institute for Public Health and the Environment, Bilthoven, the Netherlands (J. Whelan, B. Schimmer, P. Schneeberger, W. van der Hoek, M. Robert–Du Ry van Beest Holle); European Centre for Disease Prevention and Control, Stockholm, Sweden (J. Whelan); Jeroen Bosch Hospital, ‘s-Hertogenbosch, the Netherlands (P. Schneeberger, J. Meekelenkamp); and ArboUnie, Utrecht, the Netherlands (A. IJff)
DOI: http://dx.doi.org/10.3201/eid1709.110051
Figure 1. Residential location of 246 culling workers who were seronegative in December 2009 and their serostatus in June 2010 with location of 89 farms declared to be infected (by PCR-positive bulk-milk monitoring) in 2009 and 2010, the Netherlands. Ig, immunoglobulin. Seroconversion detected by ELISA was confi rmed by immunofl uorescence assay for 40 persons (38 [95%] at titers >128 and 2 [5%] at titers of 32).
Affiliaties
Chapter 3.2
1Centre for Infectious Disease Control, National Institute for Public Health and the Environment, Bilthoven, the Netherlands 2Municipal Health Service ‘Brabant Zuidoost, Eindhoven, the Netherlands 3Laboratory for Pathology and Medical Microbiology, Veldhoven, the Netherlands 4Region East, Food and Consumer Product Safety Authority, Zutphen, the Netherlands 5Department of Medical Microbiology and Infection Control, Jeroen Bosch Hospital, ‘s Hertogenbosch, the Netherlands 6Department of Small Ruminant Health, Animal Health Service, Deventer, the Netherlands
Chapter 4.1
1 Centre for Infectious Disease Control, National Institute for Public Health and The Environment, Bilthoven, The Netherlands 2 Academic Collaborative Centre AMPHI, Department of Primary and Community Care, Radboud University Nijmegen Medical Centre, Nijmegen, The Netherlands 3 Department of Medical Microbiology and Infection Control, Jeroen Bosch Hospital, ’s-Hertogenbosch, The Netherlands 4 Department of Small Ruminant Health, Animal Health Service, Deventer, The Netherlands
Chapter 4.2 1Centre for Infectious Disease Control, National Institute for Public Health and the Environment, Bilthoven, the Netherlands 2Quantitative Veterinary Epidemiology Group, Wageningen Institute of Animal Sciences, Wageningen, The Netherlands 3Department of Small Ruminant Health, Animal Health Service, Deventer, The Netherlands 4Academic Collaborative Centre AMPHI, Department of Primary and Community Care, Radboud University Nijmegen Medical Centre, the Netherlands
Chapter 4.4 1Centre for Infectious Disease Control, National Institute for Public Health and the Environment, Bilthoven, the Netherlands 2 Academic Collaborative Centre AMPHI, Department of Primary and Community Care, Radboud University Nijmegen Medical Centre, Nijmegen, the Netherlands 3Department of Small Ruminant Health, Animal Health Service, Deventer, The Netherlands
Chapter 4.5 1 National Institute for Public Health and the Environment (RIVM), Bilthoven, the Netherlands 2 Animal Health Service,Deventer, the Netherlands 3 Radboud University Nijmegen Medical Centre, Nijmegen, the Netherlands 4. Jeroen Bosch Hospital, ‘s-Hertogenbosch, the Netherlands Chapter 4.6 1 GD Animal Health, Deventer, The Netherlands 2 Centre for Infectious Disease Control, National Institute for Public Health and the Environment, Bilthoven, the Netherlands 3 Department of Primary and Community Care, Academic Collaborative Centre for Public Health (AMPHI), Radboud University Nijmegen Medical Centre, Nijmegen, The Netherlands
Chapter 5.1 1 Department of Small Ruminant Health, Animal Health Service, Deventer, The Netherlands 2 Centre for Infectious Disease Control, National Institute for Public Health and the Environment, Bilthoven, The Netherlands 3 Department of Medical Microbiology and Infection Control, Jeroen Bosch Hospital, ‘s-Hertogenbosch, The Netherlands, 4 Department of Diagnostics, Research and Epidemiology, Animal Health Service, Deventer, The Netherlands
Chapter 5.2
1 Division of Environmental Epidemiology, Institute for Risk Assessment Sciences, Utrecht, the Netherlands 2 Centre for Infectious Disease Control, National Institute for Public Health and the Environment, Bilthoven, the Netherlands, 3 Department of Medical Microbiology and Infection Control, Jeroen Bosch Hospital, ‘s-Hertogenbosch, the Netherlands, 4 Division of Veterinary Public Health, Institute for Risk Assessment Sciences, Utrecht, the Netherlands
Chapter 5.3 1.National Institute for Public Health and the Environment, Bilthoven, the Netherlands 2 European Centre for Disease Prevention and Control, Stockholm, Sweden 3 Jeroen Bosch Hospital, ‘s-Hertogenbosch, the Netherlands 4 ArboUnie, Utrecht, the Netherlands
or IgG positive. Positive results were con rmed by immuno uorescence assay (Focus Diagnostics, Cypress, CA, USA) titers >32. Symptomatic infection was de ned as fever or rigors and >1 of the following after December 1, 2009: malaise, headache, cough, nausea, diarrhea, shortness of breath, pleuritic chest pain, or myalgia. Intensity of occupational exposure was summarized as follows: hours worked, weighted mean farm size (animal number), whether animal abortions were reported, and whether work was performed on average inside or outside the stable (proxy for direct/indirect animal contact). Months worked were dichotomized as cold (December 2009–March 2010) (5) and warm (April–June 2010) (6). Use of PPE was classi ed as compliant or noncompliant.
To calculate distance of workers’ residence to the nearest infected farm, we used ArcGIS software (www.esri.com/software/arcgis/index.html). We usedStata version 11 (StataCorp LP, College Station, TX, USA)to examine univariable associations (Pearson χ2 or Fisher exact test). Variables with probability p<0.2 and known risk factors for Q fever were selected for binomial regression
analyses. Interactions between signi cant variables in the multivariable model were investigated. Missing values were excluded.
Of 517 participants, 453 gave pre-cull blood samples, 246 of these gave post-cull samples, and 351 completed the questionnaire. Age, gender, and residential distance from the nearest infected farm were available from occupational records. Participant median age was 47 years (range 19–67 years); 97% were male. Before culling, 14 (3.1%) were IgM II and IgG II positive, 8 (1.8%) were IgM II positive only, 36 (8%) were IgG II positive only, and 395 (87%) were IgG II and IgM II negative; i.e., any seropositivity was found for 13.0%. Pre-cull blood samples indicated more seropositivity among workers who lived within 5 km of an infected farm and had regular work contact with sheep and goats (excluding culling). Prior culling experience was more common among seronegative than seropositive workers (Table 1). Among those who were IgG seropositive before culling, none became IgM seropositive after culling.
Among the 395 workers who were seronegative before culling, 246 (62%) provided a follow-up blood
DISPATCHES
1720 Emerging Infectious Diseases • www.cdc.gov/eid • Vol. 17, No. 9, September 2011
Table 1. Baseline characteristics of workers before culling small ruminants, the Netherlands, December 2009*
CharacteristicTotal no. workers
No. (%) workers p value† Seronegative, n = 395 Seropositive, n = 58
Sex‡ M 342 303 (89) 39 (11) F§ 11 10 (91) 1 (9) 0.812 Age group, y¶ <40 114 95 (83) 19 (17) 40–49 157 137 (87) 20 (13) 50–59 154 139 (90) 15 (10) >60 26 22 (85) 4 (15) 0.398 Distance of residence from nearest infected farm, km¶
<5 116 95 (82) 21 (18) >5 317 282 (89) 35 (11) 0.052 Level of education¶ Low 48 43 (90) 5 (10) Medium 132 117 (89) 15 (11) High 53 45 (85) 8 (15) 0.725Medical history¶# No 159 140 (88) 19 (12) Yes 57 47 (83) 10 (18) 0.288 Current smoker¶ No 189 162 (86) 27 (14) Yes 53 48 (91) 5 (9) 0.357 Previous culling experience¶ No 116 94 (81) 22 (19) Yes 135 124 (92) 11 (8) 0.011 Regular occupational contact with sheep or goats¶ No 202 182 (90) 20 (10) Yes 34 24 (71) 10 (29) 0.002 *Missing values excluded from analysis. †Pearson 2.‡Maximum 453 respondents. Data available from occupational records. §No female respondents were pregnant. ¶Maximum 251 respondents. Data available from questionnaire responses. #History of cardiorespiratory disease, liver disorders, diabetes, cancer, immunosuppression, allergies, skin conditions.

194 | CHAPTER 5.3
Q Fever among Culling Workers, the Netherlands
sample in June 2010, and 199 (80.8%) of these completed the questionnaire. Those who participated in June were more likely to be male (p = 0.015) and 40–60 years of age (p<0.001). Seroconversion among 246 seronegative
respondents occurred as follows: 23 (9.4%) became IgG and IgM seropositive, 7 (2.9%) became IgM positive only, 13 (5.3%) became IgG positive only, and 203 (82.5%) remained seronegative; i.e., any seroconversion was found
Emerging Infectious Diseases • www.cdc.gov/eid • Vol. 17, No. 9, September 2011 1721
Table 2. Variables associated with Q fever seroconversion among 246 workers who were seronegative before culling small ruminants,the Netherlands, 2009*
VariableNo. (%) workers Univariable analysis Multivariable analysis†
Total Seroconversion RR (95% CI) p value‡ RR (95% CI) p valueTotal 246 (100) 43 (17) Sex F 6 (2) 2 (33) Reference M 240 (98) 41 (17) 0.51 (0.16–1.64) 0.301 Age, y <45 96 (39) 14 (15) Reference >45 150 (61) 29 (19) 1.33 (0.74–2.38) 0.339 2.0 (0.93–4.16) 0.07Level of education Low 39 (21) 5 (13) Reference Medium 103 (55) 18 (17) 1.36 (0.54–3.42) High 44 (24) 8 (18) 1.42 (0.51–3.98) 0.765 Minimum distance of residence from nearest infected farm, km >5 174 (73) 32 (18) Reference <5 63 (27) 9 (14) 0.78 (0.39–1.53) 0.460 Medical history§ No 128 (75) 23 (18) Reference Yes 42 (25) 5 (12) 0.66 (0.27–1.63) 0.358 Current or past smoker No 84 (44) 16 (19) Reference Yes 108 (56) 16 (15) 0.78 (0.41–1.46) 0.435 Total hours worked inside farm perimeter¶ 0–20 81 (33) 5 (6) Reference Reference 21–100 82 (34) 18 (22) 3.56 (1.39–9.12) 5.53 (0.71–42.77) 0.102 >100 80 (33) 20 (25) 4.05 (1.60–10.26) 0.003 7.75 (1.02–58.99) 0.048 Mean farm size >1,500 animals# No 167 (68) 22 (13) Reference Yes 79 (32) 21 (27) 2.02 (1.18–3.44) 0.010 1.75 (0.93–3.30) 0.081 Worked mostly inside stable No 110 (45) 11 (10) Reference Yes 133 (55) 31 (23) 2.33 (1.23–4.42) 0.006 2.58 (1.04–6.37) 0.040 Animal abortions on farm No 208 (85) 33 (16) Reference Yes 38 (15) 10 (26) 1.66 (0.89–3.07) 0.119 0.93 (0.45–1.91) 0.844 Any previous culling experience No 85 (43) 15 (18) Reference Yes 114 (57) 17 (15) 0.84 (0.45–1.59) 0.603 Adherence to hygiene and preventive measures** Fully compliant 91 (50) 13 (14) Reference Not compliant 91 (50) 17 (19) 1.31 (0.68–2.53) 0.424 0.94 (0.51–1.72) 0.829 Months spent culling 2009 Dec–2010 Mar only (mean temperature 3.2°C)
105 (54) 18 (17) Reference
2010 Apr–Jun only (mean temperature 13.9°C)
2 (1) 1 (50) 2.92 (0.69–12.41)
2009 Dec–2010 Jun 87 (45) 21 (24) 1.41 (0.80–2.47) 0.288 *Total for each category may be <246 because of missing data. RR, risk ratio; CI, confidence interval. †All data available for n = 180 in multivariable analysis. ‡Pearson 2.§History of cardiorespiratory disease, liver disorders, diabetes, cancer, immunosuppression, allergies, skin conditions. ¶Data only available for n = 194, those who worked inside the farm perimeter. #Weighted mean number of animals on farms worked by participants. **Includes wearing mask, gloves, overalls, hairnet, showering after exposure.
for 17.5%. Questionnaire respondents who seroconverted had more symptoms after December 1, 2009, (9 [31%] of 29) than nonseroconverters (17 [11%] of 150; relative risk 2.7, 95% con dence interval 1.4–5.5, p = 0.005). Symptomatic seroconverters reported fever and/or rigors and malaise (n = 7), headache (n = 6), cough (n = 6), or myalgia (n = 4). Mean duration of illness was 7.6 (range 1–14) days.
Univariable model indicated signi cance for total hours worked, farm size, and working inside the stable (p<0.05; Table 2). Multivariable model indicated signi cance for working >100 hours on the farm and working inside the stable (Table 2; Figure 2). Interaction effects were not signi cant.
ConclusionsSeroconversion for C. burnetii among 17.5% of culling
workers who were seronegative before culling provides evidence of high-risk work. Before culling, seroprevalence was 13%, similar to that among blood donors in a high-incidence area in the Netherlands in 2009 (H.L. Zaaijer, pers. comm.) and in similar high-risk occupational groups (7). Laboratory testing by using ELISA is an accepted method in an acute setting (8), and positive results (including positive IgM only) were con rmed by immuno uorescence assay. Nonparticipants were in the youngest and oldest age groups; their effect on the proportion of seroconversion is uncertain. Eighteen workers (excluded for not providing
a follow-up blood sample) completed the questionnaire in June. Symptom incidence for these 18 workers was the same as that for included participants.
Symptomatic infection (31% of seroconverters) was probably underestimated. A diagnosis of Q fever was self-reported (uncon rmed) to the occupational health service by 8 workers who did not participate in the study. During December–July 2010, the national infectious disease surveillance system reported 11 culling-related cases of acute Q fever; 2 of these patients were hospitalized.
A strong association was shown between risk for seroconversion and total hours worked on the farms and working inside the stable. In other settings internationally, a risk gradient has also been shown for close direct and indirect animal contact over time (9,10). In our study, half the participants had experience with previous animal epidemics (avian in uenza, foot-and-mouth disease, classical swine fever) and using PPE. Their compliance with PPE was reportedly high; however, a key problem was not wearing PPE while taking work breaks but remaining on the farm.
Given the high risk for infection despite extensive personal protective measures during culling, additional preventive measures are needed. The Health Council of the Netherlands issued guidelines for persons in risk groups who would bene t from vaccination against Q fever (11). Culling workers were not included in these guidelines. The ef cacy of human Q fever vaccine has been shown to be high for young and healthy persons in similar occupational groups (12–14). Vaccination of culling workers could be considered if further animal culling is advised.
AcknowledgmentsWe thank Ben Bom for providing the map and distance
calculations; Daan Notermans, Marianne van der Sande, Ioannis Karagiannis, and Biagio Pedalino for their scienti c input; the culling workers and their af liated organizations for their participation; and the Food and Consumer Product Safety Authority for facilitating this study.
Dr Whelan is a fellow with the European Programme for Intervention Epidemiology Training, National Institute for Public Health and the Environment (RIVM), the Netherlands. Her research interests are Q fever in the Netherlands and other vaccine-preventable diseases.
References
1. van der Hoek W, Dijkstra F, Schimmer B, Schneeberger PM, Vellema P, Wijkmans C, et al. Q fever in the Netherlands: an up-date on the epidemiology and control measures. Eurosurveill. 2010;15:pii=19520.
DISPATCHES
1722 Emerging Infectious Diseases • www.cdc.gov/eid • Vol. 17, No. 9, September 2011
Figure 2. Predicted probabilities of seroconversion among small ruminant culling workers by total hours worked, weighted mean farm size, and location on farm while working during December 2009–June 2010, the Netherlands. Seroconversion probabilities calculated by multivariable model adjusted for age group, occurrence of animal abortions on the farms worked, and compliance with wearing personal protective equipment.

Q FEVER AMONG CULLING WORKERS | 195
5.3
Q Fever among Culling Workers, the Netherlands
sample in June 2010, and 199 (80.8%) of these completed the questionnaire. Those who participated in June were more likely to be male (p = 0.015) and 40–60 years of age (p<0.001). Seroconversion among 246 seronegative
respondents occurred as follows: 23 (9.4%) became IgG and IgM seropositive, 7 (2.9%) became IgM positive only, 13 (5.3%) became IgG positive only, and 203 (82.5%) remained seronegative; i.e., any seroconversion was found
Emerging Infectious Diseases • www.cdc.gov/eid • Vol. 17, No. 9, September 2011 1721
Table 2. Variables associated with Q fever seroconversion among 246 workers who were seronegative before culling small ruminants,the Netherlands, 2009*
VariableNo. (%) workers Univariable analysis Multivariable analysis†
Total Seroconversion RR (95% CI) p value‡ RR (95% CI) p valueTotal 246 (100) 43 (17) Sex F 6 (2) 2 (33) Reference M 240 (98) 41 (17) 0.51 (0.16–1.64) 0.301 Age, y <45 96 (39) 14 (15) Reference >45 150 (61) 29 (19) 1.33 (0.74–2.38) 0.339 2.0 (0.93–4.16) 0.07Level of education Low 39 (21) 5 (13) Reference Medium 103 (55) 18 (17) 1.36 (0.54–3.42) High 44 (24) 8 (18) 1.42 (0.51–3.98) 0.765 Minimum distance of residence from nearest infected farm, km >5 174 (73) 32 (18) Reference <5 63 (27) 9 (14) 0.78 (0.39–1.53) 0.460 Medical history§ No 128 (75) 23 (18) Reference Yes 42 (25) 5 (12) 0.66 (0.27–1.63) 0.358 Current or past smoker No 84 (44) 16 (19) Reference Yes 108 (56) 16 (15) 0.78 (0.41–1.46) 0.435 Total hours worked inside farm perimeter¶ 0–20 81 (33) 5 (6) Reference Reference 21–100 82 (34) 18 (22) 3.56 (1.39–9.12) 5.53 (0.71–42.77) 0.102 >100 80 (33) 20 (25) 4.05 (1.60–10.26) 0.003 7.75 (1.02–58.99) 0.048 Mean farm size >1,500 animals# No 167 (68) 22 (13) Reference Yes 79 (32) 21 (27) 2.02 (1.18–3.44) 0.010 1.75 (0.93–3.30) 0.081 Worked mostly inside stable No 110 (45) 11 (10) Reference Yes 133 (55) 31 (23) 2.33 (1.23–4.42) 0.006 2.58 (1.04–6.37) 0.040 Animal abortions on farm No 208 (85) 33 (16) Reference Yes 38 (15) 10 (26) 1.66 (0.89–3.07) 0.119 0.93 (0.45–1.91) 0.844 Any previous culling experience No 85 (43) 15 (18) Reference Yes 114 (57) 17 (15) 0.84 (0.45–1.59) 0.603 Adherence to hygiene and preventive measures** Fully compliant 91 (50) 13 (14) Reference Not compliant 91 (50) 17 (19) 1.31 (0.68–2.53) 0.424 0.94 (0.51–1.72) 0.829 Months spent culling 2009 Dec–2010 Mar only (mean temperature 3.2°C)
105 (54) 18 (17) Reference
2010 Apr–Jun only (mean temperature 13.9°C)
2 (1) 1 (50) 2.92 (0.69–12.41)
2009 Dec–2010 Jun 87 (45) 21 (24) 1.41 (0.80–2.47) 0.288 *Total for each category may be <246 because of missing data. RR, risk ratio; CI, confidence interval. †All data available for n = 180 in multivariable analysis. ‡Pearson 2.§History of cardiorespiratory disease, liver disorders, diabetes, cancer, immunosuppression, allergies, skin conditions. ¶Data only available for n = 194, those who worked inside the farm perimeter. #Weighted mean number of animals on farms worked by participants. **Includes wearing mask, gloves, overalls, hairnet, showering after exposure.
for 17.5%. Questionnaire respondents who seroconverted had more symptoms after December 1, 2009, (9 [31%] of 29) than nonseroconverters (17 [11%] of 150; relative risk 2.7, 95% con dence interval 1.4–5.5, p = 0.005). Symptomatic seroconverters reported fever and/or rigors and malaise (n = 7), headache (n = 6), cough (n = 6), or myalgia (n = 4). Mean duration of illness was 7.6 (range 1–14) days.
Univariable model indicated signi cance for total hours worked, farm size, and working inside the stable (p<0.05; Table 2). Multivariable model indicated signi cance for working >100 hours on the farm and working inside the stable (Table 2; Figure 2). Interaction effects were not signi cant.
ConclusionsSeroconversion for C. burnetii among 17.5% of culling
workers who were seronegative before culling provides evidence of high-risk work. Before culling, seroprevalence was 13%, similar to that among blood donors in a high-incidence area in the Netherlands in 2009 (H.L. Zaaijer, pers. comm.) and in similar high-risk occupational groups (7). Laboratory testing by using ELISA is an accepted method in an acute setting (8), and positive results (including positive IgM only) were con rmed by immuno uorescence assay. Nonparticipants were in the youngest and oldest age groups; their effect on the proportion of seroconversion is uncertain. Eighteen workers (excluded for not providing
a follow-up blood sample) completed the questionnaire in June. Symptom incidence for these 18 workers was the same as that for included participants.
Symptomatic infection (31% of seroconverters) was probably underestimated. A diagnosis of Q fever was self-reported (uncon rmed) to the occupational health service by 8 workers who did not participate in the study. During December–July 2010, the national infectious disease surveillance system reported 11 culling-related cases of acute Q fever; 2 of these patients were hospitalized.
A strong association was shown between risk for seroconversion and total hours worked on the farms and working inside the stable. In other settings internationally, a risk gradient has also been shown for close direct and indirect animal contact over time (9,10). In our study, half the participants had experience with previous animal epidemics (avian in uenza, foot-and-mouth disease, classical swine fever) and using PPE. Their compliance with PPE was reportedly high; however, a key problem was not wearing PPE while taking work breaks but remaining on the farm.
Given the high risk for infection despite extensive personal protective measures during culling, additional preventive measures are needed. The Health Council of the Netherlands issued guidelines for persons in risk groups who would bene t from vaccination against Q fever (11). Culling workers were not included in these guidelines. The ef cacy of human Q fever vaccine has been shown to be high for young and healthy persons in similar occupational groups (12–14). Vaccination of culling workers could be considered if further animal culling is advised.
AcknowledgmentsWe thank Ben Bom for providing the map and distance
calculations; Daan Notermans, Marianne van der Sande, Ioannis Karagiannis, and Biagio Pedalino for their scienti c input; the culling workers and their af liated organizations for their participation; and the Food and Consumer Product Safety Authority for facilitating this study.
Dr Whelan is a fellow with the European Programme for Intervention Epidemiology Training, National Institute for Public Health and the Environment (RIVM), the Netherlands. Her research interests are Q fever in the Netherlands and other vaccine-preventable diseases.
References
1. van der Hoek W, Dijkstra F, Schimmer B, Schneeberger PM, Vellema P, Wijkmans C, et al. Q fever in the Netherlands: an up-date on the epidemiology and control measures. Eurosurveill. 2010;15:pii=19520.
DISPATCHES
1722 Emerging Infectious Diseases • www.cdc.gov/eid • Vol. 17, No. 9, September 2011
Figure 2. Predicted probabilities of seroconversion among small ruminant culling workers by total hours worked, weighted mean farm size, and location on farm while working during December 2009–June 2010, the Netherlands. Seroconversion probabilities calculated by multivariable model adjusted for age group, occurrence of animal abortions on the farms worked, and compliance with wearing personal protective equipment.

196 | CHAPTER 5.3
Q Fever among Culling Workers, the Netherlands
2. European Centre for Disease Prevention and Control. Risk assess-ment on Q fever. Stockholm: The Centre; 2010.
3. Roest HI, Tilburg JJ, van der Hoek W, Vellema P, van Zijderveld FG, Klaassen CH, et al. The Q fever epidemic in the Netherlands: histo-ry, onset, response and re ection. Epidemiol Infect. 2011;139:1–12. doi:10.1017/S0950268810002268
4. Food and Consumer Product Safety Authority, Ministry of Agri-culture Nature and Food Quality. Occupational health and hygiene instructions for the management of Q-fever [in Dutch]. 2009 [cited 2010 Oct 26]. http://www.vwa.nl/txmpub/ les/?p_ le_id = 46449
5. Royal Netherlands Meterological Institute. Annual report. 2009 [cited 2010 Nov 12]. http://www.knmi.nl/bibliotheek/jaarverslag/annualreport2009.pdf
6. Royal Netherlands Meterological Institute. Climate data and advice: monthly overview of the weather in the Netherlands [in Dutch]. 2010 [cited 2010 Jan 6]. http://www.knmi.nl/klimatologie/mow/
7. Anderson AD, Baker TR, Littrell AC, Mott RL, Niebuhr DW, Smoak BL. Seroepidemiologic survey for Coxiella burnetii among hospital-ized US troops deployed to Iraq. Zoonoses Public Health. 2010 Sep 29; [Epub ahead of print]. doi:10.1111/j.1863-2378.2010.01347.x
8. Boden K, Wagner-Wiening C, Seidel T, Baier M, Bischof W, Straube E, et al. Diagnosis of acute Q fever with emphasis on enzyme-linked immunosorbent assay and nested polymerase chain reaction re-garding the time of serum collection. Diagn Microbiol Infect Dis. 2010:110–6. doi:10.1016/j.diagmicrobio.2010.06.001
9. Porten K, Rissland J, Tigges A, Broll S, Hopp W, Lunemann M, et al. A super-spreading ewe infects hundreds with Q fever at a farmers’ market in Germany. BMC Infect Dis. 2006;6:147. doi:10.1186/1471-2334-6-147
10. Casolin A. Q fever in New South Wales Department of Ag-riculture workers. J Occup Environ Med. 1999;41:273–8. doi:10.1097/00043764-199904000-00009
11. Health Council of the Netherlands. Human vaccination against Q fever. Publication no. 2010/08E. The Hague: The Council; 2010 [cited 2010 Jan 6]. http://www.gezondheidsraad.nl/sites/default/ les/201008E.pdf
12. Gilroy N, Formica N, Beers M, Egan A, Conaty S, Marmion B. Abattoir-associated Q fever: a Q fever outbreak during a Q fever vaccination program. Aust N Z J Public Health. 2001;25:362–7. doi:10.1111/j.1467-842X.2001.tb00595.x
13. Shapiro RA, Siskind V, Scho eld FD, Stallman N, Worswick DA, Marmion BP. A randomized, controlled, double-blind, cross-over, clinical trial of Q fever vaccine in selected Queensland abattoirs. Ep-idemiol Infect. 1990;104:267–73. doi:10.1017/S0950268800059446
14. Ackland JR, Worswick DA, Marmion BP. Vaccine prophylaxis of Q fever. A follow-up study of the ef cacy of Q-Vax (CSL) 1985–1990. Med J Aust. 1994;160:704–8.
Address for correspondence: Jane Whelan, P.218 Postbak 75, Epidemiology and Surveillance Unit, National Institute for Public Health and the Environment (RIVM), PO Box 1, 3720 BA Bilthoven, the Netherlands; email: [email protected]
Emerging Infectious Diseases • www.cdc.gov/eid • Vol. 17, No. 9, September 2011 1723
Use of trade names is for identifi cation only and does not imply endorsement by the Public Health Service or by the US Department of Health and Human Services.


General discussion
6

General discussion
6

200 | CHAPTER 6
General discussion An unprecedented epidemic of Q fever occurred in the Netherlands and resulted in the notification of more than 4000 human cases of acute Q fever during three consecutive epidemic years, from 2007 through 2009. The research included in this thesis has been carried out within a ‘One Health’ context and contributes to the evidence base for, and practically supports, infectious disease control for Q fever at the national level in the Netherlands and elsewhere in the world. It also, provides input for the development of occupational health guidelines for relevant livestock-associated occupational groups. This thesis includes a large population-based study that assessed the seroprevalence of Coxiella burnetii (C. burnetii) in the Netherlands in 2006-2007 just prior to the start of the Dutch Q fever epidemic (Chapter 2). Chapter 2 also covers a longitudinal study of antibody responses following acute Q fever. This thesis comprises several in-depth field epidemiological investigations of acute Q fever outbreaks that occurred during the Dutch Q fever epidemic (Chapter 3). It further brings together several integrated human-veterinary studies that assessed both the C. burnetii seroprevalence and associated risk factors in occupational groups with intensive ruminant contact, as well as studies in samples of ruminant populations on commercial ruminant farms studying seroprevalence and risk factors on herd and animal level. These studies pertain to: - Farm residents of commercial dairy goat, dairy sheep, non-dairy sheep and dairy cattle farms, 2009-2011 (Chapter 4); - Dairy goat, dairy sheep, non-dairy sheep and dairy cattle herds at commercial ruminant farms, 2009-2011 (Chapter 4); - Veterinary students, livestock veterinarians and culling staff, 2009-2010 (Chapter 5).
Main findings of this thesis per chapter
Seroprevalence of C. burnetii in the Dutch general population and time-course of antibody responses following acute Q fever (Chapter 2) Previous knowledge on this subject Detection of past infections with C. burnetii in humans can be important for the estimation of the spread of Q fever in the general population and for defining risk factors for infection. Serum antibody tests can be performed on a fairly large scale using a commercial enzyme-linked immunosorbent assay (ELISA), and the serum can be stored before analysis, allowing archived samples to be analyzed. Immunofluorescence assays (IFA) can be used as a confirmative test for equivocal or positive ELISA tests (1) or as the main screening assay in order to obtain end point IgG titers against phase1 and phase2 C. burnetii antigens in smaller sera collections, as IFA is more labor-intensive (2). Results of seroprevalence studies can vary significantly depending on the method of antibody detection, the cut-off titer used and interlaboratory variability (3). After infection with C. burnetii, the antibody response develops with a lag of seven to fifteen days after symptom onset (4, 5). Characteristic features of this antibody response are: time from symptom onset to onset seroresponse, time from onset seroresponse to peak titer, magnitude of peak titer and half time of antibody decay. Knowledge of these features is useful as the estimation of the date of symptom onset retrospectively is of relevance in seroprevalence studies, and helps to better understand infection dynamics. From previous studies it is known that there is a large variability in the magnitude of the peak titer and the antibody decay (6-8). Natural variations in antibody responses of cases with acute Q fever have been reported (9, 10). To obtain insight in these variations and long-term responses, it was necessary to study antibody responses in a large cohort of acute Q fever patients with serological follow-up.
What did these investigations add? Screening of population-based sera collected from February 2006 to June 2007 with ELISA indicated that the general Dutch population was susceptible to C. burnetii exemplified by the low pre-epidemic C. burnetii seroprevalence of 2.4%, a relatively low figure in the European context.
This pre-epidemic seroprevalence estimate served as a national baseline for other seroprevalence studies carried out during and in the aftermath of the Dutch Q fever epidemic, such as in blood donors (11), groups of residents (12) and pregnant women (13) in Q fever high-incidence areas, in specific patient groups screened for chronic Q fever (14) and in professional groups occupationally exposed to C. burnetii (15-17). No recent nationwide post-epidemic figures are available (18). The national C. burnetii seroprevalence will probably be assessed in the Pienter-3 study based on sera taken in 2016-2017. For early detection of chronic Q fever, the Jeroen Bosch Hospital in ‘s Hertogenbosch (Noord-Brabant province) offered standard serological follow-up to all acute Q fever patients at 3, 6 and 12 months after diagnosis. The time course of antibody responses against C. burnetii was studied in a cohort of 344 acute Q fever patients by using their IgG and IgM phase-1 and phase-2 antibody levels in a dynamic mathematical model. It showed that C. burnetii antibodies are highly persistent and confirmed the large variability in peak titers and duration of antibody decay. IgG phase 2 serum antibody peaked at a mean of almost 2 months after symptom onset and then declined slowly, with the half-time of the antibody decay rate being estimated at 318 days. This study contributed, but also showed the difficulty, to determine the estimation of the latency of the C. burnetii infection and the presumed date of symptom onset in any individual with C. burnetii antibodies. Later in the epidemic, with systematic serological follow-up data available from over 2,000 acute Q fever patients, a similar modelling study showed that this variability in antibody responses is already present between individuals at the beginning of the antibody response. A more reliable estimate could be provided as sera were used from patients diagnosed with a positive C. burnetii PCR-test (19), instead of using samples obtained after the peak titer. In this way, the date of the seroresponse onset could be estimated based on C. burnetii IgG and IgM phase-1 and phase-2 antibody concentrations and be compared with the actual observed date of symptom onset. A serological follow-up strategy has not yet been implemented for asymptomatic acute Q fever cases or as part of periodical serological screening of professionals with an identified occupational risk, including clinical follow-up. One of the main challenges would be to identify infections in an early stage especially in the absence of symptoms, and to determine the screening intervals that are needed to get robust data. These data could be collected in existing cohorts of livestock farmers (20) and veterinary students (21, 22) or as part of targeted occupational screening as has been done in slaughterhouses (23, 24), wool factories (25) and in military staff before and after deployment to countries with high endemicity (26). Regular periodical screening could provide the serological data needed to study the time-course (27) and the individual variation in the longitudinal antibody responses after C. burnetii infection in these professional groups, including the need for new cut-off levels and the likelihood of a booster effect in the context of continuous exposure (25, 28).
Outbreak investigations during the Dutch Q fever epidemic Previous knowledge on this subject Several large community Q fever outbreaks had occurred in Europe and elsewhere, but never on such an unprecedented scale as in the Netherlands from 2007-2009. Unusual outbreak features that distinguished the Dutch epidemic from historical Q fever outbreaks were its magnitude, and the protracted nature and supra-regional spread with multiple human clusters that could not be explained by one source (29-31). A recurrent seasonal pattern, with cases peaking during spring and early summer, was observed during three subsequent epidemic years. From the early stages of the investigations there were strong indications that dairy goat herds were the main source of the Dutch Q fever epidemic. There had been active reports of abortion waves due to C. burnetii infection since 2005, with incidences up to 80% of goats spontaneously aborting (32, 33). Moreover, the dairy goat population rapidly increased the last decade in this region, as had the average herd size.As reported in other Q fever outbreaks, there had been a diagnostic delay of several weeks in pathogen confirmation (34) of the unknown respiratory disease outbreak that was detected in the village of Herpen in May 2007, and later turned out to be acute Q fever.

6
GENERAL DISCUSSION | 201
General discussion An unprecedented epidemic of Q fever occurred in the Netherlands and resulted in the notification of more than 4000 human cases of acute Q fever during three consecutive epidemic years, from 2007 through 2009. The research included in this thesis has been carried out within a ‘One Health’ context and contributes to the evidence base for, and practically supports, infectious disease control for Q fever at the national level in the Netherlands and elsewhere in the world. It also, provides input for the development of occupational health guidelines for relevant livestock-associated occupational groups. This thesis includes a large population-based study that assessed the seroprevalence of Coxiella burnetii (C. burnetii) in the Netherlands in 2006-2007 just prior to the start of the Dutch Q fever epidemic (Chapter 2). Chapter 2 also covers a longitudinal study of antibody responses following acute Q fever. This thesis comprises several in-depth field epidemiological investigations of acute Q fever outbreaks that occurred during the Dutch Q fever epidemic (Chapter 3). It further brings together several integrated human-veterinary studies that assessed both the C. burnetii seroprevalence and associated risk factors in occupational groups with intensive ruminant contact, as well as studies in samples of ruminant populations on commercial ruminant farms studying seroprevalence and risk factors on herd and animal level. These studies pertain to: - Farm residents of commercial dairy goat, dairy sheep, non-dairy sheep and dairy cattle farms, 2009-2011 (Chapter 4); - Dairy goat, dairy sheep, non-dairy sheep and dairy cattle herds at commercial ruminant farms, 2009-2011 (Chapter 4); - Veterinary students, livestock veterinarians and culling staff, 2009-2010 (Chapter 5).
Main findings of this thesis per chapter
Seroprevalence of C. burnetii in the Dutch general population and time-course of antibody responses following acute Q fever (Chapter 2) Previous knowledge on this subject Detection of past infections with C. burnetii in humans can be important for the estimation of the spread of Q fever in the general population and for defining risk factors for infection. Serum antibody tests can be performed on a fairly large scale using a commercial enzyme-linked immunosorbent assay (ELISA), and the serum can be stored before analysis, allowing archived samples to be analyzed. Immunofluorescence assays (IFA) can be used as a confirmative test for equivocal or positive ELISA tests (1) or as the main screening assay in order to obtain end point IgG titers against phase1 and phase2 C. burnetii antigens in smaller sera collections, as IFA is more labor-intensive (2). Results of seroprevalence studies can vary significantly depending on the method of antibody detection, the cut-off titer used and interlaboratory variability (3). After infection with C. burnetii, the antibody response develops with a lag of seven to fifteen days after symptom onset (4, 5). Characteristic features of this antibody response are: time from symptom onset to onset seroresponse, time from onset seroresponse to peak titer, magnitude of peak titer and half time of antibody decay. Knowledge of these features is useful as the estimation of the date of symptom onset retrospectively is of relevance in seroprevalence studies, and helps to better understand infection dynamics. From previous studies it is known that there is a large variability in the magnitude of the peak titer and the antibody decay (6-8). Natural variations in antibody responses of cases with acute Q fever have been reported (9, 10). To obtain insight in these variations and long-term responses, it was necessary to study antibody responses in a large cohort of acute Q fever patients with serological follow-up.
What did these investigations add? Screening of population-based sera collected from February 2006 to June 2007 with ELISA indicated that the general Dutch population was susceptible to C. burnetii exemplified by the low pre-epidemic C. burnetii seroprevalence of 2.4%, a relatively low figure in the European context.
This pre-epidemic seroprevalence estimate served as a national baseline for other seroprevalence studies carried out during and in the aftermath of the Dutch Q fever epidemic, such as in blood donors (11), groups of residents (12) and pregnant women (13) in Q fever high-incidence areas, in specific patient groups screened for chronic Q fever (14) and in professional groups occupationally exposed to C. burnetii (15-17). No recent nationwide post-epidemic figures are available (18). The national C. burnetii seroprevalence will probably be assessed in the Pienter-3 study based on sera taken in 2016-2017. For early detection of chronic Q fever, the Jeroen Bosch Hospital in ‘s Hertogenbosch (Noord-Brabant province) offered standard serological follow-up to all acute Q fever patients at 3, 6 and 12 months after diagnosis. The time course of antibody responses against C. burnetii was studied in a cohort of 344 acute Q fever patients by using their IgG and IgM phase-1 and phase-2 antibody levels in a dynamic mathematical model. It showed that C. burnetii antibodies are highly persistent and confirmed the large variability in peak titers and duration of antibody decay. IgG phase 2 serum antibody peaked at a mean of almost 2 months after symptom onset and then declined slowly, with the half-time of the antibody decay rate being estimated at 318 days. This study contributed, but also showed the difficulty, to determine the estimation of the latency of the C. burnetii infection and the presumed date of symptom onset in any individual with C. burnetii antibodies. Later in the epidemic, with systematic serological follow-up data available from over 2,000 acute Q fever patients, a similar modelling study showed that this variability in antibody responses is already present between individuals at the beginning of the antibody response. A more reliable estimate could be provided as sera were used from patients diagnosed with a positive C. burnetii PCR-test (19), instead of using samples obtained after the peak titer. In this way, the date of the seroresponse onset could be estimated based on C. burnetii IgG and IgM phase-1 and phase-2 antibody concentrations and be compared with the actual observed date of symptom onset. A serological follow-up strategy has not yet been implemented for asymptomatic acute Q fever cases or as part of periodical serological screening of professionals with an identified occupational risk, including clinical follow-up. One of the main challenges would be to identify infections in an early stage especially in the absence of symptoms, and to determine the screening intervals that are needed to get robust data. These data could be collected in existing cohorts of livestock farmers (20) and veterinary students (21, 22) or as part of targeted occupational screening as has been done in slaughterhouses (23, 24), wool factories (25) and in military staff before and after deployment to countries with high endemicity (26). Regular periodical screening could provide the serological data needed to study the time-course (27) and the individual variation in the longitudinal antibody responses after C. burnetii infection in these professional groups, including the need for new cut-off levels and the likelihood of a booster effect in the context of continuous exposure (25, 28).
Outbreak investigations during the Dutch Q fever epidemic Previous knowledge on this subject Several large community Q fever outbreaks had occurred in Europe and elsewhere, but never on such an unprecedented scale as in the Netherlands from 2007-2009. Unusual outbreak features that distinguished the Dutch epidemic from historical Q fever outbreaks were its magnitude, and the protracted nature and supra-regional spread with multiple human clusters that could not be explained by one source (29-31). A recurrent seasonal pattern, with cases peaking during spring and early summer, was observed during three subsequent epidemic years. From the early stages of the investigations there were strong indications that dairy goat herds were the main source of the Dutch Q fever epidemic. There had been active reports of abortion waves due to C. burnetii infection since 2005, with incidences up to 80% of goats spontaneously aborting (32, 33). Moreover, the dairy goat population rapidly increased the last decade in this region, as had the average herd size.As reported in other Q fever outbreaks, there had been a diagnostic delay of several weeks in pathogen confirmation (34) of the unknown respiratory disease outbreak that was detected in the village of Herpen in May 2007, and later turned out to be acute Q fever.
202 | CHAPTER 6
Regional microbiology laboratories in Noord-Brabant province had already signaled a possible rise in Q fever cases during the previous months, March to June 2007, and reported this to the public health authorities. Nevertheless these six hospitalized patients with an atypical pneumonia and symptoms of high fever, dyspnea and headache could not be epidemiologically linked (29). The large majority of acute Q fever outbreaks described in the literature involve single and locally restricted outbreaks with human cases arising during several months (35). These localized outbreaks could be explained by exposure to an infected ruminant source, mainly sheep or goats, while only few Q fever outbreaks have been attributed to cattle. Recurrent outbreaks in the same community during two subsequent years have occurred at relative small scale, most likely due to environmental resilience of C. burnetii (36). Information on the environmental investigation, including sampling of animal herds, records of reproductive events in the presumed animal source and supportive information on the weather conditions and prevailing wind direction and speed during the infectious period, is often included. The maximum distance of windborne C. burnetii spread is reported up to 18 kilometres in a community sheep-related outbreak in the United Kingdom (37) and at comparable distances during the mistral season that coincides with the main lambing season in the south of France (38). In some outbreak reports, distance-based attack rates were calculated to study the importance of proximity of meadows with grazing sheep flocks to the residential address of Q fever cases (39, 40). What did these investigations add? During the Dutch Q fever epidemic, several in-depth epidemiological investigations of separate acute Q fever clusters that occurred in different semi-urban and rural community settings were carried out. Four of them are described in this thesis in Chapter 3 (41-44), and at least three other community outbreaks are published elsewhere (45-47). When confronted with a national epidemic on this scale, it is imperative to keep collecting case-based information through trawling questionnaires and implement early notification of suspected animal sources and environmental reservoirs that might play a role in the epidemic. There were multiple C. burnetii emitting sources during this protracted epidemic, with cases arising simultaneously in different regions. The investigated community outbreaks appeared to be related to the presence of nearby commercial dairy goat farms (41, 43, 46, 47), of which some had recorded a Q fever induced abortion storm in goats prior to outbreak detection (32). Commercial dairy-goat farms were soon considered the putative source in the Dutch Q fever epidemic as at least 23 farms experienced C. burnetii related abortion storms from 2005 through 2008. These abortion storms were reported voluntarily during the initial stages of the epidemic, but became notifiable in June 2008 (defined as ≥5% abortions in a herd). As humans served in a way as sentinel for Q fever presence in nearby small ruminant populations, there was an important trigger to further improve abortion surveillance on small ruminant farms with mandatory notification of unexpectedly high abortion rates (>5%) in 2008 (30). PCR positivity of bulk tank milk (BTM) on dairy small ruminant farms was added to the notification criteria in October 2009, as on large farms the abortion rate was difficult to measure (32), or could be subjectively interpreted. There were indications that direct contact with non-dairy sheep had also caused a limited number of acute Q fever cases. Two smaller sheep-related outbreaks were investigated: one among staff and employees of a healthcare institution (42) and the other one affected recreational visitors of a non-dairy sheep farm with a public function (44). These clusters showed that during the whole duration of the epidemic, it was important to disentangle the different veterinary sources and the responsible ruminant species. The non-dairy sheep farm that was later implicated as the source was first identified from free text fields in the trawling questionnaires that were used by the local public health service. Where exposure to infected animals could be avoided (i.e. visiting infected farms) the advice was to do so, and the farm involved in this latter investigation was closed to the public pending vaccination of the herd and reopened in the spring of 2011.
These outbreak investigations were carried out by or in close collaboration with the local public health services and regional laboratories. This is important as for a thorough outbreak investigation one needs to go to the field to obtain insight in the local context and outbreak dynamics in order to develop hypotheses on the possible outbreak source. Environmental sampling of different matrices was an integrated part of all investigations and appeared an important tool to provide supportive evidence by detection of C. burnetii in samples derived of epidemiologically incriminated sources.
First outbreak investigation suggested a causal link with a nearby dairy goat farm The population-based case-control study in Herpen took place several months after the initial occurrence of acute Q fever cases in this village. This study showed a high attack rate as almost one quarter of the sampled inhabitants had a recent C. burnetii infection based on IFA. The identified risk factors suggested a strong plausible link with a nearby dairy goat farm that experienced an abortion storm in April 2007, one month before human Q fever cases arose. This was supported by C. burnetii DNA-positive environmental samples taken on the farm. Due to presence of several other ruminant farms in this area, it was difficult to pinpoint this first community outbreak of acute Q fever in the Netherlands to one farm, as proximity to the specific dairy goat farm with abortion history or one of four postal codes to the east of the village (‘area A’) were both significant risk factors, hampering support for the immediate implementation of control measures. Between 2007 and 2010 this village was in the proximity of four C. burnetii bulk tank milk (BTM)-positive farms, of which two had C. burnetii induced abortions in 2007 and 2008. The closest farm was in the village itself and the furthest was six kilometers from the center of the village. Population screening 7 years after the initial outbreak to identify unrecognized chronic Q fever infections in this village required a considerable effort and investment, but had a small yield with just one newly diagnosed patient with chronic Q fever out of 513 inhabitants (0.2%) with C. burnetii antibodies (48). This is currently used as input for cost-benefit analyses of future post-epidemic screening options for chronic Q fever. The urgency to establish the epidemiological link Without uniform sufficiently discriminatory molecular typing methods for comparison of human, environmental and veterinary strains, more innovative spatial-temporal methods needed to be applied during the Dutch Q fever outbreak to establish an epidemiological link, as otherwise the outbreak source would remain unproven. It became imperative to study distance-response relations in detail, as sound epidemiological evidence was needed to support the implementation of veterinary control measures to stop the zoonotic transmission (49). Spatial-temporal aspects of the Dutch Q fever epidemic The proximity of the residential address of Q fever cases to multiple potential veterinary sources had not been studied extensively in previous outbreaks abroad. In search of comparable situations, we adapted a GIS-based approach that was successfully applied during an outbreak of legionellosis occurring in two adjacent cities in Norway (50). As C. burnetii is an airborne pathogen, like Legionella spp., that similarly spreads over considerable distances and is emitted from outdoor sources, it was assumed that this method could be applied in the ongoing Dutch Q fever epidemic. This method needed data with a high spatial resolution from both notified patients and ruminant farm locations. This kind of detailed information was not routinely available at the start of the Dutch Q fever epidemic, and if accessible, not easily shared between the public and veterinary health sectors. This data sharing gradually improved during the epidemic and as soon as exact small ruminant farm locations became available and six-digit postal codes of the case residence addresses were provided by the municipal public health services for this study purpose, the spatial-temporal relation between human clusters and potential farm sources lead to improved source finding. Discrimination of potential sources through calculation of distance-based attack rates The GIS-based method using concentric ring analyses was first introduced in the urban Q fever outbreak in Helmond in 2008, and later again applied in a recurrent outbreak in the same area in 2009, and in community clusters in Utrecht and Zuid-Limburg provinces in 2009 (46, 47, 51). In all these settings, distance-based attack rates were calculated in a retrospective cohort design, resembling the risk to acquire acute Q fever associated with exposure to each of several potential farm sources, using proximity of case residential address to the source as a proxy for exposure.

6
GENERAL DISCUSSION | 203
Regional microbiology laboratories in Noord-Brabant province had already signaled a possible rise in Q fever cases during the previous months, March to June 2007, and reported this to the public health authorities. Nevertheless these six hospitalized patients with an atypical pneumonia and symptoms of high fever, dyspnea and headache could not be epidemiologically linked (29). The large majority of acute Q fever outbreaks described in the literature involve single and locally restricted outbreaks with human cases arising during several months (35). These localized outbreaks could be explained by exposure to an infected ruminant source, mainly sheep or goats, while only few Q fever outbreaks have been attributed to cattle. Recurrent outbreaks in the same community during two subsequent years have occurred at relative small scale, most likely due to environmental resilience of C. burnetii (36). Information on the environmental investigation, including sampling of animal herds, records of reproductive events in the presumed animal source and supportive information on the weather conditions and prevailing wind direction and speed during the infectious period, is often included. The maximum distance of windborne C. burnetii spread is reported up to 18 kilometres in a community sheep-related outbreak in the United Kingdom (37) and at comparable distances during the mistral season that coincides with the main lambing season in the south of France (38). In some outbreak reports, distance-based attack rates were calculated to study the importance of proximity of meadows with grazing sheep flocks to the residential address of Q fever cases (39, 40). What did these investigations add? During the Dutch Q fever epidemic, several in-depth epidemiological investigations of separate acute Q fever clusters that occurred in different semi-urban and rural community settings were carried out. Four of them are described in this thesis in Chapter 3 (41-44), and at least three other community outbreaks are published elsewhere (45-47). When confronted with a national epidemic on this scale, it is imperative to keep collecting case-based information through trawling questionnaires and implement early notification of suspected animal sources and environmental reservoirs that might play a role in the epidemic. There were multiple C. burnetii emitting sources during this protracted epidemic, with cases arising simultaneously in different regions. The investigated community outbreaks appeared to be related to the presence of nearby commercial dairy goat farms (41, 43, 46, 47), of which some had recorded a Q fever induced abortion storm in goats prior to outbreak detection (32). Commercial dairy-goat farms were soon considered the putative source in the Dutch Q fever epidemic as at least 23 farms experienced C. burnetii related abortion storms from 2005 through 2008. These abortion storms were reported voluntarily during the initial stages of the epidemic, but became notifiable in June 2008 (defined as ≥5% abortions in a herd). As humans served in a way as sentinel for Q fever presence in nearby small ruminant populations, there was an important trigger to further improve abortion surveillance on small ruminant farms with mandatory notification of unexpectedly high abortion rates (>5%) in 2008 (30). PCR positivity of bulk tank milk (BTM) on dairy small ruminant farms was added to the notification criteria in October 2009, as on large farms the abortion rate was difficult to measure (32), or could be subjectively interpreted. There were indications that direct contact with non-dairy sheep had also caused a limited number of acute Q fever cases. Two smaller sheep-related outbreaks were investigated: one among staff and employees of a healthcare institution (42) and the other one affected recreational visitors of a non-dairy sheep farm with a public function (44). These clusters showed that during the whole duration of the epidemic, it was important to disentangle the different veterinary sources and the responsible ruminant species. The non-dairy sheep farm that was later implicated as the source was first identified from free text fields in the trawling questionnaires that were used by the local public health service. Where exposure to infected animals could be avoided (i.e. visiting infected farms) the advice was to do so, and the farm involved in this latter investigation was closed to the public pending vaccination of the herd and reopened in the spring of 2011.
These outbreak investigations were carried out by or in close collaboration with the local public health services and regional laboratories. This is important as for a thorough outbreak investigation one needs to go to the field to obtain insight in the local context and outbreak dynamics in order to develop hypotheses on the possible outbreak source. Environmental sampling of different matrices was an integrated part of all investigations and appeared an important tool to provide supportive evidence by detection of C. burnetii in samples derived of epidemiologically incriminated sources.
First outbreak investigation suggested a causal link with a nearby dairy goat farm The population-based case-control study in Herpen took place several months after the initial occurrence of acute Q fever cases in this village. This study showed a high attack rate as almost one quarter of the sampled inhabitants had a recent C. burnetii infection based on IFA. The identified risk factors suggested a strong plausible link with a nearby dairy goat farm that experienced an abortion storm in April 2007, one month before human Q fever cases arose. This was supported by C. burnetii DNA-positive environmental samples taken on the farm. Due to presence of several other ruminant farms in this area, it was difficult to pinpoint this first community outbreak of acute Q fever in the Netherlands to one farm, as proximity to the specific dairy goat farm with abortion history or one of four postal codes to the east of the village (‘area A’) were both significant risk factors, hampering support for the immediate implementation of control measures. Between 2007 and 2010 this village was in the proximity of four C. burnetii bulk tank milk (BTM)-positive farms, of which two had C. burnetii induced abortions in 2007 and 2008. The closest farm was in the village itself and the furthest was six kilometers from the center of the village. Population screening 7 years after the initial outbreak to identify unrecognized chronic Q fever infections in this village required a considerable effort and investment, but had a small yield with just one newly diagnosed patient with chronic Q fever out of 513 inhabitants (0.2%) with C. burnetii antibodies (48). This is currently used as input for cost-benefit analyses of future post-epidemic screening options for chronic Q fever. The urgency to establish the epidemiological link Without uniform sufficiently discriminatory molecular typing methods for comparison of human, environmental and veterinary strains, more innovative spatial-temporal methods needed to be applied during the Dutch Q fever outbreak to establish an epidemiological link, as otherwise the outbreak source would remain unproven. It became imperative to study distance-response relations in detail, as sound epidemiological evidence was needed to support the implementation of veterinary control measures to stop the zoonotic transmission (49). Spatial-temporal aspects of the Dutch Q fever epidemic The proximity of the residential address of Q fever cases to multiple potential veterinary sources had not been studied extensively in previous outbreaks abroad. In search of comparable situations, we adapted a GIS-based approach that was successfully applied during an outbreak of legionellosis occurring in two adjacent cities in Norway (50). As C. burnetii is an airborne pathogen, like Legionella spp., that similarly spreads over considerable distances and is emitted from outdoor sources, it was assumed that this method could be applied in the ongoing Dutch Q fever epidemic. This method needed data with a high spatial resolution from both notified patients and ruminant farm locations. This kind of detailed information was not routinely available at the start of the Dutch Q fever epidemic, and if accessible, not easily shared between the public and veterinary health sectors. This data sharing gradually improved during the epidemic and as soon as exact small ruminant farm locations became available and six-digit postal codes of the case residence addresses were provided by the municipal public health services for this study purpose, the spatial-temporal relation between human clusters and potential farm sources lead to improved source finding. Discrimination of potential sources through calculation of distance-based attack rates The GIS-based method using concentric ring analyses was first introduced in the urban Q fever outbreak in Helmond in 2008, and later again applied in a recurrent outbreak in the same area in 2009, and in community clusters in Utrecht and Zuid-Limburg provinces in 2009 (46, 47, 51). In all these settings, distance-based attack rates were calculated in a retrospective cohort design, resembling the risk to acquire acute Q fever associated with exposure to each of several potential farm sources, using proximity of case residential address to the source as a proxy for exposure.

204 | CHAPTER 6
This rapid discerning method facilitated in discriminating sources that could already be ruled out after this GIS-based exercise (43, 47) and identifying epidemiologically suspect sources. This subset of suspected sources warranted further investigation including extensive environmental and veterinary sampling and collection of farm-based characteristics, such as herd size, recent animal movements, occurrence of reproductive events and status of bulk tank milk (BTM) investigations that were obtained during farm visits. This process could finally implicate a specific farm as the definite source (47). The evidence provided by clear distance-response relations in these outbreak settings was strengthened by a temporal relation between the occurrence of an abortion wave among small ruminants or the peak number of births during the kidding or lambing season and the peak week of illness onset in human Q fever cases, matching the 3 week mean incubation period of acute Q fever.
Investigation of an urban Q fever outbreak led to 5-kilometer (km) risk zones around BTM-positive farms In retrospect, the urban outbreak in Helmond in 2008 could be epidemiologically linked to a single dairy goat farm as the primary outbreak source. This farm experienced a Q fever-related abortion wave a few weeks before the first human cases were notified. Residents living within 2 km of that farm had a 31 times higher risk to acquire clinical Q fever compared to the reference population living more than 5 km away. It was concluded that living close to an infected dairy goat farm with abortion problems caused by C. burnetii posed a risk for human Q fever. This was considered strong epidemiological evidence that further supported the hypothesis of dairy goat farms as the main source of infection.Similar distance-response relationships were repeatedly found in other community outbreaks using the same initial method as in Helmond in 2008, and were later combined with more sophisticated spatial analyses and dispersion models (52). The findings from the Helmond study directly led to a national public information campaign targeted at residents that lived within a 5 km-radius around BTM-positive dairy goat and sheep farms [8]. It also convinced veterinary authorities of the indisputable relationship between dairy goat farms with abortion storms and Q fever cases among nearby residents. A list of BTM-positive small ruminant farms was made available to the public on the website of the Food and Consumer Product Safety Authority and updated daily. Residents in the 5-km zone of these farms received a letter informing them on the presence of a Q fever-positive farm in their proximity that allowed persons with known risk factors to avoid these farm areas and raised awareness among residents of these areas to seek medical care if experiencing symptoms possibly related to Q fever. In reality, it was however impossible for residents to avoid these risk zones as it was their direct residence or working area where they could experience long-lasting exposure to C. burnetii. Next to informing the public, physicians in this 5 km-zones were notified by the municipal public health services to raise awareness of possible consultation by Q fever cases and to successfully decrease the diagnostic delay, as was demonstrated in the notification data (53). Proportion of Q fever cases explained through residence in 5 km-risk zones In-depth outbreak investigations showed that the large majority of acute Q fever patients got infected following community-based exposure caused by C. burnetii transmission from nearby infected small ruminant farms. The proportion of cases that could be explained by community exposure through residence within these 5 km-risk zones, was 59% in 2009, meaning that 6 out of 10 notified cases in 2009 lived within a 5 km-radius of a BMT-positive dairy goat or dairy sheep farm. The incidence of Q fever in 2009 was 69 per 100,000 population within, and 6 per 100,000 outside the 5 km-areas (31). Nevertheless, a considerable number of dairy goat farms were BTM-positive whereas the number of notified acute Q fever cases in these regions remained limited. Therefore, several hypotheses arose including the high heterogeneity in shedding rates among farms, regional diversity in Q fever awareness and diagnostics (12, 29), presence of multiple C. burnetii strains with different virulence, and effect of the local environmental conditions on C. burnetii transmission (54, 55).
Residing near goat farms associated with Q fever-related outcomes and increased risk of pneumonia The 5 km-radius was later also adopted in several policy advices which was in the light of the ongoing epidemic quite understandable. From an epidemiologists’ perspective, extrapolation and the generalizability of study findings from one outbreak setting to other settings needs to be done cautiously as every outbreak situation is unique and has its own features. Atmospheric modelling studies showed that the affected area and timing of disease in each outbreak setting is strongly dependent on meteorological and local environmental conditions (47, 55, 56). The distance of 5 kilometres from the putative farm source should not be rigidly interpreted, as shown by another study included in this thesis (Chapter 4). The presence of a BTM-positive dairy goat farm within 8 km-distance was a risk factor for C. burnetii seropositivity in dairy goats on herd and animal level, and a BTM-positive dairy goat farm within 16 km-radius was a risk factor for C. burnetii seropositivity in dairy goat farm residents (Table 1). Another GIS-based study carried out in a livestock-dense area in the eastern part of North Brabant province and in the north of Limburg province (12) demonstrated a clear exposure-response relationship between the number of goats within a 5 km-radius of the residential address and Q fever related outcomes such as pneumonia and ‘other infectious disease’ incidence using records of general practitioners (57). This study also indicated a considerable residual risk for infection beyond this 5 kilometer radius as the increased pneumonia risk returned to background levels only beyond 10 kilometers from the nearest goat farm (57). This same association between goat density and pneumonia incidence was re-investigated in the same area, when the incidence of acute Q fever had dropped to pre-epidemic levels. During the years 2009-2013, there is still a higher incidence of pneumonia in residents in the near vicinity of goat farms, even though the pneumonia incidence in this area has decreased since the Dutch Q fever epidemic. The number of additional cases of pneumonia in the research area attributable to the presence of goat farms is approximately 5.4% over the years 2009-2013, based on advanced kernel-analyses (58). The cause of this increase is still unclear and is most likely not caused by Q fever as individuals with pneumonia were not more often seropositive for C. burnetii. Further studies are needed to confirm and identify other causes of pneumonia in this population and the potential role of non-infectious agents such as particulate matter or endotoxins (59).
Seroprevalence and risk factors of C. burnetii infection in residents and ruminants on commercial farms in a ‘One Health’ context (Chapter 4)
Previous knowledge on this subject Maintenance of C. burnetii infection within a small ruminant farm might be influenced by persistently infected domestic ruminants, other animal reservoirs of infection, ticks, and husbandry practices that favor within herd transmission or environmental contamination (60). However there is considerable uncertainty about the relative importance of risk factors for maintenance of C. burnetii infection in domestic ruminant populations within a farm and risk factors for zoonotic spill-over to other ruminant farms and to humans. Also conclusive evidence in support of a direct link between increased animal density or farm density and risks for spillover from C. burnetii infected farms to nearby human and ruminant communities was lacking. In theory, such a link would be consistent with the consequences of increased pathogen pressure as infected goats kept at a higher density would result in a greater amount of bacterial contamination per square meter. This would put naïve goats introduced to the herd at a greater risk of exposure to C. burnetii and lead to an increased emission of C. burnetii for airborne transmission. What did these studies add?
Q VIVE studies were at the forefront of the One Health approach in studying Q fever Since 2007, a large multidisciplinary research portfolio using a ‘One Health’ approach was implemented that aimed at generating better knowledge about the Dutch Q fever situation with a clear expressed need and benefit for cross-sectoral collaboration. These integrated studies studying the seroprevalence and risk factors for C. burnetii infection both in farmers’ households as in the ruminants present on the same farms were at the forefront of this ‘One Health’ research collaboration. Many institutional partners from both the veterinary and public health domains, including occupational health experts and environmental specialists were involved.

6
GENERAL DISCUSSION | 205
This rapid discerning method facilitated in discriminating sources that could already be ruled out after this GIS-based exercise (43, 47) and identifying epidemiologically suspect sources. This subset of suspected sources warranted further investigation including extensive environmental and veterinary sampling and collection of farm-based characteristics, such as herd size, recent animal movements, occurrence of reproductive events and status of bulk tank milk (BTM) investigations that were obtained during farm visits. This process could finally implicate a specific farm as the definite source (47). The evidence provided by clear distance-response relations in these outbreak settings was strengthened by a temporal relation between the occurrence of an abortion wave among small ruminants or the peak number of births during the kidding or lambing season and the peak week of illness onset in human Q fever cases, matching the 3 week mean incubation period of acute Q fever.
Investigation of an urban Q fever outbreak led to 5-kilometer (km) risk zones around BTM-positive farms In retrospect, the urban outbreak in Helmond in 2008 could be epidemiologically linked to a single dairy goat farm as the primary outbreak source. This farm experienced a Q fever-related abortion wave a few weeks before the first human cases were notified. Residents living within 2 km of that farm had a 31 times higher risk to acquire clinical Q fever compared to the reference population living more than 5 km away. It was concluded that living close to an infected dairy goat farm with abortion problems caused by C. burnetii posed a risk for human Q fever. This was considered strong epidemiological evidence that further supported the hypothesis of dairy goat farms as the main source of infection.Similar distance-response relationships were repeatedly found in other community outbreaks using the same initial method as in Helmond in 2008, and were later combined with more sophisticated spatial analyses and dispersion models (52). The findings from the Helmond study directly led to a national public information campaign targeted at residents that lived within a 5 km-radius around BTM-positive dairy goat and sheep farms [8]. It also convinced veterinary authorities of the indisputable relationship between dairy goat farms with abortion storms and Q fever cases among nearby residents. A list of BTM-positive small ruminant farms was made available to the public on the website of the Food and Consumer Product Safety Authority and updated daily. Residents in the 5-km zone of these farms received a letter informing them on the presence of a Q fever-positive farm in their proximity that allowed persons with known risk factors to avoid these farm areas and raised awareness among residents of these areas to seek medical care if experiencing symptoms possibly related to Q fever. In reality, it was however impossible for residents to avoid these risk zones as it was their direct residence or working area where they could experience long-lasting exposure to C. burnetii. Next to informing the public, physicians in this 5 km-zones were notified by the municipal public health services to raise awareness of possible consultation by Q fever cases and to successfully decrease the diagnostic delay, as was demonstrated in the notification data (53). Proportion of Q fever cases explained through residence in 5 km-risk zones In-depth outbreak investigations showed that the large majority of acute Q fever patients got infected following community-based exposure caused by C. burnetii transmission from nearby infected small ruminant farms. The proportion of cases that could be explained by community exposure through residence within these 5 km-risk zones, was 59% in 2009, meaning that 6 out of 10 notified cases in 2009 lived within a 5 km-radius of a BMT-positive dairy goat or dairy sheep farm. The incidence of Q fever in 2009 was 69 per 100,000 population within, and 6 per 100,000 outside the 5 km-areas (31). Nevertheless, a considerable number of dairy goat farms were BTM-positive whereas the number of notified acute Q fever cases in these regions remained limited. Therefore, several hypotheses arose including the high heterogeneity in shedding rates among farms, regional diversity in Q fever awareness and diagnostics (12, 29), presence of multiple C. burnetii strains with different virulence, and effect of the local environmental conditions on C. burnetii transmission (54, 55).
Residing near goat farms associated with Q fever-related outcomes and increased risk of pneumonia The 5 km-radius was later also adopted in several policy advices which was in the light of the ongoing epidemic quite understandable. From an epidemiologists’ perspective, extrapolation and the generalizability of study findings from one outbreak setting to other settings needs to be done cautiously as every outbreak situation is unique and has its own features. Atmospheric modelling studies showed that the affected area and timing of disease in each outbreak setting is strongly dependent on meteorological and local environmental conditions (47, 55, 56). The distance of 5 kilometres from the putative farm source should not be rigidly interpreted, as shown by another study included in this thesis (Chapter 4). The presence of a BTM-positive dairy goat farm within 8 km-distance was a risk factor for C. burnetii seropositivity in dairy goats on herd and animal level, and a BTM-positive dairy goat farm within 16 km-radius was a risk factor for C. burnetii seropositivity in dairy goat farm residents (Table 1). Another GIS-based study carried out in a livestock-dense area in the eastern part of North Brabant province and in the north of Limburg province (12) demonstrated a clear exposure-response relationship between the number of goats within a 5 km-radius of the residential address and Q fever related outcomes such as pneumonia and ‘other infectious disease’ incidence using records of general practitioners (57). This study also indicated a considerable residual risk for infection beyond this 5 kilometer radius as the increased pneumonia risk returned to background levels only beyond 10 kilometers from the nearest goat farm (57). This same association between goat density and pneumonia incidence was re-investigated in the same area, when the incidence of acute Q fever had dropped to pre-epidemic levels. During the years 2009-2013, there is still a higher incidence of pneumonia in residents in the near vicinity of goat farms, even though the pneumonia incidence in this area has decreased since the Dutch Q fever epidemic. The number of additional cases of pneumonia in the research area attributable to the presence of goat farms is approximately 5.4% over the years 2009-2013, based on advanced kernel-analyses (58). The cause of this increase is still unclear and is most likely not caused by Q fever as individuals with pneumonia were not more often seropositive for C. burnetii. Further studies are needed to confirm and identify other causes of pneumonia in this population and the potential role of non-infectious agents such as particulate matter or endotoxins (59).
Seroprevalence and risk factors of C. burnetii infection in residents and ruminants on commercial farms in a ‘One Health’ context (Chapter 4)
Previous knowledge on this subject Maintenance of C. burnetii infection within a small ruminant farm might be influenced by persistently infected domestic ruminants, other animal reservoirs of infection, ticks, and husbandry practices that favor within herd transmission or environmental contamination (60). However there is considerable uncertainty about the relative importance of risk factors for maintenance of C. burnetii infection in domestic ruminant populations within a farm and risk factors for zoonotic spill-over to other ruminant farms and to humans. Also conclusive evidence in support of a direct link between increased animal density or farm density and risks for spillover from C. burnetii infected farms to nearby human and ruminant communities was lacking. In theory, such a link would be consistent with the consequences of increased pathogen pressure as infected goats kept at a higher density would result in a greater amount of bacterial contamination per square meter. This would put naïve goats introduced to the herd at a greater risk of exposure to C. burnetii and lead to an increased emission of C. burnetii for airborne transmission. What did these studies add?
Q VIVE studies were at the forefront of the One Health approach in studying Q fever Since 2007, a large multidisciplinary research portfolio using a ‘One Health’ approach was implemented that aimed at generating better knowledge about the Dutch Q fever situation with a clear expressed need and benefit for cross-sectoral collaboration. These integrated studies studying the seroprevalence and risk factors for C. burnetii infection both in farmers’ households as in the ruminants present on the same farms were at the forefront of this ‘One Health’ research collaboration. Many institutional partners from both the veterinary and public health domains, including occupational health experts and environmental specialists were involved.
206 | CHAPTER 6
The ‘One Health’ set-up of these integrated studies has later been adapted and extended in other large population-based studies such as the so-called ‘Livestock farming and the health of local residents’ (VGO)-study focusing on the health risks associated with livestock farming in local residents in a livestock-dense area (12). Identified risk factors in (small) ruminants on herd and animal level and among farm residents The identified risk factors in all four ruminant sectors (dairy goat, dairy sheep, non-dairy sheep and dairy cattle) correspond with the dominant role of dairy goats during the Dutch Q fever epidemic. For all sectors, a higher risk of C. burnetii infection was found for large-sized small ruminant farms (Table 1, blue), farms located in the south of the Netherlands (Table 1, purple) or at a short distance of a BTM-positive small ruminant farm (Table 1, orange). Several risk factors indicated plausible routes of C. burnetii introduction on farms (Table 1, red). These ruminant sectors were advised to improve biosecurity measures, such as a closed farming system, avoiding other introduction pathways and optimize good hygiene practices, including wearing of protective clothing, especially when participating in birthing. Also more insight in the role of airflow in indoor farms is needed, as covering air spaces in stables, whether for pest control or as a windbreak, has been identified as a risk factor for C. burnetii infection in goats: restricted air flow in an indoor environment could have a greater risk of exposure for ruminant livestock, as indicated by positive air samples in indoor flock premises several months after lambing, compared to facilities with continuous ventilation (61). Risk factors were often similar for farm residents and (small) ruminants within the same sector, but frequently differed between sectors. Ruminant farmers face daily exposure to livestock-associated pathogens in every aspect of their work. In general, it remains difficult to precisely determine the intensity of this livestock-human contact as an exposure-response relation (62). The occupational status of the farmer, a full time workweek and the number of daily (small) ruminant-related tasks (e.g. milking, feeding, supply and removal, general animal health care, birth assistance) served as a proxy for this intensity in the studies included in this thesis. Dairy (small) ruminants seem more likely to contract C. burnetii infection than non-dairy animals. This is probably related to husbandry factors that make transmission more efficient or animals more vulnerable on dairy farms, resulting in relatively high within-herd prevalences. This has also been observed in international literature showing a higher seroprevalence in dairy cattle herds compared to beef cattle herds (63).
Compulsory Q fever vaccination in dairy small ruminants Since 2010, compulsory vaccination is applicable to all farms with more than 50 dairy goats or sheep, farms with a public function such as social care farms, petting farms and for small ruminants that are participating in shows. The French phase one vaccine Coxevac® (CEVA Sante Animale) is an animal vaccine that should be given before pregnancy in order to be effective. Vaccination has been shown to strongly decrease the abortion risk due to C. burnetii and the amount of bacterial shedding into the environment. Thereby it prevents airborne C. burnetii spread to nearby animal populations and human residents (64). Continuation of the annual vaccination at dairy small ruminant farms is of vital importance in this post-epidemic period. In the absence of vaccination, a birth cohort study that systematically investigated C. burnetii seroconversions among intensively-managed goats on infected farms showed that the majority of goats are infected early in life well before the goats were mated. The first C. burnetii IgM surge was observed in week 9 underlining the need for early vaccination in order to control C. burnetii in a heavily contaminated environment (65). This need is reinforced by the current steep increase in the mean herd size at commercial dairy goat farms since 2009 (66). Without the compulsory vaccination, there would be an increased risk of C. burnetii infection among ruminants as larger herd size was an identified risk factor on herd level (Table 1). Moreover, this rapidly increasing mean herd size conceivably makes the Dutch dairy goat sector more vulnerable for introduction of zoonotic pathogens other than C. burnetii, emphasizing the importance of implementing more general biosecurity measures beyond compulsory vaccination. End of 2016, a multidisciplinary panel of Dutch Q fever experts advised both the Ministry of Health and Ministry of Agriculture to continue the annual compulsory vaccination for dairy goat and sheep for an undetermined period.
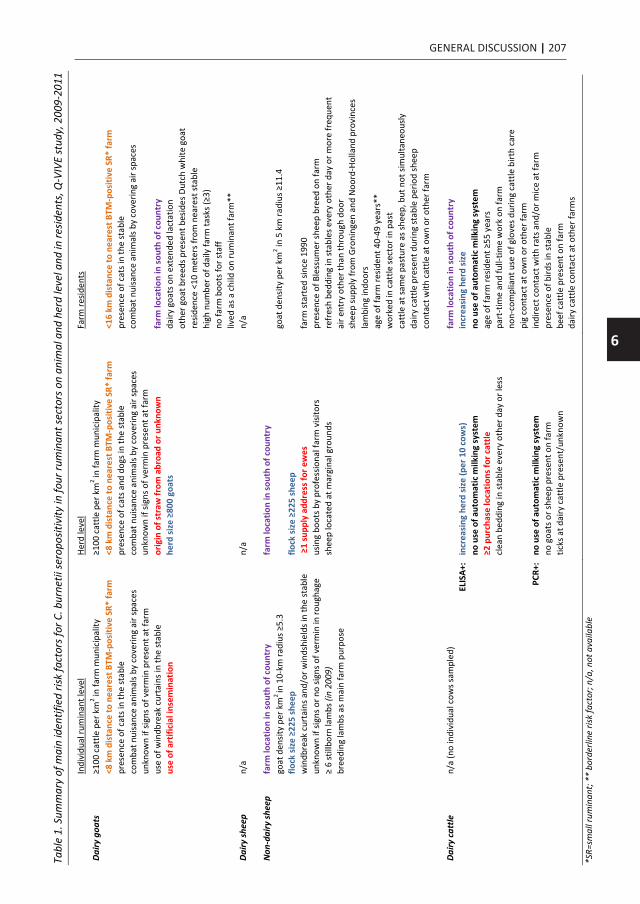
6
GENERAL DISCUSSION | 207
The ‘One Health’ set-up of these integrated studies has later been adapted and extended in other large population-based studies such as the so-called ‘Livestock farming and the health of local residents’ (VGO)-study focusing on the health risks associated with livestock farming in local residents in a livestock-dense area (12). Identified risk factors in (small) ruminants on herd and animal level and among farm residents The identified risk factors in all four ruminant sectors (dairy goat, dairy sheep, non-dairy sheep and dairy cattle) correspond with the dominant role of dairy goats during the Dutch Q fever epidemic. For all sectors, a higher risk of C. burnetii infection was found for large-sized small ruminant farms (Table 1, blue), farms located in the south of the Netherlands (Table 1, purple) or at a short distance of a BTM-positive small ruminant farm (Table 1, orange). Several risk factors indicated plausible routes of C. burnetii introduction on farms (Table 1, red). These ruminant sectors were advised to improve biosecurity measures, such as a closed farming system, avoiding other introduction pathways and optimize good hygiene practices, including wearing of protective clothing, especially when participating in birthing. Also more insight in the role of airflow in indoor farms is needed, as covering air spaces in stables, whether for pest control or as a windbreak, has been identified as a risk factor for C. burnetii infection in goats: restricted air flow in an indoor environment could have a greater risk of exposure for ruminant livestock, as indicated by positive air samples in indoor flock premises several months after lambing, compared to facilities with continuous ventilation (61). Risk factors were often similar for farm residents and (small) ruminants within the same sector, but frequently differed between sectors. Ruminant farmers face daily exposure to livestock-associated pathogens in every aspect of their work. In general, it remains difficult to precisely determine the intensity of this livestock-human contact as an exposure-response relation (62). The occupational status of the farmer, a full time workweek and the number of daily (small) ruminant-related tasks (e.g. milking, feeding, supply and removal, general animal health care, birth assistance) served as a proxy for this intensity in the studies included in this thesis. Dairy (small) ruminants seem more likely to contract C. burnetii infection than non-dairy animals. This is probably related to husbandry factors that make transmission more efficient or animals more vulnerable on dairy farms, resulting in relatively high within-herd prevalences. This has also been observed in international literature showing a higher seroprevalence in dairy cattle herds compared to beef cattle herds (63).
Compulsory Q fever vaccination in dairy small ruminants Since 2010, compulsory vaccination is applicable to all farms with more than 50 dairy goats or sheep, farms with a public function such as social care farms, petting farms and for small ruminants that are participating in shows. The French phase one vaccine Coxevac® (CEVA Sante Animale) is an animal vaccine that should be given before pregnancy in order to be effective. Vaccination has been shown to strongly decrease the abortion risk due to C. burnetii and the amount of bacterial shedding into the environment. Thereby it prevents airborne C. burnetii spread to nearby animal populations and human residents (64). Continuation of the annual vaccination at dairy small ruminant farms is of vital importance in this post-epidemic period. In the absence of vaccination, a birth cohort study that systematically investigated C. burnetii seroconversions among intensively-managed goats on infected farms showed that the majority of goats are infected early in life well before the goats were mated. The first C. burnetii IgM surge was observed in week 9 underlining the need for early vaccination in order to control C. burnetii in a heavily contaminated environment (65). This need is reinforced by the current steep increase in the mean herd size at commercial dairy goat farms since 2009 (66). Without the compulsory vaccination, there would be an increased risk of C. burnetii infection among ruminants as larger herd size was an identified risk factor on herd level (Table 1). Moreover, this rapidly increasing mean herd size conceivably makes the Dutch dairy goat sector more vulnerable for introduction of zoonotic pathogens other than C. burnetii, emphasizing the importance of implementing more general biosecurity measures beyond compulsory vaccination. End of 2016, a multidisciplinary panel of Dutch Q fever experts advised both the Ministry of Health and Ministry of Agriculture to continue the annual compulsory vaccination for dairy goat and sheep for an undetermined period.
Tabl
e 1.
Sum
mar
y of
mai
n id
entif
ied
risk
fact
ors f
or C
. bur
netii
sero
posit
ivity
in fo
ur ru
min
ant s
ecto
rs o
n an
imal
and
her
d le
vel a
nd in
resid
ents
, Q-V
IVE
stud
y, 2
009-
2011
In
divi
dual
rum
inan
t lev
el
Herd
leve
l Fa
rm re
siden
ts
Dairy
goa
ts
≥100
cat
tle p
er k
m2 in
farm
mun
icip
ality
≥1
00 c
attle
per
km
2 in fa
rm m
unic
ipal
ity
<8 k
m d
ista
nce
to n
eare
st B
TM-p
ositi
ve S
R* fa
rm
<8 k
m d
ista
nce
to n
eare
st B
TM-p
ositi
ve S
R* fa
rm
<16
km d
ista
nce
to n
eare
st B
TM-p
ositi
ve S
R* fa
rm
pr
esen
ce o
f cat
s in
the
stab
le
pres
ence
of c
ats a
nd d
ogs i
n th
e st
able
pr
esen
ce o
f cat
s in
the
stab
le
co
mba
t nui
sanc
e an
imal
s by
cove
ring
air s
pace
s co
mba
t nui
sanc
e an
imal
s by
cove
ring
air s
pace
s co
mba
t nui
sanc
e an
imal
s by
cove
ring
air s
pace
s
un
know
n if
signs
of v
erm
in p
rese
nt a
t far
m
unkn
own
if sig
ns o
f ver
min
pre
sent
at f
arm
us
e of
win
dbre
ak c
urta
ins i
n th
e st
able
or
igin
of s
traw
from
abr
oad
or u
nkno
wn
farm
loca
tion
in so
uth
of c
ount
ry
us
e of
art
ifici
al in
sem
inat
ion
herd
size
≥80
0 go
ats
dairy
goa
ts o
n ex
tend
ed la
ctat
ion
ot
her g
oat b
reed
s pre
sent
bes
ides
Dut
ch w
hite
goa
t
re
siden
ce <
10 m
eter
s fro
m n
eare
st st
able
hi
gh n
umbe
r of d
aily
farm
task
s (≥3
)
no
farm
boo
ts fo
r sta
ff
lived
as a
chi
ld o
n ru
min
ant f
arm
**
Dairy
shee
p
n/a
n/
a n/
a
Non
-dai
ry sh
eep
farm
loca
tion
in so
uth
of c
ount
ry
farm
loca
tion
in so
uth
of c
ount
ry
go
at d
ensit
y pe
r km
2 in
10-
km ra
dius
≥5.
3
goat
den
sity
per k
m2 in
5 k
m ra
dius
≥11
.4
flo
ck si
ze ≥
225
shee
p flo
ck si
ze ≥
225
shee
p
w
indb
reak
cur
tain
s and
/or w
inds
hiel
ds in
the
stab
le
≥1
supp
ly a
ddre
ss fo
r ew
es
farm
star
ted
since
199
0
un
know
n if
signs
or n
o sig
ns o
f ver
min
in ro
ugha
ge
usin
g bo
ots b
y pr
ofes
siona
l far
m v
isito
rs
pres
ence
of B
less
umer
shee
p br
eed
on fa
rm
≥
6 st
illbo
rn la
mbs
(in
2009
) sh
eep
loca
ted
at m
argi
nal g
roun
ds
refr
esh
bedd
ing
in st
able
s eve
ry o
ther
day
or m
ore
freq
uent
br
eedi
ng la
mbs
as m
ain
farm
pur
pose
air e
ntry
oth
er th
an th
roug
h do
or
sh
eep
supp
ly fr
om G
roni
ngen
and
Noo
rd-H
olla
nd p
rovi
nces
la
mbi
ng in
door
s
ag
e of
farm
resid
ent 4
0-49
yea
rs**
w
orke
d in
cat
tle se
ctor
in p
ast
ca
ttle
at s
ame
past
ure
as sh
eep,
but
not
sim
ulta
neou
sly
da
iry c
attle
pre
sent
dur
ing
stab
le p
erio
d sh
eep
co
ntac
t with
cat
tle a
t ow
n or
oth
er fa
rm
Dairy
cat
tle
n/a
(no
indi
vidu
al c
ows s
ampl
ed)
fa
rm lo
catio
n in
sout
h of
cou
ntry
EL
ISA+
: in
crea
sing
her
d si
ze (p
er 1
0 co
ws)
in
crea
sing
her
d si
ze
no u
se o
f aut
omat
ic m
ilkin
g sy
stem
no
use
of a
utom
atic
milk
ing
syst
em
≥2 p
urch
ase
loca
tions
for c
attle
ag
e of
farm
resid
ent ≥
55 y
ears
clea
n be
ddin
g in
stab
le e
very
oth
er d
ay o
r les
s pa
rt-t
ime
and
full-
time
wor
k on
farm
no
n-co
mpl
iant
use
of g
love
s dur
ing
catt
le b
irth
care
pi
g co
ntac
t at o
wn
or o
ther
farm
PC
R+:
no u
se o
f aut
omat
ic m
ilkin
g sy
stem
in
dire
ct c
onta
ct w
ith ra
ts a
nd/o
r mic
e at
farm
no g
oats
or s
heep
pre
sent
on
farm
pr
esen
ce o
f bird
s in
stab
le
ticks
at d
airy
cat
tle p
rese
nt/u
nkno
wn
beef
cat
tle p
rese
nt o
n fa
rm
dairy
cat
tle c
onta
ct a
t oth
er fa
rms
*S
R=sm
all r
umin
ant;
** b
orde
rline
risk
fact
or; n
/a, n
ot a
vaila
ble

208 | CHAPTER 6
The frequency of the BTM-monitoring program implemented in October 2009 has been reduced to monthly measurements as lambing is now more evenly spread over the year, while the rest of the preventive hygienic measures in the dairy small ruminant sector are kept in place (67). Potential health risks related to intensive animal husbandry has become a broadly debated topic in the Netherlands. These discussions have been intensified by the Q fever epidemic and the transmission of antibiotic resistant pathogens of animal origin to humans, debating the herd size, the farm density of an area and the close proximity of intense livestock farming to nearby residential areas.
Seroprevalence and occupational risk factors of C. burnetii infection in veterinary-associated populations (Chapter 5) What is already known on this topic Q fever has long been considered primarily an occupational zoonosis for abattoir workers, sheep shearers, livestock farmers, and especially veterinarians and veterinary students, because of their contact with potentially C. burnetii infected animals. In the 1980s there was already evidence that the large majority of Dutch livestock veterinarians, residents of dairy farms and wool spinners were serologically positive for C. burnetii antibodies (68), indicating that Q fever has been endemic for a long time among certain occupational groups in the Netherlands. A problem with comparing the results from studies of the 1980s is that the specificity of the indirect IFA used at that time is not known. For example also a high seroprevalence was found in the general population and antibody percentages in all age classes were much alike (68). Direct comparison with the current screening assays is not possible (69). The population-based seroprevalence survey in 2006-2007 confirmed that the presence of antibodies against C. burnetii was significantly associated with exposure to domesticated livestock by occupation or hobby (Chapter 2). The association with exposure to domesticated livestock and the agricultural industry was also shown in a large population-based study in the United States with agricultural workers six times more likely to have C. burnetii antibodies than those employed in other occupations (70). Although Q fever is often cited as an occupational disease, most acute Q fever patients actually become infected during community outbreaks (71), while occupational Q fever mainly occurs during a lifespan as sporadic infections. Based on the Dutch Q fever notification data, direct occupational exposure did not play a major role in the Q fever epidemic as only a small percentage of notified Q cases worked in the agriculture sector (3.2%) and meat processing industry (0.5%). However, the percentage of cases working in these sectors was higher than in the general population and other control groups (29) and confirms the increased occupational risk to acquire clinical Q fever. Since 2009, there is more insight in occupational exposures of cases with a notifiable infectious disease as specific questions on occupational categories and type of work were added to the national infectious disease surveillance database (72). Generally, high seroprevalence figures were found in occupational studies that screened farm residents (20, 73, 74), shepherds (75) and veterinarians for past C. burnetii infection in different countries (76-83). Studies carried out in farming populations have suggested that the disease incidence is low and that farmers dealing with cattle are considerably more at risk of infection by C. bumetii than are other farming populations (84). In seroprevalence studies that focused on the risk of C. burnetii infection in veterinarians, intensive direct contact with infected ruminants and exposures during parturition were identified as occupational risk factors (77, 82). Among veterinary students, risk factors for Q fever such as practising with living animals, especially ruminants, following specific courses focusing on animal production and food inspection, and an increasing seroprevalence prior to graduation have been reported (21, 81, 85). As the possible health impact of the Dutch Q fever epidemic was unclear for livestock veterinarians and ruminant farmers including their household members in the Netherlands, it was relevant to study C. burnetii seroprevalence and assess individual and occupational risk factors for C. burnetii seropositivity. An effective occupational Q fever vaccine is available in Australia Q fever is in theory a vaccine preventable disease. An effective whole-cell formalin-inactivated vaccine for humans is produced and only licensed in Australia since 1989 for use in persons from 15 years of age (Q-Vax; CSL Biotherapies, Parkville, Victoria, Australia) (86). An Australian government-funded national vaccination program (NQFMP) for abattoir
workers, sheep shearers and farmers, their families and employees in the livestock-rearing industry ran from 2001 to 2006. Following introduction of this program, the number of notified Q fever cases halved with the greatest reductions among young men aged 15–39 years, consistent with high documented vaccine uptake among abattoir workers (87). Since 2007, after the NQFMP finished, the vaccine remained available on the private market targeted at different occupational risk groups according to its product information. There is also a high vaccine uptake among Australian veterinarians (88), however identified potential barriers to vaccination are lack of perceived risk, financial expense, time constraints and difficulty to find a vaccine provider. The Q-Vax vaccine has been demonstrated to be highly effective and has a strong safety record in these occupational groups (89, 90). There are no indications for reduced immune responses with increasing time (91). Vaccine protection has not been evaluated in a randomized clinical trial; however, retrospective cohort studies estimate efficacy at >90% for those vaccinated at least 15 days prior to exposure (92). Following an abattoir Q fever outbreak where a Q fever vaccination program was underway, it has been proven that the Q-vax vaccine is effective if given in advance of likely C. burnetii exposure (93). Persons that already have a humoral or cellular immune response to C. burnetii can get severe adverse reactions at the injection site and are therefore contraindicated for vaccination. Because of this, potential vaccine recipients should be evaluated both for C. burnetii antibodies and by a skin test (Q-Vax skin test) prior to vaccination. Both these tests need to be negative before vaccination is advised. Since these procedures are time-consuming and costly, they preclude the use of this whole-cell vaccine in a mass vaccination program. Ongoing research efforts are targeted to develop a safer, more effective new-generation vaccine, that will not cause adverse reactions when given to someone with pre-existing immunity (94). Recent studies have concentrated on identifying protective antigens, from where development of DNA vaccines will be the next step (95, 96).
What did these studies add? High life-time risk to acquire C. burnetii infection in professionals with intensive livestock contact For all occupational groups studied in this thesis, seroprevalence figures were comparable in international context, although more in the upper range. This high seroprevalence can be influenced by the selection of study populations: small ruminant farmers that have intensive exposure to possibly infected livestock on a daily basis during the Dutch Q fever epidemic, and the focus on the specific group of livestock veterinarians who in general have a higher seroprevalence due to exposure to ruminants compared to veterinarians that solely have contact with companion animals (79), or mixed groups of veterinarians (77, 82). It is interesting to notice that the overall seroprevalence of 65% among Dutch livestock veterinarians during the Dutch Q fever epidemic was about 7% higher than in the south of Belgium (79) and 2–14% higher than in the south of Germany (77). This relative high seroprevalence can be the result of the inclusion of more recent infections, that mainly occurred among veterinary students in their final year of clinical rotations (28), or can be explained by a booster effect through continuous exposure as was suggested in studies among wool workers and livestock veterinarians (25, 28).
Seroprevalence studies among farm residents in all four ruminant sectors (dairy goat, dairy sheep, non-dairy sheep and dairy cattle) indicated a high lifetime risk for C. burnetii infection (Chapter 4). Seroprevalence figures were almost identical among farm residents of dairy goat, dairy sheep and dairy cattle, around 70%, and a bit lower in residents of meat- and breeding sheep farms (51%). One out of 9 farm residents living on a commercial dairy goat farm had evidence of a recent C. burnetii infection based on presence of IgM-phase 2 antibodies, regardless of symptoms, indicating recent exposure originating from BTM-positive small ruminant farms. There were less recent infections (1.2%) among residents of dairy cattle farms, indicating that the infection was generally in the more distant past, even though C. burnetii is widespread and enzootic in Dutch dairy cattle (Chapter 4). Veterinarians and veterinary students, ruminant farmers and other professionals intensely exposed to livestock and their physicians should be aware of this lifetime risk of Q fever to ensure a timely diagnosis and treatment, especially in case of predisposing conditions for developing chronic Q fever (20, 21, 77, 97).

6
GENERAL DISCUSSION | 209
The frequency of the BTM-monitoring program implemented in October 2009 has been reduced to monthly measurements as lambing is now more evenly spread over the year, while the rest of the preventive hygienic measures in the dairy small ruminant sector are kept in place (67). Potential health risks related to intensive animal husbandry has become a broadly debated topic in the Netherlands. These discussions have been intensified by the Q fever epidemic and the transmission of antibiotic resistant pathogens of animal origin to humans, debating the herd size, the farm density of an area and the close proximity of intense livestock farming to nearby residential areas.
Seroprevalence and occupational risk factors of C. burnetii infection in veterinary-associated populations (Chapter 5) What is already known on this topic Q fever has long been considered primarily an occupational zoonosis for abattoir workers, sheep shearers, livestock farmers, and especially veterinarians and veterinary students, because of their contact with potentially C. burnetii infected animals. In the 1980s there was already evidence that the large majority of Dutch livestock veterinarians, residents of dairy farms and wool spinners were serologically positive for C. burnetii antibodies (68), indicating that Q fever has been endemic for a long time among certain occupational groups in the Netherlands. A problem with comparing the results from studies of the 1980s is that the specificity of the indirect IFA used at that time is not known. For example also a high seroprevalence was found in the general population and antibody percentages in all age classes were much alike (68). Direct comparison with the current screening assays is not possible (69). The population-based seroprevalence survey in 2006-2007 confirmed that the presence of antibodies against C. burnetii was significantly associated with exposure to domesticated livestock by occupation or hobby (Chapter 2). The association with exposure to domesticated livestock and the agricultural industry was also shown in a large population-based study in the United States with agricultural workers six times more likely to have C. burnetii antibodies than those employed in other occupations (70). Although Q fever is often cited as an occupational disease, most acute Q fever patients actually become infected during community outbreaks (71), while occupational Q fever mainly occurs during a lifespan as sporadic infections. Based on the Dutch Q fever notification data, direct occupational exposure did not play a major role in the Q fever epidemic as only a small percentage of notified Q cases worked in the agriculture sector (3.2%) and meat processing industry (0.5%). However, the percentage of cases working in these sectors was higher than in the general population and other control groups (29) and confirms the increased occupational risk to acquire clinical Q fever. Since 2009, there is more insight in occupational exposures of cases with a notifiable infectious disease as specific questions on occupational categories and type of work were added to the national infectious disease surveillance database (72). Generally, high seroprevalence figures were found in occupational studies that screened farm residents (20, 73, 74), shepherds (75) and veterinarians for past C. burnetii infection in different countries (76-83). Studies carried out in farming populations have suggested that the disease incidence is low and that farmers dealing with cattle are considerably more at risk of infection by C. bumetii than are other farming populations (84). In seroprevalence studies that focused on the risk of C. burnetii infection in veterinarians, intensive direct contact with infected ruminants and exposures during parturition were identified as occupational risk factors (77, 82). Among veterinary students, risk factors for Q fever such as practising with living animals, especially ruminants, following specific courses focusing on animal production and food inspection, and an increasing seroprevalence prior to graduation have been reported (21, 81, 85). As the possible health impact of the Dutch Q fever epidemic was unclear for livestock veterinarians and ruminant farmers including their household members in the Netherlands, it was relevant to study C. burnetii seroprevalence and assess individual and occupational risk factors for C. burnetii seropositivity. An effective occupational Q fever vaccine is available in Australia Q fever is in theory a vaccine preventable disease. An effective whole-cell formalin-inactivated vaccine for humans is produced and only licensed in Australia since 1989 for use in persons from 15 years of age (Q-Vax; CSL Biotherapies, Parkville, Victoria, Australia) (86). An Australian government-funded national vaccination program (NQFMP) for abattoir
workers, sheep shearers and farmers, their families and employees in the livestock-rearing industry ran from 2001 to 2006. Following introduction of this program, the number of notified Q fever cases halved with the greatest reductions among young men aged 15–39 years, consistent with high documented vaccine uptake among abattoir workers (87). Since 2007, after the NQFMP finished, the vaccine remained available on the private market targeted at different occupational risk groups according to its product information. There is also a high vaccine uptake among Australian veterinarians (88), however identified potential barriers to vaccination are lack of perceived risk, financial expense, time constraints and difficulty to find a vaccine provider. The Q-Vax vaccine has been demonstrated to be highly effective and has a strong safety record in these occupational groups (89, 90). There are no indications for reduced immune responses with increasing time (91). Vaccine protection has not been evaluated in a randomized clinical trial; however, retrospective cohort studies estimate efficacy at >90% for those vaccinated at least 15 days prior to exposure (92). Following an abattoir Q fever outbreak where a Q fever vaccination program was underway, it has been proven that the Q-vax vaccine is effective if given in advance of likely C. burnetii exposure (93). Persons that already have a humoral or cellular immune response to C. burnetii can get severe adverse reactions at the injection site and are therefore contraindicated for vaccination. Because of this, potential vaccine recipients should be evaluated both for C. burnetii antibodies and by a skin test (Q-Vax skin test) prior to vaccination. Both these tests need to be negative before vaccination is advised. Since these procedures are time-consuming and costly, they preclude the use of this whole-cell vaccine in a mass vaccination program. Ongoing research efforts are targeted to develop a safer, more effective new-generation vaccine, that will not cause adverse reactions when given to someone with pre-existing immunity (94). Recent studies have concentrated on identifying protective antigens, from where development of DNA vaccines will be the next step (95, 96).
What did these studies add? High life-time risk to acquire C. burnetii infection in professionals with intensive livestock contact For all occupational groups studied in this thesis, seroprevalence figures were comparable in international context, although more in the upper range. This high seroprevalence can be influenced by the selection of study populations: small ruminant farmers that have intensive exposure to possibly infected livestock on a daily basis during the Dutch Q fever epidemic, and the focus on the specific group of livestock veterinarians who in general have a higher seroprevalence due to exposure to ruminants compared to veterinarians that solely have contact with companion animals (79), or mixed groups of veterinarians (77, 82). It is interesting to notice that the overall seroprevalence of 65% among Dutch livestock veterinarians during the Dutch Q fever epidemic was about 7% higher than in the south of Belgium (79) and 2–14% higher than in the south of Germany (77). This relative high seroprevalence can be the result of the inclusion of more recent infections, that mainly occurred among veterinary students in their final year of clinical rotations (28), or can be explained by a booster effect through continuous exposure as was suggested in studies among wool workers and livestock veterinarians (25, 28).
Seroprevalence studies among farm residents in all four ruminant sectors (dairy goat, dairy sheep, non-dairy sheep and dairy cattle) indicated a high lifetime risk for C. burnetii infection (Chapter 4). Seroprevalence figures were almost identical among farm residents of dairy goat, dairy sheep and dairy cattle, around 70%, and a bit lower in residents of meat- and breeding sheep farms (51%). One out of 9 farm residents living on a commercial dairy goat farm had evidence of a recent C. burnetii infection based on presence of IgM-phase 2 antibodies, regardless of symptoms, indicating recent exposure originating from BTM-positive small ruminant farms. There were less recent infections (1.2%) among residents of dairy cattle farms, indicating that the infection was generally in the more distant past, even though C. burnetii is widespread and enzootic in Dutch dairy cattle (Chapter 4). Veterinarians and veterinary students, ruminant farmers and other professionals intensely exposed to livestock and their physicians should be aware of this lifetime risk of Q fever to ensure a timely diagnosis and treatment, especially in case of predisposing conditions for developing chronic Q fever (20, 21, 77, 97).

210 | CHAPTER 6
Among the seropositive participants in the Q-VIVE project, 11 residents of dairy goat farms, 2 residents of a dairy cattle farm, 1 of a dairy sheep farm and 7 livestock veterinarians showed a serological profile compatible with possible chronic Q fever (Chapter 4 and 5), defined by an IgG phase I titer ≥1:1024 (98). None of them could be confirmed that these truly were chronic Q fever cases because clinical information (e.g., presence of vascular infection, endocardial involvement, or other clinical risk factors) was lacking. Although apparently healthy, proper serological follow-up as well as a medical examination should be recommended in study participants with this serological profile (79). Few periodical screening studies have been conducted to examine C. burnetii seroconversion rates and associated risk factors among exposed workers (82, 99). By following incoming, seronegative veterinary students through their veterinary program during a four-year study period, almost one out of five veterinary students seroconverted (personal communication Wim van der Hoek, RIVM), resembling the seroconversion rate in the culling workers, however during a longer time-span and not in an outbreak context. A short follow-up period of several months was sufficient in high exposure settings as was done in the culling worker study. In low-intensity settings a longer follow-up period is useful to assess the seroconversion rate and clinical impact, as was done in a cohort of first-year veterinary students participating in the Veterinarians’ Health study (VHS II) (22, 100). More efforts could be made in existing data to identify predictor variables for specific serological profiles including potential chronic C. burnetii infection as was done in Belgium livestock veterinarians using classification and regression tree analysis. Contact with manure during the prior month was found to be significantly associated with a higher risk of C. burnetii seropositivity while frequent contacts with bovine birth products in veterinarians aged 34 years or older could explain all potentially chronic C. burnetii infections (79). Occupational risk factors for C. burnetii infection in professionals with intensive exposure to livestock Identified risk factors for occupational past C. burnetii infection in Dutch livestock veterinarians were the number of hours with animal contact per week, number of years graduated as veterinarian, rural or suburban residence area, being a practicing veterinarian and occupational contact with swine. In Dutch veterinary students, advanced year of study, experiencing a zoonotic disease since starting the veterinary medicine curriculum and having ever lived on a ruminant farm were significant risk factors for being C. burnetii IgG-phase 2 seropositive (Chapter 5). Workers involved in the culling of more than 50,000 sheep and goats in December 2009 up to June 2010 were recruited into a prospective cohort study to examine C. burnetii seroconversion and related morbidity while culling. Despite the fact that these culling workers were given instructions in advance through a common presentation, advised to read the occupational health and hygiene regulations, and were provided with personal protective equipment (PPE) including FFP3 masks (‘Face Filtering Pieces’ thought to filter at least 99% of airborne particles), 17.5% seroconverted for antibodies to C. burnetii and one third of them reported a clinical episode with fever, headache and cough after culling. Working in close proximity to the animals inside the stable and prolonged contact (>100 hours per week) were risk factors for seroconversion. Anecdotally, culling workers reported removing PPE during coffee breaks and lunch breaks, which may have contributed to the high proportion of seroconversions recorded. In the context of inevitable exposure during animal culling, workers should be carefully instructed on PPE compliance in designated risk areas. Vaccination should be provided in professionals working short-term in high-exposure settings with inevitable exposure, as was the case in the group of culling workers (Chapter 5), but unfortunately this option was barely considered and not introduced in the Netherlands (101, 102). Vaccination against Q fever as an occupational control measure Q fever is a serious disease with a possible severe outcome and a high disability adjusted life years (DALY) burden (103). Vaccination of occupational risk groups is a feasible preventive option as specific risk groups have been clearly defined, with a specific focus on employees with intensive livestock contact. The availability of a Q fever vaccine is of particular interest to veterinary professionals, ruminant farmers and abattoir employees in the context of high lifetime risk for C. burnetii infection. The European Centre for Disease Prevention and Control (ECDC) has also called for the availability and use of Q-Vax among at-risk groups in Europe, including professionals coming into contact with livestock, besides persons with cardiovascular disease and immunosuppressed patients, while a new-generation vaccine is being developed (96, 104, 105).
The Health Council of the Netherlands released two advisory reports on Q fever vaccination in 2010. The Q fever vaccine can be of direct benefit to those with inevitable occupational exposure to C. burnetii or be beneficial to those with background medical conditions that might increase complication risks after having been infected with C. burnetii. In the first report, the Health Council Committee advised a Q fever vaccine campaign for patients at high risk of developing cardiovascular complications. It was designed as a one-of campaign in July 2011 and resulted in a limited coverage due to this late implementation and ending of the epidemic (106, 107). In the second report, the Committee decided not to provide this vaccine to current occupational groups with intense livestock contact such as dairy ruminant farmers, sheep shearers, laborers and veterinarians, or future professionals at risk for C. burnetii infection. While the vaccine effectiveness and occurrence of possible adverse reactions was in favor for the use of Q-Vax in these professional groups, the Committee anticipated on a low disease burden in the current professionals with intense livestock contact, as the large majority have already acquired C. burnetii antibodies, but also concluded the vaccine would be of limited efficiency in future professionals, using the same argument of a low anticipated disease burden in terms of severity and magnitude in the future (101, 102). The Health Council Committee acknowledged that the advice was based on limited research data and recommended further research regarding C. burnetii infection, underreporting and disease burden among future professionals coming into contact with livestock, such as veterinary students (102). The Committee also stated that another approach, using a more precautionary principle guaranteeing a healthy working environment for employees at all times, could lead to a different recommendation. Nevertheless, an important consideration not to advice Q-Vax for occupational groups and future professionals with livestock contact is that Q-Vax is currently not registered for use in the Netherlands. The Health Council Committee deemed it unlikely that such registration could still take place, given the available data and the relevant requirements (102). Without a license, Q-Vax can only be administered after the patients’ physician has signed a doctor’s statement and the recipient of the vaccine has signed an informed consent form, which are both significant hurdles. In 2009, the same issue was debated in the United Kingdom by the Joint Committee on Vaccination and Immunization (JCVI) after a Scottish Q fever outbreak in a slaughterhouse and cutting plant affecting a large group of short-term migrant workers who were lost for serological follow-up (108, 109). This Committee also concluded that more detailed studies were needed to assess the burden of disease in occupational risk groups, including exposed or potentially exposed workers before a decision could be made if the vaccine could be routinely implemented in an occupational context. Given the lack of data on occupational exposure and risk of infection, and the adverse reaction profile of Q-vax, this Committee stated that it could not recommend Q-fever vaccination (110). However, with the available research data as also included in this thesis, the true clinical burden in livestock-associated occupational groups has not yet been established as low, but rather is unknown. Although there is enough evidence that veterinarians and especially those working with livestock are highly exposed to C. burnetii during their lifespan, clinical disease is mostly not directly recognized because of the asymptomatic and often benign and mild, nonspecific presentation of the infection. The assumed and perceived low clinical burden of disease in occupational risk groups, might not reflect the true clinical burden, because of several reasons: 1. Based on seroprevalence data reaching a plateau at young adult age in rural areas (111) and seroconversion rates among veterinary students (personal communication Wim van der Hoek), it is likely that professionals with a high a priori risk acquire a C. burnetii infection at a relatively early stage of their professional career, which can be decades before study inclusion to assess seroprevalence and risk factors for C. burnetii infection such as during the Dutch Q fever epidemic. That explains why the livestock veterinarians and dairy cattle farmers were probably less likely to develop clinical Q fever during the epidemic years 2007-2009, due to previous C. burnetii exposure.

6
GENERAL DISCUSSION | 211
Among the seropositive participants in the Q-VIVE project, 11 residents of dairy goat farms, 2 residents of a dairy cattle farm, 1 of a dairy sheep farm and 7 livestock veterinarians showed a serological profile compatible with possible chronic Q fever (Chapter 4 and 5), defined by an IgG phase I titer ≥1:1024 (98). None of them could be confirmed that these truly were chronic Q fever cases because clinical information (e.g., presence of vascular infection, endocardial involvement, or other clinical risk factors) was lacking. Although apparently healthy, proper serological follow-up as well as a medical examination should be recommended in study participants with this serological profile (79). Few periodical screening studies have been conducted to examine C. burnetii seroconversion rates and associated risk factors among exposed workers (82, 99). By following incoming, seronegative veterinary students through their veterinary program during a four-year study period, almost one out of five veterinary students seroconverted (personal communication Wim van der Hoek, RIVM), resembling the seroconversion rate in the culling workers, however during a longer time-span and not in an outbreak context. A short follow-up period of several months was sufficient in high exposure settings as was done in the culling worker study. In low-intensity settings a longer follow-up period is useful to assess the seroconversion rate and clinical impact, as was done in a cohort of first-year veterinary students participating in the Veterinarians’ Health study (VHS II) (22, 100). More efforts could be made in existing data to identify predictor variables for specific serological profiles including potential chronic C. burnetii infection as was done in Belgium livestock veterinarians using classification and regression tree analysis. Contact with manure during the prior month was found to be significantly associated with a higher risk of C. burnetii seropositivity while frequent contacts with bovine birth products in veterinarians aged 34 years or older could explain all potentially chronic C. burnetii infections (79). Occupational risk factors for C. burnetii infection in professionals with intensive exposure to livestock Identified risk factors for occupational past C. burnetii infection in Dutch livestock veterinarians were the number of hours with animal contact per week, number of years graduated as veterinarian, rural or suburban residence area, being a practicing veterinarian and occupational contact with swine. In Dutch veterinary students, advanced year of study, experiencing a zoonotic disease since starting the veterinary medicine curriculum and having ever lived on a ruminant farm were significant risk factors for being C. burnetii IgG-phase 2 seropositive (Chapter 5). Workers involved in the culling of more than 50,000 sheep and goats in December 2009 up to June 2010 were recruited into a prospective cohort study to examine C. burnetii seroconversion and related morbidity while culling. Despite the fact that these culling workers were given instructions in advance through a common presentation, advised to read the occupational health and hygiene regulations, and were provided with personal protective equipment (PPE) including FFP3 masks (‘Face Filtering Pieces’ thought to filter at least 99% of airborne particles), 17.5% seroconverted for antibodies to C. burnetii and one third of them reported a clinical episode with fever, headache and cough after culling. Working in close proximity to the animals inside the stable and prolonged contact (>100 hours per week) were risk factors for seroconversion. Anecdotally, culling workers reported removing PPE during coffee breaks and lunch breaks, which may have contributed to the high proportion of seroconversions recorded. In the context of inevitable exposure during animal culling, workers should be carefully instructed on PPE compliance in designated risk areas. Vaccination should be provided in professionals working short-term in high-exposure settings with inevitable exposure, as was the case in the group of culling workers (Chapter 5), but unfortunately this option was barely considered and not introduced in the Netherlands (101, 102). Vaccination against Q fever as an occupational control measure Q fever is a serious disease with a possible severe outcome and a high disability adjusted life years (DALY) burden (103). Vaccination of occupational risk groups is a feasible preventive option as specific risk groups have been clearly defined, with a specific focus on employees with intensive livestock contact. The availability of a Q fever vaccine is of particular interest to veterinary professionals, ruminant farmers and abattoir employees in the context of high lifetime risk for C. burnetii infection. The European Centre for Disease Prevention and Control (ECDC) has also called for the availability and use of Q-Vax among at-risk groups in Europe, including professionals coming into contact with livestock, besides persons with cardiovascular disease and immunosuppressed patients, while a new-generation vaccine is being developed (96, 104, 105).
The Health Council of the Netherlands released two advisory reports on Q fever vaccination in 2010. The Q fever vaccine can be of direct benefit to those with inevitable occupational exposure to C. burnetii or be beneficial to those with background medical conditions that might increase complication risks after having been infected with C. burnetii. In the first report, the Health Council Committee advised a Q fever vaccine campaign for patients at high risk of developing cardiovascular complications. It was designed as a one-of campaign in July 2011 and resulted in a limited coverage due to this late implementation and ending of the epidemic (106, 107). In the second report, the Committee decided not to provide this vaccine to current occupational groups with intense livestock contact such as dairy ruminant farmers, sheep shearers, laborers and veterinarians, or future professionals at risk for C. burnetii infection. While the vaccine effectiveness and occurrence of possible adverse reactions was in favor for the use of Q-Vax in these professional groups, the Committee anticipated on a low disease burden in the current professionals with intense livestock contact, as the large majority have already acquired C. burnetii antibodies, but also concluded the vaccine would be of limited efficiency in future professionals, using the same argument of a low anticipated disease burden in terms of severity and magnitude in the future (101, 102). The Health Council Committee acknowledged that the advice was based on limited research data and recommended further research regarding C. burnetii infection, underreporting and disease burden among future professionals coming into contact with livestock, such as veterinary students (102). The Committee also stated that another approach, using a more precautionary principle guaranteeing a healthy working environment for employees at all times, could lead to a different recommendation. Nevertheless, an important consideration not to advice Q-Vax for occupational groups and future professionals with livestock contact is that Q-Vax is currently not registered for use in the Netherlands. The Health Council Committee deemed it unlikely that such registration could still take place, given the available data and the relevant requirements (102). Without a license, Q-Vax can only be administered after the patients’ physician has signed a doctor’s statement and the recipient of the vaccine has signed an informed consent form, which are both significant hurdles. In 2009, the same issue was debated in the United Kingdom by the Joint Committee on Vaccination and Immunization (JCVI) after a Scottish Q fever outbreak in a slaughterhouse and cutting plant affecting a large group of short-term migrant workers who were lost for serological follow-up (108, 109). This Committee also concluded that more detailed studies were needed to assess the burden of disease in occupational risk groups, including exposed or potentially exposed workers before a decision could be made if the vaccine could be routinely implemented in an occupational context. Given the lack of data on occupational exposure and risk of infection, and the adverse reaction profile of Q-vax, this Committee stated that it could not recommend Q-fever vaccination (110). However, with the available research data as also included in this thesis, the true clinical burden in livestock-associated occupational groups has not yet been established as low, but rather is unknown. Although there is enough evidence that veterinarians and especially those working with livestock are highly exposed to C. burnetii during their lifespan, clinical disease is mostly not directly recognized because of the asymptomatic and often benign and mild, nonspecific presentation of the infection. The assumed and perceived low clinical burden of disease in occupational risk groups, might not reflect the true clinical burden, because of several reasons: 1. Based on seroprevalence data reaching a plateau at young adult age in rural areas (111) and seroconversion rates among veterinary students (personal communication Wim van der Hoek), it is likely that professionals with a high a priori risk acquire a C. burnetii infection at a relatively early stage of their professional career, which can be decades before study inclusion to assess seroprevalence and risk factors for C. burnetii infection such as during the Dutch Q fever epidemic. That explains why the livestock veterinarians and dairy cattle farmers were probably less likely to develop clinical Q fever during the epidemic years 2007-2009, due to previous C. burnetii exposure.

212 | CHAPTER 6
2. Several clinical Q fever cases within one occupational group during the Dutch Q fever epidemic, e.g. livestock veterinarians, appear to be a low absolute number, especially when compared to the high case numbers notified during the Dutch Q fever epidemic. However if one realizes that sporadic occupational cases keep occurring during the whole lifespan, a few notified veterinarians or livestock farmers with acute Q fever during one year can still represent a high attack rate within this occupational group, as the denominator data of these occupational groups are much smaller compared to the larger population at risk from where community Q fever cases arose. 3. There is a reported lower healthcare utilization by persons with increased livestock exposure, as well as a lower latent demand indicated by self-reported symptoms (112). It is hypothesized that this population has a different attitude towards reporting of symptoms and visiting healthcare providers that could lead to a selection bias when using GP-recorded data, and thereby underestimating the true clinical Q fever burden in these groups. Further studies are therefore warranted that are more centered around the time of infection in order to assess the true clinical burden in professional groups with a high a priori occupational risk for C. burnetii infection. Such a study could be combined with the assessment of other zoonotic risks or non-infectious diseases as part of a targeted occupational surveillance, including periodical serological screening, monitoring relevant occupational exposures and self-reported symptoms, collection of sick leave registrations and health care visits. In order to establish the currently unknown occupational burden of chronic Q fever, information on occupation and specific occupational exposures should also be collected as part of the Dutch chronic Q fever database that until May 2016 includes over 400 proven, probable and possible chronic Q fever patients (113).
Vaccination of future livestock farmers, veterinarians and short-term professionals working in high-exposure settings with inevitable exposure Seroprevalence findings in Dutch livestock veterinarians, veterinary students, culling workers and small ruminant and dairy cattle farmers, even though the complete clinical picture is absent, are in favor of seriously discussing the eventual Q fever vaccine benefits as they all encounter a high lifetime risk of C. burnetii infection (Chapter 4 and 5). The timing of vaccination is important to determine in the different professional groups that could benefit of this vaccine, e.g. first-year veterinary students at the beginning of their degree or new farm employees that start to work on a ruminant farm or pet farm. With the current available studies in occupational settings, including those included in this thesis in Chapter 4 and 5, not vaccinating future professionals coming into extensive and close contact with livestock is a missed opportunity. It remains unclear why the same occupational groups that are entitled to receive an occupational Q fever vaccine in Australia, would not benefit from this vaccine when administered in an occupational setting in the Netherlands. However, caution must be taken when interpreting the current effect of C. burnetii vaccination as significant heterogeneity amongst publications was observed in recent meta-analyses (114, 115). Extensive knowledge on the size of the target occupational groups, the actual risk of occupational exposures and the number needed to screen are needed to assess the cost effectiveness for this intervention. However an effective occupational preventive measure does not necessarily need to be cost-effective as long as the occupational risk is effectively reduced. A recent call for a large, double-blind, multi-center randomized controlled trial was made to better help to establish the clinical effect of vaccination amongst occupationally exposed groups (115). So far, the evidence included may not be sufficiently robust to extrapolate the effect of vaccination beyond the population of relatively healthy and young abattoir workers with a high risk to acquire Q fever in Australia. It is imperative to involve occupational health experts, employers and representatives of occupational groups in this debate of using Q fever vaccination as effective occupational preventive measure. The Netherlands Centre for Occupational Disease released a background document as part of the registration guideline for Q fever as an occupational disease in July 2016 (116), but unfortunately failed to discuss the advantages of Q fever vaccination for professionals at risk for Q fever in an occupational setting as it just briefly copied the recommendations made by the Health Council of the Netherlands (101, 102).
References (Chapter 6)
1. Anderson AD, Kruszon-Moran D, Loftis AD, McQuillan G, Nicholson WL, Priestley RA, et al. Seroprevalence of Q fever in the United States, 2003-2004. Am J Trop Med Hyg. 2009;81(4):691-4.
2. Wegdam-Blans MC, Wielders CC, Meekelenkamp J, Korbeeck JM, Herremans T, Tjhie HT, et al. Evaluation of commonly used serological tests for detection of Coxiella burnetii antibodies in well-defined acute and follow-up sera. Clin Vaccine Immunol. 2012;19(7):1110-5.
3. Blaauw GJ, Notermans DW, Schimmer B, Meekelenkamp J, Reimerink JH, Teunis P, et al. The application of an enzyme-linked immunosorbent assay or an immunofluorescent assay test leads to different estimates of seroprevalence of Coxiella burnetii in the population. Epidemiology and infection. 2012;140(1):36-41.
4. Anderson A, Bijlmer H, Fournier PE, Graves S, Hartzell J, Kersh GJ, et al. Diagnosis and management of Q fever--United States, 2013: recommendations from CDC and the Q Fever Working Group. MMWR Recomm Rep. 2013;62(RR-03):1-30.
5. Maurin M, Raoult D. Q fever. Clinical microbiology reviews. 1999;12(4):518-53. 6. Dupuis G, Peter O, Peacock M, Burgdorfer W, Haller E. Immunoglobulin responses in acute Q fever. Journal of clinical
microbiology. 1985;22(4):484-7. 7. Guigno D, Coupland B, Smith EG, Farrell ID, Desselberger U, Caul EO. Primary humoral antibody response to Coxiella
burnetii, the causative agent of Q fever. Journal of clinical microbiology. 1992;30(8):1958-67. 8. Worswick D, Marmion BP. Antibody responses in acute and chronic Q fever and in subjects vaccinated against Q fever. J
Med Microbiol. 1985;19(3):281-96. 9. Dupont HT, Thirion X, Raoult D. Q fever serology: cutoff determination for microimmunofluorescence. Clin Diagn Lab
Immunol. 1994;1(2):189-96. 10. Limonard GJ, Nabuurs-Franssen MH, Weers-Pothoff G, Wijkmans C, Besselink R, Horrevorts AM, et al. One-year follow-up
of patients of the ongoing Dutch Q fever outbreak: clinical, serological and echocardiographic findings. Infection. 2010;38(6):471-7.
11. Hogema BM, Slot E, Molier M, Schneeberger PM, Hermans MH, van Hannen EJ, et al. Coxiella burnetii infection among blood donors during the 2009 Q-fever outbreak in The Netherlands. Transfusion. 2012;52(1):144-50.
12. Maassen KS, L. Wouters, I. van Duijkeren, E. Janse, I. Hagenaars, T. IJzermans, J. van der Hoek, W. Heederik, D. Livestock farming and the health of local residents (in Dutch). Bilthoven, the Netherlands: National Institute of Public Health and the Environment; 2016 05-07-2016. Contract No.: RIVM Report 2016-0058.
13. van der Hoek W, Meekelenkamp JC, Dijkstra F, Notermans DW, Bom B, Vellema P, et al. Proximity to goat farms and Coxiella burnetii seroprevalence among pregnant women. Emerging infectious diseases. 2011;17(12):2360-3.
14. Kampschreur LM, Hagenaars JC, Wielders CC, Elsman P, Lestrade PJ, Koning OH, et al. Screening for Coxiella burnetii seroprevalence in chronic Q fever high-risk groups reveals the magnitude of the Dutch Q fever outbreak. Epidemiology and infection. 2013;141(4):847-51.
15. Schimmer B, Lenferink A, Schneeberger P, Aangenend H, Vellema P, Hautvast J, et al. Seroprevalence and risk factors for Coxiella burnetii (Q fever) seropositivity in dairy goat farmers' households in The Netherlands, 2009-2010. PloS one. 2012;7(7):e42364.
16. Van den Brom R, Schimmer B, Schneeberger PM, Swart WA, van der Hoek W, Vellema P. Seroepidemiological survey for Coxiella burnetii antibodies and associated risk factors in Dutch livestock veterinarians. PloS one. 2013;8(1):e54021.
17. Whelan J, Schimmer B, Schneeberger P, Meekelenkamp J, Ijff A, van der Hoek W, et al. Q fever among culling workers, the Netherlands, 2009-2010. Emerging infectious diseases. 2011;17(9):1719-23.
18. van der Hoek W, Schneeberger PM, Oomen T, Wegdam-Blans MC, Dijkstra F, Notermans DW, et al. Shifting priorities in the aftermath of a Q fever epidemic in 2007 to 2009 in The Netherlands: from acute to chronic infection. Euro surveillance. 2012;17(3):2009.
19. Wielders CC, Teunis PF, Hermans MH, van der Hoek W, Schneeberger PM. Kinetics of antibody response to Coxiella burnetii infection (Q fever): Estimation of the seroresponse onset from antibody levels. Epidemics. 2015;13:37-43.
20. Thomas DR, Treweek L, Salmon RL, Kench SM, Coleman TJ, Meadows D, et al. The risk of acquiring Q fever on farms: a seroepidemiological study. Occupational and environmental medicine. 1995;52(10):644-7.
21. Sanchez A, Prats-van der Ham M, Tatay-Dualde J, Paterna A, de la Fe C, Gomez-Martin A, et al. Zoonoses in Veterinary Students: A Systematic Review of the Literature. PloS one. 2017;12(1):e0169534.
22. IRAS UU. VHS study II: cohort study among allergic and non-allergic health risks starting with first year veterinary students at the University of Utrecht, the Netherlands: study brochure. Utrechtt; 2009. Available: http://www.iras.uu.nl/vhs/
23. Chu H, Yoo SJ, Hwang KJ, Lim HS, Lee K, Park MY. Seroreactivity to Q Fever Among Slaughterhouse Workers in South Korea. J Prev Med Public Health. 2017;50(3):195-200.
24. Greig JE, Patel MS, Clements MS, Taylor NK. Control strategies for Q fever based on results of pre-vaccination screening in Victoria, 1988 to 2001. Australian and New Zealand journal of public health. 2005;29(1):53-7.
25. Wattiau P, Boldisova E, Toman R, Van Esbroeck M, Quoilin S, Hammadi S, et al. Q fever in Woolsorters, Belgium. Emerging infectious diseases. 2011;17(12):2368-9.
26. Anderson AD, Smoak B, Shuping E, Ockenhouse C, Petruccelli B. Q fever and the US military. Emerging infectious diseases. 2005;11(8):1320-2.
27. Villumsen S, Jorgensen CS, Smith B, Uldum S, Schiellerup P, Krogfelt KA. Determination of new cutoff values for indirect immunofluorescence antibody test for Q fever diagnosis in Denmark. Diagnostic microbiology and infectious disease. 2009;65(2):93-8.

6
GENERAL DISCUSSION | 213
2. Several clinical Q fever cases within one occupational group during the Dutch Q fever epidemic, e.g. livestock veterinarians, appear to be a low absolute number, especially when compared to the high case numbers notified during the Dutch Q fever epidemic. However if one realizes that sporadic occupational cases keep occurring during the whole lifespan, a few notified veterinarians or livestock farmers with acute Q fever during one year can still represent a high attack rate within this occupational group, as the denominator data of these occupational groups are much smaller compared to the larger population at risk from where community Q fever cases arose. 3. There is a reported lower healthcare utilization by persons with increased livestock exposure, as well as a lower latent demand indicated by self-reported symptoms (112). It is hypothesized that this population has a different attitude towards reporting of symptoms and visiting healthcare providers that could lead to a selection bias when using GP-recorded data, and thereby underestimating the true clinical Q fever burden in these groups. Further studies are therefore warranted that are more centered around the time of infection in order to assess the true clinical burden in professional groups with a high a priori occupational risk for C. burnetii infection. Such a study could be combined with the assessment of other zoonotic risks or non-infectious diseases as part of a targeted occupational surveillance, including periodical serological screening, monitoring relevant occupational exposures and self-reported symptoms, collection of sick leave registrations and health care visits. In order to establish the currently unknown occupational burden of chronic Q fever, information on occupation and specific occupational exposures should also be collected as part of the Dutch chronic Q fever database that until May 2016 includes over 400 proven, probable and possible chronic Q fever patients (113).
Vaccination of future livestock farmers, veterinarians and short-term professionals working in high-exposure settings with inevitable exposure Seroprevalence findings in Dutch livestock veterinarians, veterinary students, culling workers and small ruminant and dairy cattle farmers, even though the complete clinical picture is absent, are in favor of seriously discussing the eventual Q fever vaccine benefits as they all encounter a high lifetime risk of C. burnetii infection (Chapter 4 and 5). The timing of vaccination is important to determine in the different professional groups that could benefit of this vaccine, e.g. first-year veterinary students at the beginning of their degree or new farm employees that start to work on a ruminant farm or pet farm. With the current available studies in occupational settings, including those included in this thesis in Chapter 4 and 5, not vaccinating future professionals coming into extensive and close contact with livestock is a missed opportunity. It remains unclear why the same occupational groups that are entitled to receive an occupational Q fever vaccine in Australia, would not benefit from this vaccine when administered in an occupational setting in the Netherlands. However, caution must be taken when interpreting the current effect of C. burnetii vaccination as significant heterogeneity amongst publications was observed in recent meta-analyses (114, 115). Extensive knowledge on the size of the target occupational groups, the actual risk of occupational exposures and the number needed to screen are needed to assess the cost effectiveness for this intervention. However an effective occupational preventive measure does not necessarily need to be cost-effective as long as the occupational risk is effectively reduced. A recent call for a large, double-blind, multi-center randomized controlled trial was made to better help to establish the clinical effect of vaccination amongst occupationally exposed groups (115). So far, the evidence included may not be sufficiently robust to extrapolate the effect of vaccination beyond the population of relatively healthy and young abattoir workers with a high risk to acquire Q fever in Australia. It is imperative to involve occupational health experts, employers and representatives of occupational groups in this debate of using Q fever vaccination as effective occupational preventive measure. The Netherlands Centre for Occupational Disease released a background document as part of the registration guideline for Q fever as an occupational disease in July 2016 (116), but unfortunately failed to discuss the advantages of Q fever vaccination for professionals at risk for Q fever in an occupational setting as it just briefly copied the recommendations made by the Health Council of the Netherlands (101, 102).
References (Chapter 6)
1. Anderson AD, Kruszon-Moran D, Loftis AD, McQuillan G, Nicholson WL, Priestley RA, et al. Seroprevalence of Q fever in the United States, 2003-2004. Am J Trop Med Hyg. 2009;81(4):691-4.
2. Wegdam-Blans MC, Wielders CC, Meekelenkamp J, Korbeeck JM, Herremans T, Tjhie HT, et al. Evaluation of commonly used serological tests for detection of Coxiella burnetii antibodies in well-defined acute and follow-up sera. Clin Vaccine Immunol. 2012;19(7):1110-5.
3. Blaauw GJ, Notermans DW, Schimmer B, Meekelenkamp J, Reimerink JH, Teunis P, et al. The application of an enzyme-linked immunosorbent assay or an immunofluorescent assay test leads to different estimates of seroprevalence of Coxiella burnetii in the population. Epidemiology and infection. 2012;140(1):36-41.
4. Anderson A, Bijlmer H, Fournier PE, Graves S, Hartzell J, Kersh GJ, et al. Diagnosis and management of Q fever--United States, 2013: recommendations from CDC and the Q Fever Working Group. MMWR Recomm Rep. 2013;62(RR-03):1-30.
5. Maurin M, Raoult D. Q fever. Clinical microbiology reviews. 1999;12(4):518-53. 6. Dupuis G, Peter O, Peacock M, Burgdorfer W, Haller E. Immunoglobulin responses in acute Q fever. Journal of clinical
microbiology. 1985;22(4):484-7. 7. Guigno D, Coupland B, Smith EG, Farrell ID, Desselberger U, Caul EO. Primary humoral antibody response to Coxiella
burnetii, the causative agent of Q fever. Journal of clinical microbiology. 1992;30(8):1958-67. 8. Worswick D, Marmion BP. Antibody responses in acute and chronic Q fever and in subjects vaccinated against Q fever. J
Med Microbiol. 1985;19(3):281-96. 9. Dupont HT, Thirion X, Raoult D. Q fever serology: cutoff determination for microimmunofluorescence. Clin Diagn Lab
Immunol. 1994;1(2):189-96. 10. Limonard GJ, Nabuurs-Franssen MH, Weers-Pothoff G, Wijkmans C, Besselink R, Horrevorts AM, et al. One-year follow-up
of patients of the ongoing Dutch Q fever outbreak: clinical, serological and echocardiographic findings. Infection. 2010;38(6):471-7.
11. Hogema BM, Slot E, Molier M, Schneeberger PM, Hermans MH, van Hannen EJ, et al. Coxiella burnetii infection among blood donors during the 2009 Q-fever outbreak in The Netherlands. Transfusion. 2012;52(1):144-50.
12. Maassen KS, L. Wouters, I. van Duijkeren, E. Janse, I. Hagenaars, T. IJzermans, J. van der Hoek, W. Heederik, D. Livestock farming and the health of local residents (in Dutch). Bilthoven, the Netherlands: National Institute of Public Health and the Environment; 2016 05-07-2016. Contract No.: RIVM Report 2016-0058.
13. van der Hoek W, Meekelenkamp JC, Dijkstra F, Notermans DW, Bom B, Vellema P, et al. Proximity to goat farms and Coxiella burnetii seroprevalence among pregnant women. Emerging infectious diseases. 2011;17(12):2360-3.
14. Kampschreur LM, Hagenaars JC, Wielders CC, Elsman P, Lestrade PJ, Koning OH, et al. Screening for Coxiella burnetii seroprevalence in chronic Q fever high-risk groups reveals the magnitude of the Dutch Q fever outbreak. Epidemiology and infection. 2013;141(4):847-51.
15. Schimmer B, Lenferink A, Schneeberger P, Aangenend H, Vellema P, Hautvast J, et al. Seroprevalence and risk factors for Coxiella burnetii (Q fever) seropositivity in dairy goat farmers' households in The Netherlands, 2009-2010. PloS one. 2012;7(7):e42364.
16. Van den Brom R, Schimmer B, Schneeberger PM, Swart WA, van der Hoek W, Vellema P. Seroepidemiological survey for Coxiella burnetii antibodies and associated risk factors in Dutch livestock veterinarians. PloS one. 2013;8(1):e54021.
17. Whelan J, Schimmer B, Schneeberger P, Meekelenkamp J, Ijff A, van der Hoek W, et al. Q fever among culling workers, the Netherlands, 2009-2010. Emerging infectious diseases. 2011;17(9):1719-23.
18. van der Hoek W, Schneeberger PM, Oomen T, Wegdam-Blans MC, Dijkstra F, Notermans DW, et al. Shifting priorities in the aftermath of a Q fever epidemic in 2007 to 2009 in The Netherlands: from acute to chronic infection. Euro surveillance. 2012;17(3):2009.
19. Wielders CC, Teunis PF, Hermans MH, van der Hoek W, Schneeberger PM. Kinetics of antibody response to Coxiella burnetii infection (Q fever): Estimation of the seroresponse onset from antibody levels. Epidemics. 2015;13:37-43.
20. Thomas DR, Treweek L, Salmon RL, Kench SM, Coleman TJ, Meadows D, et al. The risk of acquiring Q fever on farms: a seroepidemiological study. Occupational and environmental medicine. 1995;52(10):644-7.
21. Sanchez A, Prats-van der Ham M, Tatay-Dualde J, Paterna A, de la Fe C, Gomez-Martin A, et al. Zoonoses in Veterinary Students: A Systematic Review of the Literature. PloS one. 2017;12(1):e0169534.
22. IRAS UU. VHS study II: cohort study among allergic and non-allergic health risks starting with first year veterinary students at the University of Utrecht, the Netherlands: study brochure. Utrechtt; 2009. Available: http://www.iras.uu.nl/vhs/
23. Chu H, Yoo SJ, Hwang KJ, Lim HS, Lee K, Park MY. Seroreactivity to Q Fever Among Slaughterhouse Workers in South Korea. J Prev Med Public Health. 2017;50(3):195-200.
24. Greig JE, Patel MS, Clements MS, Taylor NK. Control strategies for Q fever based on results of pre-vaccination screening in Victoria, 1988 to 2001. Australian and New Zealand journal of public health. 2005;29(1):53-7.
25. Wattiau P, Boldisova E, Toman R, Van Esbroeck M, Quoilin S, Hammadi S, et al. Q fever in Woolsorters, Belgium. Emerging infectious diseases. 2011;17(12):2368-9.
26. Anderson AD, Smoak B, Shuping E, Ockenhouse C, Petruccelli B. Q fever and the US military. Emerging infectious diseases. 2005;11(8):1320-2.
27. Villumsen S, Jorgensen CS, Smith B, Uldum S, Schiellerup P, Krogfelt KA. Determination of new cutoff values for indirect immunofluorescence antibody test for Q fever diagnosis in Denmark. Diagnostic microbiology and infectious disease. 2009;65(2):93-8.
214 | CHAPTER 6
28. Wielders CC, Boerman AW, Schimmer B, van den Brom R, Notermans DW, van der Hoek W, et al. Persistent high IgG phase I antibody levels against Coxiella burnetii among veterinarians compared to patients previously diagnosed with acute Q fever after three years of follow-up. PloS one. 2015;10(1):e0116937.
29. Dijkstra F, van der Hoek W, Wijers N, Schimmer B, Rietveld A, Wijkmans CJ, et al. The 2007-2010 Q fever epidemic in The Netherlands: characteristics of notified acute Q fever patients and the association with dairy goat farming. FEMS immunology and medical microbiology. 2012;64(1):3-12.
30. Schimmer B, Morroy G, Dijkstra F, Schneeberger PM, Weers-Pothoff G, Timen A, et al. Large ongoing Q fever outbreak in the south of The Netherlands, 2008. Euro surveillance. 2008;13(31).
31. van der Hoek W, Dijkstra F, Schimmer B, Schneeberger PM, Vellema P, Wijkmans C, et al. Q fever in the Netherlands: an update on the epidemiology and control measures. Euro surveillance.2010;15(12).
32. Roest HI, Tilburg JJ, van der Hoek W, Vellema P, van Zijderveld FG, Klaassen CH, et al. The Q fever epidemic in The Netherlands: history, onset, response and reflection. Epidemiology and infection. 2011;139(1):1-12.
33. Wouda W, Dercksen DP. [Abortion and stillbirth among dairy goats as a consequence of Coxiella burnetii]. Tijdschrift voor diergeneeskunde. 2007;132(23):908-11.
34. Karagiannis I, Morroy G, Rietveld A, Horrevorts AM, Hamans M, Francken P, et al. Q fever outbreak in the Netherlands: a preliminary report. Euro surveillance. 2007;12(8):E070809 2.
35. Georgiev M, Afonso A, Neubauer H, Needham H, Thiery R, Rodolakis A, et al. Q fever in humans and farm animals in four European countries, 1982 to 2010. Euro surveillance. 2013;18(8).
36. Hilbert A, Reith P, Brockmann SO, Tyczka J, Fischer SF, Piechotowski I, et al. [Epidemiological enquiries in two Q fever outbreaks in a community of Baden-Wurttemberg during 2008 and 2009]. Berliner und Munchener tierarztliche Wochenschrift. 2011;124(7-8):295-302.
37. Hawker JI, Ayres JG, Blair I, Evans MR, Smith DL, Smith EG, et al. A large outbreak of Q fever in the West Midlands: windborne spread into a metropolitan area? Communicable disease and public health / PHLS. 1998;1(3):180-7.
38. Tissot-Dupont H, Amadei MA, Nezri M, Raoult D. Wind in November, Q fever in December. Emerging infectious diseases. 2004;10(7):1264-9.
39. Gilsdorf A, Kroh C, Grimm S, Jensen E, Wagner-Wiening C, Alpers K. Large Q fever outbreak due to sheep farming near residential areas, Germany, 2005. Epidemiology and infection. 2008;136(8):1084-7.
40. Porten K, Rissland J, Tigges A, Broll S, Hopp W, Lunemann M, et al. A super-spreading ewe infects hundreds with Q fever at a farmers' market in Germany. BMC infectious diseases. 2006;6:147.
41. Karagiannis I, Schimmer B, Van Lier A, Timen A, Schneeberger P, Van Rotterdam B, et al. Investigation of a Q fever outbreak in a rural area of The Netherlands. Epidemiology and infection. 2009;137(9):1283-94.
42. Koene RP, Schimmer B, Rensen H, Biesheuvel M, de Bruin A, Lohuis A, et al. A Q fever outbreak in a psychiatric care institution in The Netherlands. Epidemiology and infection. 2011;139(1):13-8.
43. Schimmer B, Ter Schegget R, Wegdam M, Zuchner L, de Bruin A, Schneeberger PM, et al. The use of a geographic information system to identify a dairy goat farm as the most likely source of an urban Q-fever outbreak. BMC infectious diseases. 2010;10:69.
44. Whelan J, Schimmer B, de Bruin A, van Beest Holle MR, van der Hoek W, ter Schegget R. Visits on 'lamb-viewing days' at a sheep farm open to the public was a risk factor for Q fever in 2009. Epidemiology and infection. 2012;140(5):858-64.
45. Brandsen-Schreijer AJ. RB, Schimmer B, Cox CP, van den Bergh JP, Hulshof F, Hulshof( K, van der Hoek W, Woonink F. Q-koortsuitbraak in de provincie Utrecht in 2009 Infectieziekten Bulletin. 2010;21(9):334-41.
46. Hackert VH, van der Hoek W, Dukers-Muijrers N, de Bruin A, Al Dahouk S, Neubauer H, et al. Q fever: single-point source outbreak with high attack rates and massive numbers of undetected infections across an entire region. Clinical infectious diseases. 2012;55(12):1591-9.
47. Ladbury GA, Van Leuken JP, Swart A, Vellema P, Schimmer B, Ter Schegget R, et al. Integrating interdisciplinary methodologies for One Health: goat farm re-implicated as the probable source of an urban Q fever outbreak, the Netherlands, 2009. BMC infectious diseases. 2015;15:372.
48. Morroy G, van der Hoek W, Albers J, Coutinho RA, Bleeker-Rovers CP, Schneeberger PM. Population Screening for Chronic Q-Fever Seven Years after a Major Outbreak. PloS one. 2015;10(7):e0131777.
49. de Valk H. Q fever: new insights, still many queries. Euro surveillance. 2012;17(3):20062. 50. Nygard K, Werner-Johansen O, Ronsen S, Caugant DA, Simonsen O, Kanestrom A, et al. An outbreak of legionnaires disease
caused by long-distance spread from an industrial air scrubber in Sarpsborg, Norway. Clinical infectious diseases. 2008; 46(1):61-9.
51. Bacterial and viral zoonoses: report of a WHO Expert Committee with participation of FAO. Geneva: WHO; 1982. 52. van Leuken JP, Havelaar AH, van der Hoek W, Ladbury GA, Hackert VH, Swart AN. A model for the early identification of
sources of airborne pathogens in an outdoor environment. PloS one. 2013;8(12):e80412. 53. van der Hoek W, Dijkstra F, Wijers N, Rietveld A, Wijkmans CJ, van Steenbergen JE, et al. [Three years of Q fever in the
Netherlands: faster diagnosis]. Nederlands Tijdschrift voor Geneeskunde. 2010;154:A1845. 54. Van Leuken JPG, Swart AN, Brandsma J, Terink W, Van de Kassteele J, Droogers P, et al. Human Q fever incidence is
associated to spatiotemporal environmental conditions. One Health. 2016;2:77-87. 55. van der Hoek W, Hunink J, Vellema P, Droogers P. Q fever in The Netherlands: the role of local environmental conditions.
Int J Environ Health Res. 2011;21(6):441-51.
56. van Leuken JP, van de Kassteele J, Sauter FJ, van der Hoek W, Heederik D, Havelaar AH, et al. Improved correlation of human Q fever incidence to modelled C. burnetii concentrations by means of an atmospheric dispersion model. Int J Health Geogr. 2015;14:14.
57. Smit LA, van der Sman-de Beer F, Opstal-van Winden AW, Hooiveld M, Beekhuizen J, Wouters IM, et al. Q fever and pneumonia in an area with a high livestock density: a large population-based study. PloS one. 2012;7(6):e38843.
58. Hagenaars T, Hoeksma P, de Roda Husman AM, Swart A, Wouters I. Livestock farming and the health of local residents (additional studies). Analysis of health effects, risk factors and emission of bio-aerosols (in Dutch). Bilthoven, The Netherlands: RIVM; 2017. Report No.: RIVM-2017-0062.
59. Freidl GS, Spruijt IT, Borlee F, Smit LA, van Gageldonk-Lafeber AB, Heederik DJ, et al. Livestock-associated risk factors for pneumonia in an area of intensive animal farming in the Netherlands. PloS one. 2017;12(3):e0174796.
60. EFSA Panel on Animal Health and Welfare (AHAW); Scientific Opinion on Q Fever. EFSA Journal 2010; 8(5):1595. [114 pp.]. 61. Astobiza I, Barandika JF, Ruiz-Fons F, Hurtado A, Povedano I, Juste RA, et al. Coxiella burnetii shedding and environmental
contamination at lambing in two highly naturally-infected dairy sheep flocks after vaccination. Research in veterinary science. 2011;91(3):e58-63.
62. Klous G, Huss A, Heederik DJJ, Coutinho RA. Human-livestock contacts and their relationship to transmission of zoonotic pathogens, a systematic review of literature. One Health. 2016;2:65-76.
63. Paul S, Agger JF, Agerholm JS, Markussen B. Prevalence and risk factors of Coxiella burnetii seropositivity in Danish beef and dairy cattle at slaughter adjusted for test uncertainty. Preventive veterinary medicine. 2014;113(4):504-11.
64. Hogerwerf L, van den Brom R, Roest HI, Bouma A, Vellema P, Pieterse M, et al. Reduction of Coxiella burnetii prevalence by vaccination of goats and sheep, The Netherlands. Emerging infectious diseases. 2011;17(3):379-86.
65. Muleme M, Campbell A, Stenos J, Devlin JM, Vincent G, Cameron A, et al. A longitudinal study of serological responses to Coxiella burnetii and shedding at kidding among intensively-managed goats supports early use of vaccines. Veterinary research. 2017;48(1):50.
66. ZuivelNL. Dutch dairy in figures 2016. The Hague; 2017. 67. Van Dissel JT. Advisory letter on the Dutch expert panel meeting on zoonoses regarding Q fever. 2 December 2016. 68. Richardus JH, Donkers A, Dumas AM, Schaap GJ, Akkermans JP, Huisman J, et al. Q fever in the Netherlands: a sero-
epidemiological survey among human population groups from 1968 to 1983. Epidemiology and infection. 1987;98(2):211-9. 69. Richardus JH, Akkermans JP. [Q fever already present for a longer time in the Netherlands]. Tijdschrift voor
diergeneeskunde. 2010;135(9):373-4. 70. Walsh MG. Assessing Q fever in a representative sample from the United States population: identification of a potential
occupational hazard. Epidemiology and infection. 2012;140(1):42-6. 71. Dorko E, Rimarova K, Pilipcinec E. Influence of the environment and occupational exposure on the occurrence of Q fever.
Central European journal of public health. 2012;20(3):208-14. 72. Heimeriks K, Beaujean D, Maas J. Surveillance work-related infectious diseases- Analysis work-related infectious diseases
2009. Bilthhoven: RIVM; 2010. Report No.: RIVM Report 205014007. 73. Cisak E, Chmielewska-Badora J, Mackiewicz B, Dutkiewicz J. Prevalence of antibodies to Coxiella burnetii among farming
population in eastern Poland. Annals of agricultural and environmental medicine : AAEM. 2003;10(2):265-7. 74. Monno R, Fumarola L, Trerotoli P, Cavone D, Giannelli G, Rizzo C, et al. Seroprevalence of Q fever, brucellosis and
leptospirosis in farmers and agricultural workers in Bari, Southern Italy. Annals of agricultural and environmental medicine : AAEM. 2009;16(2):205-9.
75. Dolce P, Belanger MJ, Tumanowicz K, Gauthier CP, Jutras P, Masse R, et al. Coxiella burnetii seroprevalence of shepherds and their flocks in the lower Saint-Lawrence River region of Quebec, Canada. The Canadian journal of infectious disease.. 2003;14(2):97-102.
76. Abe T, Yamaki K, Hayakawa T, Fukuda H, Ito Y, Kume H, et al. A seroepidemiological study of the risks of Q fever infection in Japanese veterinarians. European journal of epidemiology. 2001;17(11):1029-32.
77. Bernard H, Brockmann SO, Kleinkauf N, Klinc C, Wagner-Wiening C, Stark K, et al. High seroprevalence of Coxiella burnetii antibodies in veterinarians associated with cattle obstetrics, Bavaria, 2009. Vector borne and zoonotic diseases. 2012;12(7):552-7.
78. Chang CC, Lin PS, Hou MY, Lin CC, Hung MN, Wu TM, et al. Identification of risk factors of Coxiella burnetii (Q fever) infection in veterinary-associated populations in southern Taiwan. Zoonoses and public health. 2010;57(7-8):e95-101.
79. Dal Pozzo F, Martinelle L, Leonard P, Renaville B, Renaville R, Thys C, et al. Q Fever Serological Survey and Associated Risk Factors in Veterinarians, Southern Belgium, 2013. Transboundary and emerging diseases. 2017;64(3):959-66.
80. Dorko E, Rimarova K, Kecerova A, Pilipcinec E, Dudrikova E, Lovayova V, et al. Potential association between Coxiella burnetii seroprevalence and selected risk factors among veterinary students in Slovakia. Annals of agricultural and environmental medicine : AAEM. 2011;18(1):47-53.
81. Valencia MC, Rodriguez CO, Punet OG, de Blas Giral I. Q fever seroprevalence and associated risk factors among students from the Veterinary School of Zaragoza, Spain. European journal of epidemiology. 2000;16(5):469-76.
82. Whitney EA, Massung RF, Candee AJ, Ailes EC, Myers LM, Patterson NE, et al. Seroepidemiologic and occupational risk survey for Coxiella burnetii antibodies among US veterinarians. Clinical infectious diseases. 2009;48(5):550-7.
83. Meadows SL, Jones-Bitton A, McEwen SA, Jansen J, Patel SN, Filejski C, et al. Prevalence and risk factors for Coxiella burnetii seropositivity in small ruminant veterinarians and veterinary students in Ontario, Canada. The Canadian veterinary journal. 2017;58(4):397-9.
84. Davies TR, Edwards Y, Morgan A, Caul EO. Prevalence of Q fever in a rural practice. J Public Health Med. 1997;19(3):324-7.
6
GENERAL DISCUSSION | 215
28. Wielders CC, Boerman AW, Schimmer B, van den Brom R, Notermans DW, van der Hoek W, et al. Persistent high IgG phase I antibody levels against Coxiella burnetii among veterinarians compared to patients previously diagnosed with acute Q fever after three years of follow-up. PloS one. 2015;10(1):e0116937.
29. Dijkstra F, van der Hoek W, Wijers N, Schimmer B, Rietveld A, Wijkmans CJ, et al. The 2007-2010 Q fever epidemic in The Netherlands: characteristics of notified acute Q fever patients and the association with dairy goat farming. FEMS immunology and medical microbiology. 2012;64(1):3-12.
30. Schimmer B, Morroy G, Dijkstra F, Schneeberger PM, Weers-Pothoff G, Timen A, et al. Large ongoing Q fever outbreak in the south of The Netherlands, 2008. Euro surveillance. 2008;13(31).
31. van der Hoek W, Dijkstra F, Schimmer B, Schneeberger PM, Vellema P, Wijkmans C, et al. Q fever in the Netherlands: an update on the epidemiology and control measures. Euro surveillance.2010;15(12).
32. Roest HI, Tilburg JJ, van der Hoek W, Vellema P, van Zijderveld FG, Klaassen CH, et al. The Q fever epidemic in The Netherlands: history, onset, response and reflection. Epidemiology and infection. 2011;139(1):1-12.
33. Wouda W, Dercksen DP. [Abortion and stillbirth among dairy goats as a consequence of Coxiella burnetii]. Tijdschrift voor diergeneeskunde. 2007;132(23):908-11.
34. Karagiannis I, Morroy G, Rietveld A, Horrevorts AM, Hamans M, Francken P, et al. Q fever outbreak in the Netherlands: a preliminary report. Euro surveillance. 2007;12(8):E070809 2.
35. Georgiev M, Afonso A, Neubauer H, Needham H, Thiery R, Rodolakis A, et al. Q fever in humans and farm animals in four European countries, 1982 to 2010. Euro surveillance. 2013;18(8).
36. Hilbert A, Reith P, Brockmann SO, Tyczka J, Fischer SF, Piechotowski I, et al. [Epidemiological enquiries in two Q fever outbreaks in a community of Baden-Wurttemberg during 2008 and 2009]. Berliner und Munchener tierarztliche Wochenschrift. 2011;124(7-8):295-302.
37. Hawker JI, Ayres JG, Blair I, Evans MR, Smith DL, Smith EG, et al. A large outbreak of Q fever in the West Midlands: windborne spread into a metropolitan area? Communicable disease and public health / PHLS. 1998;1(3):180-7.
38. Tissot-Dupont H, Amadei MA, Nezri M, Raoult D. Wind in November, Q fever in December. Emerging infectious diseases. 2004;10(7):1264-9.
39. Gilsdorf A, Kroh C, Grimm S, Jensen E, Wagner-Wiening C, Alpers K. Large Q fever outbreak due to sheep farming near residential areas, Germany, 2005. Epidemiology and infection. 2008;136(8):1084-7.
40. Porten K, Rissland J, Tigges A, Broll S, Hopp W, Lunemann M, et al. A super-spreading ewe infects hundreds with Q fever at a farmers' market in Germany. BMC infectious diseases. 2006;6:147.
41. Karagiannis I, Schimmer B, Van Lier A, Timen A, Schneeberger P, Van Rotterdam B, et al. Investigation of a Q fever outbreak in a rural area of The Netherlands. Epidemiology and infection. 2009;137(9):1283-94.
42. Koene RP, Schimmer B, Rensen H, Biesheuvel M, de Bruin A, Lohuis A, et al. A Q fever outbreak in a psychiatric care institution in The Netherlands. Epidemiology and infection. 2011;139(1):13-8.
43. Schimmer B, Ter Schegget R, Wegdam M, Zuchner L, de Bruin A, Schneeberger PM, et al. The use of a geographic information system to identify a dairy goat farm as the most likely source of an urban Q-fever outbreak. BMC infectious diseases. 2010;10:69.
44. Whelan J, Schimmer B, de Bruin A, van Beest Holle MR, van der Hoek W, ter Schegget R. Visits on 'lamb-viewing days' at a sheep farm open to the public was a risk factor for Q fever in 2009. Epidemiology and infection. 2012;140(5):858-64.
45. Brandsen-Schreijer AJ. RB, Schimmer B, Cox CP, van den Bergh JP, Hulshof F, Hulshof( K, van der Hoek W, Woonink F. Q-koortsuitbraak in de provincie Utrecht in 2009 Infectieziekten Bulletin. 2010;21(9):334-41.
46. Hackert VH, van der Hoek W, Dukers-Muijrers N, de Bruin A, Al Dahouk S, Neubauer H, et al. Q fever: single-point source outbreak with high attack rates and massive numbers of undetected infections across an entire region. Clinical infectious diseases. 2012;55(12):1591-9.
47. Ladbury GA, Van Leuken JP, Swart A, Vellema P, Schimmer B, Ter Schegget R, et al. Integrating interdisciplinary methodologies for One Health: goat farm re-implicated as the probable source of an urban Q fever outbreak, the Netherlands, 2009. BMC infectious diseases. 2015;15:372.
48. Morroy G, van der Hoek W, Albers J, Coutinho RA, Bleeker-Rovers CP, Schneeberger PM. Population Screening for Chronic Q-Fever Seven Years after a Major Outbreak. PloS one. 2015;10(7):e0131777.
49. de Valk H. Q fever: new insights, still many queries. Euro surveillance. 2012;17(3):20062. 50. Nygard K, Werner-Johansen O, Ronsen S, Caugant DA, Simonsen O, Kanestrom A, et al. An outbreak of legionnaires disease
caused by long-distance spread from an industrial air scrubber in Sarpsborg, Norway. Clinical infectious diseases. 2008; 46(1):61-9.
51. Bacterial and viral zoonoses: report of a WHO Expert Committee with participation of FAO. Geneva: WHO; 1982. 52. van Leuken JP, Havelaar AH, van der Hoek W, Ladbury GA, Hackert VH, Swart AN. A model for the early identification of
sources of airborne pathogens in an outdoor environment. PloS one. 2013;8(12):e80412. 53. van der Hoek W, Dijkstra F, Wijers N, Rietveld A, Wijkmans CJ, van Steenbergen JE, et al. [Three years of Q fever in the
Netherlands: faster diagnosis]. Nederlands Tijdschrift voor Geneeskunde. 2010;154:A1845. 54. Van Leuken JPG, Swart AN, Brandsma J, Terink W, Van de Kassteele J, Droogers P, et al. Human Q fever incidence is
associated to spatiotemporal environmental conditions. One Health. 2016;2:77-87. 55. van der Hoek W, Hunink J, Vellema P, Droogers P. Q fever in The Netherlands: the role of local environmental conditions.
Int J Environ Health Res. 2011;21(6):441-51.
56. van Leuken JP, van de Kassteele J, Sauter FJ, van der Hoek W, Heederik D, Havelaar AH, et al. Improved correlation of human Q fever incidence to modelled C. burnetii concentrations by means of an atmospheric dispersion model. Int J Health Geogr. 2015;14:14.
57. Smit LA, van der Sman-de Beer F, Opstal-van Winden AW, Hooiveld M, Beekhuizen J, Wouters IM, et al. Q fever and pneumonia in an area with a high livestock density: a large population-based study. PloS one. 2012;7(6):e38843.
58. Hagenaars T, Hoeksma P, de Roda Husman AM, Swart A, Wouters I. Livestock farming and the health of local residents (additional studies). Analysis of health effects, risk factors and emission of bio-aerosols (in Dutch). Bilthoven, The Netherlands: RIVM; 2017. Report No.: RIVM-2017-0062.
59. Freidl GS, Spruijt IT, Borlee F, Smit LA, van Gageldonk-Lafeber AB, Heederik DJ, et al. Livestock-associated risk factors for pneumonia in an area of intensive animal farming in the Netherlands. PloS one. 2017;12(3):e0174796.
60. EFSA Panel on Animal Health and Welfare (AHAW); Scientific Opinion on Q Fever. EFSA Journal 2010; 8(5):1595. [114 pp.]. 61. Astobiza I, Barandika JF, Ruiz-Fons F, Hurtado A, Povedano I, Juste RA, et al. Coxiella burnetii shedding and environmental
contamination at lambing in two highly naturally-infected dairy sheep flocks after vaccination. Research in veterinary science. 2011;91(3):e58-63.
62. Klous G, Huss A, Heederik DJJ, Coutinho RA. Human-livestock contacts and their relationship to transmission of zoonotic pathogens, a systematic review of literature. One Health. 2016;2:65-76.
63. Paul S, Agger JF, Agerholm JS, Markussen B. Prevalence and risk factors of Coxiella burnetii seropositivity in Danish beef and dairy cattle at slaughter adjusted for test uncertainty. Preventive veterinary medicine. 2014;113(4):504-11.
64. Hogerwerf L, van den Brom R, Roest HI, Bouma A, Vellema P, Pieterse M, et al. Reduction of Coxiella burnetii prevalence by vaccination of goats and sheep, The Netherlands. Emerging infectious diseases. 2011;17(3):379-86.
65. Muleme M, Campbell A, Stenos J, Devlin JM, Vincent G, Cameron A, et al. A longitudinal study of serological responses to Coxiella burnetii and shedding at kidding among intensively-managed goats supports early use of vaccines. Veterinary research. 2017;48(1):50.
66. ZuivelNL. Dutch dairy in figures 2016. The Hague; 2017. 67. Van Dissel JT. Advisory letter on the Dutch expert panel meeting on zoonoses regarding Q fever. 2 December 2016. 68. Richardus JH, Donkers A, Dumas AM, Schaap GJ, Akkermans JP, Huisman J, et al. Q fever in the Netherlands: a sero-
epidemiological survey among human population groups from 1968 to 1983. Epidemiology and infection. 1987;98(2):211-9. 69. Richardus JH, Akkermans JP. [Q fever already present for a longer time in the Netherlands]. Tijdschrift voor
diergeneeskunde. 2010;135(9):373-4. 70. Walsh MG. Assessing Q fever in a representative sample from the United States population: identification of a potential
occupational hazard. Epidemiology and infection. 2012;140(1):42-6. 71. Dorko E, Rimarova K, Pilipcinec E. Influence of the environment and occupational exposure on the occurrence of Q fever.
Central European journal of public health. 2012;20(3):208-14. 72. Heimeriks K, Beaujean D, Maas J. Surveillance work-related infectious diseases- Analysis work-related infectious diseases
2009. Bilthhoven: RIVM; 2010. Report No.: RIVM Report 205014007. 73. Cisak E, Chmielewska-Badora J, Mackiewicz B, Dutkiewicz J. Prevalence of antibodies to Coxiella burnetii among farming
population in eastern Poland. Annals of agricultural and environmental medicine : AAEM. 2003;10(2):265-7. 74. Monno R, Fumarola L, Trerotoli P, Cavone D, Giannelli G, Rizzo C, et al. Seroprevalence of Q fever, brucellosis and
leptospirosis in farmers and agricultural workers in Bari, Southern Italy. Annals of agricultural and environmental medicine : AAEM. 2009;16(2):205-9.
75. Dolce P, Belanger MJ, Tumanowicz K, Gauthier CP, Jutras P, Masse R, et al. Coxiella burnetii seroprevalence of shepherds and their flocks in the lower Saint-Lawrence River region of Quebec, Canada. The Canadian journal of infectious disease.. 2003;14(2):97-102.
76. Abe T, Yamaki K, Hayakawa T, Fukuda H, Ito Y, Kume H, et al. A seroepidemiological study of the risks of Q fever infection in Japanese veterinarians. European journal of epidemiology. 2001;17(11):1029-32.
77. Bernard H, Brockmann SO, Kleinkauf N, Klinc C, Wagner-Wiening C, Stark K, et al. High seroprevalence of Coxiella burnetii antibodies in veterinarians associated with cattle obstetrics, Bavaria, 2009. Vector borne and zoonotic diseases. 2012;12(7):552-7.
78. Chang CC, Lin PS, Hou MY, Lin CC, Hung MN, Wu TM, et al. Identification of risk factors of Coxiella burnetii (Q fever) infection in veterinary-associated populations in southern Taiwan. Zoonoses and public health. 2010;57(7-8):e95-101.
79. Dal Pozzo F, Martinelle L, Leonard P, Renaville B, Renaville R, Thys C, et al. Q Fever Serological Survey and Associated Risk Factors in Veterinarians, Southern Belgium, 2013. Transboundary and emerging diseases. 2017;64(3):959-66.
80. Dorko E, Rimarova K, Kecerova A, Pilipcinec E, Dudrikova E, Lovayova V, et al. Potential association between Coxiella burnetii seroprevalence and selected risk factors among veterinary students in Slovakia. Annals of agricultural and environmental medicine : AAEM. 2011;18(1):47-53.
81. Valencia MC, Rodriguez CO, Punet OG, de Blas Giral I. Q fever seroprevalence and associated risk factors among students from the Veterinary School of Zaragoza, Spain. European journal of epidemiology. 2000;16(5):469-76.
82. Whitney EA, Massung RF, Candee AJ, Ailes EC, Myers LM, Patterson NE, et al. Seroepidemiologic and occupational risk survey for Coxiella burnetii antibodies among US veterinarians. Clinical infectious diseases. 2009;48(5):550-7.
83. Meadows SL, Jones-Bitton A, McEwen SA, Jansen J, Patel SN, Filejski C, et al. Prevalence and risk factors for Coxiella burnetii seropositivity in small ruminant veterinarians and veterinary students in Ontario, Canada. The Canadian veterinary journal. 2017;58(4):397-9.
84. Davies TR, Edwards Y, Morgan A, Caul EO. Prevalence of Q fever in a rural practice. J Public Health Med. 1997;19(3):324-7.

216 | CHAPTER 6
85. Schnurrenberger PR, Helwig JH, Bashe WJ, Jr. The Incidence of Zoonotic Infections in Veterinary Students. J Am Vet Med Assoc. 1964;144:384-6.
86. Palmer C, McCall B, Jarvinen K, Krause M, Heel K. "The dust hasn't settled yet": the National Q fever Management Program, missed opportunities for vaccination and community exposures. Australian and New Zealand journal of public health. 2007;31(4):330-2.
87. Gidding HF, Wallace C, Lawrence GL, McIntyre PB. Australia's national Q fever vaccination program. Vaccine. 2009;27(14):2037-41.
88. Sellens E, Norris JM, Dhand NK, Heller J, Hayes L, Gidding HF, et al. Q Fever Knowledge, Attitudes and Vaccination Status of Australia's Veterinary Workforce in 2014. PloS one. 2016;11(1):e0146819.
89. Ackland JR, Worswick DA, Marmion BP. Vaccine prophylaxis of Q fever. A follow-up study of the efficacy of Q-Vax (CSL) 1985-1990. Med J Aust. 1994;160(11):704-8.
90. Marmion BP, Ormsbee RA, Kyrkou M, Wright J, Worswick DA, Izzo AA, et al. Vaccine prophylaxis of abattoir-associated Q fever: eight years' experience in Australian abattoirs. Epidemiology and infection. 1990;104(2):275-87.
91. Kersh GJ, Fitzpatrick KA, Self JS, Biggerstaff BJ, Massung RF. Long-Term immune responses to Coxiella burnetii after vaccination. Clin Vaccine Immunol. 2013;20(2):129-33.
92. Chiu CK, Durrheim DN. A review of the efficacy of human Q fever vaccine registered in Australia. N S.W Public Health Bull. 2007;18(7-8):133-6.
93. Gilroy N, Formica N, Beers M, Egan A, Conaty S, Marmion B. Abattoir-associated Q fever: a Q fever outbreak during a Q fever vaccination program. Australian and New Zealand journal of public health. 2001;25(4):362-7.
94. Ruiz S, Wolfe DN. Vaccination against Q fever for biodefense and public health indications. Front Microbiol. 2014;5:726. 95. Zhang G, Samuel JE. Vaccines against Coxiella infection. Expert Rev Vaccines. 2004;3(5):577-84. 96. Reeves PM, Paul SR, Sluder AE, Brauns TA, Poznansky MC. Q-vaxcelerate: A distributed development approach for a new
Coxiella burnetii vaccine. Hum Vaccin Immunother. 2017:0. 97. Bosnjak E, Hvass AM, Villumsen S, Nielsen H. Emerging evidence for Q fever in humans in Denmark: role of contact with
dairy cattle. Clin Microbiol Infect. 2010;16(8):1285-8. 98. van der Hoek W, Versteeg B, Meekelenkamp JC, Renders NH, Leenders AC, Weers-Pothoff I, et al. Follow-up of 686 patients
with acute Q fever and detection of chronic infection. Clinical infectious diseases. 2011;52(12):1431-6. 99. Fenga C, Gangemi S, De Luca A, Calimeri S, Lo Giudice D, Pugliese M, et al. Seroprevalence and occupational risk survey for
Coxiella burnetii among exposed workers in Sicily, Southern Italy. Int J Occup Med Environ Health. 2015;28(5):901-7. 100. Samadi S, Spithoven J, Jamshidifard AR, Berends BR, Lipman L, Heederik DJ, et al. Allergy among veterinary medicine
students in The Netherlands. Occupational and environmental medicine. 2012;69(1):48-55. 101. Health Council of the Netherlands. Human vaccination against Q fever. The Hague: 2010; publication no. 2010/08E. 102. Health Council of the Netherlands. Human vaccination against Q fever: second advisory report. The Hague: 2010;
publication no. 2010/18E 103. Brooke RJ, Van Lier A, Donker GA, Van Der Hoek W, Kretzschmar ME. Comparing the impact of two concurrent infectious
disease outbreaks on The Netherlands population, 2009, using disability-adjusted life years. Epidemiology and infection. 2014;142(11):2412-21.
104. ECDC Technical Report. Risk assessment on Q fever. Stockholm: ECDC; May 2010. Report No.: ISBN 978-92-9193-210-8. 105. Forland F, De Carvalho Gomes H, Nokleby H, Escriva A, Coulombier D, Giesecke J, et al. Applicability of evidence-based
practice in public health: risk assessment on Q fever under an ongoing outbreak. Euro surveillance. 2012;17(3):20060. 106. Isken LD, Kraaij-Dirkzwager M, Vermeer-de Bondt PE, Rumke HC, Wijkmans C, Opstelten W, et al. Implementation of a Q
fever vaccination program for high-risk patients in the Netherlands. Vaccine. 2013;31(23):2617-22. 107. Vermeer-de Bondt PE, Schoffelen T, Vanrolleghem AM, Isken LD, van Deuren M, Sturkenboom MC, et al. Coverage of the
2011 Q fever vaccination campaign in the Netherlands, using retrospective population-based prevalence estimation of cardiovascular risk-conditions for chronic Q fever. PloS one. 2015;10(4):e0123570.
108. Wilson LE, Couper S, Prempeh H, Young D, Pollock KG, Stewart WC, et al. Investigation of a Q fever outbreak in a Scottish co-located slaughterhouse and cutting plant. Zoonoses and public health. 2010;57(7-8):493-8.
109. Pollock KG, Mellor DJ, Browning LM, Wilson L, Donaghy M. Q fever in migrant workers, Scotland. Emerging infectious diseases. 2007;13(12):1963-4.
110. Joint Committee on Vaccination and Immunisation (JCVI). Minutes of JCVI meeting held on 14 October 2009. London; 2009. 111. McCaughey C, McKenna J, McKenna C, Coyle PV, O'Neill HJ, Wyatt DE, et al. Human seroprevalence to Coxiella burnetii (Q
fever) in Northern Ireland. Zoonoses and public health. 2008;55(4):189-94. 112. van Dijk CE, Smit LA, Hooiveld M, Zock JP, Wouters IM, Heederik DJ, et al. Associations between proximity to livestock
farms, primary health care visits and self-reported symptoms. BMC Fam Pract. 2016;17:22. 113. Kampschreur LM, Delsing CE, Groenwold RH, Wegdam-Blans MC, Bleeker-Rovers CP, de Jager-Leclercq MG, et al. Chronic Q
fever in the Netherlands 5 years after the start of the Q fever epidemic: results from the Dutch chronic Q fever database. Journal of clinical microbiology. 2014;52(5):1637-43.
114. Gefenaite G, Munster JM, van Houdt R, Hak E. Effectiveness of the Q fever vaccine: a meta-analysis. Vaccine. 2011; 29(3):395-8.
115. O'Neill TJ, Sargeant JM, Poljak Z. The effectiveness of Coxiella burnetii vaccines in occupationally exposed populations: a systematic review and meta-analysis. Zoonoses and public health. 2014;61(2):81-96.
116. Maas JG, F.; Frings-Dresen, M.; van der Molen H. Background document for registration guideline C004 Q fever as an occupational disease CAS-code A433. Amsterdam: Netherlands Centre for Occupational Disease; 2016 July 2016.

SummaryNederlandse samenvatting
7

SummaryNederlandse samenvatting
7

220 | CHAPTER 7
Summary
The 2007 – 2009 Q fever epidemic in the Netherlands caused widespread morbidity in the human population. This thesis presents several outbreak investigations focusing on the detection of farm sources and identification of distance-response relations, and a follow-up study focusing on long-term antibody responses of patients diagnosed with acute Q fever. Moreover, this large epidemic also provided opportunities to gain knowledge about the occupational nature of this zoonotic infection in several occupational groups with intensive livestock contact. Seroprevalence and associated risk factors with C. burnetii seropositivity were studied in an integrated research project, including both farm residents and on-farm herds in four different ruminant sectors, in order to formulate better control strategies to reduce the animal and human Q fever burden.
In Chapter 2, sera and questionnaires from 5654 individuals containing epidemiological data were obtained in a representative nationwide seroprevalence survey carried out in 2006–2007 and used to evaluate the National Immunisation Programme in the Netherlands each decade since 1997 (the PIENTER Study). Sera were tested by ELISA for presence of C. burnetii IgG phase-2 antibodies in order to provide a nationwide estimate of seroprevalence and main determinants for C. burnetii seropositivity. The overall seroprevalence was estimated to be 2.4%. Seropositivity increased with age, from 0.48% in young children aged 0–4 years to 2.30% in persons aged 60 years and older. C. burnetii seropositivity was not associated with municipal ruminant densities of goat, sheep and cattle. Independent risk factors for seropositivity were keeping ruminants during the past 5 years and being born in Turkey, emphasizing the risk of direct ruminant contact and a country of birth where C. burnetii is highly prevalent in the human population, respectively. This population-based study supports the hypothesis that the nationwide seroprevalence was low just prior to the start of the epidemic, and suggests that low population immunity levels may have contributed to the magnitude of the Dutch Q fever epidemic. This study served as a baseline for seroprevalence studies carried out during and after the Q fever epidemic. The 2007-2009 Dutch Q fever epidemic also provided an opportunity for long-term follow-up of acute Q fever patients. As presented in Chapter 2, a cohort of 344 adult patients diagnosed with acute Q fever between 2007 and 2009 by the regional Laboratory of Medical Microbiology at the Jeroen Bosch Hospital were offered routine serological follow-up at three, six and twelve months after diagnosis. C. burnetii IgM and IgG phase 1 and 2 antibodies were determined in all sera by IFA. These data were used to study longitudinal antibody responses and to model the seroresponse profiles. A mathematical model of the dynamic interaction of serum antibodies and pathogens was used in a mixed model framework to quantitatively analyze responses to C. burnetii infection. Responses show strong heterogeneity, with individual serum antibody responses widely different in magnitude and shape. Features of the response, peak titer and decay rate, are used to characterize the diversity of the observed responses. Binary mixture analysis of IgG peak levels (phases 1 and 2) revealed a class of patients with high IgG peak titers that decay slowly and may represent potential chronic cases. When combining the results of mixture analysis into an odds score, it is concluded that not only high IgG phase 1 may be predictive for chronic Q fever, but also that high IgG phase 2 may aid in detecting such putative chronic cases.
The Netherlands experienced several large outbreaks of acute Q fever during 2007 until 2009. In Chapter 3, four of these outbreaks are reported. The first recognized community Q fever outbreak occurred during late spring and early summer 2007 in and around Herpen, a rural village in Noord-Brabant province. A total of 696 inhabitants residing in the cluster area were invited to complete a questionnaire and provide a blood sample to be screened for presence of IgM and IgG antibodies against phase 1 and 2 of C. burnetii using an immunofluorescence assay. Risk factors for the acquisition of a recent C. burnetii infection were studied in a frequency-matched case-control study involving 332 seronegative controls and 73 cases with a recent C. burnetii infection, including previously identified Q fever cases. Current smoking, contact with agricultural products such as manure, hay and straw and residence in the east of the cluster area were risk factors associated with a recent C. burnetii infection. In this area, several livestock farms were situated including a commercial dairy goat farm where an abortion wave had occurred in April 2007. Limited sampling of environmental and animal matrices for C. burnetii DNA was done on this commercial goat farm and a hobby goat farm. All C. burnetii DNA-positive samples originated from the commercial goat farm.
Record-warm and extreme dry weather with prominent winds from the east during April 2007 may have contributed to the spread of C. burnetii contaminated aerosols. Information leaflets on Q fever were distributed to ruminant farms in this area early 2008 and included hygiene measures to reduce the risk of animal to human spread. In May 2008, a community outbreak in the urban area of Helmond in Noord-Brabant province involved 96 patients with acute Q fever. The distribution and timing of acute Q fever cases suggested a common veterinary source. A generic geographic information system (GIS) was used to develop a method for source detection. All notified Q fever cases in the area were interviewed. Postal codes of cases and of small ruminant farms (size >40 animals) located within 5 kilometers of the cluster area were geo-referenced as point locations in a GIS-model. For each farm, attack rates and relative risks were calculated for 5 concentric zones adding 1 kilometer at a time, using the 5-10 kilometer zone as reference. These data were linked to the results of veterinary investigations. Persons living within 2 kilometers of a commercial dairy goat farm that experienced an abortion wave due to Q fever in April 2008 had a strongly increased risk (Relative risk 31.1 [95% CI 16.4-59.1]) to acquire acute Q fever compared to residents living more than 5 kilometers away. This study supported the hypothesis that this single dairy goat farm was the most likely source of this urban outbreak, proved that GIS-based attack rate analysis is a promising tool to facilitate source detection in an outdoor environment and played an important role in convincing the veterinary authorities that abortion storms among goats were the source of the human Q fever epidemic.
An institutional sheep-related Q fever outbreak occurred in May 2008 in a long-term psychiatric care institution situated near the city of Nijmegen. Active case finding among the residents, employees and visitors of the institution resulted in 28 laboratory-confirmed cases among staff and in-clients. A small sheep flock was present on the institution premises and had produced 5 newborn lambs during April and the first week of May 2008. One of those lambs had been abandoned. Attack rates of acute Q fever were highest in the building where the abandoned lamb was cuddled by several in-clients, followed by buildings adjacent to the small meadows where the flock was grazing or the rabbit cage where the abandoned lamb was placed 3 days after its birth. This merely descriptive investigation pointed to the small sheep flock with newborn lambs as the most probable source of exposure, supported by C. burnetii DNA-positive samples from 3 ewes and the abandoned lamb. A large sheep flock that had been grazing outside the premises was considered less likely as an alternative source, as 10 random sheep all tested C. burnetii DNA-negative. Care institutions maintaining flocks of sheep should take adequate preventive measures to avoid contact between often vulnerable patients and lambing sheep, and take adequate hygienic measures during lambing and handling of birth products. Another sheep-related outbreak occurred between February and May 2009. The regional MHS identified this outbreak based on trawling questionnaires during preliminary investigations into an urban Q fever outbreak in the same region. The MHS suspected a non-dairy sheep farm as an alternative source for 42 acute Q fever cases that had all visited this farm during ‘lamb-viewing days’. A matched case-control study was initiated and included 146 acute Q fever cases and 431 address-matched controls. Multivariable logistic regression analysis confirmed the association between visiting a non-dairy sheep farm and development of acute Q fever in this MHS region. Other risk factors identified were being a smoker, having a past medical history and being over 40 years of age. This non-dairy sheep farm was open to the public and had received 12,000 visitors during the lambing season in 2009 with over 1200 lambs born and only 3 abortions. The large majority of vaginal swabs was PCR positive for multicopy target IS1111. Vaccination of sheep and goats on farms open to the public should help to reduce the future occurrence of acute Q fever cases related to farm visits. Dairy goat farms were the main implicated source during the Dutch Q fever epidemic. However, many questions remained concerning the burden of C. burnetii infection in presumably highly exposed farm residents and their ruminant populations. Chapter 4 presents studies that were part of an integrated research project carried out in 4 different ruminant sectors during 2009-2011, the socalled Q-VIVE project. The overall aim of this research project was to assess the C. burnetii seroprevalence in farm residents and assess herd and animal prevalence based on a representative sample per farm and to identify farm and person-based risk factors for C. burnetii seropositivity in order to formulate targeted advice and better control strategies to reduce the animal and human Q fever burden.

7
SUMMARY | 221
Summary
The 2007 – 2009 Q fever epidemic in the Netherlands caused widespread morbidity in the human population. This thesis presents several outbreak investigations focusing on the detection of farm sources and identification of distance-response relations, and a follow-up study focusing on long-term antibody responses of patients diagnosed with acute Q fever. Moreover, this large epidemic also provided opportunities to gain knowledge about the occupational nature of this zoonotic infection in several occupational groups with intensive livestock contact. Seroprevalence and associated risk factors with C. burnetii seropositivity were studied in an integrated research project, including both farm residents and on-farm herds in four different ruminant sectors, in order to formulate better control strategies to reduce the animal and human Q fever burden.
In Chapter 2, sera and questionnaires from 5654 individuals containing epidemiological data were obtained in a representative nationwide seroprevalence survey carried out in 2006–2007 and used to evaluate the National Immunisation Programme in the Netherlands each decade since 1997 (the PIENTER Study). Sera were tested by ELISA for presence of C. burnetii IgG phase-2 antibodies in order to provide a nationwide estimate of seroprevalence and main determinants for C. burnetii seropositivity. The overall seroprevalence was estimated to be 2.4%. Seropositivity increased with age, from 0.48% in young children aged 0–4 years to 2.30% in persons aged 60 years and older. C. burnetii seropositivity was not associated with municipal ruminant densities of goat, sheep and cattle. Independent risk factors for seropositivity were keeping ruminants during the past 5 years and being born in Turkey, emphasizing the risk of direct ruminant contact and a country of birth where C. burnetii is highly prevalent in the human population, respectively. This population-based study supports the hypothesis that the nationwide seroprevalence was low just prior to the start of the epidemic, and suggests that low population immunity levels may have contributed to the magnitude of the Dutch Q fever epidemic. This study served as a baseline for seroprevalence studies carried out during and after the Q fever epidemic. The 2007-2009 Dutch Q fever epidemic also provided an opportunity for long-term follow-up of acute Q fever patients. As presented in Chapter 2, a cohort of 344 adult patients diagnosed with acute Q fever between 2007 and 2009 by the regional Laboratory of Medical Microbiology at the Jeroen Bosch Hospital were offered routine serological follow-up at three, six and twelve months after diagnosis. C. burnetii IgM and IgG phase 1 and 2 antibodies were determined in all sera by IFA. These data were used to study longitudinal antibody responses and to model the seroresponse profiles. A mathematical model of the dynamic interaction of serum antibodies and pathogens was used in a mixed model framework to quantitatively analyze responses to C. burnetii infection. Responses show strong heterogeneity, with individual serum antibody responses widely different in magnitude and shape. Features of the response, peak titer and decay rate, are used to characterize the diversity of the observed responses. Binary mixture analysis of IgG peak levels (phases 1 and 2) revealed a class of patients with high IgG peak titers that decay slowly and may represent potential chronic cases. When combining the results of mixture analysis into an odds score, it is concluded that not only high IgG phase 1 may be predictive for chronic Q fever, but also that high IgG phase 2 may aid in detecting such putative chronic cases.
The Netherlands experienced several large outbreaks of acute Q fever during 2007 until 2009. In Chapter 3, four of these outbreaks are reported. The first recognized community Q fever outbreak occurred during late spring and early summer 2007 in and around Herpen, a rural village in Noord-Brabant province. A total of 696 inhabitants residing in the cluster area were invited to complete a questionnaire and provide a blood sample to be screened for presence of IgM and IgG antibodies against phase 1 and 2 of C. burnetii using an immunofluorescence assay. Risk factors for the acquisition of a recent C. burnetii infection were studied in a frequency-matched case-control study involving 332 seronegative controls and 73 cases with a recent C. burnetii infection, including previously identified Q fever cases. Current smoking, contact with agricultural products such as manure, hay and straw and residence in the east of the cluster area were risk factors associated with a recent C. burnetii infection. In this area, several livestock farms were situated including a commercial dairy goat farm where an abortion wave had occurred in April 2007. Limited sampling of environmental and animal matrices for C. burnetii DNA was done on this commercial goat farm and a hobby goat farm. All C. burnetii DNA-positive samples originated from the commercial goat farm.
Record-warm and extreme dry weather with prominent winds from the east during April 2007 may have contributed to the spread of C. burnetii contaminated aerosols. Information leaflets on Q fever were distributed to ruminant farms in this area early 2008 and included hygiene measures to reduce the risk of animal to human spread. In May 2008, a community outbreak in the urban area of Helmond in Noord-Brabant province involved 96 patients with acute Q fever. The distribution and timing of acute Q fever cases suggested a common veterinary source. A generic geographic information system (GIS) was used to develop a method for source detection. All notified Q fever cases in the area were interviewed. Postal codes of cases and of small ruminant farms (size >40 animals) located within 5 kilometers of the cluster area were geo-referenced as point locations in a GIS-model. For each farm, attack rates and relative risks were calculated for 5 concentric zones adding 1 kilometer at a time, using the 5-10 kilometer zone as reference. These data were linked to the results of veterinary investigations. Persons living within 2 kilometers of a commercial dairy goat farm that experienced an abortion wave due to Q fever in April 2008 had a strongly increased risk (Relative risk 31.1 [95% CI 16.4-59.1]) to acquire acute Q fever compared to residents living more than 5 kilometers away. This study supported the hypothesis that this single dairy goat farm was the most likely source of this urban outbreak, proved that GIS-based attack rate analysis is a promising tool to facilitate source detection in an outdoor environment and played an important role in convincing the veterinary authorities that abortion storms among goats were the source of the human Q fever epidemic.
An institutional sheep-related Q fever outbreak occurred in May 2008 in a long-term psychiatric care institution situated near the city of Nijmegen. Active case finding among the residents, employees and visitors of the institution resulted in 28 laboratory-confirmed cases among staff and in-clients. A small sheep flock was present on the institution premises and had produced 5 newborn lambs during April and the first week of May 2008. One of those lambs had been abandoned. Attack rates of acute Q fever were highest in the building where the abandoned lamb was cuddled by several in-clients, followed by buildings adjacent to the small meadows where the flock was grazing or the rabbit cage where the abandoned lamb was placed 3 days after its birth. This merely descriptive investigation pointed to the small sheep flock with newborn lambs as the most probable source of exposure, supported by C. burnetii DNA-positive samples from 3 ewes and the abandoned lamb. A large sheep flock that had been grazing outside the premises was considered less likely as an alternative source, as 10 random sheep all tested C. burnetii DNA-negative. Care institutions maintaining flocks of sheep should take adequate preventive measures to avoid contact between often vulnerable patients and lambing sheep, and take adequate hygienic measures during lambing and handling of birth products. Another sheep-related outbreak occurred between February and May 2009. The regional MHS identified this outbreak based on trawling questionnaires during preliminary investigations into an urban Q fever outbreak in the same region. The MHS suspected a non-dairy sheep farm as an alternative source for 42 acute Q fever cases that had all visited this farm during ‘lamb-viewing days’. A matched case-control study was initiated and included 146 acute Q fever cases and 431 address-matched controls. Multivariable logistic regression analysis confirmed the association between visiting a non-dairy sheep farm and development of acute Q fever in this MHS region. Other risk factors identified were being a smoker, having a past medical history and being over 40 years of age. This non-dairy sheep farm was open to the public and had received 12,000 visitors during the lambing season in 2009 with over 1200 lambs born and only 3 abortions. The large majority of vaginal swabs was PCR positive for multicopy target IS1111. Vaccination of sheep and goats on farms open to the public should help to reduce the future occurrence of acute Q fever cases related to farm visits. Dairy goat farms were the main implicated source during the Dutch Q fever epidemic. However, many questions remained concerning the burden of C. burnetii infection in presumably highly exposed farm residents and their ruminant populations. Chapter 4 presents studies that were part of an integrated research project carried out in 4 different ruminant sectors during 2009-2011, the socalled Q-VIVE project. The overall aim of this research project was to assess the C. burnetii seroprevalence in farm residents and assess herd and animal prevalence based on a representative sample per farm and to identify farm and person-based risk factors for C. burnetii seropositivity in order to formulate targeted advice and better control strategies to reduce the animal and human Q fever burden.
222 | CHAPTER 7
In total, 141 out of 334 eligible commercial dairy goat farms (≥ 100 goats), 14 out of 33 dairy sheep farms (≥ 100 sheep), 119 out of 1344 non-dairy sheep farms (≥100 sheep) and 311 out of a representative sample of 3000 dairy cattle farms (≥50 adult cows) were included in this research project. On each participating farm, up to 3 farm residents were requested to provide a blood sample and to complete an individual questionnaire, and the farm manager was asked to complete a farm questionnaire. Sera of 268 dairy goat farm residents, 27 dairy sheep farm residents, 271 non-dairy sheep farm residents and 755 cattle farm residents were screened for C. burnetii IgG and IgM phase 1 and 2 antibodies using IFA Seroprevalence was high for residents of dairy goat farms (69% of residents seropositive), dairy sheep farms (67%) and dairy cattle farms (72%), indicating a high lifetime risk to acquire a C. burnetii infection. A slightly lower seroprevalence was found in residents of non-dairy sheep farms (51%). Although the overall C. burnetii seroprevalence was high among residents on dairy cattle farms, relatively little evidence was found for recent infections among C. burnetii IgG phase 2 seropositive dairy cattle farm residents (1.2% had presence of C. burnetii IgM phase 2 antibodies versus 11.2% in dairy goat farm residents, 11.1% in residents on dairy sheep farms and 2.6% at non-dairy sheep farms). Among C. burnetii IgG phase 2 seropositive farm residents, 0.3% of dairy cattle farm residents, 4.1% of dairy goat farm residents, 4% of the dairy sheep farmers and none of the non-dairy sheep farm residents had an IgG phase 1 end titer of ≥1:1024 serologically indicative for a possible chronic C. burnetii infection. On dairy goat farms and sheep farms that participated in these studies, presence of C. burnetii antibodies was determined in sera taken from a random sample of 21 goats and 62 sheep by ELISA. A farm was considered positive when at least 1 goat or sheep tested ELISA-positive. A bulk tank milk (BTM)-sample was collected on each participating dairy cattle farm for ELISA and PCR testing to assess the farm status, while dairy cows were not individually sampled. In 2009-2010, the C. burnetii seroprevalence was assessed in dairy goats and sheep before the mandatory Q fever vaccination started at the participating farm. At individual animal level, the highest seroprevalence figures were found in dairy goats (21%) and dairy sheep (19%). In 2010-2011, the seroprevalence was significantly lower in non-dairy sheep (2%). At herd level, 43% of the dairy goat farms, 79% of the dairy sheep farms and 31% of the non-dairy sheep farms had at least one infected animal present in the random sample screened. The mean within-herd prevalence was 46.6% on C. burnetii positive goat farms, 23.5% on C. burnetii positive dairy sheep farms and 6.4% on non-dairy sheep farms, respectively. In 2010-2011, 82% of the dairy cattle farms were BTM-positive by ELISA and 19% by PCR. Risk factors for C. burnetii seropositivity were usually similar for residents and animals within a sector, but frequently differed between the sectors. For all sectors, a higher risk of infection was found for farms with a large herd size. Also farm location was a risk factor; being located in the provinces of Noord-Brabant and Limburg or in an area near (within 8-16 kilometers) BTM-positive small ruminant farms. This corresponds with the dominant role of BTM-positive dairy goat farms during the Dutch Q fever epidemic with goat-related risk factors being important for C. burnetii infections on non-dairy sheep farms. In addition, several risk factors indicated pathways for introduction of C. burnetii on dairy goat farms, such as use of imported straw, artificial insemination and presence of companion animals in the stables. For dairy cattle farms, the risk increased with wild bird presence in the stables, when rats and mice were present on the farm, if the dairy cattle had ticks and if multiple addresses were used for supply of calves. Supply of ewes from multiple addresses was a risk factor for the non-dairy sheep sector. Finally, some factors were identified that seemed to reduce the C. burnetii infection risk, such as the consistent use of gloves during birth assistance, the use of automatic milking in the dairy cattle sector (less direct contact), the use of boots by the farmer or employees at dairy goat farms (less introduction and spread) and lambing outside in the paddock at the meat- and breeding sheep farms (less accumulation and spread of bacteria). These ruminant sectors were advised to use a closed farming system, to avoid other pathways by vermin control and to optimize hygiene especially around birth, including the use of protective clothing. Moreover, Q fever vaccination as a preventive strategy could be considered in dairy ruminant farmers and their adult household members residing on the farm after pre-screening. During the Dutch Q fever epidemic, little was known about the degree of exposure to C. burnetii and related health consequences for veterinary professionals directly working with small ruminants and dairy cattle.
In Chapter 5 the seroprevalence of C. burnetii IgG antibodies among Dutch livestock veterinarians was determined, and occupational risk factors for seropositivity identified. Sera and questionnaires from 189 veterinarians, including veterinary students in their final study year were collected at a national veterinary conference held in November 2008. C. burnetii antibodies were detected in 65.1% of livestock veterinarians. Independent risk factors associated with seropositivity were number of animal contact hours per week, number of working years since graduation as veterinarian, being a practicing veterinarian, occupational contact with swine, and residence in a rural or suburban area. Livestock veterinarians, as well as their physicians, should be aware of these occupational risks. Risk factors associated with C. burnetii infection in veterinary medicine students have been scarcely studied. C. burnetii seroprevalence and associated risk factors were assessed among Dutch veterinary medicine students for all 6 study years in a cross-sectional study based on 674 sera and questionnaires obtained in 2006. Among Dutch veterinary medicine students C. burnetii seroprevalence was considerable (18.7%). Several study-related risk factors were identified such as study direction ‘farm animals’, advanced year of study and having had a zoonosis since study enrollment. Having ever resided on a ruminant farm was a separate risk factor and a dose-response relation with C. burnetii seropositivity was identified for increasing number of farm residence years. Bearing in mind that the burden of disease among veterinarians remains uncertain, vaccination of veterinary students at the start of their study should be seriously considered. These cross-sectional studies in livestock veterinarians and veterinary students mainly focused on risk factors for past C. burnetii infection. The risk for seroconversion was studied in a group of seronegative culling workers that were involved in the culling of 51,820 dairy goats on BTM-positive small ruminant farms end 2009 and first months of 2010. These workers were therefore highly exposed to C. burnetii during the culling activities. Among 517 culling workers, despite use of personal protective equipment (PPE) and instructions how to avoid infection during their work, 17.5% seroconverted for antibodies to C. burnetii. One third of seroconverted culling workers reported symptoms compatible with acute Q fever such as fever and/or rigors, malaise, headache, cough or myalgia after December 1, 2009. Mean duration of illness was 7.6 (range 1–14) days. Total hours worked, herd size, and working inside the stable were significant risk factors in the univariate model. In the multivariable model working more than 100 hours on the farms and working inside the stable remained independent risk factors for seroconversion. The compliance with PPE was reportedly high; however, a key problem was not wearing PPE during lunch breaks while staying on the farm. Vaccination of culling workers should be provided if animal culling in the small ruminant sector is advised in the future. Finally, a general discussion of the findings of the present thesis is given in Chapter 6. This describes the information already known before the studies in this thesis were performed, what these studies added and several recommendations arising from these studies.

7
SUMMARY | 223
In total, 141 out of 334 eligible commercial dairy goat farms (≥ 100 goats), 14 out of 33 dairy sheep farms (≥ 100 sheep), 119 out of 1344 non-dairy sheep farms (≥100 sheep) and 311 out of a representative sample of 3000 dairy cattle farms (≥50 adult cows) were included in this research project. On each participating farm, up to 3 farm residents were requested to provide a blood sample and to complete an individual questionnaire, and the farm manager was asked to complete a farm questionnaire. Sera of 268 dairy goat farm residents, 27 dairy sheep farm residents, 271 non-dairy sheep farm residents and 755 cattle farm residents were screened for C. burnetii IgG and IgM phase 1 and 2 antibodies using IFA Seroprevalence was high for residents of dairy goat farms (69% of residents seropositive), dairy sheep farms (67%) and dairy cattle farms (72%), indicating a high lifetime risk to acquire a C. burnetii infection. A slightly lower seroprevalence was found in residents of non-dairy sheep farms (51%). Although the overall C. burnetii seroprevalence was high among residents on dairy cattle farms, relatively little evidence was found for recent infections among C. burnetii IgG phase 2 seropositive dairy cattle farm residents (1.2% had presence of C. burnetii IgM phase 2 antibodies versus 11.2% in dairy goat farm residents, 11.1% in residents on dairy sheep farms and 2.6% at non-dairy sheep farms). Among C. burnetii IgG phase 2 seropositive farm residents, 0.3% of dairy cattle farm residents, 4.1% of dairy goat farm residents, 4% of the dairy sheep farmers and none of the non-dairy sheep farm residents had an IgG phase 1 end titer of ≥1:1024 serologically indicative for a possible chronic C. burnetii infection. On dairy goat farms and sheep farms that participated in these studies, presence of C. burnetii antibodies was determined in sera taken from a random sample of 21 goats and 62 sheep by ELISA. A farm was considered positive when at least 1 goat or sheep tested ELISA-positive. A bulk tank milk (BTM)-sample was collected on each participating dairy cattle farm for ELISA and PCR testing to assess the farm status, while dairy cows were not individually sampled. In 2009-2010, the C. burnetii seroprevalence was assessed in dairy goats and sheep before the mandatory Q fever vaccination started at the participating farm. At individual animal level, the highest seroprevalence figures were found in dairy goats (21%) and dairy sheep (19%). In 2010-2011, the seroprevalence was significantly lower in non-dairy sheep (2%). At herd level, 43% of the dairy goat farms, 79% of the dairy sheep farms and 31% of the non-dairy sheep farms had at least one infected animal present in the random sample screened. The mean within-herd prevalence was 46.6% on C. burnetii positive goat farms, 23.5% on C. burnetii positive dairy sheep farms and 6.4% on non-dairy sheep farms, respectively. In 2010-2011, 82% of the dairy cattle farms were BTM-positive by ELISA and 19% by PCR. Risk factors for C. burnetii seropositivity were usually similar for residents and animals within a sector, but frequently differed between the sectors. For all sectors, a higher risk of infection was found for farms with a large herd size. Also farm location was a risk factor; being located in the provinces of Noord-Brabant and Limburg or in an area near (within 8-16 kilometers) BTM-positive small ruminant farms. This corresponds with the dominant role of BTM-positive dairy goat farms during the Dutch Q fever epidemic with goat-related risk factors being important for C. burnetii infections on non-dairy sheep farms. In addition, several risk factors indicated pathways for introduction of C. burnetii on dairy goat farms, such as use of imported straw, artificial insemination and presence of companion animals in the stables. For dairy cattle farms, the risk increased with wild bird presence in the stables, when rats and mice were present on the farm, if the dairy cattle had ticks and if multiple addresses were used for supply of calves. Supply of ewes from multiple addresses was a risk factor for the non-dairy sheep sector. Finally, some factors were identified that seemed to reduce the C. burnetii infection risk, such as the consistent use of gloves during birth assistance, the use of automatic milking in the dairy cattle sector (less direct contact), the use of boots by the farmer or employees at dairy goat farms (less introduction and spread) and lambing outside in the paddock at the meat- and breeding sheep farms (less accumulation and spread of bacteria). These ruminant sectors were advised to use a closed farming system, to avoid other pathways by vermin control and to optimize hygiene especially around birth, including the use of protective clothing. Moreover, Q fever vaccination as a preventive strategy could be considered in dairy ruminant farmers and their adult household members residing on the farm after pre-screening. During the Dutch Q fever epidemic, little was known about the degree of exposure to C. burnetii and related health consequences for veterinary professionals directly working with small ruminants and dairy cattle.
In Chapter 5 the seroprevalence of C. burnetii IgG antibodies among Dutch livestock veterinarians was determined, and occupational risk factors for seropositivity identified. Sera and questionnaires from 189 veterinarians, including veterinary students in their final study year were collected at a national veterinary conference held in November 2008. C. burnetii antibodies were detected in 65.1% of livestock veterinarians. Independent risk factors associated with seropositivity were number of animal contact hours per week, number of working years since graduation as veterinarian, being a practicing veterinarian, occupational contact with swine, and residence in a rural or suburban area. Livestock veterinarians, as well as their physicians, should be aware of these occupational risks. Risk factors associated with C. burnetii infection in veterinary medicine students have been scarcely studied. C. burnetii seroprevalence and associated risk factors were assessed among Dutch veterinary medicine students for all 6 study years in a cross-sectional study based on 674 sera and questionnaires obtained in 2006. Among Dutch veterinary medicine students C. burnetii seroprevalence was considerable (18.7%). Several study-related risk factors were identified such as study direction ‘farm animals’, advanced year of study and having had a zoonosis since study enrollment. Having ever resided on a ruminant farm was a separate risk factor and a dose-response relation with C. burnetii seropositivity was identified for increasing number of farm residence years. Bearing in mind that the burden of disease among veterinarians remains uncertain, vaccination of veterinary students at the start of their study should be seriously considered. These cross-sectional studies in livestock veterinarians and veterinary students mainly focused on risk factors for past C. burnetii infection. The risk for seroconversion was studied in a group of seronegative culling workers that were involved in the culling of 51,820 dairy goats on BTM-positive small ruminant farms end 2009 and first months of 2010. These workers were therefore highly exposed to C. burnetii during the culling activities. Among 517 culling workers, despite use of personal protective equipment (PPE) and instructions how to avoid infection during their work, 17.5% seroconverted for antibodies to C. burnetii. One third of seroconverted culling workers reported symptoms compatible with acute Q fever such as fever and/or rigors, malaise, headache, cough or myalgia after December 1, 2009. Mean duration of illness was 7.6 (range 1–14) days. Total hours worked, herd size, and working inside the stable were significant risk factors in the univariate model. In the multivariable model working more than 100 hours on the farms and working inside the stable remained independent risk factors for seroconversion. The compliance with PPE was reportedly high; however, a key problem was not wearing PPE during lunch breaks while staying on the farm. Vaccination of culling workers should be provided if animal culling in the small ruminant sector is advised in the future. Finally, a general discussion of the findings of the present thesis is given in Chapter 6. This describes the information already known before the studies in this thesis were performed, what these studies added and several recommendations arising from these studies.

224 | CHAPTER 7
Nederlandse samenvatting
Dit proefschrift bevat epidemiologische studies die zijn uitgevoerd ten tijde van de Q-koorts epidemie in Nederland van 2007 tot en met 2010. Deze epidemie bestond uit meerdere seizoensgebonden uitbraken en resulteerde uiteindelijk in meer dan 4000 gemelde gevallen van acute Q-koorts, vooral in de provincies Noord-Brabant, Gelderland en Limburg. Q-koorts werd een grote dreiging voor de volksgezondheid. Ten tijde van de eerste Q-koorts uitbraak was nog veel onbekend. Dit proefschrift bevatenkele gedetailleerde descriptieve en analytische uitbraakstudies waarbij tijd, plaats en persoon worden gebruikt voor het aantonen van de meest waarschijnlijk veterinaire bronnen. Tevens bevat het studies naar de seroprevalentie en risicofactoren van een doorgemaakte infectie met Coxiella burnetii (C. burnetii) in de algemene Nederlandse bevolking en voor degenen die beroepsmatig worden blootgesteld aan C. burnetii. De studies in dit proefschrift werden uitgevoerd binnen het Rijksinstituut voor Volksgezondheid en Milieu (RIVM), vaak samen met onderzoekers werkzaam bij andere organisaties zoals de GGD Hart voor Brabant en GGD Brabant-Zuidoost, Academische Werkplaats AMPHI, Jeroen Bosch Ziekenhuis, de Gezondheidsdienst voor Dieren en het Institute for Risk Assessment Sciences (IRAS) van de Universiteit Utrecht. In Hoofdstuk 1 wordt een algemene inleiding gegeven over Q-koorts en worden de inhoud en de doelen van dit proefschrift beschreven. In het eerste artikel van Hoofdstuk 2 zijn sera en vragenlijsten van 5654 personen gebruikt die in 2006-2007 hebben deelgenomen aan het PIENTER-project (Peiling Immunisatie Effect Nederland ter Evaluatie van het Rijksvaccinatieprogramma). Het PIENTER-project is een groot landelijk onderzoek dat eens in de 10 jaar georganiseerd wordt, primair ter evaluatie van het Rijksvaccinatieprogramma. In het kader van dit project is sinds 1997 een serumbank opgericht, die sera bevatten van een representatieve steekproef van de Nederlandse bevolking van 0-79 jaar uit 40 gemeentes. Blootstelling aan C. burnetii leidt tot de vorming van antistoffen. Analyse van de aanwezigheid van die antistoffen bij groepen mensen geeft, in de vorm van de seroprevalentie, een indicatie van de doorgemaakte blootstelling. De tweede PIENTER-studie bood een mooie gelegenheid om retrospectief de seroprevalentie van C. burnetii in Nederland te bestuderen, vlak voordat de eerste Q-koortsuitbraak eind mei 2007 werd opgemerkt. IgG antistoffen tegen fase 2-C. burnetii werden gemeten met ELISA (Serion ELISA classic, Virion/Serion, Würzburg, Duitsland) om een nationale schatting van de seroprevalentie te verkrijgen. Om de sensitiviteit te verhogen werden zwakpositieve uitslagen als positief beschouwd. Verder werden 504 ELISA-negatieve monsters voor validatie onderzocht met de sensitievere immunofluorescentie (IFA; Focus Diagnostics, Cypress, Californië, VS). Gecorrigeerd voor de IFA-resultaten, werd er een relatief lage seroprevalentie gevonden van 2,4%. De ELISA-seroprevalentie nam toe met de leeftijd van 0,5% in jonge kinderen tot 2,3% voor 60-79 jarigen. Significante risicofactoren waren onder andere het geboren zijn in Turkije, beroepsmatig contact hebben met dieren en het houden van landbouwhuisdieren in de laatste 5 jaren. Deze risicofactoren benadrukken het bekende risico van direct contact met herkauwers en afkomst uit een voor Q-koorts hoog-endemisch land. Er werd geen verhoogde seroprevalentie van C. burnetii gevonden in Noord-Brabant. Er was geen relatie met de geiten-, schapen-, of runderdichtheid per gemeente. Deze studie ondersteunt de hypothese dat de seroprevalentie van C. burnetii antistoffen in de Nederlandse bevolking vlak voor de eerste Q-koorts uitbraak laag was, ook in vergelijking met andere Europese landen. De grote omvang van vatbaren in de Nederlandse bevolking heeft mogelijk bijgedragen aan de omvang van de Q-koortsepidemie in Nederland in de periode 2007-2009. De Q-koortsepidemie in Nederland bood de mogelijkheid om de antistofresponsen van een grote groep patiënten met acute Q-koorts te bestuderen gedurende een langere periode. Het tweede artikel in Hoofdstuk 2 beschrijft de resultaten van een cohort van volwassen acute Q-koortspatiënten die tussen 2007 en 2009 in het Laboratorium Medische Microbiologie in het Jeroen Bosch Ziekenhuis in ‘s-Hertogenbosch zijn gediagnosticeerd. Deze 344 patiënten kregen drie, zes en twaalf maanden na de diagnose standaard serologische controles aangeboden. C. burnetii IgM en IgG fase 1 en 2 antistoffen werden bepaald met behulp van IFA in serum. Deze data zijn gebruikt om de longitudinale
respons van deze vier verschillende antistoffen tegen C. burnetii antigenen te bestuderen. Een wiskundig model gericht op de dynamiek tussen serumantistoffen en pathogenen is gebruikt om kwantitatief de profielen van de C. burnetii serorespons te modelleren. Er werd een aanzienlijke mate van heterogeniteit in de individuele antistofresponsen gezien. Kenmerken van deze respons, zoals de piektiter en de vervalsnelheid werden gebruikt om deze respons te beschrijven. De binaire mixtureanalyse van de C. burnetii IgG piektiters (fase 1 en 2) liet een groep patiënten zien met hoge IgG piektiters die langzaam afnamen en mogelijk patiënten met chronische Q koorts zouden kunnen representeren. Nadat de uitkomsten van de binaire mixtureanalyse in een odds score werden verwerkt, kon worden geconcludeerd dat naast een hoge IgG fase 1-titer, ook hoge IgG fase 2-titers, voorspellend kunnen zijn voor de detectie van patiënten met mogelijke chronische Q koorts.
In Hoofdstuk 3 worden vier uitbraakonderzoeken beschreven. In het eerste artikel van Hoofdstuk 3 wordt het patiënt-controle onderzoek beschreven dat in en rondom Herpen, een plattelandsdorp met 2.850 inwoners gelegen in de provincie Noord Brabant tussen Oss en Nijmegen, is uitgevoerd. Huisartsen in dit dorp meldden eind mei 2007 een opvallende toename van het aantal patiënten - tussen de 30 en de 60 jaar - met een pneumonie of andere respiratoire klachten aan de regionale GGD. In september 2007 werden in totaal 696 inwoners en 35 reeds gediagnosticeerde patiënten met acute Q-koorts uit dit clustergebied uitgenodigd om deel te nemen aan een vragenlijstonderzoek en een eenmalige bloedafname voor screening op C. burnetii IgG and IgM fase 1 en 2 antistoffen met IFA met een 1:64 serum verdunning.
Uit dit onderzoek bleek dat 73 (16.5%) van de deelnemende inwoners een recente C. burnetii infectie had doorgemaakt. Het patiënt-controle onderzoek omvatte 332 seronegatieve inwoners als controlepersonen en 73 inwoners met een recente C. burnetii infectie, waaronder reeds gediagnosticeerde patiënten met acute Q-koorts. Er bleek een verhoogd risico op recente Q-koorts voor mensen die roken en contact hadden met landbouwproducten zoals mest, hooi en stro. Tevens gaf het onderzoek aanwijzingen dat de veterinaire bron van deze Q-koorts uitbraak zich bevond in een gebied aan de oostelijke kant van Herpen. Binnen dit gebied bevonden zich 3 melkveehouderijen met runderen, 1 melkgeitenbedrijf, 1 schapenfokkerij en 3 hobbyboerderijen. In april 2007 had het grote melkgeitenbedrijf een abortusstorm onder de melkgeiten gehad. Onderzocht abortusmateriaal door de Gezondheidsdienst voor Dieren (GD) werd positief bevonden voor C. burnetii. Omgeving- en diermonsters afgenomen op 2 verschillende bedrijven, waaronder dit melkgeitenbedrijf en een hobbyboerderij met geiten, waren eveneens positief voor C. burnetii volgens een nieuw ontwikkelde kwantitatieve Q-PCR. Analyse van de weersomstandigheden net voor de uitbraakperiode lieten een record warme en droge aprilmaand zien, met significant meer oostelijke wind in vergelijking tot voorgaande 30 jaren. Deze weersomstandigheden hebben mogelijk bijgedragen aan een effectieve aerosolverspreiding vanuit het brongebied. Eind februari 2008 zijn er informatiefolders gestuurd aan geitenhouders in Noord-Brabant, waarin hygiënemaatregelen werden aanbevolen.
In het tweede artikel van Hoofdstuk 3 is onderzocht in hoeverre het risico op acute Q-koorts afneemt met toenemende afstand tussen woonhuis en een melkgeitenbedrijf met een door C. burnetii veroorzaakt abortusprobleem. Deze mogelijkheid werd geboden door een in tijd en plaats goed afgebakend cluster van 96 acute Q-koortspatiënten in en rondom de stad Helmond tussen week 16 en week 32, 2008. Er was sprake van een duidelijke clustering in 2 woonwijken. Toen lag dit cluster nog buiten het hoogincidentie gebied van Q-koorts in Noord Brabant. Q-koorts als oorzaak van de abortusstorm werd bevestigd na onderzoek van placentamateriaal door de GD. Een generiek geografisch informatiesysteem werd gebruikt als hulpmiddel bij bronopsporing. Voor 7 bedrijven met meer dan 40 schapen of geiten werden incidenties en relatieve risico’s berekend voor cirkels met toenemende afstand rond het bedrijf, waarbij de 5-10 kilometer (km)-zone als referentie werd gebruikt. Mensen die binnen 2 km van het besmette melkgeitenbedrijf woonden hadden een veel hoger risico (relatief risico 31,1; 95% betrouwbaarheidsinterval 16,4-59,1) dan mensen die op meer dan 5 km afstand van dit bedrijf woonden. De chronologie van de abortusstorm, dagen met oost- tot noordoostenwind en incubatietijd van Q-koorts maakten het verband tussen het melkgeitenbedrijf en het humane cluster van acute Q-koorts zeer waarschijnlijk.
tweede artikel in Hoofdstuk 2

7
NEDERLANDSE SAMENVATTING | 225
Nederlandse samenvatting
Dit proefschrift bevat epidemiologische studies die zijn uitgevoerd ten tijde van de Q-koorts epidemie in Nederland van 2007 tot en met 2010. Deze epidemie bestond uit meerdere seizoensgebonden uitbraken en resulteerde uiteindelijk in meer dan 4000 gemelde gevallen van acute Q-koorts, vooral in de provincies Noord-Brabant, Gelderland en Limburg. Q-koorts werd een grote dreiging voor de volksgezondheid. Ten tijde van de eerste Q-koorts uitbraak was nog veel onbekend. Dit proefschrift bevatenkele gedetailleerde descriptieve en analytische uitbraakstudies waarbij tijd, plaats en persoon worden gebruikt voor het aantonen van de meest waarschijnlijk veterinaire bronnen. Tevens bevat het studies naar de seroprevalentie en risicofactoren van een doorgemaakte infectie met Coxiella burnetii (C. burnetii) in de algemene Nederlandse bevolking en voor degenen die beroepsmatig worden blootgesteld aan C. burnetii. De studies in dit proefschrift werden uitgevoerd binnen het Rijksinstituut voor Volksgezondheid en Milieu (RIVM), vaak samen met onderzoekers werkzaam bij andere organisaties zoals de GGD Hart voor Brabant en GGD Brabant-Zuidoost, Academische Werkplaats AMPHI, Jeroen Bosch Ziekenhuis, de Gezondheidsdienst voor Dieren en het Institute for Risk Assessment Sciences (IRAS) van de Universiteit Utrecht. In Hoofdstuk 1 wordt een algemene inleiding gegeven over Q-koorts en worden de inhoud en de doelen van dit proefschrift beschreven. In het eerste artikel van Hoofdstuk 2 zijn sera en vragenlijsten van 5654 personen gebruikt die in 2006-2007 hebben deelgenomen aan het PIENTER-project (Peiling Immunisatie Effect Nederland ter Evaluatie van het Rijksvaccinatieprogramma). Het PIENTER-project is een groot landelijk onderzoek dat eens in de 10 jaar georganiseerd wordt, primair ter evaluatie van het Rijksvaccinatieprogramma. In het kader van dit project is sinds 1997 een serumbank opgericht, die sera bevatten van een representatieve steekproef van de Nederlandse bevolking van 0-79 jaar uit 40 gemeentes. Blootstelling aan C. burnetii leidt tot de vorming van antistoffen. Analyse van de aanwezigheid van die antistoffen bij groepen mensen geeft, in de vorm van de seroprevalentie, een indicatie van de doorgemaakte blootstelling. De tweede PIENTER-studie bood een mooie gelegenheid om retrospectief de seroprevalentie van C. burnetii in Nederland te bestuderen, vlak voordat de eerste Q-koortsuitbraak eind mei 2007 werd opgemerkt. IgG antistoffen tegen fase 2-C. burnetii werden gemeten met ELISA (Serion ELISA classic, Virion/Serion, Würzburg, Duitsland) om een nationale schatting van de seroprevalentie te verkrijgen. Om de sensitiviteit te verhogen werden zwakpositieve uitslagen als positief beschouwd. Verder werden 504 ELISA-negatieve monsters voor validatie onderzocht met de sensitievere immunofluorescentie (IFA; Focus Diagnostics, Cypress, Californië, VS). Gecorrigeerd voor de IFA-resultaten, werd er een relatief lage seroprevalentie gevonden van 2,4%. De ELISA-seroprevalentie nam toe met de leeftijd van 0,5% in jonge kinderen tot 2,3% voor 60-79 jarigen. Significante risicofactoren waren onder andere het geboren zijn in Turkije, beroepsmatig contact hebben met dieren en het houden van landbouwhuisdieren in de laatste 5 jaren. Deze risicofactoren benadrukken het bekende risico van direct contact met herkauwers en afkomst uit een voor Q-koorts hoog-endemisch land. Er werd geen verhoogde seroprevalentie van C. burnetii gevonden in Noord-Brabant. Er was geen relatie met de geiten-, schapen-, of runderdichtheid per gemeente. Deze studie ondersteunt de hypothese dat de seroprevalentie van C. burnetii antistoffen in de Nederlandse bevolking vlak voor de eerste Q-koorts uitbraak laag was, ook in vergelijking met andere Europese landen. De grote omvang van vatbaren in de Nederlandse bevolking heeft mogelijk bijgedragen aan de omvang van de Q-koortsepidemie in Nederland in de periode 2007-2009. De Q-koortsepidemie in Nederland bood de mogelijkheid om de antistofresponsen van een grote groep patiënten met acute Q-koorts te bestuderen gedurende een langere periode. Het tweede artikel in Hoofdstuk 2 beschrijft de resultaten van een cohort van volwassen acute Q-koortspatiënten die tussen 2007 en 2009 in het Laboratorium Medische Microbiologie in het Jeroen Bosch Ziekenhuis in ‘s-Hertogenbosch zijn gediagnosticeerd. Deze 344 patiënten kregen drie, zes en twaalf maanden na de diagnose standaard serologische controles aangeboden. C. burnetii IgM en IgG fase 1 en 2 antistoffen werden bepaald met behulp van IFA in serum. Deze data zijn gebruikt om de longitudinale
respons van deze vier verschillende antistoffen tegen C. burnetii antigenen te bestuderen. Een wiskundig model gericht op de dynamiek tussen serumantistoffen en pathogenen is gebruikt om kwantitatief de profielen van de C. burnetii serorespons te modelleren. Er werd een aanzienlijke mate van heterogeniteit in de individuele antistofresponsen gezien. Kenmerken van deze respons, zoals de piektiter en de vervalsnelheid werden gebruikt om deze respons te beschrijven. De binaire mixtureanalyse van de C. burnetii IgG piektiters (fase 1 en 2) liet een groep patiënten zien met hoge IgG piektiters die langzaam afnamen en mogelijk patiënten met chronische Q koorts zouden kunnen representeren. Nadat de uitkomsten van de binaire mixtureanalyse in een odds score werden verwerkt, kon worden geconcludeerd dat naast een hoge IgG fase 1-titer, ook hoge IgG fase 2-titers, voorspellend kunnen zijn voor de detectie van patiënten met mogelijke chronische Q koorts.
In Hoofdstuk 3 worden vier uitbraakonderzoeken beschreven. In het eerste artikel van Hoofdstuk 3 wordt het patiënt-controle onderzoek beschreven dat in en rondom Herpen, een plattelandsdorp met 2.850 inwoners gelegen in de provincie Noord Brabant tussen Oss en Nijmegen, is uitgevoerd. Huisartsen in dit dorp meldden eind mei 2007 een opvallende toename van het aantal patiënten - tussen de 30 en de 60 jaar - met een pneumonie of andere respiratoire klachten aan de regionale GGD. In september 2007 werden in totaal 696 inwoners en 35 reeds gediagnosticeerde patiënten met acute Q-koorts uit dit clustergebied uitgenodigd om deel te nemen aan een vragenlijstonderzoek en een eenmalige bloedafname voor screening op C. burnetii IgG and IgM fase 1 en 2 antistoffen met IFA met een 1:64 serum verdunning.
Uit dit onderzoek bleek dat 73 (16.5%) van de deelnemende inwoners een recente C. burnetii infectie had doorgemaakt. Het patiënt-controle onderzoek omvatte 332 seronegatieve inwoners als controlepersonen en 73 inwoners met een recente C. burnetii infectie, waaronder reeds gediagnosticeerde patiënten met acute Q-koorts. Er bleek een verhoogd risico op recente Q-koorts voor mensen die roken en contact hadden met landbouwproducten zoals mest, hooi en stro. Tevens gaf het onderzoek aanwijzingen dat de veterinaire bron van deze Q-koorts uitbraak zich bevond in een gebied aan de oostelijke kant van Herpen. Binnen dit gebied bevonden zich 3 melkveehouderijen met runderen, 1 melkgeitenbedrijf, 1 schapenfokkerij en 3 hobbyboerderijen. In april 2007 had het grote melkgeitenbedrijf een abortusstorm onder de melkgeiten gehad. Onderzocht abortusmateriaal door de Gezondheidsdienst voor Dieren (GD) werd positief bevonden voor C. burnetii. Omgeving- en diermonsters afgenomen op 2 verschillende bedrijven, waaronder dit melkgeitenbedrijf en een hobbyboerderij met geiten, waren eveneens positief voor C. burnetii volgens een nieuw ontwikkelde kwantitatieve Q-PCR. Analyse van de weersomstandigheden net voor de uitbraakperiode lieten een record warme en droge aprilmaand zien, met significant meer oostelijke wind in vergelijking tot voorgaande 30 jaren. Deze weersomstandigheden hebben mogelijk bijgedragen aan een effectieve aerosolverspreiding vanuit het brongebied. Eind februari 2008 zijn er informatiefolders gestuurd aan geitenhouders in Noord-Brabant, waarin hygiënemaatregelen werden aanbevolen.
In het tweede artikel van Hoofdstuk 3 is onderzocht in hoeverre het risico op acute Q-koorts afneemt met toenemende afstand tussen woonhuis en een melkgeitenbedrijf met een door C. burnetii veroorzaakt abortusprobleem. Deze mogelijkheid werd geboden door een in tijd en plaats goed afgebakend cluster van 96 acute Q-koortspatiënten in en rondom de stad Helmond tussen week 16 en week 32, 2008. Er was sprake van een duidelijke clustering in 2 woonwijken. Toen lag dit cluster nog buiten het hoogincidentie gebied van Q-koorts in Noord Brabant. Q-koorts als oorzaak van de abortusstorm werd bevestigd na onderzoek van placentamateriaal door de GD. Een generiek geografisch informatiesysteem werd gebruikt als hulpmiddel bij bronopsporing. Voor 7 bedrijven met meer dan 40 schapen of geiten werden incidenties en relatieve risico’s berekend voor cirkels met toenemende afstand rond het bedrijf, waarbij de 5-10 kilometer (km)-zone als referentie werd gebruikt. Mensen die binnen 2 km van het besmette melkgeitenbedrijf woonden hadden een veel hoger risico (relatief risico 31,1; 95% betrouwbaarheidsinterval 16,4-59,1) dan mensen die op meer dan 5 km afstand van dit bedrijf woonden. De chronologie van de abortusstorm, dagen met oost- tot noordoostenwind en incubatietijd van Q-koorts maakten het verband tussen het melkgeitenbedrijf en het humane cluster van acute Q-koorts zeer waarschijnlijk.

226 | CHAPTER 7
De gebruikte GIS-methode is snel inzetbaar en biedt de mogelijkheid om op basis van epidemiologische gegevens onderscheid te maken in de waarschijnlijkheid dat bedrijven een rol spelen in de transmissie. De methode kan echter niet differentiëren tussen bedrijven die dicht bij elkaar liggen, en houdt geen rekening met windrichting en windsnelheid. Het derde artikel van Hoofdstuk 3 omvat een beschrijvende epidemiologische studie van een Q-koorts uitbraak in een psychiatrische inrichting in Nijmegen in mei 2008. Actieve case finding onder de inwonende cliënten, werknemers en bezoekers van de instelling leverde 45 personen op met klinische verschijnselen passend bij Q-koorts, waarvan 28 cliënten en werknemers na laboratoriumtesten werden bevestigd met acute Q-koorts. Een kleine kudde van zes schapen met vijf pasgeboren lammeren was de meest waarschijnlijke bron van deze institutionele uitbraak. Deze kudde werd op het terrein van deze instelling gehouden om te grazen en had in april en begin mei afgelammerd. Een lammetje dat verstoten werd door de moeder werd geplaatst in een konijnenhok 3 dagen na geboorte. De incidentie (attack rate) van acute Q-koorts werden berekend per gebouw op deze instelling en bleek het hoogst in het gebouw waar het verstoten lammertje was geaaid en verzorgd door meerdere cliënten, gevolgd door de gebouwen die grensden aan de schapenweide en het konijnenhok. Monsters afgenomen van 3 ooien uit deze kleine kudde en het verstoten lammetje waren positief voor C. burnetii DNA. Een grote schapenkudde die net buiten de instelling had gegraasd tijdens de uitbraakperiode was minder waarschijnlijk als alternatieve bron aangezien 10 random geselecteerde schapen alle negatief testen op C. burnetii DNA. Besmette kleine herkauwers vormen het grootste risico op het verspreiden van C. burnetii als ze aflammeren of verwerpen. Het is belangrijk dat zorginstellingen het contact tussen vaak kwetsbare patiëntengroepen en aflammerende schapen op hun terrein vermijden, en adequate hygiënemaatregelen treffen ten tijde van het aflammeren en het hanteren van de (na)geboorteproducten. In het vierde artikel van Hoofdstuk 3 wordt een andere schaapgerelateerde uitbraak beschreven die plaatsvond in de periode februari tot en met mei 2009. De GGD Brabant- Zuidoost identificeerde een schapenboerderij als mogelijk additionele bron tijdens het lopende uitbraakonderzoek naar de Q-koorts uitbraak in Helmond (artikel 2 in Hoofdstuk 3) aan de hand van een door patiënten ingevulde bronopsporingsvragenlijst. Van de in deze uitbraak gemelde gevallen (‘cases’) nam 62% (162/248) deel aan het onderzoek en werden vergeleken met 433 gematchte controlepersonen uit dezelfde omgeving. Er werd onderzocht of een bezoek aan deze specifieke schapenboerderij een risicofactor was voor acute Q-koorts in de lokale bevolking. Er werd een gecorrigeerde odds ratio (OR) van 43,3 voor een bezoek aan deze schapenboerderij gevonden. Andere risicofactoren voor het oplopen van acute Q-koorts waren roken, overige medische problemen en een leeftijd ouder dan 40 jaar. Deze boerderij had een publieksfunctie en ontving 12.000 bezoekers tijdens het lammerseizoen in 2009 waarin 1200 lammeren werden geboren en er slechts 3 verwerpingen plaatsvonden. Het merendeel van de vaginale swabs afgenomen van de schapen was PCR positief. Deze boerderij werd gesloten voor publiek gedurende de lente van 2010. Nadat alle schapen tegen Q-koorts gevaccineerd waren werd de schapenboerderij voor publiek heropend in de lente van 2011. Deze uitbraak illustreert het belang van het instellen van een vaccinatieplicht voor geiten- en schapenbedrijven met een publieksfunctie zoals bedrijven met lammetjesaaidagen, kinder- en zorgboerderijen, en rondtrekkende schapenkuddes in natuurgebieden. In Hoofdstuk 4 zijn een zestal studies opgenomen die deel uitmaken van het Q-VIVE project, een geïntegreerd humaan-veterinair onderzoeksproject. Het doel van dit ‘One-Health’ project was om betere adviezen en controlemaatregelen te formuleren om de impact van Q-koorts en het infectierisico met C. burnetii bij zowel melkgeiten, melkschapen, vlees-en fokschapen en melkrundvee in Nederland als binnen het veehouderijgezinnen te reduceren. Het ging om bedrijven met minstens 100 melkgeiten (141 deelnemende bedrijven; 334 uitgenodigd), 100 melkschapen (14 deelnemende bedrijven; 33 uitgenodigd), 100 vlees- en fokschapen (119 deelnemende bedrijven; 1344 uitgenodigd) en bedrijven met minstens 50 volwassen melkrunderen (311 deelnemende bedrijven uit een representatieve steekproef van 3000 melkveebedrijven). De veehouder of bedrijfsmanager werd verzocht om een bedrijfsvragenlijst in te vullen met karakteristieken over het bedrijf en de veestapel. Bij elk deelnemend geiten- en schapenbedrijf werd van een representatieve steekproef (21 geiten, 62 schapen) bloed afgenomen dat werd getest op aanwezigheid van C. burnetii antistoffen met een enzyme-linked immunosorbent assay (ELISA).
Het hoogste percentage ELISA-positieve dieren werd gevonden op de melkgeiten- en melkschapenbedrijven, respectievelijk 21% en 19%. Voor vlees- en fokschapen lag dit met 2% beduidend lager. Op bedrijfsniveau bleek 43% van de melkgeitenbedrijven, 79% van de 14 melkschapenbedrijven en 31% van de vlees/fokschaapbedrijven minimaal 1 besmet dier te houden. Voor de runderbedrijven werd een tankmelkmonster onderzocht, waarvan 82% positief bleek te zijn voor de antistoffen op basis van ELISA en 19% positief was voor aanwezigheid van bacterieel DNA. De seroprevalentie van C. burnetii infecties onder de onderzochte kleine herkauwers komt goed overeen met de dominante rol die melkgeiten en melkschapen gespeeld hebben in de Nederlandse Q-koorts epidemie. Vergelijking met eerdere seroprevalentieschattingen uit onderzoek in 2008 toen 5,7% van de onderzochte melkschapen en 14,7% van de onderzochte melkgeiten positief was, laat zien dat in deze sectoren de bacterie zich tijdens de epidemie duidelijk verder heeft kunnen verspreiden. Voor de vlees- en fokschapen werd die toename niet gezien (ook in 2008 2% positief). Voor deze schapen was er tijdens de epidemie ook enkel een relatie met Q-koorts patiënten als er direct contact met de schapen had plaatsgevonden op bedrijven waar de bacterie voorkwam. Een rol voor verwaaiing naar omwonenden werd nooit gevonden, wat past bij het duidelijk lagere risico voor verspreiding van de bacterie vanuit deze schapenbedrijven in verhouding tot de melkgeiten en melkschapenbedrijven zoals gevonden in ons onderzoek in de stal en stalomgeving. Daar werden op de vlees-en fokschapenbedrijven minder onderzochte omgevingsmonsters positief bevonden voor C. burnetii, en deze bevatten doorgaans ook een lagere hoeveelheid van de bacterie. Per bedrijf werd aan 3 personen gevraagd een individuele vragenlijst in te vullen (bij voorkeur de veehouder zelf, de partner en een inwonend kind van 12 jaar of ouder of eventueel een bedrijfswerknemer) en werd bij hen bloed afgenomen. In totaal zijn 268 sera van bewoners op melkgeitenbedrijven, 27 sera van bewoners van melkschapenbedrijven, 271 sera van bewoners op vlees- en fokschaapbedrijven en 755 sera van bewoners van melkrundveebedrijven gescreend op de aanwezigheid van C. burnetii IgG en IgM fase 1 en 2 antistoffen met IFA (Focus Diagnostics, Cypress, Californië, VS). Het percentage veehouderijbewoners met C. burnetii IgG fase 2 antistoffen was vergelijkbaar hoog voor de melkgeiten-(69%), melkschapen- (67%) en melkrundveehouders (72%). Een wat lager percentage werd gevonden voor de veehouderijgezinnen op de vlees- en fokschaapbedrijven (51%). Dit laat zien dat veehouders en hun gezinsleden in Nederland een grote kans hebben om gedurende hun leven een infectie met C. burnetii door te maken, al dan niet met gezondheidsklachten. Hoewel de seroprevalentie op basis van aanwezigheid van C. burnetii IgG fase 2 antistoffen bij de melkrundveehouders hoog was, werden er relatief weinig aanwijzingen gevonden voor recente infecties op basis van aanwezigheid van C. burnetii IgM fase 2 antistoffen (1,2% versus 11% bij de bewoners van melkgeiten- en melkschapenhouderijen). Dit suggereert dat de klinische impact van deze infecties in deze bedrijfstak mogelijk beperkt is. Dit gold tevens voor mogelijke chronische Q-koorts. Geen van de bewoners op de vlees- en fokschaapbedrijven en 0,3% van de bewoners van melkrundhouderijen had een IgG fase 1 eindtiter van 1:1024 of hoger, terwijl 4% van de bewoners op melkgeitenhouderijen en melkschapenhouderijen deze hoge IgG fase 1 titer had, hetgeen indicatief is voor mogelijke chronische Q-koorts. Risicofactoren voor infectie met C. burnetii waren doorgaans redelijk vergelijkbaar voor de veehouders en dieren binnen een bedrijfstak, maar verschilden regelmatig tussen de bedrijfstakken. Voor alle bedrijfstakken werd een hoger risico gevonden voor bedrijven met een grote bedrijfsomvang en met een bedrijfslocatie in de provincies Noord-Brabant en Limburg of een kortere afstand tot het dichtstbijzijnde tankmelkpositieve melkgeitenbedrijf (<8-16 kilometer). Dit laatste laat zien dat de epidemie onder melkgeiten ook invloed heeft gehad op het voorkomen van C. burnetii op andere soorten veehouderijen. Daarnaast gaven diverse factoren verschillende risico's van insleep weer. Voor geitenbedrijven werd een hoger risico op infecties gevonden bij aanwezigheid van honden en katten in de geitenstallen, bij aankoop van buitenlands stro, en bij toepassing van kunstmatige inseminatie. Voor melkrunderbedrijven was het risico verhoogd bij aanwezigheid van wilde vogels in de stallen, als ratten en muizen op het bedrijf aanwezig waren, als de runderen teken hadden en als meerdere aanvoeradressen werden gebruikt voor nieuwe kalveren. Aanvoer van ooien van elders was een risicofactor voor de vlees- en fokschapensector.
7
NEDERLANDSE SAMENVATTING | 227
De gebruikte GIS-methode is snel inzetbaar en biedt de mogelijkheid om op basis van epidemiologische gegevens onderscheid te maken in de waarschijnlijkheid dat bedrijven een rol spelen in de transmissie. De methode kan echter niet differentiëren tussen bedrijven die dicht bij elkaar liggen, en houdt geen rekening met windrichting en windsnelheid. Het derde artikel van Hoofdstuk 3 omvat een beschrijvende epidemiologische studie van een Q-koorts uitbraak in een psychiatrische inrichting in Nijmegen in mei 2008. Actieve case finding onder de inwonende cliënten, werknemers en bezoekers van de instelling leverde 45 personen op met klinische verschijnselen passend bij Q-koorts, waarvan 28 cliënten en werknemers na laboratoriumtesten werden bevestigd met acute Q-koorts. Een kleine kudde van zes schapen met vijf pasgeboren lammeren was de meest waarschijnlijke bron van deze institutionele uitbraak. Deze kudde werd op het terrein van deze instelling gehouden om te grazen en had in april en begin mei afgelammerd. Een lammetje dat verstoten werd door de moeder werd geplaatst in een konijnenhok 3 dagen na geboorte. De incidentie (attack rate) van acute Q-koorts werden berekend per gebouw op deze instelling en bleek het hoogst in het gebouw waar het verstoten lammertje was geaaid en verzorgd door meerdere cliënten, gevolgd door de gebouwen die grensden aan de schapenweide en het konijnenhok. Monsters afgenomen van 3 ooien uit deze kleine kudde en het verstoten lammetje waren positief voor C. burnetii DNA. Een grote schapenkudde die net buiten de instelling had gegraasd tijdens de uitbraakperiode was minder waarschijnlijk als alternatieve bron aangezien 10 random geselecteerde schapen alle negatief testen op C. burnetii DNA. Besmette kleine herkauwers vormen het grootste risico op het verspreiden van C. burnetii als ze aflammeren of verwerpen. Het is belangrijk dat zorginstellingen het contact tussen vaak kwetsbare patiëntengroepen en aflammerende schapen op hun terrein vermijden, en adequate hygiënemaatregelen treffen ten tijde van het aflammeren en het hanteren van de (na)geboorteproducten. In het vierde artikel van Hoofdstuk 3 wordt een andere schaapgerelateerde uitbraak beschreven die plaatsvond in de periode februari tot en met mei 2009. De GGD Brabant- Zuidoost identificeerde een schapenboerderij als mogelijk additionele bron tijdens het lopende uitbraakonderzoek naar de Q-koorts uitbraak in Helmond (artikel 2 in Hoofdstuk 3) aan de hand van een door patiënten ingevulde bronopsporingsvragenlijst. Van de in deze uitbraak gemelde gevallen (‘cases’) nam 62% (162/248) deel aan het onderzoek en werden vergeleken met 433 gematchte controlepersonen uit dezelfde omgeving. Er werd onderzocht of een bezoek aan deze specifieke schapenboerderij een risicofactor was voor acute Q-koorts in de lokale bevolking. Er werd een gecorrigeerde odds ratio (OR) van 43,3 voor een bezoek aan deze schapenboerderij gevonden. Andere risicofactoren voor het oplopen van acute Q-koorts waren roken, overige medische problemen en een leeftijd ouder dan 40 jaar. Deze boerderij had een publieksfunctie en ontving 12.000 bezoekers tijdens het lammerseizoen in 2009 waarin 1200 lammeren werden geboren en er slechts 3 verwerpingen plaatsvonden. Het merendeel van de vaginale swabs afgenomen van de schapen was PCR positief. Deze boerderij werd gesloten voor publiek gedurende de lente van 2010. Nadat alle schapen tegen Q-koorts gevaccineerd waren werd de schapenboerderij voor publiek heropend in de lente van 2011. Deze uitbraak illustreert het belang van het instellen van een vaccinatieplicht voor geiten- en schapenbedrijven met een publieksfunctie zoals bedrijven met lammetjesaaidagen, kinder- en zorgboerderijen, en rondtrekkende schapenkuddes in natuurgebieden. In Hoofdstuk 4 zijn een zestal studies opgenomen die deel uitmaken van het Q-VIVE project, een geïntegreerd humaan-veterinair onderzoeksproject. Het doel van dit ‘One-Health’ project was om betere adviezen en controlemaatregelen te formuleren om de impact van Q-koorts en het infectierisico met C. burnetii bij zowel melkgeiten, melkschapen, vlees-en fokschapen en melkrundvee in Nederland als binnen het veehouderijgezinnen te reduceren. Het ging om bedrijven met minstens 100 melkgeiten (141 deelnemende bedrijven; 334 uitgenodigd), 100 melkschapen (14 deelnemende bedrijven; 33 uitgenodigd), 100 vlees- en fokschapen (119 deelnemende bedrijven; 1344 uitgenodigd) en bedrijven met minstens 50 volwassen melkrunderen (311 deelnemende bedrijven uit een representatieve steekproef van 3000 melkveebedrijven). De veehouder of bedrijfsmanager werd verzocht om een bedrijfsvragenlijst in te vullen met karakteristieken over het bedrijf en de veestapel. Bij elk deelnemend geiten- en schapenbedrijf werd van een representatieve steekproef (21 geiten, 62 schapen) bloed afgenomen dat werd getest op aanwezigheid van C. burnetii antistoffen met een enzyme-linked immunosorbent assay (ELISA).
Het hoogste percentage ELISA-positieve dieren werd gevonden op de melkgeiten- en melkschapenbedrijven, respectievelijk 21% en 19%. Voor vlees- en fokschapen lag dit met 2% beduidend lager. Op bedrijfsniveau bleek 43% van de melkgeitenbedrijven, 79% van de 14 melkschapenbedrijven en 31% van de vlees/fokschaapbedrijven minimaal 1 besmet dier te houden. Voor de runderbedrijven werd een tankmelkmonster onderzocht, waarvan 82% positief bleek te zijn voor de antistoffen op basis van ELISA en 19% positief was voor aanwezigheid van bacterieel DNA. De seroprevalentie van C. burnetii infecties onder de onderzochte kleine herkauwers komt goed overeen met de dominante rol die melkgeiten en melkschapen gespeeld hebben in de Nederlandse Q-koorts epidemie. Vergelijking met eerdere seroprevalentieschattingen uit onderzoek in 2008 toen 5,7% van de onderzochte melkschapen en 14,7% van de onderzochte melkgeiten positief was, laat zien dat in deze sectoren de bacterie zich tijdens de epidemie duidelijk verder heeft kunnen verspreiden. Voor de vlees- en fokschapen werd die toename niet gezien (ook in 2008 2% positief). Voor deze schapen was er tijdens de epidemie ook enkel een relatie met Q-koorts patiënten als er direct contact met de schapen had plaatsgevonden op bedrijven waar de bacterie voorkwam. Een rol voor verwaaiing naar omwonenden werd nooit gevonden, wat past bij het duidelijk lagere risico voor verspreiding van de bacterie vanuit deze schapenbedrijven in verhouding tot de melkgeiten en melkschapenbedrijven zoals gevonden in ons onderzoek in de stal en stalomgeving. Daar werden op de vlees-en fokschapenbedrijven minder onderzochte omgevingsmonsters positief bevonden voor C. burnetii, en deze bevatten doorgaans ook een lagere hoeveelheid van de bacterie. Per bedrijf werd aan 3 personen gevraagd een individuele vragenlijst in te vullen (bij voorkeur de veehouder zelf, de partner en een inwonend kind van 12 jaar of ouder of eventueel een bedrijfswerknemer) en werd bij hen bloed afgenomen. In totaal zijn 268 sera van bewoners op melkgeitenbedrijven, 27 sera van bewoners van melkschapenbedrijven, 271 sera van bewoners op vlees- en fokschaapbedrijven en 755 sera van bewoners van melkrundveebedrijven gescreend op de aanwezigheid van C. burnetii IgG en IgM fase 1 en 2 antistoffen met IFA (Focus Diagnostics, Cypress, Californië, VS). Het percentage veehouderijbewoners met C. burnetii IgG fase 2 antistoffen was vergelijkbaar hoog voor de melkgeiten-(69%), melkschapen- (67%) en melkrundveehouders (72%). Een wat lager percentage werd gevonden voor de veehouderijgezinnen op de vlees- en fokschaapbedrijven (51%). Dit laat zien dat veehouders en hun gezinsleden in Nederland een grote kans hebben om gedurende hun leven een infectie met C. burnetii door te maken, al dan niet met gezondheidsklachten. Hoewel de seroprevalentie op basis van aanwezigheid van C. burnetii IgG fase 2 antistoffen bij de melkrundveehouders hoog was, werden er relatief weinig aanwijzingen gevonden voor recente infecties op basis van aanwezigheid van C. burnetii IgM fase 2 antistoffen (1,2% versus 11% bij de bewoners van melkgeiten- en melkschapenhouderijen). Dit suggereert dat de klinische impact van deze infecties in deze bedrijfstak mogelijk beperkt is. Dit gold tevens voor mogelijke chronische Q-koorts. Geen van de bewoners op de vlees- en fokschaapbedrijven en 0,3% van de bewoners van melkrundhouderijen had een IgG fase 1 eindtiter van 1:1024 of hoger, terwijl 4% van de bewoners op melkgeitenhouderijen en melkschapenhouderijen deze hoge IgG fase 1 titer had, hetgeen indicatief is voor mogelijke chronische Q-koorts. Risicofactoren voor infectie met C. burnetii waren doorgaans redelijk vergelijkbaar voor de veehouders en dieren binnen een bedrijfstak, maar verschilden regelmatig tussen de bedrijfstakken. Voor alle bedrijfstakken werd een hoger risico gevonden voor bedrijven met een grote bedrijfsomvang en met een bedrijfslocatie in de provincies Noord-Brabant en Limburg of een kortere afstand tot het dichtstbijzijnde tankmelkpositieve melkgeitenbedrijf (<8-16 kilometer). Dit laatste laat zien dat de epidemie onder melkgeiten ook invloed heeft gehad op het voorkomen van C. burnetii op andere soorten veehouderijen. Daarnaast gaven diverse factoren verschillende risico's van insleep weer. Voor geitenbedrijven werd een hoger risico op infecties gevonden bij aanwezigheid van honden en katten in de geitenstallen, bij aankoop van buitenlands stro, en bij toepassing van kunstmatige inseminatie. Voor melkrunderbedrijven was het risico verhoogd bij aanwezigheid van wilde vogels in de stallen, als ratten en muizen op het bedrijf aanwezig waren, als de runderen teken hadden en als meerdere aanvoeradressen werden gebruikt voor nieuwe kalveren. Aanvoer van ooien van elders was een risicofactor voor de vlees- en fokschapensector.
228 | CHAPTER 7
Tenslotte werden ook enkele factoren gevonden die het risico juist leken te reduceren, zoals het consequent gebruiken van handschoenen bij geboortehulp en het gebruik maken van een melkrobot voor het melken in de rundersector, het gebruik van laarzen door veehouder/personeel op de geitenbedrijven (minder in-/versleep) en het buiten laten aflammeren op de vlees- en fokschaapbedrijven (minder ophoping en verwaaiing van bacteriën). Aan de verschillende bedrijfstakken is geadviseerd zoveel mogelijk een gesloten bedrijfsvoering te voeren, ook verder bronnen van insleep te beperken en goede hygiëne, vooral rondom geboorte, en biosecurity toe te passen op het bedrijf, waaronder het gebruik van beschermende kleding. Daarnaast zou op grond van de hoge seroprevalentie, de relatief hoge frequentie van recente infecties en het regelmatig voorkomen van seroprofielen indicatief voor een chronische infectie, Q-koorts vaccinatie als preventieve strategie moeten worden overwogen voor melkveehouderij gezinnen en werknemers op deze bedrijven. In het eerste artikel van Hoofdstuk 5 is de seroprevalentie van C. burnetii IgG fase 1 en 2 antistoffen bepaald onder Nederlandse landbouwhuisdierenartsen en zijn beroepsgerelateerde risico’s voor seropositiviteit bestudeerd. Van 189 dierenartsen, inclusief studenten diergeneeskunde in het laatste jaar van hun studie, is bloed afgenomen en tevens hebben zij een vragenlijst ingevuld. C. burnetii antistoffen werden aangetoond bij 123 (65,1%) van de 189 dierenartsen. Praktiserende dierenartsen hadden een nog hogere seroprevalentie (88%), terwijl de seroprevalentie onder laatstejaarsstudenten diergeneeskunde 30% was. Zeven deelnemers, onder wie vier diergeneeskundestudenten bleken recent een infectie met C. burnetii te hebben doorgemaakt. Risicofactoren die gerelateerd bleken aan seropositiviteit waren het aantal uren diercontact per week, aantal jaren afgestudeerd als dierenarts, wonend op het platteland of aan de rand van de stad, werkzaam als praktiserend dierenarts en beroepsmatig contact met varkens. Slechts bij een klein deel van de deelnemende dierenartsen was Q-koorts ooit aangetoond als oorzaak van ziekteverschijnselen. In het tweede artikel van Hoofdstuk 5 wordt de seroprevalentie van C. burnetii IgG fase 1 bepaald bij 674 studenten diergeneeskunde in alle 6 studiejaren op basis van sera afgenomen in het kader van een dwarsdoorsnedeonderzoek (Veterinarians’ Health Study I) in de periode november 2006 tot en met juni 2007. Risicofactoren die gerelateerd bleken aan seropositiviteit waren het volgen van de studierichting ‘-landbouwhuisdieren-en-veterinaire-volksgezondheid’, gevorderd studiejaar en het hebben doorgemaakt van een zelf gerapporteerde zoönose sinds het begin van de studie diergeneeskunde. Ook het ooit hebben gewoond op een boerderij met herkauwers was een risicofactor voor seropositiviteit, waarbij een tijd-responsrelatie werd gezien bij een toenemend aantal woonjaren op de boerderij. In ogenschouw nemend dat de ziektelast van Q-koorts bij de groep diergeneeskundestudenten onbekend is, zou een Q-koorts vaccinatie moeten worden overwogen voor ‘toekomstige professionals’, zoals studenten diergeneeskunde, aan het begin van hun studie. In het derde artikel van Hoofdstuk 5 beschrijven we de studie onder 517 medewerkers die betrokken waren bij het ruimen van meer dan 50.000 drachtige melkgeiten en schapen tijdens de Q-koorts epidemie eind 2009 en begin 2010. Van de ruimers had 83 procent voorafgaand aan de werkzaamheden geen antistoffen tegen C. burnetii. Om te voorkomen dat de ruimers besmet raakten werden persoonlijke beschermende maatregelen (PPE) genomen in de vorm van handschoenen, overalls en maskers (FFP3 maskers, ‘face filtering pieces’, waarvan aangenomen wordt dat ze tenminste 99% van de deeltjes in lucht tegenhouden). Van hen ontwikkelden 17.5% gedurende de werkzaamheden antistoffen tegen C. burnetii, een zogeheten seroconversie, ondanks het gebruik van PPE. Een derde van hen rapporteerde ook symptomen die compatibel zijn met acute Q-koorts. Langdurig werken (>100 uur) en het werken in de stal bleken significante risicofactoren voor seroconversie in het multivariate model. Een enkele keer hadden de arbeiders tijdens de koffie- en lunchpauze hun PPE (deels) verwijderd. Dit kan bijgedragen hebben aan het hoge aantal seroconversies, hoewel we dit niet konden testen. Er is vervolgens in deze studie geadviseerd dat, indien er in de toekomst een vergelijkbare situatie van ruimen van dieren noodzakelijk zou zijn, Q-koorts vaccinatie van de ruimingswerkers serieus overwogen moet worden en dat een serologische follow-up op de langere termijn nodig is. Tot slot wordt een algemene discussie van de bevindingen van de diverse studies in dit proefschrift gepresenteerd in Hoofdstuk 6. In dit hoofdstuk wordt beschreven welke gegevens al bekend waren, wat de bevindingen in dit proefschrift toevoegen en welke aanbevelingen uit deze studies naar voren komen.

Tenslotte werden ook enkele factoren gevonden die het risico juist leken te reduceren, zoals het consequent gebruiken van handschoenen bij geboortehulp en het gebruik maken van een melkrobot voor het melken in de rundersector, het gebruik van laarzen door veehouder/personeel op de geitenbedrijven (minder in-/versleep) en het buiten laten aflammeren op de vlees- en fokschaapbedrijven (minder ophoping en verwaaiing van bacteriën). Aan de verschillende bedrijfstakken is geadviseerd zoveel mogelijk een gesloten bedrijfsvoering te voeren, ook verder bronnen van insleep te beperken en goede hygiëne, vooral rondom geboorte, en biosecurity toe te passen op het bedrijf, waaronder het gebruik van beschermende kleding. Daarnaast zou op grond van de hoge seroprevalentie, de relatief hoge frequentie van recente infecties en het regelmatig voorkomen van seroprofielen indicatief voor een chronische infectie, Q-koorts vaccinatie als preventieve strategie moeten worden overwogen voor melkveehouderij gezinnen en werknemers op deze bedrijven. In het eerste artikel van Hoofdstuk 5 is de seroprevalentie van C. burnetii IgG fase 1 en 2 antistoffen bepaald onder Nederlandse landbouwhuisdierenartsen en zijn beroepsgerelateerde risico’s voor seropositiviteit bestudeerd. Van 189 dierenartsen, inclusief studenten diergeneeskunde in het laatste jaar van hun studie, is bloed afgenomen en tevens hebben zij een vragenlijst ingevuld. C. burnetii antistoffen werden aangetoond bij 123 (65,1%) van de 189 dierenartsen. Praktiserende dierenartsen hadden een nog hogere seroprevalentie (88%), terwijl de seroprevalentie onder laatstejaarsstudenten diergeneeskunde 30% was. Zeven deelnemers, onder wie vier diergeneeskundestudenten bleken recent een infectie met C. burnetii te hebben doorgemaakt. Risicofactoren die gerelateerd bleken aan seropositiviteit waren het aantal uren diercontact per week, aantal jaren afgestudeerd als dierenarts, wonend op het platteland of aan de rand van de stad, werkzaam als praktiserend dierenarts en beroepsmatig contact met varkens. Slechts bij een klein deel van de deelnemende dierenartsen was Q-koorts ooit aangetoond als oorzaak van ziekteverschijnselen. In het tweede artikel van Hoofdstuk 5 wordt de seroprevalentie van C. burnetii IgG fase 1 bepaald bij 674 studenten diergeneeskunde in alle 6 studiejaren op basis van sera afgenomen in het kader van een dwarsdoorsnedeonderzoek (Veterinarians’ Health Study I) in de periode november 2006 tot en met juni 2007. Risicofactoren die gerelateerd bleken aan seropositiviteit waren het volgen van de studierichting ‘-landbouwhuisdieren-en-veterinaire-volksgezondheid’, gevorderd studiejaar en het hebben doorgemaakt van een zelf gerapporteerde zoönose sinds het begin van de studie diergeneeskunde. Ook het ooit hebben gewoond op een boerderij met herkauwers was een risicofactor voor seropositiviteit, waarbij een tijd-responsrelatie werd gezien bij een toenemend aantal woonjaren op de boerderij. In ogenschouw nemend dat de ziektelast van Q-koorts bij de groep diergeneeskundestudenten onbekend is, zou een Q-koorts vaccinatie moeten worden overwogen voor ‘toekomstige professionals’, zoals studenten diergeneeskunde, aan het begin van hun studie. In het derde artikel van Hoofdstuk 5 beschrijven we de studie onder 517 medewerkers die betrokken waren bij het ruimen van meer dan 50.000 drachtige melkgeiten en schapen tijdens de Q-koorts epidemie eind 2009 en begin 2010. Van de ruimers had 83 procent voorafgaand aan de werkzaamheden geen antistoffen tegen C. burnetii. Om te voorkomen dat de ruimers besmet raakten werden persoonlijke beschermende maatregelen (PPE) genomen in de vorm van handschoenen, overalls en maskers (FFP3 maskers, ‘face filtering pieces’, waarvan aangenomen wordt dat ze tenminste 99% van de deeltjes in lucht tegenhouden). Van hen ontwikkelden 17.5% gedurende de werkzaamheden antistoffen tegen C. burnetii, een zogeheten seroconversie, ondanks het gebruik van PPE. Een derde van hen rapporteerde ook symptomen die compatibel zijn met acute Q-koorts. Langdurig werken (>100 uur) en het werken in de stal bleken significante risicofactoren voor seroconversie in het multivariate model. Een enkele keer hadden de arbeiders tijdens de koffie- en lunchpauze hun PPE (deels) verwijderd. Dit kan bijgedragen hebben aan het hoge aantal seroconversies, hoewel we dit niet konden testen. Er is vervolgens in deze studie geadviseerd dat, indien er in de toekomst een vergelijkbare situatie van ruimen van dieren noodzakelijk zou zijn, Q-koorts vaccinatie van de ruimingswerkers serieus overwogen moet worden en dat een serologische follow-up op de langere termijn nodig is. Tot slot wordt een algemene discussie van de bevindingen van de diverse studies in dit proefschrift gepresenteerd in Hoofdstuk 6. In dit hoofdstuk wordt beschreven welke gegevens al bekend waren, wat de bevindingen in dit proefschrift toevoegen en welke aanbevelingen uit deze studies naar voren komen.

DankwoordList of publications
Biography
8

DankwoordList of publications
Biography
8

232 | CHAPTER 8
Dankwoord
"There will be days you don't think you can run a marathon. There will be a lifetime of knowing you have." Na een lange incubatietijd van bijna 10 jaar met een aantal onderbrekingen waarin ik serieus heb overwogen het bijltje er bij neer te gooien is dit proefschrift toch af! Tijdens zo’n lange weg kan het niet anders dat ik veel mensen wil bedanken die mij hebben begeleid, met wie ik heb samengewerkt of die op een andere wijze hebben bijgedragen aan de totstandkoming van dit boekje. Allereerst mijn promotor Roel Coutinho en co-promotoren Yvonne van Duijnhoven en Wim van der Hoek. Roel, ik dank jou hartelijk voor de vasthoudende begeleiding en de vele overleggen op het Julius Centrum en het RIVM maar vooral voor jouw geduld. Naast jouw kritische input heeft jouw mensenkennis enorm geholpen. Fijn dat ik na die lange onderbreking toch bij jou het boekje kon afronden. Je gaf duidelijk advies hoe ik dat het beste kon aanpakken. Nu heb je het boekje met geit en schep, als teken voor ‘One Health’, gelukkig in je handen. Yvonne, jij hebt mij begin 2007 aangenomen bij het toenmalige centrum voor infectieziektenepidemiologie als coördinator zoönosen bij de gastro-groep. Al snel kwam de Q-koorts op ons pad, een tijd vol vragen en urgentie. Bij jou thuis aan de keukentafel schreven we verschillende ZonMw onderzoeksvoorstellen. Als het laat werd kon ik blijven slapen en jouw kinderen, die toen net zo oud waren als Rousanne en Gideon nu, wekten mij in de ochtend. Jouw onophoudelijke werklust, persoonlijke toewijding en effectiviteit bewonder ik zeer. Je pragmatische insteek raakte bij mij de juiste snaar. Zonder een woord te hoeven zeggen wist jij waar mijn knelpunten en onzekerheden zaten. Je deur stond altijd open en daar maakte ik dan ook graag gebruik van. Wim, jij bent een rots in de branding. Toen jij in 2008 bij EPI kwam werken als hoofd respiratoire infecties ben je zelf diep in de Q-koorts materie gedoken en heb je in sneltreinvaart je eigen proefschrift afgerond. Door jou kwam er binnen EPI structuur en afstemming in het Q-koorts onderzoek. Ook werd er advies van buitenlandse experts ingewonnen. Je bent ogenschijnlijk de rust zelve. Ondertussen weet je precies met welke mensen je moet samenwerken in roerige tijden om voortgang te boeken. Dank dat je altijd open stond voor mijn ideeën en dat jij mij weer hebt betrokken bij andere onderzoeken. Het benoemen van de relevantie van dit traject in het grotere geheel was een enorme stimulans. Ik dank je voor het doorgeven van jouw ervaring en kennis. Vervolgens wil ik hier graag de leden van beoordelingscommissie Prof.dr. M.J.M. Bonten, Prof.dr. A.I.M. Hoepelman, Prof.dr. M. Nielen, Prof.dr. J.P.A. Hoebe en Prof.dr. J. van der Velden, bedanken voor de beoordeling van dit proefschrift.
Natuurlijk wil ik al mijn mede-auteurs bedanken en in het bijzonder de stagiaires Anke Lenferink, Saskia Luttikholt, Linda Keulen, Nienke Schotten en Marit de Lange die hebben geholpen om de Q-VIVE data te structureren en te analyseren. Marit, wat leuk dat je nu ook zelf gaat promoveren op Q-koorts. Erik van Engelen, ik zal nooit vergeten dat jij mij belde op de dag van mijn bevalling met een vraag over Q-VIVE die ik toen helaas niet kon beantwoorden ;-)
Ik wil graag alle leden van de Q-VIVE projectgroep bedanken voor jullie input en geslaagde samenwerking waaronder Margo Vonk, Harry Stinis, Mark Paauw, Ad de Rooij, Clementine Wijkmans, Jan van den Bergh en Olaf Stenvers. Jullie inzet en flexibiliteit heb ik erg gewaardeerd. Een aantal van jullie wil ik even speciaal noemen. Jeannine Hautvast, coördinator van de Academische Werkplaats AMPHI, wat was het fijn om met jou samen te werken. Vanuit AMPHI heb je samen met Helen Aangenend hard aan dit project getrokken. Jullie hebben alle veehouders gebeld, voortdurend alle vragen afgestemd en de prikkers van Diagnostiek Nederland voor de huisbezoeken aangestuurd. Hartelijk dank voor jullie positieve aanpak en heldere feedback!
Piet Vellema, specialist kleine herkauwers bij de Gezondheidsdienst voor Dieren. Dank voor jouw vaderlijke bezorgdheid en het inzicht dat ik van jou heb gekregen in het veterinaire veld en de geiten- en schapenhouderij. Dat heb ik als stadsmeisje en basisarts namelijk niet van huis uit meegekregen, en dat was hard nodig om tijdens dit onderzoek te kunnen blijven staan. Ik zal het bezoek aan de familie Meekma in Deinum samen met René van den Brom niet snel vergeten. Peter Schneeberger, arts-microbioloog bij het Jeroen Bosch Ziekenhuis, bedankt voor jouw aanstekelijke enthousiasme. Tijdens de bijna wekelijkse overleggen op EPI bracht je veel nieuwe onderzoeksideeën op tafel en heb je ervoor gezorgd dat de waardevolle laboratoriumdata gebruikt konden worden voor de volksgezondheid. Ik herinner mij ook de leuke gesprekken tijdens het ESCCAR International Congress on Rickettsia and other Intracellular Bacteria op Kreta.Tevens wil ik Jamie Meekelenkamp danken voor het uitvoeren, verwerken en terugkoppelen van de laboratoriumanalyses vanuit het JBZ. Ik dank ook Thijs Veenstra, Bart Versteeg, Nancy Wijers, Janne van Rooij, Mariëtte Lokate en Roos Boerman. Jullie hebben je echt vastgebeten in jullie Q-koorts project. Lisette Graat, Gerdien van Schaik en Inge Wouters, hartelijk dank voor het meedenken bij de verschillende Q-koortsonderzoeken en jullie inhoudelijke begeleiding. Het was een behoorlijke uitdaging om onderzoek goed uit te voeren ten tijde van een lopende uitbraak waarbij telkens nieuwe controle- en bestrijdingsmaatregelen werden ingezet. De gegevens belandden vaak eerder op het bureau bij het Ministerie van VWS dan dat ze verschenen in een artikel. Uiteraard bestaat er geen onderzoek zonder deelnemers. Ik dank dan ook alle veehouderijgezinnen die hebben deelgenomen aan het Q-VIVE project, de dierenartsen en de diergeneeskundestudenten (Q-VET en Q-STUD), de ruimers (Q-CULL) en de inwoners van Herpen die hebben deelgenomen aan het patiënt-controleonderzoek (Q-Herpen). Natuurlijk wil ik graag de meer dan 20 collega Q-koorts promovendi vermelden. Het was altijd inspirerend om te horen met welke stukken van de puzzel iedereen mee bezig was. René, Gabriëlla, Wim, Hendrik-Jan, Jeroen, Janna, Marjolijn, Gijs, Lieke, Linda, Lenny, Jeroen, John, Floor, Volker en Myrna, bedankt voor jullie collegialiteit, enthousiasme en kruisbestuiving op dit onderwerp. Ik ging vlot van start maar eindig gelukkig niet helemaal achteraan in de rij. EPI is echt mijn thuisbasis en de tijd is voorbij gevlogen. Tien jaar bij de GEZ-groep met hardcore gastro-fanaten Wilfrid, Ingrid, Carolien, Agnetha, Kees en later Roan en Lapo. Never a dull moment kan ik zeggen en onze jaarlijkse barbecue was altijd een feest. In het bijzonder dank ik Margriet Harms. Het was fijn om met jou te werken aan het Pienter-2 artikel dat is opgenomen in dit boekje. Tevens dank ik de hele RES-groep waar ik mij ook thuis voel. Frederika, jouw zorgvuldigheid en kalmte kwamen goed van pas in deze drukke tijden. Gelukkig weten we vaak niet waar we aan beginnen en wordt achteraf pas duidelijk in welke sneltrein we zijn gestapt. We hebben in ieder geval geleerd heel alert te zijn en te blijven. Peter Teunis, dank voor jouw degelijke en tamelijk ingewikkelde analyses van de longitudinale data. Je nam uitgebreid de tijd om alles uit te leggen. Ik ben veel dank verschuldigd aan mijn EPIET-collega’s met wie ik altijd met veel plezier heb samengewerkt. In het bijzonder dank ik Ioannis Karagiannis, Georgia Ladbury, Jane Whelan en Mina Robert voor hun werk aan de verschillende uitbraakonderzoeken en de ruimersstudie. Stefan Brockmann was altijd bereid om advies te geven op basis van zijn ervaringen met Q-koorts in Duitsland. We hebben veel werk kunnen verzetten omdat we elkaar goed kennen, dezelfde ‘taal’ spreken, snel kunnen schakelen en gewend zijn om elkaar continue feedback geven. Ik dank ook de afdelingen infectieziektebestrijding van de GGD Hart voor Brabant, de GGD Brabant Zuidoost en de GGD Gelderland-Zuid voor de intensieve samenwerking. Ik voelde mij altijd zeer welkom. Binnen het Centrum voor infectieziektebestrijding van het RIVM heb ik over de jaren heel plezierig met veel mensen samengewerkt. Ik dank de volgende collega’s in het bijzonder omdat ik altijd bij hen terecht kon met mijn vragen over Q-koorts: Arnout de Bruin en Bart van Rotterdam over de detectie van C. burnetii DNA in omgevingmonsters;

8
DANKWOORD | 233
Dankwoord
"There will be days you don't think you can run a marathon. There will be a lifetime of knowing you have." Na een lange incubatietijd van bijna 10 jaar met een aantal onderbrekingen waarin ik serieus heb overwogen het bijltje er bij neer te gooien is dit proefschrift toch af! Tijdens zo’n lange weg kan het niet anders dat ik veel mensen wil bedanken die mij hebben begeleid, met wie ik heb samengewerkt of die op een andere wijze hebben bijgedragen aan de totstandkoming van dit boekje. Allereerst mijn promotor Roel Coutinho en co-promotoren Yvonne van Duijnhoven en Wim van der Hoek. Roel, ik dank jou hartelijk voor de vasthoudende begeleiding en de vele overleggen op het Julius Centrum en het RIVM maar vooral voor jouw geduld. Naast jouw kritische input heeft jouw mensenkennis enorm geholpen. Fijn dat ik na die lange onderbreking toch bij jou het boekje kon afronden. Je gaf duidelijk advies hoe ik dat het beste kon aanpakken. Nu heb je het boekje met geit en schep, als teken voor ‘One Health’, gelukkig in je handen. Yvonne, jij hebt mij begin 2007 aangenomen bij het toenmalige centrum voor infectieziektenepidemiologie als coördinator zoönosen bij de gastro-groep. Al snel kwam de Q-koorts op ons pad, een tijd vol vragen en urgentie. Bij jou thuis aan de keukentafel schreven we verschillende ZonMw onderzoeksvoorstellen. Als het laat werd kon ik blijven slapen en jouw kinderen, die toen net zo oud waren als Rousanne en Gideon nu, wekten mij in de ochtend. Jouw onophoudelijke werklust, persoonlijke toewijding en effectiviteit bewonder ik zeer. Je pragmatische insteek raakte bij mij de juiste snaar. Zonder een woord te hoeven zeggen wist jij waar mijn knelpunten en onzekerheden zaten. Je deur stond altijd open en daar maakte ik dan ook graag gebruik van. Wim, jij bent een rots in de branding. Toen jij in 2008 bij EPI kwam werken als hoofd respiratoire infecties ben je zelf diep in de Q-koorts materie gedoken en heb je in sneltreinvaart je eigen proefschrift afgerond. Door jou kwam er binnen EPI structuur en afstemming in het Q-koorts onderzoek. Ook werd er advies van buitenlandse experts ingewonnen. Je bent ogenschijnlijk de rust zelve. Ondertussen weet je precies met welke mensen je moet samenwerken in roerige tijden om voortgang te boeken. Dank dat je altijd open stond voor mijn ideeën en dat jij mij weer hebt betrokken bij andere onderzoeken. Het benoemen van de relevantie van dit traject in het grotere geheel was een enorme stimulans. Ik dank je voor het doorgeven van jouw ervaring en kennis. Vervolgens wil ik hier graag de leden van beoordelingscommissie Prof.dr. M.J.M. Bonten, Prof.dr. A.I.M. Hoepelman, Prof.dr. M. Nielen, Prof.dr. J.P.A. Hoebe en Prof.dr. J. van der Velden, bedanken voor de beoordeling van dit proefschrift.
Natuurlijk wil ik al mijn mede-auteurs bedanken en in het bijzonder de stagiaires Anke Lenferink, Saskia Luttikholt, Linda Keulen, Nienke Schotten en Marit de Lange die hebben geholpen om de Q-VIVE data te structureren en te analyseren. Marit, wat leuk dat je nu ook zelf gaat promoveren op Q-koorts. Erik van Engelen, ik zal nooit vergeten dat jij mij belde op de dag van mijn bevalling met een vraag over Q-VIVE die ik toen helaas niet kon beantwoorden ;-)
Ik wil graag alle leden van de Q-VIVE projectgroep bedanken voor jullie input en geslaagde samenwerking waaronder Margo Vonk, Harry Stinis, Mark Paauw, Ad de Rooij, Clementine Wijkmans, Jan van den Bergh en Olaf Stenvers. Jullie inzet en flexibiliteit heb ik erg gewaardeerd. Een aantal van jullie wil ik even speciaal noemen. Jeannine Hautvast, coördinator van de Academische Werkplaats AMPHI, wat was het fijn om met jou samen te werken. Vanuit AMPHI heb je samen met Helen Aangenend hard aan dit project getrokken. Jullie hebben alle veehouders gebeld, voortdurend alle vragen afgestemd en de prikkers van Diagnostiek Nederland voor de huisbezoeken aangestuurd. Hartelijk dank voor jullie positieve aanpak en heldere feedback!
Piet Vellema, specialist kleine herkauwers bij de Gezondheidsdienst voor Dieren. Dank voor jouw vaderlijke bezorgdheid en het inzicht dat ik van jou heb gekregen in het veterinaire veld en de geiten- en schapenhouderij. Dat heb ik als stadsmeisje en basisarts namelijk niet van huis uit meegekregen, en dat was hard nodig om tijdens dit onderzoek te kunnen blijven staan. Ik zal het bezoek aan de familie Meekma in Deinum samen met René van den Brom niet snel vergeten. Peter Schneeberger, arts-microbioloog bij het Jeroen Bosch Ziekenhuis, bedankt voor jouw aanstekelijke enthousiasme. Tijdens de bijna wekelijkse overleggen op EPI bracht je veel nieuwe onderzoeksideeën op tafel en heb je ervoor gezorgd dat de waardevolle laboratoriumdata gebruikt konden worden voor de volksgezondheid. Ik herinner mij ook de leuke gesprekken tijdens het ESCCAR International Congress on Rickettsia and other Intracellular Bacteria op Kreta.Tevens wil ik Jamie Meekelenkamp danken voor het uitvoeren, verwerken en terugkoppelen van de laboratoriumanalyses vanuit het JBZ. Ik dank ook Thijs Veenstra, Bart Versteeg, Nancy Wijers, Janne van Rooij, Mariëtte Lokate en Roos Boerman. Jullie hebben je echt vastgebeten in jullie Q-koorts project. Lisette Graat, Gerdien van Schaik en Inge Wouters, hartelijk dank voor het meedenken bij de verschillende Q-koortsonderzoeken en jullie inhoudelijke begeleiding. Het was een behoorlijke uitdaging om onderzoek goed uit te voeren ten tijde van een lopende uitbraak waarbij telkens nieuwe controle- en bestrijdingsmaatregelen werden ingezet. De gegevens belandden vaak eerder op het bureau bij het Ministerie van VWS dan dat ze verschenen in een artikel. Uiteraard bestaat er geen onderzoek zonder deelnemers. Ik dank dan ook alle veehouderijgezinnen die hebben deelgenomen aan het Q-VIVE project, de dierenartsen en de diergeneeskundestudenten (Q-VET en Q-STUD), de ruimers (Q-CULL) en de inwoners van Herpen die hebben deelgenomen aan het patiënt-controleonderzoek (Q-Herpen). Natuurlijk wil ik graag de meer dan 20 collega Q-koorts promovendi vermelden. Het was altijd inspirerend om te horen met welke stukken van de puzzel iedereen mee bezig was. René, Gabriëlla, Wim, Hendrik-Jan, Jeroen, Janna, Marjolijn, Gijs, Lieke, Linda, Lenny, Jeroen, John, Floor, Volker en Myrna, bedankt voor jullie collegialiteit, enthousiasme en kruisbestuiving op dit onderwerp. Ik ging vlot van start maar eindig gelukkig niet helemaal achteraan in de rij. EPI is echt mijn thuisbasis en de tijd is voorbij gevlogen. Tien jaar bij de GEZ-groep met hardcore gastro-fanaten Wilfrid, Ingrid, Carolien, Agnetha, Kees en later Roan en Lapo. Never a dull moment kan ik zeggen en onze jaarlijkse barbecue was altijd een feest. In het bijzonder dank ik Margriet Harms. Het was fijn om met jou te werken aan het Pienter-2 artikel dat is opgenomen in dit boekje. Tevens dank ik de hele RES-groep waar ik mij ook thuis voel. Frederika, jouw zorgvuldigheid en kalmte kwamen goed van pas in deze drukke tijden. Gelukkig weten we vaak niet waar we aan beginnen en wordt achteraf pas duidelijk in welke sneltrein we zijn gestapt. We hebben in ieder geval geleerd heel alert te zijn en te blijven. Peter Teunis, dank voor jouw degelijke en tamelijk ingewikkelde analyses van de longitudinale data. Je nam uitgebreid de tijd om alles uit te leggen. Ik ben veel dank verschuldigd aan mijn EPIET-collega’s met wie ik altijd met veel plezier heb samengewerkt. In het bijzonder dank ik Ioannis Karagiannis, Georgia Ladbury, Jane Whelan en Mina Robert voor hun werk aan de verschillende uitbraakonderzoeken en de ruimersstudie. Stefan Brockmann was altijd bereid om advies te geven op basis van zijn ervaringen met Q-koorts in Duitsland. We hebben veel werk kunnen verzetten omdat we elkaar goed kennen, dezelfde ‘taal’ spreken, snel kunnen schakelen en gewend zijn om elkaar continue feedback geven. Ik dank ook de afdelingen infectieziektebestrijding van de GGD Hart voor Brabant, de GGD Brabant Zuidoost en de GGD Gelderland-Zuid voor de intensieve samenwerking. Ik voelde mij altijd zeer welkom. Binnen het Centrum voor infectieziektebestrijding van het RIVM heb ik over de jaren heel plezierig met veel mensen samengewerkt. Ik dank de volgende collega’s in het bijzonder omdat ik altijd bij hen terecht kon met mijn vragen over Q-koorts: Arnout de Bruin en Bart van Rotterdam over de detectie van C. burnetii DNA in omgevingmonsters;
234 | CHAPTER 8
Jeroen van Leuken over de ruimtelijke modellering van C. burnetii verspreiding; Johan Reimerink en Daan Notermans over de diagnostiek van Q-koorts, Riny Janssen over de genetica en Ben Bom voor de vele fraaie Q-koorts kaarten. Ik dank Leslie Isken, Karin Heimeriks, Ton Oomen, Corien Swaan, Jim van Steenbergen en Aura Timen voor de afstemming tijdens de vele responsteams over Q-koorts. Marleen Kraaij, dank voor jouw beleidsperspectief tijdens de Q-koorts epidemie en voor de leuke spontane gesprekken die doorgaan ook nu je bij medische milieukunde werkt. Ik dank ook mijn oud-kamergenoten voor de fijne gesprekken onder het werk, de laatste nieuwtjes en de lekkere kopjes thee. Henrieke en Jantine, mijn mappen haal ik binnenkort uit jullie kast. Met verschillende ‘bazen’ tijdens het promoveren ‘on the job’ was het soms wat lastig te beoordelen wat de prioriteit had en was hierover afstemming nodig. Ik ben Marianne van der Sande zeer dankbaar dat zij als centrumhoofd van EPI hierin het voortouw heeft genomen. Klaas Westhoff, zonder jou als bedrijfsarts zat ik waarschijnlijk niet waar ik nu zit. Ik heb mij bijzonder gesteund gevoeld en stap voor stap kreeg ik weer vertrouwen. Tenslotte wil ik Susan Hahné ontzettend bedanken. Wat fijn dat ik kon overstappen naar jouw afdeling SIS. Jij vond het belangrijk dat ik dit boekje ging afmaken. Je hebt mij gesteund en bood mij structuur en ruimte, waardoor het plezier en de balans weer terugkwamen. Hester de Melker, dank voor je positieve houding ten aanzien van het afronden van dit proefschrift. Dit brengt mij naar het hier en nu. Ewout, Tjalling, en Sofie, wat hebben we een leuk en dynamisch SO-team. Ik dank ook Paul, Daniëlle en Anoek die hebben bijgedragen aan deze teamspirit. Bedankt lieve SIS-collega’s voor het hier en daar opvangen als ik weer eens bezig was met het afronden van dit boekje. Loes, hopelijk krijgen de big data uitdagingen die we in kaart brengen binnenkort meer vaste vorm. Daarnaast geniet ik ook van de momenten van ontspanning op het werk. Wat is het leuk om elke maandag in het PV-honk met Elodie en het RIVM-koortje te zingen. Marlieke en Lieke, wat ben ik blij dat jullie mijn paranimf zijn. Jullie zijn mijn oud-kamergenoot en huidige kamergenoot. We hebben in heel wat kamers gezeten op de tweede en derde verdieping van het U-gebouw. Jullie zijn uiterst sportief en al gepromoveerd, kortom vrouwen met uithoudingsvermogen en ervaring. Het was leuk om met een campertje door de Zwitserse bergen te rijden en chocolade te proeven tot we er misselijk van werden. Fijn dat jullie mij achter de vodden zaten om de laatste planning te halen. Natuurlijk wil ik ook mijn vrienden en familie bedanken. Marleen en Christine, jullie zijn supervriendinnen, nu allebei met een gezin. Als we elkaar zien zijn we zo weer bijgepraat. Hopelijk komt daar ondanks onze drukke agenda’s eindelijk weer tijd voor. Ik dank ook de Oosterbeekse moeders voor de gezellige borrelavonden, de gezonde kookclub, de foute feesten en jullie vrouwelijke energie. Wat ben ik blij met onze lieve buurtvrienden Esther en Rinnert. Superfijn dat jullie er waren op de momenten dat het nodig was. Ingrid en Marcel, wat fijn dat ik in jullie Grutto in stilte mocht studeren. Tessa en Jaap, dank voor de muziek in en om ons leven. Ik wil hier graag ook mijn lieve EPIET-vriendin Agnes uit Hongarije en mijn gastouders Ron en Lisa uit Minneapolis danken, die al een paar keer de moeite hebben genomen om ons te bezoeken in Wolfheze. Komende jaren willen we ook bij jullie langskomen, dus dat wordt ‘over the pond’ vliegen of toeren met een campertje door Europa. Mijn enige neef en nicht, Martijn en Susan, ook jullie hoop ik weer wat vaker op te zoeken. Ik zal dit jaar dan ook nog de ICE naar München pakken. Tante Joyce, dank voor jouw steun en onophoudelijke interesse. Ik dank ook mijn schoonouders, Dolf en Susan. We wonen niet meer om de hoek, maar als jullie langskomen, nemen jullie ook echt een paar dagen de tijd voor ons en is er volop aandacht voor ons en jullie kleinkinderen.
Mijn lieve ouders, Ellys en Theo, dank voor jullie onvoorwaardelijke steun en dat jullie altijd voor mij hebben klaargestaan. Vanaf jongs af aan hebben jullie mij het avontuur laten aangaan, iets wat niet vanzelfsprekend was na het wegvallen van Marielle, jullie jongste dochter en mijn zusje. Na mijn VWO ging ik studeren in Amerika en ook daarna was ik vaak ver van huis. Bedankt voor jullie fijne opvoeding waarin jullie mij altijd hebben gestimuleerd mij te ontplooien en mijn eigen keuzes te maken. Pappa, het zat helaas de afgelopen tijd niet mee op gezondheidsgebied. Nu ik dit dankwoord schrijf ben je nog opgenomen in het ziekenhuis. Gelukkig ben je sterk en veerkrachtig en verwacht ik dat je over enkele maanden goed bent hersteld. Mam, wat ben je positief ingesteld en sta je altijd voor mij klaar met raad en daad. Je hebt je altijd bijzonder verdiept in iedereen en alles die in mijn leven een belangrijke plaats innemen. Mijn hartendieven Rousanne en Gideon, de tijd vliegt en jullie zijn nog maar 5 en 3 jaar. Jullie levenslust en mijn liefde voor jullie is overweldigend. Als ik weer eens laat thuiskom rennen jullie naar de keukendeur terwijl jullie vol overgave in koor ‘mamma, mamma, mamma’ roepen. Mamma’s boekje is nu eindelijk af. Daar is zoals jullie hebben gemerkt veel tijd in gaan zitten. Het liefst ben ik gewoon bij jullie thuis en lees ik jullie boeken over schaapjes en geitjes voor.
Lieve Jan-Willem, wat ben ik blij dat je in mijn leven bent! De afgelopen jaren waren echt niet gemakkelijk met alles wat op ons bordje lag. We zijn ontzettend veel aangegaan en we hebben ook veel om voor te zorgen. De afgelopen vijf jaar ben je fulltime huisvader geweest en bleef het gezin draaien dankzij jou. We komen langzaam terug in rustiger vaarwater en we richten onze blik nu op de horizon. Wat lief dat je de omslag van dit boekje hebt gemaakt met een foto waar geen twijfel over was. Ik ben benieuwd naar wat de toekomst ons brengt, maar zie het met vertrouwen tegemoet! En nu is dit boekje af en zet ik de laatste .

8
DANKWOORD | 235
Jeroen van Leuken over de ruimtelijke modellering van C. burnetii verspreiding; Johan Reimerink en Daan Notermans over de diagnostiek van Q-koorts, Riny Janssen over de genetica en Ben Bom voor de vele fraaie Q-koorts kaarten. Ik dank Leslie Isken, Karin Heimeriks, Ton Oomen, Corien Swaan, Jim van Steenbergen en Aura Timen voor de afstemming tijdens de vele responsteams over Q-koorts. Marleen Kraaij, dank voor jouw beleidsperspectief tijdens de Q-koorts epidemie en voor de leuke spontane gesprekken die doorgaan ook nu je bij medische milieukunde werkt. Ik dank ook mijn oud-kamergenoten voor de fijne gesprekken onder het werk, de laatste nieuwtjes en de lekkere kopjes thee. Henrieke en Jantine, mijn mappen haal ik binnenkort uit jullie kast. Met verschillende ‘bazen’ tijdens het promoveren ‘on the job’ was het soms wat lastig te beoordelen wat de prioriteit had en was hierover afstemming nodig. Ik ben Marianne van der Sande zeer dankbaar dat zij als centrumhoofd van EPI hierin het voortouw heeft genomen. Klaas Westhoff, zonder jou als bedrijfsarts zat ik waarschijnlijk niet waar ik nu zit. Ik heb mij bijzonder gesteund gevoeld en stap voor stap kreeg ik weer vertrouwen. Tenslotte wil ik Susan Hahné ontzettend bedanken. Wat fijn dat ik kon overstappen naar jouw afdeling SIS. Jij vond het belangrijk dat ik dit boekje ging afmaken. Je hebt mij gesteund en bood mij structuur en ruimte, waardoor het plezier en de balans weer terugkwamen. Hester de Melker, dank voor je positieve houding ten aanzien van het afronden van dit proefschrift. Dit brengt mij naar het hier en nu. Ewout, Tjalling, en Sofie, wat hebben we een leuk en dynamisch SO-team. Ik dank ook Paul, Daniëlle en Anoek die hebben bijgedragen aan deze teamspirit. Bedankt lieve SIS-collega’s voor het hier en daar opvangen als ik weer eens bezig was met het afronden van dit boekje. Loes, hopelijk krijgen de big data uitdagingen die we in kaart brengen binnenkort meer vaste vorm. Daarnaast geniet ik ook van de momenten van ontspanning op het werk. Wat is het leuk om elke maandag in het PV-honk met Elodie en het RIVM-koortje te zingen. Marlieke en Lieke, wat ben ik blij dat jullie mijn paranimf zijn. Jullie zijn mijn oud-kamergenoot en huidige kamergenoot. We hebben in heel wat kamers gezeten op de tweede en derde verdieping van het U-gebouw. Jullie zijn uiterst sportief en al gepromoveerd, kortom vrouwen met uithoudingsvermogen en ervaring. Het was leuk om met een campertje door de Zwitserse bergen te rijden en chocolade te proeven tot we er misselijk van werden. Fijn dat jullie mij achter de vodden zaten om de laatste planning te halen. Natuurlijk wil ik ook mijn vrienden en familie bedanken. Marleen en Christine, jullie zijn supervriendinnen, nu allebei met een gezin. Als we elkaar zien zijn we zo weer bijgepraat. Hopelijk komt daar ondanks onze drukke agenda’s eindelijk weer tijd voor. Ik dank ook de Oosterbeekse moeders voor de gezellige borrelavonden, de gezonde kookclub, de foute feesten en jullie vrouwelijke energie. Wat ben ik blij met onze lieve buurtvrienden Esther en Rinnert. Superfijn dat jullie er waren op de momenten dat het nodig was. Ingrid en Marcel, wat fijn dat ik in jullie Grutto in stilte mocht studeren. Tessa en Jaap, dank voor de muziek in en om ons leven. Ik wil hier graag ook mijn lieve EPIET-vriendin Agnes uit Hongarije en mijn gastouders Ron en Lisa uit Minneapolis danken, die al een paar keer de moeite hebben genomen om ons te bezoeken in Wolfheze. Komende jaren willen we ook bij jullie langskomen, dus dat wordt ‘over the pond’ vliegen of toeren met een campertje door Europa. Mijn enige neef en nicht, Martijn en Susan, ook jullie hoop ik weer wat vaker op te zoeken. Ik zal dit jaar dan ook nog de ICE naar München pakken. Tante Joyce, dank voor jouw steun en onophoudelijke interesse. Ik dank ook mijn schoonouders, Dolf en Susan. We wonen niet meer om de hoek, maar als jullie langskomen, nemen jullie ook echt een paar dagen de tijd voor ons en is er volop aandacht voor ons en jullie kleinkinderen.
Mijn lieve ouders, Ellys en Theo, dank voor jullie onvoorwaardelijke steun en dat jullie altijd voor mij hebben klaargestaan. Vanaf jongs af aan hebben jullie mij het avontuur laten aangaan, iets wat niet vanzelfsprekend was na het wegvallen van Marielle, jullie jongste dochter en mijn zusje. Na mijn VWO ging ik studeren in Amerika en ook daarna was ik vaak ver van huis. Bedankt voor jullie fijne opvoeding waarin jullie mij altijd hebben gestimuleerd mij te ontplooien en mijn eigen keuzes te maken. Pappa, het zat helaas de afgelopen tijd niet mee op gezondheidsgebied. Nu ik dit dankwoord schrijf ben je nog opgenomen in het ziekenhuis. Gelukkig ben je sterk en veerkrachtig en verwacht ik dat je over enkele maanden goed bent hersteld. Mam, wat ben je positief ingesteld en sta je altijd voor mij klaar met raad en daad. Je hebt je altijd bijzonder verdiept in iedereen en alles die in mijn leven een belangrijke plaats innemen. Mijn hartendieven Rousanne en Gideon, de tijd vliegt en jullie zijn nog maar 5 en 3 jaar. Jullie levenslust en mijn liefde voor jullie is overweldigend. Als ik weer eens laat thuiskom rennen jullie naar de keukendeur terwijl jullie vol overgave in koor ‘mamma, mamma, mamma’ roepen. Mamma’s boekje is nu eindelijk af. Daar is zoals jullie hebben gemerkt veel tijd in gaan zitten. Het liefst ben ik gewoon bij jullie thuis en lees ik jullie boeken over schaapjes en geitjes voor.
Lieve Jan-Willem, wat ben ik blij dat je in mijn leven bent! De afgelopen jaren waren echt niet gemakkelijk met alles wat op ons bordje lag. We zijn ontzettend veel aangegaan en we hebben ook veel om voor te zorgen. De afgelopen vijf jaar ben je fulltime huisvader geweest en bleef het gezin draaien dankzij jou. We komen langzaam terug in rustiger vaarwater en we richten onze blik nu op de horizon. Wat lief dat je de omslag van dit boekje hebt gemaakt met een foto waar geen twijfel over was. Ik ben benieuwd naar wat de toekomst ons brengt, maar zie het met vertrouwen tegemoet! En nu is dit boekje af en zet ik de laatste .

236 | CHAPTER 8
List of publications
Publications on Q fever
Ladbury GA, Van Leuken JP, Swart A, Vellema P, Schimmer B, Ter Schegget R, Van der Hoek W. Integrating interdisciplinary methodologies for One Health: goat farm re-implicated as the probable source of an urban Q fever outbreak, the Netherlands, 2009. BMC Infect Dis. 2015 Sep 3;15:372. Wielders CC, Hackert VH, Schimmer B, Hodemaekers HM, de Klerk A, Hoebe CJ, Schneeberger PM, van Duynhoven YT, Janssen R. Single nucleotide polymorphisms in immune response genes in acute Q fever cases with differences in self-reported symptoms. Eur J Clin Microbiol Infect Dis. 2015 May;34(5):943-50.
Wielders CC, Boerman AW, Schimmer B, van den Brom R, Notermans DW, van der Hoek W, Schneeberger PM. Persistent high IgG phase I antibody levels against Coxiella burnetii among veterinarians compared to patients previously diagnosed with acute Q fever after three years of follow-up. PLoS One. 2015 Jan 20;10(1):e0116937.
Van der Hoek W, Schimmer B, Hogerwerf L. Q fever in Africa: an emerging infectious disease. MTb, 2015 Mar 20, 53(1): 3-5.
Schimmer B, de Lange MM, Hautvast JL, Vellema P, van Duynhoven YT. Coxiella burnetii seroprevalence and risk factors on commercial sheep farms in The Netherlands. Vet Rec. 2014 Jul 5;175(1):17.
van Engelen E, Schotten N, Schimmer B, Hautvast JL, van Schaik G, van Duijnhoven YT. Prevalence and risk factors for Coxiella burnetii (Q fever) in Dutch dairy cattle herds based on bulk tank milk testing. Prev Vet Med. 2014 Nov 1;117(1):103-9.
Schimmer B, Schotten N, van Engelen E, Hautvast JL, Schneeberger PM, van Duijnhoven YT. Coxiella burnetii seroprevalence and risk for humans on dairy cattle farms, the Netherlands, 2010-2011. Emerg Infect Dis. 2014 Mar;20(3):417-25.
De Lange MM, Schimmer B, Vellema P, Hautvast JL, Schneeberger PM, Van Duijnhoven YT. Coxiella burnetii seroprevalence and risk factors in sheep farmers and farm residents in The Netherlands. Epidemiol Infect. 2014 Jun;142(6):1231-44.
van der Hoek W, van de Kassteele J, Bom B, de Bruin A, Dijkstra F, Schimmer B, Vellema P, ter Schegget R, Schneeberger PM. Smooth incidence maps give valuable insight into Q fever outbreaks in The Netherlands. Geospat Health. 2012 Nov;7(1):127-34.
Schimmer B, Lenferink A, Schneeberger P, Aangenend H, Vellema P, Hautvast J, van Duynhoven Y. Seroprevalence and risk factors for Coxiella burnetii (Q fever) seropositivity in dairy goat farmers' households in The Netherlands, 2009-2010.PLoS One. 2012;7(7):e42364.
Van den Brom R, Schimmer B, Schneeberger PM, Swart WA, van der Hoek W,Vellema P. Seroepidemiological survey for Coxiella burnetii antibodies and associated risk factors in Dutch livestock veterinarians. PLoS One. 2013;8(1):e54021.
van der Hoek W, Wielders CC, Schimmer B, Wegdam-Blans MC, Meekelenkamp J, Zaaijer HL, Schneeberger PM. Detection of phase I IgG antibodies to Coxiella burnetii with EIA as a screening test for blood donations. Eur J Clin Microbiol Infect Dis. 2012 Nov;31(11):3207-9.
Teunis PF, Schimmer B, Notermans DW, Leenders AC, Wever PC, Kretzschmar ME, Schneeberger PM. Time-course of antibody responses against Coxiella burnetii following acute Q fever. Epidemiol Infect. 2013 Jan;141(1):62-73.
de Rooij MM, Schimmer B, Versteeg B, Schneeberger P, Berends BR, Heederik D, van der Hoek W, Wouters IM. Risk factors of Coxiella burnetii (Q fever) seropositivity in veterinary medicine students. PLoS One. 2012;7(2):e32108.
de Bruin A, van der Plaats RQ, de Heer L, Paauwe R, Schimmer B, Vellema P, van Rotterdam BJ, van Duynhoven YT. Detection of Coxiella burnetii DNA on small-ruminant farms during a Q fever outbreak in the Netherlands. Appl Environ Microbiol. 2012 Mar;78(6):1652-7.
Schimmer B, Luttikholt S, Hautvast JL, Graat EA, Vellema P, Duynhoven YT. Seroprevalence and risk factors of Q fever in goats on commercial dairy goat farms in the Netherlands, 2009-2010. BMC Vet Res. 2011 Dec 30;7:81.
Dijkstra F, van der Hoek W, Wijers N, Schimmer B, Rietveld A, Wijkmans CJ, Vellema P, Schneeberger PM. The 2007–2010 Q fever epidemic in The Netherlands: characteristics of notified acute Q fever patients and the association with dairy goat farming. FEMS Immunol Med Microbiol. 2012 Feb;64(1):3-12.
Whelan J, Schimmer B, Schneeberger P, Meekelenkamp J, Ijff A, van der Hoek W, Robert-Du Ry van Beest Holle M. Q fever among culling workers, the Netherlands, 2009-2010. Emerg Infect Dis. 2011 Sep;17(9):1719-23.
Whelan J, Schimmer B, de Bruin A, van Beest Holle MR, van der Hoek W, ter Schegget R. Visits on 'lamb-viewing days' at a sheep farm open to the public was a risk factor for Q fever in 2009. Epidemiol Infect. 2012 May;140(5):858-64.
Schimmer B, Notermans DW, Harms MG, Reimerink JH, Bakker J, Schneeberger P, Mollema L, Teunis P, van Pelt W, van Duynhoven Y. Low seroprevalence of Q fever in The Netherlands prior to a series of large outbreaks. Epidemiol Infect. 2012 Jan;140(1):27-35.
Blaauw GJ, Notermans DW, Schimmer B, Meekelenkamp J, Reimerink JH, Teunis P, Schneeberger PM. The application of an enzyme-linked immunosorbent assay or an immunofluorescent assay test leads to different estimates of seroprevalence of Coxiella burnetii in the population. Epidemiol Infect. 2012 Jan;140(1):36-41.
Dijkstra F, Riphagen-Dalhuisen J, Wijers N, Hak E, Van der Sande MA, Morroy G, Schneeberger PM, Schimmer B, Notermans DW, Van der Hoek W. Antibiotic therapy for acute Q fever in The Netherlands in 2007 and 2008 and its relation to hospitalization. Epidemiol Infect. 2011 Sep;139(9):1332-41.
van den Wijngaard CC, Dijkstra F, van Pelt W, van Asten L, Kretzschmar M, Schimmer B, Nagelkerke NJ, Vellema P, Donker GA, Koopmans MP. In search of hidden Q-fever outbreaks: linking syndromic hospital clusters to infected goat farms. Epidemiol Infect. 2011 Jan;139(1):19-26.
van der Hoek W, Dijkstra F, Schimmer B, Schneeberger PM, Vellema P, Wijkmans C, ter Schegget R, Hackert V, van Duynhoven Y. Q fever in the Netherlands: an update on the epidemiology and control measures. Euro Surveill. 2010 Mar 25;15(12).
Schimmer B, Ter Schegget R, Wegdam M, Züchner L, de Bruin A, Schneeberger PM, Veenstra T, Vellema P, van der Hoek W. The use of a geographic information system to identify a dairy goat farm as the most likely source of an urban Q-fever outbreak. BMC Infect Dis. 2010 Mar 16;10:69.
Koene RP, Schimmer B, Rensen H, Biesheuvel M, de Bruin A, Lohuis A, Horrevorts A, Lunel FV, Delsing CE, Hautvast JL. A Q fever outbreak in a psychiatric care institution in The Netherlands. Epidemiol Infect. 2011 Jan;139(1):13-8.
Schimmer B, Dijkstra F, Vellema P, Schneeberger PM, Hackert V, ter Schegget R, Wijkmans C, van Duynhoven Y, van der Hoek W. Sustained intensive transmission of Q fever in the south of the Netherlands, 2009. Euro Surveill. 2009 May 14;14(19). pii: 19210.
Karagiannis I, Schimmer B, Van Lier A, Timen A, Schneeberger P, Van Rotterdam B, De Bruin A, Wijkmans C, Rietveld A, Van Duynhoven Y. Investigation of a Q fever outbreak in a rural area of The Netherlands. Epidemiol Infect. 2009 Sep;137(9):1283-94. Schimmer B, Morroy G, Dijkstra F, Schneeberger PM, Weers-Pothoff G, Timen A, Wijkmans C, van der Hoek W. Large ongoing Q fever outbreak in the south of The Netherlands, 2008. Euro Surveill. 2008 Jul 31;13(31). pii: 18939.

8
LIST OF PUBLICATIONS | 237
List of publications
Publications on Q fever
Ladbury GA, Van Leuken JP, Swart A, Vellema P, Schimmer B, Ter Schegget R, Van der Hoek W. Integrating interdisciplinary methodologies for One Health: goat farm re-implicated as the probable source of an urban Q fever outbreak, the Netherlands, 2009. BMC Infect Dis. 2015 Sep 3;15:372. Wielders CC, Hackert VH, Schimmer B, Hodemaekers HM, de Klerk A, Hoebe CJ, Schneeberger PM, van Duynhoven YT, Janssen R. Single nucleotide polymorphisms in immune response genes in acute Q fever cases with differences in self-reported symptoms. Eur J Clin Microbiol Infect Dis. 2015 May;34(5):943-50.
Wielders CC, Boerman AW, Schimmer B, van den Brom R, Notermans DW, van der Hoek W, Schneeberger PM. Persistent high IgG phase I antibody levels against Coxiella burnetii among veterinarians compared to patients previously diagnosed with acute Q fever after three years of follow-up. PLoS One. 2015 Jan 20;10(1):e0116937.
Van der Hoek W, Schimmer B, Hogerwerf L. Q fever in Africa: an emerging infectious disease. MTb, 2015 Mar 20, 53(1): 3-5.
Schimmer B, de Lange MM, Hautvast JL, Vellema P, van Duynhoven YT. Coxiella burnetii seroprevalence and risk factors on commercial sheep farms in The Netherlands. Vet Rec. 2014 Jul 5;175(1):17.
van Engelen E, Schotten N, Schimmer B, Hautvast JL, van Schaik G, van Duijnhoven YT. Prevalence and risk factors for Coxiella burnetii (Q fever) in Dutch dairy cattle herds based on bulk tank milk testing. Prev Vet Med. 2014 Nov 1;117(1):103-9.
Schimmer B, Schotten N, van Engelen E, Hautvast JL, Schneeberger PM, van Duijnhoven YT. Coxiella burnetii seroprevalence and risk for humans on dairy cattle farms, the Netherlands, 2010-2011. Emerg Infect Dis. 2014 Mar;20(3):417-25.
De Lange MM, Schimmer B, Vellema P, Hautvast JL, Schneeberger PM, Van Duijnhoven YT. Coxiella burnetii seroprevalence and risk factors in sheep farmers and farm residents in The Netherlands. Epidemiol Infect. 2014 Jun;142(6):1231-44.
van der Hoek W, van de Kassteele J, Bom B, de Bruin A, Dijkstra F, Schimmer B, Vellema P, ter Schegget R, Schneeberger PM. Smooth incidence maps give valuable insight into Q fever outbreaks in The Netherlands. Geospat Health. 2012 Nov;7(1):127-34.
Schimmer B, Lenferink A, Schneeberger P, Aangenend H, Vellema P, Hautvast J, van Duynhoven Y. Seroprevalence and risk factors for Coxiella burnetii (Q fever) seropositivity in dairy goat farmers' households in The Netherlands, 2009-2010.PLoS One. 2012;7(7):e42364.
Van den Brom R, Schimmer B, Schneeberger PM, Swart WA, van der Hoek W,Vellema P. Seroepidemiological survey for Coxiella burnetii antibodies and associated risk factors in Dutch livestock veterinarians. PLoS One. 2013;8(1):e54021.
van der Hoek W, Wielders CC, Schimmer B, Wegdam-Blans MC, Meekelenkamp J, Zaaijer HL, Schneeberger PM. Detection of phase I IgG antibodies to Coxiella burnetii with EIA as a screening test for blood donations. Eur J Clin Microbiol Infect Dis. 2012 Nov;31(11):3207-9.
Teunis PF, Schimmer B, Notermans DW, Leenders AC, Wever PC, Kretzschmar ME, Schneeberger PM. Time-course of antibody responses against Coxiella burnetii following acute Q fever. Epidemiol Infect. 2013 Jan;141(1):62-73.
de Rooij MM, Schimmer B, Versteeg B, Schneeberger P, Berends BR, Heederik D, van der Hoek W, Wouters IM. Risk factors of Coxiella burnetii (Q fever) seropositivity in veterinary medicine students. PLoS One. 2012;7(2):e32108.
de Bruin A, van der Plaats RQ, de Heer L, Paauwe R, Schimmer B, Vellema P, van Rotterdam BJ, van Duynhoven YT. Detection of Coxiella burnetii DNA on small-ruminant farms during a Q fever outbreak in the Netherlands. Appl Environ Microbiol. 2012 Mar;78(6):1652-7.
Schimmer B, Luttikholt S, Hautvast JL, Graat EA, Vellema P, Duynhoven YT. Seroprevalence and risk factors of Q fever in goats on commercial dairy goat farms in the Netherlands, 2009-2010. BMC Vet Res. 2011 Dec 30;7:81.
Dijkstra F, van der Hoek W, Wijers N, Schimmer B, Rietveld A, Wijkmans CJ, Vellema P, Schneeberger PM. The 2007–2010 Q fever epidemic in The Netherlands: characteristics of notified acute Q fever patients and the association with dairy goat farming. FEMS Immunol Med Microbiol. 2012 Feb;64(1):3-12.
Whelan J, Schimmer B, Schneeberger P, Meekelenkamp J, Ijff A, van der Hoek W, Robert-Du Ry van Beest Holle M. Q fever among culling workers, the Netherlands, 2009-2010. Emerg Infect Dis. 2011 Sep;17(9):1719-23.
Whelan J, Schimmer B, de Bruin A, van Beest Holle MR, van der Hoek W, ter Schegget R. Visits on 'lamb-viewing days' at a sheep farm open to the public was a risk factor for Q fever in 2009. Epidemiol Infect. 2012 May;140(5):858-64.
Schimmer B, Notermans DW, Harms MG, Reimerink JH, Bakker J, Schneeberger P, Mollema L, Teunis P, van Pelt W, van Duynhoven Y. Low seroprevalence of Q fever in The Netherlands prior to a series of large outbreaks. Epidemiol Infect. 2012 Jan;140(1):27-35.
Blaauw GJ, Notermans DW, Schimmer B, Meekelenkamp J, Reimerink JH, Teunis P, Schneeberger PM. The application of an enzyme-linked immunosorbent assay or an immunofluorescent assay test leads to different estimates of seroprevalence of Coxiella burnetii in the population. Epidemiol Infect. 2012 Jan;140(1):36-41.
Dijkstra F, Riphagen-Dalhuisen J, Wijers N, Hak E, Van der Sande MA, Morroy G, Schneeberger PM, Schimmer B, Notermans DW, Van der Hoek W. Antibiotic therapy for acute Q fever in The Netherlands in 2007 and 2008 and its relation to hospitalization. Epidemiol Infect. 2011 Sep;139(9):1332-41.
van den Wijngaard CC, Dijkstra F, van Pelt W, van Asten L, Kretzschmar M, Schimmer B, Nagelkerke NJ, Vellema P, Donker GA, Koopmans MP. In search of hidden Q-fever outbreaks: linking syndromic hospital clusters to infected goat farms. Epidemiol Infect. 2011 Jan;139(1):19-26.
van der Hoek W, Dijkstra F, Schimmer B, Schneeberger PM, Vellema P, Wijkmans C, ter Schegget R, Hackert V, van Duynhoven Y. Q fever in the Netherlands: an update on the epidemiology and control measures. Euro Surveill. 2010 Mar 25;15(12).
Schimmer B, Ter Schegget R, Wegdam M, Züchner L, de Bruin A, Schneeberger PM, Veenstra T, Vellema P, van der Hoek W. The use of a geographic information system to identify a dairy goat farm as the most likely source of an urban Q-fever outbreak. BMC Infect Dis. 2010 Mar 16;10:69.
Koene RP, Schimmer B, Rensen H, Biesheuvel M, de Bruin A, Lohuis A, Horrevorts A, Lunel FV, Delsing CE, Hautvast JL. A Q fever outbreak in a psychiatric care institution in The Netherlands. Epidemiol Infect. 2011 Jan;139(1):13-8.
Schimmer B, Dijkstra F, Vellema P, Schneeberger PM, Hackert V, ter Schegget R, Wijkmans C, van Duynhoven Y, van der Hoek W. Sustained intensive transmission of Q fever in the south of the Netherlands, 2009. Euro Surveill. 2009 May 14;14(19). pii: 19210.
Karagiannis I, Schimmer B, Van Lier A, Timen A, Schneeberger P, Van Rotterdam B, De Bruin A, Wijkmans C, Rietveld A, Van Duynhoven Y. Investigation of a Q fever outbreak in a rural area of The Netherlands. Epidemiol Infect. 2009 Sep;137(9):1283-94. Schimmer B, Morroy G, Dijkstra F, Schneeberger PM, Weers-Pothoff G, Timen A, Wijkmans C, van der Hoek W. Large ongoing Q fever outbreak in the south of The Netherlands, 2008. Euro Surveill. 2008 Jul 31;13(31). pii: 18939.

238 | CHAPTER 8
Publications on other topics
Pijnacker R, Goris MG, Te Wierik MJ, Broens EM, van der Giessen JW, de Rosa M, Wagenaar JA, Hartskeerl RA, Notermans DW, Maassen K, Schimmer B. Marked increase in leptospirosis infections in humans and dogs in the Netherlands, 2014. Euro Surveill. 2016 Apr 28;21(17).
de Man H, Mughini Gras L, Schimmer B, Friesema IH, DE Roda Husman AM, van Pelt W. Gastrointestinal, influenza-like illness and dermatological complaints following exposure to floodwater: a cross-sectional survey in The Netherlands. Epidemiol Infect. 2016 May;144(7):1445-54.
Severi E, Verhoef L, Thornton L, Guzman-Herrador BR, Faber M, Sundqvist L, Rimhanen-Finne R, Roque-Afonso AM, Ngui SL, Allerberger F, Baumann-Popczyk A, Muller L, Parmakova K, Alfonsi V, Tavoschi L, Vennema H, Fitzgerald M, Myrmel M, Gertler M, Ederth J, Kontio M, Vanbockstael C, Mandal S, Sadkowska-Todys M, Tosti ME, Schimmer B, O Gorman J, Stene-Johansen K, Wenzel JJ, Jones G, Balogun K, Ciccaglione AR, O' Connor L, Vold L, Takkinen J, Rizzo C. Large and prolonged food-borne multistate hepatitis A outbreak in Europe associated with consumption of frozen berries, 2013 to 2014. Euro Surveill. 2015 Jul 23;20(29):21192.
Sane J, Reimerink J, Harms M, Bakker J, Mughini-Gras L, Schimmer B, van Pelt W. Human hantavirus infections in the Netherlands. Emerg Infect Dis. 2014 Dec;20(12):2107-10.
Rebolledo J, Garvey P, Ryan A, O'Donnell J, Cormican M, Jackson S, Cloak F, Cullen L, Swaan CM, Schimmer B, Appels RW, Nygard K, Finley R, Sreenivasan N, Lenglet A, Gossner C, McKeown P. International outbreak investigation of Salmonella Heidelberg associated with in-flight catering. Epidemiol Infect. 2014 Apr;142(4):833-42.
Friesema IH, Schimmer B, Ros JA, Ober HJ, Heck ME, Swaan CM, de Jager CM, Peran i Sala RM, van Pelt W. A regional Salmonella enterica serovar Typhimurium outbreak associated with raw beef products, The Netherlands, 2010. Foodborne Pathog Dis. 2012 Feb;9(2):102-7.
Jakopanec I, Schimmer B, Grjibovski AM, Klouman E, Aavitsland P. Self-reported sexually transmitted infections and their correlates among men who have sex with men in Norway: an Internet-based cross-sectional survey. BMC Infect Dis. 2010 Sep 6;10:261.
Bosman A, Schimmer B, Coulombier D. Contribution of EPIET to public health workforce in the EU, 1995-2008. Euro Surveill. 2009 Oct 29;14(43). pii: 19381.
Karagiannis I, Schimmer B, de Roda Husman AM. Compliance with boil water advice following a water contamination incident in the Netherlands in 2007. Euro Surveill. 2009 Mar 26;14(12). pii: 19156.
Friesema I, Sigmundsdottir G, van der Zwaluw K, Heuvelink A, Schimmer B, de Jager C, Rump B, Briem H, Hardardottir H, Atladottir A, Gudmundsdottir E, van Pelt W. An international outbreak of Shiga toxin-producing Escherichia coli O157 infection due to lettuce, September-October 2007. Euro Surveill. 2008 Dec 11;13(50). pii: 19065.
Schimmer B, Nygard K, Eriksen HM, Lassen J, Lindstedt BA, Brandal LT, Kapperud G, Aavitsland P. Outbreak of haemolytic uraemic syndrome in Norway caused by stx2-positive Escherichia coli O103:H25 traced to cured mutton sausages. BMC Infect Dis. 2008 Apr 3;8:41.
Nygård K, Schimmer B, Søbstad Ø, Walde A, Tveit I, Langeland N, Hausken T, Aavitsland P. A large community outbreak of waterborne giardiasis-delayed detection in a non-endemic urban area. BMC Public Health. 2006 May 25;6:141.
Schimmer B, Ihekweazu C. Polio eradication and measles immunisation in Nigeria. Lancet Infect Dis. 2006 Feb;6(2):63-5.
Guha-Sapir D, Schimmer B. Dengue fever: new paradigms for a changing epidemiology. Emerg Themes Epidemiol. 2005 Mar 2;2(1):1.
Telgt DS, van der Ven AJ, Schimmer B, Droogleever-Fortuyn HA, Sauerwein RW. Serious psychiatric symptoms after chloroquine treatment following experimental malaria infection. Ann Pharmacother. 2005 Mar;39(3):551-4.
Schimmer B, Sprenger HG, Wismans PJ, van Genderen PJ. Three patients with orf (ecthyma contagiosum). Ned Tijdschr Geneeskd. 2004 Apr 17;148(16):788-91.
Biography
Barbara Schimmer was born on 2 August, 1975 in Schiedam, the Netherlands. In 1993, she completed her secondary education at the Montessori Lyceum in Rotterdam and obtained a grant through the Netherlands America Commission for Educational Exchange (now known as Fulbright Center), for a freshman year of study in the United States, at the University of Wisconsin-Eau Claire. In 1995, she completed her undergraduate degree in International Business Studies from the University of Maastricht. Barbara studied medicine at the University of Groningen, beginning in 1995. During this period, she was an active board member of the Faculty Council and the medical student society, Panacea. She functioned as UNESCO liaison officer for the International Federation of Medical Students’ Associations. In 1999, she did her research elective on the screening of colorectal cancer at the prestigious Mayo Clinic in Rochester (Minnesota) through the International School of Hepatology and Tropical Medicine GISH-T. In 2002, Barbara completed a multidisciplinary Master’s programme in humanitarian assistance (NOHA) at the University of Louvain-la-Neuve in Belgium, where she did an internship at the Centre for Research on the Epidemiology of Disasters (CRED). After her final medical elective at the Harbour Hospital in Rotterdam, she decided to continue in the field of infectious diseases and international health.
After obtaining her medical degree in 2002, Barbara worked as a research physician at the Centre for Clinical Malaria Studies of the Radboud University Medical Center in Nijmegen, and as staff adviser at the Department for Medical and Legal Affairs at the VU University Medical Center in Amsterdam. From 2004-2006, she was a fellow in the European Programme for Intervention Epidemiology Training (EPIET), based at the Norwegian Institute for Public Health in Oslo, where she developed a keen interest in the epidemiology of zoonoses and gastroenteritis. As an EPIET-fellow, she participated in international field missions to Pakistan, Nigeria and Northwest Russia. After completion of her fellowship, she was active in the board of the EPIET Alumni Network, as secretary and president, to help develop and maintain a network of European public health epidemiologists.
Since January 2007, Barbara has worked in the Epidemiology and Surveillance Unit, of the Centre for Infectious Disease Control (Cib) at the National Institute for Public Health and the Environment (RIVM) of the Netherlands. She was zoonoses coordinator in the department of Gastroenteritis and Zoonoses. In 2009, she started her PhD ‘on the job’ project, on the epidemiology of Q fever within a ‘One Health’ context, under the supervision of Prof. dr. Roel Coutinho, Dr. Yvonne van Duijnhoven and Dr. Wim van der Hoek, which resulted in this thesis.
Since 2016, she works within the department of Early Warning and Surveillance and is co-chair of the weekly Early Warning Meeting hosted by the Centre for Infectious Disease Control. She is also the content chair of the annual Transmission Day and editorial advisor to the Eurosurveillance editorial board.

8
Publications on other topics
Pijnacker R, Goris MG, Te Wierik MJ, Broens EM, van der Giessen JW, de Rosa M, Wagenaar JA, Hartskeerl RA, Notermans DW, Maassen K, Schimmer B. Marked increase in leptospirosis infections in humans and dogs in the Netherlands, 2014. Euro Surveill. 2016 Apr 28;21(17).
de Man H, Mughini Gras L, Schimmer B, Friesema IH, DE Roda Husman AM, van Pelt W. Gastrointestinal, influenza-like illness and dermatological complaints following exposure to floodwater: a cross-sectional survey in The Netherlands. Epidemiol Infect. 2016 May;144(7):1445-54.
Severi E, Verhoef L, Thornton L, Guzman-Herrador BR, Faber M, Sundqvist L, Rimhanen-Finne R, Roque-Afonso AM, Ngui SL, Allerberger F, Baumann-Popczyk A, Muller L, Parmakova K, Alfonsi V, Tavoschi L, Vennema H, Fitzgerald M, Myrmel M, Gertler M, Ederth J, Kontio M, Vanbockstael C, Mandal S, Sadkowska-Todys M, Tosti ME, Schimmer B, O Gorman J, Stene-Johansen K, Wenzel JJ, Jones G, Balogun K, Ciccaglione AR, O' Connor L, Vold L, Takkinen J, Rizzo C. Large and prolonged food-borne multistate hepatitis A outbreak in Europe associated with consumption of frozen berries, 2013 to 2014. Euro Surveill. 2015 Jul 23;20(29):21192.
Sane J, Reimerink J, Harms M, Bakker J, Mughini-Gras L, Schimmer B, van Pelt W. Human hantavirus infections in the Netherlands. Emerg Infect Dis. 2014 Dec;20(12):2107-10.
Rebolledo J, Garvey P, Ryan A, O'Donnell J, Cormican M, Jackson S, Cloak F, Cullen L, Swaan CM, Schimmer B, Appels RW, Nygard K, Finley R, Sreenivasan N, Lenglet A, Gossner C, McKeown P. International outbreak investigation of Salmonella Heidelberg associated with in-flight catering. Epidemiol Infect. 2014 Apr;142(4):833-42.
Friesema IH, Schimmer B, Ros JA, Ober HJ, Heck ME, Swaan CM, de Jager CM, Peran i Sala RM, van Pelt W. A regional Salmonella enterica serovar Typhimurium outbreak associated with raw beef products, The Netherlands, 2010. Foodborne Pathog Dis. 2012 Feb;9(2):102-7.
Jakopanec I, Schimmer B, Grjibovski AM, Klouman E, Aavitsland P. Self-reported sexually transmitted infections and their correlates among men who have sex with men in Norway: an Internet-based cross-sectional survey. BMC Infect Dis. 2010 Sep 6;10:261.
Bosman A, Schimmer B, Coulombier D. Contribution of EPIET to public health workforce in the EU, 1995-2008. Euro Surveill. 2009 Oct 29;14(43). pii: 19381.
Karagiannis I, Schimmer B, de Roda Husman AM. Compliance with boil water advice following a water contamination incident in the Netherlands in 2007. Euro Surveill. 2009 Mar 26;14(12). pii: 19156.
Friesema I, Sigmundsdottir G, van der Zwaluw K, Heuvelink A, Schimmer B, de Jager C, Rump B, Briem H, Hardardottir H, Atladottir A, Gudmundsdottir E, van Pelt W. An international outbreak of Shiga toxin-producing Escherichia coli O157 infection due to lettuce, September-October 2007. Euro Surveill. 2008 Dec 11;13(50). pii: 19065.
Schimmer B, Nygard K, Eriksen HM, Lassen J, Lindstedt BA, Brandal LT, Kapperud G, Aavitsland P. Outbreak of haemolytic uraemic syndrome in Norway caused by stx2-positive Escherichia coli O103:H25 traced to cured mutton sausages. BMC Infect Dis. 2008 Apr 3;8:41.
Nygård K, Schimmer B, Søbstad Ø, Walde A, Tveit I, Langeland N, Hausken T, Aavitsland P. A large community outbreak of waterborne giardiasis-delayed detection in a non-endemic urban area. BMC Public Health. 2006 May 25;6:141.
Schimmer B, Ihekweazu C. Polio eradication and measles immunisation in Nigeria. Lancet Infect Dis. 2006 Feb;6(2):63-5.
Guha-Sapir D, Schimmer B. Dengue fever: new paradigms for a changing epidemiology. Emerg Themes Epidemiol. 2005 Mar 2;2(1):1.
Telgt DS, van der Ven AJ, Schimmer B, Droogleever-Fortuyn HA, Sauerwein RW. Serious psychiatric symptoms after chloroquine treatment following experimental malaria infection. Ann Pharmacother. 2005 Mar;39(3):551-4.
Schimmer B, Sprenger HG, Wismans PJ, van Genderen PJ. Three patients with orf (ecthyma contagiosum). Ned Tijdschr Geneeskd. 2004 Apr 17;148(16):788-91.
BIOGRAPHY | 239
Biography
Barbara Schimmer was born on 2 August, 1975 in Schiedam, the Netherlands. In 1993, she completed her secondary education at the Montessori Lyceum in Rotterdam and obtained a grant through the Netherlands America Commission for Educational Exchange (now known as Fulbright Center), for a freshman year of study in the United States, at the University of Wisconsin-Eau Claire. In 1995, she completed her undergraduate degree in International Business Studies from the University of Maastricht. Barbara studied medicine at the University of Groningen, beginning in 1995. During this period, she was an active board member of the Faculty Council and the medical student society, Panacea. She functioned as UNESCO liaison officer for the International Federation of Medical Students’ Associations. In 1999, she did her research elective on the screening of colorectal cancer at the prestigious Mayo Clinic in Rochester (Minnesota) through the International School of Hepatology and Tropical Medicine GISH-T. In 2002, Barbara completed a multidisciplinary Master’s programme in humanitarian assistance (NOHA) at the University of Louvain-la-Neuve in Belgium, where she did an internship at the Centre for Research on the Epidemiology of Disasters (CRED). After her final medical elective at the Harbour Hospital in Rotterdam, she decided to continue in the field of infectious diseases and international health.
After obtaining her medical degree in 2002, Barbara worked as a research physician at the Centre for Clinical Malaria Studies of the Radboud University Medical Center in Nijmegen, and as staff adviser at the Department for Medical and Legal Affairs at the VU University Medical Center in Amsterdam. From 2004-2006, she was a fellow in the European Programme for Intervention Epidemiology Training (EPIET), based at the Norwegian Institute for Public Health in Oslo, where she developed a keen interest in the epidemiology of zoonoses and gastroenteritis. As an EPIET-fellow, she participated in international field missions to Pakistan, Nigeria and Northwest Russia. After completion of her fellowship, she was active in the board of the EPIET Alumni Network, as secretary and president, to help develop and maintain a network of European public health epidemiologists.
Since January 2007, Barbara has worked in the Epidemiology and Surveillance Unit, of the Centre for Infectious Disease Control (Cib) at the National Institute for Public Health and the Environment (RIVM) of the Netherlands. She was zoonoses coordinator in the department of Gastroenteritis and Zoonoses. In 2009, she started her PhD ‘on the job’ project, on the epidemiology of Q fever within a ‘One Health’ context, under the supervision of Prof. dr. Roel Coutinho, Dr. Yvonne van Duijnhoven and Dr. Wim van der Hoek, which resulted in this thesis.
Since 2016, she works within the department of Early Warning and Surveillance and is co-chair of the weekly Early Warning Meeting hosted by the Centre for Infectious Disease Control. She is also the content chair of the annual Transmission Day and editorial advisor to the Eurosurveillance editorial board.


![\ ] q § n ' § b](https://static.fdokumen.com/doc/165x107/633204227f0d9c38da013cb8/-q-n-b.jpg)