atttmiw - Q
77
-atttmiw Q .... ,& ll0h7'U-- c orporate Offic:e : "BEML Soudha", 23/1 . 4:h Main Road. S.R. Nagar. Bangalore · 560 027. INDIA Tel. : 080-22963240/200 E-mail : Offic:[email protected] Manufac:tur1ng Units : Bangalore Complex Tel. : 080-25242414 e-mail · roffice@bernl.co.,n KGF Complex Tel .: 08153-263777 e-mail : [email protected] Mysuru Comple.x T el.: 0821- 2<402422 e-mail : [email protected] Palakkad Complex Tel. : 0491-2565000/230 e-mail : p@beml. c:o.in International Bu1inesa Division Tel. : +91-80-2296 3229 / 3238 e-mail: [email protected] Aerospace Division Tel. . +91-80-2296 3506 & 528 / 575 e-mail: [email protected] · Regional Offlc:es : Bangalore Tel.: +91-80-2296 3590 lo 595 e-mail : [email protected] Bilupur Tel. : 07752-252745 e-mail : [email protected]. cc.in Chennai Tel. : 044-28220844 e-mail : [email protected] Dhanbad Tel. : 0326-2222 :-S85 e-mail : [email protected] Hyderabad Tel. : 040-2322 7032 e-mail : [email protected] Kolkata Tel. : 033-2401 5286 e-mail : ko[email protected].in Mumbai Tel. : 022-23781457 e-mail : mumbal@rm.beml. co.in Nagpur Tel. : 0712-2248 435 o-mail : [email protected] NewDelhl Tel. : 011-2331 6500 e-mail : [email protected]. co.in Ranc:hl Tel. : 0651-2540 710 . e-mail : [email protected] Sambalpur Tel. : 0663-252 1604 . e-matt : [email protected]. rn Slngraull . Tel. : 07805-268260 / 266668 e-mail : [email protected] BEML Sarlvlce Centrea : Bllaapur Tel. : 07752-252 598 e-mail : mvc:@rm.beml.co.in Hyderabad Tel. : 040-2724 0973 . e-mail : [email protected]. co . rn Kolkata Tel. : 033-2401 0782 . e-mail : mc:[email protected] New Deihl Tel. : 011-2215 8655 e-mail : [email protected] Singrauli Tel. : 07805-266 334 e-mail : msg@rm.beml.co.in m 81 M2s BEML LIMITED (fitf.t uf ~ . qmr ~) ( A Govt. of India Mini Ratna Company under Ministry of Defence) ~cffl / Mysuru Complex (CIN : L35202KA1964GO1001530) TKT/137(C)/2018 Date : 26 . 03 . 2018 TO WHOMSOEVER IT MAY CONCERN Proiect Certificate This is to certify · that Mr. Rakshith Kumar B, USN: 1AY16MBA57, MBA in Finance from The Acharya Institute of Technology, Bangalore has successfully completed Project work on "A Study on Working Capital Management with reference to BEML M~sore Complex, Mysore" under the guidance of Mr. Mohan T, Assistant General Manager, Finance Department, BEML Mysore Complex, Mysuru from 22.01.2018 to 24.03.2018. During his stay at BEML Limited, his character was found good. We wish Mr. Rakshith Kumar B, ALL THE BEST in his future endeavours. for BEML LIMITED rahma~ ~enior _Manaae~ - Training. -:t '- .j <t I,. BK <t"'rl l\1 A ' HJ \ti .! , 7; i3 ' :"f :JV.=i Sen ,or 1-\r • <' 1·r ';Tf 1'\ r ' · ; - .' ' ·r1, _, G:: ITRf: '1 '\ :- C~mplex ~-~1111!14<, - 570 018, ~. 'l!T«f 1 ; •• ·..:. 11: MysunJ ,Cl:¥DR"4-.vadi Post, Mysuru-570 018, Kamataka, India .• , ,V ,1 .U R. ~~0821-2402422 ~Fax:0821-2402434 { m:r Email : HR - [email protected], Purchase - [email protected], Finance · [email protected] Website : www.bemlindia.com
-
Upload
khangminh22 -
Category
Documents
-
view
4 -
download
0
Transcript of atttmiw - Q

-atttmiw Q ....
,& ll0h7'U-c orporate Offic:e : "BEML Soudha",
23/1 . 4:h Main Road. S.R. Nagar. Bangalore · 560 027. INDIA Tel. : 080-22963240/200 E-mail : Offic:[email protected]
Manufac:tur1ng Units : Bangalore Complex Tel. : 080-25242414 e-mail · [email protected].,n KGF Complex Tel.: 08153-263777 e-mail : [email protected]
Mysuru Comple.x Tel. : 0821-2<402422 e-mail : [email protected]
Palakkad Complex Tel. : 0491-2565000/230 e-mail : [email protected]:o.in
International Bu1inesa Division Tel. : +91-80-2296 3229 / 3238 e-mail: [email protected]
Aerospace Division Tel . . +91-80-2296 3506 & 528 / 575 e-mail: [email protected] ·
Regional Offlc:es :
Bangalore Tel.: +91-80-2296 3590 lo 595 e-mail : [email protected] Bilupur Tel. : 07752-252745 e-mail : [email protected] Chennai Tel. : 044-28220844 e-mail : [email protected] Dhanbad Tel. : 0326-2222 :-S85 e-mail : [email protected] Hyderabad Tel. : 040-2322 7032 e-mail : [email protected]
Kolkata Tel. : 033-2401 5286 e-mail : [email protected]
Mumbai Tel. : 022-23781457 e-mail : [email protected]
Nagpur Tel. : 0712-2248 435 o-mail : [email protected]
NewDelhl Tel. : 011-2331 6500 e-mail : [email protected]
Ranc:hl Tel. : 0651-2540 710 . e-mail : [email protected]. in
Sambalpur Tel. : 0663-252 1604 . e-matt : [email protected]
Slngraull . Tel. : 07805-268260 / 266668 e-mail : [email protected]
BEML Sarlvlce Centrea :
Bllaapur Tel. : 07752-252 598 e-mail : mvc:@rm.beml.co.in
Hyderabad Tel. : 040-2724 0973 . e-mail : [email protected]
Kolkata Tel. : 033-2401 0782 . e-mail : mc:[email protected]
New Deihl Tel. : 011-2215 8655 e-mail : [email protected]
Singrauli Tel. : 07805-266 334 e-mail : [email protected]
m ~ ~ ~ 81 M2s BEML LIMITED
(fitf.t uf ~ . qmr ~ ~ ~ ~ ~)
( A Govt. of India Mini Ratna Company under Ministry of Defence)
~ ~cffl / Mysuru Complex
(CIN : L35202KA1964GO1001530)
TKT/137(C)/2018 Date : 26 .03 .2018
TO WHOMSOEVER IT MAY CONCERN
Proiect Certificate
This is to certify · that Mr. Rakshith Kumar B, USN: 1AY16MBA57, MBA in Finance from The Acharya Institute of Technology, Bangalore has successfully completed Project work on "A Study on Working Capital Management with reference to BEML M~sore Complex, Mysore" under the guidance of Mr. Mohan T, Assistant General Manager, Finance Department, BEML Mysore Complex, Mysuru from 22.01.2018 to 24.03.2018. During his stay at BEML Limited, his character was found good.
We wish Mr. Rakshith Kumar B, ALL THE BEST in his future endeavours.
for BEML LIMITED
~
rahma~
~enior _Manaae~ - Training. -:t'- .j <t I,. BK<t"'rl l\1A 'HJ\ti.!
,7; i3 ' :"f:JV.=i Sen,or 1-\r •<'1·r ';Tf 1'\ r ' · ; - .' ' ·r1,_, G::ITRf: '1 '\ :- C~mplex
~ ~-~1111!14<, ~ - 570 018, ~. 'l!T«f
1; •• ·..:. 11: MysunJ ,Cl:¥DR"4-.vadi Post, Mysuru-570 018, Kamataka, India
.• , ,V,1 .UR.~~0821-2402422 ~Fax:0821-2402434 { m:r Email : HR - [email protected], Purchase - [email protected], Finance · [email protected]
~ Website : www.bemlindia.com
ACI-IARYA INSTll"'UTE OF TECHNOLOGY
(Afliliutod lo Visvesv:11 ay,1 Tochnolnuicnl Univnrsily, Aolan,ivi, Approvocl hyAIC rE. N1!wOulh1 a11d A1;c.rr:drt1JrJ byl·IBA awJ N/1/ CJ
Date: 22/05/2018
CERTIFICATE
This is to certify that Mr. Rakshith Kumar B bearing USN
IA Y16MBA57 is a bonafide student of Master of Business Administration
course of the Institute 2016-18 batch, affiliated to Visvesvaraya
Technological University, Belgaum. Project report on "A Study on Working
Capital Management With Reference to BEML Mysore Complex" at
Mysore is prepared by him under the guidance of Dr. Ramanaiah G, in
partial fulfillment of the requirements for the award of the degree of Master of
Business Administration, Visvesvaraya Technological University, Belgaum,
Karnataka.
Signature of Internal Guide
~
~ ( - ~
Signature]! Head of the Department
Department of MBA Acharya 1,stitute of Tech·mlouy
~ , ,.,..: )_9vanah111, Bangalore-560 1 L
~ )g'N\ ~
Signature of Principal
LO~ OJ! ;--n1 P. ~l 1r.1pAL'',!'::f-. ·J• ·1ns, Af',t,MU\fl•. ½ · - ·, • -Jr 'lli ~ ~J\:J'tur >-r .i:, i' , , '· · , L,),fil";,w ~ Sfil •• - \1d ji\H~d •,~-560 107
Ar:h:irya Or Sarvcpallr Radhakrislt113n Road Solartevanahall!· Ar.h;iryiJ P.O. Oim[plorr. S60 107 ·urna .t~J. India • \\'\\• v dch:iry.1 c:c If\ :i •
• Ph i 91-80 n~J 55S !h f x111 2102 • ~ax 191 -80-73/ 007 ,17 • E-mail r111nr.1pillil n)11rhaivc1 ill. 11

DECLARATION
I. Rakshith Kumar B hereby declare that the pro_jcct report entitled "A
Study On Working Capital Management With Reference to Bharat Earth
Movers Limited ., Mysuru Complex" prepared by me under the guidance of
Dr.Ramanaiah Gfaculty of M.B.A department, Acharya Institute Of
Technology, Bengaluru and external assistance by Mr.Mohan T, AGM,
Finance Dept. BEI\,1LMysuru. I also declare that this project work is
towards the pai1ial fulfilment of the university regulations for the award of
degree of master of business administration by Visvesvaraya Technological
University, Belgaum. I have undergone a summer project for a period of
twelve weeks. I further declare that this project is based on the original
studv undertaken bv me and has not been submitted for the award of anv ~ .I ~
degree/diploma from any other university
Place: lSocJ~Jvl Date: J_ <:;? l o 1' [ 2----o L e

ACKNOWLEDGEMENT
First and foremost, I wish to thank the company for enabling the successful
completion of the internship training.
I express my profound gratitude and sincere thanks to Dr. S C Pilli Principal of
Acharya Institute of Technology, Bangalore.
I express my heartfelt thanks to, Dr. G Nijaguna, Head of the Department of
Management Studies, Acharya Institute of Technology, Bangalore for inspiration
and valuable suggestions for carrying out this endeavour.
It is my first and foremost duty to express my deep and sincere thanks to
Dr. Ramanaiah G Professor, Acharya Institute of Technology , Bangalore, who
supervised this Internship Training. I sincerely thank her for the inspiring
guidance, generous help and support.
I would like to express my sincere thanks to all the staff members and all other
individuals who helped me in completing this Internship Training.
RAKSHITH KUMAR B

TABLE OF CONTENTS
Chapter No Titles Page No
EXECUTIVE SUMMERY
INTRODUCTION
1.1 Introduction 1
1.2 Industry profile 1
1.3 Company profile 2
1.3.1 Promoters 4
1.3.2 Vision , Mission and Quality policy 7
1.3.3 Products or Service profile 9
Chapter 1 1.3.4 Infrastructure facility 16
1.3.5 Competitors information 17
1.3.6 SWOT analysis 17
1.3.7 Future and growth and prospectus 18
1.3.8 Financial Statements 19
CONCEPTUAL BACKGROUND AND LITERATURE REVIEW
Chapter 2 2.1 Theoretical background of the study 20
2.2 Literature review 25
RESEARCH DESIGN
3.1 Statement of the problem 30
3.2 Need for the study 30
Chapter 3 3.3 Objectives 30
3.4 Scope of the study 30
3.5 Research methodology 31
3.6 Limitations 31
3.7 Chapter scheme 31
Chapter 4 ANALYSIS AND INTERPRETATION
4.1 Data analysis 33
FINDINGS CONCLUSION AND SUGGESTION
5.1 Findings 61
Chapter 5 5.2 Suggestion 62
5.3 Conclusion 63
Bibliography 64
Annexures

LIST OF TABLES
Table no Title of the table Page No
TREND ANALYSIS
1 Equity capital 34
2 Reserves and surplus 36
3 Net worth 38
4 Inventory 40
5 Sundry debtor 42
6 Working capital 44
7 Capital employed 46
8 Sales 48
9 Receivables management 50
RATIO ANALYSIS
11 Current ratio 54
12 Quick ratio 55
13 Inventory ratio 56
14 Debtors turnover ratio 57
15 Working capital turnover ratio 58
16 Fixed assets turnover ratio 59
17 Capital turnover ratio 60
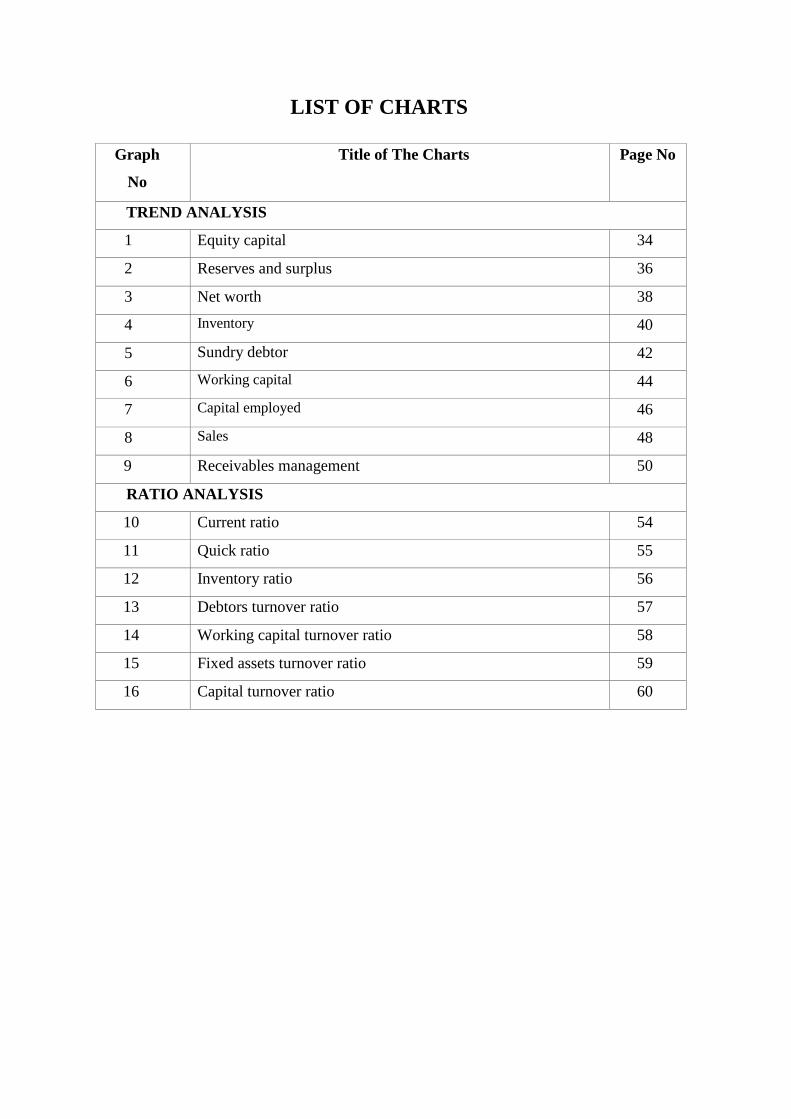
LIST OF CHARTS
Graph
No
Title of The Charts Page No
TREND ANALYSIS
1 Equity capital 34
2 Reserves and surplus 36
3 Net worth 38
4 Inventory 40
5 Sundry debtor 42
6 Working capital 44
7 Capital employed 46
8 Sales 48
9 Receivables management 50
RATIO ANALYSIS
10 Current ratio 54
11 Quick ratio 55
12 Inventory ratio 56
13 Debtors turnover ratio 57
14 Working capital turnover ratio 58
15 Fixed assets turnover ratio 59
16 Capital turnover ratio 60

EXUCUTIVE SUMMARY
A fine planned and executed working capital management is predictable underwrite
completely to the formation of a firm’s value. The tenacity of this project is to inspect the
trends in working capital management (WCM) and its impression on the performance of
BEML LTD. This project objects at learning various facets of working capital management at
BEML. These projects also pulls a evaluation between BEML and other projecting players
active in the organisation segment and tries to find out the reasons playing an active role
behind the numerous status of BEML. Working capital management includes not only
dealing the various components of the current assets, but also dealing the current liabilities, or
in precise financing the current assets. A company is requisite to sustain a balance between
liquidity and profitability while leading its day to day processes. The status of cash as an
needle of on-going financial strength should not be astonishing in opinion of its critical role
within the business. This matter shows that business must be lead both efficiently and
profitably.. On the other hand, too much focus on liquidity will be at the expense of
profitability. We can see major three verticals of working capital management following:
Receivables management, Cash management and Inventory management using the financial
statements of BEML, an analysis has been done by analysing trends applied and followed.
The financial statements (balance sheet, profit & loss accounts) are used to analyse different
ratios which help us in well understanding the company.

1 BEML LTD, MYSURU
CHAPTER 1
1.1 INTRODUCTION
An internship is the on the job training which will be thought the working process of the
company. Internship for professional carrier are similar in some ways but lack of
standardisation and oversite leaves the term open to grow interpretation. Internship is a
programme which the problem will identified in the particular field of the company in a
period of time.
Internship consists experience between students and an organisation with exchange of
services. The internship programme is info mated to provide interns engaged in a outside
experience with an opportunity to share their discernment. Internship is one the foundation to
develop the professional skill and professionalism behaviour of every intern.
Working capital may be considered a business life blood that its effective provision can do a
lot to achievement business success while in efficient management leading not to a profit
loss, but also the final reduction of what could be considered otherwise as a promising
concern. However, a study is very important to inside and outside analysis due to its
connection with today's business day. It is also known as circulating current capital or capital,
because current assets are safeguarding in the nature of the use of the term "circulatory
capital" for "working capital" indicating that its flow is a newsletter in its nature
1.2 INDUSTRY PROFILE
BEML is undisputed leader in the Indian engineering industry for over 4 decades with
substantial contribution to the core verticals of market such as construction, mining. defence
and railways. The term “Development” conjures up images of vibrant town, contemporary
buildings and well-connected roadways. The Earth moving industry has a sizeable role to
play in creating them. The technology required to manufacture such machines was not earlier
available. The lot of research and insight has gone into the development of the earth moving
market.
The development of the earth moving industry is technological development of a country
because commissioning of such a large machine was a challenge and it requires the honed
skills and experience. The industry is also a good way to absorb the development of the latest
global technology. The industry has been able to design, develop and manufacture a major
equipment and critical accessories. Production of different goods in 60 to 80 % has already

2 BEML LTD, MYSURU
been achieved. Land mobility in the public sector has been able to record 85% of the mobbed
average projects that make favourable. The earth's air and construction industry play an
important role in the development of the country. The large part of the landing industry
depends on the development of the major industry's core sector. The government has already
constructed a large-scale road, bridge, airport and port, which has increased the transfer of the
land to the land. The Indian construction machinery industry is running at high speed speeds,
the volume of the volume of movement, movement equipment, specific use of a variety of
uses, is a government-owned government-oriented construction projects with the national
highway development program on the north-east-west of the west. Apart from this, the
government decides to overturn the private sector of roadside bridge, airport and port and
ensure 100% promotion plan to enhance the construction of the construction industry, as well
as the construction of the machine.
1.3 COMPANY PROFILE
BEML was incorporated in May 1964 with its corporate office at Bengaluru commenced
operations from 1st Jan 1965 .It is Asia’s second largest land growing and mining equipment
manufacturer. The company is engaged in rail coach, rail bus, and Indian railways, heavy
duty trucks, its various types, crash fire tenders, heavy maintenance vehicles, bridge, landing
equipment and combinations for defence
Whole landing companies, In various fields of economy in different decades like coal,
mining, steel, cement, electricity, irrigation, construction, road construction and railway, the
company's multi-regional and multi-product company is an important application for BMW.
It has increased its product limit so that the high-quality hydraulics, heavy deal diesel
engines, welding robots and heavy construction jobs begin.
BEML had joined the elite group in sectors in public sectors in 1989. For the first time it
sighted a memorandum of undertakings(MOU) in 1990 with its administrative ministry
namely department of defence production supplies ministry of defence. Its contribution to
defence is around 33% which includes military equipment such as TATRA*8,6*6,4*4 truck,
tank transportation trailer, heavy recovery vehicle amored recovery vehicle, engineering mine
ploughs and other defence aggregates. It is also manufacturing Aircraft weapon loader.
BEML in-house R&D with advanced CAD facilities , test equipment, laboratories and
prototype manufacturing shops is responsible for the updating the existing products bringing

3 BEML LTD, MYSURU
out new special purpose equipment. Every important point to be mentioned here is the BEML
has a leader in manufacture of earth moving and defence equipment has got a wide strong
network of marketing and service spread through-out the nation in all direction. From the
year of inception, the company generated the profits. It is generating its own internal resource
funds and remains as a major contributors to the national exchange in the form of dividends,
income tax, customs duty, central excise duty and sales tax. BEML as a municipal sectors
activity under the ministry of defence company in India.
The company functions in three major business verticals - viz. mining & construction and rail
& metro defence. Everything which the above is headed business and acts as a director of the
CEO and the business & managing director reports to the president of the company. In
addition to the above trading division deals in non-company products. BEML she is doing
this, and the reason of defence was the support equipment such as tatra, according to the
maximum mobility trucks, recovery downtown, over the bridge, the new design, downtown,
for the machine of our missiles projects, tank film, wagons, fire, tenders, and sewers of stone,
the aircraft towing of his critics, aircraft arrow loading trolley. He thinks the company should
overhaul and up gradation to assemble and develop a view of Lake Bell into dry products.
A dedicated team has 500 company r & infrastructure consistent and in line with company
policy to meet the needs of the technological tie-ups with in-house r & 500 for technical and
strategic global players.
BEML is working in three major business verticals
Mining & Construction
Defence
Rail & Metro
BEML has 9 manufacturing units in different following locations
Kolar Gold Fields (KGF) Complex
Mysore Complex
Bangalore Complex - Rail & Metro Division
Palakkad Complex

4 BEML LTD, MYSURU
1.3.1 PROMOTERS
SHRI D K HOTA
CEO and MD
SHRI R. H. MURALIDHARA
Director (Defence Business)

5 BEML LTD, MYSURU
SHRI B. R. VISWANATHA
Director (M&C Business)
Smt.SurinaRajan Shri Sanjay Prasad
Government Nominee Director Government Nominee Director
6 BEML LTD, MYSURU
Shri B. P. Rao
Independent Director
Shri S. K. Beri
Independent Director
Shri M. G. Raghuveer
Independent Director

7 BEML LTD, MYSURU
1.3.2 VISION AND MISSION
VISION
Becomes a marketplace chief as a differenced Company providing first-rate products and
services to sectors together with mining & creation, Rail and metro, Defence & aerospace and
to grow to be an outstanding global participant.
MISSION
Improve attractiveness thru cooperation, tactical alliances and joint ventures, to
preserve and beautify marketplace proportion in product organizations BEML
operates.
Grow profitably with the aid of violentlychasing business and marketplace
chances in home and global markets by pursuing as a minimum 10% of sales in
exports.
Implementation of ultra-modern technologies and produce in new products via
Transfer of Technology and in-residence R&D.
Continue to diversify and develop addressing new merchandise and markets with
turnover from in-residence R&D evolved merchandise at 60%.
Attract and preserve humans in a worthwhile and galvanizing environment by
developmentcreativeness and innovation with attrition ranges less than five%.
Offer technology and cost effective total keys for better client happiness.
QUALITY POLICY
BEML views quality improvement and remains so in any war proactive in the areas of
product and service categories. BEML by the corporate quality policy quality roman
emphasizing that the quality system is based on the results of products, services and
processes standards and stringent requirements to meet performance criteria. A total quality
department spearheads push to separate quality management.
All company manufacturing units are certified by the ISO 9001-2008 quality management
system (QMS) .the KGF complex, Bangalore complex and complicated, Mysore certified by
the ISO 14001-2004, story management system (EMS)also includes bangalore certified to
integrated management system and BS OHSAS18001-2007 engine division, mysore all

8 BEML LTD, MYSURU
certified in Armenia AS9100c certification. All manufacturing steps of the ISO 2015
standards gearing up pieces of the amended version.
Manufacturing facilities available to test increased with its R&D 500 laboratories, KGF
national accreditation board in Mysore, which includes regular laboratories (NABL) by
covering calibration of flow overpowered collar and mechanical measuring. Vivamus labs, a
division of em extensions of them unto the top, there are differences of steps to the NABL us
labourites diam. The facilities include the path that will test and evaluate equipment
performance.
Seller for the project development items remain in a "focus area" to improve the appearance
of-sale service and items of sub-assemblies. Standard procedure, the seller registration form
in lorem website loaded up as fast antioxidants ugly new sellers.
Quality function deployment "is active in the organization. Lorem cross-functional teams
routinely visit sites to capture the voice of the customer. Such actions have resulted in many
elements of the then fine quality product features and improvements over the house, and
workers as well as products developed to suit specific operating requirements and conditions
lorem.
Quality assurance of various kinds of works, he was taken away, that he should bring in the
quality counsel, the result of constantly is to say, the various events in the region of the
kaizen, statistical process control (SPC), the quality, the quantity of the whole circles this has
been done; 5s, etc., with tools like the cause-effect diagram, why, why pareto analysis,
through the grass root level histogram research in training procedures.
The small group action teams (GC teams) are regularly participating in regional / chapter /
national / international competition level and at the prestigious awards.

9 BEML LTD, MYSURU
1.3.3 PRODUCT PROFILE
Mining &Construction Products
Bull Dozers : 90 - 860 FHP
Excavators : 0.3 - 11.2 Cu.m
Rear Dump Trucks : 35 - 205 T
Wheeled Loaders : 1.7 and 4.7 Cum

10 BEML LTD, MYSURU
Motor Graders : 125,145 & 285 HP
Wheeled Dozers : 126 and 300 HP
Back Hoe Loaders : 0.24 / 1.2 Cu.m
Pipe Layers : 40T, 70 T & 100 T
Side Discharge Loaders : 1.1 Cu.m
Crash Fire Tender

11 BEML LTD, MYSURU
Tyre Handler : Lifting capacity 3500 kg
Water sprinkler
Defence Products
Armoured Recovery Vehicle
Heavy Duty High Mobility Vehicles –10x10,8x8, 6x6, 4x4 & Variants
50T Trailer for Tank Transportation
Aircraft Towing Tractor
Aircraft Weapon Loading Trolley

12 BEML LTD, MYSURU
Heavy, Medium and Light Recovery Vehicles
Pontoon System
Ground Support Vehicles for Integrated Guided Missile Programme
Mine Plough
Dozers for snow clearance / road construction to DGBR and E-in-C
Transmissions, Final Drives, Interface Items and Ejector & Air Cleaner Assemblies
for Infantry Combat Vehicles (ICV-BMP-II)
Hydro-pneumatic Suspension Systems ,Hull, Turret, Transmission and Under
Carriage items for MBT Arjun
Military Rail Coaches and Military Wagons

13 BEML LTD, MYSURU
Rocket launcher
Hydro-pneumatic Suspension Systems ,Hull, Turret, Transmission and Under
Carriage items for MBT Arjun
Aerospace vehicle

14 BEML LTD, MYSURU
Prithvi missile launcher
Snow Cutter
Railway &Metro Products
Metro Cars

15 BEML LTD, MYSURU
Passenger Rail Coaches
Military Rail Coaches
Laying Equipment
Overhead Equipment
Rail bus
Treasury Vans
Stainless Steel Electric Multiple Units (SSEMU)
AC Electric (AC EMU)
Diesel Electric (DEMU)
Utility Track Vehicle

16 BEML LTD, MYSURU
Diesel Engines (100 HP to 770 HP)
for captive application
for manufacture of DG sets
for Heavy Duty Trucks application
for replacement on Defence Equipment
for compressor application
1.3.4 INFRASTRUCTURE FACILITY
BEML has a well-established manufacturing division at three places catering to different
segment of product. Also a 100% subsidiary foundry is there for meeting good sharing unit
castings,.Thy are well equipped with all manufacturing facilities with modern technologies.
BEML has 8 manufacturing units in India. apart from this BEML have 5 strategic business
units and research and development facilities.
Mysore complex; Earth moving, engine and aerospace manufacture division
Bangalore division; Rail and metro division
Kolar gold field; Rail coach unit ii, heavy fabrication unit
Palakkad complex (Kerala); Tatra trucks, pontoon Bridge system
Vignyan industries (a subsidiary unit located at Terikere); Steel casting
Research and development facilities;
R&D centre installed in 1959 is the largest of its kind in India. The business enterprise has a
strong base of in house layout and development set up. Company’s R&D division at
KGF(Kolar gold area ) has designed (around 10km from Bangalore ), developed and
correctly productions a variety of latest products.
The process of R&D encompass technology absorption, import substitution price reduction
and product development for home and export markets. Product advanced through R&D have
been extensively exported to counties which includes UK Syria and so forth. The employer
has R&D unit for layout and product improvement at both Bangalore and Mysore complexes.

17 BEML LTD, MYSURU
1.3.5 COMPETITORS INFORMATION
BEML owns 70% markets share in domestic earth moving markets. And second of the largest
earth moving manufacturer in India and second largest in Asia and also BEMLfacing
competition from the following;-
Caterpillar
Komotsu
JCB
Terex
Hitachi
Volvo
L&T
And the main competitors are;
Bombardier transportation (Salvi, Gujarat); supplied coaches to(DMRC) and Alstom (Srisity
near Chennai ) supplied coaches to Kochi Metro.
1.3.6 SWOT ANALYSIS
SWOT analysis (strength weakness analysis wires) framework to examine the instability of
identifying seen from the program, product or organization souls. Every order is the benefit
of the species throughout the analysis.
STRENGTHS
The strong point and major facilityof the BEML
Largest manufacturer of earth moving equipment’s in India.
Highly versatile manufacturing facilities capable of handling wide range of products.
State-of art design capability and testing facilities sophisticated R&D centre comprising
specialize areas like power line structural engineering material science etc.
with vast knowledge and experience in multi-disciplinary skill the company is in a better
position to absorb and adopt new technologies.
Widest network of regional/district officers, across the country with spare parts and service
centres at strategic locations.
All production unit of the company are ISO 002-2000 accredited.

18 BEML LTD, MYSURU
WEAKNESS
The Major drawbacks and lacks of BEML
BEMI, has some weakness in the following areas:-
High cost and price.
Delay in decision due to procedures and authorities
Focus on large institutional customers only
Inadequate market research Realization of credits.
OPPORTUNITIES
The external opportunity which showcases BEML
Increase in the order from the defence.
Increased Government support for export.
Technological advancement in the production and safety.
THREATS
The obstacles which effected to BEML are
Permitting private sector for manufacturing and supplying defence requirements
Increased competition in mining segment due to entry of multinational companies to
Indian market
1.3.7 FUTURE GROWTH AND PROSPECTUS
In the established infrastructure indigenization of components for metro cars, defence
products. Scanning expertise / partners for the mining and construction products including
trucks, hunter higher capacity and dozers loaders with state-of-the-art features are in line with
major global competitors

19 BEML LTD, MYSURU
1.3.8 FINANCIAL STATEMENTS
BEML Limited
Balance Sheet For Financial Year From 2012-13 To 2016-2017
Particulars 2013 2014 2015 2016 2017
I Equity And Liabilities
(1)Shareholders Funds
(A)Share Capital 4177.22 4177.22 4177.22 4177.22 4177.22
(B)Reserve And Surplus 203826.10 203806.70 203498.40 206759.00 213978.10
Sub Total 208003.4 207983.9 207675.6 210936.2 218155.3
(2)Share Applications Money Pending
Allotment
0.00 0.00 0.00 0.00 0.00
(3) Non-Current Borrowings
(A) Long Term Borrowings 49811.05 46520.11 41392.67 36265.22 31052.30
(B)Other Long Term Liabilities 40603.50 37939.83 31697.48 36399.19 34189.87
(C)Long Term Provisions 14916.67 13587.26 16435.86 16064.00 17494.24
Sub Total 105331.20 98047.20 89526.01 88728.67 82736.41
(4)Current Liabilities
(A)Short Term Borrowings 71620.00 43943.21 17823.51 14542.15 15846.28
(B)Trade Payables 48955.65 38579.63 54328.65 40821.47 49684.90
(C)Other Current Liabilities 680588.70 75892.21 77141.60 61750.69 89648.90
(D)Short Term Provisions 19514.58 11637.25 12597.46 15517.04 14940.35
Sub Total 208179.40 170052.30 161891.20 132631.40 170120.40
Total Equity And Liabilities 521514.00 476083.40 459092.80 432296.20 471012.20
II Assets
(1) Non-Current Assets
(A) Fixed Assets
(I) Tangible Assets 50253.93 47775.37 45455.92 52306.09 51843.99
(II) Intangible Assets 2820.50 2094.25 1415.24 1715.58 5242.26
(II) Capital Work In Progress 11322.87 13533.63 14994.98 5883.43 7942.33
(IV) Intangible Assets Under Development 2855.77 3753.73 4174.86 4504.95 0.00
(B)Non-Current Investments 257.64 257.64 257.64 257.64 257.64
(C) Deferred Tax Assets (Net) 10523.84 10005.33 10137.85 10351.57 11117.57
Sub Total 78034.55 77419.95 76436.49 75019.26 76403.79
(D)Long Term Loans Advances 28297.98 29760.71 23391.01 22816.30 1837.23
(E) Other Non-Current Assets 245.83 428.03 406.92 434.05 10026.27
Sub Total 28543.81 30188.74 23797.93 23250.35 11863.50
(2) Current Assets
(A) Current Investments 155.70 129.06 80.02 62.14 51.83
(B) Inventories 245619.90 215210.30 192119.80 169631.80 197445.60
(C) Trade Receivables 86151.14 97736.19 99169.65 120805.10 143037.40
(D) Cash And Cash Equivalents 7692.46 1623.49 14473.02 6556.18 1401.02
(E) Short Term Loans And Advances 38612.71 23437.98 16631.50 20681.99 1331.46
(F) Other Current Assets 36703.70 30337.73 36384.45 16289.35 39477.69
Sub Total 414935.60 368474.70 358858.40 334026.60 382744.90
Total Assets 521514.00 476083.40 459092.80 432296.20 471012.20

20 BEML LTD, MYSURU
CHAPTER 2
2.1 CONCEPTUAL BACKGROUND AND LITERATURE REVIEW
Working capital management concerns the company's accounting management strategy to
monitor and utilize both components of working capital, current assets and short-term
liabilities to ensure the most effective financial performance of the company.
The proper management of working capital is essential for the company's core financial
health and operational success as a business. The working capital ratio dividing current assets
into current liabilities shows whether a company has an adequate cash flow to cover short-
term debts and costs.
The ratio of the working capital business is also reflected in the net sales of working capital.
It indicates the efficiency of a company in the use of its working capital. Work capital is the
total amount of current assets, excluding the total amount of the current liability.
TYPES OF WORKING CAPITAL
1. Permanent working capital
It means the minimum amount of investment in all current assets which is regarded at
all times to carry on minimum level of business activities.
Features of permanent working capital
He amount of permanent working capital of business will remain in one form or other.
Positive correlation between the amount of permanent working capital and the size of
the business.
2. Temporary working capital
This is also referred to as the fluctuating or variable running capital. The quantity of
temporary running capital keeps on changing depending upon the adjustments in
manufacturing and income.

21 BEML LTD, MYSURU
Permanent and temporary working capital.
3. Gross working capital.
It is the amount of funds invested in the various components of currents assets.
The concept has the following advantages:
Finance executives are speciallyanxious with management of modern property.
It enables a company to launch the greatness the greatest reruns on its funding.
It permits a firm to plot and control the funds at its disposal
It allows within the fixation of diverse regions of monetary duty
4. Net working capital
It is the difference among contemporary belongings and modern liabilities. The idea
net operation capital allows a company to decide the precise quantity available at its
discarding for working requirements.
5. Negative working capital
When modern liabilities exceeds contemporary belongings, terrible operating capital
emerges. Such a state of affairs happens whilst a company is nearing a disaster of
some magnitude.
NEED OF WORKING CAPITAL.
A firm has a profit to keep its image in the capital market. Is also looking headlong to
see from the development of the productivity of the investor continues. And the result of
increased profit growth in the firm. To earn significant profit, sales volume will be increased.
22 BEML LTD, MYSURU
At once it is clear that, to be converted into cash and have not the faith of the good things are
the things in the nature of the salt and with salt and ground. This extra head prerequisite for
the uninterrupted business will be closed to the extent as current accounts receivable good
stock etc.
Factors influencing working capital management
1. Nature
The structure of current assets is a characteristic dimensions of commercial
enterprise and the enterprise to which it belongs. SSC companies have smaller
proportions of cash, debts and stock than huge groups. This distinction will become
more marked in big companies.
2. Size of business
The length of commercial enterprise has also a vital effect of running capital
desires. Size can be measured in phrases of scale of task. A firm with large scale of
operation will need extra operating capital than a small firm.
3. Manufacturing cycle
This is due to the truth that tremendously capital extensive industries require a
huge quantity of working capital to run their state-of-the-art and lengthy production
manner. On the identical precept, a trading concern calls for a far decrease working
capital than a production problem.
4. Production policy
The production guidelines pursued by using the management have a big effect
at the requirements of working capital of the enterprise. The manufacturing agenda has
a tremendous have an effect on on the extent of inventories The selection of the control
concerning automation, and so forth., will even have its impact on operating capital
necessities.
5. Volume of sales
A company keeps modern-day property due to the fact they're needed to help
the operational sports which bring about income. The extent of revenue and the

23 BEML LTD, MYSURU
dimensions of the operation are at once related to each different. As the quantity of
income growths, there is an growth within the funding of working capital
6. Terms of purchase and sales
A firm which allows liberal credits to its clients may also enjoy higher, however
will need greater operating capital as compared to a firm enforcing credit score phrases.
The running capital necessities also are affected by the credit centres enjoyed by way of
the firm. A company enjoying liberal credit facilities from its providers requires,
decrease quantity of running capital as compared to a firm which does not enjoy such
liberal credit score facilities
7. Business cycle
Business enlarges throughout the duration of wealth and failures throughout the
duration of despair. Consequently, greater working capital is needed throughout the
length of prosperity and much less all through the length of depression.
8. Price level changes
The growing changes in rate tiers make the capabilities of financial executive
hard. He must assume the impact of price degree adjustments on working capital
necessities of the firm. Generally, rising rate tiers will require a firm to preserve better
amount of operating capital. The identical stages of cutting-edge belongings will want
accelerated investment when prices are growing. However, the businesses that may
right now revise their product prices with rising rate levels will not face an extreme
running capital
9. Profit margin
The working efficiency of the company pertains to the most reliable utilisation
of resources at minimal value. The company can be efficaciously contributing to its
working capital if it's miles green in controlling the working prices. The use of running
capital is advanced and tempo of the coins cycle is multiplied with running
performance. Better utilisation of sources improves profitability and as a result, enables
in releasing the strain on running capital

24 BEML LTD, MYSURU
10. Profit apportionment
Firms vary of their capacity to generate make the most of enterprise operations.
Some company revel in a dominant position, due to best product or good advertising
and marketing management or monopoly strength inside the market and earn a high
income margin. Some other corporations may additionally need to operate in an
environment of excessive opposition and can earn low margin of income A high
internet earnings margin contributes closer to the working capital pool.
Working Capital Analysis
Woking capital is certainly the life blood is the head of running the commercial centre
of the enterprise. Enough leisure running of the world, it is very much depends on the
traveling business. It is quite a work, in the green the head of the rest on the right is the most
important part of management is. But clearly a role is substantial, according to the company
for working capital control. Therefore, a look at the inside from the powers it on running and
running and adjustments to the efficiency of the head of the uses it is important to assess the
damage of the head is the use of the commercial enterprise. The evaluation of running capital
can be carried out thru some of gadgets.
1. Ratio analysis.
This is very simple arithmetic a variety of expression of the one in relation to the other. In the
trial measuring system can be used during the brief running time for the role of liquidity and
stability.
Current ratio.
Quick ratio
Absolute liquid ratio
Inventory turnover.
Receivables turnover.
Payable turnover ratio.
Working capital turnover ratio.
Working capital leverage
Ratio of current liabilities to tangible net worth.
25 BEML LTD, MYSURU
2. Fund flow analysis
Trust float evaluation is a nominal device distinct to the have a look at the supply from which
extra funds had been derived and the use to which those assets had been placed.
It is an operative control device to look at the changes in monetary role commercial
enterprise employer among beginning and finishing of the monetary dates
3. Working Capital Budget
The cost of funds and / or the quantity stated in the pursuit of commercial business plans
family time. Economic or working capital to help price range plans to use some resources
will go. And the successful implementation of the treasury of the house of the lord, before the
separate runs of the head is in the budget is what he was about each and every thing is
running in the head, including the, cash, and that inventories and in receivables
2.2 REVIEW OF LITERATURE
1. (Verma, 1989)analyzed administration in (TISCO), (SAIL) and Indian Iron and Steel
Company(IISCO) amid the period from 1978-79 to 1985-86 by utilizing the money
related devices and factual systems. The investigation uncovered that Tata Iron and
Steel Company Limited would be wise to working capital administration in contrast
with Steel Authority of India Limited and Indian Iron and Steel Company. Results
additionally uncovered that all the three firms under investigation had made
intemperate utilization of bank borrowings to fund the working capital prerequisites.
2. (Manjumdar, 1992)keeping in mind the end goal to know the example of financing
the corporate working capital in India, has examined asset reports of 20 organizations
10 from private segment and 10 from open division for the period from 1981 to 1990.
With the end goal of examination specialist has utilized factual systems and budgetary
instruments. Study demonstrates that real offer of working capital back is from
borrowings and impact of cost on the determination of wellsprings of working capital
isn't at all huge.
3. (Mills, 1996)has investigated the topic of the effect of expansion on the capital
planning process. The examination uncovers that it is sensible to expect that the cost
26 BEML LTD, MYSURU
of capital will increment at an indistinguishable rate from the rate of swelling on an
ex-stake premise, and that this expansion will be a multiplicative relationship. It
likewise uncovers that the higher the net working capital the more prominent is the
effect of swelling on capital spending.
4. (Venkatachalam, 1996)have attempted endeavors to do inside and out investigation of
Tamilnadu Sugar Corporation for the time of 1985-86 to 1993-94. Results
demonstrate that the organization has kept up direct level of working capital, less sum
from long haul reserves has been utilized for meeting here and now liabilities and
because of overabundance liquidity, benefit was influenced amid the time of study.
5. (Chalam G. V. and Manohar Babu B. V, 1999)watch that fluidity execution is low
when contrasted with the perfect standards. It is recommended that for overseeing
WC viably the working and other required spending plans ought to be set up by the
particular levels of the administration on here and now and in addition long haul
premise. It is additionally recommended that these are the general population
concerned who can truly impact the procedure of creation action to such a degree, to
the point that there ought to be ideal usage of the interest in working capital.
6. (Batra, Sharma, 2001)have considered working capital administration hones in Goetze
India Limited for the period from 1989-90 to 1993-94 with the assistance of monetary
apparatuses. The investigation uncovers that general position of working capital
administration was palatable yet there were a few holes in administration of stock,
receivable and payable which require some change.
7. (Filbeck, 2002)in his investigation, examined the execution of the organizations
utilizing the CFO magazine's yearly WC administration Survey. The analyst found
that critical contrast existed between businesses in WC measures crosswise over time
and furthermore found that these measures for working capital changed fundamentally
inside ventures crosswise over time.
8. (Garg, 2002)examinedWC pattern and fluidity of 8 Haryana Government possessed
mechanical ventures in Haryana amid the period from 1978-79 to 1987-88 with the
assistance of bookkeeping apparatuses and factual systems. The examination uncovers
27 BEML LTD, MYSURU
that because of high interests in current resources the greater part of the undertakings
had encountered lack of assets for purchasing crude material and paying different
liabilities.
9. (Pathenia, 2003)examinedWC administration in Himachal Pradesh (HPSCARDB) for
the period beginning from 1990-91 to 1994-95 with the assistance of proportion
examination. The investigation uncovers that the Bank under examination has not
utilized money productively and viably which brought about diminishing in
gainfulness.
10. (Filbeck Greg and Krueger Thomas M, 2005)construct their examination with respect
to the appraisals of working capital administration distributed in CFO magazines. The
discoveries of the examination gives understanding into working capital execution
and WC administration, which is clarified by large scale financial elements, loan
costs, rivalry, and so forth., and their effect on WC administration. The article
additionally considers the effect of WC administration on stock costs.
11. (Tewolde, 2006) endeavored to contemplate the working capital administration
practices of Government possessed, transitional and privatized producing firms in
Eritrea. The outcomes demonstrate that however the administrators of the
Government and transitional firms are productive yet they are not engaged to deal
with the working capital adequately because of inconvenience of Government
controls.
12. (Sankar, 2007)centres around the significance of legitimate working capital
administration of Sun Pharmaceutical Company. The paper tosses sunnyon the ideas
of WC, parts of WC and components influencing working capital in the Sun Pharma
Industries Ltd amid the most recent five years, and recognizes certain elements which
are in charge of the change of working capital of the organization.
13. (Dinesh, april,2008)elucidates the ideas of working capital, the distinctive difficulties
being looked by the business firms in overseeing working capital and the systems to
be embraced for its reasonable administration. The creator finishes up with the view
that the greater part of the organizations fizzled not for need of benefit but rather for
28 BEML LTD, MYSURU
absence of money. The quick development underway and deals may make the
business use the majority of the budgetary assets looking for development and making
resources, for example, inventories, debt claims and different resources as more
illiquid.
14. (Rahman Mohammad, 2011)centres around the co-connection between working
capital and productivity. A compelling working capital administration positively
affects benefit of firms. From the investigation it is seen that in the material business
benefit and working capital administration position are observed to be up to the check.
15. (Bansal, 2011)has contemplated working capital administration in Himachal Pradesh
Agro Industries Corporation Limited for the period from 1985-86 to 1994-95 with the
assistance of monetary devices. The examination uncovers that the company under
investigation has received traditionalist arrangement of financing current resources
which brought about insufficient working capital. Money, Inventory, receivable and
creation limit have not been overseen appropriately by the organization under
examination.
16. (Gamze VURAL, Ahmet Gökhan SÖKMEN, Emin Hüseyin ÇETENAK, 2012)based
on their opinion the working capital management plays on important role in the firm
success or failure. because of its effect on firm performance and liquidity. This study
based on the secondary data which is collected from the Istanbul stock exchange
market for the period 2002-09. Through analysis and performance evaluation they
conclude that leverages as a control negative relationship with firm value and
profitability.
17. (Akoto Richard K., Vitor Dadson A. and Angmor Peter L, 2013)nearly ponder the
connection between WC administration strategies and benefit of the thirteen recorded
assembling company in Ghana. Toward finish of investigation, an essentially adverse
connection amongst benefit and records receivable days is found to exist. Productivity
is fundamentally decidedly affected by the firm‟s money transformation cycle (CCC),
current resources proportion and current resource turnover. It is additionally
recommended that chiefs can make an incentive for the investors by making
impetuses to diminish their records receivable to 30 days.

29 BEML LTD, MYSURU
18. (joseph jisha, 2014)nearly looks at the investigation of WC administration in Ashok
brothers and calls attention to that the liquidity and gainfulness position of the
organization isn't agreeable, and should have been fortified with a specific end goal to
have the capacity to meet its commitments in time.
19. (Madhavi, 2014)makes an exact investigation of the co-connection between liquidity
position and benefit of the paper processes in AP. It has been watched that wasteful
working capital administration has a negative effect on gainfulness and liquidity
position of the paper plants.
20. (Tanveer Bagh, Muhammad Imran Nazir, Muhammad Asif Khan, Muhammad Atif
Khan, Sadaf Razzaq, 2016)gives an overview of impact of working capital
management on the performance. The quantitative research method, multiple
regression and correlation matrix, secondary data methods are worked out for the
study the performance of the manufacturing firm. Their study results like firm
performance of selected firm is completely influenced on the working capital
management and they are all advices that if the company more focuses on the WCM
that will improve the firm performance.

30 BEML LTD, MYSURU
CHAPTER – 3
RESEARCH DESIGN
3.1 STATEMENT OFTHE PROBLEM
Working capital is having direct relation with fund flow analysis of the concerned.
These techniques help us on technicaljudgment making process in utilising working capital.
In the company more than 70% of the total investment is in working capital. In this contest
cost reduction is very important aspects in company where that should be analysed in RW,
WIP, and FG where all cost will be determined. The above scenario explains profitability and
goal satisfactions are the two main aspects over which financial discipline should be cautions.
The problem taken for the study is working capital management.
3.2 NEED OFTHE STUDY
This study is a practical component in academics studies which gives the practical
norms and activities of WCM. Need for the working capital management to analyse the
inheritance of current assets and current liabilities. And also to study the firm position,
performance and financial scale of BEML LTD by adopting financial tools.
3.3 OBJECTIVES
To determine the financial performance of the company.
To study trends of managing working capital.
To analysis the amount of working capital employed by BEML.
To study the ups and downs in the positions of working capital.
3.4 SCOPE OFTHE STUDY
The study covers a period ranging from 2013 to 2017. This because ratios may not
prescribe standards.Under this situations we are also constrained to stress the trends over a
period span of 5 years which has been considered. Though the project is designed to analyse
working capital from the of view of management aspects, it speaks in general about
soundness profitability of the firm, this will help to the different parties having different
interest in the business.

31 BEML LTD, MYSURU
3.5 RESEARCH METHODOLOGY
Information has collected from both the primary and secondary data source. This
project is planned or designed mainly based on the data provided in annual reports for the
company for the years 2013-14 to 2016-2017 which it will be acting as a secondary data,
other data required for the study was directly obtained from the concerned officials which it
has said to be primary data for the study. Research design used in a study is in analytical in
nature.
3.6 LIMITATIONS OF THE STUDY
Working capital management is very wide approach to analyse and very difficult to
summarize.
This study is done only the basis of supplied data
It is very difficult make interpretation and conclusion which creates variations in
calculations, due to the lack of information where company was not willing to give
confidential documents.
Where the company is not located in a single location it is very difficult to collect
data.
Scope of the study is very tight it has given importance on academic study.
3.7 CHAPTER SCHEME
CHAPTER 1: INTRODUCTION
This chapter deals with the basic information related to the subject of the study. It starts with
the introduction of main topic ,complete profile of the company of that is in terms of history,
vision and mission, product profile, objectives, and SWOT.
CHAPTER 2: CONCEPTUAL BACKGROUND AND LITERATURE REVIEW
This part generally includes the background of the study.
CHAPTER 3: RESEARCH DESIGN
This chapter explains about the statement of problem, the scope of the study, objectives of the
study, limitation of the study, methodology, sources of data that used to obtain the
information and analyse the data collected for the study.
32 BEML LTD, MYSURU
CHAPTER 4:ANALYSIS AND INTERPRETATION
This chapter deals with analysis of data that are collected through various sources and
interpret the result using graphs tables.
CHAPTER 5:FINDINGS, SUGGESTIONS AND CONCLUSION
This chapter explains about the summary of all findings, the conclusions drawn from this
study and recommendation made to the company.

33 BEML LTD, MYSURU
CHAPTER 4
4.1 DATA ANALYSIS AND INTERPRETATION
The analysis is carried out using tools like trend analysis and ratio analysis. The data for this
analysis is obtained from the five previous year reports of the company, i.e., from the
previous year 2012-13 to 2016-17.
Data analysis has been divided into two sections:
Section A : dealing in trend analysis
Section B : dealing in ratio analysis
Section A: Dealing In Trend Analysis
Trend analysis is a technique of financial management find out the growth and other crucial
aspects relating to changes the takes place in an organisation. In simple words, this method of
finance is the study of % relationship that each item of financial statement has to be the same
item in the base year.
One the greatest advantage of trend is that it focuses attention on the subtle problems faced
by a concern in achieving its target and commitment. For the purpose of calculating trend
analysis, the 2012-2013 is taken as the base year and therefore is consider to be 100% in the
all the cases and the growth in this year is shown as 0.
Working notes
Working capital= CA – CL.
Capital employed = Net block (+) working capital (+) deferred tax
asset
Net worth = paid-up capital (+) free reserves and surplus (+) security
premium (-) miscellaneous expenditure not written off.
34 BEML LTD, MYSURU
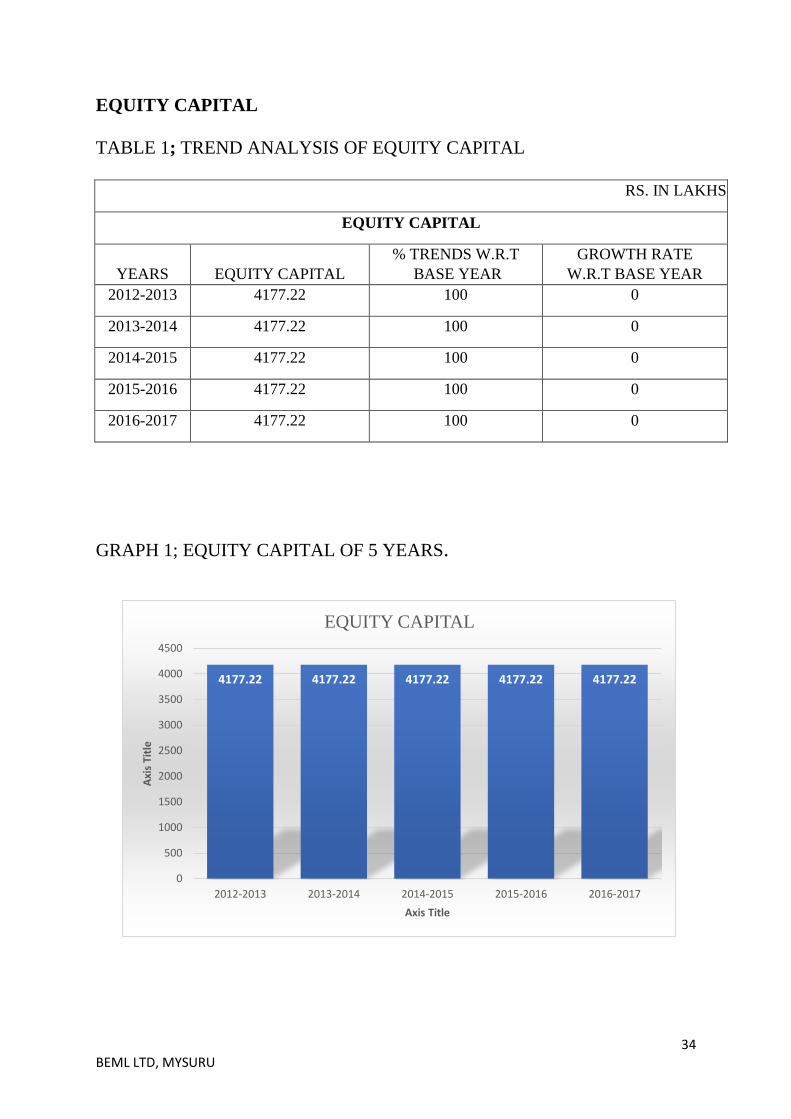
EQUITY CAPITAL
TABLE 1; TREND ANALYSIS OF EQUITY CAPITAL
RS. IN LAKHS
EQUITY CAPITAL
YEARS EQUITY CAPITAL
% TRENDS W.R.T
BASE YEAR
GROWTH RATE
W.R.T BASE YEAR
2012-2013 4177.22 100 0
2013-2014 4177.22 100 0
2014-2015 4177.22 100 0
2015-2016 4177.22 100 0
2016-2017 4177.22 100 0
GRAPH 1; EQUITY CAPITAL OF 5 YEARS.
4177.22 4177.22 4177.22 4177.22 4177.22
0
500
1000
1500
2000
2500
3000
3500
4000
4500
2012-2013 2013-2014 2014-2015 2015-2016 2016-2017
Axi
s Ti
tle
Axis Title
EQUITY CAPITAL

35 BEML LTD, MYSURU
GRAPH 2 ; TREND ANALYSIS OF EQUITY CAPITAL.
INTERPRETATION ;
It can be noticed that trend analysis in equity is constant in all the 5 years the company has
not given or subscribed any equity. The equity capital amount is constant for all the 4 year i.e.
Rs 4177.22 lakhs.
100 100 100 100 100
0
20
40
60
80
100
120
2012-2013 2013-2014 2014-2015 2015-2016 2016-2017
%tr
en
d
Year
% TRENDS W.R.T BASE YEAR

36 BEML LTD, MYSURU
RESERVES AND SURPLUS
TABLE 2; TREND ANALYSIS OF RESERVES AND SURPLUS
RS. IN LAKHS
RESERVE AND SURPLUS
YEARS RESERVE AND SURPLUS
% TRENDS W.R.T
BASE YEAR
GROWTH RATE
W.R.T BASE YEAR
2012-2013 203826.13 100.00 0.00
2013-2014 203806.71 99.99 -0.01
2014-2015 203498.39 99.84 -0.16
2015-2016 206758.96 101.44 1.44
2016-2017 205373.31 100.76 0.76
GRAPH 3; RESERVES AND SURPLUS OF 5 YEARS.
203826.13 203806.71 203498.39
206758.96
205373.31
201000
202000
203000
204000
205000
206000
207000
208000
2012-2013 2013-2014 2014-2015 2015-2016 2016-2017
Rs
in la
kh
Year
RESERVE AND SURPLUS

37 BEML LTD, MYSURU
GRAPH 4 ; TREND ANALYSIS OF RESERVES AND SURPLUS.
INTERPRETATION ;
The trend in reserves and surplus has been fluctuating over the years. The trend in 2013-14 as
observed is at 99.99 i.e. decreased by 00.01% with respect to the base year 2012-13 trend.
The trend in 2014-15 is 99.84 i.e. 0.16% decreased with respect to the base year 2012-13.
The trend in 2015-16 the trend is increased by 1.44% with respect to the base year.
The trend analysis of 2016-17 also increased by 0.76% compare to the base year 2012-13.
100.00 99.99 99.84
101.44
100.76
99.00
99.50
100.00
100.50
101.00
101.50
102.00
2012-2013 2013-2014 2014-2015 2015-2016 2016-2017
%TR
END
Year
% TRENDS W.R.T BASE YEAR

38 BEML LTD, MYSURU
NET WORTH
TABLE3 ; TREND ANALYSIS OF NET WORTH.
RS. IN LAKHS
NET WORTH
YEARS NET WORTH
% TRENDS
WRT BASE YEAR
GROWTH RATE
WRT BASE YEAR
2012-2013 195719.17 100.00 0.00
2013-2014 197654.26 100.99 0.99
2014-2015 198965.06 101.66 1.66
2015-2016 202688.81 103.56 3.56
2016-2017 202790.76 103.61 3.61
GRAPH 5 ; NET WORTH OF 5 YEARS.
195719.17
197654.26
198965.06
202688.81 202790.76
192000
194000
196000
198000
200000
202000
204000
2012-2013 2013-2014 2014-2015 2015-2016 2016-2017
Rs
in la
kh
Year
NET WORTH

39 BEML LTD, MYSURU
GRAPH 6 ; TREND IN NET WORTH.
INTERPRETATION ;
The Trend in net worth as been fluctuated over the years. The trend in 2013-14 as observed is
at 100.99% with increase of 0.99% in base year 2012-13.
The trend in 2014-15 raised to 101.66% that is increased by 1.66% in base year 2012-13.
Again in the year 2015-16 the trend is increased by 3.56% in base year 2012-13.
The trend in 2016-17 is 103.61% that is 3.61% in the base year 2012-13.
100.00
100.99
101.66
103.56 103.61
98.00
99.00
100.00
101.00
102.00
103.00
104.00
2012-2013 2013-2014 2014-2015 2015-2016 2016-2017
%TR
END
Year
% TRENDS W.R.T BASE YEAR

40 BEML LTD, MYSURU
INVENTORY
TABLE 4 ; TREND ANALYSIS OF INVENTORY
RS. IN LAKHS
INVENTORY
YEARS INVENTORY
% TRENDS W.R.T
BASE YEAR
GROWTH RATE
W.R.T BASE YEAR
2012-2013 245619.92 100.00 0.00
2013-2014 215210.29 87.62 -12.38
2014-2015 192119.78 78.22 -21.78
2015-2016 169631.83 69.06 -30.94
2016-2017 197445.58 80.39 -19.61
GRAPH 7 ; INVENTORIES OF 5 YEAR.
245619.92
215210.29
192119.78 169631.83
197445.58
0
50000
100000
150000
200000
250000
300000
2012-2013 2013-2014 2014-2015 2015-2016 2016-2017
Rs
in la
kh
Year
INVENTORY

41 BEML LTD, MYSURU
GRAPH 8 ; TREND IN INVENTORIES.
INTERPRETATION ;
There is a variation in the trend during the 5 years as far as inventories is considered.
Maximum amount of trend can we see in the base year 2012-13.
There is a variation in the year in the 2013-14 with value of 87.62% which is decreased by
12.38% with respect to the base year.
there is slight down in the next few years that is in 2014-15 decreased by 21.78% and next
year 2015-16 decreased to 69.06% that is down by 90.94%.
there is slight rise in trend compare to previous year but in the year 2016-17 80.39%
decreased by 19.31% with respect to base year 2012-13.
100.00
87.62
78.22 69.06
80.39
0.00
20.00
40.00
60.00
80.00
100.00
120.00
2012-2013 2013-2014 2014-2015 2015-2016 2016-2017
% T
REN
DS
Year
% TRENDS W.R.T BASE YEAR

42 BEML LTD, MYSURU
SUNDRY DEBOTRS
TABLE 5 ; TREND ANALYSIS OF SUNDRY DEBTOR.
RS. IN LAKHS
SUNDRY DEBOTRS
YEARS SUNDRY DEBOTRS
% TRENDS WRT
BASE YEAR
GROWTH RATE
WRT BASE YEAR
2012-2013 86151.14 100.00 0.00
2013-2014 97736.19 113.45 13.45
2014-2015 99169.65 115.11 15.11
2015-2016 120805.1 140.22 40.22
2016-2017 143037.35 166.03 66.03
GRAPH 9 ; SHOWING SUNDRY DEBTORS OF 5 YEARS.
86151.14 97736.19 99169.65
120805.1
143037.35
0
20000
40000
60000
80000
100000
120000
140000
160000
2012-2013 2013-2014 2014-2015 2015-2016 2016-2017
Rs
in la
kh
Year
SUNDRY DEBOTRS

43 BEML LTD, MYSURU
GRAPH 10 : TRENDS IN SUNDRY DEBTORS
INTERPRETATION :
There is fluctuation the trends of sundry debtors. The trends in 2013-14 has risen to 113.45%
which is 13.45% respect to the base year2012-13.
The trends in 2014-15 which is 115.11% increased by 15.11% with respect in base year
2012-13.
In 2015-16 the sundry debtors trends was 140.22% which is 40.22% increase compared to the
base year 2012-13.
There is a lot of changes in the trends in the year 2016-17 that is 166.03% which is 66.03%
increase with respect to the base year 2012-13.
100.00
113.45 115.11
140.22
166.03
0.00
20.00
40.00
60.00
80.00
100.00
120.00
140.00
160.00
180.00
2012-2013 2013-2014 2014-2015 2015-2016 2016-2017
% T
REN
DS
Year
% TRENDS WRT BASE YEAR

44 BEML LTD, MYSURU
WORKING CAPITAL
TABLE 6 : TREND ANALYSIS OF WORKING CAPITAL.
RS. IN LAKHS
WORKING CAPITAL
YEARS WORKING CAPITAL
% TRENDS WRT
BASE YEAR
GROWTH RATE
WRT BASE YEAR
2012-2013 206756.21 100.00 0.00
2013-2014 198422.44 95.97 -4.03
2014-2015 196967.2 95.27 -4.73
2015-2016 201395.25 97.41 -2.59
2016-2017 212666.06 102.86 2.86
GRAPH 11 : SHOWING WORKING CAPITAL OF 5 YEARS
206756.21
198422.44 196967.2
201395.25
212666.06
185000
190000
195000
200000
205000
210000
215000
2012-2013 2013-2014 2014-2015 2015-2016 2016-2017
Rs
in la
kh
Year
WORKING CAPITAL

45 BEML LTD, MYSURU
GRAPH 12 : TREND ANALYSIS OF WORKING CAPITAL.
INTERPRETATION :
Variable trend is observed in the working capital trend over the years. There is no growth in
first 3 year. The trend in 2013-14 was 95.97% which is 4.03% net decreased in trend with
respect to the base year 2012-13.
The trend in 2014-15 95.27% again the trend was down by 4.73% net decreases by compare
to base year.
The trend in the year 2015-16 has shown little improvement compare to previous year but
compare to base year 2.59% was decreased.
The trend in 2016-17 has improved to a great extent when compared to the previous year an
record a value of 102.86% which is a 5.45% net increased and compared to base year 2012-
13 net increased by 2.86%.
100.00
95.97 95.27
97.41
102.86
90.00
92.00
94.00
96.00
98.00
100.00
102.00
104.00
2012-2013 2013-2014 2014-2015 2015-2016 2016-2017
% T
REN
DS
Year
% TRENDS W.R.T BASE YEAR

46 BEML LTD, MYSURU
CAPITAL EMPLOYED
TABLE 7 : TREND ANALYSIS CAPITAL EMPLOYED.
RS. IN LAKHS
CAPITAL EMPLOYED
YEARS
CAPITAL
EMPLOYED % TRENDS WRT BASE YEAR GROWTH RATE WRT BASE YEAR
2012-2013 270384.05 100.00 0.00
2013-2014 258296.77 95.53 -4.47
2014-2015 253976.05 93.93 -6.07
2015-2016 265768.82 98.29 -1.71
2016-2017 280869.63 103.88 3.88
GRAPH 13: SHOWING CAPITAL EMPLOYED OF 5 YEAR.
270384.05
258296.77
253976.05
265768.82
280869.63
240000
245000
250000
255000
260000
265000
270000
275000
280000
285000
2012-2013 2013-2014 2014-2015 2015-2016 2016-2017
Rs
in la
kh
Year
CAPITAL EMPLOYED

47 BEML LTD, MYSURU
GRAPH 14 : TREND ANALYSIS IN CAPITAL EMPLOYED.
INTERPRETATION :
The trends in the capital employed variable over a year. The trend in 2013-14
was 95.53% which is decreased by 4.47% with regards to the base year.
The trend in 2014-15 has 93.93% decreases by 6.07in base year 2012-13.
The trend in 2015-16 has 98.29% which is increased by 4.36% respect to the
previous year that is 2014-15. And compare to base year 2012-13 the trend is
decrease by 1.71%.
In the year 2016-17 has recorded with an increasing trend with respect to the
previous and base year which is 103.88% that is 3.88% increased with respect
to base year 2012-13 and 5.59% to previous year 2015-16.
100.00
95.53
93.93
98.29
103.88
88.00
90.00
92.00
94.00
96.00
98.00
100.00
102.00
104.00
106.00
2012-2013 2013-2014 2014-2015 2015-2016 2016-2017
% T
REN
DS
Year
% TRENDS W.R.T BASE YEAR

48 BEML LTD, MYSURU
SALES
TABLE 8 : TREND ANALYSIS OF SALES
RS. IN LAKHS
SALES
YEARS SALES
% TRENDS WRT
BASE YEAR
GROWTH RATE
WRT BASE YEAR
2012-2013 328977 100.00 0.00
2013-2014 326220 99.16 -0.84
2014-2015 312965 95.13 -4.87
2015-2016 342602 104.14 4.14
2016-2017 293698 89.28 -10.72
GRAPH 15 : SHOWING SALES OF 5 YEARS.
328977 326220
312965
342602
293698
260000
270000
280000
290000
300000
310000
320000
330000
340000
350000
2012-2013 2013-2014 2014-2015 2015-2016 2016-2017
Rs
in la
kh
Year
SALES

49 BEML LTD, MYSURU
GRAPH 16 : TREND IN SALES.
INTERPRETATION :
The Trend in sales for 5 consecutive years appears to be andecreasing and increasing trend
which depicts the healthy growth of the organisation over the year. The trend was decreased
in the year 2013-14 by 0.84% with respect to the base year.
And in 2014-15 which is 95.13% decreased by 4.87% with regards to base year 2012-13.
The sales trend in 2015-16 has 104.14% which is increased by 9.01% with respect to
previous year and 4.14% respect to base year 2012-13.
In the year 2016-17 the sales trend is completely down compare to previous year that is
14.86% and 10.72% with respect to the base year 2012-13.
100.00 99.16
95.13
104.14
89.28
80.00
85.00
90.00
95.00
100.00
105.00
110.00
2012-2013 2013-2014 2014-2015 2015-2016 2016-2017
% T
REN
DS
Year
% TRENDS WRT BASE YEAR
50 BEML LTD, MYSURU
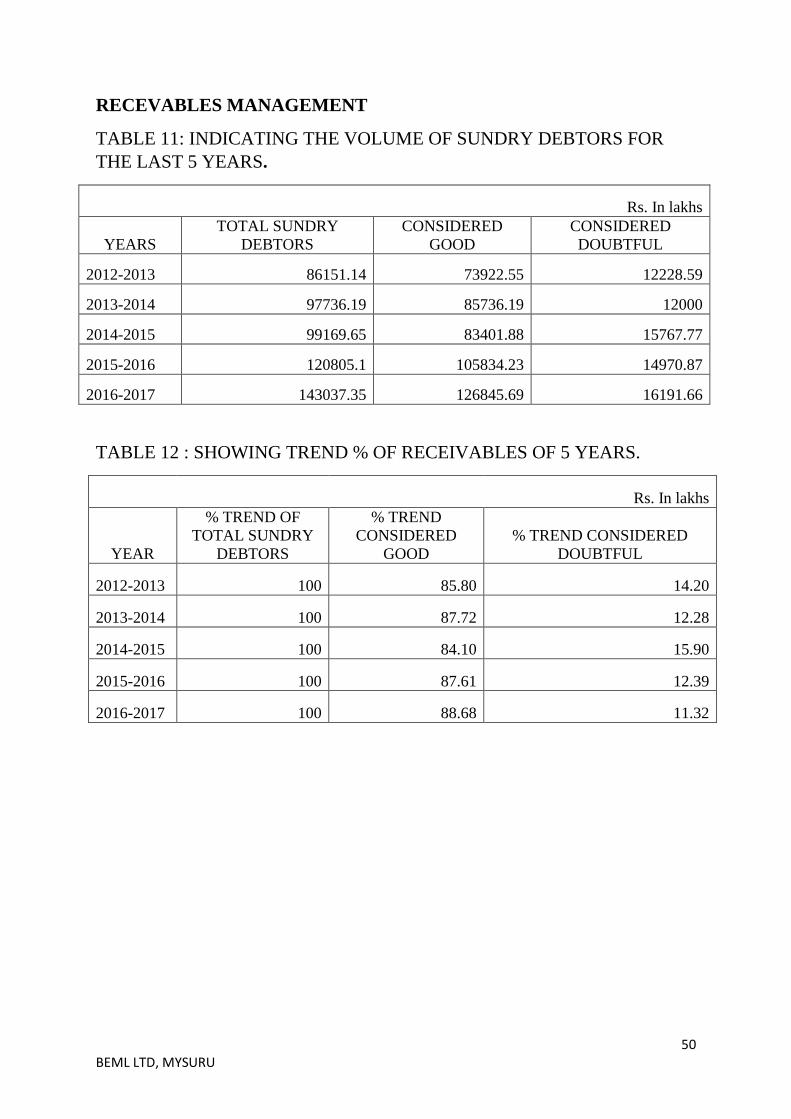
RECEVABLES MANAGEMENT
TABLE 11: INDICATING THE VOLUME OF SUNDRY DEBTORS FOR
THE LAST 5 YEARS.
Rs. In lakhs
YEARS
TOTAL SUNDRY
DEBTORS
CONSIDERED
GOOD
CONSIDERED
DOUBTFUL
2012-2013 86151.14 73922.55 12228.59
2013-2014 97736.19 85736.19 12000
2014-2015 99169.65 83401.88 15767.77
2015-2016 120805.1 105834.23 14970.87
2016-2017 143037.35 126845.69 16191.66
TABLE 12 : SHOWING TREND % OF RECEIVABLES OF 5 YEARS.
Rs. In lakhs
YEAR
% TREND OF
TOTAL SUNDRY
DEBTORS
% TREND
CONSIDERED
GOOD
% TREND CONSIDERED
DOUBTFUL
2012-2013 100 85.80 14.20
2013-2014 100 87.72 12.28
2014-2015 100 84.10 15.90
2015-2016 100 87.61 12.39
2016-2017 100 88.68 11.32

51 BEML LTD, MYSURU
GRAPH 17 : SHOWING RECEIVABLES MANAGEMENT OF 5 YEARS.
GRAPH 18 : SHOWING THE % TREND IN RECIEVABLE
MANAGEMENT OVER THE LAST 5 YEAR.
0
20000
40000
60000
80000
100000
120000
140000
160000
2012-2013 2013-2014 2014-2015 2015-2016 2016-2017
Rs
in la
kh
year
Rs. In lakhs Rs. In lakhs Rs. In lakhs
100 100 100 100 100
85.8 87.72 84.1
87.61 88.68
14.2 12.28 15.9
12.39 11.32
0
20
40
60
80
100
120
2012-2013 2013-2014 2014-2015 2015-2016 2016-2017
% o
f tr
end
year
Rs. In lakhs Rs. In lakhs Rs. In lakhs

52 BEML LTD, MYSURU
INTERPRETATION:
From above information, it can be informed that receivable management at BEML is average
as a percentage of sundry debtors considered goods with respect to the total sundry debtors is
nearing to 100% over the 5 years. Considered goods and considered doubtful amounts are the
fluctuated in all 5 years and % trends in considered goods and doubtful goods are average
with respect to base year and previous year.

53 BEML LTD, MYSURU
RATIO ANALYSIS
Ratio may be defined as "the indicated quotient of two mathematical expressions." A ratio
can be expressed by dividing one number into another. It is also expressed as a proportion.
Some analyst expresses ratio as a rate or time.
As our area of study is the working capital management, the ratios relating to it from 5 years
data is taken. And the ratios we are taken study are below:
1. Current ratio
2. Quick ratio
3. Inventory ratio
4. Debtors turnover ratio
5. Working capital turnover ratio
6. Fixed assets turnover ratio
7. Capital turnover ratio

54 BEML LTD, MYSURU
CURRENT RATIO
TABLE 13
CURRENT RATIO
YEAR
CURRENT
ASSETS
CURRENT
LIABILITIES RATIO
2012-2013 414935.63 208179.42 1.99
2013-2014 368474.74 170052.30 2.17
2014-2015 358858.42 161891.22 2.22
2015-2016 334026.59 132631.35 2.52
2016-2017 382744.93 170078.87 2.25
GRAPH 19 : CURRENT RATIO OF 5 YEAR
INTERPRETATION :
In the above table we can notice that current assets are have an increased trend
in connection with current liabilities. The standard current ratio is 2:1. The
higher the current ratio the greater margin of safety to creditor. However, in the
above table increasing trends in current ratio shows the lower management of
the working capital.
1.99 2.17 2.22
2.52
2.25
2012-2013 2013-2014 2014-2015 2015-2016 2016-2017
RA
TIO
YEAR
CURRENT RATIO

55 BEML LTD, MYSURU
QUICK RATIO
TABLE 14
QUICK RATIO
YEAR QUICK ASSETS CURRENT LIABILITIES RATIO
2012-2013 169315.71 208179.42 0.81
2013-2014 153264.45 170052.30 0.90
2014-2015 166738.64 161891.22 1.03
2015-2016 164394.76 132631.35 1.24
2016-2017 185299.35 170078.87 1.09
GRAPH 20
INTERPRETATION :
The ratio establishes a relationship between quick assets and quick liabilities
generally a quick ratio of 1:1 Is considered satisfactory as a firm can easily meet
all the current claims. The quick ratio of BEML from the year 2012- 13 to 2016-
17 has been satisfactory.
0.81 0.90
1.03
1.24
1.09
2012-2013 2013-2014 2014-2015 2015-2016 2016-2017
RA
TIO
YEAR
QUICK RATIO

56 BEML LTD, MYSURU
INVENTORY RATIO
TABLE 15
INVENTORY RATIO
YEAR NET SALES INVENTORY RATIO
2012-2013 328977 245619.92 1.34
2013-2014 326220 215210.29 1.52
2014-2015 312965 192119.78 1.63
2015-2016 342602 169631.83 2.02
2016-2017 293698 197445.58 1.49
GRAPH 21
INTERPRETATION :
In the respect of increase in sales the is growth in inventory turnover ratio in the
year 2015-16 compare to the base and previous year. From the beginning of the
year both inventory and sales were decreased resulting in low inventory
turnover ratio.
1.34 1.52
1.63
2.02
1.49
2012-2013 2013-2014 2014-2015 2015-2016 2016-2017
RA
TIO
YEAR
INVENTORY RATIO

57 BEML LTD, MYSURU
DEBTORS TURNOVER RATIO
TABLE 16
DEBTORS TURNOVER RATIO
YEAR TOTAL SALES DEBTORS RATIO
2012-2013 328977 86151.14 3.82
2013-2014 326220 97736.19 3.34
2014-2015 312965 99169.65 3.16
2015-2016 342602 120805.1 2.84
2016-2017 293698 143037.4 2.05
GRAPH 22
INTERPRETATION :
In this shown table, there is no any core rule for debtor turnover ratio, the less
ratio shows that low liquid receivables and shows the less liquidity of BEML.
The high ratio signs the high liquidity.
3.82
3.34 3.16
2.84
2.05
2012-2013 2013-2014 2014-2015 2015-2016 2016-2017
RA
TIO
YEAR
DEBTORS TURNOVER RATIO

58 BEML LTD, MYSURU
WORKING CAPITAL TURNOVER RATIO
TABLE 17
WORKING CAPITAL TURNOVER RATIO
YEAR NET SALES WORKING CAPITAL RATIO
2012-2013 328977 206756.21 1.59
2013-2014 326220 198422.44 1.64
2014-2015 312965 196967.2 1.59
2015-2016 342602 201395.25 1.70
2016-2017 293698 212666.06 1.38
GRAPH 23
INTERPRETATION
In this table, the ratio will be compared between the previous year’s ratio. The
first four years the working capital is satisfactory. But, in the year 2016-2017
there is low ratio it shows that there is inefficient utilisation of working capital.
1.59 1.64
1.59 1.70
1.38
2012-2013 2013-2014 2014-2015 2015-2016 2016-2017
RA
TIO
YEAR
WORKING CAPITAL TURNOVER RATIO

59 BEML LTD, MYSURU
FIXED ASSETS TURN OVER RATIO
TABLE 18
FIXED ASSETS TURN OVER RATIO
YEAR NET SALES TOTAL FIXED ASSETS RATIO
2012-2013 328977 67,253.07 4.89
2013-2014 326220 67,156.98 4.86
2014-2015 312965 66,041.00 4.74
2015-2016 342602 64,410.05 5.32
2016-2017 293698 65,028.58 4.52
GRAPH 24
INTERPRETATION
The above tables indicates that, in the year 2015-2016 there is better utilisation
of fixed assets. And in the year 2016-17 low utilisation of fixed assets due to net
sales.0
4.89 4.86
4.74
5.32
4.52
2012-2013 2013-2014 2014-2015 2015-2016 2016-2017
RA
TIO
YEAR
FIXED ASSETS TURNOVER RATIO

60 BEML LTD, MYSURU
CAPITAL TURNOVER RATIO
TABLE 19
CAPITAL TURNOVER RATIO
YEAR COST OF SALES CAPITAL EMPLOYED RATIO
2012-2013 328977 270384.05 1.22
2013-2014 326220 258296.77 1.26
2014-2015 312965 253976.05 1.23
2015-2016 342602 265768.82 1.29
2016-2017 293698 280869.63 1.05
GRAPH 25
INTERPRETATION :
The above table shows that capital employed and cost of sales are utilised
efficiently to make the sales every year except the 2016-17. In 2016-17 the
capital turnover ratio is very low which means less cost of sales for those sales
due to the more usage of capital employed with respect to all the year.
1.22 1.26 1.23
1.29
1.05
2012-2013 2013-2014 2014-2015 2015-2016 2016-2017
RA
TIO
YEAR
CAPITAL TURNOVER RATIO

61 BEML LTD, MYSURU
CHAPTER 5
FINDINGS, SUGGESTIONS AND CONCLUSION
5.1 FINDINGS
The equity capital has been constant since 5 year from 2012-13 to 2016-17 hence it is
said as the company as not called for shares or debentures.
Reserves and surplus has seen growth to maximum 1.44% in the year 2015-16 W.R.T
base year. Which is really bull for the firm to use this funds when requires.
The net worth of the firm has been increasing year by year from the base year that
shows the management is slowly increasing the firm goodwill.
The inventory of the firm is rapidly decreased W.R.T to base year which means we
can see there is increase in sales year by year.
There is a high peak in debtors of 66% with respect to the base year.The prompt
payment and liquidity of cash is good from year to year.
The trends in growth of working capital of the company for first 3 year was low with
respect to base year. Trend in 2016-17 as increased as a result in sundry debtors,
inventory, loans and advances, current liabilities and decrease in case and bank
balances.
Capital employed trend as some fluctuation with the net increase of 3.88% during the
2016-17 W.R.T to base year depicting there is no healthy trend of employing
minimum capital to attain maximum sales and revenue.
Sales are fluctuating year by year but in the year 2016-17 the sales volume is
completely down fall with respect to previous and base year it shows the there is no
stability.
We can see that the trend of receivable management is consistent. It shows that there
is better working capital management.
The company has maintained liquidity of the firm which is satisfactory as for as quick
ratio is concern.
We can find that there is an increase of sale by clearing the inventory and company is
trying to achieve their goals but in the year 2016-17 there is down fall in sale compare
to previous year.
We can see that there is better utilisation of fixed assets in all the year.
Capital employed ratio depict the economical usage of working capital to the most
which is the most important factor for a firm to attain its organisational objective.
62 BEML LTD, MYSURU
5.2 SUGGESTIONS
The company need to plan to increase the share capital to meet the
expenses and to have a better profit margin for the shareholders.
The company should attain a proper plan to recovery the debt.
The firm need to increase the liquid assets cash, trade receivables and
marketable securities to make smooth and proper working capital.
The company need to concentrate to increases sales and achieve the
goals.
The management of BEML ltd should take necessary measure in order to
see that all the resources like 5M’s are utilised at optimum level.
63 BEML LTD, MYSURU
5.3 CONCLUSION
A case study without conclusion will be like a formal wear without shoes. as
mentioned a working capital in BEML is satisfactory. The profits have
increased in the year 2016-17 thus we can find company has a growing trend
and making very sound financial performance.
Working capital has so for being looking at as the driving seat for financial
heads. By studying the working capital management at BEML one can know
the growth and prospectus of the company.
Thus we can conclude the study by analysing BEML is a good model for every
public ltd company.

64 BEML LTD, MYSURU
BIBLIOGRAPHY
http://www.bemlindia.com/
http://bemlindia.com/oldsite/annual_report.php
http://www.moneycontrol.com/india/stockpricequote/infrastructure-
general/beml/bem03
https://en.wikipedia.org/wiki/bharat_earth_movers
https://www.edupristine.com/blog/ratio-analysis-ratios-formulae
Annual reports from the year 2012-13 to 2016-17
REFERENCES
Akoto Richard K., Vitor Dadson A. and Angmor Peter L. (2013). Working Capital Management
and Profitability: Evidence from Ghanaian Listed Manufacturing Firms. Journal of Economics
and International Finance, 373-379.
Bansal. (2011). proposed financial ratios for analysis . AAII Journal.
Batra, Sharma. (2001). Evaluation of woring capital analysis. Review of Accounting & Finance,
35-55.
Chalam G. V. and Manohar Babu B. V. (1999). working caital management. Working Capital
Trends in Large Public Limited Companies in Indian Private Corporate Sector, 107-126.
Dinesh, M. (april,2008). Working Capital Management. Challenges and Strategies, The
Accounting World, ICFAI University Press, 37-40.
Filbeck. (2002). Working capital Analysis with refernce to PSU. IPE Journal.
Filbeck Greg and Krueger Thomas M. (2005). An Analysis of Working Management Results
Across Industries. American Journal of Business Finance, 5-11.
Gamze VURAL, Ahmet Gökhan SÖKMEN, Emin Hüseyin ÇETENAK. (2012). Affects of Working
Capital Management on Firm’s Performance:Evidence from Turkey. International Journal of
Economics and Financial Issues , 488-495.
Garg. (2002). working capital management. ICSI journal.
joseph jisha. (2014). Impact of Working Capital Management on Firm's Profitability and
Liquidity: An Empirical Study of Ashok Leyland Ltd. International Journal of Research in
Commerce and Management, , 32-38.
Madhavi. (2014). Working Capital Management of Paper Mills. International Journal of
Research in Business Management, 61-64.
Manjumdar. (1992). Fianancials analysis tools and techniques. Journal of commerce and
accounting Research.
Mills. (1996). working capital analysation . The Goverment accounts Journal, 50-65.

65 BEML LTD, MYSURU
Pathenia. (2003). working capital analysis and management. IUP Journals .
Rahman Mohammad, M. (2011). Working Capital Management and Profitability: A study on
Textiles Industry. ASA University Review, 115-132.
Sankar, T. (2007). Working Capital Management in Sun Pharmaceutical Industries Ltd. – A
Case Study. Tecnia Journal of Management Studies, 45-52.
Tanveer Bagh, Muhammad Imran Nazir, Muhammad Asif Khan, Muhammad Atif Khan, Sadaf
Razzaq. (2016). The Impact of Working Capital Management on Firms Financial performance.
International Journal of Economics and Financial issues, 1097-1105.
Tewolde. (2006). Financial analysis and control. Global Perspective on Accounitng Education,
56-70.
Venkatachalam, V. a. (1996). working capital analysis of selected public sector enterprise .
IUP Journal of management research , 40-53.
Verma. (1989). Disclosure of accounting policies. South asian Journal of Managemet .
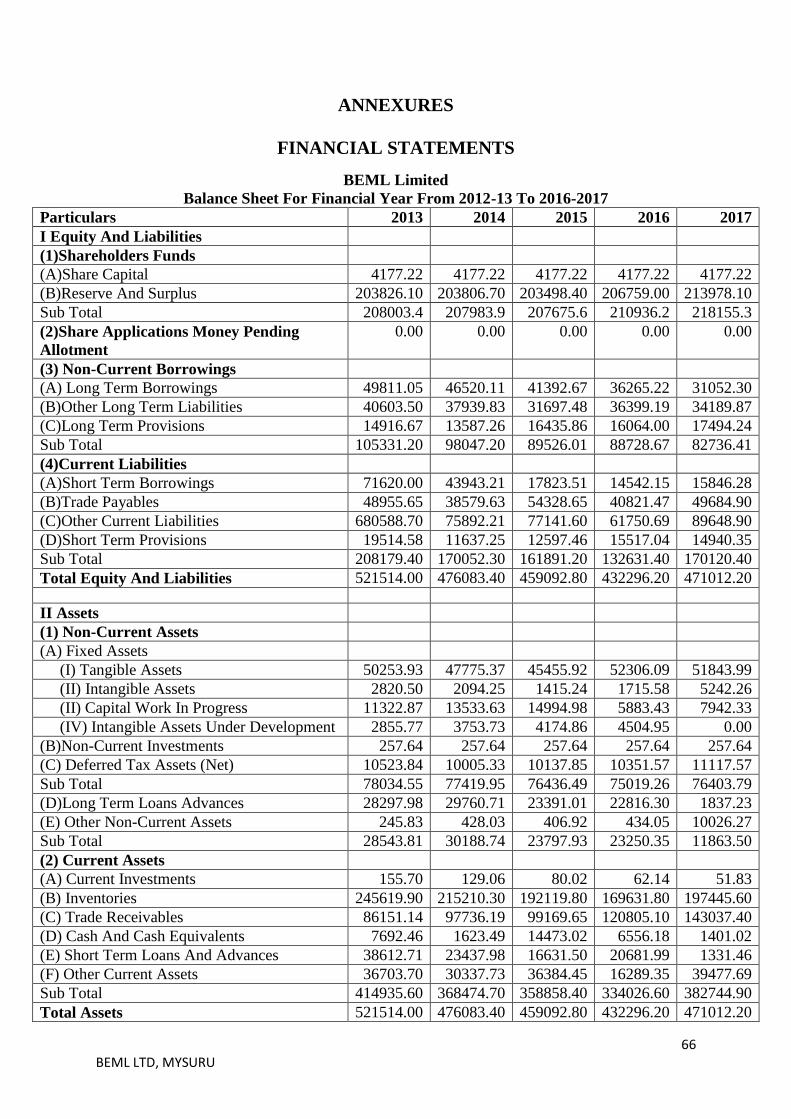
66 BEML LTD, MYSURU
ANNEXURES
FINANCIAL STATEMENTS
BEML Limited
Balance Sheet For Financial Year From 2012-13 To 2016-2017
Particulars 2013 2014 2015 2016 2017
I Equity And Liabilities
(1)Shareholders Funds
(A)Share Capital 4177.22 4177.22 4177.22 4177.22 4177.22
(B)Reserve And Surplus 203826.10 203806.70 203498.40 206759.00 213978.10
Sub Total 208003.4 207983.9 207675.6 210936.2 218155.3
(2)Share Applications Money Pending
Allotment
0.00 0.00 0.00 0.00 0.00
(3) Non-Current Borrowings
(A) Long Term Borrowings 49811.05 46520.11 41392.67 36265.22 31052.30
(B)Other Long Term Liabilities 40603.50 37939.83 31697.48 36399.19 34189.87
(C)Long Term Provisions 14916.67 13587.26 16435.86 16064.00 17494.24
Sub Total 105331.20 98047.20 89526.01 88728.67 82736.41
(4)Current Liabilities
(A)Short Term Borrowings 71620.00 43943.21 17823.51 14542.15 15846.28
(B)Trade Payables 48955.65 38579.63 54328.65 40821.47 49684.90
(C)Other Current Liabilities 680588.70 75892.21 77141.60 61750.69 89648.90
(D)Short Term Provisions 19514.58 11637.25 12597.46 15517.04 14940.35
Sub Total 208179.40 170052.30 161891.20 132631.40 170120.40
Total Equity And Liabilities 521514.00 476083.40 459092.80 432296.20 471012.20
II Assets
(1) Non-Current Assets
(A) Fixed Assets
(I) Tangible Assets 50253.93 47775.37 45455.92 52306.09 51843.99
(II) Intangible Assets 2820.50 2094.25 1415.24 1715.58 5242.26
(II) Capital Work In Progress 11322.87 13533.63 14994.98 5883.43 7942.33
(IV) Intangible Assets Under Development 2855.77 3753.73 4174.86 4504.95 0.00
(B)Non-Current Investments 257.64 257.64 257.64 257.64 257.64
(C) Deferred Tax Assets (Net) 10523.84 10005.33 10137.85 10351.57 11117.57
Sub Total 78034.55 77419.95 76436.49 75019.26 76403.79
(D)Long Term Loans Advances 28297.98 29760.71 23391.01 22816.30 1837.23
(E) Other Non-Current Assets 245.83 428.03 406.92 434.05 10026.27
Sub Total 28543.81 30188.74 23797.93 23250.35 11863.50
(2) Current Assets
(A) Current Investments 155.70 129.06 80.02 62.14 51.83
(B) Inventories 245619.90 215210.30 192119.80 169631.80 197445.60
(C) Trade Receivables 86151.14 97736.19 99169.65 120805.10 143037.40
(D) Cash And Cash Equivalents 7692.46 1623.49 14473.02 6556.18 1401.02
(E) Short Term Loans And Advances 38612.71 23437.98 16631.50 20681.99 1331.46
(F) Other Current Assets 36703.70 30337.73 36384.45 16289.35 39477.69
Sub Total 414935.60 368474.70 358858.40 334026.60 382744.90
Total Assets 521514.00 476083.40 459092.80 432296.20 471012.20

67 BEML LTD, MYSURU

l
~• ... ACHARYA INSTITUTE OF TECHNOLOGY
DEPARTMENT OF MBA
ACHARYA I :---.:ST IT llTI .\
I',TLR:\Sl·HP WEEK! Y REPORT (16i\lBAPR407)
Name of the Student: RAKSHITH KUMAR B
Internal G uide: Dr. RAMANJ\IAH G
US . l'\o: I A Y J 6MBA5 7
Specialization: Finance
Title of the Project: A Study on Working Capital management With Reference to 13EML
Mysore Complex. Mysore
Company Name: BEML MYSORE
Week
16-01 -2018 to
22-01 -20 18
23-01-2018 to
29-0 1-20 18
30-01 -20 18 to
5-02-20 18
6-02-2018 to
12-02-2018
13-02-20 18 to
19-02-2018
Work Undertaken External Guide Signature
Introduction about BEML MYSORE
~\, Learning about the different
~ operations and product by BEML MYSORE
Orientation and gathering infonnation
~_,,-/' about the growth of the company
Orientation with functional department of the organisation
~ and detailed study of
Department.
Rest.:arch problem identification I
}I\{. 1[6'!1'1 I ( I /., :1 .,I._ )~ _,..;. ,.. .. -, ~ < 1m Moll.!~' -· • <- •
"it:..1: .;01 ·, :?-. TF:t>ltdNG CENTRE -q- .1- :,-;r;;--;:;:r, il1ysore Com~lex ,:1~n1 .,., :~::;; 1:-.:s tj l:,,',L LIMl'fEO ; (n-:iT' 'l/"'.•": Lcli:Vildl Post ,:r".fT" 1-·: · 11 R l J s 7 c, o , n
Internal Guide S ignature
iv ~ ~ o/ \V
2ll-02-20 l S Preparation of the research instrument tl
1 for data colkction
2b-02 -20lS
:--02-20 IS Thl'\'R'tic:11 hack ground of thl' study
V (\)
:--03-20 IS
t--02-201S to Data colkction and data analysis
12-03-2018
13-03-201S to
.20-03 -.20 I~ to
2b-03-.201 8
I lnt~rpretation of the data gathered dunng the sur,cy
Final report preparation and ~
submission " ,, B 1 , . HMA 1 ,m ~CT, . . - ,. . . - "'I l P ~c...,. ~- .)~n1 r ,, 0.,' - ; - ~-- .,... .. . -, ~ : q _
4-~~ Siorrnturc of H® 0 ·
" > f •.• ..., ~ G o ~he Dep3rtmem Departme nt of MBA
Acharya Institute of Tech .iology So1de~anahH'i, Ba•galore~560 1-07


![=^f EPiTSa^_b³Tgc^acX^]´ Q^\Q^]Tg 7< BT]P](https://static.fdokumen.com/doc/165x107/631b1814c51d6b41aa0517ad/f-epitsabtgcacx-qqtg-7-btp.jpg)